Zip Codes with the Highest Percentage of Population Employed in Agriculture, Fishing & Hunting in North Augusta, SC
RELATED REPORTS & OPTIONS
Agriculture, Fishing & Hunting
North Augusta
Compare Zip Codes
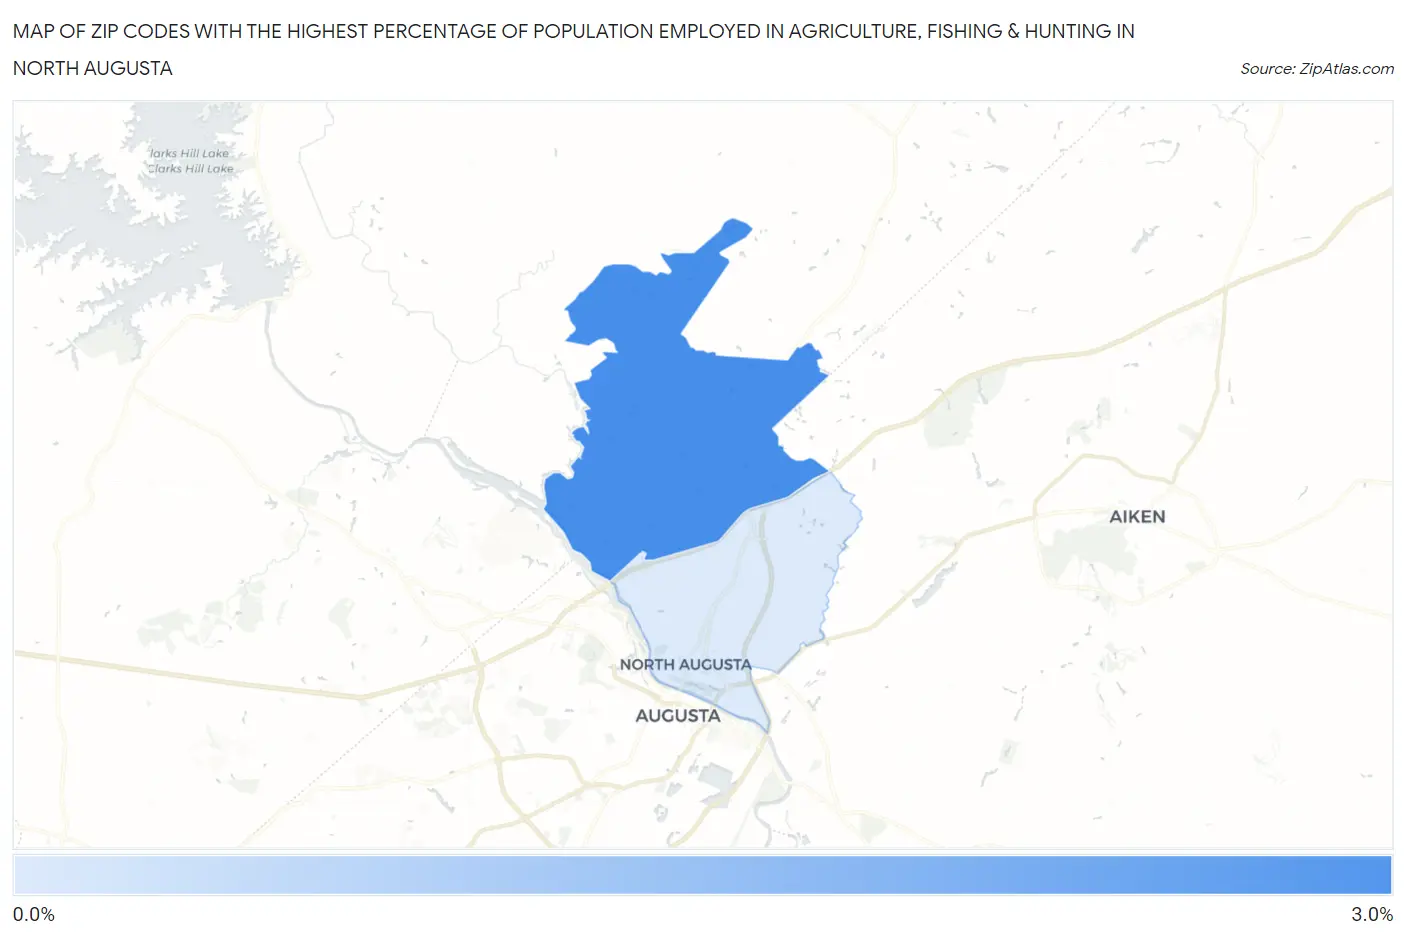
Map of Zip Codes with the Highest Percentage of Population Employed in Agriculture, Fishing & Hunting in North Augusta
0.0%
3.0%
Zip Codes with the Highest Percentage of Population Employed in Agriculture, Fishing & Hunting in North Augusta, SC
| Zip Code | % Employed | vs State | vs National | |
| 1. | 29860 | 2.7% | 0.78%(+1.95)#76 | 1.2%(+1.52)#11,093 |
| 2. | 29841 | 0.10% | 0.78%(-0.676)#301 | 1.2%(-1.10)#23,644 |
1
Common Questions
What are the Top Zip Codes with the Highest Percentage of Population Employed in Agriculture, Fishing & Hunting in North Augusta, SC?
Top Zip Codes with the Highest Percentage of Population Employed in Agriculture, Fishing & Hunting in North Augusta, SC are:
What zip code has the Highest Percentage of Population Employed in Agriculture, Fishing & Hunting in North Augusta, SC?
29860 has the Highest Percentage of Population Employed in Agriculture, Fishing & Hunting in North Augusta, SC with 2.7%.
What is the Percentage of Population Employed in Agriculture, Fishing & Hunting in North Augusta, SC?
Percentage of Population Employed in Agriculture, Fishing & Hunting in North Augusta is 0.31%.
What is the Percentage of Population Employed in Agriculture, Fishing & Hunting in South Carolina?
Percentage of Population Employed in Agriculture, Fishing & Hunting in South Carolina is 0.78%.
What is the Percentage of Population Employed in Agriculture, Fishing & Hunting in the United States?
Percentage of Population Employed in Agriculture, Fishing & Hunting in the United States is 1.2%.