Zip Codes with the Highest Percentage of Population Employed in Agriculture, Fishing & Hunting in Greer, SC
RELATED REPORTS & OPTIONS
Agriculture, Fishing & Hunting
Greer
Compare Zip Codes
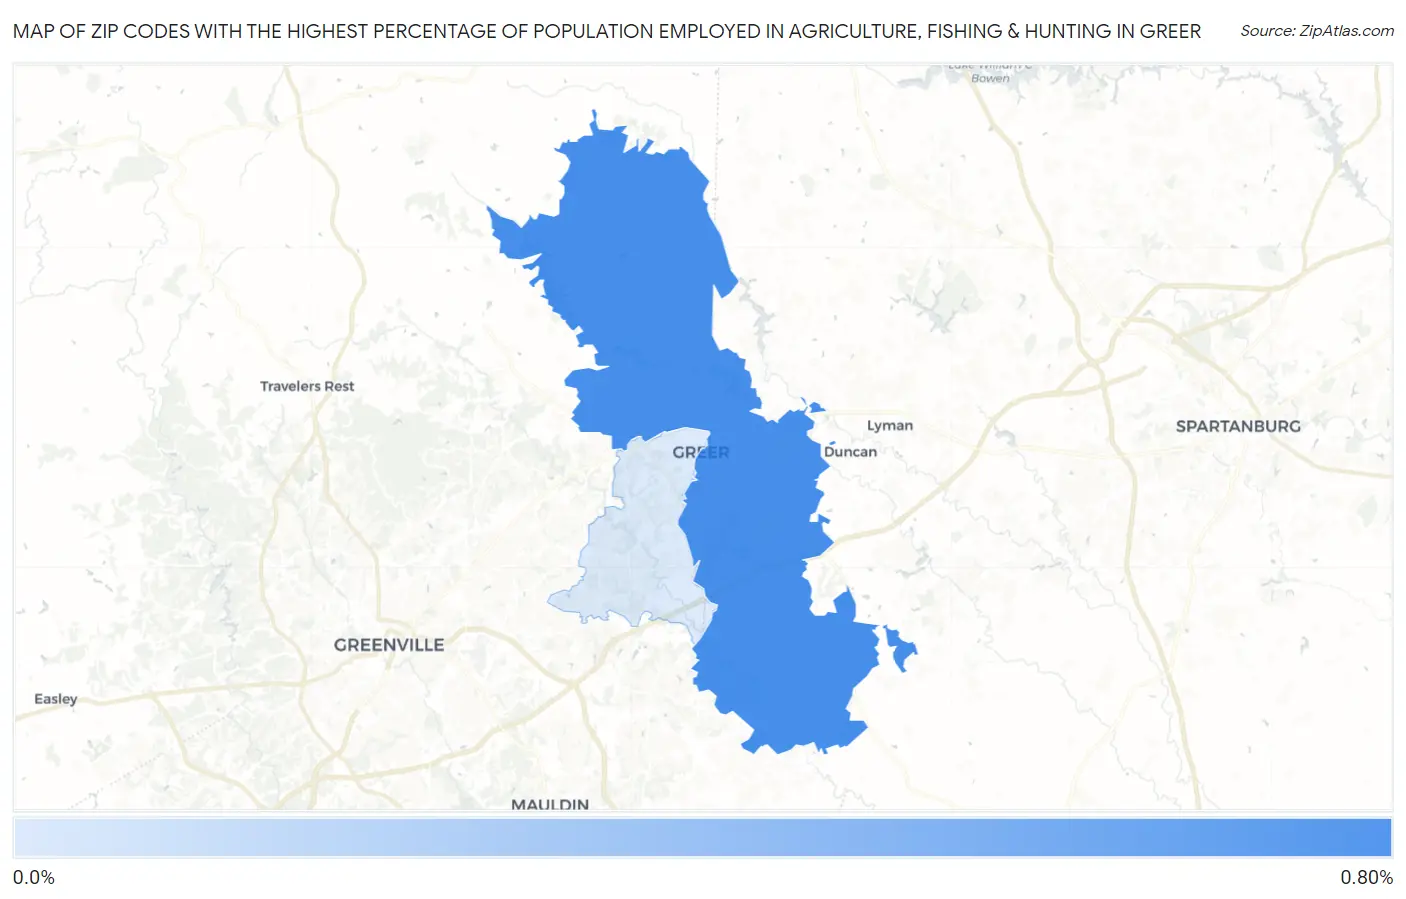
Map of Zip Codes with the Highest Percentage of Population Employed in Agriculture, Fishing & Hunting in Greer
0.0%
0.80%
Zip Codes with the Highest Percentage of Population Employed in Agriculture, Fishing & Hunting in Greer, SC
| Zip Code | % Employed | vs State | vs National | |
| 1. | 29651 | 0.78% | 0.78%(+0.003)#181 | 1.2%(-0.419)#17,359 |
| 2. | 29650 | 0.15% | 0.78%(-0.626)#282 | 1.2%(-1.05)#22,984 |
1
Common Questions
What are the Top Zip Codes with the Highest Percentage of Population Employed in Agriculture, Fishing & Hunting in Greer, SC?
Top Zip Codes with the Highest Percentage of Population Employed in Agriculture, Fishing & Hunting in Greer, SC are:
What zip code has the Highest Percentage of Population Employed in Agriculture, Fishing & Hunting in Greer, SC?
29651 has the Highest Percentage of Population Employed in Agriculture, Fishing & Hunting in Greer, SC with 0.78%.
What is the Percentage of Population Employed in Agriculture, Fishing & Hunting in Greer, SC?
Percentage of Population Employed in Agriculture, Fishing & Hunting in Greer is 0.27%.
What is the Percentage of Population Employed in Agriculture, Fishing & Hunting in South Carolina?
Percentage of Population Employed in Agriculture, Fishing & Hunting in South Carolina is 0.78%.
What is the Percentage of Population Employed in Agriculture, Fishing & Hunting in the United States?
Percentage of Population Employed in Agriculture, Fishing & Hunting in the United States is 1.2%.