Zip Codes with the Highest Percentage of Population Employed in Agriculture, Fishing & Hunting in Greenwood, SC
RELATED REPORTS & OPTIONS
Agriculture, Fishing & Hunting
Greenwood
Compare Zip Codes
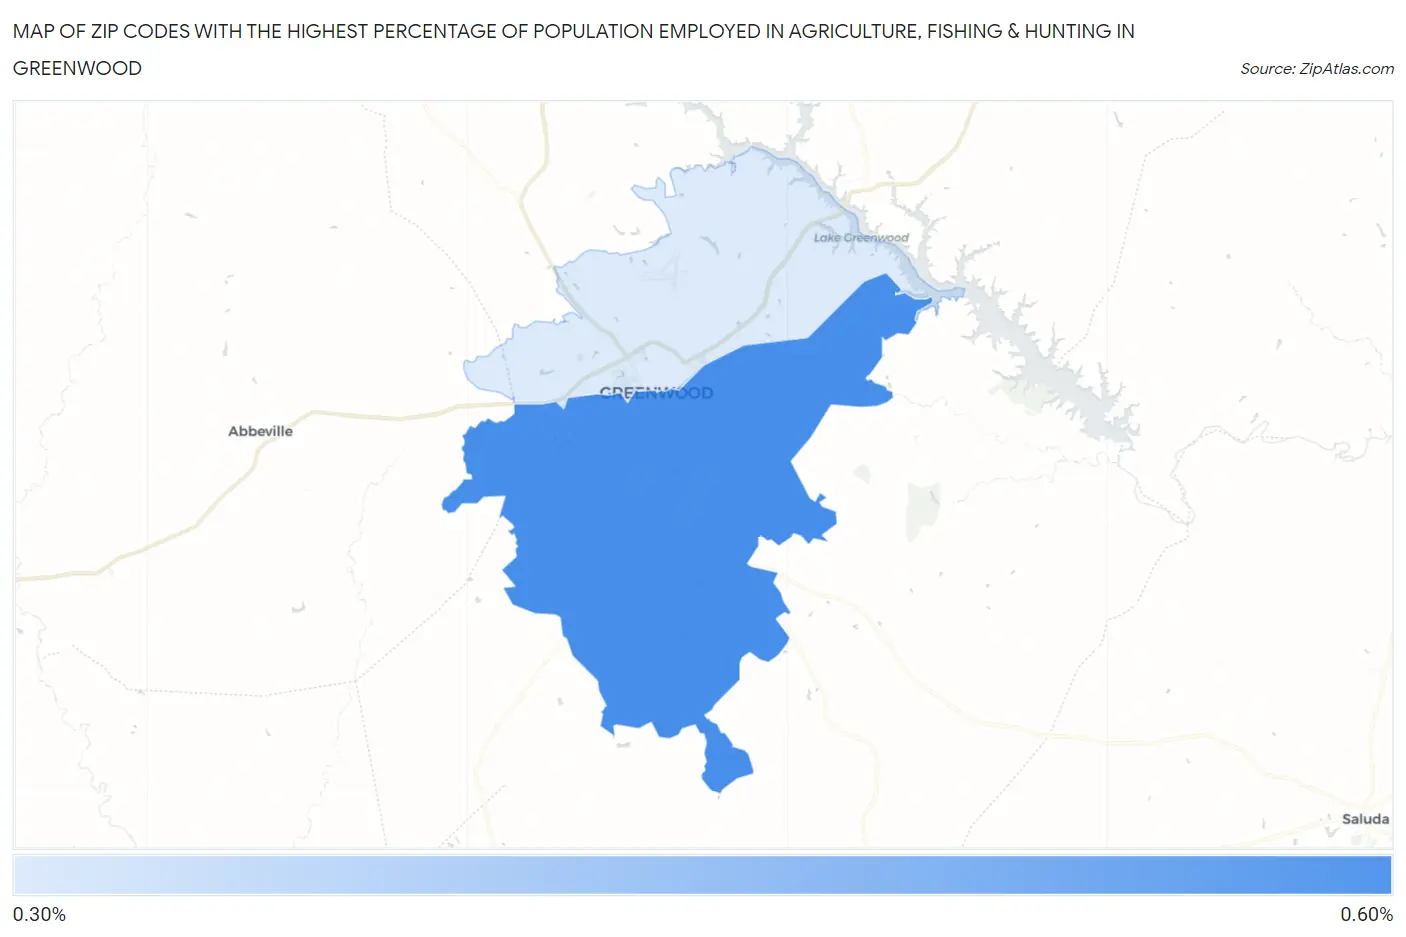
Map of Zip Codes with the Highest Percentage of Population Employed in Agriculture, Fishing & Hunting in Greenwood
0.0%
0.60%
Zip Codes with the Highest Percentage of Population Employed in Agriculture, Fishing & Hunting in Greenwood, SC
| Zip Code | % Employed | vs State | vs National | |
| 1. | 29646 | 0.59% | 0.78%(-0.191)#204 | 1.2%(-0.612)#18,571 |
| 2. | 29649 | 0.31% | 0.78%(-0.468)#260 | 1.2%(-0.889)#21,059 |
1
Common Questions
What are the Top Zip Codes with the Highest Percentage of Population Employed in Agriculture, Fishing & Hunting in Greenwood, SC?
Top Zip Codes with the Highest Percentage of Population Employed in Agriculture, Fishing & Hunting in Greenwood, SC are:
What zip code has the Highest Percentage of Population Employed in Agriculture, Fishing & Hunting in Greenwood, SC?
29646 has the Highest Percentage of Population Employed in Agriculture, Fishing & Hunting in Greenwood, SC with 0.59%.
What is the Percentage of Population Employed in Agriculture, Fishing & Hunting in Greenwood, SC?
Percentage of Population Employed in Agriculture, Fishing & Hunting in Greenwood is 0.13%.
What is the Percentage of Population Employed in Agriculture, Fishing & Hunting in South Carolina?
Percentage of Population Employed in Agriculture, Fishing & Hunting in South Carolina is 0.78%.
What is the Percentage of Population Employed in Agriculture, Fishing & Hunting in the United States?
Percentage of Population Employed in Agriculture, Fishing & Hunting in the United States is 1.2%.