Wynnewood, OK Map & Demographics
Wynnewood Map
Wynnewood Overview
$23,507
PER CAPITA INCOME
$43,000
AVG FAMILY INCOME
$39,327
AVG HOUSEHOLD INCOME
26.9%
WAGE / INCOME GAP [ % ]
73.1¢/ $1
WAGE / INCOME GAP [ $ ]
0.48
INEQUALITY / GINI INDEX
1,767
TOTAL POPULATION
907
MALE POPULATION
860
FEMALE POPULATION
105.47
MALES / 100 FEMALES
94.82
FEMALES / 100 MALES
38.1
MEDIAN AGE
3.5
AVG FAMILY SIZE
2.8
AVG HOUSEHOLD SIZE
732
LABOR FORCE [ PEOPLE ]
54.9%
PERCENT IN LABOR FORCE
4.5%
UNEMPLOYMENT RATE
Wynnewood Zip Codes
Income in Wynnewood
Income Overview in Wynnewood
Per Capita Income in Wynnewood is $23,507, while median incomes of families and households are $43,000 and $39,327 respectively.
| Characteristic | Number | Measure |
| Per Capita Income | 1,767 | $23,507 |
| Median Family Income | 388 | $43,000 |
| Mean Family Income | 388 | $60,962 |
| Median Household Income | 628 | $39,327 |
| Mean Household Income | 628 | $59,008 |
| Income Deficit | 388 | $0 |
| Wage / Income Gap (%) | 1,767 | 26.91% |
| Wage / Income Gap ($) | 1,767 | 73.09¢ per $1 |
| Gini / Inequality Index | 1,767 | 0.48 |
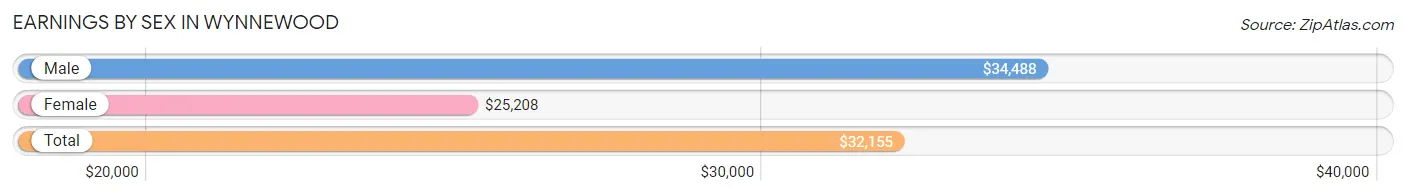
Earnings by Sex in Wynnewood
Average Earnings in Wynnewood are $32,155, $34,488 for men and $25,208 for women, a difference of 26.9%.
| Sex | Number | Average Earnings |
| Male | 403 (54.9%) | $34,488 |
| Female | 331 (45.1%) | $25,208 |
| Total | 734 (100.0%) | $32,155 |
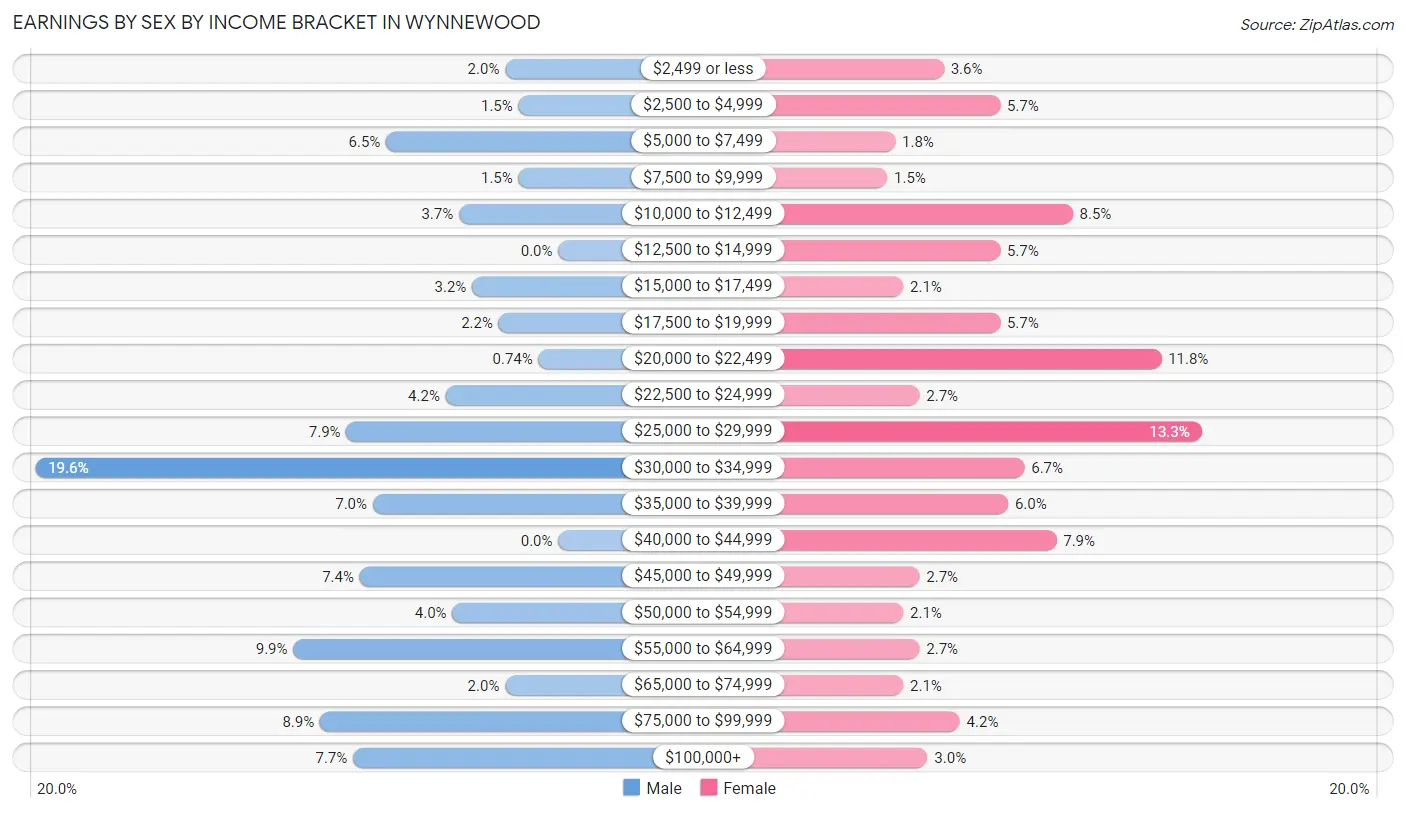
Earnings by Sex by Income Bracket in Wynnewood
The most common earnings brackets in Wynnewood are $30,000 to $34,999 for men (79 | 19.6%) and $25,000 to $29,999 for women (44 | 13.3%).
| Income | Male | Female |
| $2,499 or less | 8 (2.0%) | 12 (3.6%) |
| $2,500 to $4,999 | 6 (1.5%) | 19 (5.7%) |
| $5,000 to $7,499 | 26 (6.5%) | 6 (1.8%) |
| $7,500 to $9,999 | 6 (1.5%) | 5 (1.5%) |
| $10,000 to $12,499 | 15 (3.7%) | 28 (8.5%) |
| $12,500 to $14,999 | 0 (0.0%) | 19 (5.7%) |
| $15,000 to $17,499 | 13 (3.2%) | 7 (2.1%) |
| $17,500 to $19,999 | 9 (2.2%) | 19 (5.7%) |
| $20,000 to $22,499 | 3 (0.7%) | 39 (11.8%) |
| $22,500 to $24,999 | 17 (4.2%) | 9 (2.7%) |
| $25,000 to $29,999 | 32 (7.9%) | 44 (13.3%) |
| $30,000 to $34,999 | 79 (19.6%) | 22 (6.7%) |
| $35,000 to $39,999 | 28 (7.0%) | 20 (6.0%) |
| $40,000 to $44,999 | 0 (0.0%) | 26 (7.9%) |
| $45,000 to $49,999 | 30 (7.4%) | 9 (2.7%) |
| $50,000 to $54,999 | 16 (4.0%) | 7 (2.1%) |
| $55,000 to $64,999 | 40 (9.9%) | 9 (2.7%) |
| $65,000 to $74,999 | 8 (2.0%) | 7 (2.1%) |
| $75,000 to $99,999 | 36 (8.9%) | 14 (4.2%) |
| $100,000+ | 31 (7.7%) | 10 (3.0%) |
| Total | 403 (100.0%) | 331 (100.0%) |
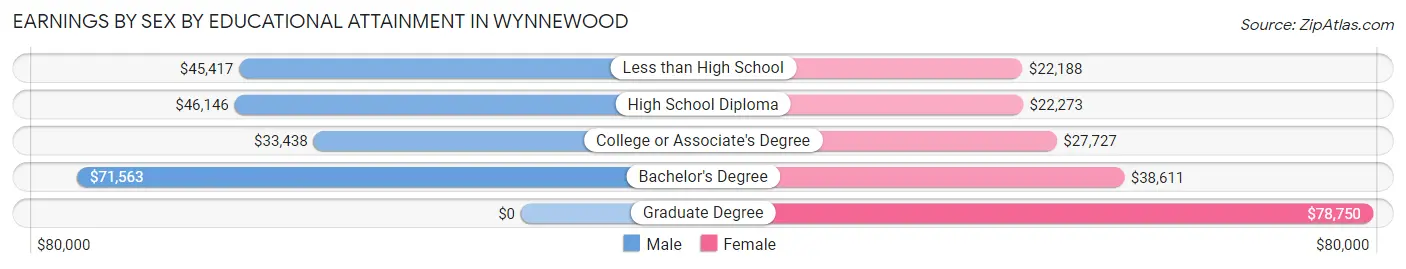
Earnings by Sex by Educational Attainment in Wynnewood
Average earnings in Wynnewood are $35,547 for men and $26,417 for women, a difference of 25.7%. Men with an educational attainment of bachelor's degree enjoy the highest average annual earnings of $71,563, while those with college or associate's degree education earn the least with $33,438. Women with an educational attainment of graduate degree earn the most with the average annual earnings of $78,750, while those with less than high school education have the smallest earnings of $22,188.
| Educational Attainment | Male Income | Female Income |
| Less than High School | $45,417 | $22,188 |
| High School Diploma | $46,146 | $22,273 |
| College or Associate's Degree | $33,438 | $27,727 |
| Bachelor's Degree | $71,563 | $38,611 |
| Graduate Degree | - | - |
| Total | $35,547 | $26,417 |
Family Income in Wynnewood
Family Income Brackets in Wynnewood
According to the Wynnewood family income data, there are 70 families falling into the $35,000 to $49,999 income range, which is the most common income bracket and makes up 18.0% of all families. Conversely, the $200,000+ income bracket is the least frequent group with only 10 families (2.6%) belonging to this category.
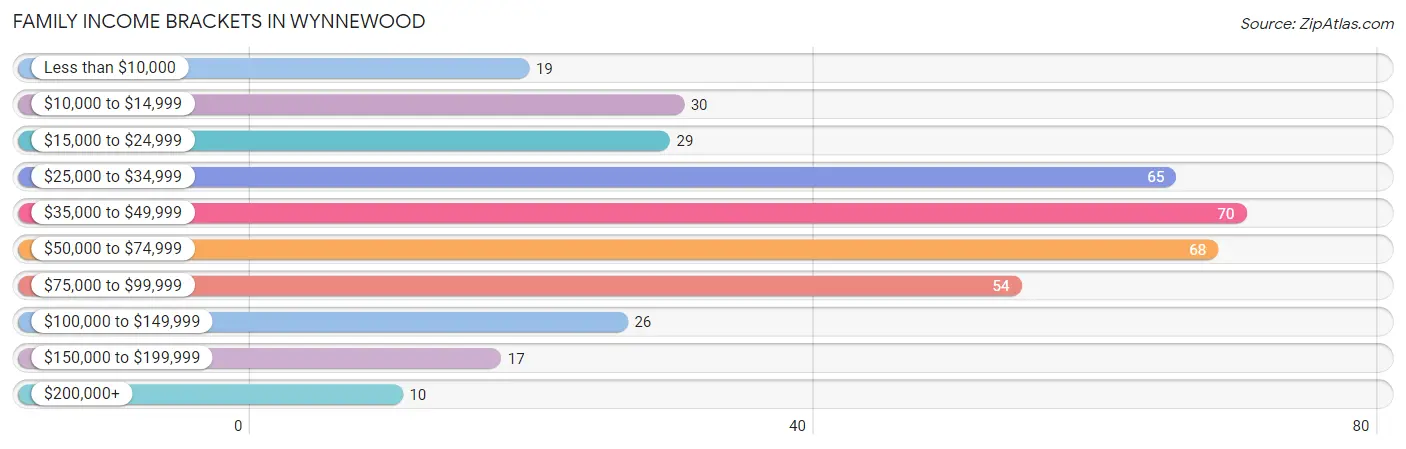
| Income Bracket | # Families | % Families |
| Less than $10,000 | 19 | 4.9% |
| $10,000 to $14,999 | 30 | 7.7% |
| $15,000 to $24,999 | 29 | 7.5% |
| $25,000 to $34,999 | 65 | 16.8% |
| $35,000 to $49,999 | 70 | 18.0% |
| $50,000 to $74,999 | 68 | 17.5% |
| $75,000 to $99,999 | 54 | 13.9% |
| $100,000 to $149,999 | 26 | 6.7% |
| $150,000 to $199,999 | 17 | 4.4% |
| $200,000+ | 10 | 2.6% |
Family Income by Famaliy Size in Wynnewood
2-person families (197 | 50.8%) account for the highest median family income in Wynnewood with $53,750 per family, while 2-person families (197 | 50.8%) have the highest median income of $26,875 per family member.
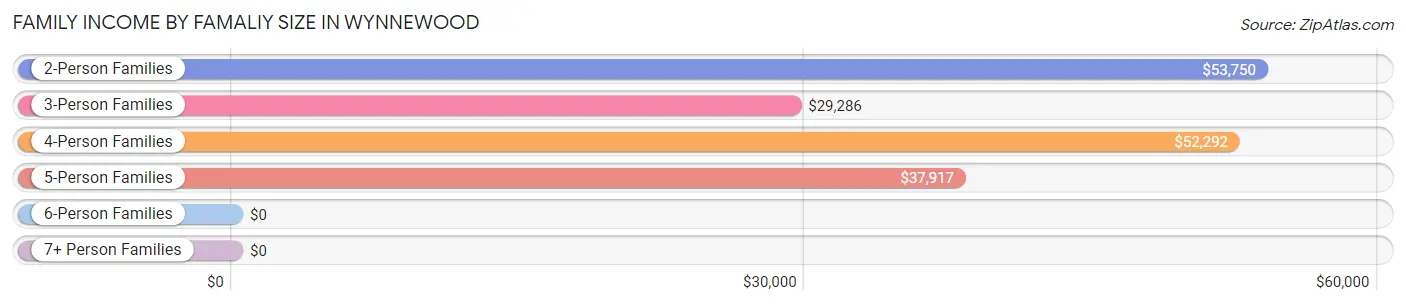
| Income Bracket | # Families | Median Income |
| 2-Person Families | 197 (50.8%) | $53,750 |
| 3-Person Families | 96 (24.7%) | $29,286 |
| 4-Person Families | 55 (14.2%) | $52,292 |
| 5-Person Families | 22 (5.7%) | $37,917 |
| 6-Person Families | 6 (1.5%) | $0 |
| 7+ Person Families | 12 (3.1%) | $0 |
| Total | 388 (100.0%) | $43,000 |
Family Income by Number of Earners in Wynnewood
The median family income in Wynnewood is $43,000, with families comprising 3+ earners (21) having the highest median family income of $190,625, while families with no earners (90) have the lowest median family income of $30,000, accounting for 5.4% and 23.2% of families, respectively.
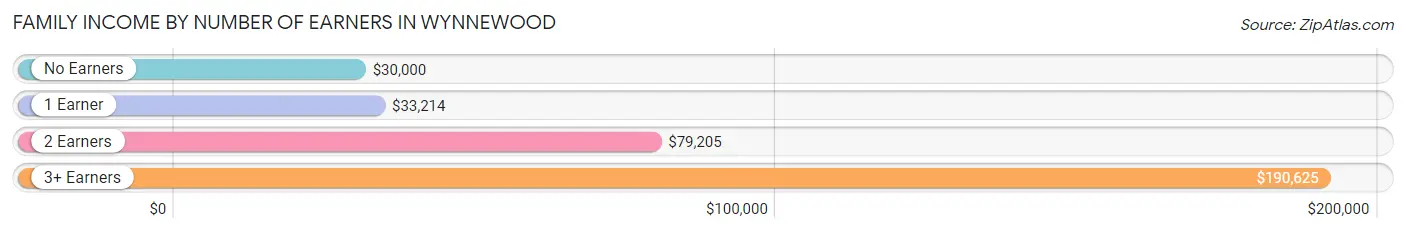
| Number of Earners | # Families | Median Income |
| No Earners | 90 (23.2%) | $30,000 |
| 1 Earner | 168 (43.3%) | $33,214 |
| 2 Earners | 109 (28.1%) | $79,205 |
| 3+ Earners | 21 (5.4%) | $190,625 |
| Total | 388 (100.0%) | $43,000 |
Household Income in Wynnewood
Household Income Brackets in Wynnewood
With 111 households falling in the category, the $50,000 to $74,999 income range is the most frequent in Wynnewood, accounting for 17.7% of all households. In contrast, only 11 households (1.8%) fall into the $150,000 to $199,999 income bracket, making it the least populous group.
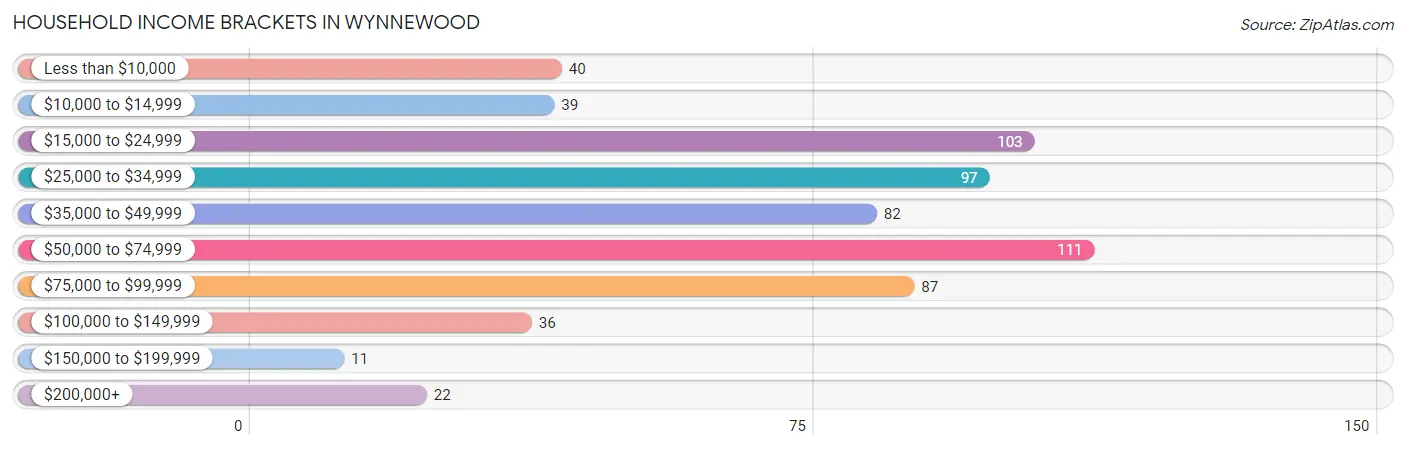
| Income Bracket | # Households | % Households |
| Less than $10,000 | 40 | 6.4% |
| $10,000 to $14,999 | 39 | 6.2% |
| $15,000 to $24,999 | 103 | 16.4% |
| $25,000 to $34,999 | 97 | 15.4% |
| $35,000 to $49,999 | 82 | 13.1% |
| $50,000 to $74,999 | 111 | 17.7% |
| $75,000 to $99,999 | 87 | 13.9% |
| $100,000 to $149,999 | 36 | 5.7% |
| $150,000 to $199,999 | 11 | 1.8% |
| $200,000+ | 22 | 3.5% |
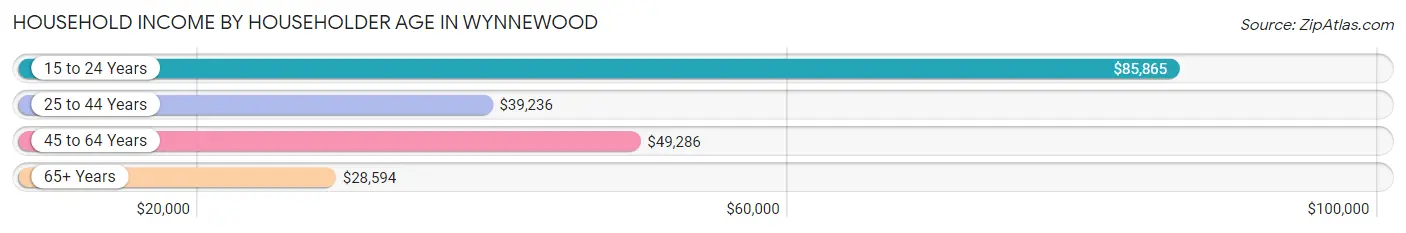
Household Income by Householder Age in Wynnewood
The median household income in Wynnewood is $39,327, with the highest median household income of $85,865 found in the 15 to 24 years age bracket for the primary householder. A total of 34 households (5.4%) fall into this category. Meanwhile, the 65+ years age bracket for the primary householder has the lowest median household income of $28,594, with 173 households (27.6%) in this group.
| Income Bracket | # Households | Median Income |
| 15 to 24 Years | 34 (5.4%) | $85,865 |
| 25 to 44 Years | 205 (32.6%) | $39,236 |
| 45 to 64 Years | 216 (34.4%) | $49,286 |
| 65+ Years | 173 (27.6%) | $28,594 |
| Total | 628 (100.0%) | $39,327 |
Poverty in Wynnewood
Income Below Poverty by Sex and Age in Wynnewood
With 23.7% poverty level for males and 29.2% for females among the residents of Wynnewood, 5 year old males and 12 to 14 year old females are the most vulnerable to poverty, with 7 males (100.0%) and 30 females (61.2%) in their respective age groups living below the poverty level.
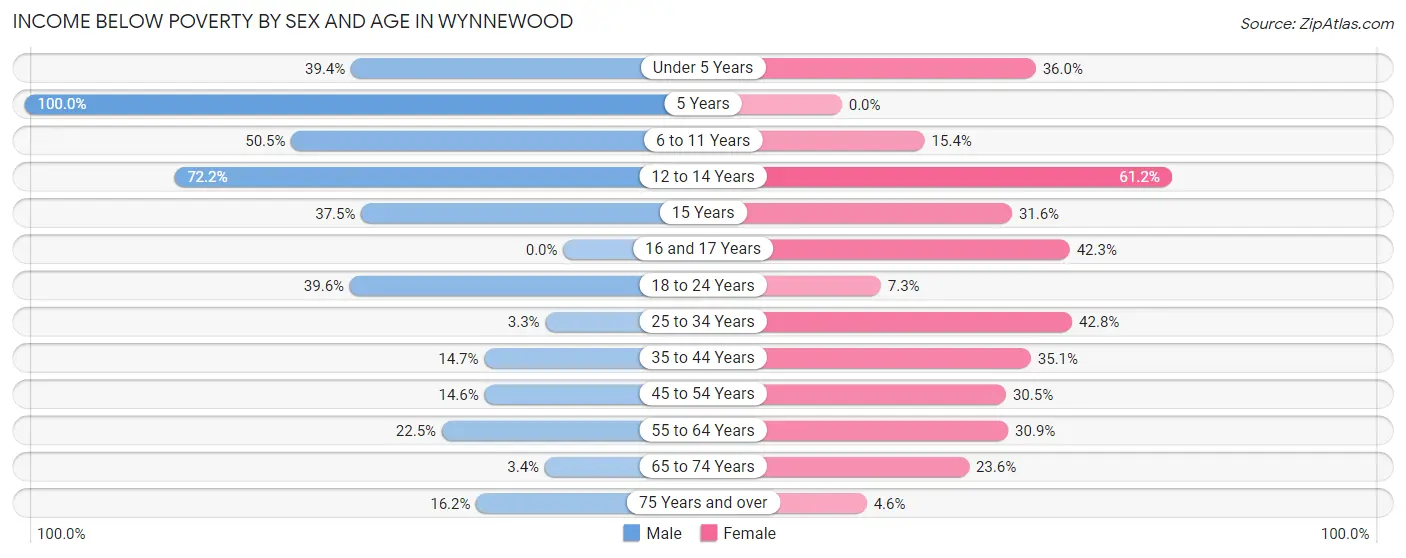
| Age Bracket | Male | Female |
| Under 5 Years | 26 (39.4%) | 9 (36.0%) |
| 5 Years | 7 (100.0%) | 0 (0.0%) |
| 6 to 11 Years | 52 (50.5%) | 10 (15.4%) |
| 12 to 14 Years | 26 (72.2%) | 30 (61.2%) |
| 15 Years | 3 (37.5%) | 6 (31.6%) |
| 16 and 17 Years | 0 (0.0%) | 11 (42.3%) |
| 18 to 24 Years | 21 (39.6%) | 5 (7.2%) |
| 25 to 34 Years | 2 (3.3%) | 65 (42.8%) |
| 35 to 44 Years | 17 (14.7%) | 40 (35.1%) |
| 45 to 54 Years | 12 (14.6%) | 32 (30.5%) |
| 55 to 64 Years | 16 (22.5%) | 21 (30.9%) |
| 65 to 74 Years | 4 (3.4%) | 17 (23.6%) |
| 75 Years and over | 16 (16.2%) | 3 (4.6%) |
| Total | 202 (23.7%) | 249 (29.2%) |
Income Above Poverty by Sex and Age in Wynnewood
According to the poverty statistics in Wynnewood, males aged 16 and 17 years and females aged 5 years are the age groups that are most secure financially, with 100.0% of males and 100.0% of females in these age groups living above the poverty line.
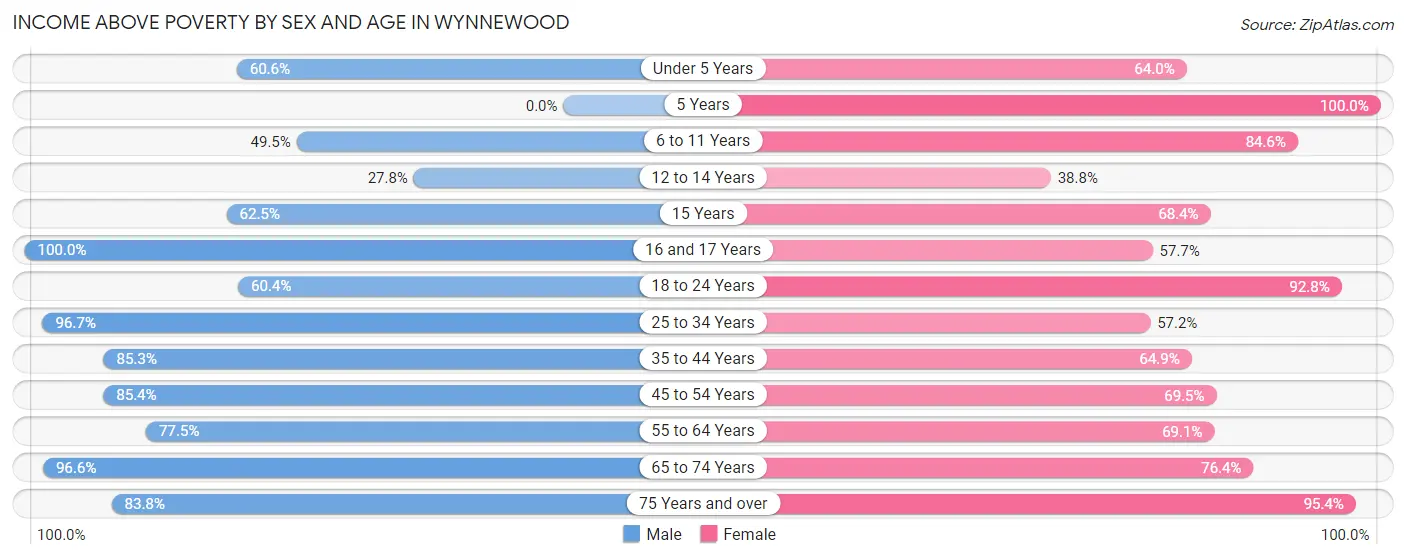
| Age Bracket | Male | Female |
| Under 5 Years | 40 (60.6%) | 16 (64.0%) |
| 5 Years | 0 (0.0%) | 23 (100.0%) |
| 6 to 11 Years | 51 (49.5%) | 55 (84.6%) |
| 12 to 14 Years | 10 (27.8%) | 19 (38.8%) |
| 15 Years | 5 (62.5%) | 13 (68.4%) |
| 16 and 17 Years | 33 (100.0%) | 15 (57.7%) |
| 18 to 24 Years | 32 (60.4%) | 64 (92.7%) |
| 25 to 34 Years | 58 (96.7%) | 87 (57.2%) |
| 35 to 44 Years | 99 (85.3%) | 74 (64.9%) |
| 45 to 54 Years | 70 (85.4%) | 73 (69.5%) |
| 55 to 64 Years | 55 (77.5%) | 47 (69.1%) |
| 65 to 74 Years | 113 (96.6%) | 55 (76.4%) |
| 75 Years and over | 83 (83.8%) | 62 (95.4%) |
| Total | 649 (76.3%) | 603 (70.8%) |
Income Below Poverty Among Married-Couple Families in Wynnewood
The poverty statistics for married-couple families in Wynnewood show that 12.3% or 27 of the total 220 families live below the poverty line. Families with 5 or more children have the highest poverty rate of 100.0%, comprising of 2 families. On the other hand, families with 3 or 4 children have the lowest poverty rate of 0.0%, which includes 0 families.
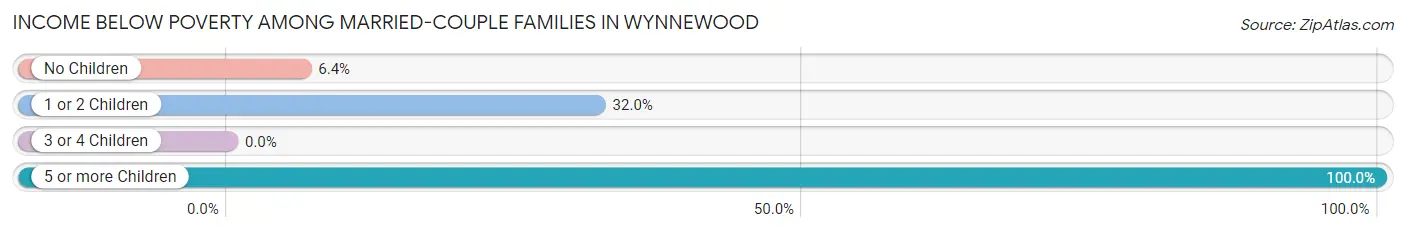
| Children | Above Poverty | Below Poverty |
| No Children | 132 (93.6%) | 9 (6.4%) |
| 1 or 2 Children | 34 (68.0%) | 16 (32.0%) |
| 3 or 4 Children | 27 (100.0%) | 0 (0.0%) |
| 5 or more Children | 0 (0.0%) | 2 (100.0%) |
| Total | 193 (87.7%) | 27 (12.3%) |
Income Below Poverty Among Single-Parent Households in Wynnewood
According to the poverty data in Wynnewood, 8.5% or 4 single-father households and 46.3% or 56 single-mother households are living below the poverty line. Among single-father households, those with 3 or 4 children have the highest poverty rate, with 4 households (26.7%) experiencing poverty. Likewise, among single-mother households, those with 3 or 4 children have the highest poverty rate, with 14 households (70.0%) falling below the poverty line.
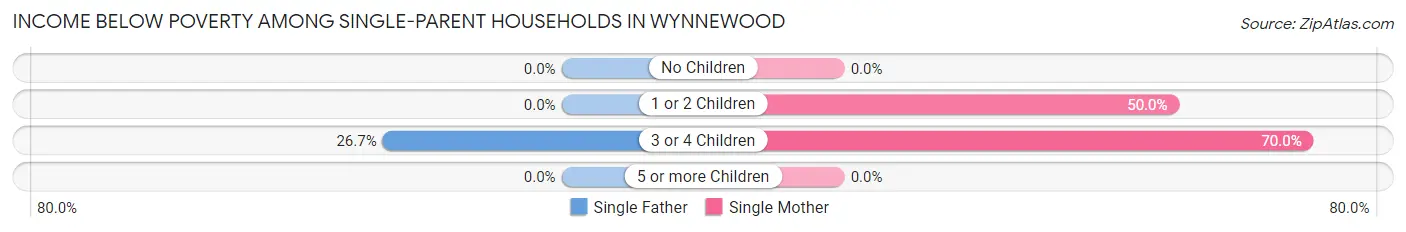
| Children | Single Father | Single Mother |
| No Children | 0 (0.0%) | 0 (0.0%) |
| 1 or 2 Children | 0 (0.0%) | 42 (50.0%) |
| 3 or 4 Children | 4 (26.7%) | 14 (70.0%) |
| 5 or more Children | 0 (0.0%) | 0 (0.0%) |
| Total | 4 (8.5%) | 56 (46.3%) |
Income Below Poverty Among Married-Couple vs Single-Parent Households in Wynnewood
The poverty data for Wynnewood shows that 27 of the married-couple family households (12.3%) and 60 of the single-parent households (35.7%) are living below the poverty level. Within the married-couple family households, those with 5 or more children have the highest poverty rate, with 2 households (100.0%) falling below the poverty line. Among the single-parent households, those with 3 or 4 children have the highest poverty rate, with 18 household (51.4%) living below poverty.
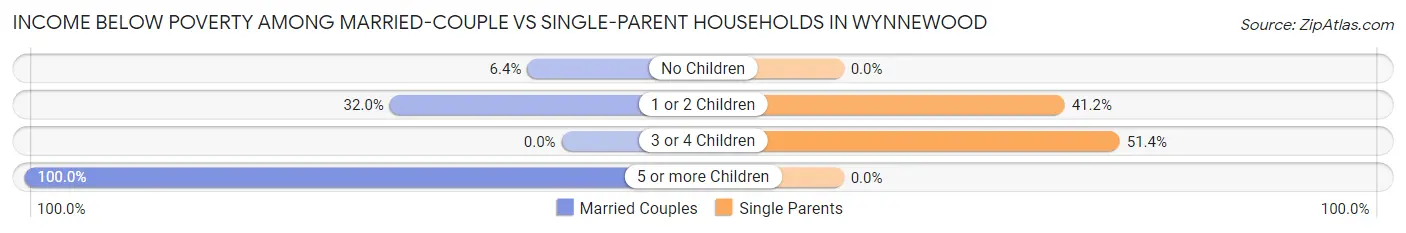
| Children | Married-Couple Families | Single-Parent Households |
| No Children | 9 (6.4%) | 0 (0.0%) |
| 1 or 2 Children | 16 (32.0%) | 42 (41.2%) |
| 3 or 4 Children | 0 (0.0%) | 18 (51.4%) |
| 5 or more Children | 2 (100.0%) | 0 (0.0%) |
| Total | 27 (12.3%) | 60 (35.7%) |
Race in Wynnewood
The most populous races in Wynnewood are White / Caucasian (1,297 | 73.4%), Two or more Races (307 | 17.4%), and Hispanic or Latino (211 | 11.9%).
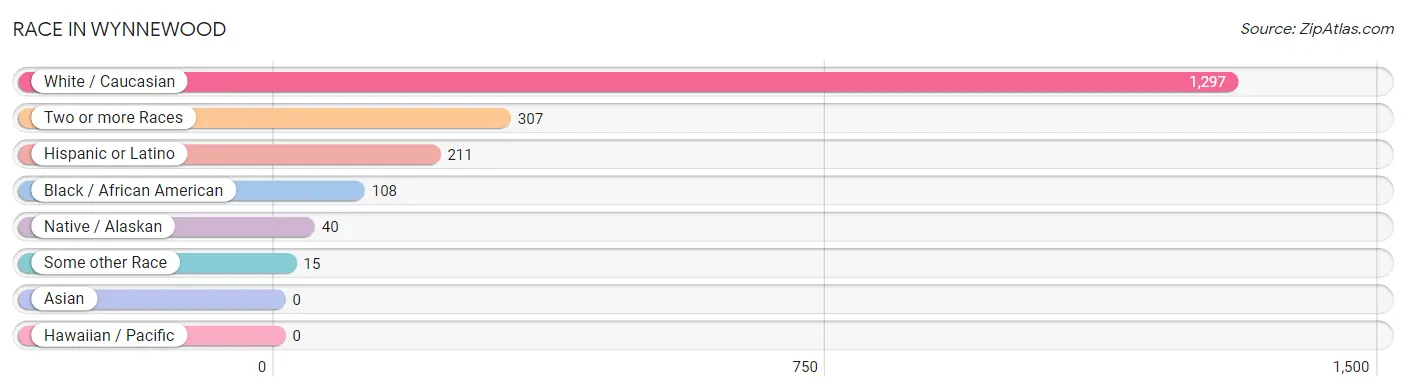
| Race | # Population | % Population |
| Asian | 0 | 0.0% |
| Black / African American | 108 | 6.1% |
| Hawaiian / Pacific | 0 | 0.0% |
| Hispanic or Latino | 211 | 11.9% |
| Native / Alaskan | 40 | 2.3% |
| White / Caucasian | 1,297 | 73.4% |
| Two or more Races | 307 | 17.4% |
| Some other Race | 15 | 0.9% |
| Total | 1,767 | 100.0% |
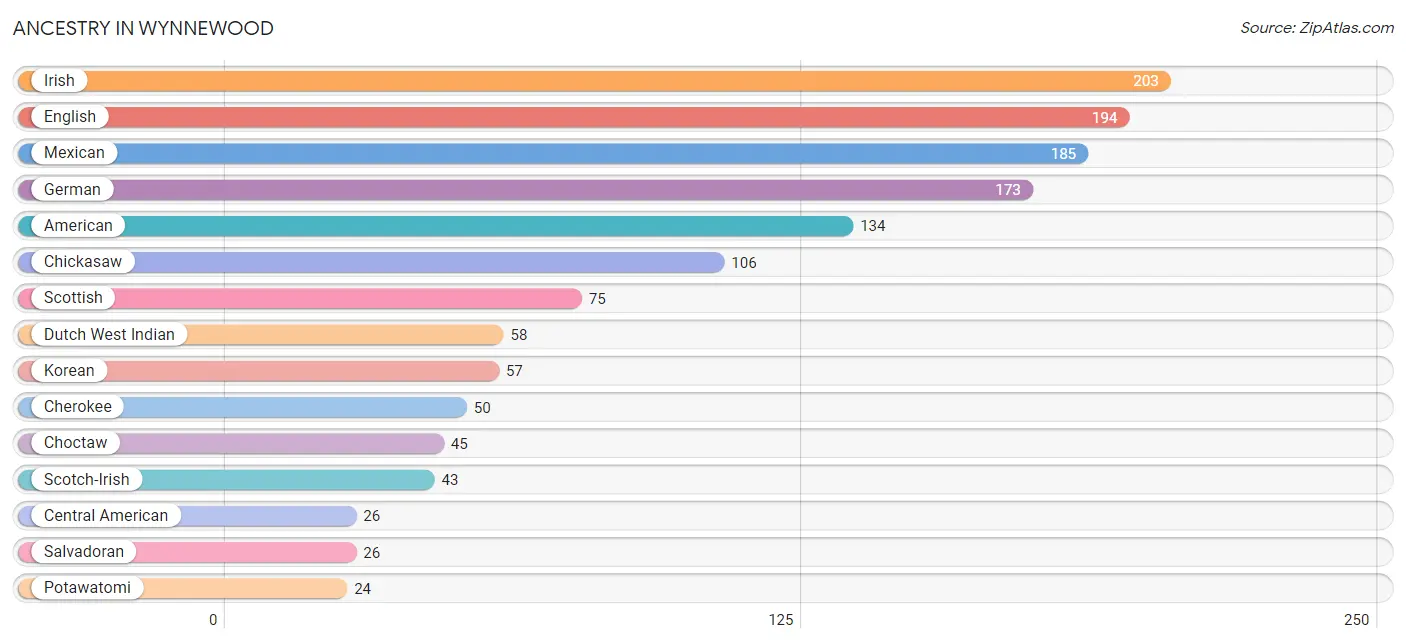
Ancestry in Wynnewood
The most populous ancestries reported in Wynnewood are Irish (203 | 11.5%), English (194 | 11.0%), Mexican (185 | 10.5%), German (173 | 9.8%), and American (134 | 7.6%), together accounting for 50.3% of all Wynnewood residents.
| Ancestry | # Population | % Population |
| African | 1 | 0.1% |
| American | 134 | 7.6% |
| Apache | 13 | 0.7% |
| Arab | 6 | 0.3% |
| Austrian | 16 | 0.9% |
| British | 3 | 0.2% |
| Central American | 26 | 1.5% |
| Cherokee | 50 | 2.8% |
| Chickasaw | 106 | 6.0% |
| Choctaw | 45 | 2.5% |
| Creek | 14 | 0.8% |
| Czechoslovakian | 7 | 0.4% |
| Danish | 5 | 0.3% |
| Dutch | 6 | 0.3% |
| Dutch West Indian | 58 | 3.3% |
| English | 194 | 11.0% |
| European | 9 | 0.5% |
| French | 4 | 0.2% |
| German | 173 | 9.8% |
| Irish | 203 | 11.5% |
| Italian | 10 | 0.6% |
| Korean | 57 | 3.2% |
| Lebanese | 6 | 0.3% |
| Mexican | 185 | 10.5% |
| Nigerian | 4 | 0.2% |
| Polish | 5 | 0.3% |
| Portuguese | 12 | 0.7% |
| Potawatomi | 24 | 1.4% |
| Salvadoran | 26 | 1.5% |
| Scandinavian | 2 | 0.1% |
| Scotch-Irish | 43 | 2.4% |
| Scottish | 75 | 4.2% |
| Subsaharan African | 5 | 0.3% |
| Swedish | 7 | 0.4% | View All 34 Rows |
Immigrants in Wynnewood
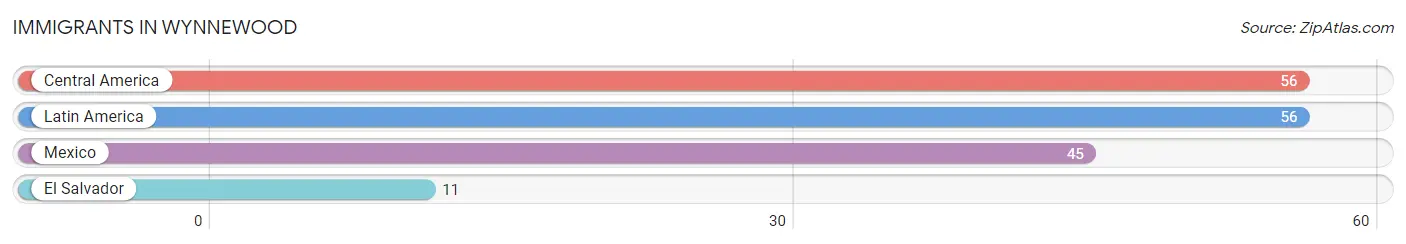
The most numerous immigrant groups reported in Wynnewood came from Central America (56 | 3.2%), Latin America (56 | 3.2%), Mexico (45 | 2.5%), and El Salvador (11 | 0.6%), together accounting for 9.5% of all Wynnewood residents.
| Immigration Origin | # Population | % Population |
| Central America | 56 | 3.2% |
| El Salvador | 11 | 0.6% |
| Latin America | 56 | 3.2% |
| Mexico | 45 | 2.5% | View All 4 Rows |
Sex and Age in Wynnewood
Sex and Age in Wynnewood
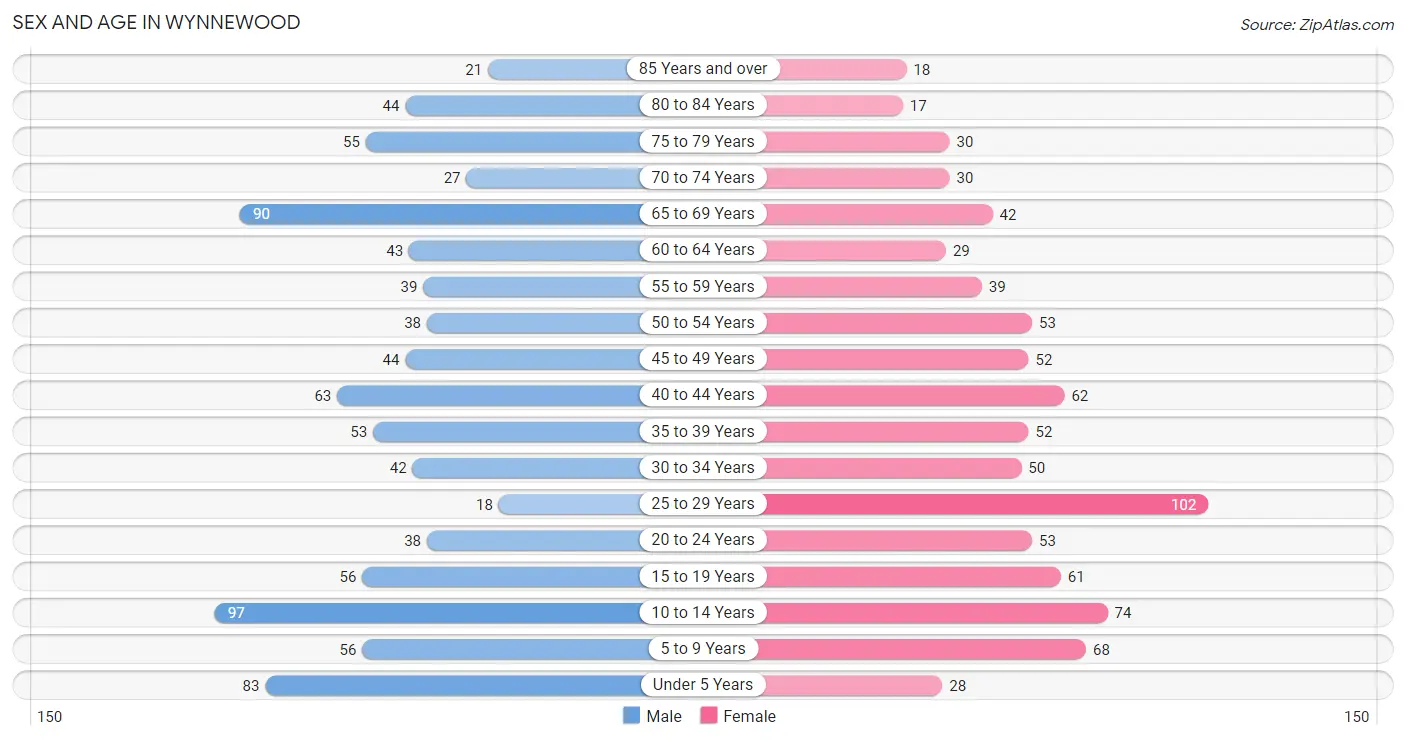
The most populous age groups in Wynnewood are 10 to 14 Years (97 | 10.7%) for men and 25 to 29 Years (102 | 11.9%) for women.
| Age Bracket | Male | Female |
| Under 5 Years | 83 (9.1%) | 28 (3.3%) |
| 5 to 9 Years | 56 (6.2%) | 68 (7.9%) |
| 10 to 14 Years | 97 (10.7%) | 74 (8.6%) |
| 15 to 19 Years | 56 (6.2%) | 61 (7.1%) |
| 20 to 24 Years | 38 (4.2%) | 53 (6.2%) |
| 25 to 29 Years | 18 (2.0%) | 102 (11.9%) |
| 30 to 34 Years | 42 (4.6%) | 50 (5.8%) |
| 35 to 39 Years | 53 (5.8%) | 52 (6.0%) |
| 40 to 44 Years | 63 (7.0%) | 62 (7.2%) |
| 45 to 49 Years | 44 (4.9%) | 52 (6.0%) |
| 50 to 54 Years | 38 (4.2%) | 53 (6.2%) |
| 55 to 59 Years | 39 (4.3%) | 39 (4.5%) |
| 60 to 64 Years | 43 (4.7%) | 29 (3.4%) |
| 65 to 69 Years | 90 (9.9%) | 42 (4.9%) |
| 70 to 74 Years | 27 (3.0%) | 30 (3.5%) |
| 75 to 79 Years | 55 (6.1%) | 30 (3.5%) |
| 80 to 84 Years | 44 (4.9%) | 17 (2.0%) |
| 85 Years and over | 21 (2.3%) | 18 (2.1%) |
| Total | 907 (100.0%) | 860 (100.0%) |
Families and Households in Wynnewood
Median Family Size in Wynnewood
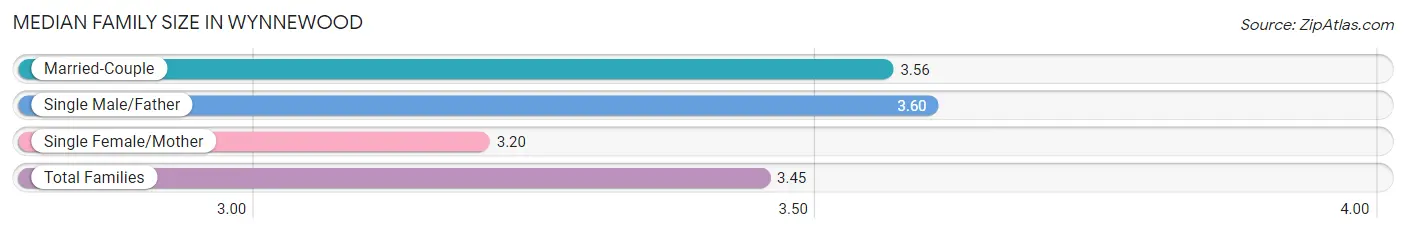
The median family size in Wynnewood is 3.45 persons per family, with single male/father families (47 | 12.1%) accounting for the largest median family size of 3.6 persons per family. On the other hand, single female/mother families (121 | 31.2%) represent the smallest median family size with 3.20 persons per family.
| Family Type | # Families | Family Size |
| Married-Couple | 220 (56.7%) | 3.56 |
| Single Male/Father | 47 (12.1%) | 3.60 |
| Single Female/Mother | 121 (31.2%) | 3.20 |
| Total Families | 388 (100.0%) | 3.45 |
Median Household Size in Wynnewood
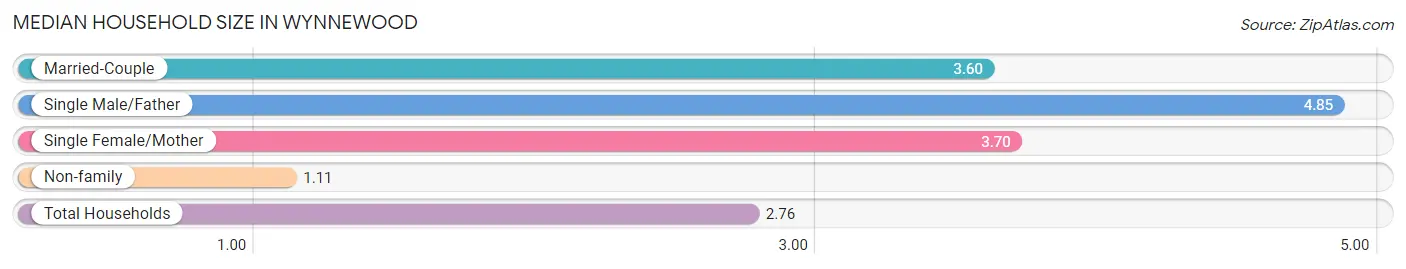
The median household size in Wynnewood is 2.76 persons per household, with single male/father households (47 | 7.5%) accounting for the largest median household size of 4.85 persons per household. non-family households (240 | 38.2%) represent the smallest median household size with 1.11 persons per household.
| Household Type | # Households | Household Size |
| Married-Couple | 220 (35.0%) | 3.60 |
| Single Male/Father | 47 (7.5%) | 4.85 |
| Single Female/Mother | 121 (19.3%) | 3.70 |
| Non-family | 240 (38.2%) | 1.11 |
| Total Households | 628 (100.0%) | 2.76 |
Household Size by Marriage Status in Wynnewood
Out of a total of 628 households in Wynnewood, 388 (61.8%) are family households, while 240 (38.2%) are nonfamily households. The most numerous type of family households are 2-person households, comprising 174, and the most common type of nonfamily households are 1-person households, comprising 214.
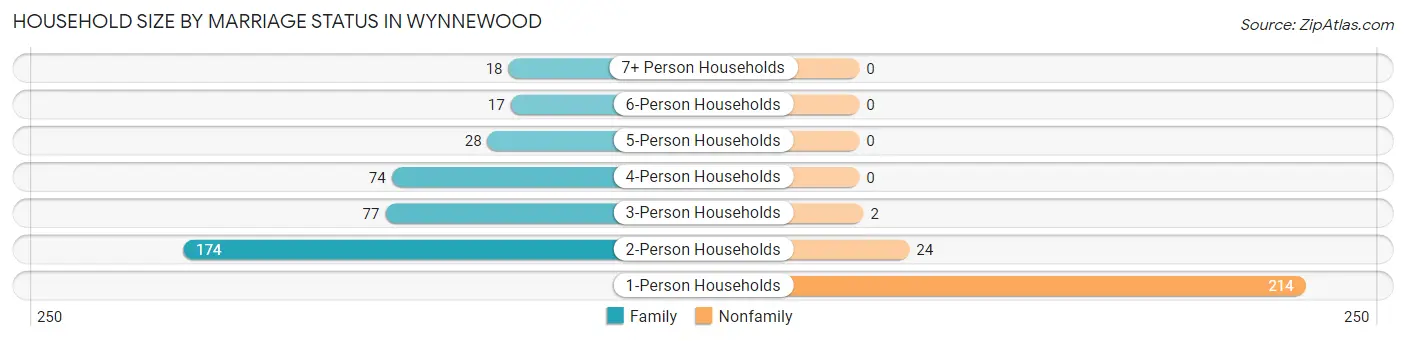
| Household Size | Family Households | Nonfamily Households |
| 1-Person Households | - | 214 (34.1%) |
| 2-Person Households | 174 (27.7%) | 24 (3.8%) |
| 3-Person Households | 77 (12.3%) | 2 (0.3%) |
| 4-Person Households | 74 (11.8%) | 0 (0.0%) |
| 5-Person Households | 28 (4.5%) | 0 (0.0%) |
| 6-Person Households | 17 (2.7%) | 0 (0.0%) |
| 7+ Person Households | 18 (2.9%) | 0 (0.0%) |
| Total | 388 (61.8%) | 240 (38.2%) |
Female Fertility in Wynnewood
Fertility by Age in Wynnewood
Average fertility rate in Wynnewood is 99.0 births per 1,000 women. Women in the age bracket of 20 to 34 years have the highest fertility rate with 200.0 births per 1,000 women. Women in the age bracket of 20 to 34 years acount for 91.1% of all women with births.
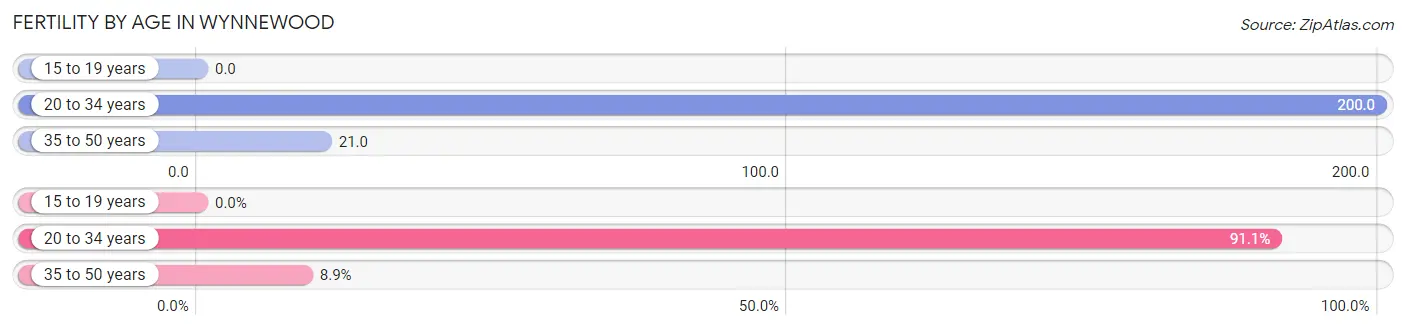
| Age Bracket | Women with Births | Births / 1,000 Women |
| 15 to 19 years | 0 (0.0%) | 0.0 |
| 20 to 34 years | 41 (91.1%) | 200.0 |
| 35 to 50 years | 4 (8.9%) | 21.0 |
| Total | 45 (100.0%) | 99.0 |
Fertility by Age by Marriage Status in Wynnewood
55.6% of women with births (45) in Wynnewood are married. The highest percentage of unmarried women with births falls into 20 to 34 years age bracket with 48.8% of them unmarried at the time of birth, while the lowest percentage of unmarried women with births belong to 35 to 50 years age bracket with 0.0% of them unmarried.
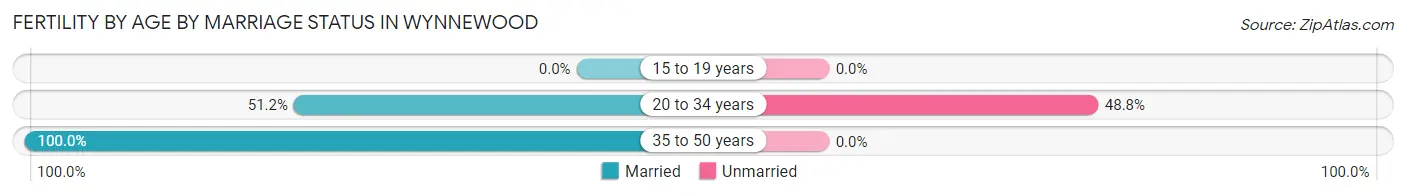
| Age Bracket | Married | Unmarried |
| 15 to 19 years | 0 (0.0%) | 0 (0.0%) |
| 20 to 34 years | 21 (51.2%) | 20 (48.8%) |
| 35 to 50 years | 4 (100.0%) | 0 (0.0%) |
| Total | 25 (55.6%) | 20 (44.4%) |
Fertility by Education in Wynnewood
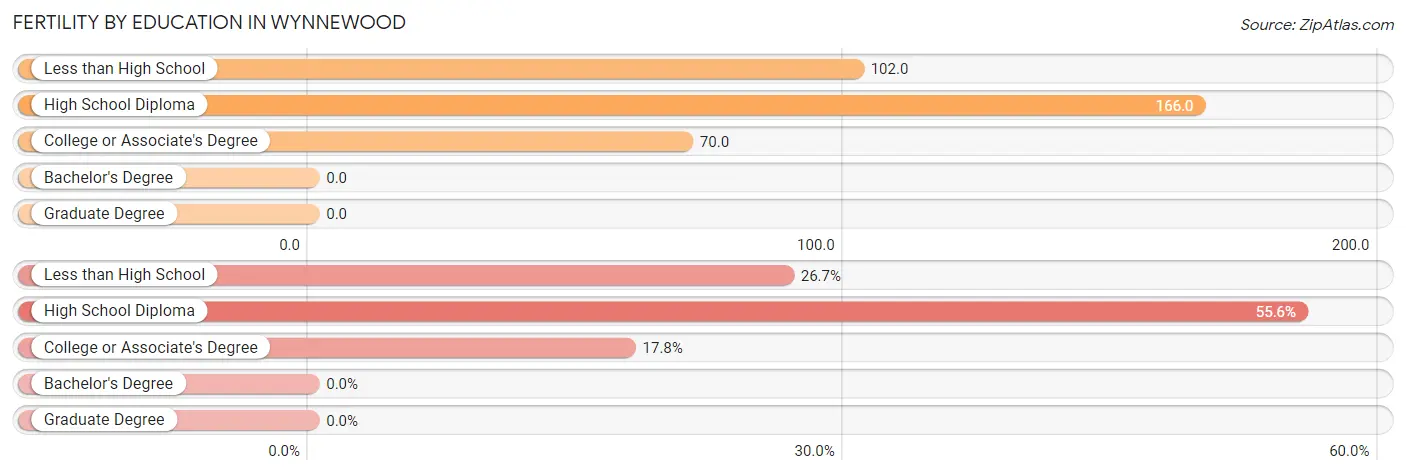
| Educational Attainment | Women with Births | Births / 1,000 Women |
| Less than High School | 12 (26.7%) | 102.0 |
| High School Diploma | 25 (55.6%) | 166.0 |
| College or Associate's Degree | 8 (17.8%) | 70.0 |
| Bachelor's Degree | 0 (0.0%) | 0.0 |
| Graduate Degree | 0 (0.0%) | 0.0 |
| Total | 45 (100.0%) | 99.0 |
Fertility by Education by Marriage Status in Wynnewood
44.4% of women with births in Wynnewood are unmarried. Women with the educational attainment of high school diploma are most likely to be married with 100.0% of them married at childbirth, while women with the educational attainment of less than high school are least likely to be married with 100.0% of them unmarried at childbirth.
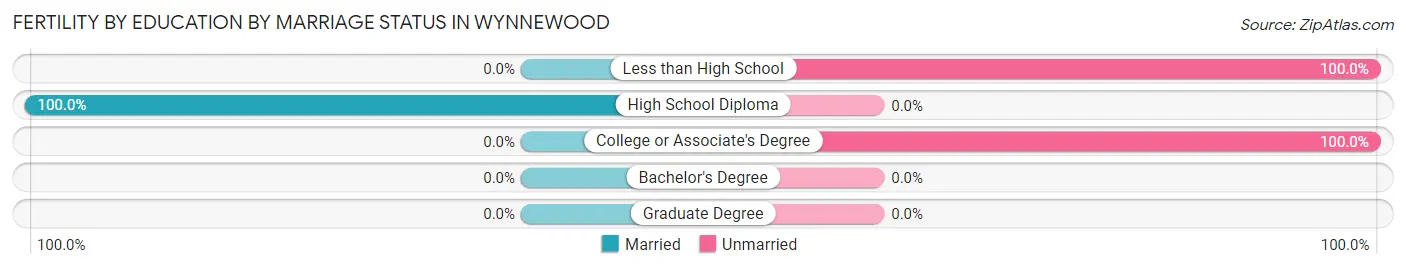
| Educational Attainment | Married | Unmarried |
| Less than High School | 0 (0.0%) | 12 (100.0%) |
| High School Diploma | 25 (100.0%) | 0 (0.0%) |
| College or Associate's Degree | 0 (0.0%) | 8 (100.0%) |
| Bachelor's Degree | 0 (0.0%) | 0 (0.0%) |
| Graduate Degree | 0 (0.0%) | 0 (0.0%) |
| Total | 25 (55.6%) | 20 (44.4%) |
Employment Characteristics in Wynnewood
Employment by Class of Employer in Wynnewood
Among the 699 employed individuals in Wynnewood, private company employees (500 | 71.5%), local government employees (87 | 12.4%), and state government employees (26 | 3.7%) make up the most common classes of employment.
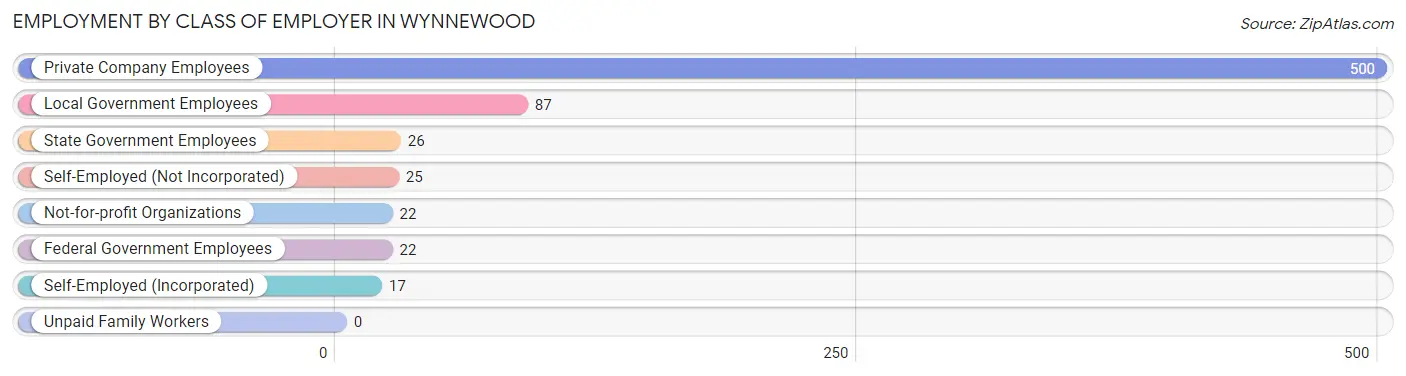
| Employer Class | # Employees | % Employees |
| Private Company Employees | 500 | 71.5% |
| Self-Employed (Incorporated) | 17 | 2.4% |
| Self-Employed (Not Incorporated) | 25 | 3.6% |
| Not-for-profit Organizations | 22 | 3.2% |
| Local Government Employees | 87 | 12.4% |
| State Government Employees | 26 | 3.7% |
| Federal Government Employees | 22 | 3.2% |
| Unpaid Family Workers | 0 | 0.0% |
| Total | 699 | 100.0% |
Employment Status by Age in Wynnewood
According to the labor force statistics for Wynnewood, out of the total population over 16 years of age (1,334), 54.9% or 732 individuals are in the labor force, with 4.5% or 33 of them unemployed. The age group with the highest labor force participation rate is 30 to 34 years, with 94.6% or 87 individuals in the labor force. Within the labor force, the 20 to 24 years age range has the highest percentage of unemployed individuals, with 28.6% or 20 of them being unemployed.
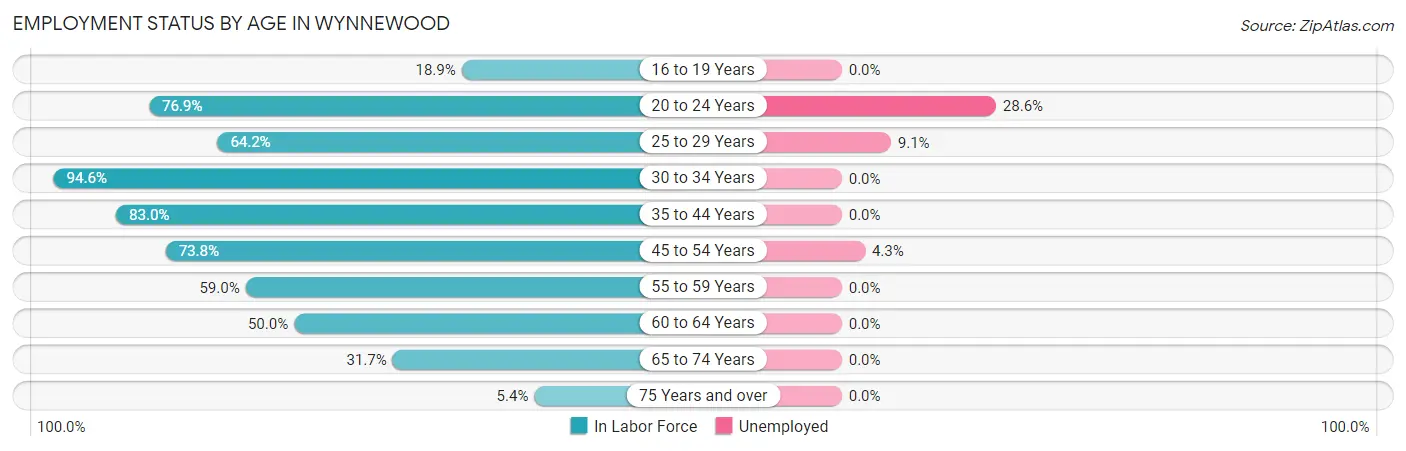
| Age Bracket | In Labor Force | Unemployed |
| 16 to 19 Years | 17 (18.9%) | 0 (0.0%) |
| 20 to 24 Years | 70 (76.9%) | 20 (28.6%) |
| 25 to 29 Years | 77 (64.2%) | 7 (9.1%) |
| 30 to 34 Years | 87 (94.6%) | 0 (0.0%) |
| 35 to 44 Years | 191 (83.0%) | 0 (0.0%) |
| 45 to 54 Years | 138 (73.8%) | 6 (4.3%) |
| 55 to 59 Years | 46 (59.0%) | 0 (0.0%) |
| 60 to 64 Years | 36 (50.0%) | 0 (0.0%) |
| 65 to 74 Years | 60 (31.7%) | 0 (0.0%) |
| 75 Years and over | 10 (5.4%) | 0 (0.0%) |
| Total | 732 (54.9%) | 33 (4.5%) |
Employment Status by Educational Attainment in Wynnewood
According to labor force statistics for Wynnewood, 73.8% of individuals (575) out of the total population between 25 and 64 years of age (779) are in the labor force, with 2.3% or 13 of them being unemployed. The group with the highest labor force participation rate are those with the educational attainment of bachelor's degree or higher, with 91.9% or 113 individuals in the labor force. Within the labor force, individuals with college / associate degree education have the highest percentage of unemployment, with 8.2% or 13 of them being unemployed.
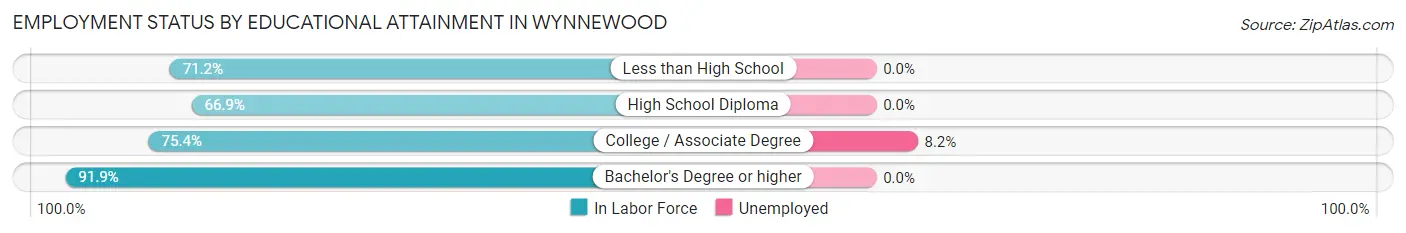
| Educational Attainment | In Labor Force | Unemployed |
| Less than High School | 89 (71.2%) | 0 (0.0%) |
| High School Diploma | 214 (66.9%) | 0 (0.0%) |
| College / Associate Degree | 159 (75.4%) | 17 (8.2%) |
| Bachelor's Degree or higher | 113 (91.9%) | 0 (0.0%) |
| Total | 575 (73.8%) | 18 (2.3%) |
Employment Occupations by Sex in Wynnewood
Management, Business, Science and Arts Occupations
The most common Management, Business, Science and Arts occupations in Wynnewood are Community & Social Service (76 | 10.9%), Education Instruction & Library (72 | 10.3%), Management (49 | 7.0%), Computers, Engineering & Science (30 | 4.3%), and Health Diagnosing & Treating (19 | 2.7%).

Management, Business, Science and Arts Occupations by Sex
Within the Management, Business, Science and Arts occupations in Wynnewood, the most male-oriented occupations are Computers & Mathematics (100.0%), Architecture & Engineering (100.0%), and Computers, Engineering & Science (80.0%), while the most female-oriented occupations are Business & Financial (100.0%), Life, Physical & Social Science (100.0%), and Education, Arts & Media (100.0%).
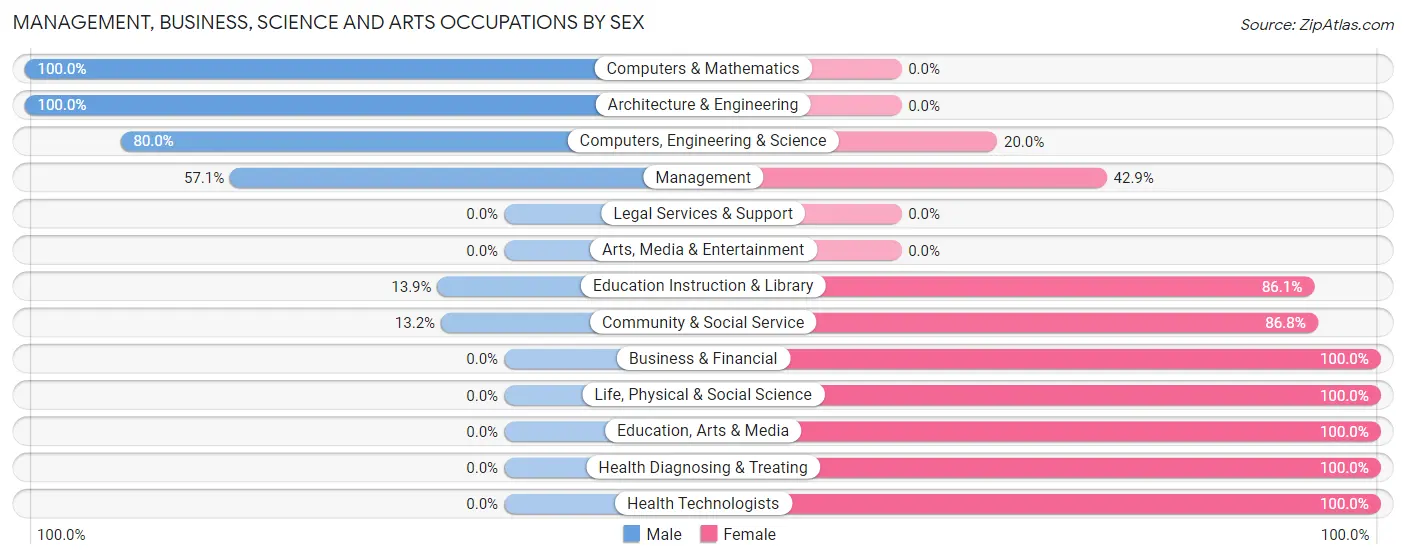
| Occupation | Male | Female |
| Management | 28 (57.1%) | 21 (42.9%) |
| Business & Financial | 0 (0.0%) | 12 (100.0%) |
| Computers, Engineering & Science | 24 (80.0%) | 6 (20.0%) |
| Computers & Mathematics | 7 (100.0%) | 0 (0.0%) |
| Architecture & Engineering | 17 (100.0%) | 0 (0.0%) |
| Life, Physical & Social Science | 0 (0.0%) | 6 (100.0%) |
| Community & Social Service | 10 (13.2%) | 66 (86.8%) |
| Education, Arts & Media | 0 (0.0%) | 4 (100.0%) |
| Legal Services & Support | 0 (0.0%) | 0 (0.0%) |
| Education Instruction & Library | 10 (13.9%) | 62 (86.1%) |
| Arts, Media & Entertainment | 0 (0.0%) | 0 (0.0%) |
| Health Diagnosing & Treating | 0 (0.0%) | 19 (100.0%) |
| Health Technologists | 0 (0.0%) | 10 (100.0%) |
| Total (Category) | 62 (33.3%) | 124 (66.7%) |
| Total (Overall) | 394 (56.4%) | 305 (43.6%) |
Services Occupations
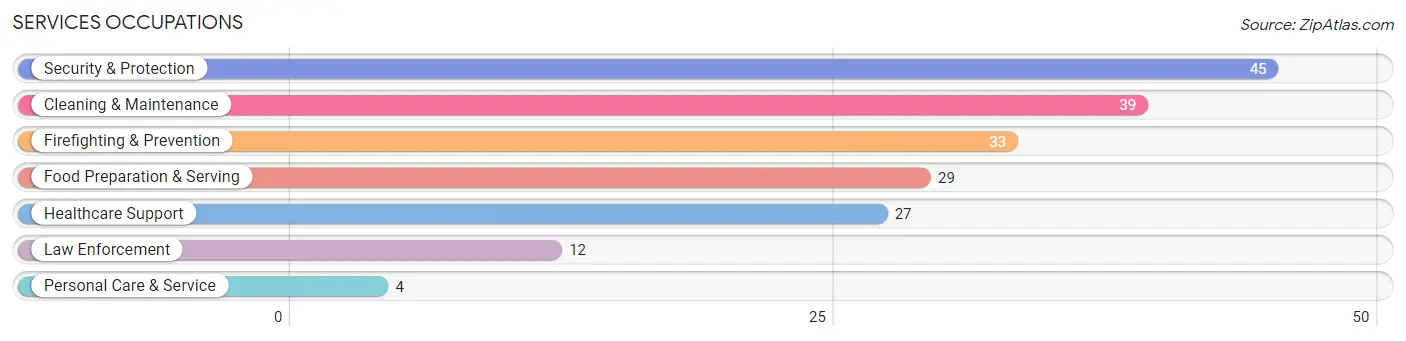
The most common Services occupations in Wynnewood are Security & Protection (45 | 6.4%), Cleaning & Maintenance (39 | 5.6%), Firefighting & Prevention (33 | 4.7%), Food Preparation & Serving (29 | 4.2%), and Healthcare Support (27 | 3.9%).
Services Occupations by Sex
Within the Services occupations in Wynnewood, the most male-oriented occupations are Cleaning & Maintenance (87.2%), Firefighting & Prevention (63.6%), and Security & Protection (62.2%), while the most female-oriented occupations are Personal Care & Service (100.0%), Healthcare Support (96.3%), and Food Preparation & Serving (86.2%).
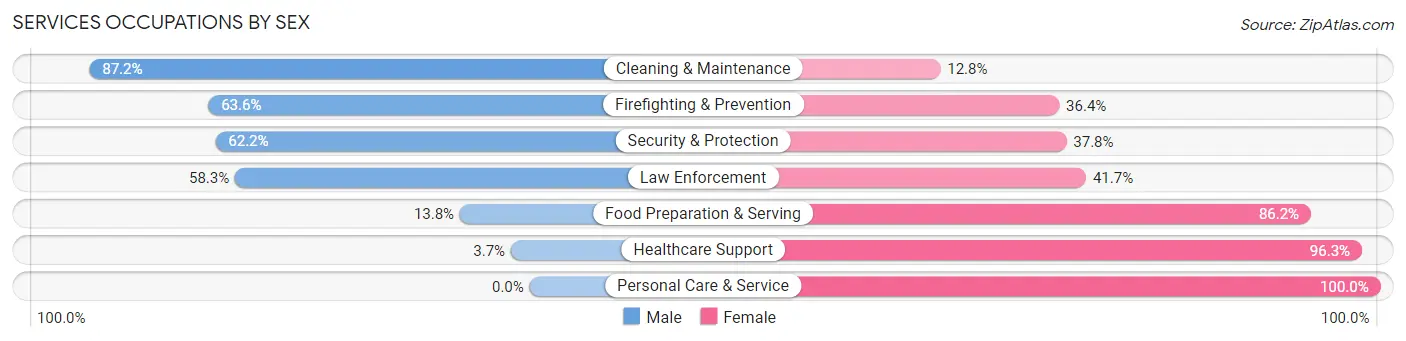
| Occupation | Male | Female |
| Healthcare Support | 1 (3.7%) | 26 (96.3%) |
| Security & Protection | 28 (62.2%) | 17 (37.8%) |
| Firefighting & Prevention | 21 (63.6%) | 12 (36.4%) |
| Law Enforcement | 7 (58.3%) | 5 (41.7%) |
| Food Preparation & Serving | 4 (13.8%) | 25 (86.2%) |
| Cleaning & Maintenance | 34 (87.2%) | 5 (12.8%) |
| Personal Care & Service | 0 (0.0%) | 4 (100.0%) |
| Total (Category) | 67 (46.5%) | 77 (53.5%) |
| Total (Overall) | 394 (56.4%) | 305 (43.6%) |
Sales and Office Occupations
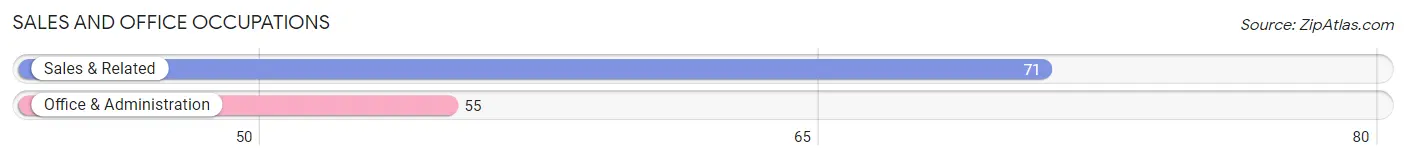
The most common Sales and Office occupations in Wynnewood are Sales & Related (71 | 10.2%), and Office & Administration (55 | 7.9%).
Sales and Office Occupations by Sex
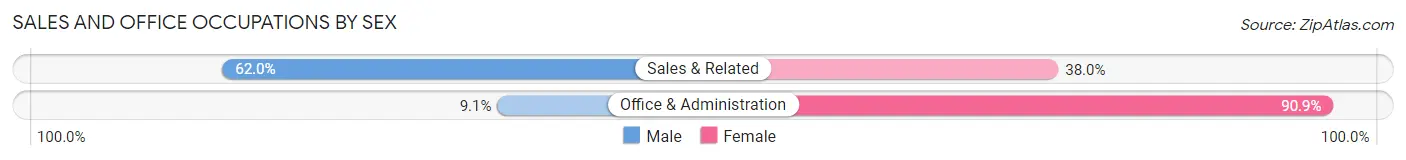
| Occupation | Male | Female |
| Sales & Related | 44 (62.0%) | 27 (38.0%) |
| Office & Administration | 5 (9.1%) | 50 (90.9%) |
| Total (Category) | 49 (38.9%) | 77 (61.1%) |
| Total (Overall) | 394 (56.4%) | 305 (43.6%) |
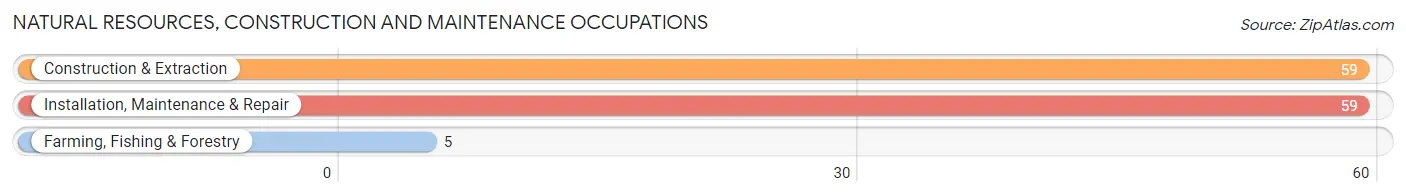
Natural Resources, Construction and Maintenance Occupations
The most common Natural Resources, Construction and Maintenance occupations in Wynnewood are Construction & Extraction (59 | 8.4%), Installation, Maintenance & Repair (59 | 8.4%), and Farming, Fishing & Forestry (5 | 0.7%).
Natural Resources, Construction and Maintenance Occupations by Sex
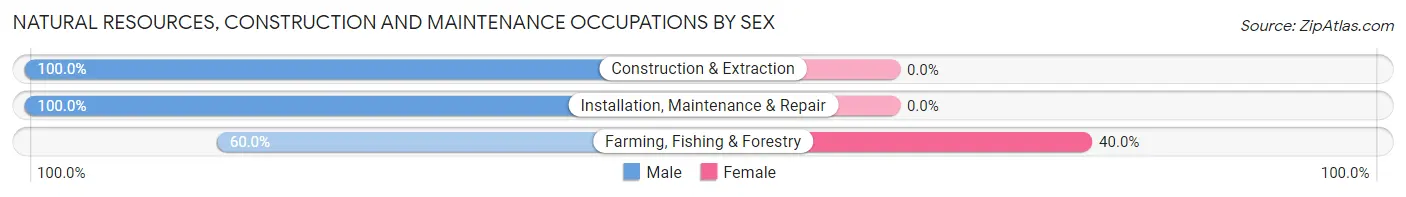
| Occupation | Male | Female |
| Farming, Fishing & Forestry | 3 (60.0%) | 2 (40.0%) |
| Construction & Extraction | 59 (100.0%) | 0 (0.0%) |
| Installation, Maintenance & Repair | 59 (100.0%) | 0 (0.0%) |
| Total (Category) | 121 (98.4%) | 2 (1.6%) |
| Total (Overall) | 394 (56.4%) | 305 (43.6%) |
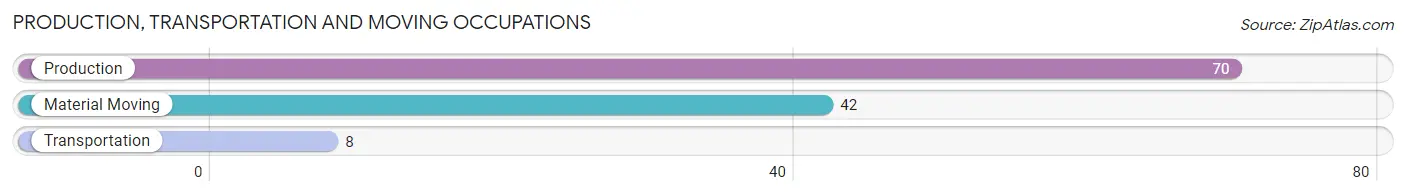
Production, Transportation and Moving Occupations
The most common Production, Transportation and Moving occupations in Wynnewood are Production (70 | 10.0%), Material Moving (42 | 6.0%), and Transportation (8 | 1.1%).
Production, Transportation and Moving Occupations by Sex
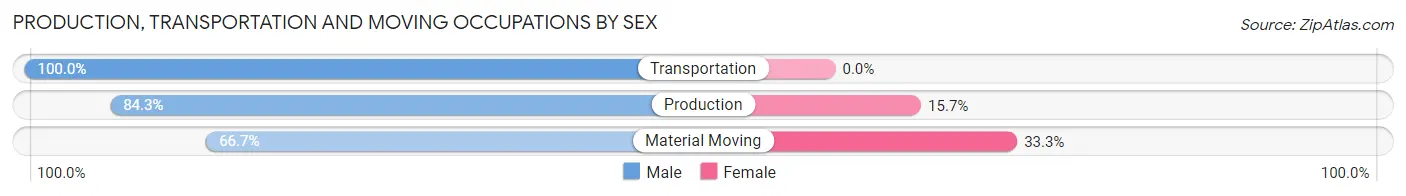
| Occupation | Male | Female |
| Production | 59 (84.3%) | 11 (15.7%) |
| Transportation | 8 (100.0%) | 0 (0.0%) |
| Material Moving | 28 (66.7%) | 14 (33.3%) |
| Total (Category) | 95 (79.2%) | 25 (20.8%) |
| Total (Overall) | 394 (56.4%) | 305 (43.6%) |
Employment Industries by Sex in Wynnewood
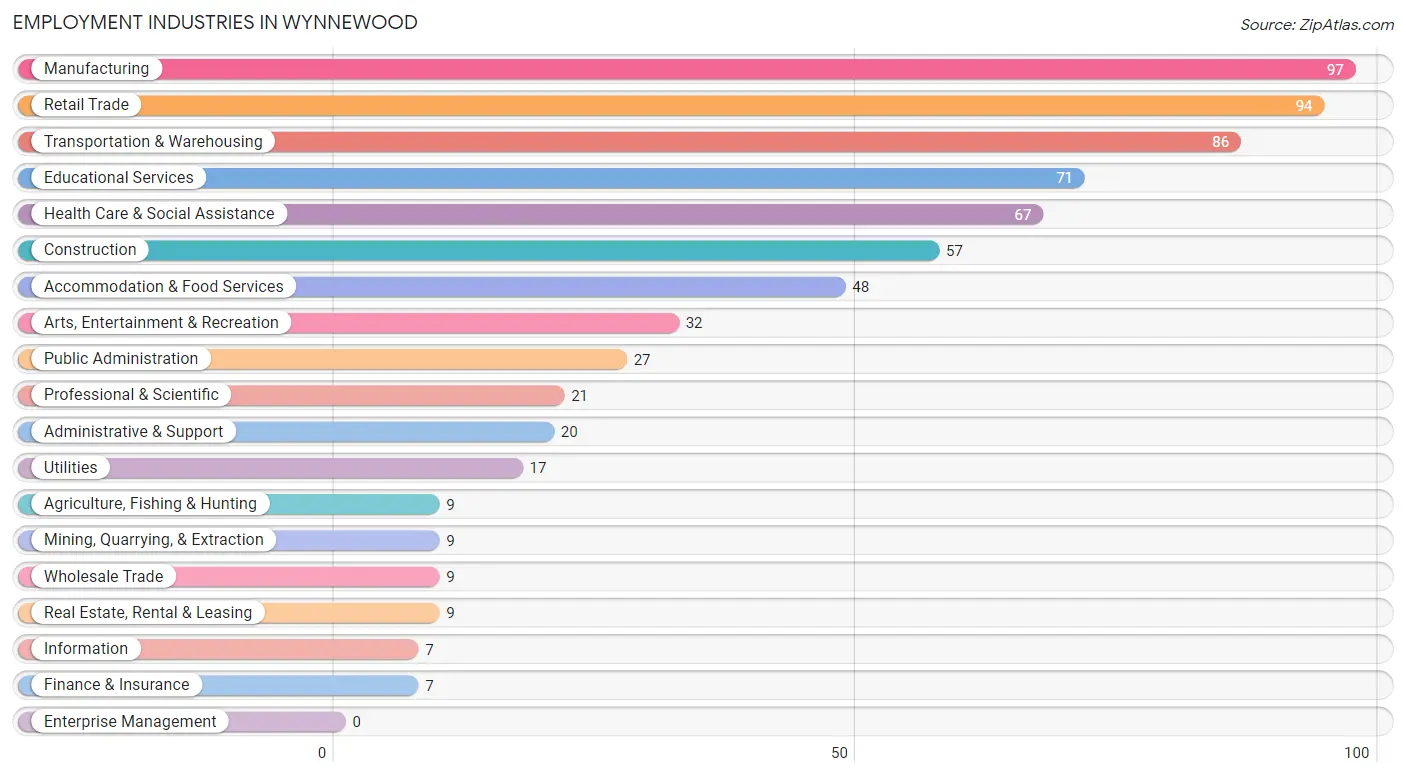
Employment Industries in Wynnewood
The major employment industries in Wynnewood include Manufacturing (97 | 13.9%), Retail Trade (94 | 13.5%), Transportation & Warehousing (86 | 12.3%), Educational Services (71 | 10.2%), and Health Care & Social Assistance (67 | 9.6%).
Employment Industries by Sex in Wynnewood
The Wynnewood industries that see more men than women are Construction (100.0%), Administrative & Support (100.0%), and Transportation & Warehousing (90.7%), whereas the industries that tend to have a higher number of women are Wholesale Trade (100.0%), Information (100.0%), and Finance & Insurance (100.0%).
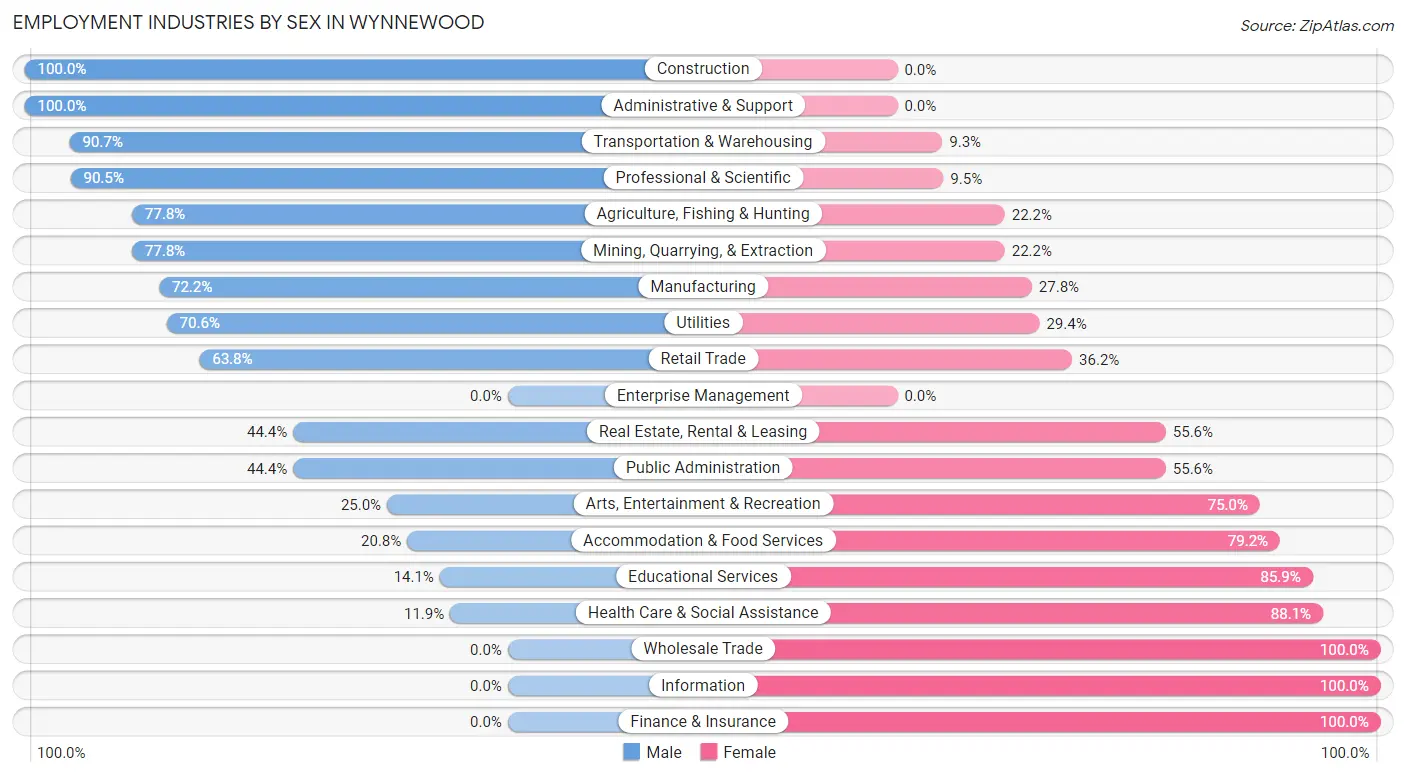
| Industry | Male | Female |
| Agriculture, Fishing & Hunting | 7 (77.8%) | 2 (22.2%) |
| Mining, Quarrying, & Extraction | 7 (77.8%) | 2 (22.2%) |
| Construction | 57 (100.0%) | 0 (0.0%) |
| Manufacturing | 70 (72.2%) | 27 (27.8%) |
| Wholesale Trade | 0 (0.0%) | 9 (100.0%) |
| Retail Trade | 60 (63.8%) | 34 (36.2%) |
| Transportation & Warehousing | 78 (90.7%) | 8 (9.3%) |
| Utilities | 12 (70.6%) | 5 (29.4%) |
| Information | 0 (0.0%) | 7 (100.0%) |
| Finance & Insurance | 0 (0.0%) | 7 (100.0%) |
| Real Estate, Rental & Leasing | 4 (44.4%) | 5 (55.6%) |
| Professional & Scientific | 19 (90.5%) | 2 (9.5%) |
| Enterprise Management | 0 (0.0%) | 0 (0.0%) |
| Administrative & Support | 20 (100.0%) | 0 (0.0%) |
| Educational Services | 10 (14.1%) | 61 (85.9%) |
| Health Care & Social Assistance | 8 (11.9%) | 59 (88.1%) |
| Arts, Entertainment & Recreation | 8 (25.0%) | 24 (75.0%) |
| Accommodation & Food Services | 10 (20.8%) | 38 (79.2%) |
| Public Administration | 12 (44.4%) | 15 (55.6%) |
| Total | 394 (56.4%) | 305 (43.6%) |
Education in Wynnewood
School Enrollment in Wynnewood
The most common levels of schooling among the 438 students in Wynnewood are high school (152 | 34.7%), elementary school (118 | 26.9%), and middle school (95 | 21.7%).
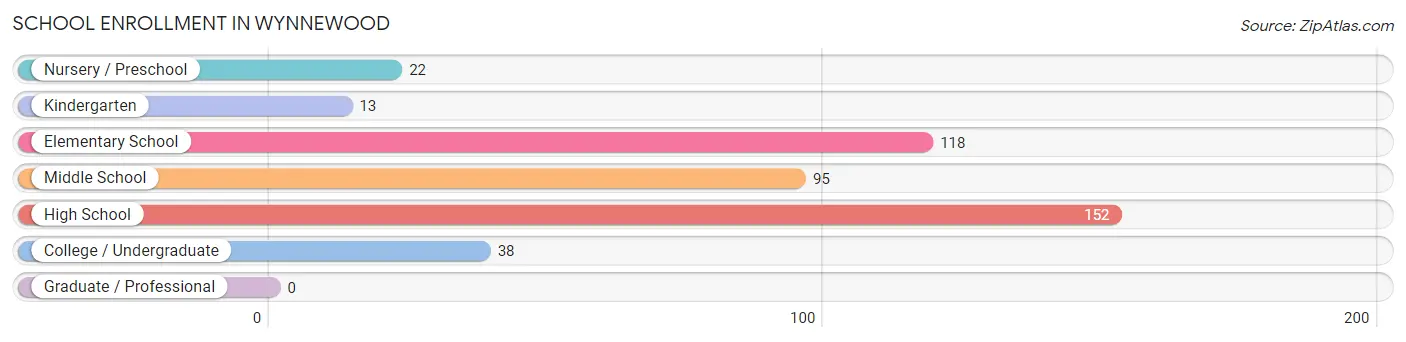
| School Level | # Students | % Students |
| Nursery / Preschool | 22 | 5.0% |
| Kindergarten | 13 | 3.0% |
| Elementary School | 118 | 26.9% |
| Middle School | 95 | 21.7% |
| High School | 152 | 34.7% |
| College / Undergraduate | 38 | 8.7% |
| Graduate / Professional | 0 | 0.0% |
| Total | 438 | 100.0% |
School Enrollment by Age by Funding Source in Wynnewood
Out of a total of 438 students who are enrolled in schools in Wynnewood, 21 (4.8%) attend a private institution, while the remaining 417 (95.2%) are enrolled in public schools. The age group of 20 to 24 year olds has the highest likelihood of being enrolled in private schools, with 7 (100.0% in the age bracket) enrolled. Conversely, the age group of 3 to 4 year olds has the lowest likelihood of being enrolled in a private school, with 5 (100.0% in the age bracket) attending a public institution.
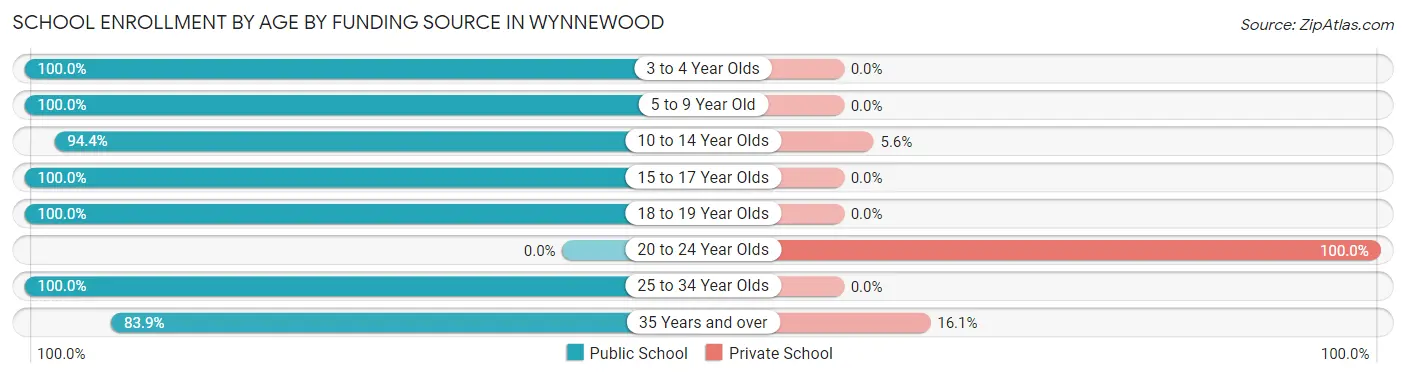
| Age Bracket | Public School | Private School |
| 3 to 4 Year Olds | 5 (100.0%) | 0 (0.0%) |
| 5 to 9 Year Old | 111 (100.0%) | 0 (0.0%) |
| 10 to 14 Year Olds | 153 (94.4%) | 9 (5.6%) |
| 15 to 17 Year Olds | 86 (100.0%) | 0 (0.0%) |
| 18 to 19 Year Olds | 31 (100.0%) | 0 (0.0%) |
| 20 to 24 Year Olds | 0 (0.0%) | 7 (100.0%) |
| 25 to 34 Year Olds | 5 (100.0%) | 0 (0.0%) |
| 35 Years and over | 26 (83.9%) | 5 (16.1%) |
| Total | 417 (95.2%) | 21 (4.8%) |
Educational Attainment by Field of Study in Wynnewood
Education (43 | 24.7%), science & technology (34 | 19.5%), business (33 | 19.0%), social sciences (18 | 10.3%), and visual & performing arts (13 | 7.5%) are the most common fields of study among 174 individuals in Wynnewood who have obtained a bachelor's degree or higher.
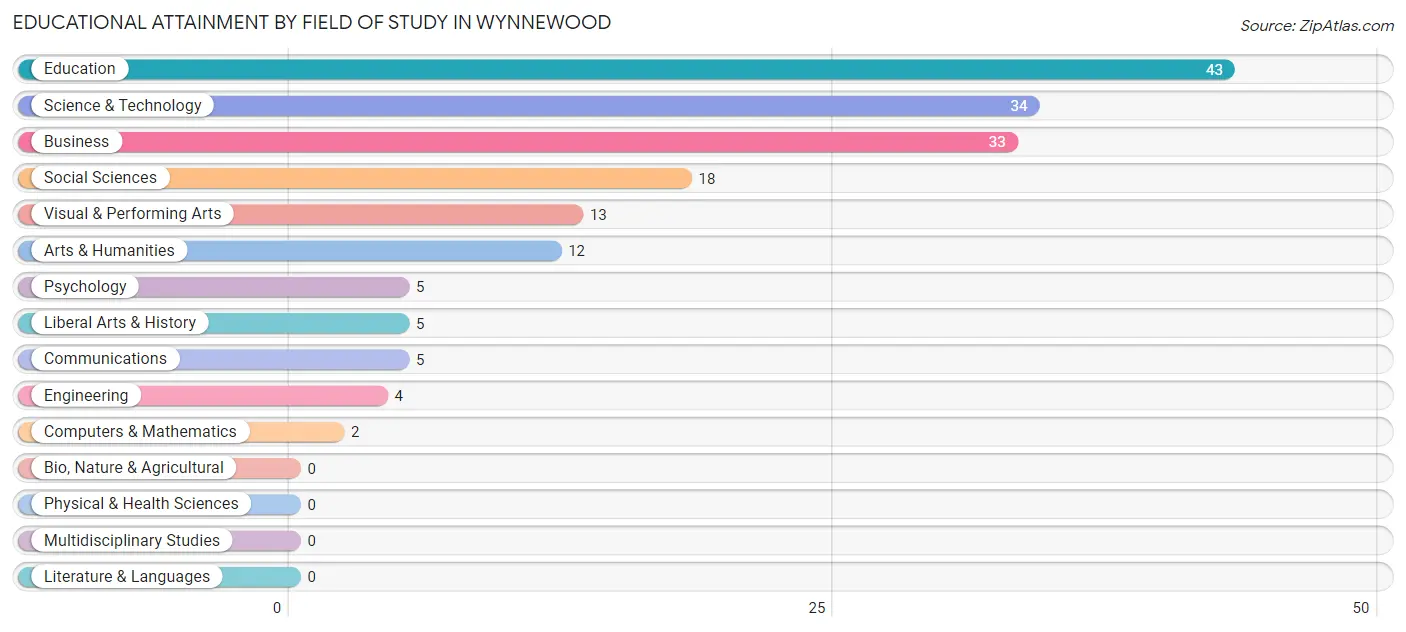
| Field of Study | # Graduates | % Graduates |
| Computers & Mathematics | 2 | 1.1% |
| Bio, Nature & Agricultural | 0 | 0.0% |
| Physical & Health Sciences | 0 | 0.0% |
| Psychology | 5 | 2.9% |
| Social Sciences | 18 | 10.3% |
| Engineering | 4 | 2.3% |
| Multidisciplinary Studies | 0 | 0.0% |
| Science & Technology | 34 | 19.5% |
| Business | 33 | 19.0% |
| Education | 43 | 24.7% |
| Literature & Languages | 0 | 0.0% |
| Liberal Arts & History | 5 | 2.9% |
| Visual & Performing Arts | 13 | 7.5% |
| Communications | 5 | 2.9% |
| Arts & Humanities | 12 | 6.9% |
| Total | 174 | 100.0% |
Transportation & Commute in Wynnewood
Vehicle Availability by Sex in Wynnewood
The most prevalent vehicle ownership categories in Wynnewood are males with 2 vehicles (150, accounting for 38.1%) and females with 2 vehicles (89, making up 49.2%).
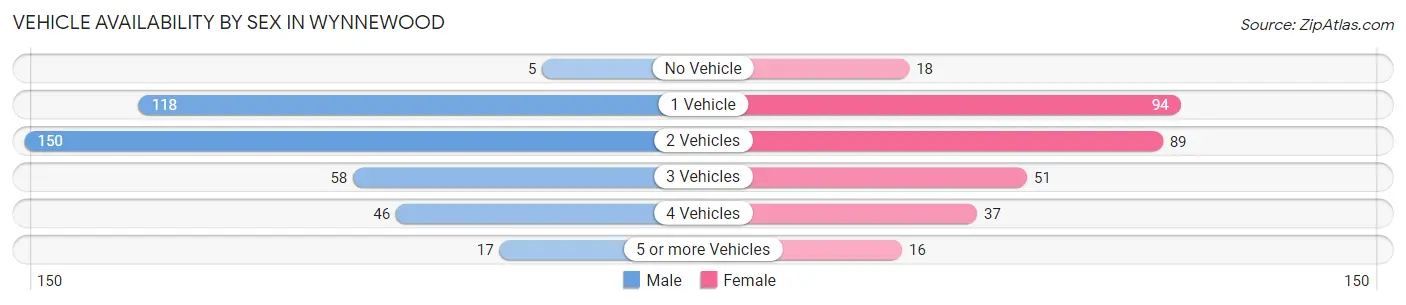
| Vehicles Available | Male | Female |
| No Vehicle | 5 (1.3%) | 18 (5.9%) |
| 1 Vehicle | 118 (29.9%) | 94 (30.8%) |
| 2 Vehicles | 150 (38.1%) | 89 (29.2%) |
| 3 Vehicles | 58 (14.7%) | 51 (16.7%) |
| 4 Vehicles | 46 (11.7%) | 37 (12.1%) |
| 5 or more Vehicles | 17 (4.3%) | 16 (5.2%) |
| Total | 394 (100.0%) | 305 (100.0%) |
Commute Time in Wynnewood
The most frequently occuring commute durations in Wynnewood are 5 to 9 minutes (126 commuters, 18.3%), 10 to 14 minutes (103 commuters, 14.9%), and 15 to 19 minutes (103 commuters, 14.9%).
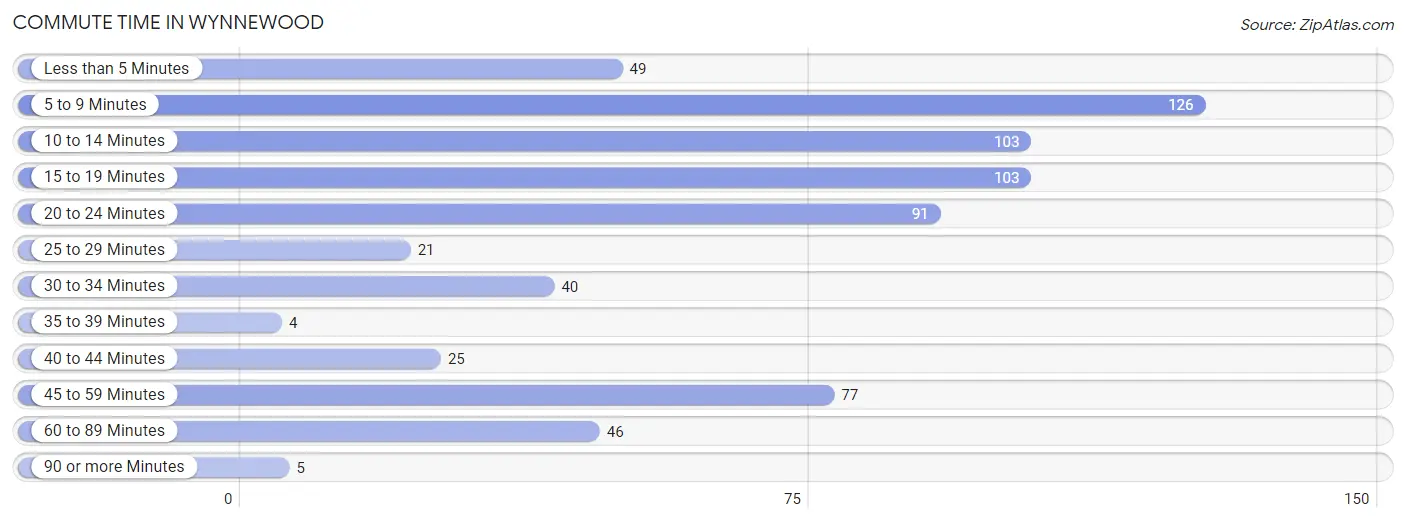
| Commute Time | # Commuters | % Commuters |
| Less than 5 Minutes | 49 | 7.1% |
| 5 to 9 Minutes | 126 | 18.3% |
| 10 to 14 Minutes | 103 | 14.9% |
| 15 to 19 Minutes | 103 | 14.9% |
| 20 to 24 Minutes | 91 | 13.2% |
| 25 to 29 Minutes | 21 | 3.0% |
| 30 to 34 Minutes | 40 | 5.8% |
| 35 to 39 Minutes | 4 | 0.6% |
| 40 to 44 Minutes | 25 | 3.6% |
| 45 to 59 Minutes | 77 | 11.2% |
| 60 to 89 Minutes | 46 | 6.7% |
| 90 or more Minutes | 5 | 0.7% |
Commute Time by Sex in Wynnewood
The most common commute times in Wynnewood are 45 to 59 minutes (63 commuters, 16.2%) for males and 5 to 9 minutes (67 commuters, 22.3%) for females.
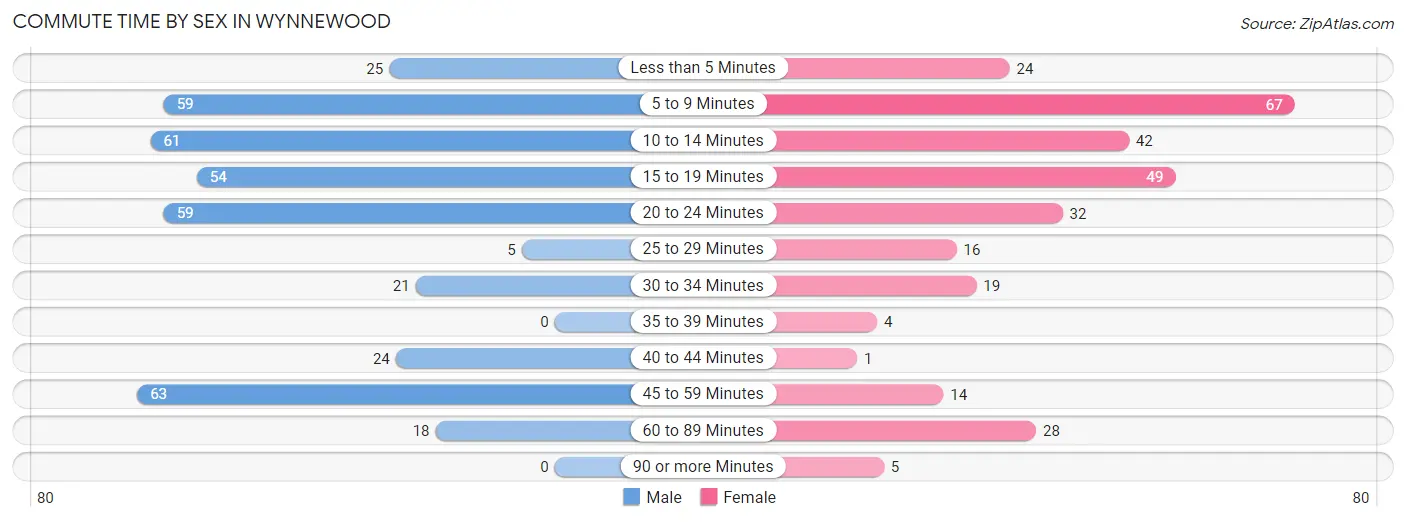
| Commute Time | Male | Female |
| Less than 5 Minutes | 25 (6.4%) | 24 (8.0%) |
| 5 to 9 Minutes | 59 (15.2%) | 67 (22.3%) |
| 10 to 14 Minutes | 61 (15.7%) | 42 (14.0%) |
| 15 to 19 Minutes | 54 (13.9%) | 49 (16.3%) |
| 20 to 24 Minutes | 59 (15.2%) | 32 (10.6%) |
| 25 to 29 Minutes | 5 (1.3%) | 16 (5.3%) |
| 30 to 34 Minutes | 21 (5.4%) | 19 (6.3%) |
| 35 to 39 Minutes | 0 (0.0%) | 4 (1.3%) |
| 40 to 44 Minutes | 24 (6.2%) | 1 (0.3%) |
| 45 to 59 Minutes | 63 (16.2%) | 14 (4.6%) |
| 60 to 89 Minutes | 18 (4.6%) | 28 (9.3%) |
| 90 or more Minutes | 0 (0.0%) | 5 (1.7%) |
Time of Departure to Work by Sex in Wynnewood
The most frequent times of departure to work in Wynnewood are 8:00 AM to 8:29 AM (77, 19.8%) for males and 7:00 AM to 7:29 AM (54, 17.9%) for females.
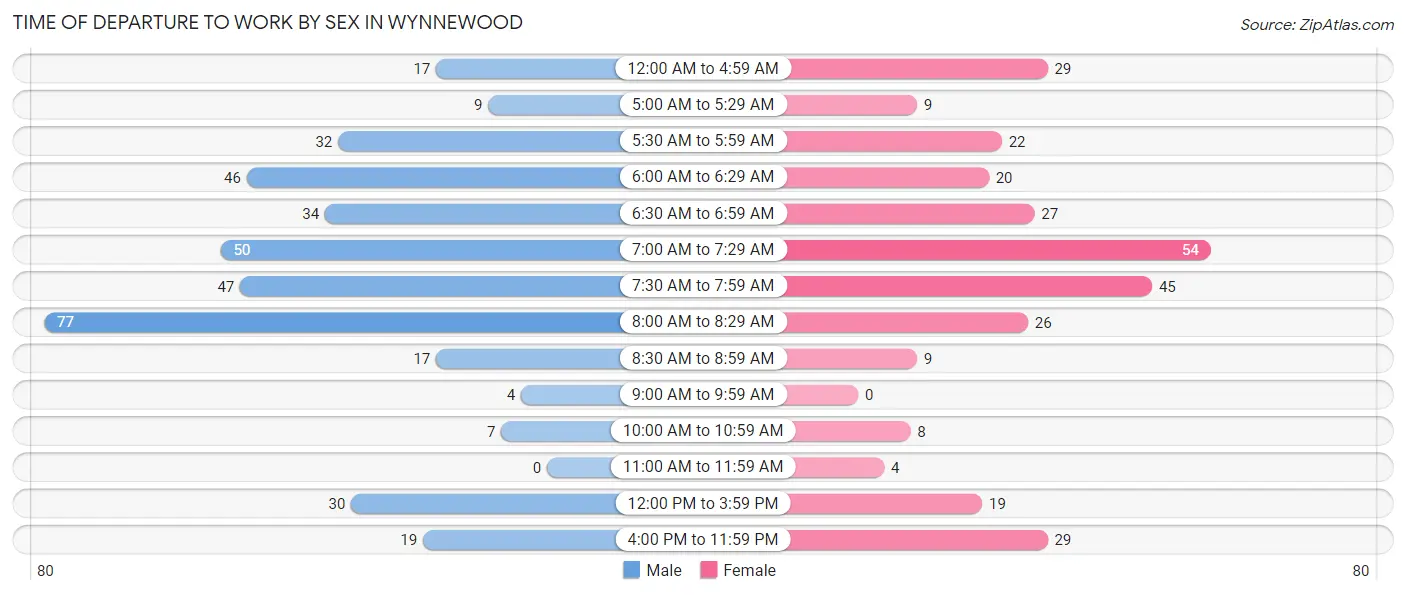
| Time of Departure | Male | Female |
| 12:00 AM to 4:59 AM | 17 (4.4%) | 29 (9.6%) |
| 5:00 AM to 5:29 AM | 9 (2.3%) | 9 (3.0%) |
| 5:30 AM to 5:59 AM | 32 (8.2%) | 22 (7.3%) |
| 6:00 AM to 6:29 AM | 46 (11.8%) | 20 (6.6%) |
| 6:30 AM to 6:59 AM | 34 (8.7%) | 27 (9.0%) |
| 7:00 AM to 7:29 AM | 50 (12.9%) | 54 (17.9%) |
| 7:30 AM to 7:59 AM | 47 (12.1%) | 45 (14.9%) |
| 8:00 AM to 8:29 AM | 77 (19.8%) | 26 (8.6%) |
| 8:30 AM to 8:59 AM | 17 (4.4%) | 9 (3.0%) |
| 9:00 AM to 9:59 AM | 4 (1.0%) | 0 (0.0%) |
| 10:00 AM to 10:59 AM | 7 (1.8%) | 8 (2.7%) |
| 11:00 AM to 11:59 AM | 0 (0.0%) | 4 (1.3%) |
| 12:00 PM to 3:59 PM | 30 (7.7%) | 19 (6.3%) |
| 4:00 PM to 11:59 PM | 19 (4.9%) | 29 (9.6%) |
| Total | 389 (100.0%) | 301 (100.0%) |
Housing Occupancy in Wynnewood
Occupancy by Ownership in Wynnewood
Of the total 628 dwellings in Wynnewood, owner-occupied units account for 344 (54.8%), while renter-occupied units make up 284 (45.2%).
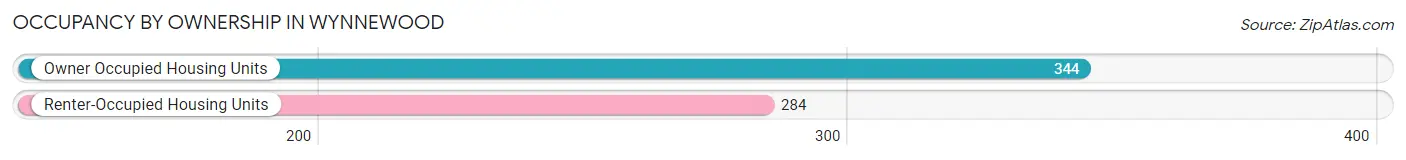
| Occupancy | # Housing Units | % Housing Units |
| Owner Occupied Housing Units | 344 | 54.8% |
| Renter-Occupied Housing Units | 284 | 45.2% |
| Total Occupied Housing Units | 628 | 100.0% |
Occupancy by Household Size in Wynnewood
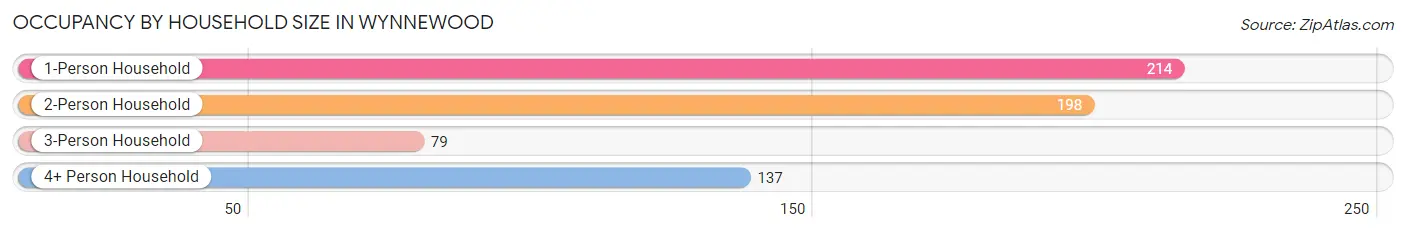
| Household Size | # Housing Units | % Housing Units |
| 1-Person Household | 214 | 34.1% |
| 2-Person Household | 198 | 31.5% |
| 3-Person Household | 79 | 12.6% |
| 4+ Person Household | 137 | 21.8% |
| Total Housing Units | 628 | 100.0% |
Occupancy by Ownership by Household Size in Wynnewood
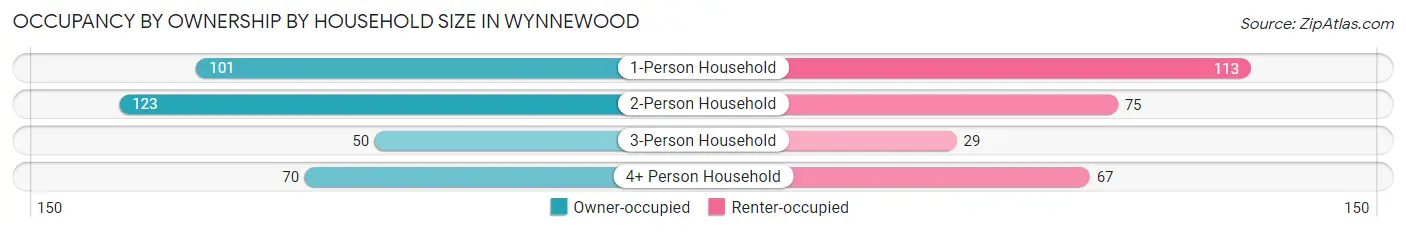
| Household Size | Owner-occupied | Renter-occupied |
| 1-Person Household | 101 (47.2%) | 113 (52.8%) |
| 2-Person Household | 123 (62.1%) | 75 (37.9%) |
| 3-Person Household | 50 (63.3%) | 29 (36.7%) |
| 4+ Person Household | 70 (51.1%) | 67 (48.9%) |
| Total Housing Units | 344 (54.8%) | 284 (45.2%) |
Occupancy by Educational Attainment in Wynnewood
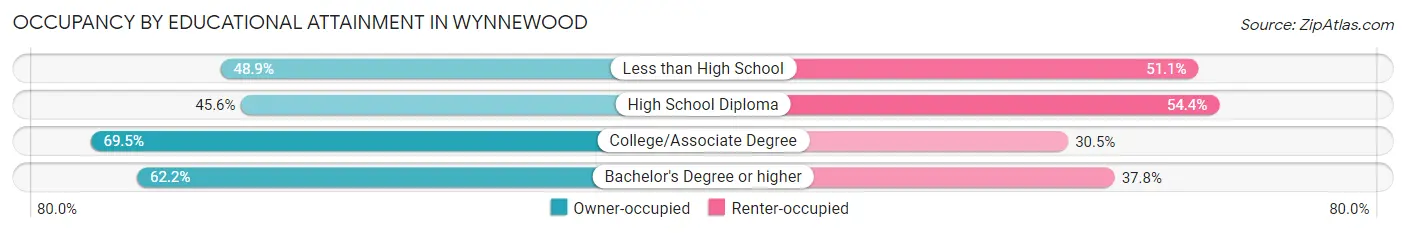
| Household Size | Owner-occupied | Renter-occupied |
| Less than High School | 45 (48.9%) | 47 (51.1%) |
| High School Diploma | 125 (45.6%) | 149 (54.4%) |
| College/Associate Degree | 105 (69.5%) | 46 (30.5%) |
| Bachelor's Degree or higher | 69 (62.2%) | 42 (37.8%) |
Occupancy by Age of Householder in Wynnewood
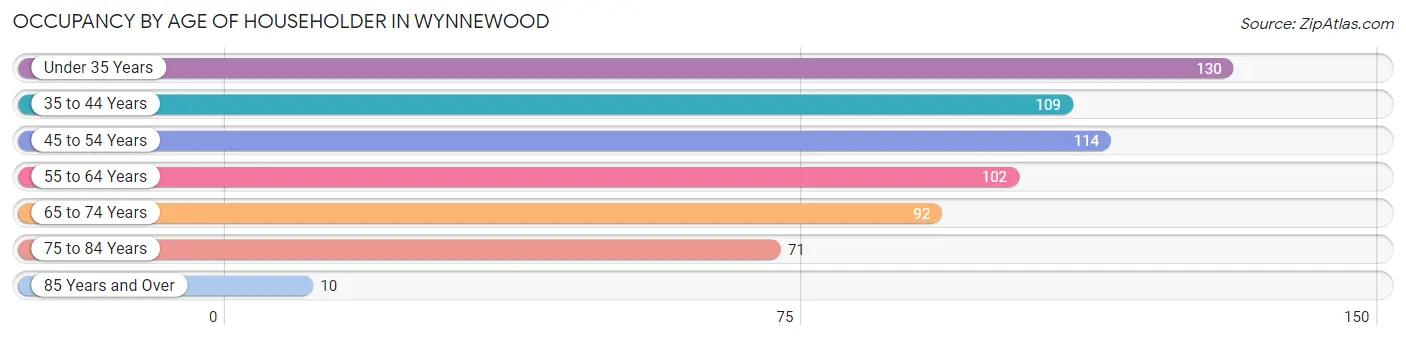
| Age Bracket | # Households | % Households |
| Under 35 Years | 130 | 20.7% |
| 35 to 44 Years | 109 | 17.4% |
| 45 to 54 Years | 114 | 18.1% |
| 55 to 64 Years | 102 | 16.2% |
| 65 to 74 Years | 92 | 14.6% |
| 75 to 84 Years | 71 | 11.3% |
| 85 Years and Over | 10 | 1.6% |
| Total | 628 | 100.0% |
Housing Finances in Wynnewood
Median Income by Occupancy in Wynnewood
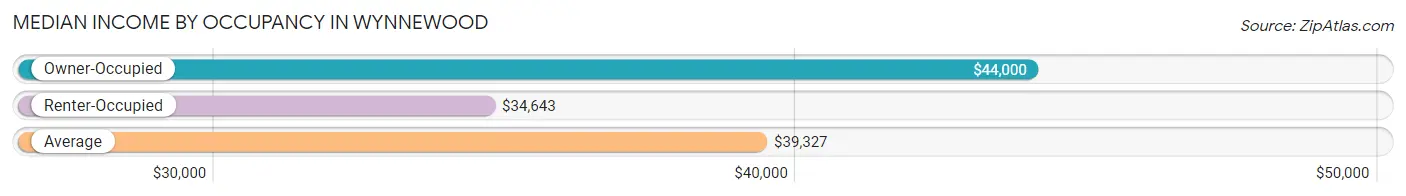
| Occupancy Type | # Households | Median Income |
| Owner-Occupied | 344 (54.8%) | $44,000 |
| Renter-Occupied | 284 (45.2%) | $34,643 |
| Average | 628 (100.0%) | $39,327 |
Occupancy by Householder Income Bracket in Wynnewood
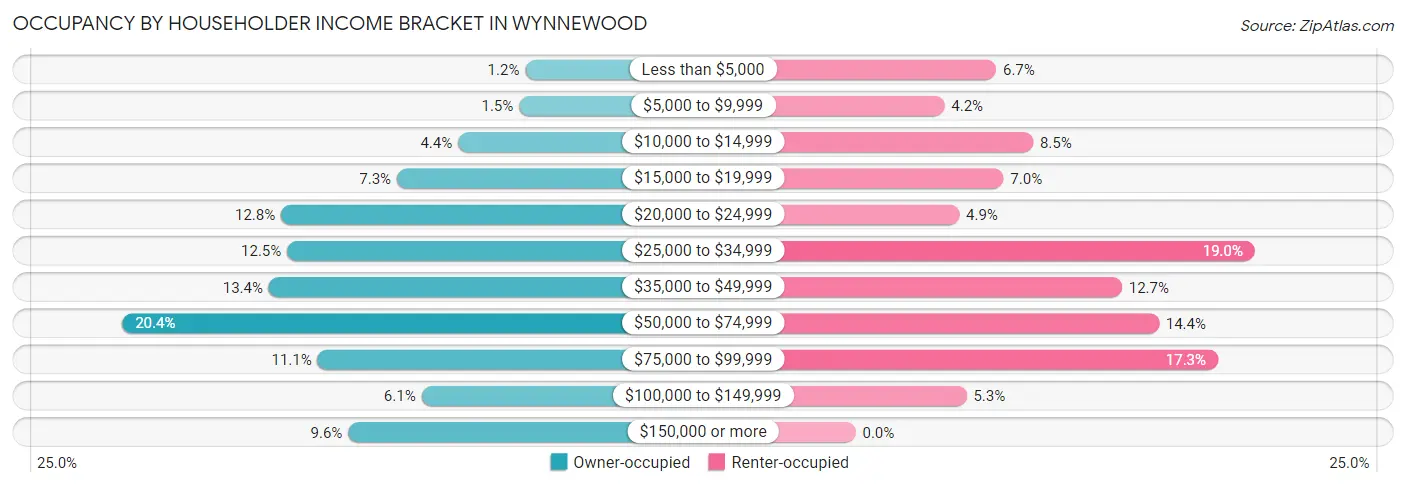
| Income Bracket | Owner-occupied | Renter-occupied |
| Less than $5,000 | 4 (1.2%) | 19 (6.7%) |
| $5,000 to $9,999 | 5 (1.5%) | 12 (4.2%) |
| $10,000 to $14,999 | 15 (4.4%) | 24 (8.5%) |
| $15,000 to $19,999 | 25 (7.3%) | 20 (7.0%) |
| $20,000 to $24,999 | 44 (12.8%) | 14 (4.9%) |
| $25,000 to $34,999 | 43 (12.5%) | 54 (19.0%) |
| $35,000 to $49,999 | 46 (13.4%) | 36 (12.7%) |
| $50,000 to $74,999 | 70 (20.3%) | 41 (14.4%) |
| $75,000 to $99,999 | 38 (11.1%) | 49 (17.2%) |
| $100,000 to $149,999 | 21 (6.1%) | 15 (5.3%) |
| $150,000 or more | 33 (9.6%) | 0 (0.0%) |
| Total | 344 (100.0%) | 284 (100.0%) |
Monthly Housing Cost Tiers in Wynnewood
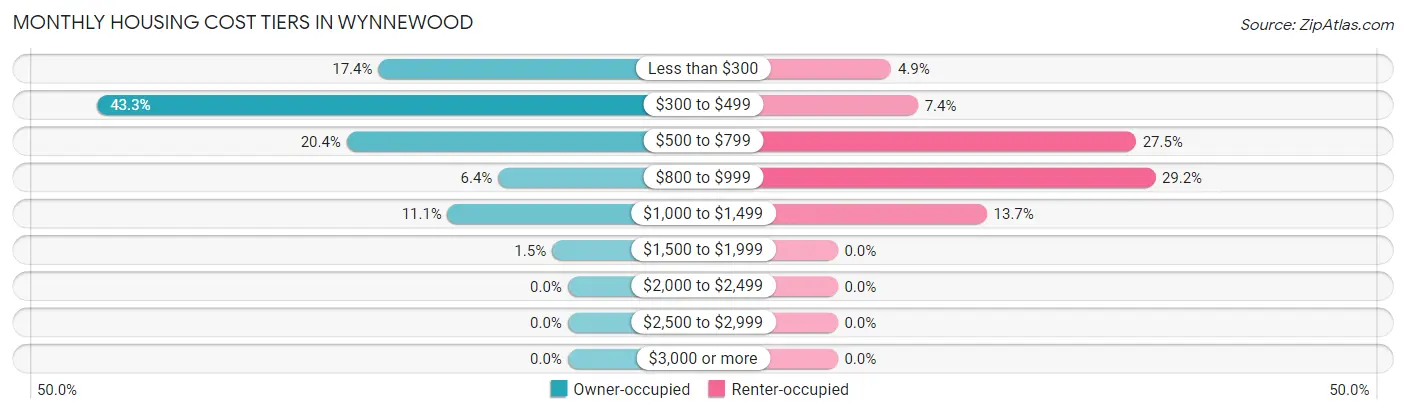
| Monthly Cost | Owner-occupied | Renter-occupied |
| Less than $300 | 60 (17.4%) | 14 (4.9%) |
| $300 to $499 | 149 (43.3%) | 21 (7.4%) |
| $500 to $799 | 70 (20.3%) | 78 (27.5%) |
| $800 to $999 | 22 (6.4%) | 83 (29.2%) |
| $1,000 to $1,499 | 38 (11.1%) | 39 (13.7%) |
| $1,500 to $1,999 | 5 (1.5%) | 0 (0.0%) |
| $2,000 to $2,499 | 0 (0.0%) | 0 (0.0%) |
| $2,500 to $2,999 | 0 (0.0%) | 0 (0.0%) |
| $3,000 or more | 0 (0.0%) | 0 (0.0%) |
| Total | 344 (100.0%) | 284 (100.0%) |
Physical Housing Characteristics in Wynnewood
Housing Structures in Wynnewood
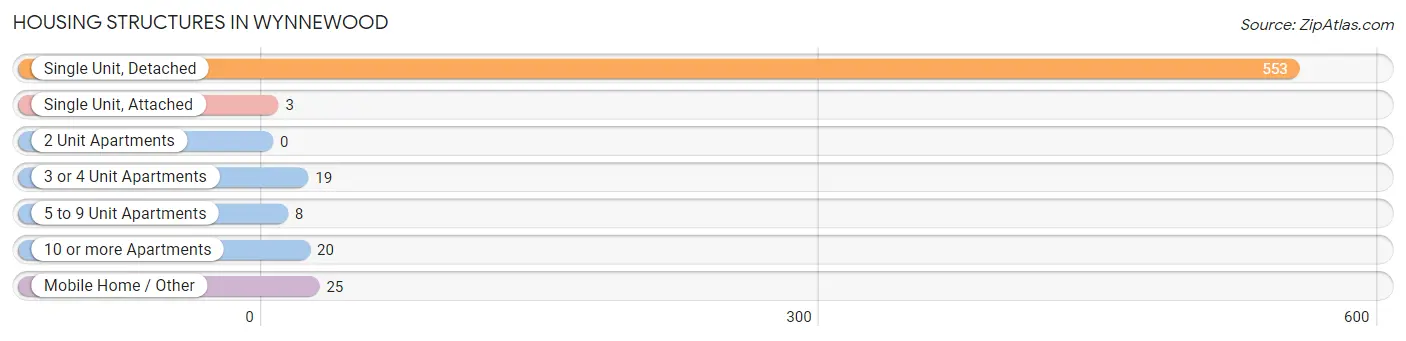
| Structure Type | # Housing Units | % Housing Units |
| Single Unit, Detached | 553 | 88.1% |
| Single Unit, Attached | 3 | 0.5% |
| 2 Unit Apartments | 0 | 0.0% |
| 3 or 4 Unit Apartments | 19 | 3.0% |
| 5 to 9 Unit Apartments | 8 | 1.3% |
| 10 or more Apartments | 20 | 3.2% |
| Mobile Home / Other | 25 | 4.0% |
| Total | 628 | 100.0% |
Housing Structures by Occupancy in Wynnewood
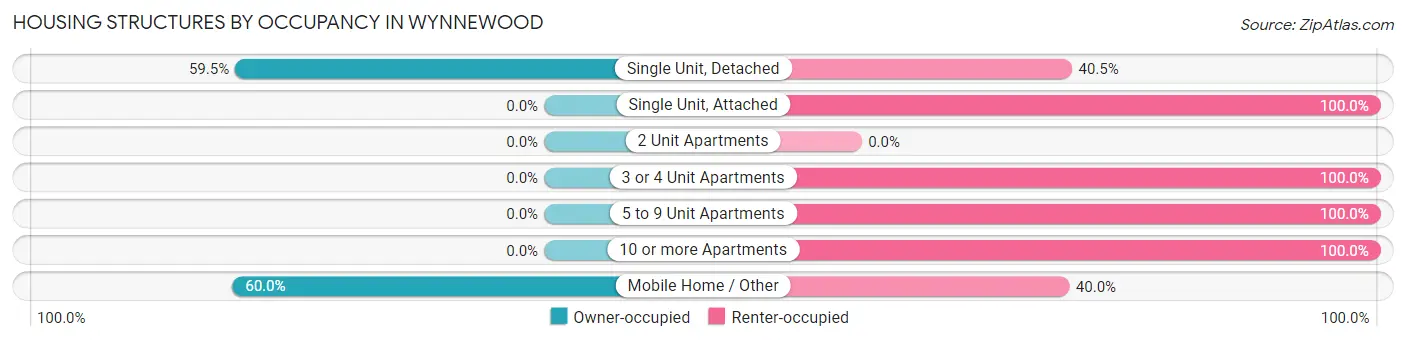
| Structure Type | Owner-occupied | Renter-occupied |
| Single Unit, Detached | 329 (59.5%) | 224 (40.5%) |
| Single Unit, Attached | 0 (0.0%) | 3 (100.0%) |
| 2 Unit Apartments | 0 (0.0%) | 0 (0.0%) |
| 3 or 4 Unit Apartments | 0 (0.0%) | 19 (100.0%) |
| 5 to 9 Unit Apartments | 0 (0.0%) | 8 (100.0%) |
| 10 or more Apartments | 0 (0.0%) | 20 (100.0%) |
| Mobile Home / Other | 15 (60.0%) | 10 (40.0%) |
| Total | 344 (54.8%) | 284 (45.2%) |
Housing Structures by Number of Rooms in Wynnewood
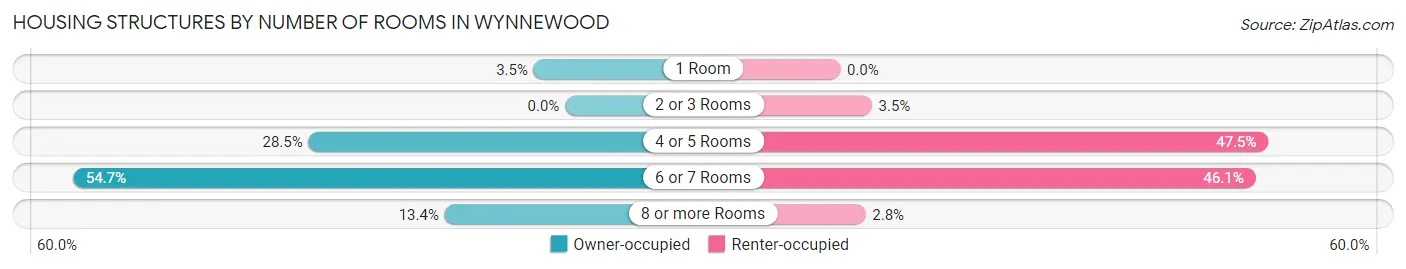
| Number of Rooms | Owner-occupied | Renter-occupied |
| 1 Room | 12 (3.5%) | 0 (0.0%) |
| 2 or 3 Rooms | 0 (0.0%) | 10 (3.5%) |
| 4 or 5 Rooms | 98 (28.5%) | 135 (47.5%) |
| 6 or 7 Rooms | 188 (54.6%) | 131 (46.1%) |
| 8 or more Rooms | 46 (13.4%) | 8 (2.8%) |
| Total | 344 (100.0%) | 284 (100.0%) |
Housing Structure by Heating Type in Wynnewood
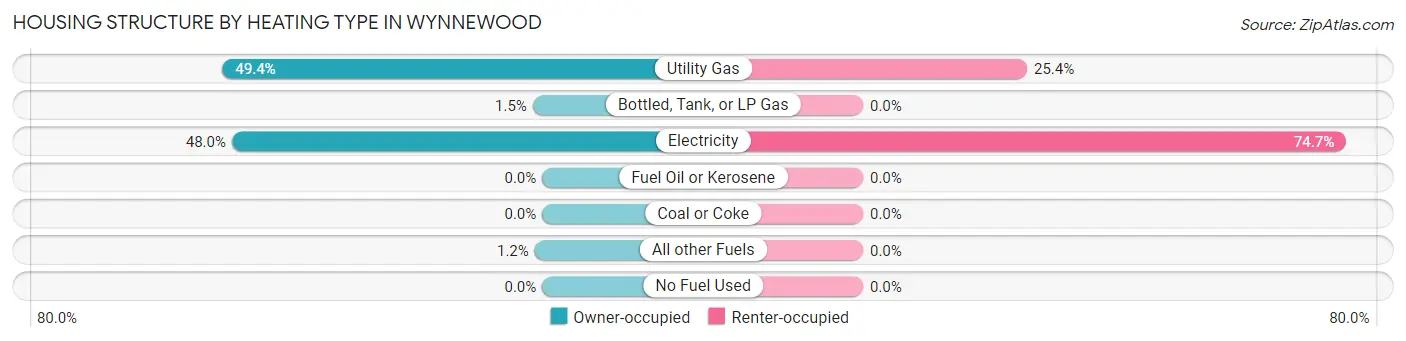
| Heating Type | Owner-occupied | Renter-occupied |
| Utility Gas | 170 (49.4%) | 72 (25.4%) |
| Bottled, Tank, or LP Gas | 5 (1.5%) | 0 (0.0%) |
| Electricity | 165 (48.0%) | 212 (74.7%) |
| Fuel Oil or Kerosene | 0 (0.0%) | 0 (0.0%) |
| Coal or Coke | 0 (0.0%) | 0 (0.0%) |
| All other Fuels | 4 (1.2%) | 0 (0.0%) |
| No Fuel Used | 0 (0.0%) | 0 (0.0%) |
| Total | 344 (100.0%) | 284 (100.0%) |
Household Vehicle Usage in Wynnewood
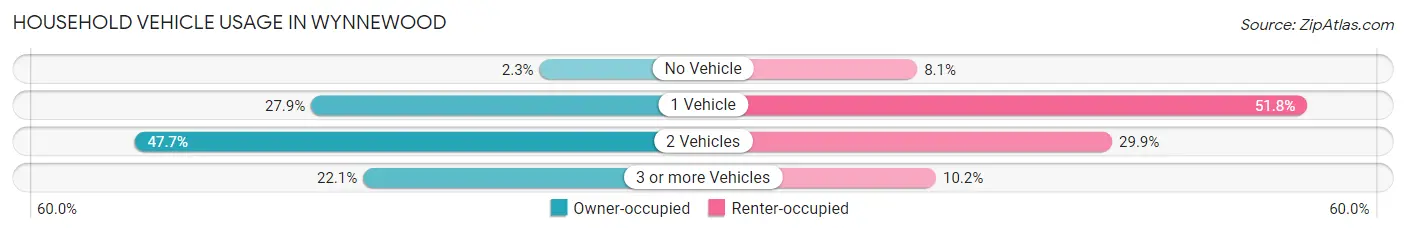
| Vehicles per Household | Owner-occupied | Renter-occupied |
| No Vehicle | 8 (2.3%) | 23 (8.1%) |
| 1 Vehicle | 96 (27.9%) | 147 (51.8%) |
| 2 Vehicles | 164 (47.7%) | 85 (29.9%) |
| 3 or more Vehicles | 76 (22.1%) | 29 (10.2%) |
| Total | 344 (100.0%) | 284 (100.0%) |
Real Estate & Mortgages in Wynnewood
Real Estate and Mortgage Overview in Wynnewood
| Characteristic | Without Mortgage | With Mortgage |
| Housing Units | 259 | 85 |
| Median Property Value | $81,300 | $126,100 |
| Median Household Income | $52,750 | $0 |
| Monthly Housing Costs | $380 | $0 |
| Real Estate Taxes | $444 | $0 |
Property Value by Mortgage Status in Wynnewood
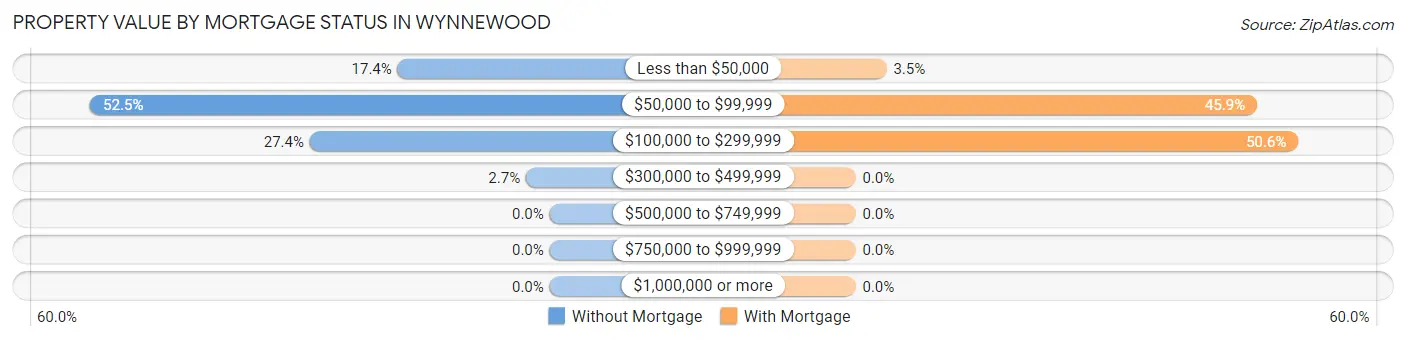
| Property Value | Without Mortgage | With Mortgage |
| Less than $50,000 | 45 (17.4%) | 3 (3.5%) |
| $50,000 to $99,999 | 136 (52.5%) | 39 (45.9%) |
| $100,000 to $299,999 | 71 (27.4%) | 43 (50.6%) |
| $300,000 to $499,999 | 7 (2.7%) | 0 (0.0%) |
| $500,000 to $749,999 | 0 (0.0%) | 0 (0.0%) |
| $750,000 to $999,999 | 0 (0.0%) | 0 (0.0%) |
| $1,000,000 or more | 0 (0.0%) | 0 (0.0%) |
| Total | 259 (100.0%) | 85 (100.0%) |
Household Income by Mortgage Status in Wynnewood
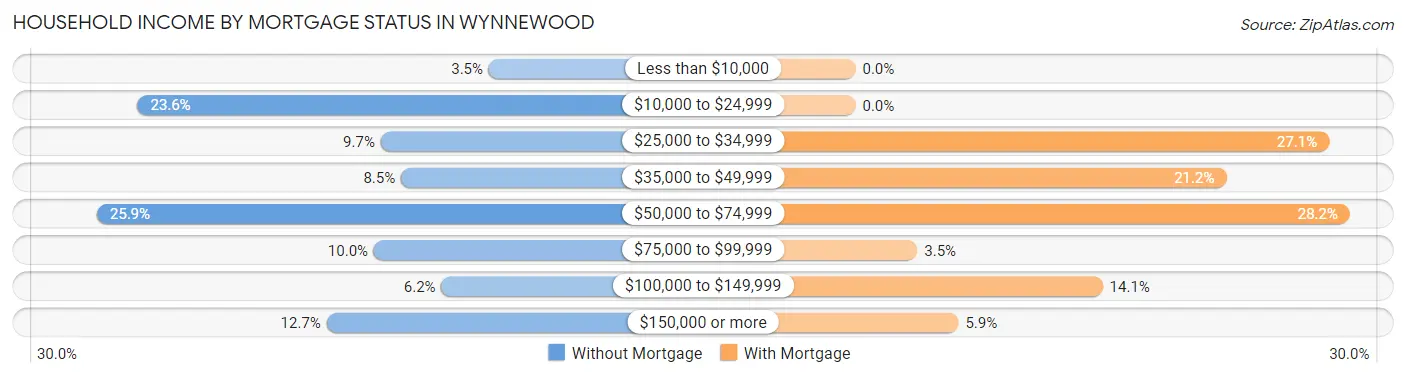
| Household Income | Without Mortgage | With Mortgage |
| Less than $10,000 | 9 (3.5%) | 0 (0.0%) |
| $10,000 to $24,999 | 61 (23.5%) | 0 (0.0%) |
| $25,000 to $34,999 | 25 (9.7%) | 23 (27.1%) |
| $35,000 to $49,999 | 22 (8.5%) | 18 (21.2%) |
| $50,000 to $74,999 | 67 (25.9%) | 24 (28.2%) |
| $75,000 to $99,999 | 26 (10.0%) | 3 (3.5%) |
| $100,000 to $149,999 | 16 (6.2%) | 12 (14.1%) |
| $150,000 or more | 33 (12.7%) | 5 (5.9%) |
| Total | 259 (100.0%) | 85 (100.0%) |
Property Value to Household Income Ratio in Wynnewood
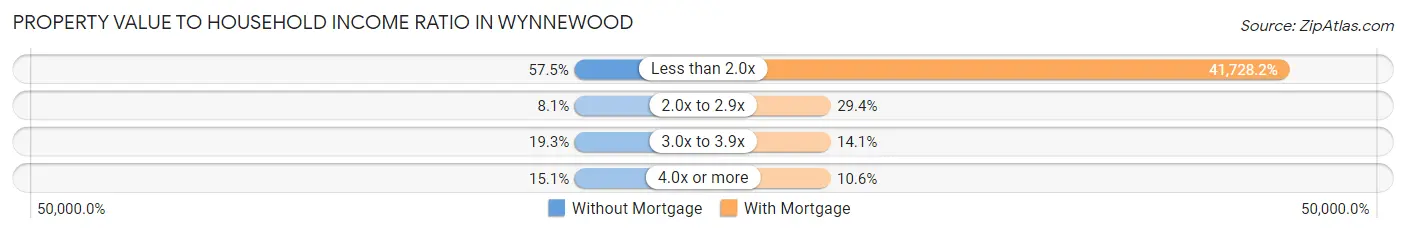
| Value-to-Income Ratio | Without Mortgage | With Mortgage |
| Less than 2.0x | 149 (57.5%) | 35,469 (41,728.2%) |
| 2.0x to 2.9x | 21 (8.1%) | 25 (29.4%) |
| 3.0x to 3.9x | 50 (19.3%) | 12 (14.1%) |
| 4.0x or more | 39 (15.1%) | 9 (10.6%) |
| Total | 259 (100.0%) | 85 (100.0%) |
Real Estate Taxes by Mortgage Status in Wynnewood
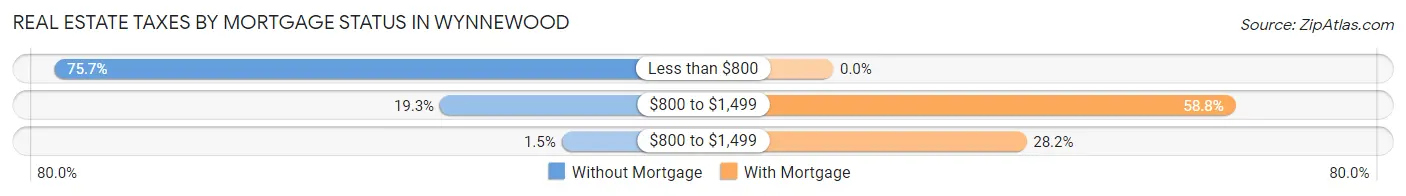
| Property Taxes | Without Mortgage | With Mortgage |
| Less than $800 | 196 (75.7%) | 0 (0.0%) |
| $800 to $1,499 | 50 (19.3%) | 50 (58.8%) |
| $800 to $1,499 | 4 (1.5%) | 24 (28.2%) |
| Total | 259 (100.0%) | 85 (100.0%) |
Health & Disability in Wynnewood
Health Insurance Coverage by Age in Wynnewood
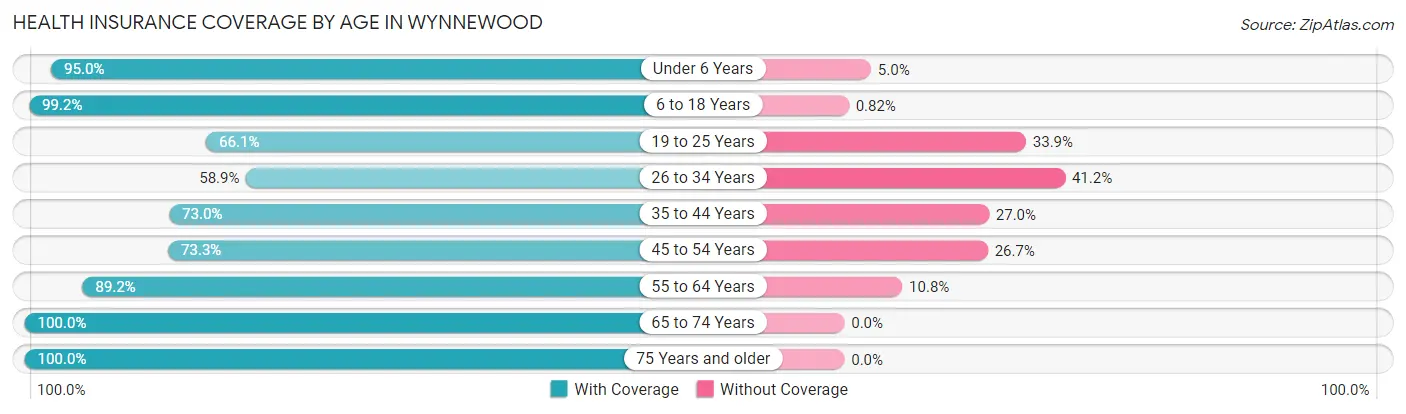
| Age Bracket | With Coverage | Without Coverage |
| Under 6 Years | 134 (95.0%) | 7 (5.0%) |
| 6 to 18 Years | 363 (99.2%) | 3 (0.8%) |
| 19 to 25 Years | 84 (66.1%) | 43 (33.9%) |
| 26 to 34 Years | 113 (58.9%) | 79 (41.1%) |
| 35 to 44 Years | 168 (73.0%) | 62 (27.0%) |
| 45 to 54 Years | 137 (73.3%) | 50 (26.7%) |
| 55 to 64 Years | 124 (89.2%) | 15 (10.8%) |
| 65 to 74 Years | 189 (100.0%) | 0 (0.0%) |
| 75 Years and older | 164 (100.0%) | 0 (0.0%) |
| Total | 1,476 (85.1%) | 259 (14.9%) |
Health Insurance Coverage by Citizenship Status in Wynnewood
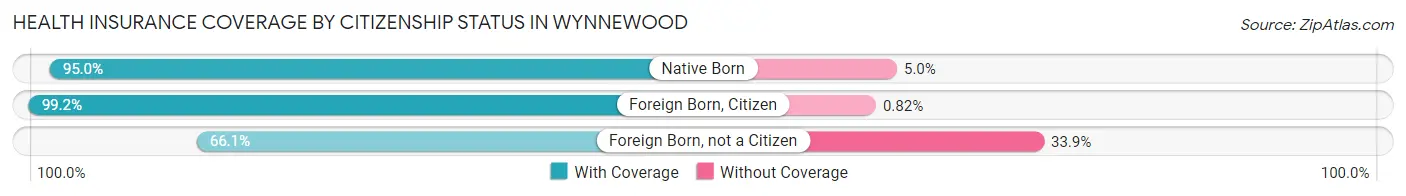
| Citizenship Status | With Coverage | Without Coverage |
| Native Born | 134 (95.0%) | 7 (5.0%) |
| Foreign Born, Citizen | 363 (99.2%) | 3 (0.8%) |
| Foreign Born, not a Citizen | 84 (66.1%) | 43 (33.9%) |
Health Insurance Coverage by Household Income in Wynnewood
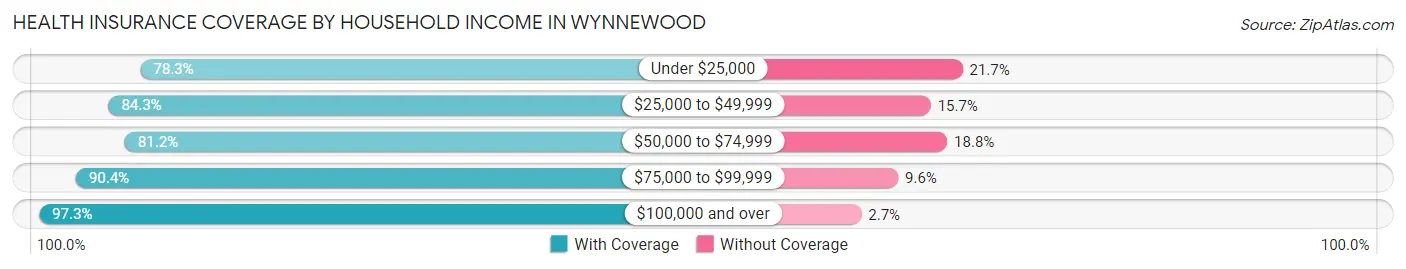
| Household Income | With Coverage | Without Coverage |
| Under $25,000 | 296 (78.3%) | 82 (21.7%) |
| $25,000 to $49,999 | 386 (84.3%) | 72 (15.7%) |
| $50,000 to $74,999 | 298 (81.2%) | 69 (18.8%) |
| $75,000 to $99,999 | 282 (90.4%) | 30 (9.6%) |
| $100,000 and over | 214 (97.3%) | 6 (2.7%) |
Public vs Private Health Insurance Coverage by Age in Wynnewood
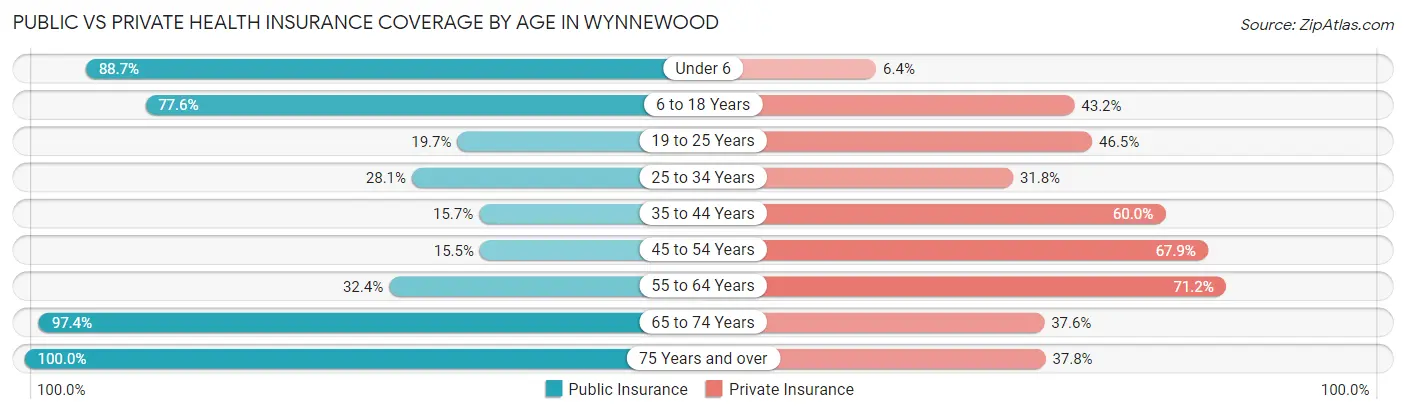
| Age Bracket | Public Insurance | Private Insurance |
| Under 6 | 125 (88.6%) | 9 (6.4%) |
| 6 to 18 Years | 284 (77.6%) | 158 (43.2%) |
| 19 to 25 Years | 25 (19.7%) | 59 (46.5%) |
| 25 to 34 Years | 54 (28.1%) | 61 (31.8%) |
| 35 to 44 Years | 36 (15.7%) | 138 (60.0%) |
| 45 to 54 Years | 29 (15.5%) | 127 (67.9%) |
| 55 to 64 Years | 45 (32.4%) | 99 (71.2%) |
| 65 to 74 Years | 184 (97.4%) | 71 (37.6%) |
| 75 Years and over | 164 (100.0%) | 62 (37.8%) |
| Total | 946 (54.5%) | 784 (45.2%) |
Disability Status by Sex by Age in Wynnewood
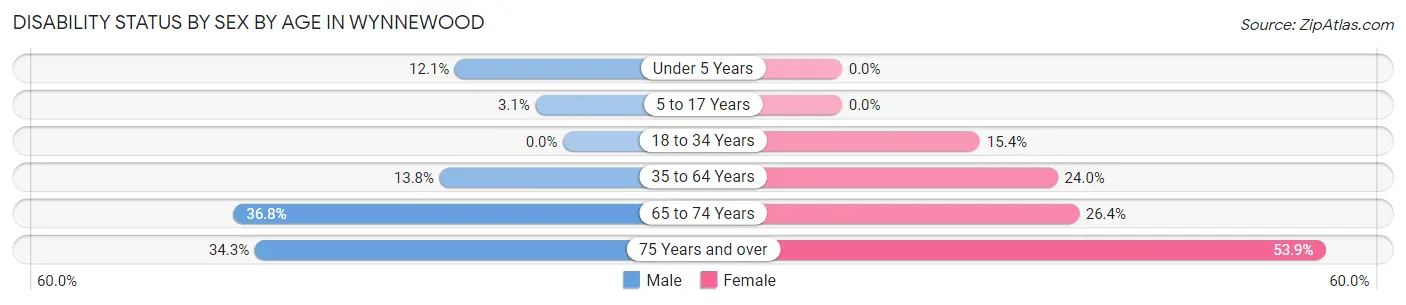
| Age Bracket | Male | Female |
| Under 5 Years | 10 (12.0%) | 0 (0.0%) |
| 5 to 17 Years | 6 (3.1%) | 0 (0.0%) |
| 18 to 34 Years | 0 (0.0%) | 34 (15.4%) |
| 35 to 64 Years | 37 (13.8%) | 69 (24.0%) |
| 65 to 74 Years | 43 (36.7%) | 19 (26.4%) |
| 75 Years and over | 34 (34.3%) | 35 (53.8%) |
Disability Class by Sex by Age in Wynnewood
Disability Class: Hearing Difficulty
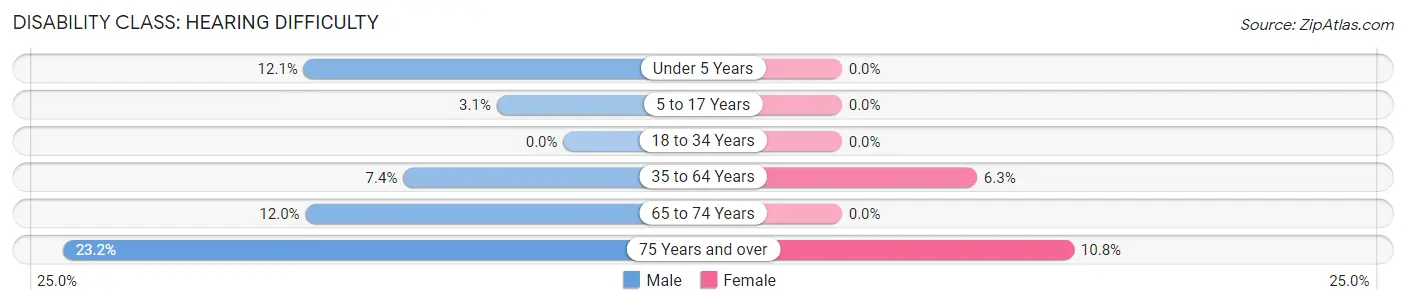
| Age Bracket | Male | Female |
| Under 5 Years | 10 (12.0%) | 0 (0.0%) |
| 5 to 17 Years | 6 (3.1%) | 0 (0.0%) |
| 18 to 34 Years | 0 (0.0%) | 0 (0.0%) |
| 35 to 64 Years | 20 (7.4%) | 18 (6.3%) |
| 65 to 74 Years | 14 (12.0%) | 0 (0.0%) |
| 75 Years and over | 23 (23.2%) | 7 (10.8%) |
Disability Class: Vision Difficulty
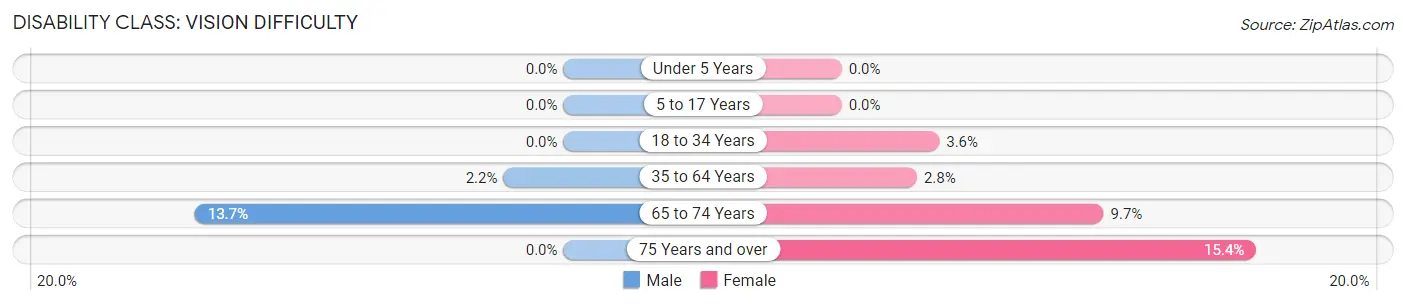
| Age Bracket | Male | Female |
| Under 5 Years | 0 (0.0%) | 0 (0.0%) |
| 5 to 17 Years | 0 (0.0%) | 0 (0.0%) |
| 18 to 34 Years | 0 (0.0%) | 8 (3.6%) |
| 35 to 64 Years | 6 (2.2%) | 8 (2.8%) |
| 65 to 74 Years | 16 (13.7%) | 7 (9.7%) |
| 75 Years and over | 0 (0.0%) | 10 (15.4%) |
Disability Class: Cognitive Difficulty
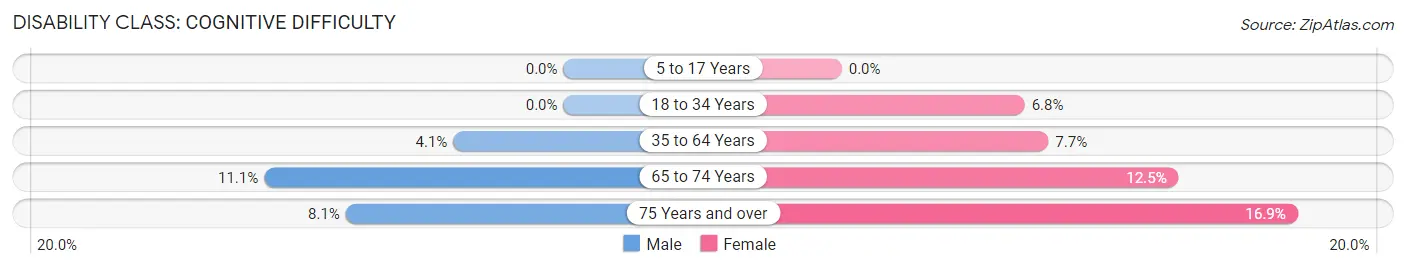
| Age Bracket | Male | Female |
| 5 to 17 Years | 0 (0.0%) | 0 (0.0%) |
| 18 to 34 Years | 0 (0.0%) | 15 (6.8%) |
| 35 to 64 Years | 11 (4.1%) | 22 (7.7%) |
| 65 to 74 Years | 13 (11.1%) | 9 (12.5%) |
| 75 Years and over | 8 (8.1%) | 11 (16.9%) |
Disability Class: Ambulatory Difficulty
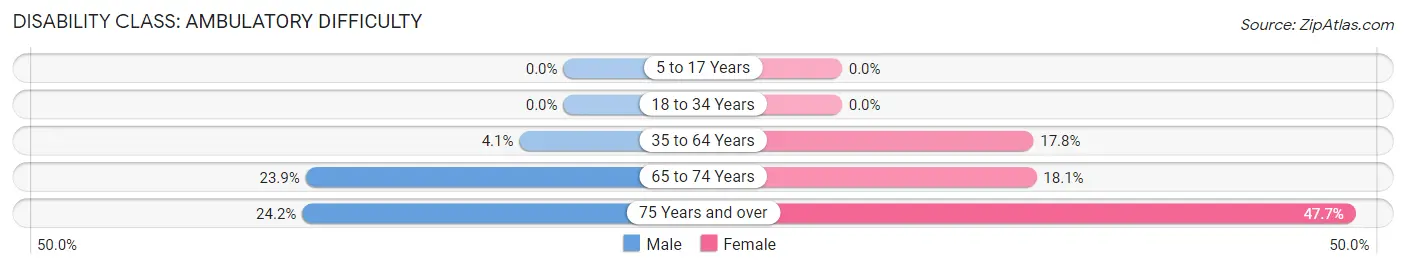
| Age Bracket | Male | Female |
| 5 to 17 Years | 0 (0.0%) | 0 (0.0%) |
| 18 to 34 Years | 0 (0.0%) | 0 (0.0%) |
| 35 to 64 Years | 11 (4.1%) | 51 (17.8%) |
| 65 to 74 Years | 28 (23.9%) | 13 (18.1%) |
| 75 Years and over | 24 (24.2%) | 31 (47.7%) |
Disability Class: Self-Care Difficulty
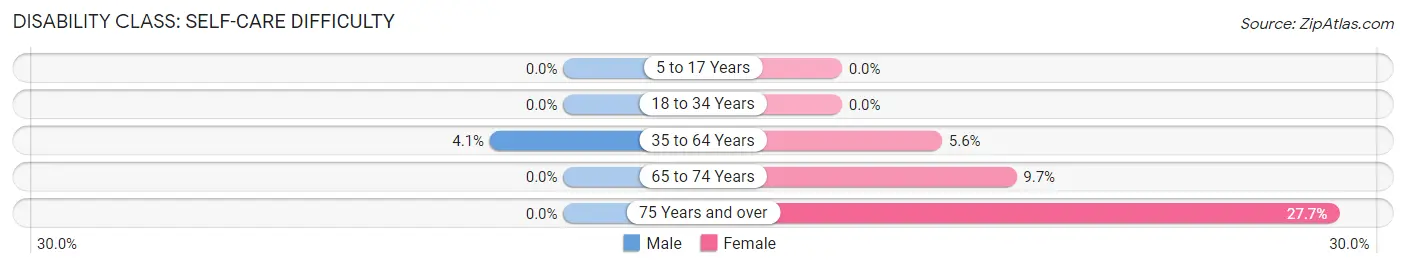
| Age Bracket | Male | Female |
| 5 to 17 Years | 0 (0.0%) | 0 (0.0%) |
| 18 to 34 Years | 0 (0.0%) | 0 (0.0%) |
| 35 to 64 Years | 11 (4.1%) | 16 (5.6%) |
| 65 to 74 Years | 0 (0.0%) | 7 (9.7%) |
| 75 Years and over | 0 (0.0%) | 18 (27.7%) |
Technology Access in Wynnewood
Computing Device Access in Wynnewood
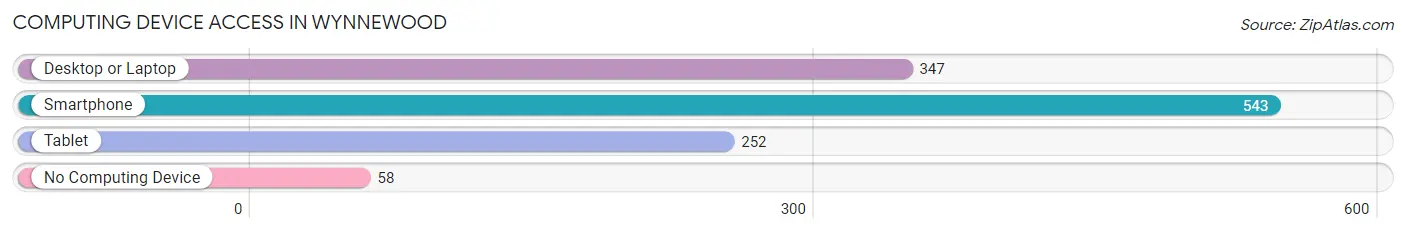
| Device Type | # Households | % Households |
| Desktop or Laptop | 347 | 55.2% |
| Smartphone | 543 | 86.5% |
| Tablet | 252 | 40.1% |
| No Computing Device | 58 | 9.2% |
| Total | 628 | 100.0% |
Internet Access in Wynnewood
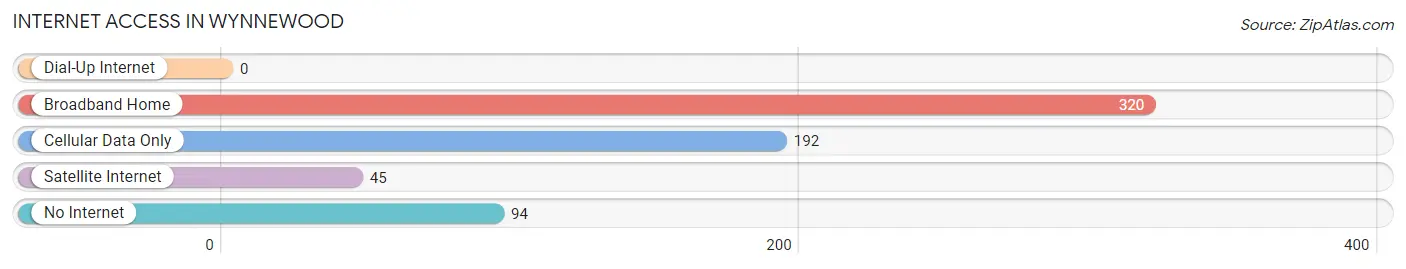
| Internet Type | # Households | % Households |
| Dial-Up Internet | 0 | 0.0% |
| Broadband Home | 320 | 51.0% |
| Cellular Data Only | 192 | 30.6% |
| Satellite Internet | 45 | 7.2% |
| No Internet | 94 | 15.0% |
| Total | 628 | 100.0% |
Wynnewood Summary
Wynnewood is a small town located in Garvin County, Oklahoma. It is situated in the Arbuckle Mountains, approximately 70 miles south of Oklahoma City. The town was founded in 1891 and was named after the nearby Wynnewood Creek. As of the 2010 census, the population of Wynnewood was 2,130.
Geography
Wynnewood is located at 34°45'25" North, 97°10'25" West (34.7569, -97.1736). It is situated in the Arbuckle Mountains, approximately 70 miles south of Oklahoma City. The town is located at an elevation of 890 feet above sea level. The total area of the town is 2.2 square miles, all of which is land.
Climate
Wynnewood has a humid subtropical climate, with hot summers and mild winters. The average annual temperature is 64°F, with an average high of 87°F in July and an average low of 40°F in January. The average annual precipitation is 40 inches, with an average of 4.5 inches of snowfall per year.
Demographics
As of the 2010 census, the population of Wynnewood was 2,130. The racial makeup of the town was 79.2% White, 15.2% African American, 0.7% Native American, 0.3% Asian, 0.1% Pacific Islander, and 4.5% from other races. Hispanic or Latino of any race were 3.2% of the population.
Economy
Wynnewood is a small town with a largely agricultural economy. The town is home to several farms, as well as a few small businesses. The town is also home to a number of oil and gas wells, which provide jobs and revenue for the town.
History
Wynnewood was founded in 1891 and was named after the nearby Wynnewood Creek. The town was originally a stop on the St. Louis and San Francisco Railway. The town was incorporated in 1901 and has remained relatively unchanged since then.
In the early 20th century, Wynnewood was a popular tourist destination, with many visitors coming to the town to enjoy the natural beauty of the Arbuckle Mountains. The town was also home to a number of resorts, including the Wynnewood Hotel, which was built in 1910 and was a popular destination for visitors from Oklahoma City.
In the late 20th century, Wynnewood began to decline as a tourist destination, and the town's economy shifted to focus more on agriculture and oil and gas production. The town has remained relatively unchanged since then, and is still a small, rural community.
Common Questions
What is Per Capita Income in Wynnewood?
Per Capita income in Wynnewood is $23,507.
What is the Median Family Income in Wynnewood?
Median Family Income in Wynnewood is $43,000.
What is the Median Household income in Wynnewood?
Median Household Income in Wynnewood is $39,327.
What is Income or Wage Gap in Wynnewood?
Income or Wage Gap in Wynnewood is 26.9%.
Women in Wynnewood earn 73.1 cents for every dollar earned by a man.
What is Inequality or Gini Index in Wynnewood?
Inequality or Gini Index in Wynnewood is 0.48.
What is the Total Population of Wynnewood?
Total Population of Wynnewood is 1,767.
What is the Total Male Population of Wynnewood?
Total Male Population of Wynnewood is 907.
What is the Total Female Population of Wynnewood?
Total Female Population of Wynnewood is 860.
What is the Ratio of Males per 100 Females in Wynnewood?
There are 105.47 Males per 100 Females in Wynnewood.
What is the Ratio of Females per 100 Males in Wynnewood?
There are 94.82 Females per 100 Males in Wynnewood.
What is the Median Population Age in Wynnewood?
Median Population Age in Wynnewood is 38.1 Years.
What is the Average Family Size in Wynnewood
Average Family Size in Wynnewood is 3.5 People.
What is the Average Household Size in Wynnewood
Average Household Size in Wynnewood is 2.8 People.
How Large is the Labor Force in Wynnewood?
There are 732 People in the Labor Forcein in Wynnewood.
What is the Percentage of People in the Labor Force in Wynnewood?
54.9% of People are in the Labor Force in Wynnewood.
What is the Unemployment Rate in Wynnewood?
Unemployment Rate in Wynnewood is 4.5%.