Willow, OK Map & Demographics
Willow Map
Willow Overview
$49,082
PER CAPITA INCOME
$67,639
AVG FAMILY INCOME
$53,665
AVG HOUSEHOLD INCOME
51.8%
WAGE / INCOME GAP [ % ]
48.2¢/ $1
WAGE / INCOME GAP [ $ ]
0.25
INEQUALITY / GINI INDEX
163
TOTAL POPULATION
112
MALE POPULATION
51
FEMALE POPULATION
219.61
MALES / 100 FEMALES
45.54
FEMALES / 100 MALES
62.3
MEDIAN AGE
3.5
AVG FAMILY SIZE
1.6
AVG HOUSEHOLD SIZE
112
LABOR FORCE [ PEOPLE ]
75.7%
PERCENT IN LABOR FORCE
Willow Zip Codes
Willow Area Codes
Income in Willow
Income Overview in Willow
Per Capita Income in Willow is $49,082, while median incomes of families and households are $67,639 and $53,665 respectively.
| Characteristic | Number | Measure |
| Per Capita Income | 163 | $49,082 |
| Median Family Income | 23 | $67,639 |
| Mean Family Income | 23 | $89,091 |
| Median Household Income | 105 | $53,665 |
| Mean Household Income | 105 | $58,905 |
| Income Deficit | 23 | $0 |
| Wage / Income Gap (%) | 163 | 51.78% |
| Wage / Income Gap ($) | 163 | 48.22¢ per $1 |
| Gini / Inequality Index | 163 | 0.25 |
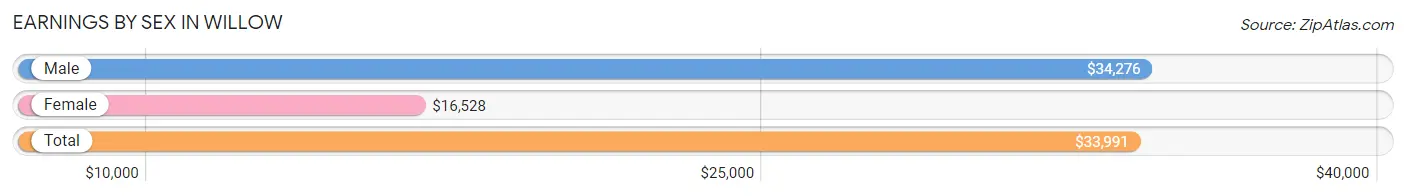
Earnings by Sex in Willow
Average Earnings in Willow are $33,991, $34,276 for men and $16,528 for women, a difference of 51.8%.
| Sex | Number | Average Earnings |
| Male | 97 (86.6%) | $34,276 |
| Female | 15 (13.4%) | $16,528 |
| Total | 112 (100.0%) | $33,991 |
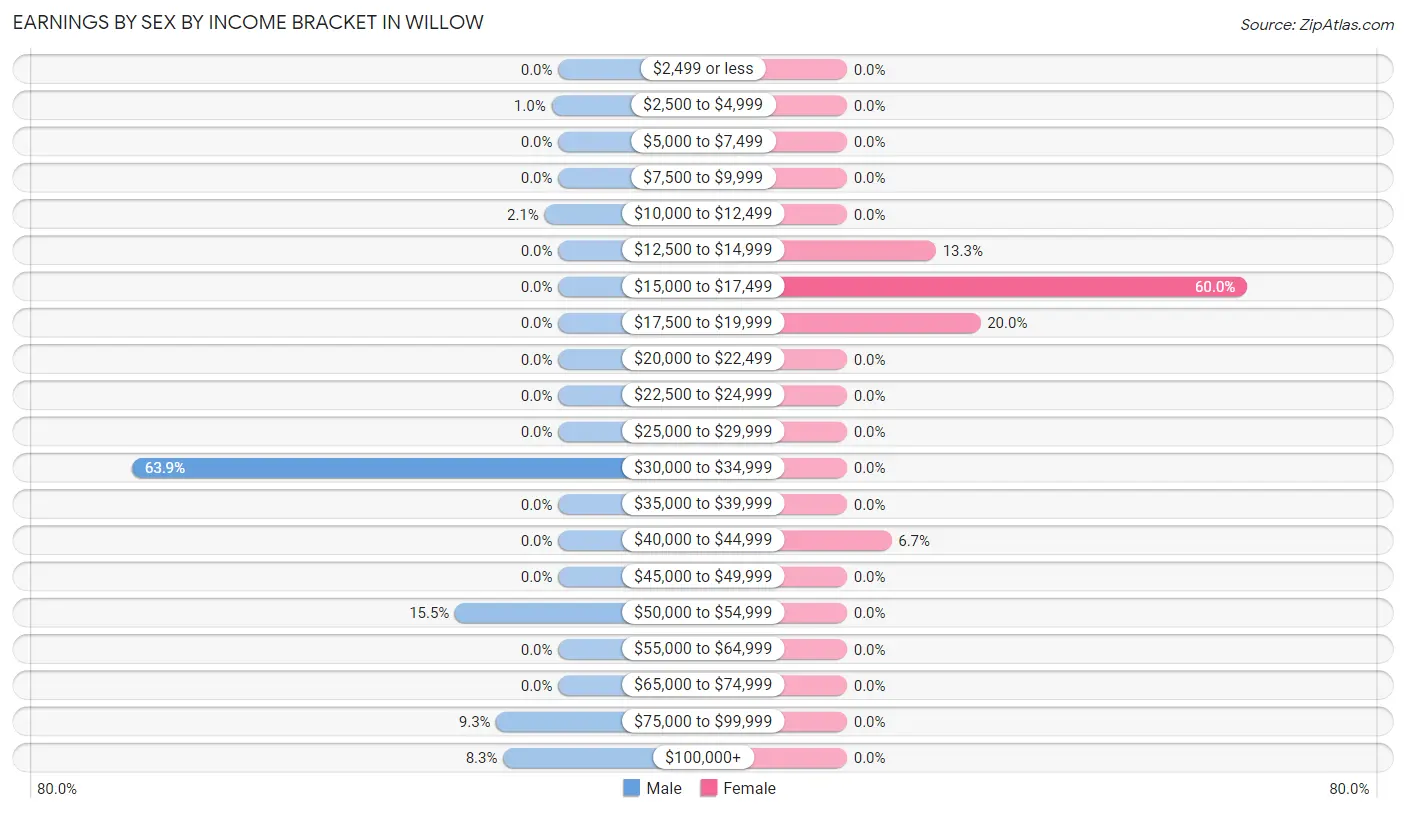
Earnings by Sex by Income Bracket in Willow
The most common earnings brackets in Willow are $30,000 to $34,999 for men (62 | 63.9%) and $15,000 to $17,499 for women (9 | 60.0%).
| Income | Male | Female |
| $2,499 or less | 0 (0.0%) | 0 (0.0%) |
| $2,500 to $4,999 | 1 (1.0%) | 0 (0.0%) |
| $5,000 to $7,499 | 0 (0.0%) | 0 (0.0%) |
| $7,500 to $9,999 | 0 (0.0%) | 0 (0.0%) |
| $10,000 to $12,499 | 2 (2.1%) | 0 (0.0%) |
| $12,500 to $14,999 | 0 (0.0%) | 2 (13.3%) |
| $15,000 to $17,499 | 0 (0.0%) | 9 (60.0%) |
| $17,500 to $19,999 | 0 (0.0%) | 3 (20.0%) |
| $20,000 to $22,499 | 0 (0.0%) | 0 (0.0%) |
| $22,500 to $24,999 | 0 (0.0%) | 0 (0.0%) |
| $25,000 to $29,999 | 0 (0.0%) | 0 (0.0%) |
| $30,000 to $34,999 | 62 (63.9%) | 0 (0.0%) |
| $35,000 to $39,999 | 0 (0.0%) | 0 (0.0%) |
| $40,000 to $44,999 | 0 (0.0%) | 1 (6.7%) |
| $45,000 to $49,999 | 0 (0.0%) | 0 (0.0%) |
| $50,000 to $54,999 | 15 (15.5%) | 0 (0.0%) |
| $55,000 to $64,999 | 0 (0.0%) | 0 (0.0%) |
| $65,000 to $74,999 | 0 (0.0%) | 0 (0.0%) |
| $75,000 to $99,999 | 9 (9.3%) | 0 (0.0%) |
| $100,000+ | 8 (8.3%) | 0 (0.0%) |
| Total | 97 (100.0%) | 15 (100.0%) |
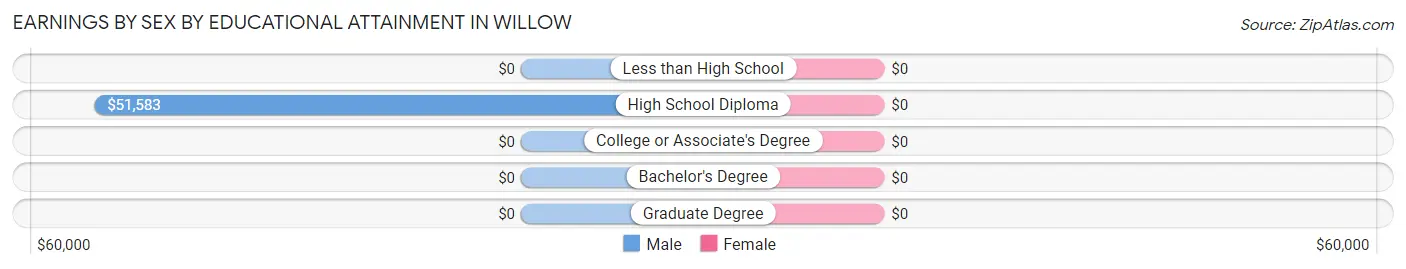
Earnings by Sex by Educational Attainment in Willow
| Educational Attainment | Male Income | Female Income |
| Less than High School | - | - |
| High School Diploma | $51,583 | $0 |
| College or Associate's Degree | - | - |
| Bachelor's Degree | - | - |
| Graduate Degree | - | - |
| Total | $34,298 | $16,528 |
Family Income in Willow
Family Income Brackets in Willow
According to the Willow family income data, there are 14 families falling into the $50,000 to $74,999 income range, which is the most common income bracket and makes up 60.9% of all families.
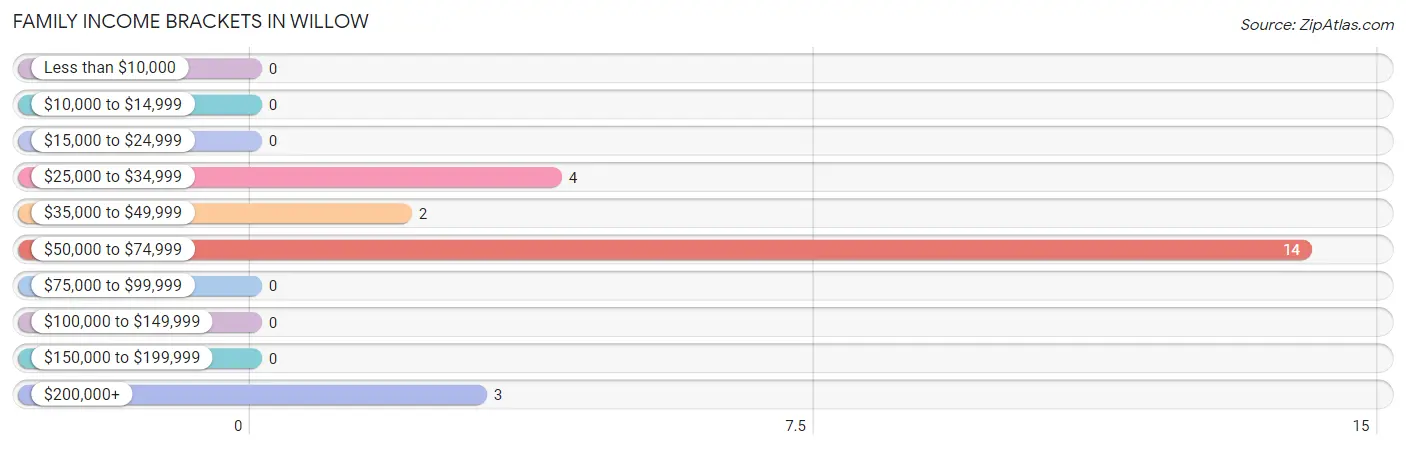
| Income Bracket | # Families | % Families |
| Less than $10,000 | 0 | 0.0% |
| $10,000 to $14,999 | 0 | 0.0% |
| $15,000 to $24,999 | 0 | 0.0% |
| $25,000 to $34,999 | 4 | 17.4% |
| $35,000 to $49,999 | 2 | 8.7% |
| $50,000 to $74,999 | 14 | 60.9% |
| $75,000 to $99,999 | 0 | 0.0% |
| $100,000 to $149,999 | 0 | 0.0% |
| $150,000 to $199,999 | 0 | 0.0% |
| $200,000+ | 3 | 13.0% |
Family Income by Famaliy Size in Willow
| Income Bracket | # Families | Median Income |
| 2-Person Families | 4 (17.4%) | $0 |
| 3-Person Families | 14 (60.9%) | $0 |
| 4-Person Families | 5 (21.7%) | $0 |
| 5-Person Families | 0 (0.0%) | $0 |
| 6-Person Families | 0 (0.0%) | $0 |
| 7+ Person Families | 0 (0.0%) | $0 |
| Total | 23 (100.0%) | $67,639 |
Family Income by Number of Earners in Willow
| Number of Earners | # Families | Median Income |
| No Earners | 5 (21.7%) | $0 |
| 1 Earner | 4 (17.4%) | $0 |
| 2 Earners | 11 (47.8%) | $0 |
| 3+ Earners | 3 (13.0%) | $0 |
| Total | 23 (100.0%) | $67,639 |
Household Income in Willow
Household Income Brackets in Willow
With 72 households falling in the category, the $50,000 to $74,999 income range is the most frequent in Willow, accounting for 68.6% of all households.
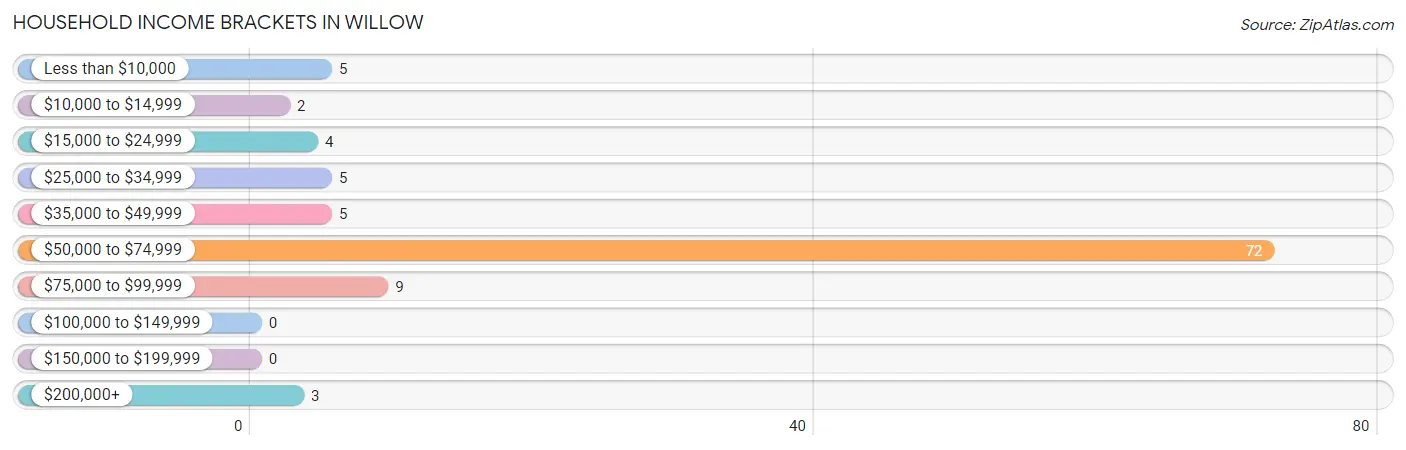
| Income Bracket | # Households | % Households |
| Less than $10,000 | 5 | 4.8% |
| $10,000 to $14,999 | 2 | 1.9% |
| $15,000 to $24,999 | 4 | 3.8% |
| $25,000 to $34,999 | 5 | 4.8% |
| $35,000 to $49,999 | 5 | 4.8% |
| $50,000 to $74,999 | 72 | 68.6% |
| $75,000 to $99,999 | 9 | 8.6% |
| $100,000 to $149,999 | 0 | 0.0% |
| $150,000 to $199,999 | 0 | 0.0% |
| $200,000+ | 3 | 2.9% |
Household Income by Householder Age in Willow
The median household income in Willow is $53,665, with the highest median household income of $78,750 found in the 25 to 44 years age bracket for the primary householder. A total of 15 households (14.3%) fall into this category.
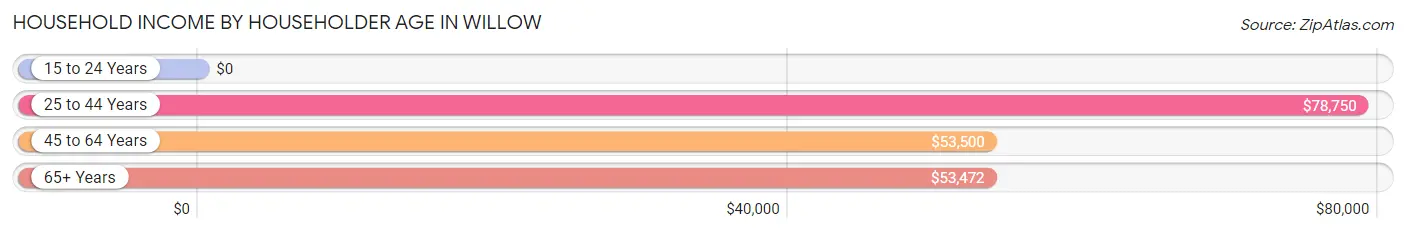
| Income Bracket | # Households | Median Income |
| 15 to 24 Years | 0 (0.0%) | $0 |
| 25 to 44 Years | 15 (14.3%) | $78,750 |
| 45 to 64 Years | 24 (22.9%) | $53,500 |
| 65+ Years | 66 (62.9%) | $53,472 |
| Total | 105 (100.0%) | $53,665 |
Poverty in Willow
Income Below Poverty by Sex and Age in Willow
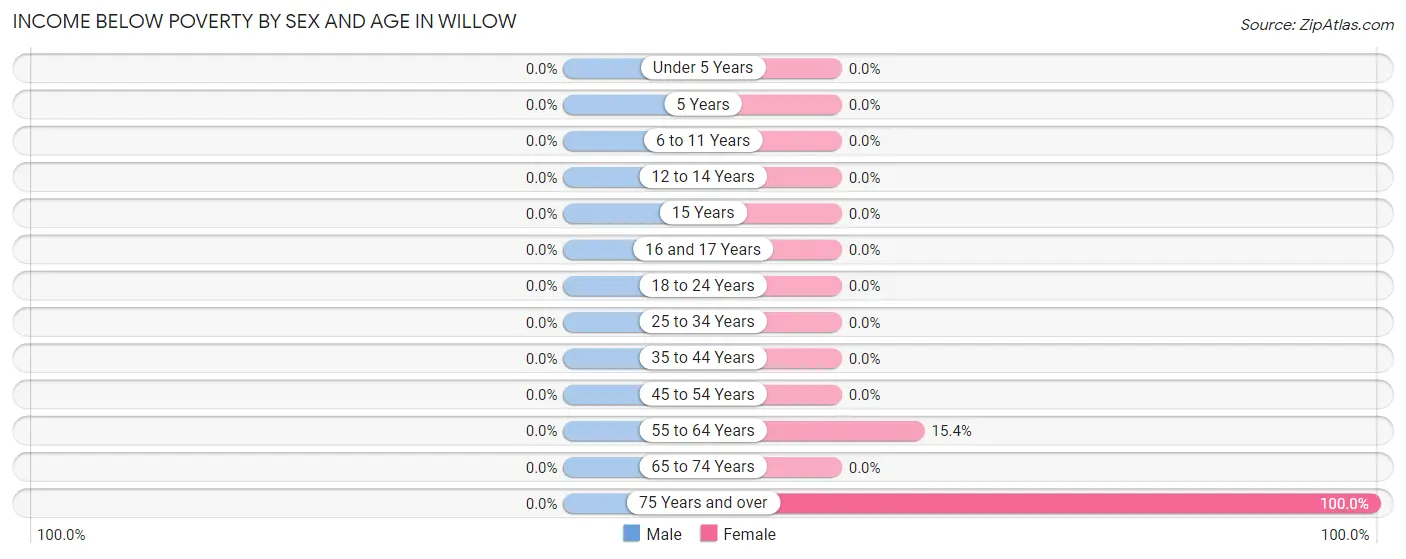
| Age Bracket | Male | Female |
| Under 5 Years | 0 (0.0%) | 0 (0.0%) |
| 5 Years | 0 (0.0%) | 0 (0.0%) |
| 6 to 11 Years | 0 (0.0%) | 0 (0.0%) |
| 12 to 14 Years | 0 (0.0%) | 0 (0.0%) |
| 15 Years | 0 (0.0%) | 0 (0.0%) |
| 16 and 17 Years | 0 (0.0%) | 0 (0.0%) |
| 18 to 24 Years | 0 (0.0%) | 0 (0.0%) |
| 25 to 34 Years | 0 (0.0%) | 0 (0.0%) |
| 35 to 44 Years | 0 (0.0%) | 0 (0.0%) |
| 45 to 54 Years | 0 (0.0%) | 0 (0.0%) |
| 55 to 64 Years | 0 (0.0%) | 2 (15.4%) |
| 65 to 74 Years | 0 (0.0%) | 0 (0.0%) |
| 75 Years and over | 0 (0.0%) | 5 (100.0%) |
| Total | 0 (0.0%) | 7 (13.7%) |
Income Above Poverty by Sex and Age in Willow
According to the poverty statistics in Willow, males aged 6 to 11 years and females aged 6 to 11 years are the age groups that are most secure financially, with 100.0% of males and 100.0% of females in these age groups living above the poverty line.
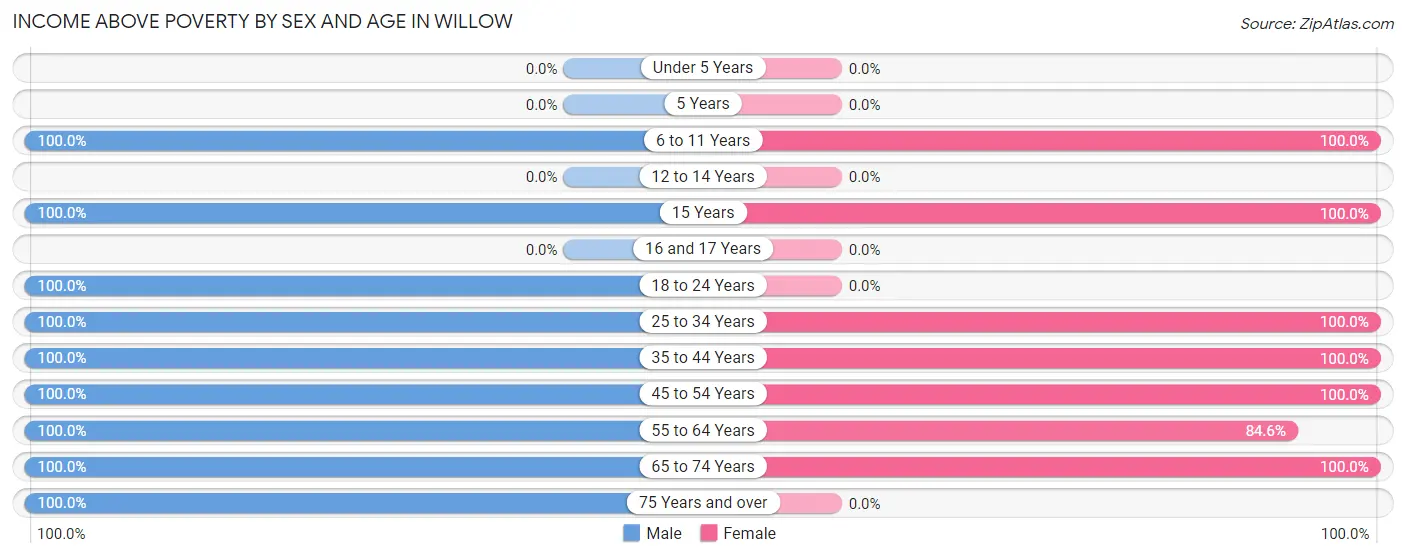
| Age Bracket | Male | Female |
| Under 5 Years | 0 (0.0%) | 0 (0.0%) |
| 5 Years | 0 (0.0%) | 0 (0.0%) |
| 6 to 11 Years | 2 (100.0%) | 2 (100.0%) |
| 12 to 14 Years | 0 (0.0%) | 0 (0.0%) |
| 15 Years | 1 (100.0%) | 10 (100.0%) |
| 16 and 17 Years | 0 (0.0%) | 0 (0.0%) |
| 18 to 24 Years | 1 (100.0%) | 0 (0.0%) |
| 25 to 34 Years | 12 (100.0%) | 3 (100.0%) |
| 35 to 44 Years | 23 (100.0%) | 3 (100.0%) |
| 45 to 54 Years | 5 (100.0%) | 13 (100.0%) |
| 55 to 64 Years | 9 (100.0%) | 11 (84.6%) |
| 65 to 74 Years | 4 (100.0%) | 2 (100.0%) |
| 75 Years and over | 55 (100.0%) | 0 (0.0%) |
| Total | 112 (100.0%) | 44 (86.3%) |
Income Below Poverty Among Married-Couple Families in Willow
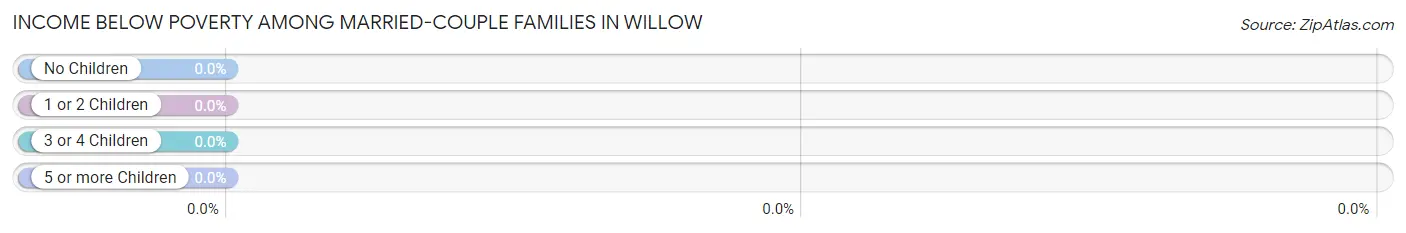
| Children | Above Poverty | Below Poverty |
| No Children | 9 (100.0%) | 0 (0.0%) |
| 1 or 2 Children | 14 (100.0%) | 0 (0.0%) |
| 3 or 4 Children | 0 (0.0%) | 0 (0.0%) |
| 5 or more Children | 0 (0.0%) | 0 (0.0%) |
| Total | 23 (100.0%) | 0 (0.0%) |
Income Below Poverty Among Single-Parent Households in Willow
| Children | Single Father | Single Mother |
| No Children | 0 (0.0%) | 0 (0.0%) |
| 1 or 2 Children | 0 (0.0%) | 0 (0.0%) |
| 3 or 4 Children | 0 (0.0%) | 0 (0.0%) |
| 5 or more Children | 0 (0.0%) | 0 (0.0%) |
| Total | 0 (0.0%) | 0 (0.0%) |
Income Below Poverty Among Married-Couple vs Single-Parent Households in Willow
| Children | Married-Couple Families | Single-Parent Households |
| No Children | 0 (0.0%) | 0 (0.0%) |
| 1 or 2 Children | 0 (0.0%) | 0 (0.0%) |
| 3 or 4 Children | 0 (0.0%) | 0 (0.0%) |
| 5 or more Children | 0 (0.0%) | 0 (0.0%) |
| Total | 0 (0.0%) | 0 (0.0%) |
Race in Willow
The most populous races in Willow are White / Caucasian (149 | 91.4%), Hispanic or Latino (20 | 12.3%), and Two or more Races (11 | 6.8%).
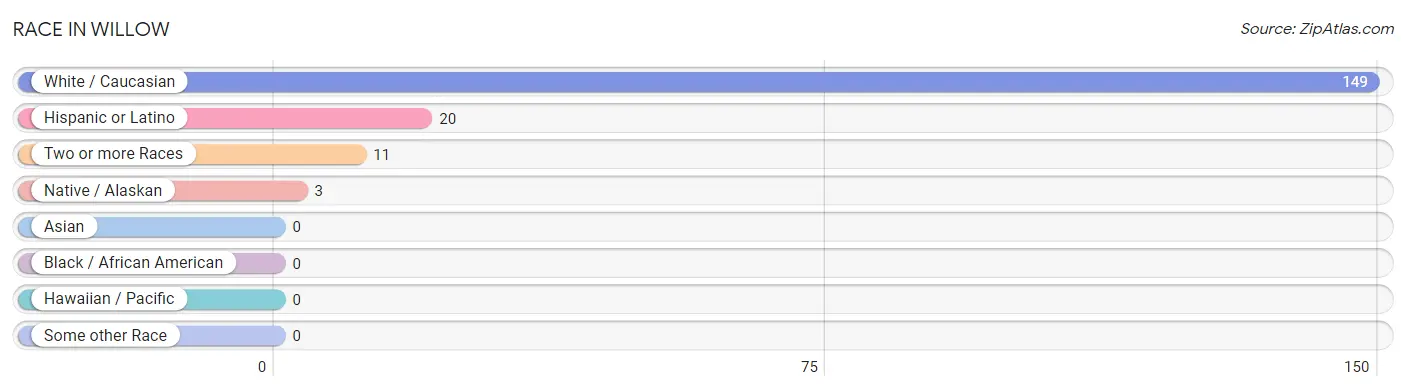
| Race | # Population | % Population |
| Asian | 0 | 0.0% |
| Black / African American | 0 | 0.0% |
| Hawaiian / Pacific | 0 | 0.0% |
| Hispanic or Latino | 20 | 12.3% |
| Native / Alaskan | 3 | 1.8% |
| White / Caucasian | 149 | 91.4% |
| Two or more Races | 11 | 6.8% |
| Some other Race | 0 | 0.0% |
| Total | 163 | 100.0% |
Ancestry in Willow
The most populous ancestries reported in Willow are Irish (61 | 37.4%), Mexican (18 | 11.0%), American (14 | 8.6%), German (12 | 7.4%), and Cherokee (5 | 3.1%), together accounting for 67.5% of all Willow residents.
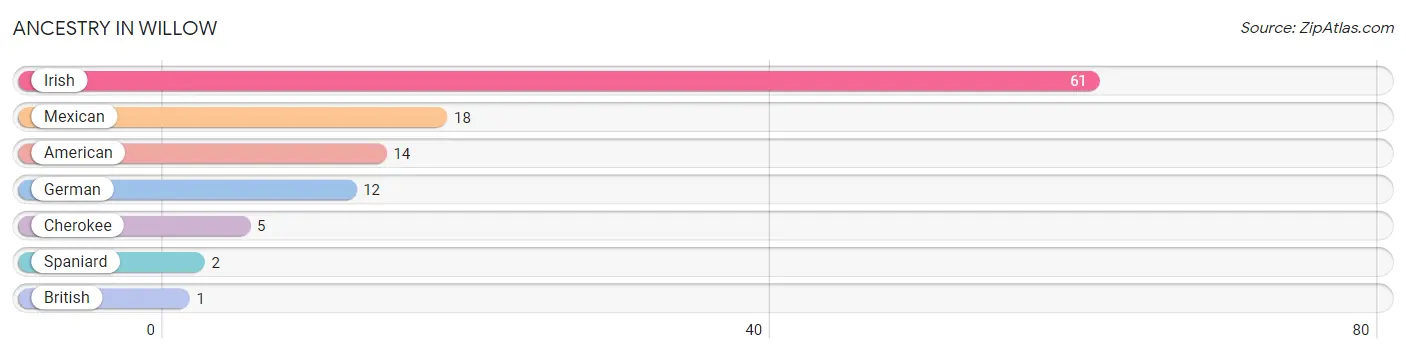
| Ancestry | # Population | % Population |
| American | 14 | 8.6% |
| British | 1 | 0.6% |
| Cherokee | 5 | 3.1% |
| German | 12 | 7.4% |
| Irish | 61 | 37.4% |
| Mexican | 18 | 11.0% |
| Spaniard | 2 | 1.2% | View All 7 Rows |
Immigrants in Willow

| Immigration Origin | # Population | % Population | View All 0 Rows |
Sex and Age in Willow
Sex and Age in Willow
The most populous age groups in Willow are 80 to 84 Years (54 | 48.2%) for men and 60 to 64 Years (13 | 25.5%) for women.
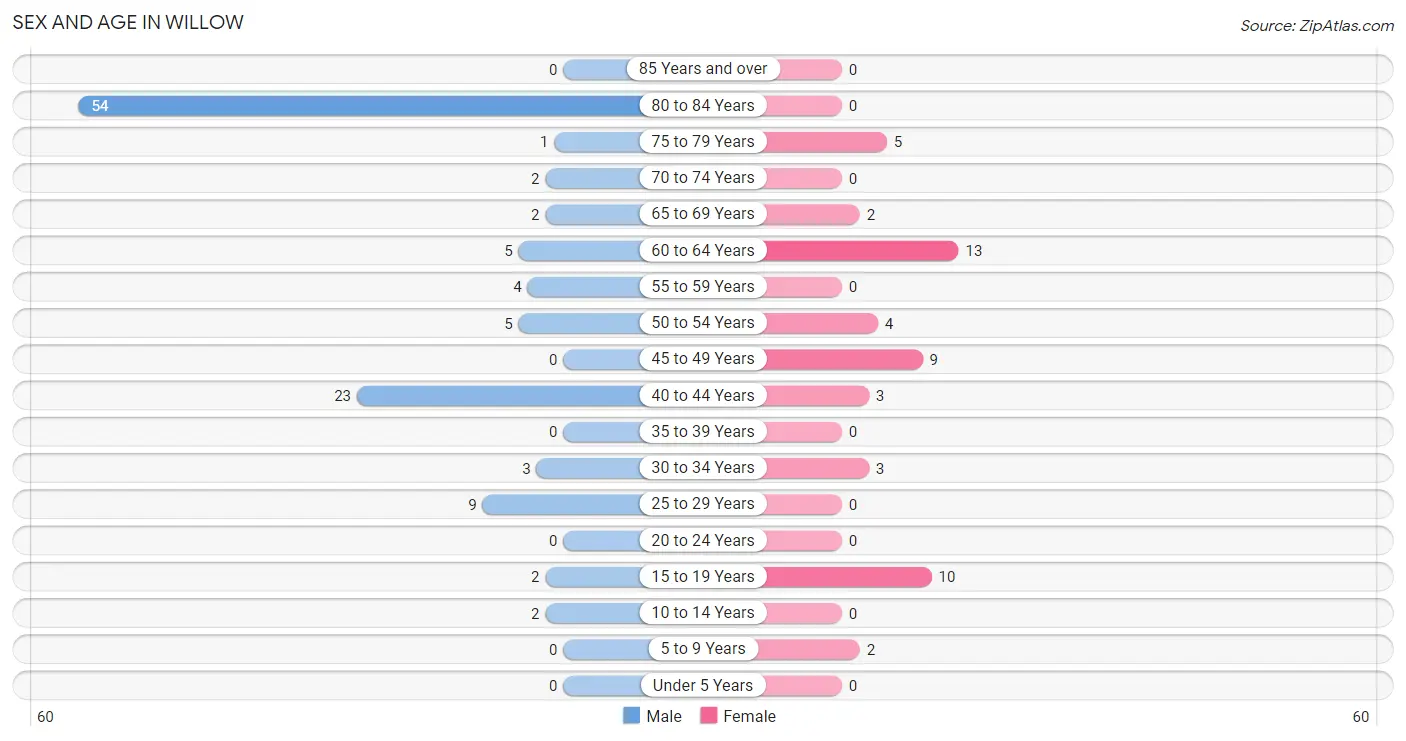
| Age Bracket | Male | Female |
| Under 5 Years | 0 (0.0%) | 0 (0.0%) |
| 5 to 9 Years | 0 (0.0%) | 2 (3.9%) |
| 10 to 14 Years | 2 (1.8%) | 0 (0.0%) |
| 15 to 19 Years | 2 (1.8%) | 10 (19.6%) |
| 20 to 24 Years | 0 (0.0%) | 0 (0.0%) |
| 25 to 29 Years | 9 (8.0%) | 0 (0.0%) |
| 30 to 34 Years | 3 (2.7%) | 3 (5.9%) |
| 35 to 39 Years | 0 (0.0%) | 0 (0.0%) |
| 40 to 44 Years | 23 (20.5%) | 3 (5.9%) |
| 45 to 49 Years | 0 (0.0%) | 9 (17.6%) |
| 50 to 54 Years | 5 (4.5%) | 4 (7.8%) |
| 55 to 59 Years | 4 (3.6%) | 0 (0.0%) |
| 60 to 64 Years | 5 (4.5%) | 13 (25.5%) |
| 65 to 69 Years | 2 (1.8%) | 2 (3.9%) |
| 70 to 74 Years | 2 (1.8%) | 0 (0.0%) |
| 75 to 79 Years | 1 (0.9%) | 5 (9.8%) |
| 80 to 84 Years | 54 (48.2%) | 0 (0.0%) |
| 85 Years and over | 0 (0.0%) | 0 (0.0%) |
| Total | 112 (100.0%) | 51 (100.0%) |
Families and Households in Willow
Median Family Size in Willow
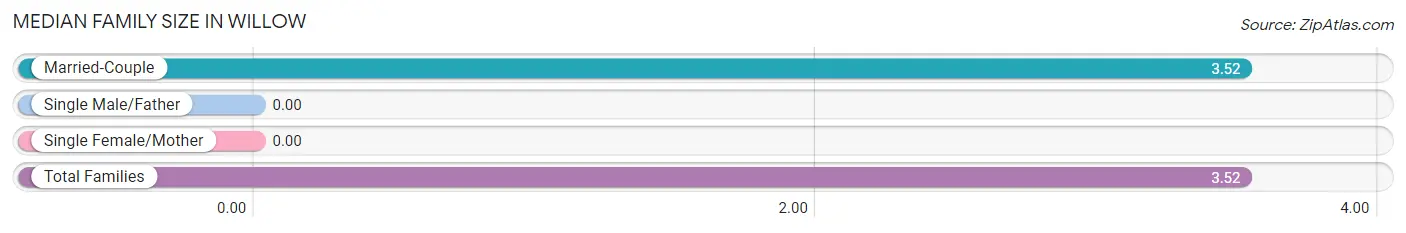
| Family Type | # Families | Family Size |
| Married-Couple | 23 (100.0%) | 3.52 |
| Single Male/Father | 0 (0.0%) | - |
| Single Female/Mother | 0 (0.0%) | - |
| Total Families | 23 (100.0%) | 3.52 |
Median Household Size in Willow
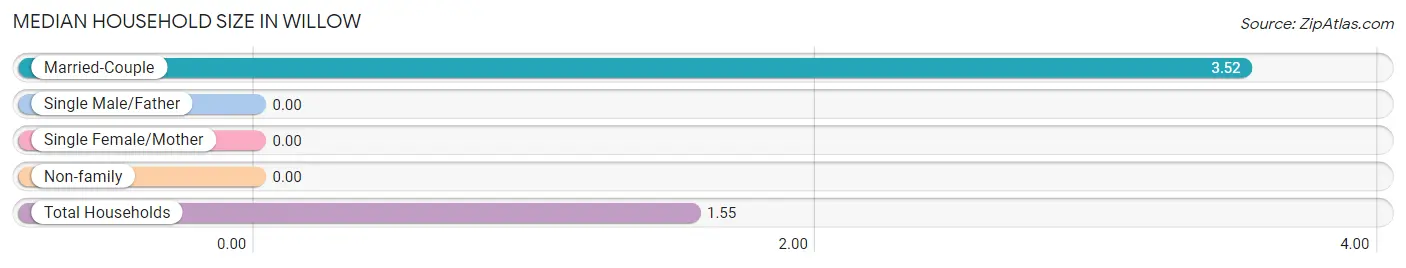
| Household Type | # Households | Household Size |
| Married-Couple | 23 (21.9%) | 3.52 |
| Single Male/Father | 0 (0.0%) | - |
| Single Female/Mother | 0 (0.0%) | - |
| Non-family | 82 (78.1%) | - |
| Total Households | 105 (100.0%) | 1.55 |
Household Size by Marriage Status in Willow
Out of a total of 105 households in Willow, 23 (21.9%) are family households, while 82 (78.1%) are nonfamily households. The most numerous type of family households are 3-person households, comprising 14, and the most common type of nonfamily households are 1-person households, comprising 82.
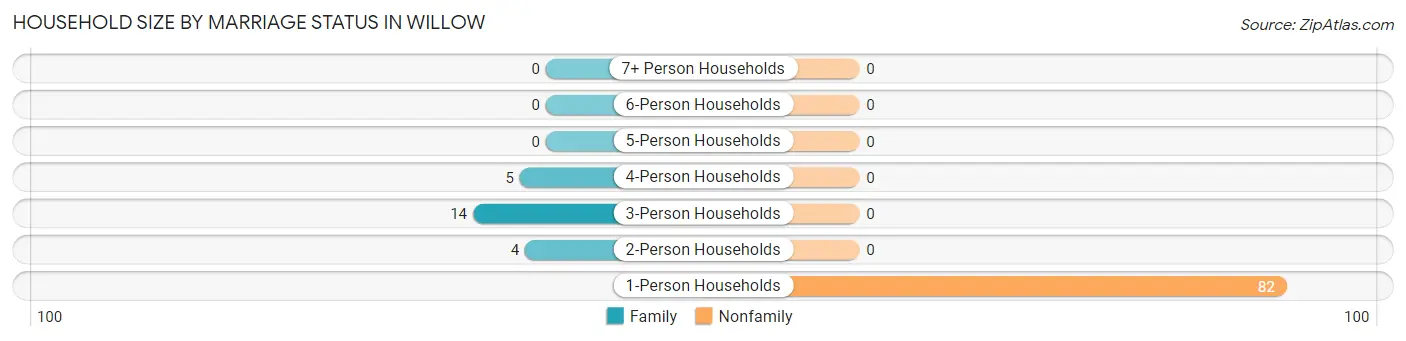
| Household Size | Family Households | Nonfamily Households |
| 1-Person Households | - | 82 (78.1%) |
| 2-Person Households | 4 (3.8%) | 0 (0.0%) |
| 3-Person Households | 14 (13.3%) | 0 (0.0%) |
| 4-Person Households | 5 (4.8%) | 0 (0.0%) |
| 5-Person Households | 0 (0.0%) | 0 (0.0%) |
| 6-Person Households | 0 (0.0%) | 0 (0.0%) |
| 7+ Person Households | 0 (0.0%) | 0 (0.0%) |
| Total | 23 (21.9%) | 82 (78.1%) |
Female Fertility in Willow
Fertility by Age in Willow
| Age Bracket | Women with Births | Births / 1,000 Women |
| 15 to 19 years | 0 (0.0%) | 0.0 |
| 20 to 34 years | 0 (0.0%) | 0.0 |
| 35 to 50 years | 0 (0.0%) | 0.0 |
| Total | 0 (0.0%) | 0.0 |
Fertility by Age by Marriage Status in Willow
| Age Bracket | Married | Unmarried |
| 15 to 19 years | 0 (0.0%) | 0 (0.0%) |
| 20 to 34 years | 0 (0.0%) | 0 (0.0%) |
| 35 to 50 years | 0 (0.0%) | 0 (0.0%) |
| Total | 0 (0.0%) | 0 (0.0%) |
Fertility by Education in Willow
| Educational Attainment | Women with Births | Births / 1,000 Women |
| Less than High School | 0 (0.0%) | 0.0 |
| High School Diploma | 0 (0.0%) | 0.0 |
| College or Associate's Degree | 0 (0.0%) | 0.0 |
| Bachelor's Degree | 0 (0.0%) | 0.0 |
| Graduate Degree | 0 (0.0%) | 0.0 |
| Total | 0 (0.0%) | 0.0 |
Fertility by Education by Marriage Status in Willow
| Educational Attainment | Married | Unmarried |
| Less than High School | 0 (0.0%) | 0 (0.0%) |
| High School Diploma | 0 (0.0%) | 0 (0.0%) |
| College or Associate's Degree | 0 (0.0%) | 0 (0.0%) |
| Bachelor's Degree | 0 (0.0%) | 0 (0.0%) |
| Graduate Degree | 0 (0.0%) | 0 (0.0%) |
| Total | 0 (0.0%) | 0 (0.0%) |
Employment Characteristics in Willow
Employment by Class of Employer in Willow
Among the 112 employed individuals in Willow, self-employed (not incorporated) (54 | 48.2%), private company employees (42 | 37.5%), and state government employees (14 | 12.5%) make up the most common classes of employment.
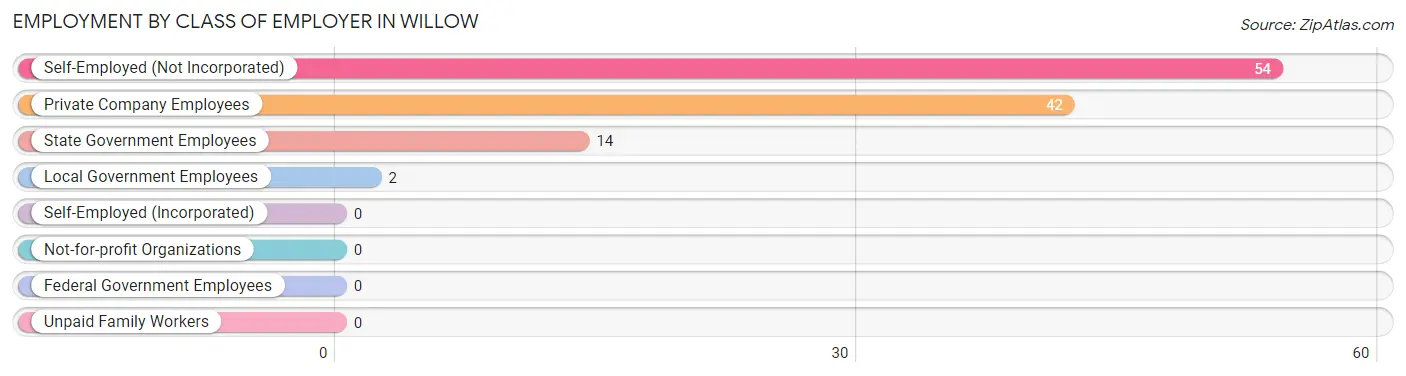
| Employer Class | # Employees | % Employees |
| Private Company Employees | 42 | 37.5% |
| Self-Employed (Incorporated) | 0 | 0.0% |
| Self-Employed (Not Incorporated) | 54 | 48.2% |
| Not-for-profit Organizations | 0 | 0.0% |
| Local Government Employees | 2 | 1.8% |
| State Government Employees | 14 | 12.5% |
| Federal Government Employees | 0 | 0.0% |
| Unpaid Family Workers | 0 | 0.0% |
| Total | 112 | 100.0% |
Employment Status by Age in Willow
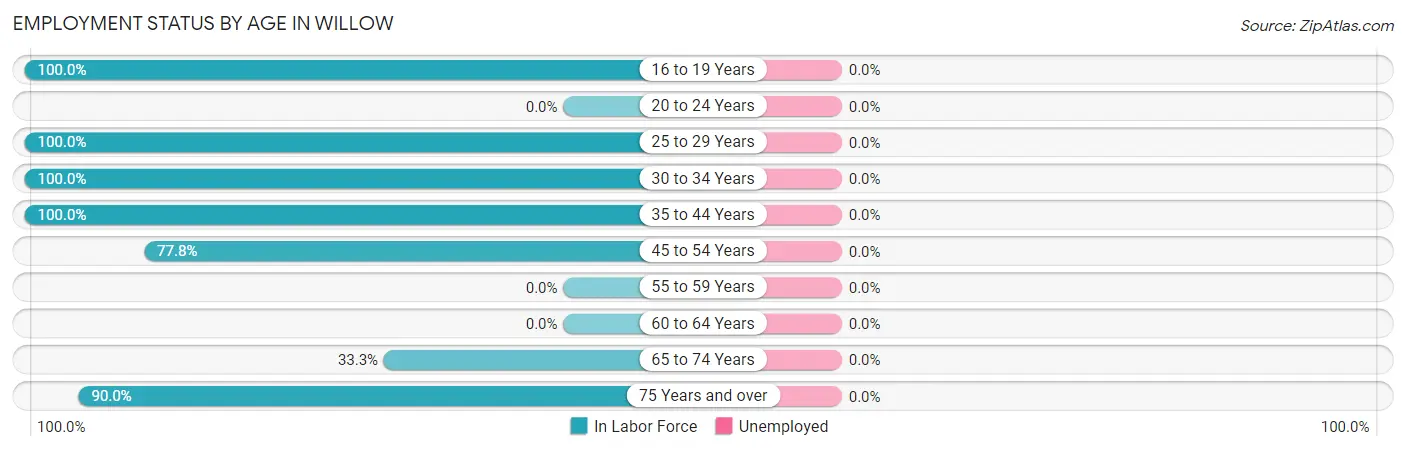
| Age Bracket | In Labor Force | Unemployed |
| 16 to 19 Years | 1 (100.0%) | 0 (0.0%) |
| 20 to 24 Years | 0 (0.0%) | 0 (0.0%) |
| 25 to 29 Years | 9 (100.0%) | 0 (0.0%) |
| 30 to 34 Years | 6 (100.0%) | 0 (0.0%) |
| 35 to 44 Years | 26 (100.0%) | 0 (0.0%) |
| 45 to 54 Years | 14 (77.8%) | 0 (0.0%) |
| 55 to 59 Years | 0 (0.0%) | 0 (0.0%) |
| 60 to 64 Years | 0 (0.0%) | 0 (0.0%) |
| 65 to 74 Years | 2 (33.3%) | 0 (0.0%) |
| 75 Years and over | 54 (90.0%) | 0 (0.0%) |
| Total | 112 (75.7%) | 0 (0.0%) |
Employment Status by Educational Attainment in Willow
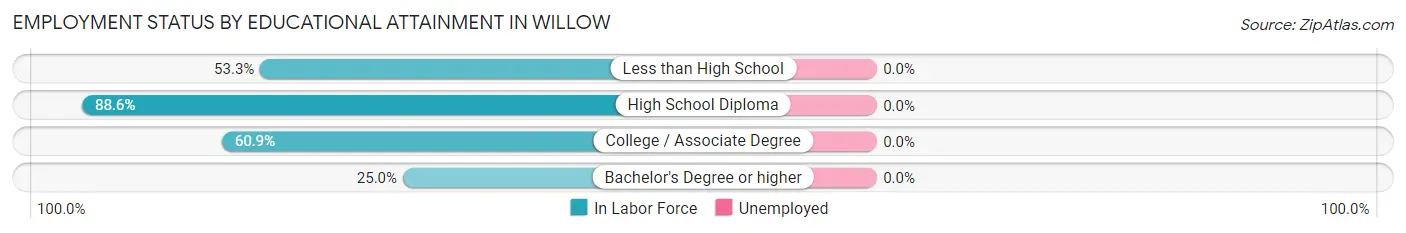
| Educational Attainment | In Labor Force | Unemployed |
| Less than High School | 8 (53.3%) | 0 (0.0%) |
| High School Diploma | 31 (88.6%) | 0 (0.0%) |
| College / Associate Degree | 14 (60.9%) | 0 (0.0%) |
| Bachelor's Degree or higher | 2 (25.0%) | 0 (0.0%) |
| Total | 55 (67.9%) | 0 (0.0%) |
Employment Occupations by Sex in Willow
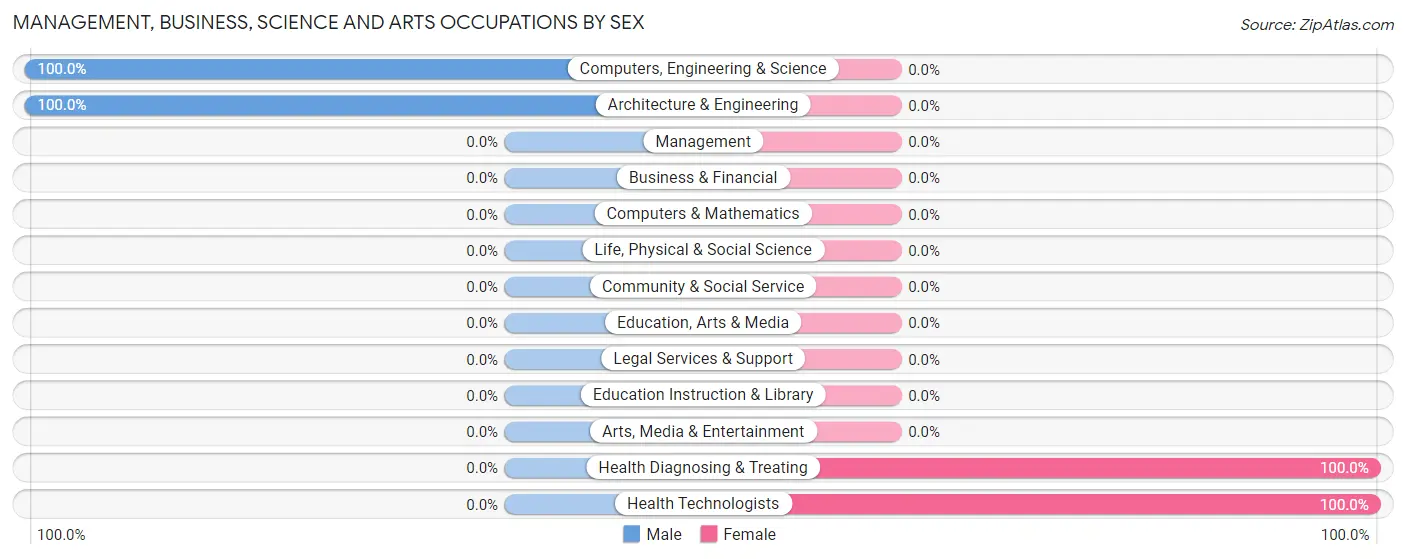
Management, Business, Science and Arts Occupations
The most common Management, Business, Science and Arts occupations in Willow are Computers, Engineering & Science (8 | 7.1%), Architecture & Engineering (8 | 7.1%), Health Diagnosing & Treating (2 | 1.8%), and Health Technologists (2 | 1.8%).
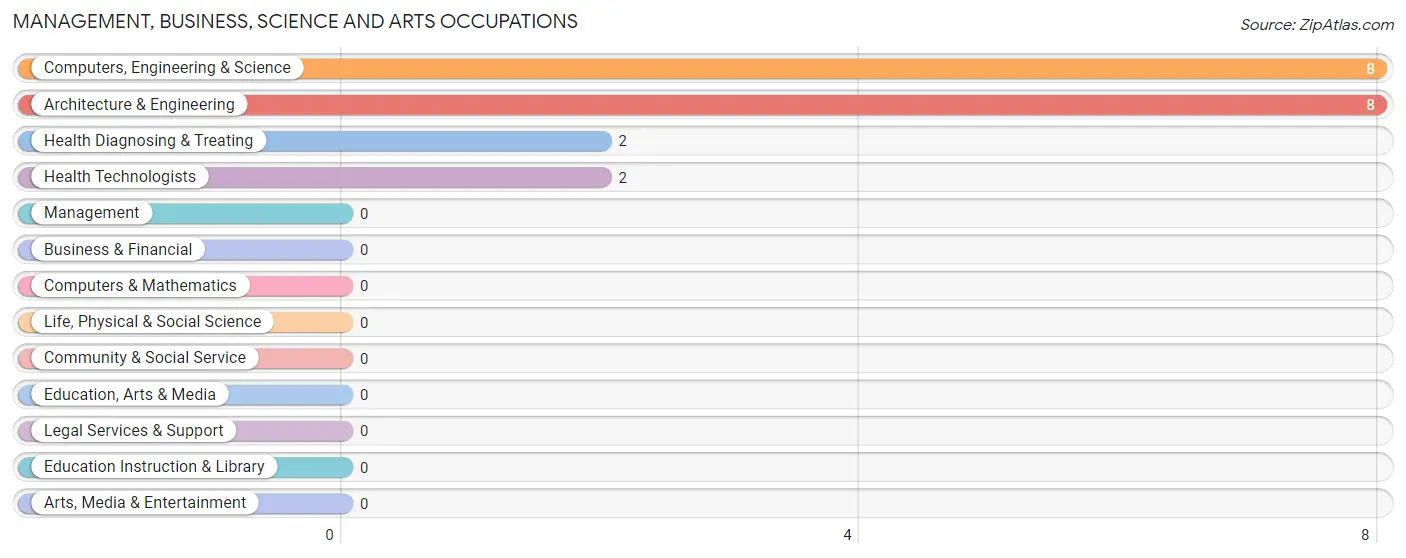
Management, Business, Science and Arts Occupations by Sex
Within the Management, Business, Science and Arts occupations in Willow, the most male-oriented occupations are Computers, Engineering & Science (100.0%), and Architecture & Engineering (100.0%), while the most female-oriented occupations are Health Diagnosing & Treating (100.0%), and Health Technologists (100.0%).
| Occupation | Male | Female |
| Management | 0 (0.0%) | 0 (0.0%) |
| Business & Financial | 0 (0.0%) | 0 (0.0%) |
| Computers, Engineering & Science | 8 (100.0%) | 0 (0.0%) |
| Computers & Mathematics | 0 (0.0%) | 0 (0.0%) |
| Architecture & Engineering | 8 (100.0%) | 0 (0.0%) |
| Life, Physical & Social Science | 0 (0.0%) | 0 (0.0%) |
| Community & Social Service | 0 (0.0%) | 0 (0.0%) |
| Education, Arts & Media | 0 (0.0%) | 0 (0.0%) |
| Legal Services & Support | 0 (0.0%) | 0 (0.0%) |
| Education Instruction & Library | 0 (0.0%) | 0 (0.0%) |
| Arts, Media & Entertainment | 0 (0.0%) | 0 (0.0%) |
| Health Diagnosing & Treating | 0 (0.0%) | 2 (100.0%) |
| Health Technologists | 0 (0.0%) | 2 (100.0%) |
| Total (Category) | 8 (80.0%) | 2 (20.0%) |
| Total (Overall) | 97 (86.6%) | 15 (13.4%) |
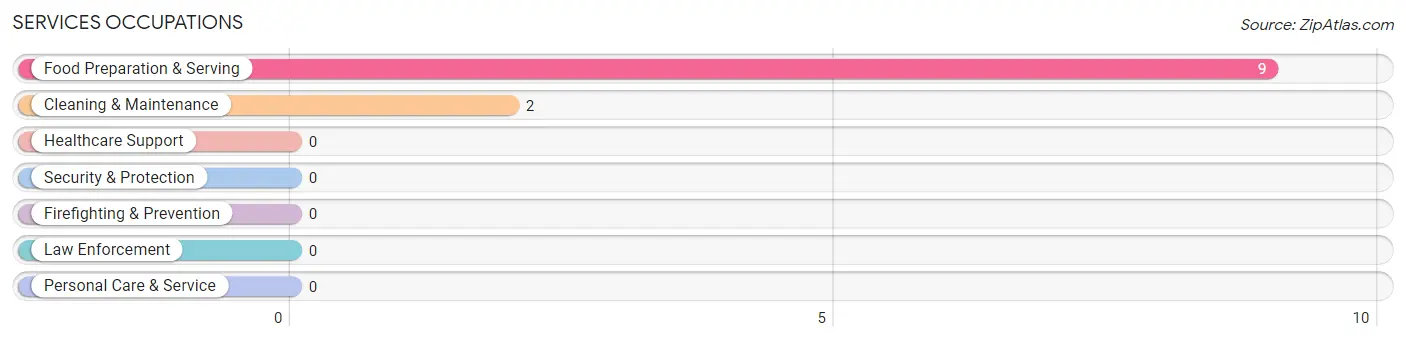
Services Occupations
The most common Services occupations in Willow are Food Preparation & Serving (9 | 8.0%), and Cleaning & Maintenance (2 | 1.8%).
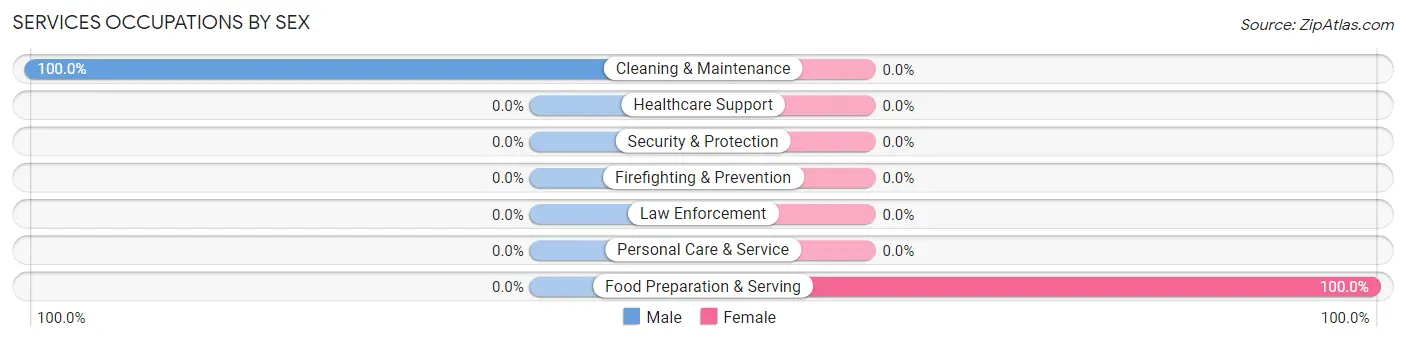
Services Occupations by Sex
| Occupation | Male | Female |
| Healthcare Support | 0 (0.0%) | 0 (0.0%) |
| Security & Protection | 0 (0.0%) | 0 (0.0%) |
| Firefighting & Prevention | 0 (0.0%) | 0 (0.0%) |
| Law Enforcement | 0 (0.0%) | 0 (0.0%) |
| Food Preparation & Serving | 0 (0.0%) | 9 (100.0%) |
| Cleaning & Maintenance | 2 (100.0%) | 0 (0.0%) |
| Personal Care & Service | 0 (0.0%) | 0 (0.0%) |
| Total (Category) | 2 (18.2%) | 9 (81.8%) |
| Total (Overall) | 97 (86.6%) | 15 (13.4%) |
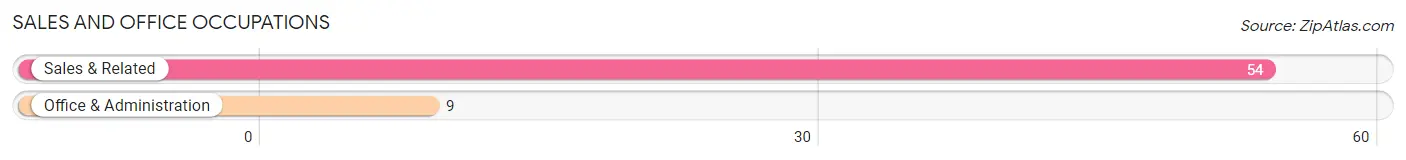
Sales and Office Occupations
The most common Sales and Office occupations in Willow are Sales & Related (54 | 48.2%), and Office & Administration (9 | 8.0%).
Sales and Office Occupations by Sex

| Occupation | Male | Female |
| Sales & Related | 54 (100.0%) | 0 (0.0%) |
| Office & Administration | 5 (55.6%) | 4 (44.4%) |
| Total (Category) | 59 (93.6%) | 4 (6.4%) |
| Total (Overall) | 97 (86.6%) | 15 (13.4%) |
Natural Resources, Construction and Maintenance Occupations
Natural Resources, Construction and Maintenance Occupations by Sex
| Occupation | Male | Female |
| Farming, Fishing & Forestry | 0 (0.0%) | 0 (0.0%) |
| Construction & Extraction | 0 (0.0%) | 0 (0.0%) |
| Installation, Maintenance & Repair | 0 (0.0%) | 0 (0.0%) |
| Total (Category) | 0 (0.0%) | 0 (0.0%) |
| Total (Overall) | 97 (86.6%) | 15 (13.4%) |
Production, Transportation and Moving Occupations
The most common Production, Transportation and Moving occupations in Willow are Transportation (15 | 13.4%), Production (9 | 8.0%), and Material Moving (4 | 3.6%).
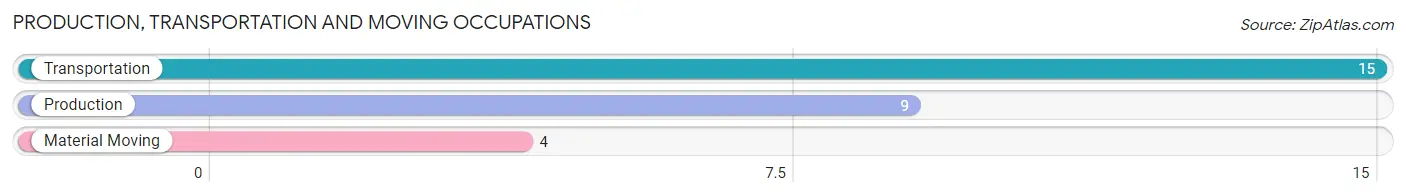
Production, Transportation and Moving Occupations by Sex
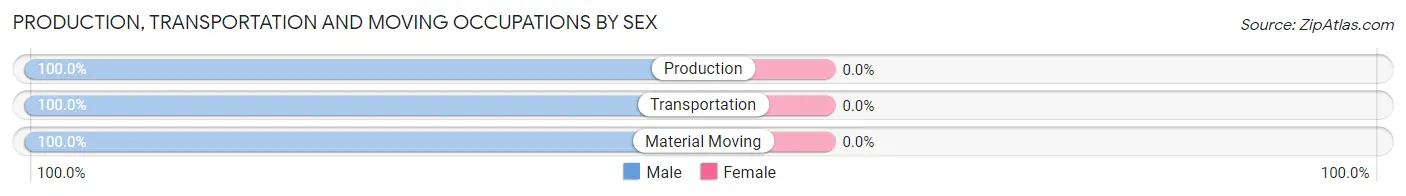
| Occupation | Male | Female |
| Production | 9 (100.0%) | 0 (0.0%) |
| Transportation | 15 (100.0%) | 0 (0.0%) |
| Material Moving | 4 (100.0%) | 0 (0.0%) |
| Total (Category) | 28 (100.0%) | 0 (0.0%) |
| Total (Overall) | 97 (86.6%) | 15 (13.4%) |
Employment Industries by Sex in Willow
Employment Industries in Willow
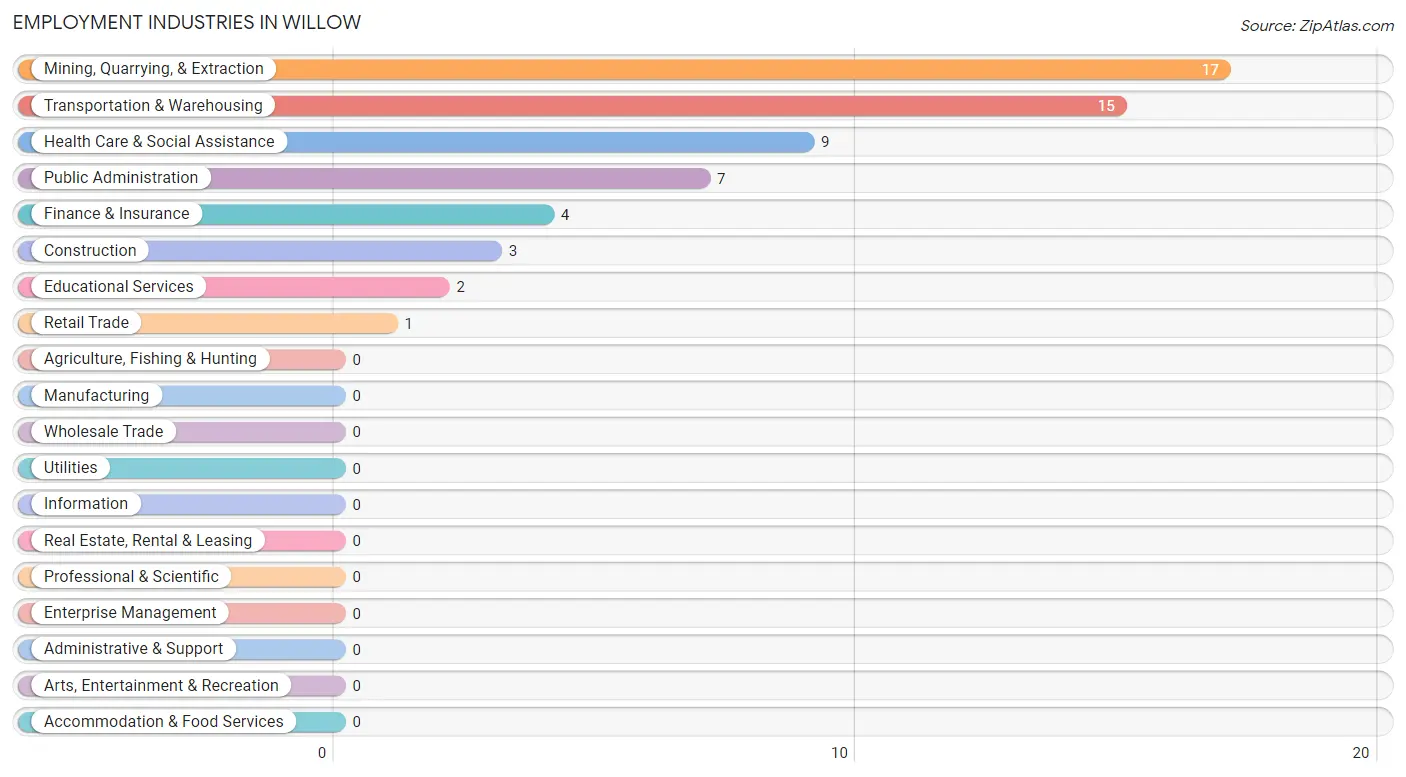
The major employment industries in Willow include Mining, Quarrying, & Extraction (17 | 15.2%), Transportation & Warehousing (15 | 13.4%), Health Care & Social Assistance (9 | 8.0%), Public Administration (7 | 6.2%), and Finance & Insurance (4 | 3.6%).
Employment Industries by Sex in Willow
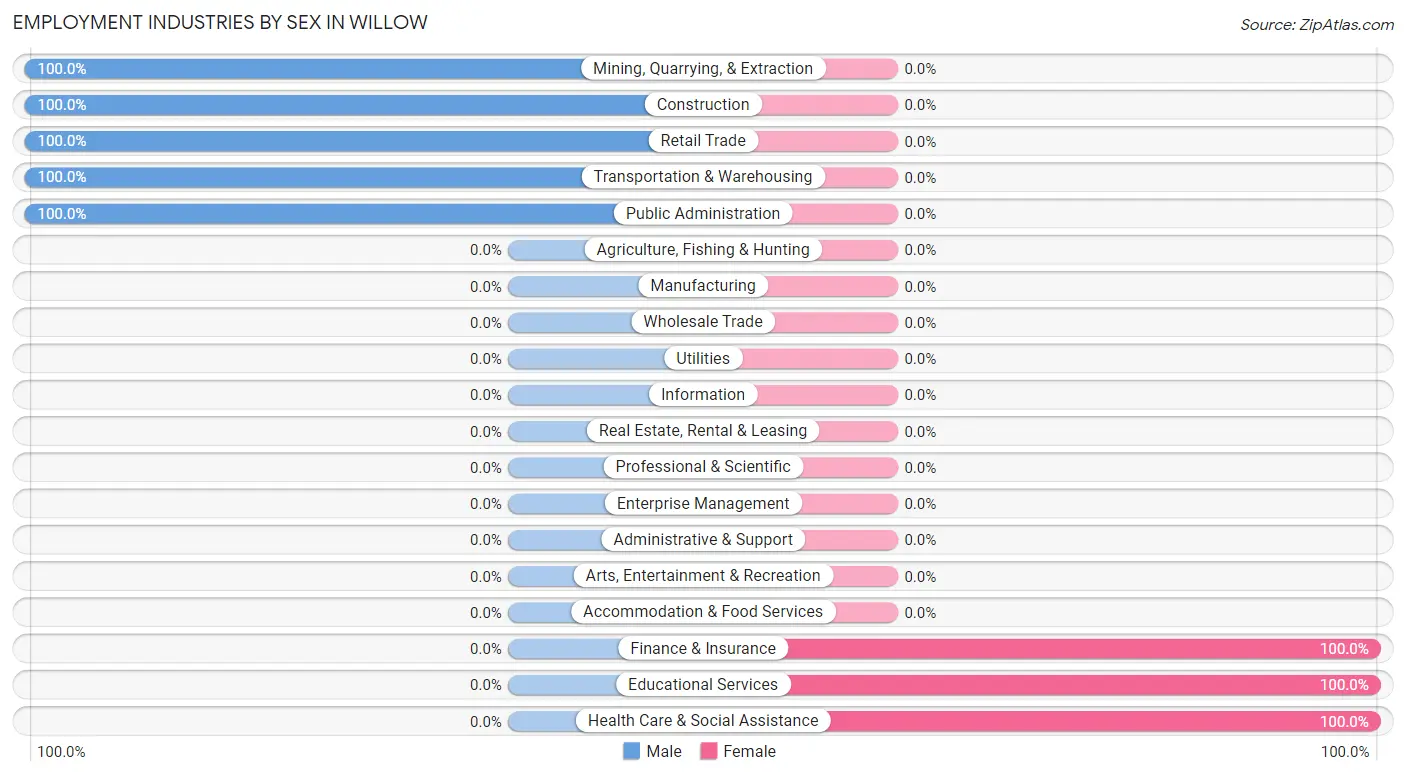
The Willow industries that see more men than women are Mining, Quarrying, & Extraction (100.0%), Construction (100.0%), and Retail Trade (100.0%), whereas the industries that tend to have a higher number of women are Finance & Insurance (100.0%), Educational Services (100.0%), and Health Care & Social Assistance (100.0%).
| Industry | Male | Female |
| Agriculture, Fishing & Hunting | 0 (0.0%) | 0 (0.0%) |
| Mining, Quarrying, & Extraction | 17 (100.0%) | 0 (0.0%) |
| Construction | 3 (100.0%) | 0 (0.0%) |
| Manufacturing | 0 (0.0%) | 0 (0.0%) |
| Wholesale Trade | 0 (0.0%) | 0 (0.0%) |
| Retail Trade | 1 (100.0%) | 0 (0.0%) |
| Transportation & Warehousing | 15 (100.0%) | 0 (0.0%) |
| Utilities | 0 (0.0%) | 0 (0.0%) |
| Information | 0 (0.0%) | 0 (0.0%) |
| Finance & Insurance | 0 (0.0%) | 4 (100.0%) |
| Real Estate, Rental & Leasing | 0 (0.0%) | 0 (0.0%) |
| Professional & Scientific | 0 (0.0%) | 0 (0.0%) |
| Enterprise Management | 0 (0.0%) | 0 (0.0%) |
| Administrative & Support | 0 (0.0%) | 0 (0.0%) |
| Educational Services | 0 (0.0%) | 2 (100.0%) |
| Health Care & Social Assistance | 0 (0.0%) | 9 (100.0%) |
| Arts, Entertainment & Recreation | 0 (0.0%) | 0 (0.0%) |
| Accommodation & Food Services | 0 (0.0%) | 0 (0.0%) |
| Public Administration | 7 (100.0%) | 0 (0.0%) |
| Total | 97 (86.6%) | 15 (13.4%) |
Education in Willow
School Enrollment in Willow
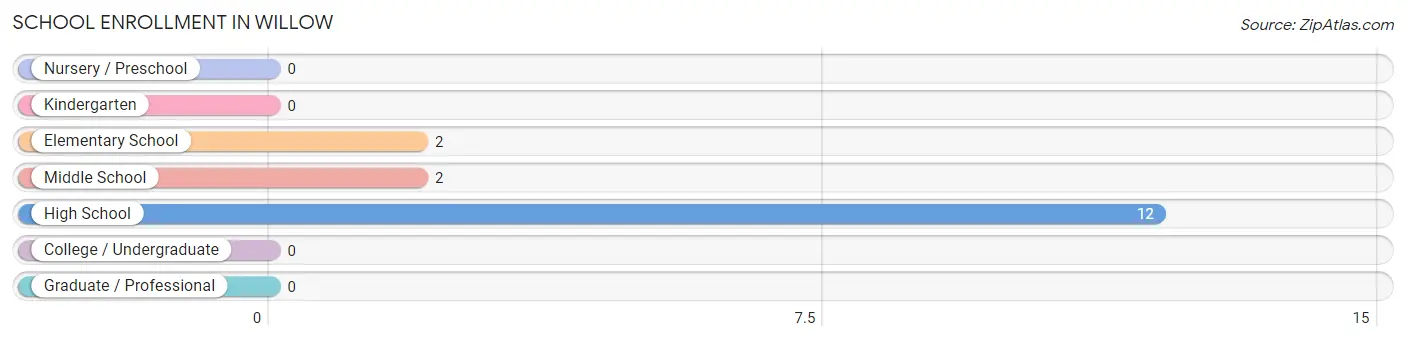
The most common levels of schooling among the 16 students in Willow are high school (12 | 75.0%), elementary school (2 | 12.5%), and middle school (2 | 12.5%).
| School Level | # Students | % Students |
| Nursery / Preschool | 0 | 0.0% |
| Kindergarten | 0 | 0.0% |
| Elementary School | 2 | 12.5% |
| Middle School | 2 | 12.5% |
| High School | 12 | 75.0% |
| College / Undergraduate | 0 | 0.0% |
| Graduate / Professional | 0 | 0.0% |
| Total | 16 | 100.0% |
School Enrollment by Age by Funding Source in Willow
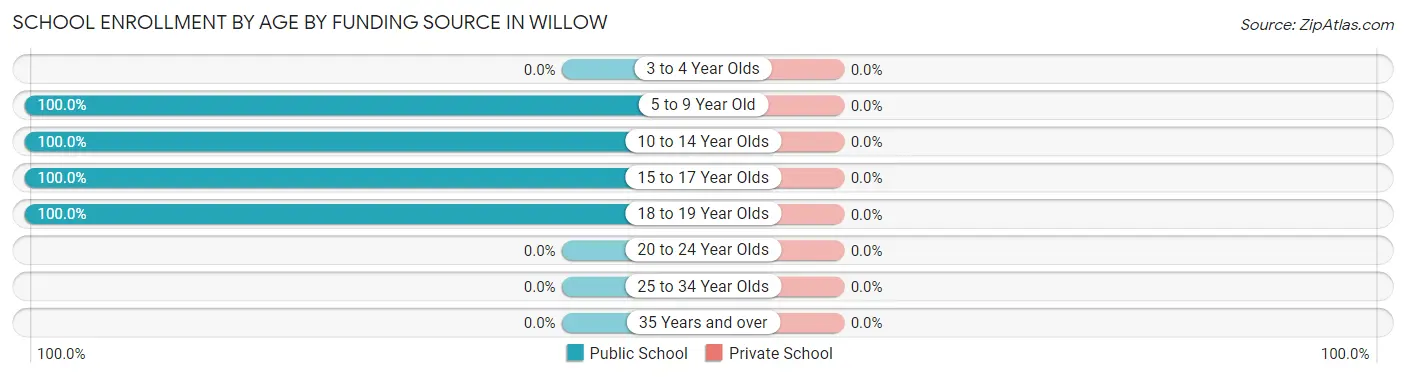
| Age Bracket | Public School | Private School |
| 3 to 4 Year Olds | 0 (0.0%) | 0 (0.0%) |
| 5 to 9 Year Old | 2 (100.0%) | 0 (0.0%) |
| 10 to 14 Year Olds | 2 (100.0%) | 0 (0.0%) |
| 15 to 17 Year Olds | 11 (100.0%) | 0 (0.0%) |
| 18 to 19 Year Olds | 1 (100.0%) | 0 (0.0%) |
| 20 to 24 Year Olds | 0 (0.0%) | 0 (0.0%) |
| 25 to 34 Year Olds | 0 (0.0%) | 0 (0.0%) |
| 35 Years and over | 0 (0.0%) | 0 (0.0%) |
| Total | 16 (100.0%) | 0 (0.0%) |
Educational Attainment by Field of Study in Willow
Bio, nature & agricultural (6 | 75.0%), and physical & health sciences (2 | 25.0%) are the most common fields of study among 8 individuals in Willow who have obtained a bachelor's degree or higher.
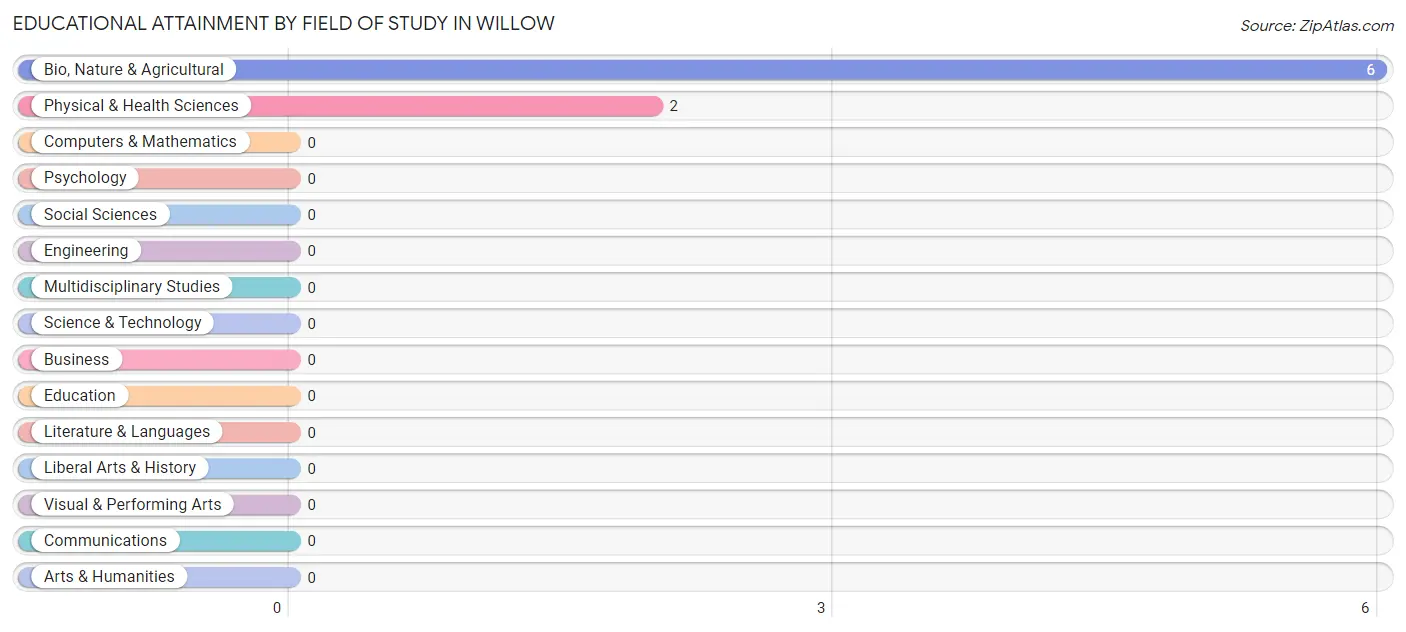
| Field of Study | # Graduates | % Graduates |
| Computers & Mathematics | 0 | 0.0% |
| Bio, Nature & Agricultural | 6 | 75.0% |
| Physical & Health Sciences | 2 | 25.0% |
| Psychology | 0 | 0.0% |
| Social Sciences | 0 | 0.0% |
| Engineering | 0 | 0.0% |
| Multidisciplinary Studies | 0 | 0.0% |
| Science & Technology | 0 | 0.0% |
| Business | 0 | 0.0% |
| Education | 0 | 0.0% |
| Literature & Languages | 0 | 0.0% |
| Liberal Arts & History | 0 | 0.0% |
| Visual & Performing Arts | 0 | 0.0% |
| Communications | 0 | 0.0% |
| Arts & Humanities | 0 | 0.0% |
| Total | 8 | 100.0% |
Transportation & Commute in Willow
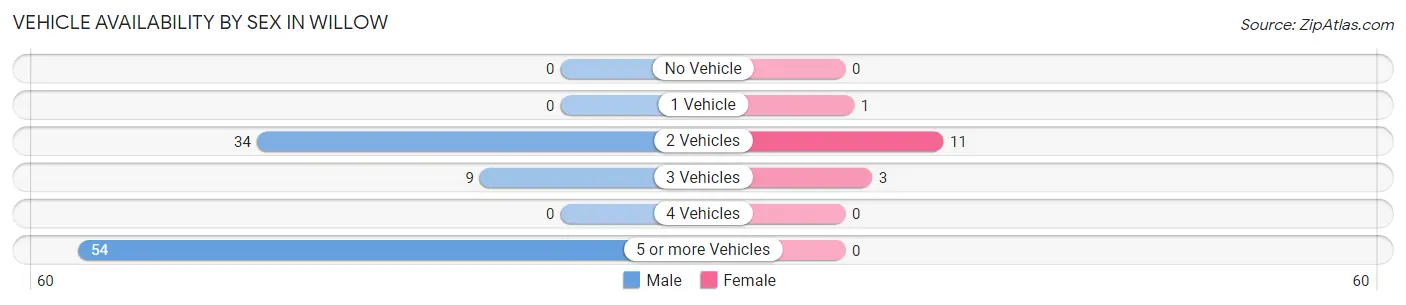
Vehicle Availability by Sex in Willow
The most prevalent vehicle ownership categories in Willow are males with 5 or more vehicles (54, accounting for 55.7%) and females with 5 or more vehicles (0, making up 360.0%).
| Vehicles Available | Male | Female |
| No Vehicle | 0 (0.0%) | 0 (0.0%) |
| 1 Vehicle | 0 (0.0%) | 1 (6.7%) |
| 2 Vehicles | 34 (35.0%) | 11 (73.3%) |
| 3 Vehicles | 9 (9.3%) | 3 (20.0%) |
| 4 Vehicles | 0 (0.0%) | 0 (0.0%) |
| 5 or more Vehicles | 54 (55.7%) | 0 (0.0%) |
| Total | 97 (100.0%) | 15 (100.0%) |
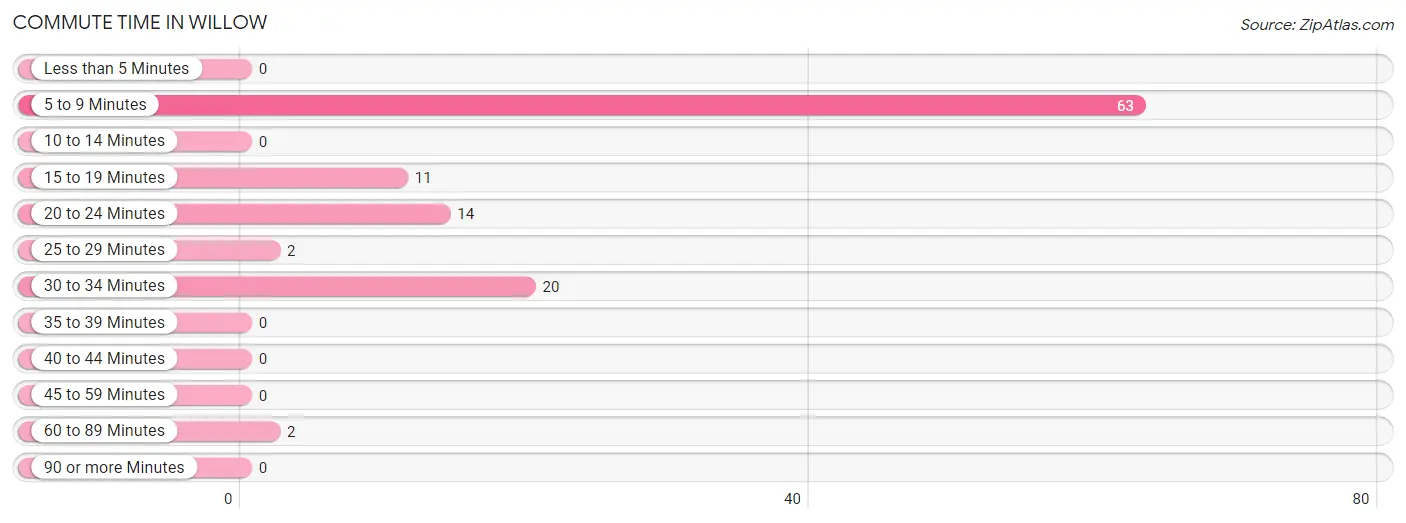
Commute Time in Willow
The most frequently occuring commute durations in Willow are 5 to 9 minutes (63 commuters, 56.2%), 30 to 34 minutes (20 commuters, 17.9%), and 20 to 24 minutes (14 commuters, 12.5%).
| Commute Time | # Commuters | % Commuters |
| Less than 5 Minutes | 0 | 0.0% |
| 5 to 9 Minutes | 63 | 56.2% |
| 10 to 14 Minutes | 0 | 0.0% |
| 15 to 19 Minutes | 11 | 9.8% |
| 20 to 24 Minutes | 14 | 12.5% |
| 25 to 29 Minutes | 2 | 1.8% |
| 30 to 34 Minutes | 20 | 17.9% |
| 35 to 39 Minutes | 0 | 0.0% |
| 40 to 44 Minutes | 0 | 0.0% |
| 45 to 59 Minutes | 0 | 0.0% |
| 60 to 89 Minutes | 2 | 1.8% |
| 90 or more Minutes | 0 | 0.0% |
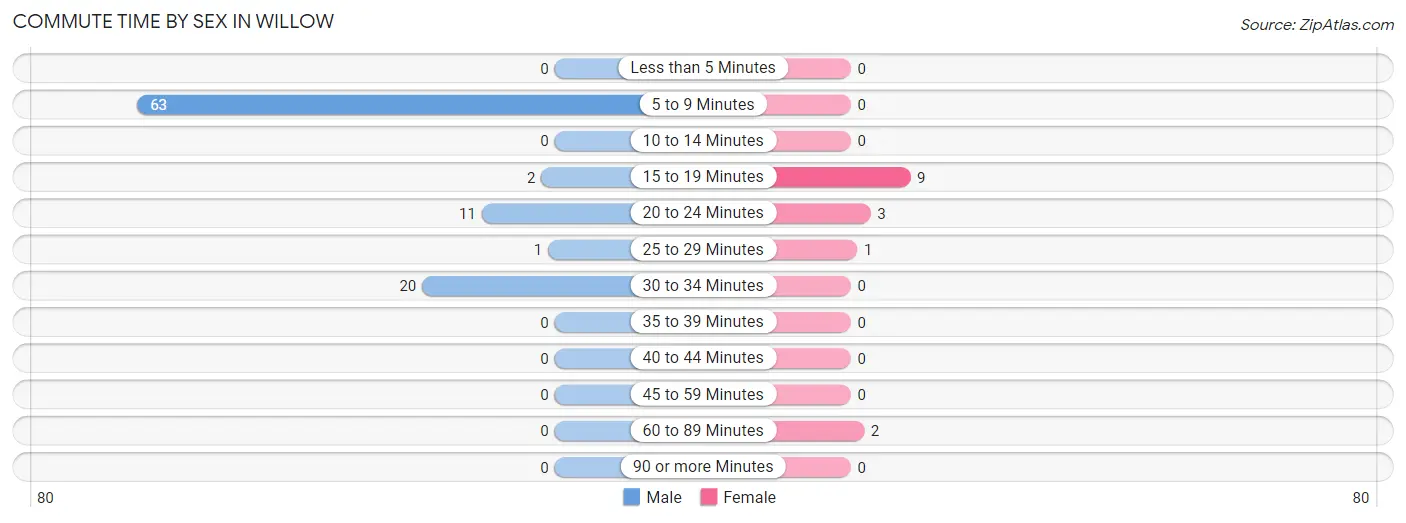
Commute Time by Sex in Willow
The most common commute times in Willow are 5 to 9 minutes (63 commuters, 64.9%) for males and 15 to 19 minutes (9 commuters, 60.0%) for females.
| Commute Time | Male | Female |
| Less than 5 Minutes | 0 (0.0%) | 0 (0.0%) |
| 5 to 9 Minutes | 63 (64.9%) | 0 (0.0%) |
| 10 to 14 Minutes | 0 (0.0%) | 0 (0.0%) |
| 15 to 19 Minutes | 2 (2.1%) | 9 (60.0%) |
| 20 to 24 Minutes | 11 (11.3%) | 3 (20.0%) |
| 25 to 29 Minutes | 1 (1.0%) | 1 (6.7%) |
| 30 to 34 Minutes | 20 (20.6%) | 0 (0.0%) |
| 35 to 39 Minutes | 0 (0.0%) | 0 (0.0%) |
| 40 to 44 Minutes | 0 (0.0%) | 0 (0.0%) |
| 45 to 59 Minutes | 0 (0.0%) | 0 (0.0%) |
| 60 to 89 Minutes | 0 (0.0%) | 2 (13.3%) |
| 90 or more Minutes | 0 (0.0%) | 0 (0.0%) |
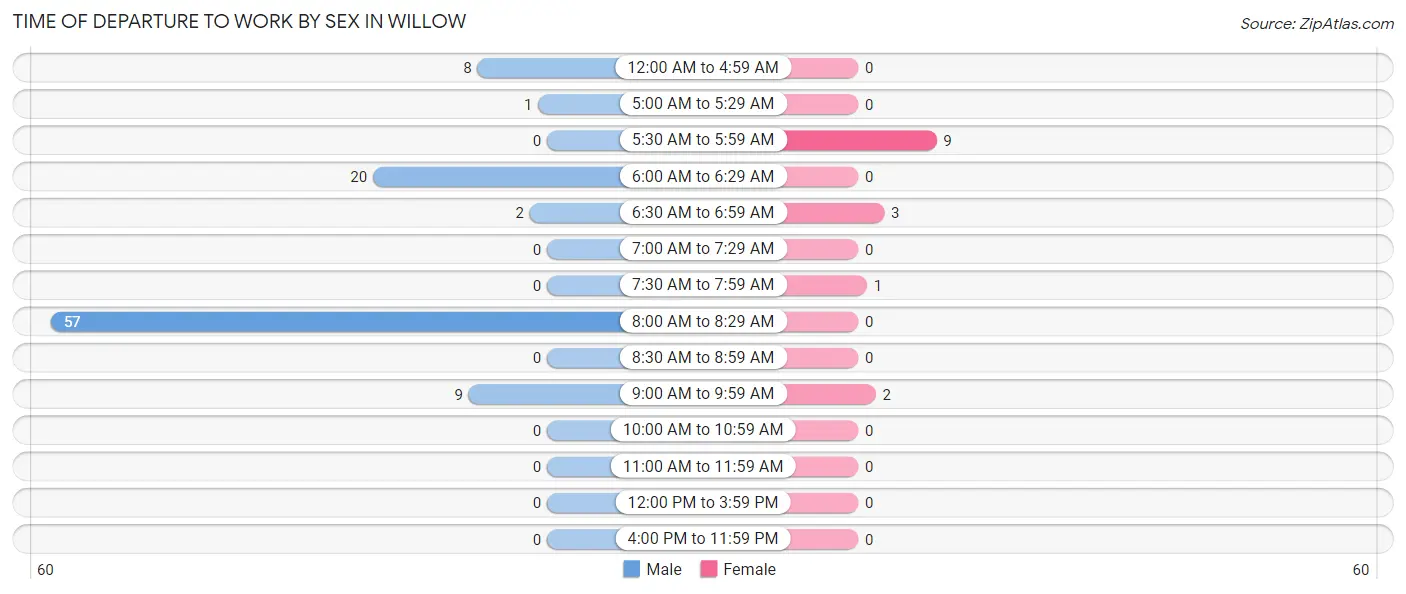
Time of Departure to Work by Sex in Willow
The most frequent times of departure to work in Willow are 8:00 AM to 8:29 AM (57, 58.8%) for males and 5:30 AM to 5:59 AM (9, 60.0%) for females.
| Time of Departure | Male | Female |
| 12:00 AM to 4:59 AM | 8 (8.3%) | 0 (0.0%) |
| 5:00 AM to 5:29 AM | 1 (1.0%) | 0 (0.0%) |
| 5:30 AM to 5:59 AM | 0 (0.0%) | 9 (60.0%) |
| 6:00 AM to 6:29 AM | 20 (20.6%) | 0 (0.0%) |
| 6:30 AM to 6:59 AM | 2 (2.1%) | 3 (20.0%) |
| 7:00 AM to 7:29 AM | 0 (0.0%) | 0 (0.0%) |
| 7:30 AM to 7:59 AM | 0 (0.0%) | 1 (6.7%) |
| 8:00 AM to 8:29 AM | 57 (58.8%) | 0 (0.0%) |
| 8:30 AM to 8:59 AM | 0 (0.0%) | 0 (0.0%) |
| 9:00 AM to 9:59 AM | 9 (9.3%) | 2 (13.3%) |
| 10:00 AM to 10:59 AM | 0 (0.0%) | 0 (0.0%) |
| 11:00 AM to 11:59 AM | 0 (0.0%) | 0 (0.0%) |
| 12:00 PM to 3:59 PM | 0 (0.0%) | 0 (0.0%) |
| 4:00 PM to 11:59 PM | 0 (0.0%) | 0 (0.0%) |
| Total | 97 (100.0%) | 15 (100.0%) |
Housing Occupancy in Willow
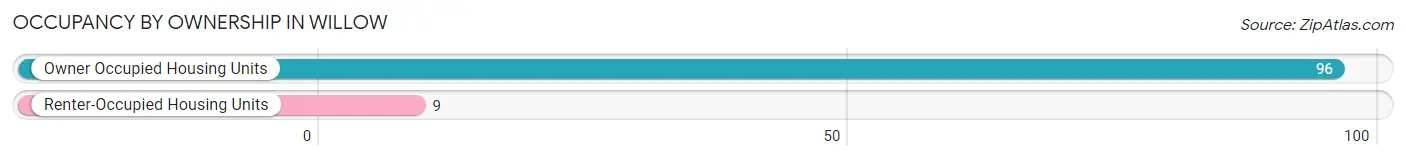
Occupancy by Ownership in Willow
Of the total 105 dwellings in Willow, owner-occupied units account for 96 (91.4%), while renter-occupied units make up 9 (8.6%).
| Occupancy | # Housing Units | % Housing Units |
| Owner Occupied Housing Units | 96 | 91.4% |
| Renter-Occupied Housing Units | 9 | 8.6% |
| Total Occupied Housing Units | 105 | 100.0% |
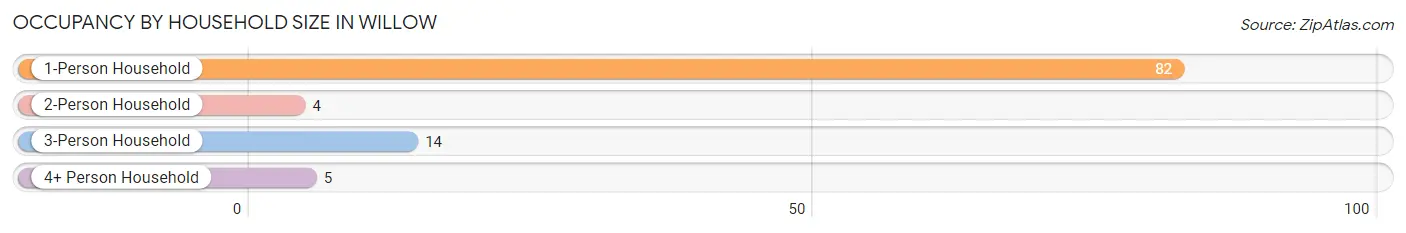
Occupancy by Household Size in Willow
| Household Size | # Housing Units | % Housing Units |
| 1-Person Household | 82 | 78.1% |
| 2-Person Household | 4 | 3.8% |
| 3-Person Household | 14 | 13.3% |
| 4+ Person Household | 5 | 4.8% |
| Total Housing Units | 105 | 100.0% |
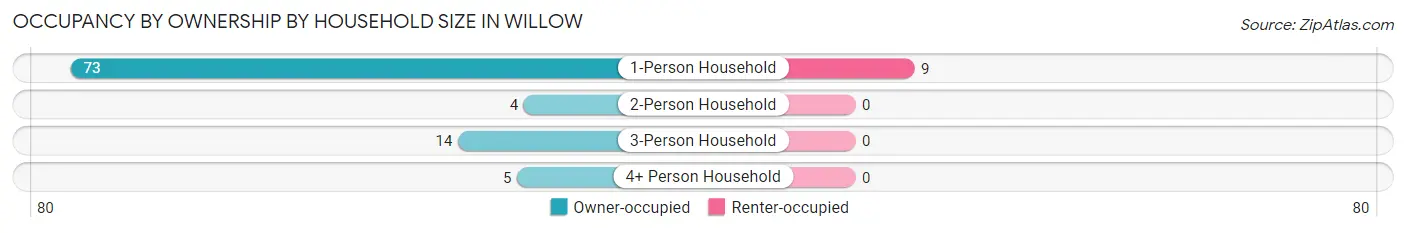
Occupancy by Ownership by Household Size in Willow
| Household Size | Owner-occupied | Renter-occupied |
| 1-Person Household | 73 (89.0%) | 9 (11.0%) |
| 2-Person Household | 4 (100.0%) | 0 (0.0%) |
| 3-Person Household | 14 (100.0%) | 0 (0.0%) |
| 4+ Person Household | 5 (100.0%) | 0 (0.0%) |
| Total Housing Units | 96 (91.4%) | 9 (8.6%) |
Occupancy by Educational Attainment in Willow
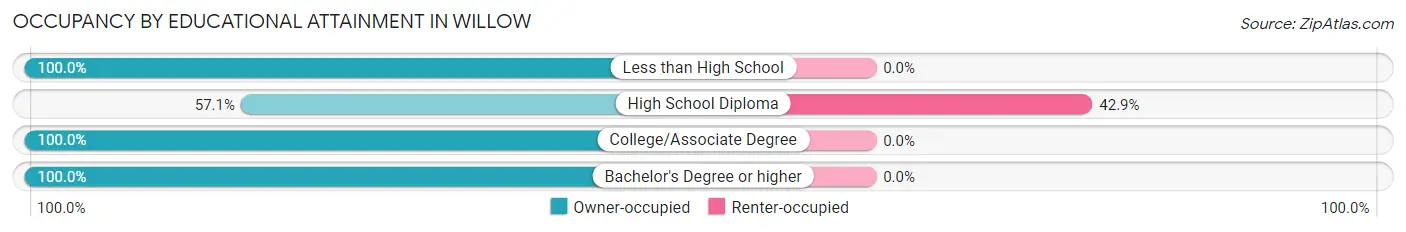
| Household Size | Owner-occupied | Renter-occupied |
| Less than High School | 3 (100.0%) | 0 (0.0%) |
| High School Diploma | 12 (57.1%) | 9 (42.9%) |
| College/Associate Degree | 79 (100.0%) | 0 (0.0%) |
| Bachelor's Degree or higher | 2 (100.0%) | 0 (0.0%) |
Occupancy by Age of Householder in Willow
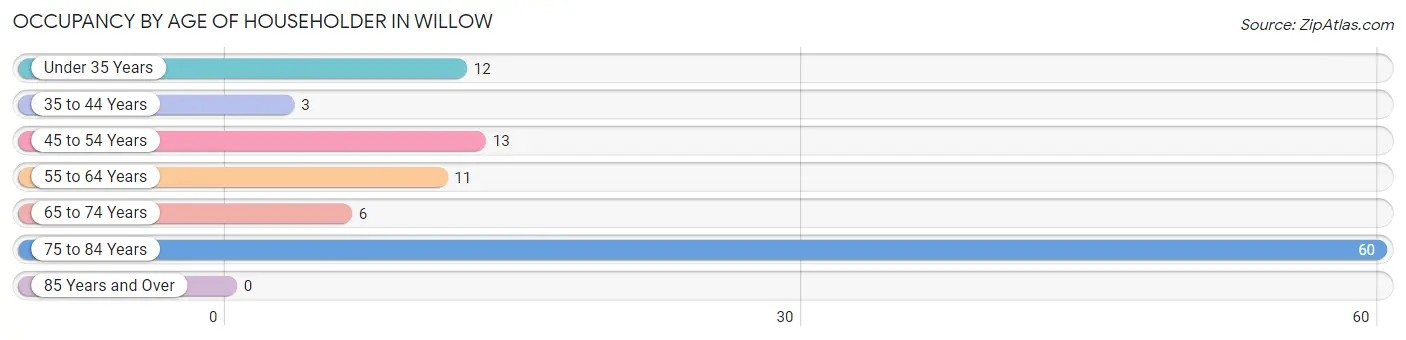
| Age Bracket | # Households | % Households |
| Under 35 Years | 12 | 11.4% |
| 35 to 44 Years | 3 | 2.9% |
| 45 to 54 Years | 13 | 12.4% |
| 55 to 64 Years | 11 | 10.5% |
| 65 to 74 Years | 6 | 5.7% |
| 75 to 84 Years | 60 | 57.1% |
| 85 Years and Over | 0 | 0.0% |
| Total | 105 | 100.0% |
Housing Finances in Willow
Median Income by Occupancy in Willow
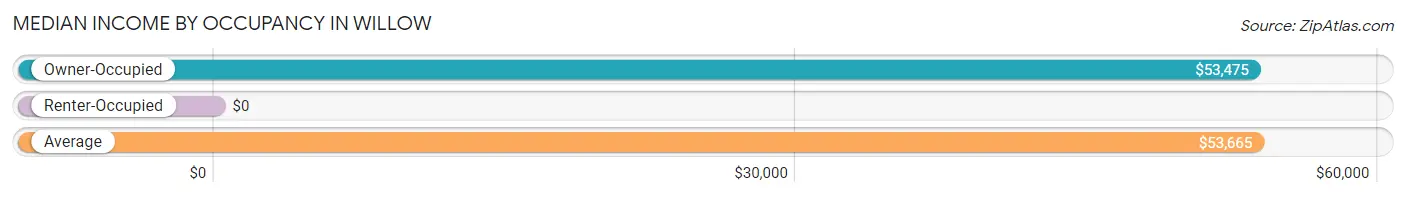
| Occupancy Type | # Households | Median Income |
| Owner-Occupied | 96 (91.4%) | $53,475 |
| Renter-Occupied | 9 (8.6%) | $0 |
| Average | 105 (100.0%) | $53,665 |
Occupancy by Householder Income Bracket in Willow
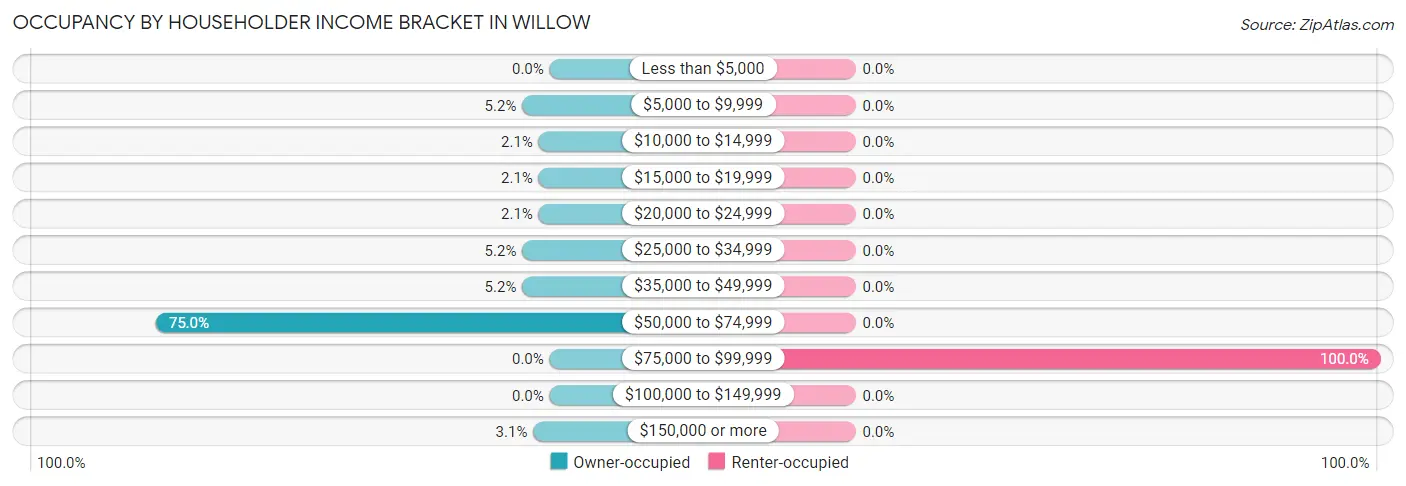
| Income Bracket | Owner-occupied | Renter-occupied |
| Less than $5,000 | 0 (0.0%) | 0 (0.0%) |
| $5,000 to $9,999 | 5 (5.2%) | 0 (0.0%) |
| $10,000 to $14,999 | 2 (2.1%) | 0 (0.0%) |
| $15,000 to $19,999 | 2 (2.1%) | 0 (0.0%) |
| $20,000 to $24,999 | 2 (2.1%) | 0 (0.0%) |
| $25,000 to $34,999 | 5 (5.2%) | 0 (0.0%) |
| $35,000 to $49,999 | 5 (5.2%) | 0 (0.0%) |
| $50,000 to $74,999 | 72 (75.0%) | 0 (0.0%) |
| $75,000 to $99,999 | 0 (0.0%) | 9 (100.0%) |
| $100,000 to $149,999 | 0 (0.0%) | 0 (0.0%) |
| $150,000 or more | 3 (3.1%) | 0 (0.0%) |
| Total | 96 (100.0%) | 9 (100.0%) |
Monthly Housing Cost Tiers in Willow
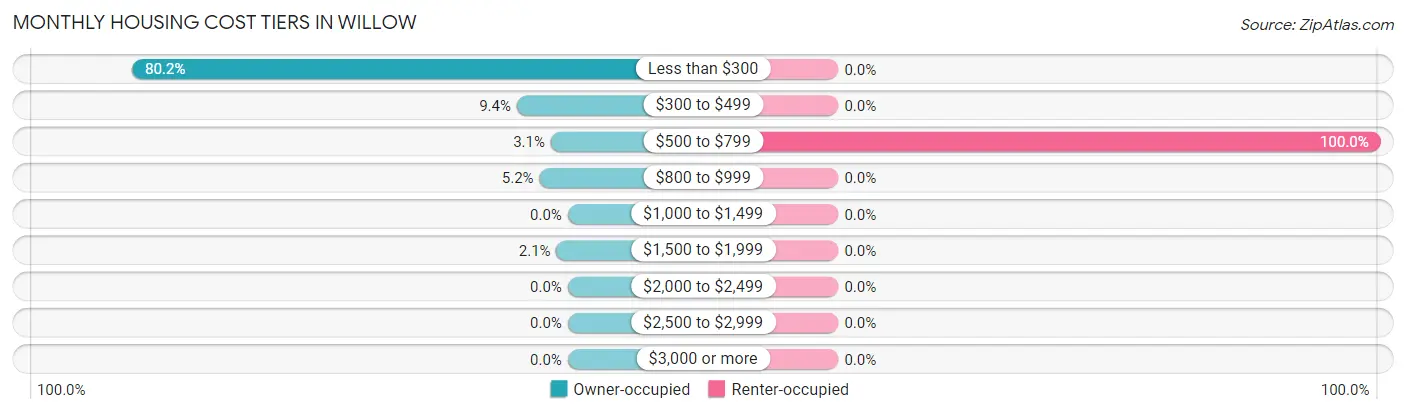
| Monthly Cost | Owner-occupied | Renter-occupied |
| Less than $300 | 77 (80.2%) | 0 (0.0%) |
| $300 to $499 | 9 (9.4%) | 0 (0.0%) |
| $500 to $799 | 3 (3.1%) | 9 (100.0%) |
| $800 to $999 | 5 (5.2%) | 0 (0.0%) |
| $1,000 to $1,499 | 0 (0.0%) | 0 (0.0%) |
| $1,500 to $1,999 | 2 (2.1%) | 0 (0.0%) |
| $2,000 to $2,499 | 0 (0.0%) | 0 (0.0%) |
| $2,500 to $2,999 | 0 (0.0%) | 0 (0.0%) |
| $3,000 or more | 0 (0.0%) | 0 (0.0%) |
| Total | 96 (100.0%) | 9 (100.0%) |
Physical Housing Characteristics in Willow
Housing Structures in Willow
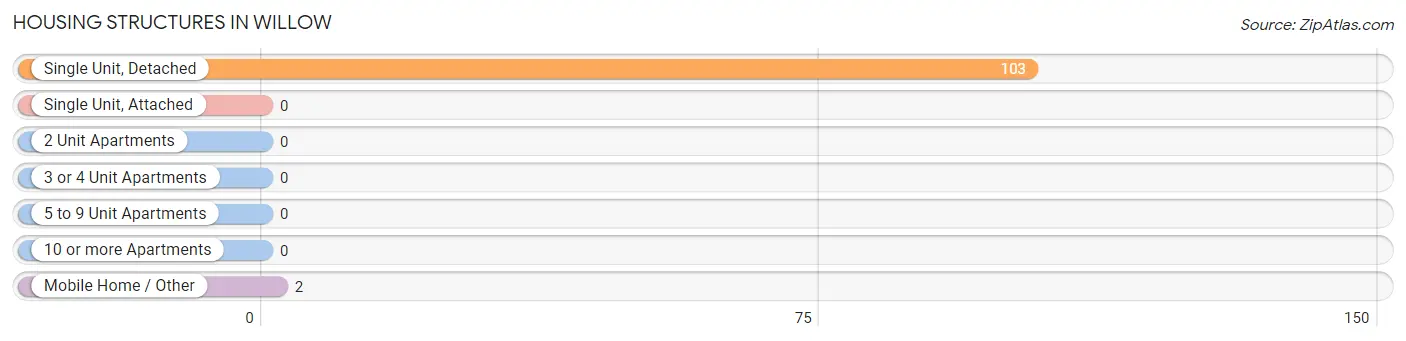
| Structure Type | # Housing Units | % Housing Units |
| Single Unit, Detached | 103 | 98.1% |
| Single Unit, Attached | 0 | 0.0% |
| 2 Unit Apartments | 0 | 0.0% |
| 3 or 4 Unit Apartments | 0 | 0.0% |
| 5 to 9 Unit Apartments | 0 | 0.0% |
| 10 or more Apartments | 0 | 0.0% |
| Mobile Home / Other | 2 | 1.9% |
| Total | 105 | 100.0% |
Housing Structures by Occupancy in Willow
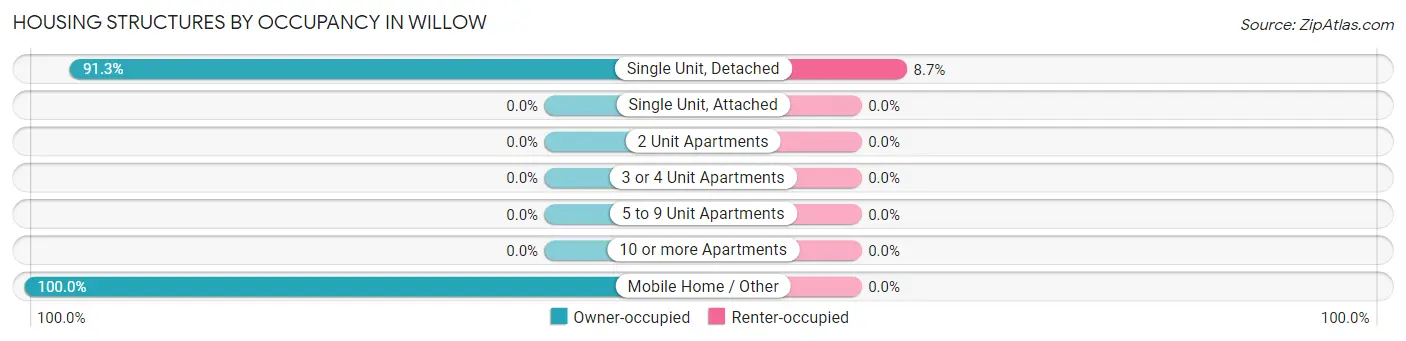
| Structure Type | Owner-occupied | Renter-occupied |
| Single Unit, Detached | 94 (91.3%) | 9 (8.7%) |
| Single Unit, Attached | 0 (0.0%) | 0 (0.0%) |
| 2 Unit Apartments | 0 (0.0%) | 0 (0.0%) |
| 3 or 4 Unit Apartments | 0 (0.0%) | 0 (0.0%) |
| 5 to 9 Unit Apartments | 0 (0.0%) | 0 (0.0%) |
| 10 or more Apartments | 0 (0.0%) | 0 (0.0%) |
| Mobile Home / Other | 2 (100.0%) | 0 (0.0%) |
| Total | 96 (91.4%) | 9 (8.6%) |
Housing Structures by Number of Rooms in Willow
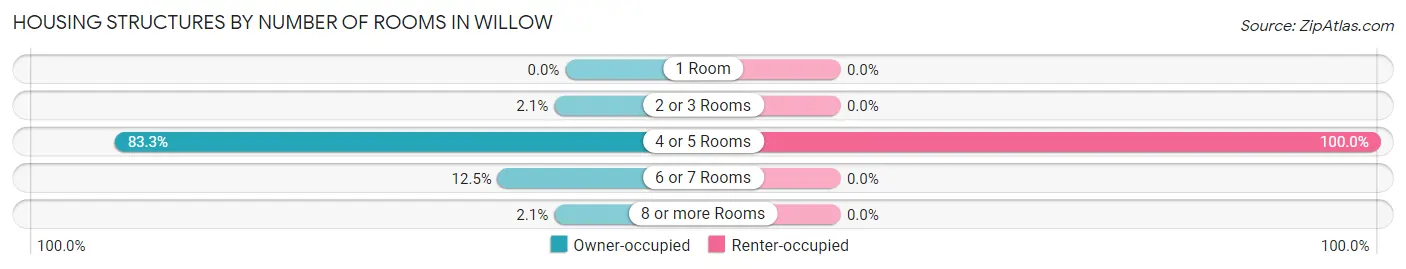
| Number of Rooms | Owner-occupied | Renter-occupied |
| 1 Room | 0 (0.0%) | 0 (0.0%) |
| 2 or 3 Rooms | 2 (2.1%) | 0 (0.0%) |
| 4 or 5 Rooms | 80 (83.3%) | 9 (100.0%) |
| 6 or 7 Rooms | 12 (12.5%) | 0 (0.0%) |
| 8 or more Rooms | 2 (2.1%) | 0 (0.0%) |
| Total | 96 (100.0%) | 9 (100.0%) |
Housing Structure by Heating Type in Willow
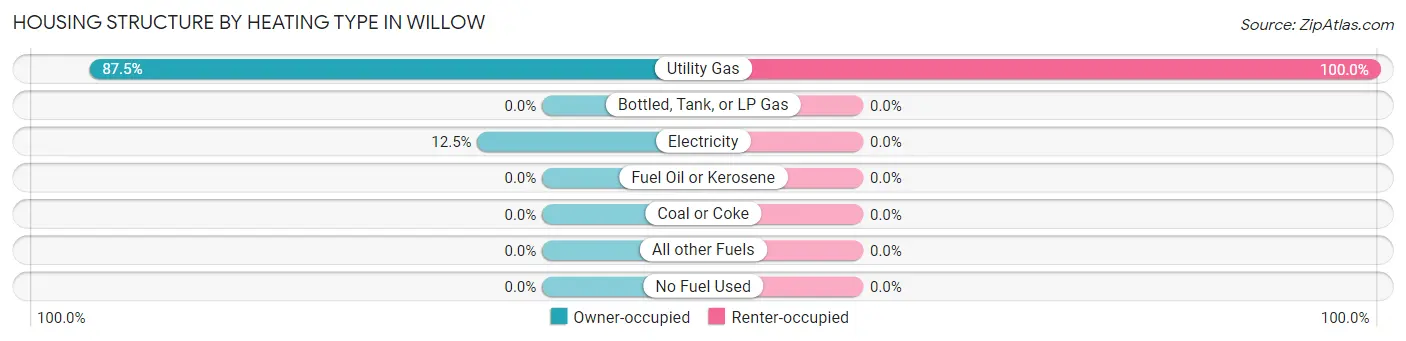
| Heating Type | Owner-occupied | Renter-occupied |
| Utility Gas | 84 (87.5%) | 9 (100.0%) |
| Bottled, Tank, or LP Gas | 0 (0.0%) | 0 (0.0%) |
| Electricity | 12 (12.5%) | 0 (0.0%) |
| Fuel Oil or Kerosene | 0 (0.0%) | 0 (0.0%) |
| Coal or Coke | 0 (0.0%) | 0 (0.0%) |
| All other Fuels | 0 (0.0%) | 0 (0.0%) |
| No Fuel Used | 0 (0.0%) | 0 (0.0%) |
| Total | 96 (100.0%) | 9 (100.0%) |
Household Vehicle Usage in Willow
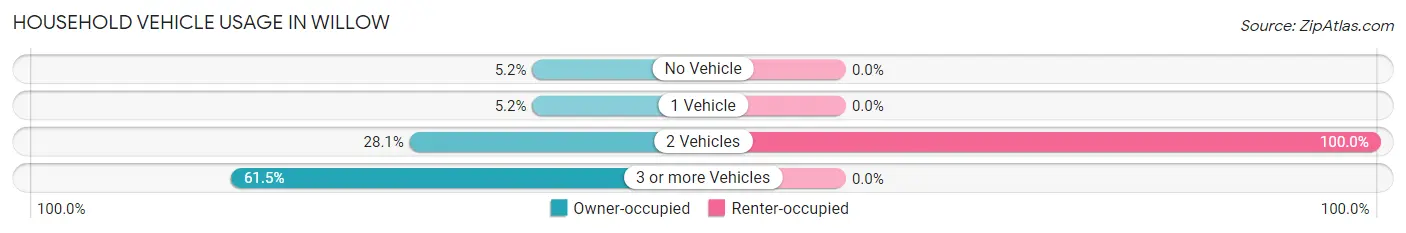
| Vehicles per Household | Owner-occupied | Renter-occupied |
| No Vehicle | 5 (5.2%) | 0 (0.0%) |
| 1 Vehicle | 5 (5.2%) | 0 (0.0%) |
| 2 Vehicles | 27 (28.1%) | 9 (100.0%) |
| 3 or more Vehicles | 59 (61.5%) | 0 (0.0%) |
| Total | 96 (100.0%) | 9 (100.0%) |
Real Estate & Mortgages in Willow
Real Estate and Mortgage Overview in Willow
| Characteristic | Without Mortgage | With Mortgage |
| Housing Units | 86 | 10 |
| Median Property Value | $28,700 | $54,000 |
| Median Household Income | $53,565 | $0 |
| Monthly Housing Costs | $275 | $0 |
| Real Estate Taxes | $338 | $0 |
Property Value by Mortgage Status in Willow
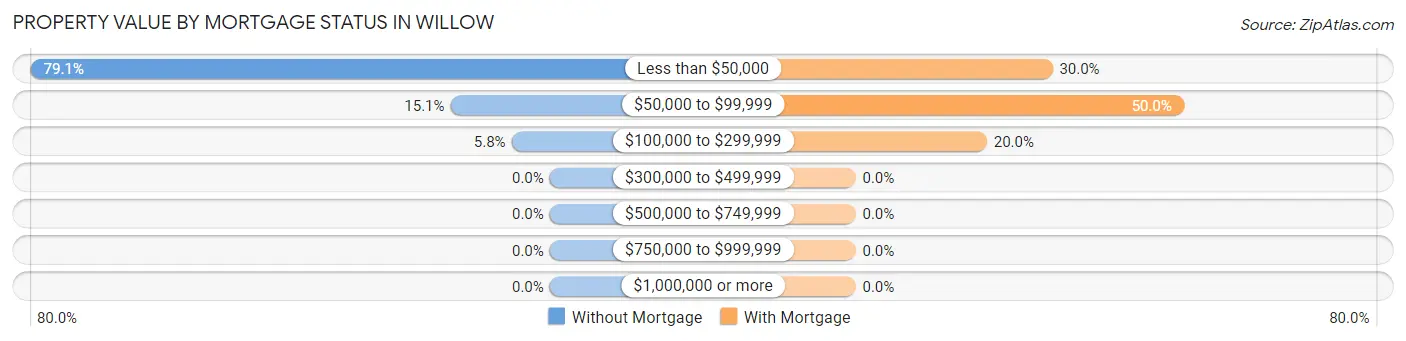
| Property Value | Without Mortgage | With Mortgage |
| Less than $50,000 | 68 (79.1%) | 3 (30.0%) |
| $50,000 to $99,999 | 13 (15.1%) | 5 (50.0%) |
| $100,000 to $299,999 | 5 (5.8%) | 2 (20.0%) |
| $300,000 to $499,999 | 0 (0.0%) | 0 (0.0%) |
| $500,000 to $749,999 | 0 (0.0%) | 0 (0.0%) |
| $750,000 to $999,999 | 0 (0.0%) | 0 (0.0%) |
| $1,000,000 or more | 0 (0.0%) | 0 (0.0%) |
| Total | 86 (100.0%) | 10 (100.0%) |
Household Income by Mortgage Status in Willow
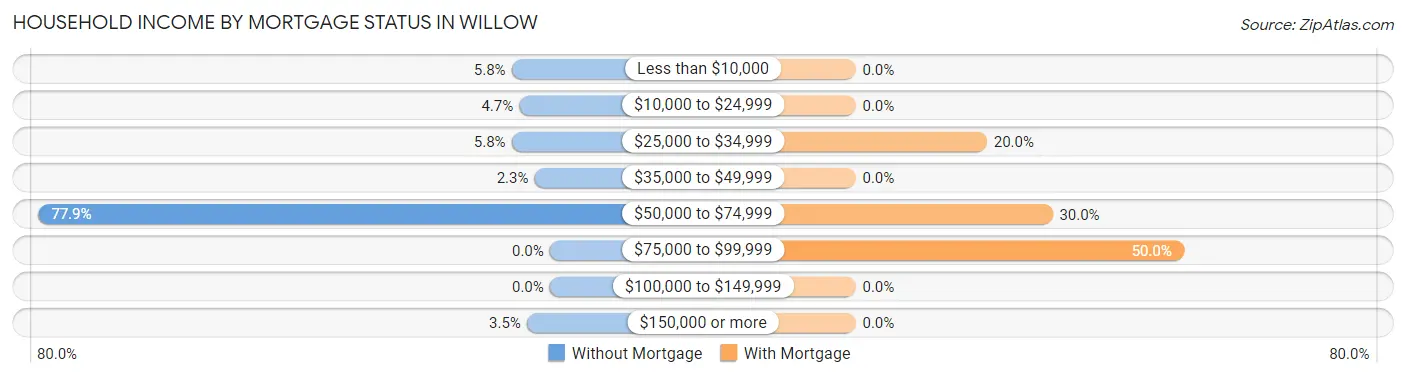
| Household Income | Without Mortgage | With Mortgage |
| Less than $10,000 | 5 (5.8%) | 0 (0.0%) |
| $10,000 to $24,999 | 4 (4.6%) | 0 (0.0%) |
| $25,000 to $34,999 | 5 (5.8%) | 2 (20.0%) |
| $35,000 to $49,999 | 2 (2.3%) | 0 (0.0%) |
| $50,000 to $74,999 | 67 (77.9%) | 3 (30.0%) |
| $75,000 to $99,999 | 0 (0.0%) | 5 (50.0%) |
| $100,000 to $149,999 | 0 (0.0%) | 0 (0.0%) |
| $150,000 or more | 3 (3.5%) | 0 (0.0%) |
| Total | 86 (100.0%) | 10 (100.0%) |
Property Value to Household Income Ratio in Willow
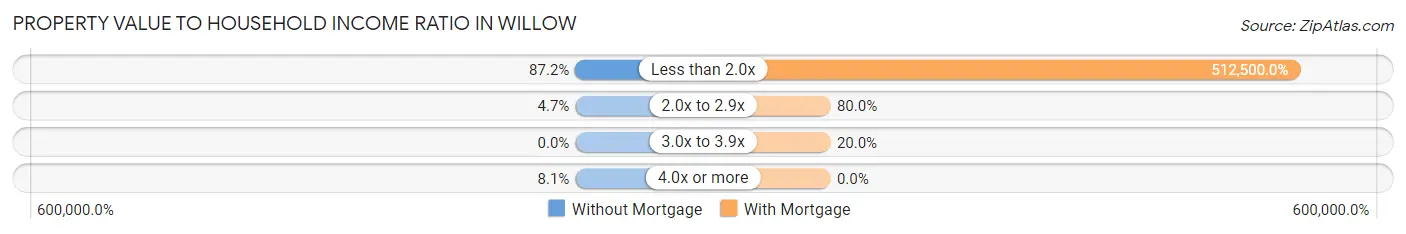
| Value-to-Income Ratio | Without Mortgage | With Mortgage |
| Less than 2.0x | 75 (87.2%) | 51,250 (512,500.0%) |
| 2.0x to 2.9x | 4 (4.6%) | 8 (80.0%) |
| 3.0x to 3.9x | 0 (0.0%) | 2 (20.0%) |
| 4.0x or more | 7 (8.1%) | 0 (0.0%) |
| Total | 86 (100.0%) | 10 (100.0%) |
Real Estate Taxes by Mortgage Status in Willow
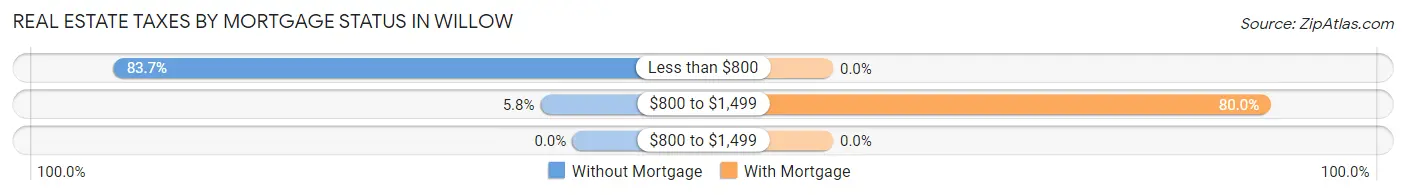
| Property Taxes | Without Mortgage | With Mortgage |
| Less than $800 | 72 (83.7%) | 0 (0.0%) |
| $800 to $1,499 | 5 (5.8%) | 8 (80.0%) |
| $800 to $1,499 | 0 (0.0%) | 0 (0.0%) |
| Total | 86 (100.0%) | 10 (100.0%) |
Health & Disability in Willow
Health Insurance Coverage by Age in Willow
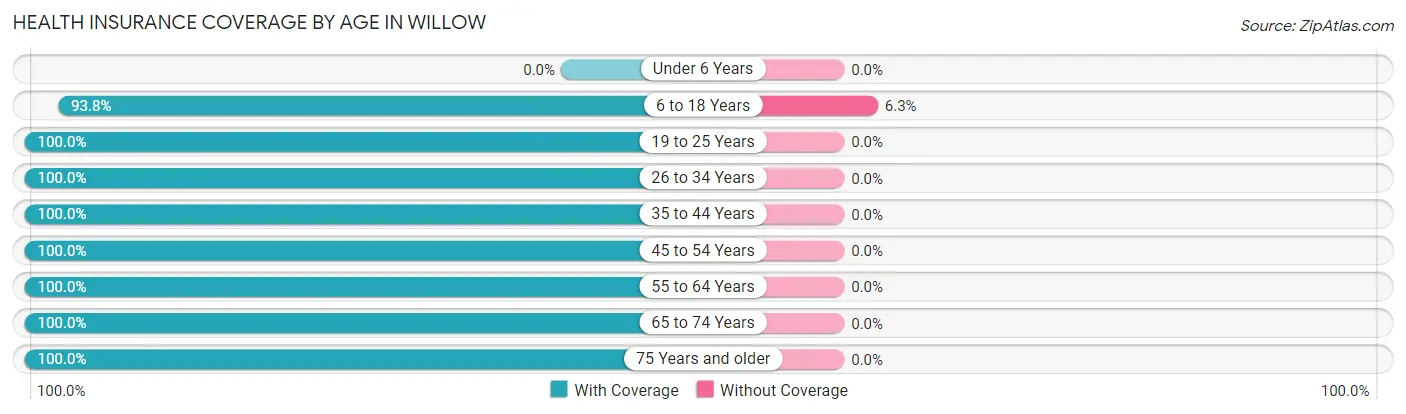
| Age Bracket | With Coverage | Without Coverage |
| Under 6 Years | 0 (0.0%) | 0 (0.0%) |
| 6 to 18 Years | 15 (93.8%) | 1 (6.2%) |
| 19 to 25 Years | 9 (100.0%) | 0 (0.0%) |
| 26 to 34 Years | 6 (100.0%) | 0 (0.0%) |
| 35 to 44 Years | 26 (100.0%) | 0 (0.0%) |
| 45 to 54 Years | 18 (100.0%) | 0 (0.0%) |
| 55 to 64 Years | 22 (100.0%) | 0 (0.0%) |
| 65 to 74 Years | 6 (100.0%) | 0 (0.0%) |
| 75 Years and older | 60 (100.0%) | 0 (0.0%) |
| Total | 162 (99.4%) | 1 (0.6%) |
Health Insurance Coverage by Citizenship Status in Willow
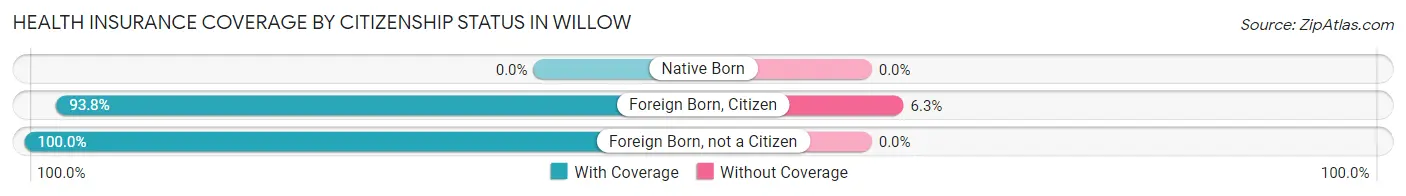
| Citizenship Status | With Coverage | Without Coverage |
| Native Born | 0 (0.0%) | 0 (0.0%) |
| Foreign Born, Citizen | 15 (93.8%) | 1 (6.2%) |
| Foreign Born, not a Citizen | 9 (100.0%) | 0 (0.0%) |
Health Insurance Coverage by Household Income in Willow
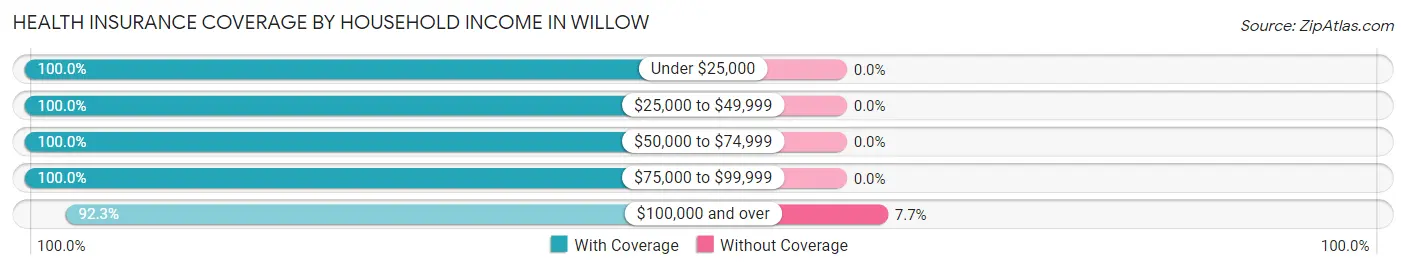
| Household Income | With Coverage | Without Coverage |
| Under $25,000 | 11 (100.0%) | 0 (0.0%) |
| $25,000 to $49,999 | 22 (100.0%) | 0 (0.0%) |
| $50,000 to $74,999 | 108 (100.0%) | 0 (0.0%) |
| $75,000 to $99,999 | 9 (100.0%) | 0 (0.0%) |
| $100,000 and over | 12 (92.3%) | 1 (7.7%) |
Public vs Private Health Insurance Coverage by Age in Willow
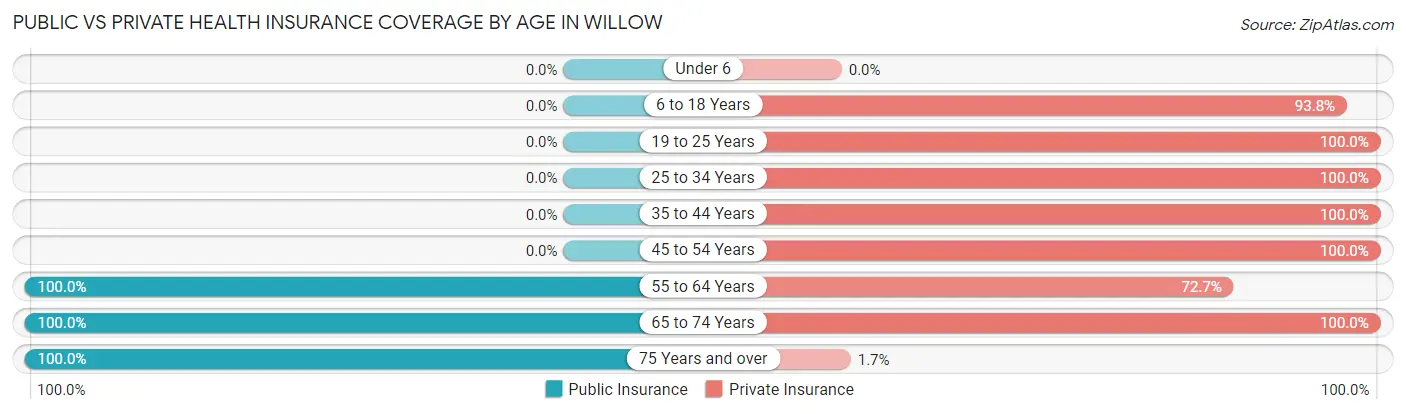
| Age Bracket | Public Insurance | Private Insurance |
| Under 6 | 0 (0.0%) | 0 (0.0%) |
| 6 to 18 Years | 0 (0.0%) | 15 (93.8%) |
| 19 to 25 Years | 0 (0.0%) | 9 (100.0%) |
| 25 to 34 Years | 0 (0.0%) | 6 (100.0%) |
| 35 to 44 Years | 0 (0.0%) | 26 (100.0%) |
| 45 to 54 Years | 0 (0.0%) | 18 (100.0%) |
| 55 to 64 Years | 22 (100.0%) | 16 (72.7%) |
| 65 to 74 Years | 6 (100.0%) | 6 (100.0%) |
| 75 Years and over | 60 (100.0%) | 1 (1.7%) |
| Total | 88 (54.0%) | 97 (59.5%) |
Disability Status by Sex by Age in Willow
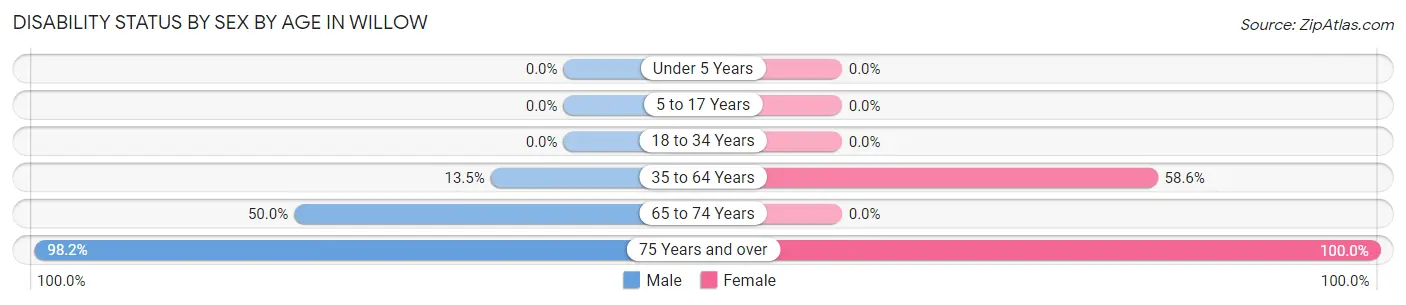
| Age Bracket | Male | Female |
| Under 5 Years | 0 (0.0%) | 0 (0.0%) |
| 5 to 17 Years | 0 (0.0%) | 0 (0.0%) |
| 18 to 34 Years | 0 (0.0%) | 0 (0.0%) |
| 35 to 64 Years | 5 (13.5%) | 17 (58.6%) |
| 65 to 74 Years | 2 (50.0%) | 0 (0.0%) |
| 75 Years and over | 54 (98.2%) | 5 (100.0%) |
Disability Class by Sex by Age in Willow
Disability Class: Hearing Difficulty
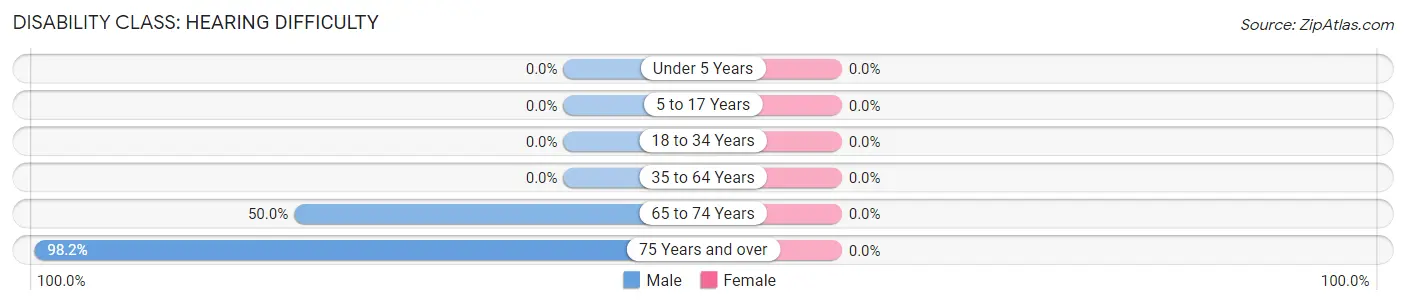
| Age Bracket | Male | Female |
| Under 5 Years | 0 (0.0%) | 0 (0.0%) |
| 5 to 17 Years | 0 (0.0%) | 0 (0.0%) |
| 18 to 34 Years | 0 (0.0%) | 0 (0.0%) |
| 35 to 64 Years | 0 (0.0%) | 0 (0.0%) |
| 65 to 74 Years | 2 (50.0%) | 0 (0.0%) |
| 75 Years and over | 54 (98.2%) | 0 (0.0%) |
Disability Class: Vision Difficulty
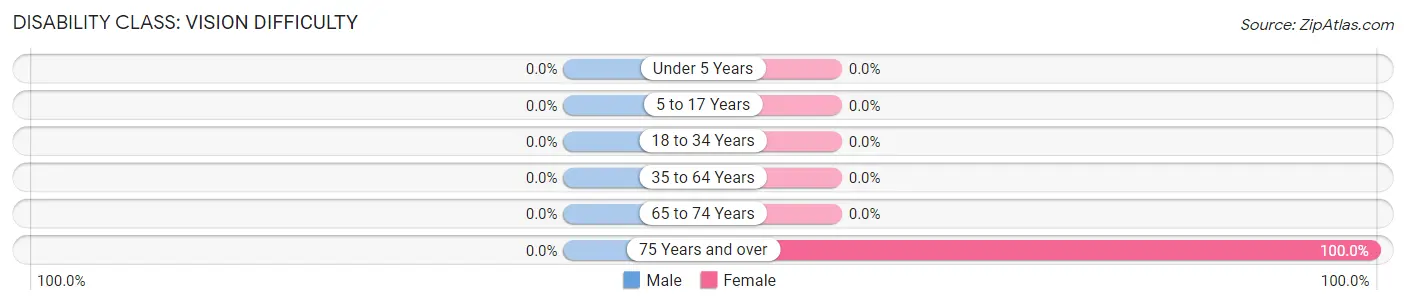
| Age Bracket | Male | Female |
| Under 5 Years | 0 (0.0%) | 0 (0.0%) |
| 5 to 17 Years | 0 (0.0%) | 0 (0.0%) |
| 18 to 34 Years | 0 (0.0%) | 0 (0.0%) |
| 35 to 64 Years | 0 (0.0%) | 0 (0.0%) |
| 65 to 74 Years | 0 (0.0%) | 0 (0.0%) |
| 75 Years and over | 0 (0.0%) | 5 (100.0%) |
Disability Class: Cognitive Difficulty
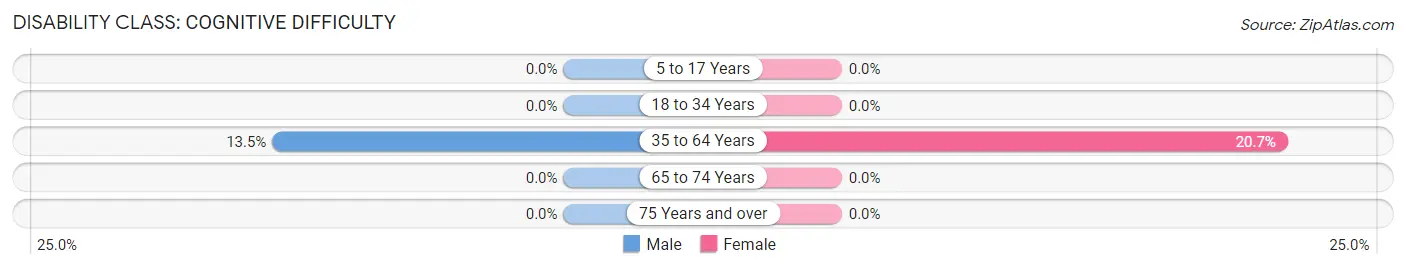
| Age Bracket | Male | Female |
| 5 to 17 Years | 0 (0.0%) | 0 (0.0%) |
| 18 to 34 Years | 0 (0.0%) | 0 (0.0%) |
| 35 to 64 Years | 5 (13.5%) | 6 (20.7%) |
| 65 to 74 Years | 0 (0.0%) | 0 (0.0%) |
| 75 Years and over | 0 (0.0%) | 0 (0.0%) |
Disability Class: Ambulatory Difficulty
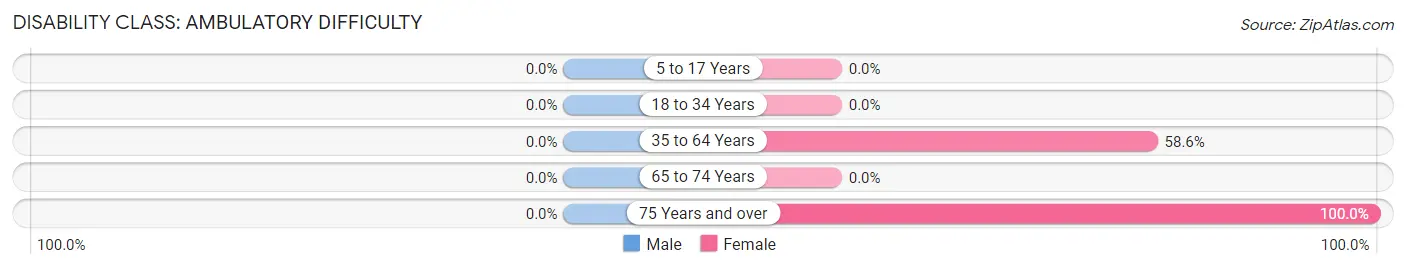
| Age Bracket | Male | Female |
| 5 to 17 Years | 0 (0.0%) | 0 (0.0%) |
| 18 to 34 Years | 0 (0.0%) | 0 (0.0%) |
| 35 to 64 Years | 0 (0.0%) | 17 (58.6%) |
| 65 to 74 Years | 0 (0.0%) | 0 (0.0%) |
| 75 Years and over | 0 (0.0%) | 5 (100.0%) |
Disability Class: Self-Care Difficulty
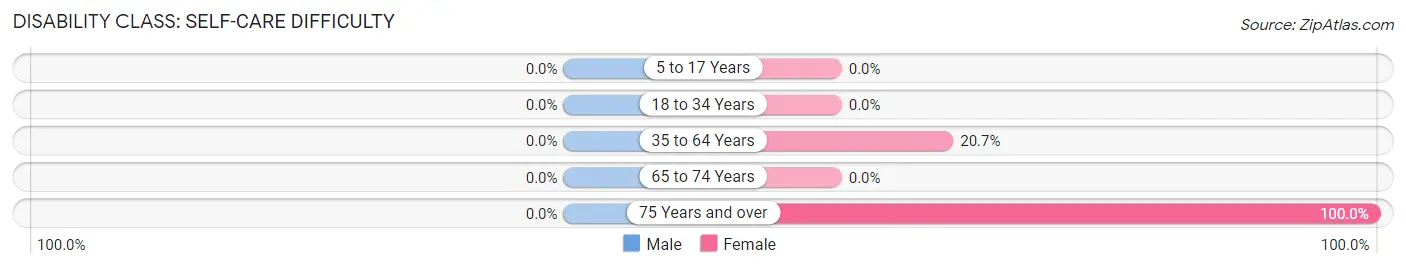
| Age Bracket | Male | Female |
| 5 to 17 Years | 0 (0.0%) | 0 (0.0%) |
| 18 to 34 Years | 0 (0.0%) | 0 (0.0%) |
| 35 to 64 Years | 0 (0.0%) | 6 (20.7%) |
| 65 to 74 Years | 0 (0.0%) | 0 (0.0%) |
| 75 Years and over | 0 (0.0%) | 5 (100.0%) |
Technology Access in Willow
Computing Device Access in Willow
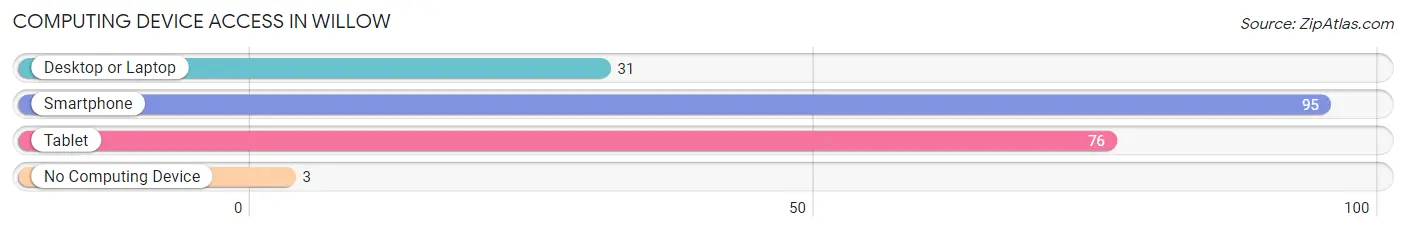
| Device Type | # Households | % Households |
| Desktop or Laptop | 31 | 29.5% |
| Smartphone | 95 | 90.5% |
| Tablet | 76 | 72.4% |
| No Computing Device | 3 | 2.9% |
| Total | 105 | 100.0% |
Internet Access in Willow
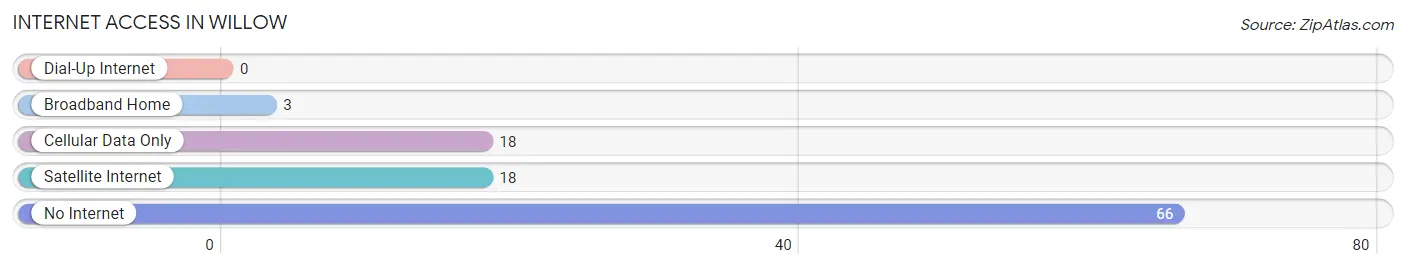
| Internet Type | # Households | % Households |
| Dial-Up Internet | 0 | 0.0% |
| Broadband Home | 3 | 2.9% |
| Cellular Data Only | 18 | 17.1% |
| Satellite Internet | 18 | 17.1% |
| No Internet | 66 | 62.9% |
| Total | 105 | 100.0% |
Willow Summary
Willow, Oklahoma is a small town located in the southeastern corner of the state, in the foothills of the Ouachita Mountains. It is situated in the county of LeFlore, and is part of the Fort Smith metropolitan area. The town has a population of just over 1,000 people, and is known for its rural charm and friendly atmosphere.
Geography
Willow is located in the southeastern corner of Oklahoma, in the foothills of the Ouachita Mountains. It is situated in the county of LeFlore, and is part of the Fort Smith metropolitan area. The town is located at the intersection of US Highway 59 and State Highway 82. The town is surrounded by rolling hills and forests, and is located near the Arkansas River. The climate in Willow is humid subtropical, with hot summers and mild winters.
Economy
Willow’s economy is largely based on agriculture and forestry. The town is home to several farms and ranches, as well as a sawmill and a lumber mill. The town also has a few small businesses, including a grocery store, a hardware store, and a few restaurants. The town is also home to a few manufacturing plants, including a furniture factory and a plastics factory.
Demographics
As of the 2010 census, the population of Willow was 1,039. The racial makeup of the town was 94.3% White, 0.7% African American, 0.3% Native American, 0.2% Asian, 0.1% Pacific Islander, and 4.4% from other races. The median household income in Willow was $30,938, and the median family income was $37,813. The per capita income in the town was $15,945.
Conclusion
Willow, Oklahoma is a small town located in the southeastern corner of the state, in the foothills of the Ouachita Mountains. It is situated in the county of LeFlore, and is part of the Fort Smith metropolitan area. The town has a population of just over 1,000 people, and is known for its rural charm and friendly atmosphere. The economy of Willow is largely based on agriculture and forestry, and the town is home to several farms and ranches, as well as a few small businesses. The racial makeup of the town is predominantly White, with a small percentage of African American, Native American, Asian, and Pacific Islander residents. The median household income in Willow is $30,938, and the per capita income is $15,945.
Common Questions
What is Per Capita Income in Willow?
Per Capita income in Willow is $49,082.
What is the Median Family Income in Willow?
Median Family Income in Willow is $67,639.
What is the Median Household income in Willow?
Median Household Income in Willow is $53,665.
What is Income or Wage Gap in Willow?
Income or Wage Gap in Willow is 51.8%.
Women in Willow earn 48.2 cents for every dollar earned by a man.
What is Inequality or Gini Index in Willow?
Inequality or Gini Index in Willow is 0.25.
What is the Total Population of Willow?
Total Population of Willow is 163.
What is the Total Male Population of Willow?
Total Male Population of Willow is 112.
What is the Total Female Population of Willow?
Total Female Population of Willow is 51.
What is the Ratio of Males per 100 Females in Willow?
There are 219.61 Males per 100 Females in Willow.
What is the Ratio of Females per 100 Males in Willow?
There are 45.54 Females per 100 Males in Willow.
What is the Median Population Age in Willow?
Median Population Age in Willow is 62.3 Years.
What is the Average Family Size in Willow
Average Family Size in Willow is 3.5 People.
What is the Average Household Size in Willow
Average Household Size in Willow is 1.6 People.
How Large is the Labor Force in Willow?
There are 112 People in the Labor Forcein in Willow.
What is the Percentage of People in the Labor Force in Willow?
75.7% of People are in the Labor Force in Willow.