Westville, OK Map & Demographics
Westville Map
Westville Overview
$16,836
PER CAPITA INCOME
$45,658
AVG FAMILY INCOME
$32,600
AVG HOUSEHOLD INCOME
30.2%
WAGE / INCOME GAP [ % ]
69.8¢/ $1
WAGE / INCOME GAP [ $ ]
0.46
INEQUALITY / GINI INDEX
1,672
TOTAL POPULATION
830
MALE POPULATION
842
FEMALE POPULATION
98.57
MALES / 100 FEMALES
101.45
FEMALES / 100 MALES
35.1
MEDIAN AGE
3.5
AVG FAMILY SIZE
2.6
AVG HOUSEHOLD SIZE
632
LABOR FORCE [ PEOPLE ]
49.8%
PERCENT IN LABOR FORCE
10.9%
UNEMPLOYMENT RATE
Westville Zip Codes
Westville Area Codes
Income in Westville
Income Overview in Westville
Per Capita Income in Westville is $16,836, while median incomes of families and households are $45,658 and $32,600 respectively.
| Characteristic | Number | Measure |
| Per Capita Income | 1,672 | $16,836 |
| Median Family Income | 384 | $45,658 |
| Mean Family Income | 384 | $54,033 |
| Median Household Income | 648 | $32,600 |
| Mean Household Income | 648 | $41,241 |
| Income Deficit | 384 | $0 |
| Wage / Income Gap (%) | 1,672 | 30.21% |
| Wage / Income Gap ($) | 1,672 | 69.79¢ per $1 |
| Gini / Inequality Index | 1,672 | 0.46 |
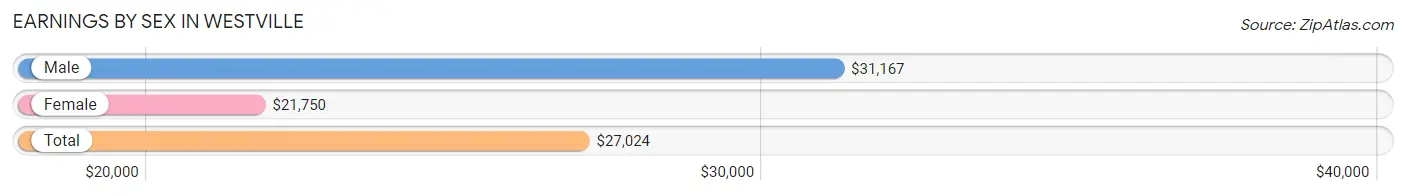
Earnings by Sex in Westville
Average Earnings in Westville are $27,024, $31,167 for men and $21,750 for women, a difference of 30.2%.
| Sex | Number | Average Earnings |
| Male | 262 (41.7%) | $31,167 |
| Female | 366 (58.3%) | $21,750 |
| Total | 628 (100.0%) | $27,024 |
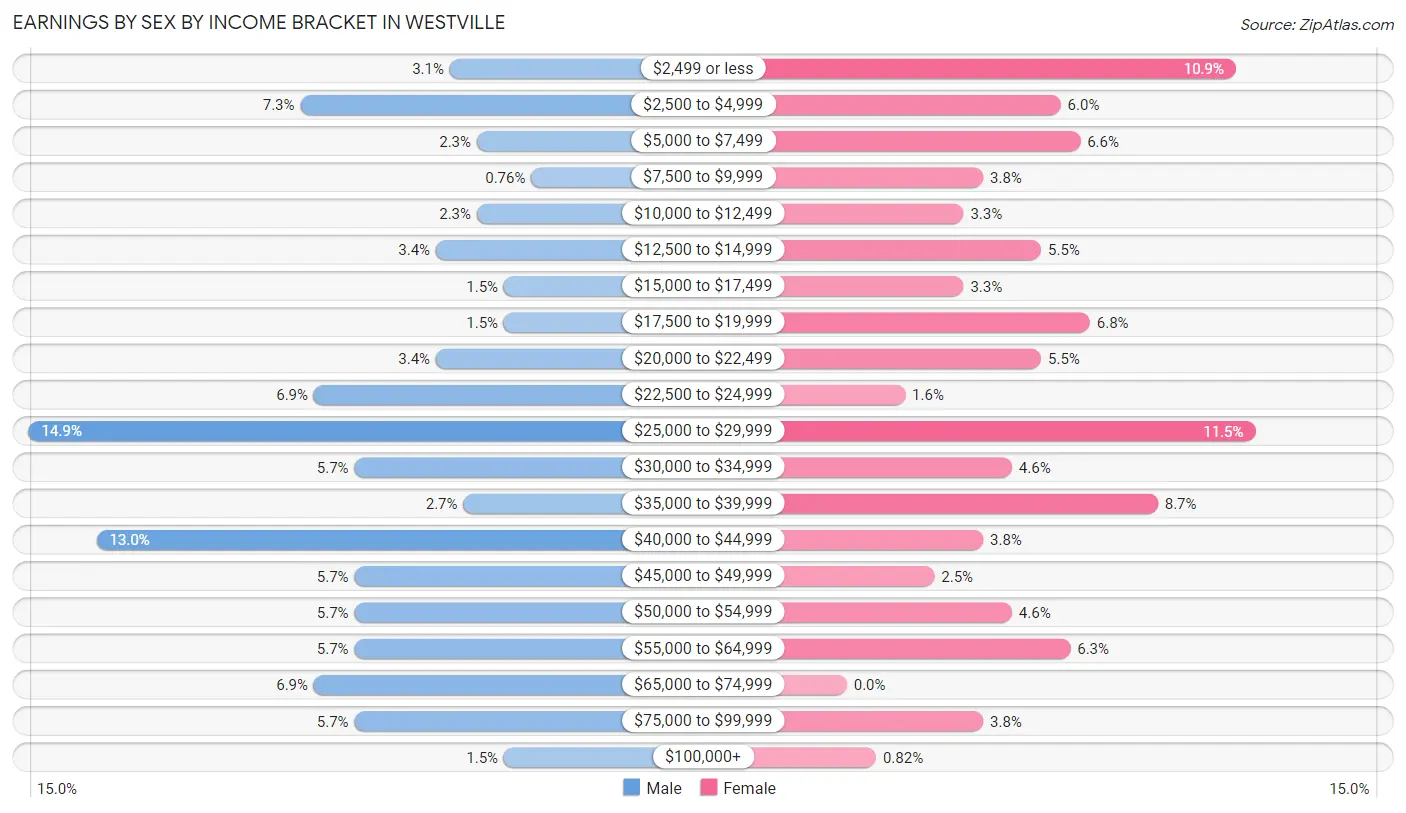
Earnings by Sex by Income Bracket in Westville
The most common earnings brackets in Westville are $25,000 to $29,999 for men (39 | 14.9%) and $25,000 to $29,999 for women (42 | 11.5%).
| Income | Male | Female |
| $2,499 or less | 8 (3.0%) | 40 (10.9%) |
| $2,500 to $4,999 | 19 (7.2%) | 22 (6.0%) |
| $5,000 to $7,499 | 6 (2.3%) | 24 (6.6%) |
| $7,500 to $9,999 | 2 (0.8%) | 14 (3.8%) |
| $10,000 to $12,499 | 6 (2.3%) | 12 (3.3%) |
| $12,500 to $14,999 | 9 (3.4%) | 20 (5.5%) |
| $15,000 to $17,499 | 4 (1.5%) | 12 (3.3%) |
| $17,500 to $19,999 | 4 (1.5%) | 25 (6.8%) |
| $20,000 to $22,499 | 9 (3.4%) | 20 (5.5%) |
| $22,500 to $24,999 | 18 (6.9%) | 6 (1.6%) |
| $25,000 to $29,999 | 39 (14.9%) | 42 (11.5%) |
| $30,000 to $34,999 | 15 (5.7%) | 17 (4.6%) |
| $35,000 to $39,999 | 7 (2.7%) | 32 (8.7%) |
| $40,000 to $44,999 | 34 (13.0%) | 14 (3.8%) |
| $45,000 to $49,999 | 15 (5.7%) | 9 (2.5%) |
| $50,000 to $54,999 | 15 (5.7%) | 17 (4.6%) |
| $55,000 to $64,999 | 15 (5.7%) | 23 (6.3%) |
| $65,000 to $74,999 | 18 (6.9%) | 0 (0.0%) |
| $75,000 to $99,999 | 15 (5.7%) | 14 (3.8%) |
| $100,000+ | 4 (1.5%) | 3 (0.8%) |
| Total | 262 (100.0%) | 366 (100.0%) |
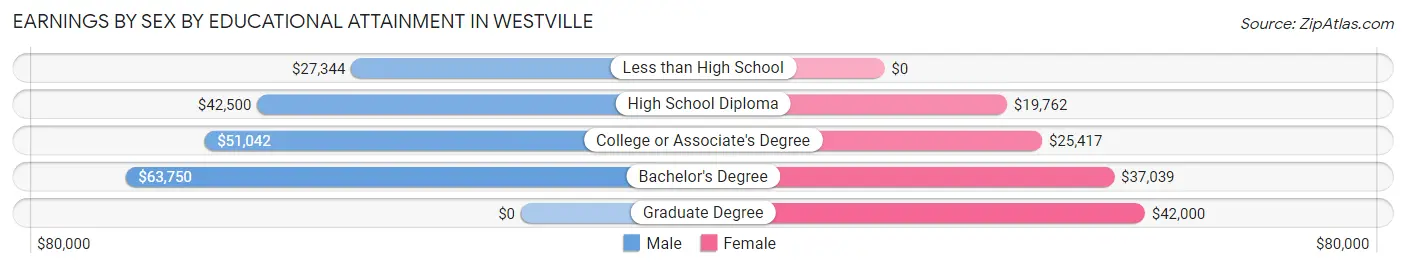
Earnings by Sex by Educational Attainment in Westville
Average earnings in Westville are $41,438 for men and $25,595 for women, a difference of 38.2%. Men with an educational attainment of bachelor's degree enjoy the highest average annual earnings of $63,750, while those with less than high school education earn the least with $27,344. Women with an educational attainment of graduate degree earn the most with the average annual earnings of $42,000, while those with high school diploma education have the smallest earnings of $19,762.
| Educational Attainment | Male Income | Female Income |
| Less than High School | $27,344 | $0 |
| High School Diploma | $42,500 | $19,762 |
| College or Associate's Degree | $51,042 | $25,417 |
| Bachelor's Degree | $63,750 | $37,039 |
| Graduate Degree | - | - |
| Total | $41,438 | $25,595 |
Family Income in Westville
Family Income Brackets in Westville
According to the Westville family income data, there are 90 families falling into the $50,000 to $74,999 income range, which is the most common income bracket and makes up 23.4% of all families.
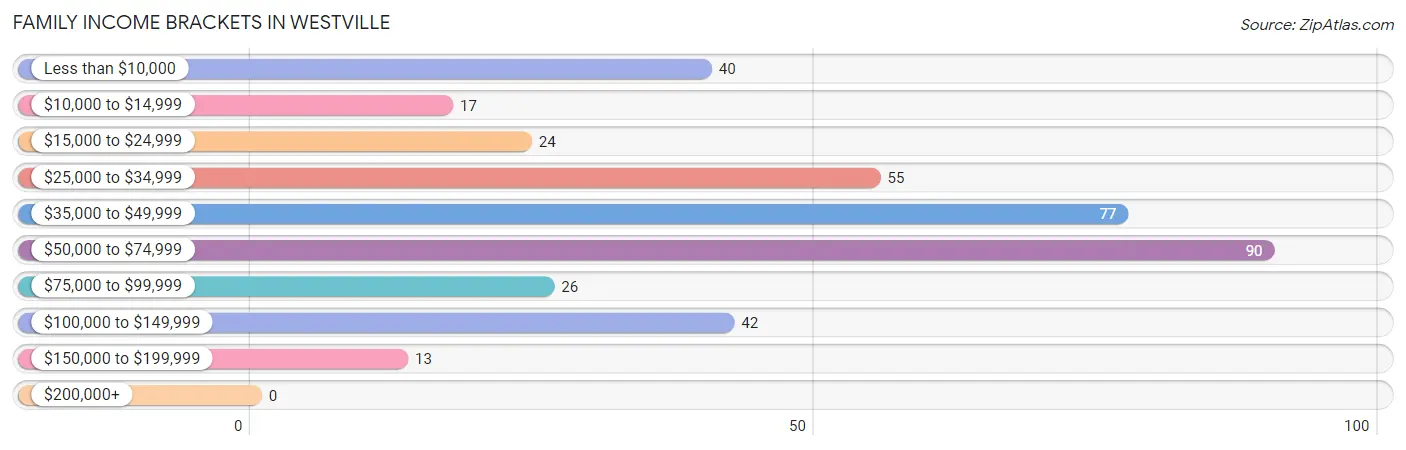
| Income Bracket | # Families | % Families |
| Less than $10,000 | 40 | 10.4% |
| $10,000 to $14,999 | 17 | 4.4% |
| $15,000 to $24,999 | 24 | 6.3% |
| $25,000 to $34,999 | 55 | 14.3% |
| $35,000 to $49,999 | 77 | 20.1% |
| $50,000 to $74,999 | 90 | 23.4% |
| $75,000 to $99,999 | 26 | 6.8% |
| $100,000 to $149,999 | 42 | 10.9% |
| $150,000 to $199,999 | 13 | 3.4% |
| $200,000+ | 0 | 0.0% |
Family Income by Famaliy Size in Westville
6-person families (11 | 2.9%) account for the highest median family income in Westville with $61,563 per family, while 3-person families (91 | 23.7%) have the highest median income of $19,250 per family member.
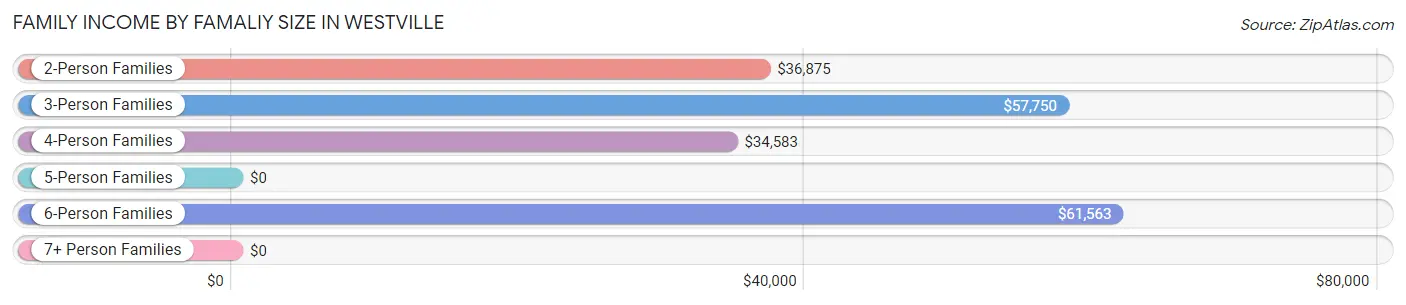
| Income Bracket | # Families | Median Income |
| 2-Person Families | 178 (46.4%) | $36,875 |
| 3-Person Families | 91 (23.7%) | $57,750 |
| 4-Person Families | 71 (18.5%) | $34,583 |
| 5-Person Families | 23 (6.0%) | $0 |
| 6-Person Families | 11 (2.9%) | $61,563 |
| 7+ Person Families | 10 (2.6%) | $0 |
| Total | 384 (100.0%) | $45,658 |
Family Income by Number of Earners in Westville
The median family income in Westville is $45,658, with families comprising 3+ earners (33) having the highest median family income of $106,750, while families with no earners (83) have the lowest median family income of $32,946, accounting for 8.6% and 21.6% of families, respectively.
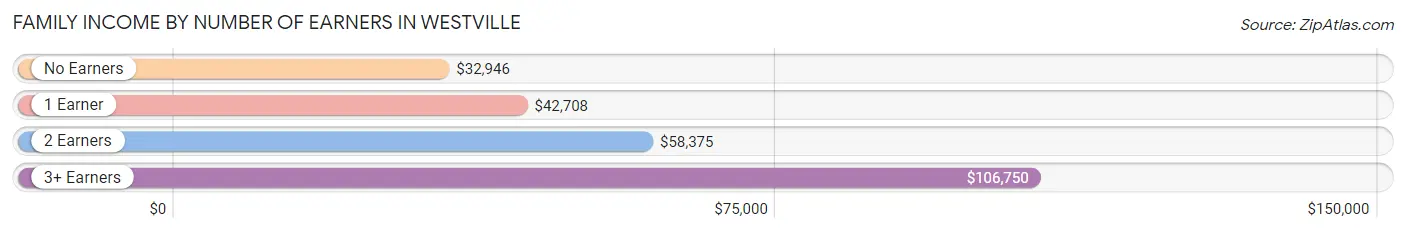
| Number of Earners | # Families | Median Income |
| No Earners | 83 (21.6%) | $32,946 |
| 1 Earner | 147 (38.3%) | $42,708 |
| 2 Earners | 121 (31.5%) | $58,375 |
| 3+ Earners | 33 (8.6%) | $106,750 |
| Total | 384 (100.0%) | $45,658 |
Household Income in Westville
Household Income Brackets in Westville
With 128 households falling in the category, the $15,000 to $24,999 income range is the most frequent in Westville, accounting for 19.8% of all households.
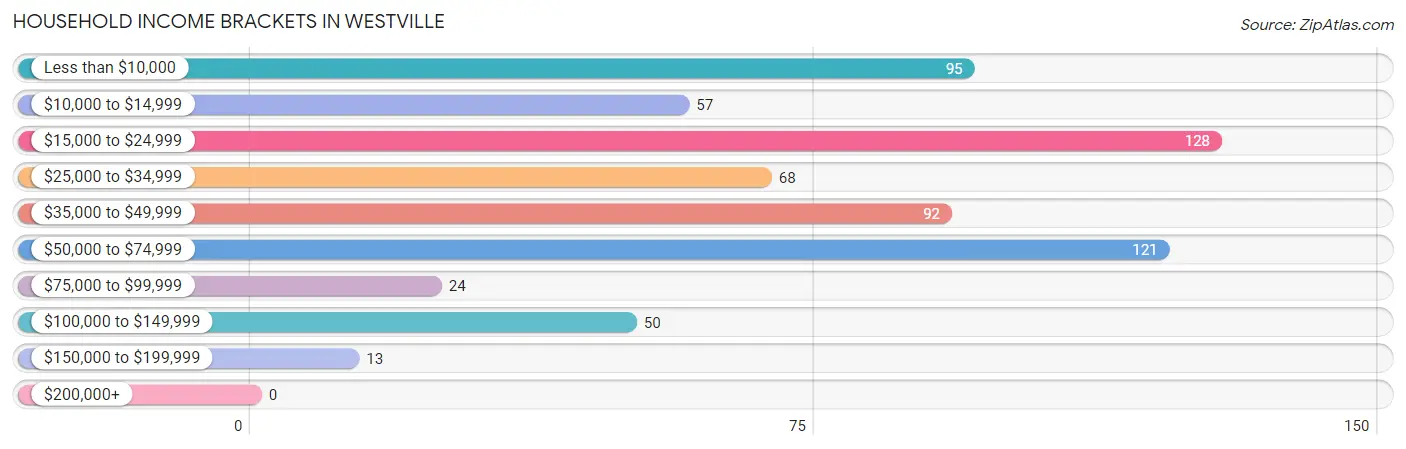
| Income Bracket | # Households | % Households |
| Less than $10,000 | 95 | 14.7% |
| $10,000 to $14,999 | 57 | 8.8% |
| $15,000 to $24,999 | 128 | 19.8% |
| $25,000 to $34,999 | 68 | 10.5% |
| $35,000 to $49,999 | 92 | 14.2% |
| $50,000 to $74,999 | 121 | 18.7% |
| $75,000 to $99,999 | 24 | 3.7% |
| $100,000 to $149,999 | 50 | 7.7% |
| $150,000 to $199,999 | 13 | 2.0% |
| $200,000+ | 0 | 0.0% |
Household Income by Householder Age in Westville
The median household income in Westville is $32,600, with the highest median household income of $46,500 found in the 15 to 24 years age bracket for the primary householder. A total of 30 households (4.6%) fall into this category. Meanwhile, the 65+ years age bracket for the primary householder has the lowest median household income of $27,292, with 181 households (27.9%) in this group.
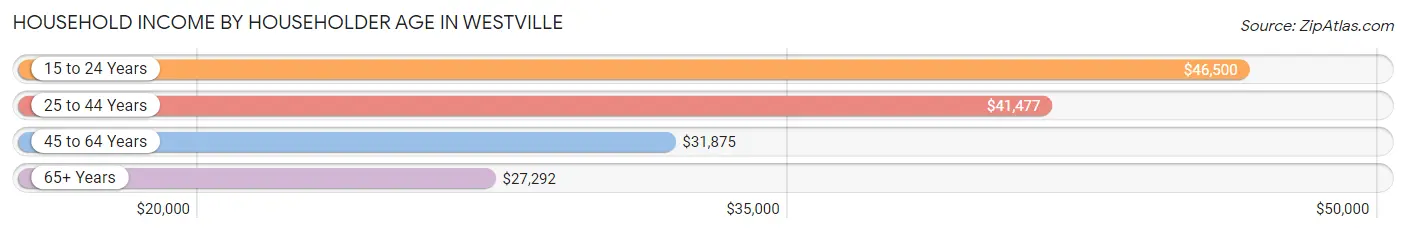
| Income Bracket | # Households | Median Income |
| 15 to 24 Years | 30 (4.6%) | $46,500 |
| 25 to 44 Years | 217 (33.5%) | $41,477 |
| 45 to 64 Years | 220 (34.0%) | $31,875 |
| 65+ Years | 181 (27.9%) | $27,292 |
| Total | 648 (100.0%) | $32,600 |
Poverty in Westville
Income Below Poverty by Sex and Age in Westville
With 22.2% poverty level for males and 30.2% for females among the residents of Westville, 15 year old males and under 5 year old females are the most vulnerable to poverty, with 3 males (37.5%) and 61 females (87.1%) in their respective age groups living below the poverty level.
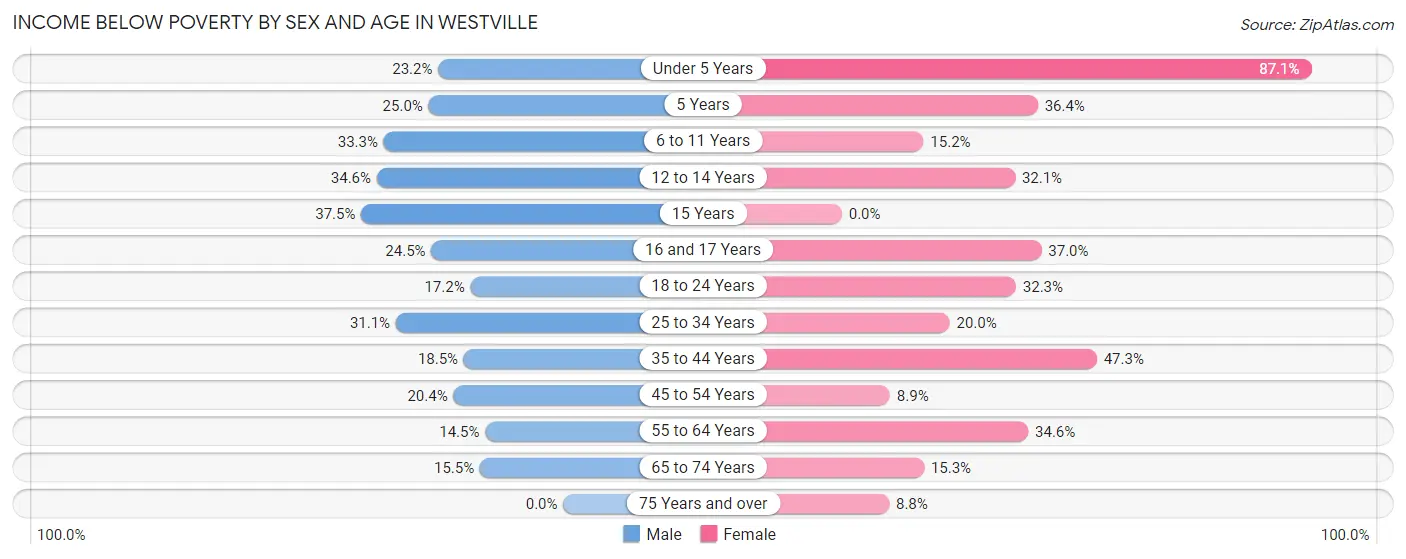
| Age Bracket | Male | Female |
| Under 5 Years | 13 (23.2%) | 61 (87.1%) |
| 5 Years | 11 (25.0%) | 4 (36.4%) |
| 6 to 11 Years | 17 (33.3%) | 10 (15.1%) |
| 12 to 14 Years | 18 (34.6%) | 9 (32.1%) |
| 15 Years | 3 (37.5%) | 0 (0.0%) |
| 16 and 17 Years | 12 (24.5%) | 10 (37.0%) |
| 18 to 24 Years | 10 (17.2%) | 21 (32.3%) |
| 25 to 34 Years | 32 (31.1%) | 25 (20.0%) |
| 35 to 44 Years | 19 (18.4%) | 53 (47.3%) |
| 45 to 54 Years | 21 (20.4%) | 10 (8.9%) |
| 55 to 64 Years | 10 (14.5%) | 37 (34.6%) |
| 65 to 74 Years | 15 (15.5%) | 9 (15.2%) |
| 75 Years and over | 0 (0.0%) | 5 (8.8%) |
| Total | 181 (22.2%) | 254 (30.2%) |
Income Above Poverty by Sex and Age in Westville
According to the poverty statistics in Westville, males aged 75 years and over and females aged 15 years are the age groups that are most secure financially, with 100.0% of males and 100.0% of females in these age groups living above the poverty line.
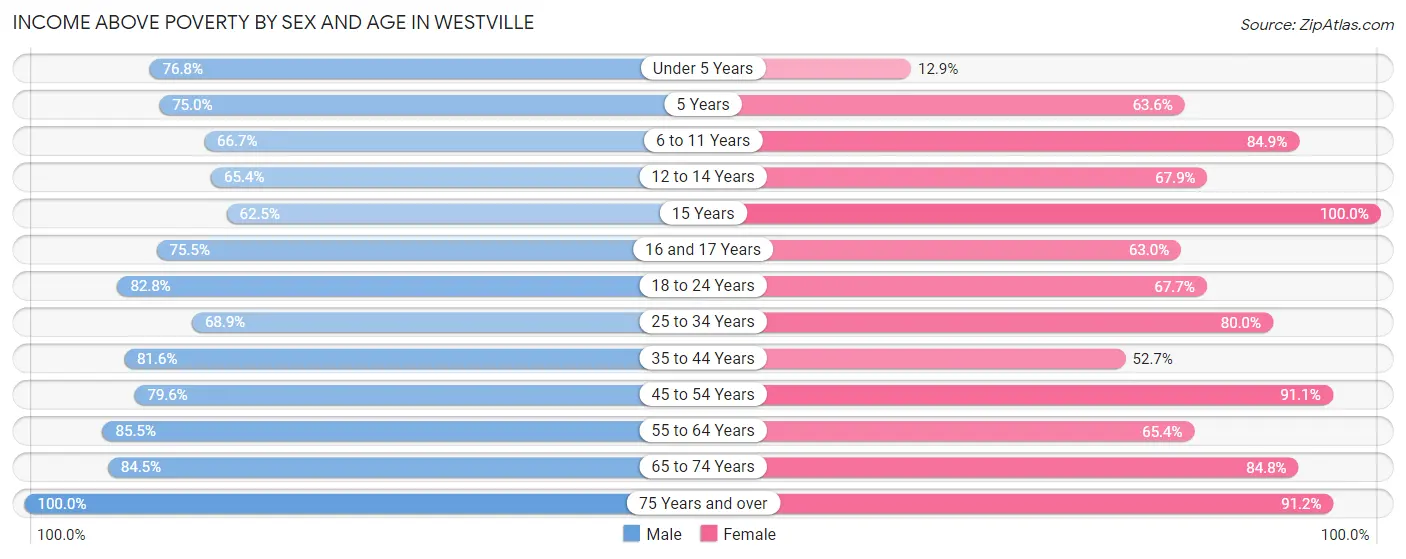
| Age Bracket | Male | Female |
| Under 5 Years | 43 (76.8%) | 9 (12.9%) |
| 5 Years | 33 (75.0%) | 7 (63.6%) |
| 6 to 11 Years | 34 (66.7%) | 56 (84.9%) |
| 12 to 14 Years | 34 (65.4%) | 19 (67.9%) |
| 15 Years | 5 (62.5%) | 3 (100.0%) |
| 16 and 17 Years | 37 (75.5%) | 17 (63.0%) |
| 18 to 24 Years | 48 (82.8%) | 44 (67.7%) |
| 25 to 34 Years | 71 (68.9%) | 100 (80.0%) |
| 35 to 44 Years | 84 (81.6%) | 59 (52.7%) |
| 45 to 54 Years | 82 (79.6%) | 102 (91.1%) |
| 55 to 64 Years | 59 (85.5%) | 70 (65.4%) |
| 65 to 74 Years | 82 (84.5%) | 50 (84.8%) |
| 75 Years and over | 23 (100.0%) | 52 (91.2%) |
| Total | 635 (77.8%) | 588 (69.8%) |
Income Below Poverty Among Married-Couple Families in Westville
The poverty statistics for married-couple families in Westville show that 9.6% or 20 of the total 209 families live below the poverty line. Families with 1 or 2 children have the highest poverty rate of 22.4%, comprising of 17 families. On the other hand, families with 3 or 4 children have the lowest poverty rate of 0.0%, which includes 0 families.
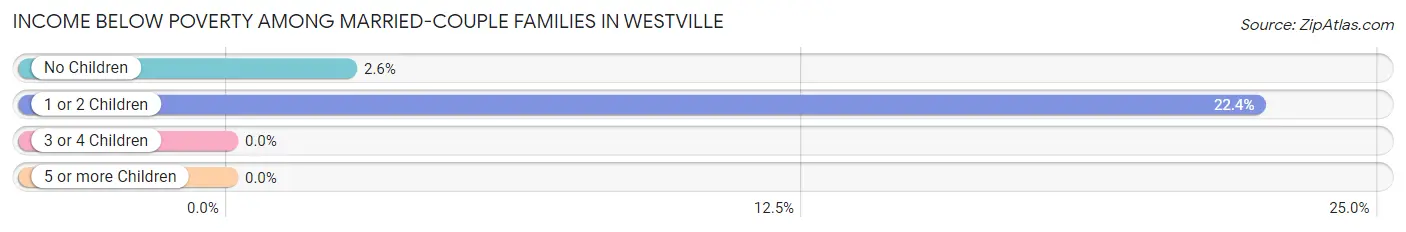
| Children | Above Poverty | Below Poverty |
| No Children | 113 (97.4%) | 3 (2.6%) |
| 1 or 2 Children | 59 (77.6%) | 17 (22.4%) |
| 3 or 4 Children | 17 (100.0%) | 0 (0.0%) |
| 5 or more Children | 0 (0.0%) | 0 (0.0%) |
| Total | 189 (90.4%) | 20 (9.6%) |
Income Below Poverty Among Single-Parent Households in Westville
According to the poverty data in Westville, 10.3% or 3 single-father households and 33.6% or 49 single-mother households are living below the poverty line. Among single-father households, those with 1 or 2 children have the highest poverty rate, with 3 households (13.6%) experiencing poverty. Likewise, among single-mother households, those with 3 or 4 children have the highest poverty rate, with 26 households (78.8%) falling below the poverty line.
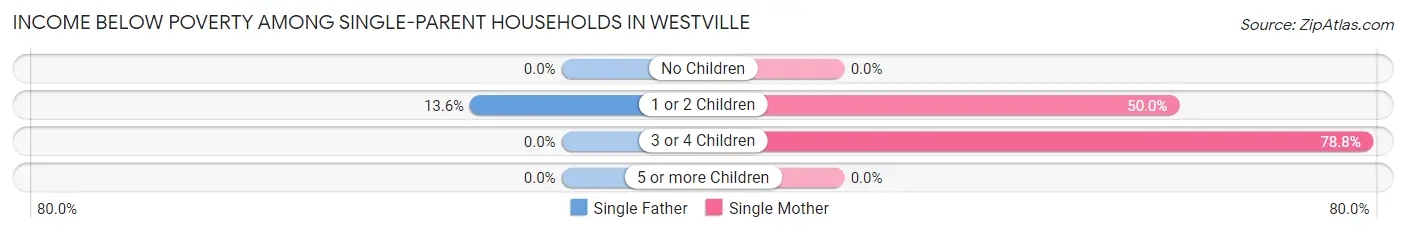
| Children | Single Father | Single Mother |
| No Children | 0 (0.0%) | 0 (0.0%) |
| 1 or 2 Children | 3 (13.6%) | 23 (50.0%) |
| 3 or 4 Children | 0 (0.0%) | 26 (78.8%) |
| 5 or more Children | 0 (0.0%) | 0 (0.0%) |
| Total | 3 (10.3%) | 49 (33.6%) |
Income Below Poverty Among Married-Couple vs Single-Parent Households in Westville
The poverty data for Westville shows that 20 of the married-couple family households (9.6%) and 52 of the single-parent households (29.7%) are living below the poverty level. Within the married-couple family households, those with 1 or 2 children have the highest poverty rate, with 17 households (22.4%) falling below the poverty line. Among the single-parent households, those with 3 or 4 children have the highest poverty rate, with 26 household (78.8%) living below poverty.
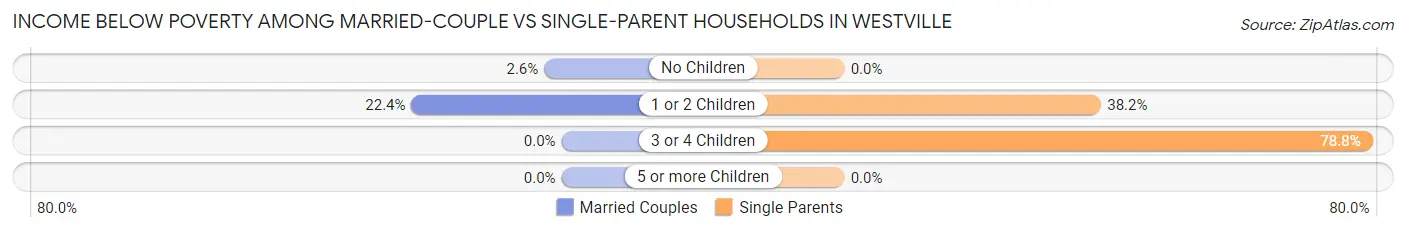
| Children | Married-Couple Families | Single-Parent Households |
| No Children | 3 (2.6%) | 0 (0.0%) |
| 1 or 2 Children | 17 (22.4%) | 26 (38.2%) |
| 3 or 4 Children | 0 (0.0%) | 26 (78.8%) |
| 5 or more Children | 0 (0.0%) | 0 (0.0%) |
| Total | 20 (9.6%) | 52 (29.7%) |
Race in Westville
The most populous races in Westville are White / Caucasian (833 | 49.8%), Native / Alaskan (672 | 40.2%), and Two or more Races (113 | 6.8%).
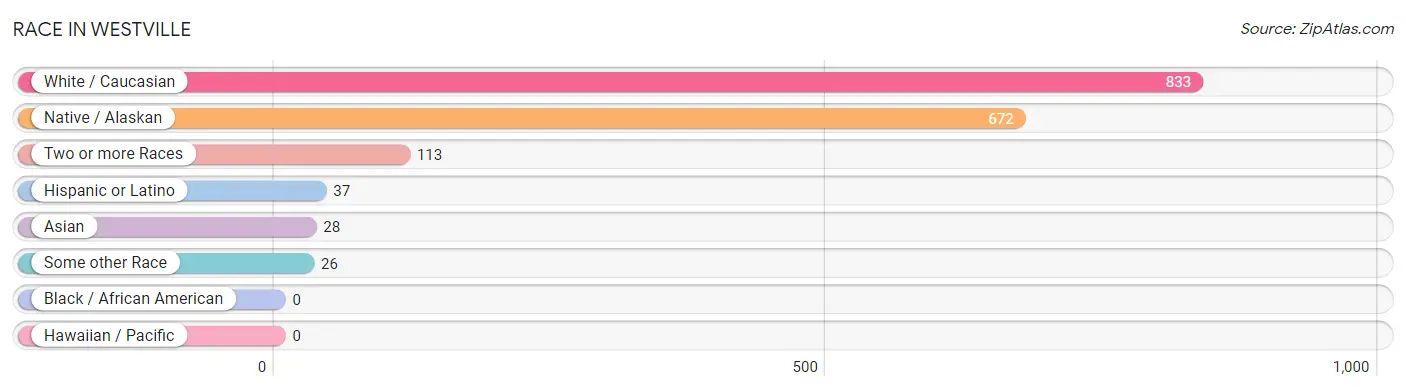
| Race | # Population | % Population |
| Asian | 28 | 1.7% |
| Black / African American | 0 | 0.0% |
| Hawaiian / Pacific | 0 | 0.0% |
| Hispanic or Latino | 37 | 2.2% |
| Native / Alaskan | 672 | 40.2% |
| White / Caucasian | 833 | 49.8% |
| Two or more Races | 113 | 6.8% |
| Some other Race | 26 | 1.6% |
| Total | 1,672 | 100.0% |
Ancestry in Westville
The most populous ancestries reported in Westville are Cherokee (701 | 41.9%), Irish (150 | 9.0%), American (87 | 5.2%), German (70 | 4.2%), and English (63 | 3.8%), together accounting for 64.1% of all Westville residents.
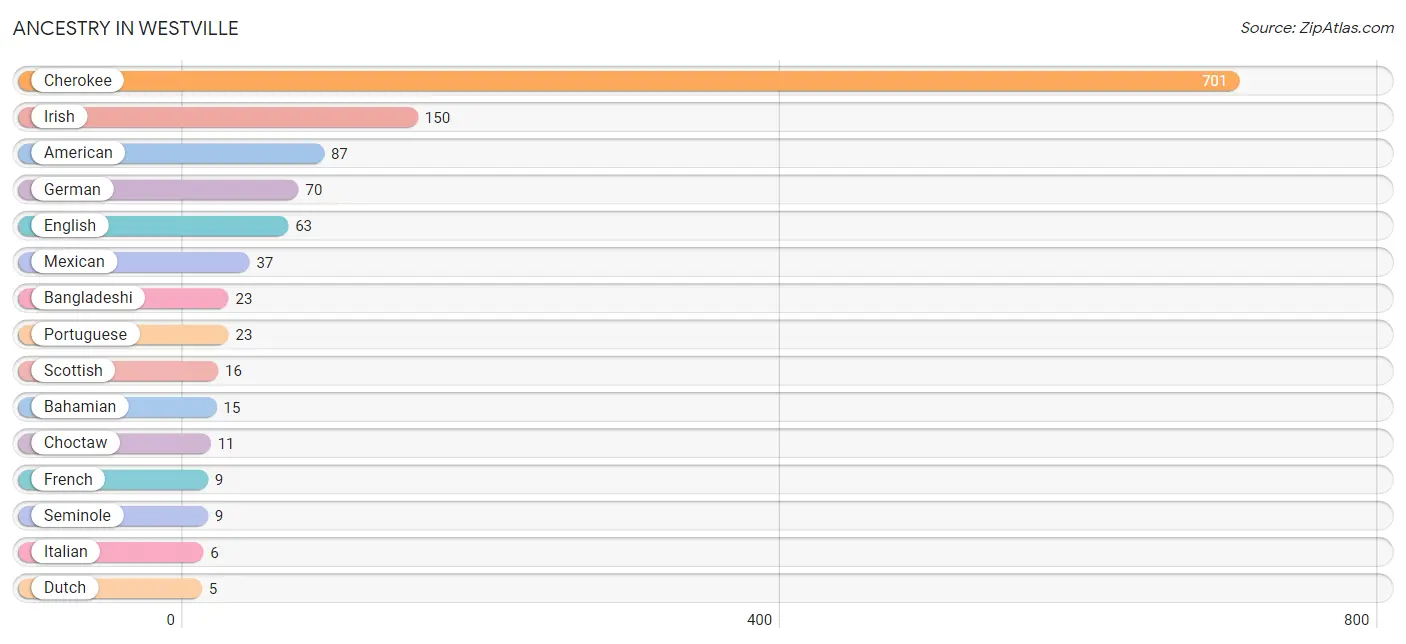
| Ancestry | # Population | % Population |
| American | 87 | 5.2% |
| Bahamian | 15 | 0.9% |
| Bangladeshi | 23 | 1.4% |
| Cherokee | 701 | 41.9% |
| Choctaw | 11 | 0.7% |
| Comanche | 1 | 0.1% |
| Dutch | 5 | 0.3% |
| English | 63 | 3.8% |
| European | 5 | 0.3% |
| French | 9 | 0.5% |
| German | 70 | 4.2% |
| Irish | 150 | 9.0% |
| Italian | 6 | 0.4% |
| Kiowa | 4 | 0.2% |
| Korean | 3 | 0.2% |
| Malaysian | 2 | 0.1% |
| Mexican | 37 | 2.2% |
| Polish | 4 | 0.2% |
| Portuguese | 23 | 1.4% |
| Scottish | 16 | 1.0% |
| Seminole | 9 | 0.5% |
| Swedish | 3 | 0.2% | View All 22 Rows |
Immigrants in Westville
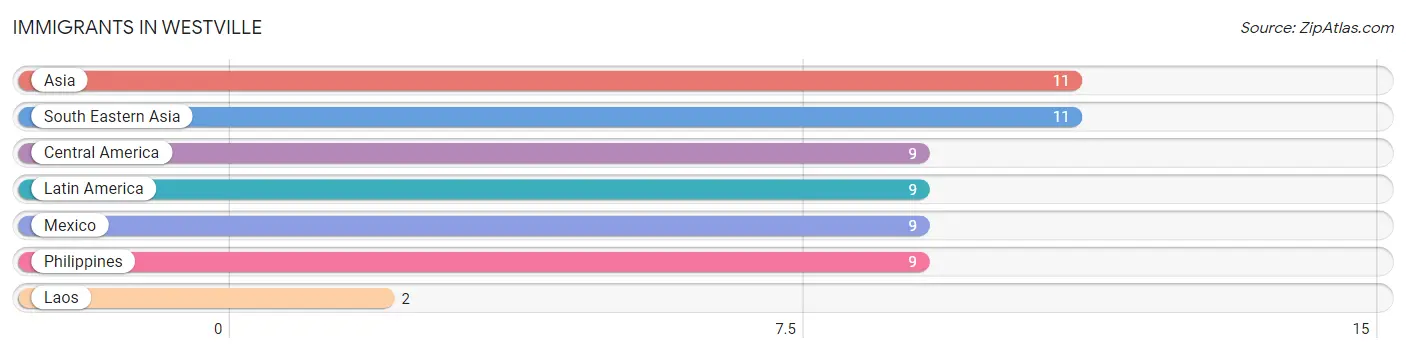
The most numerous immigrant groups reported in Westville came from Asia (11 | 0.7%), South Eastern Asia (11 | 0.7%), Central America (9 | 0.5%), Latin America (9 | 0.5%), and Mexico (9 | 0.5%), together accounting for 2.9% of all Westville residents.
| Immigration Origin | # Population | % Population |
| Asia | 11 | 0.7% |
| Central America | 9 | 0.5% |
| Laos | 2 | 0.1% |
| Latin America | 9 | 0.5% |
| Mexico | 9 | 0.5% |
| Philippines | 9 | 0.5% |
| South Eastern Asia | 11 | 0.7% | View All 7 Rows |
Sex and Age in Westville
Sex and Age in Westville
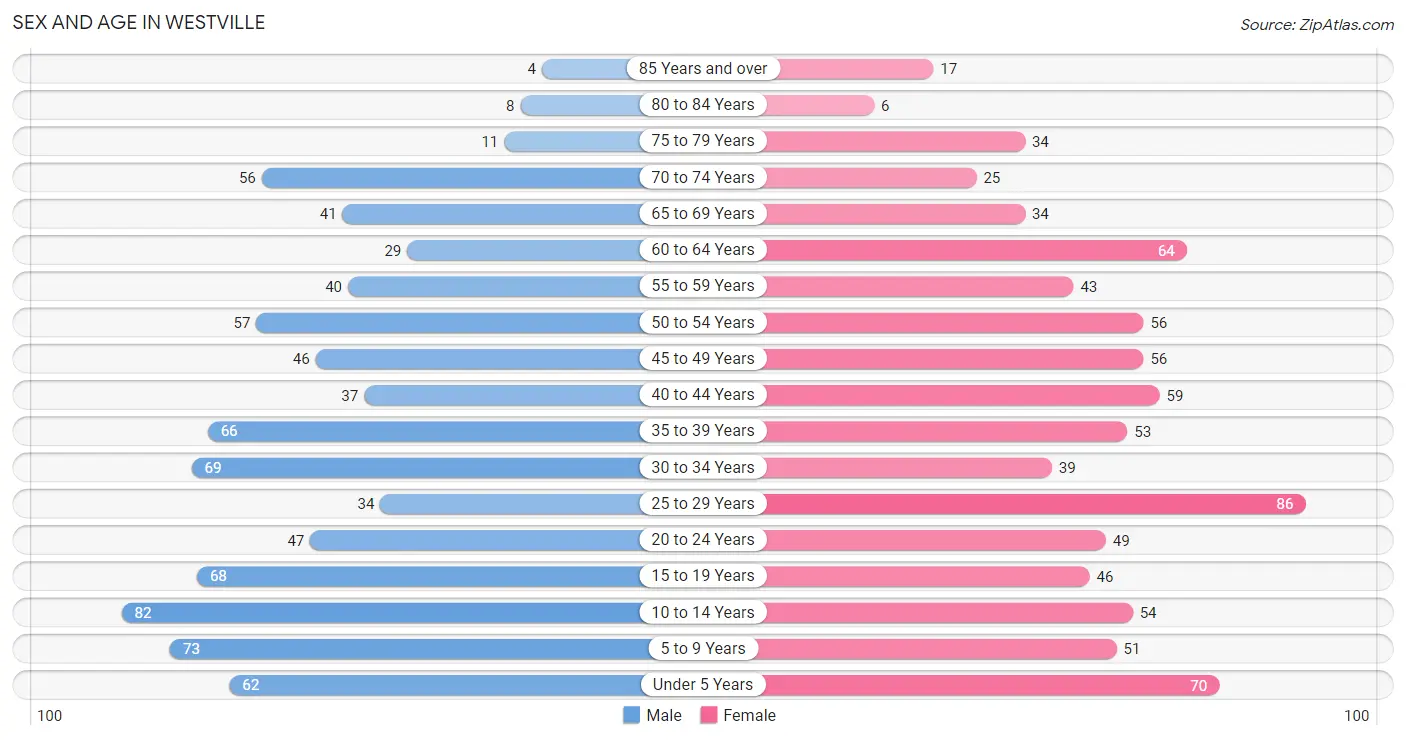
The most populous age groups in Westville are 10 to 14 Years (82 | 9.9%) for men and 25 to 29 Years (86 | 10.2%) for women.
| Age Bracket | Male | Female |
| Under 5 Years | 62 (7.5%) | 70 (8.3%) |
| 5 to 9 Years | 73 (8.8%) | 51 (6.1%) |
| 10 to 14 Years | 82 (9.9%) | 54 (6.4%) |
| 15 to 19 Years | 68 (8.2%) | 46 (5.5%) |
| 20 to 24 Years | 47 (5.7%) | 49 (5.8%) |
| 25 to 29 Years | 34 (4.1%) | 86 (10.2%) |
| 30 to 34 Years | 69 (8.3%) | 39 (4.6%) |
| 35 to 39 Years | 66 (8.0%) | 53 (6.3%) |
| 40 to 44 Years | 37 (4.5%) | 59 (7.0%) |
| 45 to 49 Years | 46 (5.5%) | 56 (6.7%) |
| 50 to 54 Years | 57 (6.9%) | 56 (6.7%) |
| 55 to 59 Years | 40 (4.8%) | 43 (5.1%) |
| 60 to 64 Years | 29 (3.5%) | 64 (7.6%) |
| 65 to 69 Years | 41 (4.9%) | 34 (4.0%) |
| 70 to 74 Years | 56 (6.8%) | 25 (3.0%) |
| 75 to 79 Years | 11 (1.3%) | 34 (4.0%) |
| 80 to 84 Years | 8 (1.0%) | 6 (0.7%) |
| 85 Years and over | 4 (0.5%) | 17 (2.0%) |
| Total | 830 (100.0%) | 842 (100.0%) |
Families and Households in Westville
Median Family Size in Westville
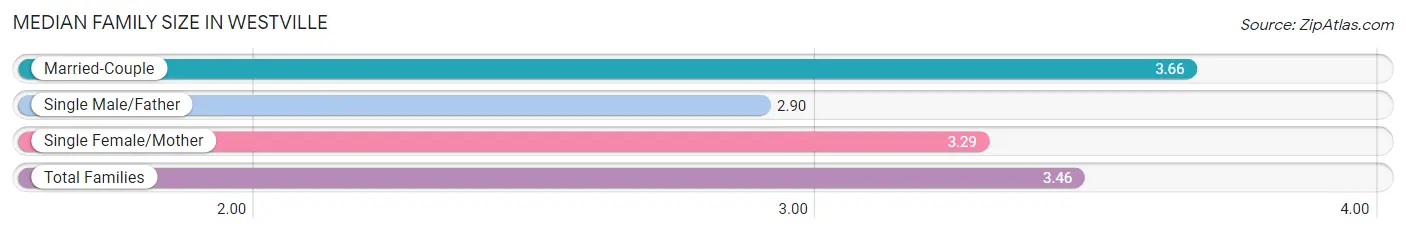
The median family size in Westville is 3.46 persons per family, with married-couple families (209 | 54.4%) accounting for the largest median family size of 3.66 persons per family. On the other hand, single male/father families (29 | 7.5%) represent the smallest median family size with 2.90 persons per family.
| Family Type | # Families | Family Size |
| Married-Couple | 209 (54.4%) | 3.66 |
| Single Male/Father | 29 (7.5%) | 2.90 |
| Single Female/Mother | 146 (38.0%) | 3.29 |
| Total Families | 384 (100.0%) | 3.46 |
Median Household Size in Westville
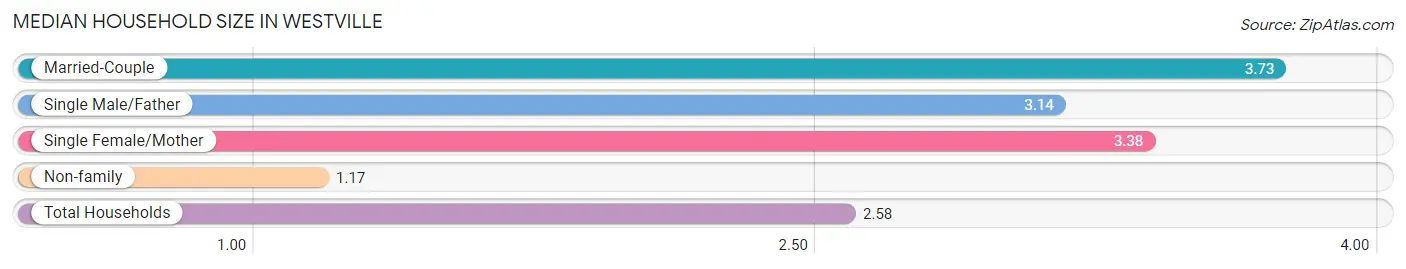
The median household size in Westville is 2.58 persons per household, with married-couple households (209 | 32.3%) accounting for the largest median household size of 3.73 persons per household. non-family households (264 | 40.7%) represent the smallest median household size with 1.17 persons per household.
| Household Type | # Households | Household Size |
| Married-Couple | 209 (32.3%) | 3.73 |
| Single Male/Father | 29 (4.5%) | 3.14 |
| Single Female/Mother | 146 (22.5%) | 3.38 |
| Non-family | 264 (40.7%) | 1.17 |
| Total Households | 648 (100.0%) | 2.58 |
Household Size by Marriage Status in Westville
Out of a total of 648 households in Westville, 384 (59.3%) are family households, while 264 (40.7%) are nonfamily households. The most numerous type of family households are 2-person households, comprising 178, and the most common type of nonfamily households are 1-person households, comprising 222.
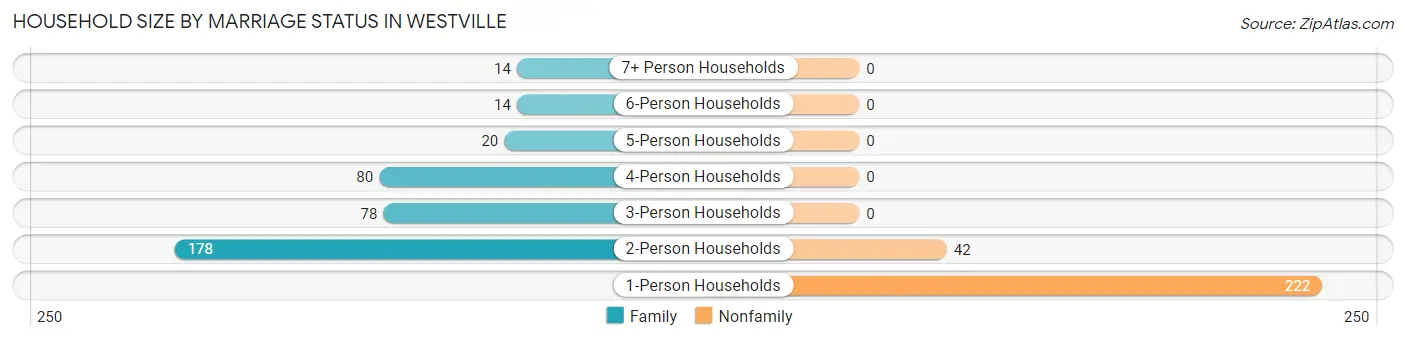
| Household Size | Family Households | Nonfamily Households |
| 1-Person Households | - | 222 (34.3%) |
| 2-Person Households | 178 (27.5%) | 42 (6.5%) |
| 3-Person Households | 78 (12.0%) | 0 (0.0%) |
| 4-Person Households | 80 (12.3%) | 0 (0.0%) |
| 5-Person Households | 20 (3.1%) | 0 (0.0%) |
| 6-Person Households | 14 (2.2%) | 0 (0.0%) |
| 7+ Person Households | 14 (2.2%) | 0 (0.0%) |
| Total | 384 (59.3%) | 264 (40.7%) |
Female Fertility in Westville
Fertility by Age in Westville
Average fertility rate in Westville is 52.0 births per 1,000 women. Women in the age bracket of 20 to 34 years have the highest fertility rate with 98.0 births per 1,000 women. Women in the age bracket of 20 to 34 years acount for 80.9% of all women with births.
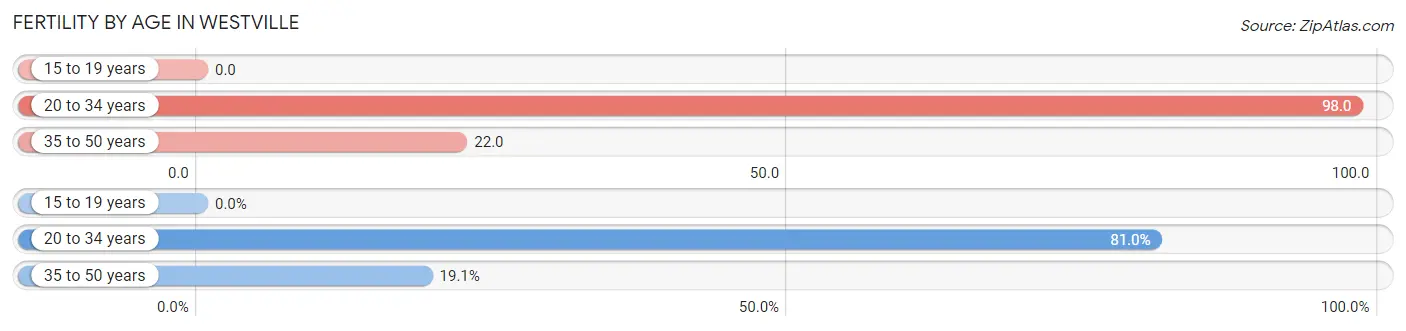
| Age Bracket | Women with Births | Births / 1,000 Women |
| 15 to 19 years | 0 (0.0%) | 0.0 |
| 20 to 34 years | 17 (80.9%) | 98.0 |
| 35 to 50 years | 4 (19.1%) | 22.0 |
| Total | 21 (100.0%) | 52.0 |
Fertility by Age by Marriage Status in Westville
61.9% of women with births (21) in Westville are married. The highest percentage of unmarried women with births falls into 35 to 50 years age bracket with 100.0% of them unmarried at the time of birth, while the lowest percentage of unmarried women with births belong to 20 to 34 years age bracket with 23.5% of them unmarried.
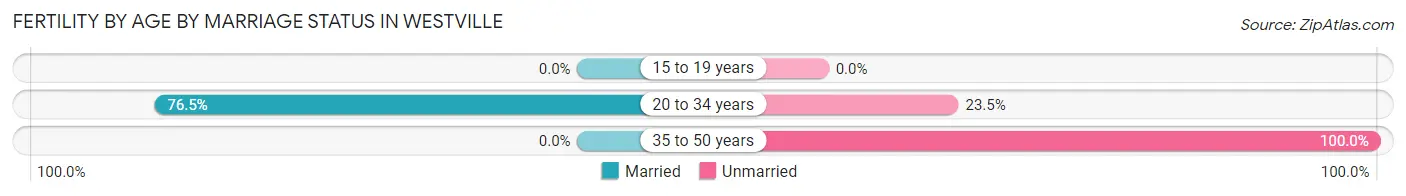
| Age Bracket | Married | Unmarried |
| 15 to 19 years | 0 (0.0%) | 0 (0.0%) |
| 20 to 34 years | 13 (76.5%) | 4 (23.5%) |
| 35 to 50 years | 0 (0.0%) | 4 (100.0%) |
| Total | 13 (61.9%) | 8 (38.1%) |
Fertility by Education in Westville
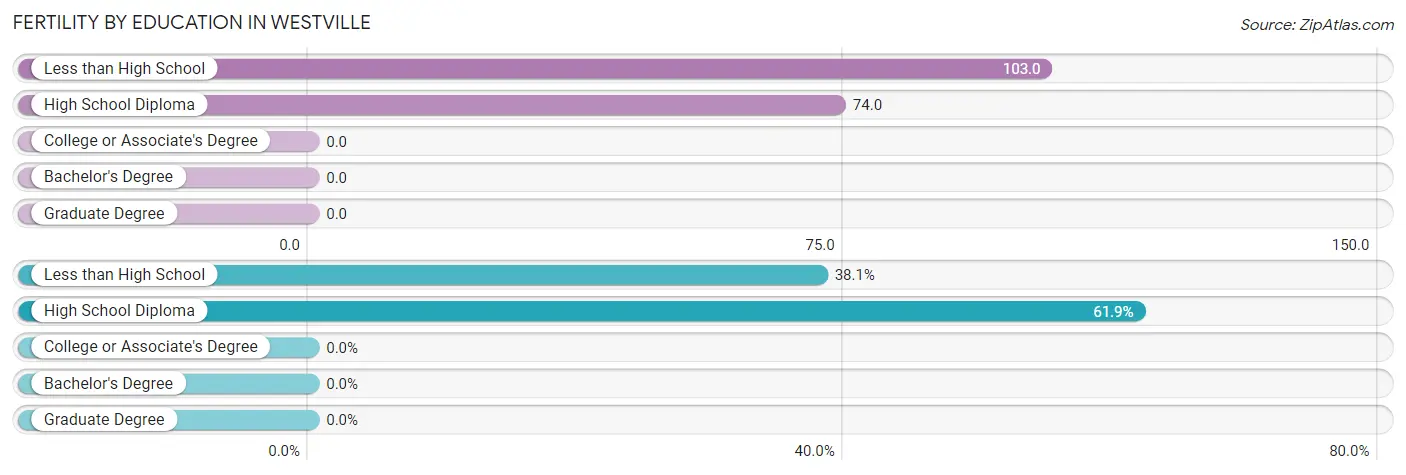
| Educational Attainment | Women with Births | Births / 1,000 Women |
| Less than High School | 8 (38.1%) | 103.0 |
| High School Diploma | 13 (61.9%) | 74.0 |
| College or Associate's Degree | 0 (0.0%) | 0.0 |
| Bachelor's Degree | 0 (0.0%) | 0.0 |
| Graduate Degree | 0 (0.0%) | 0.0 |
| Total | 21 (100.0%) | 52.0 |
Fertility by Education by Marriage Status in Westville
38.1% of women with births in Westville are unmarried. Women with the educational attainment of high school diploma are most likely to be married with 69.2% of them married at childbirth, while women with the educational attainment of less than high school are least likely to be married with 50.0% of them unmarried at childbirth.
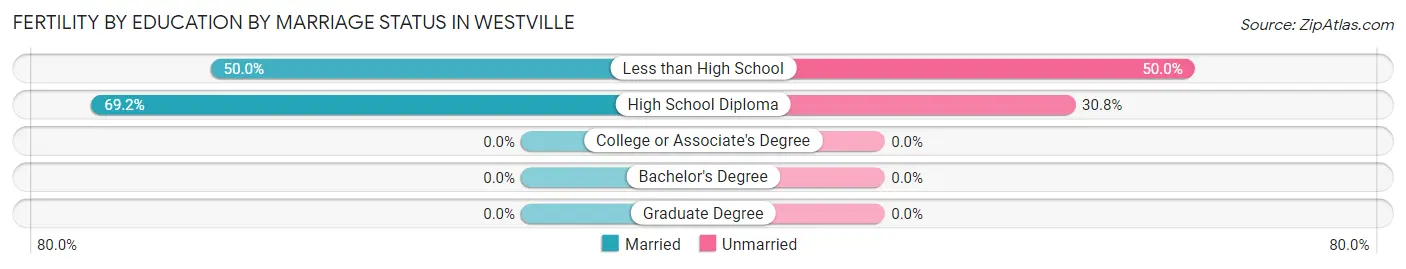
| Educational Attainment | Married | Unmarried |
| Less than High School | 4 (50.0%) | 4 (50.0%) |
| High School Diploma | 9 (69.2%) | 4 (30.8%) |
| College or Associate's Degree | 0 (0.0%) | 0 (0.0%) |
| Bachelor's Degree | 0 (0.0%) | 0 (0.0%) |
| Graduate Degree | 0 (0.0%) | 0 (0.0%) |
| Total | 13 (61.9%) | 8 (38.1%) |
Employment Characteristics in Westville
Employment by Class of Employer in Westville
Among the 544 employed individuals in Westville, private company employees (417 | 76.6%), local government employees (39 | 7.2%), and self-employed (not incorporated) (24 | 4.4%) make up the most common classes of employment.
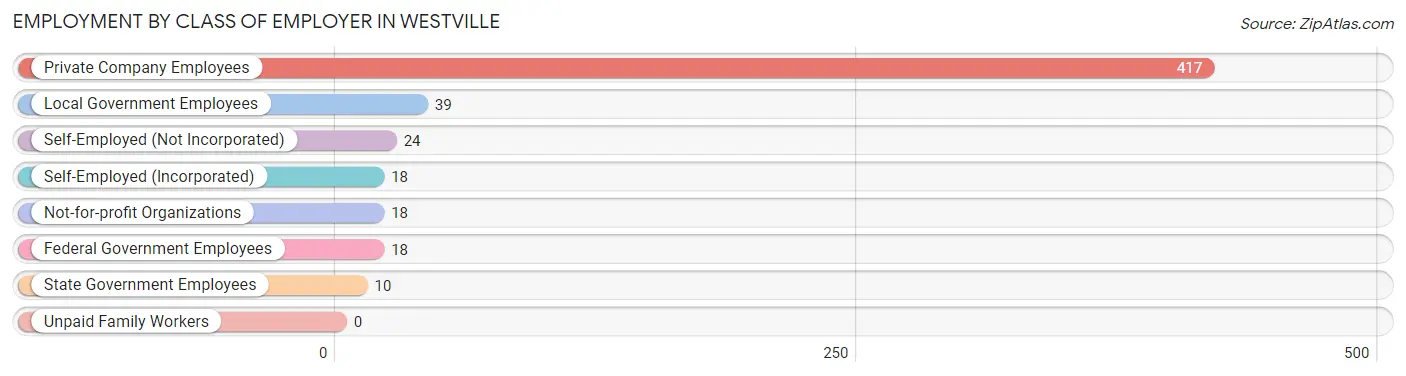
| Employer Class | # Employees | % Employees |
| Private Company Employees | 417 | 76.6% |
| Self-Employed (Incorporated) | 18 | 3.3% |
| Self-Employed (Not Incorporated) | 24 | 4.4% |
| Not-for-profit Organizations | 18 | 3.3% |
| Local Government Employees | 39 | 7.2% |
| State Government Employees | 10 | 1.8% |
| Federal Government Employees | 18 | 3.3% |
| Unpaid Family Workers | 0 | 0.0% |
| Total | 544 | 100.0% |
Employment Status by Age in Westville
According to the labor force statistics for Westville, out of the total population over 16 years of age (1,269), 49.8% or 632 individuals are in the labor force, with 10.9% or 69 of them unemployed. The age group with the highest labor force participation rate is 20 to 24 years, with 89.6% or 86 individuals in the labor force. Within the labor force, the 35 to 44 years age range has the highest percentage of unemployed individuals, with 22.0% or 35 of them being unemployed.
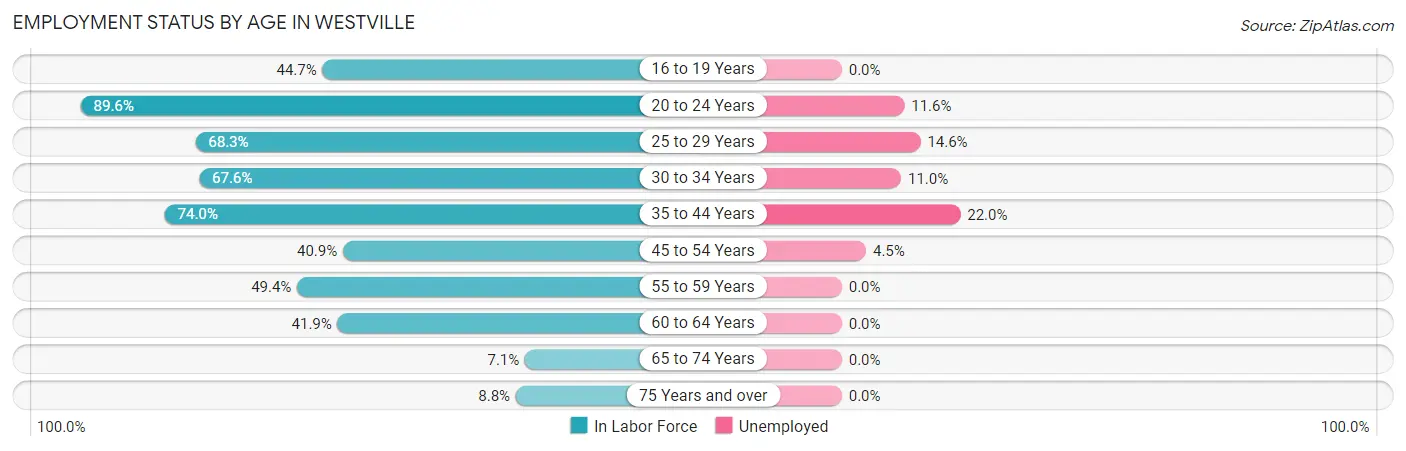
| Age Bracket | In Labor Force | Unemployed |
| 16 to 19 Years | 46 (44.7%) | 0 (0.0%) |
| 20 to 24 Years | 86 (89.6%) | 10 (11.6%) |
| 25 to 29 Years | 82 (68.3%) | 12 (14.6%) |
| 30 to 34 Years | 73 (67.6%) | 8 (11.0%) |
| 35 to 44 Years | 159 (74.0%) | 35 (22.0%) |
| 45 to 54 Years | 88 (40.9%) | 4 (4.5%) |
| 55 to 59 Years | 41 (49.4%) | 0 (0.0%) |
| 60 to 64 Years | 39 (41.9%) | 0 (0.0%) |
| 65 to 74 Years | 11 (7.1%) | 0 (0.0%) |
| 75 Years and over | 7 (8.8%) | 0 (0.0%) |
| Total | 632 (49.8%) | 69 (10.9%) |
Employment Status by Educational Attainment in Westville
According to labor force statistics for Westville, 57.8% of individuals (482) out of the total population between 25 and 64 years of age (834) are in the labor force, with 12.2% or 59 of them being unemployed. The group with the highest labor force participation rate are those with the educational attainment of bachelor's degree or higher, with 95.1% or 78 individuals in the labor force. Within the labor force, individuals with high school diploma education have the highest percentage of unemployment, with 16.2% or 36 of them being unemployed.
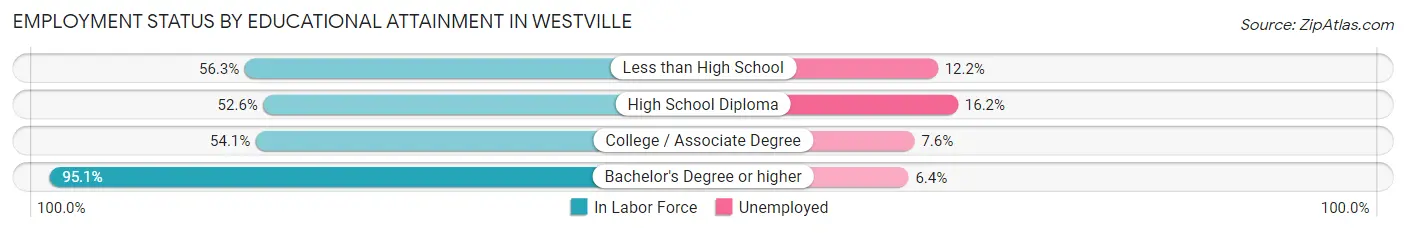
| Educational Attainment | In Labor Force | Unemployed |
| Less than High School | 90 (56.3%) | 20 (12.2%) |
| High School Diploma | 222 (52.6%) | 68 (16.2%) |
| College / Associate Degree | 92 (54.1%) | 13 (7.6%) |
| Bachelor's Degree or higher | 78 (95.1%) | 5 (6.4%) |
| Total | 482 (57.8%) | 102 (12.2%) |
Employment Occupations by Sex in Westville
Management, Business, Science and Arts Occupations
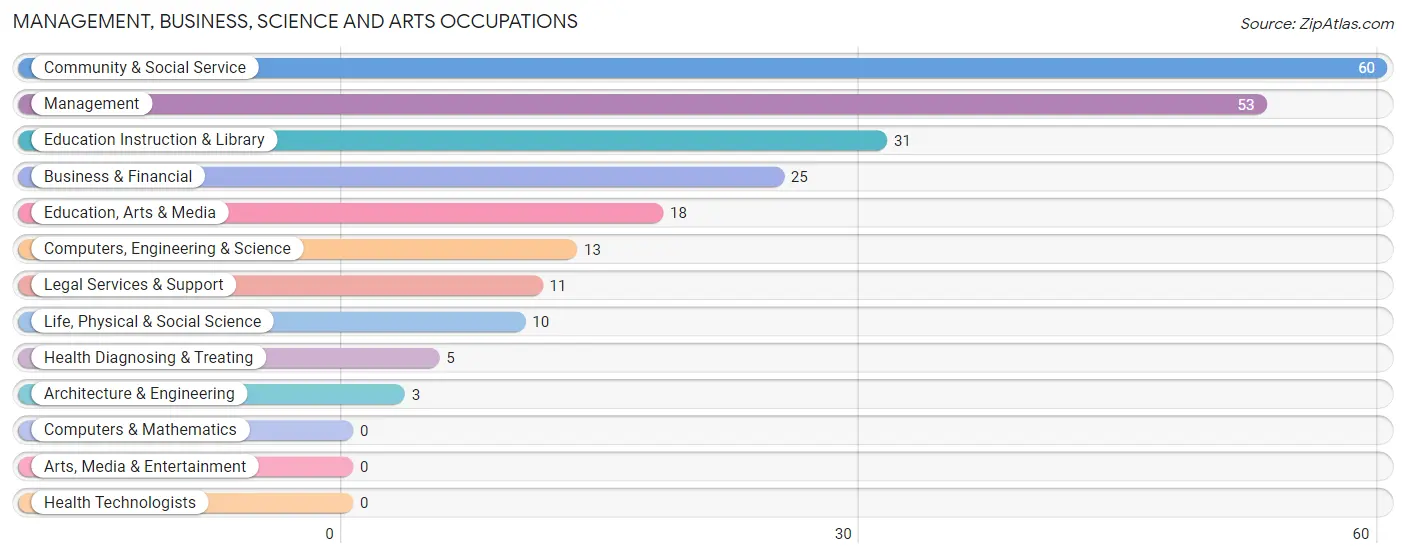
The most common Management, Business, Science and Arts occupations in Westville are Community & Social Service (60 | 10.7%), Management (53 | 9.4%), Education Instruction & Library (31 | 5.5%), Business & Financial (25 | 4.4%), and Education, Arts & Media (18 | 3.2%).
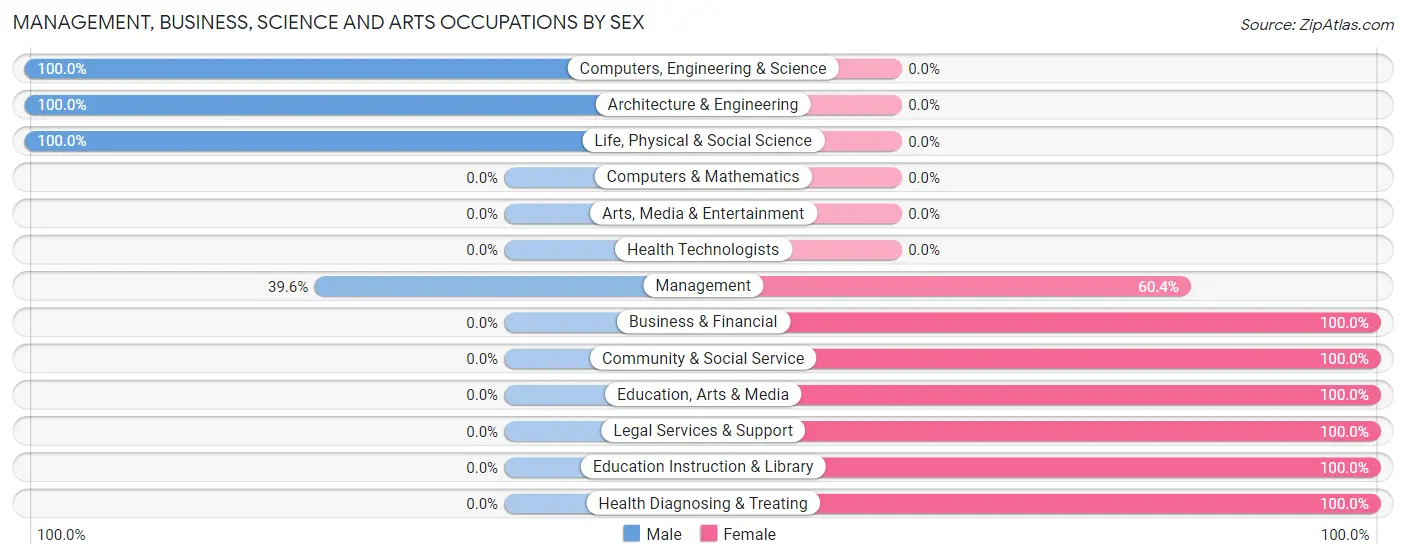
Management, Business, Science and Arts Occupations by Sex
Within the Management, Business, Science and Arts occupations in Westville, the most male-oriented occupations are Computers, Engineering & Science (100.0%), Architecture & Engineering (100.0%), and Life, Physical & Social Science (100.0%), while the most female-oriented occupations are Business & Financial (100.0%), Community & Social Service (100.0%), and Education, Arts & Media (100.0%).
| Occupation | Male | Female |
| Management | 21 (39.6%) | 32 (60.4%) |
| Business & Financial | 0 (0.0%) | 25 (100.0%) |
| Computers, Engineering & Science | 13 (100.0%) | 0 (0.0%) |
| Computers & Mathematics | 0 (0.0%) | 0 (0.0%) |
| Architecture & Engineering | 3 (100.0%) | 0 (0.0%) |
| Life, Physical & Social Science | 10 (100.0%) | 0 (0.0%) |
| Community & Social Service | 0 (0.0%) | 60 (100.0%) |
| Education, Arts & Media | 0 (0.0%) | 18 (100.0%) |
| Legal Services & Support | 0 (0.0%) | 11 (100.0%) |
| Education Instruction & Library | 0 (0.0%) | 31 (100.0%) |
| Arts, Media & Entertainment | 0 (0.0%) | 0 (0.0%) |
| Health Diagnosing & Treating | 0 (0.0%) | 5 (100.0%) |
| Health Technologists | 0 (0.0%) | 0 (0.0%) |
| Total (Category) | 34 (21.8%) | 122 (78.2%) |
| Total (Overall) | 253 (44.9%) | 310 (55.1%) |
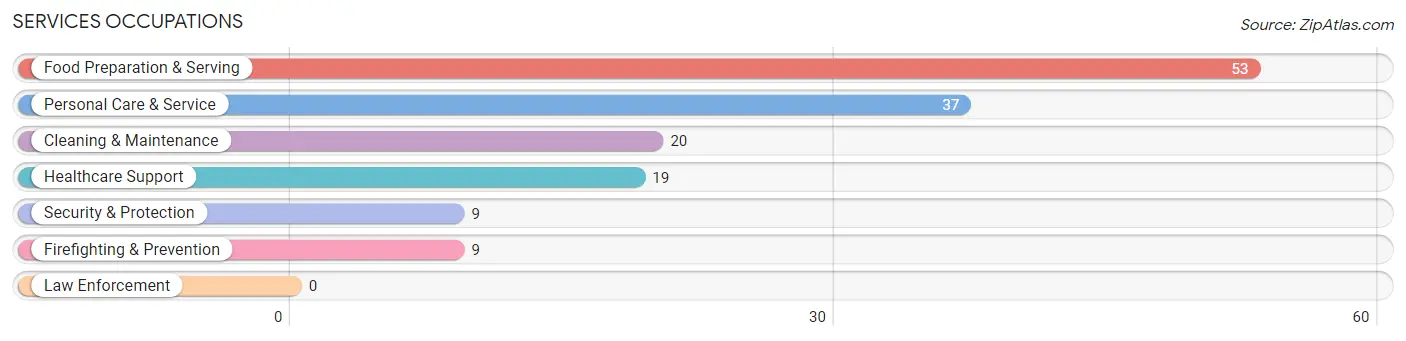
Services Occupations
The most common Services occupations in Westville are Food Preparation & Serving (53 | 9.4%), Personal Care & Service (37 | 6.6%), Cleaning & Maintenance (20 | 3.5%), Healthcare Support (19 | 3.4%), and Security & Protection (9 | 1.6%).
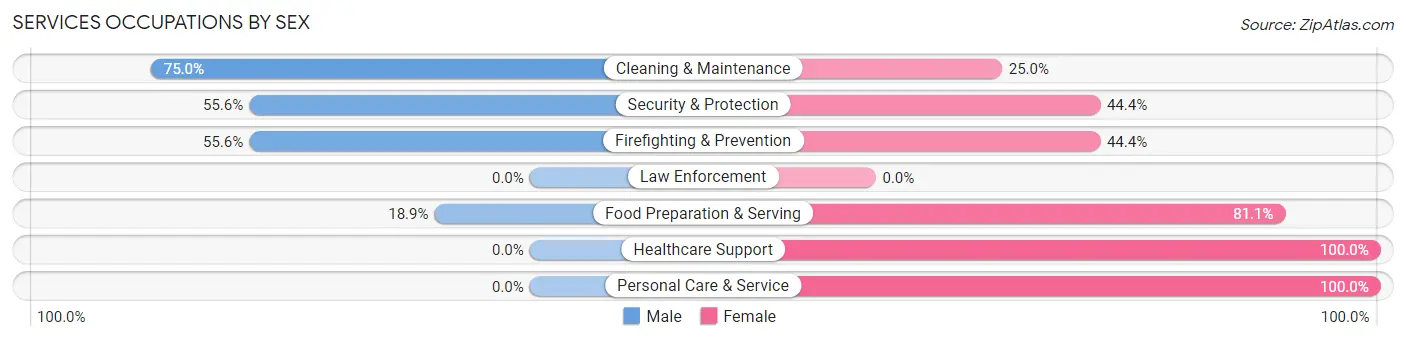
Services Occupations by Sex
Within the Services occupations in Westville, the most male-oriented occupations are Cleaning & Maintenance (75.0%), Security & Protection (55.6%), and Firefighting & Prevention (55.6%), while the most female-oriented occupations are Healthcare Support (100.0%), Personal Care & Service (100.0%), and Food Preparation & Serving (81.1%).
| Occupation | Male | Female |
| Healthcare Support | 0 (0.0%) | 19 (100.0%) |
| Security & Protection | 5 (55.6%) | 4 (44.4%) |
| Firefighting & Prevention | 5 (55.6%) | 4 (44.4%) |
| Law Enforcement | 0 (0.0%) | 0 (0.0%) |
| Food Preparation & Serving | 10 (18.9%) | 43 (81.1%) |
| Cleaning & Maintenance | 15 (75.0%) | 5 (25.0%) |
| Personal Care & Service | 0 (0.0%) | 37 (100.0%) |
| Total (Category) | 30 (21.7%) | 108 (78.3%) |
| Total (Overall) | 253 (44.9%) | 310 (55.1%) |
Sales and Office Occupations
The most common Sales and Office occupations in Westville are Sales & Related (34 | 6.0%), and Office & Administration (32 | 5.7%).

Sales and Office Occupations by Sex

| Occupation | Male | Female |
| Sales & Related | 9 (26.5%) | 25 (73.5%) |
| Office & Administration | 5 (15.6%) | 27 (84.4%) |
| Total (Category) | 14 (21.2%) | 52 (78.8%) |
| Total (Overall) | 253 (44.9%) | 310 (55.1%) |
Natural Resources, Construction and Maintenance Occupations
The most common Natural Resources, Construction and Maintenance occupations in Westville are Construction & Extraction (33 | 5.9%), and Installation, Maintenance & Repair (21 | 3.7%).

Natural Resources, Construction and Maintenance Occupations by Sex
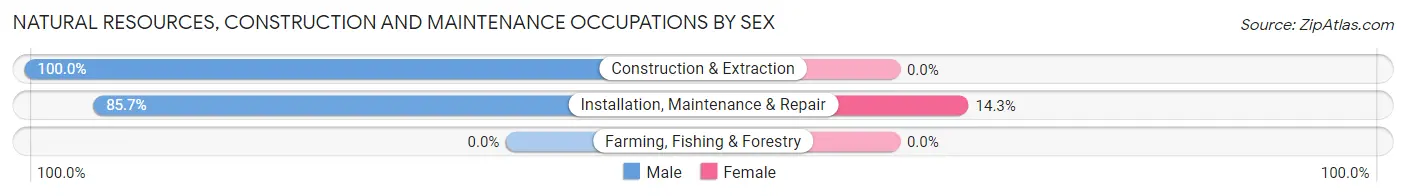
| Occupation | Male | Female |
| Farming, Fishing & Forestry | 0 (0.0%) | 0 (0.0%) |
| Construction & Extraction | 33 (100.0%) | 0 (0.0%) |
| Installation, Maintenance & Repair | 18 (85.7%) | 3 (14.3%) |
| Total (Category) | 51 (94.4%) | 3 (5.6%) |
| Total (Overall) | 253 (44.9%) | 310 (55.1%) |
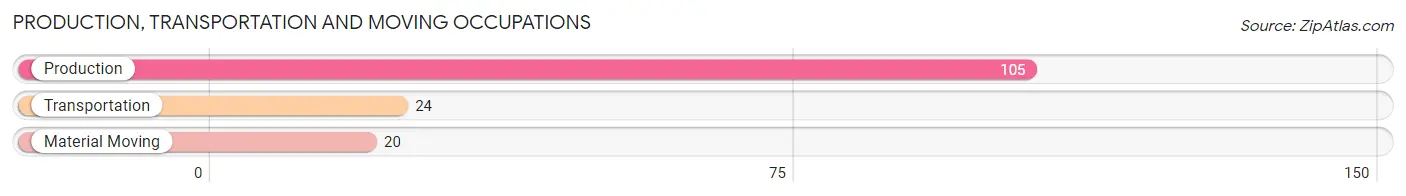
Production, Transportation and Moving Occupations
The most common Production, Transportation and Moving occupations in Westville are Production (105 | 18.6%), Transportation (24 | 4.3%), and Material Moving (20 | 3.5%).
Production, Transportation and Moving Occupations by Sex
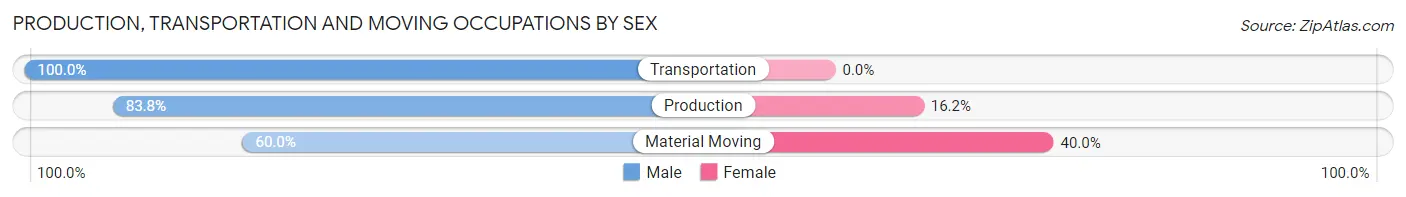
| Occupation | Male | Female |
| Production | 88 (83.8%) | 17 (16.2%) |
| Transportation | 24 (100.0%) | 0 (0.0%) |
| Material Moving | 12 (60.0%) | 8 (40.0%) |
| Total (Category) | 124 (83.2%) | 25 (16.8%) |
| Total (Overall) | 253 (44.9%) | 310 (55.1%) |
Employment Industries by Sex in Westville
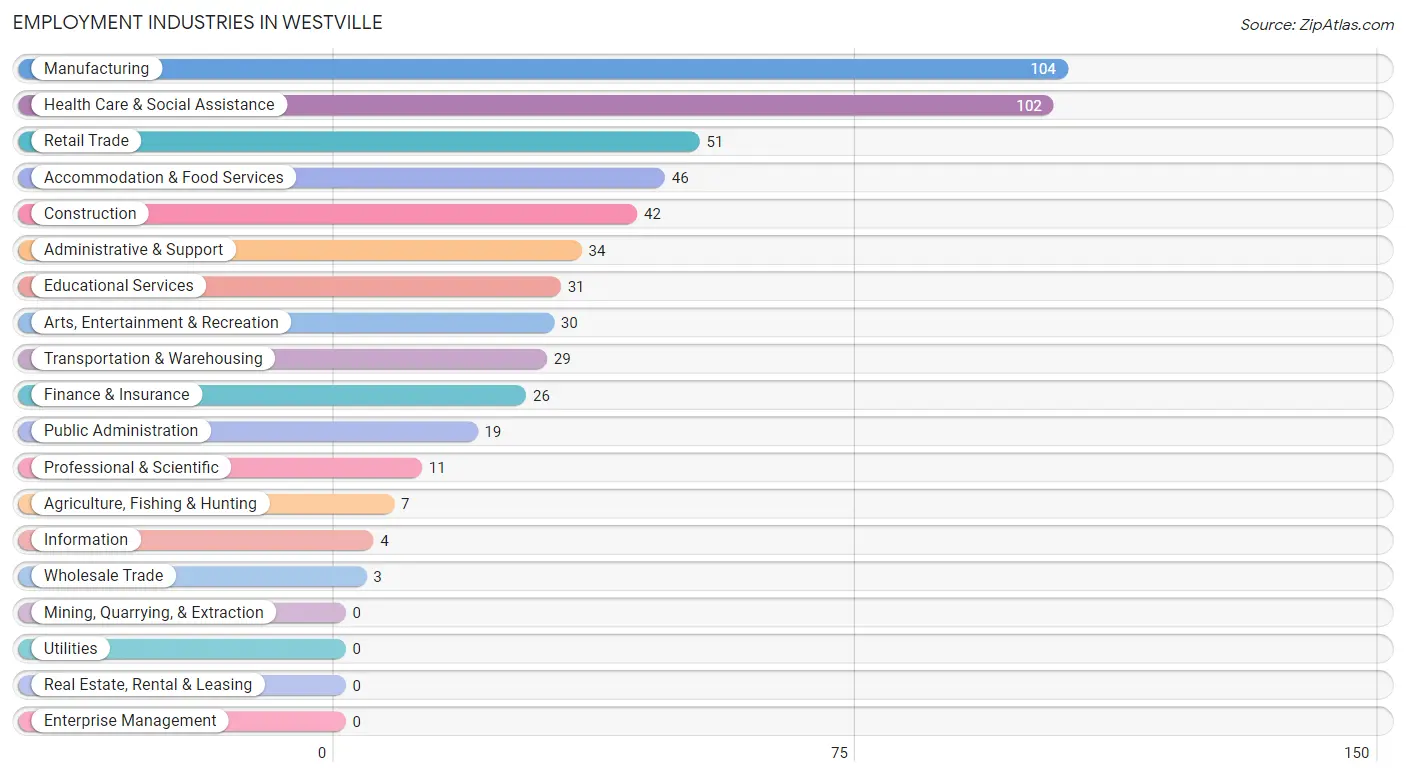
Employment Industries in Westville
The major employment industries in Westville include Manufacturing (104 | 18.5%), Health Care & Social Assistance (102 | 18.1%), Retail Trade (51 | 9.1%), Accommodation & Food Services (46 | 8.2%), and Construction (42 | 7.5%).
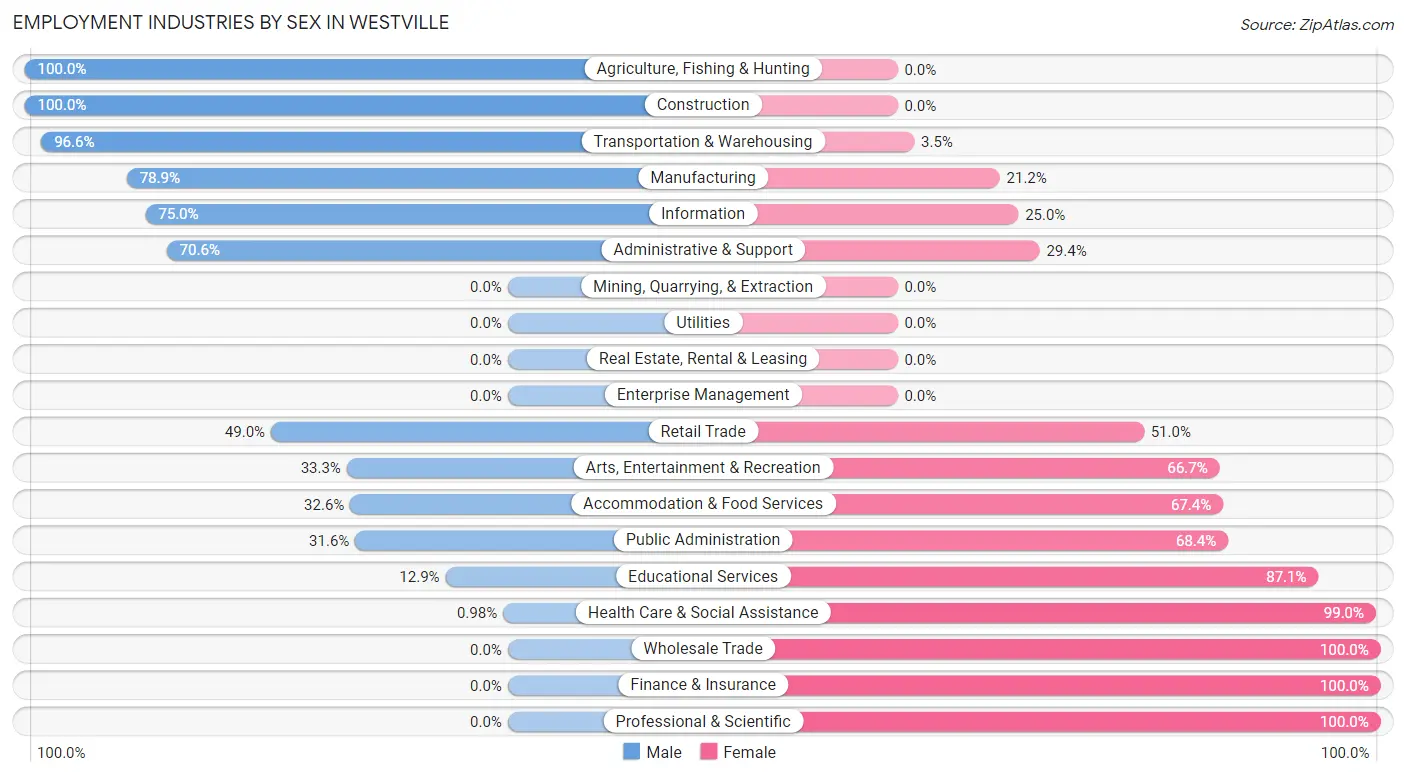
Employment Industries by Sex in Westville
The Westville industries that see more men than women are Agriculture, Fishing & Hunting (100.0%), Construction (100.0%), and Transportation & Warehousing (96.6%), whereas the industries that tend to have a higher number of women are Wholesale Trade (100.0%), Finance & Insurance (100.0%), and Professional & Scientific (100.0%).
| Industry | Male | Female |
| Agriculture, Fishing & Hunting | 7 (100.0%) | 0 (0.0%) |
| Mining, Quarrying, & Extraction | 0 (0.0%) | 0 (0.0%) |
| Construction | 42 (100.0%) | 0 (0.0%) |
| Manufacturing | 82 (78.8%) | 22 (21.1%) |
| Wholesale Trade | 0 (0.0%) | 3 (100.0%) |
| Retail Trade | 25 (49.0%) | 26 (51.0%) |
| Transportation & Warehousing | 28 (96.6%) | 1 (3.5%) |
| Utilities | 0 (0.0%) | 0 (0.0%) |
| Information | 3 (75.0%) | 1 (25.0%) |
| Finance & Insurance | 0 (0.0%) | 26 (100.0%) |
| Real Estate, Rental & Leasing | 0 (0.0%) | 0 (0.0%) |
| Professional & Scientific | 0 (0.0%) | 11 (100.0%) |
| Enterprise Management | 0 (0.0%) | 0 (0.0%) |
| Administrative & Support | 24 (70.6%) | 10 (29.4%) |
| Educational Services | 4 (12.9%) | 27 (87.1%) |
| Health Care & Social Assistance | 1 (1.0%) | 101 (99.0%) |
| Arts, Entertainment & Recreation | 10 (33.3%) | 20 (66.7%) |
| Accommodation & Food Services | 15 (32.6%) | 31 (67.4%) |
| Public Administration | 6 (31.6%) | 13 (68.4%) |
| Total | 253 (44.9%) | 310 (55.1%) |
Education in Westville
School Enrollment in Westville
The most common levels of schooling among the 348 students in Westville are high school (91 | 26.2%), elementary school (79 | 22.7%), and middle school (78 | 22.4%).
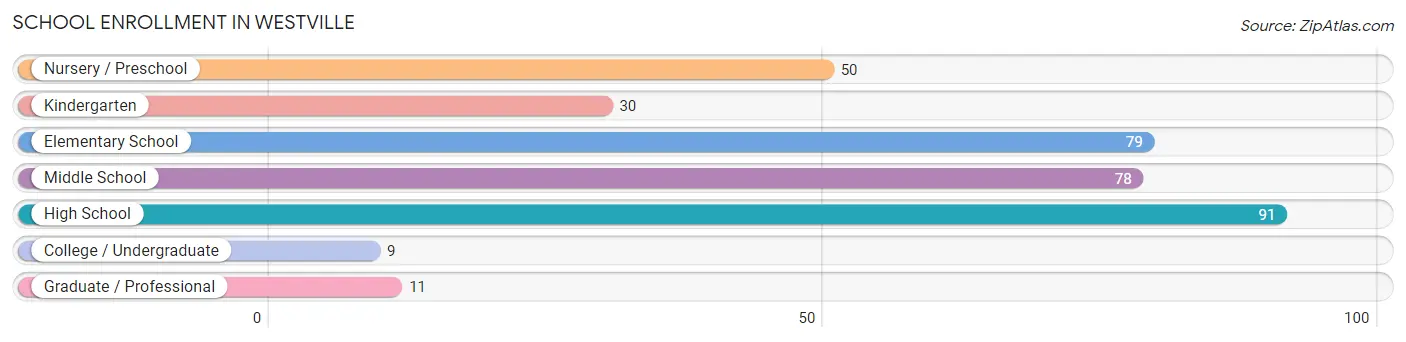
| School Level | # Students | % Students |
| Nursery / Preschool | 50 | 14.4% |
| Kindergarten | 30 | 8.6% |
| Elementary School | 79 | 22.7% |
| Middle School | 78 | 22.4% |
| High School | 91 | 26.2% |
| College / Undergraduate | 9 | 2.6% |
| Graduate / Professional | 11 | 3.2% |
| Total | 348 | 100.0% |
School Enrollment by Age by Funding Source in Westville
Out of a total of 348 students who are enrolled in schools in Westville, 21 (6.0%) attend a private institution, while the remaining 327 (94.0%) are enrolled in public schools. The age group of 20 to 24 year olds has the highest likelihood of being enrolled in private schools, with 11 (52.4% in the age bracket) enrolled. Conversely, the age group of 3 to 4 year olds has the lowest likelihood of being enrolled in a private school, with 13 (100.0% in the age bracket) attending a public institution.
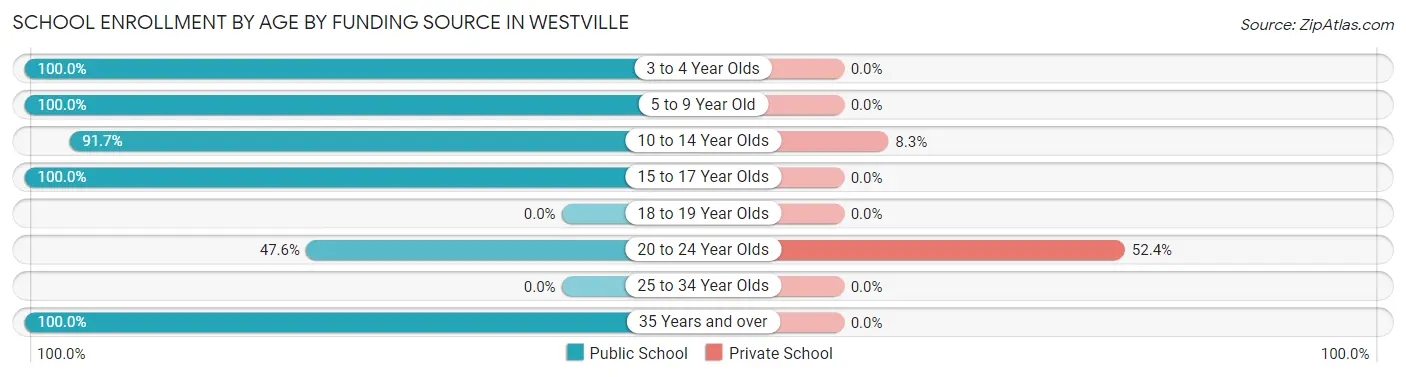
| Age Bracket | Public School | Private School |
| 3 to 4 Year Olds | 13 (100.0%) | 0 (0.0%) |
| 5 to 9 Year Old | 117 (100.0%) | 0 (0.0%) |
| 10 to 14 Year Olds | 110 (91.7%) | 10 (8.3%) |
| 15 to 17 Year Olds | 73 (100.0%) | 0 (0.0%) |
| 18 to 19 Year Olds | 0 (0.0%) | 0 (0.0%) |
| 20 to 24 Year Olds | 10 (47.6%) | 11 (52.4%) |
| 25 to 34 Year Olds | 0 (0.0%) | 0 (0.0%) |
| 35 Years and over | 4 (100.0%) | 0 (0.0%) |
| Total | 327 (94.0%) | 21 (6.0%) |
Educational Attainment by Field of Study in Westville
Education (25 | 25.8%), science & technology (19 | 19.6%), psychology (15 | 15.5%), arts & humanities (13 | 13.4%), and business (9 | 9.3%) are the most common fields of study among 97 individuals in Westville who have obtained a bachelor's degree or higher.
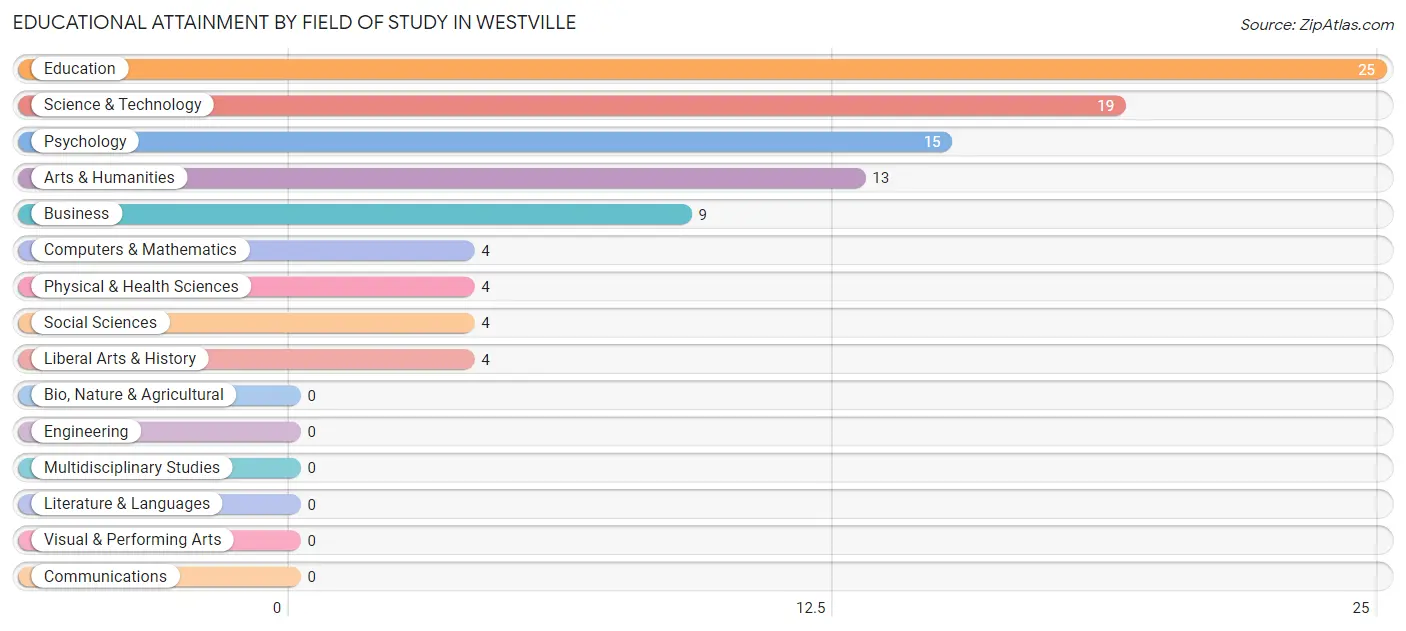
| Field of Study | # Graduates | % Graduates |
| Computers & Mathematics | 4 | 4.1% |
| Bio, Nature & Agricultural | 0 | 0.0% |
| Physical & Health Sciences | 4 | 4.1% |
| Psychology | 15 | 15.5% |
| Social Sciences | 4 | 4.1% |
| Engineering | 0 | 0.0% |
| Multidisciplinary Studies | 0 | 0.0% |
| Science & Technology | 19 | 19.6% |
| Business | 9 | 9.3% |
| Education | 25 | 25.8% |
| Literature & Languages | 0 | 0.0% |
| Liberal Arts & History | 4 | 4.1% |
| Visual & Performing Arts | 0 | 0.0% |
| Communications | 0 | 0.0% |
| Arts & Humanities | 13 | 13.4% |
| Total | 97 | 100.0% |
Transportation & Commute in Westville
Vehicle Availability by Sex in Westville
The most prevalent vehicle ownership categories in Westville are males with 3 vehicles (86, accounting for 35.4%) and females with 3 vehicles (76, making up 28.6%).
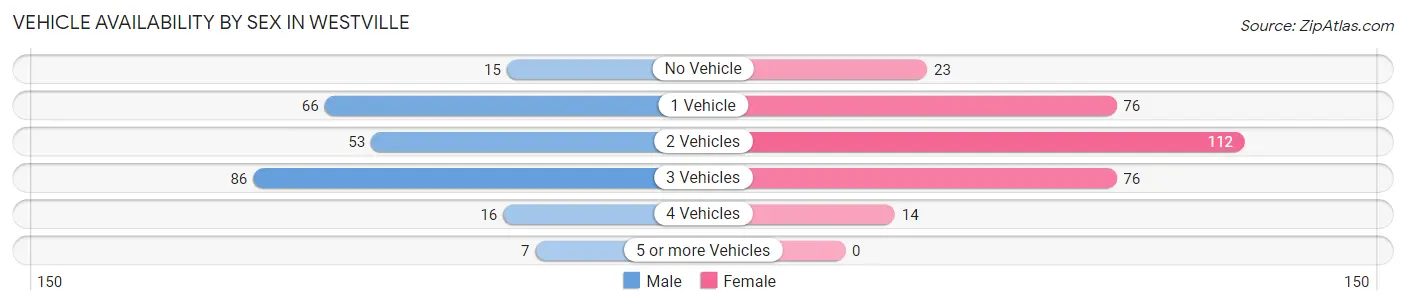
| Vehicles Available | Male | Female |
| No Vehicle | 15 (6.2%) | 23 (7.6%) |
| 1 Vehicle | 66 (27.2%) | 76 (25.3%) |
| 2 Vehicles | 53 (21.8%) | 112 (37.2%) |
| 3 Vehicles | 86 (35.4%) | 76 (25.3%) |
| 4 Vehicles | 16 (6.6%) | 14 (4.6%) |
| 5 or more Vehicles | 7 (2.9%) | 0 (0.0%) |
| Total | 243 (100.0%) | 301 (100.0%) |
Commute Time in Westville
The most frequently occuring commute durations in Westville are 30 to 34 minutes (82 commuters, 15.5%), 5 to 9 minutes (80 commuters, 15.1%), and 45 to 59 minutes (80 commuters, 15.1%).
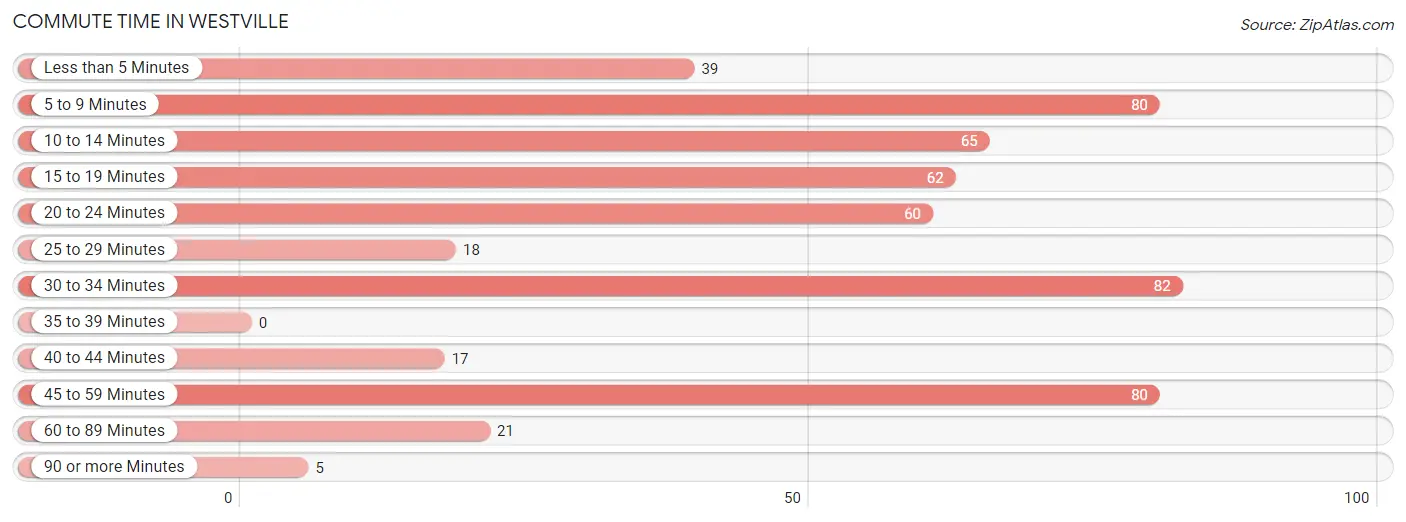
| Commute Time | # Commuters | % Commuters |
| Less than 5 Minutes | 39 | 7.4% |
| 5 to 9 Minutes | 80 | 15.1% |
| 10 to 14 Minutes | 65 | 12.3% |
| 15 to 19 Minutes | 62 | 11.7% |
| 20 to 24 Minutes | 60 | 11.3% |
| 25 to 29 Minutes | 18 | 3.4% |
| 30 to 34 Minutes | 82 | 15.5% |
| 35 to 39 Minutes | 0 | 0.0% |
| 40 to 44 Minutes | 17 | 3.2% |
| 45 to 59 Minutes | 80 | 15.1% |
| 60 to 89 Minutes | 21 | 4.0% |
| 90 or more Minutes | 5 | 0.9% |
Commute Time by Sex in Westville
The most common commute times in Westville are 45 to 59 minutes (56 commuters, 23.1%) for males and 30 to 34 minutes (62 commuters, 21.7%) for females.
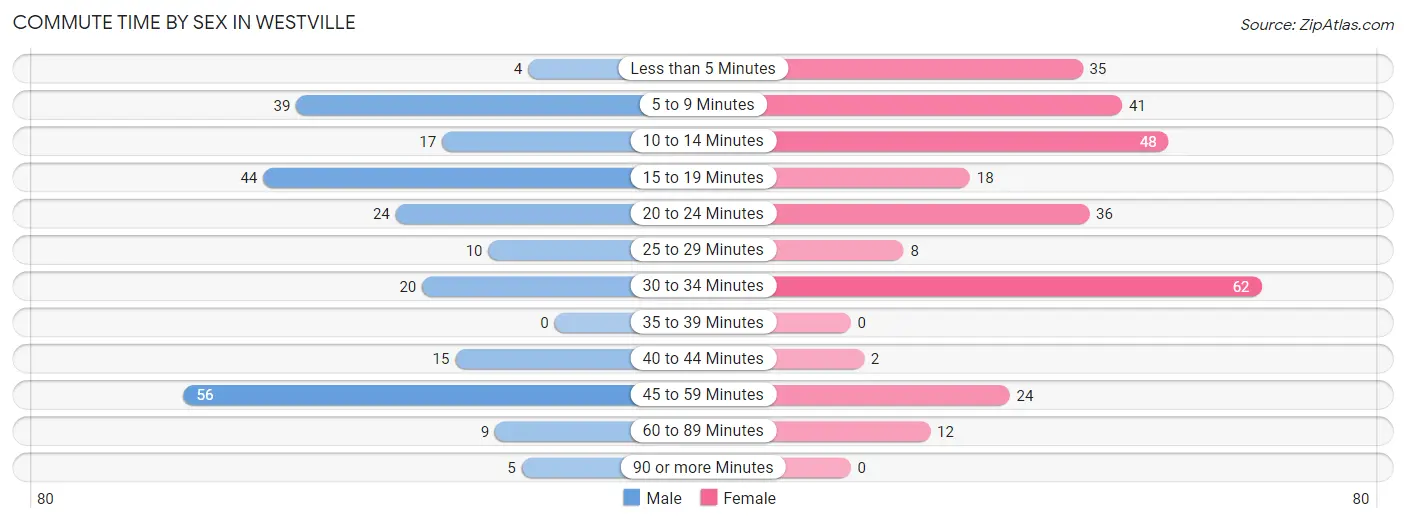
| Commute Time | Male | Female |
| Less than 5 Minutes | 4 (1.7%) | 35 (12.2%) |
| 5 to 9 Minutes | 39 (16.1%) | 41 (14.3%) |
| 10 to 14 Minutes | 17 (7.0%) | 48 (16.8%) |
| 15 to 19 Minutes | 44 (18.1%) | 18 (6.3%) |
| 20 to 24 Minutes | 24 (9.9%) | 36 (12.6%) |
| 25 to 29 Minutes | 10 (4.1%) | 8 (2.8%) |
| 30 to 34 Minutes | 20 (8.2%) | 62 (21.7%) |
| 35 to 39 Minutes | 0 (0.0%) | 0 (0.0%) |
| 40 to 44 Minutes | 15 (6.2%) | 2 (0.7%) |
| 45 to 59 Minutes | 56 (23.1%) | 24 (8.4%) |
| 60 to 89 Minutes | 9 (3.7%) | 12 (4.2%) |
| 90 or more Minutes | 5 (2.1%) | 0 (0.0%) |
Time of Departure to Work by Sex in Westville
The most frequent times of departure to work in Westville are 4:00 PM to 11:59 PM (60, 24.7%) for males and 7:30 AM to 7:59 AM (47, 16.4%) for females.
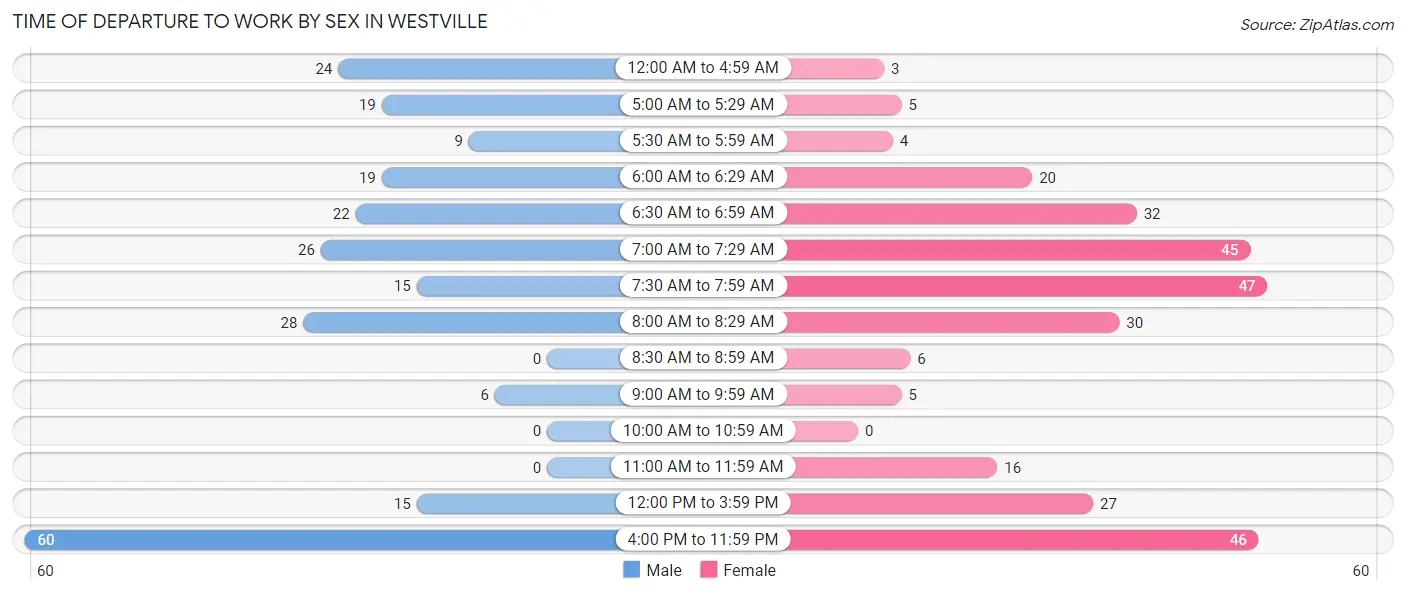
| Time of Departure | Male | Female |
| 12:00 AM to 4:59 AM | 24 (9.9%) | 3 (1.1%) |
| 5:00 AM to 5:29 AM | 19 (7.8%) | 5 (1.8%) |
| 5:30 AM to 5:59 AM | 9 (3.7%) | 4 (1.4%) |
| 6:00 AM to 6:29 AM | 19 (7.8%) | 20 (7.0%) |
| 6:30 AM to 6:59 AM | 22 (9.0%) | 32 (11.2%) |
| 7:00 AM to 7:29 AM | 26 (10.7%) | 45 (15.7%) |
| 7:30 AM to 7:59 AM | 15 (6.2%) | 47 (16.4%) |
| 8:00 AM to 8:29 AM | 28 (11.5%) | 30 (10.5%) |
| 8:30 AM to 8:59 AM | 0 (0.0%) | 6 (2.1%) |
| 9:00 AM to 9:59 AM | 6 (2.5%) | 5 (1.8%) |
| 10:00 AM to 10:59 AM | 0 (0.0%) | 0 (0.0%) |
| 11:00 AM to 11:59 AM | 0 (0.0%) | 16 (5.6%) |
| 12:00 PM to 3:59 PM | 15 (6.2%) | 27 (9.4%) |
| 4:00 PM to 11:59 PM | 60 (24.7%) | 46 (16.1%) |
| Total | 243 (100.0%) | 286 (100.0%) |
Housing Occupancy in Westville
Occupancy by Ownership in Westville
Of the total 648 dwellings in Westville, owner-occupied units account for 292 (45.1%), while renter-occupied units make up 356 (54.9%).
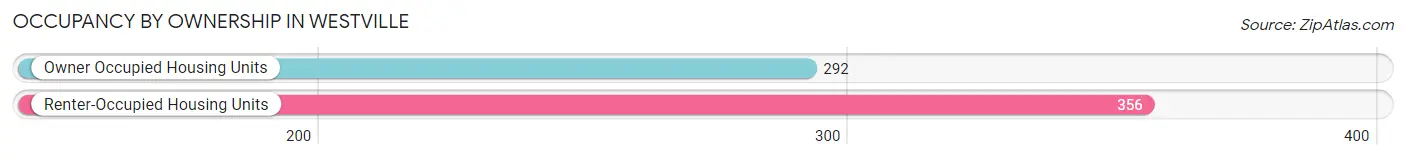
| Occupancy | # Housing Units | % Housing Units |
| Owner Occupied Housing Units | 292 | 45.1% |
| Renter-Occupied Housing Units | 356 | 54.9% |
| Total Occupied Housing Units | 648 | 100.0% |
Occupancy by Household Size in Westville
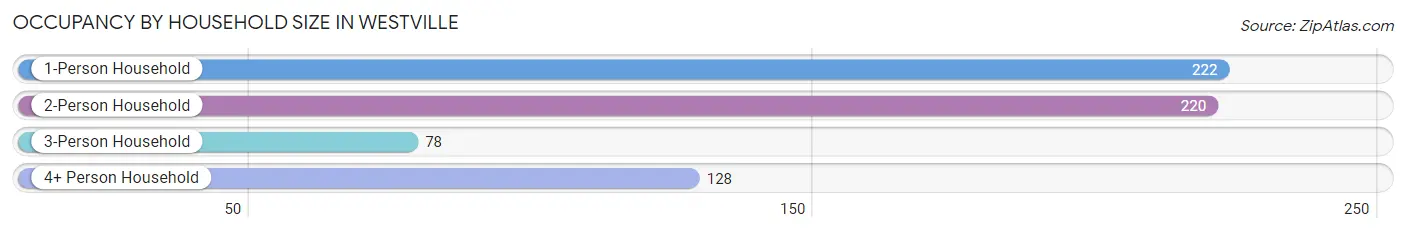
| Household Size | # Housing Units | % Housing Units |
| 1-Person Household | 222 | 34.3% |
| 2-Person Household | 220 | 34.0% |
| 3-Person Household | 78 | 12.0% |
| 4+ Person Household | 128 | 19.8% |
| Total Housing Units | 648 | 100.0% |
Occupancy by Ownership by Household Size in Westville
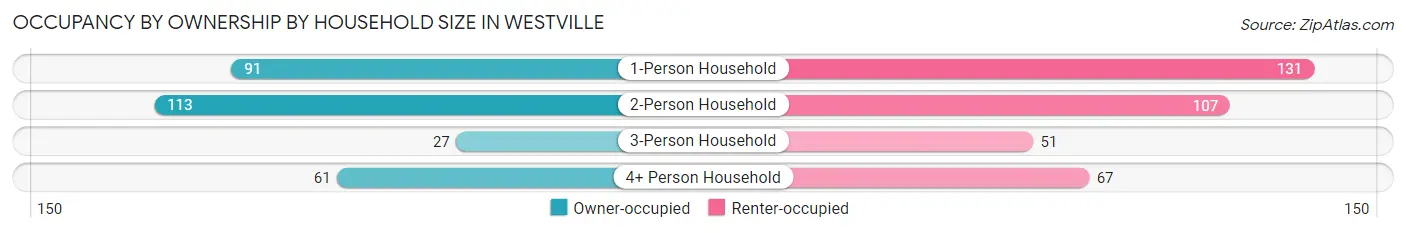
| Household Size | Owner-occupied | Renter-occupied |
| 1-Person Household | 91 (41.0%) | 131 (59.0%) |
| 2-Person Household | 113 (51.4%) | 107 (48.6%) |
| 3-Person Household | 27 (34.6%) | 51 (65.4%) |
| 4+ Person Household | 61 (47.7%) | 67 (52.3%) |
| Total Housing Units | 292 (45.1%) | 356 (54.9%) |
Occupancy by Educational Attainment in Westville
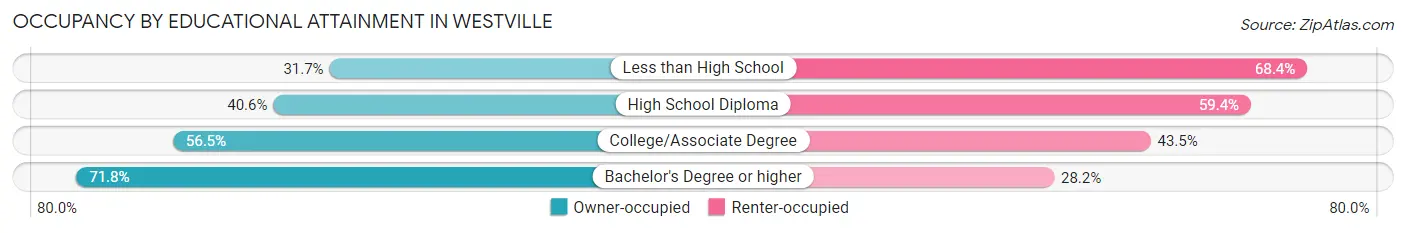
| Household Size | Owner-occupied | Renter-occupied |
| Less than High School | 44 (31.7%) | 95 (68.3%) |
| High School Diploma | 131 (40.6%) | 192 (59.4%) |
| College/Associate Degree | 61 (56.5%) | 47 (43.5%) |
| Bachelor's Degree or higher | 56 (71.8%) | 22 (28.2%) |
Occupancy by Age of Householder in Westville
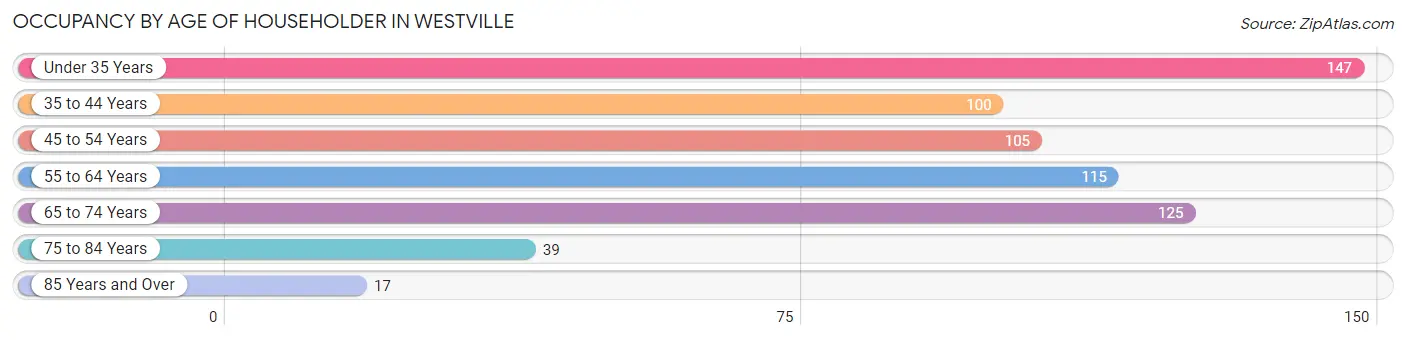
| Age Bracket | # Households | % Households |
| Under 35 Years | 147 | 22.7% |
| 35 to 44 Years | 100 | 15.4% |
| 45 to 54 Years | 105 | 16.2% |
| 55 to 64 Years | 115 | 17.7% |
| 65 to 74 Years | 125 | 19.3% |
| 75 to 84 Years | 39 | 6.0% |
| 85 Years and Over | 17 | 2.6% |
| Total | 648 | 100.0% |
Housing Finances in Westville
Median Income by Occupancy in Westville
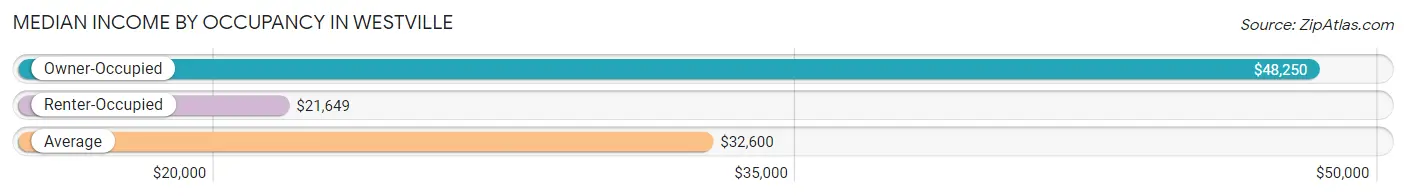
| Occupancy Type | # Households | Median Income |
| Owner-Occupied | 292 (45.1%) | $48,250 |
| Renter-Occupied | 356 (54.9%) | $21,649 |
| Average | 648 (100.0%) | $32,600 |
Occupancy by Householder Income Bracket in Westville
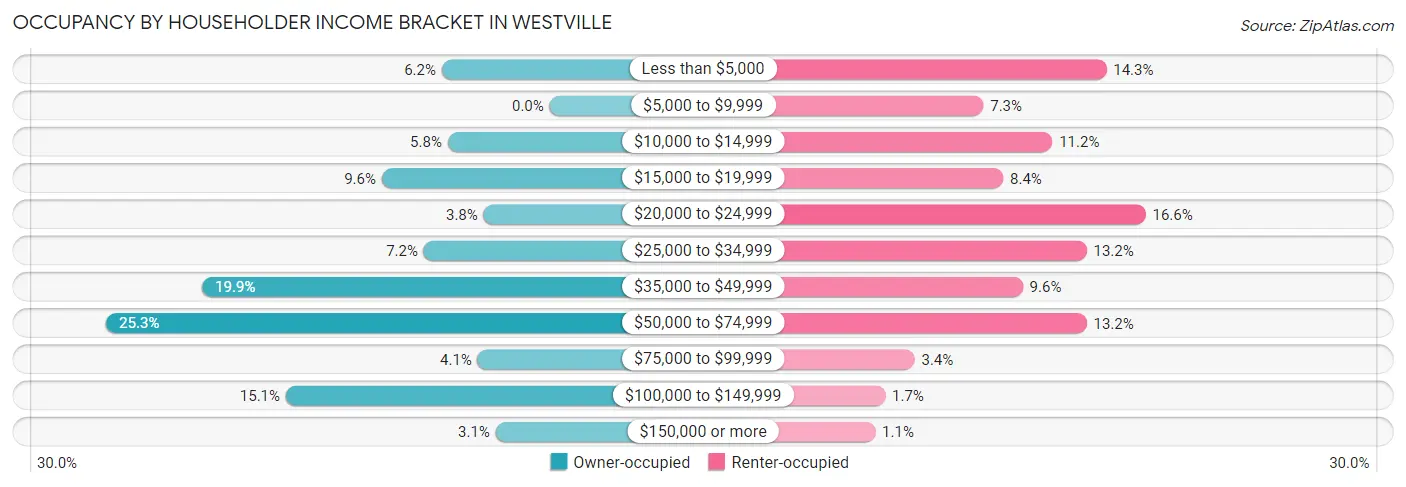
| Income Bracket | Owner-occupied | Renter-occupied |
| Less than $5,000 | 18 (6.2%) | 51 (14.3%) |
| $5,000 to $9,999 | 0 (0.0%) | 26 (7.3%) |
| $10,000 to $14,999 | 17 (5.8%) | 40 (11.2%) |
| $15,000 to $19,999 | 28 (9.6%) | 30 (8.4%) |
| $20,000 to $24,999 | 11 (3.8%) | 59 (16.6%) |
| $25,000 to $34,999 | 21 (7.2%) | 47 (13.2%) |
| $35,000 to $49,999 | 58 (19.9%) | 34 (9.6%) |
| $50,000 to $74,999 | 74 (25.3%) | 47 (13.2%) |
| $75,000 to $99,999 | 12 (4.1%) | 12 (3.4%) |
| $100,000 to $149,999 | 44 (15.1%) | 6 (1.7%) |
| $150,000 or more | 9 (3.1%) | 4 (1.1%) |
| Total | 292 (100.0%) | 356 (100.0%) |
Monthly Housing Cost Tiers in Westville
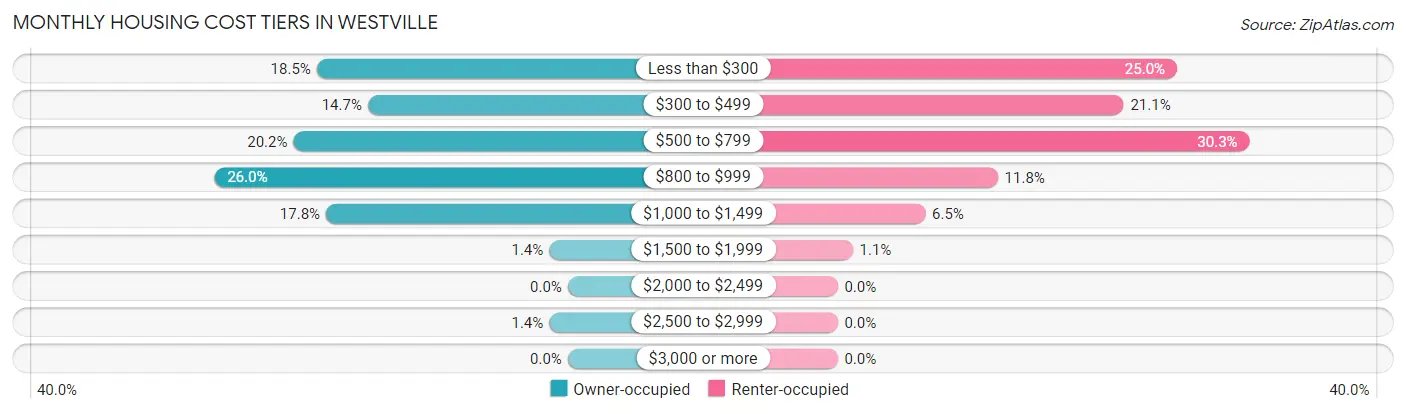
| Monthly Cost | Owner-occupied | Renter-occupied |
| Less than $300 | 54 (18.5%) | 89 (25.0%) |
| $300 to $499 | 43 (14.7%) | 75 (21.1%) |
| $500 to $799 | 59 (20.2%) | 108 (30.3%) |
| $800 to $999 | 76 (26.0%) | 42 (11.8%) |
| $1,000 to $1,499 | 52 (17.8%) | 23 (6.5%) |
| $1,500 to $1,999 | 4 (1.4%) | 4 (1.1%) |
| $2,000 to $2,499 | 0 (0.0%) | 0 (0.0%) |
| $2,500 to $2,999 | 4 (1.4%) | 0 (0.0%) |
| $3,000 or more | 0 (0.0%) | 0 (0.0%) |
| Total | 292 (100.0%) | 356 (100.0%) |
Physical Housing Characteristics in Westville
Housing Structures in Westville
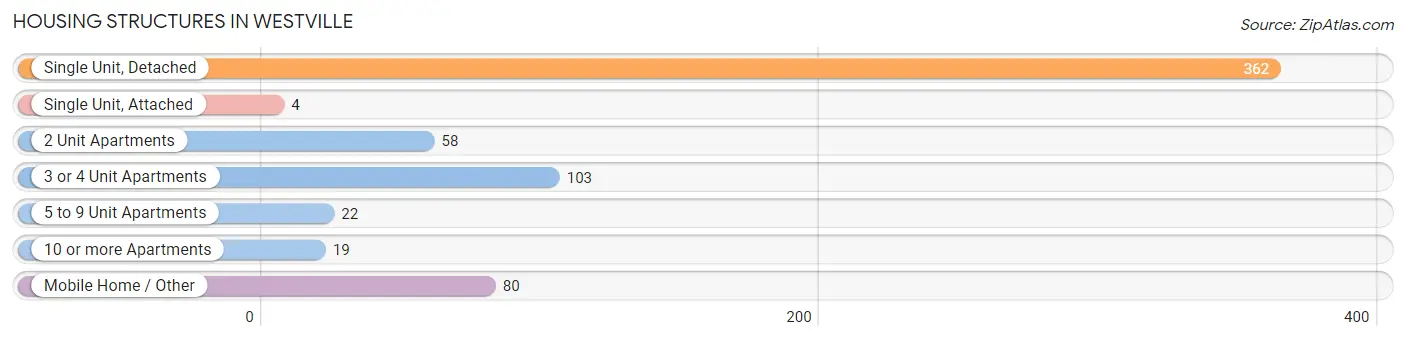
| Structure Type | # Housing Units | % Housing Units |
| Single Unit, Detached | 362 | 55.9% |
| Single Unit, Attached | 4 | 0.6% |
| 2 Unit Apartments | 58 | 8.9% |
| 3 or 4 Unit Apartments | 103 | 15.9% |
| 5 to 9 Unit Apartments | 22 | 3.4% |
| 10 or more Apartments | 19 | 2.9% |
| Mobile Home / Other | 80 | 12.3% |
| Total | 648 | 100.0% |
Housing Structures by Occupancy in Westville
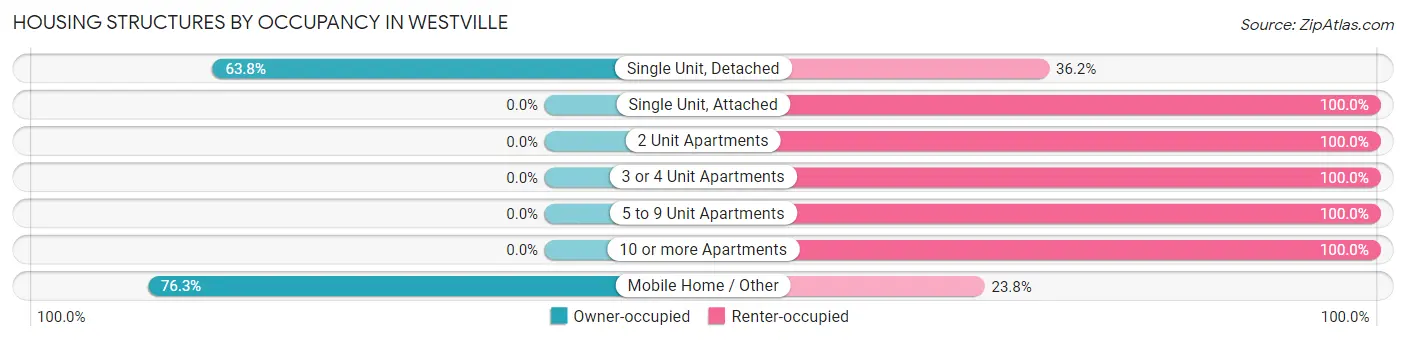
| Structure Type | Owner-occupied | Renter-occupied |
| Single Unit, Detached | 231 (63.8%) | 131 (36.2%) |
| Single Unit, Attached | 0 (0.0%) | 4 (100.0%) |
| 2 Unit Apartments | 0 (0.0%) | 58 (100.0%) |
| 3 or 4 Unit Apartments | 0 (0.0%) | 103 (100.0%) |
| 5 to 9 Unit Apartments | 0 (0.0%) | 22 (100.0%) |
| 10 or more Apartments | 0 (0.0%) | 19 (100.0%) |
| Mobile Home / Other | 61 (76.2%) | 19 (23.7%) |
| Total | 292 (45.1%) | 356 (54.9%) |
Housing Structures by Number of Rooms in Westville
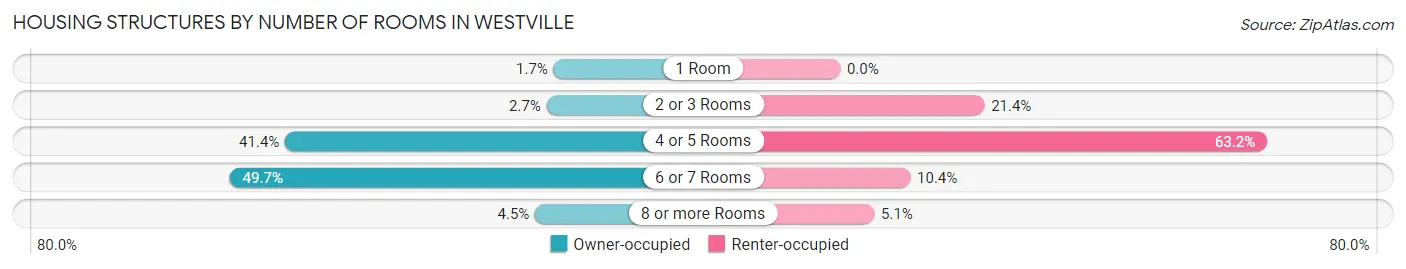
| Number of Rooms | Owner-occupied | Renter-occupied |
| 1 Room | 5 (1.7%) | 0 (0.0%) |
| 2 or 3 Rooms | 8 (2.7%) | 76 (21.3%) |
| 4 or 5 Rooms | 121 (41.4%) | 225 (63.2%) |
| 6 or 7 Rooms | 145 (49.7%) | 37 (10.4%) |
| 8 or more Rooms | 13 (4.4%) | 18 (5.1%) |
| Total | 292 (100.0%) | 356 (100.0%) |
Housing Structure by Heating Type in Westville
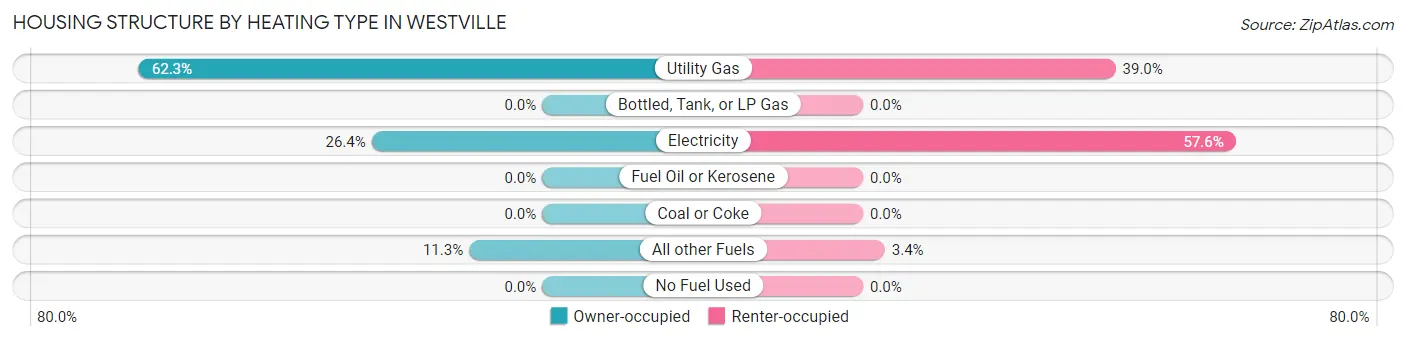
| Heating Type | Owner-occupied | Renter-occupied |
| Utility Gas | 182 (62.3%) | 139 (39.0%) |
| Bottled, Tank, or LP Gas | 0 (0.0%) | 0 (0.0%) |
| Electricity | 77 (26.4%) | 205 (57.6%) |
| Fuel Oil or Kerosene | 0 (0.0%) | 0 (0.0%) |
| Coal or Coke | 0 (0.0%) | 0 (0.0%) |
| All other Fuels | 33 (11.3%) | 12 (3.4%) |
| No Fuel Used | 0 (0.0%) | 0 (0.0%) |
| Total | 292 (100.0%) | 356 (100.0%) |
Household Vehicle Usage in Westville
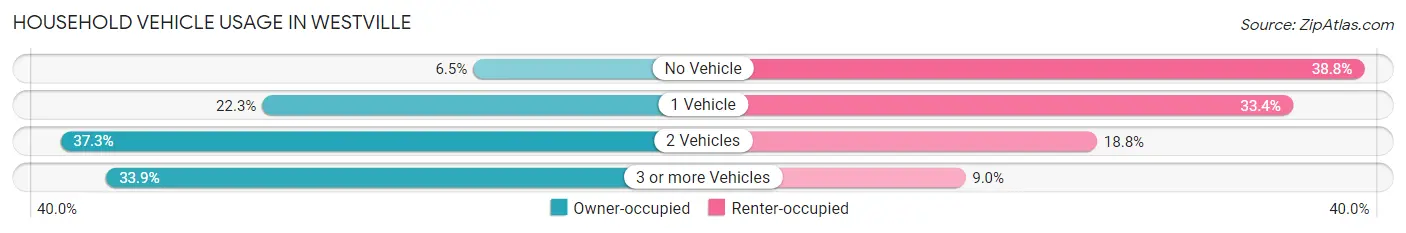
| Vehicles per Household | Owner-occupied | Renter-occupied |
| No Vehicle | 19 (6.5%) | 138 (38.8%) |
| 1 Vehicle | 65 (22.3%) | 119 (33.4%) |
| 2 Vehicles | 109 (37.3%) | 67 (18.8%) |
| 3 or more Vehicles | 99 (33.9%) | 32 (9.0%) |
| Total | 292 (100.0%) | 356 (100.0%) |
Real Estate & Mortgages in Westville
Real Estate and Mortgage Overview in Westville
| Characteristic | Without Mortgage | With Mortgage |
| Housing Units | 115 | 177 |
| Median Property Value | $53,900 | $95,500 |
| Median Household Income | $41,250 | $5 |
| Monthly Housing Costs | $353 | $0 |
| Real Estate Taxes | $366 | $10 |
Property Value by Mortgage Status in Westville
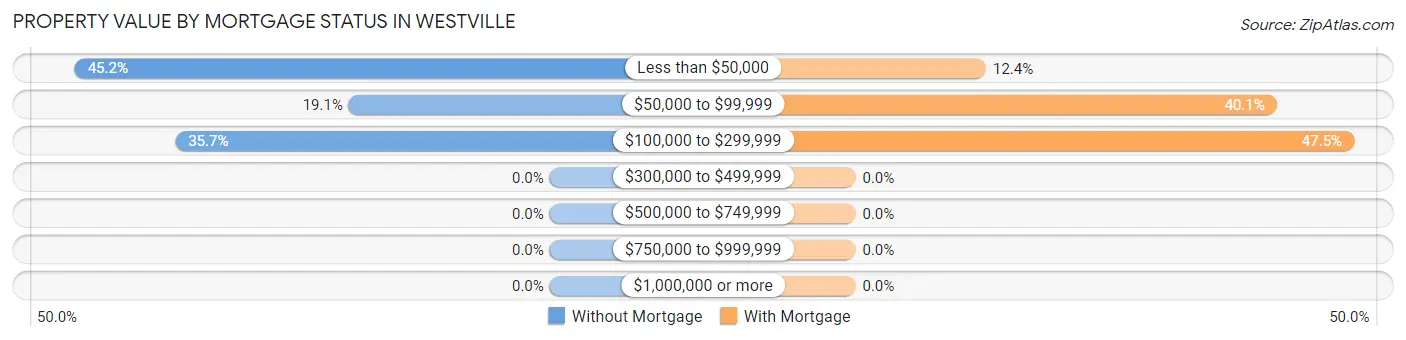
| Property Value | Without Mortgage | With Mortgage |
| Less than $50,000 | 52 (45.2%) | 22 (12.4%) |
| $50,000 to $99,999 | 22 (19.1%) | 71 (40.1%) |
| $100,000 to $299,999 | 41 (35.6%) | 84 (47.5%) |
| $300,000 to $499,999 | 0 (0.0%) | 0 (0.0%) |
| $500,000 to $749,999 | 0 (0.0%) | 0 (0.0%) |
| $750,000 to $999,999 | 0 (0.0%) | 0 (0.0%) |
| $1,000,000 or more | 0 (0.0%) | 0 (0.0%) |
| Total | 115 (100.0%) | 177 (100.0%) |
Household Income by Mortgage Status in Westville
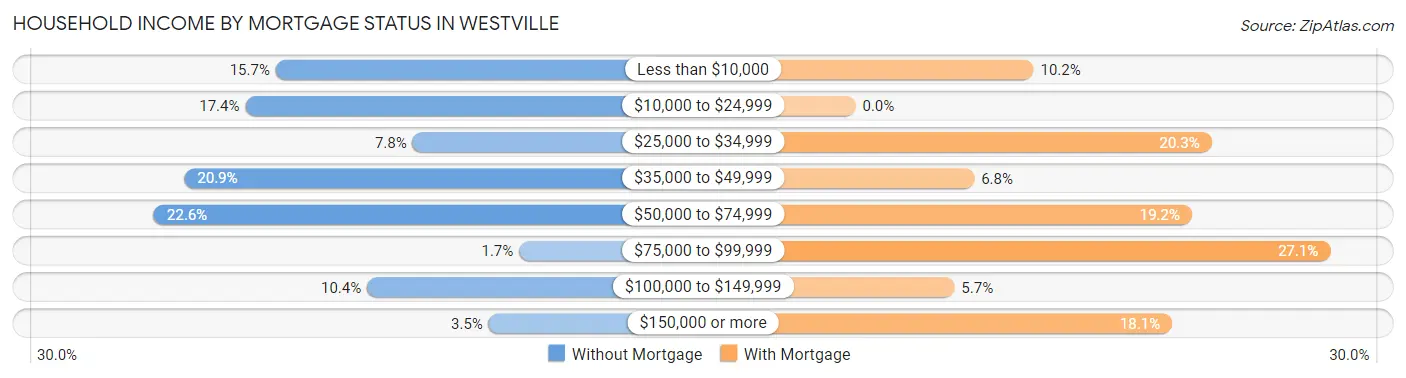
| Household Income | Without Mortgage | With Mortgage |
| Less than $10,000 | 18 (15.7%) | 18 (10.2%) |
| $10,000 to $24,999 | 20 (17.4%) | 0 (0.0%) |
| $25,000 to $34,999 | 9 (7.8%) | 36 (20.3%) |
| $35,000 to $49,999 | 24 (20.9%) | 12 (6.8%) |
| $50,000 to $74,999 | 26 (22.6%) | 34 (19.2%) |
| $75,000 to $99,999 | 2 (1.7%) | 48 (27.1%) |
| $100,000 to $149,999 | 12 (10.4%) | 10 (5.7%) |
| $150,000 or more | 4 (3.5%) | 32 (18.1%) |
| Total | 115 (100.0%) | 177 (100.0%) |
Property Value to Household Income Ratio in Westville
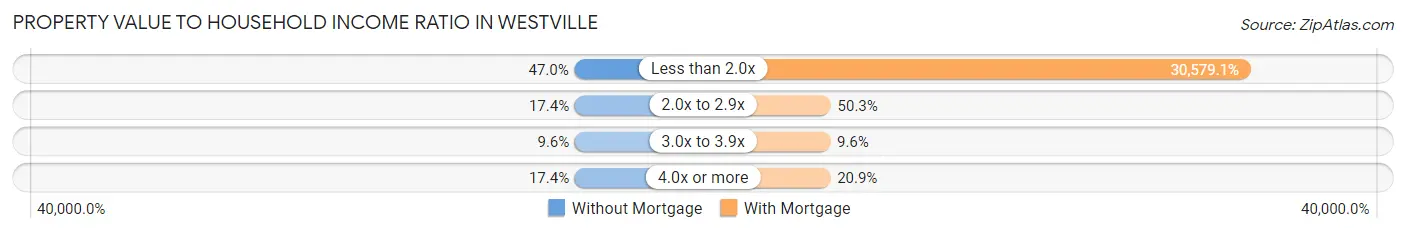
| Value-to-Income Ratio | Without Mortgage | With Mortgage |
| Less than 2.0x | 54 (47.0%) | 54,125 (30,579.1%) |
| 2.0x to 2.9x | 20 (17.4%) | 89 (50.3%) |
| 3.0x to 3.9x | 11 (9.6%) | 17 (9.6%) |
| 4.0x or more | 20 (17.4%) | 37 (20.9%) |
| Total | 115 (100.0%) | 177 (100.0%) |
Real Estate Taxes by Mortgage Status in Westville
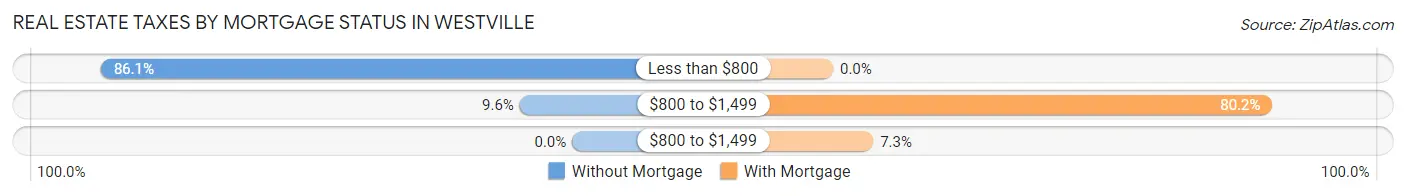
| Property Taxes | Without Mortgage | With Mortgage |
| Less than $800 | 99 (86.1%) | 0 (0.0%) |
| $800 to $1,499 | 11 (9.6%) | 142 (80.2%) |
| $800 to $1,499 | 0 (0.0%) | 13 (7.3%) |
| Total | 115 (100.0%) | 177 (100.0%) |
Health & Disability in Westville
Health Insurance Coverage by Age in Westville
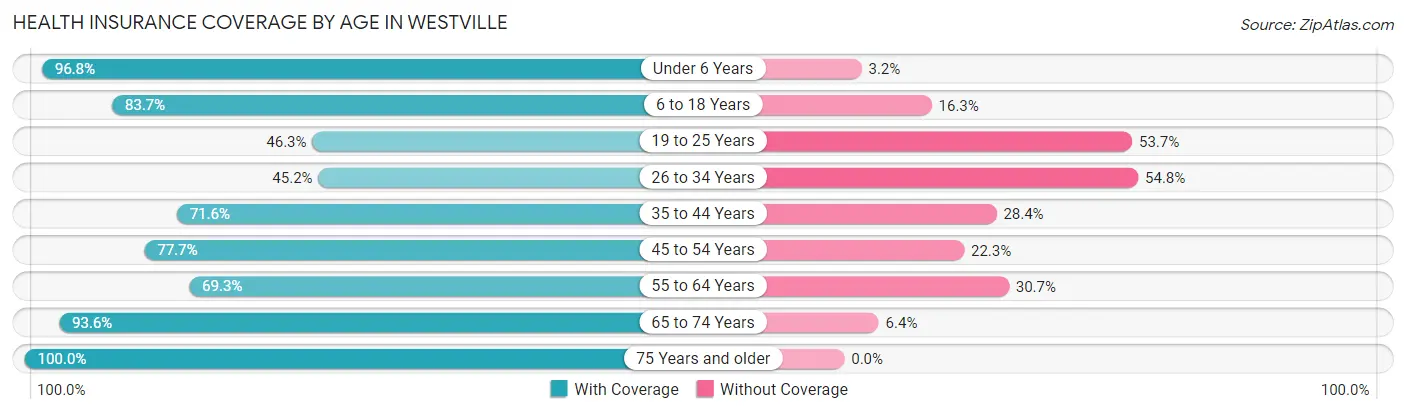
| Age Bracket | With Coverage | Without Coverage |
| Under 6 Years | 181 (96.8%) | 6 (3.2%) |
| 6 to 18 Years | 252 (83.7%) | 49 (16.3%) |
| 19 to 25 Years | 57 (46.3%) | 66 (53.7%) |
| 26 to 34 Years | 99 (45.2%) | 120 (54.8%) |
| 35 to 44 Years | 154 (71.6%) | 61 (28.4%) |
| 45 to 54 Years | 167 (77.7%) | 48 (22.3%) |
| 55 to 64 Years | 122 (69.3%) | 54 (30.7%) |
| 65 to 74 Years | 146 (93.6%) | 10 (6.4%) |
| 75 Years and older | 80 (100.0%) | 0 (0.0%) |
| Total | 1,258 (75.2%) | 414 (24.8%) |
Health Insurance Coverage by Citizenship Status in Westville
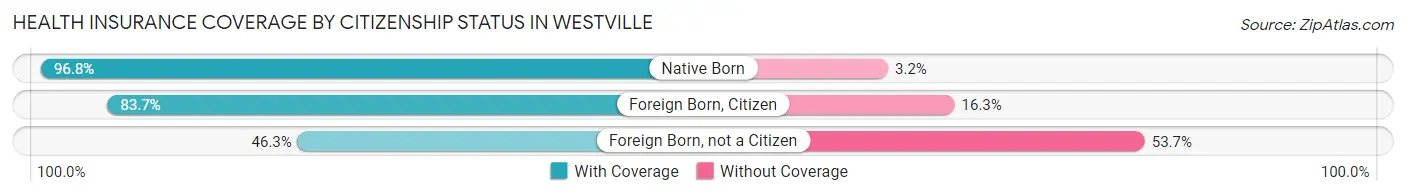
| Citizenship Status | With Coverage | Without Coverage |
| Native Born | 181 (96.8%) | 6 (3.2%) |
| Foreign Born, Citizen | 252 (83.7%) | 49 (16.3%) |
| Foreign Born, not a Citizen | 57 (46.3%) | 66 (53.7%) |
Health Insurance Coverage by Household Income in Westville
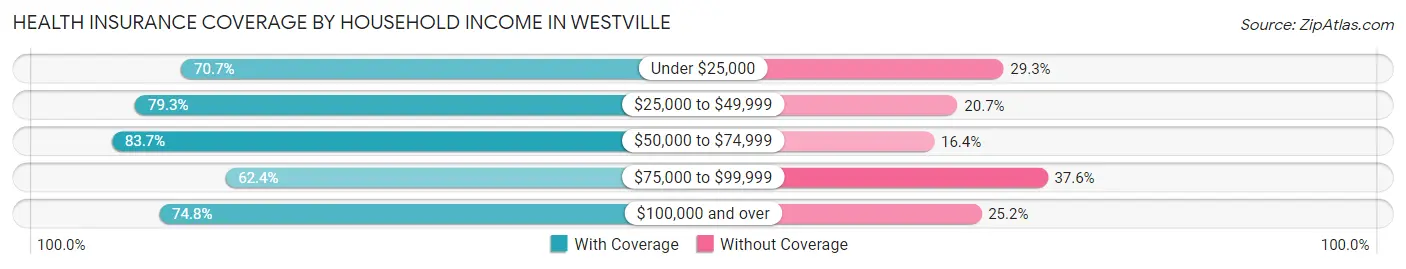
| Household Income | With Coverage | Without Coverage |
| Under $25,000 | 383 (70.7%) | 159 (29.3%) |
| $25,000 to $49,999 | 329 (79.3%) | 86 (20.7%) |
| $50,000 to $74,999 | 261 (83.7%) | 51 (16.4%) |
| $75,000 to $99,999 | 83 (62.4%) | 50 (37.6%) |
| $100,000 and over | 202 (74.8%) | 68 (25.2%) |
Public vs Private Health Insurance Coverage by Age in Westville
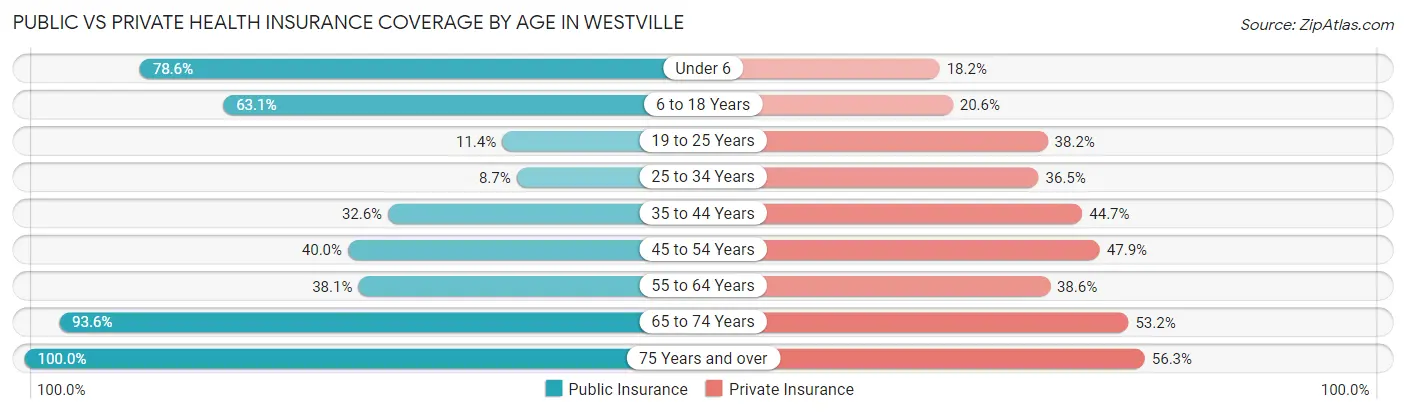
| Age Bracket | Public Insurance | Private Insurance |
| Under 6 | 147 (78.6%) | 34 (18.2%) |
| 6 to 18 Years | 190 (63.1%) | 62 (20.6%) |
| 19 to 25 Years | 14 (11.4%) | 47 (38.2%) |
| 25 to 34 Years | 19 (8.7%) | 80 (36.5%) |
| 35 to 44 Years | 70 (32.6%) | 96 (44.7%) |
| 45 to 54 Years | 86 (40.0%) | 103 (47.9%) |
| 55 to 64 Years | 67 (38.1%) | 68 (38.6%) |
| 65 to 74 Years | 146 (93.6%) | 83 (53.2%) |
| 75 Years and over | 80 (100.0%) | 45 (56.2%) |
| Total | 819 (49.0%) | 618 (37.0%) |
Disability Status by Sex by Age in Westville
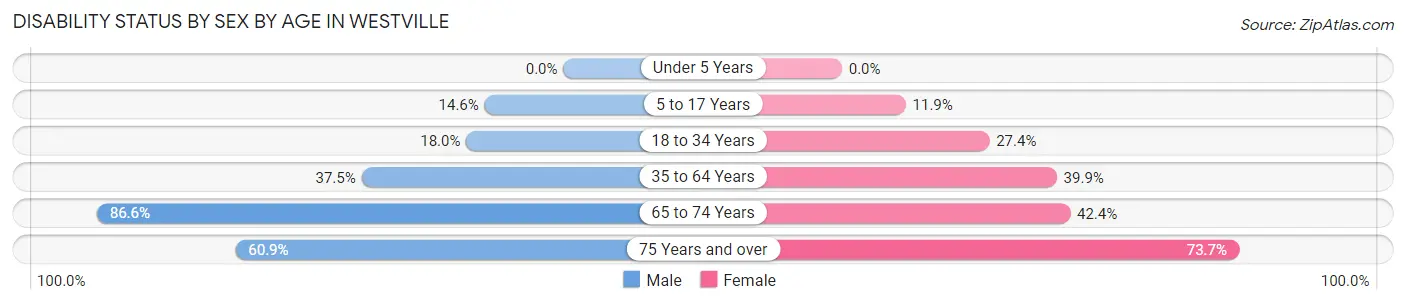
| Age Bracket | Male | Female |
| Under 5 Years | 0 (0.0%) | 0 (0.0%) |
| 5 to 17 Years | 31 (14.6%) | 16 (11.8%) |
| 18 to 34 Years | 29 (18.0%) | 52 (27.4%) |
| 35 to 64 Years | 103 (37.4%) | 132 (39.9%) |
| 65 to 74 Years | 84 (86.6%) | 25 (42.4%) |
| 75 Years and over | 14 (60.9%) | 42 (73.7%) |
Disability Class by Sex by Age in Westville
Disability Class: Hearing Difficulty
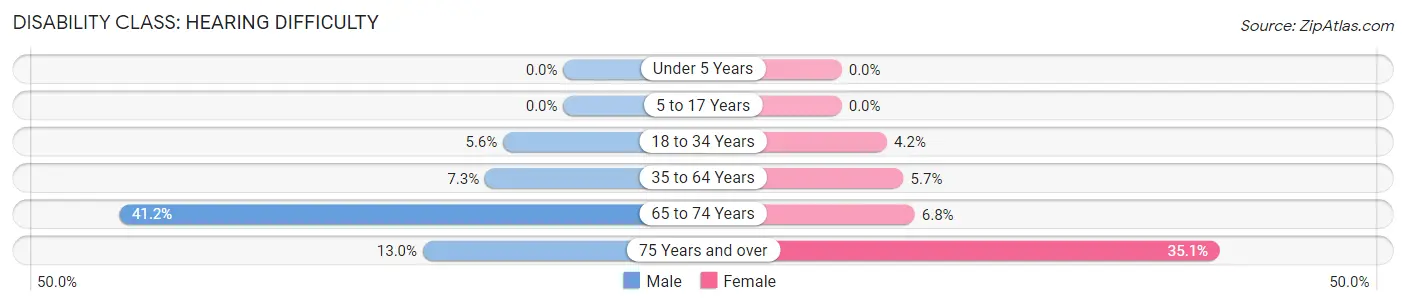
| Age Bracket | Male | Female |
| Under 5 Years | 0 (0.0%) | 0 (0.0%) |
| 5 to 17 Years | 0 (0.0%) | 0 (0.0%) |
| 18 to 34 Years | 9 (5.6%) | 8 (4.2%) |
| 35 to 64 Years | 20 (7.3%) | 19 (5.7%) |
| 65 to 74 Years | 40 (41.2%) | 4 (6.8%) |
| 75 Years and over | 3 (13.0%) | 20 (35.1%) |
Disability Class: Vision Difficulty
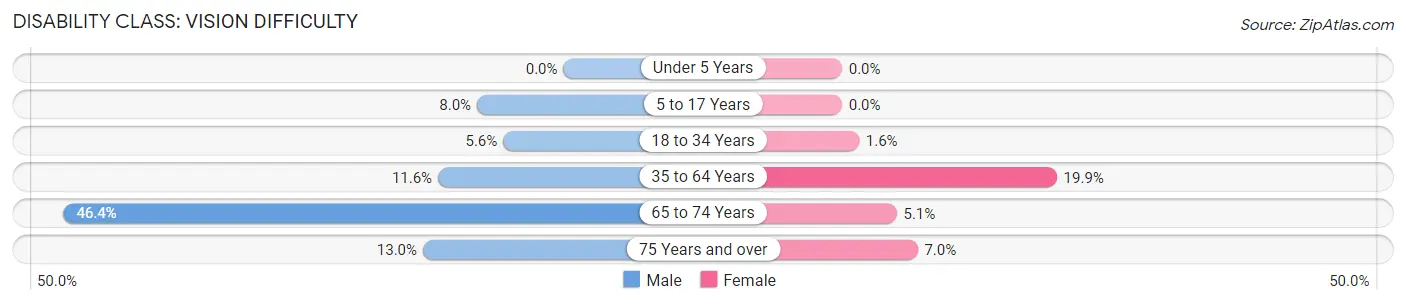
| Age Bracket | Male | Female |
| Under 5 Years | 0 (0.0%) | 0 (0.0%) |
| 5 to 17 Years | 17 (8.0%) | 0 (0.0%) |
| 18 to 34 Years | 9 (5.6%) | 3 (1.6%) |
| 35 to 64 Years | 32 (11.6%) | 66 (19.9%) |
| 65 to 74 Years | 45 (46.4%) | 3 (5.1%) |
| 75 Years and over | 3 (13.0%) | 4 (7.0%) |
Disability Class: Cognitive Difficulty
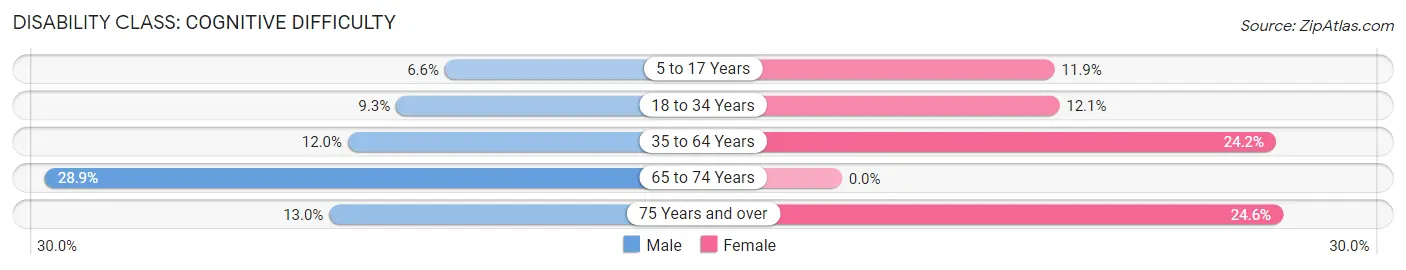
| Age Bracket | Male | Female |
| 5 to 17 Years | 14 (6.6%) | 16 (11.8%) |
| 18 to 34 Years | 15 (9.3%) | 23 (12.1%) |
| 35 to 64 Years | 33 (12.0%) | 80 (24.2%) |
| 65 to 74 Years | 28 (28.9%) | 0 (0.0%) |
| 75 Years and over | 3 (13.0%) | 14 (24.6%) |
Disability Class: Ambulatory Difficulty
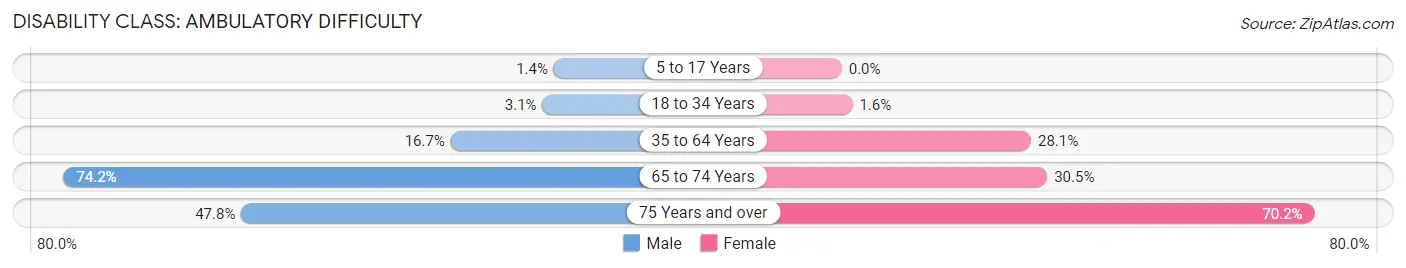
| Age Bracket | Male | Female |
| 5 to 17 Years | 3 (1.4%) | 0 (0.0%) |
| 18 to 34 Years | 5 (3.1%) | 3 (1.6%) |
| 35 to 64 Years | 46 (16.7%) | 93 (28.1%) |
| 65 to 74 Years | 72 (74.2%) | 18 (30.5%) |
| 75 Years and over | 11 (47.8%) | 40 (70.2%) |
Disability Class: Self-Care Difficulty
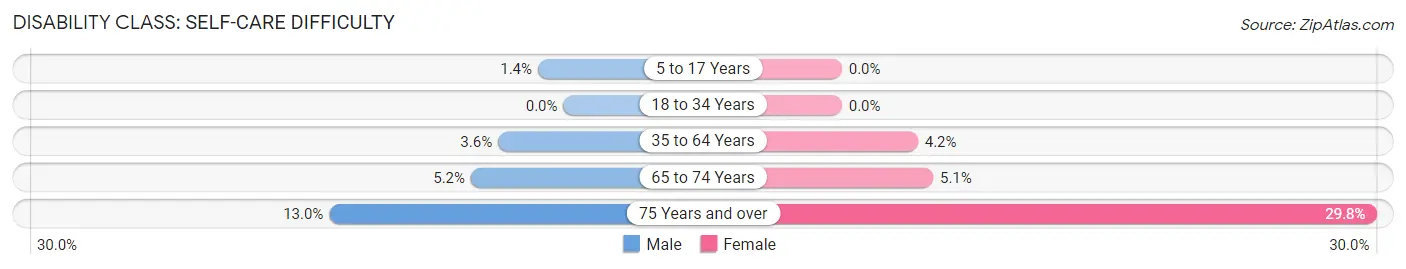
| Age Bracket | Male | Female |
| 5 to 17 Years | 3 (1.4%) | 0 (0.0%) |
| 18 to 34 Years | 0 (0.0%) | 0 (0.0%) |
| 35 to 64 Years | 10 (3.6%) | 14 (4.2%) |
| 65 to 74 Years | 5 (5.1%) | 3 (5.1%) |
| 75 Years and over | 3 (13.0%) | 17 (29.8%) |
Technology Access in Westville
Computing Device Access in Westville
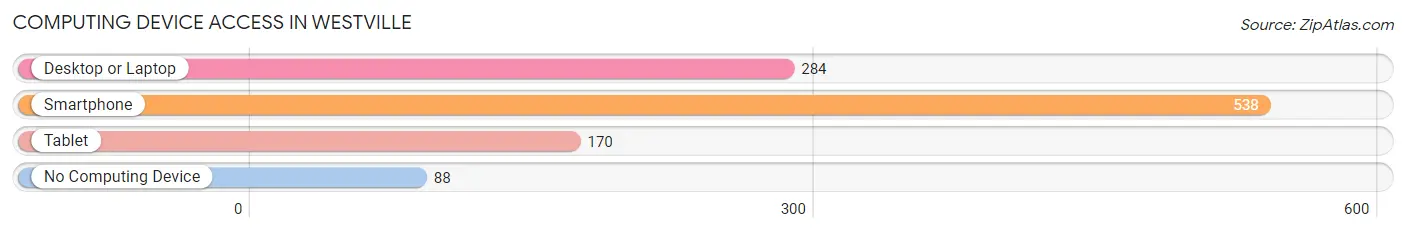
| Device Type | # Households | % Households |
| Desktop or Laptop | 284 | 43.8% |
| Smartphone | 538 | 83.0% |
| Tablet | 170 | 26.2% |
| No Computing Device | 88 | 13.6% |
| Total | 648 | 100.0% |
Internet Access in Westville
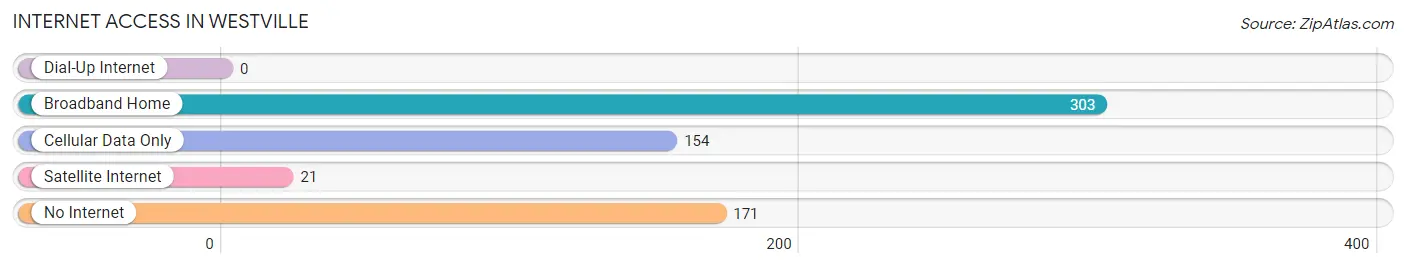
| Internet Type | # Households | % Households |
| Dial-Up Internet | 0 | 0.0% |
| Broadband Home | 303 | 46.8% |
| Cellular Data Only | 154 | 23.8% |
| Satellite Internet | 21 | 3.2% |
| No Internet | 171 | 26.4% |
| Total | 648 | 100.0% |
Westville Summary
History
The town of Westville, Oklahoma is located in Adair County, in the northeastern corner of the state. It is situated on the Illinois River, and is the county seat of Adair County. The town was founded in 1851 by a group of settlers from the Cherokee Nation, who were led by Chief John Jolly. The town was originally known as Jolly's Stand, and was later renamed Westville in honor of the first postmaster, William West.
The town was officially incorporated in 1891, and the first mayor was William West. The town grew rapidly in the late 19th and early 20th centuries, and by the 1920s, it had become a thriving commercial center. The town was home to several businesses, including a cotton gin, a sawmill, a gristmill, a blacksmith shop, and a general store.
Westville was also home to a number of educational institutions, including the Westville Academy, which was established in 1891. The academy was a private school that offered classes in a variety of subjects, including Latin, Greek, and mathematics. The school was later renamed the Westville High School, and it is still in operation today.
Geography
Westville is located in the foothills of the Ozark Mountains, in the northeastern corner of Oklahoma. The town is situated on the Illinois River, and is surrounded by rolling hills and wooded areas. The town is located approximately 30 miles from the Arkansas border, and is about 90 miles from Tulsa.
The climate in Westville is generally mild, with hot summers and cold winters. The average annual temperature is around 60 degrees Fahrenheit, and the average annual precipitation is around 40 inches.
Economy
Westville's economy is largely based on agriculture and tourism. The town is home to several farms, which produce a variety of crops, including corn, soybeans, wheat, and hay. The town is also home to several tourist attractions, including the Westville Historical Museum, the Westville Lake, and the Westville State Park.
The town is also home to several businesses, including a grocery store, a hardware store, a pharmacy, and a variety of restaurants and shops. The town is also home to a number of manufacturing companies, including a furniture factory, a printing company, and a plastics factory.
Demographics
As of the 2010 census, the population of Westville was 2,845. The racial makeup of the town was 94.3% White, 0.7% African American, 0.7% Native American, 0.3% Asian, 0.1% Pacific Islander, and 3.0% from other races. The median household income was $30,938, and the median family income was $37,813.
The town is served by the Westville Public School District, which includes Westville Elementary School, Westville Middle School, and Westville High School. The town is also home to a number of churches, including the First Baptist Church, the First United Methodist Church, and the Westville Church of Christ.
Common Questions
What is Per Capita Income in Westville?
Per Capita income in Westville is $16,836.
What is the Median Family Income in Westville?
Median Family Income in Westville is $45,658.
What is the Median Household income in Westville?
Median Household Income in Westville is $32,600.
What is Income or Wage Gap in Westville?
Income or Wage Gap in Westville is 30.2%.
Women in Westville earn 69.8 cents for every dollar earned by a man.
What is Inequality or Gini Index in Westville?
Inequality or Gini Index in Westville is 0.46.
What is the Total Population of Westville?
Total Population of Westville is 1,672.
What is the Total Male Population of Westville?
Total Male Population of Westville is 830.
What is the Total Female Population of Westville?
Total Female Population of Westville is 842.
What is the Ratio of Males per 100 Females in Westville?
There are 98.57 Males per 100 Females in Westville.
What is the Ratio of Females per 100 Males in Westville?
There are 101.45 Females per 100 Males in Westville.
What is the Median Population Age in Westville?
Median Population Age in Westville is 35.1 Years.
What is the Average Family Size in Westville
Average Family Size in Westville is 3.5 People.
What is the Average Household Size in Westville
Average Household Size in Westville is 2.6 People.
How Large is the Labor Force in Westville?
There are 632 People in the Labor Forcein in Westville.
What is the Percentage of People in the Labor Force in Westville?
49.8% of People are in the Labor Force in Westville.
What is the Unemployment Rate in Westville?
Unemployment Rate in Westville is 10.9%.