Wellston, OK Map & Demographics
Wellston Map
Wellston Overview
$31,056
PER CAPITA INCOME
$69,375
AVG FAMILY INCOME
$55,665
AVG HOUSEHOLD INCOME
22.5%
WAGE / INCOME GAP [ % ]
77.5¢/ $1
WAGE / INCOME GAP [ $ ]
$9,914
FAMILY INCOME DEFICIT
0.38
INEQUALITY / GINI INDEX
794
TOTAL POPULATION
436
MALE POPULATION
358
FEMALE POPULATION
121.79
MALES / 100 FEMALES
82.11
FEMALES / 100 MALES
41.4
MEDIAN AGE
3.3
AVG FAMILY SIZE
2.1
AVG HOUSEHOLD SIZE
338
LABOR FORCE [ PEOPLE ]
52.7%
PERCENT IN LABOR FORCE
4.4%
UNEMPLOYMENT RATE
Wellston Zip Codes
Wellston Area Codes
Income in Wellston
Income Overview in Wellston
Per Capita Income in Wellston is $31,056, while median incomes of families and households are $69,375 and $55,665 respectively.
| Characteristic | Number | Measure |
| Per Capita Income | 794 | $31,056 |
| Median Family Income | 169 | $69,375 |
| Mean Family Income | 169 | $84,106 |
| Median Household Income | 382 | $55,665 |
| Mean Household Income | 382 | $61,275 |
| Income Deficit | 169 | $9,914 |
| Wage / Income Gap (%) | 794 | 22.48% |
| Wage / Income Gap ($) | 794 | 77.52¢ per $1 |
| Gini / Inequality Index | 794 | 0.38 |
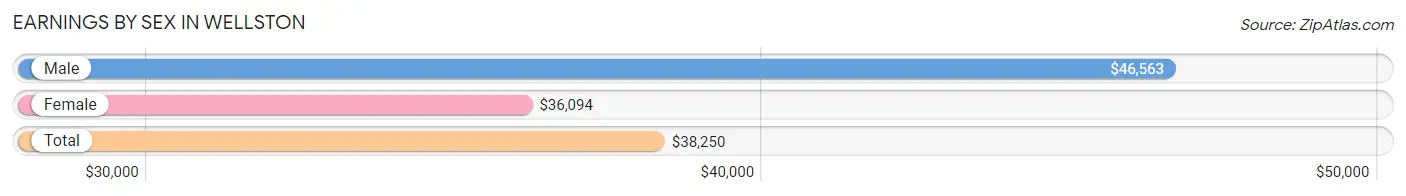
Earnings by Sex in Wellston
Average Earnings in Wellston are $38,250, $46,563 for men and $36,094 for women, a difference of 22.5%.
| Sex | Number | Average Earnings |
| Male | 177 (52.4%) | $46,563 |
| Female | 161 (47.6%) | $36,094 |
| Total | 338 (100.0%) | $38,250 |
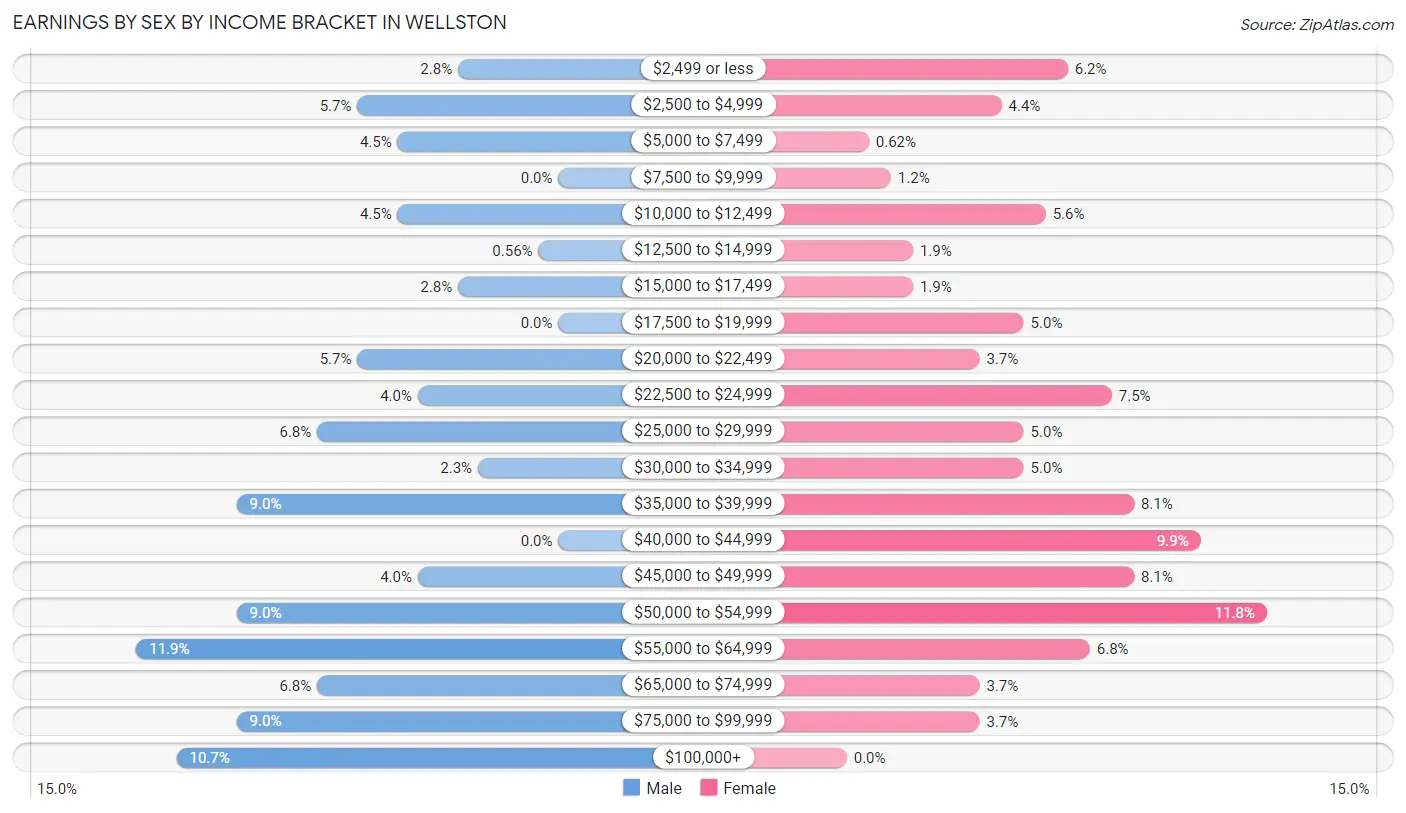
Earnings by Sex by Income Bracket in Wellston
The most common earnings brackets in Wellston are $55,000 to $64,999 for men (21 | 11.9%) and $50,000 to $54,999 for women (19 | 11.8%).
| Income | Male | Female |
| $2,499 or less | 5 (2.8%) | 10 (6.2%) |
| $2,500 to $4,999 | 10 (5.7%) | 7 (4.3%) |
| $5,000 to $7,499 | 8 (4.5%) | 1 (0.6%) |
| $7,500 to $9,999 | 0 (0.0%) | 2 (1.2%) |
| $10,000 to $12,499 | 8 (4.5%) | 9 (5.6%) |
| $12,500 to $14,999 | 1 (0.6%) | 3 (1.9%) |
| $15,000 to $17,499 | 5 (2.8%) | 3 (1.9%) |
| $17,500 to $19,999 | 0 (0.0%) | 8 (5.0%) |
| $20,000 to $22,499 | 10 (5.7%) | 6 (3.7%) |
| $22,500 to $24,999 | 7 (4.0%) | 12 (7.4%) |
| $25,000 to $29,999 | 12 (6.8%) | 8 (5.0%) |
| $30,000 to $34,999 | 4 (2.3%) | 8 (5.0%) |
| $35,000 to $39,999 | 16 (9.0%) | 13 (8.1%) |
| $40,000 to $44,999 | 0 (0.0%) | 16 (9.9%) |
| $45,000 to $49,999 | 7 (4.0%) | 13 (8.1%) |
| $50,000 to $54,999 | 16 (9.0%) | 19 (11.8%) |
| $55,000 to $64,999 | 21 (11.9%) | 11 (6.8%) |
| $65,000 to $74,999 | 12 (6.8%) | 6 (3.7%) |
| $75,000 to $99,999 | 16 (9.0%) | 6 (3.7%) |
| $100,000+ | 19 (10.7%) | 0 (0.0%) |
| Total | 177 (100.0%) | 161 (100.0%) |
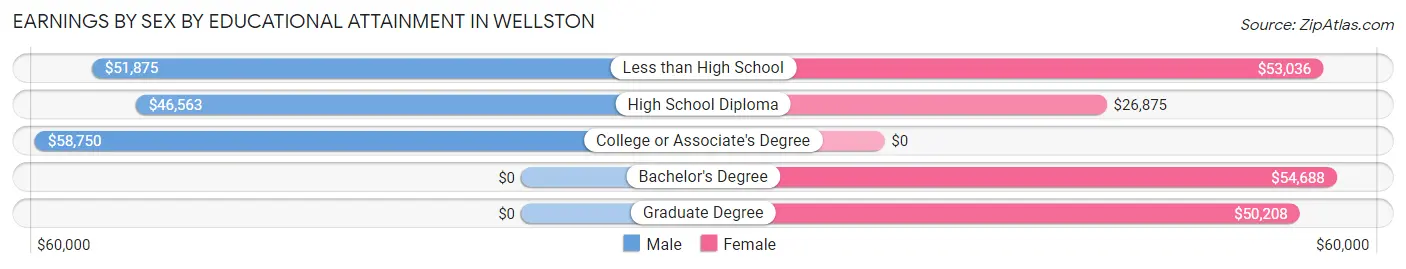
Earnings by Sex by Educational Attainment in Wellston
Average earnings in Wellston are $53,125 for men and $38,250 for women, a difference of 28.0%. Men with an educational attainment of college or associate's degree enjoy the highest average annual earnings of $58,750, while those with high school diploma education earn the least with $46,563. Women with an educational attainment of bachelor's degree earn the most with the average annual earnings of $54,688, while those with high school diploma education have the smallest earnings of $26,875.
| Educational Attainment | Male Income | Female Income |
| Less than High School | $51,875 | $53,036 |
| High School Diploma | $46,563 | $26,875 |
| College or Associate's Degree | $58,750 | $0 |
| Bachelor's Degree | - | - |
| Graduate Degree | - | - |
| Total | $53,125 | $38,250 |
Family Income in Wellston
Family Income Brackets in Wellston
According to the Wellston family income data, there are 40 families falling into the $50,000 to $74,999 income range, which is the most common income bracket and makes up 23.7% of all families. Conversely, the less than $10,000 income bracket is the least frequent group with only 1 families (0.6%) belonging to this category.
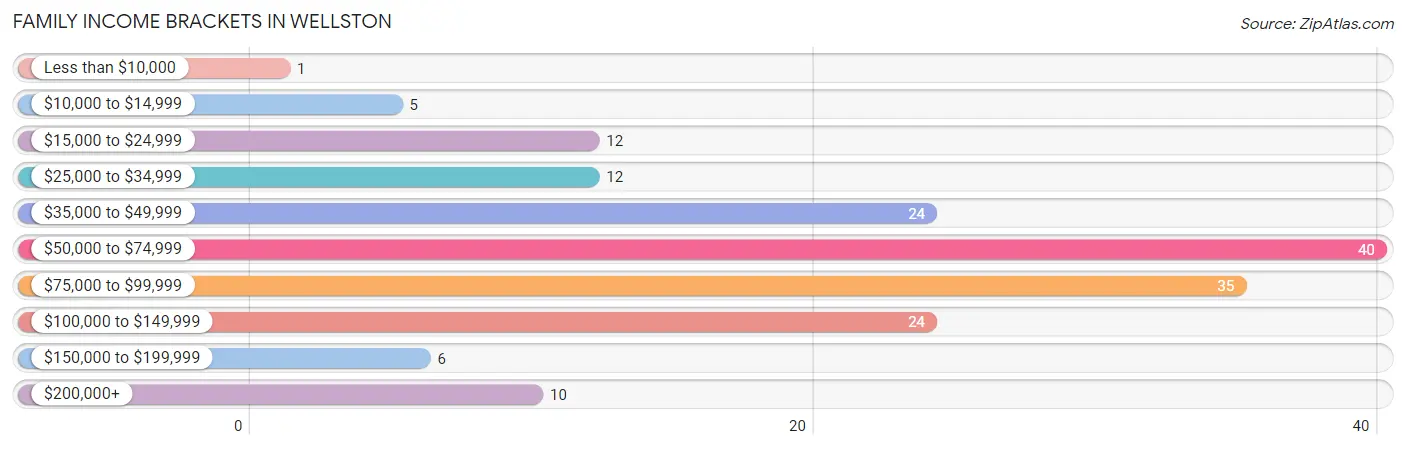
| Income Bracket | # Families | % Families |
| Less than $10,000 | 1 | 0.6% |
| $10,000 to $14,999 | 5 | 3.0% |
| $15,000 to $24,999 | 12 | 7.1% |
| $25,000 to $34,999 | 12 | 7.1% |
| $35,000 to $49,999 | 24 | 14.2% |
| $50,000 to $74,999 | 40 | 23.7% |
| $75,000 to $99,999 | 35 | 20.7% |
| $100,000 to $149,999 | 24 | 14.2% |
| $150,000 to $199,999 | 6 | 3.6% |
| $200,000+ | 10 | 5.9% |
Family Income by Famaliy Size in Wellston
6-person families (12 | 7.1%) account for the highest median family income in Wellston with $105,357 per family, while 2-person families (73 | 43.2%) have the highest median income of $34,062 per family member.
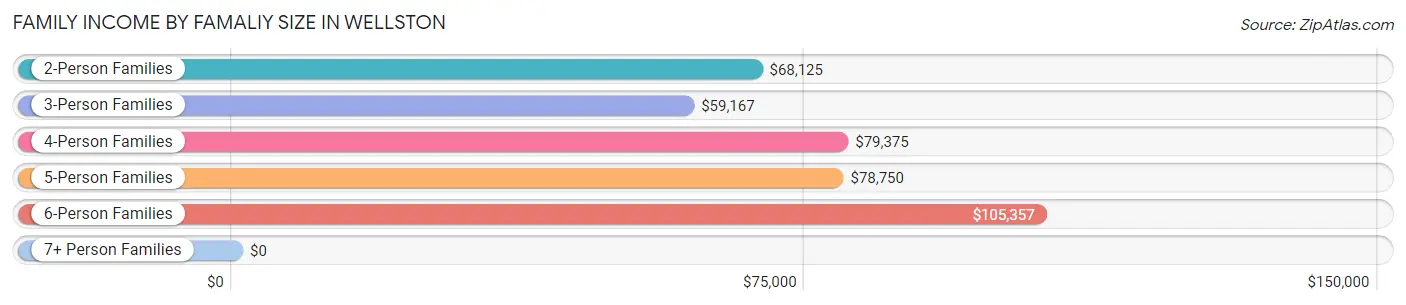
| Income Bracket | # Families | Median Income |
| 2-Person Families | 73 (43.2%) | $68,125 |
| 3-Person Families | 44 (26.0%) | $59,167 |
| 4-Person Families | 29 (17.2%) | $79,375 |
| 5-Person Families | 9 (5.3%) | $78,750 |
| 6-Person Families | 12 (7.1%) | $105,357 |
| 7+ Person Families | 2 (1.2%) | $0 |
| Total | 169 (100.0%) | $69,375 |
Family Income by Number of Earners in Wellston
The median family income in Wellston is $69,375, with families comprising 3+ earners (13) having the highest median family income of $133,125, while families with no earners (24) have the lowest median family income of $40,625, accounting for 7.7% and 14.2% of families, respectively.
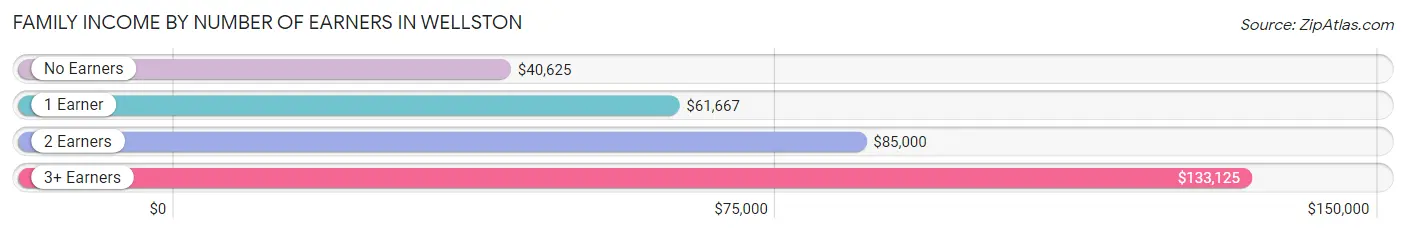
| Number of Earners | # Families | Median Income |
| No Earners | 24 (14.2%) | $40,625 |
| 1 Earner | 62 (36.7%) | $61,667 |
| 2 Earners | 70 (41.4%) | $85,000 |
| 3+ Earners | 13 (7.7%) | $133,125 |
| Total | 169 (100.0%) | $69,375 |
Household Income in Wellston
Household Income Brackets in Wellston
With 144 households falling in the category, the $50,000 to $74,999 income range is the most frequent in Wellston, accounting for 37.7% of all households. In contrast, only 8 households (2.1%) fall into the $150,000 to $199,999 income bracket, making it the least populous group.
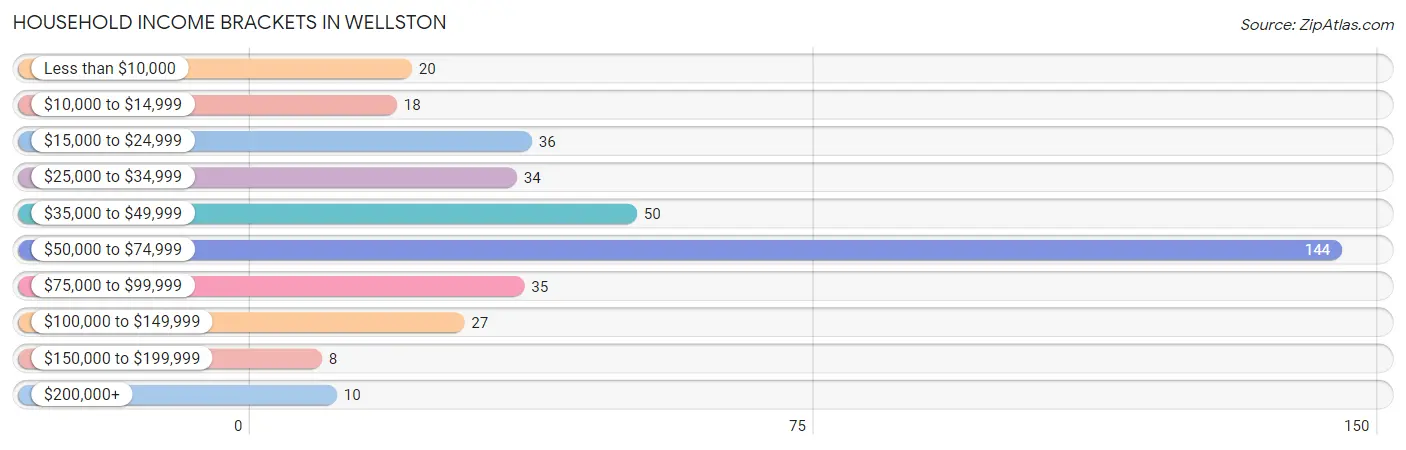
| Income Bracket | # Households | % Households |
| Less than $10,000 | 20 | 5.2% |
| $10,000 to $14,999 | 18 | 4.7% |
| $15,000 to $24,999 | 36 | 9.4% |
| $25,000 to $34,999 | 34 | 8.9% |
| $35,000 to $49,999 | 50 | 13.1% |
| $50,000 to $74,999 | 144 | 37.7% |
| $75,000 to $99,999 | 35 | 9.2% |
| $100,000 to $149,999 | 27 | 7.1% |
| $150,000 to $199,999 | 8 | 2.1% |
| $200,000+ | 10 | 2.6% |
Household Income by Householder Age in Wellston
The median household income in Wellston is $55,665, with the highest median household income of $61,000 found in the 45 to 64 years age bracket for the primary householder. A total of 130 households (34.0%) fall into this category. Meanwhile, the 25 to 44 years age bracket for the primary householder has the lowest median household income of $49,167, with 90 households (23.6%) in this group.
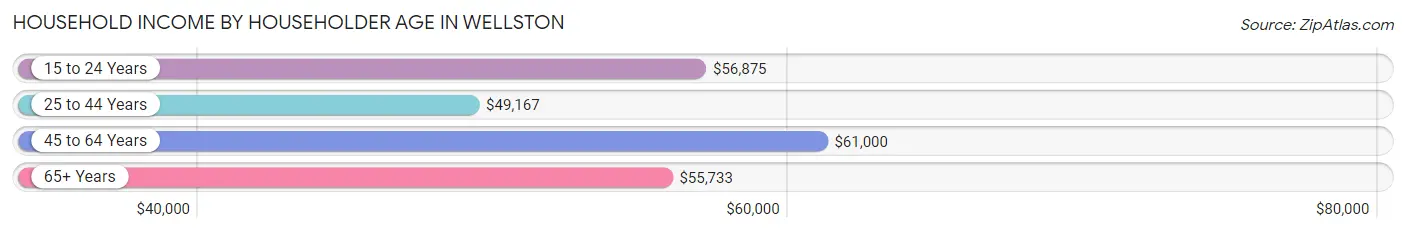
| Income Bracket | # Households | Median Income |
| 15 to 24 Years | 7 (1.8%) | $56,875 |
| 25 to 44 Years | 90 (23.6%) | $49,167 |
| 45 to 64 Years | 130 (34.0%) | $61,000 |
| 65+ Years | 155 (40.6%) | $55,733 |
| Total | 382 (100.0%) | $55,665 |
Poverty in Wellston
Income Below Poverty by Sex and Age in Wellston
With 10.1% poverty level for males and 19.2% for females among the residents of Wellston, 12 to 14 year old males and 5 year old females are the most vulnerable to poverty, with 4 males (100.0%) and 4 females (66.7%) in their respective age groups living below the poverty level.
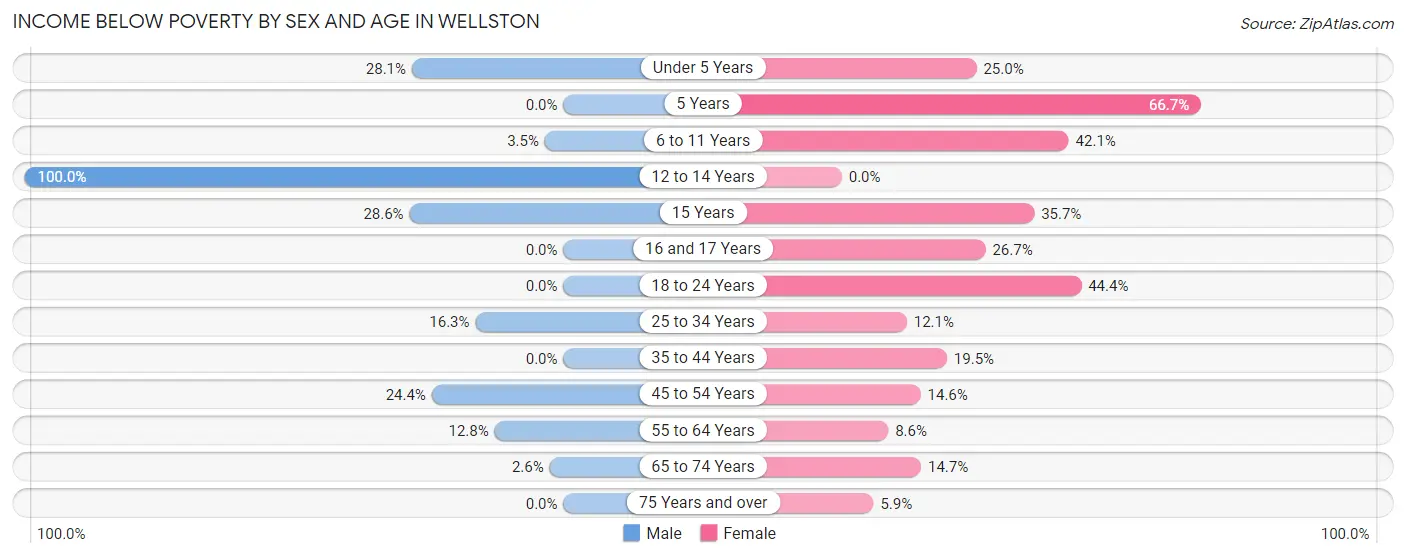
| Age Bracket | Male | Female |
| Under 5 Years | 9 (28.1%) | 7 (25.0%) |
| 5 Years | 0 (0.0%) | 4 (66.7%) |
| 6 to 11 Years | 1 (3.5%) | 8 (42.1%) |
| 12 to 14 Years | 4 (100.0%) | 0 (0.0%) |
| 15 Years | 2 (28.6%) | 5 (35.7%) |
| 16 and 17 Years | 0 (0.0%) | 4 (26.7%) |
| 18 to 24 Years | 0 (0.0%) | 8 (44.4%) |
| 25 to 34 Years | 8 (16.3%) | 7 (12.1%) |
| 35 to 44 Years | 0 (0.0%) | 8 (19.5%) |
| 45 to 54 Years | 11 (24.4%) | 6 (14.6%) |
| 55 to 64 Years | 6 (12.8%) | 5 (8.6%) |
| 65 to 74 Years | 3 (2.6%) | 5 (14.7%) |
| 75 Years and over | 0 (0.0%) | 1 (5.9%) |
| Total | 44 (10.1%) | 68 (19.2%) |
Income Above Poverty by Sex and Age in Wellston
According to the poverty statistics in Wellston, males aged 5 years and females aged 12 to 14 years are the age groups that are most secure financially, with 100.0% of males and 100.0% of females in these age groups living above the poverty line.
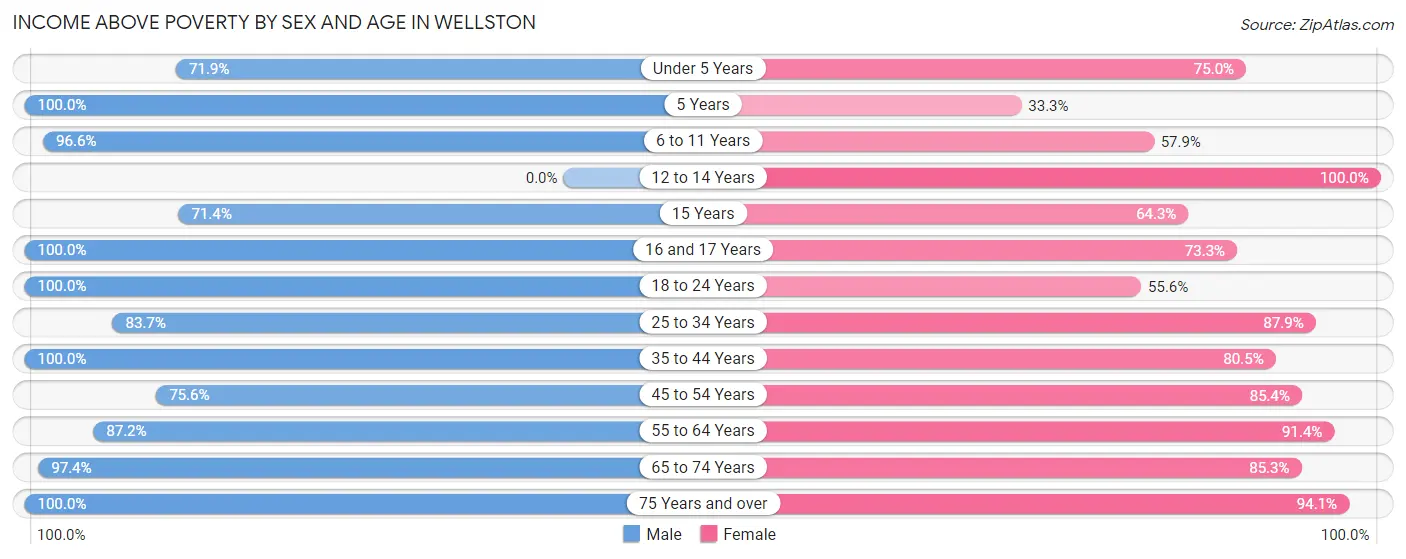
| Age Bracket | Male | Female |
| Under 5 Years | 23 (71.9%) | 21 (75.0%) |
| 5 Years | 5 (100.0%) | 2 (33.3%) |
| 6 to 11 Years | 28 (96.6%) | 11 (57.9%) |
| 12 to 14 Years | 0 (0.0%) | 5 (100.0%) |
| 15 Years | 5 (71.4%) | 9 (64.3%) |
| 16 and 17 Years | 7 (100.0%) | 11 (73.3%) |
| 18 to 24 Years | 48 (100.0%) | 10 (55.6%) |
| 25 to 34 Years | 41 (83.7%) | 51 (87.9%) |
| 35 to 44 Years | 39 (100.0%) | 33 (80.5%) |
| 45 to 54 Years | 34 (75.6%) | 35 (85.4%) |
| 55 to 64 Years | 41 (87.2%) | 53 (91.4%) |
| 65 to 74 Years | 114 (97.4%) | 29 (85.3%) |
| 75 Years and over | 7 (100.0%) | 16 (94.1%) |
| Total | 392 (89.9%) | 286 (80.8%) |
Income Below Poverty Among Married-Couple Families in Wellston
The poverty statistics for married-couple families in Wellston show that 4.3% or 5 of the total 115 families live below the poverty line. Families with 3 or 4 children have the highest poverty rate of 33.3%, comprising of 3 families. On the other hand, families with 1 or 2 children have the lowest poverty rate of 0.0%, which includes 0 families.
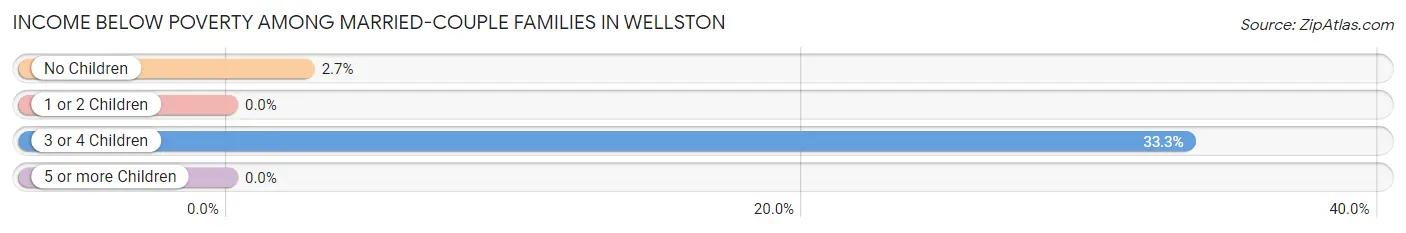
| Children | Above Poverty | Below Poverty |
| No Children | 73 (97.3%) | 2 (2.7%) |
| 1 or 2 Children | 31 (100.0%) | 0 (0.0%) |
| 3 or 4 Children | 6 (66.7%) | 3 (33.3%) |
| 5 or more Children | 0 (0.0%) | 0 (0.0%) |
| Total | 110 (95.7%) | 5 (4.3%) |
Income Below Poverty Among Single-Parent Households in Wellston
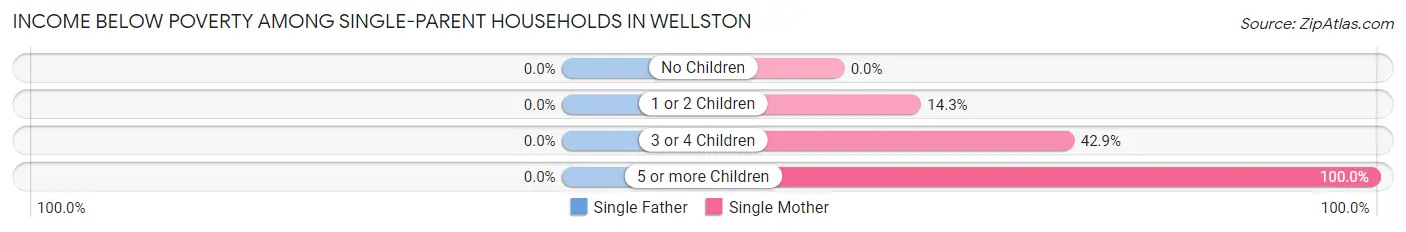
| Children | Single Father | Single Mother |
| No Children | 0 (0.0%) | 0 (0.0%) |
| 1 or 2 Children | 0 (0.0%) | 4 (14.3%) |
| 3 or 4 Children | 0 (0.0%) | 3 (42.9%) |
| 5 or more Children | 0 (0.0%) | 2 (100.0%) |
| Total | 0 (0.0%) | 9 (22.0%) |
Income Below Poverty Among Married-Couple vs Single-Parent Households in Wellston
The poverty data for Wellston shows that 5 of the married-couple family households (4.3%) and 9 of the single-parent households (16.7%) are living below the poverty level. Within the married-couple family households, those with 3 or 4 children have the highest poverty rate, with 3 households (33.3%) falling below the poverty line. Among the single-parent households, those with 5 or more children have the highest poverty rate, with 2 household (100.0%) living below poverty.
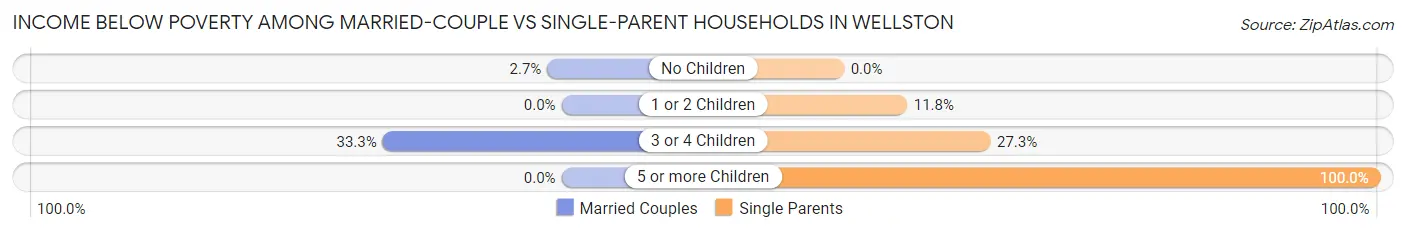
| Children | Married-Couple Families | Single-Parent Households |
| No Children | 2 (2.7%) | 0 (0.0%) |
| 1 or 2 Children | 0 (0.0%) | 4 (11.8%) |
| 3 or 4 Children | 3 (33.3%) | 3 (27.3%) |
| 5 or more Children | 0 (0.0%) | 2 (100.0%) |
| Total | 5 (4.3%) | 9 (16.7%) |
Race in Wellston
The most populous races in Wellston are White / Caucasian (718 | 90.4%), Two or more Races (42 | 5.3%), and Hispanic or Latino (30 | 3.8%).
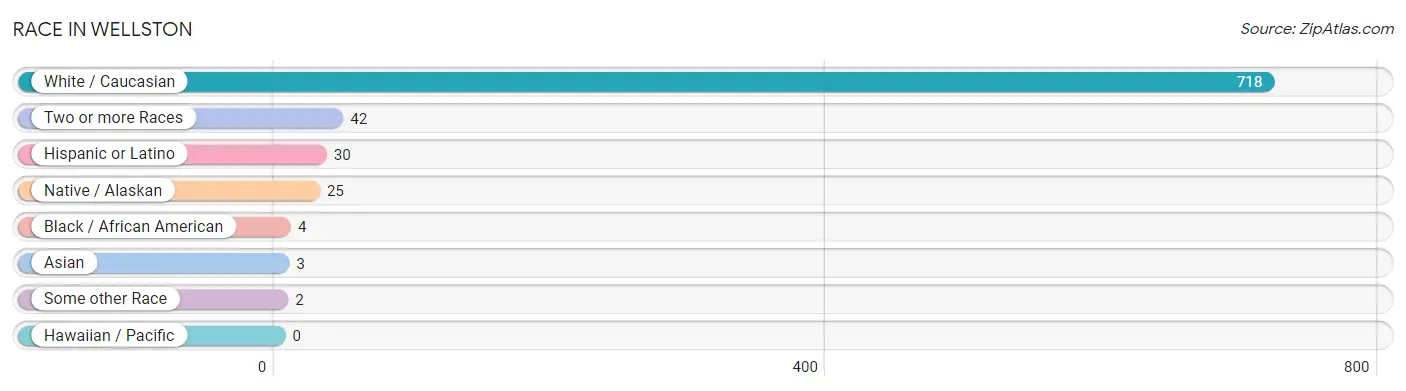
| Race | # Population | % Population |
| Asian | 3 | 0.4% |
| Black / African American | 4 | 0.5% |
| Hawaiian / Pacific | 0 | 0.0% |
| Hispanic or Latino | 30 | 3.8% |
| Native / Alaskan | 25 | 3.2% |
| White / Caucasian | 718 | 90.4% |
| Two or more Races | 42 | 5.3% |
| Some other Race | 2 | 0.3% |
| Total | 794 | 100.0% |
Ancestry in Wellston
The most populous ancestries reported in Wellston are English (166 | 20.9%), German (134 | 16.9%), Irish (116 | 14.6%), Mexican (26 | 3.3%), and Cherokee (25 | 3.2%), together accounting for 58.8% of all Wellston residents.
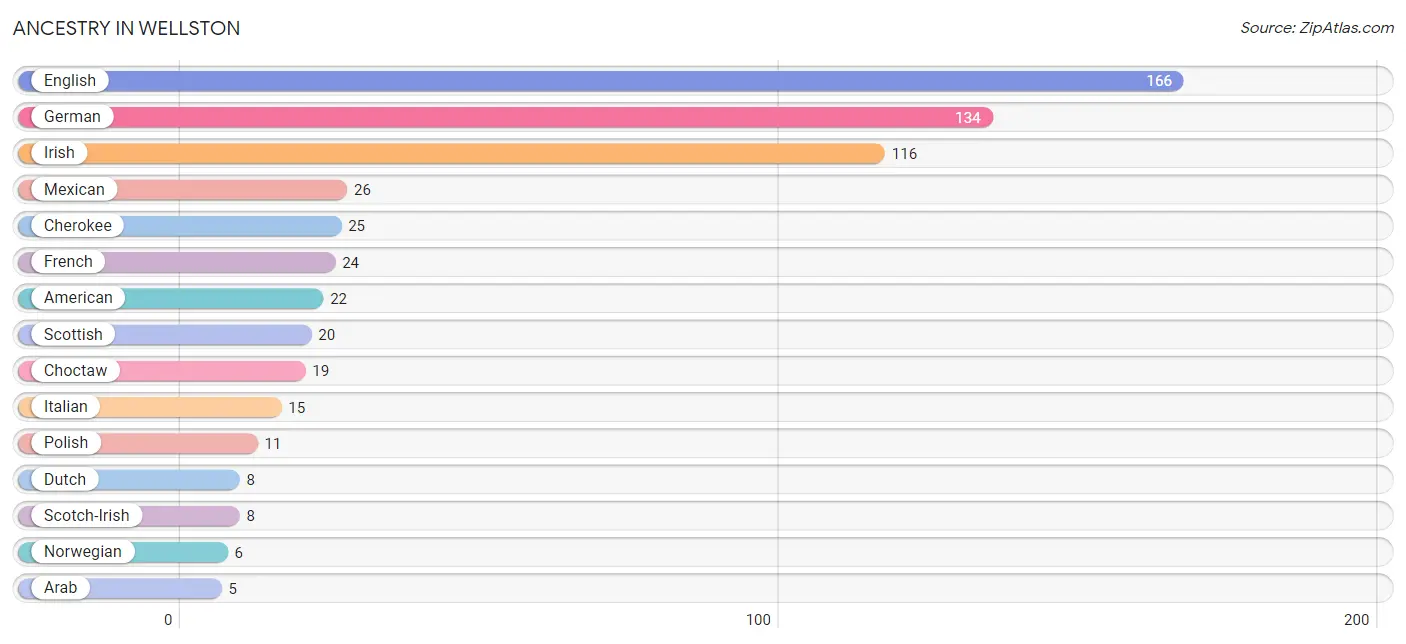
| Ancestry | # Population | % Population |
| American | 22 | 2.8% |
| Arab | 5 | 0.6% |
| Central American | 2 | 0.3% |
| Cherokee | 25 | 3.2% |
| Choctaw | 19 | 2.4% |
| Costa Rican | 2 | 0.3% |
| Croatian | 4 | 0.5% |
| Czech | 2 | 0.3% |
| Dutch | 8 | 1.0% |
| English | 166 | 20.9% |
| French | 24 | 3.0% |
| French American Indian | 2 | 0.3% |
| French Canadian | 3 | 0.4% |
| German | 134 | 16.9% |
| Indian (Asian) | 3 | 0.4% |
| Irish | 116 | 14.6% |
| Italian | 15 | 1.9% |
| Mexican | 26 | 3.3% |
| Moroccan | 5 | 0.6% |
| Northern European | 4 | 0.5% |
| Norwegian | 6 | 0.8% |
| Polish | 11 | 1.4% |
| Potawatomi | 1 | 0.1% |
| Scotch-Irish | 8 | 1.0% |
| Scottish | 20 | 2.5% |
| Spaniard | 2 | 0.3% |
| Welsh | 3 | 0.4% | View All 27 Rows |
Immigrants in Wellston
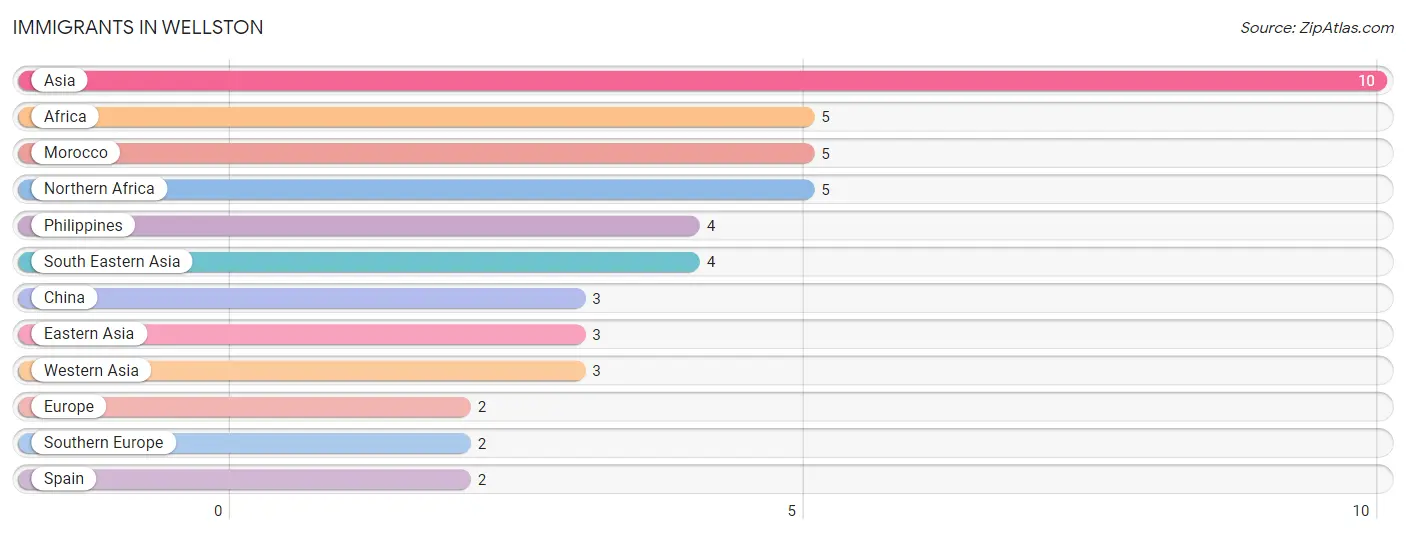
The most numerous immigrant groups reported in Wellston came from Asia (10 | 1.3%), Africa (5 | 0.6%), Morocco (5 | 0.6%), Northern Africa (5 | 0.6%), and Philippines (4 | 0.5%), together accounting for 3.6% of all Wellston residents.
| Immigration Origin | # Population | % Population |
| Africa | 5 | 0.6% |
| Asia | 10 | 1.3% |
| China | 3 | 0.4% |
| Eastern Asia | 3 | 0.4% |
| Europe | 2 | 0.3% |
| Morocco | 5 | 0.6% |
| Northern Africa | 5 | 0.6% |
| Philippines | 4 | 0.5% |
| South Eastern Asia | 4 | 0.5% |
| Southern Europe | 2 | 0.3% |
| Spain | 2 | 0.3% |
| Western Asia | 3 | 0.4% | View All 12 Rows |
Sex and Age in Wellston
Sex and Age in Wellston
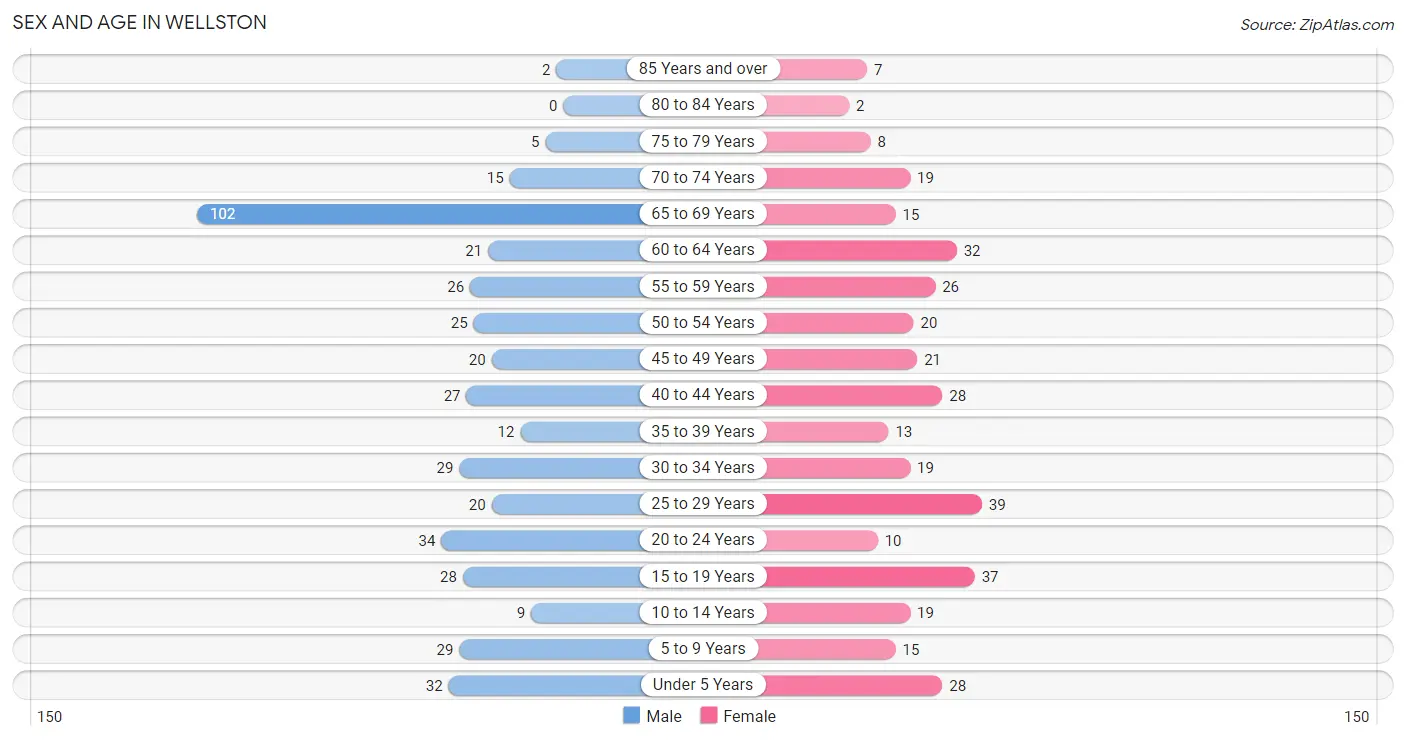
The most populous age groups in Wellston are 65 to 69 Years (102 | 23.4%) for men and 25 to 29 Years (39 | 10.9%) for women.
| Age Bracket | Male | Female |
| Under 5 Years | 32 (7.3%) | 28 (7.8%) |
| 5 to 9 Years | 29 (6.7%) | 15 (4.2%) |
| 10 to 14 Years | 9 (2.1%) | 19 (5.3%) |
| 15 to 19 Years | 28 (6.4%) | 37 (10.3%) |
| 20 to 24 Years | 34 (7.8%) | 10 (2.8%) |
| 25 to 29 Years | 20 (4.6%) | 39 (10.9%) |
| 30 to 34 Years | 29 (6.7%) | 19 (5.3%) |
| 35 to 39 Years | 12 (2.8%) | 13 (3.6%) |
| 40 to 44 Years | 27 (6.2%) | 28 (7.8%) |
| 45 to 49 Years | 20 (4.6%) | 21 (5.9%) |
| 50 to 54 Years | 25 (5.7%) | 20 (5.6%) |
| 55 to 59 Years | 26 (6.0%) | 26 (7.3%) |
| 60 to 64 Years | 21 (4.8%) | 32 (8.9%) |
| 65 to 69 Years | 102 (23.4%) | 15 (4.2%) |
| 70 to 74 Years | 15 (3.4%) | 19 (5.3%) |
| 75 to 79 Years | 5 (1.1%) | 8 (2.2%) |
| 80 to 84 Years | 0 (0.0%) | 2 (0.6%) |
| 85 Years and over | 2 (0.5%) | 7 (2.0%) |
| Total | 436 (100.0%) | 358 (100.0%) |
Families and Households in Wellston
Median Family Size in Wellston
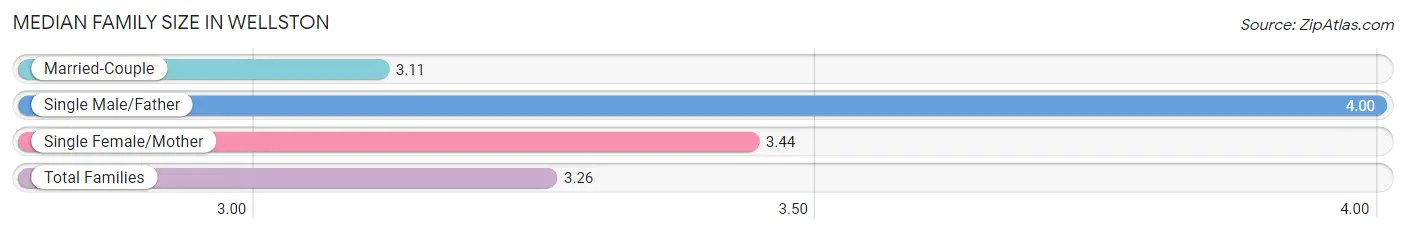
The median family size in Wellston is 3.26 persons per family, with single male/father families (13 | 7.7%) accounting for the largest median family size of 4 persons per family. On the other hand, married-couple families (115 | 68.0%) represent the smallest median family size with 3.11 persons per family.
| Family Type | # Families | Family Size |
| Married-Couple | 115 (68.0%) | 3.11 |
| Single Male/Father | 13 (7.7%) | 4.00 |
| Single Female/Mother | 41 (24.3%) | 3.44 |
| Total Families | 169 (100.0%) | 3.26 |
Median Household Size in Wellston
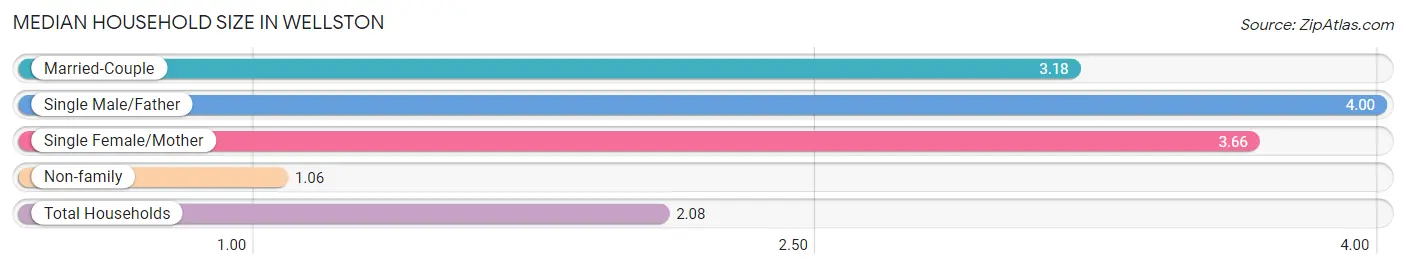
The median household size in Wellston is 2.08 persons per household, with single male/father households (13 | 3.4%) accounting for the largest median household size of 4 persons per household. non-family households (213 | 55.8%) represent the smallest median household size with 1.06 persons per household.
| Household Type | # Households | Household Size |
| Married-Couple | 115 (30.1%) | 3.18 |
| Single Male/Father | 13 (3.4%) | 4.00 |
| Single Female/Mother | 41 (10.7%) | 3.66 |
| Non-family | 213 (55.8%) | 1.06 |
| Total Households | 382 (100.0%) | 2.08 |
Household Size by Marriage Status in Wellston
Out of a total of 382 households in Wellston, 169 (44.2%) are family households, while 213 (55.8%) are nonfamily households. The most numerous type of family households are 2-person households, comprising 66, and the most common type of nonfamily households are 1-person households, comprising 201.
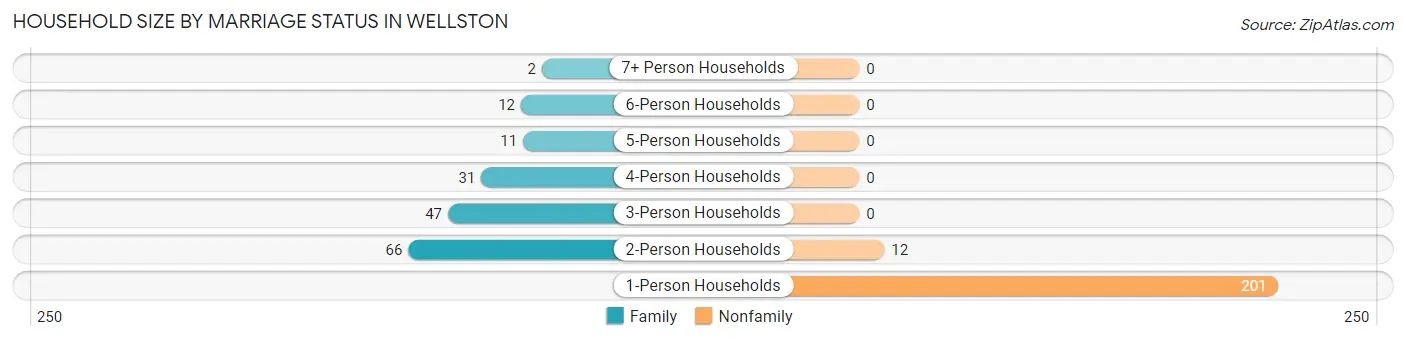
| Household Size | Family Households | Nonfamily Households |
| 1-Person Households | - | 201 (52.6%) |
| 2-Person Households | 66 (17.3%) | 12 (3.1%) |
| 3-Person Households | 47 (12.3%) | 0 (0.0%) |
| 4-Person Households | 31 (8.1%) | 0 (0.0%) |
| 5-Person Households | 11 (2.9%) | 0 (0.0%) |
| 6-Person Households | 12 (3.1%) | 0 (0.0%) |
| 7+ Person Households | 2 (0.5%) | 0 (0.0%) |
| Total | 169 (44.2%) | 213 (55.8%) |
Female Fertility in Wellston
Fertility by Age in Wellston
Average fertility rate in Wellston is 82.0 births per 1,000 women. Women in the age bracket of 20 to 34 years have the highest fertility rate with 206.0 births per 1,000 women. Women in the age bracket of 20 to 34 years acount for 100.0% of all women with births.
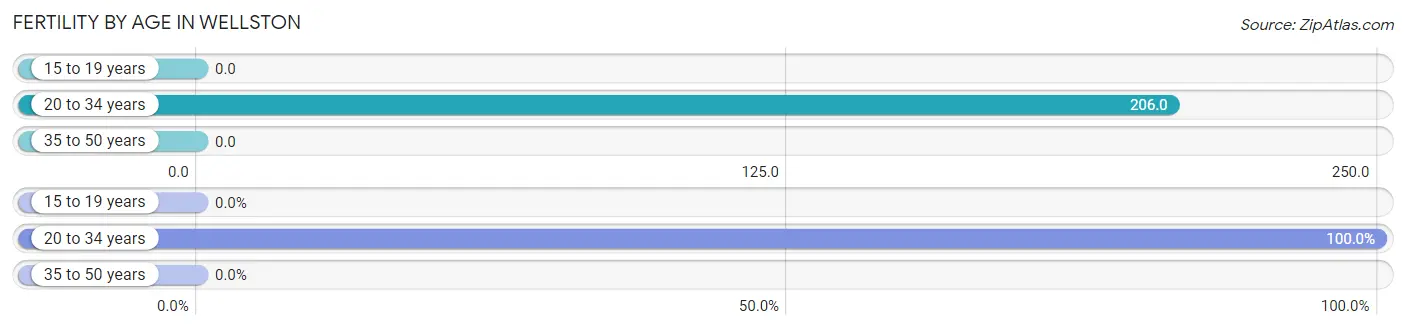
| Age Bracket | Women with Births | Births / 1,000 Women |
| 15 to 19 years | 0 (0.0%) | 0.0 |
| 20 to 34 years | 14 (100.0%) | 206.0 |
| 35 to 50 years | 0 (0.0%) | 0.0 |
| Total | 14 (100.0%) | 82.0 |
Fertility by Age by Marriage Status in Wellston
78.6% of women with births (14) in Wellston are married. The highest percentage of unmarried women with births falls into 20 to 34 years age bracket with 21.4% of them unmarried at the time of birth, while the lowest percentage of unmarried women with births belong to 20 to 34 years age bracket with 21.4% of them unmarried.
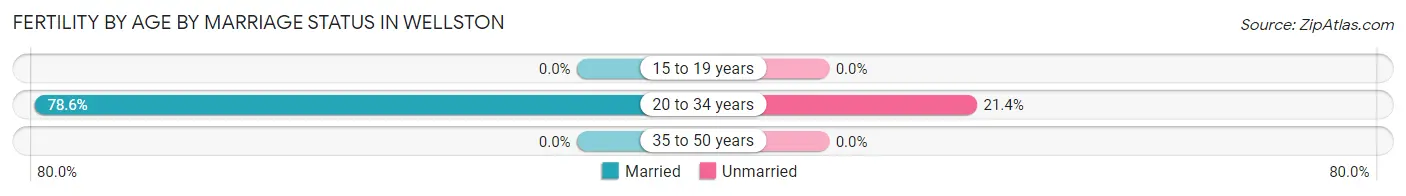
| Age Bracket | Married | Unmarried |
| 15 to 19 years | 0 (0.0%) | 0 (0.0%) |
| 20 to 34 years | 11 (78.6%) | 3 (21.4%) |
| 35 to 50 years | 0 (0.0%) | 0 (0.0%) |
| Total | 11 (78.6%) | 3 (21.4%) |
Fertility by Education in Wellston
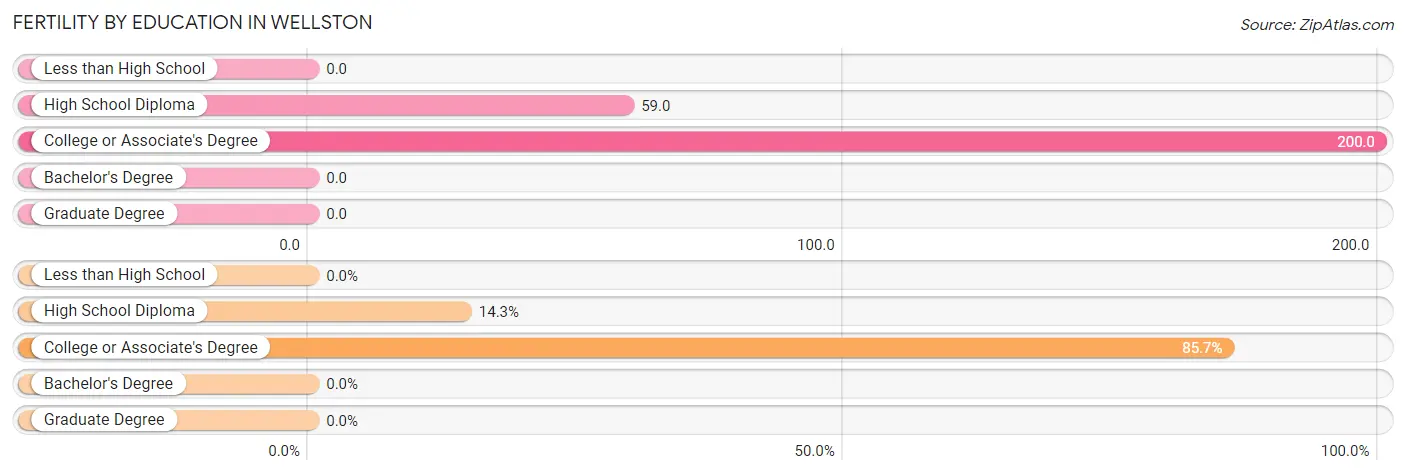
| Educational Attainment | Women with Births | Births / 1,000 Women |
| Less than High School | 0 (0.0%) | 0.0 |
| High School Diploma | 2 (14.3%) | 59.0 |
| College or Associate's Degree | 12 (85.7%) | 200.0 |
| Bachelor's Degree | 0 (0.0%) | 0.0 |
| Graduate Degree | 0 (0.0%) | 0.0 |
| Total | 14 (100.0%) | 82.0 |
Fertility by Education by Marriage Status in Wellston
21.4% of women with births in Wellston are unmarried. Women with the educational attainment of high school diploma are most likely to be married with 100.0% of them married at childbirth, while women with the educational attainment of college or associate's degree are least likely to be married with 25.0% of them unmarried at childbirth.
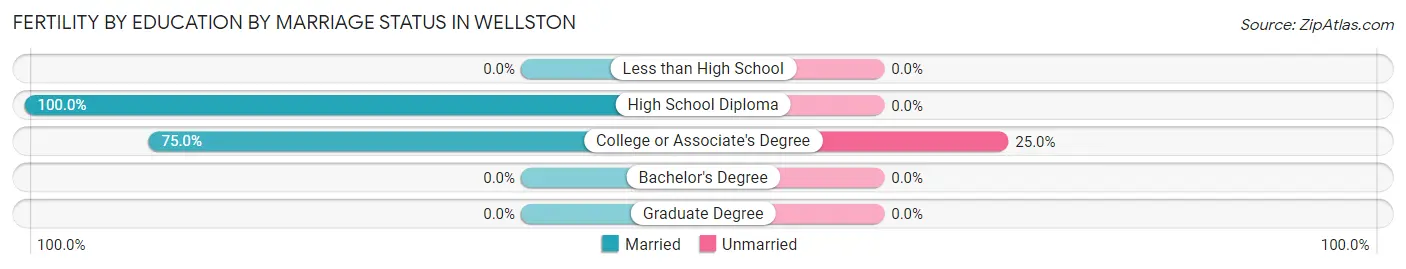
| Educational Attainment | Married | Unmarried |
| Less than High School | 0 (0.0%) | 0 (0.0%) |
| High School Diploma | 2 (100.0%) | 0 (0.0%) |
| College or Associate's Degree | 9 (75.0%) | 3 (25.0%) |
| Bachelor's Degree | 0 (0.0%) | 0 (0.0%) |
| Graduate Degree | 0 (0.0%) | 0 (0.0%) |
| Total | 11 (78.6%) | 3 (21.4%) |
Employment Characteristics in Wellston
Employment by Class of Employer in Wellston
Among the 319 employed individuals in Wellston, private company employees (226 | 70.9%), local government employees (21 | 6.6%), and federal government employees (21 | 6.6%) make up the most common classes of employment.
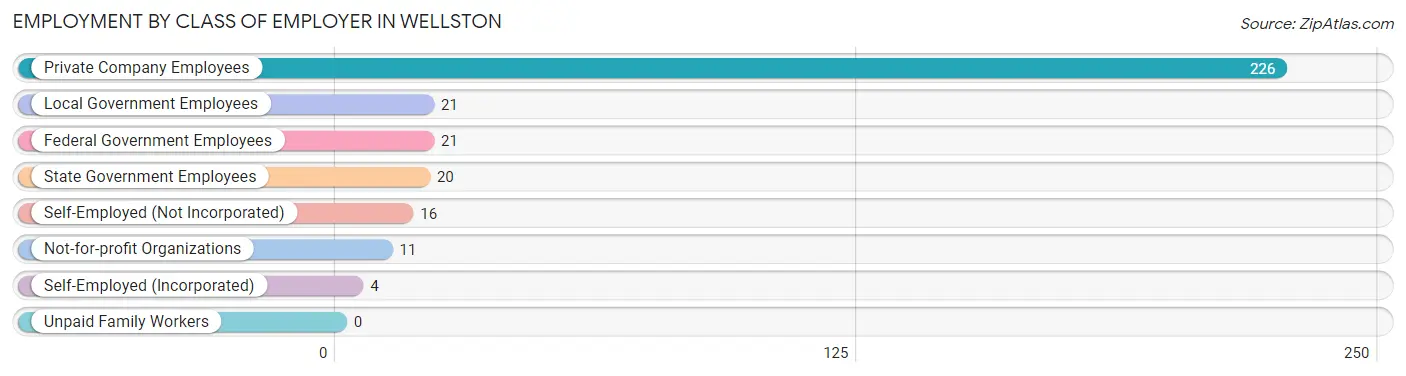
| Employer Class | # Employees | % Employees |
| Private Company Employees | 226 | 70.9% |
| Self-Employed (Incorporated) | 4 | 1.3% |
| Self-Employed (Not Incorporated) | 16 | 5.0% |
| Not-for-profit Organizations | 11 | 3.5% |
| Local Government Employees | 21 | 6.6% |
| State Government Employees | 20 | 6.3% |
| Federal Government Employees | 21 | 6.6% |
| Unpaid Family Workers | 0 | 0.0% |
| Total | 319 | 100.0% |
Employment Status by Age in Wellston
According to the labor force statistics for Wellston, out of the total population over 16 years of age (641), 52.7% or 338 individuals are in the labor force, with 4.4% or 15 of them unemployed. The age group with the highest labor force participation rate is 20 to 24 years, with 88.6% or 39 individuals in the labor force. Within the labor force, the 16 to 19 years age range has the highest percentage of unemployed individuals, with 16.7% or 4 of them being unemployed.
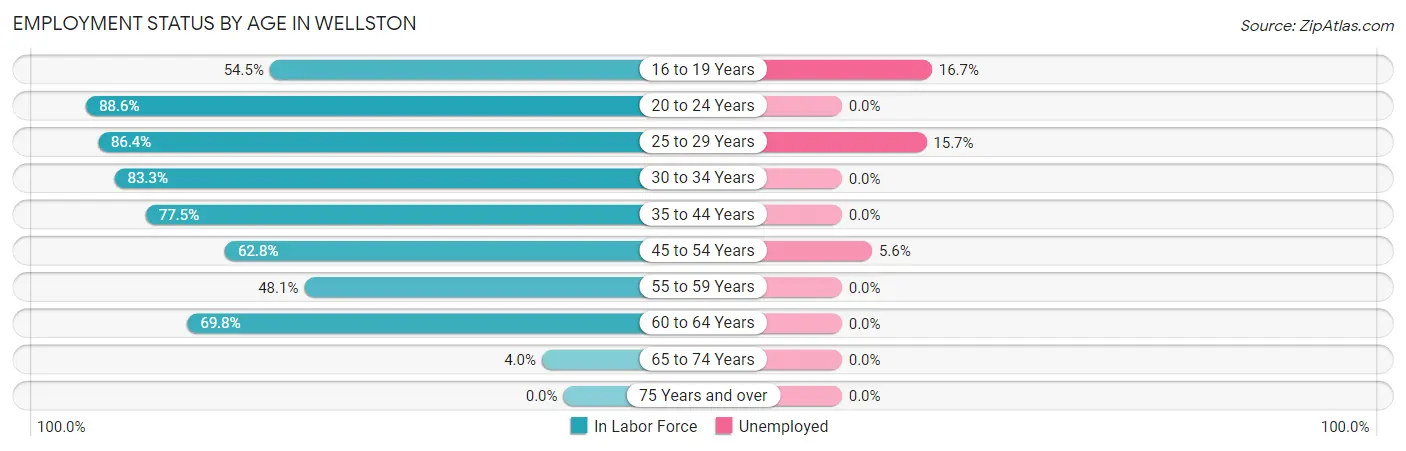
| Age Bracket | In Labor Force | Unemployed |
| 16 to 19 Years | 24 (54.5%) | 4 (16.7%) |
| 20 to 24 Years | 39 (88.6%) | 0 (0.0%) |
| 25 to 29 Years | 51 (86.4%) | 8 (15.7%) |
| 30 to 34 Years | 40 (83.3%) | 0 (0.0%) |
| 35 to 44 Years | 62 (77.5%) | 0 (0.0%) |
| 45 to 54 Years | 54 (62.8%) | 3 (5.6%) |
| 55 to 59 Years | 25 (48.1%) | 0 (0.0%) |
| 60 to 64 Years | 37 (69.8%) | 0 (0.0%) |
| 65 to 74 Years | 6 (4.0%) | 0 (0.0%) |
| 75 Years and over | 0 (0.0%) | 0 (0.0%) |
| Total | 338 (52.7%) | 15 (4.4%) |
Employment Status by Educational Attainment in Wellston
According to labor force statistics for Wellston, 71.2% of individuals (269) out of the total population between 25 and 64 years of age (378) are in the labor force, with 4.1% or 11 of them being unemployed. The group with the highest labor force participation rate are those with the educational attainment of bachelor's degree or higher, with 83.8% or 31 individuals in the labor force. Within the labor force, individuals with less than high school education have the highest percentage of unemployment, with 14.3% or 3 of them being unemployed.
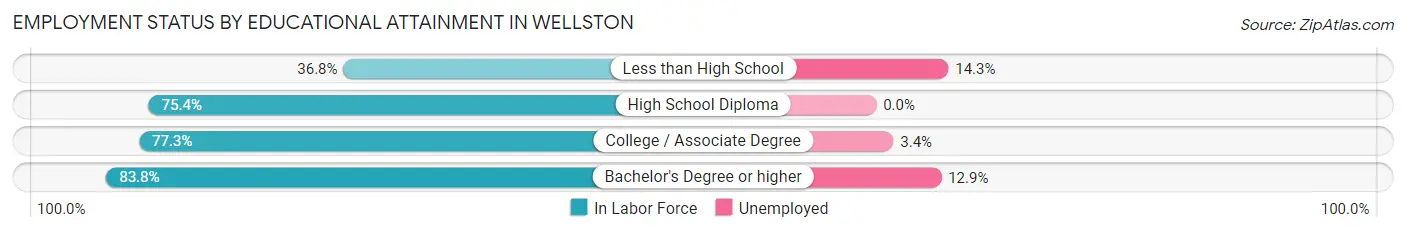
| Educational Attainment | In Labor Force | Unemployed |
| Less than High School | 21 (36.8%) | 8 (14.3%) |
| High School Diploma | 101 (75.4%) | 0 (0.0%) |
| College / Associate Degree | 116 (77.3%) | 5 (3.4%) |
| Bachelor's Degree or higher | 31 (83.8%) | 5 (12.9%) |
| Total | 269 (71.2%) | 15 (4.1%) |
Employment Occupations by Sex in Wellston
Management, Business, Science and Arts Occupations
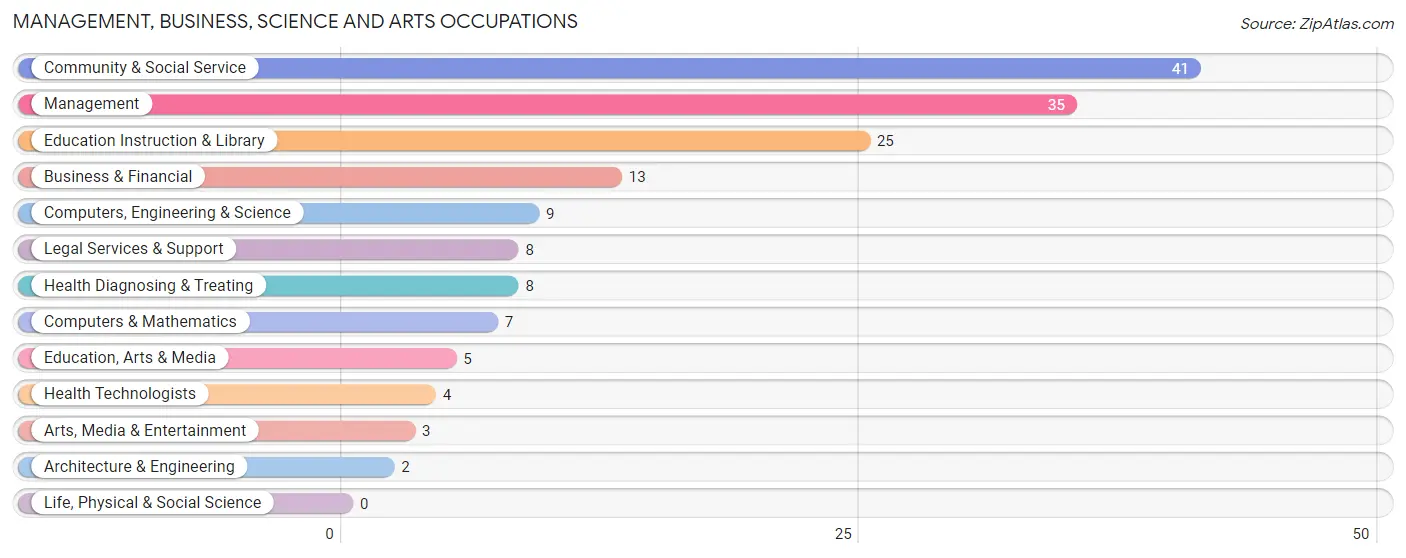
The most common Management, Business, Science and Arts occupations in Wellston are Community & Social Service (41 | 12.7%), Management (35 | 10.8%), Education Instruction & Library (25 | 7.7%), Business & Financial (13 | 4.0%), and Computers, Engineering & Science (9 | 2.8%).
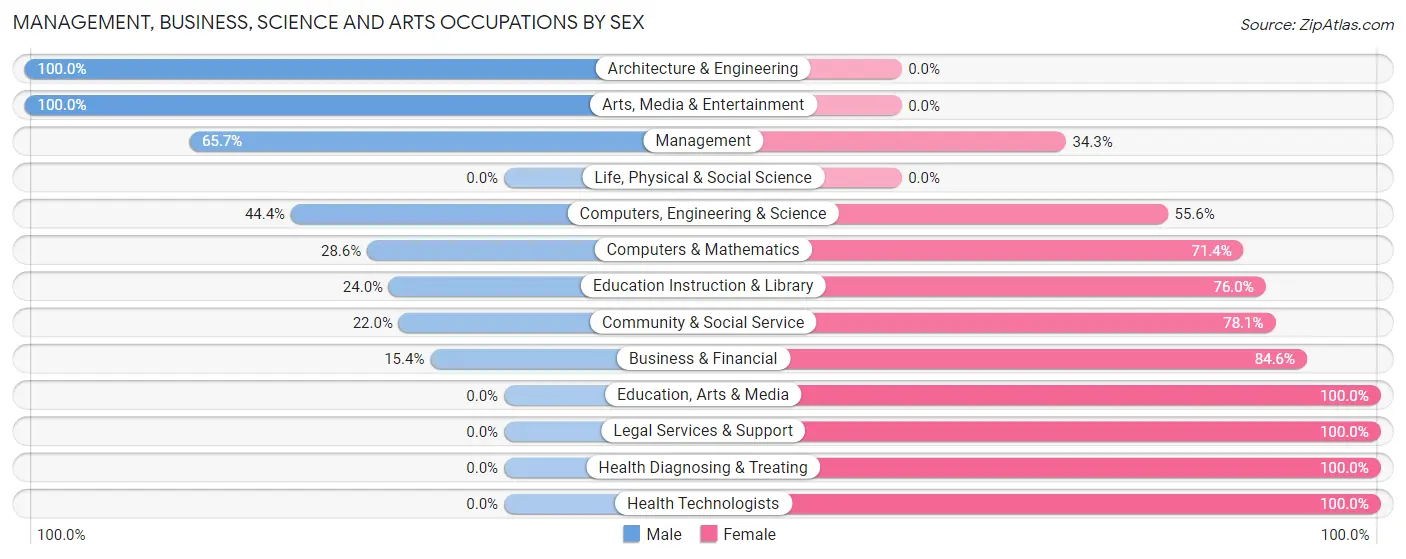
Management, Business, Science and Arts Occupations by Sex
Within the Management, Business, Science and Arts occupations in Wellston, the most male-oriented occupations are Architecture & Engineering (100.0%), Arts, Media & Entertainment (100.0%), and Management (65.7%), while the most female-oriented occupations are Education, Arts & Media (100.0%), Legal Services & Support (100.0%), and Health Diagnosing & Treating (100.0%).
| Occupation | Male | Female |
| Management | 23 (65.7%) | 12 (34.3%) |
| Business & Financial | 2 (15.4%) | 11 (84.6%) |
| Computers, Engineering & Science | 4 (44.4%) | 5 (55.6%) |
| Computers & Mathematics | 2 (28.6%) | 5 (71.4%) |
| Architecture & Engineering | 2 (100.0%) | 0 (0.0%) |
| Life, Physical & Social Science | 0 (0.0%) | 0 (0.0%) |
| Community & Social Service | 9 (22.0%) | 32 (78.0%) |
| Education, Arts & Media | 0 (0.0%) | 5 (100.0%) |
| Legal Services & Support | 0 (0.0%) | 8 (100.0%) |
| Education Instruction & Library | 6 (24.0%) | 19 (76.0%) |
| Arts, Media & Entertainment | 3 (100.0%) | 0 (0.0%) |
| Health Diagnosing & Treating | 0 (0.0%) | 8 (100.0%) |
| Health Technologists | 0 (0.0%) | 4 (100.0%) |
| Total (Category) | 38 (35.8%) | 68 (64.1%) |
| Total (Overall) | 175 (54.2%) | 148 (45.8%) |
Services Occupations
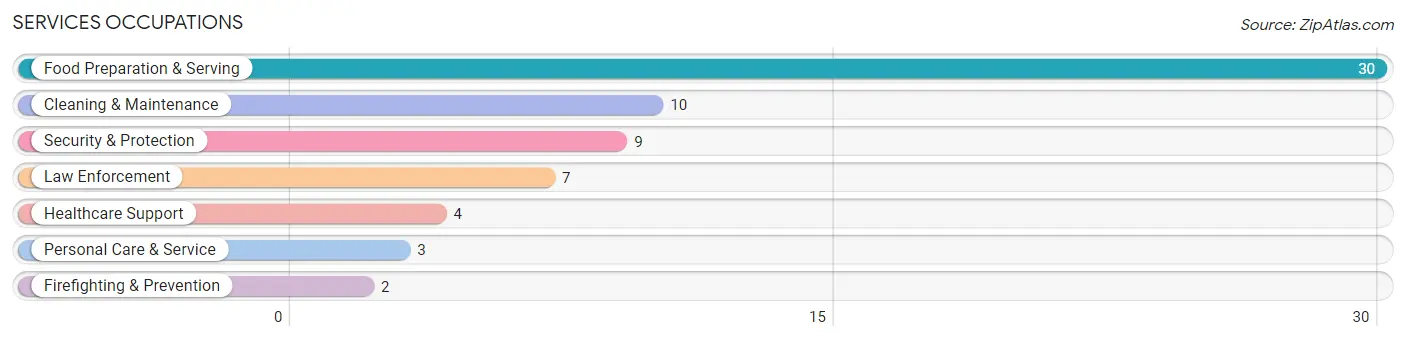
The most common Services occupations in Wellston are Food Preparation & Serving (30 | 9.3%), Cleaning & Maintenance (10 | 3.1%), Security & Protection (9 | 2.8%), Law Enforcement (7 | 2.2%), and Healthcare Support (4 | 1.2%).
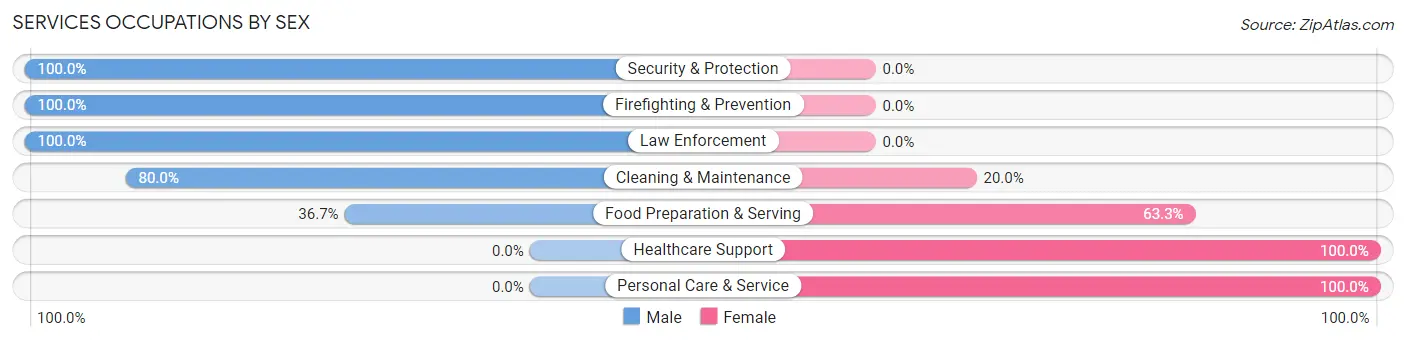
Services Occupations by Sex
Within the Services occupations in Wellston, the most male-oriented occupations are Security & Protection (100.0%), Firefighting & Prevention (100.0%), and Law Enforcement (100.0%), while the most female-oriented occupations are Healthcare Support (100.0%), Personal Care & Service (100.0%), and Food Preparation & Serving (63.3%).
| Occupation | Male | Female |
| Healthcare Support | 0 (0.0%) | 4 (100.0%) |
| Security & Protection | 9 (100.0%) | 0 (0.0%) |
| Firefighting & Prevention | 2 (100.0%) | 0 (0.0%) |
| Law Enforcement | 7 (100.0%) | 0 (0.0%) |
| Food Preparation & Serving | 11 (36.7%) | 19 (63.3%) |
| Cleaning & Maintenance | 8 (80.0%) | 2 (20.0%) |
| Personal Care & Service | 0 (0.0%) | 3 (100.0%) |
| Total (Category) | 28 (50.0%) | 28 (50.0%) |
| Total (Overall) | 175 (54.2%) | 148 (45.8%) |
Sales and Office Occupations
The most common Sales and Office occupations in Wellston are Office & Administration (38 | 11.8%), and Sales & Related (32 | 9.9%).
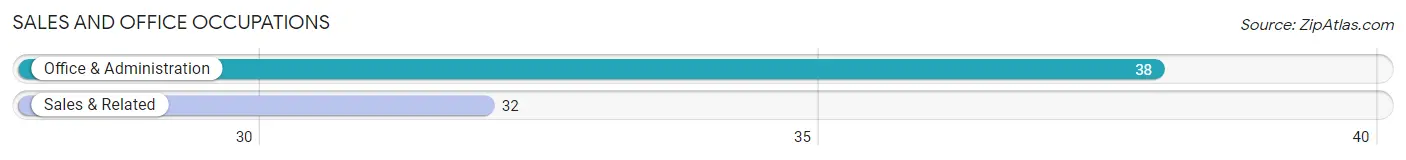
Sales and Office Occupations by Sex
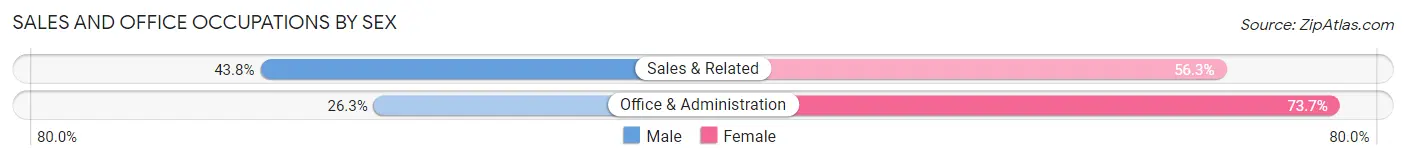
| Occupation | Male | Female |
| Sales & Related | 14 (43.8%) | 18 (56.2%) |
| Office & Administration | 10 (26.3%) | 28 (73.7%) |
| Total (Category) | 24 (34.3%) | 46 (65.7%) |
| Total (Overall) | 175 (54.2%) | 148 (45.8%) |
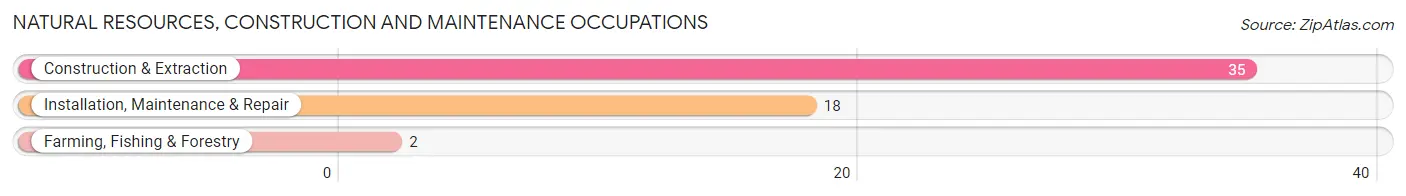
Natural Resources, Construction and Maintenance Occupations
The most common Natural Resources, Construction and Maintenance occupations in Wellston are Construction & Extraction (35 | 10.8%), Installation, Maintenance & Repair (18 | 5.6%), and Farming, Fishing & Forestry (2 | 0.6%).
Natural Resources, Construction and Maintenance Occupations by Sex
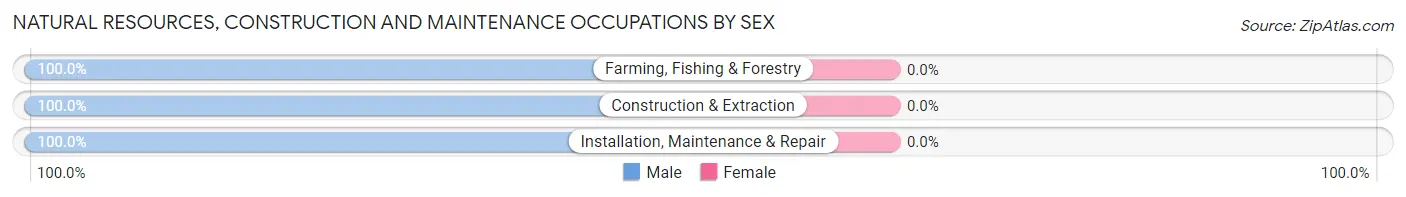
| Occupation | Male | Female |
| Farming, Fishing & Forestry | 2 (100.0%) | 0 (0.0%) |
| Construction & Extraction | 35 (100.0%) | 0 (0.0%) |
| Installation, Maintenance & Repair | 18 (100.0%) | 0 (0.0%) |
| Total (Category) | 55 (100.0%) | 0 (0.0%) |
| Total (Overall) | 175 (54.2%) | 148 (45.8%) |
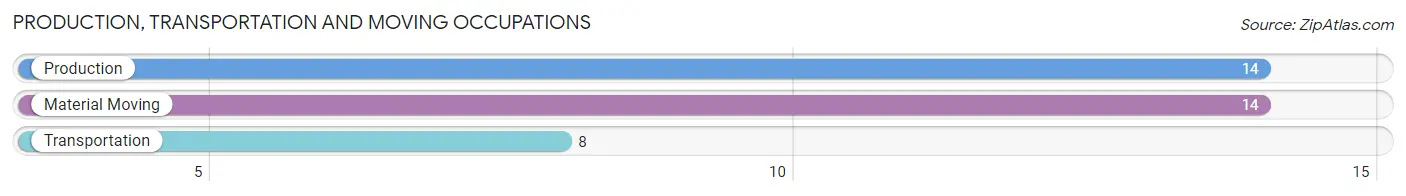
Production, Transportation and Moving Occupations
The most common Production, Transportation and Moving occupations in Wellston are Production (14 | 4.3%), Material Moving (14 | 4.3%), and Transportation (8 | 2.5%).
Production, Transportation and Moving Occupations by Sex
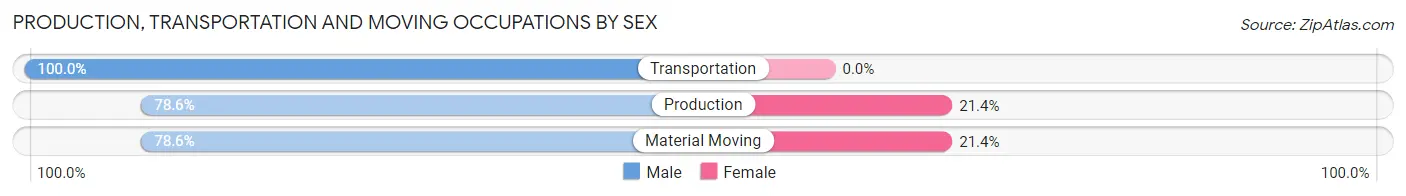
| Occupation | Male | Female |
| Production | 11 (78.6%) | 3 (21.4%) |
| Transportation | 8 (100.0%) | 0 (0.0%) |
| Material Moving | 11 (78.6%) | 3 (21.4%) |
| Total (Category) | 30 (83.3%) | 6 (16.7%) |
| Total (Overall) | 175 (54.2%) | 148 (45.8%) |
Employment Industries by Sex in Wellston
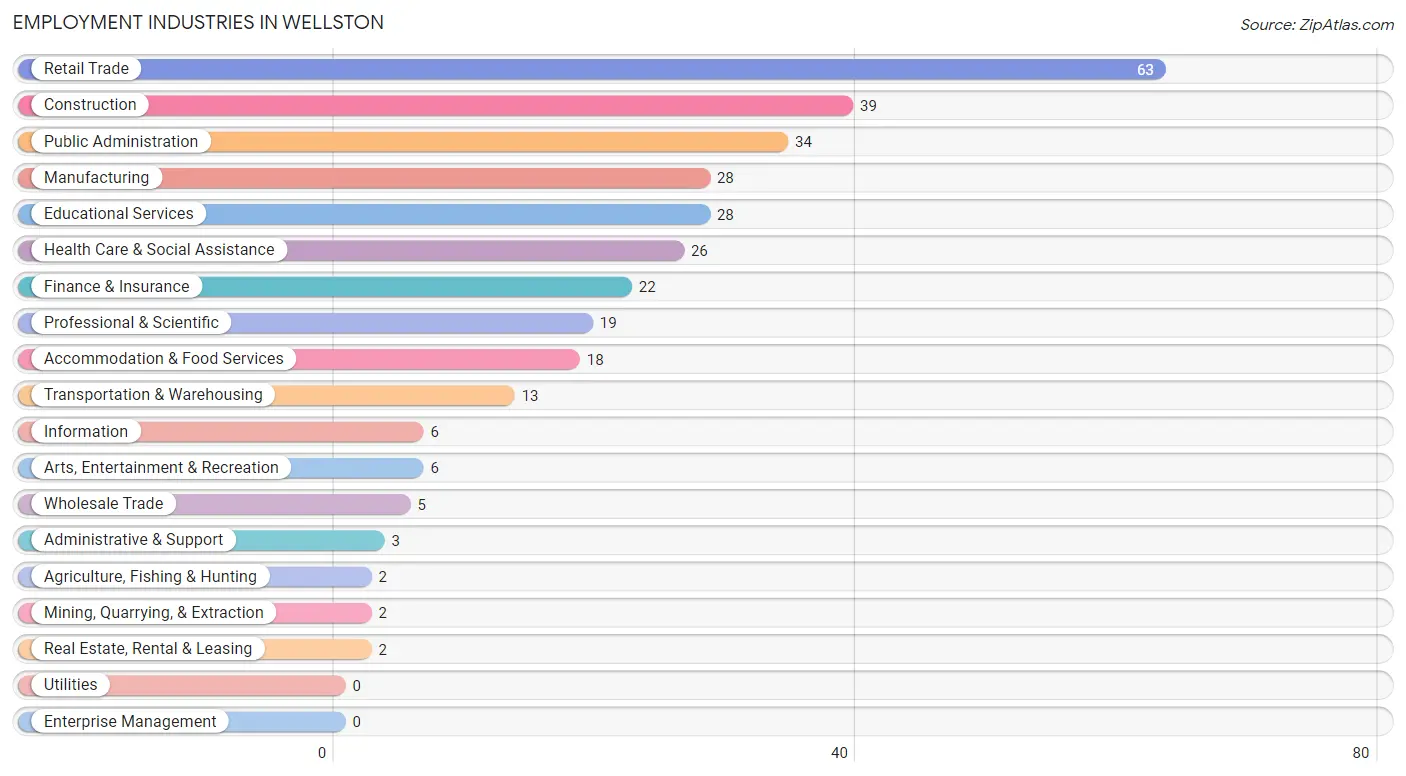
Employment Industries in Wellston
The major employment industries in Wellston include Retail Trade (63 | 19.5%), Construction (39 | 12.1%), Public Administration (34 | 10.5%), Manufacturing (28 | 8.7%), and Educational Services (28 | 8.7%).
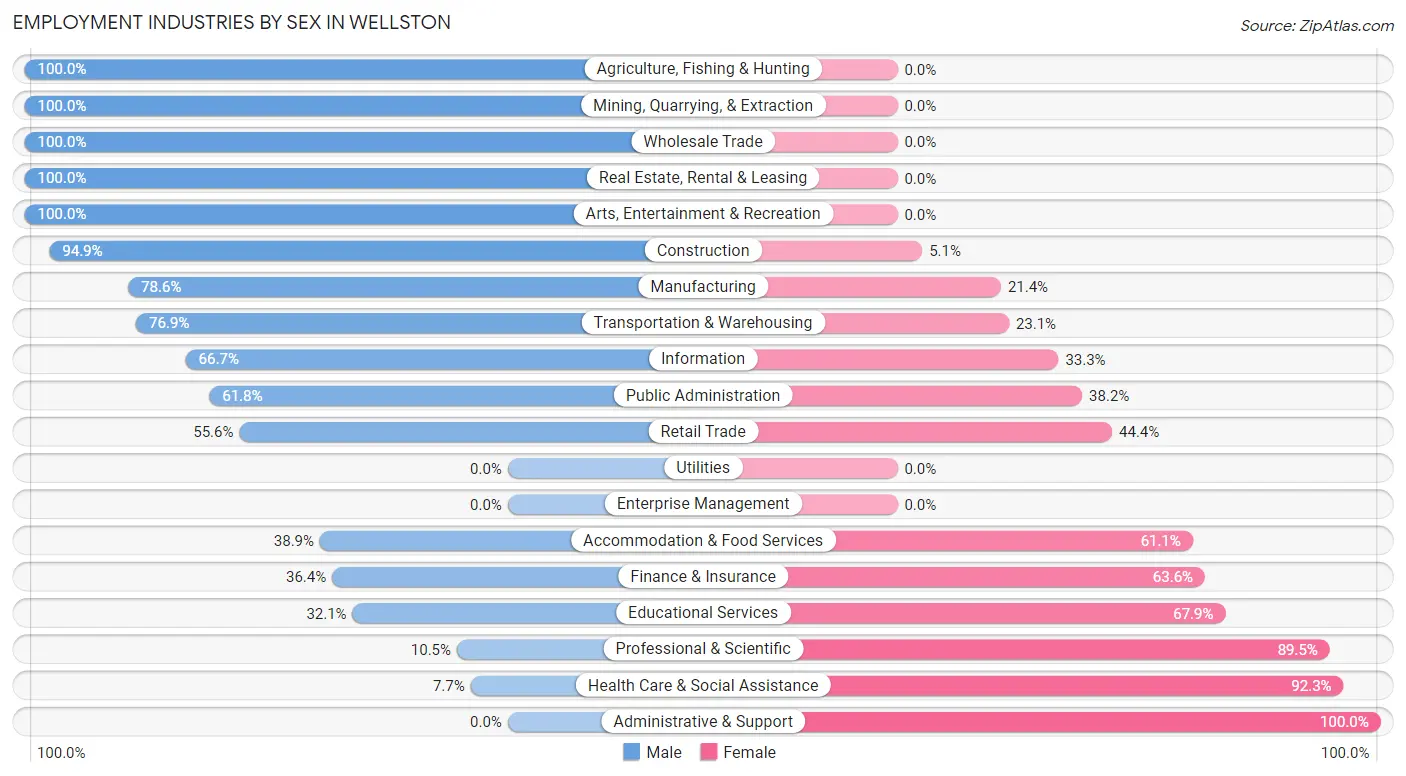
Employment Industries by Sex in Wellston
The Wellston industries that see more men than women are Agriculture, Fishing & Hunting (100.0%), Mining, Quarrying, & Extraction (100.0%), and Wholesale Trade (100.0%), whereas the industries that tend to have a higher number of women are Administrative & Support (100.0%), Health Care & Social Assistance (92.3%), and Professional & Scientific (89.5%).
| Industry | Male | Female |
| Agriculture, Fishing & Hunting | 2 (100.0%) | 0 (0.0%) |
| Mining, Quarrying, & Extraction | 2 (100.0%) | 0 (0.0%) |
| Construction | 37 (94.9%) | 2 (5.1%) |
| Manufacturing | 22 (78.6%) | 6 (21.4%) |
| Wholesale Trade | 5 (100.0%) | 0 (0.0%) |
| Retail Trade | 35 (55.6%) | 28 (44.4%) |
| Transportation & Warehousing | 10 (76.9%) | 3 (23.1%) |
| Utilities | 0 (0.0%) | 0 (0.0%) |
| Information | 4 (66.7%) | 2 (33.3%) |
| Finance & Insurance | 8 (36.4%) | 14 (63.6%) |
| Real Estate, Rental & Leasing | 2 (100.0%) | 0 (0.0%) |
| Professional & Scientific | 2 (10.5%) | 17 (89.5%) |
| Enterprise Management | 0 (0.0%) | 0 (0.0%) |
| Administrative & Support | 0 (0.0%) | 3 (100.0%) |
| Educational Services | 9 (32.1%) | 19 (67.9%) |
| Health Care & Social Assistance | 2 (7.7%) | 24 (92.3%) |
| Arts, Entertainment & Recreation | 6 (100.0%) | 0 (0.0%) |
| Accommodation & Food Services | 7 (38.9%) | 11 (61.1%) |
| Public Administration | 21 (61.8%) | 13 (38.2%) |
| Total | 175 (54.2%) | 148 (45.8%) |
Education in Wellston
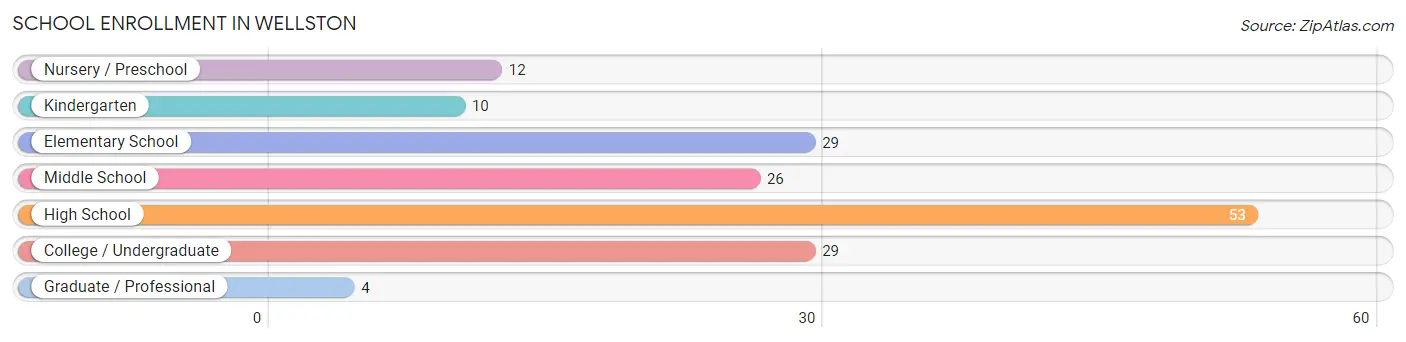
School Enrollment in Wellston
The most common levels of schooling among the 163 students in Wellston are high school (53 | 32.5%), elementary school (29 | 17.8%), and college / undergraduate (29 | 17.8%).
| School Level | # Students | % Students |
| Nursery / Preschool | 12 | 7.4% |
| Kindergarten | 10 | 6.1% |
| Elementary School | 29 | 17.8% |
| Middle School | 26 | 16.0% |
| High School | 53 | 32.5% |
| College / Undergraduate | 29 | 17.8% |
| Graduate / Professional | 4 | 2.5% |
| Total | 163 | 100.0% |
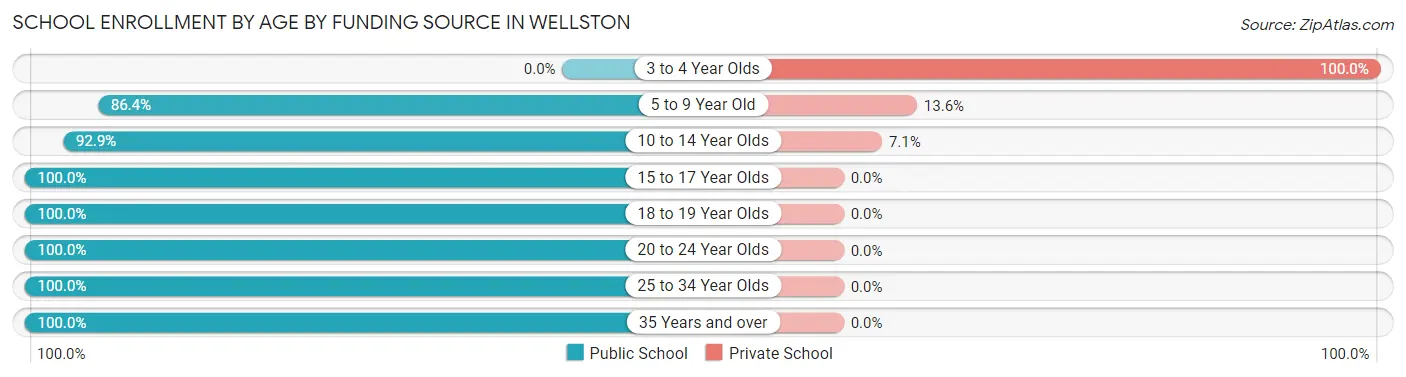
School Enrollment by Age by Funding Source in Wellston
Out of a total of 163 students who are enrolled in schools in Wellston, 13 (8.0%) attend a private institution, while the remaining 150 (92.0%) are enrolled in public schools. The age group of 3 to 4 year olds has the highest likelihood of being enrolled in private schools, with 5 (100.0% in the age bracket) enrolled. Conversely, the age group of 15 to 17 year olds has the lowest likelihood of being enrolled in a private school, with 41 (100.0% in the age bracket) attending a public institution.
| Age Bracket | Public School | Private School |
| 3 to 4 Year Olds | 0 (0.0%) | 5 (100.0%) |
| 5 to 9 Year Old | 38 (86.4%) | 6 (13.6%) |
| 10 to 14 Year Olds | 26 (92.9%) | 2 (7.1%) |
| 15 to 17 Year Olds | 41 (100.0%) | 0 (0.0%) |
| 18 to 19 Year Olds | 17 (100.0%) | 0 (0.0%) |
| 20 to 24 Year Olds | 4 (100.0%) | 0 (0.0%) |
| 25 to 34 Year Olds | 11 (100.0%) | 0 (0.0%) |
| 35 Years and over | 13 (100.0%) | 0 (0.0%) |
| Total | 150 (92.0%) | 13 (8.0%) |
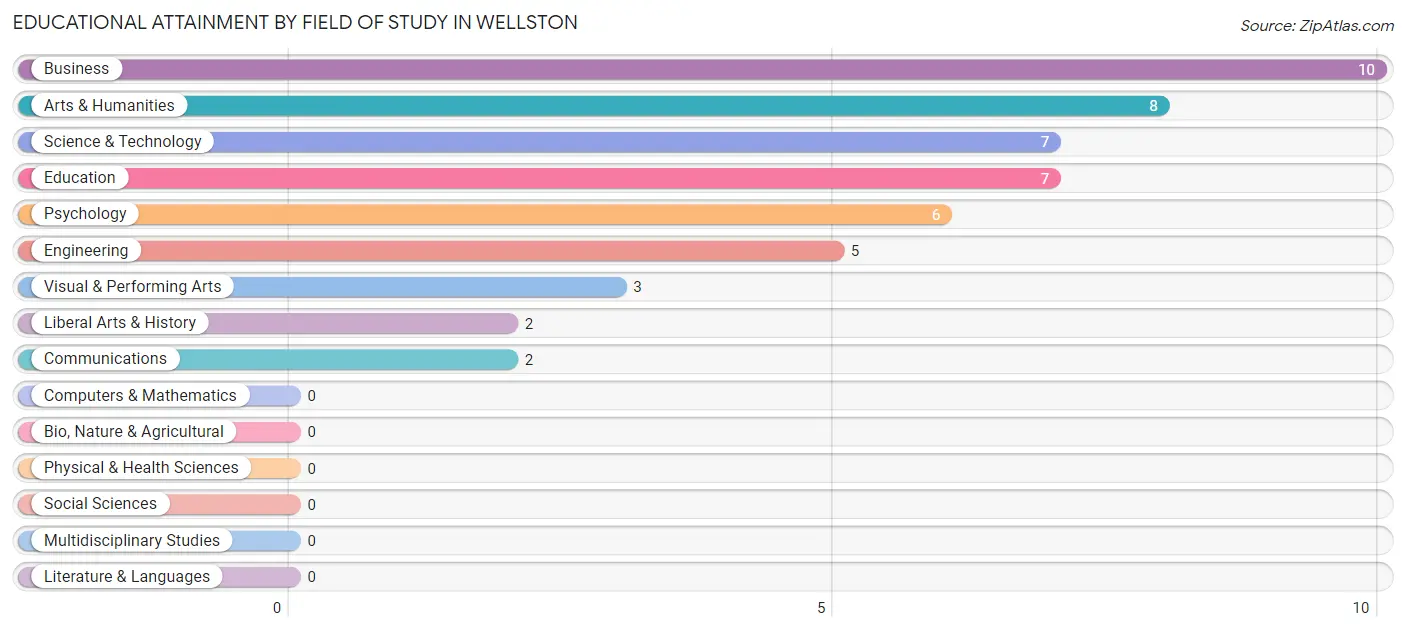
Educational Attainment by Field of Study in Wellston
Business (10 | 20.0%), arts & humanities (8 | 16.0%), science & technology (7 | 14.0%), education (7 | 14.0%), and psychology (6 | 12.0%) are the most common fields of study among 50 individuals in Wellston who have obtained a bachelor's degree or higher.
| Field of Study | # Graduates | % Graduates |
| Computers & Mathematics | 0 | 0.0% |
| Bio, Nature & Agricultural | 0 | 0.0% |
| Physical & Health Sciences | 0 | 0.0% |
| Psychology | 6 | 12.0% |
| Social Sciences | 0 | 0.0% |
| Engineering | 5 | 10.0% |
| Multidisciplinary Studies | 0 | 0.0% |
| Science & Technology | 7 | 14.0% |
| Business | 10 | 20.0% |
| Education | 7 | 14.0% |
| Literature & Languages | 0 | 0.0% |
| Liberal Arts & History | 2 | 4.0% |
| Visual & Performing Arts | 3 | 6.0% |
| Communications | 2 | 4.0% |
| Arts & Humanities | 8 | 16.0% |
| Total | 50 | 100.0% |
Transportation & Commute in Wellston
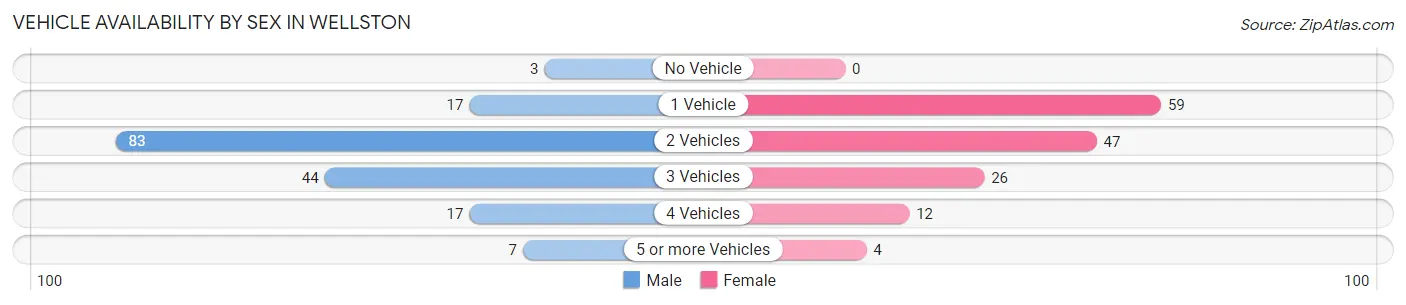
Vehicle Availability by Sex in Wellston
The most prevalent vehicle ownership categories in Wellston are males with 2 vehicles (83, accounting for 48.5%) and females with 2 vehicles (47, making up 56.1%).
| Vehicles Available | Male | Female |
| No Vehicle | 3 (1.8%) | 0 (0.0%) |
| 1 Vehicle | 17 (9.9%) | 59 (39.9%) |
| 2 Vehicles | 83 (48.5%) | 47 (31.8%) |
| 3 Vehicles | 44 (25.7%) | 26 (17.6%) |
| 4 Vehicles | 17 (9.9%) | 12 (8.1%) |
| 5 or more Vehicles | 7 (4.1%) | 4 (2.7%) |
| Total | 171 (100.0%) | 148 (100.0%) |
Commute Time in Wellston
The most frequently occuring commute durations in Wellston are 45 to 59 minutes (60 commuters, 20.3%), 5 to 9 minutes (45 commuters, 15.2%), and 30 to 34 minutes (38 commuters, 12.9%).
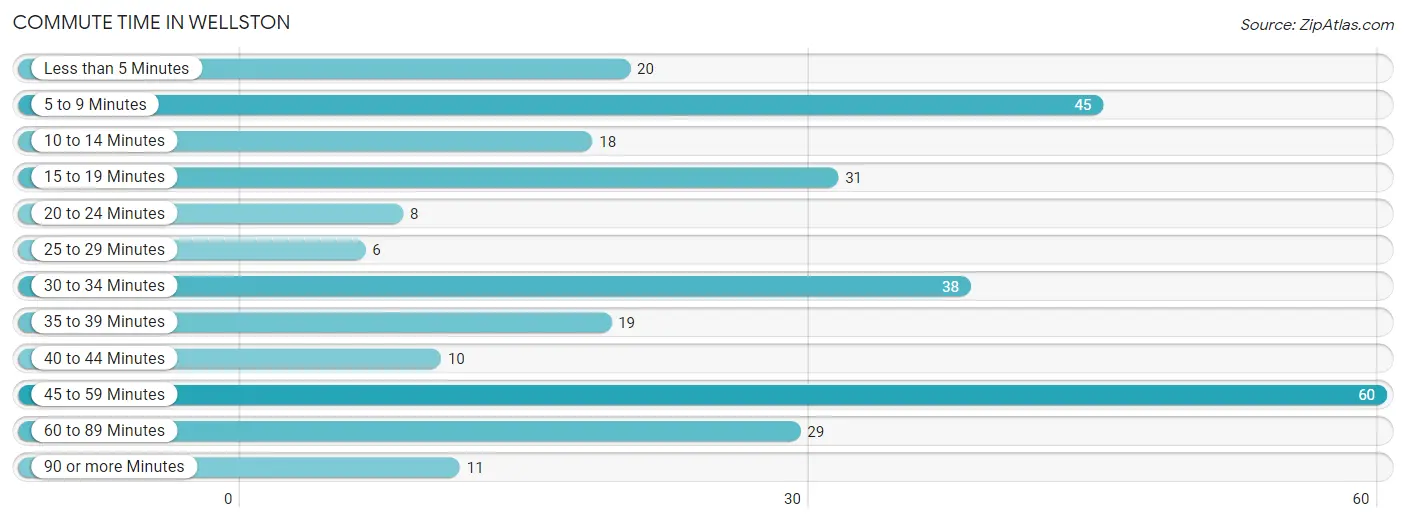
| Commute Time | # Commuters | % Commuters |
| Less than 5 Minutes | 20 | 6.8% |
| 5 to 9 Minutes | 45 | 15.2% |
| 10 to 14 Minutes | 18 | 6.1% |
| 15 to 19 Minutes | 31 | 10.5% |
| 20 to 24 Minutes | 8 | 2.7% |
| 25 to 29 Minutes | 6 | 2.0% |
| 30 to 34 Minutes | 38 | 12.9% |
| 35 to 39 Minutes | 19 | 6.4% |
| 40 to 44 Minutes | 10 | 3.4% |
| 45 to 59 Minutes | 60 | 20.3% |
| 60 to 89 Minutes | 29 | 9.8% |
| 90 or more Minutes | 11 | 3.7% |
Commute Time by Sex in Wellston
The most common commute times in Wellston are 45 to 59 minutes (40 commuters, 25.2%) for males and 5 to 9 minutes (31 commuters, 22.8%) for females.
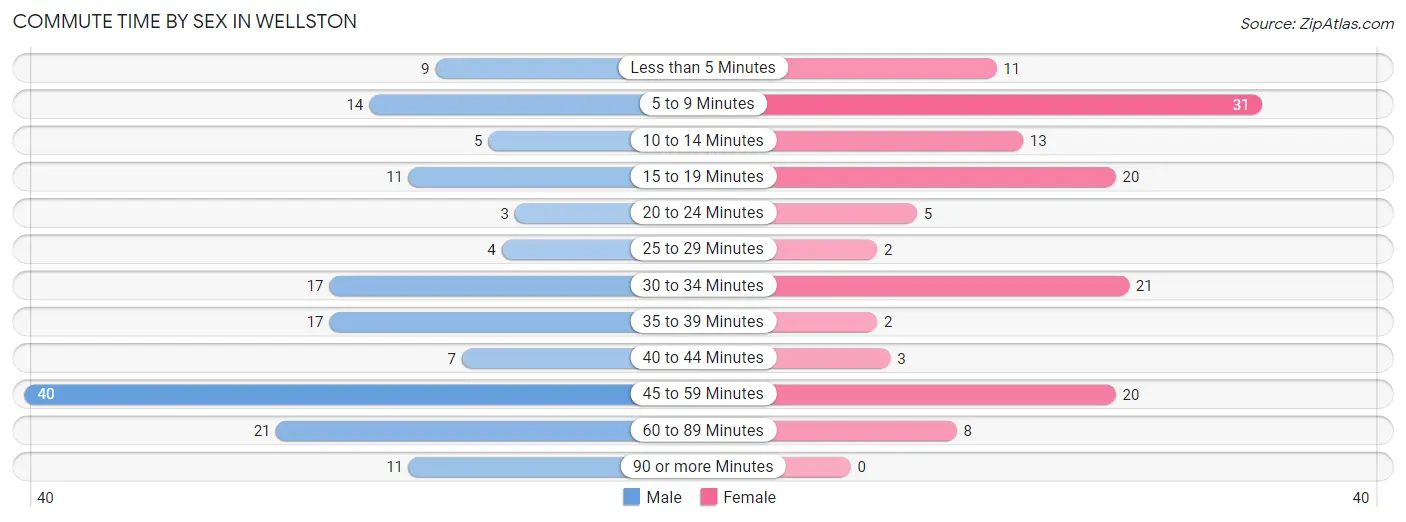
| Commute Time | Male | Female |
| Less than 5 Minutes | 9 (5.7%) | 11 (8.1%) |
| 5 to 9 Minutes | 14 (8.8%) | 31 (22.8%) |
| 10 to 14 Minutes | 5 (3.1%) | 13 (9.6%) |
| 15 to 19 Minutes | 11 (6.9%) | 20 (14.7%) |
| 20 to 24 Minutes | 3 (1.9%) | 5 (3.7%) |
| 25 to 29 Minutes | 4 (2.5%) | 2 (1.5%) |
| 30 to 34 Minutes | 17 (10.7%) | 21 (15.4%) |
| 35 to 39 Minutes | 17 (10.7%) | 2 (1.5%) |
| 40 to 44 Minutes | 7 (4.4%) | 3 (2.2%) |
| 45 to 59 Minutes | 40 (25.2%) | 20 (14.7%) |
| 60 to 89 Minutes | 21 (13.2%) | 8 (5.9%) |
| 90 or more Minutes | 11 (6.9%) | 0 (0.0%) |
Time of Departure to Work by Sex in Wellston
The most frequent times of departure to work in Wellston are 12:00 AM to 4:59 AM (33, 20.7%) for males and 7:30 AM to 7:59 AM (38, 27.9%) for females.
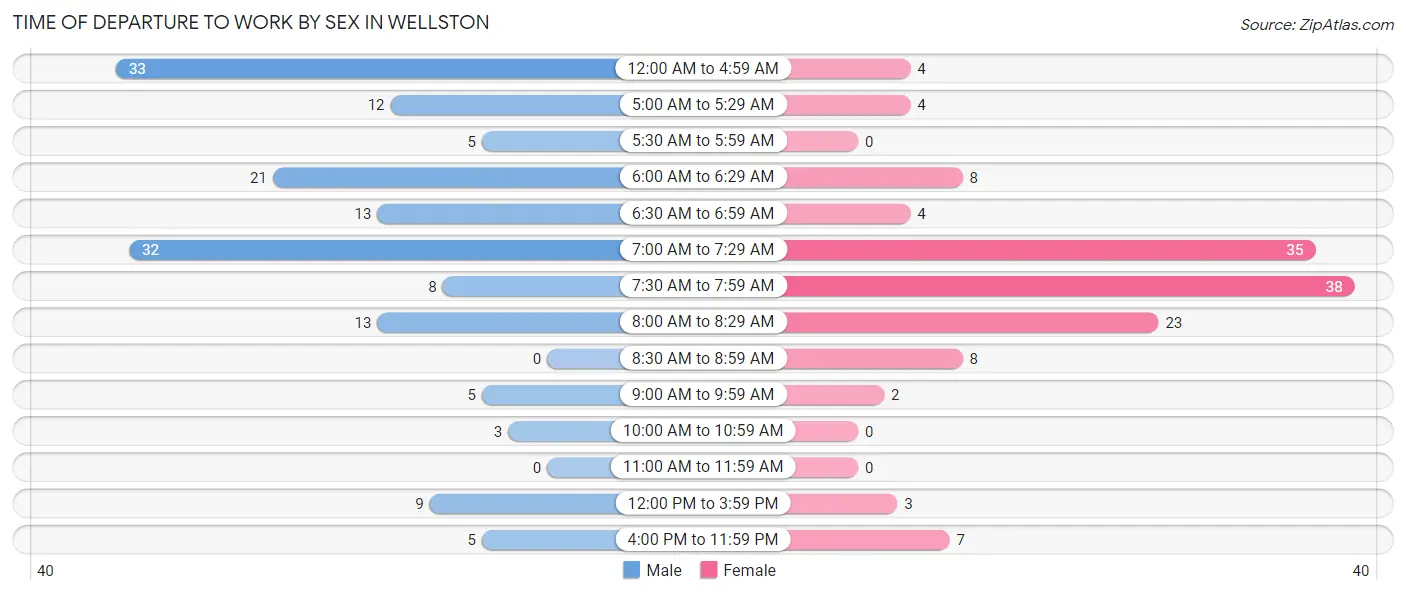
| Time of Departure | Male | Female |
| 12:00 AM to 4:59 AM | 33 (20.7%) | 4 (2.9%) |
| 5:00 AM to 5:29 AM | 12 (7.5%) | 4 (2.9%) |
| 5:30 AM to 5:59 AM | 5 (3.1%) | 0 (0.0%) |
| 6:00 AM to 6:29 AM | 21 (13.2%) | 8 (5.9%) |
| 6:30 AM to 6:59 AM | 13 (8.2%) | 4 (2.9%) |
| 7:00 AM to 7:29 AM | 32 (20.1%) | 35 (25.7%) |
| 7:30 AM to 7:59 AM | 8 (5.0%) | 38 (27.9%) |
| 8:00 AM to 8:29 AM | 13 (8.2%) | 23 (16.9%) |
| 8:30 AM to 8:59 AM | 0 (0.0%) | 8 (5.9%) |
| 9:00 AM to 9:59 AM | 5 (3.1%) | 2 (1.5%) |
| 10:00 AM to 10:59 AM | 3 (1.9%) | 0 (0.0%) |
| 11:00 AM to 11:59 AM | 0 (0.0%) | 0 (0.0%) |
| 12:00 PM to 3:59 PM | 9 (5.7%) | 3 (2.2%) |
| 4:00 PM to 11:59 PM | 5 (3.1%) | 7 (5.1%) |
| Total | 159 (100.0%) | 136 (100.0%) |
Housing Occupancy in Wellston
Occupancy by Ownership in Wellston
Of the total 382 dwellings in Wellston, owner-occupied units account for 304 (79.6%), while renter-occupied units make up 78 (20.4%).
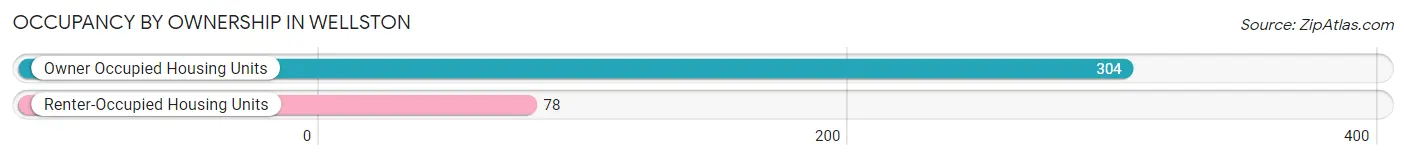
| Occupancy | # Housing Units | % Housing Units |
| Owner Occupied Housing Units | 304 | 79.6% |
| Renter-Occupied Housing Units | 78 | 20.4% |
| Total Occupied Housing Units | 382 | 100.0% |
Occupancy by Household Size in Wellston
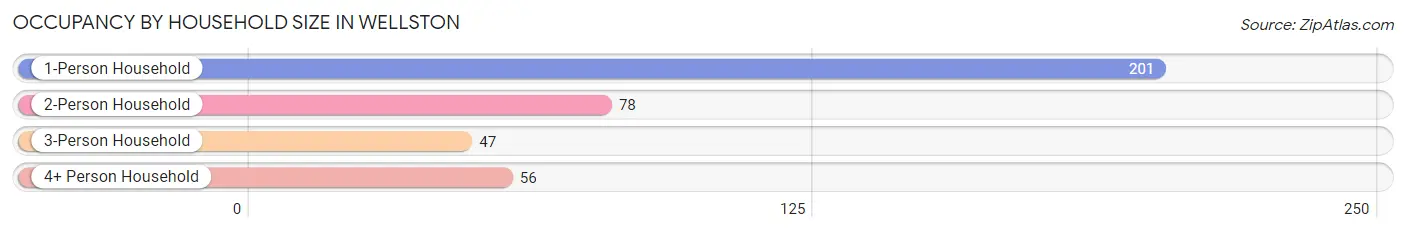
| Household Size | # Housing Units | % Housing Units |
| 1-Person Household | 201 | 52.6% |
| 2-Person Household | 78 | 20.4% |
| 3-Person Household | 47 | 12.3% |
| 4+ Person Household | 56 | 14.7% |
| Total Housing Units | 382 | 100.0% |
Occupancy by Ownership by Household Size in Wellston
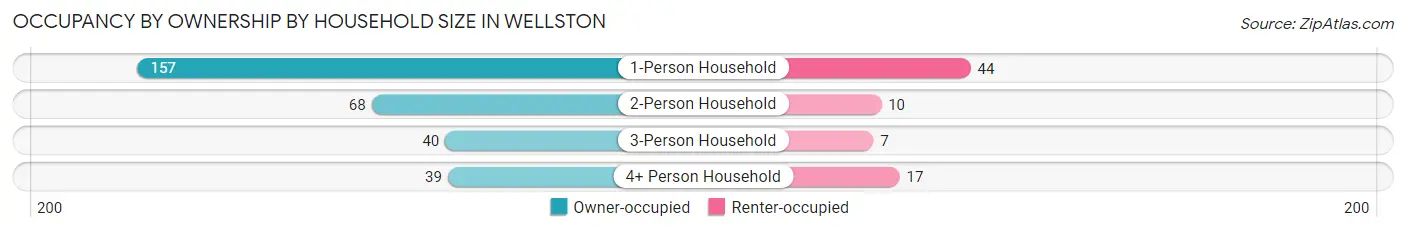
| Household Size | Owner-occupied | Renter-occupied |
| 1-Person Household | 157 (78.1%) | 44 (21.9%) |
| 2-Person Household | 68 (87.2%) | 10 (12.8%) |
| 3-Person Household | 40 (85.1%) | 7 (14.9%) |
| 4+ Person Household | 39 (69.6%) | 17 (30.4%) |
| Total Housing Units | 304 (79.6%) | 78 (20.4%) |
Occupancy by Educational Attainment in Wellston
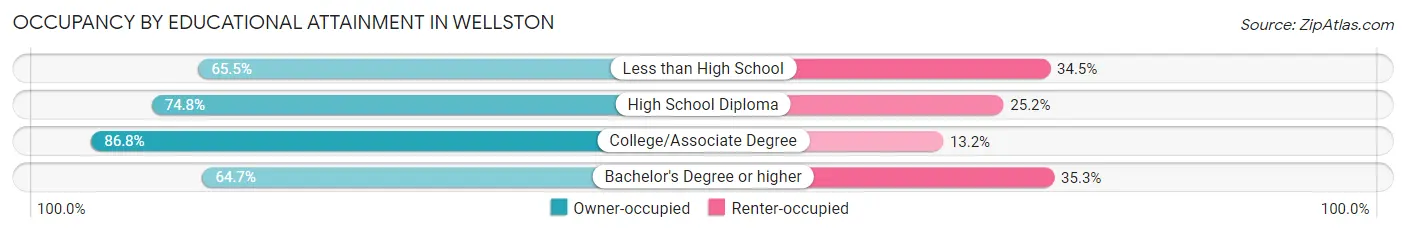
| Household Size | Owner-occupied | Renter-occupied |
| Less than High School | 19 (65.5%) | 10 (34.5%) |
| High School Diploma | 86 (74.8%) | 29 (25.2%) |
| College/Associate Degree | 177 (86.8%) | 27 (13.2%) |
| Bachelor's Degree or higher | 22 (64.7%) | 12 (35.3%) |
Occupancy by Age of Householder in Wellston
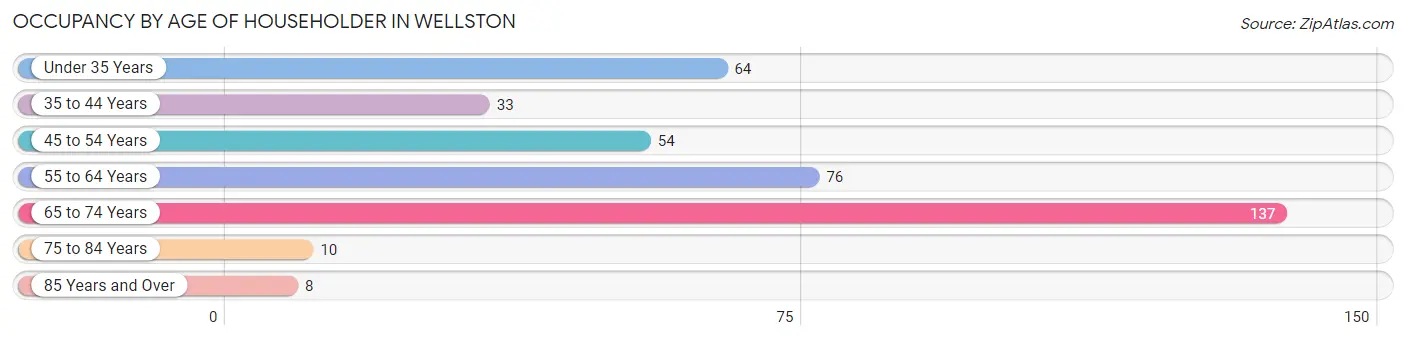
| Age Bracket | # Households | % Households |
| Under 35 Years | 64 | 16.8% |
| 35 to 44 Years | 33 | 8.6% |
| 45 to 54 Years | 54 | 14.1% |
| 55 to 64 Years | 76 | 19.9% |
| 65 to 74 Years | 137 | 35.9% |
| 75 to 84 Years | 10 | 2.6% |
| 85 Years and Over | 8 | 2.1% |
| Total | 382 | 100.0% |
Housing Finances in Wellston
Median Income by Occupancy in Wellston
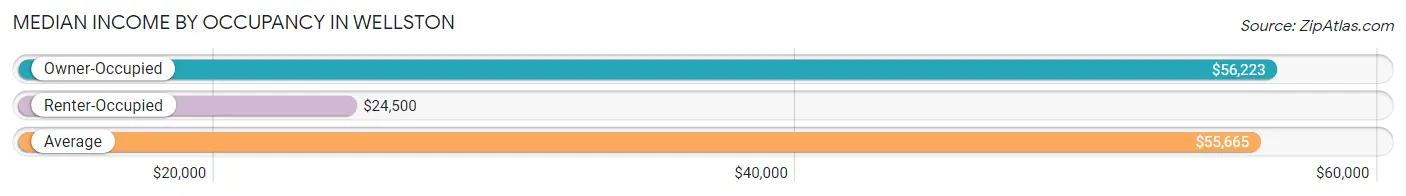
| Occupancy Type | # Households | Median Income |
| Owner-Occupied | 304 (79.6%) | $56,223 |
| Renter-Occupied | 78 (20.4%) | $24,500 |
| Average | 382 (100.0%) | $55,665 |
Occupancy by Householder Income Bracket in Wellston
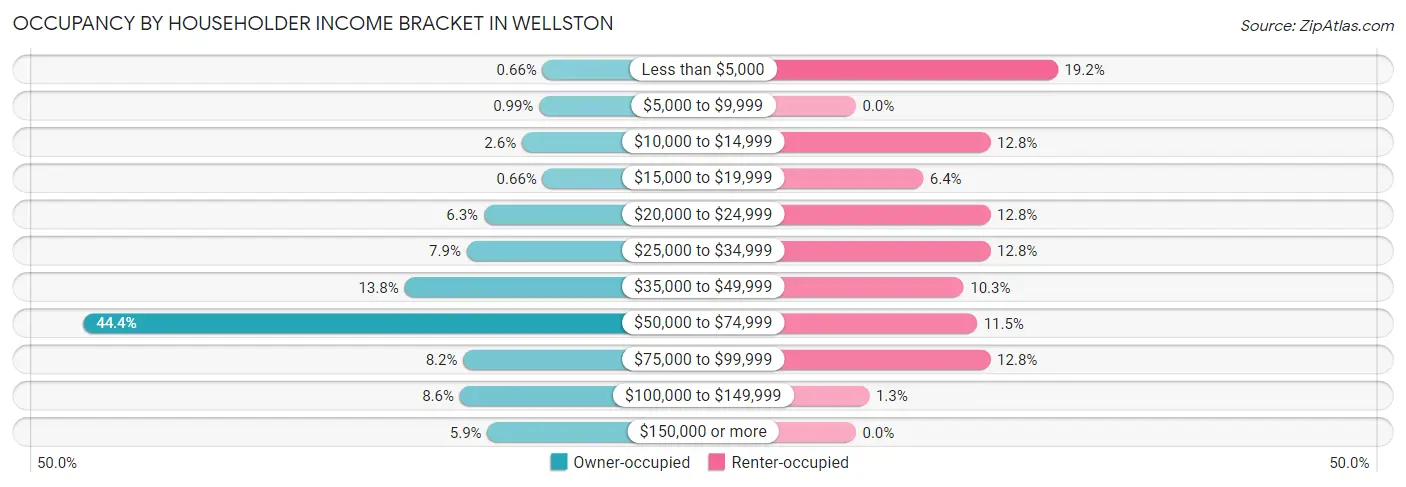
| Income Bracket | Owner-occupied | Renter-occupied |
| Less than $5,000 | 2 (0.7%) | 15 (19.2%) |
| $5,000 to $9,999 | 3 (1.0%) | 0 (0.0%) |
| $10,000 to $14,999 | 8 (2.6%) | 10 (12.8%) |
| $15,000 to $19,999 | 2 (0.7%) | 5 (6.4%) |
| $20,000 to $24,999 | 19 (6.2%) | 10 (12.8%) |
| $25,000 to $34,999 | 24 (7.9%) | 10 (12.8%) |
| $35,000 to $49,999 | 42 (13.8%) | 8 (10.3%) |
| $50,000 to $74,999 | 135 (44.4%) | 9 (11.5%) |
| $75,000 to $99,999 | 25 (8.2%) | 10 (12.8%) |
| $100,000 to $149,999 | 26 (8.6%) | 1 (1.3%) |
| $150,000 or more | 18 (5.9%) | 0 (0.0%) |
| Total | 304 (100.0%) | 78 (100.0%) |
Monthly Housing Cost Tiers in Wellston
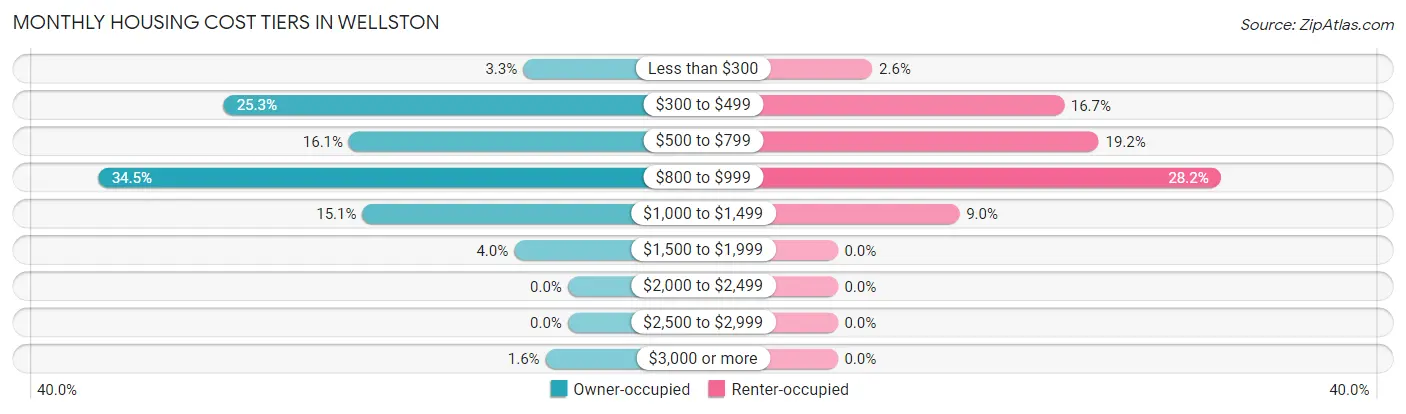
| Monthly Cost | Owner-occupied | Renter-occupied |
| Less than $300 | 10 (3.3%) | 2 (2.6%) |
| $300 to $499 | 77 (25.3%) | 13 (16.7%) |
| $500 to $799 | 49 (16.1%) | 15 (19.2%) |
| $800 to $999 | 105 (34.5%) | 22 (28.2%) |
| $1,000 to $1,499 | 46 (15.1%) | 7 (9.0%) |
| $1,500 to $1,999 | 12 (4.0%) | 0 (0.0%) |
| $2,000 to $2,499 | 0 (0.0%) | 0 (0.0%) |
| $2,500 to $2,999 | 0 (0.0%) | 0 (0.0%) |
| $3,000 or more | 5 (1.6%) | 0 (0.0%) |
| Total | 304 (100.0%) | 78 (100.0%) |
Physical Housing Characteristics in Wellston
Housing Structures in Wellston
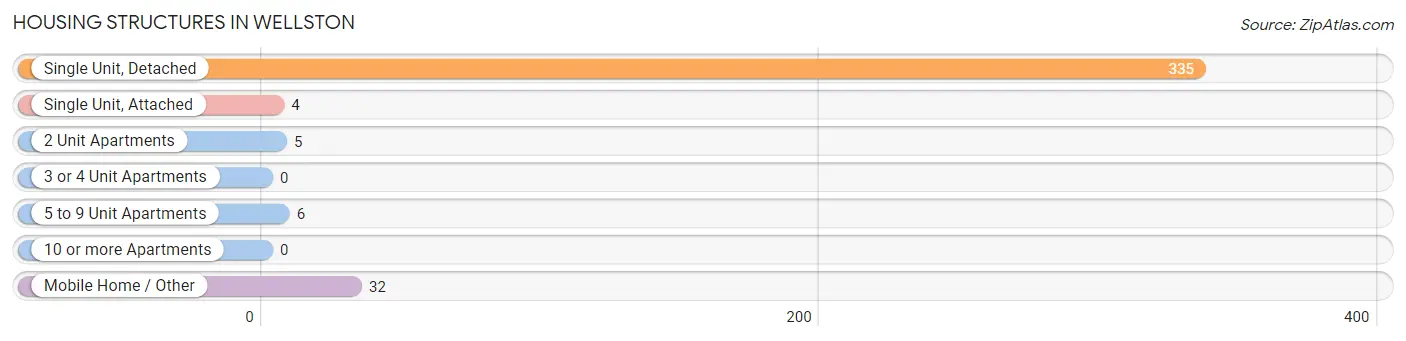
| Structure Type | # Housing Units | % Housing Units |
| Single Unit, Detached | 335 | 87.7% |
| Single Unit, Attached | 4 | 1.1% |
| 2 Unit Apartments | 5 | 1.3% |
| 3 or 4 Unit Apartments | 0 | 0.0% |
| 5 to 9 Unit Apartments | 6 | 1.6% |
| 10 or more Apartments | 0 | 0.0% |
| Mobile Home / Other | 32 | 8.4% |
| Total | 382 | 100.0% |
Housing Structures by Occupancy in Wellston
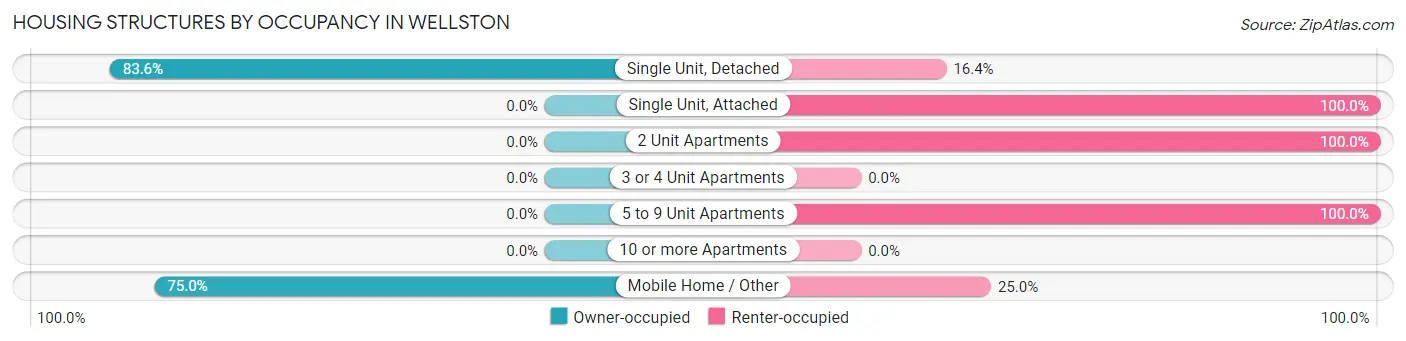
| Structure Type | Owner-occupied | Renter-occupied |
| Single Unit, Detached | 280 (83.6%) | 55 (16.4%) |
| Single Unit, Attached | 0 (0.0%) | 4 (100.0%) |
| 2 Unit Apartments | 0 (0.0%) | 5 (100.0%) |
| 3 or 4 Unit Apartments | 0 (0.0%) | 0 (0.0%) |
| 5 to 9 Unit Apartments | 0 (0.0%) | 6 (100.0%) |
| 10 or more Apartments | 0 (0.0%) | 0 (0.0%) |
| Mobile Home / Other | 24 (75.0%) | 8 (25.0%) |
| Total | 304 (79.6%) | 78 (20.4%) |
Housing Structures by Number of Rooms in Wellston
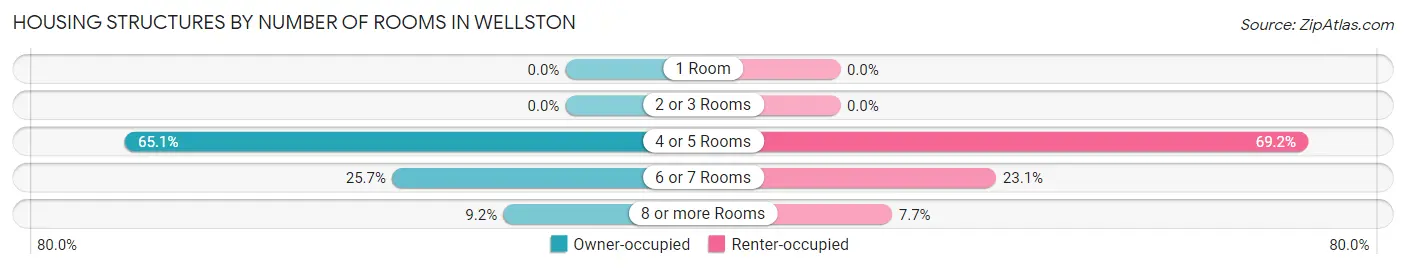
| Number of Rooms | Owner-occupied | Renter-occupied |
| 1 Room | 0 (0.0%) | 0 (0.0%) |
| 2 or 3 Rooms | 0 (0.0%) | 0 (0.0%) |
| 4 or 5 Rooms | 198 (65.1%) | 54 (69.2%) |
| 6 or 7 Rooms | 78 (25.7%) | 18 (23.1%) |
| 8 or more Rooms | 28 (9.2%) | 6 (7.7%) |
| Total | 304 (100.0%) | 78 (100.0%) |
Housing Structure by Heating Type in Wellston
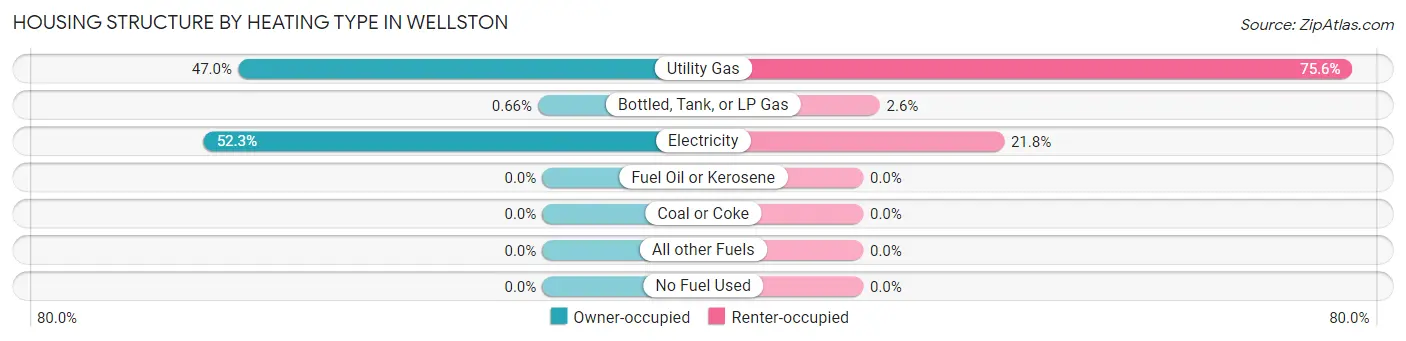
| Heating Type | Owner-occupied | Renter-occupied |
| Utility Gas | 143 (47.0%) | 59 (75.6%) |
| Bottled, Tank, or LP Gas | 2 (0.7%) | 2 (2.6%) |
| Electricity | 159 (52.3%) | 17 (21.8%) |
| Fuel Oil or Kerosene | 0 (0.0%) | 0 (0.0%) |
| Coal or Coke | 0 (0.0%) | 0 (0.0%) |
| All other Fuels | 0 (0.0%) | 0 (0.0%) |
| No Fuel Used | 0 (0.0%) | 0 (0.0%) |
| Total | 304 (100.0%) | 78 (100.0%) |
Household Vehicle Usage in Wellston
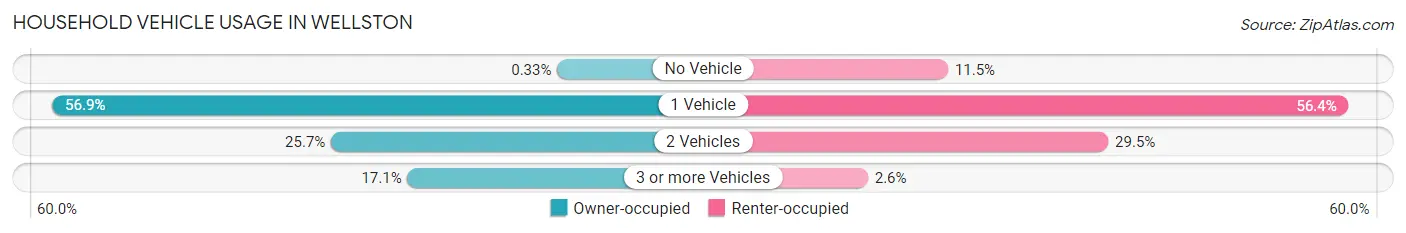
| Vehicles per Household | Owner-occupied | Renter-occupied |
| No Vehicle | 1 (0.3%) | 9 (11.5%) |
| 1 Vehicle | 173 (56.9%) | 44 (56.4%) |
| 2 Vehicles | 78 (25.7%) | 23 (29.5%) |
| 3 or more Vehicles | 52 (17.1%) | 2 (2.6%) |
| Total | 304 (100.0%) | 78 (100.0%) |
Real Estate & Mortgages in Wellston
Real Estate and Mortgage Overview in Wellston
| Characteristic | Without Mortgage | With Mortgage |
| Housing Units | 107 | 197 |
| Median Property Value | $108,100 | $72,500 |
| Median Household Income | $49,250 | $11 |
| Monthly Housing Costs | $385 | $2 |
| Real Estate Taxes | $414 | $98 |
Property Value by Mortgage Status in Wellston
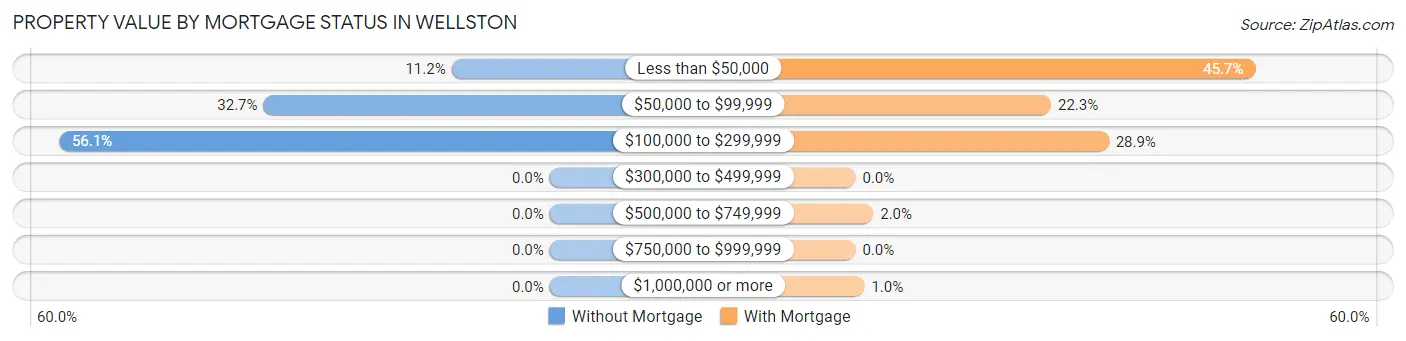
| Property Value | Without Mortgage | With Mortgage |
| Less than $50,000 | 12 (11.2%) | 90 (45.7%) |
| $50,000 to $99,999 | 35 (32.7%) | 44 (22.3%) |
| $100,000 to $299,999 | 60 (56.1%) | 57 (28.9%) |
| $300,000 to $499,999 | 0 (0.0%) | 0 (0.0%) |
| $500,000 to $749,999 | 0 (0.0%) | 4 (2.0%) |
| $750,000 to $999,999 | 0 (0.0%) | 0 (0.0%) |
| $1,000,000 or more | 0 (0.0%) | 2 (1.0%) |
| Total | 107 (100.0%) | 197 (100.0%) |
Household Income by Mortgage Status in Wellston
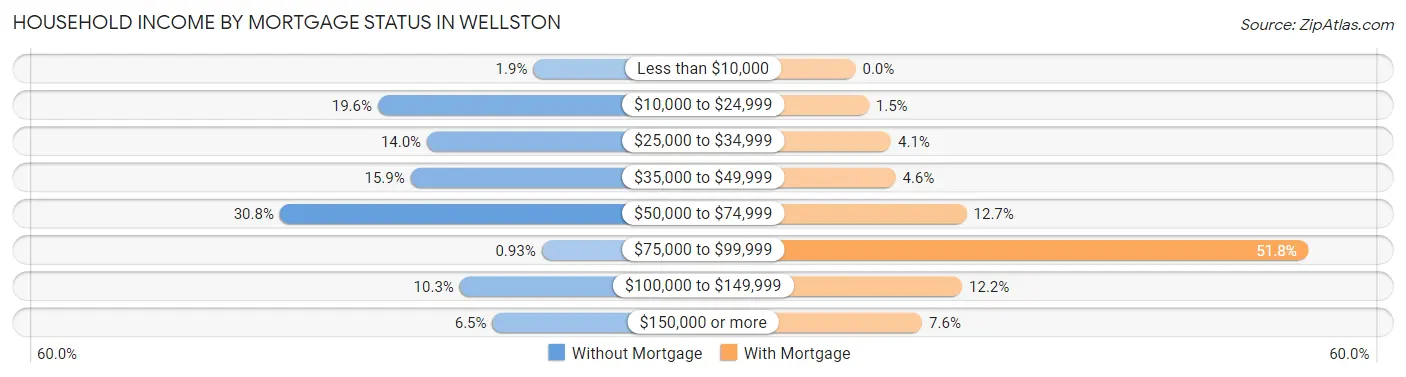
| Household Income | Without Mortgage | With Mortgage |
| Less than $10,000 | 2 (1.9%) | 0 (0.0%) |
| $10,000 to $24,999 | 21 (19.6%) | 3 (1.5%) |
| $25,000 to $34,999 | 15 (14.0%) | 8 (4.1%) |
| $35,000 to $49,999 | 17 (15.9%) | 9 (4.6%) |
| $50,000 to $74,999 | 33 (30.8%) | 25 (12.7%) |
| $75,000 to $99,999 | 1 (0.9%) | 102 (51.8%) |
| $100,000 to $149,999 | 11 (10.3%) | 24 (12.2%) |
| $150,000 or more | 7 (6.5%) | 15 (7.6%) |
| Total | 107 (100.0%) | 197 (100.0%) |
Property Value to Household Income Ratio in Wellston
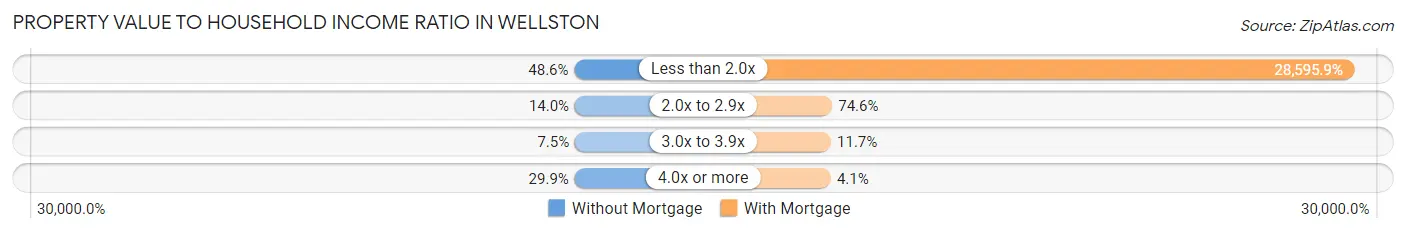
| Value-to-Income Ratio | Without Mortgage | With Mortgage |
| Less than 2.0x | 52 (48.6%) | 56,334 (28,595.9%) |
| 2.0x to 2.9x | 15 (14.0%) | 147 (74.6%) |
| 3.0x to 3.9x | 8 (7.5%) | 23 (11.7%) |
| 4.0x or more | 32 (29.9%) | 8 (4.1%) |
| Total | 107 (100.0%) | 197 (100.0%) |
Real Estate Taxes by Mortgage Status in Wellston
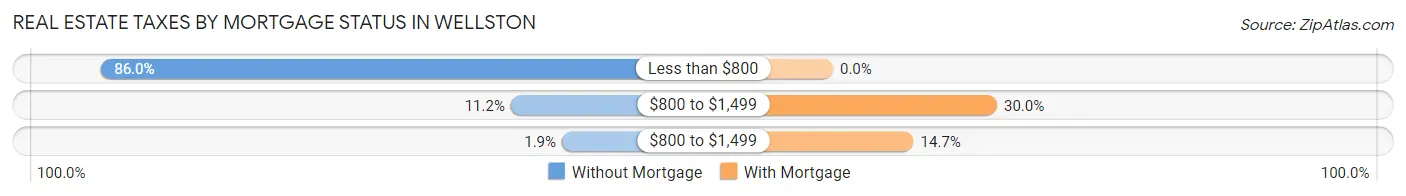
| Property Taxes | Without Mortgage | With Mortgage |
| Less than $800 | 92 (86.0%) | 0 (0.0%) |
| $800 to $1,499 | 12 (11.2%) | 59 (29.9%) |
| $800 to $1,499 | 2 (1.9%) | 29 (14.7%) |
| Total | 107 (100.0%) | 197 (100.0%) |
Health & Disability in Wellston
Health Insurance Coverage by Age in Wellston
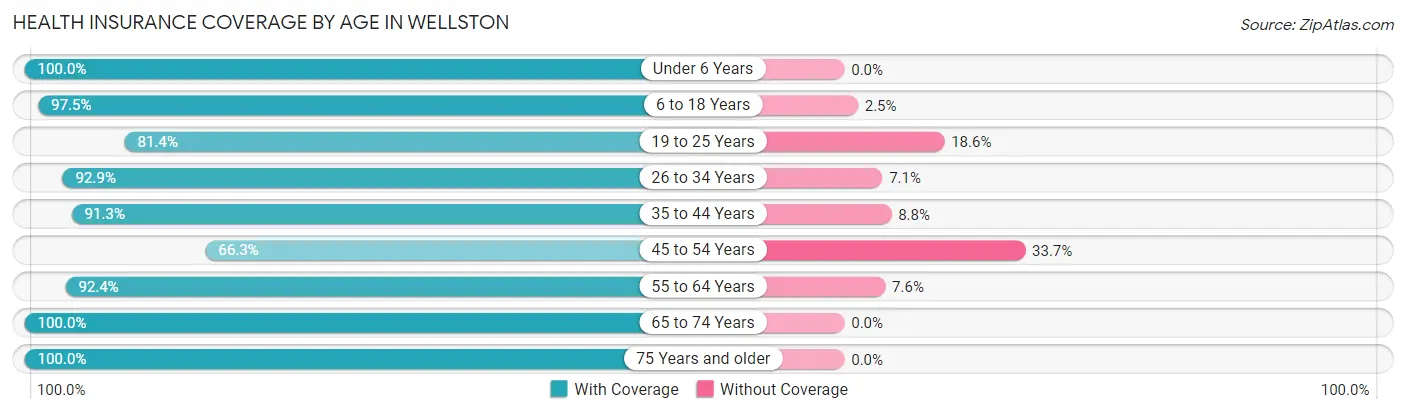
| Age Bracket | With Coverage | Without Coverage |
| Under 6 Years | 71 (100.0%) | 0 (0.0%) |
| 6 to 18 Years | 116 (97.5%) | 3 (2.5%) |
| 19 to 25 Years | 48 (81.4%) | 11 (18.6%) |
| 26 to 34 Years | 92 (92.9%) | 7 (7.1%) |
| 35 to 44 Years | 73 (91.2%) | 7 (8.7%) |
| 45 to 54 Years | 57 (66.3%) | 29 (33.7%) |
| 55 to 64 Years | 97 (92.4%) | 8 (7.6%) |
| 65 to 74 Years | 151 (100.0%) | 0 (0.0%) |
| 75 Years and older | 24 (100.0%) | 0 (0.0%) |
| Total | 729 (91.8%) | 65 (8.2%) |
Health Insurance Coverage by Citizenship Status in Wellston
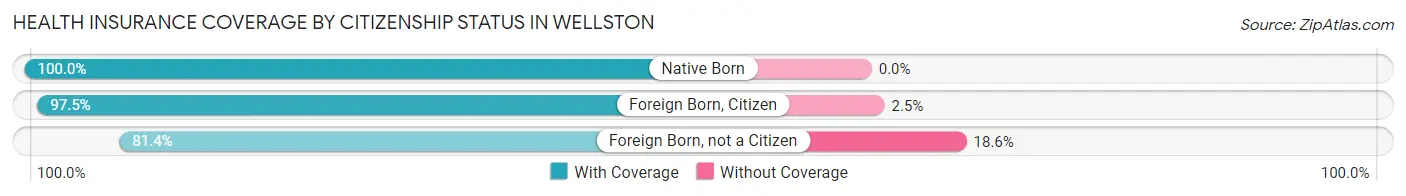
| Citizenship Status | With Coverage | Without Coverage |
| Native Born | 71 (100.0%) | 0 (0.0%) |
| Foreign Born, Citizen | 116 (97.5%) | 3 (2.5%) |
| Foreign Born, not a Citizen | 48 (81.4%) | 11 (18.6%) |
Health Insurance Coverage by Household Income in Wellston
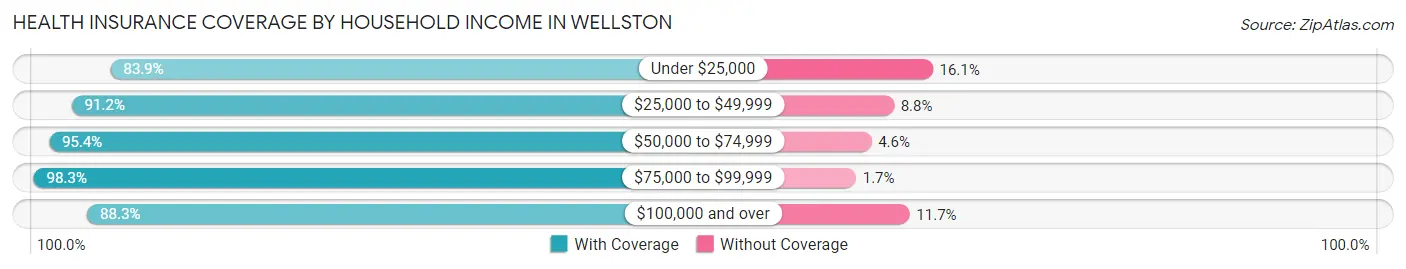
| Household Income | With Coverage | Without Coverage |
| Under $25,000 | 94 (83.9%) | 18 (16.1%) |
| $25,000 to $49,999 | 166 (91.2%) | 16 (8.8%) |
| $50,000 to $74,999 | 209 (95.4%) | 10 (4.6%) |
| $75,000 to $99,999 | 117 (98.3%) | 2 (1.7%) |
| $100,000 and over | 143 (88.3%) | 19 (11.7%) |
Public vs Private Health Insurance Coverage by Age in Wellston
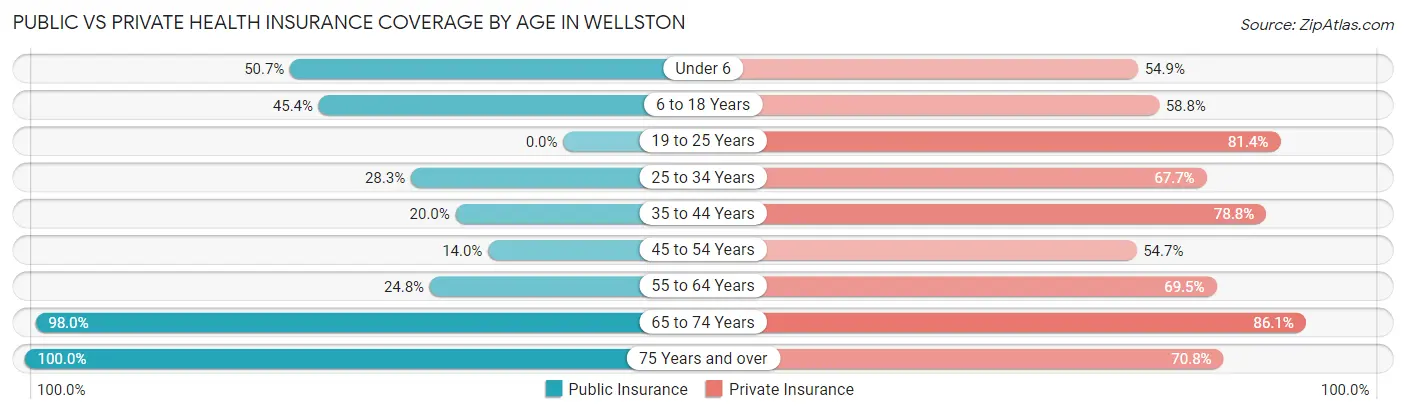
| Age Bracket | Public Insurance | Private Insurance |
| Under 6 | 36 (50.7%) | 39 (54.9%) |
| 6 to 18 Years | 54 (45.4%) | 70 (58.8%) |
| 19 to 25 Years | 0 (0.0%) | 48 (81.4%) |
| 25 to 34 Years | 28 (28.3%) | 67 (67.7%) |
| 35 to 44 Years | 16 (20.0%) | 63 (78.7%) |
| 45 to 54 Years | 12 (14.0%) | 47 (54.6%) |
| 55 to 64 Years | 26 (24.8%) | 73 (69.5%) |
| 65 to 74 Years | 148 (98.0%) | 130 (86.1%) |
| 75 Years and over | 24 (100.0%) | 17 (70.8%) |
| Total | 344 (43.3%) | 554 (69.8%) |
Disability Status by Sex by Age in Wellston
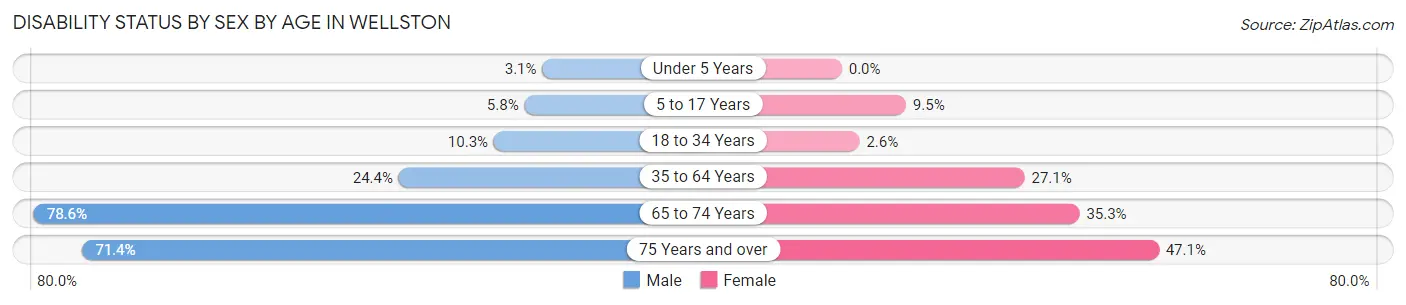
| Age Bracket | Male | Female |
| Under 5 Years | 1 (3.1%) | 0 (0.0%) |
| 5 to 17 Years | 3 (5.8%) | 6 (9.5%) |
| 18 to 34 Years | 10 (10.3%) | 2 (2.6%) |
| 35 to 64 Years | 32 (24.4%) | 38 (27.1%) |
| 65 to 74 Years | 92 (78.6%) | 12 (35.3%) |
| 75 Years and over | 5 (71.4%) | 8 (47.1%) |
Disability Class by Sex by Age in Wellston
Disability Class: Hearing Difficulty
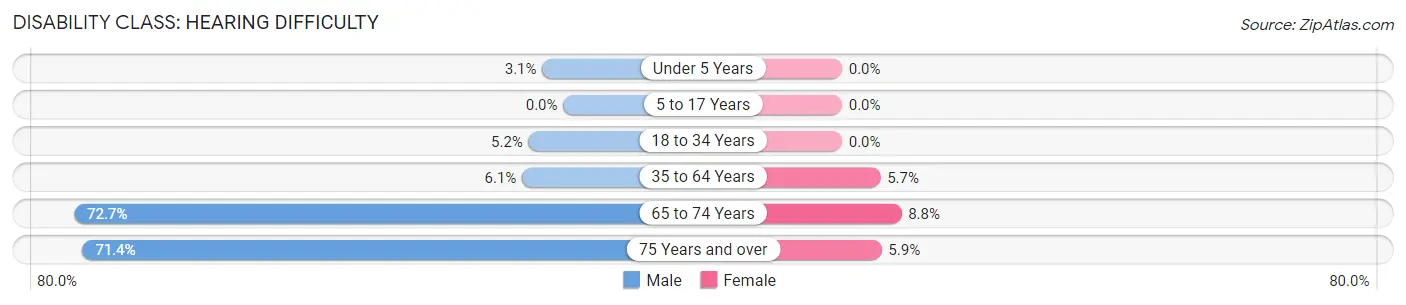
| Age Bracket | Male | Female |
| Under 5 Years | 1 (3.1%) | 0 (0.0%) |
| 5 to 17 Years | 0 (0.0%) | 0 (0.0%) |
| 18 to 34 Years | 5 (5.1%) | 0 (0.0%) |
| 35 to 64 Years | 8 (6.1%) | 8 (5.7%) |
| 65 to 74 Years | 85 (72.7%) | 3 (8.8%) |
| 75 Years and over | 5 (71.4%) | 1 (5.9%) |
Disability Class: Vision Difficulty
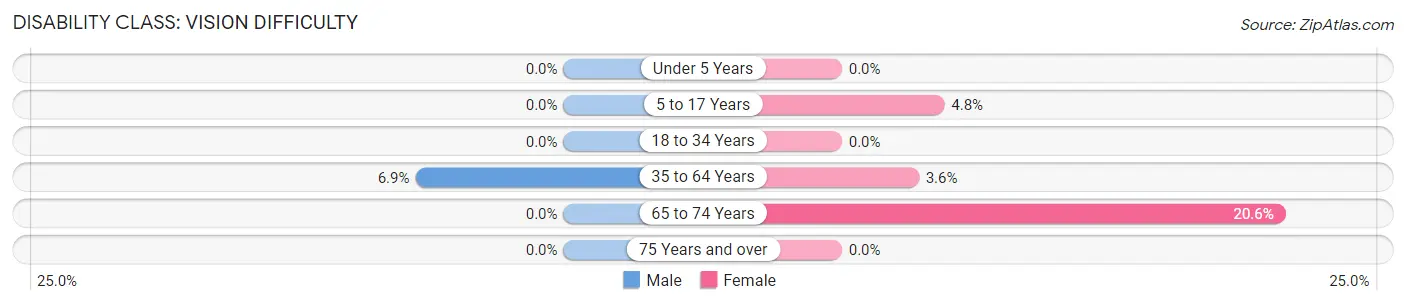
| Age Bracket | Male | Female |
| Under 5 Years | 0 (0.0%) | 0 (0.0%) |
| 5 to 17 Years | 0 (0.0%) | 3 (4.8%) |
| 18 to 34 Years | 0 (0.0%) | 0 (0.0%) |
| 35 to 64 Years | 9 (6.9%) | 5 (3.6%) |
| 65 to 74 Years | 0 (0.0%) | 7 (20.6%) |
| 75 Years and over | 0 (0.0%) | 0 (0.0%) |
Disability Class: Cognitive Difficulty
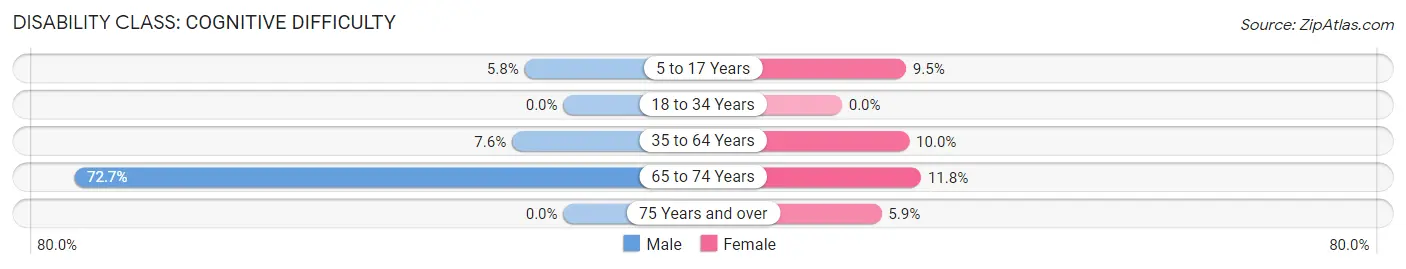
| Age Bracket | Male | Female |
| 5 to 17 Years | 3 (5.8%) | 6 (9.5%) |
| 18 to 34 Years | 0 (0.0%) | 0 (0.0%) |
| 35 to 64 Years | 10 (7.6%) | 14 (10.0%) |
| 65 to 74 Years | 85 (72.7%) | 4 (11.8%) |
| 75 Years and over | 0 (0.0%) | 1 (5.9%) |
Disability Class: Ambulatory Difficulty
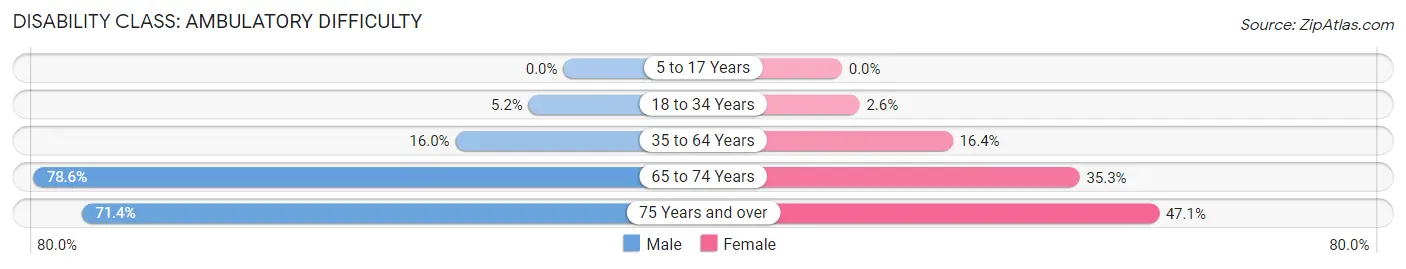
| Age Bracket | Male | Female |
| 5 to 17 Years | 0 (0.0%) | 0 (0.0%) |
| 18 to 34 Years | 5 (5.1%) | 2 (2.6%) |
| 35 to 64 Years | 21 (16.0%) | 23 (16.4%) |
| 65 to 74 Years | 92 (78.6%) | 12 (35.3%) |
| 75 Years and over | 5 (71.4%) | 8 (47.1%) |
Disability Class: Self-Care Difficulty
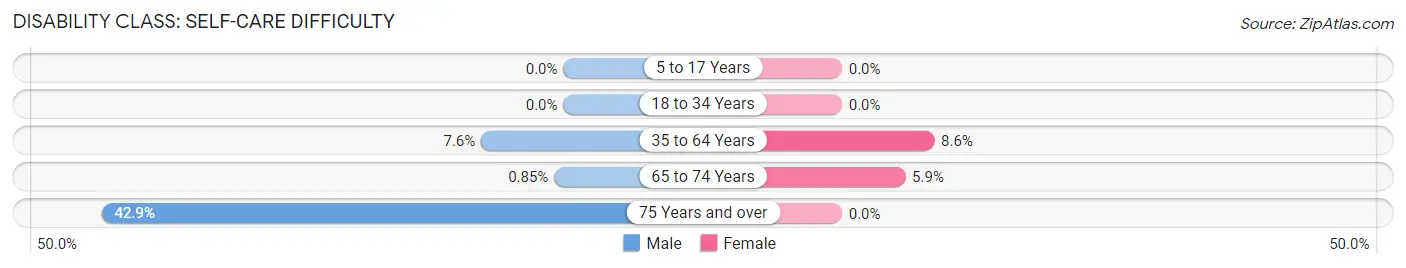
| Age Bracket | Male | Female |
| 5 to 17 Years | 0 (0.0%) | 0 (0.0%) |
| 18 to 34 Years | 0 (0.0%) | 0 (0.0%) |
| 35 to 64 Years | 10 (7.6%) | 12 (8.6%) |
| 65 to 74 Years | 1 (0.9%) | 2 (5.9%) |
| 75 Years and over | 3 (42.9%) | 0 (0.0%) |
Technology Access in Wellston
Computing Device Access in Wellston
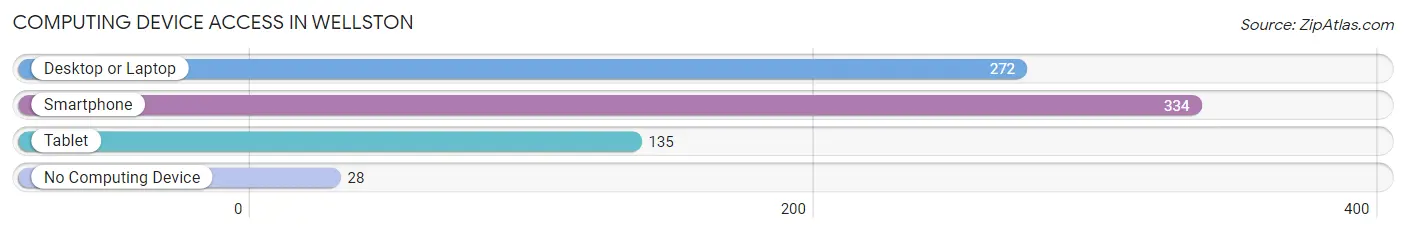
| Device Type | # Households | % Households |
| Desktop or Laptop | 272 | 71.2% |
| Smartphone | 334 | 87.4% |
| Tablet | 135 | 35.3% |
| No Computing Device | 28 | 7.3% |
| Total | 382 | 100.0% |
Internet Access in Wellston
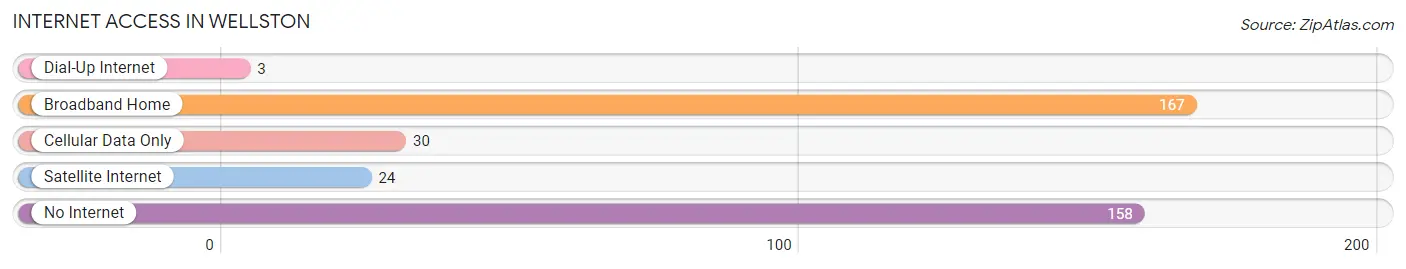
| Internet Type | # Households | % Households |
| Dial-Up Internet | 3 | 0.8% |
| Broadband Home | 167 | 43.7% |
| Cellular Data Only | 30 | 7.9% |
| Satellite Internet | 24 | 6.3% |
| No Internet | 158 | 41.4% |
| Total | 382 | 100.0% |
Wellston Summary
Wellston, Oklahoma is a small town located in Lincoln County, Oklahoma. It is situated about 25 miles northeast of Oklahoma City and is part of the Oklahoma City metropolitan area. The town was founded in 1891 and was named after the Wellston family, who were early settlers in the area. As of the 2010 census, the population of Wellston was 1,521.
History
The area that is now Wellston was originally inhabited by the Wichita and Caddo Native American tribes. The first white settlers arrived in the area in the late 1800s, and the town of Wellston was officially founded in 1891. The town was named after the Wellston family, who were early settlers in the area.
In the early 1900s, Wellston was a thriving agricultural community. The town was home to several cotton gins, a flour mill, and a lumber mill. The town also had a hotel, a bank, and several stores.
In the 1920s, the town began to decline as the Great Depression hit the area. Many of the businesses in town closed, and the population began to decline.
In the 1950s, the town began to experience a resurgence as the oil and gas industry began to boom in the area. The town was home to several oil and gas companies, and the population began to increase.
Geography
Wellston is located in Lincoln County, Oklahoma. It is situated about 25 miles northeast of Oklahoma City and is part of the Oklahoma City metropolitan area. The town is located at the intersection of State Highway 66 and State Highway 33.
The town is situated on a flat plain, with an elevation of 1,068 feet. The town is located in a humid subtropical climate zone, with hot summers and mild winters.
Economy
The economy of Wellston is largely based on agriculture and oil and gas production. The town is home to several oil and gas companies, as well as several farms and ranches.
The town is also home to several small businesses, including restaurants, retail stores, and service providers.
Demographics
As of the 2010 census, the population of Wellston was 1,521. The racial makeup of the town was 94.3% White, 0.7% African American, 0.3% Native American, 0.2% Asian, 0.1% Pacific Islander, and 4.4% from other races.
The median household income in Wellston was $37,917, and the median family income was $45,625. The per capita income in the town was $17,917. About 11.3% of the population was below the poverty line.
Common Questions
What is Per Capita Income in Wellston?
Per Capita income in Wellston is $31,056.
What is the Median Family Income in Wellston?
Median Family Income in Wellston is $69,375.
What is the Median Household income in Wellston?
Median Household Income in Wellston is $55,665.
What is Income or Wage Gap in Wellston?
Income or Wage Gap in Wellston is 22.5%.
Women in Wellston earn 77.5 cents for every dollar earned by a man.
What is Family Income Deficit in Wellston?
Family Income Deficit in Wellston is $9,914.
Families that are below poverty line in Wellston earn $9,914 less on average than the poverty threshold level.
What is Inequality or Gini Index in Wellston?
Inequality or Gini Index in Wellston is 0.38.
What is the Total Population of Wellston?
Total Population of Wellston is 794.
What is the Total Male Population of Wellston?
Total Male Population of Wellston is 436.
What is the Total Female Population of Wellston?
Total Female Population of Wellston is 358.
What is the Ratio of Males per 100 Females in Wellston?
There are 121.79 Males per 100 Females in Wellston.
What is the Ratio of Females per 100 Males in Wellston?
There are 82.11 Females per 100 Males in Wellston.
What is the Median Population Age in Wellston?
Median Population Age in Wellston is 41.4 Years.
What is the Average Family Size in Wellston
Average Family Size in Wellston is 3.3 People.
What is the Average Household Size in Wellston
Average Household Size in Wellston is 2.1 People.
How Large is the Labor Force in Wellston?
There are 338 People in the Labor Forcein in Wellston.
What is the Percentage of People in the Labor Force in Wellston?
52.7% of People are in the Labor Force in Wellston.
What is the Unemployment Rate in Wellston?
Unemployment Rate in Wellston is 4.4%.