Weatherford, OK Map & Demographics
Weatherford Map
Weatherford Overview
$28,841
PER CAPITA INCOME
$78,257
AVG FAMILY INCOME
$47,851
AVG HOUSEHOLD INCOME
51.2%
WAGE / INCOME GAP [ % ]
48.8¢/ $1
WAGE / INCOME GAP [ $ ]
0.52
INEQUALITY / GINI INDEX
11,999
TOTAL POPULATION
5,672
MALE POPULATION
6,327
FEMALE POPULATION
89.65
MALES / 100 FEMALES
111.55
FEMALES / 100 MALES
23.9
MEDIAN AGE
3.2
AVG FAMILY SIZE
2.4
AVG HOUSEHOLD SIZE
6,685
LABOR FORCE [ PEOPLE ]
69.5%
PERCENT IN LABOR FORCE
5.2%
UNEMPLOYMENT RATE
Weatherford Zip Codes
Weatherford Area Codes
Income in Weatherford
Income Overview in Weatherford
Per Capita Income in Weatherford is $28,841, while median incomes of families and households are $78,257 and $47,851 respectively.
| Characteristic | Number | Measure |
| Per Capita Income | 11,999 | $28,841 |
| Median Family Income | 2,245 | $78,257 |
| Mean Family Income | 2,245 | $104,702 |
| Median Household Income | 4,530 | $47,851 |
| Mean Household Income | 4,530 | $73,838 |
| Income Deficit | 2,245 | $0 |
| Wage / Income Gap (%) | 11,999 | 51.25% |
| Wage / Income Gap ($) | 11,999 | 48.75¢ per $1 |
| Gini / Inequality Index | 11,999 | 0.52 |
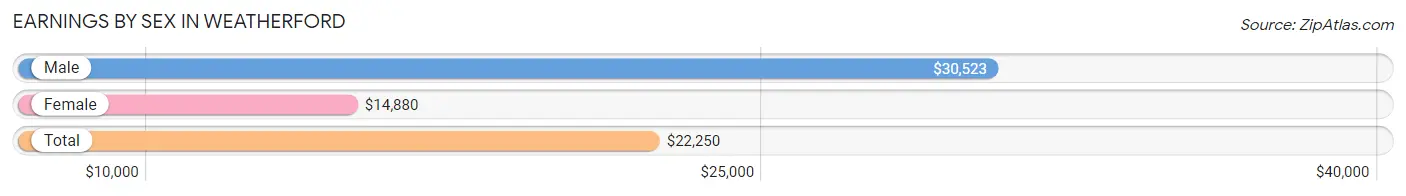
Earnings by Sex in Weatherford
Average Earnings in Weatherford are $22,250, $30,523 for men and $14,880 for women, a difference of 51.2%.
| Sex | Number | Average Earnings |
| Male | 3,722 (51.6%) | $30,523 |
| Female | 3,491 (48.4%) | $14,880 |
| Total | 7,213 (100.0%) | $22,250 |
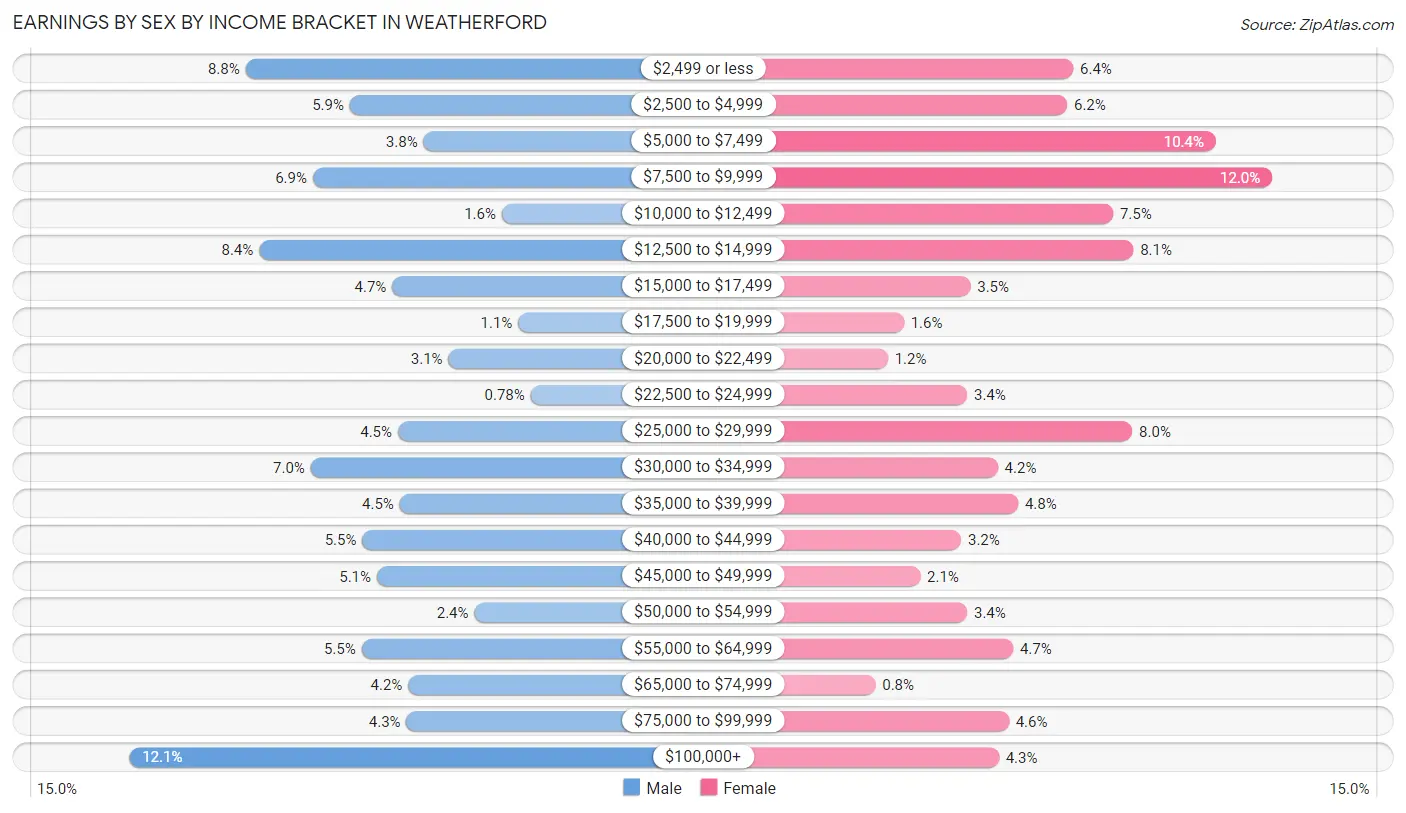
Earnings by Sex by Income Bracket in Weatherford
The most common earnings brackets in Weatherford are $100,000+ for men (449 | 12.1%) and $7,500 to $9,999 for women (417 | 11.9%).
| Income | Male | Female |
| $2,499 or less | 327 (8.8%) | 222 (6.4%) |
| $2,500 to $4,999 | 218 (5.9%) | 216 (6.2%) |
| $5,000 to $7,499 | 141 (3.8%) | 362 (10.4%) |
| $7,500 to $9,999 | 257 (6.9%) | 417 (11.9%) |
| $10,000 to $12,499 | 59 (1.6%) | 261 (7.5%) |
| $12,500 to $14,999 | 313 (8.4%) | 281 (8.1%) |
| $15,000 to $17,499 | 174 (4.7%) | 121 (3.5%) |
| $17,500 to $19,999 | 42 (1.1%) | 56 (1.6%) |
| $20,000 to $22,499 | 115 (3.1%) | 40 (1.1%) |
| $22,500 to $24,999 | 29 (0.8%) | 118 (3.4%) |
| $25,000 to $29,999 | 168 (4.5%) | 280 (8.0%) |
| $30,000 to $34,999 | 259 (7.0%) | 148 (4.2%) |
| $35,000 to $39,999 | 166 (4.5%) | 168 (4.8%) |
| $40,000 to $44,999 | 205 (5.5%) | 112 (3.2%) |
| $45,000 to $49,999 | 190 (5.1%) | 72 (2.1%) |
| $50,000 to $54,999 | 88 (2.4%) | 118 (3.4%) |
| $55,000 to $64,999 | 206 (5.5%) | 163 (4.7%) |
| $65,000 to $74,999 | 157 (4.2%) | 28 (0.8%) |
| $75,000 to $99,999 | 159 (4.3%) | 159 (4.5%) |
| $100,000+ | 449 (12.1%) | 149 (4.3%) |
| Total | 3,722 (100.0%) | 3,491 (100.0%) |
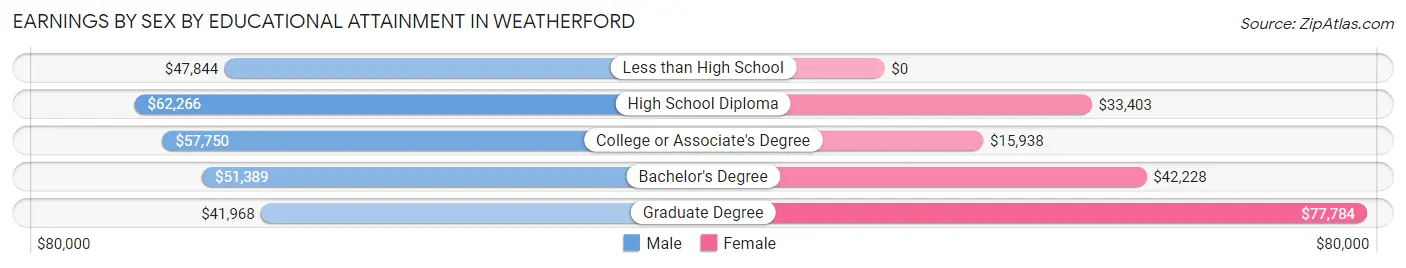
Earnings by Sex by Educational Attainment in Weatherford
Average earnings in Weatherford are $53,288 for men and $33,837 for women, a difference of 36.5%. Men with an educational attainment of high school diploma enjoy the highest average annual earnings of $62,266, while those with graduate degree education earn the least with $41,968. Women with an educational attainment of graduate degree earn the most with the average annual earnings of $77,784, while those with college or associate's degree education have the smallest earnings of $15,938.
| Educational Attainment | Male Income | Female Income |
| Less than High School | $47,844 | $0 |
| High School Diploma | $62,266 | $33,403 |
| College or Associate's Degree | $57,750 | $15,938 |
| Bachelor's Degree | $51,389 | $42,228 |
| Graduate Degree | $41,968 | $77,784 |
| Total | $53,288 | $33,837 |
Family Income in Weatherford
Family Income Brackets in Weatherford
According to the Weatherford family income data, there are 352 families falling into the $100,000 to $149,999 income range, which is the most common income bracket and makes up 15.7% of all families. Conversely, the less than $10,000 income bracket is the least frequent group with only 83 families (3.7%) belonging to this category.
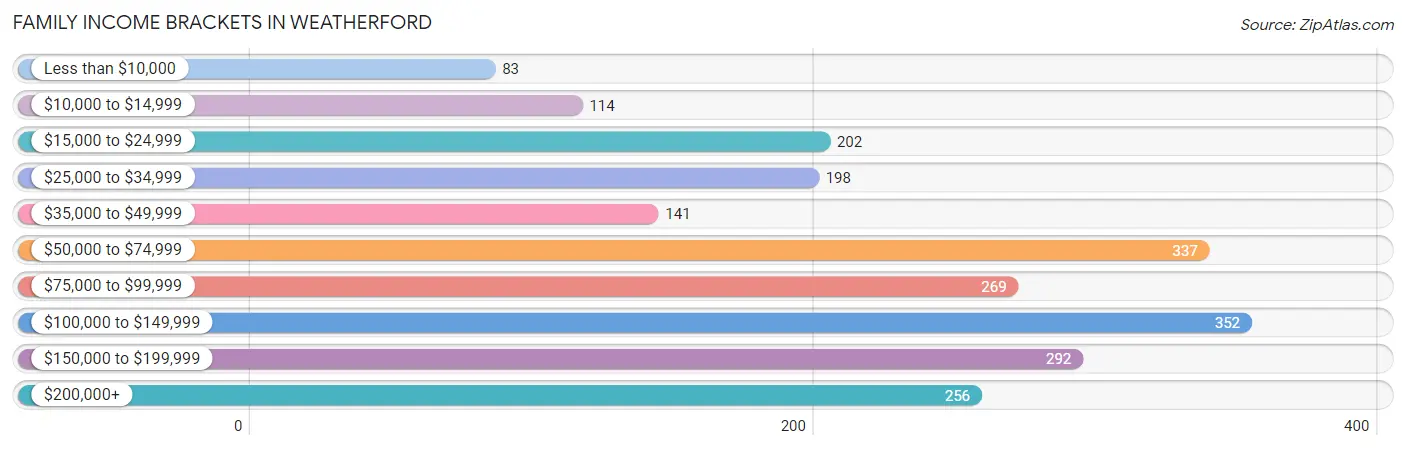
| Income Bracket | # Families | % Families |
| Less than $10,000 | 83 | 3.7% |
| $10,000 to $14,999 | 114 | 5.1% |
| $15,000 to $24,999 | 202 | 9.0% |
| $25,000 to $34,999 | 198 | 8.8% |
| $35,000 to $49,999 | 141 | 6.3% |
| $50,000 to $74,999 | 337 | 15.0% |
| $75,000 to $99,999 | 269 | 12.0% |
| $100,000 to $149,999 | 352 | 15.7% |
| $150,000 to $199,999 | 292 | 13.0% |
| $200,000+ | 256 | 11.4% |
Family Income by Famaliy Size in Weatherford
4-person families (566 | 25.2%) account for the highest median family income in Weatherford with $129,677 per family, while 2-person families (821 | 36.6%) have the highest median income of $37,256 per family member.
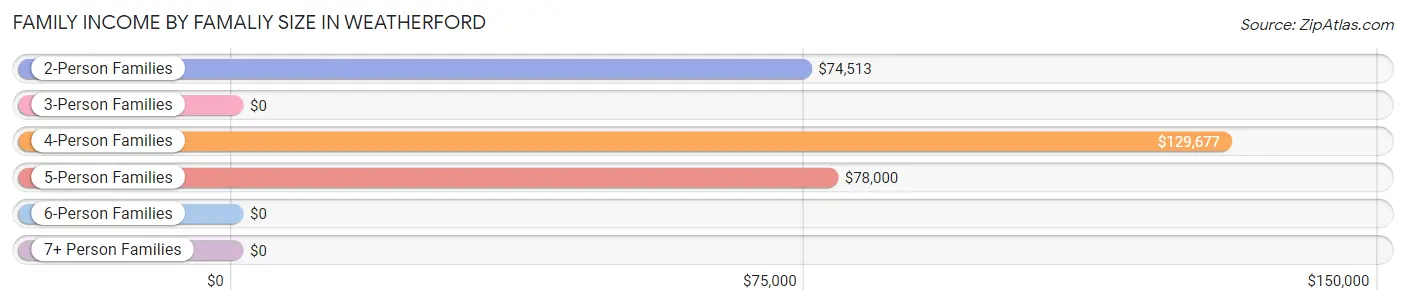
| Income Bracket | # Families | Median Income |
| 2-Person Families | 821 (36.6%) | $74,513 |
| 3-Person Families | 568 (25.3%) | $0 |
| 4-Person Families | 566 (25.2%) | $129,677 |
| 5-Person Families | 260 (11.6%) | $78,000 |
| 6-Person Families | 0 (0.0%) | $0 |
| 7+ Person Families | 30 (1.3%) | $0 |
| Total | 2,245 (100.0%) | $78,257 |
Family Income by Number of Earners in Weatherford
The median family income in Weatherford is $78,257, with families comprising 3+ earners (250) having the highest median family income of $193,643, while families with 1 earner (745) have the lowest median family income of $33,264, accounting for 11.1% and 33.2% of families, respectively.
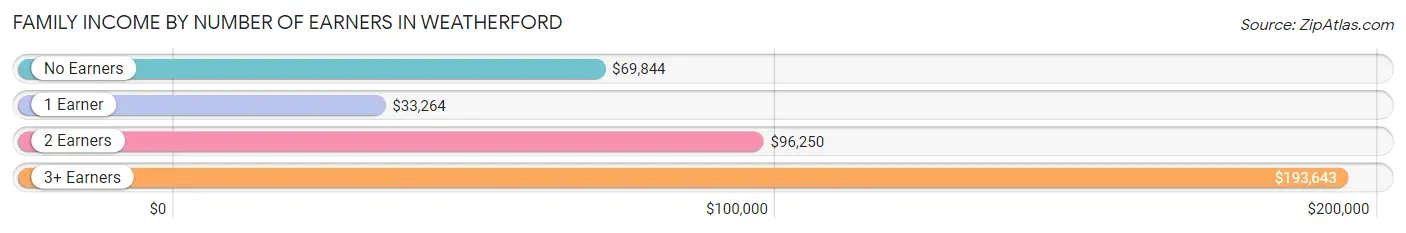
| Number of Earners | # Families | Median Income |
| No Earners | 329 (14.6%) | $69,844 |
| 1 Earner | 745 (33.2%) | $33,264 |
| 2 Earners | 921 (41.0%) | $96,250 |
| 3+ Earners | 250 (11.1%) | $193,643 |
| Total | 2,245 (100.0%) | $78,257 |
Household Income in Weatherford
Household Income Brackets in Weatherford
With 702 households falling in the category, the $50,000 to $74,999 income range is the most frequent in Weatherford, accounting for 15.5% of all households. In contrast, only 276 households (6.1%) fall into the $200,000+ income bracket, making it the least populous group.
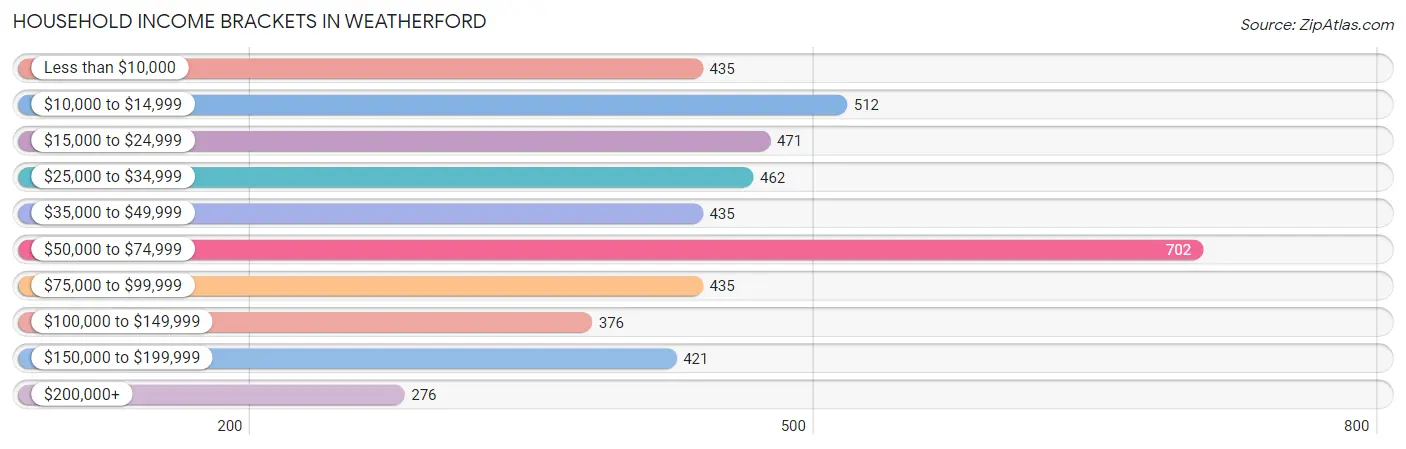
| Income Bracket | # Households | % Households |
| Less than $10,000 | 435 | 9.6% |
| $10,000 to $14,999 | 512 | 11.3% |
| $15,000 to $24,999 | 471 | 10.4% |
| $25,000 to $34,999 | 462 | 10.2% |
| $35,000 to $49,999 | 435 | 9.6% |
| $50,000 to $74,999 | 702 | 15.5% |
| $75,000 to $99,999 | 435 | 9.6% |
| $100,000 to $149,999 | 376 | 8.3% |
| $150,000 to $199,999 | 421 | 9.3% |
| $200,000+ | 276 | 6.1% |
Household Income by Householder Age in Weatherford
The median household income in Weatherford is $47,851, with the highest median household income of $67,750 found in the 45 to 64 years age bracket for the primary householder. A total of 992 households (21.9%) fall into this category. Meanwhile, the 15 to 24 years age bracket for the primary householder has the lowest median household income of $22,845, with 1,032 households (22.8%) in this group.
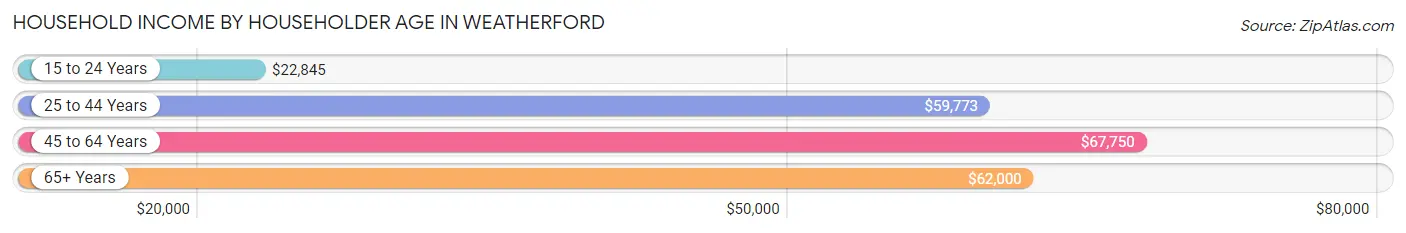
| Income Bracket | # Households | Median Income |
| 15 to 24 Years | 1,032 (22.8%) | $22,845 |
| 25 to 44 Years | 1,676 (37.0%) | $59,773 |
| 45 to 64 Years | 992 (21.9%) | $67,750 |
| 65+ Years | 830 (18.3%) | $62,000 |
| Total | 4,530 (100.0%) | $47,851 |
Poverty in Weatherford
Income Below Poverty by Sex and Age in Weatherford
With 22.1% poverty level for males and 25.8% for females among the residents of Weatherford, 16 and 17 year old males and 18 to 24 year old females are the most vulnerable to poverty, with 43 males (72.9%) and 751 females (61.8%) in their respective age groups living below the poverty level.
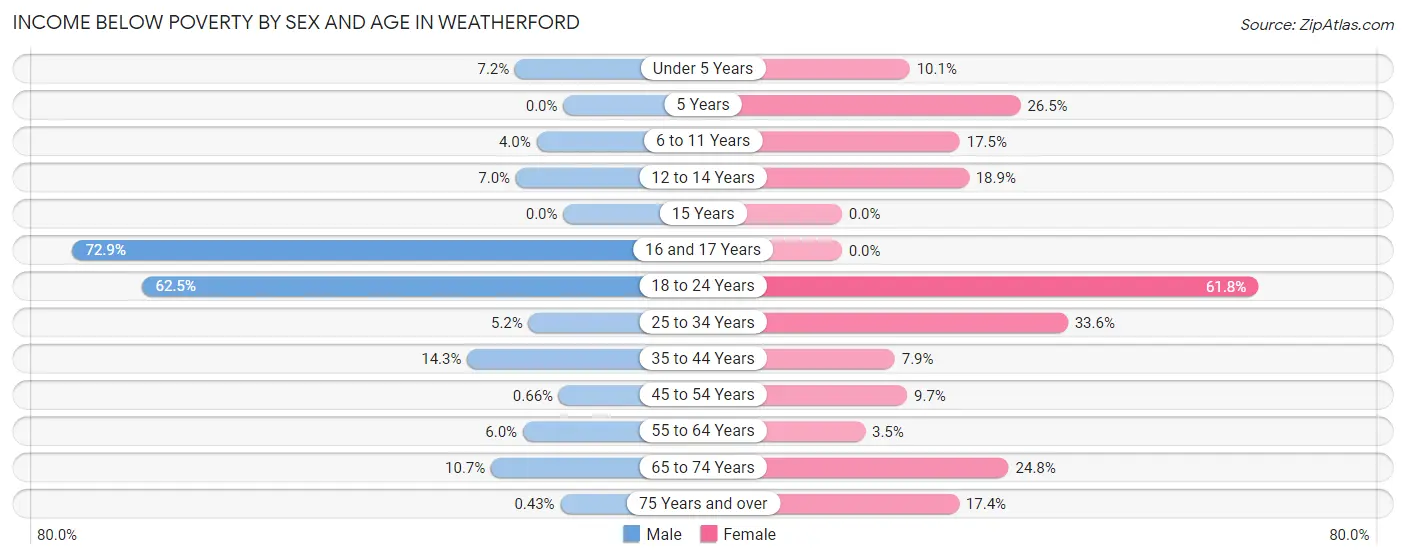
| Age Bracket | Male | Female |
| Under 5 Years | 29 (7.2%) | 44 (10.1%) |
| 5 Years | 0 (0.0%) | 26 (26.5%) |
| 6 to 11 Years | 15 (4.0%) | 79 (17.5%) |
| 12 to 14 Years | 14 (7.0%) | 36 (18.9%) |
| 15 Years | 0 (0.0%) | 0 (0.0%) |
| 16 and 17 Years | 43 (72.9%) | 0 (0.0%) |
| 18 to 24 Years | 851 (62.5%) | 751 (61.8%) |
| 25 to 34 Years | 39 (5.2%) | 262 (33.6%) |
| 35 to 44 Years | 98 (14.3%) | 47 (7.9%) |
| 45 to 54 Years | 2 (0.7%) | 35 (9.7%) |
| 55 to 64 Years | 25 (6.0%) | 18 (3.5%) |
| 65 to 74 Years | 31 (10.7%) | 82 (24.8%) |
| 75 Years and over | 1 (0.4%) | 64 (17.4%) |
| Total | 1,148 (22.1%) | 1,444 (25.8%) |
Income Above Poverty by Sex and Age in Weatherford
According to the poverty statistics in Weatherford, males aged 5 years and females aged 15 years are the age groups that are most secure financially, with 100.0% of males and 100.0% of females in these age groups living above the poverty line.
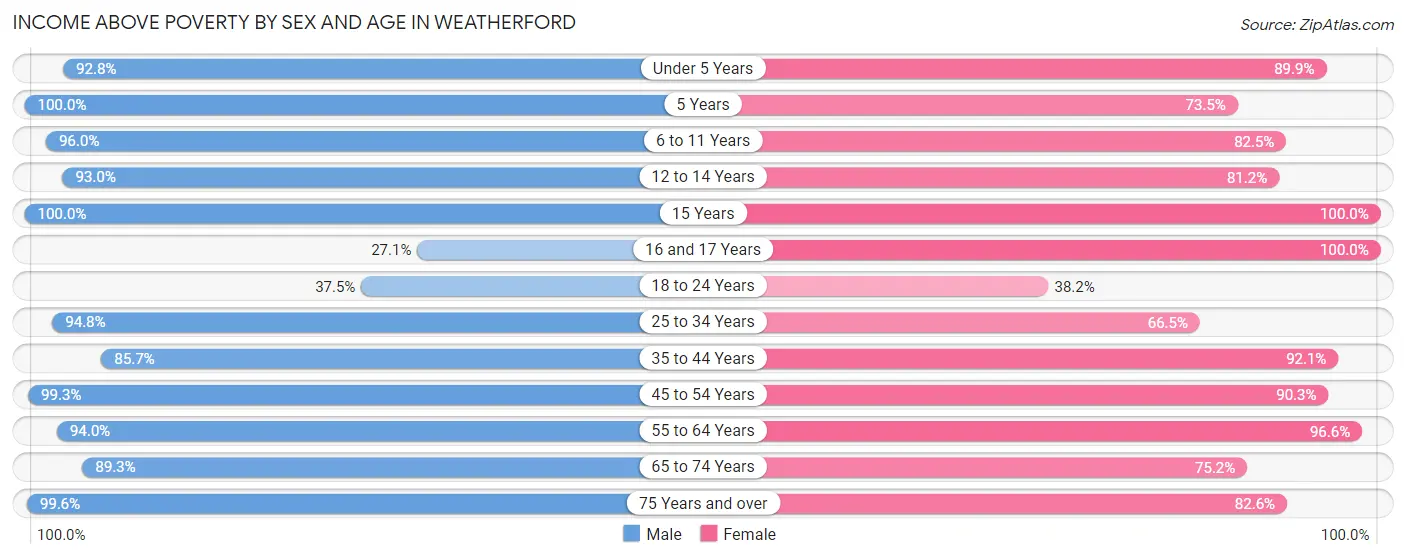
| Age Bracket | Male | Female |
| Under 5 Years | 376 (92.8%) | 392 (89.9%) |
| 5 Years | 56 (100.0%) | 72 (73.5%) |
| 6 to 11 Years | 362 (96.0%) | 372 (82.5%) |
| 12 to 14 Years | 185 (93.0%) | 155 (81.1%) |
| 15 Years | 53 (100.0%) | 109 (100.0%) |
| 16 and 17 Years | 16 (27.1%) | 147 (100.0%) |
| 18 to 24 Years | 511 (37.5%) | 464 (38.2%) |
| 25 to 34 Years | 717 (94.8%) | 519 (66.4%) |
| 35 to 44 Years | 589 (85.7%) | 550 (92.1%) |
| 45 to 54 Years | 301 (99.3%) | 326 (90.3%) |
| 55 to 64 Years | 392 (94.0%) | 504 (96.6%) |
| 65 to 74 Years | 258 (89.3%) | 249 (75.2%) |
| 75 Years and over | 230 (99.6%) | 304 (82.6%) |
| Total | 4,046 (77.9%) | 4,163 (74.3%) |
Income Below Poverty Among Married-Couple Families in Weatherford
The poverty statistics for married-couple families in Weatherford show that 3.7% or 60 of the total 1,637 families live below the poverty line. Families with 1 or 2 children have the highest poverty rate of 4.5%, comprising of 32 families. On the other hand, families with 3 or 4 children have the lowest poverty rate of 0.0%, which includes 0 families.
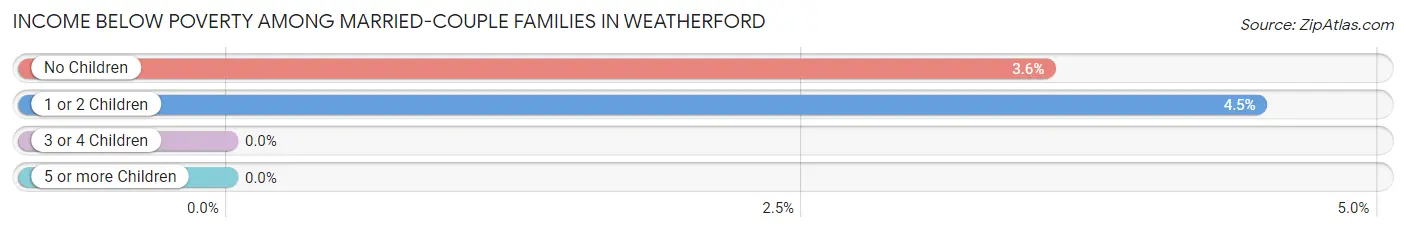
| Children | Above Poverty | Below Poverty |
| No Children | 759 (96.4%) | 28 (3.6%) |
| 1 or 2 Children | 682 (95.5%) | 32 (4.5%) |
| 3 or 4 Children | 106 (100.0%) | 0 (0.0%) |
| 5 or more Children | 30 (100.0%) | 0 (0.0%) |
| Total | 1,577 (96.3%) | 60 (3.7%) |
Income Below Poverty Among Single-Parent Households in Weatherford
According to the poverty data in Weatherford, 15.2% or 17 single-father households and 34.1% or 169 single-mother households are living below the poverty line. Among single-father households, those with 1 or 2 children have the highest poverty rate, with 17 households (100.0%) experiencing poverty. Likewise, among single-mother households, those with no children have the highest poverty rate, with 42 households (71.2%) falling below the poverty line.
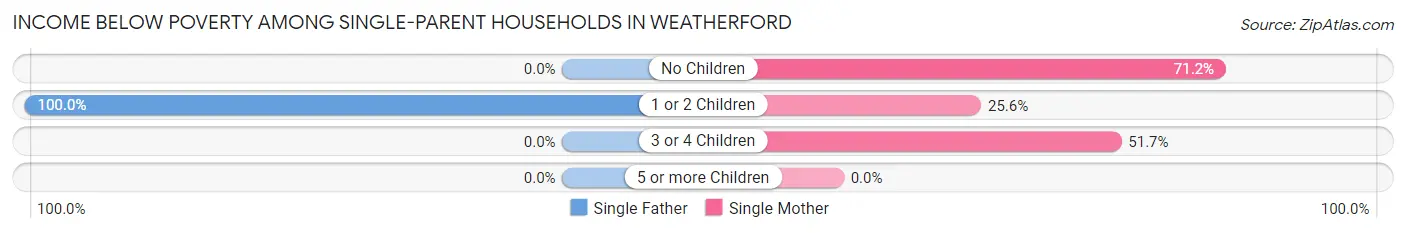
| Children | Single Father | Single Mother |
| No Children | 0 (0.0%) | 42 (71.2%) |
| 1 or 2 Children | 17 (100.0%) | 97 (25.6%) |
| 3 or 4 Children | 0 (0.0%) | 30 (51.7%) |
| 5 or more Children | 0 (0.0%) | 0 (0.0%) |
| Total | 17 (15.2%) | 169 (34.1%) |
Income Below Poverty Among Married-Couple vs Single-Parent Households in Weatherford
The poverty data for Weatherford shows that 60 of the married-couple family households (3.7%) and 186 of the single-parent households (30.6%) are living below the poverty level. Within the married-couple family households, those with 1 or 2 children have the highest poverty rate, with 32 households (4.5%) falling below the poverty line. Among the single-parent households, those with no children have the highest poverty rate, with 42 household (37.8%) living below poverty.
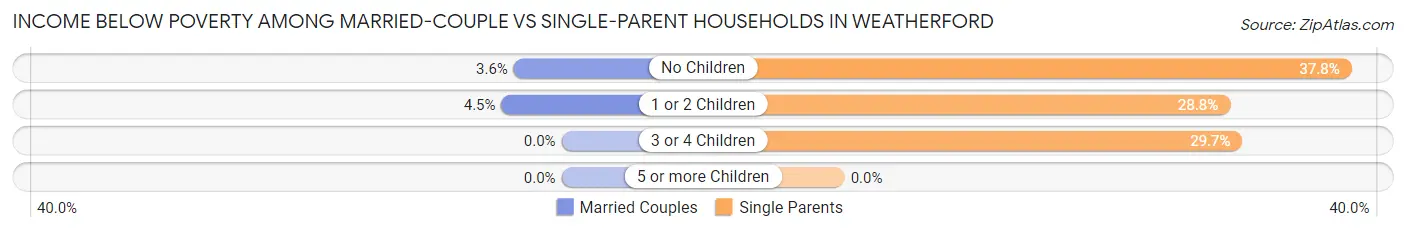
| Children | Married-Couple Families | Single-Parent Households |
| No Children | 28 (3.6%) | 42 (37.8%) |
| 1 or 2 Children | 32 (4.5%) | 114 (28.8%) |
| 3 or 4 Children | 0 (0.0%) | 30 (29.7%) |
| 5 or more Children | 0 (0.0%) | 0 (0.0%) |
| Total | 60 (3.7%) | 186 (30.6%) |
Race in Weatherford
The most populous races in Weatherford are White / Caucasian (9,489 | 79.1%), Hispanic or Latino (1,607 | 13.4%), and Two or more Races (1,283 | 10.7%).
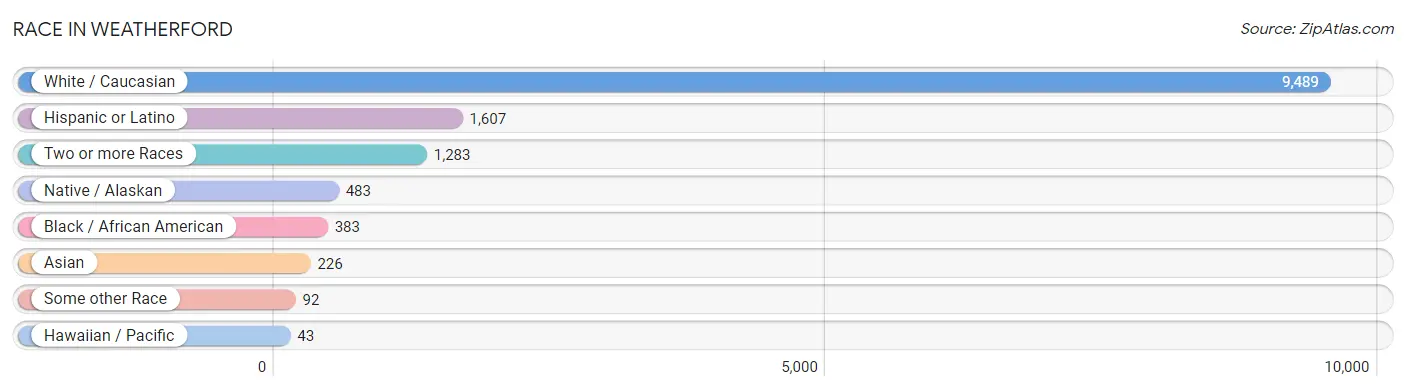
| Race | # Population | % Population |
| Asian | 226 | 1.9% |
| Black / African American | 383 | 3.2% |
| Hawaiian / Pacific | 43 | 0.4% |
| Hispanic or Latino | 1,607 | 13.4% |
| Native / Alaskan | 483 | 4.0% |
| White / Caucasian | 9,489 | 79.1% |
| Two or more Races | 1,283 | 10.7% |
| Some other Race | 92 | 0.8% |
| Total | 11,999 | 100.0% |
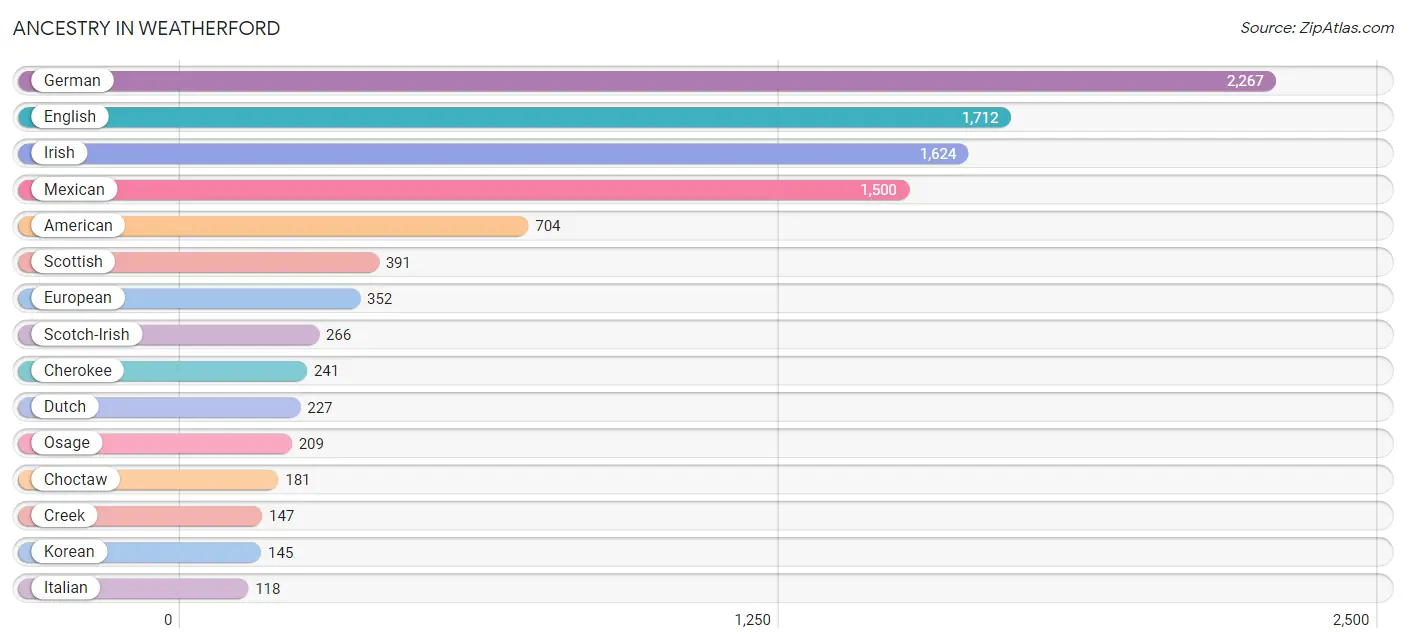
Ancestry in Weatherford
The most populous ancestries reported in Weatherford are German (2,267 | 18.9%), English (1,712 | 14.3%), Irish (1,624 | 13.5%), Mexican (1,500 | 12.5%), and American (704 | 5.9%), together accounting for 65.1% of all Weatherford residents.
| Ancestry | # Population | % Population |
| African | 7 | 0.1% |
| American | 704 | 5.9% |
| Arab | 6 | 0.1% |
| Belgian | 68 | 0.6% |
| Bhutanese | 62 | 0.5% |
| Blackfeet | 2 | 0.0% |
| British | 38 | 0.3% |
| Burmese | 8 | 0.1% |
| Canadian | 45 | 0.4% |
| Central American | 29 | 0.2% |
| Cherokee | 241 | 2.0% |
| Cheyenne | 7 | 0.1% |
| Chickasaw | 55 | 0.5% |
| Chippewa | 9 | 0.1% |
| Choctaw | 181 | 1.5% |
| Comanche | 2 | 0.0% |
| Creek | 147 | 1.2% |
| Czech | 55 | 0.5% |
| Delaware | 9 | 0.1% |
| Dutch | 227 | 1.9% |
| English | 1,712 | 14.3% |
| European | 352 | 2.9% |
| Filipino | 38 | 0.3% |
| French | 8 | 0.1% |
| French Canadian | 6 | 0.1% |
| German | 2,267 | 18.9% |
| Guatemalan | 29 | 0.2% |
| Hungarian | 11 | 0.1% |
| Indian (Asian) | 64 | 0.5% |
| Irish | 1,624 | 13.5% |
| Israeli | 21 | 0.2% |
| Italian | 118 | 1.0% |
| Kiowa | 47 | 0.4% |
| Korean | 145 | 1.2% |
| Mexican | 1,500 | 12.5% |
| Moroccan | 6 | 0.1% |
| Native Hawaiian | 43 | 0.4% |
| Norwegian | 49 | 0.4% |
| Osage | 209 | 1.7% |
| Pakistani | 31 | 0.3% |
| Polish | 100 | 0.8% |
| Puerto Rican | 35 | 0.3% |
| Russian | 56 | 0.5% |
| Scandinavian | 8 | 0.1% |
| Scotch-Irish | 266 | 2.2% |
| Scottish | 391 | 3.3% |
| Seminole | 53 | 0.4% |
| Sioux | 3 | 0.0% |
| Spaniard | 43 | 0.4% |
| Sri Lankan | 59 | 0.5% |
| Subsaharan African | 7 | 0.1% |
| Swedish | 68 | 0.6% |
| Swiss | 11 | 0.1% |
| Thai | 29 | 0.2% |
| Tlingit-Haida | 12 | 0.1% |
| Trinidadian and Tobagonian | 25 | 0.2% |
| Welsh | 24 | 0.2% | View All 57 Rows |
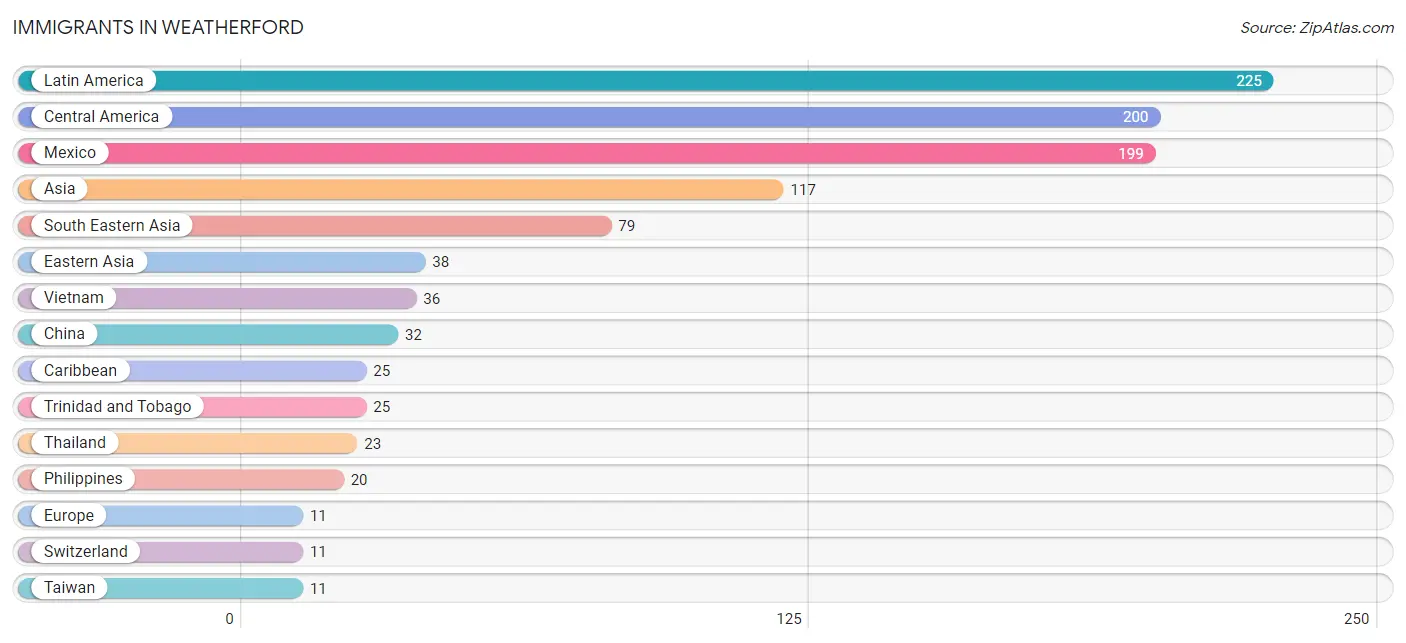
Immigrants in Weatherford
The most numerous immigrant groups reported in Weatherford came from Latin America (225 | 1.9%), Central America (200 | 1.7%), Mexico (199 | 1.7%), Asia (117 | 1.0%), and South Eastern Asia (79 | 0.7%), together accounting for 6.9% of all Weatherford residents.
| Immigration Origin | # Population | % Population |
| Africa | 6 | 0.1% |
| Asia | 117 | 1.0% |
| Australia | 3 | 0.0% |
| Caribbean | 25 | 0.2% |
| Central America | 200 | 1.7% |
| China | 32 | 0.3% |
| Eastern Asia | 38 | 0.3% |
| Europe | 11 | 0.1% |
| Guatemala | 1 | 0.0% |
| Japan | 6 | 0.1% |
| Latin America | 225 | 1.9% |
| Mexico | 199 | 1.7% |
| Morocco | 6 | 0.1% |
| Northern Africa | 6 | 0.1% |
| Oceania | 3 | 0.0% |
| Philippines | 20 | 0.2% |
| South Eastern Asia | 79 | 0.7% |
| Switzerland | 11 | 0.1% |
| Taiwan | 11 | 0.1% |
| Thailand | 23 | 0.2% |
| Trinidad and Tobago | 25 | 0.2% |
| Vietnam | 36 | 0.3% |
| Western Europe | 11 | 0.1% | View All 23 Rows |
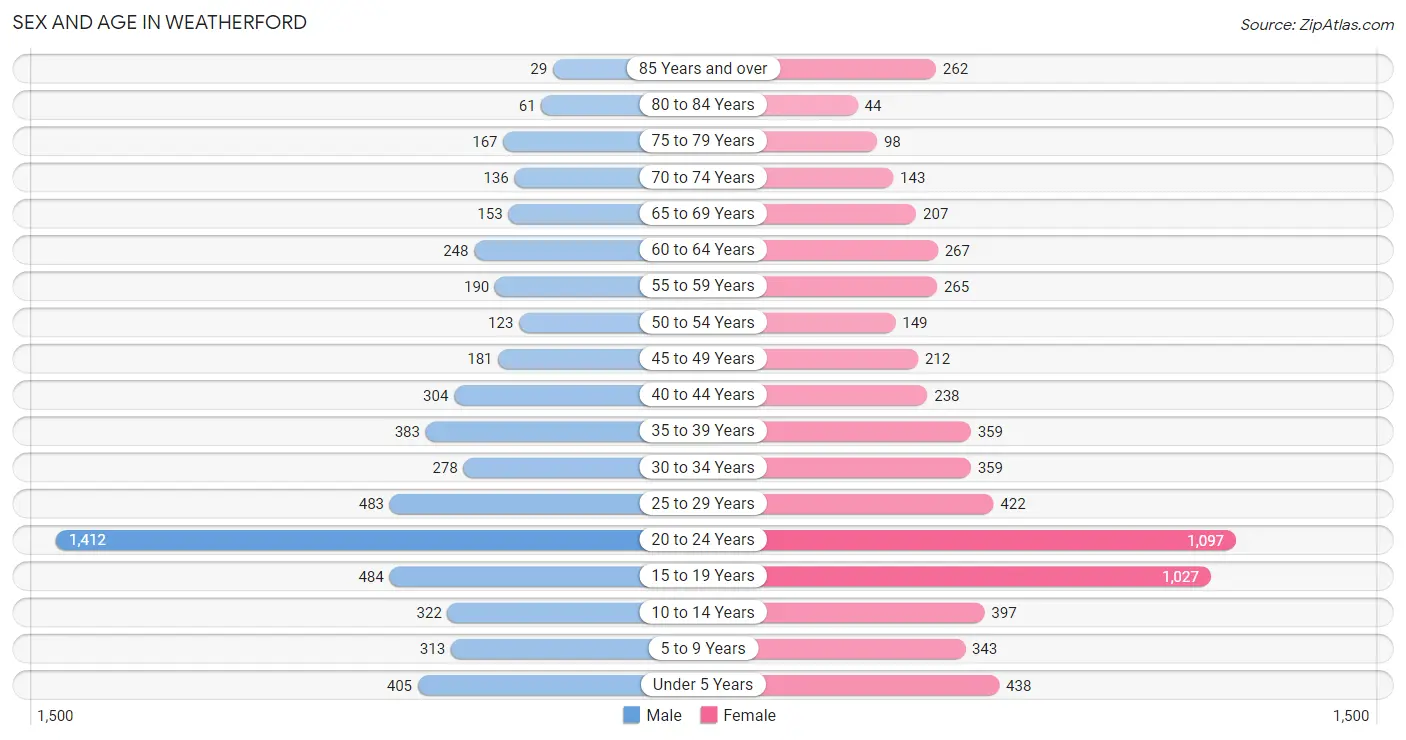
Sex and Age in Weatherford
Sex and Age in Weatherford
The most populous age groups in Weatherford are 20 to 24 Years (1,412 | 24.9%) for men and 20 to 24 Years (1,097 | 17.3%) for women.
| Age Bracket | Male | Female |
| Under 5 Years | 405 (7.1%) | 438 (6.9%) |
| 5 to 9 Years | 313 (5.5%) | 343 (5.4%) |
| 10 to 14 Years | 322 (5.7%) | 397 (6.3%) |
| 15 to 19 Years | 484 (8.5%) | 1,027 (16.2%) |
| 20 to 24 Years | 1,412 (24.9%) | 1,097 (17.3%) |
| 25 to 29 Years | 483 (8.5%) | 422 (6.7%) |
| 30 to 34 Years | 278 (4.9%) | 359 (5.7%) |
| 35 to 39 Years | 383 (6.8%) | 359 (5.7%) |
| 40 to 44 Years | 304 (5.4%) | 238 (3.8%) |
| 45 to 49 Years | 181 (3.2%) | 212 (3.4%) |
| 50 to 54 Years | 123 (2.2%) | 149 (2.4%) |
| 55 to 59 Years | 190 (3.4%) | 265 (4.2%) |
| 60 to 64 Years | 248 (4.4%) | 267 (4.2%) |
| 65 to 69 Years | 153 (2.7%) | 207 (3.3%) |
| 70 to 74 Years | 136 (2.4%) | 143 (2.3%) |
| 75 to 79 Years | 167 (2.9%) | 98 (1.5%) |
| 80 to 84 Years | 61 (1.1%) | 44 (0.7%) |
| 85 Years and over | 29 (0.5%) | 262 (4.1%) |
| Total | 5,672 (100.0%) | 6,327 (100.0%) |
Families and Households in Weatherford
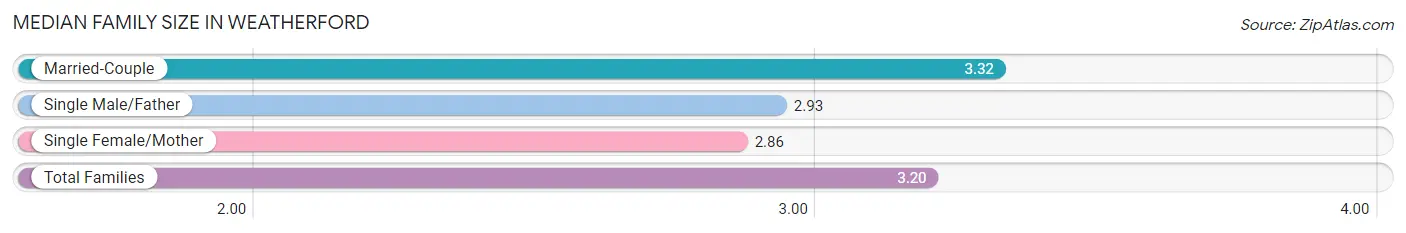
Median Family Size in Weatherford
The median family size in Weatherford is 3.20 persons per family, with married-couple families (1,637 | 72.9%) accounting for the largest median family size of 3.32 persons per family. On the other hand, single female/mother families (496 | 22.1%) represent the smallest median family size with 2.86 persons per family.
| Family Type | # Families | Family Size |
| Married-Couple | 1,637 (72.9%) | 3.32 |
| Single Male/Father | 112 (5.0%) | 2.93 |
| Single Female/Mother | 496 (22.1%) | 2.86 |
| Total Families | 2,245 (100.0%) | 3.20 |
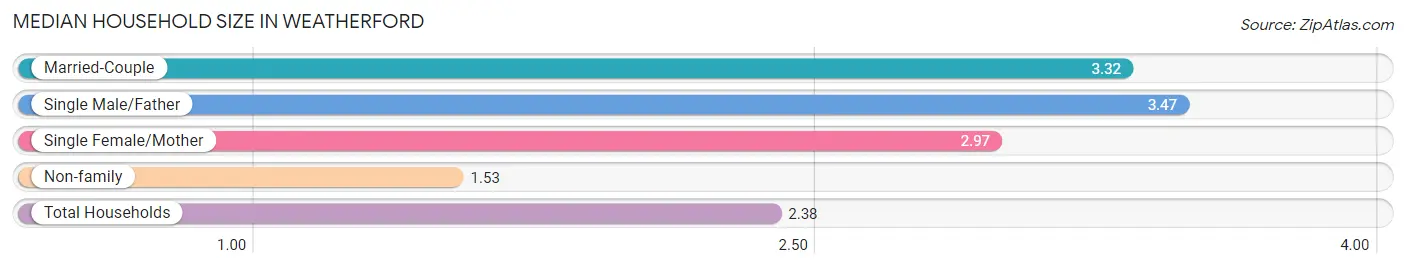
Median Household Size in Weatherford
The median household size in Weatherford is 2.38 persons per household, with single male/father households (112 | 2.5%) accounting for the largest median household size of 3.47 persons per household. non-family households (2,285 | 50.4%) represent the smallest median household size with 1.53 persons per household.
| Household Type | # Households | Household Size |
| Married-Couple | 1,637 (36.1%) | 3.32 |
| Single Male/Father | 112 (2.5%) | 3.47 |
| Single Female/Mother | 496 (11.0%) | 2.97 |
| Non-family | 2,285 (50.4%) | 1.53 |
| Total Households | 4,530 (100.0%) | 2.38 |
Household Size by Marriage Status in Weatherford
Out of a total of 4,530 households in Weatherford, 2,245 (49.6%) are family households, while 2,285 (50.4%) are nonfamily households. The most numerous type of family households are 2-person households, comprising 790, and the most common type of nonfamily households are 1-person households, comprising 1,683.
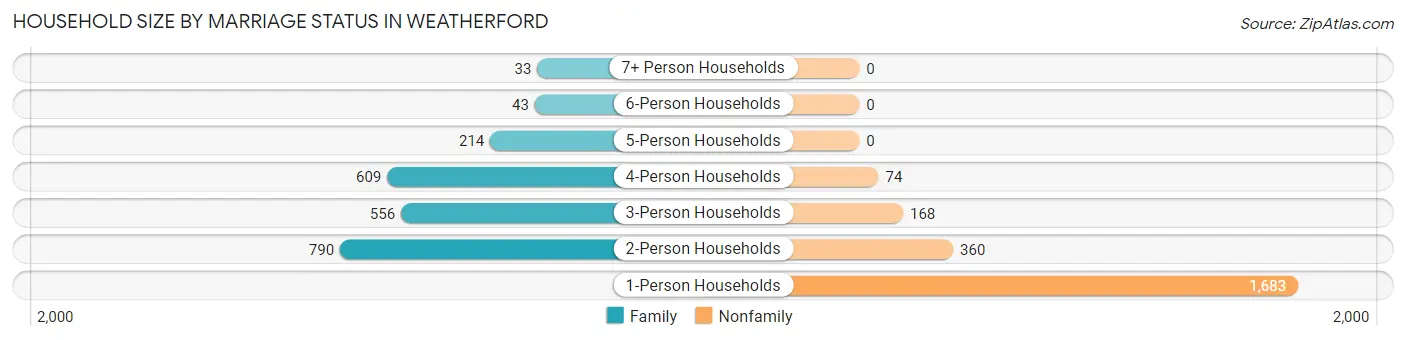
| Household Size | Family Households | Nonfamily Households |
| 1-Person Households | - | 1,683 (37.1%) |
| 2-Person Households | 790 (17.4%) | 360 (8.0%) |
| 3-Person Households | 556 (12.3%) | 168 (3.7%) |
| 4-Person Households | 609 (13.4%) | 74 (1.6%) |
| 5-Person Households | 214 (4.7%) | 0 (0.0%) |
| 6-Person Households | 43 (0.9%) | 0 (0.0%) |
| 7+ Person Households | 33 (0.7%) | 0 (0.0%) |
| Total | 2,245 (49.6%) | 2,285 (50.4%) |
Female Fertility in Weatherford
Fertility by Age in Weatherford
Average fertility rate in Weatherford is 26.0 births per 1,000 women. Women in the age bracket of 35 to 50 years have the highest fertility rate with 37.0 births per 1,000 women. Women in the age bracket of 20 to 34 years acount for 68.0% of all women with births.
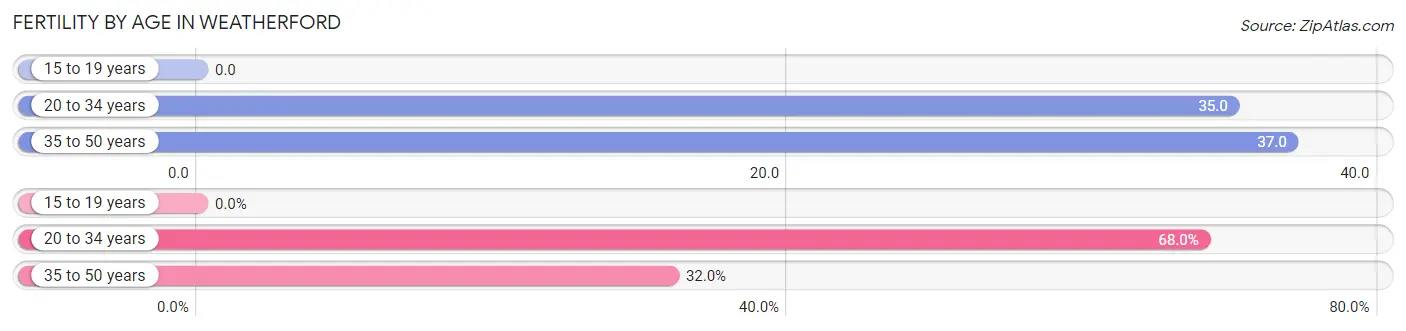
| Age Bracket | Women with Births | Births / 1,000 Women |
| 15 to 19 years | 0 (0.0%) | 0.0 |
| 20 to 34 years | 66 (68.0%) | 35.0 |
| 35 to 50 years | 31 (32.0%) | 37.0 |
| Total | 97 (100.0%) | 26.0 |
Fertility by Age by Marriage Status in Weatherford
32.0% of women with births (97) in Weatherford are married. The highest percentage of unmarried women with births falls into 20 to 34 years age bracket with 100.0% of them unmarried at the time of birth, while the lowest percentage of unmarried women with births belong to 35 to 50 years age bracket with 0.0% of them unmarried.
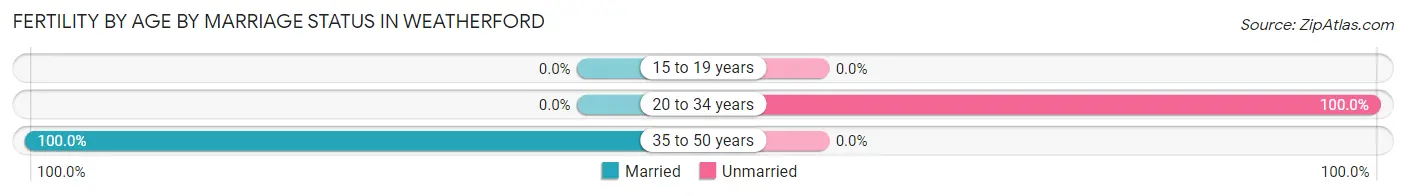
| Age Bracket | Married | Unmarried |
| 15 to 19 years | 0 (0.0%) | 0 (0.0%) |
| 20 to 34 years | 0 (0.0%) | 66 (100.0%) |
| 35 to 50 years | 31 (100.0%) | 0 (0.0%) |
| Total | 31 (32.0%) | 66 (68.0%) |
Fertility by Education in Weatherford
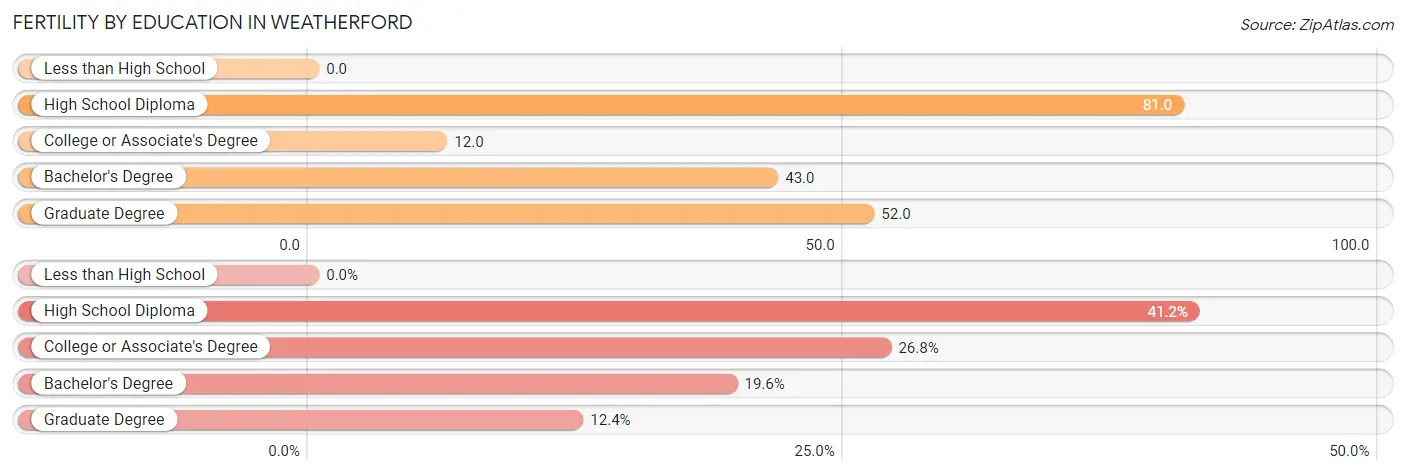
| Educational Attainment | Women with Births | Births / 1,000 Women |
| Less than High School | 0 (0.0%) | 0.0 |
| High School Diploma | 40 (41.2%) | 81.0 |
| College or Associate's Degree | 26 (26.8%) | 12.0 |
| Bachelor's Degree | 19 (19.6%) | 43.0 |
| Graduate Degree | 12 (12.4%) | 52.0 |
| Total | 97 (100.0%) | 26.0 |
Fertility by Education by Marriage Status in Weatherford
68.0% of women with births in Weatherford are unmarried. Women with the educational attainment of bachelor's degree are most likely to be married with 100.0% of them married at childbirth, while women with the educational attainment of high school diploma are least likely to be married with 100.0% of them unmarried at childbirth.
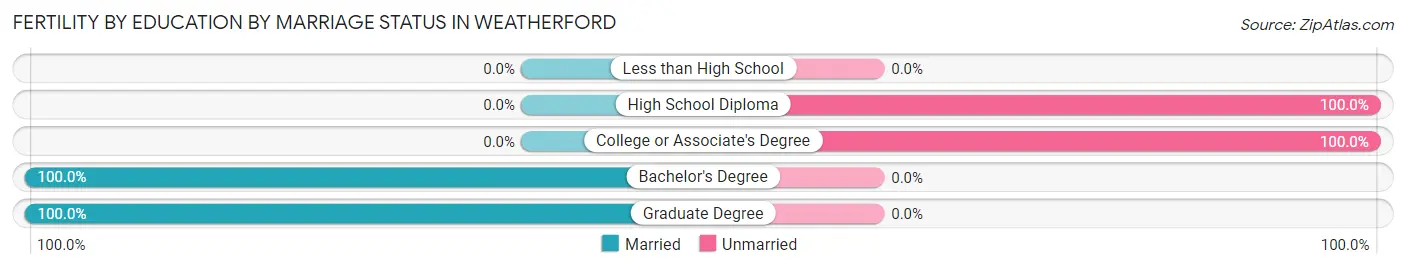
| Educational Attainment | Married | Unmarried |
| Less than High School | 0 (0.0%) | 0 (0.0%) |
| High School Diploma | 0 (0.0%) | 40 (100.0%) |
| College or Associate's Degree | 0 (0.0%) | 26 (100.0%) |
| Bachelor's Degree | 19 (100.0%) | 0 (0.0%) |
| Graduate Degree | 12 (100.0%) | 0 (0.0%) |
| Total | 31 (32.0%) | 66 (68.0%) |
Employment Characteristics in Weatherford
Employment by Class of Employer in Weatherford
Among the 6,228 employed individuals in Weatherford, private company employees (4,080 | 65.5%), state government employees (827 | 13.3%), and not-for-profit organizations (478 | 7.7%) make up the most common classes of employment.
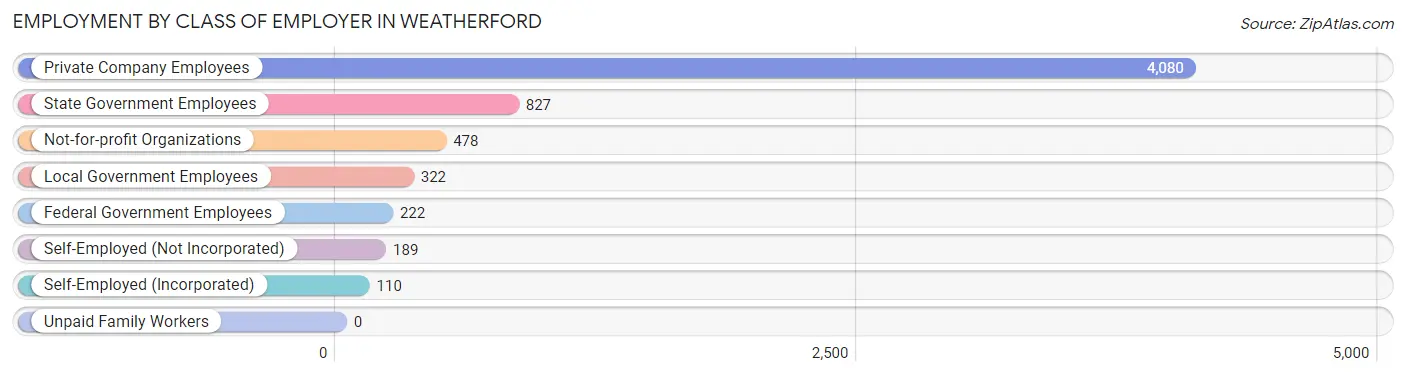
| Employer Class | # Employees | % Employees |
| Private Company Employees | 4,080 | 65.5% |
| Self-Employed (Incorporated) | 110 | 1.8% |
| Self-Employed (Not Incorporated) | 189 | 3.0% |
| Not-for-profit Organizations | 478 | 7.7% |
| Local Government Employees | 322 | 5.2% |
| State Government Employees | 827 | 13.3% |
| Federal Government Employees | 222 | 3.6% |
| Unpaid Family Workers | 0 | 0.0% |
| Total | 6,228 | 100.0% |
Employment Status by Age in Weatherford
According to the labor force statistics for Weatherford, out of the total population over 16 years of age (9,619), 69.5% or 6,685 individuals are in the labor force, with 5.2% or 348 of them unemployed. The age group with the highest labor force participation rate is 30 to 34 years, with 93.2% or 594 individuals in the labor force. Within the labor force, the 20 to 24 years age range has the highest percentage of unemployed individuals, with 10.3% or 224 of them being unemployed.
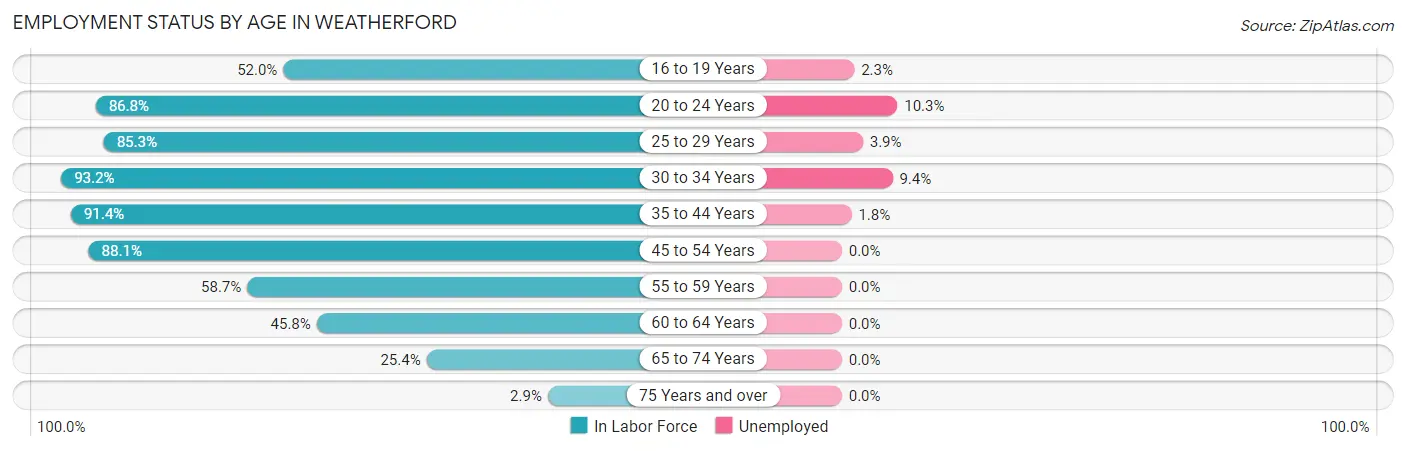
| Age Bracket | In Labor Force | Unemployed |
| 16 to 19 Years | 701 (52.0%) | 16 (2.3%) |
| 20 to 24 Years | 2,178 (86.8%) | 224 (10.3%) |
| 25 to 29 Years | 772 (85.3%) | 30 (3.9%) |
| 30 to 34 Years | 594 (93.2%) | 56 (9.4%) |
| 35 to 44 Years | 1,174 (91.4%) | 21 (1.8%) |
| 45 to 54 Years | 586 (88.1%) | 0 (0.0%) |
| 55 to 59 Years | 267 (58.7%) | 0 (0.0%) |
| 60 to 64 Years | 236 (45.8%) | 0 (0.0%) |
| 65 to 74 Years | 162 (25.4%) | 0 (0.0%) |
| 75 Years and over | 19 (2.9%) | 0 (0.0%) |
| Total | 6,685 (69.5%) | 348 (5.2%) |
Employment Status by Educational Attainment in Weatherford
According to labor force statistics for Weatherford, 81.3% of individuals (3,627) out of the total population between 25 and 64 years of age (4,461) are in the labor force, with 2.9% or 105 of them being unemployed. The group with the highest labor force participation rate are those with the educational attainment of bachelor's degree or higher, with 91.5% or 1,384 individuals in the labor force. Within the labor force, individuals with high school diploma education have the highest percentage of unemployment, with 5.8% or 41 of them being unemployed.
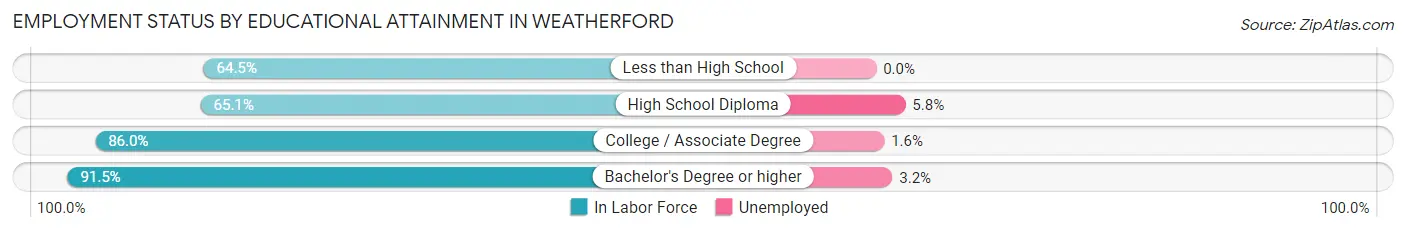
| Educational Attainment | In Labor Force | Unemployed |
| Less than High School | 193 (64.5%) | 0 (0.0%) |
| High School Diploma | 705 (65.1%) | 63 (5.8%) |
| College / Associate Degree | 1,347 (86.0%) | 25 (1.6%) |
| Bachelor's Degree or higher | 1,384 (91.5%) | 48 (3.2%) |
| Total | 3,627 (81.3%) | 129 (2.9%) |
Employment Occupations by Sex in Weatherford
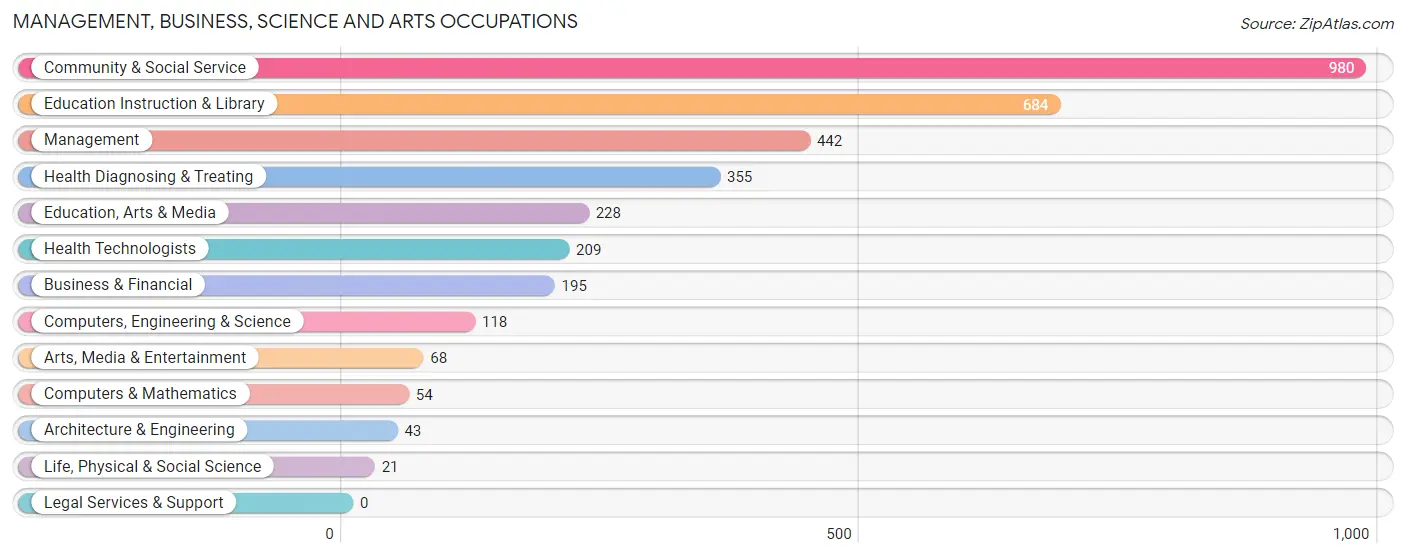
Management, Business, Science and Arts Occupations
The most common Management, Business, Science and Arts occupations in Weatherford are Community & Social Service (980 | 15.5%), Education Instruction & Library (684 | 10.8%), Management (442 | 7.0%), Health Diagnosing & Treating (355 | 5.6%), and Education, Arts & Media (228 | 3.6%).
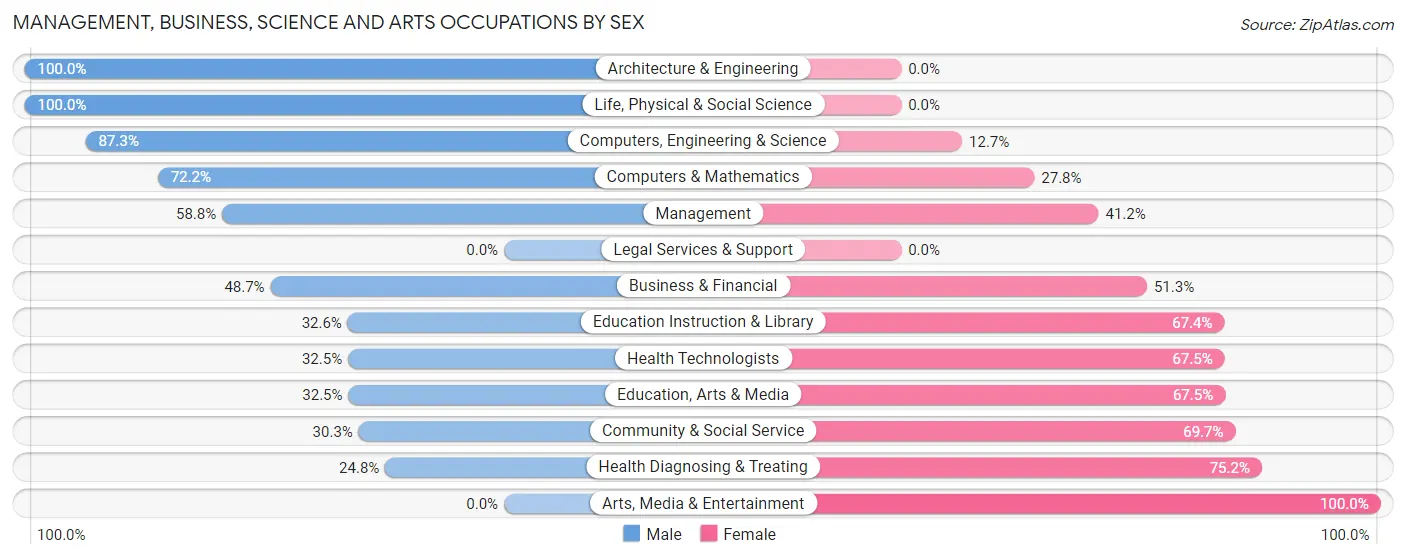
Management, Business, Science and Arts Occupations by Sex
Within the Management, Business, Science and Arts occupations in Weatherford, the most male-oriented occupations are Architecture & Engineering (100.0%), Life, Physical & Social Science (100.0%), and Computers, Engineering & Science (87.3%), while the most female-oriented occupations are Arts, Media & Entertainment (100.0%), Health Diagnosing & Treating (75.2%), and Community & Social Service (69.7%).
| Occupation | Male | Female |
| Management | 260 (58.8%) | 182 (41.2%) |
| Business & Financial | 95 (48.7%) | 100 (51.3%) |
| Computers, Engineering & Science | 103 (87.3%) | 15 (12.7%) |
| Computers & Mathematics | 39 (72.2%) | 15 (27.8%) |
| Architecture & Engineering | 43 (100.0%) | 0 (0.0%) |
| Life, Physical & Social Science | 21 (100.0%) | 0 (0.0%) |
| Community & Social Service | 297 (30.3%) | 683 (69.7%) |
| Education, Arts & Media | 74 (32.5%) | 154 (67.5%) |
| Legal Services & Support | 0 (0.0%) | 0 (0.0%) |
| Education Instruction & Library | 223 (32.6%) | 461 (67.4%) |
| Arts, Media & Entertainment | 0 (0.0%) | 68 (100.0%) |
| Health Diagnosing & Treating | 88 (24.8%) | 267 (75.2%) |
| Health Technologists | 68 (32.5%) | 141 (67.5%) |
| Total (Category) | 843 (40.3%) | 1,247 (59.7%) |
| Total (Overall) | 3,218 (50.9%) | 3,107 (49.1%) |
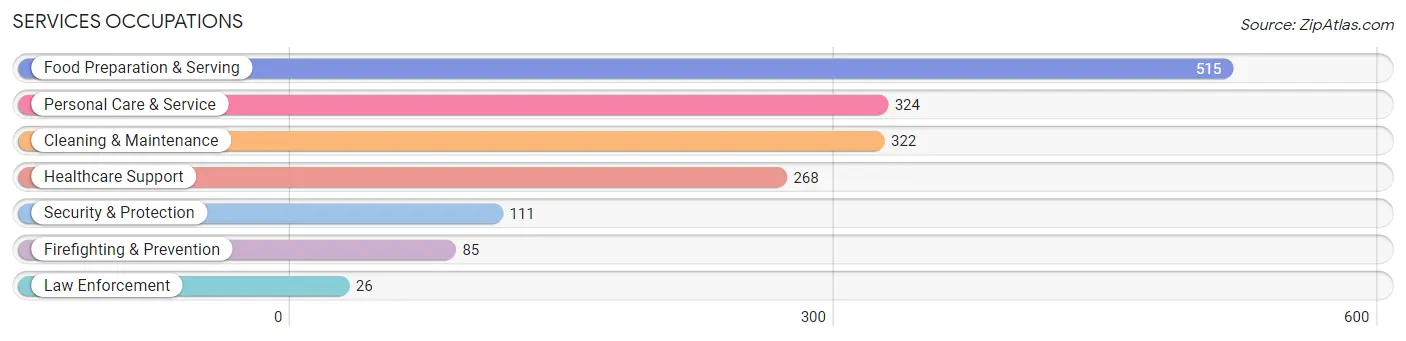
Services Occupations
The most common Services occupations in Weatherford are Food Preparation & Serving (515 | 8.1%), Personal Care & Service (324 | 5.1%), Cleaning & Maintenance (322 | 5.1%), Healthcare Support (268 | 4.2%), and Security & Protection (111 | 1.8%).
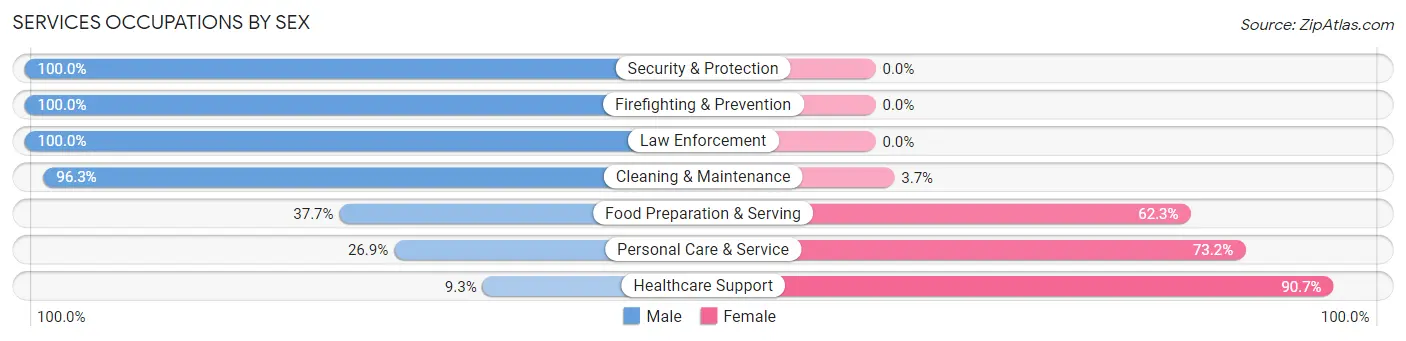
Services Occupations by Sex
Within the Services occupations in Weatherford, the most male-oriented occupations are Security & Protection (100.0%), Firefighting & Prevention (100.0%), and Law Enforcement (100.0%), while the most female-oriented occupations are Healthcare Support (90.7%), Personal Care & Service (73.2%), and Food Preparation & Serving (62.3%).
| Occupation | Male | Female |
| Healthcare Support | 25 (9.3%) | 243 (90.7%) |
| Security & Protection | 111 (100.0%) | 0 (0.0%) |
| Firefighting & Prevention | 85 (100.0%) | 0 (0.0%) |
| Law Enforcement | 26 (100.0%) | 0 (0.0%) |
| Food Preparation & Serving | 194 (37.7%) | 321 (62.3%) |
| Cleaning & Maintenance | 310 (96.3%) | 12 (3.7%) |
| Personal Care & Service | 87 (26.9%) | 237 (73.2%) |
| Total (Category) | 727 (47.2%) | 813 (52.8%) |
| Total (Overall) | 3,218 (50.9%) | 3,107 (49.1%) |
Sales and Office Occupations
The most common Sales and Office occupations in Weatherford are Sales & Related (934 | 14.8%), and Office & Administration (579 | 9.1%).
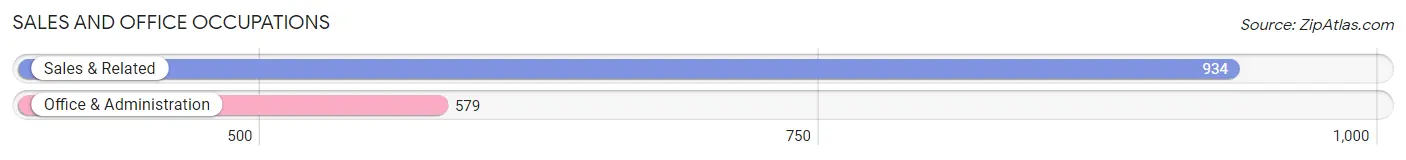
Sales and Office Occupations by Sex
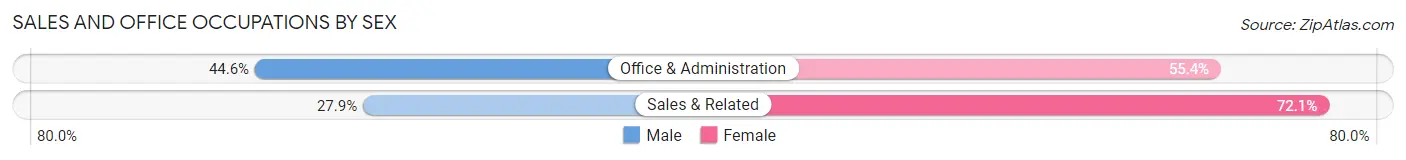
| Occupation | Male | Female |
| Sales & Related | 261 (27.9%) | 673 (72.1%) |
| Office & Administration | 258 (44.6%) | 321 (55.4%) |
| Total (Category) | 519 (34.3%) | 994 (65.7%) |
| Total (Overall) | 3,218 (50.9%) | 3,107 (49.1%) |
Natural Resources, Construction and Maintenance Occupations
The most common Natural Resources, Construction and Maintenance occupations in Weatherford are Construction & Extraction (495 | 7.8%), Installation, Maintenance & Repair (124 | 2.0%), and Farming, Fishing & Forestry (69 | 1.1%).
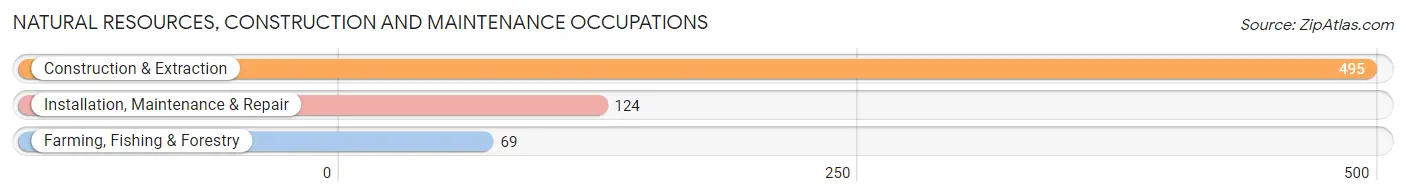
Natural Resources, Construction and Maintenance Occupations by Sex
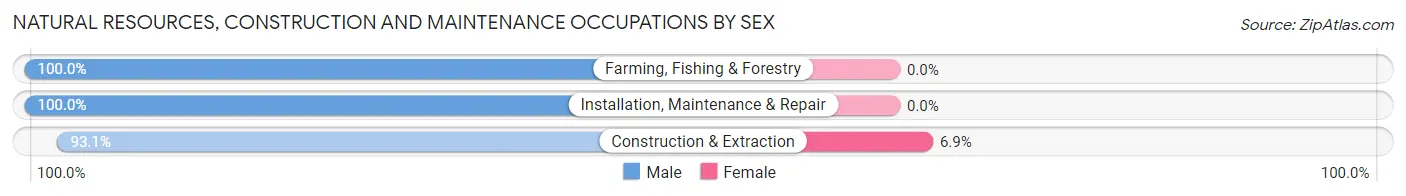
| Occupation | Male | Female |
| Farming, Fishing & Forestry | 69 (100.0%) | 0 (0.0%) |
| Construction & Extraction | 461 (93.1%) | 34 (6.9%) |
| Installation, Maintenance & Repair | 124 (100.0%) | 0 (0.0%) |
| Total (Category) | 654 (95.1%) | 34 (4.9%) |
| Total (Overall) | 3,218 (50.9%) | 3,107 (49.1%) |
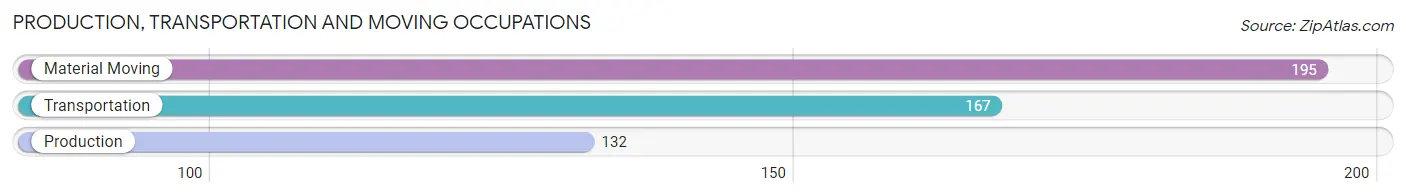
Production, Transportation and Moving Occupations
The most common Production, Transportation and Moving occupations in Weatherford are Material Moving (195 | 3.1%), Transportation (167 | 2.6%), and Production (132 | 2.1%).
Production, Transportation and Moving Occupations by Sex
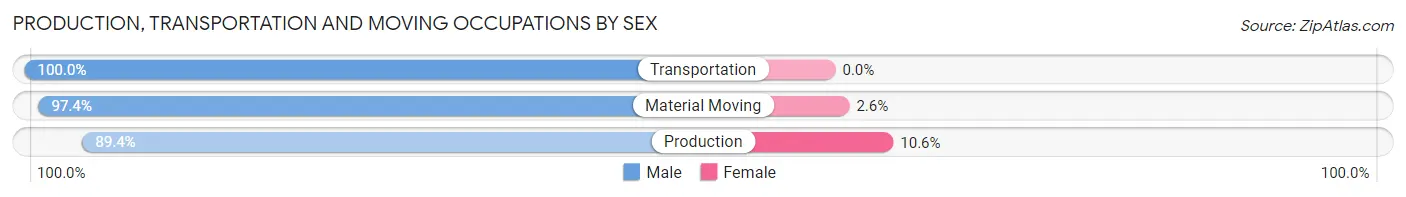
| Occupation | Male | Female |
| Production | 118 (89.4%) | 14 (10.6%) |
| Transportation | 167 (100.0%) | 0 (0.0%) |
| Material Moving | 190 (97.4%) | 5 (2.6%) |
| Total (Category) | 475 (96.2%) | 19 (3.8%) |
| Total (Overall) | 3,218 (50.9%) | 3,107 (49.1%) |
Employment Industries by Sex in Weatherford
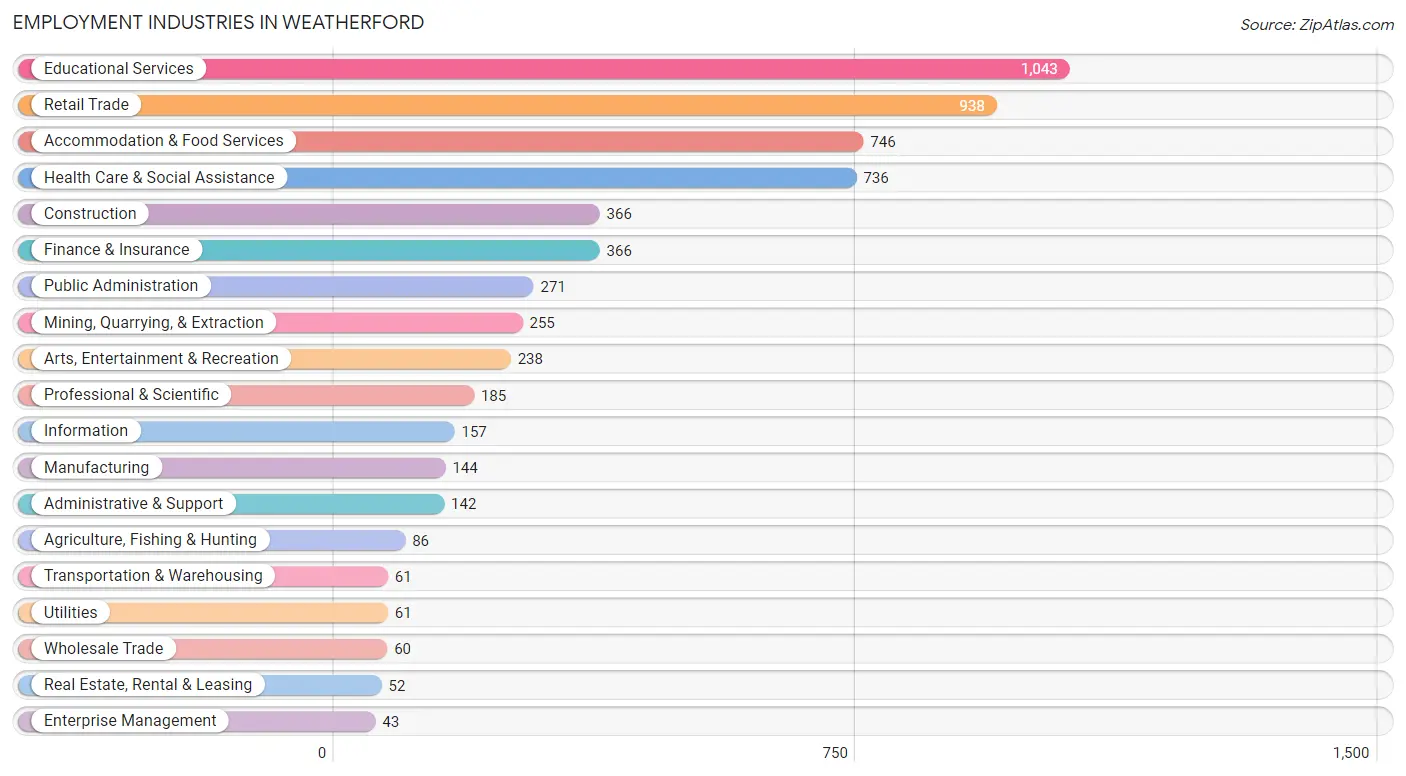
Employment Industries in Weatherford
The major employment industries in Weatherford include Educational Services (1,043 | 16.5%), Retail Trade (938 | 14.8%), Accommodation & Food Services (746 | 11.8%), Health Care & Social Assistance (736 | 11.6%), and Construction (366 | 5.8%).
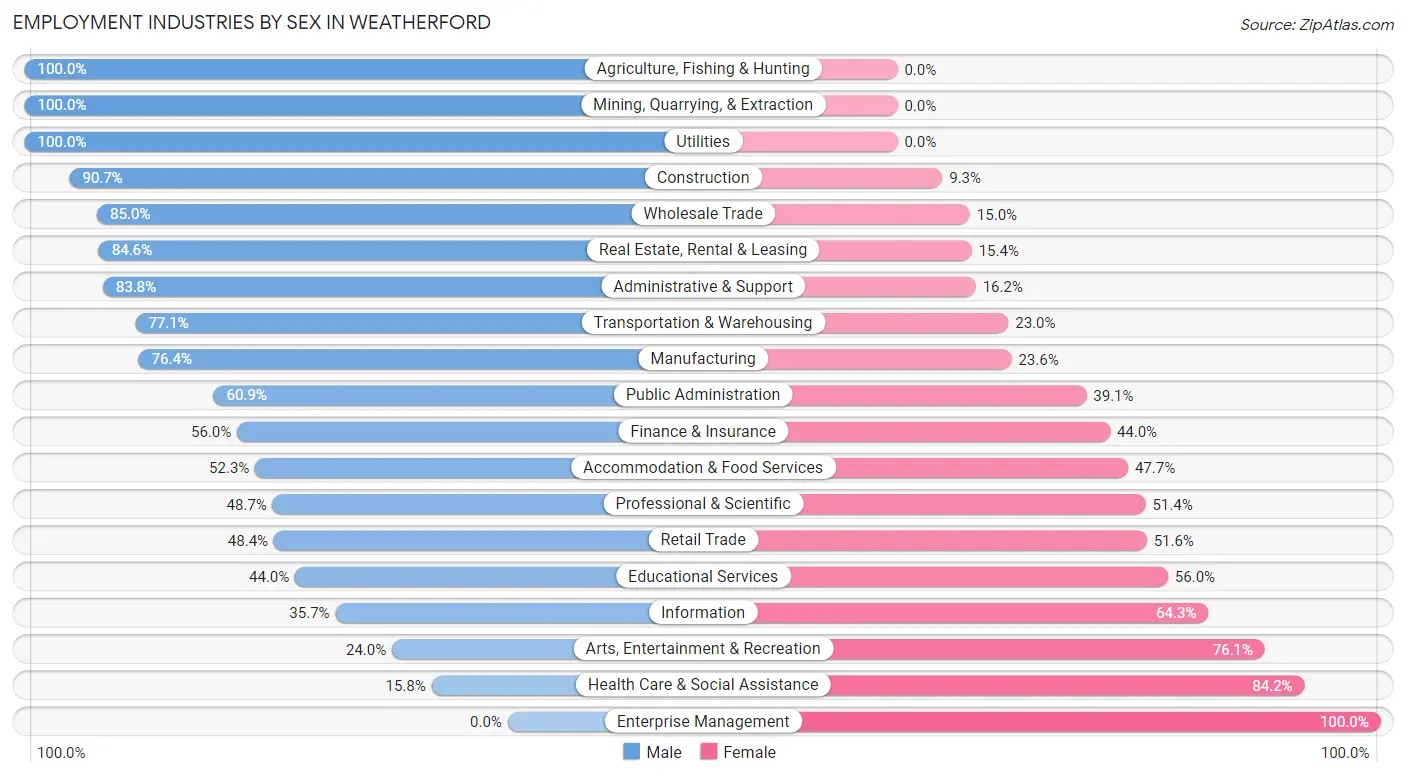
Employment Industries by Sex in Weatherford
The Weatherford industries that see more men than women are Agriculture, Fishing & Hunting (100.0%), Mining, Quarrying, & Extraction (100.0%), and Utilities (100.0%), whereas the industries that tend to have a higher number of women are Enterprise Management (100.0%), Health Care & Social Assistance (84.2%), and Arts, Entertainment & Recreation (76.0%).
| Industry | Male | Female |
| Agriculture, Fishing & Hunting | 86 (100.0%) | 0 (0.0%) |
| Mining, Quarrying, & Extraction | 255 (100.0%) | 0 (0.0%) |
| Construction | 332 (90.7%) | 34 (9.3%) |
| Manufacturing | 110 (76.4%) | 34 (23.6%) |
| Wholesale Trade | 51 (85.0%) | 9 (15.0%) |
| Retail Trade | 454 (48.4%) | 484 (51.6%) |
| Transportation & Warehousing | 47 (77.0%) | 14 (23.0%) |
| Utilities | 61 (100.0%) | 0 (0.0%) |
| Information | 56 (35.7%) | 101 (64.3%) |
| Finance & Insurance | 205 (56.0%) | 161 (44.0%) |
| Real Estate, Rental & Leasing | 44 (84.6%) | 8 (15.4%) |
| Professional & Scientific | 90 (48.6%) | 95 (51.3%) |
| Enterprise Management | 0 (0.0%) | 43 (100.0%) |
| Administrative & Support | 119 (83.8%) | 23 (16.2%) |
| Educational Services | 459 (44.0%) | 584 (56.0%) |
| Health Care & Social Assistance | 116 (15.8%) | 620 (84.2%) |
| Arts, Entertainment & Recreation | 57 (23.9%) | 181 (76.0%) |
| Accommodation & Food Services | 390 (52.3%) | 356 (47.7%) |
| Public Administration | 165 (60.9%) | 106 (39.1%) |
| Total | 3,218 (50.9%) | 3,107 (49.1%) |
Education in Weatherford
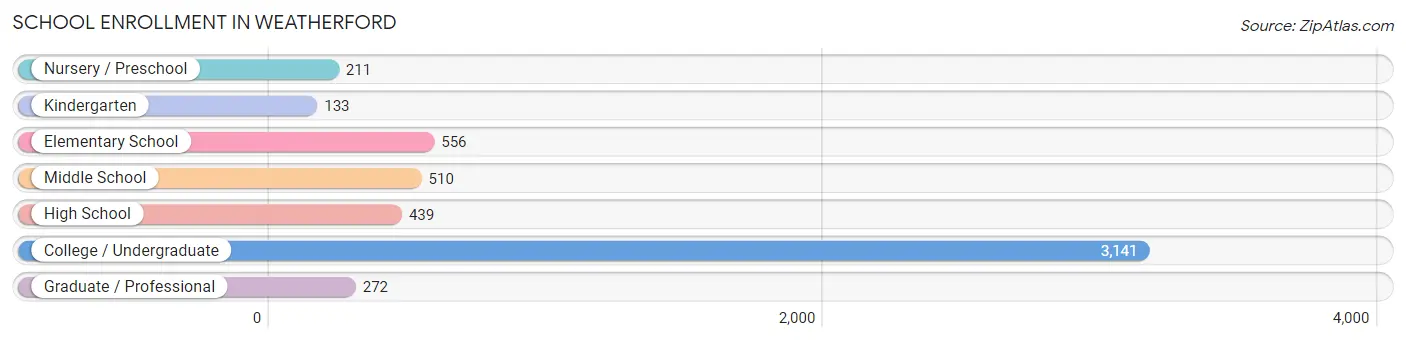
School Enrollment in Weatherford
The most common levels of schooling among the 5,262 students in Weatherford are college / undergraduate (3,141 | 59.7%), elementary school (556 | 10.6%), and middle school (510 | 9.7%).
| School Level | # Students | % Students |
| Nursery / Preschool | 211 | 4.0% |
| Kindergarten | 133 | 2.5% |
| Elementary School | 556 | 10.6% |
| Middle School | 510 | 9.7% |
| High School | 439 | 8.3% |
| College / Undergraduate | 3,141 | 59.7% |
| Graduate / Professional | 272 | 5.2% |
| Total | 5,262 | 100.0% |
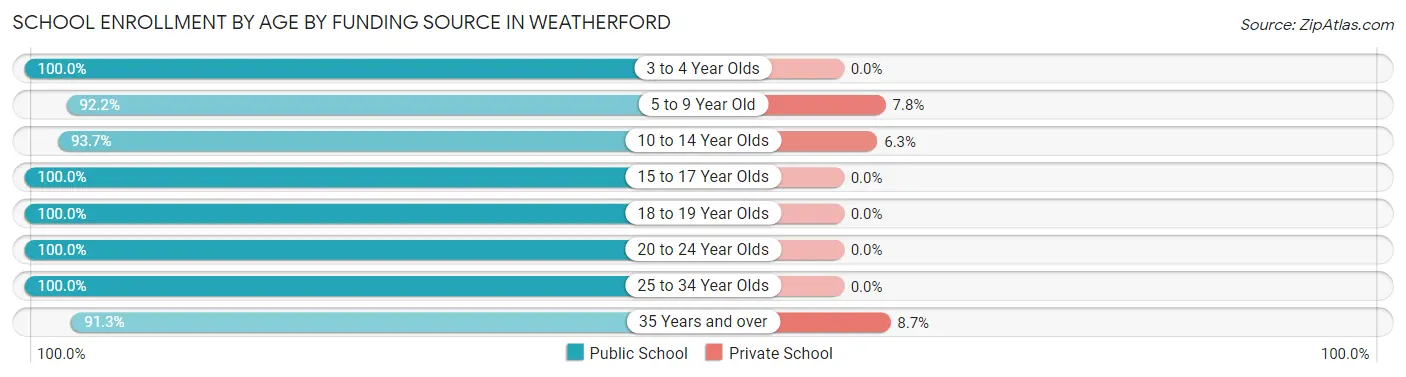
School Enrollment by Age by Funding Source in Weatherford
Out of a total of 5,262 students who are enrolled in schools in Weatherford, 100 (1.9%) attend a private institution, while the remaining 5,162 (98.1%) are enrolled in public schools. The age group of 35 years and over has the highest likelihood of being enrolled in private schools, with 8 (8.7% in the age bracket) enrolled. Conversely, the age group of 3 to 4 year olds has the lowest likelihood of being enrolled in a private school, with 123 (100.0% in the age bracket) attending a public institution.
| Age Bracket | Public School | Private School |
| 3 to 4 Year Olds | 123 (100.0%) | 0 (0.0%) |
| 5 to 9 Year Old | 555 (92.2%) | 47 (7.8%) |
| 10 to 14 Year Olds | 674 (93.7%) | 45 (6.3%) |
| 15 to 17 Year Olds | 368 (100.0%) | 0 (0.0%) |
| 18 to 19 Year Olds | 1,088 (100.0%) | 0 (0.0%) |
| 20 to 24 Year Olds | 2,021 (100.0%) | 0 (0.0%) |
| 25 to 34 Year Olds | 249 (100.0%) | 0 (0.0%) |
| 35 Years and over | 84 (91.3%) | 8 (8.7%) |
| Total | 5,162 (98.1%) | 100 (1.9%) |
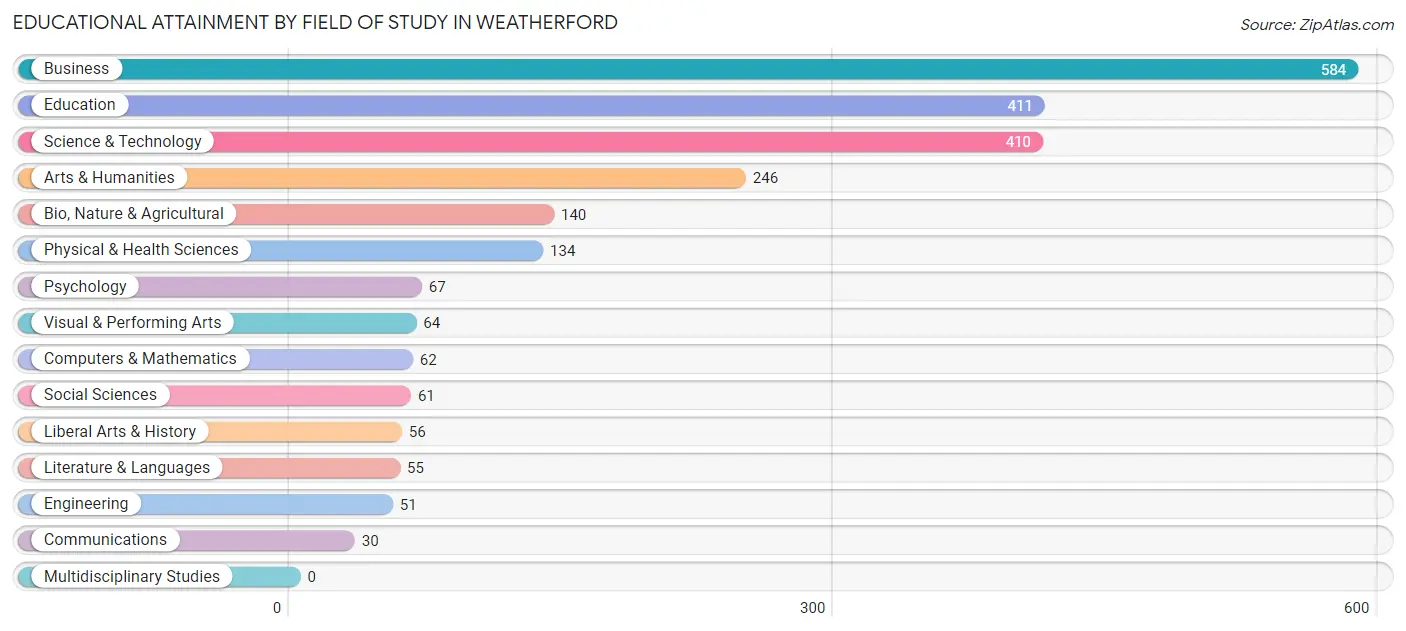
Educational Attainment by Field of Study in Weatherford
Business (584 | 24.6%), education (411 | 17.3%), science & technology (410 | 17.3%), arts & humanities (246 | 10.4%), and bio, nature & agricultural (140 | 5.9%) are the most common fields of study among 2,371 individuals in Weatherford who have obtained a bachelor's degree or higher.
| Field of Study | # Graduates | % Graduates |
| Computers & Mathematics | 62 | 2.6% |
| Bio, Nature & Agricultural | 140 | 5.9% |
| Physical & Health Sciences | 134 | 5.7% |
| Psychology | 67 | 2.8% |
| Social Sciences | 61 | 2.6% |
| Engineering | 51 | 2.1% |
| Multidisciplinary Studies | 0 | 0.0% |
| Science & Technology | 410 | 17.3% |
| Business | 584 | 24.6% |
| Education | 411 | 17.3% |
| Literature & Languages | 55 | 2.3% |
| Liberal Arts & History | 56 | 2.4% |
| Visual & Performing Arts | 64 | 2.7% |
| Communications | 30 | 1.3% |
| Arts & Humanities | 246 | 10.4% |
| Total | 2,371 | 100.0% |
Transportation & Commute in Weatherford
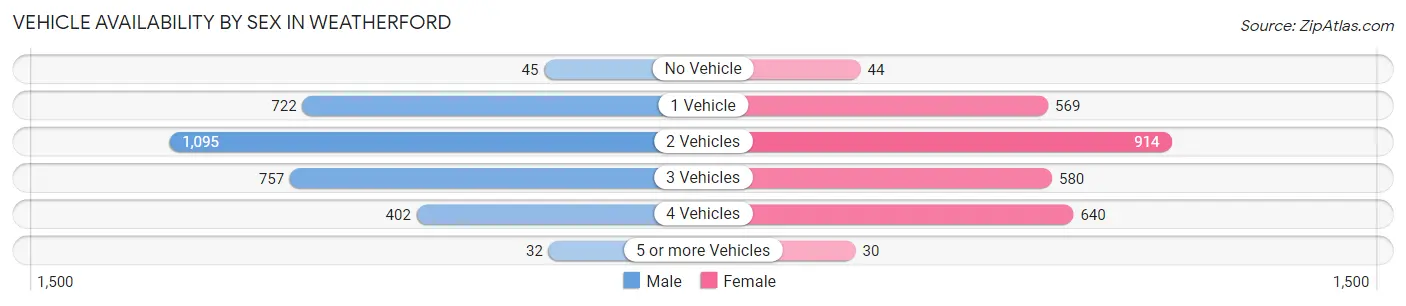
Vehicle Availability by Sex in Weatherford
The most prevalent vehicle ownership categories in Weatherford are males with 2 vehicles (1,095, accounting for 35.9%) and females with 2 vehicles (914, making up 39.4%).
| Vehicles Available | Male | Female |
| No Vehicle | 45 (1.5%) | 44 (1.6%) |
| 1 Vehicle | 722 (23.6%) | 569 (20.5%) |
| 2 Vehicles | 1,095 (35.9%) | 914 (32.9%) |
| 3 Vehicles | 757 (24.8%) | 580 (20.9%) |
| 4 Vehicles | 402 (13.2%) | 640 (23.1%) |
| 5 or more Vehicles | 32 (1.1%) | 30 (1.1%) |
| Total | 3,053 (100.0%) | 2,777 (100.0%) |
Commute Time in Weatherford
The most frequently occuring commute durations in Weatherford are 5 to 9 minutes (1,922 commuters, 32.1%), 10 to 14 minutes (1,059 commuters, 17.7%), and less than 5 minutes (981 commuters, 16.4%).
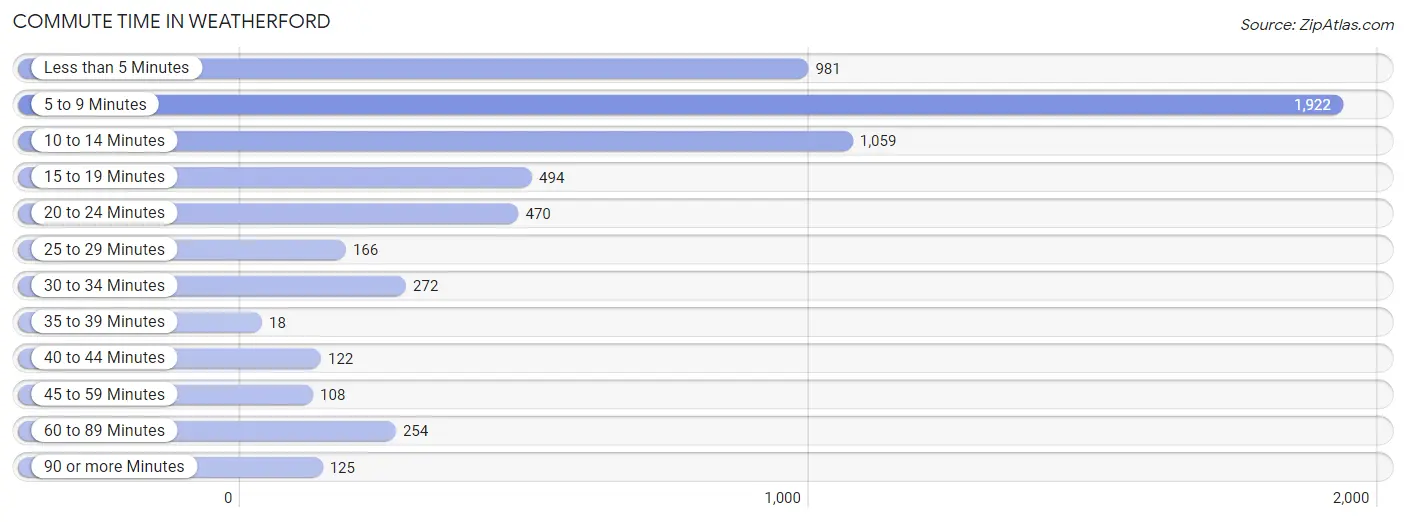
| Commute Time | # Commuters | % Commuters |
| Less than 5 Minutes | 981 | 16.4% |
| 5 to 9 Minutes | 1,922 | 32.1% |
| 10 to 14 Minutes | 1,059 | 17.7% |
| 15 to 19 Minutes | 494 | 8.3% |
| 20 to 24 Minutes | 470 | 7.9% |
| 25 to 29 Minutes | 166 | 2.8% |
| 30 to 34 Minutes | 272 | 4.5% |
| 35 to 39 Minutes | 18 | 0.3% |
| 40 to 44 Minutes | 122 | 2.0% |
| 45 to 59 Minutes | 108 | 1.8% |
| 60 to 89 Minutes | 254 | 4.2% |
| 90 or more Minutes | 125 | 2.1% |
Commute Time by Sex in Weatherford
The most common commute times in Weatherford are 5 to 9 minutes (834 commuters, 27.4%) for males and 5 to 9 minutes (1,088 commuters, 36.9%) for females.
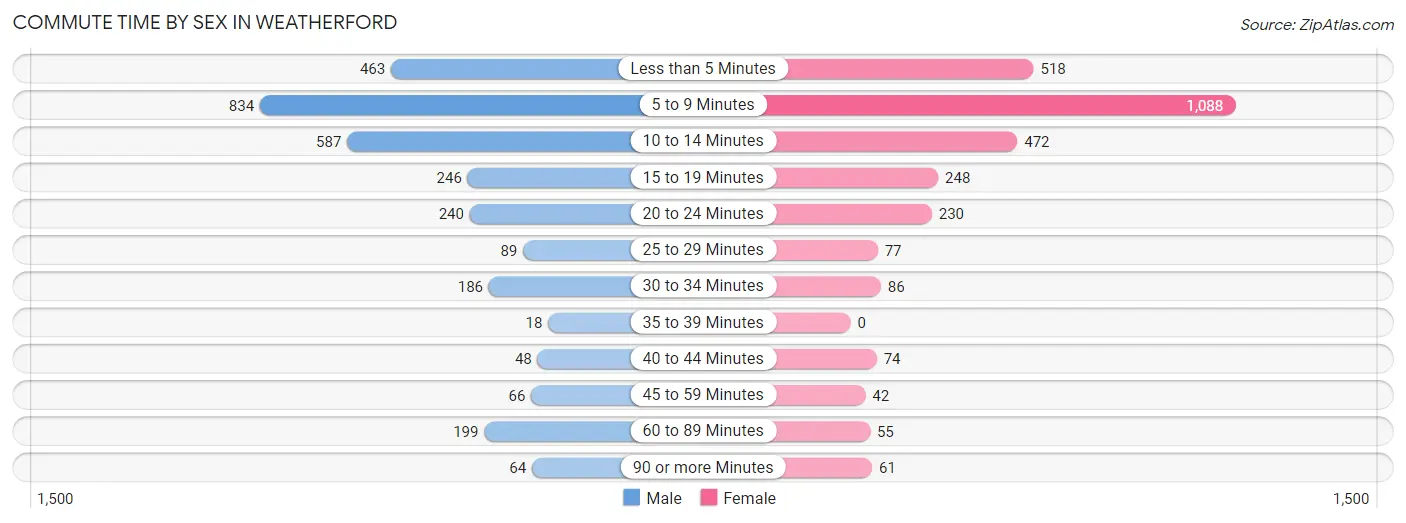
| Commute Time | Male | Female |
| Less than 5 Minutes | 463 (15.2%) | 518 (17.5%) |
| 5 to 9 Minutes | 834 (27.4%) | 1,088 (36.9%) |
| 10 to 14 Minutes | 587 (19.3%) | 472 (16.0%) |
| 15 to 19 Minutes | 246 (8.1%) | 248 (8.4%) |
| 20 to 24 Minutes | 240 (7.9%) | 230 (7.8%) |
| 25 to 29 Minutes | 89 (2.9%) | 77 (2.6%) |
| 30 to 34 Minutes | 186 (6.1%) | 86 (2.9%) |
| 35 to 39 Minutes | 18 (0.6%) | 0 (0.0%) |
| 40 to 44 Minutes | 48 (1.6%) | 74 (2.5%) |
| 45 to 59 Minutes | 66 (2.2%) | 42 (1.4%) |
| 60 to 89 Minutes | 199 (6.6%) | 55 (1.9%) |
| 90 or more Minutes | 64 (2.1%) | 61 (2.1%) |
Time of Departure to Work by Sex in Weatherford
The most frequent times of departure to work in Weatherford are 7:00 AM to 7:29 AM (580, 19.1%) for males and 7:30 AM to 7:59 AM (597, 20.2%) for females.
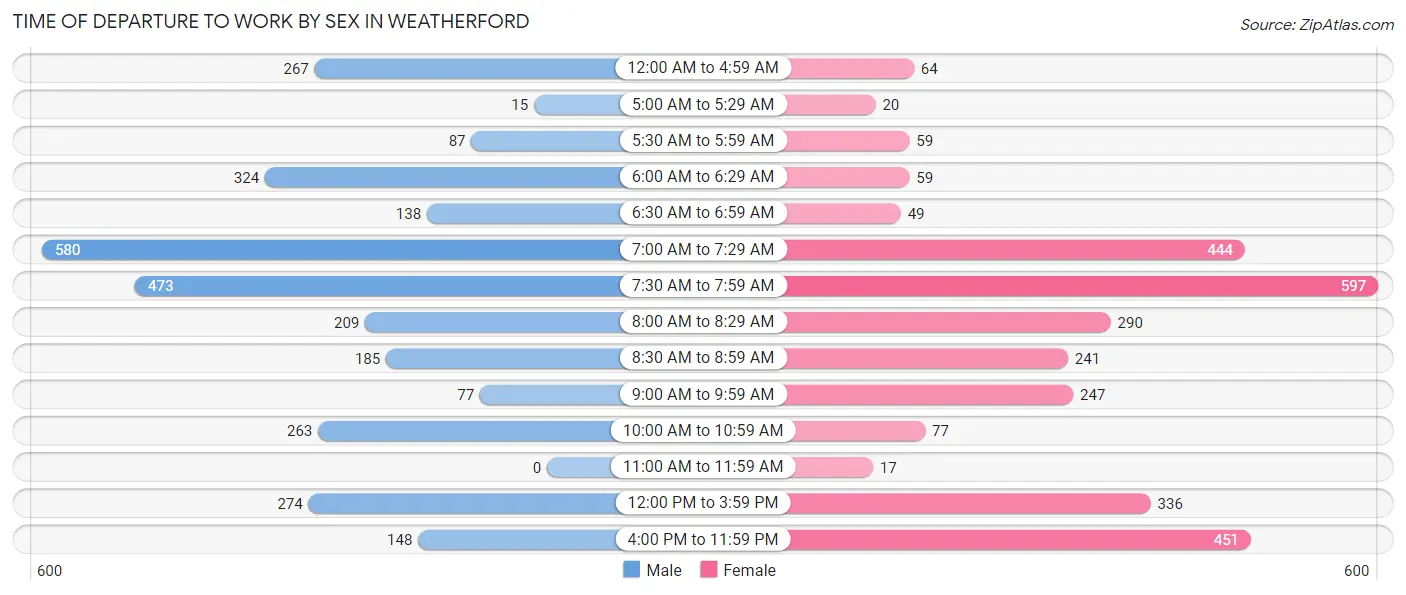
| Time of Departure | Male | Female |
| 12:00 AM to 4:59 AM | 267 (8.8%) | 64 (2.2%) |
| 5:00 AM to 5:29 AM | 15 (0.5%) | 20 (0.7%) |
| 5:30 AM to 5:59 AM | 87 (2.9%) | 59 (2.0%) |
| 6:00 AM to 6:29 AM | 324 (10.7%) | 59 (2.0%) |
| 6:30 AM to 6:59 AM | 138 (4.5%) | 49 (1.7%) |
| 7:00 AM to 7:29 AM | 580 (19.1%) | 444 (15.0%) |
| 7:30 AM to 7:59 AM | 473 (15.6%) | 597 (20.2%) |
| 8:00 AM to 8:29 AM | 209 (6.9%) | 290 (9.8%) |
| 8:30 AM to 8:59 AM | 185 (6.1%) | 241 (8.2%) |
| 9:00 AM to 9:59 AM | 77 (2.5%) | 247 (8.4%) |
| 10:00 AM to 10:59 AM | 263 (8.6%) | 77 (2.6%) |
| 11:00 AM to 11:59 AM | 0 (0.0%) | 17 (0.6%) |
| 12:00 PM to 3:59 PM | 274 (9.0%) | 336 (11.4%) |
| 4:00 PM to 11:59 PM | 148 (4.9%) | 451 (15.3%) |
| Total | 3,040 (100.0%) | 2,951 (100.0%) |
Housing Occupancy in Weatherford
Occupancy by Ownership in Weatherford
Of the total 4,530 dwellings in Weatherford, owner-occupied units account for 2,205 (48.7%), while renter-occupied units make up 2,325 (51.3%).
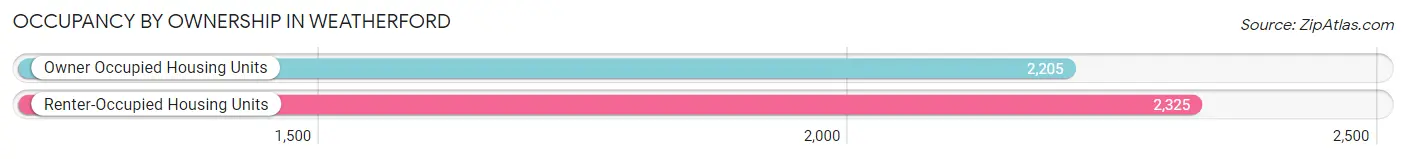
| Occupancy | # Housing Units | % Housing Units |
| Owner Occupied Housing Units | 2,205 | 48.7% |
| Renter-Occupied Housing Units | 2,325 | 51.3% |
| Total Occupied Housing Units | 4,530 | 100.0% |
Occupancy by Household Size in Weatherford
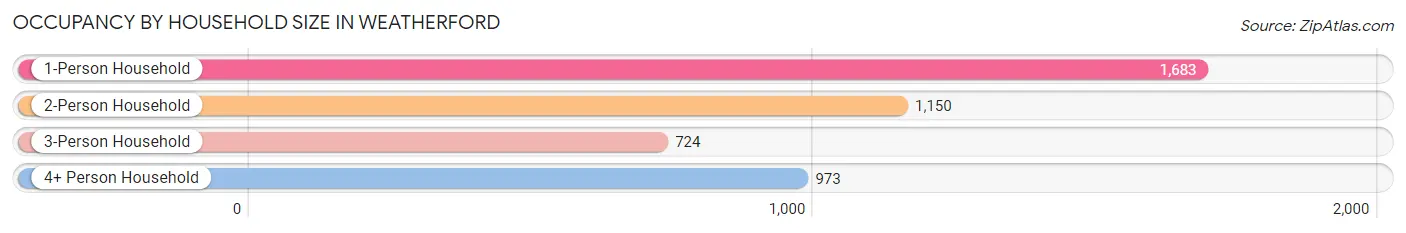
| Household Size | # Housing Units | % Housing Units |
| 1-Person Household | 1,683 | 37.1% |
| 2-Person Household | 1,150 | 25.4% |
| 3-Person Household | 724 | 16.0% |
| 4+ Person Household | 973 | 21.5% |
| Total Housing Units | 4,530 | 100.0% |
Occupancy by Ownership by Household Size in Weatherford
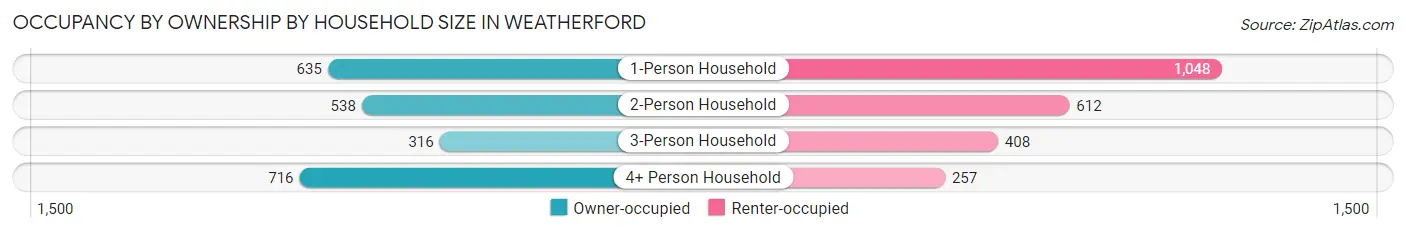
| Household Size | Owner-occupied | Renter-occupied |
| 1-Person Household | 635 (37.7%) | 1,048 (62.3%) |
| 2-Person Household | 538 (46.8%) | 612 (53.2%) |
| 3-Person Household | 316 (43.6%) | 408 (56.4%) |
| 4+ Person Household | 716 (73.6%) | 257 (26.4%) |
| Total Housing Units | 2,205 (48.7%) | 2,325 (51.3%) |
Occupancy by Educational Attainment in Weatherford
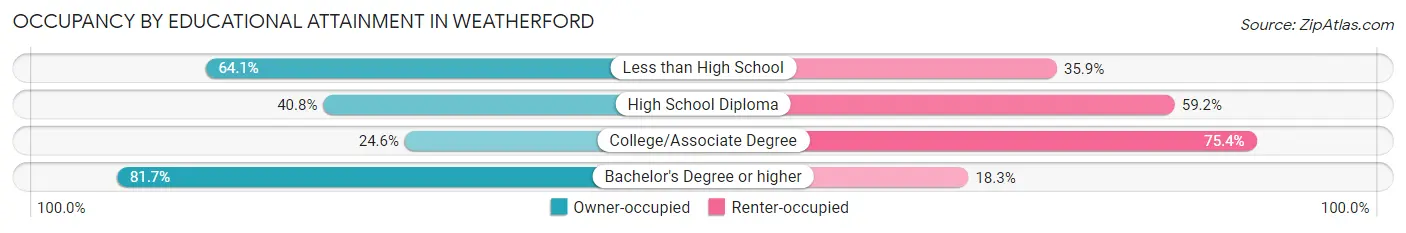
| Household Size | Owner-occupied | Renter-occupied |
| Less than High School | 127 (64.1%) | 71 (35.9%) |
| High School Diploma | 412 (40.8%) | 598 (59.2%) |
| College/Associate Degree | 452 (24.6%) | 1,384 (75.4%) |
| Bachelor's Degree or higher | 1,214 (81.7%) | 272 (18.3%) |
Occupancy by Age of Householder in Weatherford
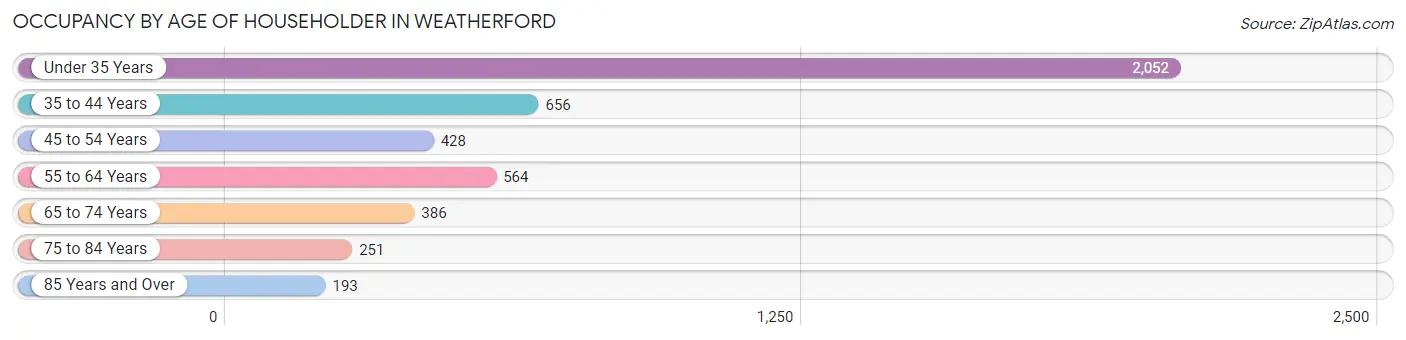
| Age Bracket | # Households | % Households |
| Under 35 Years | 2,052 | 45.3% |
| 35 to 44 Years | 656 | 14.5% |
| 45 to 54 Years | 428 | 9.5% |
| 55 to 64 Years | 564 | 12.4% |
| 65 to 74 Years | 386 | 8.5% |
| 75 to 84 Years | 251 | 5.5% |
| 85 Years and Over | 193 | 4.3% |
| Total | 4,530 | 100.0% |
Housing Finances in Weatherford
Median Income by Occupancy in Weatherford
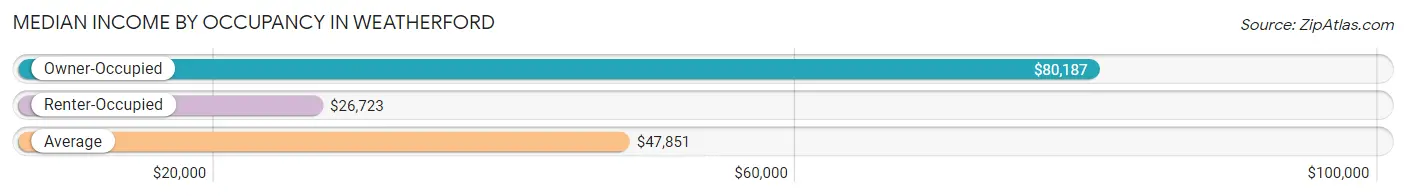
| Occupancy Type | # Households | Median Income |
| Owner-Occupied | 2,205 (48.7%) | $80,187 |
| Renter-Occupied | 2,325 (51.3%) | $26,723 |
| Average | 4,530 (100.0%) | $47,851 |
Occupancy by Householder Income Bracket in Weatherford
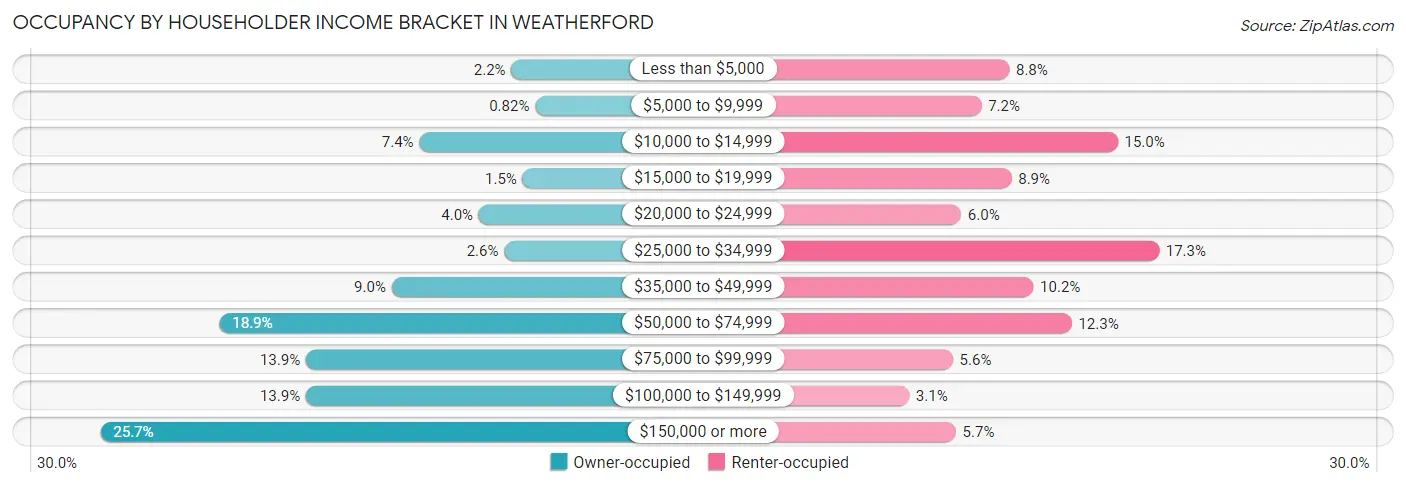
| Income Bracket | Owner-occupied | Renter-occupied |
| Less than $5,000 | 48 (2.2%) | 204 (8.8%) |
| $5,000 to $9,999 | 18 (0.8%) | 167 (7.2%) |
| $10,000 to $14,999 | 164 (7.4%) | 348 (15.0%) |
| $15,000 to $19,999 | 34 (1.5%) | 207 (8.9%) |
| $20,000 to $24,999 | 89 (4.0%) | 140 (6.0%) |
| $25,000 to $34,999 | 57 (2.6%) | 403 (17.3%) |
| $35,000 to $49,999 | 199 (9.0%) | 236 (10.2%) |
| $50,000 to $74,999 | 416 (18.9%) | 287 (12.3%) |
| $75,000 to $99,999 | 307 (13.9%) | 129 (5.6%) |
| $100,000 to $149,999 | 307 (13.9%) | 71 (3.0%) |
| $150,000 or more | 566 (25.7%) | 133 (5.7%) |
| Total | 2,205 (100.0%) | 2,325 (100.0%) |
Monthly Housing Cost Tiers in Weatherford
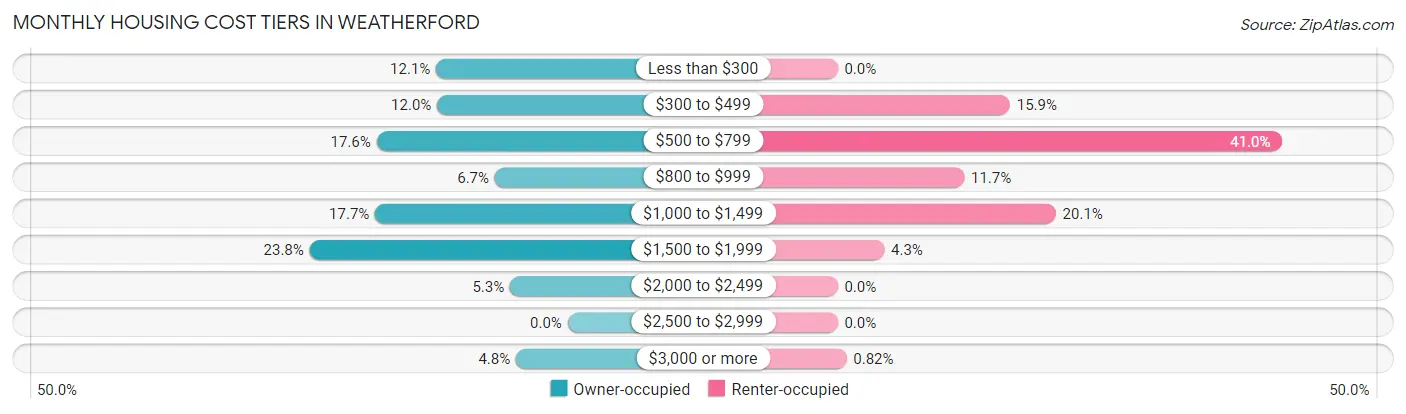
| Monthly Cost | Owner-occupied | Renter-occupied |
| Less than $300 | 267 (12.1%) | 0 (0.0%) |
| $300 to $499 | 265 (12.0%) | 369 (15.9%) |
| $500 to $799 | 388 (17.6%) | 952 (40.9%) |
| $800 to $999 | 148 (6.7%) | 271 (11.7%) |
| $1,000 to $1,499 | 391 (17.7%) | 467 (20.1%) |
| $1,500 to $1,999 | 524 (23.8%) | 100 (4.3%) |
| $2,000 to $2,499 | 117 (5.3%) | 0 (0.0%) |
| $2,500 to $2,999 | 0 (0.0%) | 0 (0.0%) |
| $3,000 or more | 105 (4.8%) | 19 (0.8%) |
| Total | 2,205 (100.0%) | 2,325 (100.0%) |
Physical Housing Characteristics in Weatherford
Housing Structures in Weatherford
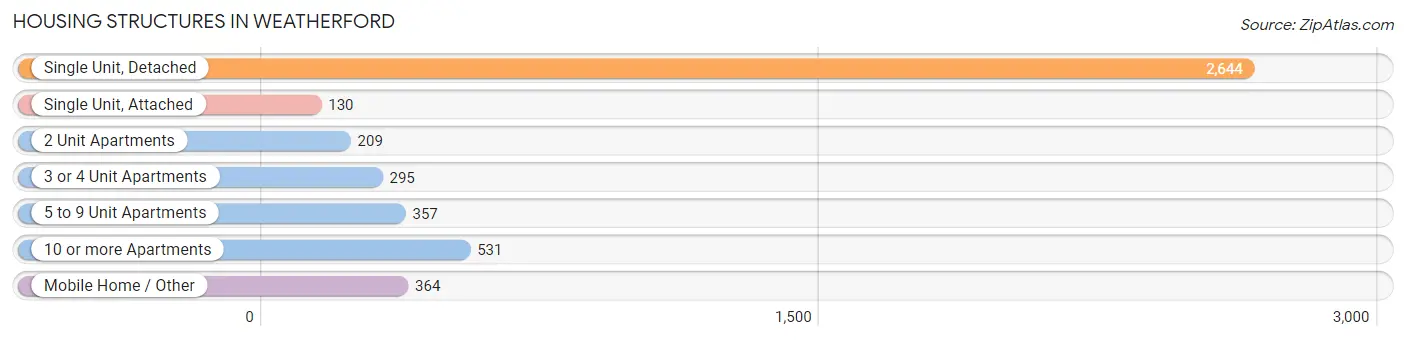
| Structure Type | # Housing Units | % Housing Units |
| Single Unit, Detached | 2,644 | 58.4% |
| Single Unit, Attached | 130 | 2.9% |
| 2 Unit Apartments | 209 | 4.6% |
| 3 or 4 Unit Apartments | 295 | 6.5% |
| 5 to 9 Unit Apartments | 357 | 7.9% |
| 10 or more Apartments | 531 | 11.7% |
| Mobile Home / Other | 364 | 8.0% |
| Total | 4,530 | 100.0% |
Housing Structures by Occupancy in Weatherford
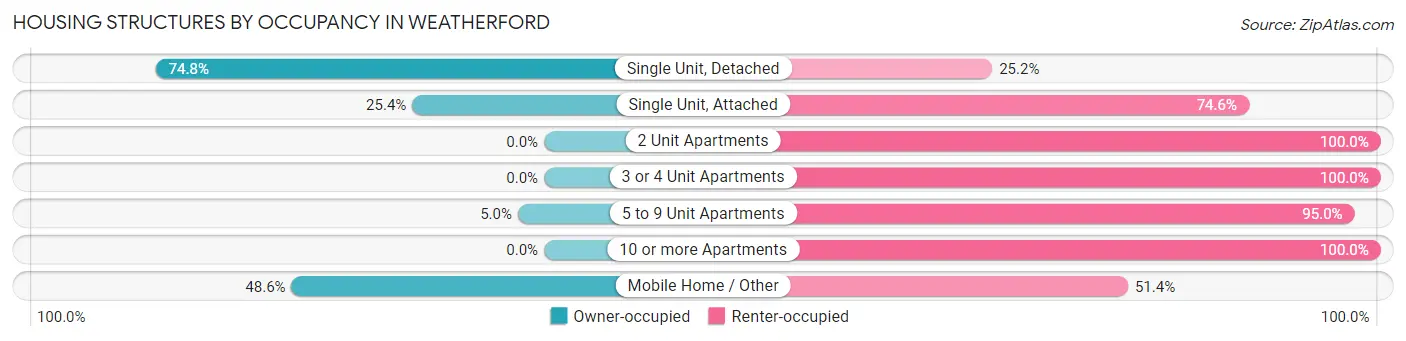
| Structure Type | Owner-occupied | Renter-occupied |
| Single Unit, Detached | 1,977 (74.8%) | 667 (25.2%) |
| Single Unit, Attached | 33 (25.4%) | 97 (74.6%) |
| 2 Unit Apartments | 0 (0.0%) | 209 (100.0%) |
| 3 or 4 Unit Apartments | 0 (0.0%) | 295 (100.0%) |
| 5 to 9 Unit Apartments | 18 (5.0%) | 339 (95.0%) |
| 10 or more Apartments | 0 (0.0%) | 531 (100.0%) |
| Mobile Home / Other | 177 (48.6%) | 187 (51.4%) |
| Total | 2,205 (48.7%) | 2,325 (51.3%) |
Housing Structures by Number of Rooms in Weatherford
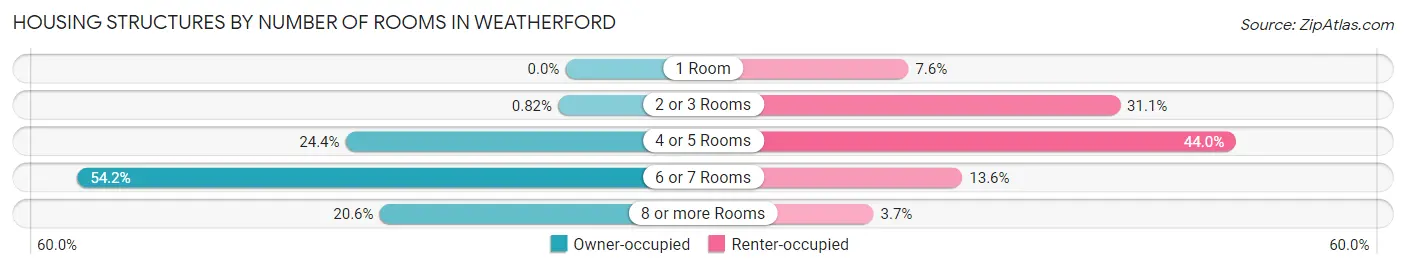
| Number of Rooms | Owner-occupied | Renter-occupied |
| 1 Room | 0 (0.0%) | 177 (7.6%) |
| 2 or 3 Rooms | 18 (0.8%) | 723 (31.1%) |
| 4 or 5 Rooms | 538 (24.4%) | 1,022 (44.0%) |
| 6 or 7 Rooms | 1,194 (54.1%) | 316 (13.6%) |
| 8 or more Rooms | 455 (20.6%) | 87 (3.7%) |
| Total | 2,205 (100.0%) | 2,325 (100.0%) |
Housing Structure by Heating Type in Weatherford
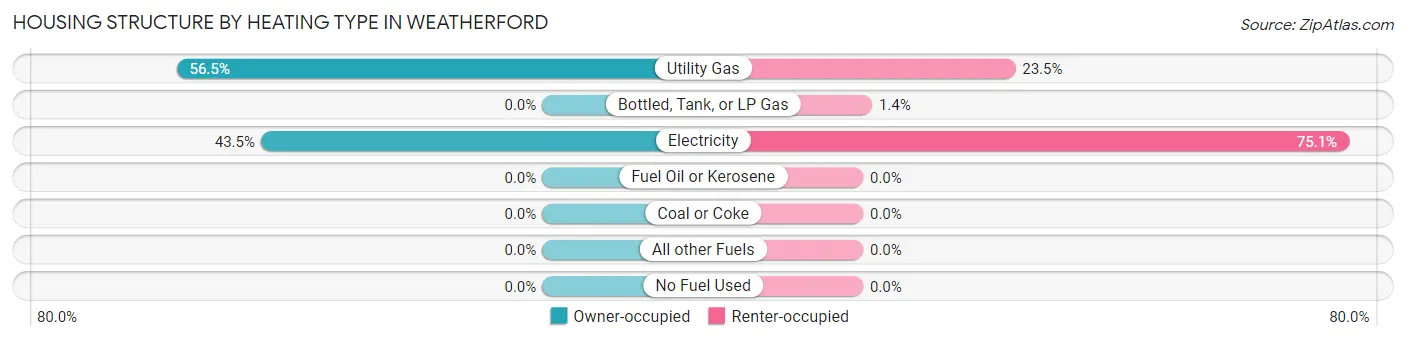
| Heating Type | Owner-occupied | Renter-occupied |
| Utility Gas | 1,246 (56.5%) | 547 (23.5%) |
| Bottled, Tank, or LP Gas | 0 (0.0%) | 32 (1.4%) |
| Electricity | 959 (43.5%) | 1,746 (75.1%) |
| Fuel Oil or Kerosene | 0 (0.0%) | 0 (0.0%) |
| Coal or Coke | 0 (0.0%) | 0 (0.0%) |
| All other Fuels | 0 (0.0%) | 0 (0.0%) |
| No Fuel Used | 0 (0.0%) | 0 (0.0%) |
| Total | 2,205 (100.0%) | 2,325 (100.0%) |
Household Vehicle Usage in Weatherford
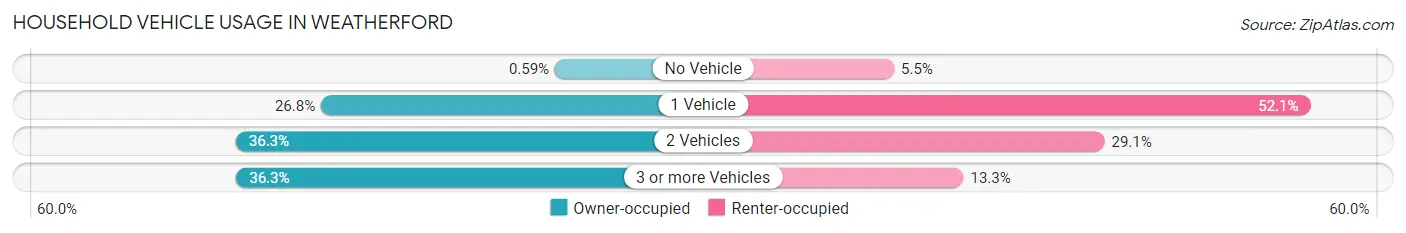
| Vehicles per Household | Owner-occupied | Renter-occupied |
| No Vehicle | 13 (0.6%) | 128 (5.5%) |
| 1 Vehicle | 591 (26.8%) | 1,212 (52.1%) |
| 2 Vehicles | 801 (36.3%) | 676 (29.1%) |
| 3 or more Vehicles | 800 (36.3%) | 309 (13.3%) |
| Total | 2,205 (100.0%) | 2,325 (100.0%) |
Real Estate & Mortgages in Weatherford
Real Estate and Mortgage Overview in Weatherford
| Characteristic | Without Mortgage | With Mortgage |
| Housing Units | 1,094 | 1,111 |
| Median Property Value | $188,700 | $228,100 |
| Median Household Income | $60,125 | $352 |
| Monthly Housing Costs | $513 | $105 |
| Real Estate Taxes | $1,278 | $0 |
Property Value by Mortgage Status in Weatherford
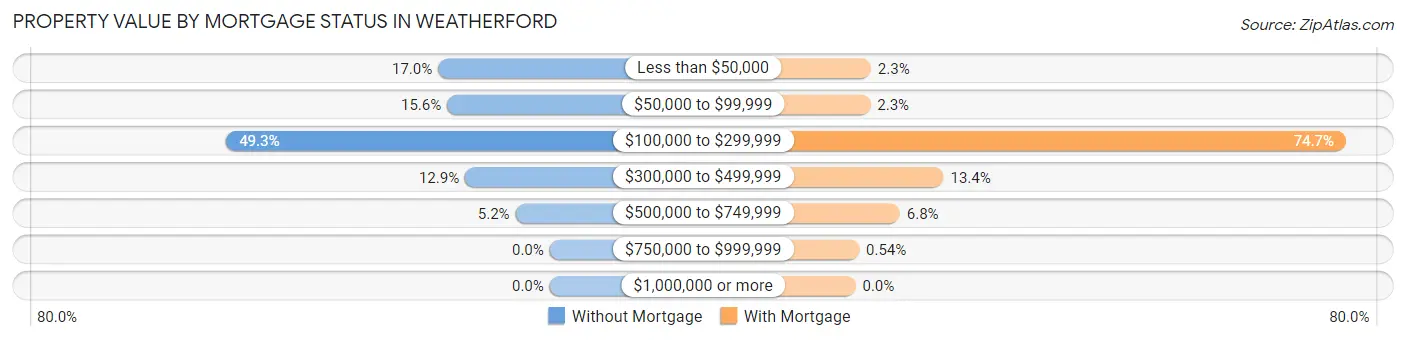
| Property Value | Without Mortgage | With Mortgage |
| Less than $50,000 | 186 (17.0%) | 26 (2.3%) |
| $50,000 to $99,999 | 171 (15.6%) | 25 (2.2%) |
| $100,000 to $299,999 | 539 (49.3%) | 830 (74.7%) |
| $300,000 to $499,999 | 141 (12.9%) | 149 (13.4%) |
| $500,000 to $749,999 | 57 (5.2%) | 75 (6.8%) |
| $750,000 to $999,999 | 0 (0.0%) | 6 (0.5%) |
| $1,000,000 or more | 0 (0.0%) | 0 (0.0%) |
| Total | 1,094 (100.0%) | 1,111 (100.0%) |
Household Income by Mortgage Status in Weatherford
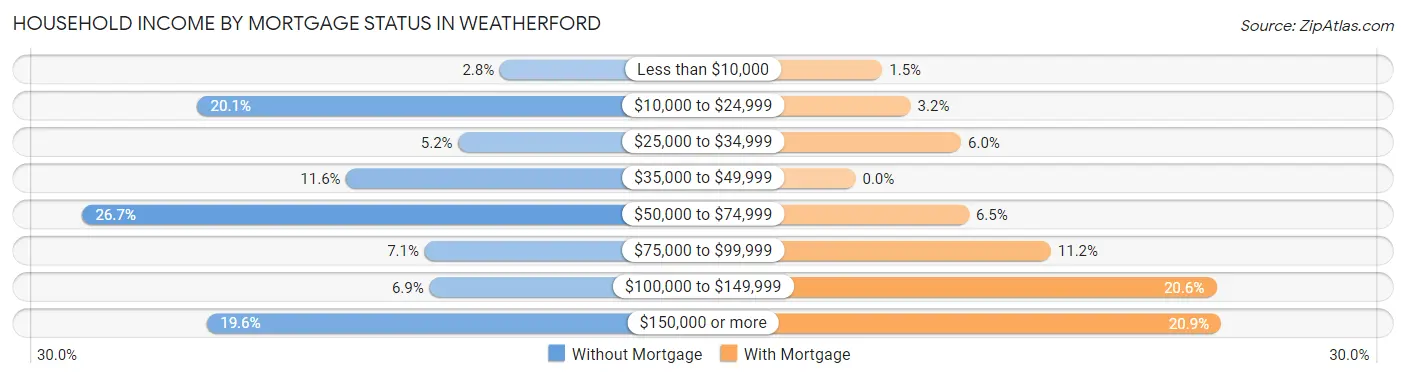
| Household Income | Without Mortgage | With Mortgage |
| Less than $10,000 | 31 (2.8%) | 17 (1.5%) |
| $10,000 to $24,999 | 220 (20.1%) | 35 (3.2%) |
| $25,000 to $34,999 | 57 (5.2%) | 67 (6.0%) |
| $35,000 to $49,999 | 127 (11.6%) | 0 (0.0%) |
| $50,000 to $74,999 | 292 (26.7%) | 72 (6.5%) |
| $75,000 to $99,999 | 78 (7.1%) | 124 (11.2%) |
| $100,000 to $149,999 | 75 (6.9%) | 229 (20.6%) |
| $150,000 or more | 214 (19.6%) | 232 (20.9%) |
| Total | 1,094 (100.0%) | 1,111 (100.0%) |
Property Value to Household Income Ratio in Weatherford
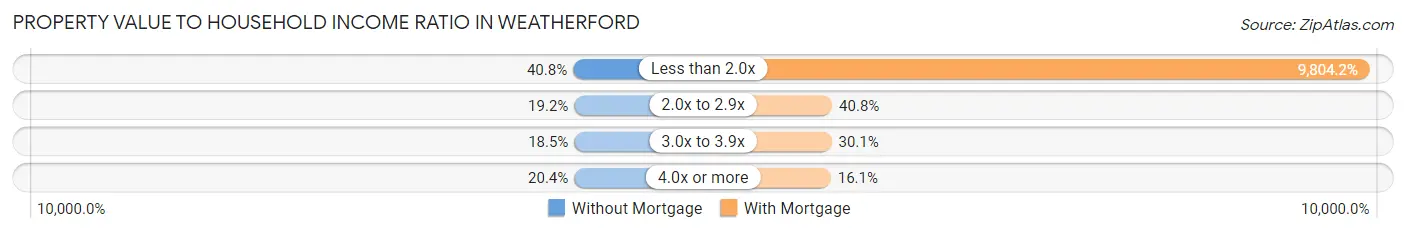
| Value-to-Income Ratio | Without Mortgage | With Mortgage |
| Less than 2.0x | 446 (40.8%) | 108,925 (9,804.2%) |
| 2.0x to 2.9x | 210 (19.2%) | 453 (40.8%) |
| 3.0x to 3.9x | 202 (18.5%) | 334 (30.1%) |
| 4.0x or more | 223 (20.4%) | 179 (16.1%) |
| Total | 1,094 (100.0%) | 1,111 (100.0%) |
Real Estate Taxes by Mortgage Status in Weatherford
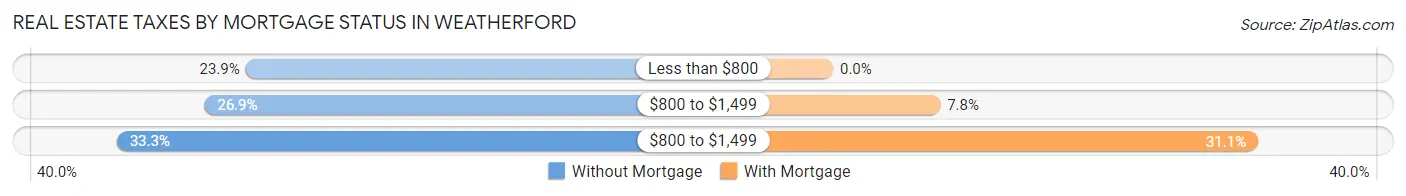
| Property Taxes | Without Mortgage | With Mortgage |
| Less than $800 | 261 (23.9%) | 0 (0.0%) |
| $800 to $1,499 | 294 (26.9%) | 87 (7.8%) |
| $800 to $1,499 | 364 (33.3%) | 345 (31.0%) |
| Total | 1,094 (100.0%) | 1,111 (100.0%) |
Health & Disability in Weatherford
Health Insurance Coverage by Age in Weatherford
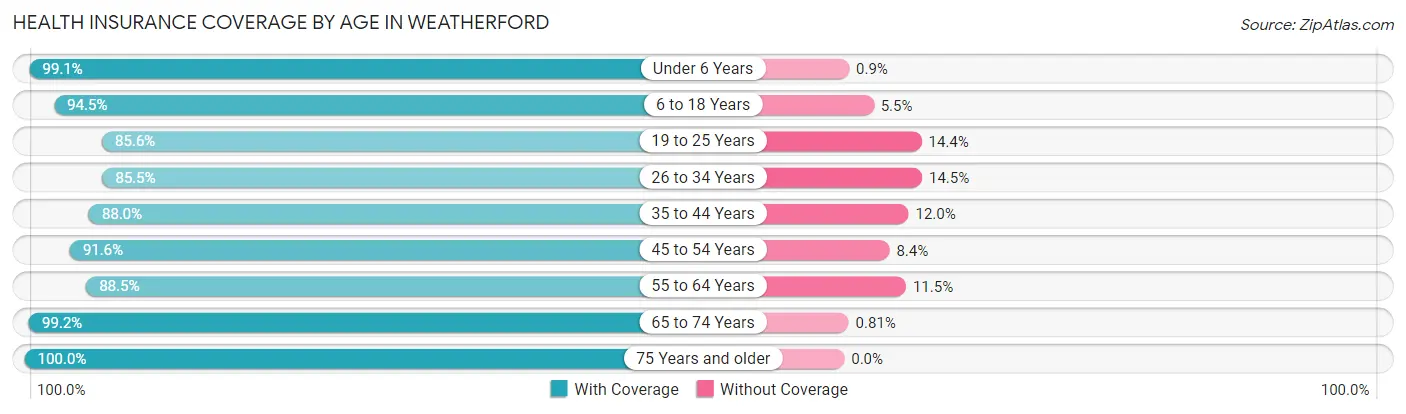
| Age Bracket | With Coverage | Without Coverage |
| Under 6 Years | 991 (99.1%) | 9 (0.9%) |
| 6 to 18 Years | 1,861 (94.5%) | 108 (5.5%) |
| 19 to 25 Years | 2,950 (85.6%) | 497 (14.4%) |
| 26 to 34 Years | 1,144 (85.5%) | 194 (14.5%) |
| 35 to 44 Years | 1,130 (88.0%) | 154 (12.0%) |
| 45 to 54 Years | 608 (91.6%) | 56 (8.4%) |
| 55 to 64 Years | 831 (88.5%) | 108 (11.5%) |
| 65 to 74 Years | 615 (99.2%) | 5 (0.8%) |
| 75 Years and older | 599 (100.0%) | 0 (0.0%) |
| Total | 10,729 (90.5%) | 1,131 (9.5%) |
Health Insurance Coverage by Citizenship Status in Weatherford
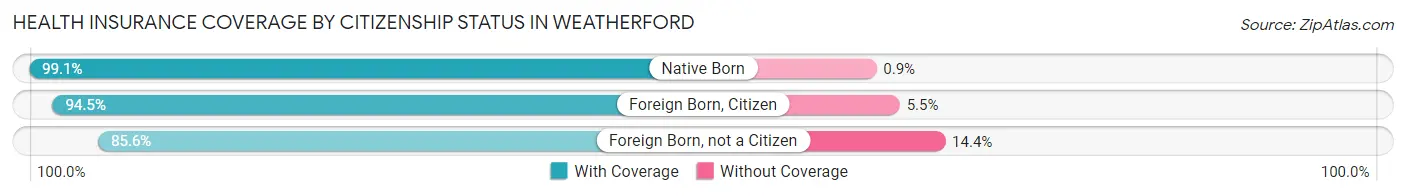
| Citizenship Status | With Coverage | Without Coverage |
| Native Born | 991 (99.1%) | 9 (0.9%) |
| Foreign Born, Citizen | 1,861 (94.5%) | 108 (5.5%) |
| Foreign Born, not a Citizen | 2,950 (85.6%) | 497 (14.4%) |
Health Insurance Coverage by Household Income in Weatherford
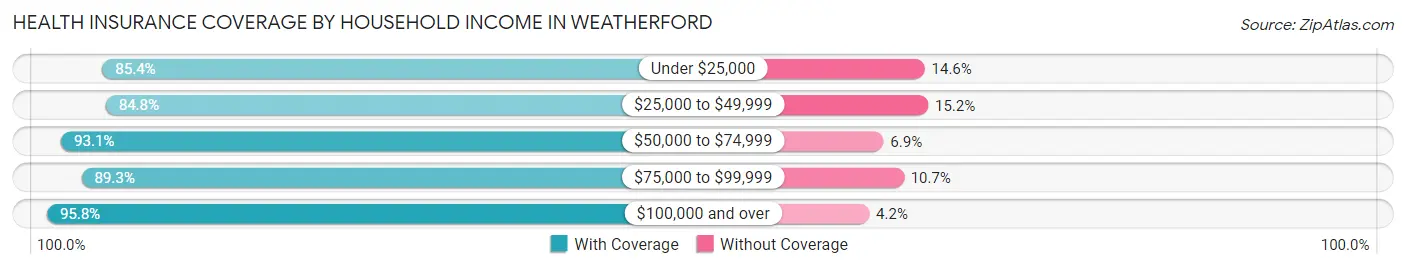
| Household Income | With Coverage | Without Coverage |
| Under $25,000 | 1,928 (85.4%) | 329 (14.6%) |
| $25,000 to $49,999 | 1,922 (84.8%) | 345 (15.2%) |
| $50,000 to $74,999 | 1,439 (93.1%) | 106 (6.9%) |
| $75,000 to $99,999 | 1,224 (89.3%) | 146 (10.7%) |
| $100,000 and over | 3,222 (95.8%) | 141 (4.2%) |
Public vs Private Health Insurance Coverage by Age in Weatherford
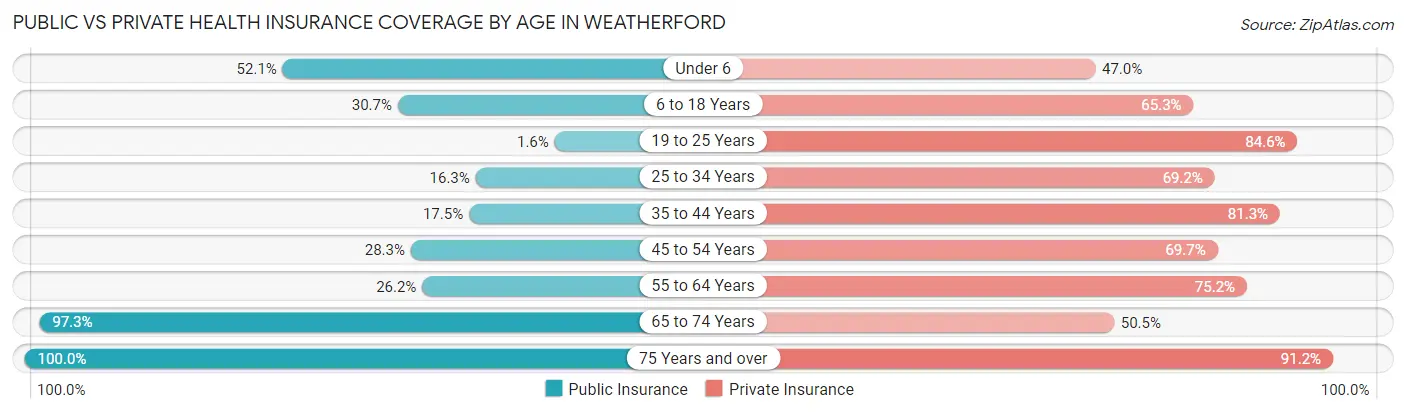
| Age Bracket | Public Insurance | Private Insurance |
| Under 6 | 521 (52.1%) | 470 (47.0%) |
| 6 to 18 Years | 605 (30.7%) | 1,285 (65.3%) |
| 19 to 25 Years | 56 (1.6%) | 2,915 (84.6%) |
| 25 to 34 Years | 218 (16.3%) | 926 (69.2%) |
| 35 to 44 Years | 225 (17.5%) | 1,044 (81.3%) |
| 45 to 54 Years | 188 (28.3%) | 463 (69.7%) |
| 55 to 64 Years | 246 (26.2%) | 706 (75.2%) |
| 65 to 74 Years | 603 (97.3%) | 313 (50.5%) |
| 75 Years and over | 599 (100.0%) | 546 (91.1%) |
| Total | 3,261 (27.5%) | 8,668 (73.1%) |
Disability Status by Sex by Age in Weatherford
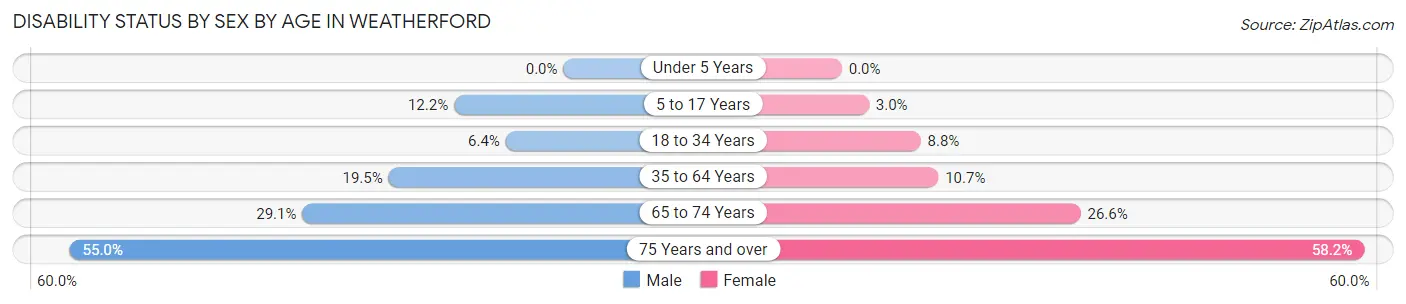
| Age Bracket | Male | Female |
| Under 5 Years | 0 (0.0%) | 0 (0.0%) |
| 5 to 17 Years | 91 (12.2%) | 30 (3.0%) |
| 18 to 34 Years | 163 (6.4%) | 231 (8.8%) |
| 35 to 64 Years | 274 (19.5%) | 159 (10.7%) |
| 65 to 74 Years | 84 (29.1%) | 88 (26.6%) |
| 75 Years and over | 127 (55.0%) | 214 (58.2%) |
Disability Class by Sex by Age in Weatherford
Disability Class: Hearing Difficulty
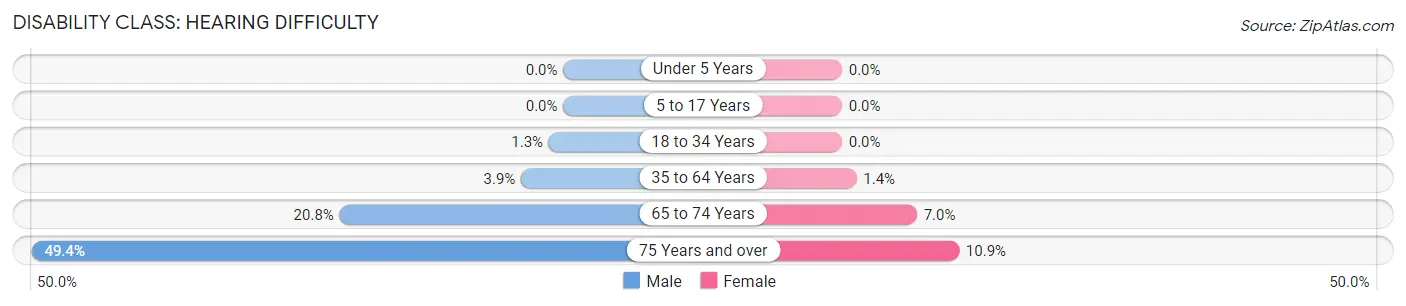
| Age Bracket | Male | Female |
| Under 5 Years | 0 (0.0%) | 0 (0.0%) |
| 5 to 17 Years | 0 (0.0%) | 0 (0.0%) |
| 18 to 34 Years | 34 (1.3%) | 0 (0.0%) |
| 35 to 64 Years | 55 (3.9%) | 20 (1.3%) |
| 65 to 74 Years | 60 (20.8%) | 23 (7.0%) |
| 75 Years and over | 114 (49.3%) | 40 (10.9%) |
Disability Class: Vision Difficulty
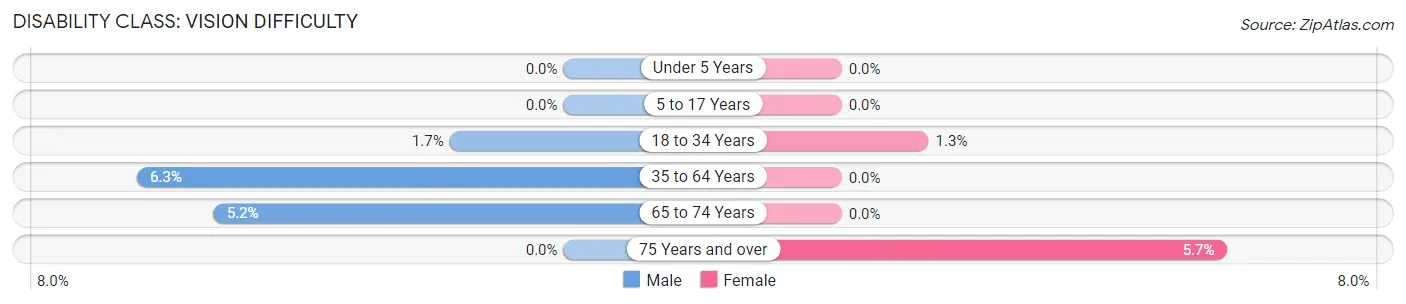
| Age Bracket | Male | Female |
| Under 5 Years | 0 (0.0%) | 0 (0.0%) |
| 5 to 17 Years | 0 (0.0%) | 0 (0.0%) |
| 18 to 34 Years | 43 (1.7%) | 34 (1.3%) |
| 35 to 64 Years | 89 (6.3%) | 0 (0.0%) |
| 65 to 74 Years | 15 (5.2%) | 0 (0.0%) |
| 75 Years and over | 0 (0.0%) | 21 (5.7%) |
Disability Class: Cognitive Difficulty
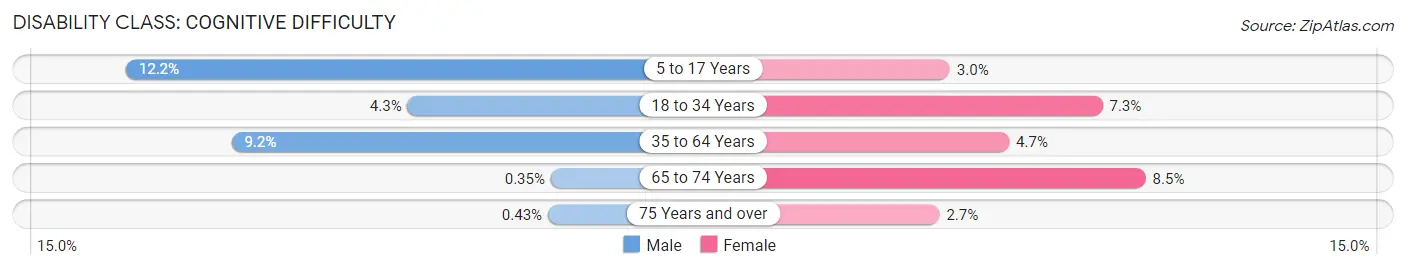
| Age Bracket | Male | Female |
| 5 to 17 Years | 91 (12.2%) | 30 (3.0%) |
| 18 to 34 Years | 110 (4.3%) | 191 (7.3%) |
| 35 to 64 Years | 130 (9.2%) | 69 (4.7%) |
| 65 to 74 Years | 1 (0.4%) | 28 (8.5%) |
| 75 Years and over | 1 (0.4%) | 10 (2.7%) |
Disability Class: Ambulatory Difficulty
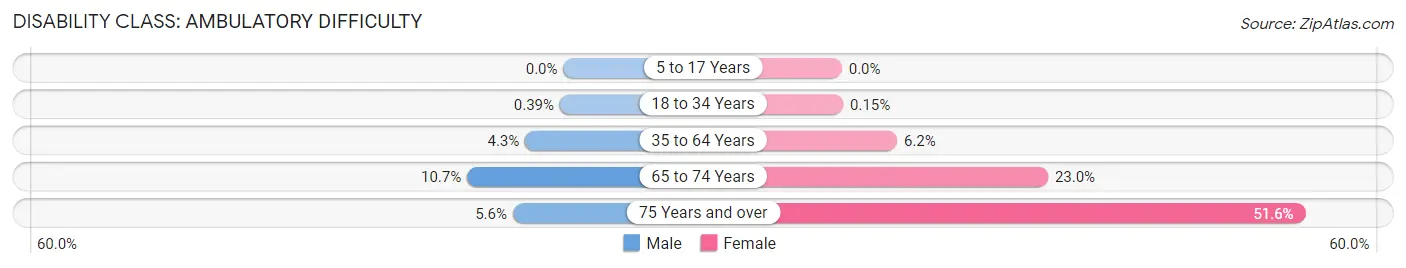
| Age Bracket | Male | Female |
| 5 to 17 Years | 0 (0.0%) | 0 (0.0%) |
| 18 to 34 Years | 10 (0.4%) | 4 (0.2%) |
| 35 to 64 Years | 60 (4.3%) | 91 (6.1%) |
| 65 to 74 Years | 31 (10.7%) | 76 (23.0%) |
| 75 Years and over | 13 (5.6%) | 190 (51.6%) |
Disability Class: Self-Care Difficulty
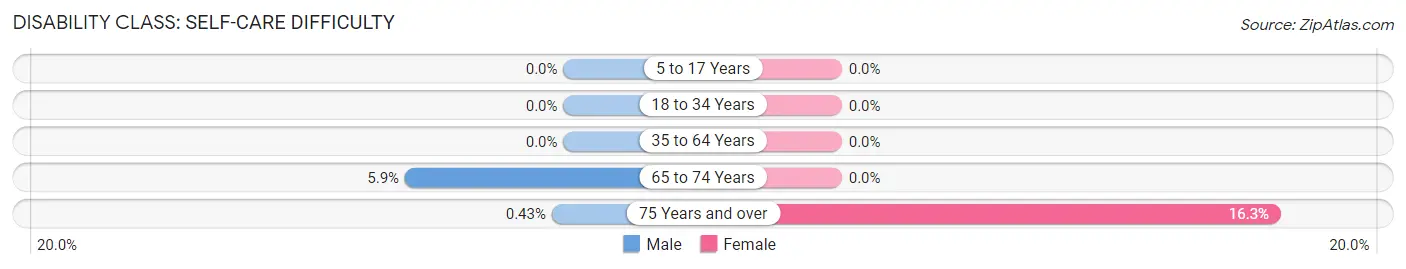
| Age Bracket | Male | Female |
| 5 to 17 Years | 0 (0.0%) | 0 (0.0%) |
| 18 to 34 Years | 0 (0.0%) | 0 (0.0%) |
| 35 to 64 Years | 0 (0.0%) | 0 (0.0%) |
| 65 to 74 Years | 17 (5.9%) | 0 (0.0%) |
| 75 Years and over | 1 (0.4%) | 60 (16.3%) |
Technology Access in Weatherford
Computing Device Access in Weatherford
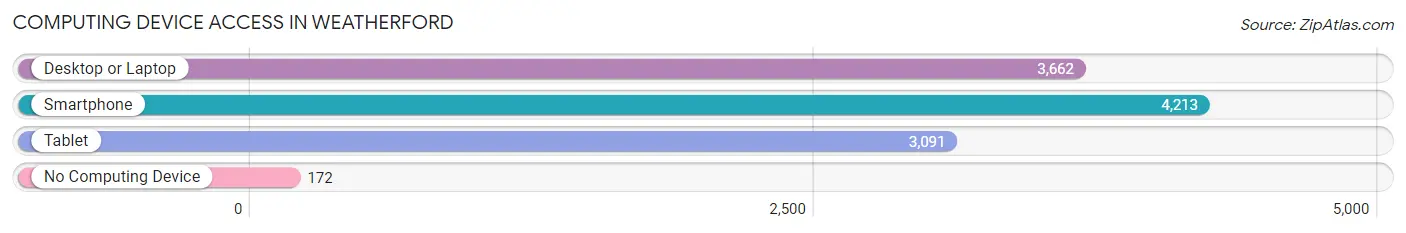
| Device Type | # Households | % Households |
| Desktop or Laptop | 3,662 | 80.8% |
| Smartphone | 4,213 | 93.0% |
| Tablet | 3,091 | 68.2% |
| No Computing Device | 172 | 3.8% |
| Total | 4,530 | 100.0% |
Internet Access in Weatherford
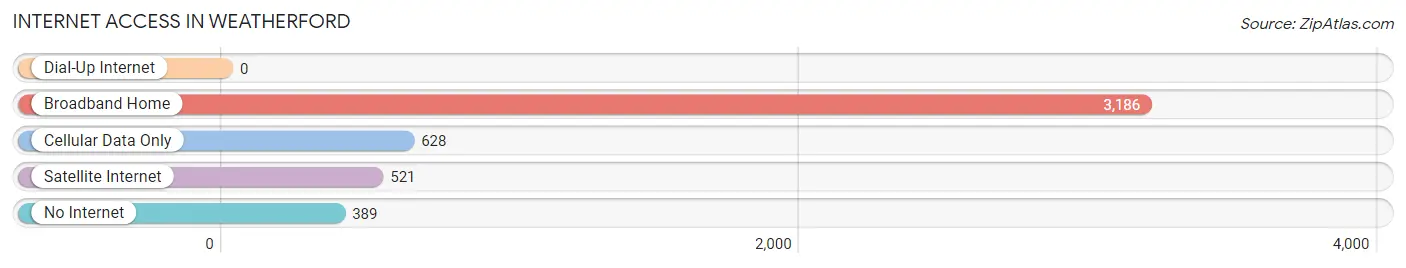
| Internet Type | # Households | % Households |
| Dial-Up Internet | 0 | 0.0% |
| Broadband Home | 3,186 | 70.3% |
| Cellular Data Only | 628 | 13.9% |
| Satellite Internet | 521 | 11.5% |
| No Internet | 389 | 8.6% |
| Total | 4,530 | 100.0% |
Weatherford Summary
History
The city of Weatherford, Oklahoma is located in Custer County in the western part of the state. It is the county seat and the largest city in the county. The city was founded in 1887 and was named after the nearby Weatherford Creek. The creek was named after the Weatherford family, who were early settlers in the area.
The city was originally a trading post for the nearby Native American tribes, including the Cheyenne, Arapaho, and Kiowa. The trading post was established by the U.S. government in 1868. The city was officially incorporated in 1891.
In the early 1900s, Weatherford became a major agricultural center in the region. The city was home to several large farms and ranches, and the local economy was largely based on the production of wheat, corn, and other crops.
The city also became a major transportation hub in the early 1900s. The Atchison, Topeka and Santa Fe Railway built a line through the city in 1901, and the city became a major stop on the route. The railway also helped to spur the growth of the city, as it allowed for the easy transportation of goods and people.
The city continued to grow throughout the 20th century, and by the 2000s, it had become a major center for the oil and gas industry. The city is home to several major oil and gas companies, and the local economy is largely based on the production of oil and gas.
Geography
Weatherford is located in western Oklahoma, in Custer County. The city is situated at the intersection of U.S. Route 183 and State Highway 54. The city is located about 70 miles west of Oklahoma City and about 90 miles east of Amarillo, Texas.
The city is located in the Great Plains region of the United States, and the local terrain is mostly flat. The city is located at an elevation of 1,717 feet above sea level.
The climate in Weatherford is classified as a humid subtropical climate, with hot summers and mild winters. The average temperature in the summer months is around 90 degrees Fahrenheit, and the average temperature in the winter months is around 40 degrees Fahrenheit.
Economy
The economy of Weatherford is largely based on the production of oil and gas. The city is home to several major oil and gas companies, and the local economy is largely dependent on the production of oil and gas.
The city is also home to several manufacturing companies, including a large paper mill and a large food processing plant. The city is also home to several retail stores, restaurants, and other businesses.
The city is also home to several educational institutions, including Southwestern Oklahoma State University and Weatherford College.
Demographics
As of the 2010 census, the population of Weatherford was 10,833. The racial makeup of the city was 79.3% White, 1.3% African American, 0.9% Native American, 0.7% Asian, 0.1% Pacific Islander, 15.2% from other races, and 2.5% from two or more races. Hispanic or Latino of any race were 24.3% of the population.
The median household income in Weatherford was $37,917, and the median family income was $45,938. The per capita income in Weatherford was $19,945. About 16.2% of the population was below the poverty line.
Common Questions
What is Per Capita Income in Weatherford?
Per Capita income in Weatherford is $28,841.
What is the Median Family Income in Weatherford?
Median Family Income in Weatherford is $78,257.
What is the Median Household income in Weatherford?
Median Household Income in Weatherford is $47,851.
What is Income or Wage Gap in Weatherford?
Income or Wage Gap in Weatherford is 51.2%.
Women in Weatherford earn 48.8 cents for every dollar earned by a man.
What is Inequality or Gini Index in Weatherford?
Inequality or Gini Index in Weatherford is 0.52.
What is the Total Population of Weatherford?
Total Population of Weatherford is 11,999.
What is the Total Male Population of Weatherford?
Total Male Population of Weatherford is 5,672.
What is the Total Female Population of Weatherford?
Total Female Population of Weatherford is 6,327.
What is the Ratio of Males per 100 Females in Weatherford?
There are 89.65 Males per 100 Females in Weatherford.
What is the Ratio of Females per 100 Males in Weatherford?
There are 111.55 Females per 100 Males in Weatherford.
What is the Median Population Age in Weatherford?
Median Population Age in Weatherford is 23.9 Years.
What is the Average Family Size in Weatherford
Average Family Size in Weatherford is 3.2 People.
What is the Average Household Size in Weatherford
Average Household Size in Weatherford is 2.4 People.
How Large is the Labor Force in Weatherford?
There are 6,685 People in the Labor Forcein in Weatherford.
What is the Percentage of People in the Labor Force in Weatherford?
69.5% of People are in the Labor Force in Weatherford.
What is the Unemployment Rate in Weatherford?
Unemployment Rate in Weatherford is 5.2%.