Waukomis, OK Map & Demographics
Waukomis Map
Waukomis Overview
$30,229
PER CAPITA INCOME
$84,432
AVG FAMILY INCOME
$63,482
AVG HOUSEHOLD INCOME
27.6%
WAGE / INCOME GAP [ % ]
72.4¢/ $1
WAGE / INCOME GAP [ $ ]
0.38
INEQUALITY / GINI INDEX
1,087
TOTAL POPULATION
530
MALE POPULATION
557
FEMALE POPULATION
95.15
MALES / 100 FEMALES
105.09
FEMALES / 100 MALES
48.8
MEDIAN AGE
3.1
AVG FAMILY SIZE
2.4
AVG HOUSEHOLD SIZE
519
LABOR FORCE [ PEOPLE ]
55.0%
PERCENT IN LABOR FORCE
3.1%
UNEMPLOYMENT RATE
Waukomis Zip Codes
Waukomis Area Codes
Income in Waukomis
Income Overview in Waukomis
Per Capita Income in Waukomis is $30,229, while median incomes of families and households are $84,432 and $63,482 respectively.
| Characteristic | Number | Measure |
| Per Capita Income | 1,087 | $30,229 |
| Median Family Income | 291 | $84,432 |
| Mean Family Income | 291 | $91,800 |
| Median Household Income | 449 | $63,482 |
| Mean Household Income | 449 | $73,911 |
| Income Deficit | 291 | $0 |
| Wage / Income Gap (%) | 1,087 | 27.59% |
| Wage / Income Gap ($) | 1,087 | 72.41¢ per $1 |
| Gini / Inequality Index | 1,087 | 0.38 |
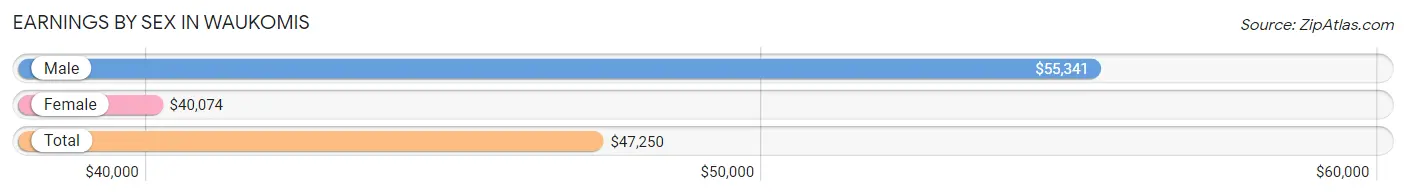
Earnings by Sex in Waukomis
Average Earnings in Waukomis are $47,250, $55,341 for men and $40,074 for women, a difference of 27.6%.
| Sex | Number | Average Earnings |
| Male | 265 (49.8%) | $55,341 |
| Female | 267 (50.2%) | $40,074 |
| Total | 532 (100.0%) | $47,250 |
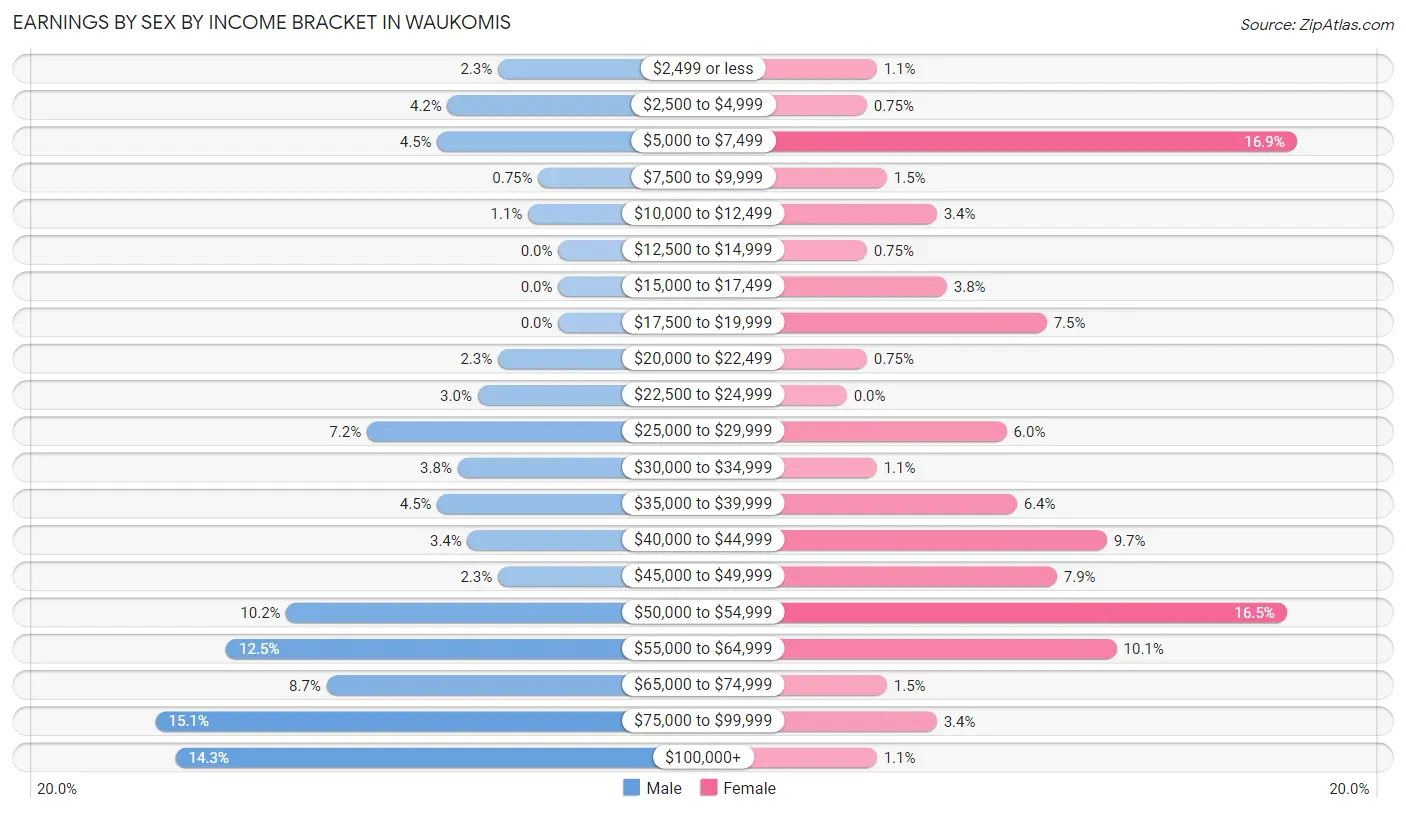
Earnings by Sex by Income Bracket in Waukomis
The most common earnings brackets in Waukomis are $75,000 to $99,999 for men (40 | 15.1%) and $5,000 to $7,499 for women (45 | 16.9%).
| Income | Male | Female |
| $2,499 or less | 6 (2.3%) | 3 (1.1%) |
| $2,500 to $4,999 | 11 (4.2%) | 2 (0.7%) |
| $5,000 to $7,499 | 12 (4.5%) | 45 (16.9%) |
| $7,500 to $9,999 | 2 (0.7%) | 4 (1.5%) |
| $10,000 to $12,499 | 3 (1.1%) | 9 (3.4%) |
| $12,500 to $14,999 | 0 (0.0%) | 2 (0.7%) |
| $15,000 to $17,499 | 0 (0.0%) | 10 (3.7%) |
| $17,500 to $19,999 | 0 (0.0%) | 20 (7.5%) |
| $20,000 to $22,499 | 6 (2.3%) | 2 (0.7%) |
| $22,500 to $24,999 | 8 (3.0%) | 0 (0.0%) |
| $25,000 to $29,999 | 19 (7.2%) | 16 (6.0%) |
| $30,000 to $34,999 | 10 (3.8%) | 3 (1.1%) |
| $35,000 to $39,999 | 12 (4.5%) | 17 (6.4%) |
| $40,000 to $44,999 | 9 (3.4%) | 26 (9.7%) |
| $45,000 to $49,999 | 6 (2.3%) | 21 (7.9%) |
| $50,000 to $54,999 | 27 (10.2%) | 44 (16.5%) |
| $55,000 to $64,999 | 33 (12.4%) | 27 (10.1%) |
| $65,000 to $74,999 | 23 (8.7%) | 4 (1.5%) |
| $75,000 to $99,999 | 40 (15.1%) | 9 (3.4%) |
| $100,000+ | 38 (14.3%) | 3 (1.1%) |
| Total | 265 (100.0%) | 267 (100.0%) |
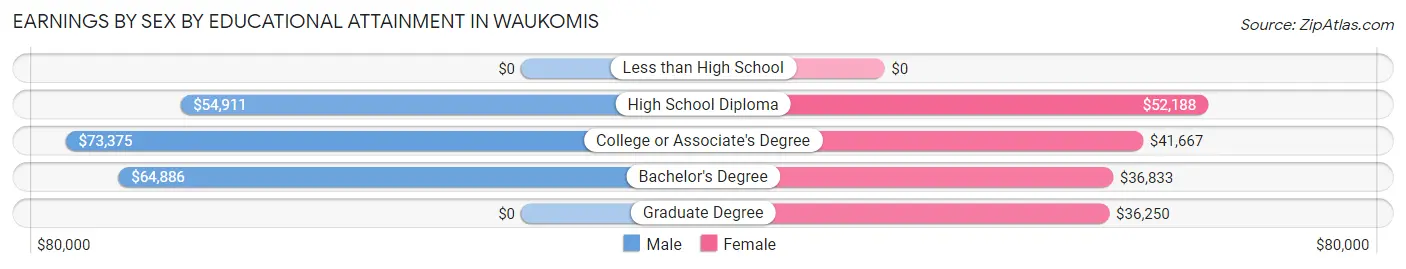
Earnings by Sex by Educational Attainment in Waukomis
Average earnings in Waukomis are $63,295 for men and $46,125 for women, a difference of 27.1%. Men with an educational attainment of college or associate's degree enjoy the highest average annual earnings of $73,375, while those with high school diploma education earn the least with $54,911. Women with an educational attainment of high school diploma earn the most with the average annual earnings of $52,188, while those with graduate degree education have the smallest earnings of $36,250.
| Educational Attainment | Male Income | Female Income |
| Less than High School | - | - |
| High School Diploma | $54,911 | $52,188 |
| College or Associate's Degree | $73,375 | $41,667 |
| Bachelor's Degree | $64,886 | $36,833 |
| Graduate Degree | - | - |
| Total | $63,295 | $46,125 |
Family Income in Waukomis
Family Income Brackets in Waukomis
According to the Waukomis family income data, there are 63 families falling into the $100,000 to $149,999 income range, which is the most common income bracket and makes up 21.6% of all families. Conversely, the less than $10,000 income bracket is the least frequent group with only 2 families (0.7%) belonging to this category.
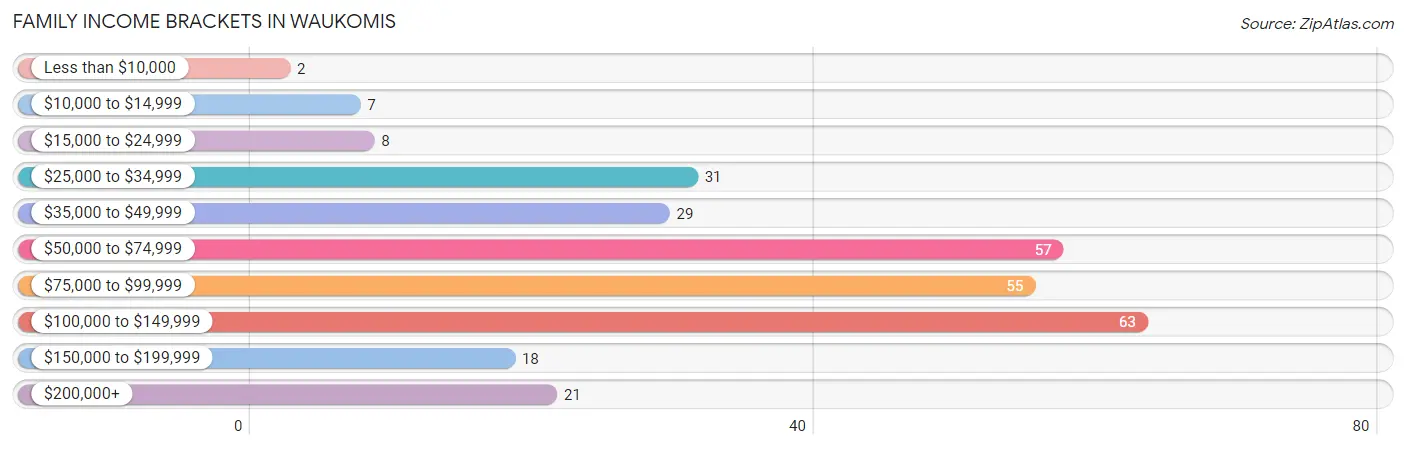
| Income Bracket | # Families | % Families |
| Less than $10,000 | 2 | 0.7% |
| $10,000 to $14,999 | 7 | 2.4% |
| $15,000 to $24,999 | 8 | 2.7% |
| $25,000 to $34,999 | 31 | 10.7% |
| $35,000 to $49,999 | 29 | 10.0% |
| $50,000 to $74,999 | 57 | 19.6% |
| $75,000 to $99,999 | 55 | 18.9% |
| $100,000 to $149,999 | 63 | 21.6% |
| $150,000 to $199,999 | 18 | 6.2% |
| $200,000+ | 21 | 7.2% |
Family Income by Famaliy Size in Waukomis
3-person families (68 | 23.4%) account for the highest median family income in Waukomis with $106,875 per family, while 2-person families (165 | 56.7%) have the highest median income of $41,307 per family member.
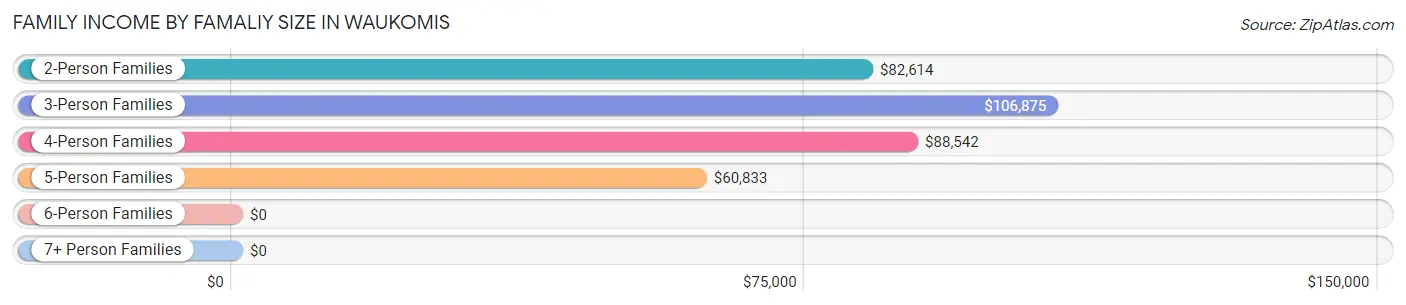
| Income Bracket | # Families | Median Income |
| 2-Person Families | 165 (56.7%) | $82,614 |
| 3-Person Families | 68 (23.4%) | $106,875 |
| 4-Person Families | 49 (16.8%) | $88,542 |
| 5-Person Families | 6 (2.1%) | $60,833 |
| 6-Person Families | 3 (1.0%) | $0 |
| 7+ Person Families | 0 (0.0%) | $0 |
| Total | 291 (100.0%) | $84,432 |
Family Income by Number of Earners in Waukomis
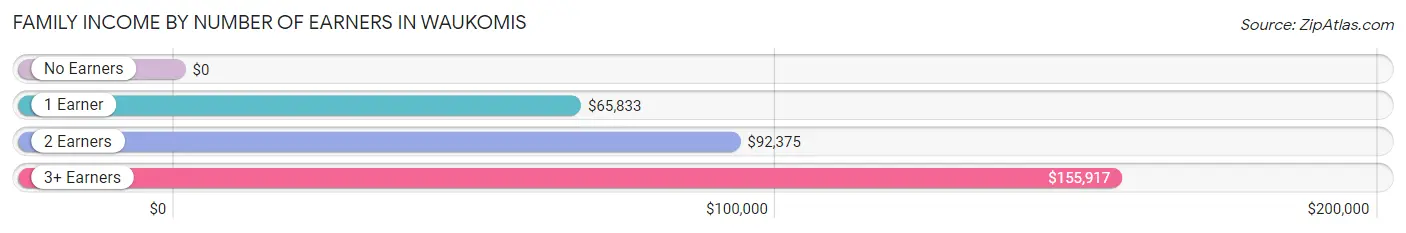
| Number of Earners | # Families | Median Income |
| No Earners | 49 (16.8%) | $0 |
| 1 Earner | 70 (24.0%) | $65,833 |
| 2 Earners | 135 (46.4%) | $92,375 |
| 3+ Earners | 37 (12.7%) | $155,917 |
| Total | 291 (100.0%) | $84,432 |
Household Income in Waukomis
Household Income Brackets in Waukomis
With 125 households falling in the category, the $25,000 to $34,999 income range is the most frequent in Waukomis, accounting for 27.8% of all households. In contrast, only 3 households (0.7%) fall into the less than $10,000 income bracket, making it the least populous group.
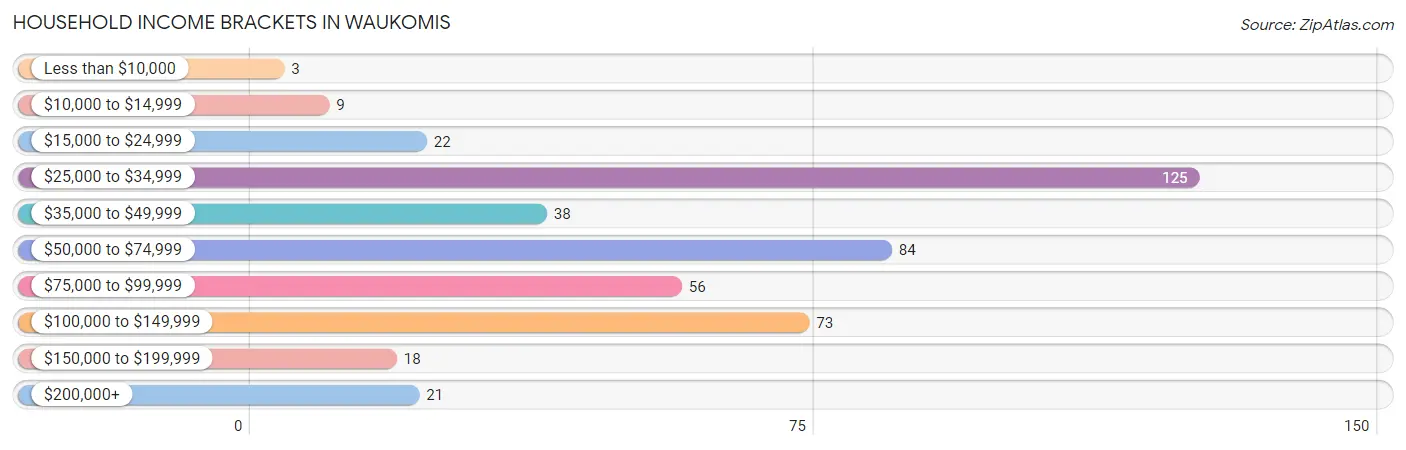
| Income Bracket | # Households | % Households |
| Less than $10,000 | 3 | 0.7% |
| $10,000 to $14,999 | 9 | 2.0% |
| $15,000 to $24,999 | 22 | 4.9% |
| $25,000 to $34,999 | 125 | 27.8% |
| $35,000 to $49,999 | 38 | 8.5% |
| $50,000 to $74,999 | 84 | 18.7% |
| $75,000 to $99,999 | 56 | 12.5% |
| $100,000 to $149,999 | 73 | 16.3% |
| $150,000 to $199,999 | 18 | 4.0% |
| $200,000+ | 21 | 4.7% |
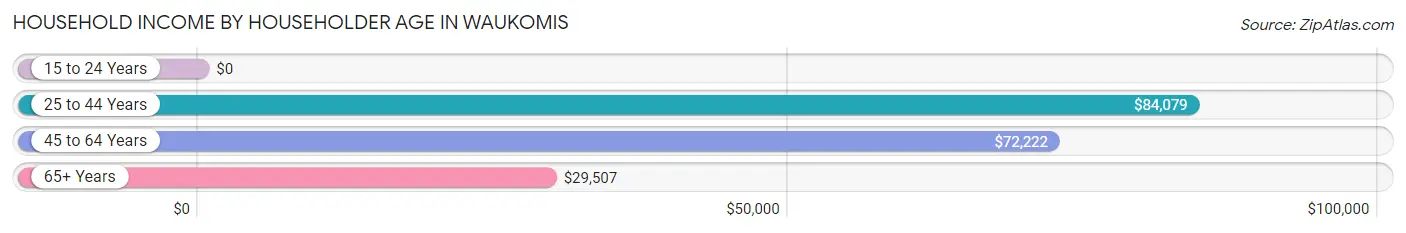
Household Income by Householder Age in Waukomis
The median household income in Waukomis is $63,482, with the highest median household income of $84,079 found in the 25 to 44 years age bracket for the primary householder. A total of 106 households (23.6%) fall into this category. Meanwhile, the 15 to 24 years age bracket for the primary householder has the lowest median household income of $0, with 19 households (4.2%) in this group.
| Income Bracket | # Households | Median Income |
| 15 to 24 Years | 19 (4.2%) | $0 |
| 25 to 44 Years | 106 (23.6%) | $84,079 |
| 45 to 64 Years | 156 (34.7%) | $72,222 |
| 65+ Years | 168 (37.4%) | $29,507 |
| Total | 449 (100.0%) | $63,482 |
Poverty in Waukomis
Income Below Poverty by Sex and Age in Waukomis
With 4.2% poverty level for males and 21.7% for females among the residents of Waukomis, under 5 year old males and 65 to 74 year old females are the most vulnerable to poverty, with 8 males (33.3%) and 100 females (60.2%) in their respective age groups living below the poverty level.
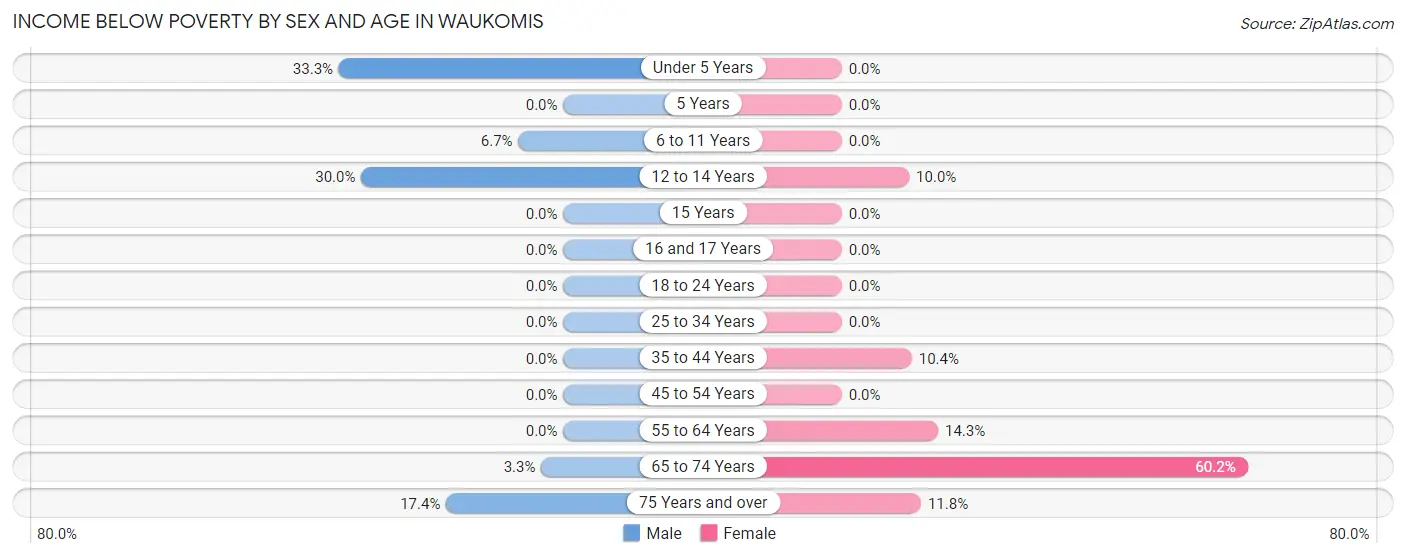
| Age Bracket | Male | Female |
| Under 5 Years | 8 (33.3%) | 0 (0.0%) |
| 5 Years | 0 (0.0%) | 0 (0.0%) |
| 6 to 11 Years | 3 (6.7%) | 0 (0.0%) |
| 12 to 14 Years | 3 (30.0%) | 1 (10.0%) |
| 15 Years | 0 (0.0%) | 0 (0.0%) |
| 16 and 17 Years | 0 (0.0%) | 0 (0.0%) |
| 18 to 24 Years | 0 (0.0%) | 0 (0.0%) |
| 25 to 34 Years | 0 (0.0%) | 0 (0.0%) |
| 35 to 44 Years | 0 (0.0%) | 8 (10.4%) |
| 45 to 54 Years | 0 (0.0%) | 0 (0.0%) |
| 55 to 64 Years | 0 (0.0%) | 10 (14.3%) |
| 65 to 74 Years | 4 (3.3%) | 100 (60.2%) |
| 75 Years and over | 4 (17.4%) | 2 (11.8%) |
| Total | 22 (4.2%) | 121 (21.7%) |
Income Above Poverty by Sex and Age in Waukomis
According to the poverty statistics in Waukomis, males aged 5 years and females aged under 5 years are the age groups that are most secure financially, with 100.0% of males and 100.0% of females in these age groups living above the poverty line.
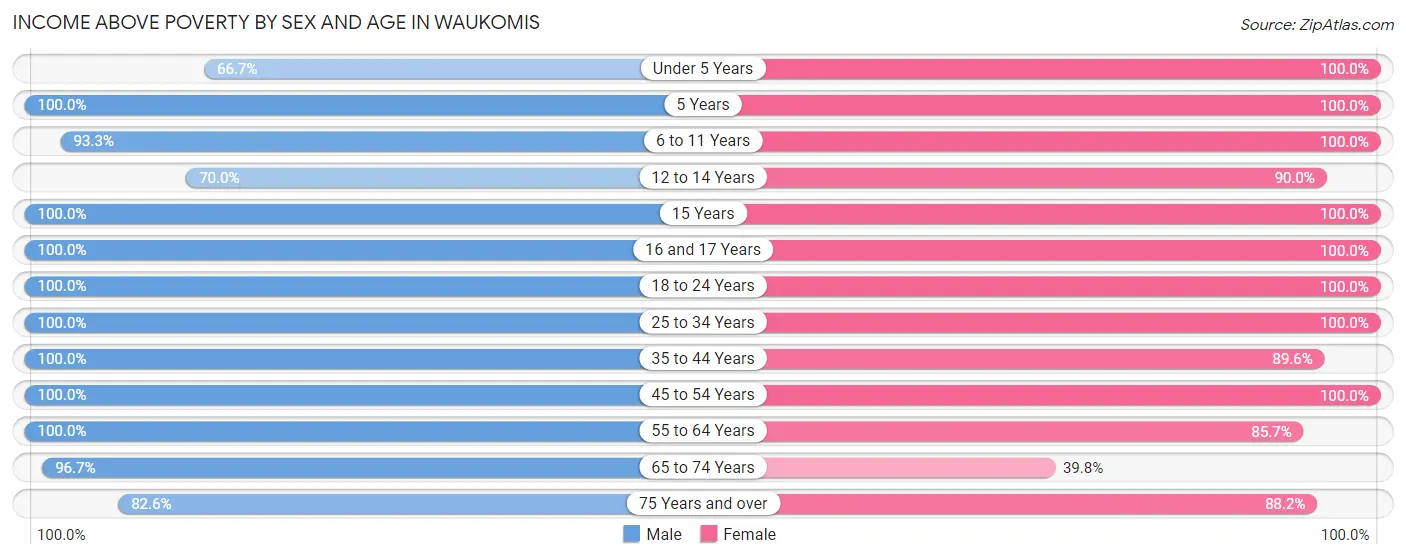
| Age Bracket | Male | Female |
| Under 5 Years | 16 (66.7%) | 6 (100.0%) |
| 5 Years | 14 (100.0%) | 3 (100.0%) |
| 6 to 11 Years | 42 (93.3%) | 19 (100.0%) |
| 12 to 14 Years | 7 (70.0%) | 9 (90.0%) |
| 15 Years | 1 (100.0%) | 3 (100.0%) |
| 16 and 17 Years | 3 (100.0%) | 24 (100.0%) |
| 18 to 24 Years | 45 (100.0%) | 41 (100.0%) |
| 25 to 34 Years | 26 (100.0%) | 42 (100.0%) |
| 35 to 44 Years | 71 (100.0%) | 69 (89.6%) |
| 45 to 54 Years | 58 (100.0%) | 79 (100.0%) |
| 55 to 64 Years | 80 (100.0%) | 60 (85.7%) |
| 65 to 74 Years | 118 (96.7%) | 66 (39.8%) |
| 75 Years and over | 19 (82.6%) | 15 (88.2%) |
| Total | 500 (95.8%) | 436 (78.3%) |
Income Below Poverty Among Married-Couple Families in Waukomis
The poverty statistics for married-couple families in Waukomis show that 3.5% or 8 of the total 229 families live below the poverty line. Families with 1 or 2 children have the highest poverty rate of 4.3%, comprising of 3 families. On the other hand, families with 3 or 4 children have the lowest poverty rate of 0.0%, which includes 0 families.
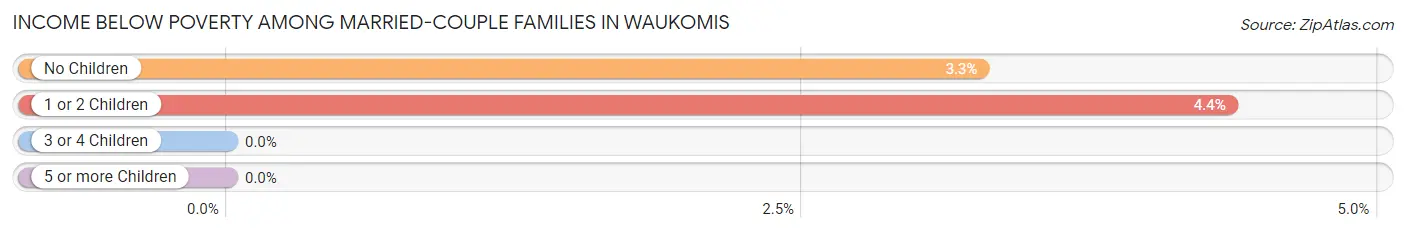
| Children | Above Poverty | Below Poverty |
| No Children | 148 (96.7%) | 5 (3.3%) |
| 1 or 2 Children | 66 (95.7%) | 3 (4.3%) |
| 3 or 4 Children | 7 (100.0%) | 0 (0.0%) |
| 5 or more Children | 0 (0.0%) | 0 (0.0%) |
| Total | 221 (96.5%) | 8 (3.5%) |
Income Below Poverty Among Single-Parent Households in Waukomis
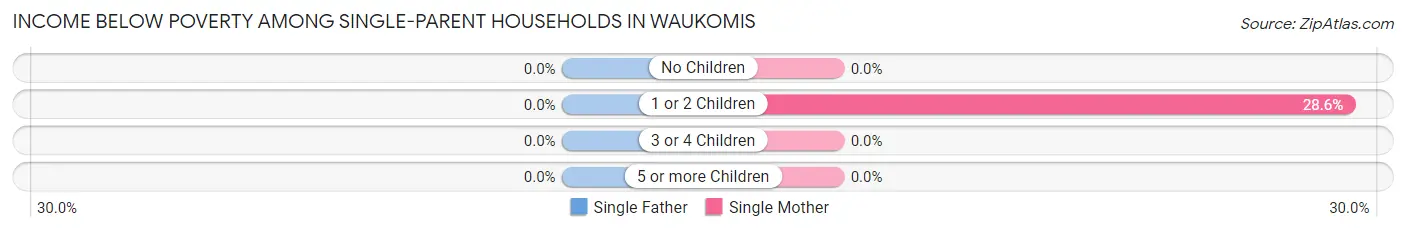
| Children | Single Father | Single Mother |
| No Children | 0 (0.0%) | 0 (0.0%) |
| 1 or 2 Children | 0 (0.0%) | 4 (28.6%) |
| 3 or 4 Children | 0 (0.0%) | 0 (0.0%) |
| 5 or more Children | 0 (0.0%) | 0 (0.0%) |
| Total | 0 (0.0%) | 4 (10.3%) |
Income Below Poverty Among Married-Couple vs Single-Parent Households in Waukomis
The poverty data for Waukomis shows that 8 of the married-couple family households (3.5%) and 4 of the single-parent households (6.5%) are living below the poverty level. Within the married-couple family households, those with 1 or 2 children have the highest poverty rate, with 3 households (4.3%) falling below the poverty line. Among the single-parent households, those with 1 or 2 children have the highest poverty rate, with 4 household (11.8%) living below poverty.
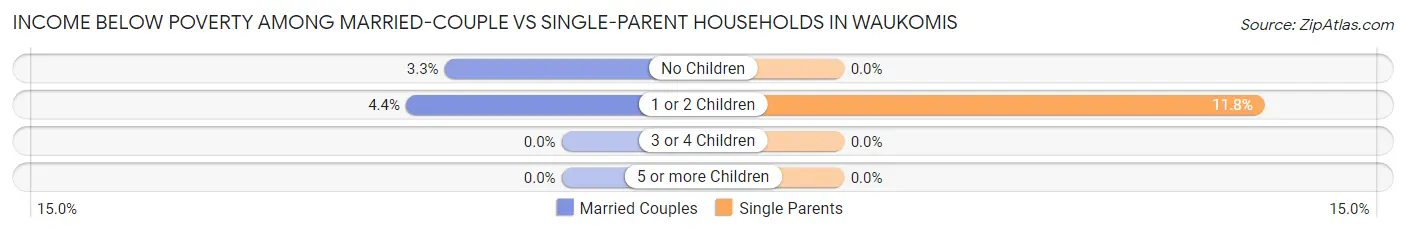
| Children | Married-Couple Families | Single-Parent Households |
| No Children | 5 (3.3%) | 0 (0.0%) |
| 1 or 2 Children | 3 (4.3%) | 4 (11.8%) |
| 3 or 4 Children | 0 (0.0%) | 0 (0.0%) |
| 5 or more Children | 0 (0.0%) | 0 (0.0%) |
| Total | 8 (3.5%) | 4 (6.5%) |
Race in Waukomis
The most populous races in Waukomis are White / Caucasian (1,039 | 95.6%), Hispanic or Latino (51 | 4.7%), and Two or more Races (44 | 4.1%).
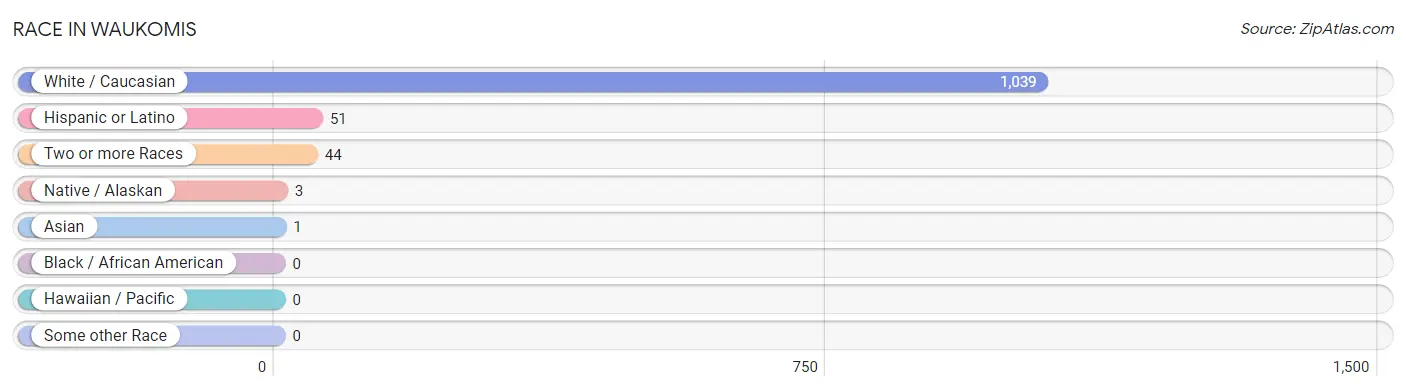
| Race | # Population | % Population |
| Asian | 1 | 0.1% |
| Black / African American | 0 | 0.0% |
| Hawaiian / Pacific | 0 | 0.0% |
| Hispanic or Latino | 51 | 4.7% |
| Native / Alaskan | 3 | 0.3% |
| White / Caucasian | 1,039 | 95.6% |
| Two or more Races | 44 | 4.1% |
| Some other Race | 0 | 0.0% |
| Total | 1,087 | 100.0% |
Ancestry in Waukomis
The most populous ancestries reported in Waukomis are German (144 | 13.3%), American (132 | 12.1%), English (96 | 8.8%), Irish (77 | 7.1%), and Czech (35 | 3.2%), together accounting for 44.5% of all Waukomis residents.
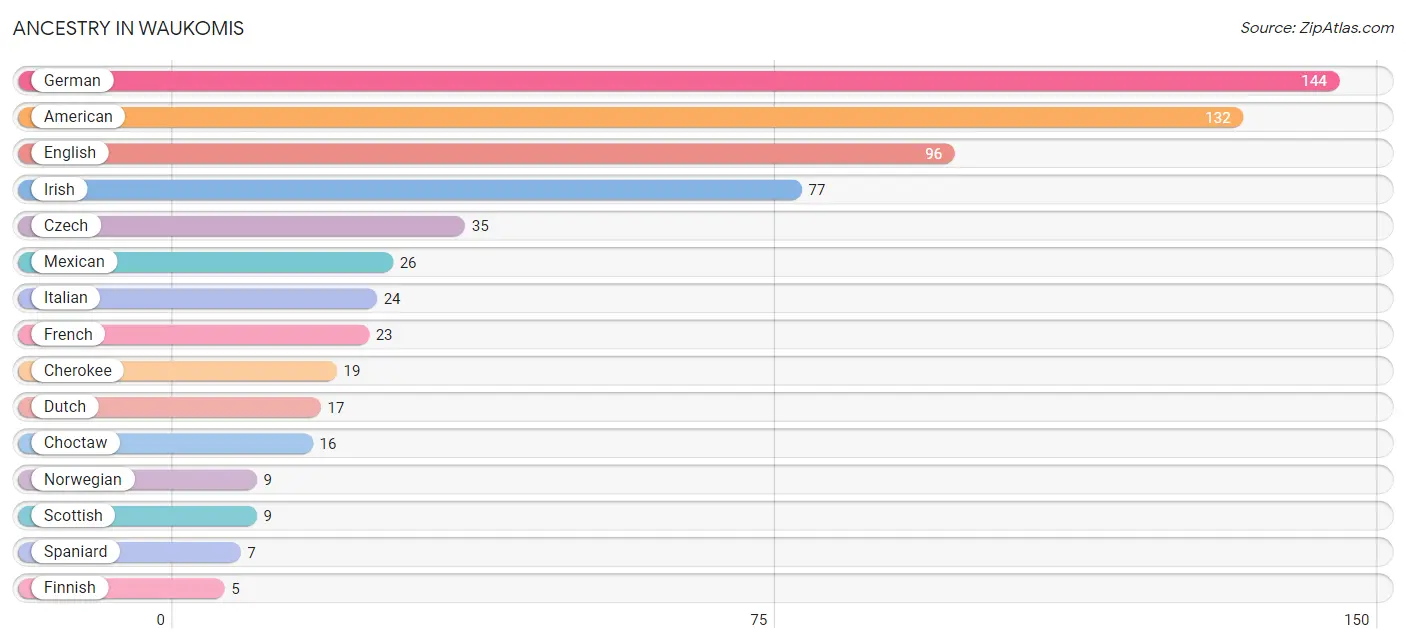
| Ancestry | # Population | % Population |
| American | 132 | 12.1% |
| Belgian | 3 | 0.3% |
| British | 2 | 0.2% |
| Burmese | 1 | 0.1% |
| Cherokee | 19 | 1.8% |
| Chickasaw | 2 | 0.2% |
| Choctaw | 16 | 1.5% |
| Colombian | 2 | 0.2% |
| Czech | 35 | 3.2% |
| Danish | 3 | 0.3% |
| Dutch | 17 | 1.6% |
| English | 96 | 8.8% |
| Finnish | 5 | 0.5% |
| French | 23 | 2.1% |
| French Canadian | 4 | 0.4% |
| German | 144 | 13.3% |
| Irish | 77 | 7.1% |
| Italian | 24 | 2.2% |
| Mexican | 26 | 2.4% |
| Norwegian | 9 | 0.8% |
| Scandinavian | 1 | 0.1% |
| Scotch-Irish | 3 | 0.3% |
| Scottish | 9 | 0.8% |
| South American | 2 | 0.2% |
| Spaniard | 7 | 0.6% |
| Swedish | 2 | 0.2% |
| Welsh | 4 | 0.4% | View All 27 Rows |
Immigrants in Waukomis
The most numerous immigrant groups reported in Waukomis came from Canada (4 | 0.4%), Colombia (2 | 0.2%), Latin America (2 | 0.2%), and South America (2 | 0.2%), together accounting for 0.9% of all Waukomis residents.
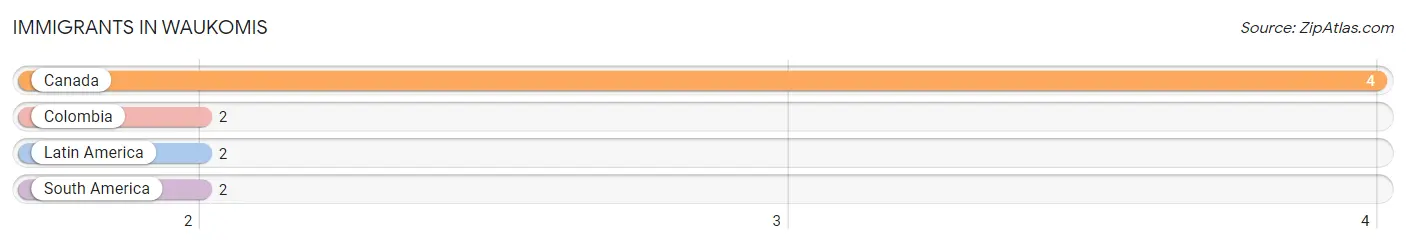
| Immigration Origin | # Population | % Population |
| Canada | 4 | 0.4% |
| Colombia | 2 | 0.2% |
| Latin America | 2 | 0.2% |
| South America | 2 | 0.2% | View All 4 Rows |
Sex and Age in Waukomis
Sex and Age in Waukomis
The most populous age groups in Waukomis are 70 to 74 Years (98 | 18.5%) for men and 70 to 74 Years (135 | 24.2%) for women.
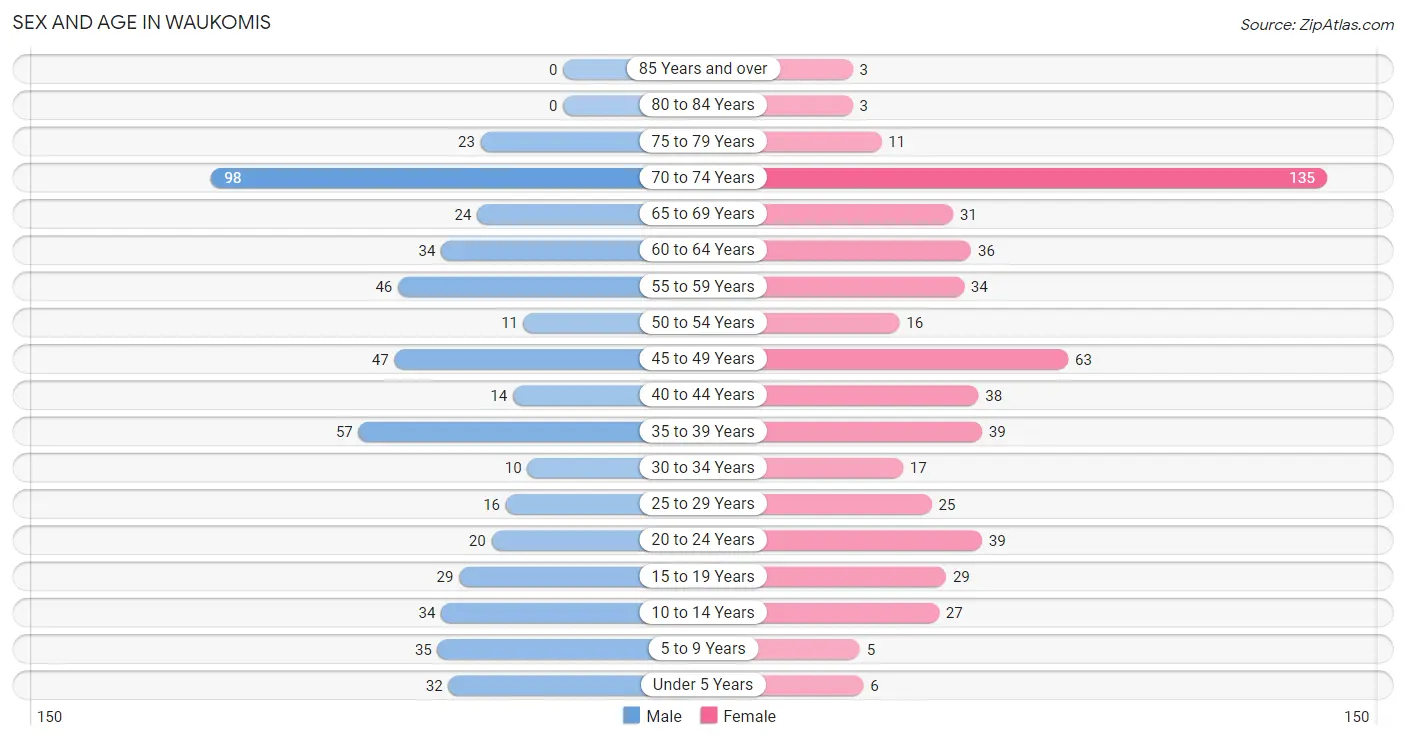
| Age Bracket | Male | Female |
| Under 5 Years | 32 (6.0%) | 6 (1.1%) |
| 5 to 9 Years | 35 (6.6%) | 5 (0.9%) |
| 10 to 14 Years | 34 (6.4%) | 27 (4.9%) |
| 15 to 19 Years | 29 (5.5%) | 29 (5.2%) |
| 20 to 24 Years | 20 (3.8%) | 39 (7.0%) |
| 25 to 29 Years | 16 (3.0%) | 25 (4.5%) |
| 30 to 34 Years | 10 (1.9%) | 17 (3.0%) |
| 35 to 39 Years | 57 (10.7%) | 39 (7.0%) |
| 40 to 44 Years | 14 (2.6%) | 38 (6.8%) |
| 45 to 49 Years | 47 (8.9%) | 63 (11.3%) |
| 50 to 54 Years | 11 (2.1%) | 16 (2.9%) |
| 55 to 59 Years | 46 (8.7%) | 34 (6.1%) |
| 60 to 64 Years | 34 (6.4%) | 36 (6.5%) |
| 65 to 69 Years | 24 (4.5%) | 31 (5.6%) |
| 70 to 74 Years | 98 (18.5%) | 135 (24.2%) |
| 75 to 79 Years | 23 (4.3%) | 11 (2.0%) |
| 80 to 84 Years | 0 (0.0%) | 3 (0.5%) |
| 85 Years and over | 0 (0.0%) | 3 (0.5%) |
| Total | 530 (100.0%) | 557 (100.0%) |
Families and Households in Waukomis
Median Family Size in Waukomis
The median family size in Waukomis is 3.07 persons per family, with married-couple families (229 | 78.7%) accounting for the largest median family size of 3.27 persons per family. On the other hand, single male/father families (23 | 7.9%) represent the smallest median family size with 2.00 persons per family.
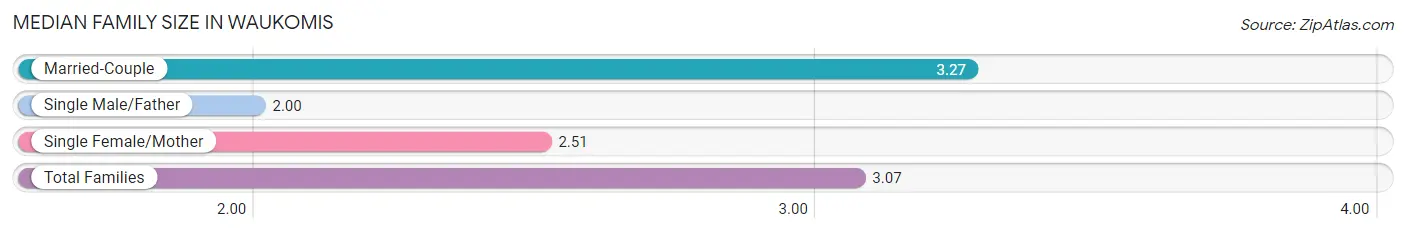
| Family Type | # Families | Family Size |
| Married-Couple | 229 (78.7%) | 3.27 |
| Single Male/Father | 23 (7.9%) | 2.00 |
| Single Female/Mother | 39 (13.4%) | 2.51 |
| Total Families | 291 (100.0%) | 3.07 |
Median Household Size in Waukomis
The median household size in Waukomis is 2.42 persons per household, with married-couple households (229 | 51.0%) accounting for the largest median household size of 3.3 persons per household. non-family households (158 | 35.2%) represent the smallest median household size with 1.08 persons per household.
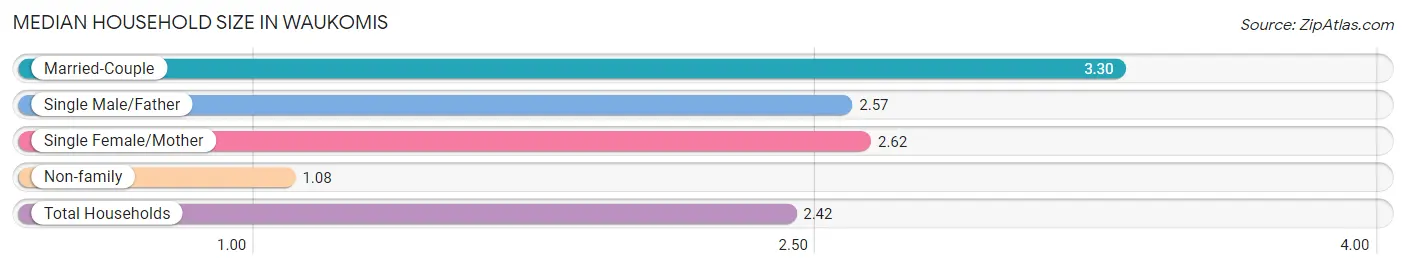
| Household Type | # Households | Household Size |
| Married-Couple | 229 (51.0%) | 3.30 |
| Single Male/Father | 23 (5.1%) | 2.57 |
| Single Female/Mother | 39 (8.7%) | 2.62 |
| Non-family | 158 (35.2%) | 1.08 |
| Total Households | 449 (100.0%) | 2.42 |
Household Size by Marriage Status in Waukomis
Out of a total of 449 households in Waukomis, 291 (64.8%) are family households, while 158 (35.2%) are nonfamily households. The most numerous type of family households are 2-person households, comprising 152, and the most common type of nonfamily households are 1-person households, comprising 151.
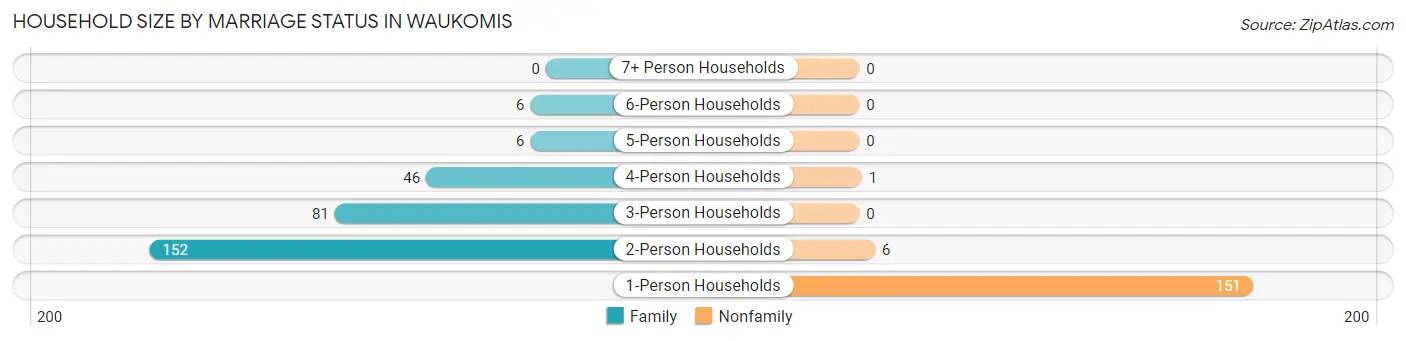
| Household Size | Family Households | Nonfamily Households |
| 1-Person Households | - | 151 (33.6%) |
| 2-Person Households | 152 (33.9%) | 6 (1.3%) |
| 3-Person Households | 81 (18.0%) | 0 (0.0%) |
| 4-Person Households | 46 (10.2%) | 1 (0.2%) |
| 5-Person Households | 6 (1.3%) | 0 (0.0%) |
| 6-Person Households | 6 (1.3%) | 0 (0.0%) |
| 7+ Person Households | 0 (0.0%) | 0 (0.0%) |
| Total | 291 (64.8%) | 158 (35.2%) |
Female Fertility in Waukomis
Fertility by Age in Waukomis
Average fertility rate in Waukomis is 47.0 births per 1,000 women. Women in the age bracket of 20 to 34 years have the highest fertility rate with 148.0 births per 1,000 women. Women in the age bracket of 20 to 34 years acount for 100.0% of all women with births.
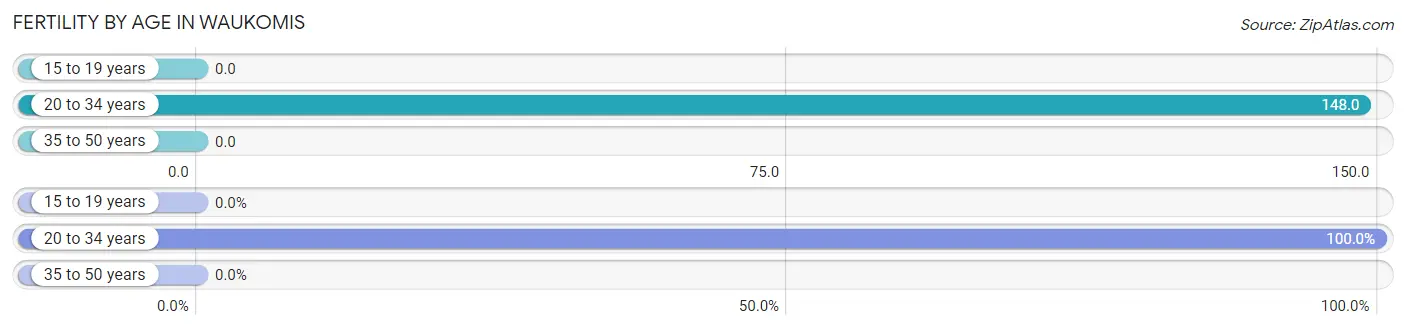
| Age Bracket | Women with Births | Births / 1,000 Women |
| 15 to 19 years | 0 (0.0%) | 0.0 |
| 20 to 34 years | 12 (100.0%) | 148.0 |
| 35 to 50 years | 0 (0.0%) | 0.0 |
| Total | 12 (100.0%) | 47.0 |
Fertility by Age by Marriage Status in Waukomis
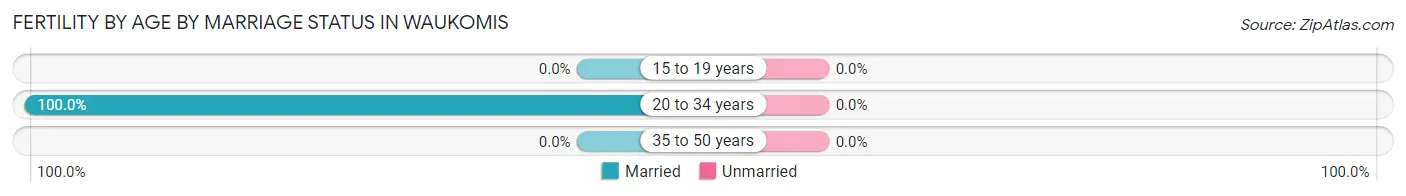
| Age Bracket | Married | Unmarried |
| 15 to 19 years | 0 (0.0%) | 0 (0.0%) |
| 20 to 34 years | 12 (100.0%) | 0 (0.0%) |
| 35 to 50 years | 0 (0.0%) | 0 (0.0%) |
| Total | 12 (100.0%) | 0 (0.0%) |
Fertility by Education in Waukomis
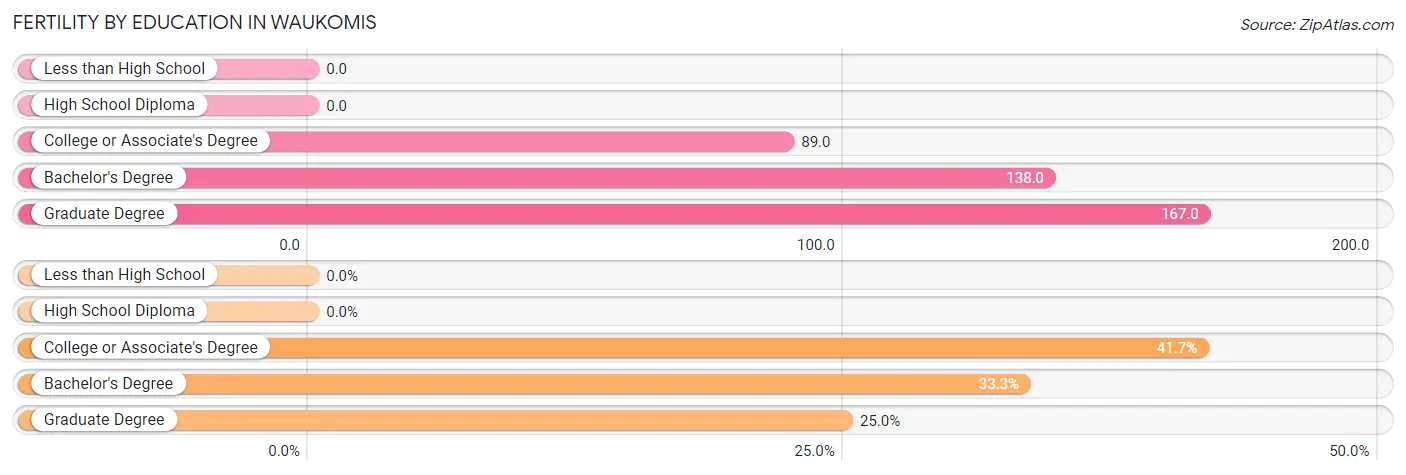
| Educational Attainment | Women with Births | Births / 1,000 Women |
| Less than High School | 0 (0.0%) | 0.0 |
| High School Diploma | 0 (0.0%) | 0.0 |
| College or Associate's Degree | 5 (41.7%) | 89.0 |
| Bachelor's Degree | 4 (33.3%) | 138.0 |
| Graduate Degree | 3 (25.0%) | 167.0 |
| Total | 12 (100.0%) | 47.0 |
Fertility by Education by Marriage Status in Waukomis
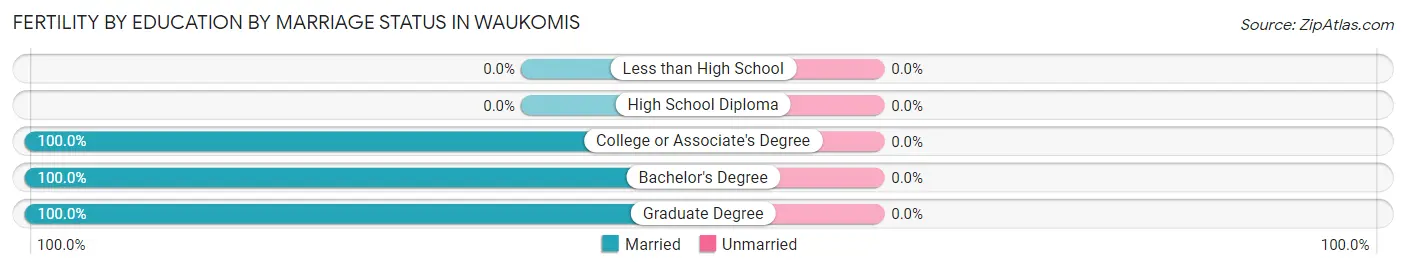
| Educational Attainment | Married | Unmarried |
| Less than High School | 0 (0.0%) | 0 (0.0%) |
| High School Diploma | 0 (0.0%) | 0 (0.0%) |
| College or Associate's Degree | 5 (100.0%) | 0 (0.0%) |
| Bachelor's Degree | 4 (100.0%) | 0 (0.0%) |
| Graduate Degree | 3 (100.0%) | 0 (0.0%) |
| Total | 12 (100.0%) | 0 (0.0%) |
Employment Characteristics in Waukomis
Employment by Class of Employer in Waukomis
Among the 469 employed individuals in Waukomis, private company employees (302 | 64.4%), self-employed (not incorporated) (48 | 10.2%), and local government employees (43 | 9.2%) make up the most common classes of employment.
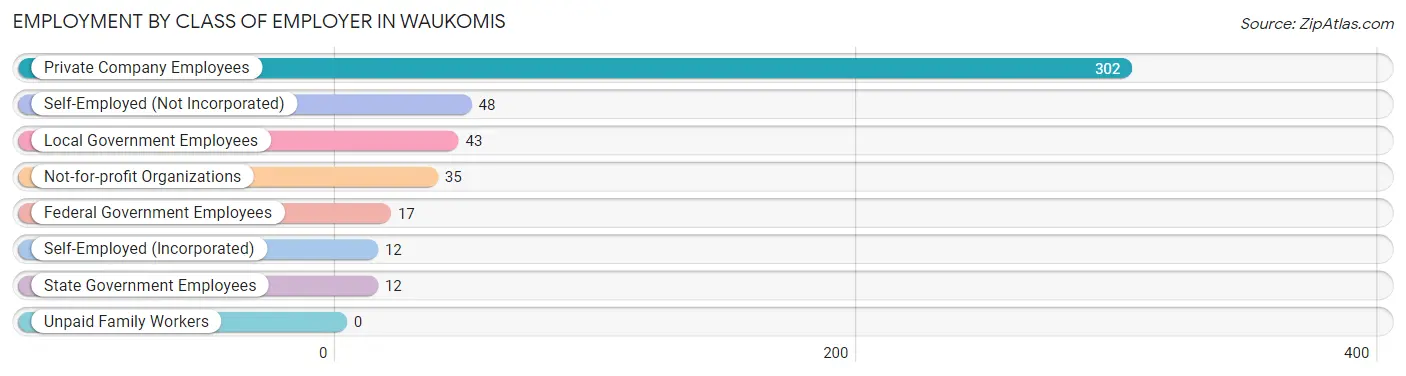
| Employer Class | # Employees | % Employees |
| Private Company Employees | 302 | 64.4% |
| Self-Employed (Incorporated) | 12 | 2.6% |
| Self-Employed (Not Incorporated) | 48 | 10.2% |
| Not-for-profit Organizations | 35 | 7.5% |
| Local Government Employees | 43 | 9.2% |
| State Government Employees | 12 | 2.6% |
| Federal Government Employees | 17 | 3.6% |
| Unpaid Family Workers | 0 | 0.0% |
| Total | 469 | 100.0% |
Employment Status by Age in Waukomis
According to the labor force statistics for Waukomis, out of the total population over 16 years of age (944), 55.0% or 519 individuals are in the labor force, with 3.1% or 16 of them unemployed. The age group with the highest labor force participation rate is 20 to 24 years, with 100.0% or 59 individuals in the labor force. Within the labor force, the 16 to 19 years age range has the highest percentage of unemployed individuals, with 16.3% or 7 of them being unemployed.
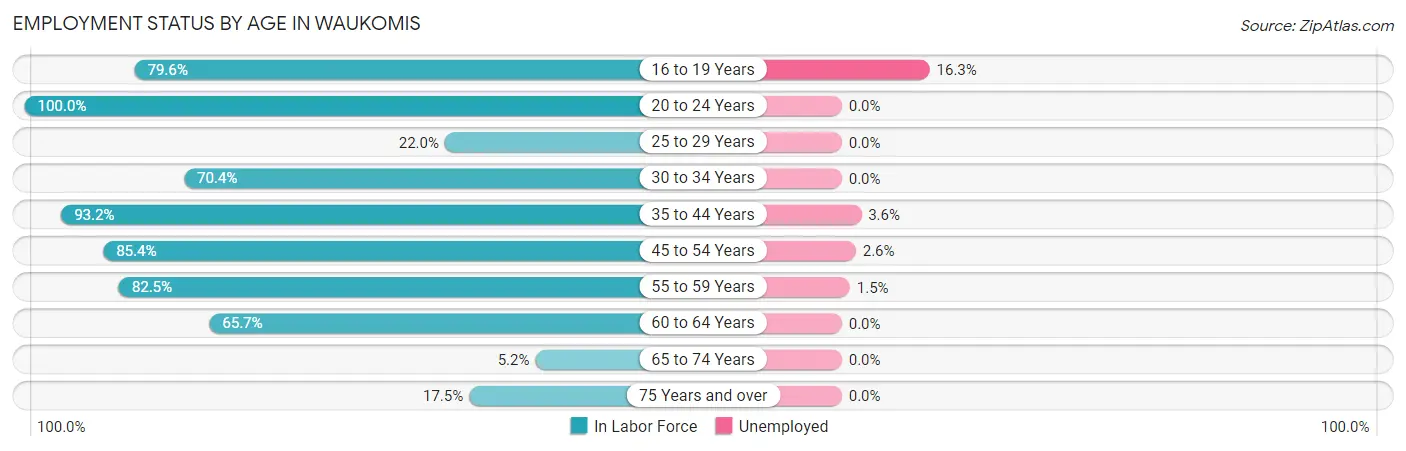
| Age Bracket | In Labor Force | Unemployed |
| 16 to 19 Years | 43 (79.6%) | 7 (16.3%) |
| 20 to 24 Years | 59 (100.0%) | 0 (0.0%) |
| 25 to 29 Years | 9 (22.0%) | 0 (0.0%) |
| 30 to 34 Years | 19 (70.4%) | 0 (0.0%) |
| 35 to 44 Years | 138 (93.2%) | 5 (3.6%) |
| 45 to 54 Years | 117 (85.4%) | 3 (2.6%) |
| 55 to 59 Years | 66 (82.5%) | 1 (1.5%) |
| 60 to 64 Years | 46 (65.7%) | 0 (0.0%) |
| 65 to 74 Years | 15 (5.2%) | 0 (0.0%) |
| 75 Years and over | 7 (17.5%) | 0 (0.0%) |
| Total | 519 (55.0%) | 16 (3.1%) |
Employment Status by Educational Attainment in Waukomis
According to labor force statistics for Waukomis, 78.5% of individuals (395) out of the total population between 25 and 64 years of age (503) are in the labor force, with 2.3% or 9 of them being unemployed. The group with the highest labor force participation rate are those with the educational attainment of bachelor's degree or higher, with 96.5% or 83 individuals in the labor force. Within the labor force, individuals with less than high school education have the highest percentage of unemployment, with 4.8% or 1 of them being unemployed.
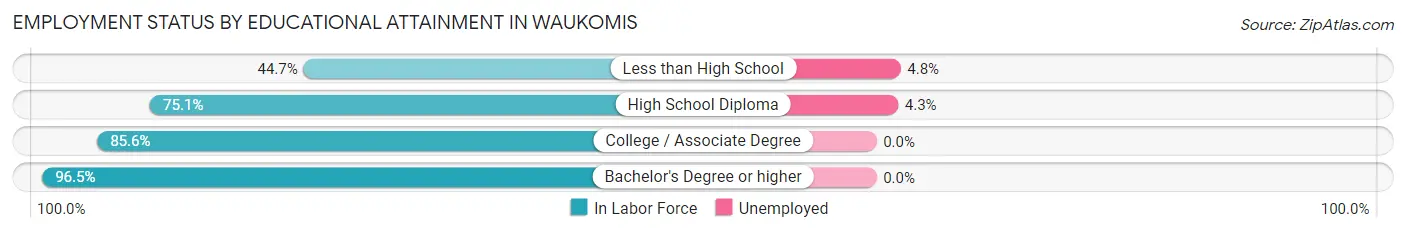
| Educational Attainment | In Labor Force | Unemployed |
| Less than High School | 21 (44.7%) | 2 (4.8%) |
| High School Diploma | 184 (75.1%) | 11 (4.3%) |
| College / Associate Degree | 107 (85.6%) | 0 (0.0%) |
| Bachelor's Degree or higher | 83 (96.5%) | 0 (0.0%) |
| Total | 395 (78.5%) | 12 (2.3%) |
Employment Occupations by Sex in Waukomis
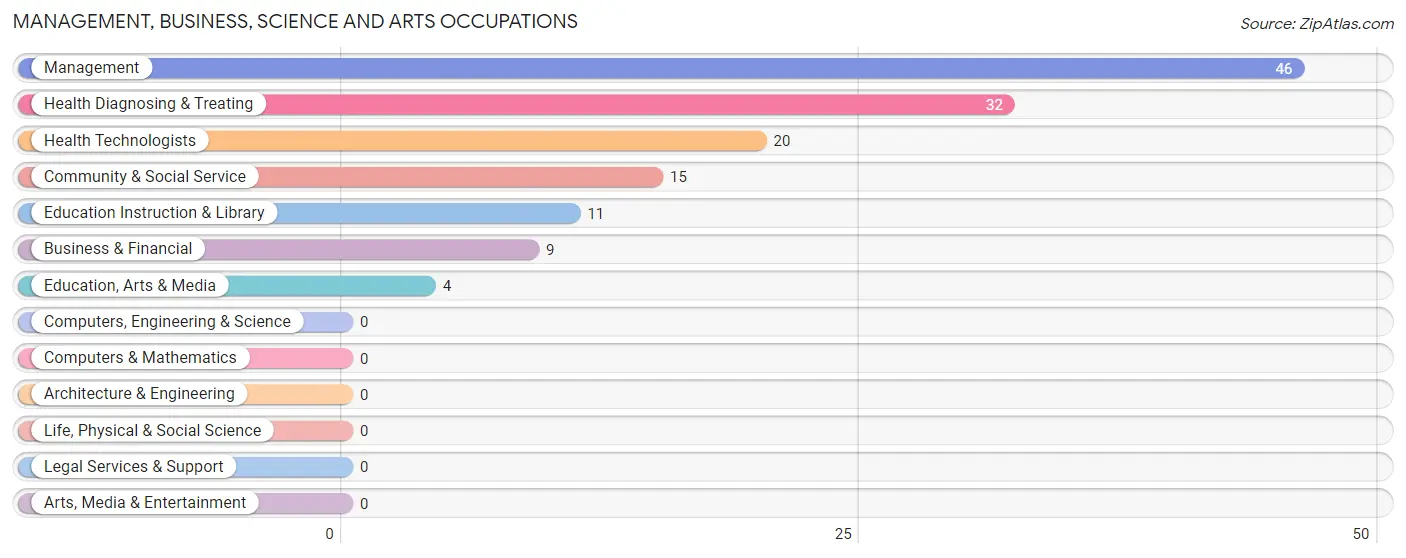
Management, Business, Science and Arts Occupations
The most common Management, Business, Science and Arts occupations in Waukomis are Management (46 | 9.1%), Health Diagnosing & Treating (32 | 6.4%), Health Technologists (20 | 4.0%), Community & Social Service (15 | 3.0%), and Education Instruction & Library (11 | 2.2%).
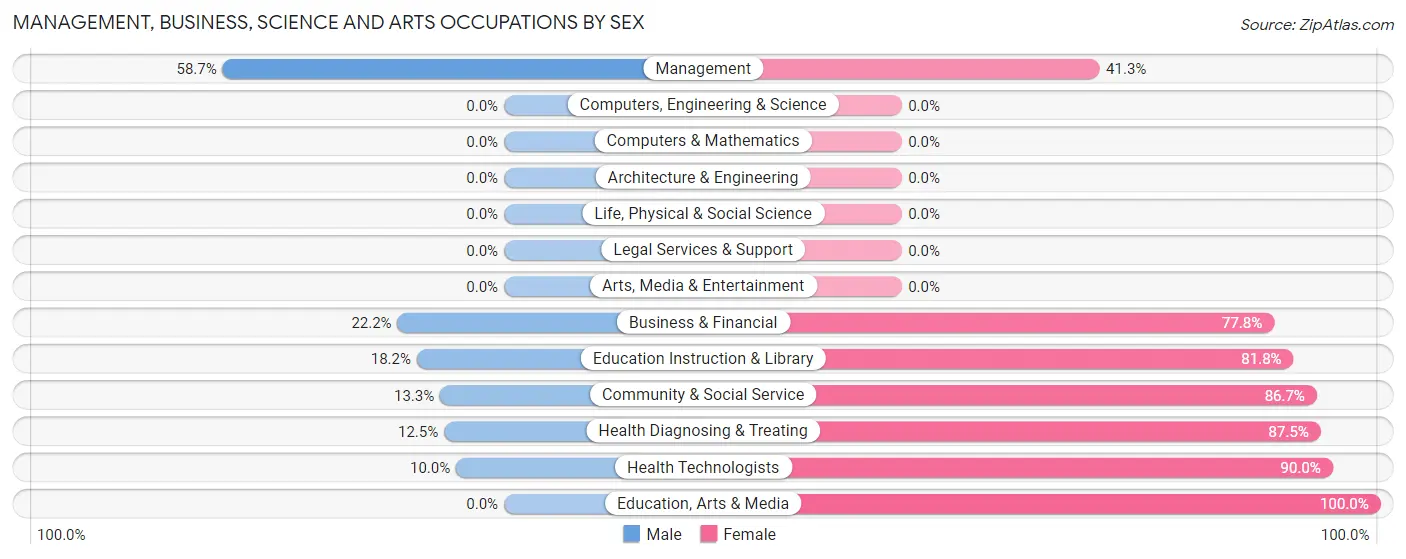
Management, Business, Science and Arts Occupations by Sex
Within the Management, Business, Science and Arts occupations in Waukomis, the most male-oriented occupations are Management (58.7%), Business & Financial (22.2%), and Education Instruction & Library (18.2%), while the most female-oriented occupations are Education, Arts & Media (100.0%), Health Technologists (90.0%), and Health Diagnosing & Treating (87.5%).
| Occupation | Male | Female |
| Management | 27 (58.7%) | 19 (41.3%) |
| Business & Financial | 2 (22.2%) | 7 (77.8%) |
| Computers, Engineering & Science | 0 (0.0%) | 0 (0.0%) |
| Computers & Mathematics | 0 (0.0%) | 0 (0.0%) |
| Architecture & Engineering | 0 (0.0%) | 0 (0.0%) |
| Life, Physical & Social Science | 0 (0.0%) | 0 (0.0%) |
| Community & Social Service | 2 (13.3%) | 13 (86.7%) |
| Education, Arts & Media | 0 (0.0%) | 4 (100.0%) |
| Legal Services & Support | 0 (0.0%) | 0 (0.0%) |
| Education Instruction & Library | 2 (18.2%) | 9 (81.8%) |
| Arts, Media & Entertainment | 0 (0.0%) | 0 (0.0%) |
| Health Diagnosing & Treating | 4 (12.5%) | 28 (87.5%) |
| Health Technologists | 2 (10.0%) | 18 (90.0%) |
| Total (Category) | 35 (34.3%) | 67 (65.7%) |
| Total (Overall) | 245 (48.7%) | 258 (51.3%) |
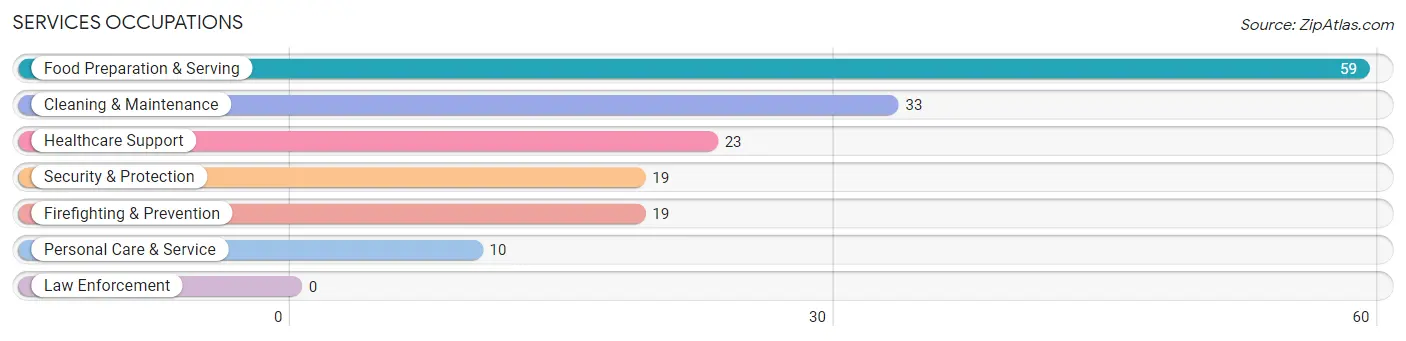
Services Occupations
The most common Services occupations in Waukomis are Food Preparation & Serving (59 | 11.7%), Cleaning & Maintenance (33 | 6.6%), Healthcare Support (23 | 4.6%), Security & Protection (19 | 3.8%), and Firefighting & Prevention (19 | 3.8%).
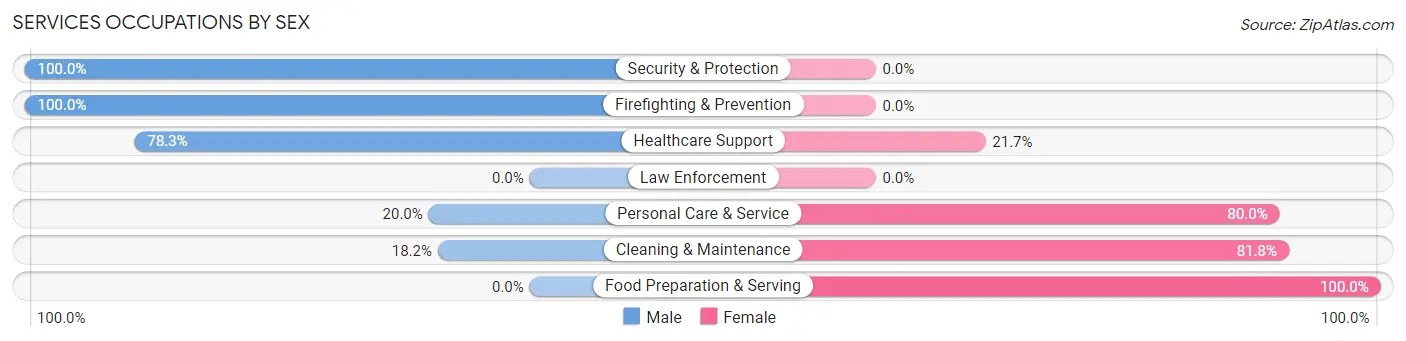
Services Occupations by Sex
Within the Services occupations in Waukomis, the most male-oriented occupations are Security & Protection (100.0%), Firefighting & Prevention (100.0%), and Healthcare Support (78.3%), while the most female-oriented occupations are Food Preparation & Serving (100.0%), Cleaning & Maintenance (81.8%), and Personal Care & Service (80.0%).
| Occupation | Male | Female |
| Healthcare Support | 18 (78.3%) | 5 (21.7%) |
| Security & Protection | 19 (100.0%) | 0 (0.0%) |
| Firefighting & Prevention | 19 (100.0%) | 0 (0.0%) |
| Law Enforcement | 0 (0.0%) | 0 (0.0%) |
| Food Preparation & Serving | 0 (0.0%) | 59 (100.0%) |
| Cleaning & Maintenance | 6 (18.2%) | 27 (81.8%) |
| Personal Care & Service | 2 (20.0%) | 8 (80.0%) |
| Total (Category) | 45 (31.2%) | 99 (68.8%) |
| Total (Overall) | 245 (48.7%) | 258 (51.3%) |
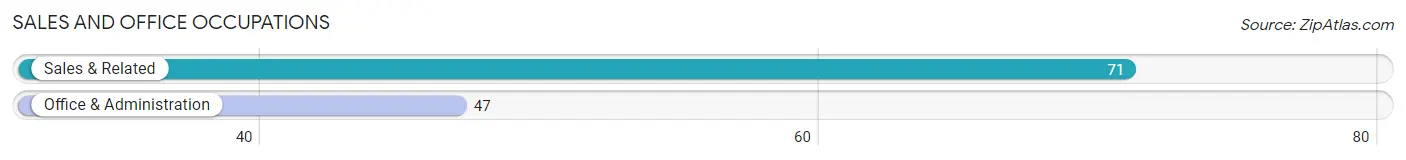
Sales and Office Occupations
The most common Sales and Office occupations in Waukomis are Sales & Related (71 | 14.1%), and Office & Administration (47 | 9.3%).
Sales and Office Occupations by Sex
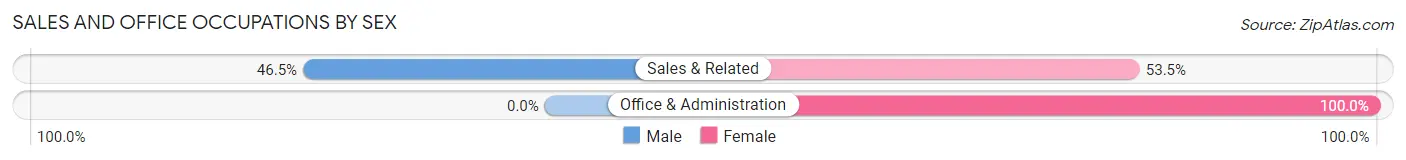
| Occupation | Male | Female |
| Sales & Related | 33 (46.5%) | 38 (53.5%) |
| Office & Administration | 0 (0.0%) | 47 (100.0%) |
| Total (Category) | 33 (28.0%) | 85 (72.0%) |
| Total (Overall) | 245 (48.7%) | 258 (51.3%) |
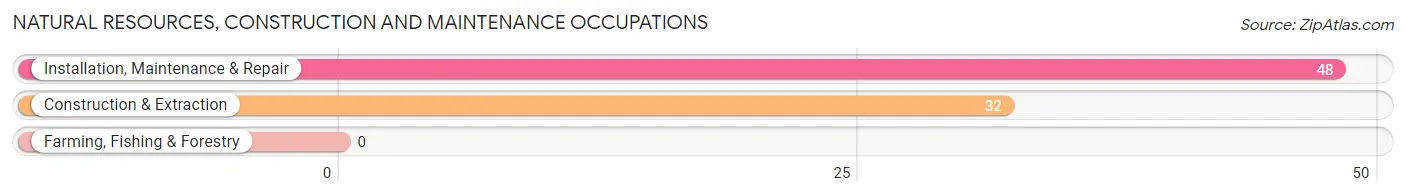
Natural Resources, Construction and Maintenance Occupations
The most common Natural Resources, Construction and Maintenance occupations in Waukomis are Installation, Maintenance & Repair (48 | 9.5%), and Construction & Extraction (32 | 6.4%).
Natural Resources, Construction and Maintenance Occupations by Sex
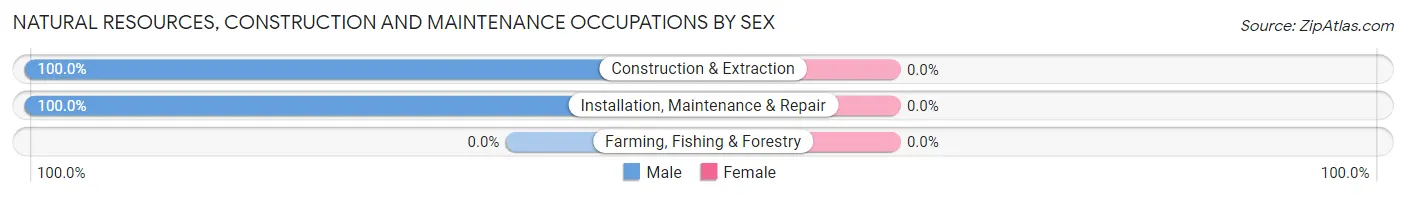
| Occupation | Male | Female |
| Farming, Fishing & Forestry | 0 (0.0%) | 0 (0.0%) |
| Construction & Extraction | 32 (100.0%) | 0 (0.0%) |
| Installation, Maintenance & Repair | 48 (100.0%) | 0 (0.0%) |
| Total (Category) | 80 (100.0%) | 0 (0.0%) |
| Total (Overall) | 245 (48.7%) | 258 (51.3%) |
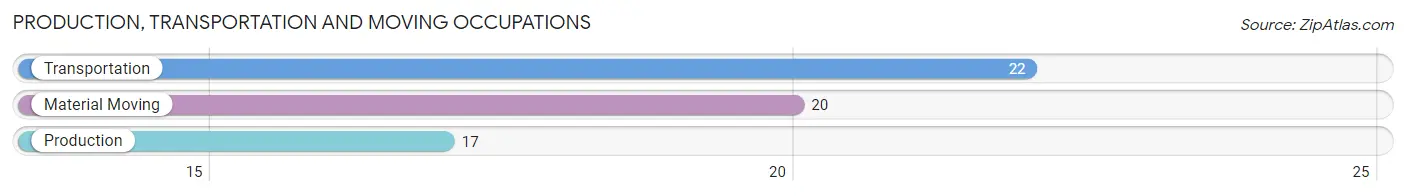
Production, Transportation and Moving Occupations
The most common Production, Transportation and Moving occupations in Waukomis are Transportation (22 | 4.4%), Material Moving (20 | 4.0%), and Production (17 | 3.4%).
Production, Transportation and Moving Occupations by Sex
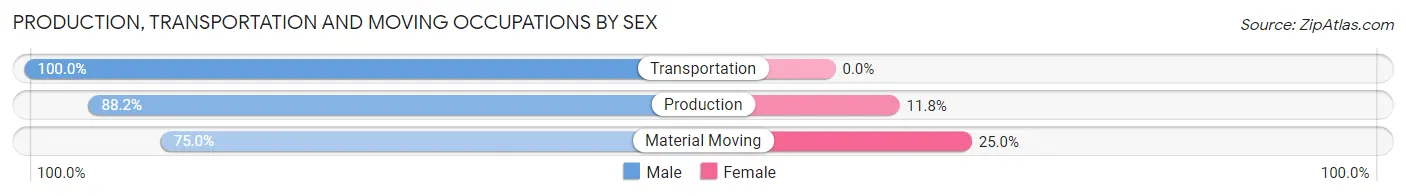
| Occupation | Male | Female |
| Production | 15 (88.2%) | 2 (11.8%) |
| Transportation | 22 (100.0%) | 0 (0.0%) |
| Material Moving | 15 (75.0%) | 5 (25.0%) |
| Total (Category) | 52 (88.1%) | 7 (11.9%) |
| Total (Overall) | 245 (48.7%) | 258 (51.3%) |
Employment Industries by Sex in Waukomis
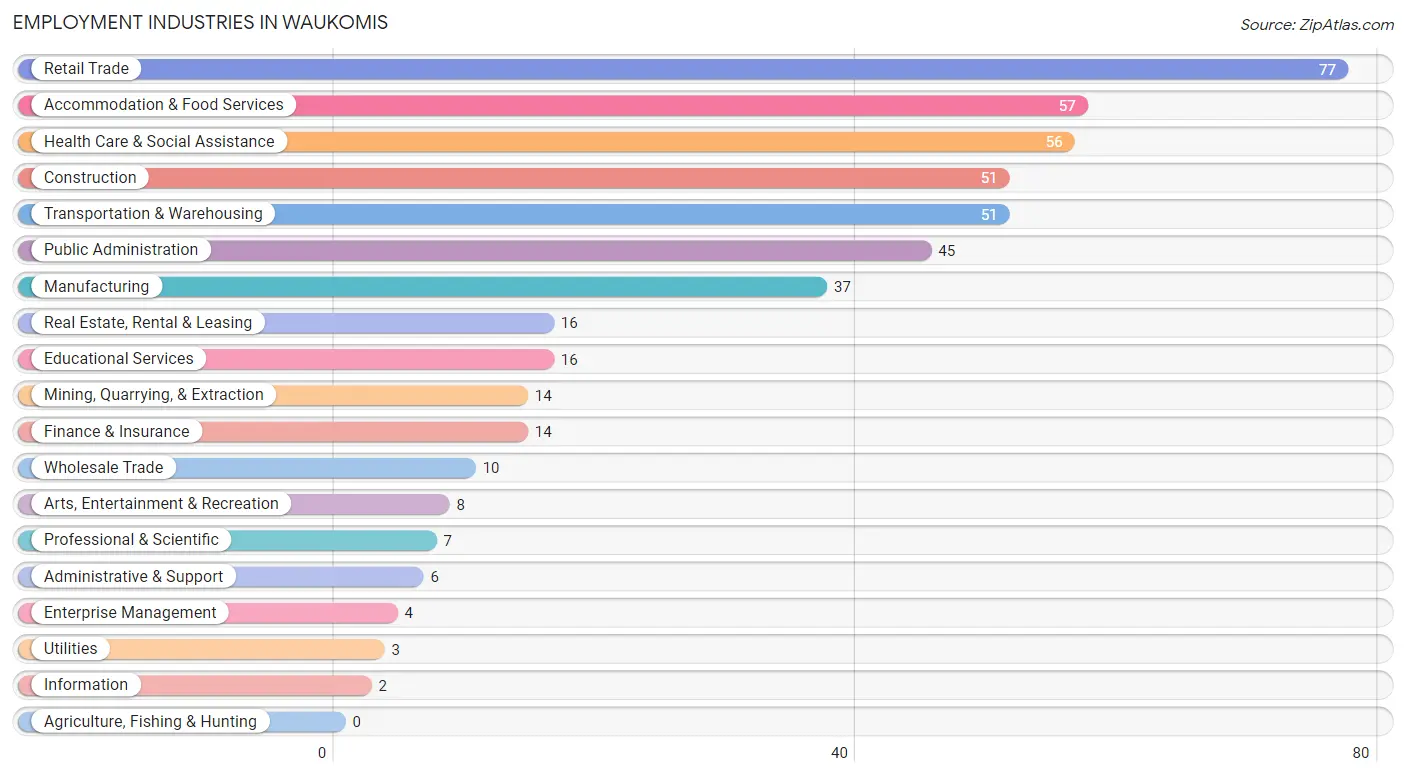
Employment Industries in Waukomis
The major employment industries in Waukomis include Retail Trade (77 | 15.3%), Accommodation & Food Services (57 | 11.3%), Health Care & Social Assistance (56 | 11.1%), Construction (51 | 10.1%), and Transportation & Warehousing (51 | 10.1%).
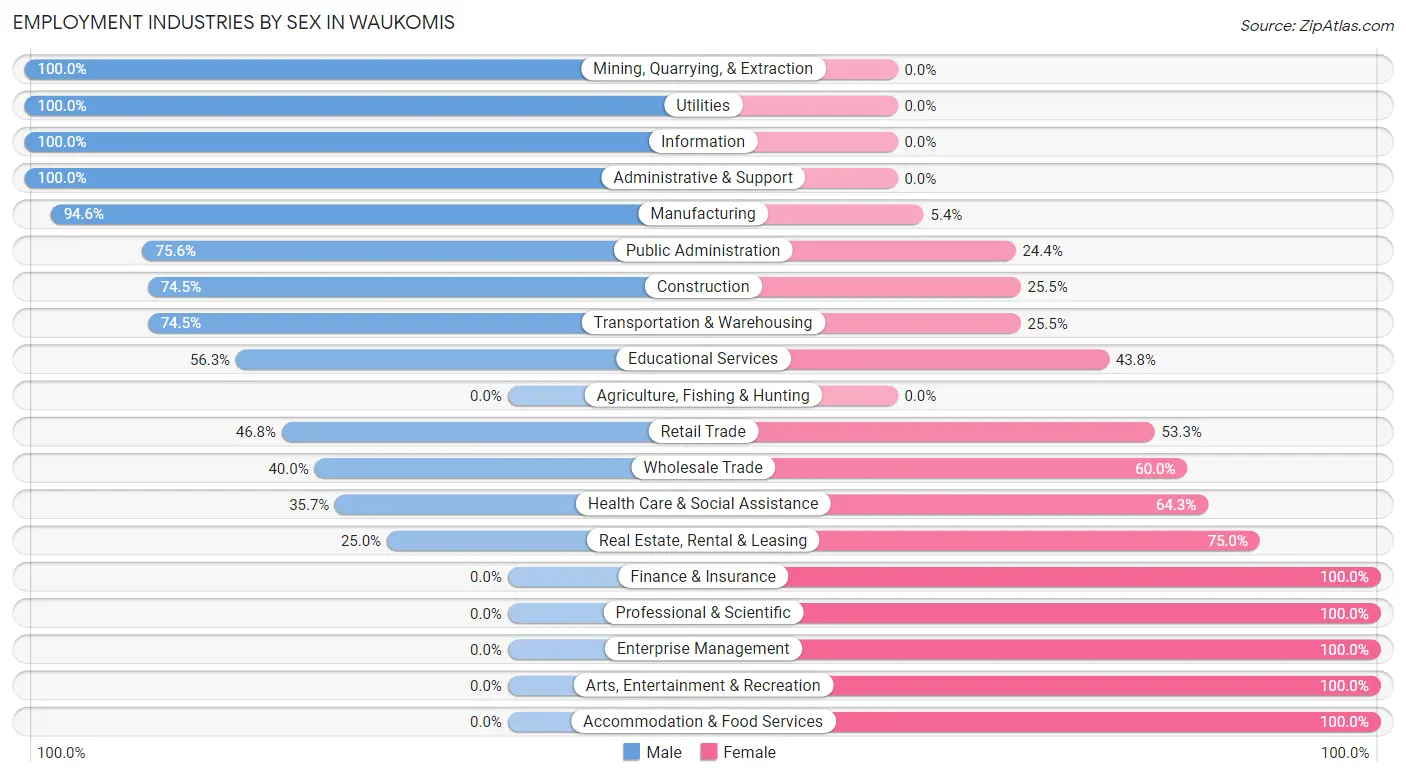
Employment Industries by Sex in Waukomis
The Waukomis industries that see more men than women are Mining, Quarrying, & Extraction (100.0%), Utilities (100.0%), and Information (100.0%), whereas the industries that tend to have a higher number of women are Finance & Insurance (100.0%), Professional & Scientific (100.0%), and Enterprise Management (100.0%).
| Industry | Male | Female |
| Agriculture, Fishing & Hunting | 0 (0.0%) | 0 (0.0%) |
| Mining, Quarrying, & Extraction | 14 (100.0%) | 0 (0.0%) |
| Construction | 38 (74.5%) | 13 (25.5%) |
| Manufacturing | 35 (94.6%) | 2 (5.4%) |
| Wholesale Trade | 4 (40.0%) | 6 (60.0%) |
| Retail Trade | 36 (46.8%) | 41 (53.2%) |
| Transportation & Warehousing | 38 (74.5%) | 13 (25.5%) |
| Utilities | 3 (100.0%) | 0 (0.0%) |
| Information | 2 (100.0%) | 0 (0.0%) |
| Finance & Insurance | 0 (0.0%) | 14 (100.0%) |
| Real Estate, Rental & Leasing | 4 (25.0%) | 12 (75.0%) |
| Professional & Scientific | 0 (0.0%) | 7 (100.0%) |
| Enterprise Management | 0 (0.0%) | 4 (100.0%) |
| Administrative & Support | 6 (100.0%) | 0 (0.0%) |
| Educational Services | 9 (56.2%) | 7 (43.8%) |
| Health Care & Social Assistance | 20 (35.7%) | 36 (64.3%) |
| Arts, Entertainment & Recreation | 0 (0.0%) | 8 (100.0%) |
| Accommodation & Food Services | 0 (0.0%) | 57 (100.0%) |
| Public Administration | 34 (75.6%) | 11 (24.4%) |
| Total | 245 (48.7%) | 258 (51.3%) |
Education in Waukomis
School Enrollment in Waukomis
The most common levels of schooling among the 165 students in Waukomis are elementary school (40 | 24.2%), high school (35 | 21.2%), and college / undergraduate (35 | 21.2%).
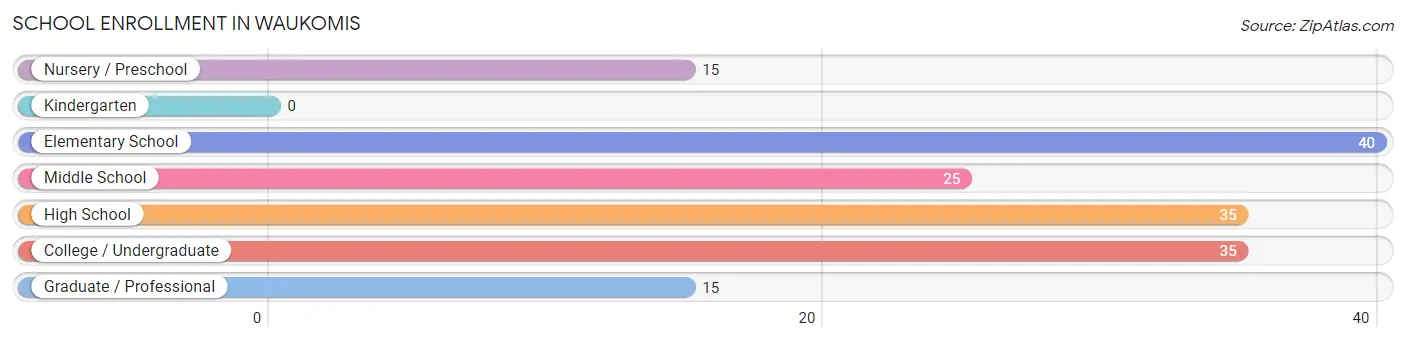
| School Level | # Students | % Students |
| Nursery / Preschool | 15 | 9.1% |
| Kindergarten | 0 | 0.0% |
| Elementary School | 40 | 24.2% |
| Middle School | 25 | 15.1% |
| High School | 35 | 21.2% |
| College / Undergraduate | 35 | 21.2% |
| Graduate / Professional | 15 | 9.1% |
| Total | 165 | 100.0% |
School Enrollment by Age by Funding Source in Waukomis
Out of a total of 165 students who are enrolled in schools in Waukomis, 18 (10.9%) attend a private institution, while the remaining 147 (89.1%) are enrolled in public schools. The age group of 3 to 4 year olds has the highest likelihood of being enrolled in private schools, with 15 (100.0% in the age bracket) enrolled. Conversely, the age group of 10 to 14 year olds has the lowest likelihood of being enrolled in a private school, with 44 (100.0% in the age bracket) attending a public institution.
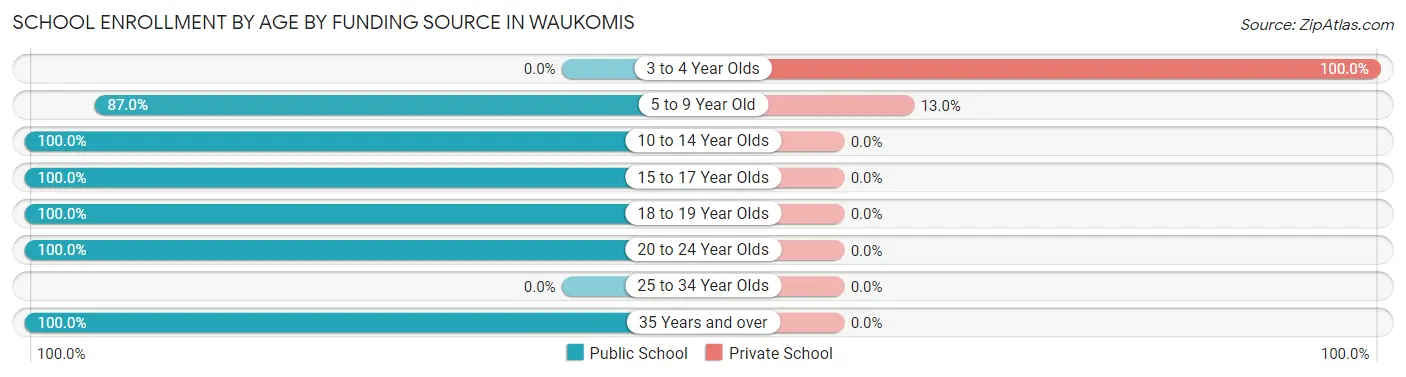
| Age Bracket | Public School | Private School |
| 3 to 4 Year Olds | 0 (0.0%) | 15 (100.0%) |
| 5 to 9 Year Old | 20 (87.0%) | 3 (13.0%) |
| 10 to 14 Year Olds | 44 (100.0%) | 0 (0.0%) |
| 15 to 17 Year Olds | 30 (100.0%) | 0 (0.0%) |
| 18 to 19 Year Olds | 10 (100.0%) | 0 (0.0%) |
| 20 to 24 Year Olds | 26 (100.0%) | 0 (0.0%) |
| 25 to 34 Year Olds | 0 (0.0%) | 0 (0.0%) |
| 35 Years and over | 17 (100.0%) | 0 (0.0%) |
| Total | 147 (89.1%) | 18 (10.9%) |
Educational Attainment by Field of Study in Waukomis
Science & technology (31 | 28.7%), business (31 | 28.7%), education (23 | 21.3%), arts & humanities (15 | 13.9%), and bio, nature & agricultural (3 | 2.8%) are the most common fields of study among 108 individuals in Waukomis who have obtained a bachelor's degree or higher.
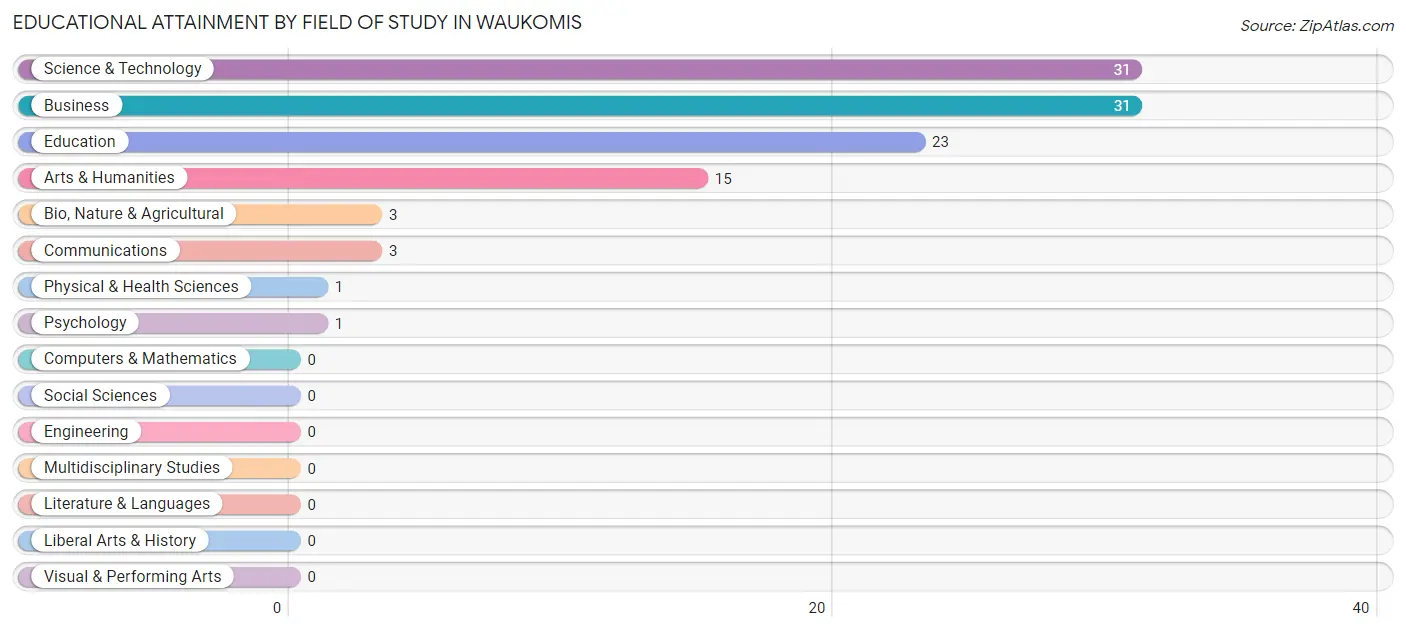
| Field of Study | # Graduates | % Graduates |
| Computers & Mathematics | 0 | 0.0% |
| Bio, Nature & Agricultural | 3 | 2.8% |
| Physical & Health Sciences | 1 | 0.9% |
| Psychology | 1 | 0.9% |
| Social Sciences | 0 | 0.0% |
| Engineering | 0 | 0.0% |
| Multidisciplinary Studies | 0 | 0.0% |
| Science & Technology | 31 | 28.7% |
| Business | 31 | 28.7% |
| Education | 23 | 21.3% |
| Literature & Languages | 0 | 0.0% |
| Liberal Arts & History | 0 | 0.0% |
| Visual & Performing Arts | 0 | 0.0% |
| Communications | 3 | 2.8% |
| Arts & Humanities | 15 | 13.9% |
| Total | 108 | 100.0% |
Transportation & Commute in Waukomis
Vehicle Availability by Sex in Waukomis
The most prevalent vehicle ownership categories in Waukomis are males with 3 vehicles (94, accounting for 41.6%) and females with 3 vehicles (101, making up 38.7%).
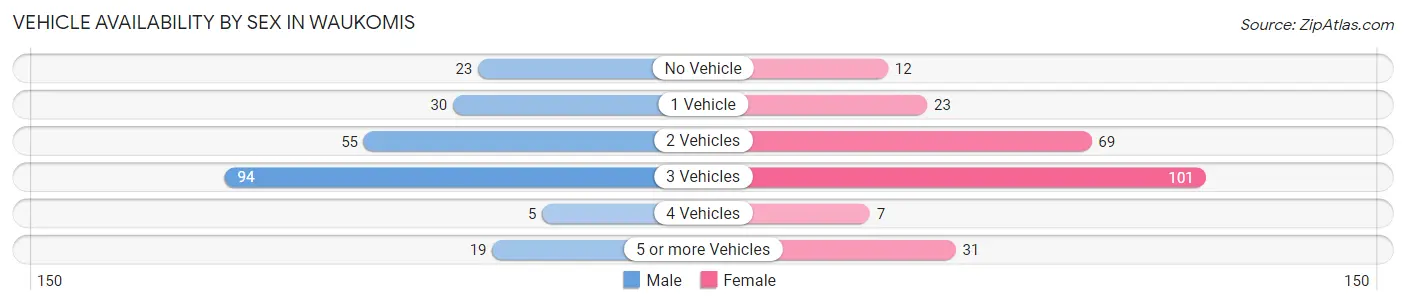
| Vehicles Available | Male | Female |
| No Vehicle | 23 (10.2%) | 12 (4.9%) |
| 1 Vehicle | 30 (13.3%) | 23 (9.5%) |
| 2 Vehicles | 55 (24.3%) | 69 (28.4%) |
| 3 Vehicles | 94 (41.6%) | 101 (41.6%) |
| 4 Vehicles | 5 (2.2%) | 7 (2.9%) |
| 5 or more Vehicles | 19 (8.4%) | 31 (12.8%) |
| Total | 226 (100.0%) | 243 (100.0%) |
Commute Time in Waukomis
The most frequently occuring commute durations in Waukomis are 20 to 24 minutes (152 commuters, 33.0%), 15 to 19 minutes (130 commuters, 28.2%), and 10 to 14 minutes (40 commuters, 8.7%).
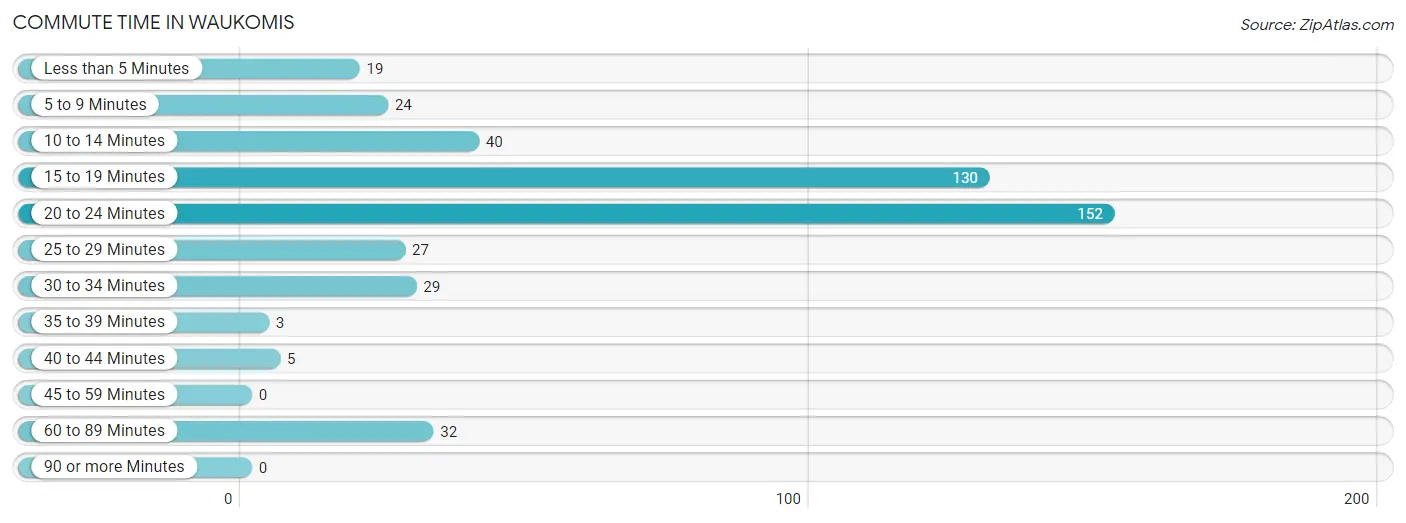
| Commute Time | # Commuters | % Commuters |
| Less than 5 Minutes | 19 | 4.1% |
| 5 to 9 Minutes | 24 | 5.2% |
| 10 to 14 Minutes | 40 | 8.7% |
| 15 to 19 Minutes | 130 | 28.2% |
| 20 to 24 Minutes | 152 | 33.0% |
| 25 to 29 Minutes | 27 | 5.9% |
| 30 to 34 Minutes | 29 | 6.3% |
| 35 to 39 Minutes | 3 | 0.6% |
| 40 to 44 Minutes | 5 | 1.1% |
| 45 to 59 Minutes | 0 | 0.0% |
| 60 to 89 Minutes | 32 | 6.9% |
| 90 or more Minutes | 0 | 0.0% |
Commute Time by Sex in Waukomis
The most common commute times in Waukomis are 15 to 19 minutes (81 commuters, 36.5%) for males and 20 to 24 minutes (123 commuters, 51.5%) for females.
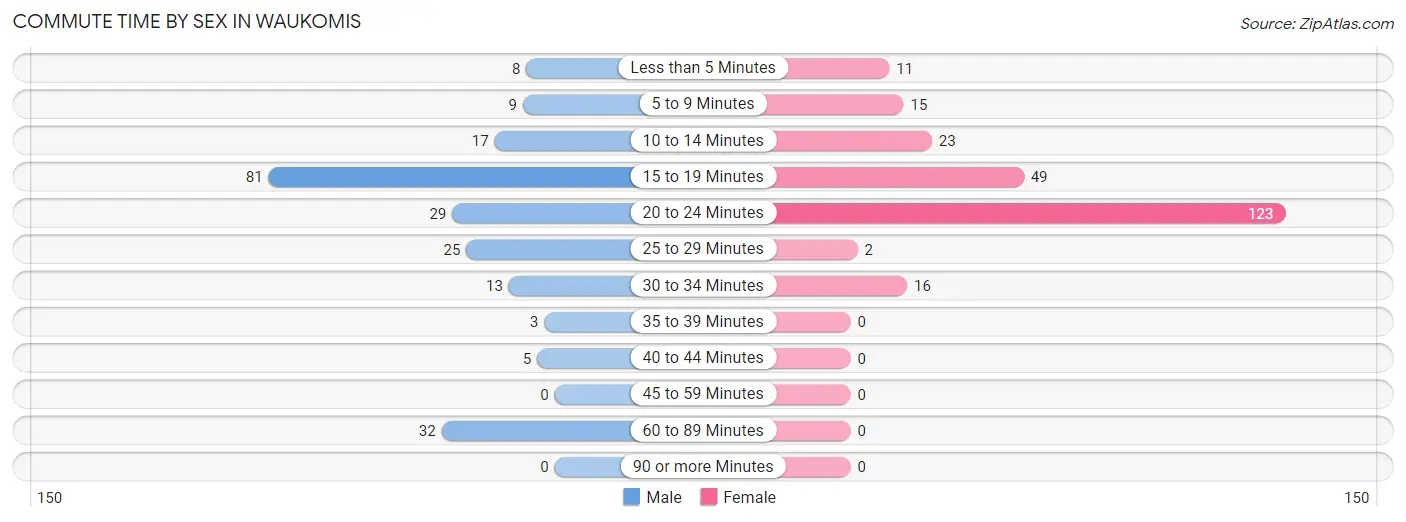
| Commute Time | Male | Female |
| Less than 5 Minutes | 8 (3.6%) | 11 (4.6%) |
| 5 to 9 Minutes | 9 (4.1%) | 15 (6.3%) |
| 10 to 14 Minutes | 17 (7.7%) | 23 (9.6%) |
| 15 to 19 Minutes | 81 (36.5%) | 49 (20.5%) |
| 20 to 24 Minutes | 29 (13.1%) | 123 (51.5%) |
| 25 to 29 Minutes | 25 (11.3%) | 2 (0.8%) |
| 30 to 34 Minutes | 13 (5.9%) | 16 (6.7%) |
| 35 to 39 Minutes | 3 (1.3%) | 0 (0.0%) |
| 40 to 44 Minutes | 5 (2.2%) | 0 (0.0%) |
| 45 to 59 Minutes | 0 (0.0%) | 0 (0.0%) |
| 60 to 89 Minutes | 32 (14.4%) | 0 (0.0%) |
| 90 or more Minutes | 0 (0.0%) | 0 (0.0%) |
Time of Departure to Work by Sex in Waukomis
The most frequent times of departure to work in Waukomis are 12:00 AM to 4:59 AM (51, 23.0%) for males and 7:30 AM to 7:59 AM (52, 21.8%) for females.
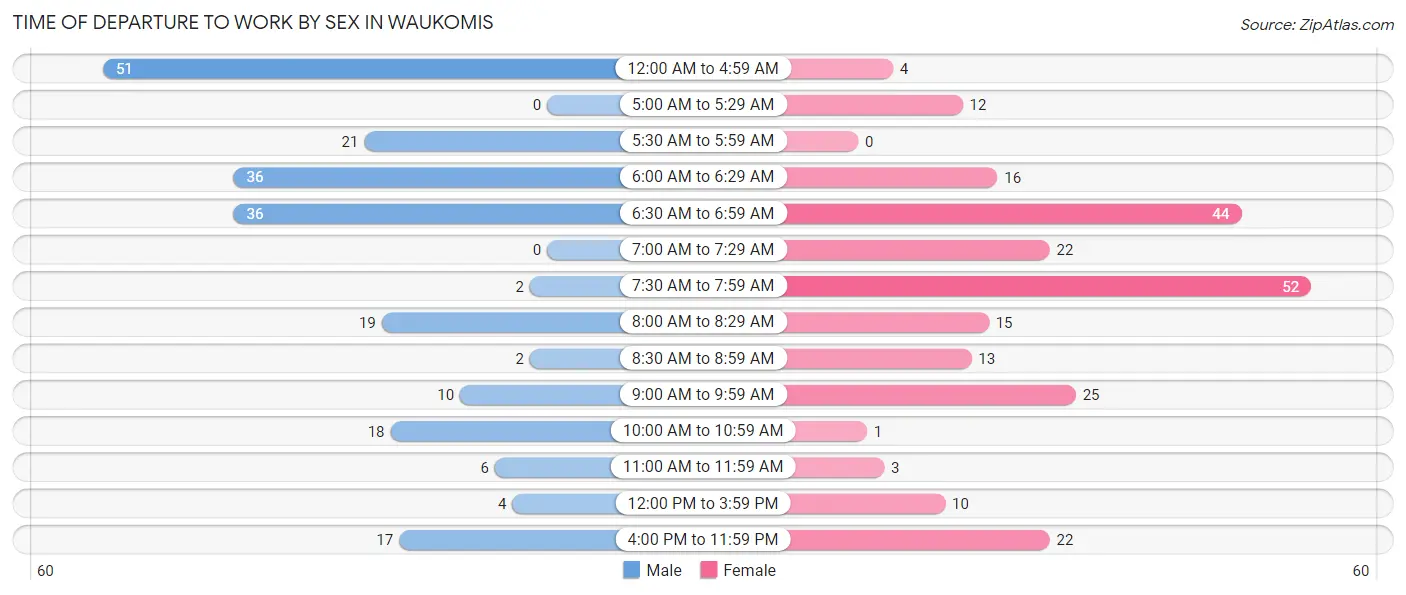
| Time of Departure | Male | Female |
| 12:00 AM to 4:59 AM | 51 (23.0%) | 4 (1.7%) |
| 5:00 AM to 5:29 AM | 0 (0.0%) | 12 (5.0%) |
| 5:30 AM to 5:59 AM | 21 (9.5%) | 0 (0.0%) |
| 6:00 AM to 6:29 AM | 36 (16.2%) | 16 (6.7%) |
| 6:30 AM to 6:59 AM | 36 (16.2%) | 44 (18.4%) |
| 7:00 AM to 7:29 AM | 0 (0.0%) | 22 (9.2%) |
| 7:30 AM to 7:59 AM | 2 (0.9%) | 52 (21.8%) |
| 8:00 AM to 8:29 AM | 19 (8.6%) | 15 (6.3%) |
| 8:30 AM to 8:59 AM | 2 (0.9%) | 13 (5.4%) |
| 9:00 AM to 9:59 AM | 10 (4.5%) | 25 (10.5%) |
| 10:00 AM to 10:59 AM | 18 (8.1%) | 1 (0.4%) |
| 11:00 AM to 11:59 AM | 6 (2.7%) | 3 (1.3%) |
| 12:00 PM to 3:59 PM | 4 (1.8%) | 10 (4.2%) |
| 4:00 PM to 11:59 PM | 17 (7.7%) | 22 (9.2%) |
| Total | 222 (100.0%) | 239 (100.0%) |
Housing Occupancy in Waukomis
Occupancy by Ownership in Waukomis
Of the total 449 dwellings in Waukomis, owner-occupied units account for 407 (90.6%), while renter-occupied units make up 42 (9.3%).
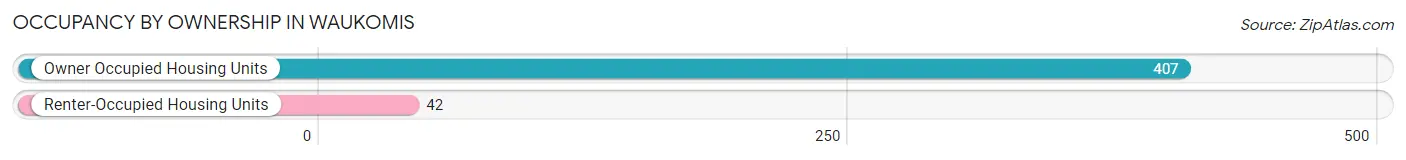
| Occupancy | # Housing Units | % Housing Units |
| Owner Occupied Housing Units | 407 | 90.6% |
| Renter-Occupied Housing Units | 42 | 9.3% |
| Total Occupied Housing Units | 449 | 100.0% |
Occupancy by Household Size in Waukomis
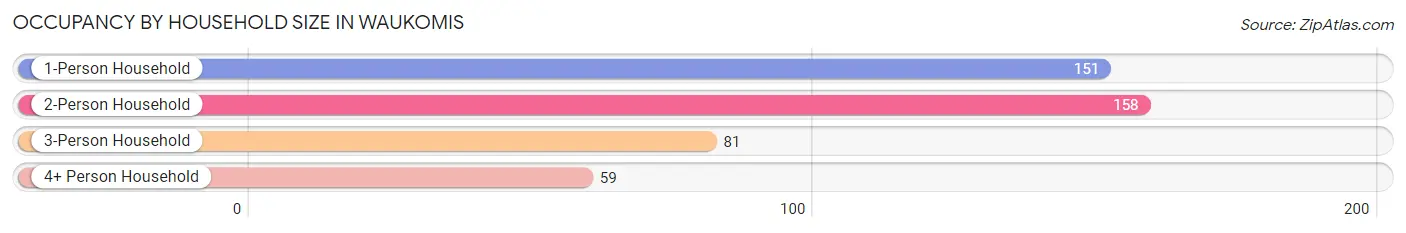
| Household Size | # Housing Units | % Housing Units |
| 1-Person Household | 151 | 33.6% |
| 2-Person Household | 158 | 35.2% |
| 3-Person Household | 81 | 18.0% |
| 4+ Person Household | 59 | 13.1% |
| Total Housing Units | 449 | 100.0% |
Occupancy by Ownership by Household Size in Waukomis
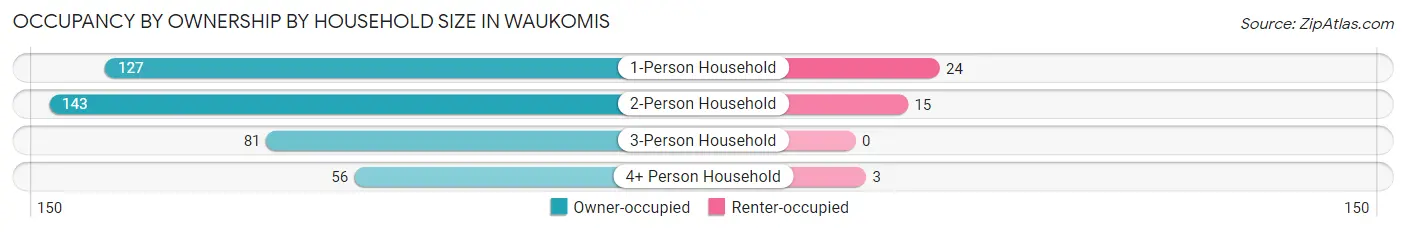
| Household Size | Owner-occupied | Renter-occupied |
| 1-Person Household | 127 (84.1%) | 24 (15.9%) |
| 2-Person Household | 143 (90.5%) | 15 (9.5%) |
| 3-Person Household | 81 (100.0%) | 0 (0.0%) |
| 4+ Person Household | 56 (94.9%) | 3 (5.1%) |
| Total Housing Units | 407 (90.6%) | 42 (9.3%) |
Occupancy by Educational Attainment in Waukomis
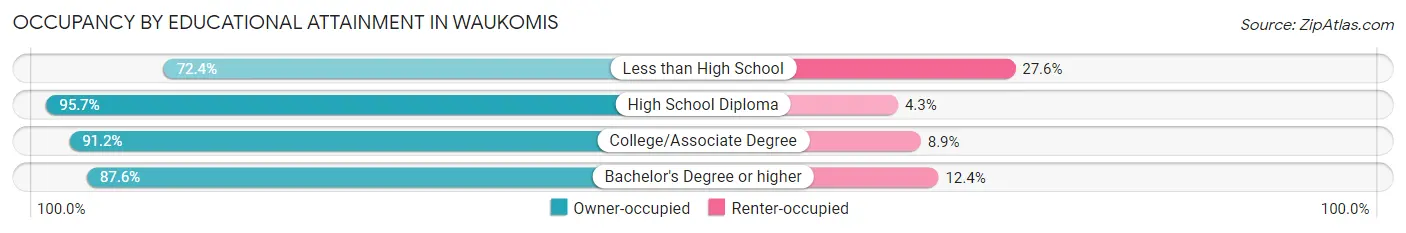
| Household Size | Owner-occupied | Renter-occupied |
| Less than High School | 21 (72.4%) | 8 (27.6%) |
| High School Diploma | 133 (95.7%) | 6 (4.3%) |
| College/Associate Degree | 175 (91.1%) | 17 (8.8%) |
| Bachelor's Degree or higher | 78 (87.6%) | 11 (12.4%) |
Occupancy by Age of Householder in Waukomis
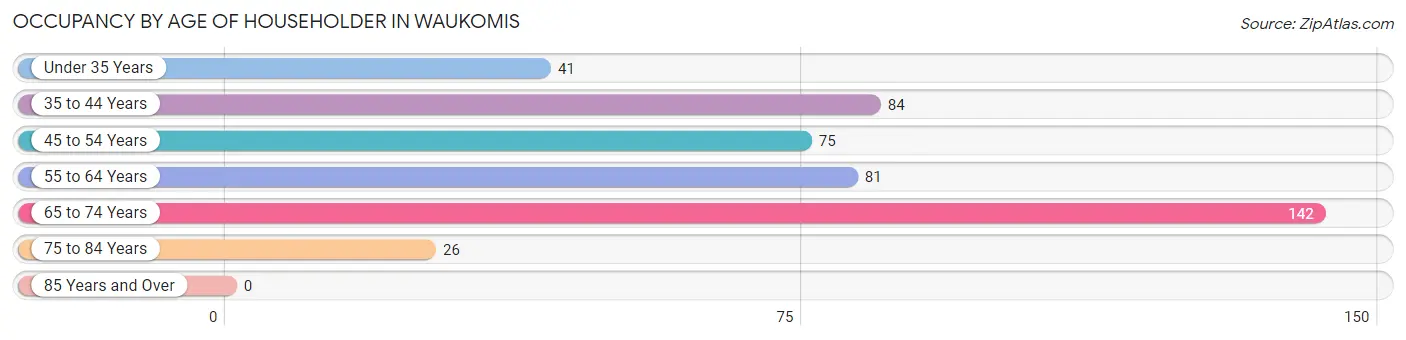
| Age Bracket | # Households | % Households |
| Under 35 Years | 41 | 9.1% |
| 35 to 44 Years | 84 | 18.7% |
| 45 to 54 Years | 75 | 16.7% |
| 55 to 64 Years | 81 | 18.0% |
| 65 to 74 Years | 142 | 31.6% |
| 75 to 84 Years | 26 | 5.8% |
| 85 Years and Over | 0 | 0.0% |
| Total | 449 | 100.0% |
Housing Finances in Waukomis
Median Income by Occupancy in Waukomis
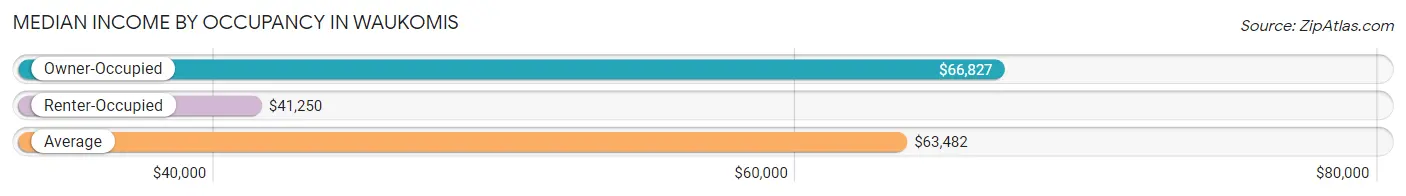
| Occupancy Type | # Households | Median Income |
| Owner-Occupied | 407 (90.6%) | $66,827 |
| Renter-Occupied | 42 (9.3%) | $41,250 |
| Average | 449 (100.0%) | $63,482 |
Occupancy by Householder Income Bracket in Waukomis
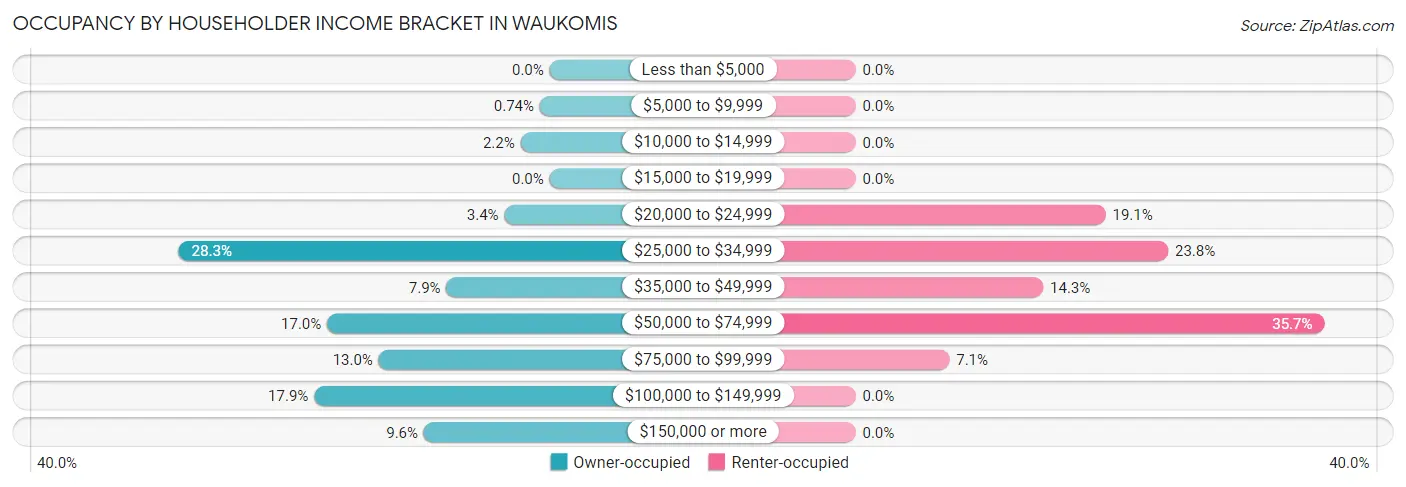
| Income Bracket | Owner-occupied | Renter-occupied |
| Less than $5,000 | 0 (0.0%) | 0 (0.0%) |
| $5,000 to $9,999 | 3 (0.7%) | 0 (0.0%) |
| $10,000 to $14,999 | 9 (2.2%) | 0 (0.0%) |
| $15,000 to $19,999 | 0 (0.0%) | 0 (0.0%) |
| $20,000 to $24,999 | 14 (3.4%) | 8 (19.1%) |
| $25,000 to $34,999 | 115 (28.3%) | 10 (23.8%) |
| $35,000 to $49,999 | 32 (7.9%) | 6 (14.3%) |
| $50,000 to $74,999 | 69 (17.0%) | 15 (35.7%) |
| $75,000 to $99,999 | 53 (13.0%) | 3 (7.1%) |
| $100,000 to $149,999 | 73 (17.9%) | 0 (0.0%) |
| $150,000 or more | 39 (9.6%) | 0 (0.0%) |
| Total | 407 (100.0%) | 42 (100.0%) |
Monthly Housing Cost Tiers in Waukomis
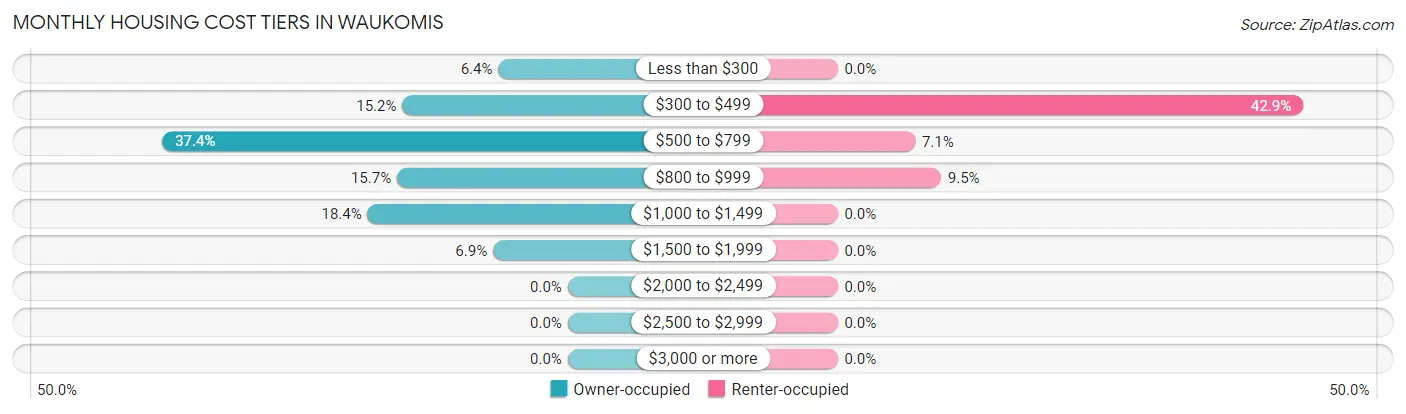
| Monthly Cost | Owner-occupied | Renter-occupied |
| Less than $300 | 26 (6.4%) | 0 (0.0%) |
| $300 to $499 | 62 (15.2%) | 18 (42.9%) |
| $500 to $799 | 152 (37.3%) | 3 (7.1%) |
| $800 to $999 | 64 (15.7%) | 4 (9.5%) |
| $1,000 to $1,499 | 75 (18.4%) | 0 (0.0%) |
| $1,500 to $1,999 | 28 (6.9%) | 0 (0.0%) |
| $2,000 to $2,499 | 0 (0.0%) | 0 (0.0%) |
| $2,500 to $2,999 | 0 (0.0%) | 0 (0.0%) |
| $3,000 or more | 0 (0.0%) | 0 (0.0%) |
| Total | 407 (100.0%) | 42 (100.0%) |
Physical Housing Characteristics in Waukomis
Housing Structures in Waukomis
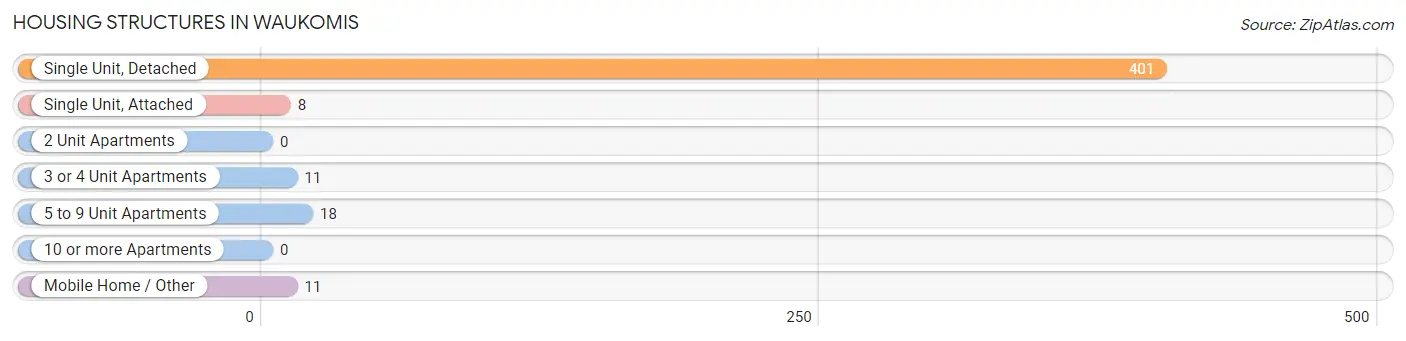
| Structure Type | # Housing Units | % Housing Units |
| Single Unit, Detached | 401 | 89.3% |
| Single Unit, Attached | 8 | 1.8% |
| 2 Unit Apartments | 0 | 0.0% |
| 3 or 4 Unit Apartments | 11 | 2.5% |
| 5 to 9 Unit Apartments | 18 | 4.0% |
| 10 or more Apartments | 0 | 0.0% |
| Mobile Home / Other | 11 | 2.5% |
| Total | 449 | 100.0% |
Housing Structures by Occupancy in Waukomis
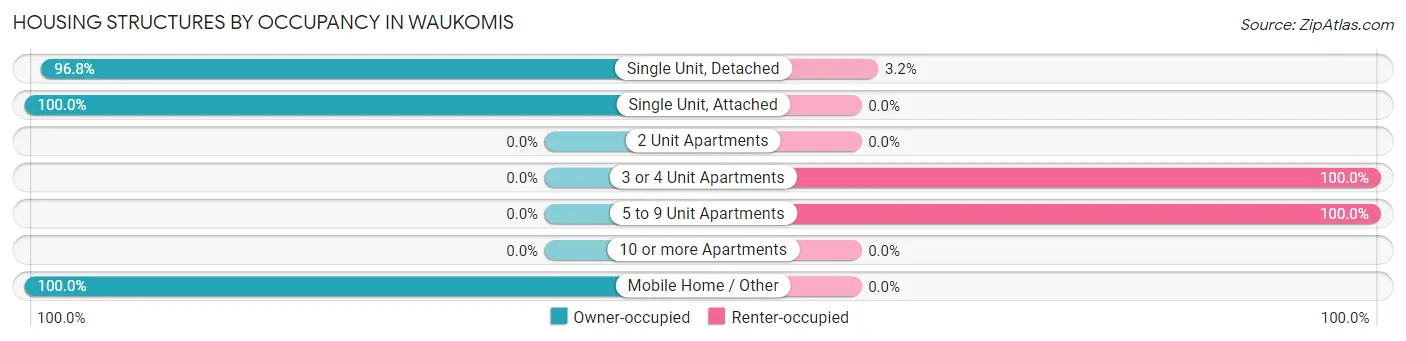
| Structure Type | Owner-occupied | Renter-occupied |
| Single Unit, Detached | 388 (96.8%) | 13 (3.2%) |
| Single Unit, Attached | 8 (100.0%) | 0 (0.0%) |
| 2 Unit Apartments | 0 (0.0%) | 0 (0.0%) |
| 3 or 4 Unit Apartments | 0 (0.0%) | 11 (100.0%) |
| 5 to 9 Unit Apartments | 0 (0.0%) | 18 (100.0%) |
| 10 or more Apartments | 0 (0.0%) | 0 (0.0%) |
| Mobile Home / Other | 11 (100.0%) | 0 (0.0%) |
| Total | 407 (90.6%) | 42 (9.3%) |
Housing Structures by Number of Rooms in Waukomis
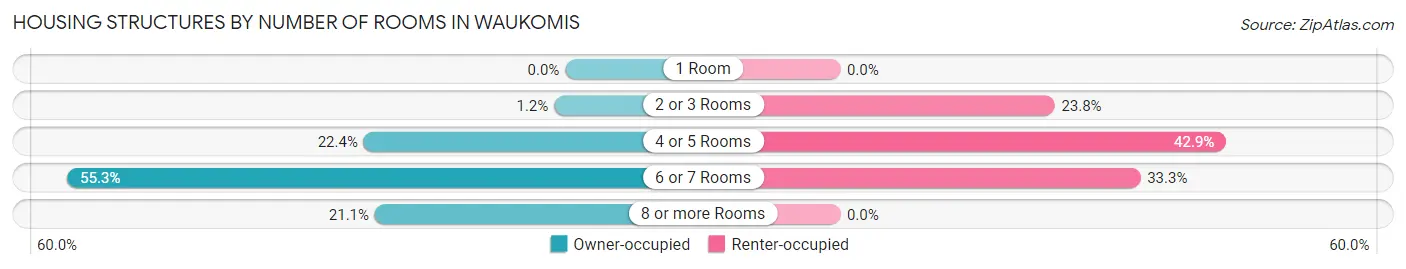
| Number of Rooms | Owner-occupied | Renter-occupied |
| 1 Room | 0 (0.0%) | 0 (0.0%) |
| 2 or 3 Rooms | 5 (1.2%) | 10 (23.8%) |
| 4 or 5 Rooms | 91 (22.4%) | 18 (42.9%) |
| 6 or 7 Rooms | 225 (55.3%) | 14 (33.3%) |
| 8 or more Rooms | 86 (21.1%) | 0 (0.0%) |
| Total | 407 (100.0%) | 42 (100.0%) |
Housing Structure by Heating Type in Waukomis
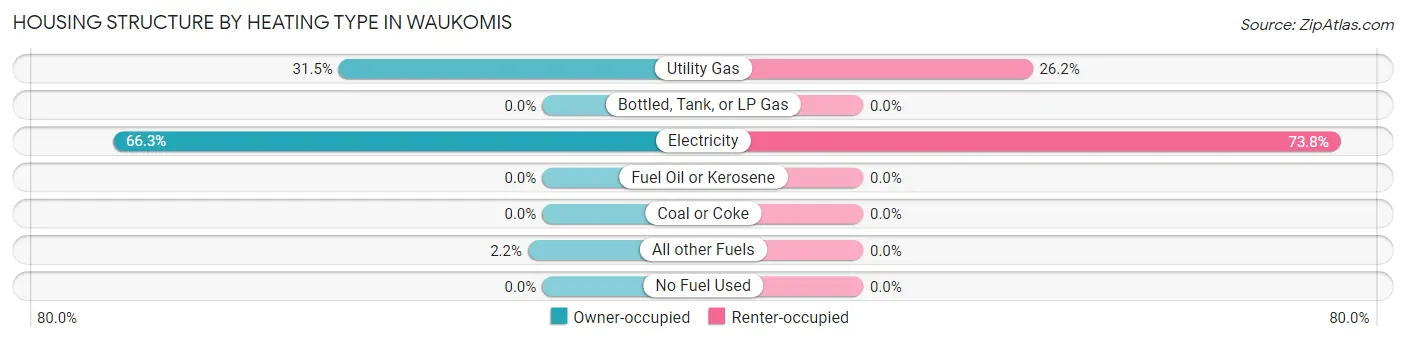
| Heating Type | Owner-occupied | Renter-occupied |
| Utility Gas | 128 (31.5%) | 11 (26.2%) |
| Bottled, Tank, or LP Gas | 0 (0.0%) | 0 (0.0%) |
| Electricity | 270 (66.3%) | 31 (73.8%) |
| Fuel Oil or Kerosene | 0 (0.0%) | 0 (0.0%) |
| Coal or Coke | 0 (0.0%) | 0 (0.0%) |
| All other Fuels | 9 (2.2%) | 0 (0.0%) |
| No Fuel Used | 0 (0.0%) | 0 (0.0%) |
| Total | 407 (100.0%) | 42 (100.0%) |
Household Vehicle Usage in Waukomis
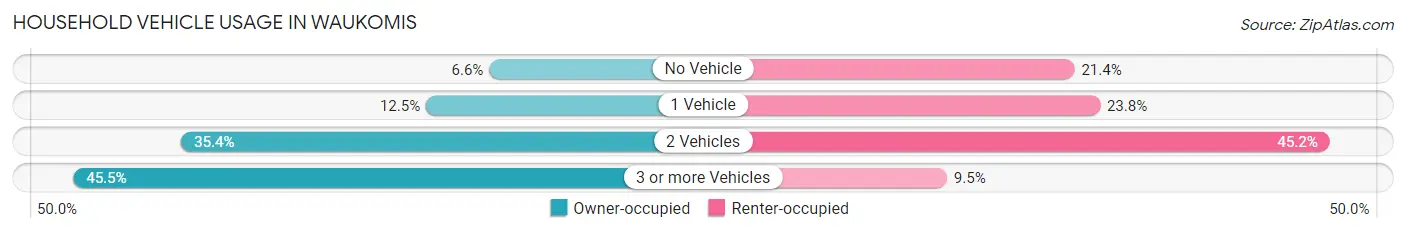
| Vehicles per Household | Owner-occupied | Renter-occupied |
| No Vehicle | 27 (6.6%) | 9 (21.4%) |
| 1 Vehicle | 51 (12.5%) | 10 (23.8%) |
| 2 Vehicles | 144 (35.4%) | 19 (45.2%) |
| 3 or more Vehicles | 185 (45.5%) | 4 (9.5%) |
| Total | 407 (100.0%) | 42 (100.0%) |
Real Estate & Mortgages in Waukomis
Real Estate and Mortgage Overview in Waukomis
| Characteristic | Without Mortgage | With Mortgage |
| Housing Units | 203 | 204 |
| Median Property Value | $128,100 | $108,300 |
| Median Household Income | - | - |
| Monthly Housing Costs | $569 | $0 |
| Real Estate Taxes | $675 | $9 |
Property Value by Mortgage Status in Waukomis
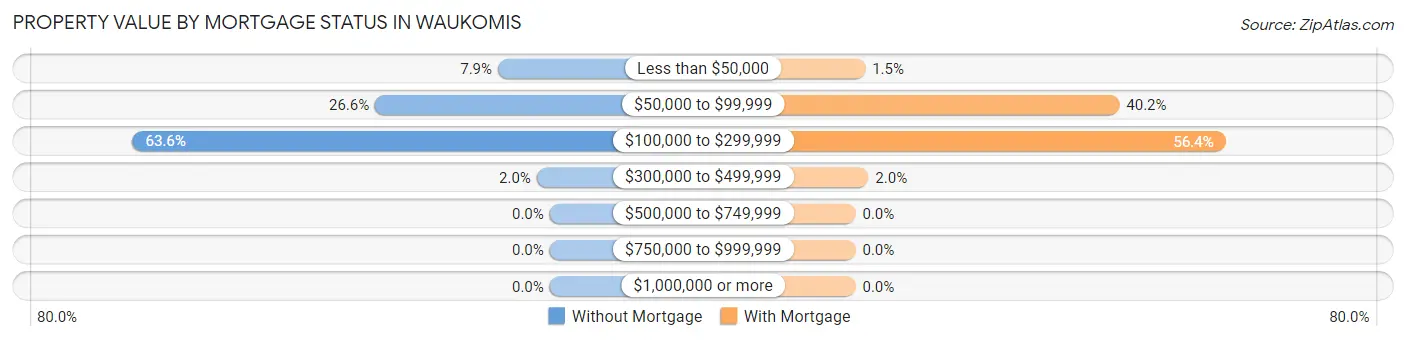
| Property Value | Without Mortgage | With Mortgage |
| Less than $50,000 | 16 (7.9%) | 3 (1.5%) |
| $50,000 to $99,999 | 54 (26.6%) | 82 (40.2%) |
| $100,000 to $299,999 | 129 (63.5%) | 115 (56.4%) |
| $300,000 to $499,999 | 4 (2.0%) | 4 (2.0%) |
| $500,000 to $749,999 | 0 (0.0%) | 0 (0.0%) |
| $750,000 to $999,999 | 0 (0.0%) | 0 (0.0%) |
| $1,000,000 or more | 0 (0.0%) | 0 (0.0%) |
| Total | 203 (100.0%) | 204 (100.0%) |
Household Income by Mortgage Status in Waukomis
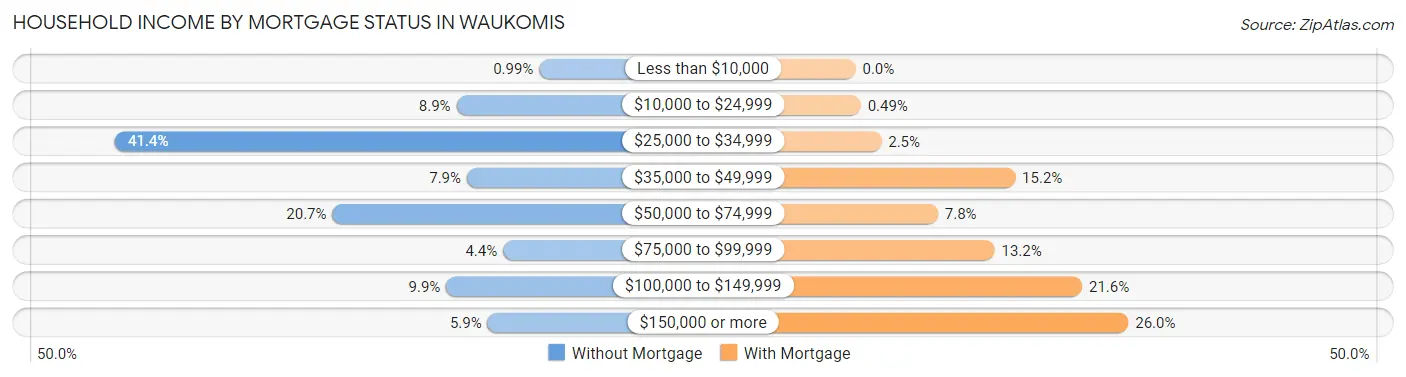
| Household Income | Without Mortgage | With Mortgage |
| Less than $10,000 | 2 (1.0%) | 0 (0.0%) |
| $10,000 to $24,999 | 18 (8.9%) | 1 (0.5%) |
| $25,000 to $34,999 | 84 (41.4%) | 5 (2.5%) |
| $35,000 to $49,999 | 16 (7.9%) | 31 (15.2%) |
| $50,000 to $74,999 | 42 (20.7%) | 16 (7.8%) |
| $75,000 to $99,999 | 9 (4.4%) | 27 (13.2%) |
| $100,000 to $149,999 | 20 (9.9%) | 44 (21.6%) |
| $150,000 or more | 12 (5.9%) | 53 (26.0%) |
| Total | 203 (100.0%) | 204 (100.0%) |
Property Value to Household Income Ratio in Waukomis
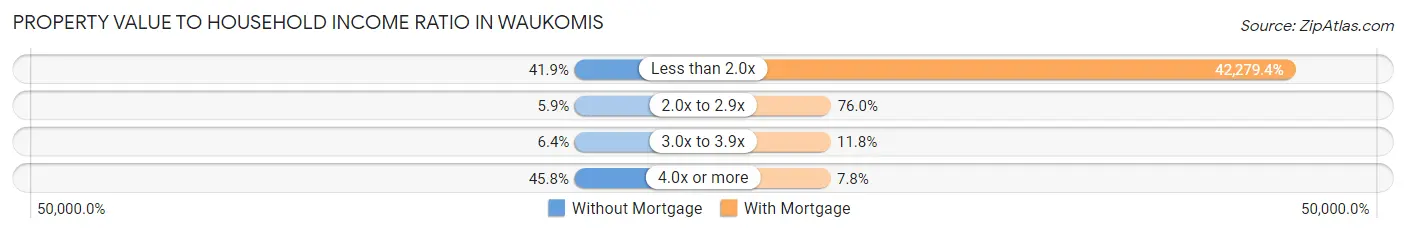
| Value-to-Income Ratio | Without Mortgage | With Mortgage |
| Less than 2.0x | 85 (41.9%) | 86,250 (42,279.4%) |
| 2.0x to 2.9x | 12 (5.9%) | 155 (76.0%) |
| 3.0x to 3.9x | 13 (6.4%) | 24 (11.8%) |
| 4.0x or more | 93 (45.8%) | 16 (7.8%) |
| Total | 203 (100.0%) | 204 (100.0%) |
Real Estate Taxes by Mortgage Status in Waukomis
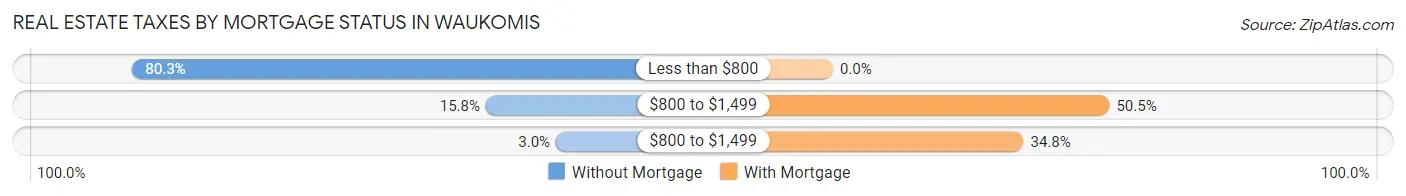
| Property Taxes | Without Mortgage | With Mortgage |
| Less than $800 | 163 (80.3%) | 0 (0.0%) |
| $800 to $1,499 | 32 (15.8%) | 103 (50.5%) |
| $800 to $1,499 | 6 (3.0%) | 71 (34.8%) |
| Total | 203 (100.0%) | 204 (100.0%) |
Health & Disability in Waukomis
Health Insurance Coverage by Age in Waukomis
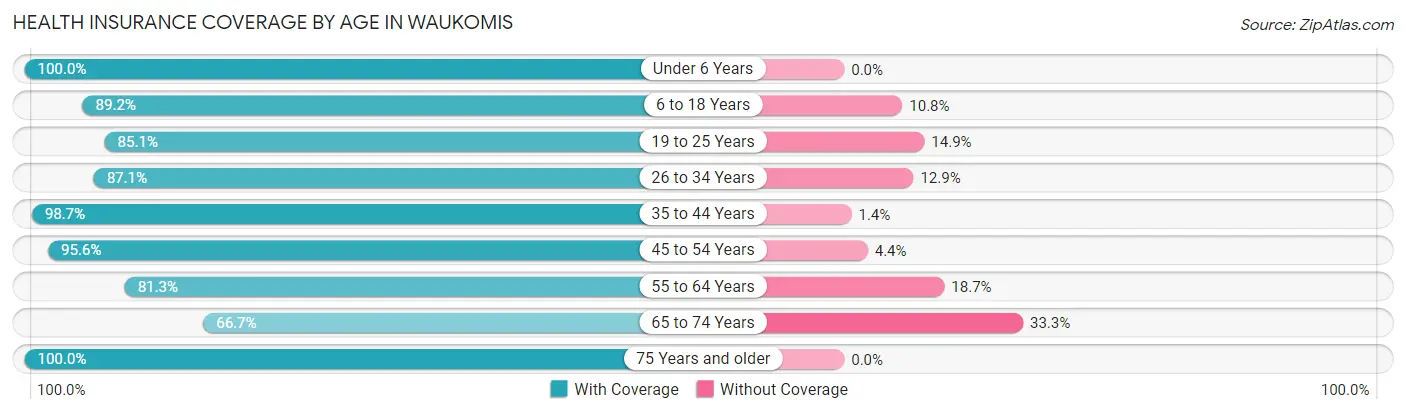
| Age Bracket | With Coverage | Without Coverage |
| Under 6 Years | 55 (100.0%) | 0 (0.0%) |
| 6 to 18 Years | 107 (89.2%) | 13 (10.8%) |
| 19 to 25 Years | 74 (85.1%) | 13 (14.9%) |
| 26 to 34 Years | 54 (87.1%) | 8 (12.9%) |
| 35 to 44 Years | 146 (98.7%) | 2 (1.3%) |
| 45 to 54 Years | 131 (95.6%) | 6 (4.4%) |
| 55 to 64 Years | 122 (81.3%) | 28 (18.7%) |
| 65 to 74 Years | 192 (66.7%) | 96 (33.3%) |
| 75 Years and older | 40 (100.0%) | 0 (0.0%) |
| Total | 921 (84.7%) | 166 (15.3%) |
Health Insurance Coverage by Citizenship Status in Waukomis
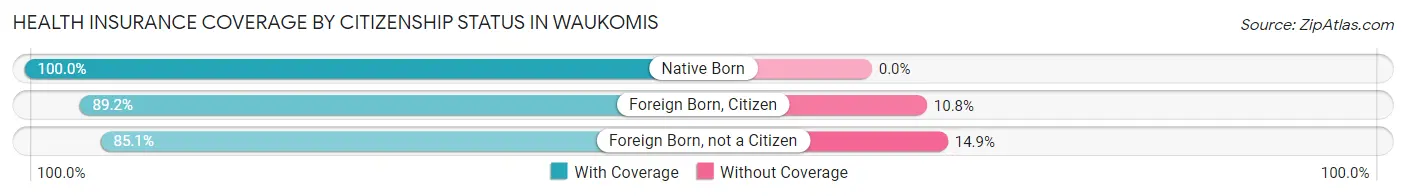
| Citizenship Status | With Coverage | Without Coverage |
| Native Born | 55 (100.0%) | 0 (0.0%) |
| Foreign Born, Citizen | 107 (89.2%) | 13 (10.8%) |
| Foreign Born, not a Citizen | 74 (85.1%) | 13 (14.9%) |
Health Insurance Coverage by Household Income in Waukomis
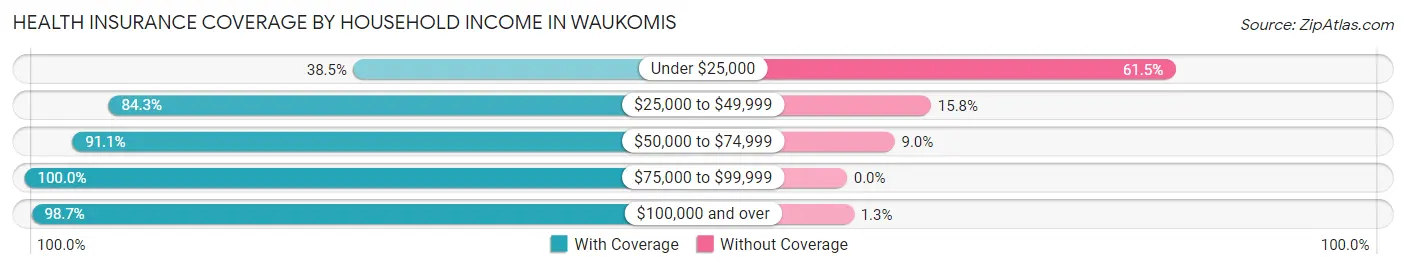
| Household Income | With Coverage | Without Coverage |
| Under $25,000 | 62 (38.5%) | 99 (61.5%) |
| $25,000 to $49,999 | 246 (84.3%) | 46 (15.8%) |
| $50,000 to $74,999 | 173 (91.0%) | 17 (8.9%) |
| $75,000 to $99,999 | 134 (100.0%) | 0 (0.0%) |
| $100,000 and over | 306 (98.7%) | 4 (1.3%) |
Public vs Private Health Insurance Coverage by Age in Waukomis
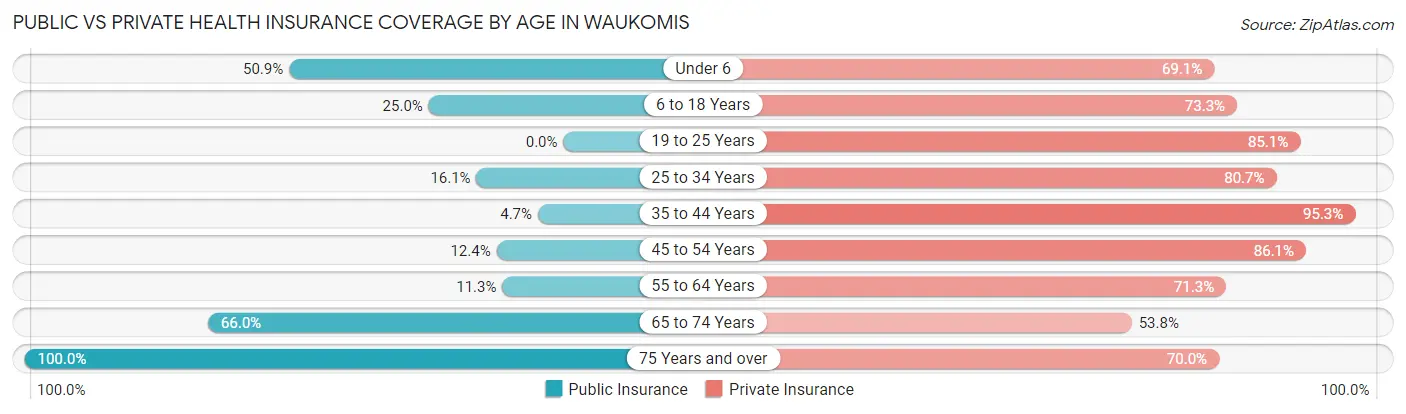
| Age Bracket | Public Insurance | Private Insurance |
| Under 6 | 28 (50.9%) | 38 (69.1%) |
| 6 to 18 Years | 30 (25.0%) | 88 (73.3%) |
| 19 to 25 Years | 0 (0.0%) | 74 (85.1%) |
| 25 to 34 Years | 10 (16.1%) | 50 (80.6%) |
| 35 to 44 Years | 7 (4.7%) | 141 (95.3%) |
| 45 to 54 Years | 17 (12.4%) | 118 (86.1%) |
| 55 to 64 Years | 17 (11.3%) | 107 (71.3%) |
| 65 to 74 Years | 190 (66.0%) | 155 (53.8%) |
| 75 Years and over | 40 (100.0%) | 28 (70.0%) |
| Total | 339 (31.2%) | 799 (73.5%) |
Disability Status by Sex by Age in Waukomis
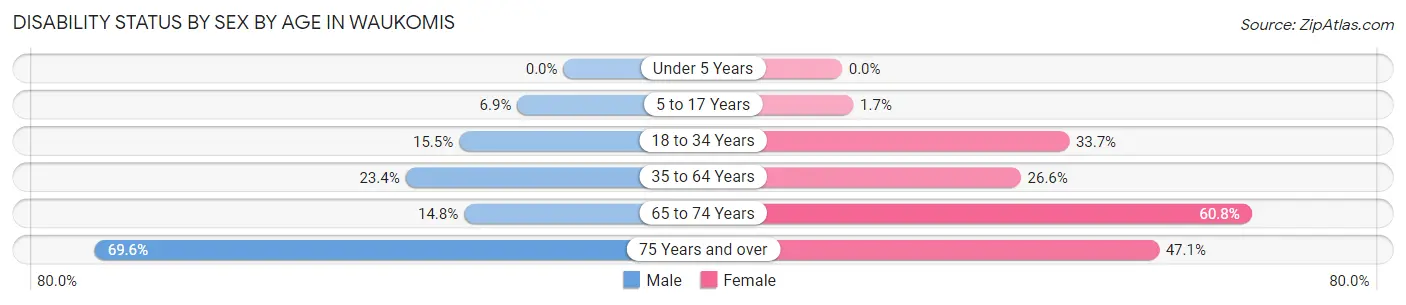
| Age Bracket | Male | Female |
| Under 5 Years | 0 (0.0%) | 0 (0.0%) |
| 5 to 17 Years | 5 (6.9%) | 1 (1.7%) |
| 18 to 34 Years | 11 (15.5%) | 28 (33.7%) |
| 35 to 64 Years | 49 (23.4%) | 60 (26.6%) |
| 65 to 74 Years | 18 (14.7%) | 101 (60.8%) |
| 75 Years and over | 16 (69.6%) | 8 (47.1%) |
Disability Class by Sex by Age in Waukomis
Disability Class: Hearing Difficulty
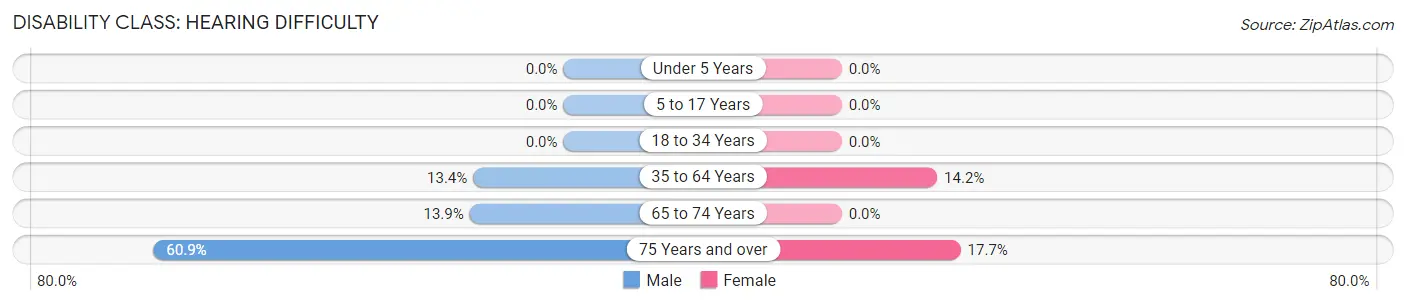
| Age Bracket | Male | Female |
| Under 5 Years | 0 (0.0%) | 0 (0.0%) |
| 5 to 17 Years | 0 (0.0%) | 0 (0.0%) |
| 18 to 34 Years | 0 (0.0%) | 0 (0.0%) |
| 35 to 64 Years | 28 (13.4%) | 32 (14.2%) |
| 65 to 74 Years | 17 (13.9%) | 0 (0.0%) |
| 75 Years and over | 14 (60.9%) | 3 (17.6%) |
Disability Class: Vision Difficulty
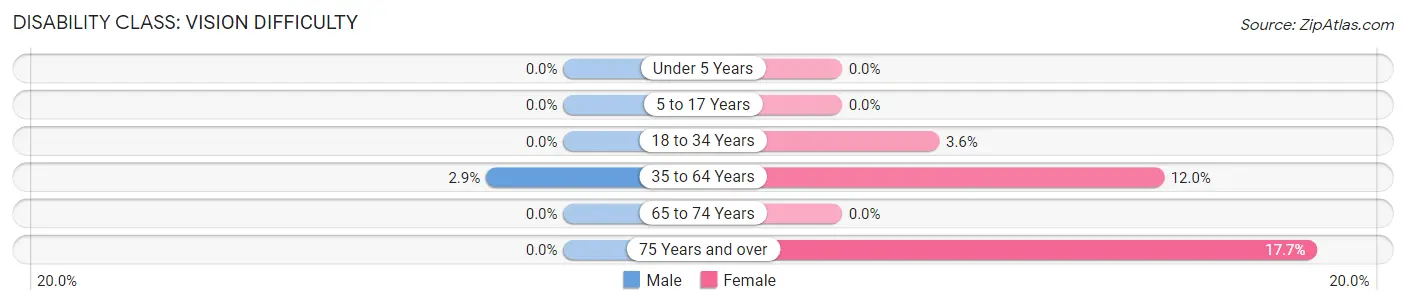
| Age Bracket | Male | Female |
| Under 5 Years | 0 (0.0%) | 0 (0.0%) |
| 5 to 17 Years | 0 (0.0%) | 0 (0.0%) |
| 18 to 34 Years | 0 (0.0%) | 3 (3.6%) |
| 35 to 64 Years | 6 (2.9%) | 27 (11.9%) |
| 65 to 74 Years | 0 (0.0%) | 0 (0.0%) |
| 75 Years and over | 0 (0.0%) | 3 (17.6%) |
Disability Class: Cognitive Difficulty
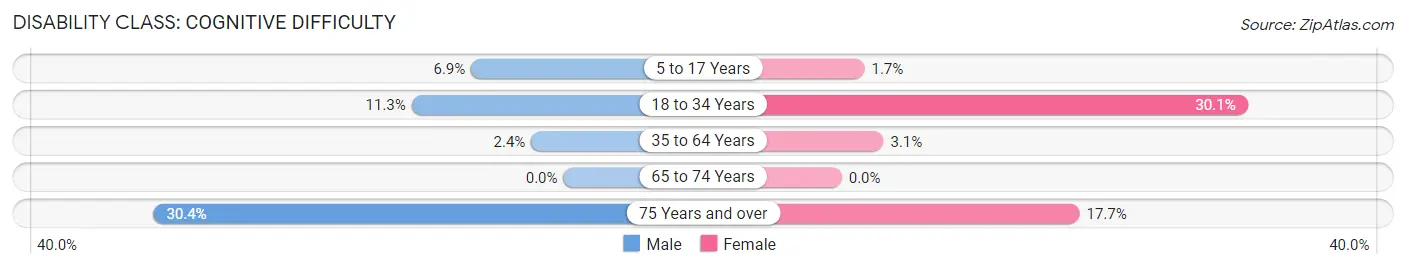
| Age Bracket | Male | Female |
| 5 to 17 Years | 5 (6.9%) | 1 (1.7%) |
| 18 to 34 Years | 8 (11.3%) | 25 (30.1%) |
| 35 to 64 Years | 5 (2.4%) | 7 (3.1%) |
| 65 to 74 Years | 0 (0.0%) | 0 (0.0%) |
| 75 Years and over | 7 (30.4%) | 3 (17.6%) |
Disability Class: Ambulatory Difficulty
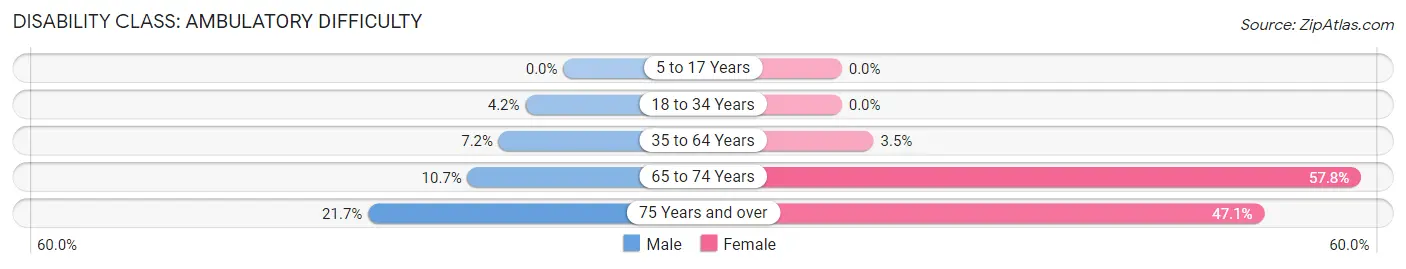
| Age Bracket | Male | Female |
| 5 to 17 Years | 0 (0.0%) | 0 (0.0%) |
| 18 to 34 Years | 3 (4.2%) | 0 (0.0%) |
| 35 to 64 Years | 15 (7.2%) | 8 (3.5%) |
| 65 to 74 Years | 13 (10.7%) | 96 (57.8%) |
| 75 Years and over | 5 (21.7%) | 8 (47.1%) |
Disability Class: Self-Care Difficulty
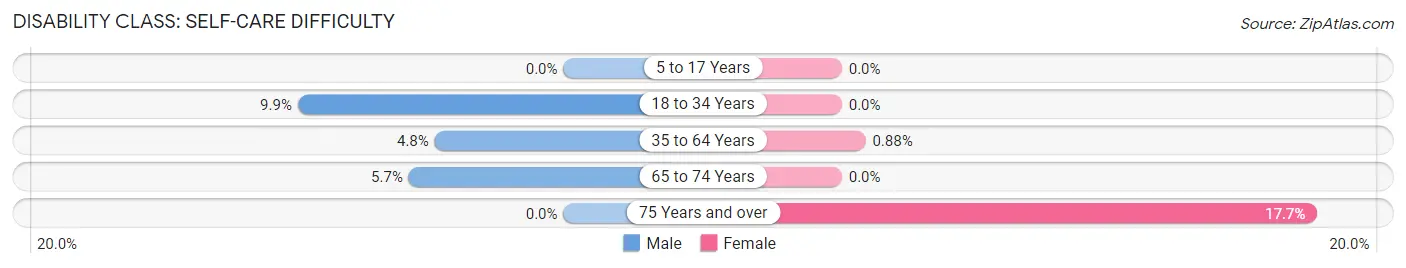
| Age Bracket | Male | Female |
| 5 to 17 Years | 0 (0.0%) | 0 (0.0%) |
| 18 to 34 Years | 7 (9.9%) | 0 (0.0%) |
| 35 to 64 Years | 10 (4.8%) | 2 (0.9%) |
| 65 to 74 Years | 7 (5.7%) | 0 (0.0%) |
| 75 Years and over | 0 (0.0%) | 3 (17.6%) |
Technology Access in Waukomis
Computing Device Access in Waukomis
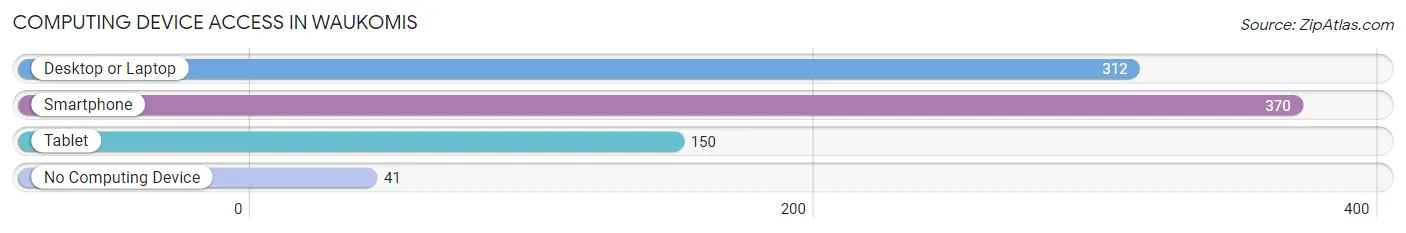
| Device Type | # Households | % Households |
| Desktop or Laptop | 312 | 69.5% |
| Smartphone | 370 | 82.4% |
| Tablet | 150 | 33.4% |
| No Computing Device | 41 | 9.1% |
| Total | 449 | 100.0% |
Internet Access in Waukomis
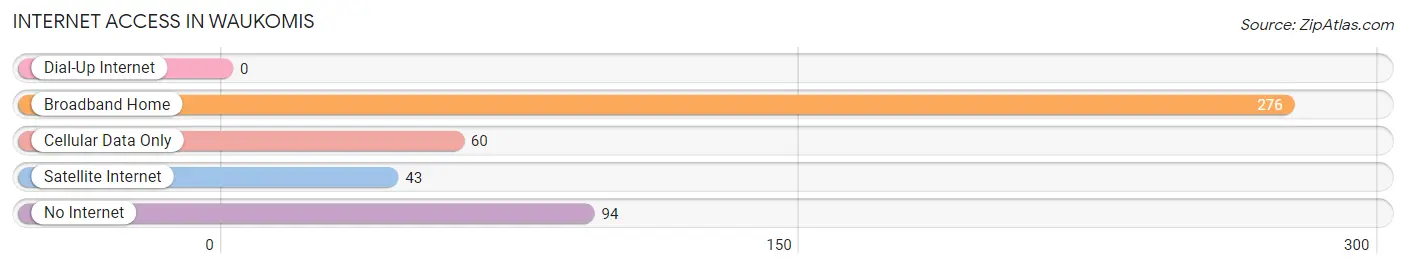
| Internet Type | # Households | % Households |
| Dial-Up Internet | 0 | 0.0% |
| Broadband Home | 276 | 61.5% |
| Cellular Data Only | 60 | 13.4% |
| Satellite Internet | 43 | 9.6% |
| No Internet | 94 | 20.9% |
| Total | 449 | 100.0% |
Waukomis Summary
Waukomis is a small town located in Garfield County, Oklahoma. It is situated in the northwest corner of the state, approximately 20 miles northwest of Enid. The town was founded in 1901 and was named after the Waukomis Indian tribe, which had inhabited the area for centuries.
Geography
Waukomis is located in the northwest corner of Oklahoma, approximately 20 miles northwest of Enid. The town is situated in the Red Bed Plains region of the state, which is characterized by rolling hills and flat plains. The town is located at an elevation of 1,068 feet above sea level. The climate in Waukomis is generally mild, with hot summers and cold winters. The average annual temperature is around 60 degrees Fahrenheit.
Demographics
As of the 2010 census, the population of Waukomis was 1,092. The racial makeup of the town was 95.2% White, 0.7% African American, 0.7% Native American, 0.2% Asian, 0.1% Pacific Islander, and 2.2% from other races. Hispanic or Latino of any race were 2.2% of the population.
Economy
The economy of Waukomis is largely based on agriculture. The town is home to several farms, which produce a variety of crops, including wheat, corn, soybeans, and hay. The town is also home to several businesses, including a grocery store, a hardware store, and a restaurant.
History
Waukomis was founded in 1901 by a group of settlers from Kansas. The town was named after the Waukomis Indian tribe, which had inhabited the area for centuries. The town grew quickly, and by 1910, it had a population of over 500.
In the early 20th century, Waukomis was a thriving agricultural community. The town was home to several grain elevators, a flour mill, and a cotton gin. The town also had a bank, a hotel, and several stores.
In the 1950s, the town began to decline as many of its residents moved away in search of better economic opportunities. By the 1970s, the population had dropped to just over 500.
In recent years, Waukomis has seen a resurgence in population and economic activity. The town is now home to several businesses, including a grocery store, a hardware store, and a restaurant. The town also has a post office, a library, and a museum.
Conclusion
Waukomis is a small town located in Garfield County, Oklahoma. It is situated in the northwest corner of the state, approximately 20 miles northwest of Enid. The town was founded in 1901 and was named after the Waukomis Indian tribe, which had inhabited the area for centuries. The town is located at an elevation of 1,068 feet above sea level and has a mild climate. As of the 2010 census, the population of Waukomis was 1,092. The economy of Waukomis is largely based on agriculture, and the town is home to several businesses. In recent years, Waukomis has seen a resurgence in population and economic activity.
Common Questions
What is Per Capita Income in Waukomis?
Per Capita income in Waukomis is $30,229.
What is the Median Family Income in Waukomis?
Median Family Income in Waukomis is $84,432.
What is the Median Household income in Waukomis?
Median Household Income in Waukomis is $63,482.
What is Income or Wage Gap in Waukomis?
Income or Wage Gap in Waukomis is 27.6%.
Women in Waukomis earn 72.4 cents for every dollar earned by a man.
What is Inequality or Gini Index in Waukomis?
Inequality or Gini Index in Waukomis is 0.38.
What is the Total Population of Waukomis?
Total Population of Waukomis is 1,087.
What is the Total Male Population of Waukomis?
Total Male Population of Waukomis is 530.
What is the Total Female Population of Waukomis?
Total Female Population of Waukomis is 557.
What is the Ratio of Males per 100 Females in Waukomis?
There are 95.15 Males per 100 Females in Waukomis.
What is the Ratio of Females per 100 Males in Waukomis?
There are 105.09 Females per 100 Males in Waukomis.
What is the Median Population Age in Waukomis?
Median Population Age in Waukomis is 48.8 Years.
What is the Average Family Size in Waukomis
Average Family Size in Waukomis is 3.1 People.
What is the Average Household Size in Waukomis
Average Household Size in Waukomis is 2.4 People.
How Large is the Labor Force in Waukomis?
There are 519 People in the Labor Forcein in Waukomis.
What is the Percentage of People in the Labor Force in Waukomis?
55.0% of People are in the Labor Force in Waukomis.
What is the Unemployment Rate in Waukomis?
Unemployment Rate in Waukomis is 3.1%.