Watts, OK Map & Demographics
Watts Map
Watts Overview
$14,704
PER CAPITA INCOME
$57,708
AVG FAMILY INCOME
$35,000
AVG HOUSEHOLD INCOME
0.39
INEQUALITY / GINI INDEX
257
TOTAL POPULATION
105
MALE POPULATION
152
FEMALE POPULATION
69.08
MALES / 100 FEMALES
144.76
FEMALES / 100 MALES
32.6
MEDIAN AGE
3.9
AVG FAMILY SIZE
2.6
AVG HOUSEHOLD SIZE
76
LABOR FORCE [ PEOPLE ]
43.4%
PERCENT IN LABOR FORCE
Watts Zip Codes
Watts Area Codes
Income in Watts
Income Overview in Watts
Per Capita Income in Watts is $14,704, while median incomes of families and households are $57,708 and $35,000 respectively.
| Characteristic | Number | Measure |
| Per Capita Income | 257 | $14,704 |
| Median Family Income | 50 | $57,708 |
| Mean Family Income | 50 | $50,706 |
| Median Household Income | 100 | $35,000 |
| Mean Household Income | 100 | $39,898 |
| Income Deficit | 50 | $0 |
| Wage / Income Gap (%) | 257 | 0.00% |
| Wage / Income Gap ($) | 257 | 100.00¢ per $1 |
| Gini / Inequality Index | 257 | 0.39 |
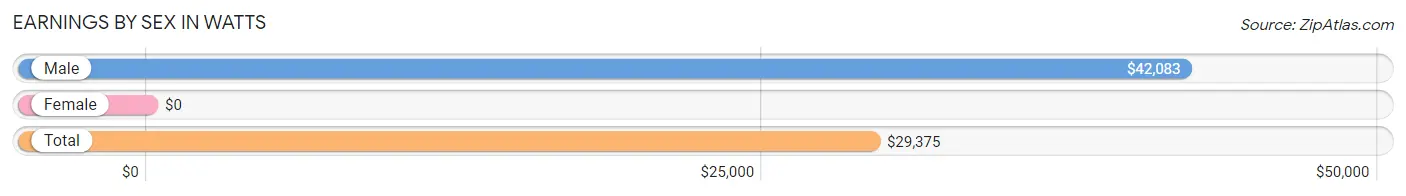
Earnings by Sex in Watts
| Sex | Number | Average Earnings |
| Male | 44 (50.6%) | $42,083 |
| Female | 43 (49.4%) | $0 |
| Total | 87 (100.0%) | $29,375 |
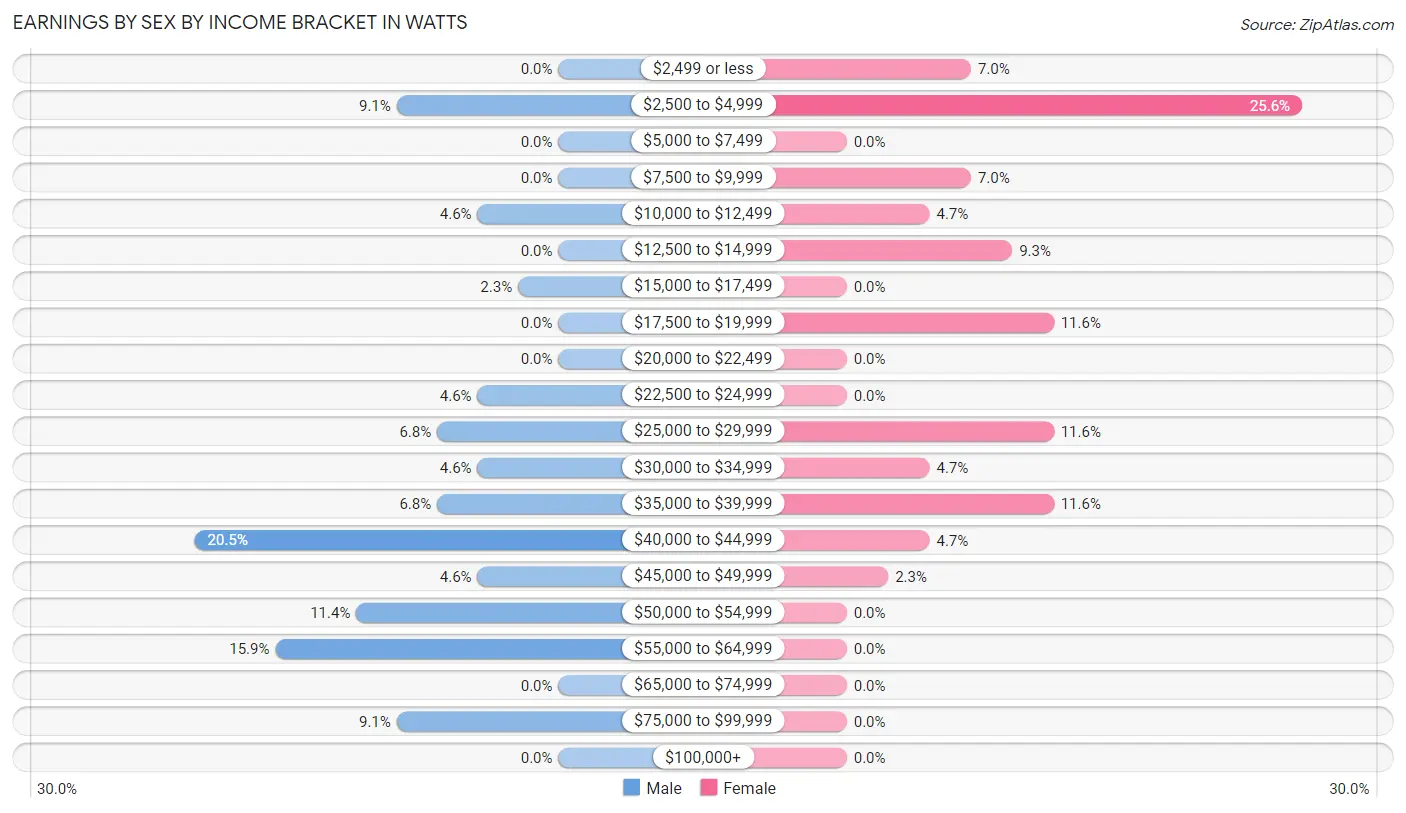
Earnings by Sex by Income Bracket in Watts
The most common earnings brackets in Watts are $40,000 to $44,999 for men (9 | 20.4%) and $2,500 to $4,999 for women (11 | 25.6%).
| Income | Male | Female |
| $2,499 or less | 0 (0.0%) | 3 (7.0%) |
| $2,500 to $4,999 | 4 (9.1%) | 11 (25.6%) |
| $5,000 to $7,499 | 0 (0.0%) | 0 (0.0%) |
| $7,500 to $9,999 | 0 (0.0%) | 3 (7.0%) |
| $10,000 to $12,499 | 2 (4.5%) | 2 (4.6%) |
| $12,500 to $14,999 | 0 (0.0%) | 4 (9.3%) |
| $15,000 to $17,499 | 1 (2.3%) | 0 (0.0%) |
| $17,500 to $19,999 | 0 (0.0%) | 5 (11.6%) |
| $20,000 to $22,499 | 0 (0.0%) | 0 (0.0%) |
| $22,500 to $24,999 | 2 (4.5%) | 0 (0.0%) |
| $25,000 to $29,999 | 3 (6.8%) | 5 (11.6%) |
| $30,000 to $34,999 | 2 (4.5%) | 2 (4.6%) |
| $35,000 to $39,999 | 3 (6.8%) | 5 (11.6%) |
| $40,000 to $44,999 | 9 (20.4%) | 2 (4.6%) |
| $45,000 to $49,999 | 2 (4.5%) | 1 (2.3%) |
| $50,000 to $54,999 | 5 (11.4%) | 0 (0.0%) |
| $55,000 to $64,999 | 7 (15.9%) | 0 (0.0%) |
| $65,000 to $74,999 | 0 (0.0%) | 0 (0.0%) |
| $75,000 to $99,999 | 4 (9.1%) | 0 (0.0%) |
| $100,000+ | 0 (0.0%) | 0 (0.0%) |
| Total | 44 (100.0%) | 43 (100.0%) |
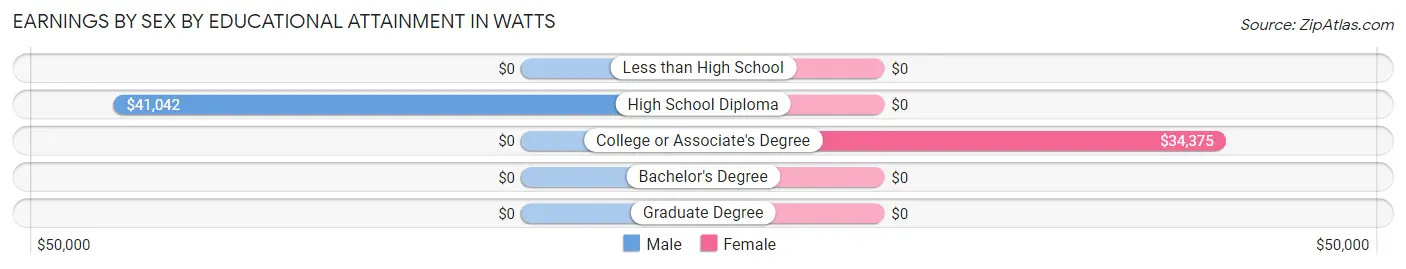
Earnings by Sex by Educational Attainment in Watts
| Educational Attainment | Male Income | Female Income |
| Less than High School | - | - |
| High School Diploma | $41,042 | $0 |
| College or Associate's Degree | - | - |
| Bachelor's Degree | - | - |
| Graduate Degree | - | - |
| Total | $42,500 | $0 |
Family Income in Watts
Family Income Brackets in Watts
According to the Watts family income data, there are 16 families falling into the $50,000 to $74,999 income range, which is the most common income bracket and makes up 32.0% of all families.
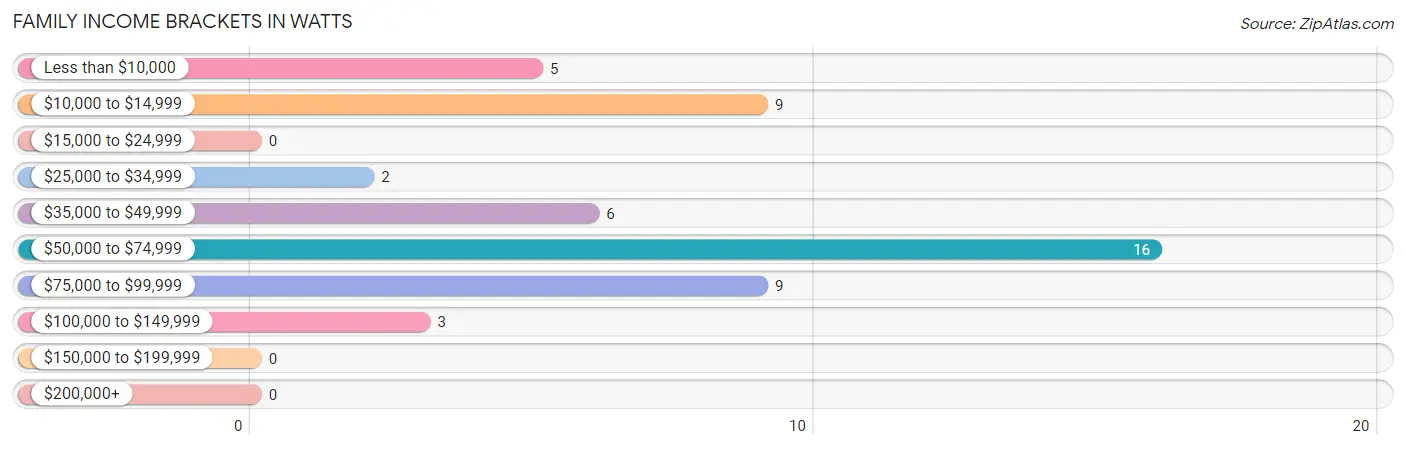
| Income Bracket | # Families | % Families |
| Less than $10,000 | 5 | 10.0% |
| $10,000 to $14,999 | 9 | 18.0% |
| $15,000 to $24,999 | 0 | 0.0% |
| $25,000 to $34,999 | 2 | 4.0% |
| $35,000 to $49,999 | 6 | 12.0% |
| $50,000 to $74,999 | 16 | 32.0% |
| $75,000 to $99,999 | 9 | 18.0% |
| $100,000 to $149,999 | 3 | 6.0% |
| $150,000 to $199,999 | 0 | 0.0% |
| $200,000+ | 0 | 0.0% |
Family Income by Famaliy Size in Watts
6-person families (9 | 18.0%) account for the highest median family income in Watts with $76,250 per family, while 6-person families (9 | 18.0%) have the highest median income of $12,708 per family member.
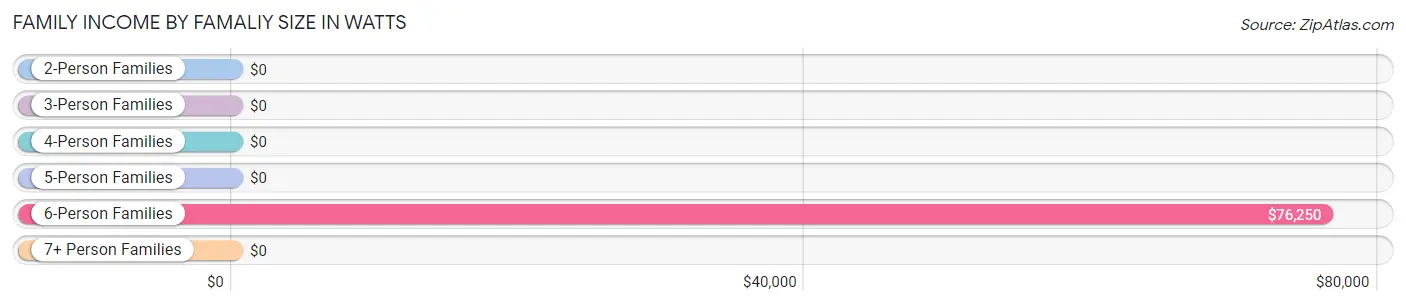
| Income Bracket | # Families | Median Income |
| 2-Person Families | 21 (42.0%) | $0 |
| 3-Person Families | 7 (14.0%) | $0 |
| 4-Person Families | 10 (20.0%) | $0 |
| 5-Person Families | 2 (4.0%) | $0 |
| 6-Person Families | 9 (18.0%) | $76,250 |
| 7+ Person Families | 1 (2.0%) | $0 |
| Total | 50 (100.0%) | $57,708 |
Family Income by Number of Earners in Watts
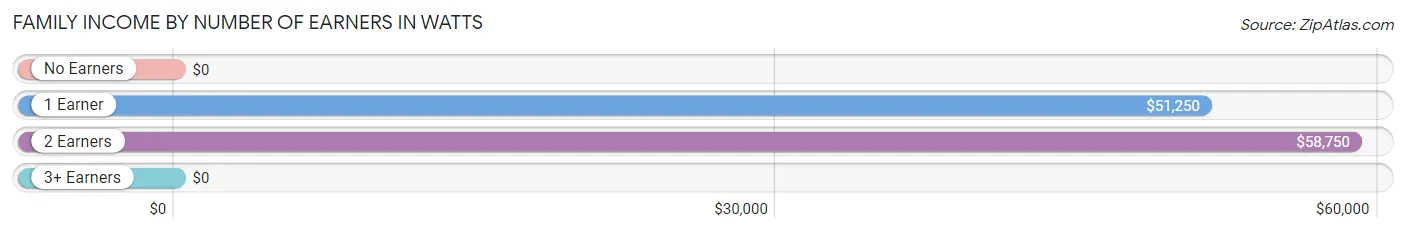
| Number of Earners | # Families | Median Income |
| No Earners | 8 (16.0%) | $0 |
| 1 Earner | 24 (48.0%) | $51,250 |
| 2 Earners | 16 (32.0%) | $58,750 |
| 3+ Earners | 2 (4.0%) | $0 |
| Total | 50 (100.0%) | $57,708 |
Household Income in Watts
Household Income Brackets in Watts
With 22 households falling in the category, the $10,000 to $14,999 income range is the most frequent in Watts, accounting for 22.0% of all households.
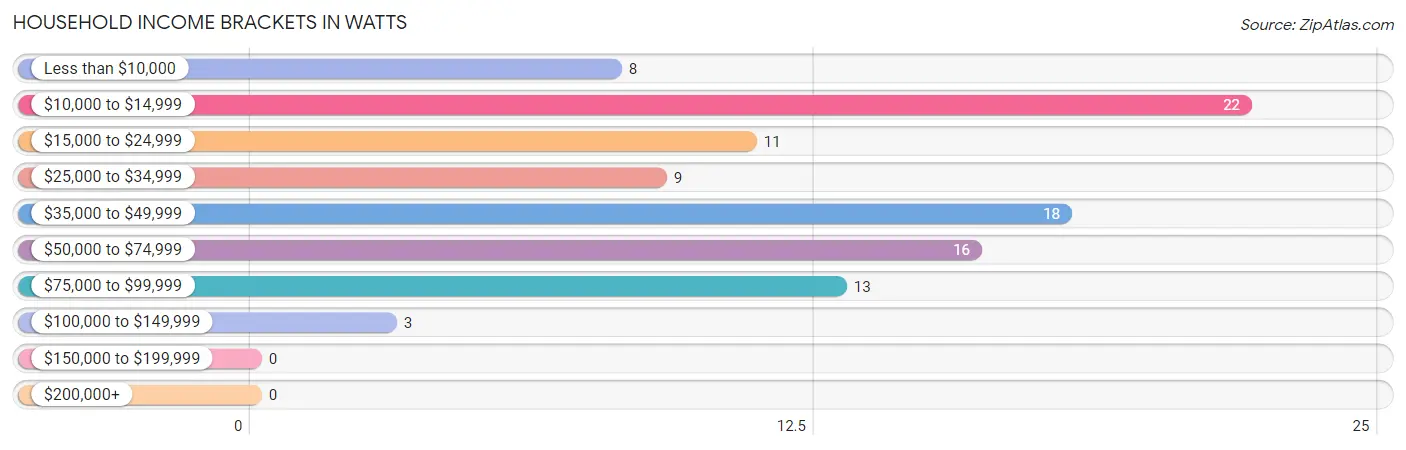
| Income Bracket | # Households | % Households |
| Less than $10,000 | 8 | 8.0% |
| $10,000 to $14,999 | 22 | 22.0% |
| $15,000 to $24,999 | 11 | 11.0% |
| $25,000 to $34,999 | 9 | 9.0% |
| $35,000 to $49,999 | 18 | 18.0% |
| $50,000 to $74,999 | 16 | 16.0% |
| $75,000 to $99,999 | 13 | 13.0% |
| $100,000 to $149,999 | 3 | 3.0% |
| $150,000 to $199,999 | 0 | 0.0% |
| $200,000+ | 0 | 0.0% |
Household Income by Householder Age in Watts
The median household income in Watts is $35,000, with the highest median household income of $57,639 found in the 25 to 44 years age bracket for the primary householder. A total of 31 households (31.0%) fall into this category. Meanwhile, the 15 to 24 years age bracket for the primary householder has the lowest median household income of $0, with 2 households (2.0%) in this group.
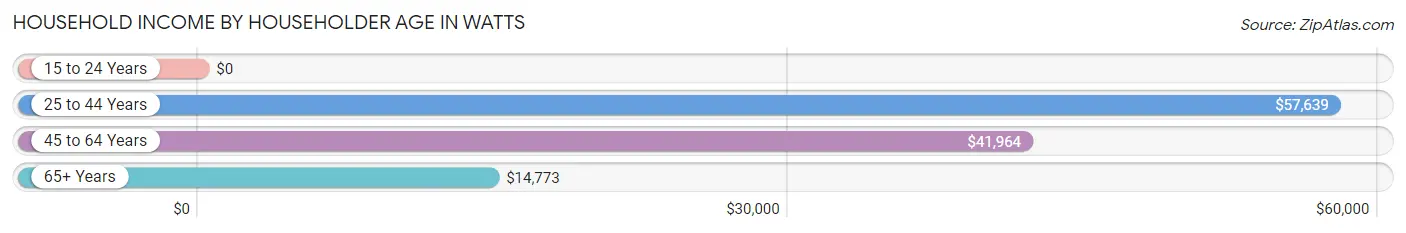
| Income Bracket | # Households | Median Income |
| 15 to 24 Years | 2 (2.0%) | $0 |
| 25 to 44 Years | 31 (31.0%) | $57,639 |
| 45 to 64 Years | 35 (35.0%) | $41,964 |
| 65+ Years | 32 (32.0%) | $14,773 |
| Total | 100 (100.0%) | $35,000 |
Poverty in Watts
Income Below Poverty by Sex and Age in Watts
With 31.4% poverty level for males and 30.9% for females among the residents of Watts, 12 to 14 year old males and under 5 year old females are the most vulnerable to poverty, with 3 males (100.0%) and 8 females (61.5%) in their respective age groups living below the poverty level.
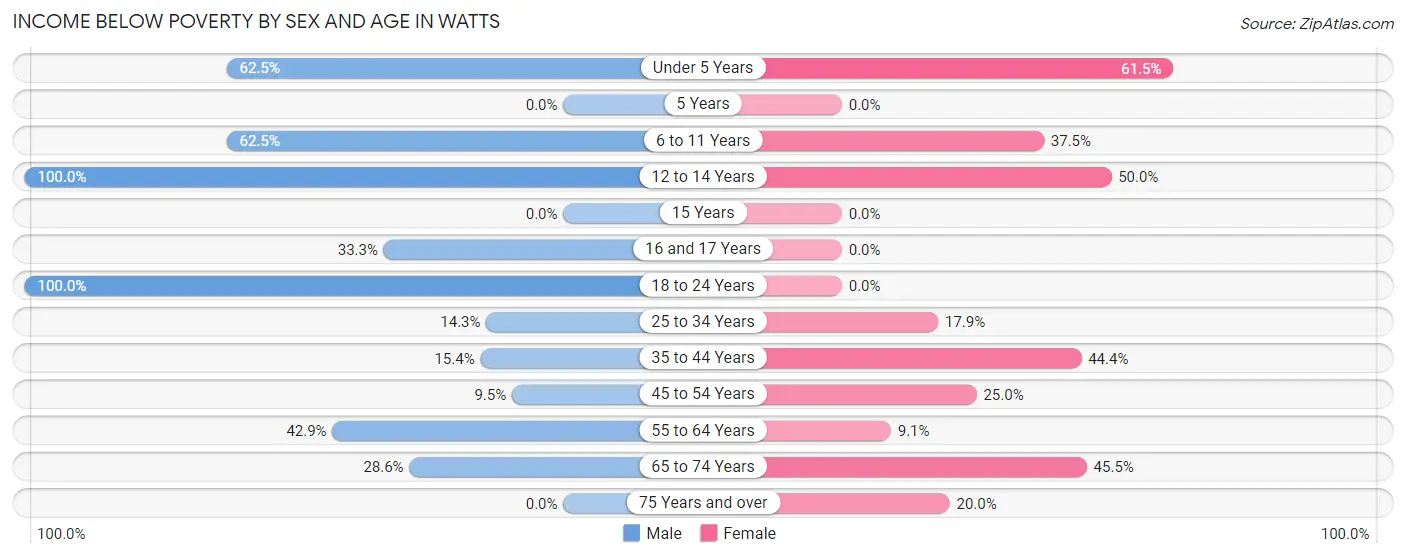
| Age Bracket | Male | Female |
| Under 5 Years | 5 (62.5%) | 8 (61.5%) |
| 5 Years | 0 (0.0%) | 0 (0.0%) |
| 6 to 11 Years | 10 (62.5%) | 9 (37.5%) |
| 12 to 14 Years | 3 (100.0%) | 6 (50.0%) |
| 15 Years | 0 (0.0%) | 0 (0.0%) |
| 16 and 17 Years | 2 (33.3%) | 0 (0.0%) |
| 18 to 24 Years | 2 (100.0%) | 0 (0.0%) |
| 25 to 34 Years | 2 (14.3%) | 5 (17.9%) |
| 35 to 44 Years | 2 (15.4%) | 4 (44.4%) |
| 45 to 54 Years | 2 (9.5%) | 5 (25.0%) |
| 55 to 64 Years | 3 (42.9%) | 1 (9.1%) |
| 65 to 74 Years | 2 (28.6%) | 5 (45.5%) |
| 75 Years and over | 0 (0.0%) | 4 (20.0%) |
| Total | 33 (31.4%) | 47 (30.9%) |
Income Above Poverty by Sex and Age in Watts
According to the poverty statistics in Watts, males aged 5 years and females aged 16 and 17 years are the age groups that are most secure financially, with 100.0% of males and 100.0% of females in these age groups living above the poverty line.
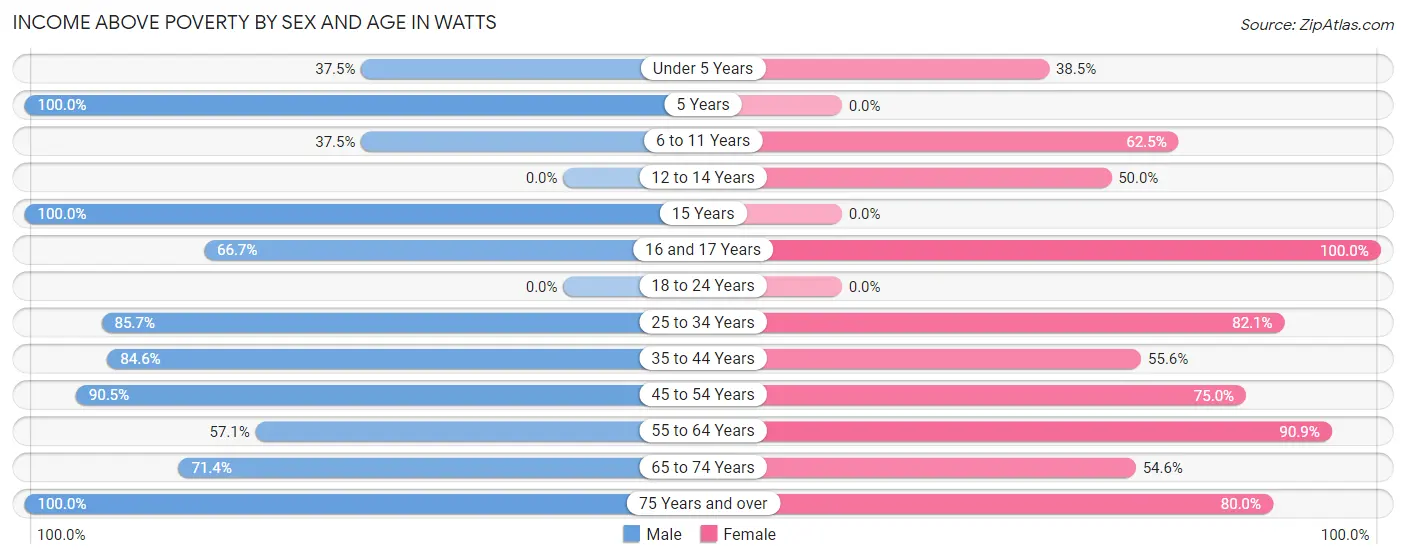
| Age Bracket | Male | Female |
| Under 5 Years | 3 (37.5%) | 5 (38.5%) |
| 5 Years | 5 (100.0%) | 0 (0.0%) |
| 6 to 11 Years | 6 (37.5%) | 15 (62.5%) |
| 12 to 14 Years | 0 (0.0%) | 6 (50.0%) |
| 15 Years | 1 (100.0%) | 0 (0.0%) |
| 16 and 17 Years | 4 (66.7%) | 4 (100.0%) |
| 18 to 24 Years | 0 (0.0%) | 0 (0.0%) |
| 25 to 34 Years | 12 (85.7%) | 23 (82.1%) |
| 35 to 44 Years | 11 (84.6%) | 5 (55.6%) |
| 45 to 54 Years | 19 (90.5%) | 15 (75.0%) |
| 55 to 64 Years | 4 (57.1%) | 10 (90.9%) |
| 65 to 74 Years | 5 (71.4%) | 6 (54.5%) |
| 75 Years and over | 2 (100.0%) | 16 (80.0%) |
| Total | 72 (68.6%) | 105 (69.1%) |
Income Below Poverty Among Married-Couple Families in Watts
The poverty statistics for married-couple families in Watts show that 5.3% or 2 of the total 38 families live below the poverty line. Families with no children have the highest poverty rate of 13.3%, comprising of 2 families. On the other hand, families with 1 or 2 children have the lowest poverty rate of 0.0%, which includes 0 families.
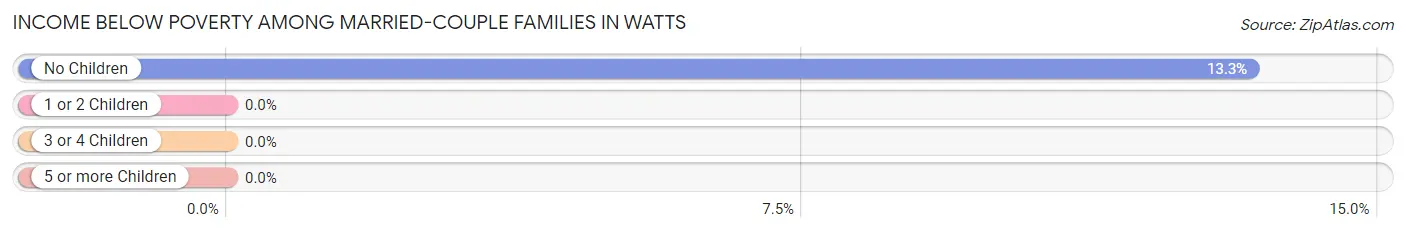
| Children | Above Poverty | Below Poverty |
| No Children | 13 (86.7%) | 2 (13.3%) |
| 1 or 2 Children | 16 (100.0%) | 0 (0.0%) |
| 3 or 4 Children | 7 (100.0%) | 0 (0.0%) |
| 5 or more Children | 0 (0.0%) | 0 (0.0%) |
| Total | 36 (94.7%) | 2 (5.3%) |
Income Below Poverty Among Single-Parent Households in Watts
According to the poverty data in Watts, 100.0% or 2 single-father households and 100.0% or 10 single-mother households are living below the poverty line. Among single-father households, those with 1 or 2 children have the highest poverty rate, with 2 households (100.0%) experiencing poverty. Likewise, among single-mother households, those with no children have the highest poverty rate, with 4 households (100.0%) falling below the poverty line.
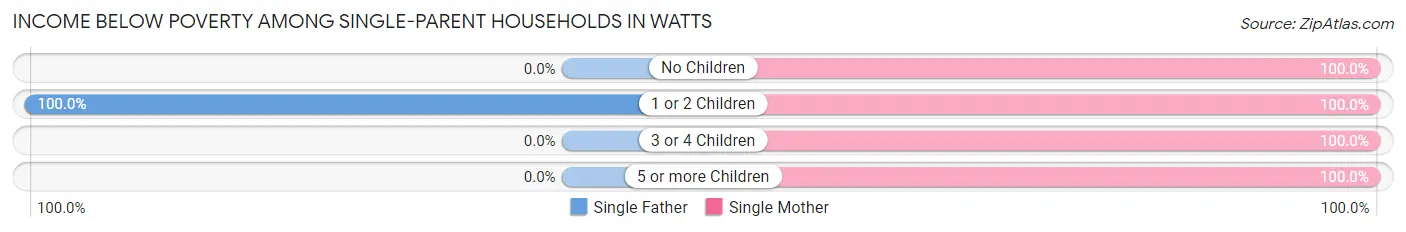
| Children | Single Father | Single Mother |
| No Children | 0 (0.0%) | 4 (100.0%) |
| 1 or 2 Children | 2 (100.0%) | 2 (100.0%) |
| 3 or 4 Children | 0 (0.0%) | 3 (100.0%) |
| 5 or more Children | 0 (0.0%) | 1 (100.0%) |
| Total | 2 (100.0%) | 10 (100.0%) |
Income Below Poverty Among Married-Couple vs Single-Parent Households in Watts
The poverty data for Watts shows that 2 of the married-couple family households (5.3%) and 12 of the single-parent households (100.0%) are living below the poverty level. Within the married-couple family households, those with no children have the highest poverty rate, with 2 households (13.3%) falling below the poverty line. Among the single-parent households, those with no children have the highest poverty rate, with 4 household (100.0%) living below poverty.
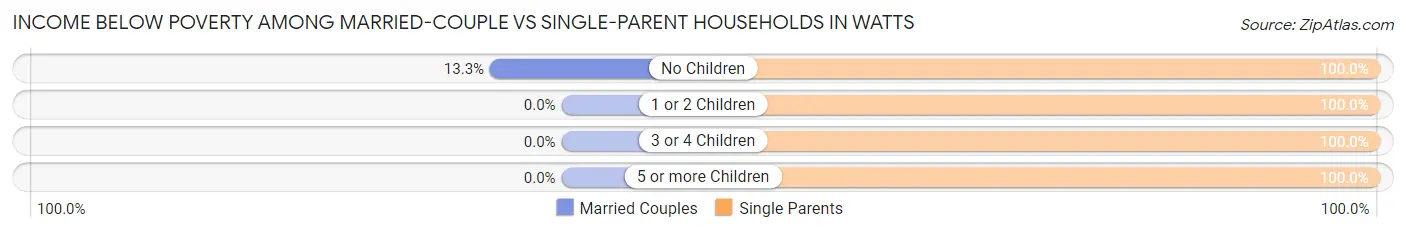
| Children | Married-Couple Families | Single-Parent Households |
| No Children | 2 (13.3%) | 4 (100.0%) |
| 1 or 2 Children | 0 (0.0%) | 4 (100.0%) |
| 3 or 4 Children | 0 (0.0%) | 3 (100.0%) |
| 5 or more Children | 0 (0.0%) | 1 (100.0%) |
| Total | 2 (5.3%) | 12 (100.0%) |
Race in Watts
The most populous races in Watts are White / Caucasian (166 | 64.6%), Native / Alaskan (43 | 16.7%), and Hispanic or Latino (42 | 16.3%).
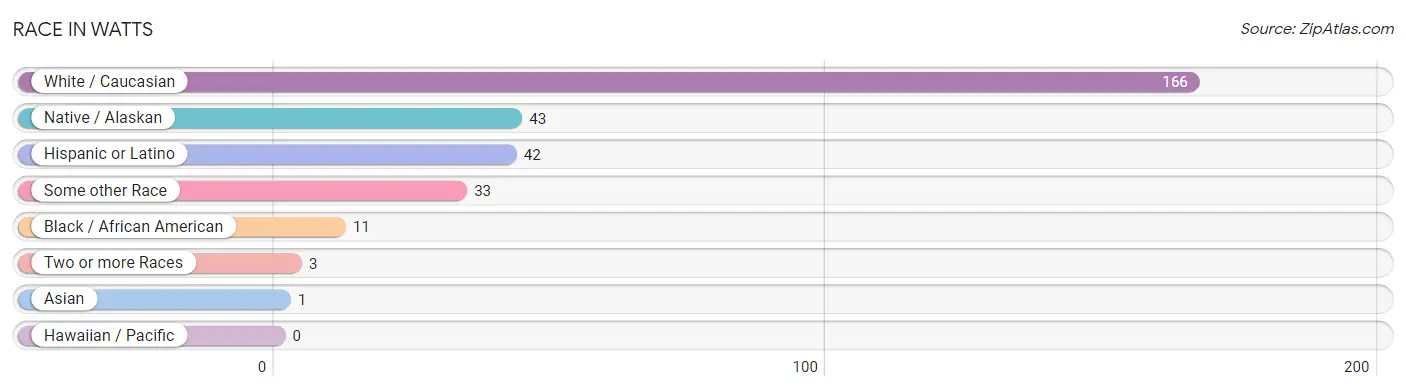
| Race | # Population | % Population |
| Asian | 1 | 0.4% |
| Black / African American | 11 | 4.3% |
| Hawaiian / Pacific | 0 | 0.0% |
| Hispanic or Latino | 42 | 16.3% |
| Native / Alaskan | 43 | 16.7% |
| White / Caucasian | 166 | 64.6% |
| Two or more Races | 3 | 1.2% |
| Some other Race | 33 | 12.8% |
| Total | 257 | 100.0% |
Ancestry in Watts
The most populous ancestries reported in Watts are Mexican (42 | 16.3%), Cherokee (36 | 14.0%), Irish (14 | 5.4%), German (11 | 4.3%), and French (8 | 3.1%), together accounting for 43.2% of all Watts residents.
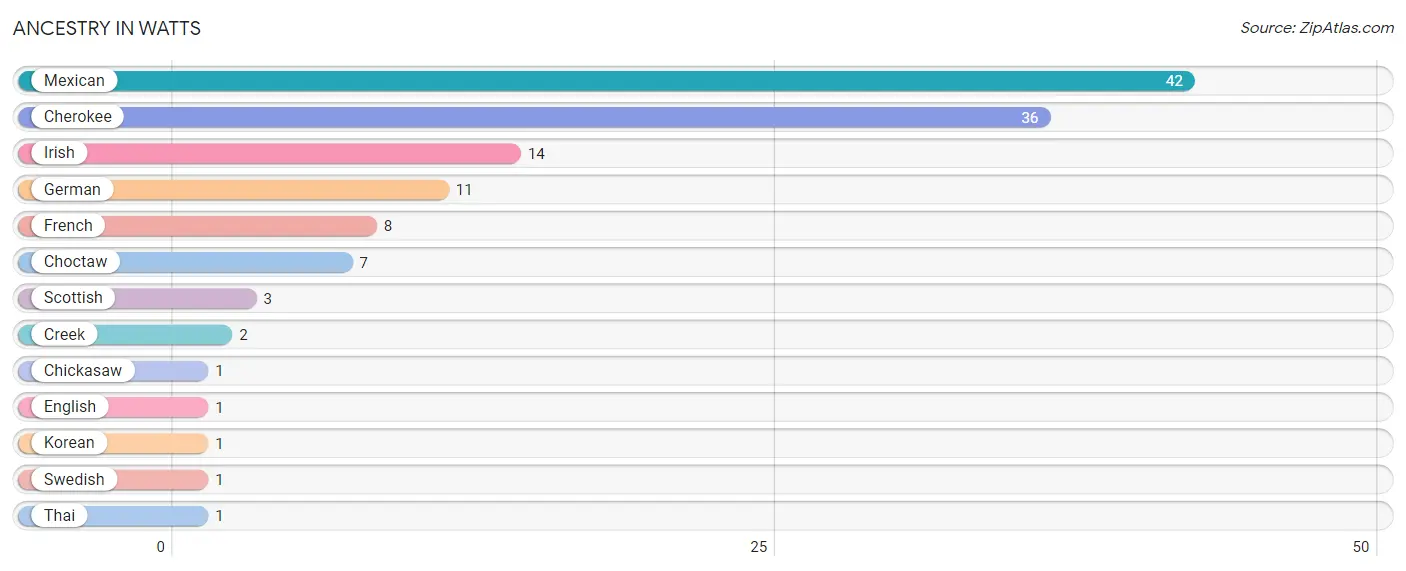
| Ancestry | # Population | % Population |
| Cherokee | 36 | 14.0% |
| Chickasaw | 1 | 0.4% |
| Choctaw | 7 | 2.7% |
| Creek | 2 | 0.8% |
| English | 1 | 0.4% |
| French | 8 | 3.1% |
| German | 11 | 4.3% |
| Irish | 14 | 5.4% |
| Korean | 1 | 0.4% |
| Mexican | 42 | 16.3% |
| Scottish | 3 | 1.2% |
| Swedish | 1 | 0.4% |
| Thai | 1 | 0.4% | View All 13 Rows |
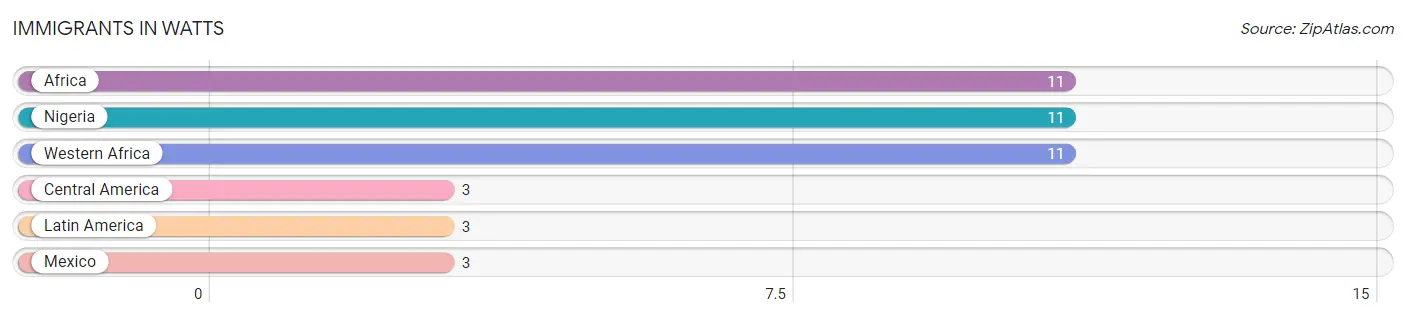
Immigrants in Watts
The most numerous immigrant groups reported in Watts came from Africa (11 | 4.3%), Nigeria (11 | 4.3%), Western Africa (11 | 4.3%), Central America (3 | 1.2%), and Latin America (3 | 1.2%), together accounting for 15.2% of all Watts residents.
| Immigration Origin | # Population | % Population |
| Africa | 11 | 4.3% |
| Central America | 3 | 1.2% |
| Latin America | 3 | 1.2% |
| Mexico | 3 | 1.2% |
| Nigeria | 11 | 4.3% |
| Western Africa | 11 | 4.3% | View All 6 Rows |
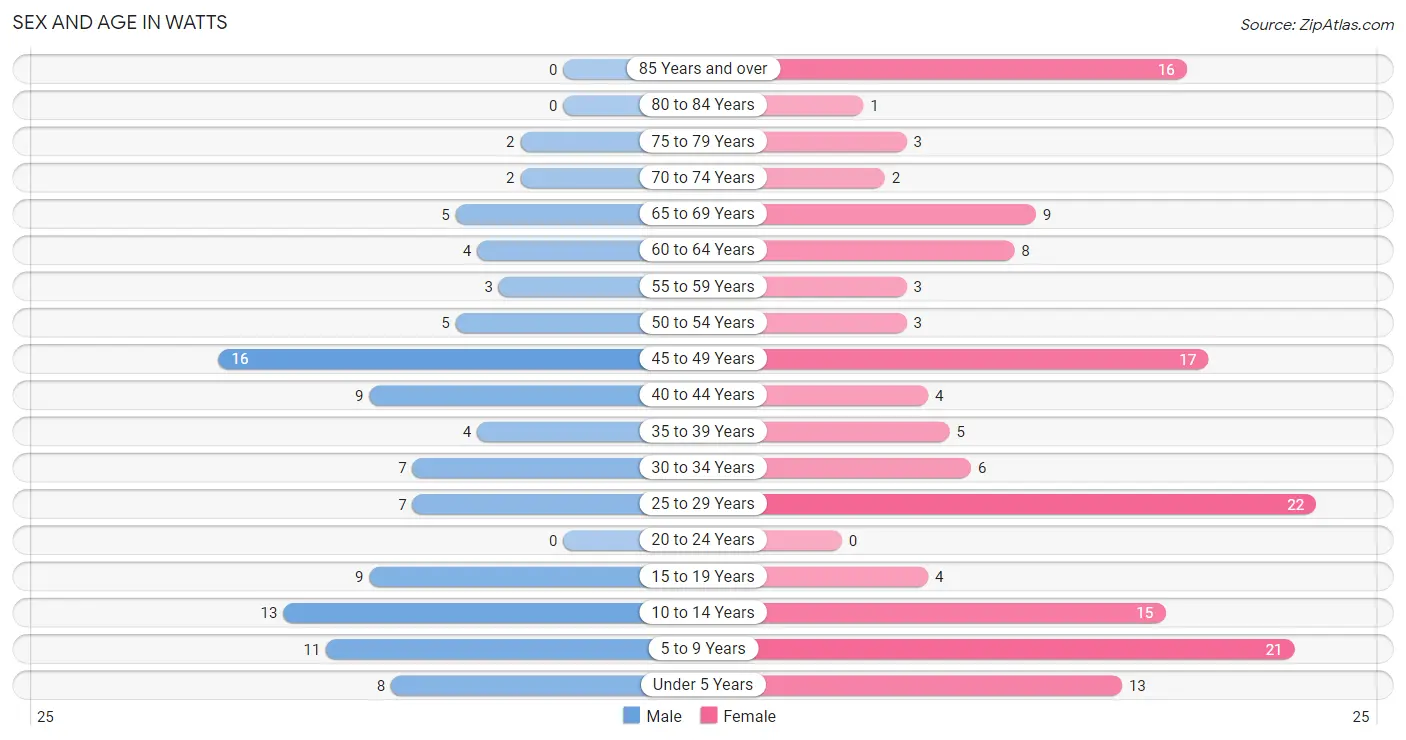
Sex and Age in Watts
Sex and Age in Watts
The most populous age groups in Watts are 45 to 49 Years (16 | 15.2%) for men and 25 to 29 Years (22 | 14.5%) for women.
| Age Bracket | Male | Female |
| Under 5 Years | 8 (7.6%) | 13 (8.6%) |
| 5 to 9 Years | 11 (10.5%) | 21 (13.8%) |
| 10 to 14 Years | 13 (12.4%) | 15 (9.9%) |
| 15 to 19 Years | 9 (8.6%) | 4 (2.6%) |
| 20 to 24 Years | 0 (0.0%) | 0 (0.0%) |
| 25 to 29 Years | 7 (6.7%) | 22 (14.5%) |
| 30 to 34 Years | 7 (6.7%) | 6 (4.0%) |
| 35 to 39 Years | 4 (3.8%) | 5 (3.3%) |
| 40 to 44 Years | 9 (8.6%) | 4 (2.6%) |
| 45 to 49 Years | 16 (15.2%) | 17 (11.2%) |
| 50 to 54 Years | 5 (4.8%) | 3 (2.0%) |
| 55 to 59 Years | 3 (2.9%) | 3 (2.0%) |
| 60 to 64 Years | 4 (3.8%) | 8 (5.3%) |
| 65 to 69 Years | 5 (4.8%) | 9 (5.9%) |
| 70 to 74 Years | 2 (1.9%) | 2 (1.3%) |
| 75 to 79 Years | 2 (1.9%) | 3 (2.0%) |
| 80 to 84 Years | 0 (0.0%) | 1 (0.7%) |
| 85 Years and over | 0 (0.0%) | 16 (10.5%) |
| Total | 105 (100.0%) | 152 (100.0%) |
Families and Households in Watts
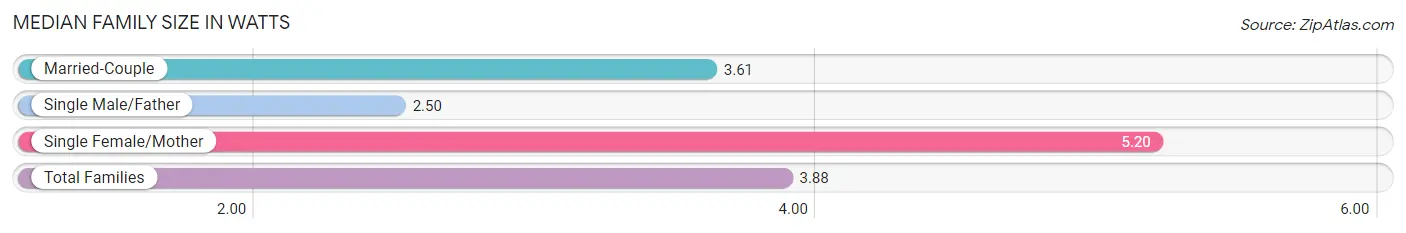
Median Family Size in Watts
The median family size in Watts is 3.88 persons per family, with single female/mother families (10 | 20.0%) accounting for the largest median family size of 5.2 persons per family. On the other hand, single male/father families (2 | 4.0%) represent the smallest median family size with 2.50 persons per family.
| Family Type | # Families | Family Size |
| Married-Couple | 38 (76.0%) | 3.61 |
| Single Male/Father | 2 (4.0%) | 2.50 |
| Single Female/Mother | 10 (20.0%) | 5.20 |
| Total Families | 50 (100.0%) | 3.88 |
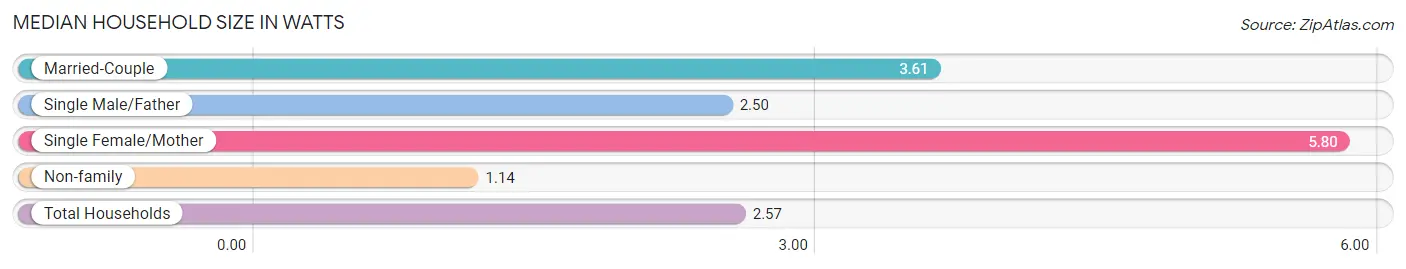
Median Household Size in Watts
The median household size in Watts is 2.57 persons per household, with single female/mother households (10 | 10.0%) accounting for the largest median household size of 5.8 persons per household. non-family households (50 | 50.0%) represent the smallest median household size with 1.14 persons per household.
| Household Type | # Households | Household Size |
| Married-Couple | 38 (38.0%) | 3.61 |
| Single Male/Father | 2 (2.0%) | 2.50 |
| Single Female/Mother | 10 (10.0%) | 5.80 |
| Non-family | 50 (50.0%) | 1.14 |
| Total Households | 100 (100.0%) | 2.57 |
Household Size by Marriage Status in Watts
Out of a total of 100 households in Watts, 50 (50.0%) are family households, while 50 (50.0%) are nonfamily households. The most numerous type of family households are 2-person households, comprising 19, and the most common type of nonfamily households are 1-person households, comprising 45.
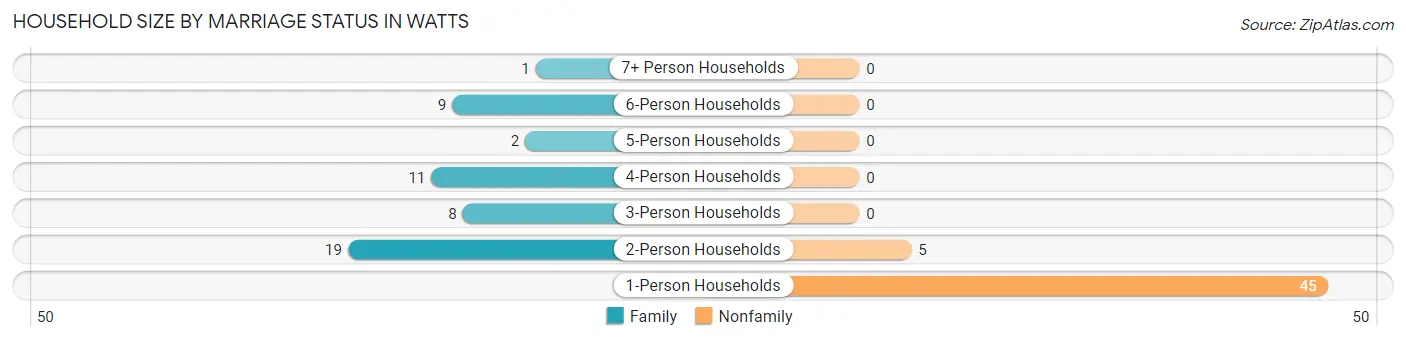
| Household Size | Family Households | Nonfamily Households |
| 1-Person Households | - | 45 (45.0%) |
| 2-Person Households | 19 (19.0%) | 5 (5.0%) |
| 3-Person Households | 8 (8.0%) | 0 (0.0%) |
| 4-Person Households | 11 (11.0%) | 0 (0.0%) |
| 5-Person Households | 2 (2.0%) | 0 (0.0%) |
| 6-Person Households | 9 (9.0%) | 0 (0.0%) |
| 7+ Person Households | 1 (1.0%) | 0 (0.0%) |
| Total | 50 (50.0%) | 50 (50.0%) |
Female Fertility in Watts
Fertility by Age in Watts
Average fertility rate in Watts is 86.0 births per 1,000 women. Women in the age bracket of 20 to 34 years have the highest fertility rate with 179.0 births per 1,000 women. Women in the age bracket of 20 to 34 years acount for 100.0% of all women with births.
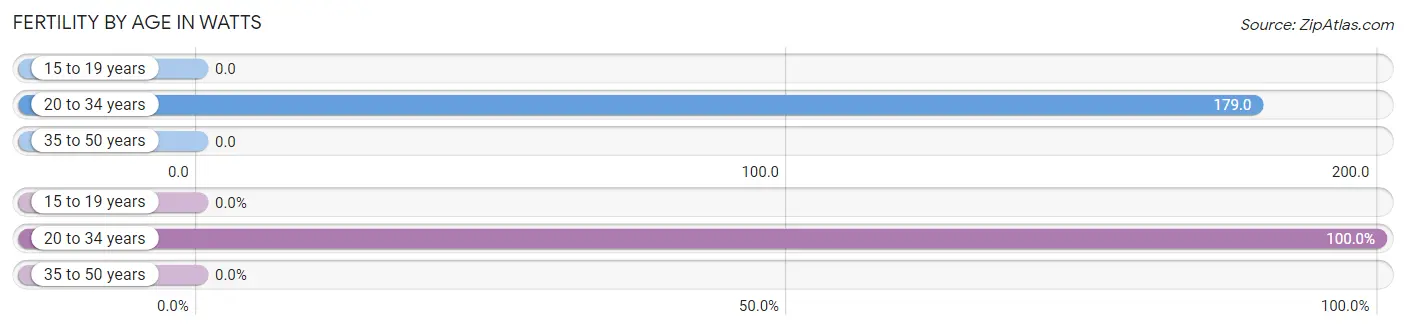
| Age Bracket | Women with Births | Births / 1,000 Women |
| 15 to 19 years | 0 (0.0%) | 0.0 |
| 20 to 34 years | 5 (100.0%) | 179.0 |
| 35 to 50 years | 0 (0.0%) | 0.0 |
| Total | 5 (100.0%) | 86.0 |
Fertility by Age by Marriage Status in Watts
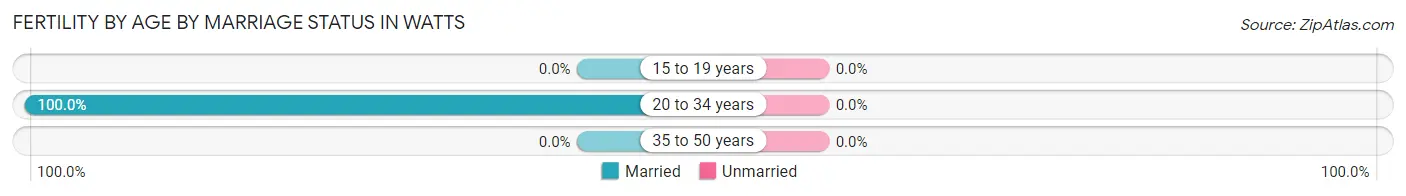
| Age Bracket | Married | Unmarried |
| 15 to 19 years | 0 (0.0%) | 0 (0.0%) |
| 20 to 34 years | 5 (100.0%) | 0 (0.0%) |
| 35 to 50 years | 0 (0.0%) | 0 (0.0%) |
| Total | 5 (100.0%) | 0 (0.0%) |
Fertility by Education in Watts
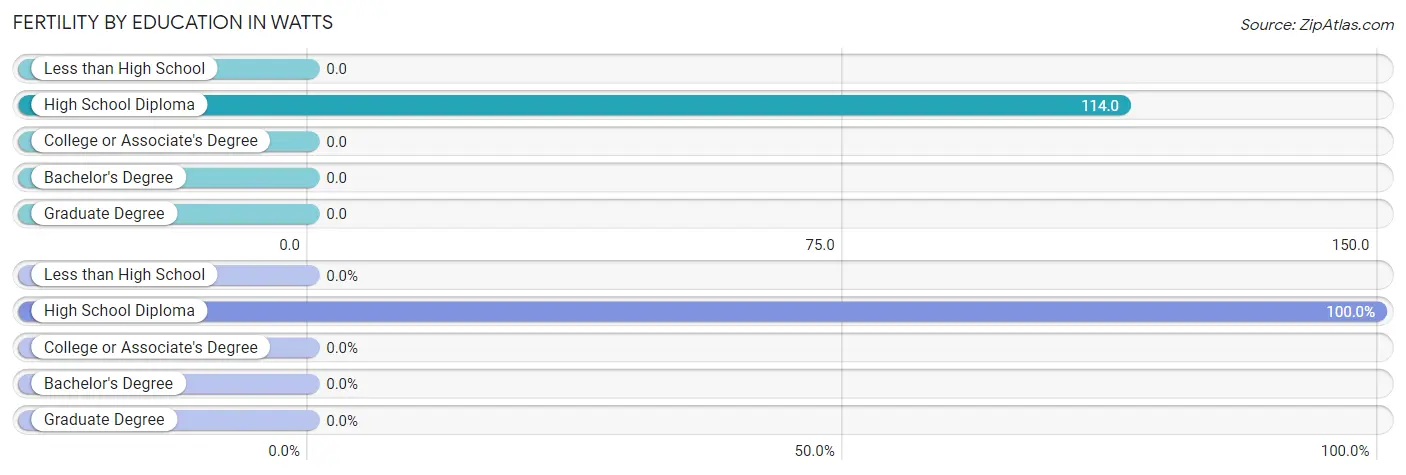
| Educational Attainment | Women with Births | Births / 1,000 Women |
| Less than High School | 0 (0.0%) | 0.0 |
| High School Diploma | 5 (100.0%) | 114.0 |
| College or Associate's Degree | 0 (0.0%) | 0.0 |
| Bachelor's Degree | 0 (0.0%) | 0.0 |
| Graduate Degree | 0 (0.0%) | 0.0 |
| Total | 5 (100.0%) | 86.0 |
Fertility by Education by Marriage Status in Watts
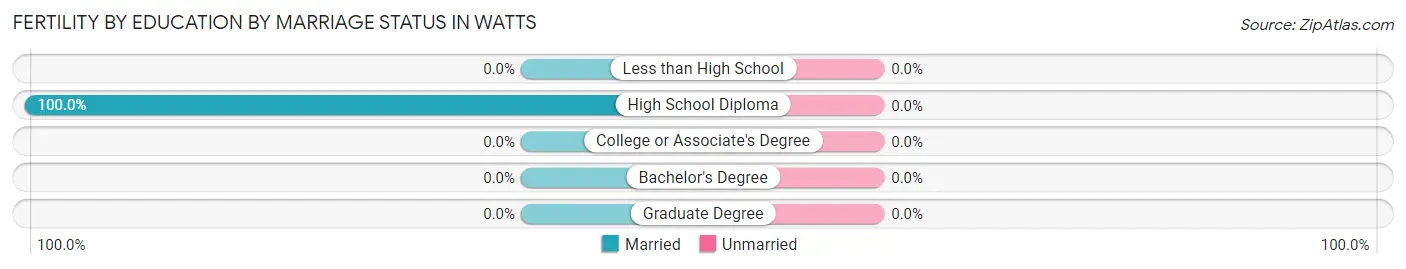
| Educational Attainment | Married | Unmarried |
| Less than High School | 0 (0.0%) | 0 (0.0%) |
| High School Diploma | 5 (100.0%) | 0 (0.0%) |
| College or Associate's Degree | 0 (0.0%) | 0 (0.0%) |
| Bachelor's Degree | 0 (0.0%) | 0 (0.0%) |
| Graduate Degree | 0 (0.0%) | 0 (0.0%) |
| Total | 5 (100.0%) | 0 (0.0%) |
Employment Characteristics in Watts
Employment by Class of Employer in Watts
Among the 76 employed individuals in Watts, private company employees (45 | 59.2%), local government employees (21 | 27.6%), and self-employed (not incorporated) (4 | 5.3%) make up the most common classes of employment.
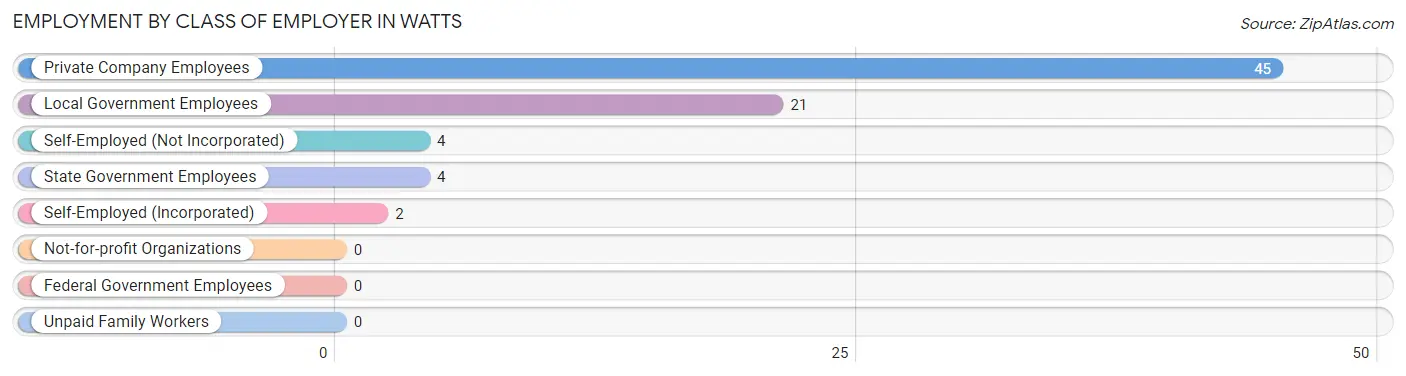
| Employer Class | # Employees | % Employees |
| Private Company Employees | 45 | 59.2% |
| Self-Employed (Incorporated) | 2 | 2.6% |
| Self-Employed (Not Incorporated) | 4 | 5.3% |
| Not-for-profit Organizations | 0 | 0.0% |
| Local Government Employees | 21 | 27.6% |
| State Government Employees | 4 | 5.3% |
| Federal Government Employees | 0 | 0.0% |
| Unpaid Family Workers | 0 | 0.0% |
| Total | 76 | 100.0% |
Employment Status by Age in Watts
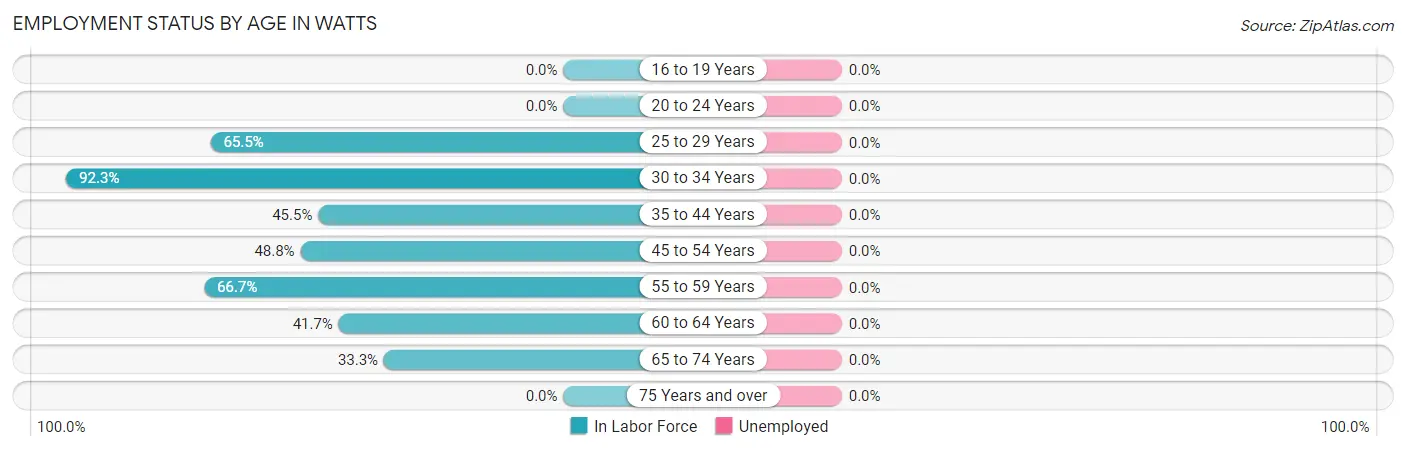
| Age Bracket | In Labor Force | Unemployed |
| 16 to 19 Years | 0 (0.0%) | 0 (0.0%) |
| 20 to 24 Years | 0 (0.0%) | 0 (0.0%) |
| 25 to 29 Years | 19 (65.5%) | 0 (0.0%) |
| 30 to 34 Years | 12 (92.3%) | 0 (0.0%) |
| 35 to 44 Years | 10 (45.5%) | 0 (0.0%) |
| 45 to 54 Years | 20 (48.8%) | 0 (0.0%) |
| 55 to 59 Years | 4 (66.7%) | 0 (0.0%) |
| 60 to 64 Years | 5 (41.7%) | 0 (0.0%) |
| 65 to 74 Years | 6 (33.3%) | 0 (0.0%) |
| 75 Years and over | 0 (0.0%) | 0 (0.0%) |
| Total | 76 (43.4%) | 0 (0.0%) |
Employment Status by Educational Attainment in Watts
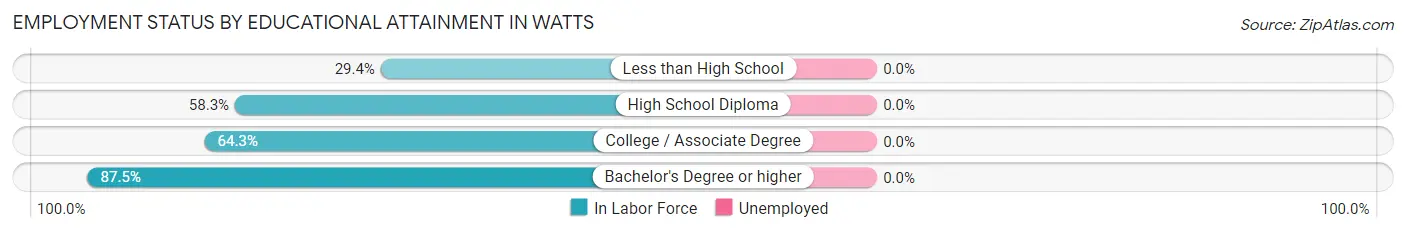
| Educational Attainment | In Labor Force | Unemployed |
| Less than High School | 5 (29.4%) | 0 (0.0%) |
| High School Diploma | 49 (58.3%) | 0 (0.0%) |
| College / Associate Degree | 9 (64.3%) | 0 (0.0%) |
| Bachelor's Degree or higher | 7 (87.5%) | 0 (0.0%) |
| Total | 70 (56.9%) | 0 (0.0%) |
Employment Occupations by Sex in Watts
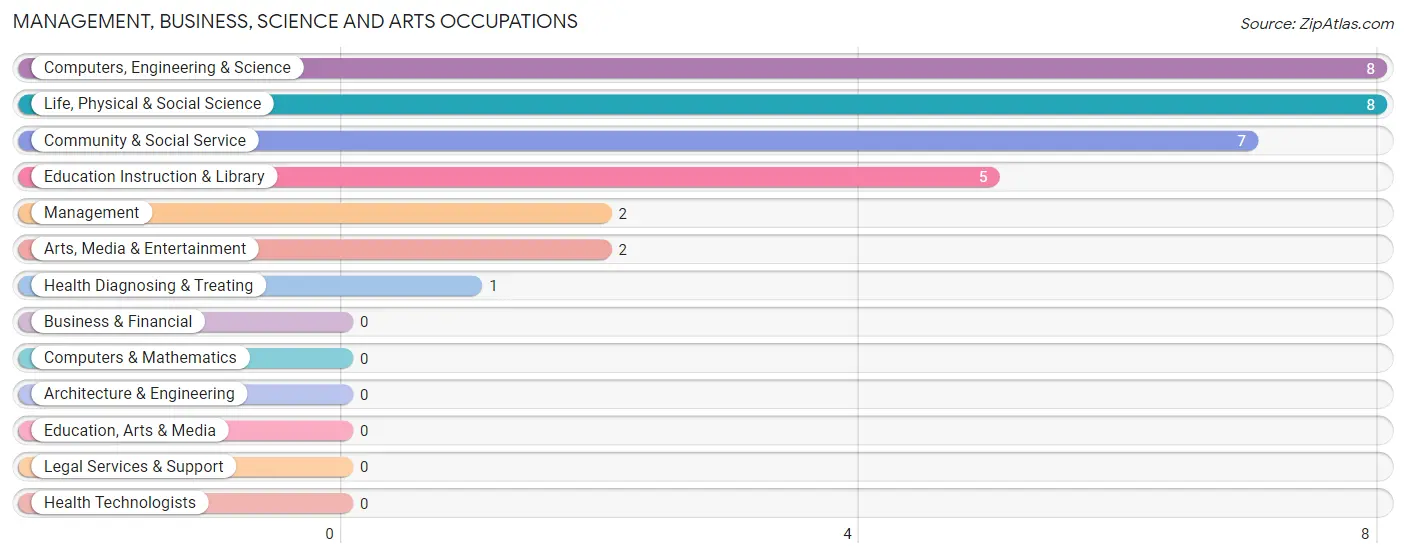
Management, Business, Science and Arts Occupations
The most common Management, Business, Science and Arts occupations in Watts are Computers, Engineering & Science (8 | 10.5%), Life, Physical & Social Science (8 | 10.5%), Community & Social Service (7 | 9.2%), Education Instruction & Library (5 | 6.6%), and Management (2 | 2.6%).
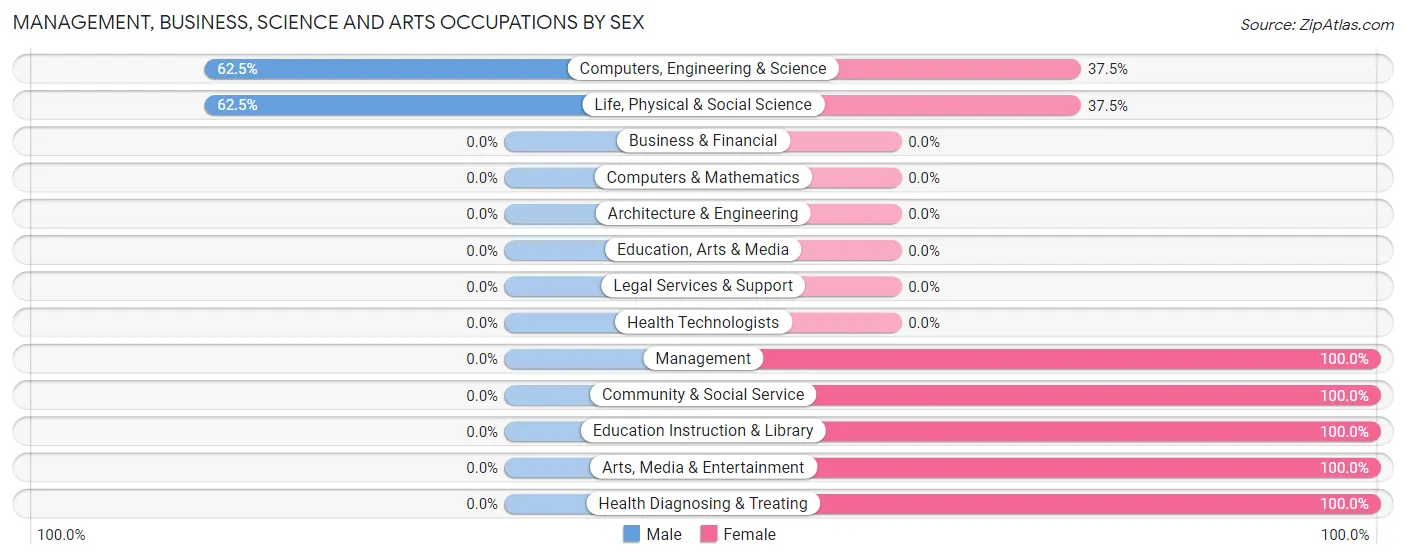
Management, Business, Science and Arts Occupations by Sex
Within the Management, Business, Science and Arts occupations in Watts, the most male-oriented occupations are Computers, Engineering & Science (62.5%), and Life, Physical & Social Science (62.5%), while the most female-oriented occupations are Management (100.0%), Community & Social Service (100.0%), and Education Instruction & Library (100.0%).
| Occupation | Male | Female |
| Management | 0 (0.0%) | 2 (100.0%) |
| Business & Financial | 0 (0.0%) | 0 (0.0%) |
| Computers, Engineering & Science | 5 (62.5%) | 3 (37.5%) |
| Computers & Mathematics | 0 (0.0%) | 0 (0.0%) |
| Architecture & Engineering | 0 (0.0%) | 0 (0.0%) |
| Life, Physical & Social Science | 5 (62.5%) | 3 (37.5%) |
| Community & Social Service | 0 (0.0%) | 7 (100.0%) |
| Education, Arts & Media | 0 (0.0%) | 0 (0.0%) |
| Legal Services & Support | 0 (0.0%) | 0 (0.0%) |
| Education Instruction & Library | 0 (0.0%) | 5 (100.0%) |
| Arts, Media & Entertainment | 0 (0.0%) | 2 (100.0%) |
| Health Diagnosing & Treating | 0 (0.0%) | 1 (100.0%) |
| Health Technologists | 0 (0.0%) | 0 (0.0%) |
| Total (Category) | 5 (27.8%) | 13 (72.2%) |
| Total (Overall) | 36 (47.4%) | 40 (52.6%) |
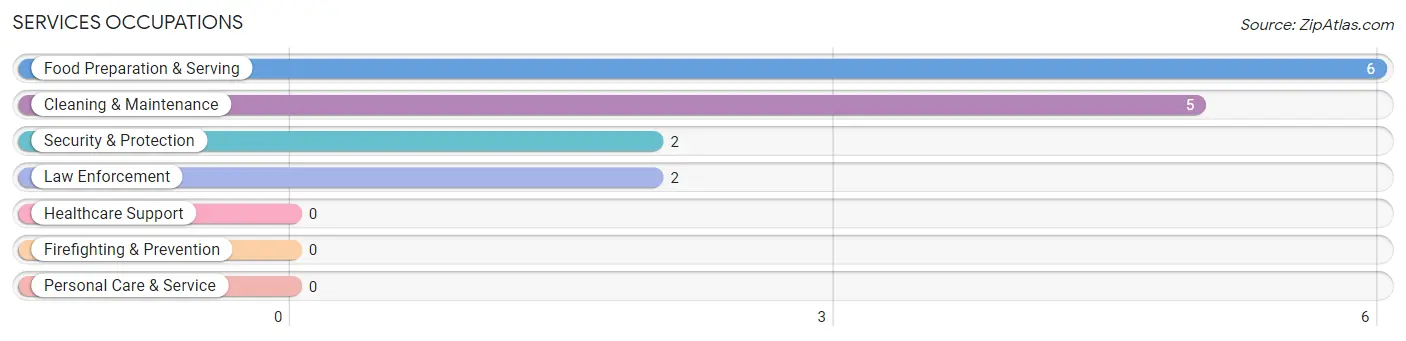
Services Occupations
The most common Services occupations in Watts are Food Preparation & Serving (6 | 7.9%), Cleaning & Maintenance (5 | 6.6%), Security & Protection (2 | 2.6%), and Law Enforcement (2 | 2.6%).
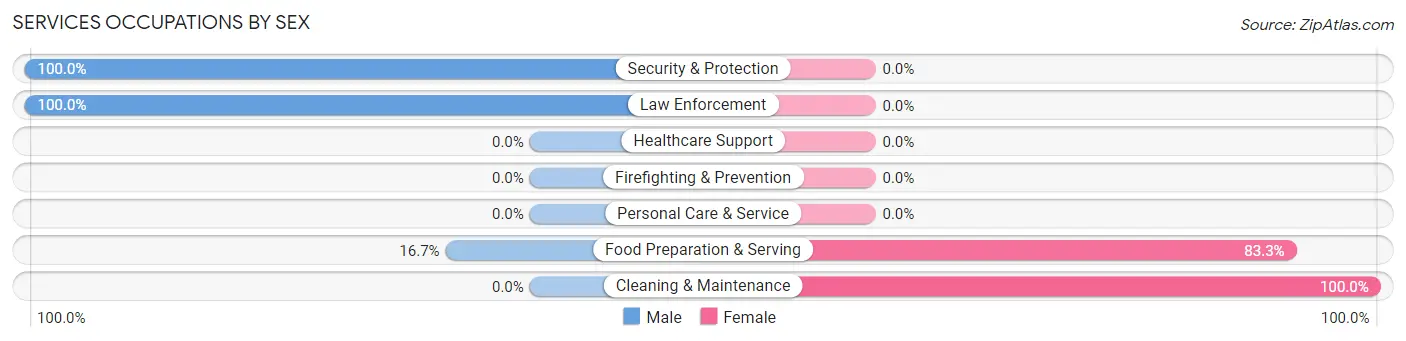
Services Occupations by Sex
Within the Services occupations in Watts, the most male-oriented occupations are Security & Protection (100.0%), Law Enforcement (100.0%), and Food Preparation & Serving (16.7%), while the most female-oriented occupations are Cleaning & Maintenance (100.0%), and Food Preparation & Serving (83.3%).
| Occupation | Male | Female |
| Healthcare Support | 0 (0.0%) | 0 (0.0%) |
| Security & Protection | 2 (100.0%) | 0 (0.0%) |
| Firefighting & Prevention | 0 (0.0%) | 0 (0.0%) |
| Law Enforcement | 2 (100.0%) | 0 (0.0%) |
| Food Preparation & Serving | 1 (16.7%) | 5 (83.3%) |
| Cleaning & Maintenance | 0 (0.0%) | 5 (100.0%) |
| Personal Care & Service | 0 (0.0%) | 0 (0.0%) |
| Total (Category) | 3 (23.1%) | 10 (76.9%) |
| Total (Overall) | 36 (47.4%) | 40 (52.6%) |
Sales and Office Occupations
The most common Sales and Office occupations in Watts are , and Sales & Related (13 | 17.1%).
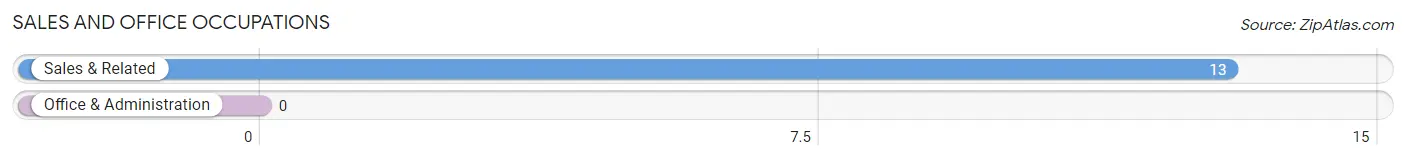
Sales and Office Occupations by Sex
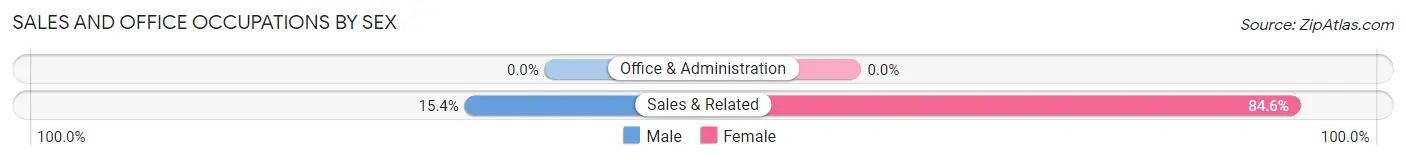
| Occupation | Male | Female |
| Sales & Related | 2 (15.4%) | 11 (84.6%) |
| Office & Administration | 0 (0.0%) | 0 (0.0%) |
| Total (Category) | 2 (15.4%) | 11 (84.6%) |
| Total (Overall) | 36 (47.4%) | 40 (52.6%) |
Natural Resources, Construction and Maintenance Occupations
The most common Natural Resources, Construction and Maintenance occupations in Watts are Construction & Extraction (6 | 7.9%), and Farming, Fishing & Forestry (2 | 2.6%).
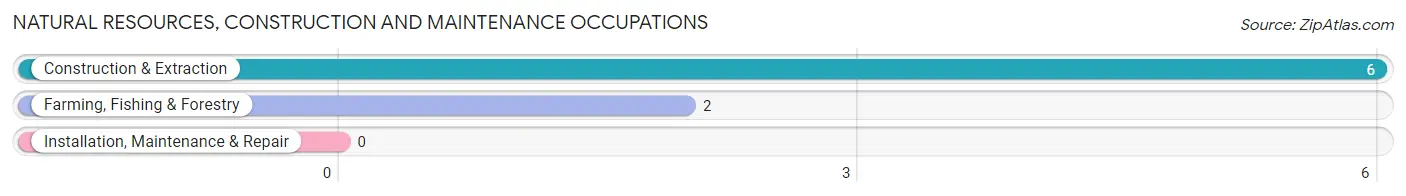
Natural Resources, Construction and Maintenance Occupations by Sex
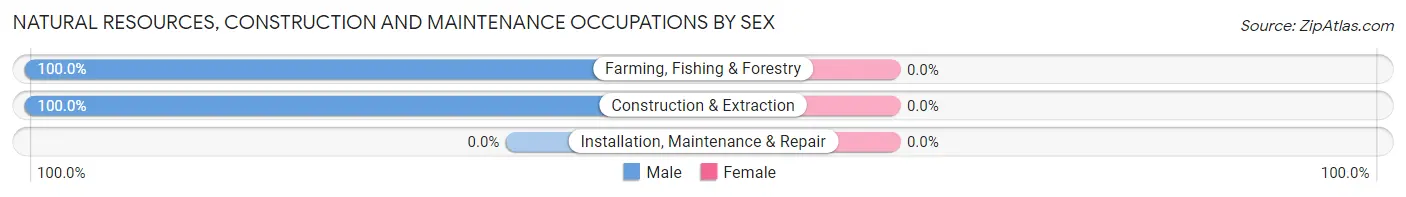
| Occupation | Male | Female |
| Farming, Fishing & Forestry | 2 (100.0%) | 0 (0.0%) |
| Construction & Extraction | 6 (100.0%) | 0 (0.0%) |
| Installation, Maintenance & Repair | 0 (0.0%) | 0 (0.0%) |
| Total (Category) | 8 (100.0%) | 0 (0.0%) |
| Total (Overall) | 36 (47.4%) | 40 (52.6%) |
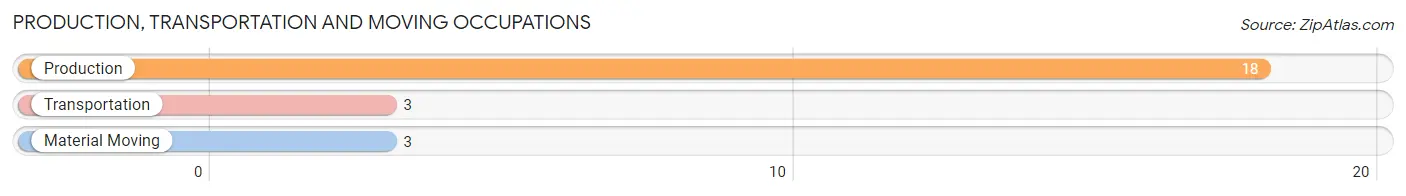
Production, Transportation and Moving Occupations
The most common Production, Transportation and Moving occupations in Watts are Production (18 | 23.7%), Transportation (3 | 4.0%), and Material Moving (3 | 4.0%).
Production, Transportation and Moving Occupations by Sex
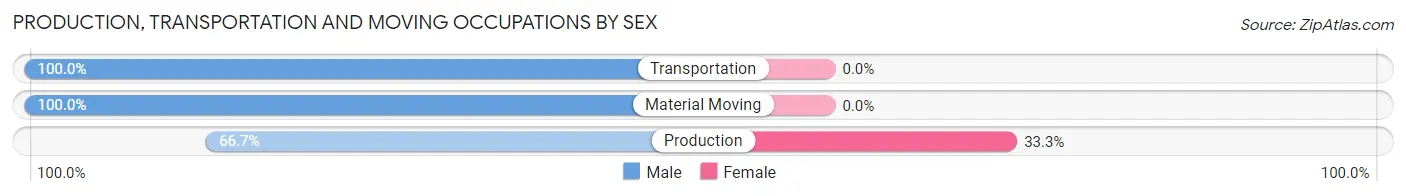
| Occupation | Male | Female |
| Production | 12 (66.7%) | 6 (33.3%) |
| Transportation | 3 (100.0%) | 0 (0.0%) |
| Material Moving | 3 (100.0%) | 0 (0.0%) |
| Total (Category) | 18 (75.0%) | 6 (25.0%) |
| Total (Overall) | 36 (47.4%) | 40 (52.6%) |
Employment Industries by Sex in Watts
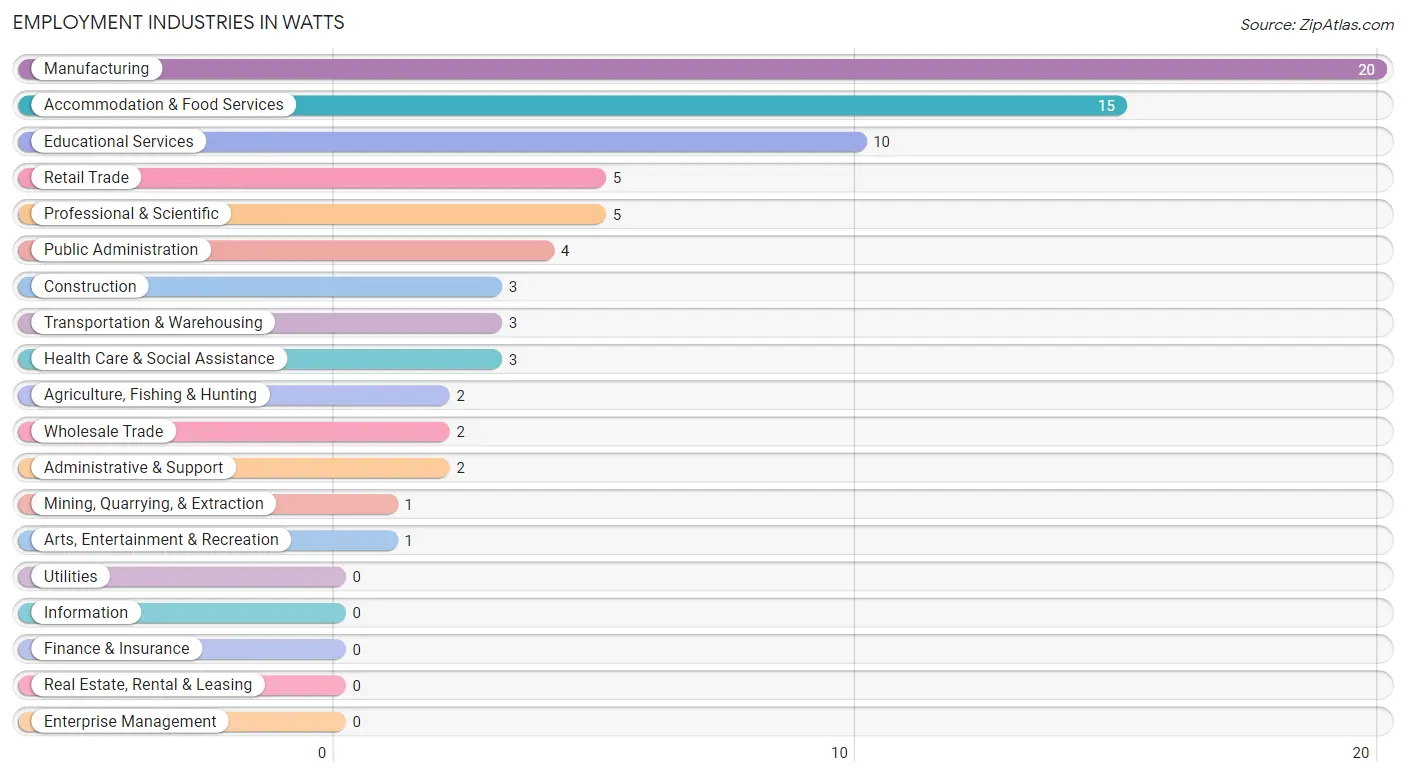
Employment Industries in Watts
The major employment industries in Watts include Manufacturing (20 | 26.3%), Accommodation & Food Services (15 | 19.7%), Educational Services (10 | 13.2%), Retail Trade (5 | 6.6%), and Professional & Scientific (5 | 6.6%).
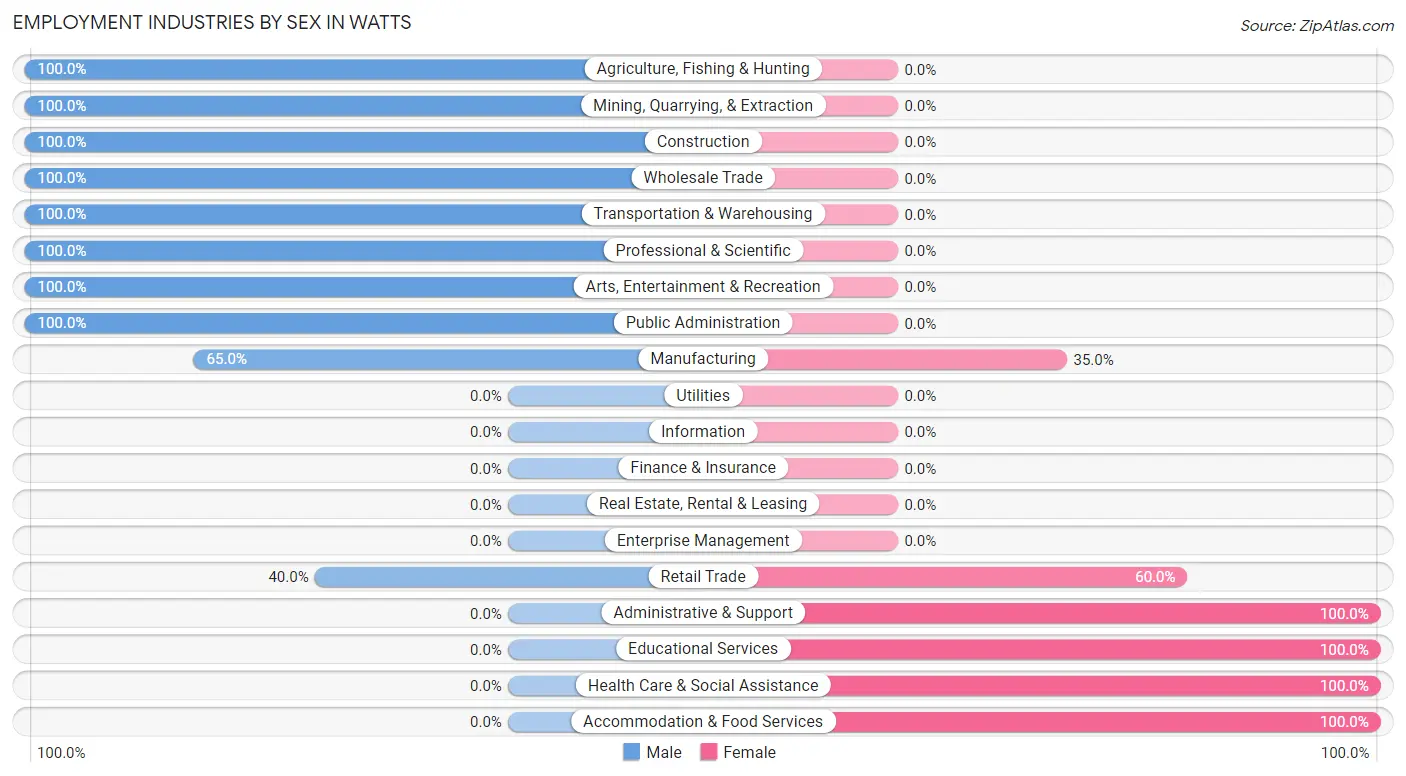
Employment Industries by Sex in Watts
The Watts industries that see more men than women are Agriculture, Fishing & Hunting (100.0%), Mining, Quarrying, & Extraction (100.0%), and Construction (100.0%), whereas the industries that tend to have a higher number of women are Administrative & Support (100.0%), Educational Services (100.0%), and Health Care & Social Assistance (100.0%).
| Industry | Male | Female |
| Agriculture, Fishing & Hunting | 2 (100.0%) | 0 (0.0%) |
| Mining, Quarrying, & Extraction | 1 (100.0%) | 0 (0.0%) |
| Construction | 3 (100.0%) | 0 (0.0%) |
| Manufacturing | 13 (65.0%) | 7 (35.0%) |
| Wholesale Trade | 2 (100.0%) | 0 (0.0%) |
| Retail Trade | 2 (40.0%) | 3 (60.0%) |
| Transportation & Warehousing | 3 (100.0%) | 0 (0.0%) |
| Utilities | 0 (0.0%) | 0 (0.0%) |
| Information | 0 (0.0%) | 0 (0.0%) |
| Finance & Insurance | 0 (0.0%) | 0 (0.0%) |
| Real Estate, Rental & Leasing | 0 (0.0%) | 0 (0.0%) |
| Professional & Scientific | 5 (100.0%) | 0 (0.0%) |
| Enterprise Management | 0 (0.0%) | 0 (0.0%) |
| Administrative & Support | 0 (0.0%) | 2 (100.0%) |
| Educational Services | 0 (0.0%) | 10 (100.0%) |
| Health Care & Social Assistance | 0 (0.0%) | 3 (100.0%) |
| Arts, Entertainment & Recreation | 1 (100.0%) | 0 (0.0%) |
| Accommodation & Food Services | 0 (0.0%) | 15 (100.0%) |
| Public Administration | 4 (100.0%) | 0 (0.0%) |
| Total | 36 (47.4%) | 40 (52.6%) |
Education in Watts
School Enrollment in Watts
The most common levels of schooling among the 70 students in Watts are elementary school (26 | 37.1%), middle school (20 | 28.6%), and nursery / preschool (13 | 18.6%).
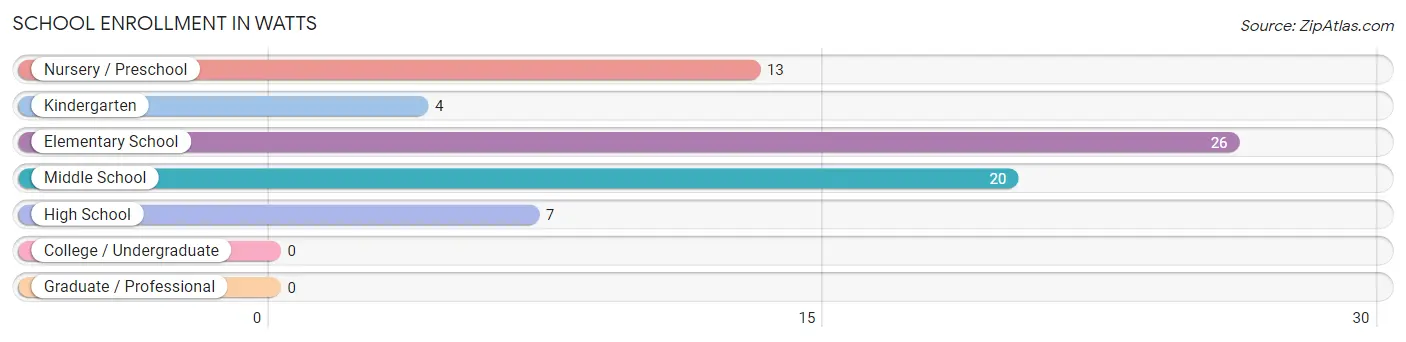
| School Level | # Students | % Students |
| Nursery / Preschool | 13 | 18.6% |
| Kindergarten | 4 | 5.7% |
| Elementary School | 26 | 37.1% |
| Middle School | 20 | 28.6% |
| High School | 7 | 10.0% |
| College / Undergraduate | 0 | 0.0% |
| Graduate / Professional | 0 | 0.0% |
| Total | 70 | 100.0% |
School Enrollment by Age by Funding Source in Watts
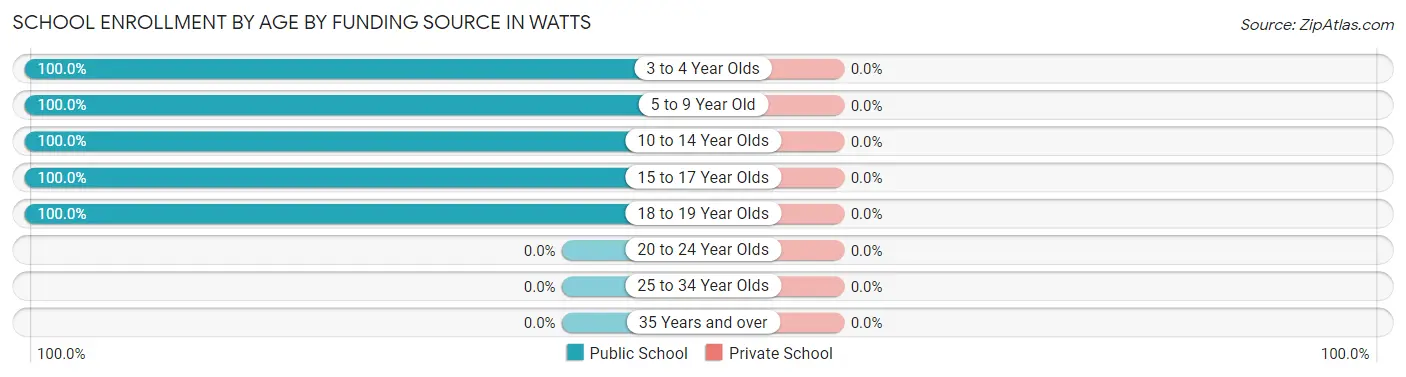
| Age Bracket | Public School | Private School |
| 3 to 4 Year Olds | 8 (100.0%) | 0 (0.0%) |
| 5 to 9 Year Old | 32 (100.0%) | 0 (0.0%) |
| 10 to 14 Year Olds | 23 (100.0%) | 0 (0.0%) |
| 15 to 17 Year Olds | 5 (100.0%) | 0 (0.0%) |
| 18 to 19 Year Olds | 2 (100.0%) | 0 (0.0%) |
| 20 to 24 Year Olds | 0 (0.0%) | 0 (0.0%) |
| 25 to 34 Year Olds | 0 (0.0%) | 0 (0.0%) |
| 35 Years and over | 0 (0.0%) | 0 (0.0%) |
| Total | 70 (100.0%) | 0 (0.0%) |
Educational Attainment by Field of Study in Watts
Social sciences (6 | 46.2%), bio, nature & agricultural (2 | 15.4%), multidisciplinary studies (2 | 15.4%), business (2 | 15.4%), and education (1 | 7.7%) are the most common fields of study among 13 individuals in Watts who have obtained a bachelor's degree or higher.
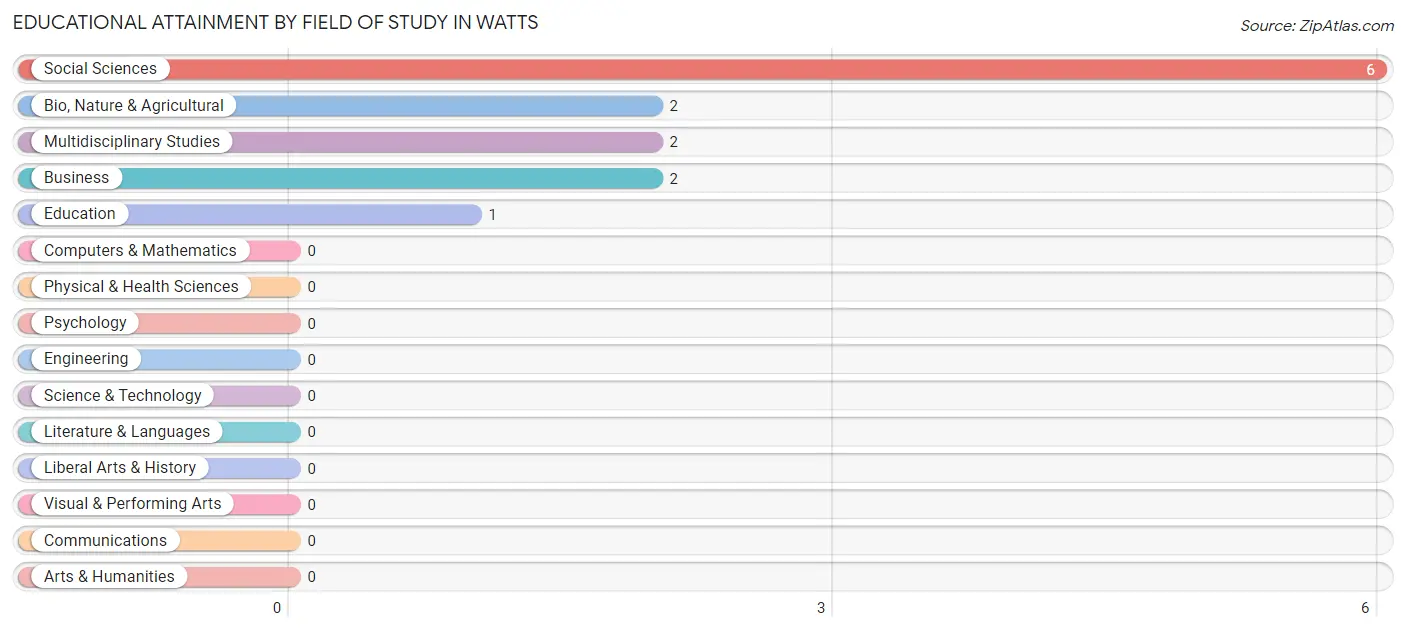
| Field of Study | # Graduates | % Graduates |
| Computers & Mathematics | 0 | 0.0% |
| Bio, Nature & Agricultural | 2 | 15.4% |
| Physical & Health Sciences | 0 | 0.0% |
| Psychology | 0 | 0.0% |
| Social Sciences | 6 | 46.2% |
| Engineering | 0 | 0.0% |
| Multidisciplinary Studies | 2 | 15.4% |
| Science & Technology | 0 | 0.0% |
| Business | 2 | 15.4% |
| Education | 1 | 7.7% |
| Literature & Languages | 0 | 0.0% |
| Liberal Arts & History | 0 | 0.0% |
| Visual & Performing Arts | 0 | 0.0% |
| Communications | 0 | 0.0% |
| Arts & Humanities | 0 | 0.0% |
| Total | 13 | 100.0% |
Transportation & Commute in Watts
Vehicle Availability by Sex in Watts
The most prevalent vehicle ownership categories in Watts are males with 2 vehicles (13, accounting for 36.1%) and females with 2 vehicles (18, making up 32.5%).

| Vehicles Available | Male | Female |
| No Vehicle | 0 (0.0%) | 0 (0.0%) |
| 1 Vehicle | 12 (33.3%) | 9 (22.5%) |
| 2 Vehicles | 13 (36.1%) | 18 (45.0%) |
| 3 Vehicles | 9 (25.0%) | 7 (17.5%) |
| 4 Vehicles | 2 (5.6%) | 4 (10.0%) |
| 5 or more Vehicles | 0 (0.0%) | 2 (5.0%) |
| Total | 36 (100.0%) | 40 (100.0%) |
Commute Time in Watts
The most frequently occuring commute durations in Watts are 15 to 19 minutes (17 commuters, 22.4%), 90 or more minutes (15 commuters, 19.7%), and 10 to 14 minutes (8 commuters, 10.5%).
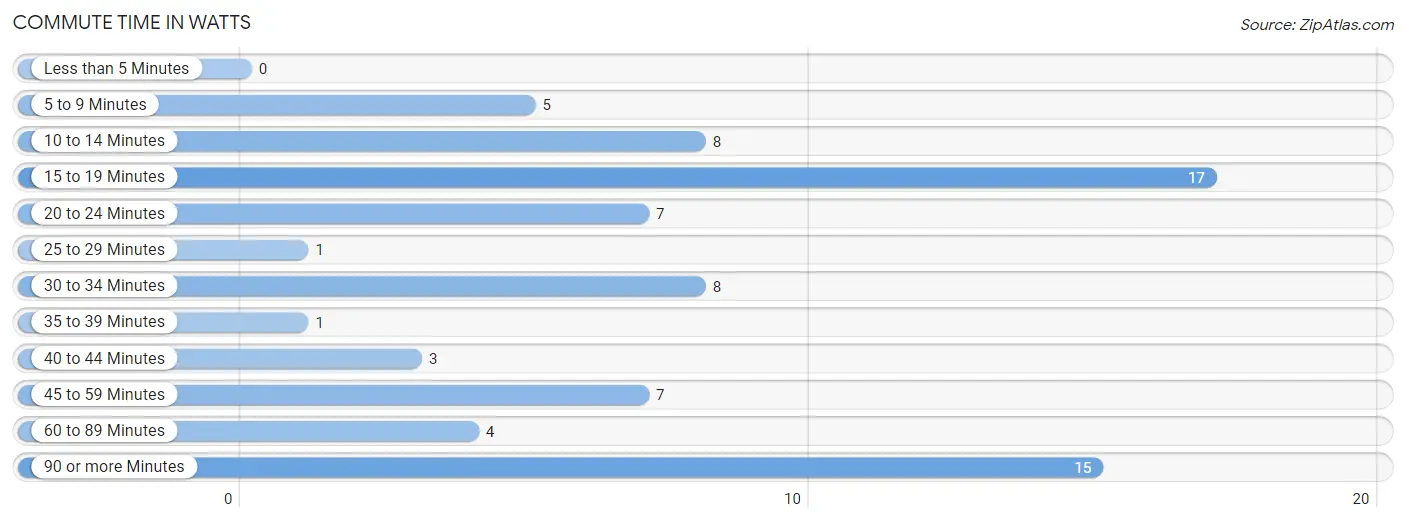
| Commute Time | # Commuters | % Commuters |
| Less than 5 Minutes | 0 | 0.0% |
| 5 to 9 Minutes | 5 | 6.6% |
| 10 to 14 Minutes | 8 | 10.5% |
| 15 to 19 Minutes | 17 | 22.4% |
| 20 to 24 Minutes | 7 | 9.2% |
| 25 to 29 Minutes | 1 | 1.3% |
| 30 to 34 Minutes | 8 | 10.5% |
| 35 to 39 Minutes | 1 | 1.3% |
| 40 to 44 Minutes | 3 | 4.0% |
| 45 to 59 Minutes | 7 | 9.2% |
| 60 to 89 Minutes | 4 | 5.3% |
| 90 or more Minutes | 15 | 19.7% |
Commute Time by Sex in Watts
The most common commute times in Watts are 15 to 19 minutes (11 commuters, 30.6%) for males and 90 or more minutes (11 commuters, 27.5%) for females.
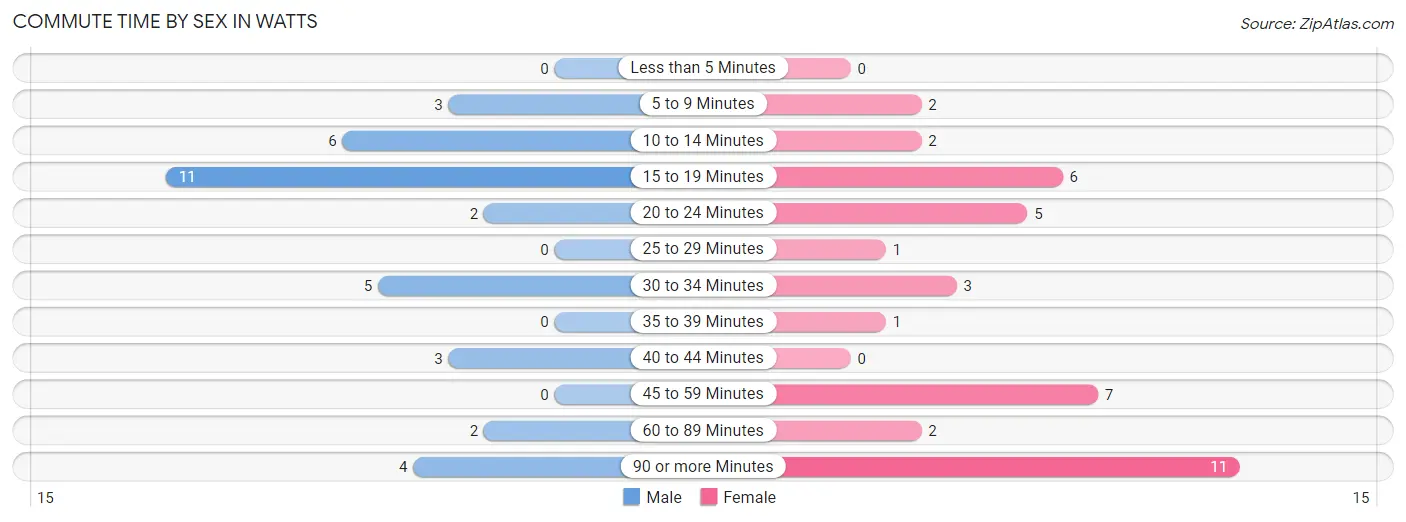
| Commute Time | Male | Female |
| Less than 5 Minutes | 0 (0.0%) | 0 (0.0%) |
| 5 to 9 Minutes | 3 (8.3%) | 2 (5.0%) |
| 10 to 14 Minutes | 6 (16.7%) | 2 (5.0%) |
| 15 to 19 Minutes | 11 (30.6%) | 6 (15.0%) |
| 20 to 24 Minutes | 2 (5.6%) | 5 (12.5%) |
| 25 to 29 Minutes | 0 (0.0%) | 1 (2.5%) |
| 30 to 34 Minutes | 5 (13.9%) | 3 (7.5%) |
| 35 to 39 Minutes | 0 (0.0%) | 1 (2.5%) |
| 40 to 44 Minutes | 3 (8.3%) | 0 (0.0%) |
| 45 to 59 Minutes | 0 (0.0%) | 7 (17.5%) |
| 60 to 89 Minutes | 2 (5.6%) | 2 (5.0%) |
| 90 or more Minutes | 4 (11.1%) | 11 (27.5%) |
Time of Departure to Work by Sex in Watts
The most frequent times of departure to work in Watts are 7:00 AM to 7:29 AM (11, 30.6%) for males and 6:00 AM to 6:29 AM (11, 27.5%) for females.
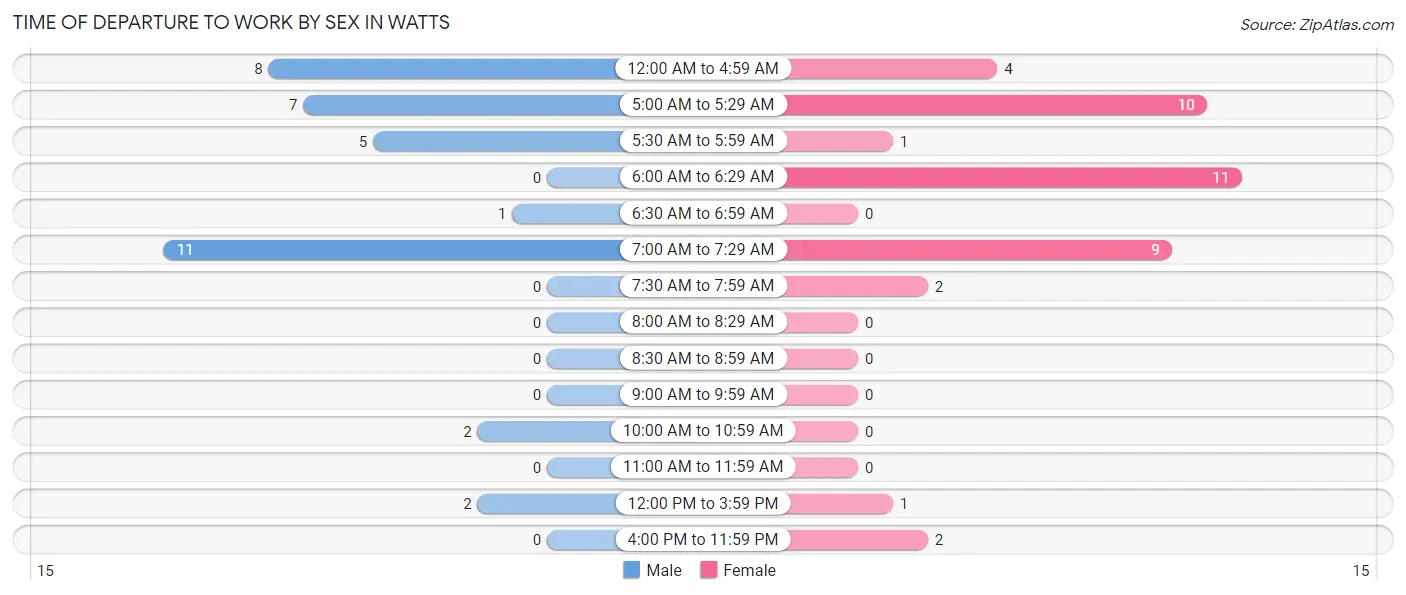
| Time of Departure | Male | Female |
| 12:00 AM to 4:59 AM | 8 (22.2%) | 4 (10.0%) |
| 5:00 AM to 5:29 AM | 7 (19.4%) | 10 (25.0%) |
| 5:30 AM to 5:59 AM | 5 (13.9%) | 1 (2.5%) |
| 6:00 AM to 6:29 AM | 0 (0.0%) | 11 (27.5%) |
| 6:30 AM to 6:59 AM | 1 (2.8%) | 0 (0.0%) |
| 7:00 AM to 7:29 AM | 11 (30.6%) | 9 (22.5%) |
| 7:30 AM to 7:59 AM | 0 (0.0%) | 2 (5.0%) |
| 8:00 AM to 8:29 AM | 0 (0.0%) | 0 (0.0%) |
| 8:30 AM to 8:59 AM | 0 (0.0%) | 0 (0.0%) |
| 9:00 AM to 9:59 AM | 0 (0.0%) | 0 (0.0%) |
| 10:00 AM to 10:59 AM | 2 (5.6%) | 0 (0.0%) |
| 11:00 AM to 11:59 AM | 0 (0.0%) | 0 (0.0%) |
| 12:00 PM to 3:59 PM | 2 (5.6%) | 1 (2.5%) |
| 4:00 PM to 11:59 PM | 0 (0.0%) | 2 (5.0%) |
| Total | 36 (100.0%) | 40 (100.0%) |
Housing Occupancy in Watts
Occupancy by Ownership in Watts
Of the total 100 dwellings in Watts, owner-occupied units account for 64 (64.0%), while renter-occupied units make up 36 (36.0%).
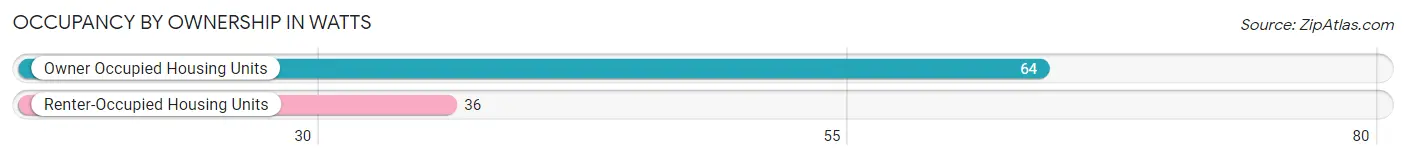
| Occupancy | # Housing Units | % Housing Units |
| Owner Occupied Housing Units | 64 | 64.0% |
| Renter-Occupied Housing Units | 36 | 36.0% |
| Total Occupied Housing Units | 100 | 100.0% |
Occupancy by Household Size in Watts
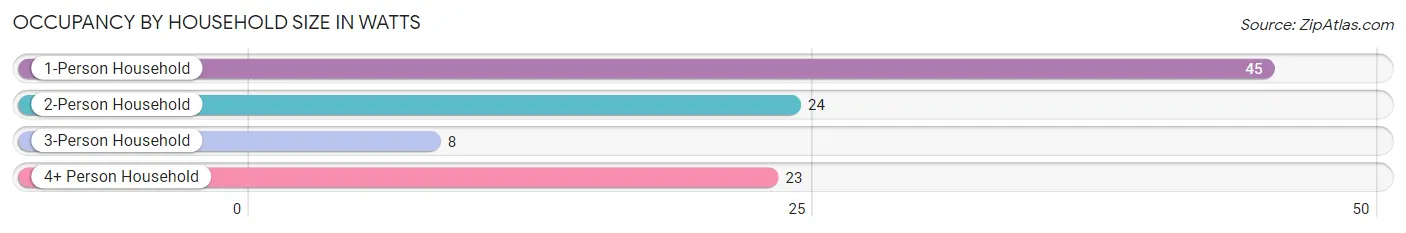
| Household Size | # Housing Units | % Housing Units |
| 1-Person Household | 45 | 45.0% |
| 2-Person Household | 24 | 24.0% |
| 3-Person Household | 8 | 8.0% |
| 4+ Person Household | 23 | 23.0% |
| Total Housing Units | 100 | 100.0% |
Occupancy by Ownership by Household Size in Watts
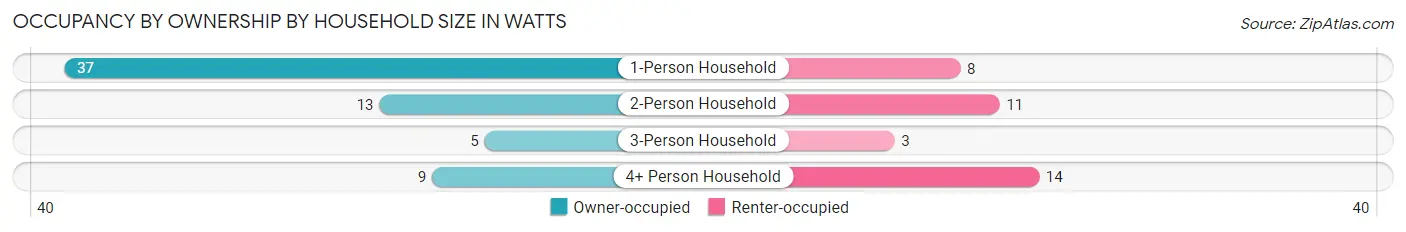
| Household Size | Owner-occupied | Renter-occupied |
| 1-Person Household | 37 (82.2%) | 8 (17.8%) |
| 2-Person Household | 13 (54.2%) | 11 (45.8%) |
| 3-Person Household | 5 (62.5%) | 3 (37.5%) |
| 4+ Person Household | 9 (39.1%) | 14 (60.9%) |
| Total Housing Units | 64 (64.0%) | 36 (36.0%) |
Occupancy by Educational Attainment in Watts
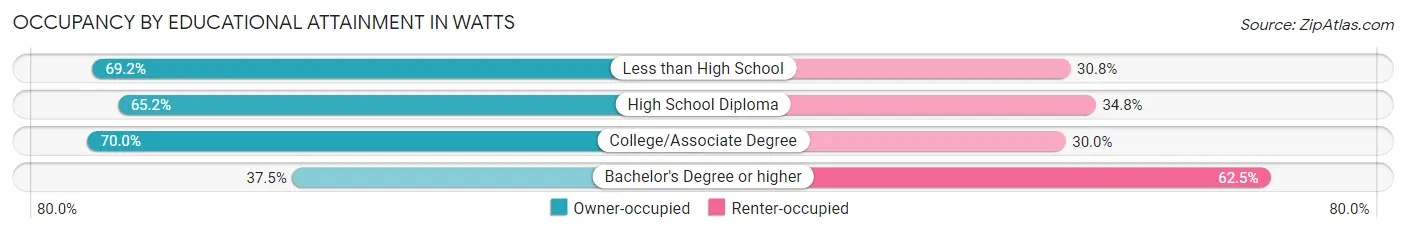
| Household Size | Owner-occupied | Renter-occupied |
| Less than High School | 9 (69.2%) | 4 (30.8%) |
| High School Diploma | 45 (65.2%) | 24 (34.8%) |
| College/Associate Degree | 7 (70.0%) | 3 (30.0%) |
| Bachelor's Degree or higher | 3 (37.5%) | 5 (62.5%) |
Occupancy by Age of Householder in Watts
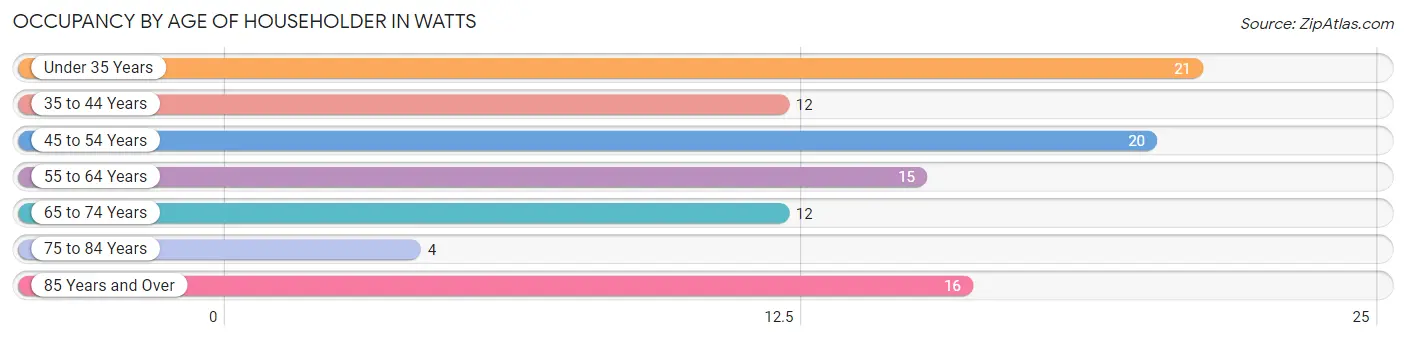
| Age Bracket | # Households | % Households |
| Under 35 Years | 21 | 21.0% |
| 35 to 44 Years | 12 | 12.0% |
| 45 to 54 Years | 20 | 20.0% |
| 55 to 64 Years | 15 | 15.0% |
| 65 to 74 Years | 12 | 12.0% |
| 75 to 84 Years | 4 | 4.0% |
| 85 Years and Over | 16 | 16.0% |
| Total | 100 | 100.0% |
Housing Finances in Watts
Median Income by Occupancy in Watts
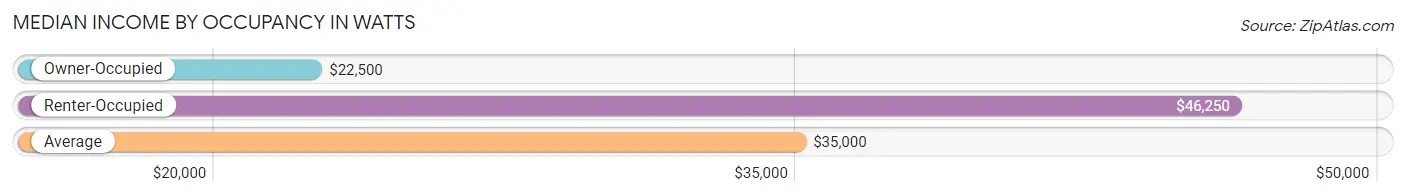
| Occupancy Type | # Households | Median Income |
| Owner-Occupied | 64 (64.0%) | $22,500 |
| Renter-Occupied | 36 (36.0%) | $46,250 |
| Average | 100 (100.0%) | $35,000 |
Occupancy by Householder Income Bracket in Watts
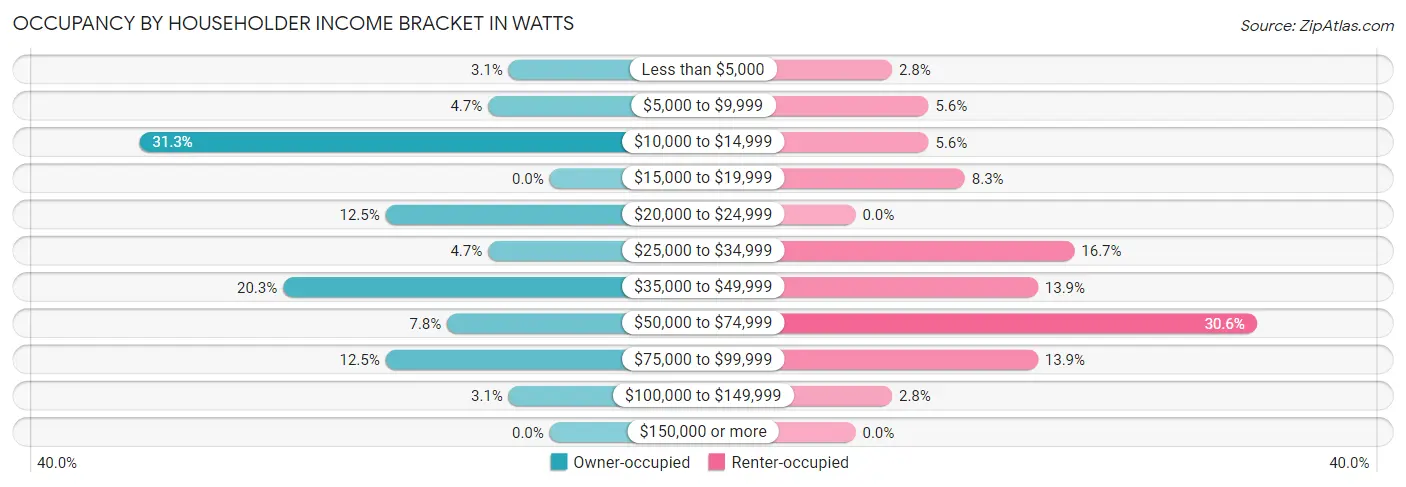
| Income Bracket | Owner-occupied | Renter-occupied |
| Less than $5,000 | 2 (3.1%) | 1 (2.8%) |
| $5,000 to $9,999 | 3 (4.7%) | 2 (5.6%) |
| $10,000 to $14,999 | 20 (31.2%) | 2 (5.6%) |
| $15,000 to $19,999 | 0 (0.0%) | 3 (8.3%) |
| $20,000 to $24,999 | 8 (12.5%) | 0 (0.0%) |
| $25,000 to $34,999 | 3 (4.7%) | 6 (16.7%) |
| $35,000 to $49,999 | 13 (20.3%) | 5 (13.9%) |
| $50,000 to $74,999 | 5 (7.8%) | 11 (30.6%) |
| $75,000 to $99,999 | 8 (12.5%) | 5 (13.9%) |
| $100,000 to $149,999 | 2 (3.1%) | 1 (2.8%) |
| $150,000 or more | 0 (0.0%) | 0 (0.0%) |
| Total | 64 (100.0%) | 36 (100.0%) |
Monthly Housing Cost Tiers in Watts
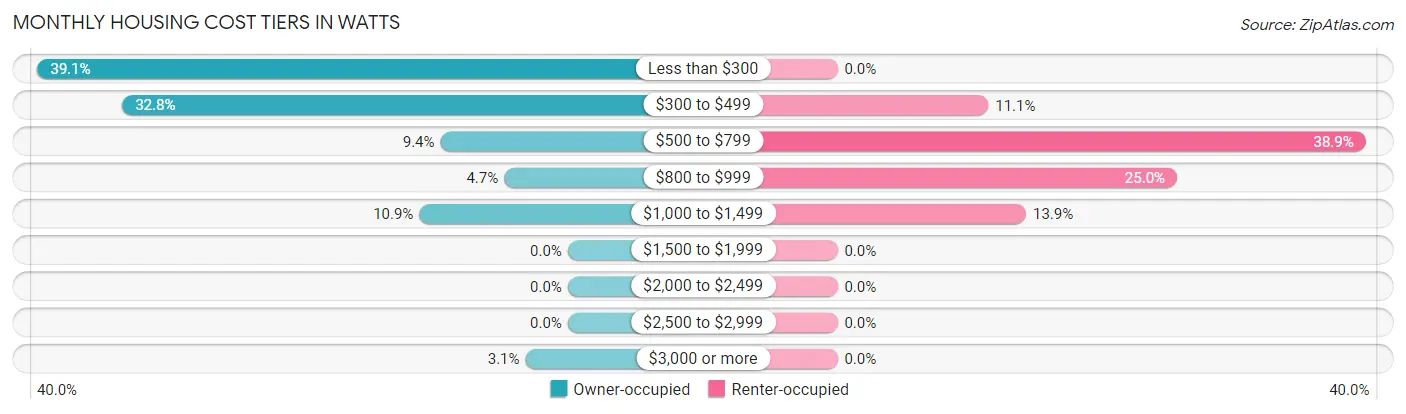
| Monthly Cost | Owner-occupied | Renter-occupied |
| Less than $300 | 25 (39.1%) | 0 (0.0%) |
| $300 to $499 | 21 (32.8%) | 4 (11.1%) |
| $500 to $799 | 6 (9.4%) | 14 (38.9%) |
| $800 to $999 | 3 (4.7%) | 9 (25.0%) |
| $1,000 to $1,499 | 7 (10.9%) | 5 (13.9%) |
| $1,500 to $1,999 | 0 (0.0%) | 0 (0.0%) |
| $2,000 to $2,499 | 0 (0.0%) | 0 (0.0%) |
| $2,500 to $2,999 | 0 (0.0%) | 0 (0.0%) |
| $3,000 or more | 2 (3.1%) | 0 (0.0%) |
| Total | 64 (100.0%) | 36 (100.0%) |
Physical Housing Characteristics in Watts
Housing Structures in Watts
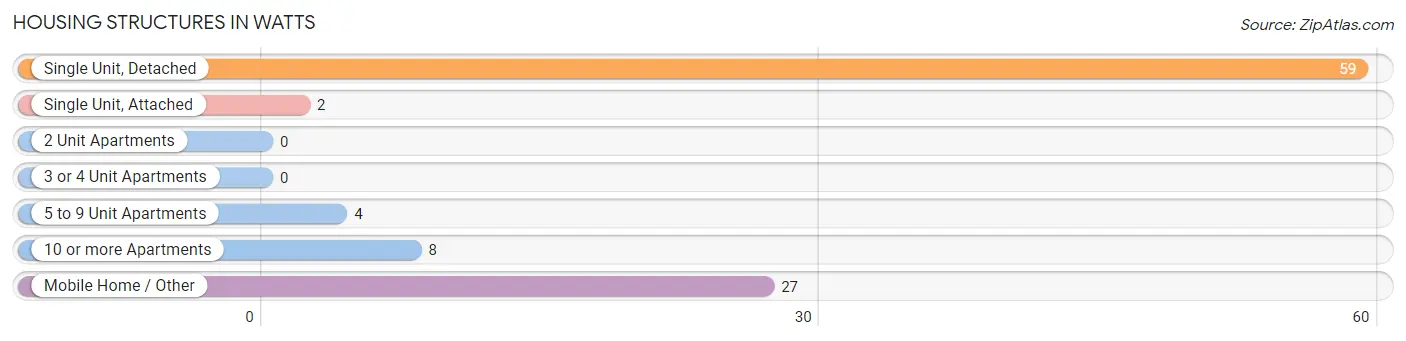
| Structure Type | # Housing Units | % Housing Units |
| Single Unit, Detached | 59 | 59.0% |
| Single Unit, Attached | 2 | 2.0% |
| 2 Unit Apartments | 0 | 0.0% |
| 3 or 4 Unit Apartments | 0 | 0.0% |
| 5 to 9 Unit Apartments | 4 | 4.0% |
| 10 or more Apartments | 8 | 8.0% |
| Mobile Home / Other | 27 | 27.0% |
| Total | 100 | 100.0% |
Housing Structures by Occupancy in Watts
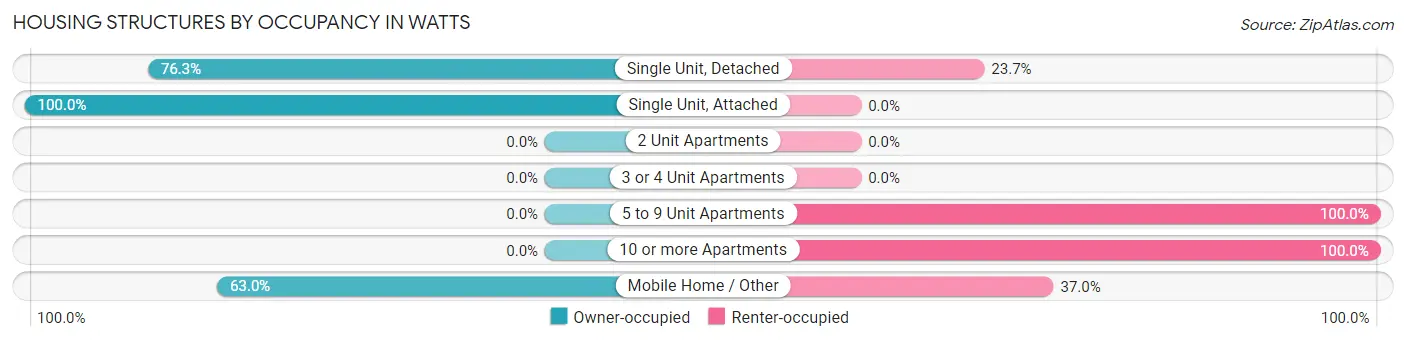
| Structure Type | Owner-occupied | Renter-occupied |
| Single Unit, Detached | 45 (76.3%) | 14 (23.7%) |
| Single Unit, Attached | 2 (100.0%) | 0 (0.0%) |
| 2 Unit Apartments | 0 (0.0%) | 0 (0.0%) |
| 3 or 4 Unit Apartments | 0 (0.0%) | 0 (0.0%) |
| 5 to 9 Unit Apartments | 0 (0.0%) | 4 (100.0%) |
| 10 or more Apartments | 0 (0.0%) | 8 (100.0%) |
| Mobile Home / Other | 17 (63.0%) | 10 (37.0%) |
| Total | 64 (64.0%) | 36 (36.0%) |
Housing Structures by Number of Rooms in Watts
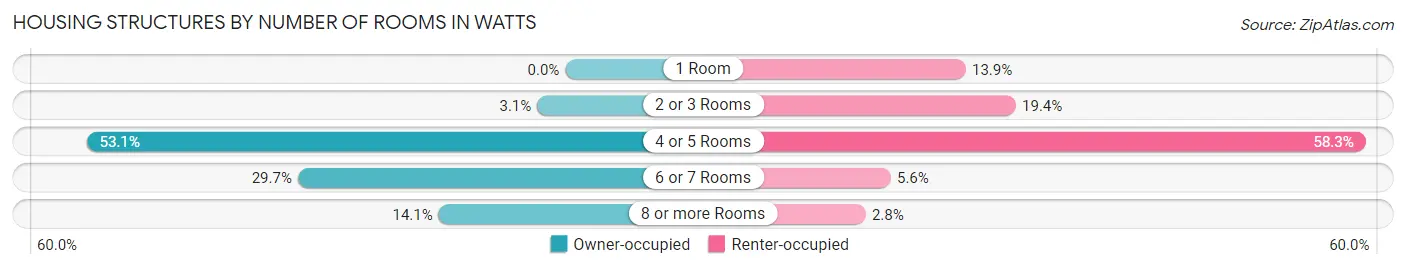
| Number of Rooms | Owner-occupied | Renter-occupied |
| 1 Room | 0 (0.0%) | 5 (13.9%) |
| 2 or 3 Rooms | 2 (3.1%) | 7 (19.4%) |
| 4 or 5 Rooms | 34 (53.1%) | 21 (58.3%) |
| 6 or 7 Rooms | 19 (29.7%) | 2 (5.6%) |
| 8 or more Rooms | 9 (14.1%) | 1 (2.8%) |
| Total | 64 (100.0%) | 36 (100.0%) |
Housing Structure by Heating Type in Watts
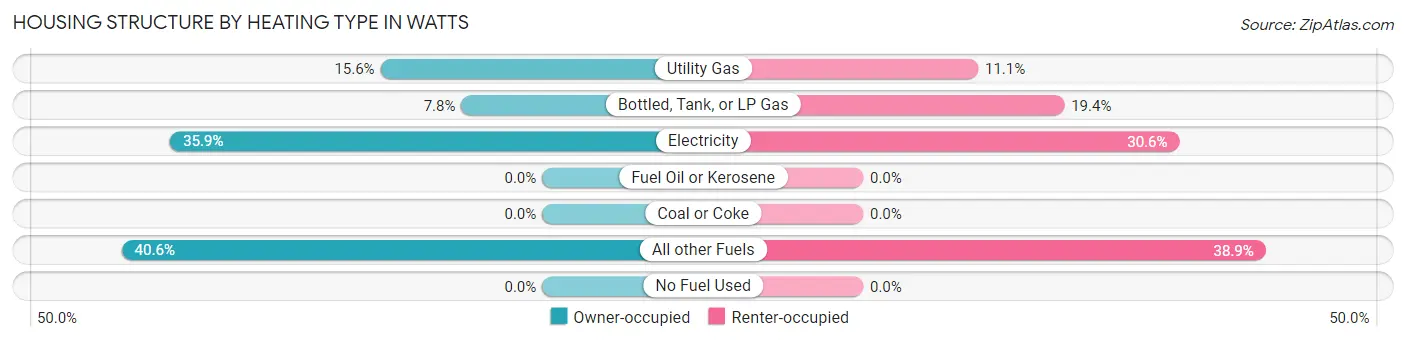
| Heating Type | Owner-occupied | Renter-occupied |
| Utility Gas | 10 (15.6%) | 4 (11.1%) |
| Bottled, Tank, or LP Gas | 5 (7.8%) | 7 (19.4%) |
| Electricity | 23 (35.9%) | 11 (30.6%) |
| Fuel Oil or Kerosene | 0 (0.0%) | 0 (0.0%) |
| Coal or Coke | 0 (0.0%) | 0 (0.0%) |
| All other Fuels | 26 (40.6%) | 14 (38.9%) |
| No Fuel Used | 0 (0.0%) | 0 (0.0%) |
| Total | 64 (100.0%) | 36 (100.0%) |
Household Vehicle Usage in Watts
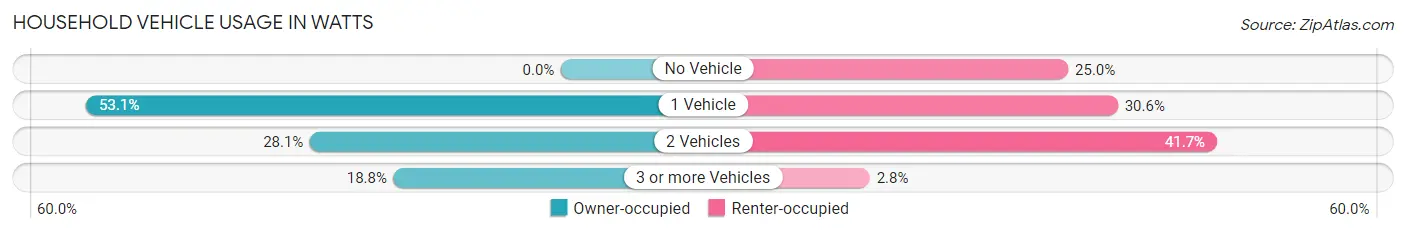
| Vehicles per Household | Owner-occupied | Renter-occupied |
| No Vehicle | 0 (0.0%) | 9 (25.0%) |
| 1 Vehicle | 34 (53.1%) | 11 (30.6%) |
| 2 Vehicles | 18 (28.1%) | 15 (41.7%) |
| 3 or more Vehicles | 12 (18.8%) | 1 (2.8%) |
| Total | 64 (100.0%) | 36 (100.0%) |
Real Estate & Mortgages in Watts
Real Estate and Mortgage Overview in Watts
| Characteristic | Without Mortgage | With Mortgage |
| Housing Units | 51 | 13 |
| Median Property Value | $102,100 | $53,000 |
| Median Household Income | $21,964 | $0 |
| Monthly Housing Costs | $375 | $0 |
| Real Estate Taxes | $227 | $0 |
Property Value by Mortgage Status in Watts
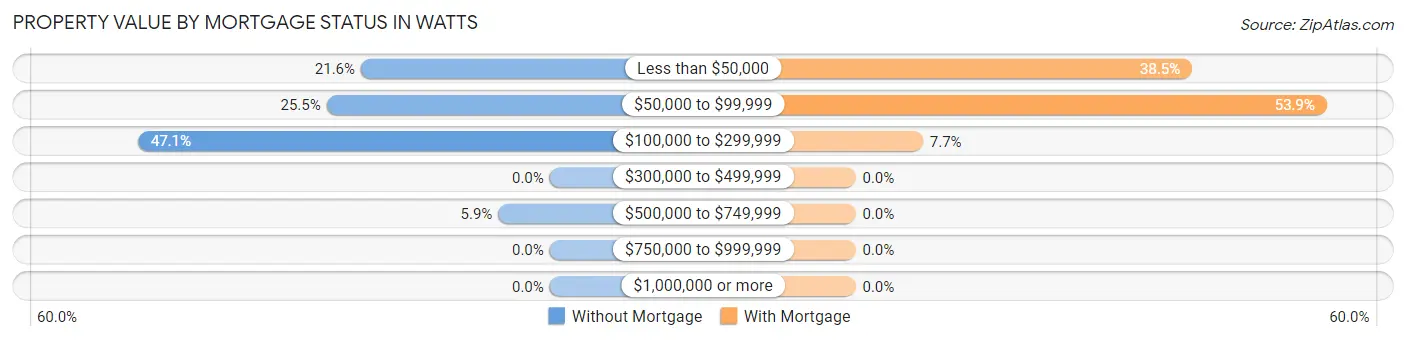
| Property Value | Without Mortgage | With Mortgage |
| Less than $50,000 | 11 (21.6%) | 5 (38.5%) |
| $50,000 to $99,999 | 13 (25.5%) | 7 (53.8%) |
| $100,000 to $299,999 | 24 (47.1%) | 1 (7.7%) |
| $300,000 to $499,999 | 0 (0.0%) | 0 (0.0%) |
| $500,000 to $749,999 | 3 (5.9%) | 0 (0.0%) |
| $750,000 to $999,999 | 0 (0.0%) | 0 (0.0%) |
| $1,000,000 or more | 0 (0.0%) | 0 (0.0%) |
| Total | 51 (100.0%) | 13 (100.0%) |
Household Income by Mortgage Status in Watts
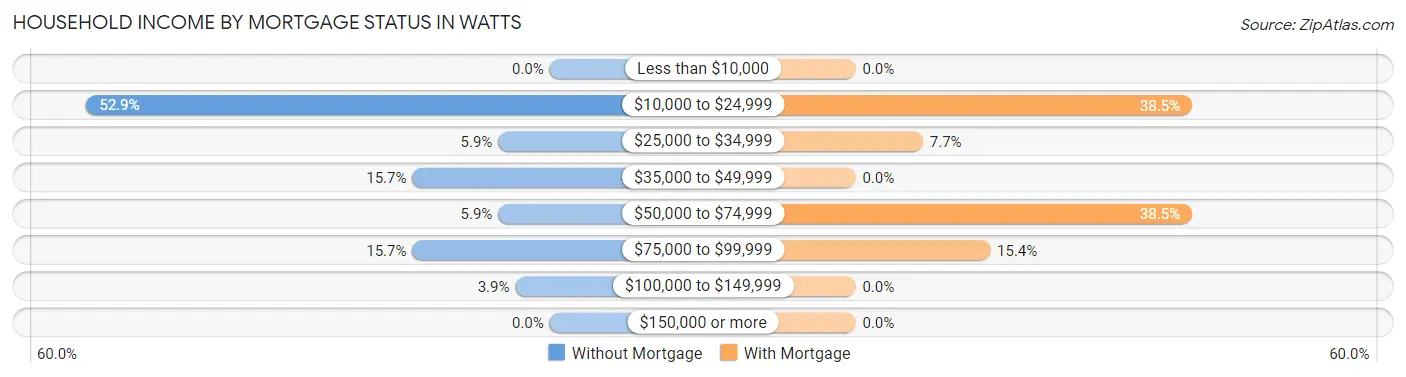
| Household Income | Without Mortgage | With Mortgage |
| Less than $10,000 | 0 (0.0%) | 0 (0.0%) |
| $10,000 to $24,999 | 27 (52.9%) | 5 (38.5%) |
| $25,000 to $34,999 | 3 (5.9%) | 1 (7.7%) |
| $35,000 to $49,999 | 8 (15.7%) | 0 (0.0%) |
| $50,000 to $74,999 | 3 (5.9%) | 5 (38.5%) |
| $75,000 to $99,999 | 8 (15.7%) | 2 (15.4%) |
| $100,000 to $149,999 | 2 (3.9%) | 0 (0.0%) |
| $150,000 or more | 0 (0.0%) | 0 (0.0%) |
| Total | 51 (100.0%) | 13 (100.0%) |
Property Value to Household Income Ratio in Watts
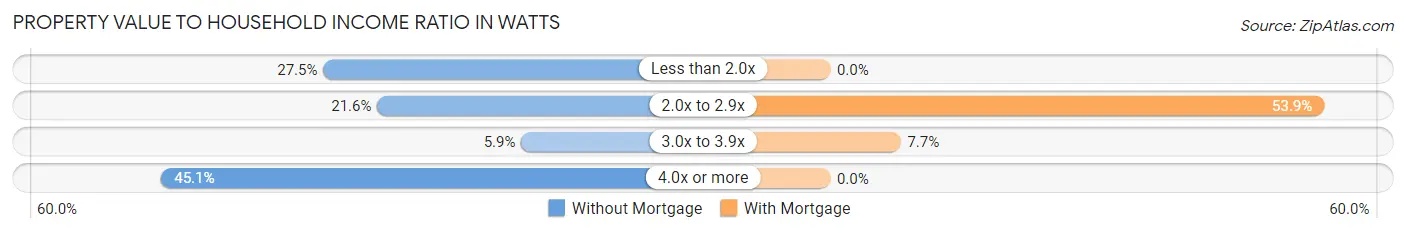
| Value-to-Income Ratio | Without Mortgage | With Mortgage |
| Less than 2.0x | 14 (27.5%) | 0 (0.0%) |
| 2.0x to 2.9x | 11 (21.6%) | 7 (53.8%) |
| 3.0x to 3.9x | 3 (5.9%) | 1 (7.7%) |
| 4.0x or more | 23 (45.1%) | 0 (0.0%) |
| Total | 51 (100.0%) | 13 (100.0%) |
Real Estate Taxes by Mortgage Status in Watts
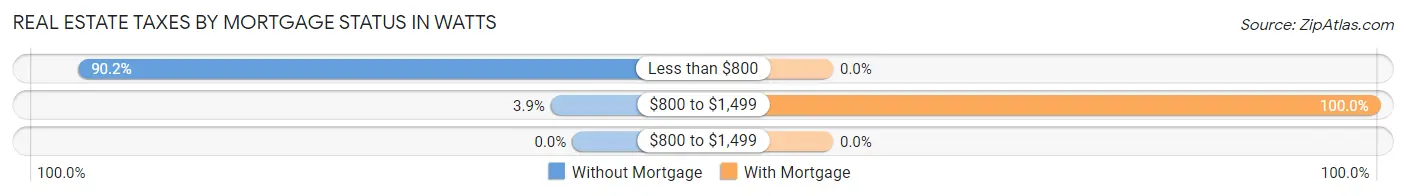
| Property Taxes | Without Mortgage | With Mortgage |
| Less than $800 | 46 (90.2%) | 0 (0.0%) |
| $800 to $1,499 | 2 (3.9%) | 13 (100.0%) |
| $800 to $1,499 | 0 (0.0%) | 0 (0.0%) |
| Total | 51 (100.0%) | 13 (100.0%) |
Health & Disability in Watts
Health Insurance Coverage by Age in Watts
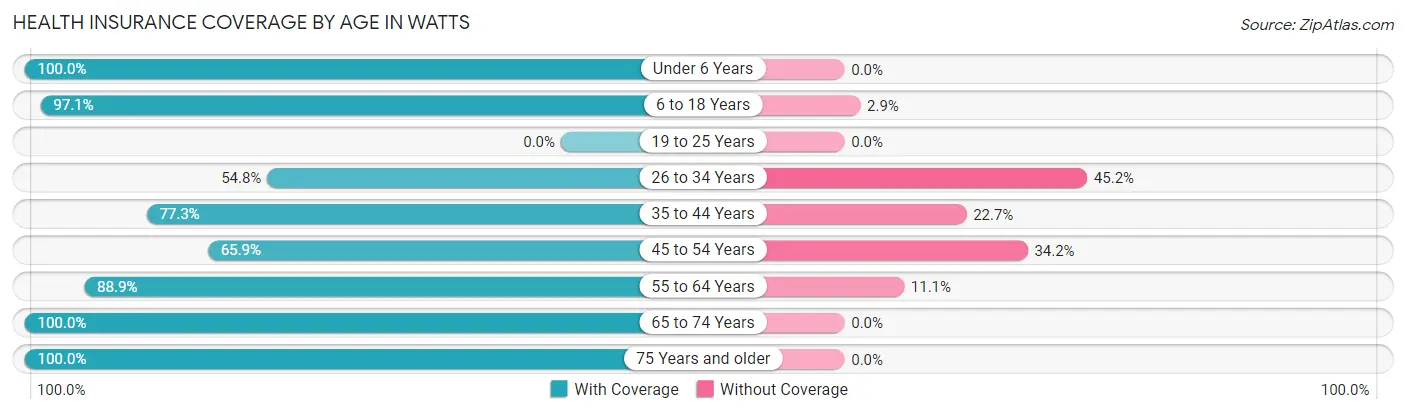
| Age Bracket | With Coverage | Without Coverage |
| Under 6 Years | 26 (100.0%) | 0 (0.0%) |
| 6 to 18 Years | 66 (97.1%) | 2 (2.9%) |
| 19 to 25 Years | 0 (0.0%) | 0 (0.0%) |
| 26 to 34 Years | 23 (54.8%) | 19 (45.2%) |
| 35 to 44 Years | 17 (77.3%) | 5 (22.7%) |
| 45 to 54 Years | 27 (65.8%) | 14 (34.2%) |
| 55 to 64 Years | 16 (88.9%) | 2 (11.1%) |
| 65 to 74 Years | 18 (100.0%) | 0 (0.0%) |
| 75 Years and older | 22 (100.0%) | 0 (0.0%) |
| Total | 215 (83.7%) | 42 (16.3%) |
Health Insurance Coverage by Citizenship Status in Watts
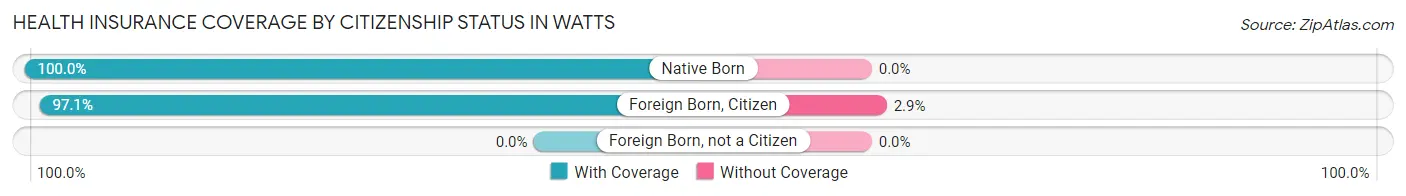
| Citizenship Status | With Coverage | Without Coverage |
| Native Born | 26 (100.0%) | 0 (0.0%) |
| Foreign Born, Citizen | 66 (97.1%) | 2 (2.9%) |
| Foreign Born, not a Citizen | 0 (0.0%) | 0 (0.0%) |
Health Insurance Coverage by Household Income in Watts
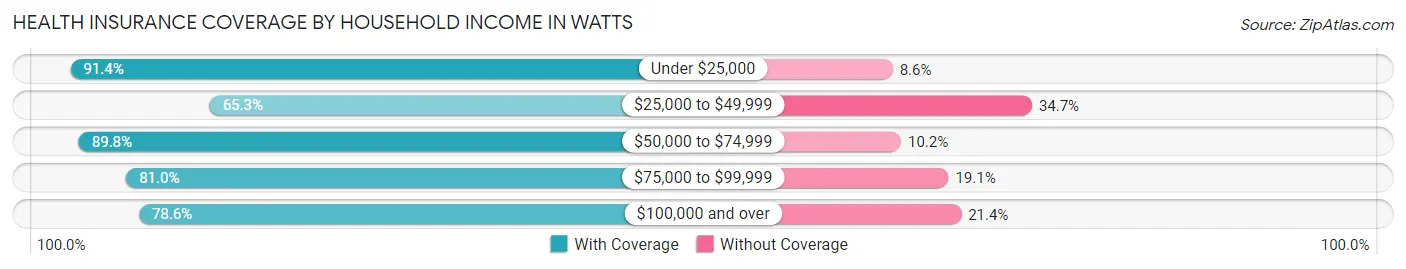
| Household Income | With Coverage | Without Coverage |
| Under $25,000 | 85 (91.4%) | 8 (8.6%) |
| $25,000 to $49,999 | 32 (65.3%) | 17 (34.7%) |
| $50,000 to $74,999 | 53 (89.8%) | 6 (10.2%) |
| $75,000 to $99,999 | 34 (80.9%) | 8 (19.1%) |
| $100,000 and over | 11 (78.6%) | 3 (21.4%) |
Public vs Private Health Insurance Coverage by Age in Watts
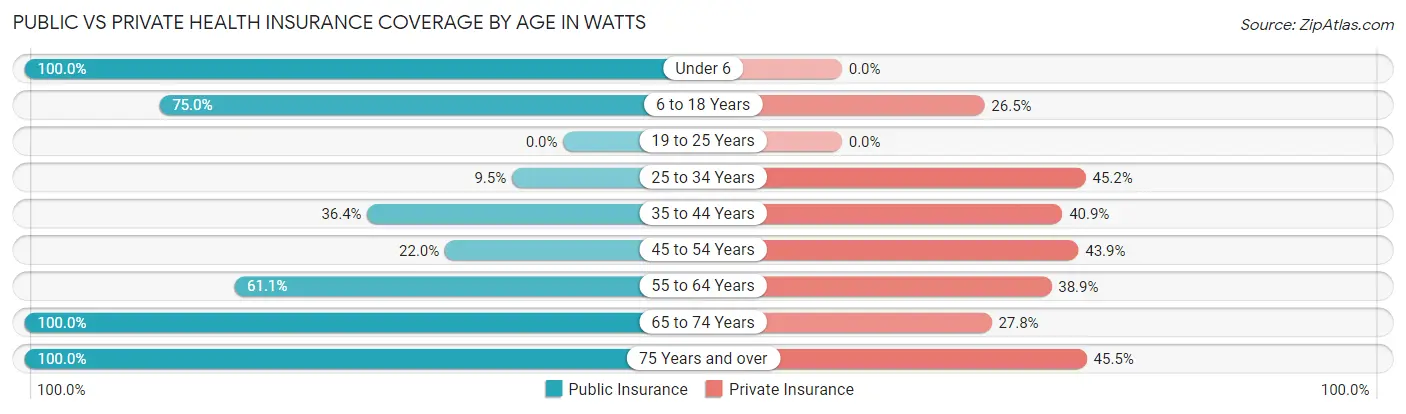
| Age Bracket | Public Insurance | Private Insurance |
| Under 6 | 26 (100.0%) | 0 (0.0%) |
| 6 to 18 Years | 51 (75.0%) | 18 (26.5%) |
| 19 to 25 Years | 0 (0.0%) | 0 (0.0%) |
| 25 to 34 Years | 4 (9.5%) | 19 (45.2%) |
| 35 to 44 Years | 8 (36.4%) | 9 (40.9%) |
| 45 to 54 Years | 9 (22.0%) | 18 (43.9%) |
| 55 to 64 Years | 11 (61.1%) | 7 (38.9%) |
| 65 to 74 Years | 18 (100.0%) | 5 (27.8%) |
| 75 Years and over | 22 (100.0%) | 10 (45.5%) |
| Total | 149 (58.0%) | 86 (33.5%) |
Disability Status by Sex by Age in Watts
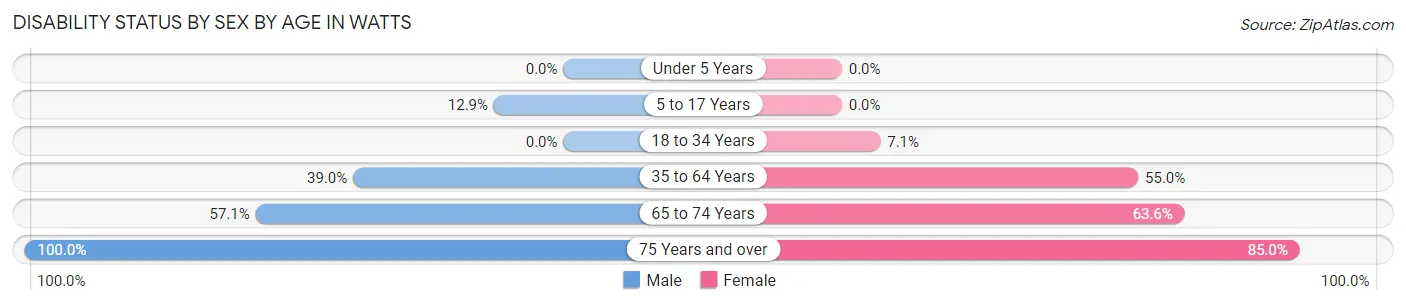
| Age Bracket | Male | Female |
| Under 5 Years | 0 (0.0%) | 0 (0.0%) |
| 5 to 17 Years | 4 (12.9%) | 0 (0.0%) |
| 18 to 34 Years | 0 (0.0%) | 2 (7.1%) |
| 35 to 64 Years | 16 (39.0%) | 22 (55.0%) |
| 65 to 74 Years | 4 (57.1%) | 7 (63.6%) |
| 75 Years and over | 2 (100.0%) | 17 (85.0%) |
Disability Class by Sex by Age in Watts
Disability Class: Hearing Difficulty
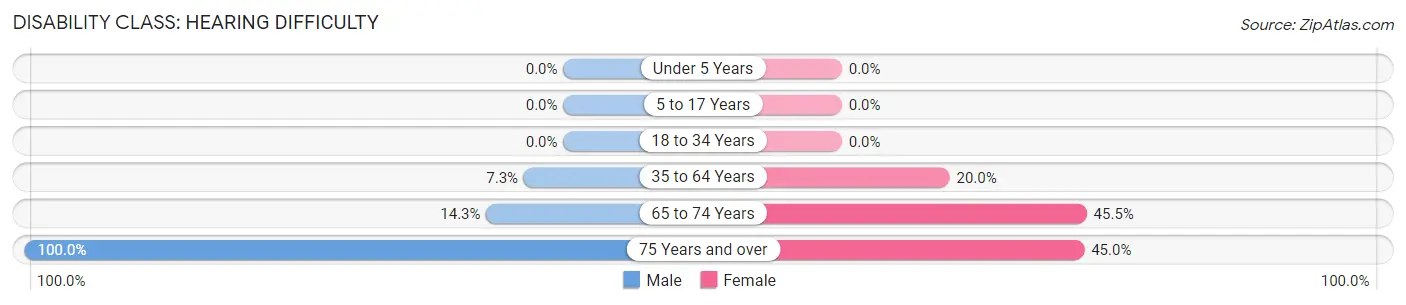
| Age Bracket | Male | Female |
| Under 5 Years | 0 (0.0%) | 0 (0.0%) |
| 5 to 17 Years | 0 (0.0%) | 0 (0.0%) |
| 18 to 34 Years | 0 (0.0%) | 0 (0.0%) |
| 35 to 64 Years | 3 (7.3%) | 8 (20.0%) |
| 65 to 74 Years | 1 (14.3%) | 5 (45.5%) |
| 75 Years and over | 2 (100.0%) | 9 (45.0%) |
Disability Class: Vision Difficulty
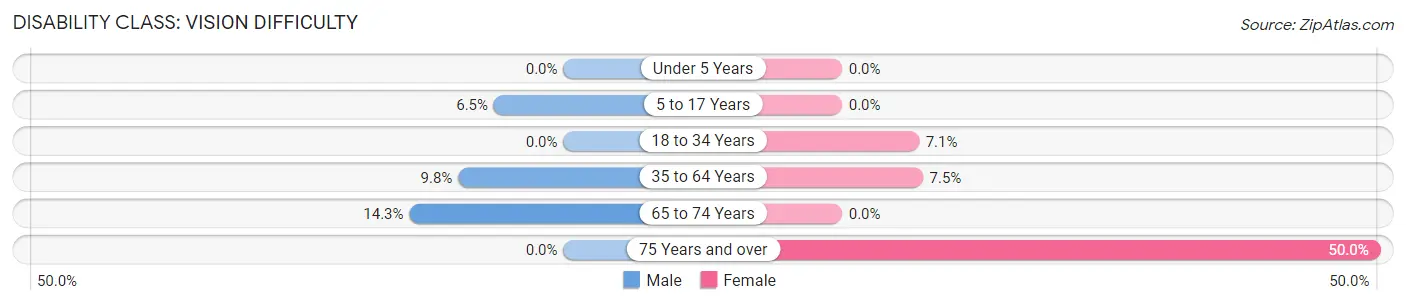
| Age Bracket | Male | Female |
| Under 5 Years | 0 (0.0%) | 0 (0.0%) |
| 5 to 17 Years | 2 (6.5%) | 0 (0.0%) |
| 18 to 34 Years | 0 (0.0%) | 2 (7.1%) |
| 35 to 64 Years | 4 (9.8%) | 3 (7.5%) |
| 65 to 74 Years | 1 (14.3%) | 0 (0.0%) |
| 75 Years and over | 0 (0.0%) | 10 (50.0%) |
Disability Class: Cognitive Difficulty
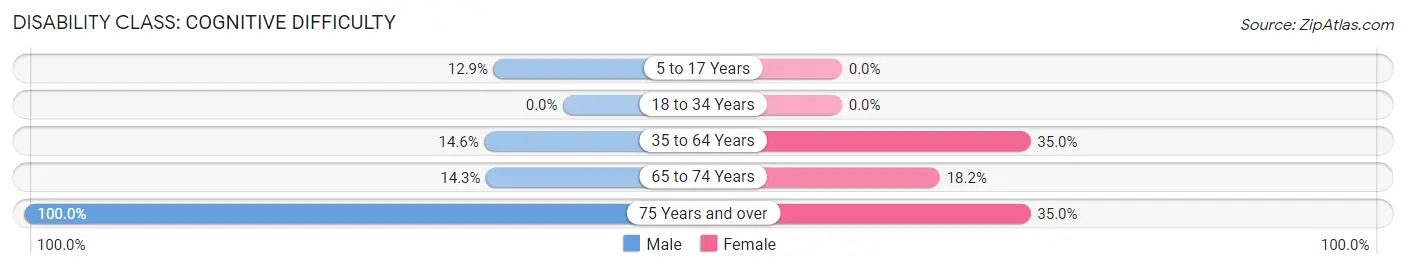
| Age Bracket | Male | Female |
| 5 to 17 Years | 4 (12.9%) | 0 (0.0%) |
| 18 to 34 Years | 0 (0.0%) | 0 (0.0%) |
| 35 to 64 Years | 6 (14.6%) | 14 (35.0%) |
| 65 to 74 Years | 1 (14.3%) | 2 (18.2%) |
| 75 Years and over | 2 (100.0%) | 7 (35.0%) |
Disability Class: Ambulatory Difficulty
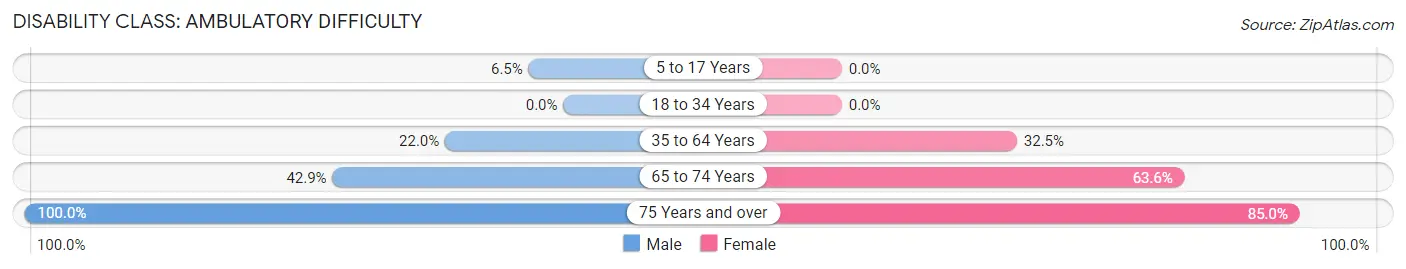
| Age Bracket | Male | Female |
| 5 to 17 Years | 2 (6.5%) | 0 (0.0%) |
| 18 to 34 Years | 0 (0.0%) | 0 (0.0%) |
| 35 to 64 Years | 9 (22.0%) | 13 (32.5%) |
| 65 to 74 Years | 3 (42.9%) | 7 (63.6%) |
| 75 Years and over | 2 (100.0%) | 17 (85.0%) |
Disability Class: Self-Care Difficulty
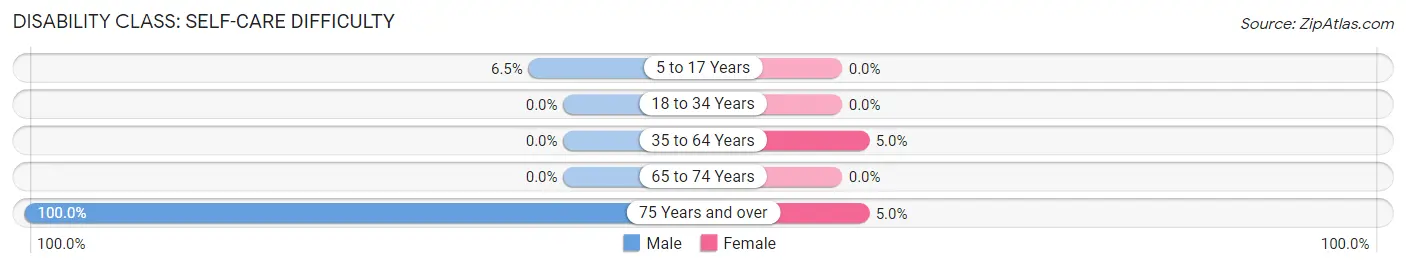
| Age Bracket | Male | Female |
| 5 to 17 Years | 2 (6.5%) | 0 (0.0%) |
| 18 to 34 Years | 0 (0.0%) | 0 (0.0%) |
| 35 to 64 Years | 0 (0.0%) | 2 (5.0%) |
| 65 to 74 Years | 0 (0.0%) | 0 (0.0%) |
| 75 Years and over | 2 (100.0%) | 1 (5.0%) |
Technology Access in Watts
Computing Device Access in Watts
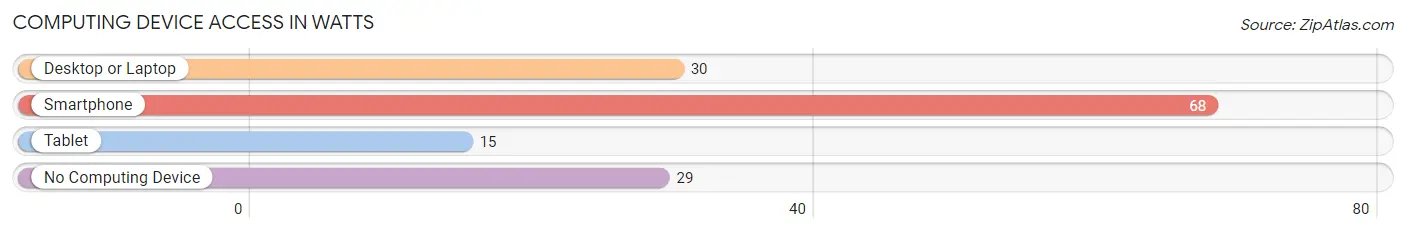
| Device Type | # Households | % Households |
| Desktop or Laptop | 30 | 30.0% |
| Smartphone | 68 | 68.0% |
| Tablet | 15 | 15.0% |
| No Computing Device | 29 | 29.0% |
| Total | 100 | 100.0% |
Internet Access in Watts
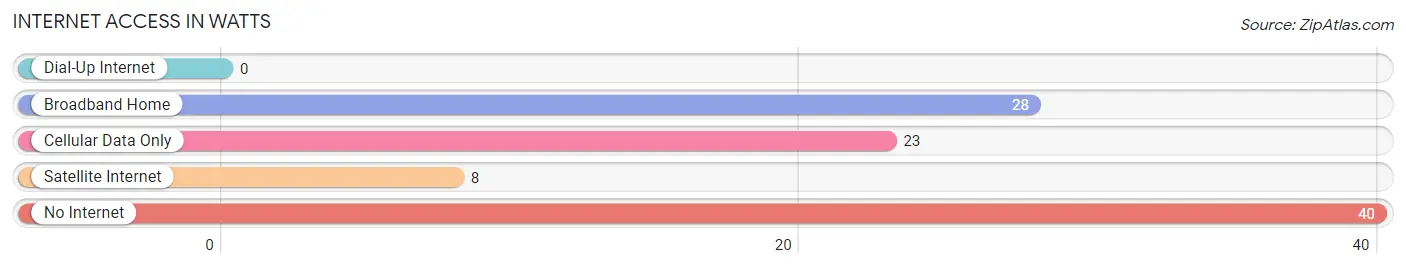
| Internet Type | # Households | % Households |
| Dial-Up Internet | 0 | 0.0% |
| Broadband Home | 28 | 28.0% |
| Cellular Data Only | 23 | 23.0% |
| Satellite Internet | 8 | 8.0% |
| No Internet | 40 | 40.0% |
| Total | 100 | 100.0% |
Watts Summary
Watts is a small town located in the southeastern corner of Oklahoma, in the United States. It is situated in the foothills of the Ouachita Mountains, and is part of the Choctaw Nation. The town was founded in 1891, and has a population of approximately 1,000 people.
Geography
Watts is located in the foothills of the Ouachita Mountains, in the southeastern corner of Oklahoma. It is situated in the Choctaw Nation, and is bordered by the towns of Bokoshe, Pocola, and Spiro. The town is located at an elevation of 890 feet, and has a total area of 1.2 square miles. The climate in Watts is humid subtropical, with hot summers and mild winters.
Economy
The economy of Watts is largely based on agriculture and forestry. The town is home to several small businesses, including a grocery store, a hardware store, and a restaurant. The town also has a small manufacturing sector, which produces furniture and other wood products.
Demographics
As of the 2010 census, the population of Watts was 1,000 people. The racial makeup of the town was 95.2% White, 0.7% African American, 0.3% Native American, 0.2% Asian, 0.1% Pacific Islander, and 3.5% from other races. The median household income in Watts was $30,000, and the median family income was $35,000.
History
Watts was founded in 1891, and was named after the Watts family, who were among the first settlers in the area. The town was originally a farming community, and the main crops grown were cotton, corn, and wheat. In the early 1900s, the town began to grow, and several businesses were established, including a grocery store, a hardware store, and a restaurant.
In the 1920s, the town was hit hard by the Great Depression, and many of the businesses closed. However, the town was able to recover, and by the 1950s, it had become a thriving community. In the 1960s, the town was hit by a tornado, which destroyed many of the buildings in the town. However, the town was able to rebuild, and today it is a thriving community.
Conclusion
Watts is a small town located in the southeastern corner of Oklahoma, in the United States. It is situated in the foothills of the Ouachita Mountains, and is part of the Choctaw Nation. The town was founded in 1891, and has a population of approximately 1,000 people. The economy of Watts is largely based on agriculture and forestry, and the town is home to several small businesses. The racial makeup of the town is 95.2% White, 0.7% African American, 0.3% Native American, 0.2% Asian, 0.1% Pacific Islander, and 3.5% from other races. The median household income in Watts was $30,000, and the median family income was $35,000. Watts has a long and rich history, and today it is a thriving community.
Common Questions
What is Per Capita Income in Watts?
Per Capita income in Watts is $14,704.
What is the Median Family Income in Watts?
Median Family Income in Watts is $57,708.
What is the Median Household income in Watts?
Median Household Income in Watts is $35,000.
What is Inequality or Gini Index in Watts?
Inequality or Gini Index in Watts is 0.39.
What is the Total Population of Watts?
Total Population of Watts is 257.
What is the Total Male Population of Watts?
Total Male Population of Watts is 105.
What is the Total Female Population of Watts?
Total Female Population of Watts is 152.
What is the Ratio of Males per 100 Females in Watts?
There are 69.08 Males per 100 Females in Watts.
What is the Ratio of Females per 100 Males in Watts?
There are 144.76 Females per 100 Males in Watts.
What is the Median Population Age in Watts?
Median Population Age in Watts is 32.6 Years.
What is the Average Family Size in Watts
Average Family Size in Watts is 3.9 People.
What is the Average Household Size in Watts
Average Household Size in Watts is 2.6 People.
How Large is the Labor Force in Watts?
There are 76 People in the Labor Forcein in Watts.
What is the Percentage of People in the Labor Force in Watts?
43.4% of People are in the Labor Force in Watts.