Tupelo, OK Map & Demographics
Tupelo Map
Tupelo Overview
$18,308
PER CAPITA INCOME
$35,750
AVG FAMILY INCOME
$35,208
AVG HOUSEHOLD INCOME
32.8%
WAGE / INCOME GAP [ % ]
67.2¢/ $1
WAGE / INCOME GAP [ $ ]
0.43
INEQUALITY / GINI INDEX
388
TOTAL POPULATION
204
MALE POPULATION
184
FEMALE POPULATION
110.87
MALES / 100 FEMALES
90.20
FEMALES / 100 MALES
40.1
MEDIAN AGE
3.4
AVG FAMILY SIZE
2.9
AVG HOUSEHOLD SIZE
133
LABOR FORCE [ PEOPLE ]
40.2%
PERCENT IN LABOR FORCE
12.0%
UNEMPLOYMENT RATE
Tupelo Zip Codes
Tupelo Area Codes
Income in Tupelo
Income Overview in Tupelo
Per Capita Income in Tupelo is $18,308, while median incomes of families and households are $35,750 and $35,208 respectively.
| Characteristic | Number | Measure |
| Per Capita Income | 388 | $18,308 |
| Median Family Income | 89 | $35,750 |
| Mean Family Income | 89 | $56,290 |
| Median Household Income | 133 | $35,208 |
| Mean Household Income | 133 | $49,737 |
| Income Deficit | 89 | $0 |
| Wage / Income Gap (%) | 388 | 32.76% |
| Wage / Income Gap ($) | 388 | 67.24¢ per $1 |
| Gini / Inequality Index | 388 | 0.43 |
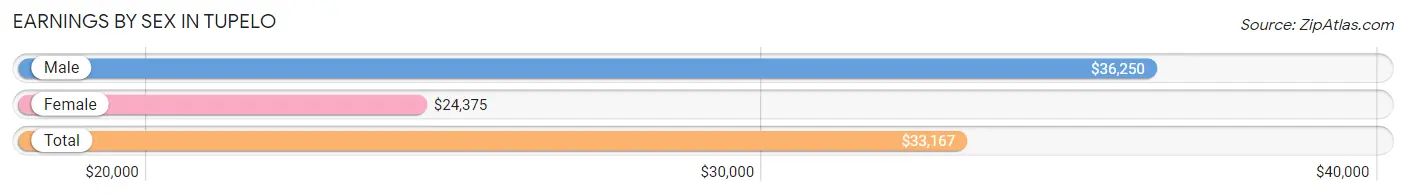
Earnings by Sex in Tupelo
Average Earnings in Tupelo are $33,167, $36,250 for men and $24,375 for women, a difference of 32.8%.
| Sex | Number | Average Earnings |
| Male | 74 (56.1%) | $36,250 |
| Female | 58 (43.9%) | $24,375 |
| Total | 132 (100.0%) | $33,167 |
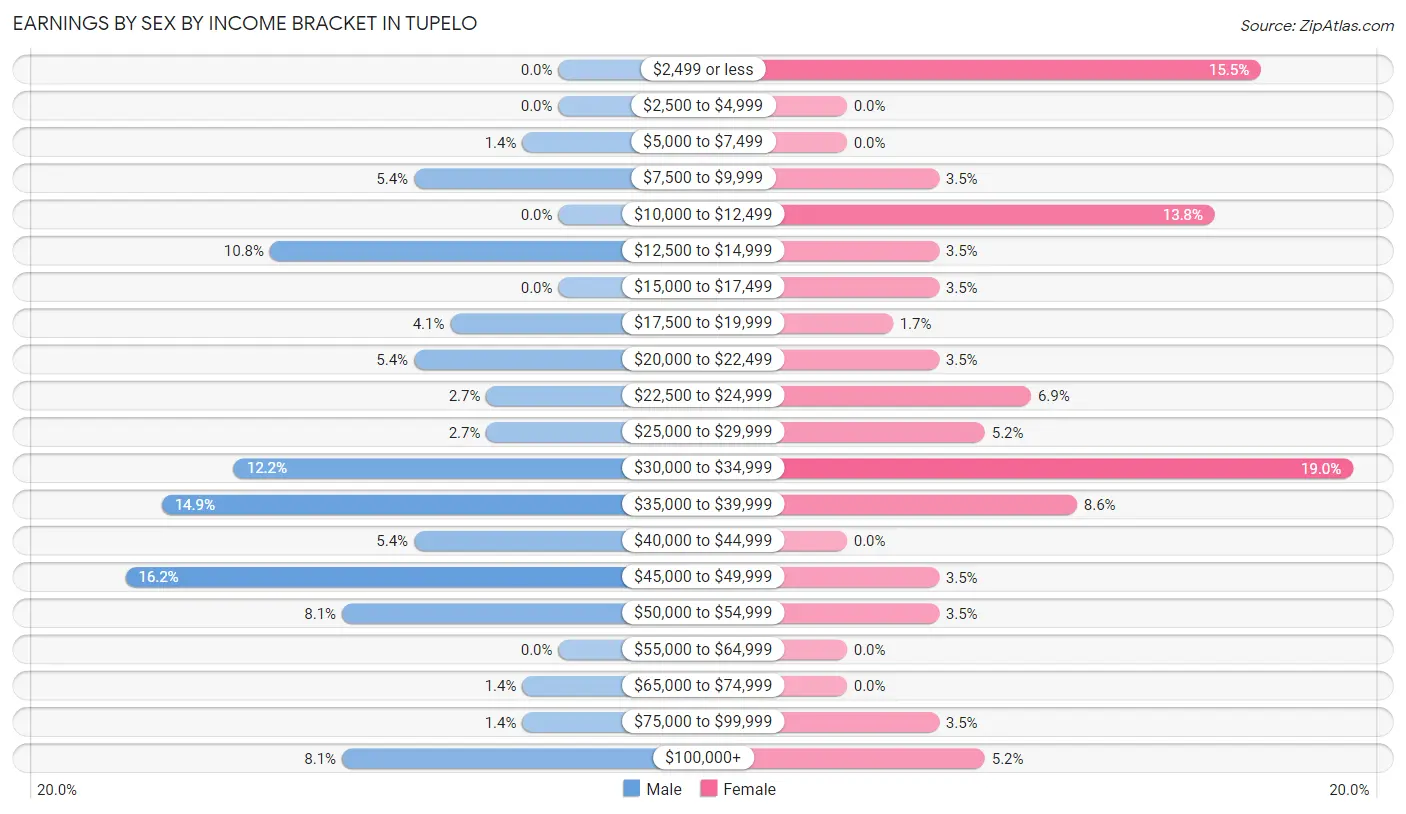
Earnings by Sex by Income Bracket in Tupelo
The most common earnings brackets in Tupelo are $45,000 to $49,999 for men (12 | 16.2%) and $30,000 to $34,999 for women (11 | 19.0%).
| Income | Male | Female |
| $2,499 or less | 0 (0.0%) | 9 (15.5%) |
| $2,500 to $4,999 | 0 (0.0%) | 0 (0.0%) |
| $5,000 to $7,499 | 1 (1.3%) | 0 (0.0%) |
| $7,500 to $9,999 | 4 (5.4%) | 2 (3.5%) |
| $10,000 to $12,499 | 0 (0.0%) | 8 (13.8%) |
| $12,500 to $14,999 | 8 (10.8%) | 2 (3.5%) |
| $15,000 to $17,499 | 0 (0.0%) | 2 (3.5%) |
| $17,500 to $19,999 | 3 (4.1%) | 1 (1.7%) |
| $20,000 to $22,499 | 4 (5.4%) | 2 (3.5%) |
| $22,500 to $24,999 | 2 (2.7%) | 4 (6.9%) |
| $25,000 to $29,999 | 2 (2.7%) | 3 (5.2%) |
| $30,000 to $34,999 | 9 (12.2%) | 11 (19.0%) |
| $35,000 to $39,999 | 11 (14.9%) | 5 (8.6%) |
| $40,000 to $44,999 | 4 (5.4%) | 0 (0.0%) |
| $45,000 to $49,999 | 12 (16.2%) | 2 (3.5%) |
| $50,000 to $54,999 | 6 (8.1%) | 2 (3.5%) |
| $55,000 to $64,999 | 0 (0.0%) | 0 (0.0%) |
| $65,000 to $74,999 | 1 (1.3%) | 0 (0.0%) |
| $75,000 to $99,999 | 1 (1.3%) | 2 (3.5%) |
| $100,000+ | 6 (8.1%) | 3 (5.2%) |
| Total | 74 (100.0%) | 58 (100.0%) |
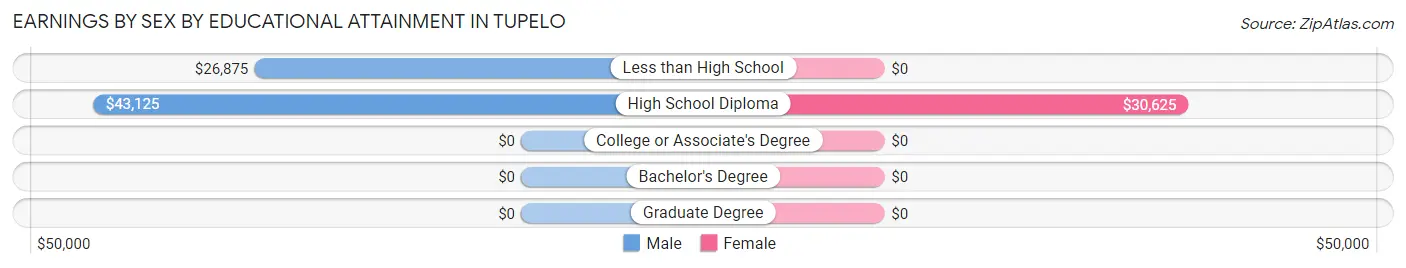
Earnings by Sex by Educational Attainment in Tupelo
Average earnings in Tupelo are $37,188 for men and $31,250 for women, a difference of 16.0%. Men with an educational attainment of high school diploma enjoy the highest average annual earnings of $43,125, while those with less than high school education earn the least with $26,875. Women with an educational attainment of high school diploma earn the most with the average annual earnings of $30,625, while those with high school diploma education have the smallest earnings of $30,625.
| Educational Attainment | Male Income | Female Income |
| Less than High School | $26,875 | $0 |
| High School Diploma | $43,125 | $30,625 |
| College or Associate's Degree | - | - |
| Bachelor's Degree | - | - |
| Graduate Degree | - | - |
| Total | $37,188 | $31,250 |
Family Income in Tupelo
Family Income Brackets in Tupelo
According to the Tupelo family income data, there are 18 families falling into the $15,000 to $24,999 income range, which is the most common income bracket and makes up 20.2% of all families.
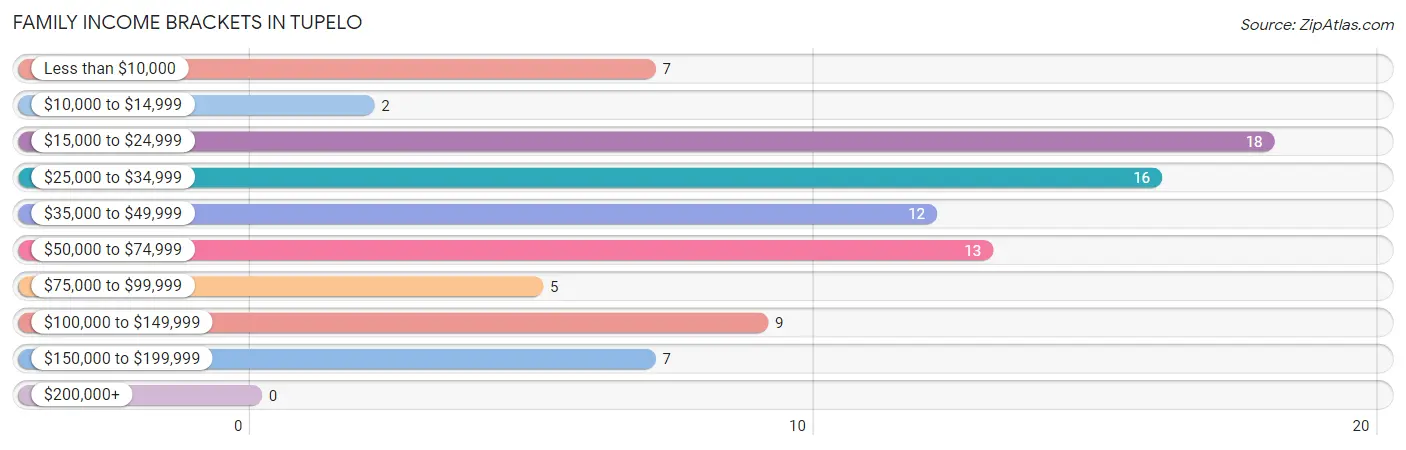
| Income Bracket | # Families | % Families |
| Less than $10,000 | 7 | 7.9% |
| $10,000 to $14,999 | 2 | 2.2% |
| $15,000 to $24,999 | 18 | 20.2% |
| $25,000 to $34,999 | 16 | 18.0% |
| $35,000 to $49,999 | 12 | 13.5% |
| $50,000 to $74,999 | 13 | 14.6% |
| $75,000 to $99,999 | 5 | 5.6% |
| $100,000 to $149,999 | 9 | 10.1% |
| $150,000 to $199,999 | 7 | 7.9% |
| $200,000+ | 0 | 0.0% |
Family Income by Famaliy Size in Tupelo
6-person families (5 | 5.6%) account for the highest median family income in Tupelo with $69,583 per family, while 2-person families (40 | 44.9%) have the highest median income of $12,361 per family member.
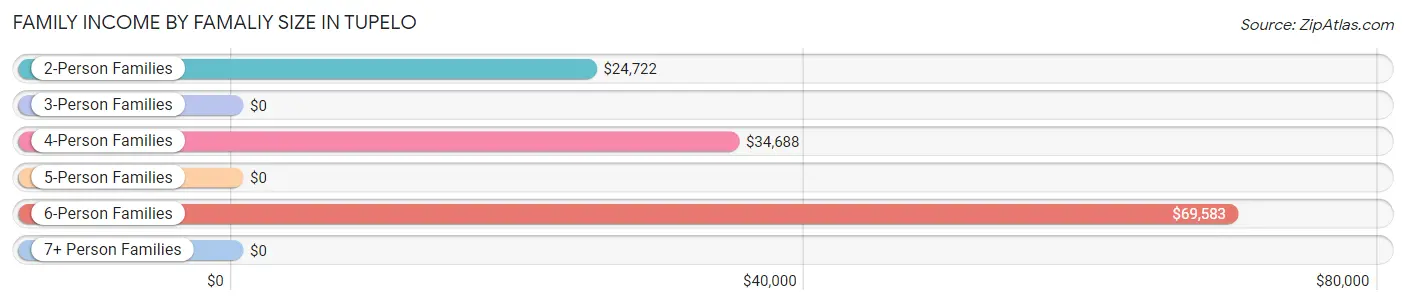
| Income Bracket | # Families | Median Income |
| 2-Person Families | 40 (44.9%) | $24,722 |
| 3-Person Families | 11 (12.4%) | $0 |
| 4-Person Families | 22 (24.7%) | $34,688 |
| 5-Person Families | 10 (11.2%) | $0 |
| 6-Person Families | 5 (5.6%) | $69,583 |
| 7+ Person Families | 1 (1.1%) | $0 |
| Total | 89 (100.0%) | $35,750 |
Family Income by Number of Earners in Tupelo
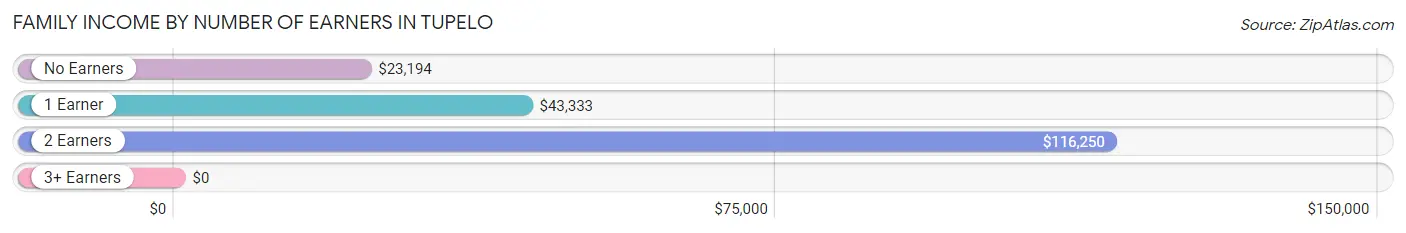
| Number of Earners | # Families | Median Income |
| No Earners | 31 (34.8%) | $23,194 |
| 1 Earner | 36 (40.5%) | $43,333 |
| 2 Earners | 19 (21.3%) | $116,250 |
| 3+ Earners | 3 (3.4%) | $0 |
| Total | 89 (100.0%) | $35,750 |
Household Income in Tupelo
Household Income Brackets in Tupelo
With 33 households falling in the category, the $15,000 to $24,999 income range is the most frequent in Tupelo, accounting for 24.8% of all households.
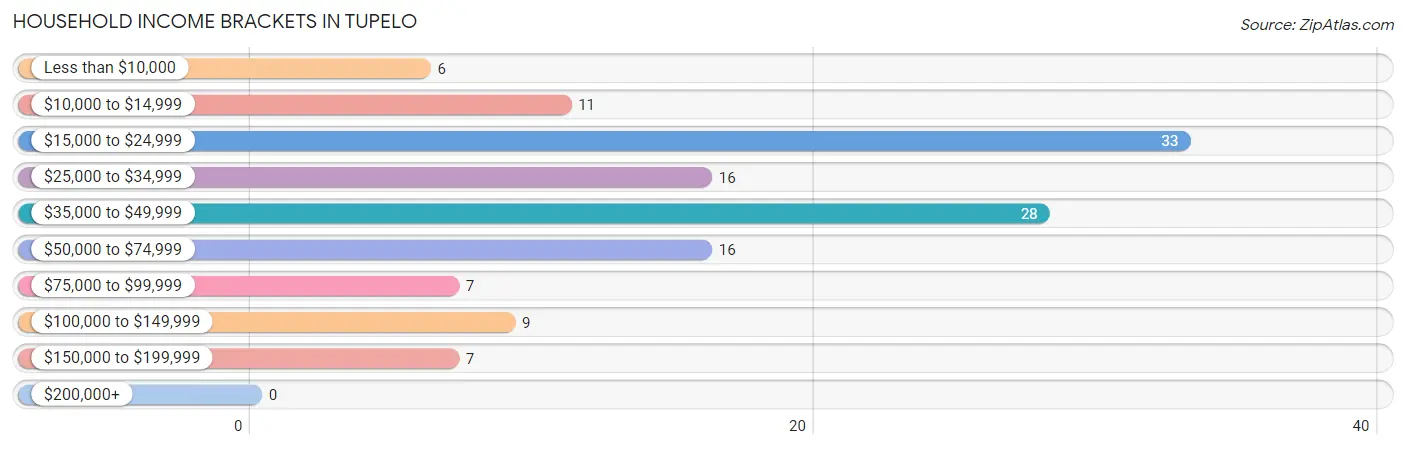
| Income Bracket | # Households | % Households |
| Less than $10,000 | 6 | 4.5% |
| $10,000 to $14,999 | 11 | 8.3% |
| $15,000 to $24,999 | 33 | 24.8% |
| $25,000 to $34,999 | 16 | 12.0% |
| $35,000 to $49,999 | 28 | 21.1% |
| $50,000 to $74,999 | 16 | 12.0% |
| $75,000 to $99,999 | 7 | 5.3% |
| $100,000 to $149,999 | 9 | 6.8% |
| $150,000 to $199,999 | 7 | 5.3% |
| $200,000+ | 0 | 0.0% |
Household Income by Householder Age in Tupelo
The median household income in Tupelo is $35,208, with the highest median household income of $47,857 found in the 45 to 64 years age bracket for the primary householder. A total of 42 households (31.6%) fall into this category. Meanwhile, the 15 to 24 years age bracket for the primary householder has the lowest median household income of $0, with 5 households (3.8%) in this group.
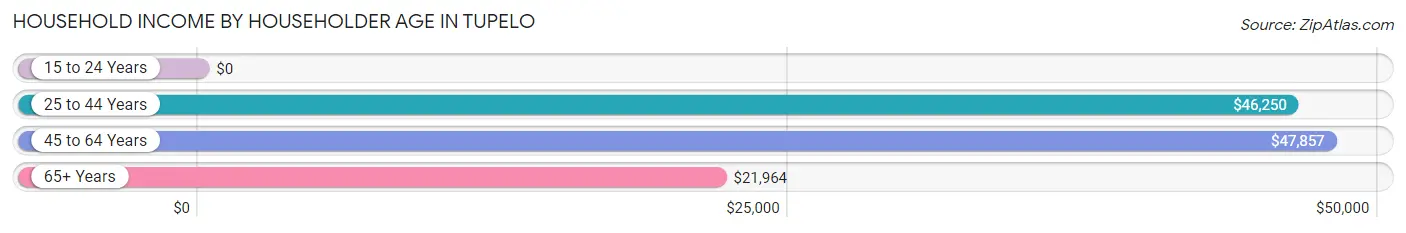
| Income Bracket | # Households | Median Income |
| 15 to 24 Years | 5 (3.8%) | $0 |
| 25 to 44 Years | 41 (30.8%) | $46,250 |
| 45 to 64 Years | 42 (31.6%) | $47,857 |
| 65+ Years | 45 (33.8%) | $21,964 |
| Total | 133 (100.0%) | $35,208 |
Poverty in Tupelo
Income Below Poverty by Sex and Age in Tupelo
With 21.1% poverty level for males and 24.5% for females among the residents of Tupelo, 16 and 17 year old males and 18 to 24 year old females are the most vulnerable to poverty, with 2 males (100.0%) and 12 females (57.1%) in their respective age groups living below the poverty level.
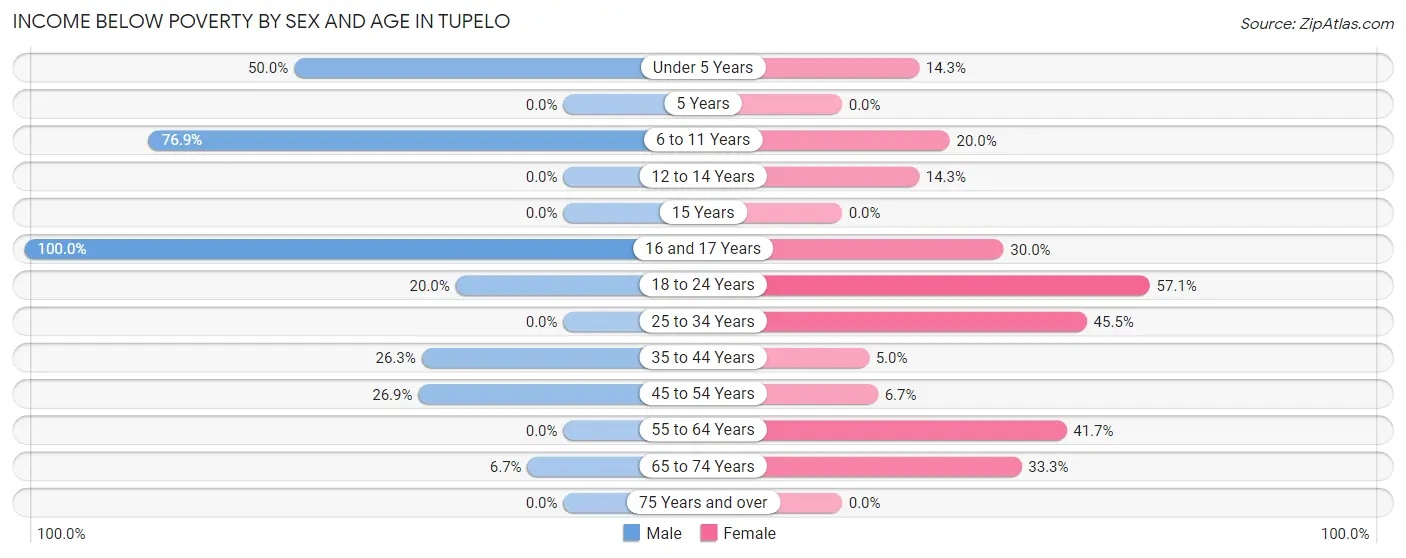
| Age Bracket | Male | Female |
| Under 5 Years | 2 (50.0%) | 1 (14.3%) |
| 5 Years | 0 (0.0%) | 0 (0.0%) |
| 6 to 11 Years | 10 (76.9%) | 3 (20.0%) |
| 12 to 14 Years | 0 (0.0%) | 1 (14.3%) |
| 15 Years | 0 (0.0%) | 0 (0.0%) |
| 16 and 17 Years | 2 (100.0%) | 3 (30.0%) |
| 18 to 24 Years | 11 (20.0%) | 12 (57.1%) |
| 25 to 34 Years | 0 (0.0%) | 10 (45.5%) |
| 35 to 44 Years | 10 (26.3%) | 1 (5.0%) |
| 45 to 54 Years | 7 (26.9%) | 2 (6.7%) |
| 55 to 64 Years | 0 (0.0%) | 10 (41.7%) |
| 65 to 74 Years | 1 (6.7%) | 2 (33.3%) |
| 75 Years and over | 0 (0.0%) | 0 (0.0%) |
| Total | 43 (21.1%) | 45 (24.5%) |
Income Above Poverty by Sex and Age in Tupelo
According to the poverty statistics in Tupelo, males aged 12 to 14 years and females aged 75 years and over are the age groups that are most secure financially, with 100.0% of males and 100.0% of females in these age groups living above the poverty line.
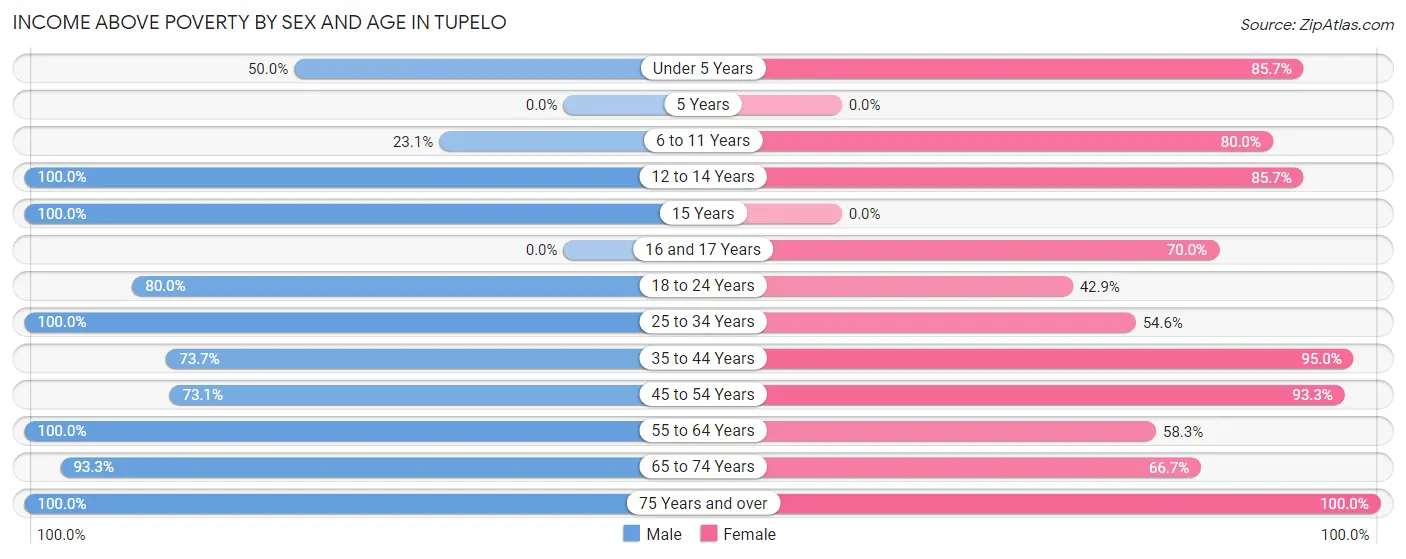
| Age Bracket | Male | Female |
| Under 5 Years | 2 (50.0%) | 6 (85.7%) |
| 5 Years | 0 (0.0%) | 0 (0.0%) |
| 6 to 11 Years | 3 (23.1%) | 12 (80.0%) |
| 12 to 14 Years | 2 (100.0%) | 6 (85.7%) |
| 15 Years | 9 (100.0%) | 0 (0.0%) |
| 16 and 17 Years | 0 (0.0%) | 7 (70.0%) |
| 18 to 24 Years | 44 (80.0%) | 9 (42.9%) |
| 25 to 34 Years | 7 (100.0%) | 12 (54.5%) |
| 35 to 44 Years | 28 (73.7%) | 19 (95.0%) |
| 45 to 54 Years | 19 (73.1%) | 28 (93.3%) |
| 55 to 64 Years | 17 (100.0%) | 14 (58.3%) |
| 65 to 74 Years | 14 (93.3%) | 4 (66.7%) |
| 75 Years and over | 16 (100.0%) | 22 (100.0%) |
| Total | 161 (78.9%) | 139 (75.5%) |
Income Below Poverty Among Married-Couple Families in Tupelo
The poverty statistics for married-couple families in Tupelo show that 3.5% or 2 of the total 58 families live below the poverty line. Families with 1 or 2 children have the highest poverty rate of 11.1%, comprising of 2 families. On the other hand, families with no children have the lowest poverty rate of 0.0%, which includes 0 families.
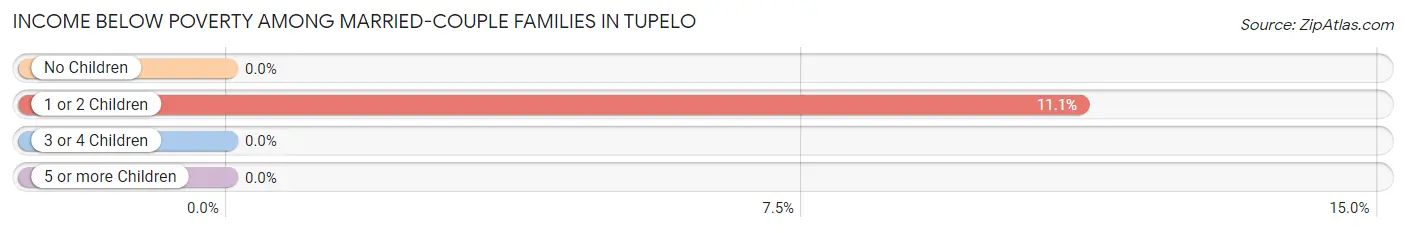
| Children | Above Poverty | Below Poverty |
| No Children | 36 (100.0%) | 0 (0.0%) |
| 1 or 2 Children | 16 (88.9%) | 2 (11.1%) |
| 3 or 4 Children | 4 (100.0%) | 0 (0.0%) |
| 5 or more Children | 0 (0.0%) | 0 (0.0%) |
| Total | 56 (96.6%) | 2 (3.5%) |
Income Below Poverty Among Single-Parent Households in Tupelo
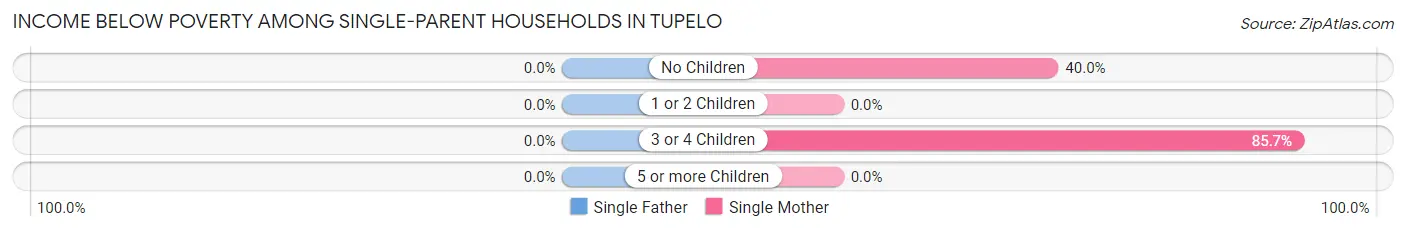
| Children | Single Father | Single Mother |
| No Children | 0 (0.0%) | 6 (40.0%) |
| 1 or 2 Children | 0 (0.0%) | 0 (0.0%) |
| 3 or 4 Children | 0 (0.0%) | 6 (85.7%) |
| 5 or more Children | 0 (0.0%) | 0 (0.0%) |
| Total | 0 (0.0%) | 12 (44.4%) |
Income Below Poverty Among Married-Couple vs Single-Parent Households in Tupelo
The poverty data for Tupelo shows that 2 of the married-couple family households (3.5%) and 12 of the single-parent households (38.7%) are living below the poverty level. Within the married-couple family households, those with 1 or 2 children have the highest poverty rate, with 2 households (11.1%) falling below the poverty line. Among the single-parent households, those with 3 or 4 children have the highest poverty rate, with 6 household (85.7%) living below poverty.
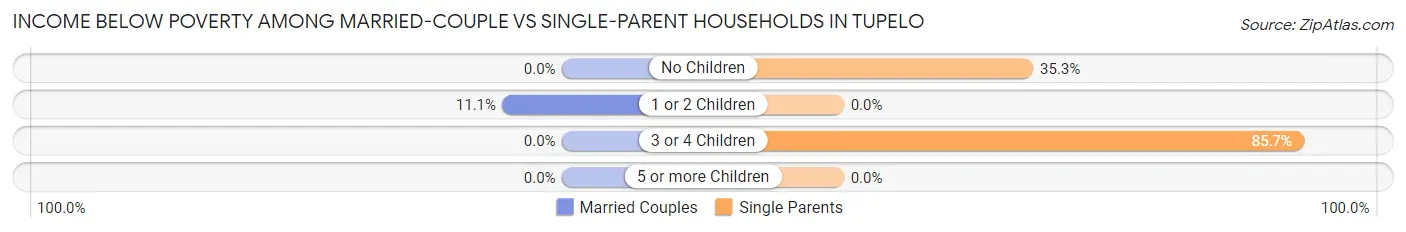
| Children | Married-Couple Families | Single-Parent Households |
| No Children | 0 (0.0%) | 6 (35.3%) |
| 1 or 2 Children | 2 (11.1%) | 0 (0.0%) |
| 3 or 4 Children | 0 (0.0%) | 6 (85.7%) |
| 5 or more Children | 0 (0.0%) | 0 (0.0%) |
| Total | 2 (3.5%) | 12 (38.7%) |
Race in Tupelo
The most populous races in Tupelo are White / Caucasian (271 | 69.9%), Two or more Races (71 | 18.3%), and Native / Alaskan (38 | 9.8%).
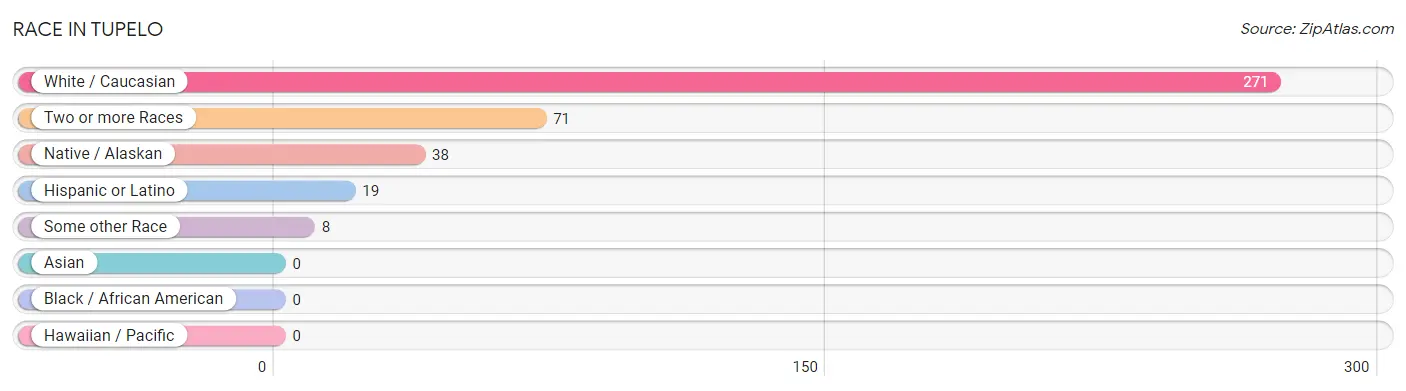
| Race | # Population | % Population |
| Asian | 0 | 0.0% |
| Black / African American | 0 | 0.0% |
| Hawaiian / Pacific | 0 | 0.0% |
| Hispanic or Latino | 19 | 4.9% |
| Native / Alaskan | 38 | 9.8% |
| White / Caucasian | 271 | 69.9% |
| Two or more Races | 71 | 18.3% |
| Some other Race | 8 | 2.1% |
| Total | 388 | 100.0% |
Ancestry in Tupelo
The most populous ancestries reported in Tupelo are American (84 | 21.6%), Irish (60 | 15.5%), Choctaw (44 | 11.3%), Cherokee (34 | 8.8%), and Mexican (16 | 4.1%), together accounting for 61.3% of all Tupelo residents.
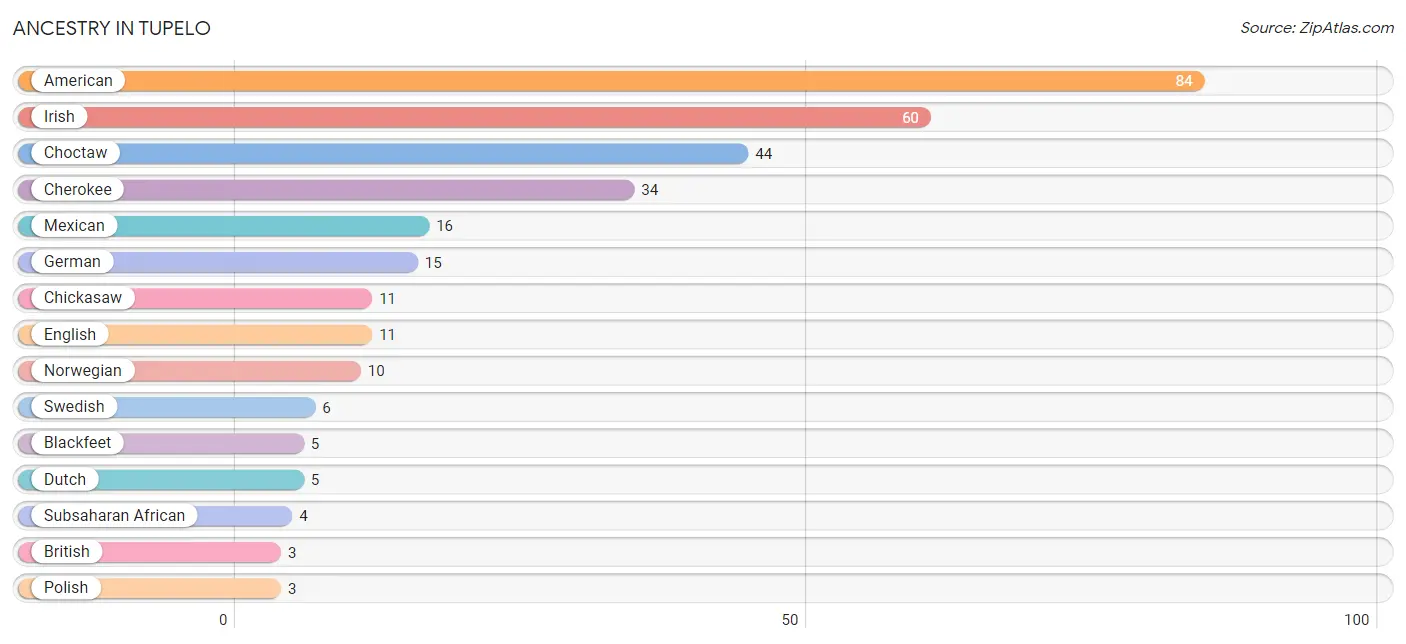
| Ancestry | # Population | % Population |
| American | 84 | 21.6% |
| Blackfeet | 5 | 1.3% |
| British | 3 | 0.8% |
| Cherokee | 34 | 8.8% |
| Chickasaw | 11 | 2.8% |
| Choctaw | 44 | 11.3% |
| Creek | 2 | 0.5% |
| Czech | 2 | 0.5% |
| Dutch | 5 | 1.3% |
| English | 11 | 2.8% |
| German | 15 | 3.9% |
| Irish | 60 | 15.5% |
| Mexican | 16 | 4.1% |
| Norwegian | 10 | 2.6% |
| Polish | 3 | 0.8% |
| Scottish | 2 | 0.5% |
| Sioux | 1 | 0.3% |
| Subsaharan African | 4 | 1.0% |
| Swedish | 6 | 1.5% | View All 19 Rows |
Immigrants in Tupelo
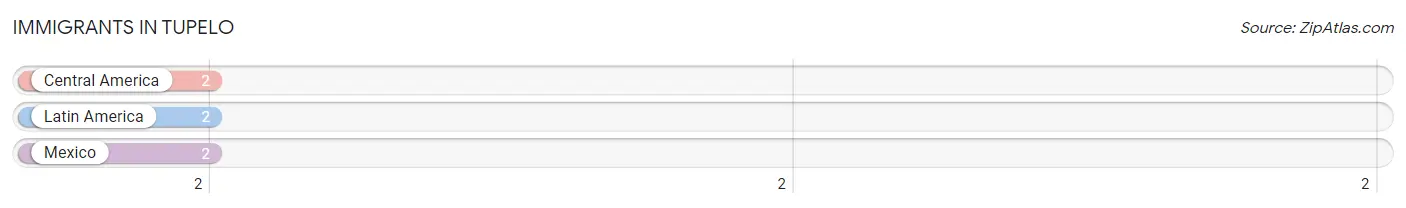
The most numerous immigrant groups reported in Tupelo came from Central America (2 | 0.5%), Latin America (2 | 0.5%), and Mexico (2 | 0.5%), together accounting for 1.6% of all Tupelo residents.
| Immigration Origin | # Population | % Population |
| Central America | 2 | 0.5% |
| Latin America | 2 | 0.5% |
| Mexico | 2 | 0.5% | View All 3 Rows |
Sex and Age in Tupelo
Sex and Age in Tupelo
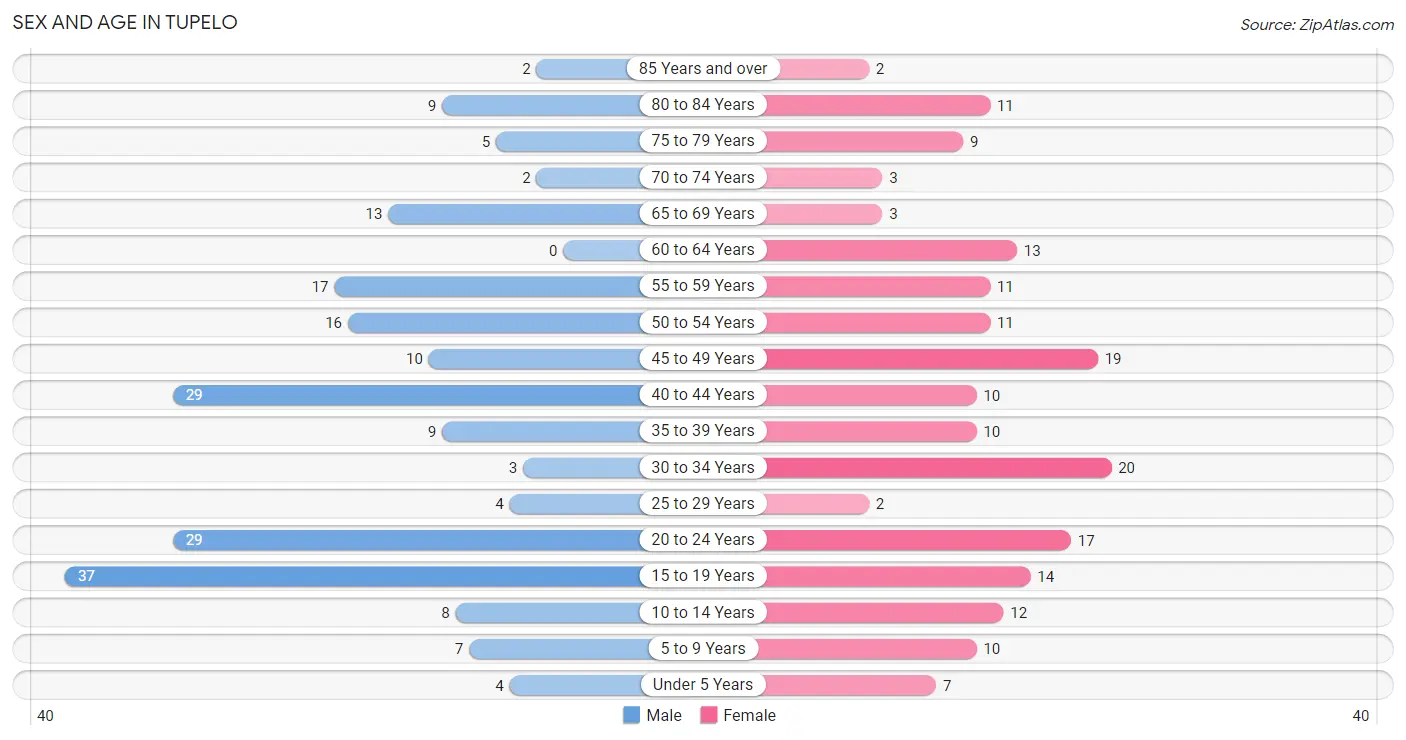
The most populous age groups in Tupelo are 15 to 19 Years (37 | 18.1%) for men and 30 to 34 Years (20 | 10.9%) for women.
| Age Bracket | Male | Female |
| Under 5 Years | 4 (2.0%) | 7 (3.8%) |
| 5 to 9 Years | 7 (3.4%) | 10 (5.4%) |
| 10 to 14 Years | 8 (3.9%) | 12 (6.5%) |
| 15 to 19 Years | 37 (18.1%) | 14 (7.6%) |
| 20 to 24 Years | 29 (14.2%) | 17 (9.2%) |
| 25 to 29 Years | 4 (2.0%) | 2 (1.1%) |
| 30 to 34 Years | 3 (1.5%) | 20 (10.9%) |
| 35 to 39 Years | 9 (4.4%) | 10 (5.4%) |
| 40 to 44 Years | 29 (14.2%) | 10 (5.4%) |
| 45 to 49 Years | 10 (4.9%) | 19 (10.3%) |
| 50 to 54 Years | 16 (7.8%) | 11 (6.0%) |
| 55 to 59 Years | 17 (8.3%) | 11 (6.0%) |
| 60 to 64 Years | 0 (0.0%) | 13 (7.1%) |
| 65 to 69 Years | 13 (6.4%) | 3 (1.6%) |
| 70 to 74 Years | 2 (1.0%) | 3 (1.6%) |
| 75 to 79 Years | 5 (2.5%) | 9 (4.9%) |
| 80 to 84 Years | 9 (4.4%) | 11 (6.0%) |
| 85 Years and over | 2 (1.0%) | 2 (1.1%) |
| Total | 204 (100.0%) | 184 (100.0%) |
Families and Households in Tupelo
Median Family Size in Tupelo
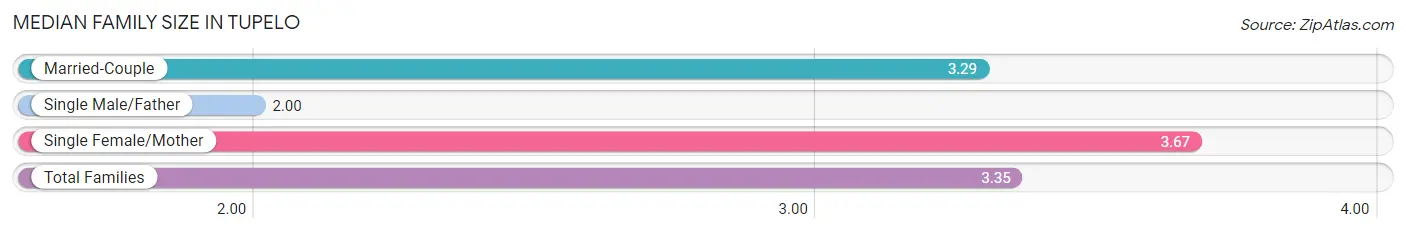
The median family size in Tupelo is 3.35 persons per family, with single female/mother families (27 | 30.3%) accounting for the largest median family size of 3.67 persons per family. On the other hand, single male/father families (4 | 4.5%) represent the smallest median family size with 2.00 persons per family.
| Family Type | # Families | Family Size |
| Married-Couple | 58 (65.2%) | 3.29 |
| Single Male/Father | 4 (4.5%) | 2.00 |
| Single Female/Mother | 27 (30.3%) | 3.67 |
| Total Families | 89 (100.0%) | 3.35 |
Median Household Size in Tupelo
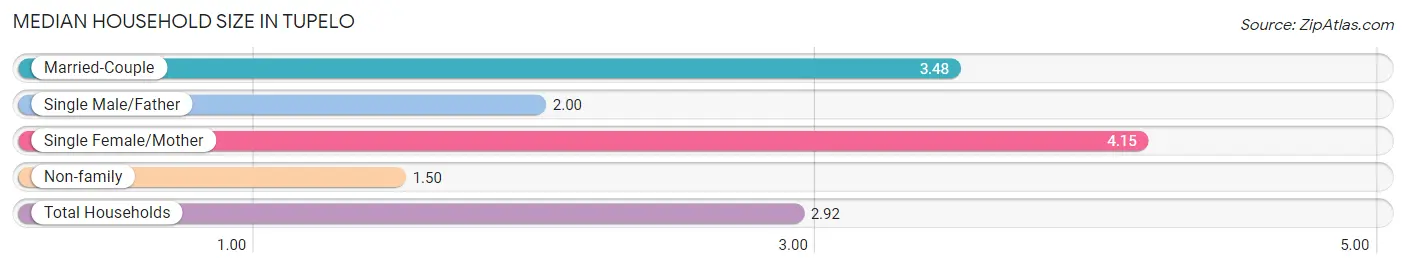
The median household size in Tupelo is 2.92 persons per household, with single female/mother households (27 | 20.3%) accounting for the largest median household size of 4.15 persons per household. non-family households (44 | 33.1%) represent the smallest median household size with 1.50 persons per household.
| Household Type | # Households | Household Size |
| Married-Couple | 58 (43.6%) | 3.48 |
| Single Male/Father | 4 (3.0%) | 2.00 |
| Single Female/Mother | 27 (20.3%) | 4.15 |
| Non-family | 44 (33.1%) | 1.50 |
| Total Households | 133 (100.0%) | 2.92 |
Household Size by Marriage Status in Tupelo
Out of a total of 133 households in Tupelo, 89 (66.9%) are family households, while 44 (33.1%) are nonfamily households. The most numerous type of family households are 2-person households, comprising 37, and the most common type of nonfamily households are 1-person households, comprising 33.
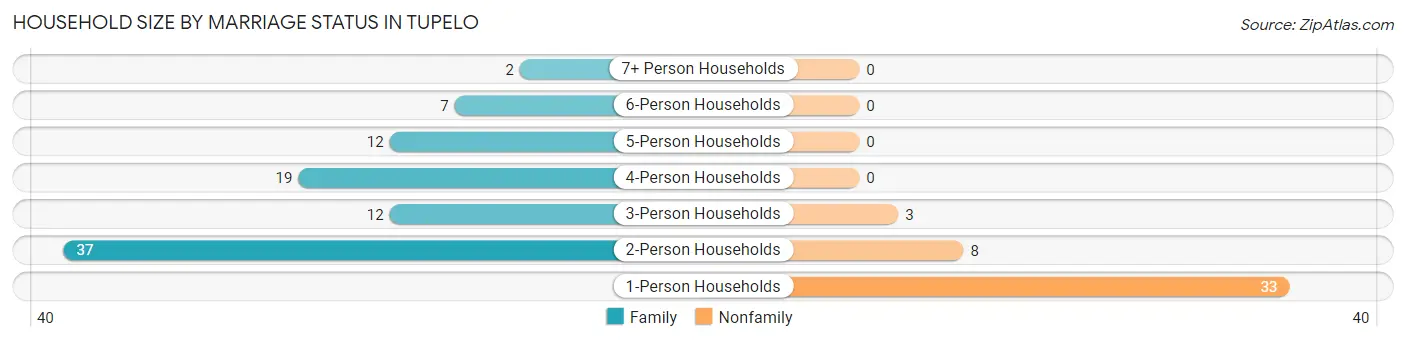
| Household Size | Family Households | Nonfamily Households |
| 1-Person Households | - | 33 (24.8%) |
| 2-Person Households | 37 (27.8%) | 8 (6.0%) |
| 3-Person Households | 12 (9.0%) | 3 (2.3%) |
| 4-Person Households | 19 (14.3%) | 0 (0.0%) |
| 5-Person Households | 12 (9.0%) | 0 (0.0%) |
| 6-Person Households | 7 (5.3%) | 0 (0.0%) |
| 7+ Person Households | 2 (1.5%) | 0 (0.0%) |
| Total | 89 (66.9%) | 44 (33.1%) |
Female Fertility in Tupelo
Fertility by Age in Tupelo
| Age Bracket | Women with Births | Births / 1,000 Women |
| 15 to 19 years | 0 (0.0%) | 0.0 |
| 20 to 34 years | 0 (0.0%) | 0.0 |
| 35 to 50 years | 0 (0.0%) | 0.0 |
| Total | 0 (0.0%) | 0.0 |
Fertility by Age by Marriage Status in Tupelo
| Age Bracket | Married | Unmarried |
| 15 to 19 years | 0 (0.0%) | 0 (0.0%) |
| 20 to 34 years | 0 (0.0%) | 0 (0.0%) |
| 35 to 50 years | 0 (0.0%) | 0 (0.0%) |
| Total | 0 (0.0%) | 0 (0.0%) |
Fertility by Education in Tupelo
| Educational Attainment | Women with Births | Births / 1,000 Women |
| Less than High School | 0 (0.0%) | 0.0 |
| High School Diploma | 0 (0.0%) | 0.0 |
| College or Associate's Degree | 0 (0.0%) | 0.0 |
| Bachelor's Degree | 0 (0.0%) | 0.0 |
| Graduate Degree | 0 (0.0%) | 0.0 |
| Total | 0 (0.0%) | 0.0 |
Fertility by Education by Marriage Status in Tupelo
| Educational Attainment | Married | Unmarried |
| Less than High School | 0 (0.0%) | 0 (0.0%) |
| High School Diploma | 0 (0.0%) | 0 (0.0%) |
| College or Associate's Degree | 0 (0.0%) | 0 (0.0%) |
| Bachelor's Degree | 0 (0.0%) | 0 (0.0%) |
| Graduate Degree | 0 (0.0%) | 0 (0.0%) |
| Total | 0 (0.0%) | 0 (0.0%) |
Employment Characteristics in Tupelo
Employment by Class of Employer in Tupelo
Among the 111 employed individuals in Tupelo, private company employees (74 | 66.7%), local government employees (17 | 15.3%), and not-for-profit organizations (9 | 8.1%) make up the most common classes of employment.
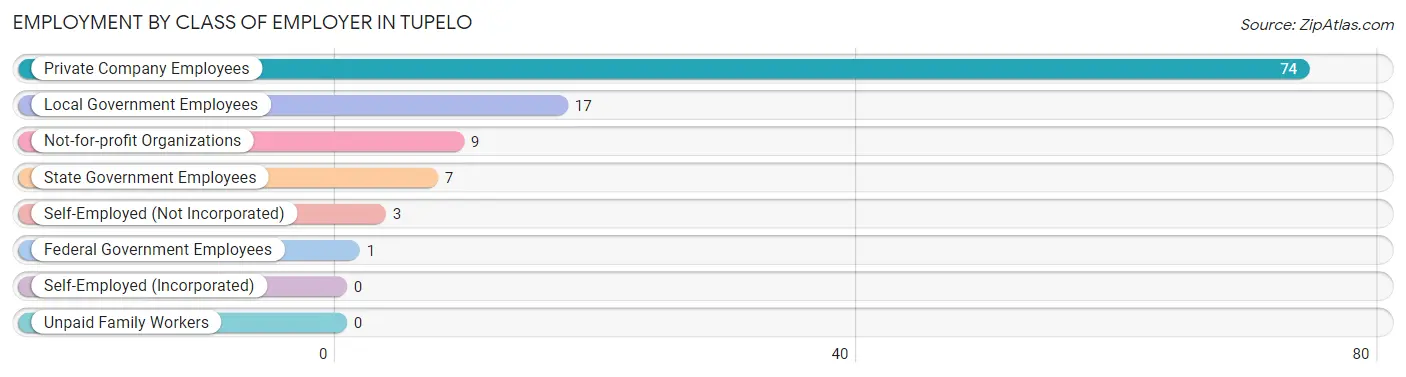
| Employer Class | # Employees | % Employees |
| Private Company Employees | 74 | 66.7% |
| Self-Employed (Incorporated) | 0 | 0.0% |
| Self-Employed (Not Incorporated) | 3 | 2.7% |
| Not-for-profit Organizations | 9 | 8.1% |
| Local Government Employees | 17 | 15.3% |
| State Government Employees | 7 | 6.3% |
| Federal Government Employees | 1 | 0.9% |
| Unpaid Family Workers | 0 | 0.0% |
| Total | 111 | 100.0% |
Employment Status by Age in Tupelo
According to the labor force statistics for Tupelo, out of the total population over 16 years of age (331), 40.2% or 133 individuals are in the labor force, with 12.0% or 16 of them unemployed. The age group with the highest labor force participation rate is 25 to 29 years, with 100.0% or 6 individuals in the labor force. Within the labor force, the 20 to 24 years age range has the highest percentage of unemployed individuals, with 41.2% or 7 of them being unemployed.
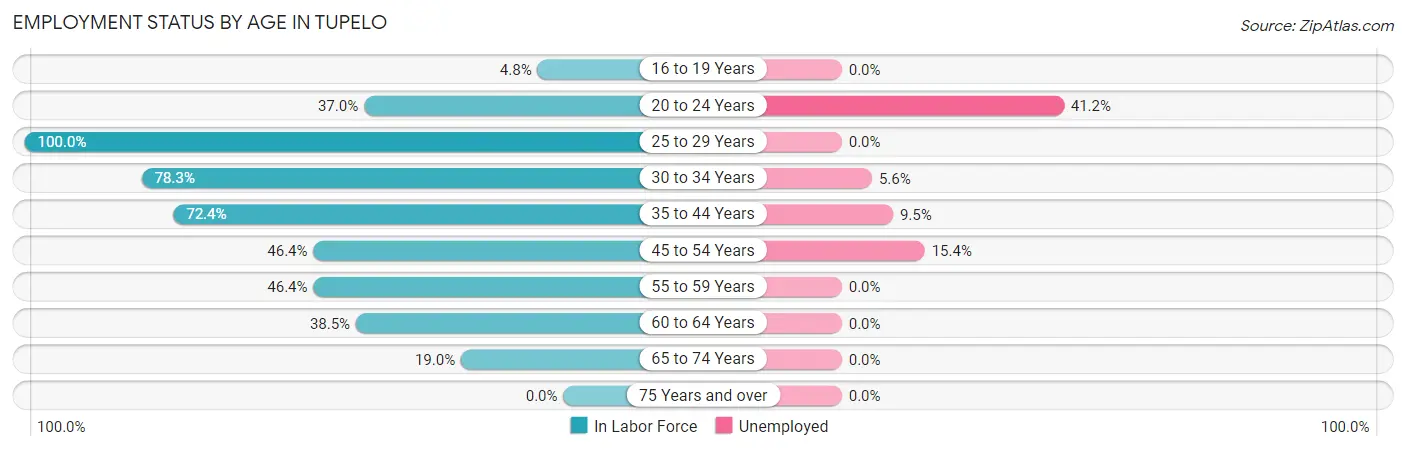
| Age Bracket | In Labor Force | Unemployed |
| 16 to 19 Years | 2 (4.8%) | 0 (0.0%) |
| 20 to 24 Years | 17 (37.0%) | 7 (41.2%) |
| 25 to 29 Years | 6 (100.0%) | 0 (0.0%) |
| 30 to 34 Years | 18 (78.3%) | 1 (5.6%) |
| 35 to 44 Years | 42 (72.4%) | 4 (9.5%) |
| 45 to 54 Years | 26 (46.4%) | 4 (15.4%) |
| 55 to 59 Years | 13 (46.4%) | 0 (0.0%) |
| 60 to 64 Years | 5 (38.5%) | 0 (0.0%) |
| 65 to 74 Years | 4 (19.0%) | 0 (0.0%) |
| 75 Years and over | 0 (0.0%) | 0 (0.0%) |
| Total | 133 (40.2%) | 16 (12.0%) |
Employment Status by Educational Attainment in Tupelo
According to labor force statistics for Tupelo, 59.8% of individuals (110) out of the total population between 25 and 64 years of age (184) are in the labor force, with 8.2% or 9 of them being unemployed. The group with the highest labor force participation rate are those with the educational attainment of high school diploma, with 68.5% or 76 individuals in the labor force. Within the labor force, individuals with college / associate degree education have the highest percentage of unemployment, with 13.3% or 2 of them being unemployed.
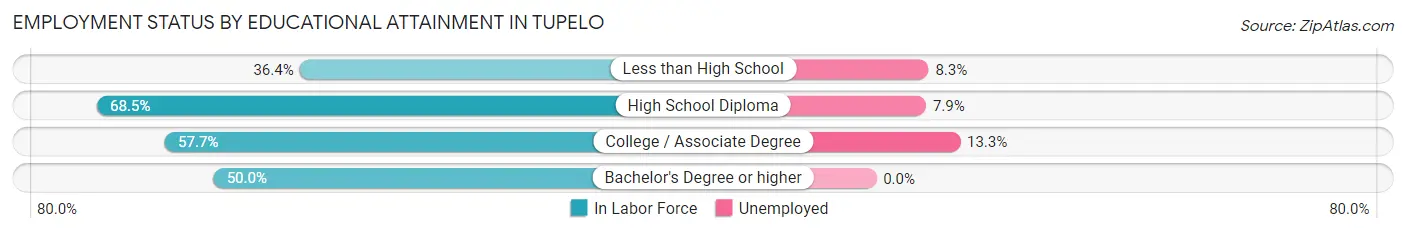
| Educational Attainment | In Labor Force | Unemployed |
| Less than High School | 12 (36.4%) | 3 (8.3%) |
| High School Diploma | 76 (68.5%) | 9 (7.9%) |
| College / Associate Degree | 15 (57.7%) | 3 (13.3%) |
| Bachelor's Degree or higher | 7 (50.0%) | 0 (0.0%) |
| Total | 110 (59.8%) | 15 (8.2%) |
Employment Occupations by Sex in Tupelo
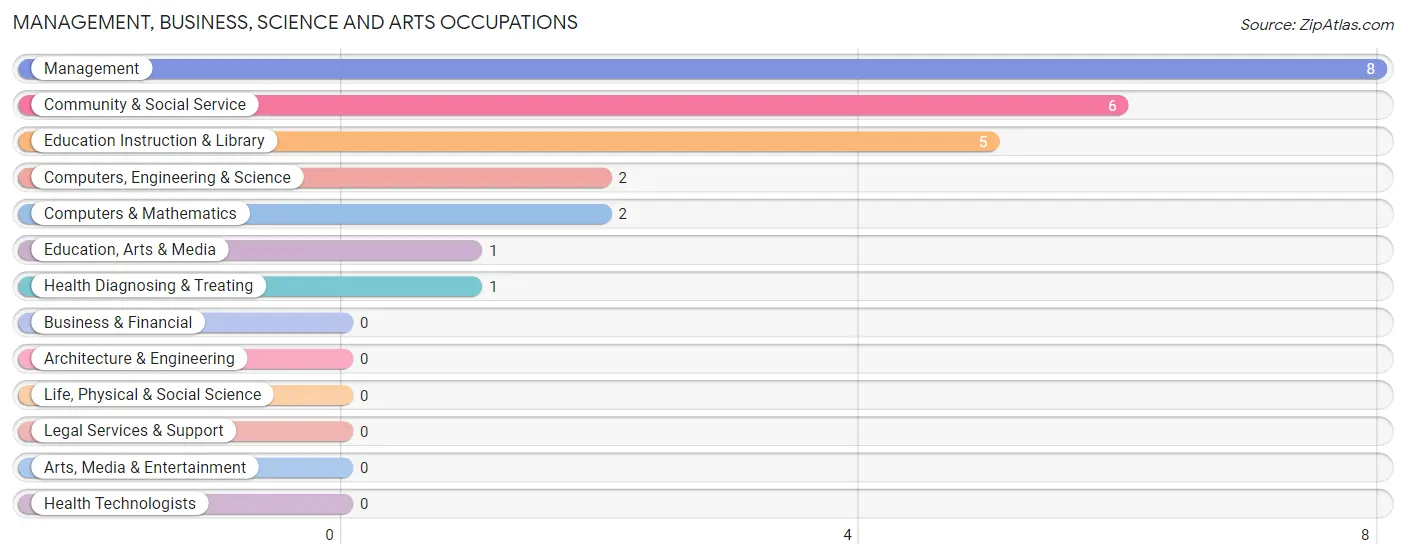
Management, Business, Science and Arts Occupations
The most common Management, Business, Science and Arts occupations in Tupelo are Management (8 | 6.8%), Community & Social Service (6 | 5.1%), Education Instruction & Library (5 | 4.3%), Computers, Engineering & Science (2 | 1.7%), and Computers & Mathematics (2 | 1.7%).
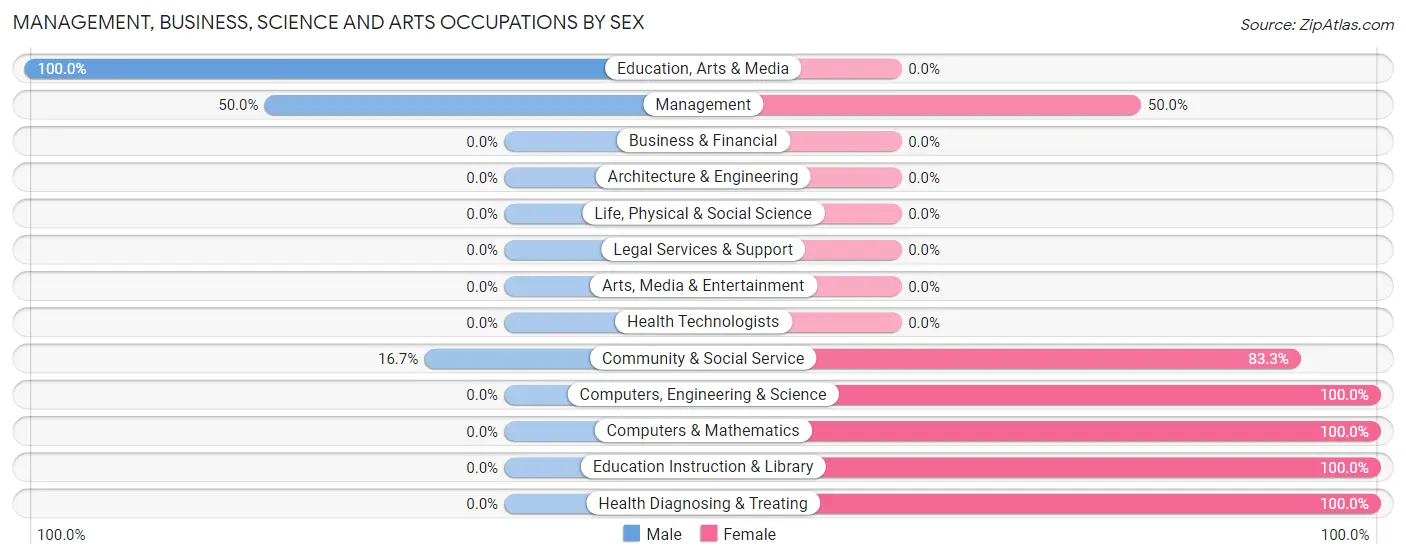
Management, Business, Science and Arts Occupations by Sex
Within the Management, Business, Science and Arts occupations in Tupelo, the most male-oriented occupations are Education, Arts & Media (100.0%), Management (50.0%), and Community & Social Service (16.7%), while the most female-oriented occupations are Computers, Engineering & Science (100.0%), Computers & Mathematics (100.0%), and Education Instruction & Library (100.0%).
| Occupation | Male | Female |
| Management | 4 (50.0%) | 4 (50.0%) |
| Business & Financial | 0 (0.0%) | 0 (0.0%) |
| Computers, Engineering & Science | 0 (0.0%) | 2 (100.0%) |
| Computers & Mathematics | 0 (0.0%) | 2 (100.0%) |
| Architecture & Engineering | 0 (0.0%) | 0 (0.0%) |
| Life, Physical & Social Science | 0 (0.0%) | 0 (0.0%) |
| Community & Social Service | 1 (16.7%) | 5 (83.3%) |
| Education, Arts & Media | 1 (100.0%) | 0 (0.0%) |
| Legal Services & Support | 0 (0.0%) | 0 (0.0%) |
| Education Instruction & Library | 0 (0.0%) | 5 (100.0%) |
| Arts, Media & Entertainment | 0 (0.0%) | 0 (0.0%) |
| Health Diagnosing & Treating | 0 (0.0%) | 1 (100.0%) |
| Health Technologists | 0 (0.0%) | 0 (0.0%) |
| Total (Category) | 5 (29.4%) | 12 (70.6%) |
| Total (Overall) | 69 (59.0%) | 48 (41.0%) |
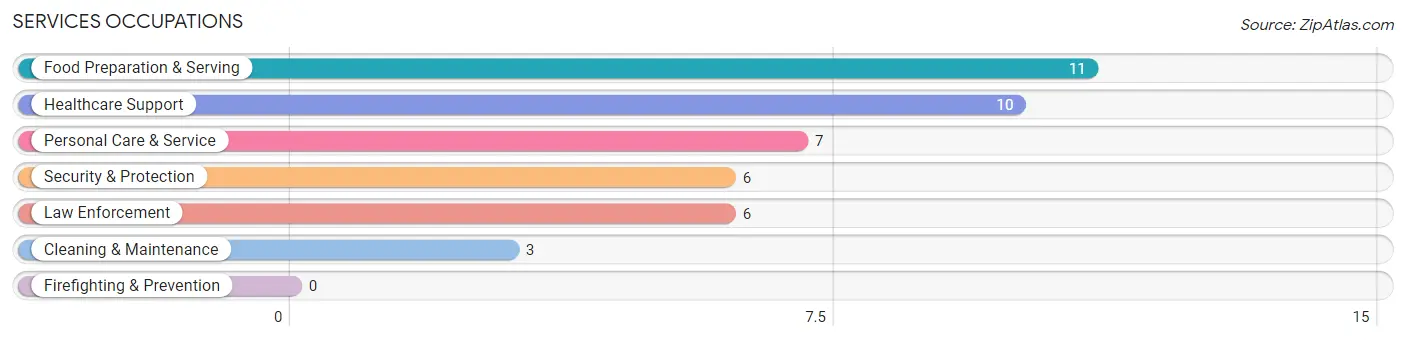
Services Occupations
The most common Services occupations in Tupelo are Food Preparation & Serving (11 | 9.4%), Healthcare Support (10 | 8.6%), Personal Care & Service (7 | 6.0%), Security & Protection (6 | 5.1%), and Law Enforcement (6 | 5.1%).
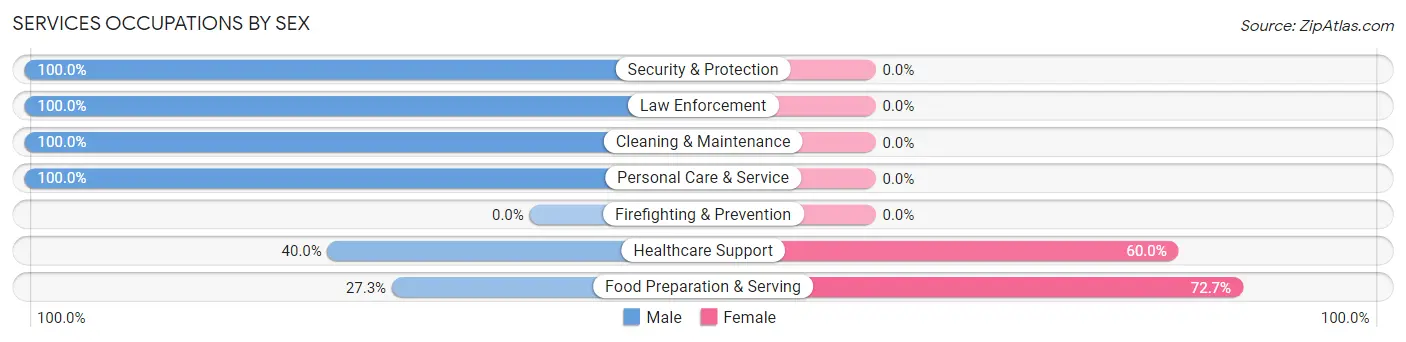
Services Occupations by Sex
Within the Services occupations in Tupelo, the most male-oriented occupations are Security & Protection (100.0%), Law Enforcement (100.0%), and Cleaning & Maintenance (100.0%), while the most female-oriented occupations are Food Preparation & Serving (72.7%), and Healthcare Support (60.0%).
| Occupation | Male | Female |
| Healthcare Support | 4 (40.0%) | 6 (60.0%) |
| Security & Protection | 6 (100.0%) | 0 (0.0%) |
| Firefighting & Prevention | 0 (0.0%) | 0 (0.0%) |
| Law Enforcement | 6 (100.0%) | 0 (0.0%) |
| Food Preparation & Serving | 3 (27.3%) | 8 (72.7%) |
| Cleaning & Maintenance | 3 (100.0%) | 0 (0.0%) |
| Personal Care & Service | 7 (100.0%) | 0 (0.0%) |
| Total (Category) | 23 (62.2%) | 14 (37.8%) |
| Total (Overall) | 69 (59.0%) | 48 (41.0%) |
Sales and Office Occupations
The most common Sales and Office occupations in Tupelo are Office & Administration (12 | 10.3%), and Sales & Related (5 | 4.3%).

Sales and Office Occupations by Sex

| Occupation | Male | Female |
| Sales & Related | 2 (40.0%) | 3 (60.0%) |
| Office & Administration | 0 (0.0%) | 12 (100.0%) |
| Total (Category) | 2 (11.8%) | 15 (88.2%) |
| Total (Overall) | 69 (59.0%) | 48 (41.0%) |
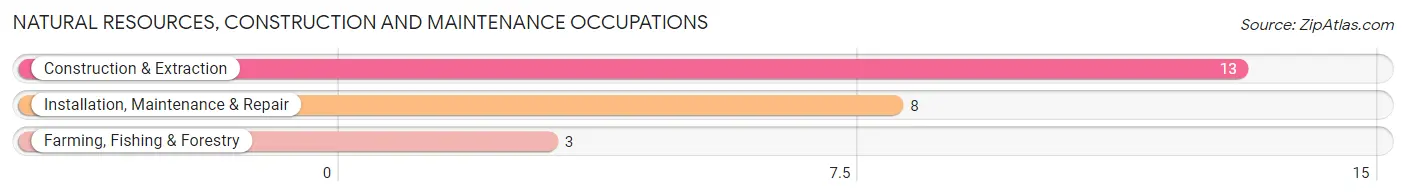
Natural Resources, Construction and Maintenance Occupations
The most common Natural Resources, Construction and Maintenance occupations in Tupelo are Construction & Extraction (13 | 11.1%), Installation, Maintenance & Repair (8 | 6.8%), and Farming, Fishing & Forestry (3 | 2.6%).
Natural Resources, Construction and Maintenance Occupations by Sex
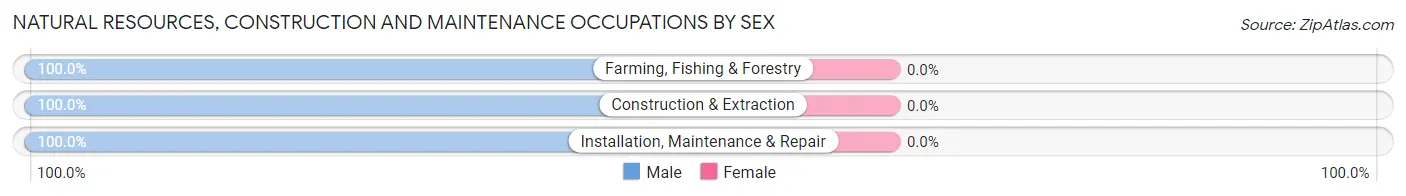
| Occupation | Male | Female |
| Farming, Fishing & Forestry | 3 (100.0%) | 0 (0.0%) |
| Construction & Extraction | 13 (100.0%) | 0 (0.0%) |
| Installation, Maintenance & Repair | 8 (100.0%) | 0 (0.0%) |
| Total (Category) | 24 (100.0%) | 0 (0.0%) |
| Total (Overall) | 69 (59.0%) | 48 (41.0%) |
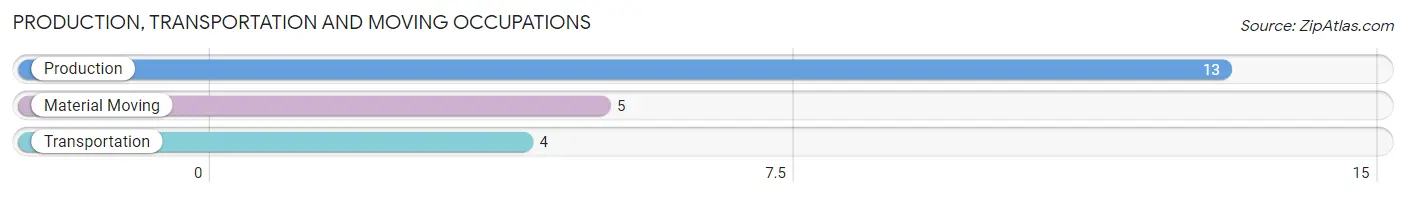
Production, Transportation and Moving Occupations
The most common Production, Transportation and Moving occupations in Tupelo are Production (13 | 11.1%), Material Moving (5 | 4.3%), and Transportation (4 | 3.4%).
Production, Transportation and Moving Occupations by Sex
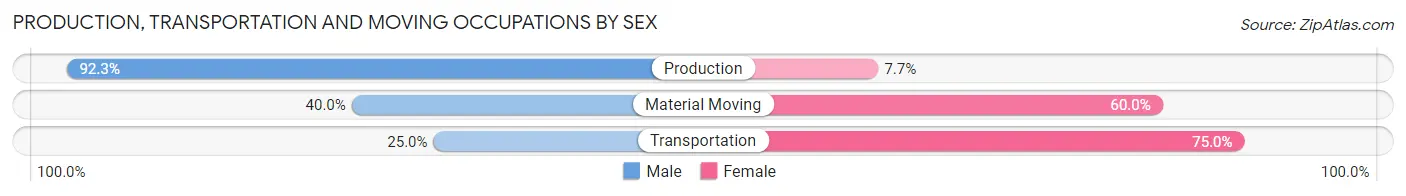
| Occupation | Male | Female |
| Production | 12 (92.3%) | 1 (7.7%) |
| Transportation | 1 (25.0%) | 3 (75.0%) |
| Material Moving | 2 (40.0%) | 3 (60.0%) |
| Total (Category) | 15 (68.2%) | 7 (31.8%) |
| Total (Overall) | 69 (59.0%) | 48 (41.0%) |
Employment Industries by Sex in Tupelo
Employment Industries in Tupelo
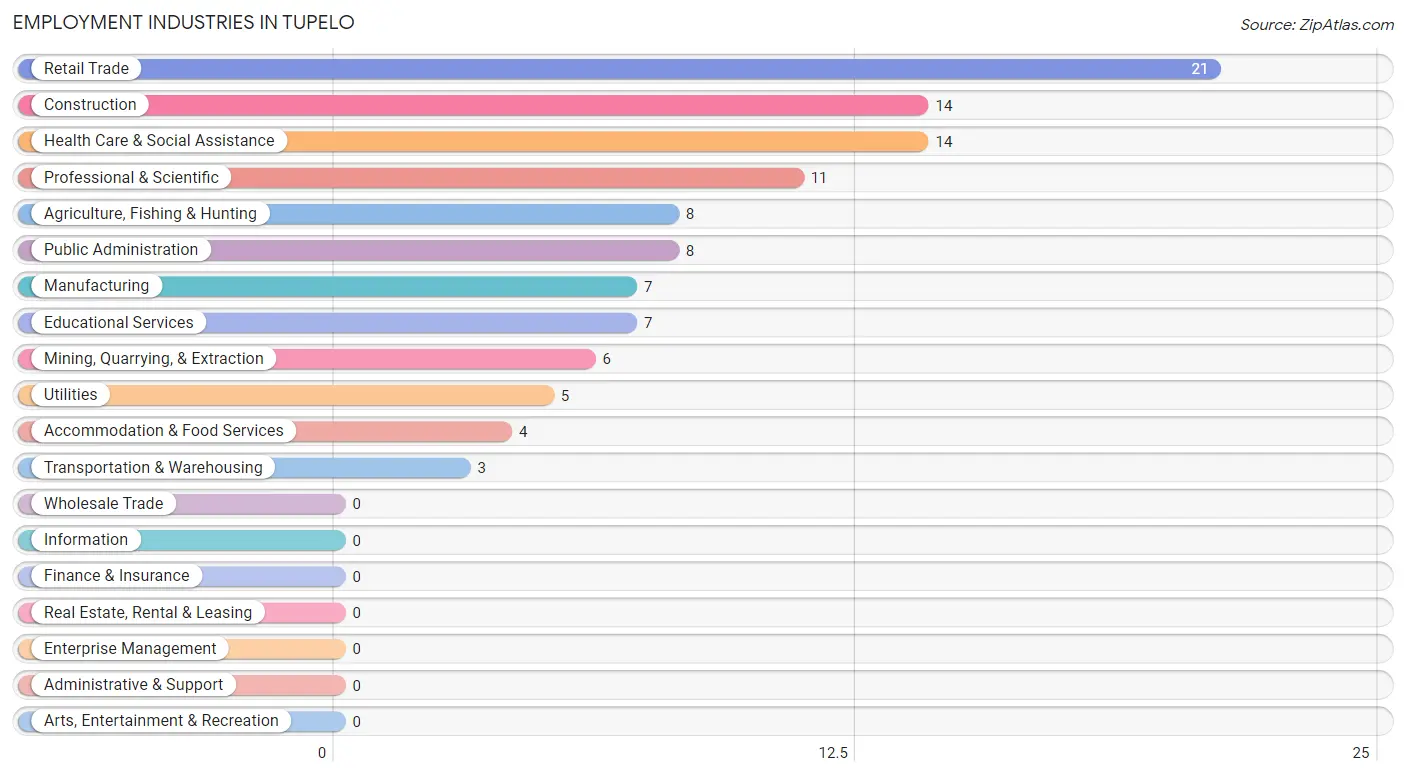
The major employment industries in Tupelo include Retail Trade (21 | 17.9%), Construction (14 | 12.0%), Health Care & Social Assistance (14 | 12.0%), Professional & Scientific (11 | 9.4%), and Agriculture, Fishing & Hunting (8 | 6.8%).
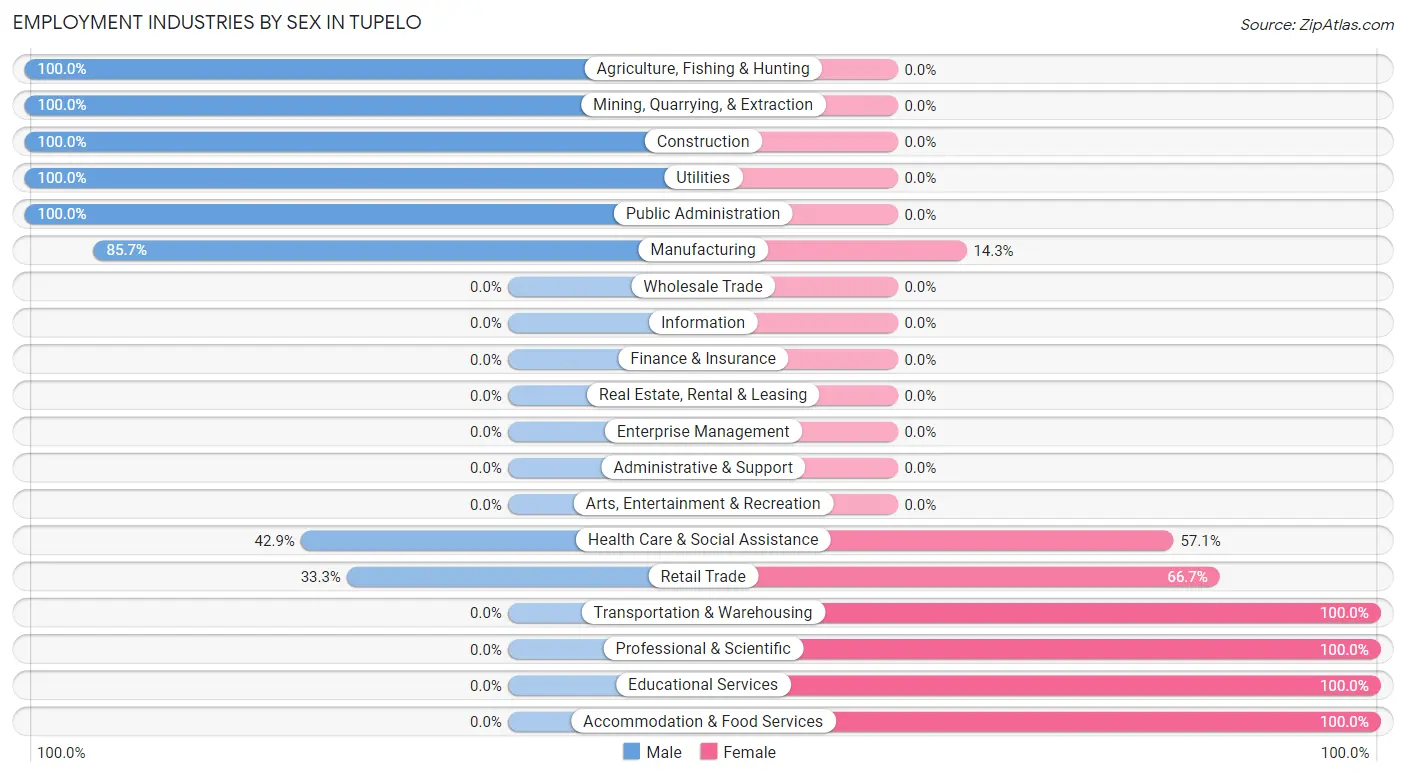
Employment Industries by Sex in Tupelo
The Tupelo industries that see more men than women are Agriculture, Fishing & Hunting (100.0%), Mining, Quarrying, & Extraction (100.0%), and Construction (100.0%), whereas the industries that tend to have a higher number of women are Transportation & Warehousing (100.0%), Professional & Scientific (100.0%), and Educational Services (100.0%).
| Industry | Male | Female |
| Agriculture, Fishing & Hunting | 8 (100.0%) | 0 (0.0%) |
| Mining, Quarrying, & Extraction | 6 (100.0%) | 0 (0.0%) |
| Construction | 14 (100.0%) | 0 (0.0%) |
| Manufacturing | 6 (85.7%) | 1 (14.3%) |
| Wholesale Trade | 0 (0.0%) | 0 (0.0%) |
| Retail Trade | 7 (33.3%) | 14 (66.7%) |
| Transportation & Warehousing | 0 (0.0%) | 3 (100.0%) |
| Utilities | 5 (100.0%) | 0 (0.0%) |
| Information | 0 (0.0%) | 0 (0.0%) |
| Finance & Insurance | 0 (0.0%) | 0 (0.0%) |
| Real Estate, Rental & Leasing | 0 (0.0%) | 0 (0.0%) |
| Professional & Scientific | 0 (0.0%) | 11 (100.0%) |
| Enterprise Management | 0 (0.0%) | 0 (0.0%) |
| Administrative & Support | 0 (0.0%) | 0 (0.0%) |
| Educational Services | 0 (0.0%) | 7 (100.0%) |
| Health Care & Social Assistance | 6 (42.9%) | 8 (57.1%) |
| Arts, Entertainment & Recreation | 0 (0.0%) | 0 (0.0%) |
| Accommodation & Food Services | 0 (0.0%) | 4 (100.0%) |
| Public Administration | 8 (100.0%) | 0 (0.0%) |
| Total | 69 (59.0%) | 48 (41.0%) |
Education in Tupelo
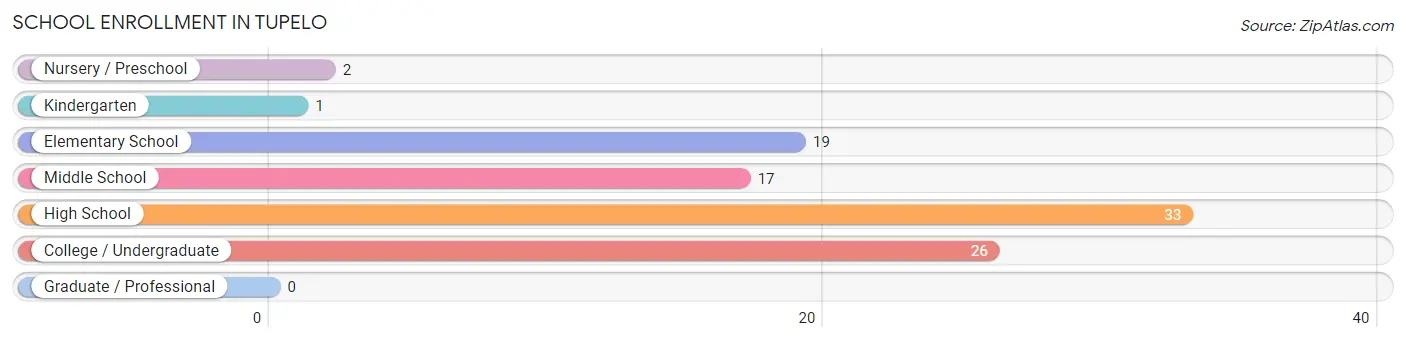
School Enrollment in Tupelo
The most common levels of schooling among the 98 students in Tupelo are high school (33 | 33.7%), college / undergraduate (26 | 26.5%), and elementary school (19 | 19.4%).
| School Level | # Students | % Students |
| Nursery / Preschool | 2 | 2.0% |
| Kindergarten | 1 | 1.0% |
| Elementary School | 19 | 19.4% |
| Middle School | 17 | 17.3% |
| High School | 33 | 33.7% |
| College / Undergraduate | 26 | 26.5% |
| Graduate / Professional | 0 | 0.0% |
| Total | 98 | 100.0% |
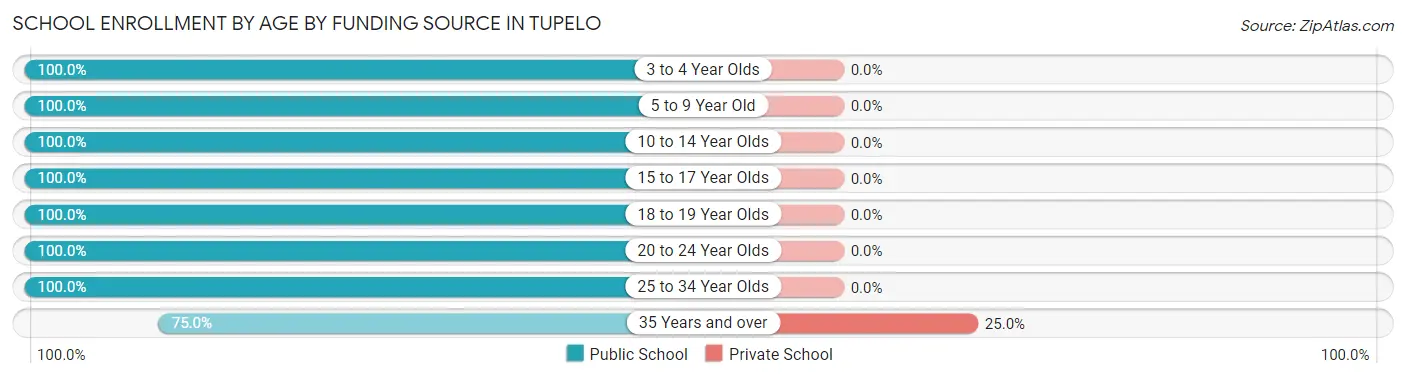
School Enrollment by Age by Funding Source in Tupelo
Out of a total of 98 students who are enrolled in schools in Tupelo, 1 (1.0%) attend a private institution, while the remaining 97 (99.0%) are enrolled in public schools. The age group of 35 years and over has the highest likelihood of being enrolled in private schools, with 1 (25.0% in the age bracket) enrolled. Conversely, the age group of 3 to 4 year olds has the lowest likelihood of being enrolled in a private school, with 2 (100.0% in the age bracket) attending a public institution.
| Age Bracket | Public School | Private School |
| 3 to 4 Year Olds | 2 (100.0%) | 0 (0.0%) |
| 5 to 9 Year Old | 17 (100.0%) | 0 (0.0%) |
| 10 to 14 Year Olds | 20 (100.0%) | 0 (0.0%) |
| 15 to 17 Year Olds | 18 (100.0%) | 0 (0.0%) |
| 18 to 19 Year Olds | 18 (100.0%) | 0 (0.0%) |
| 20 to 24 Year Olds | 15 (100.0%) | 0 (0.0%) |
| 25 to 34 Year Olds | 4 (100.0%) | 0 (0.0%) |
| 35 Years and over | 3 (75.0%) | 1 (25.0%) |
| Total | 97 (99.0%) | 1 (1.0%) |
Educational Attainment by Field of Study in Tupelo
Education (8 | 38.1%), bio, nature & agricultural (3 | 14.3%), physical & health sciences (3 | 14.3%), literature & languages (3 | 14.3%), and arts & humanities (2 | 9.5%) are the most common fields of study among 21 individuals in Tupelo who have obtained a bachelor's degree or higher.
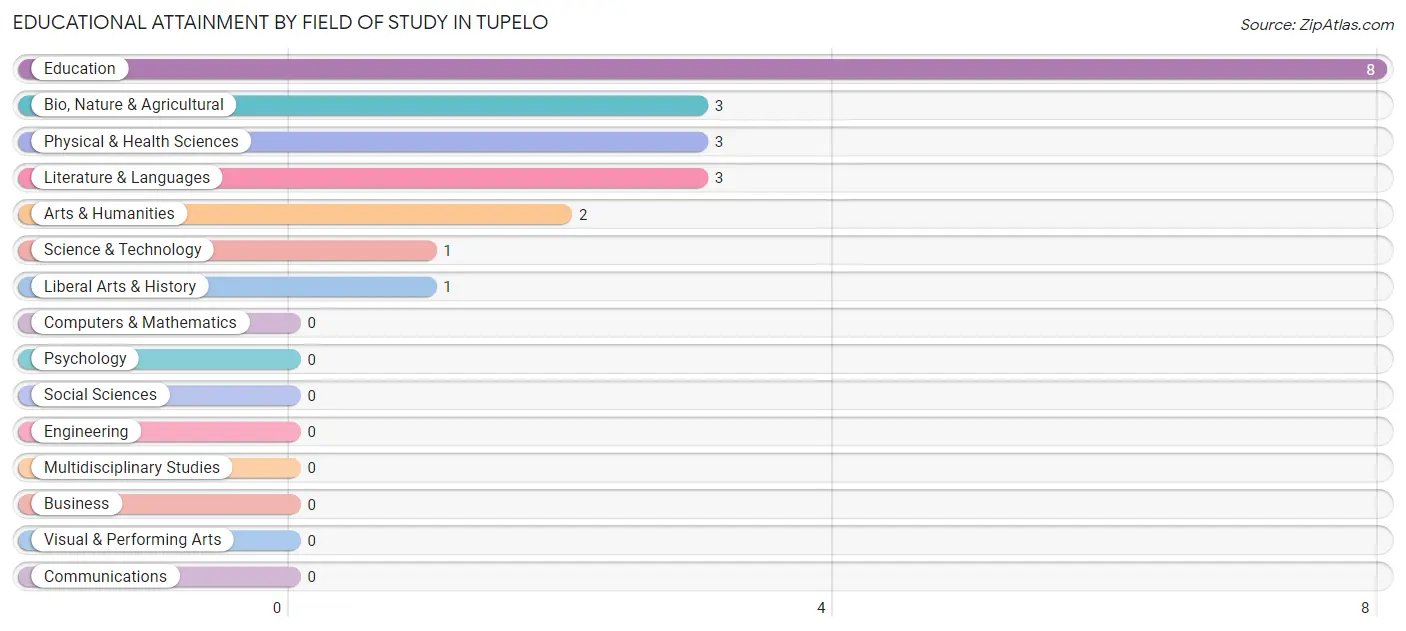
| Field of Study | # Graduates | % Graduates |
| Computers & Mathematics | 0 | 0.0% |
| Bio, Nature & Agricultural | 3 | 14.3% |
| Physical & Health Sciences | 3 | 14.3% |
| Psychology | 0 | 0.0% |
| Social Sciences | 0 | 0.0% |
| Engineering | 0 | 0.0% |
| Multidisciplinary Studies | 0 | 0.0% |
| Science & Technology | 1 | 4.8% |
| Business | 0 | 0.0% |
| Education | 8 | 38.1% |
| Literature & Languages | 3 | 14.3% |
| Liberal Arts & History | 1 | 4.8% |
| Visual & Performing Arts | 0 | 0.0% |
| Communications | 0 | 0.0% |
| Arts & Humanities | 2 | 9.5% |
| Total | 21 | 100.0% |
Transportation & Commute in Tupelo
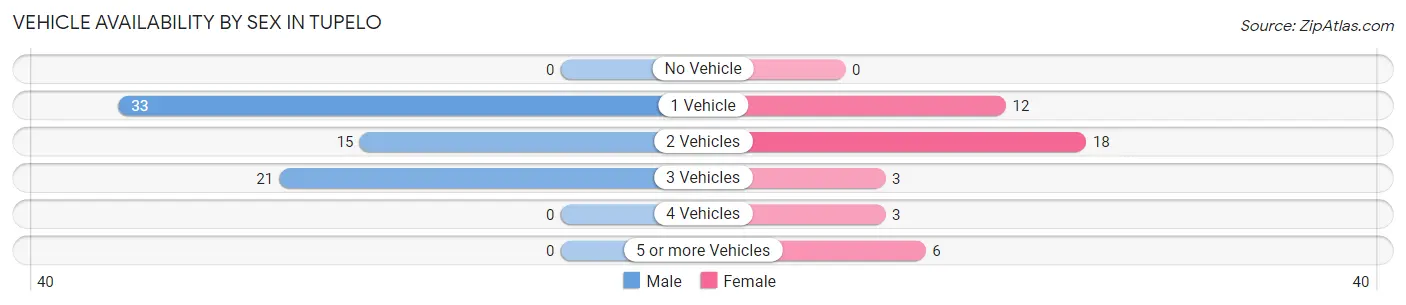
Vehicle Availability by Sex in Tupelo
The most prevalent vehicle ownership categories in Tupelo are males with 1 vehicle (33, accounting for 47.8%) and females with 1 vehicle (12, making up 78.6%).
| Vehicles Available | Male | Female |
| No Vehicle | 0 (0.0%) | 0 (0.0%) |
| 1 Vehicle | 33 (47.8%) | 12 (28.6%) |
| 2 Vehicles | 15 (21.7%) | 18 (42.9%) |
| 3 Vehicles | 21 (30.4%) | 3 (7.1%) |
| 4 Vehicles | 0 (0.0%) | 3 (7.1%) |
| 5 or more Vehicles | 0 (0.0%) | 6 (14.3%) |
| Total | 69 (100.0%) | 42 (100.0%) |
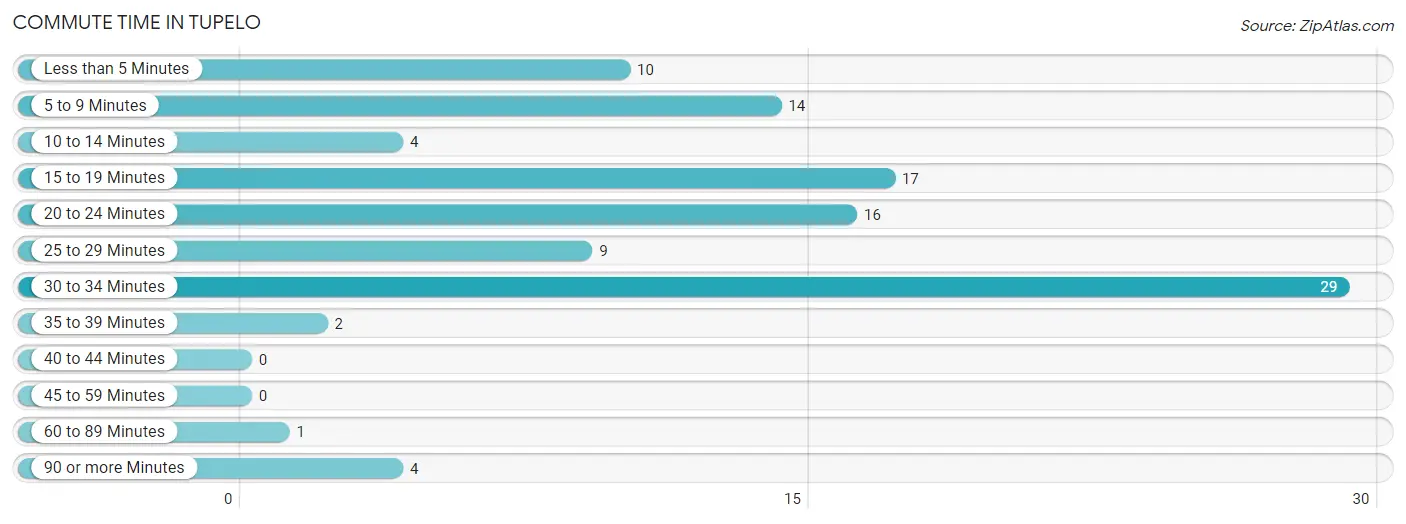
Commute Time in Tupelo
The most frequently occuring commute durations in Tupelo are 30 to 34 minutes (29 commuters, 27.4%), 15 to 19 minutes (17 commuters, 16.0%), and 20 to 24 minutes (16 commuters, 15.1%).
| Commute Time | # Commuters | % Commuters |
| Less than 5 Minutes | 10 | 9.4% |
| 5 to 9 Minutes | 14 | 13.2% |
| 10 to 14 Minutes | 4 | 3.8% |
| 15 to 19 Minutes | 17 | 16.0% |
| 20 to 24 Minutes | 16 | 15.1% |
| 25 to 29 Minutes | 9 | 8.5% |
| 30 to 34 Minutes | 29 | 27.4% |
| 35 to 39 Minutes | 2 | 1.9% |
| 40 to 44 Minutes | 0 | 0.0% |
| 45 to 59 Minutes | 0 | 0.0% |
| 60 to 89 Minutes | 1 | 0.9% |
| 90 or more Minutes | 4 | 3.8% |
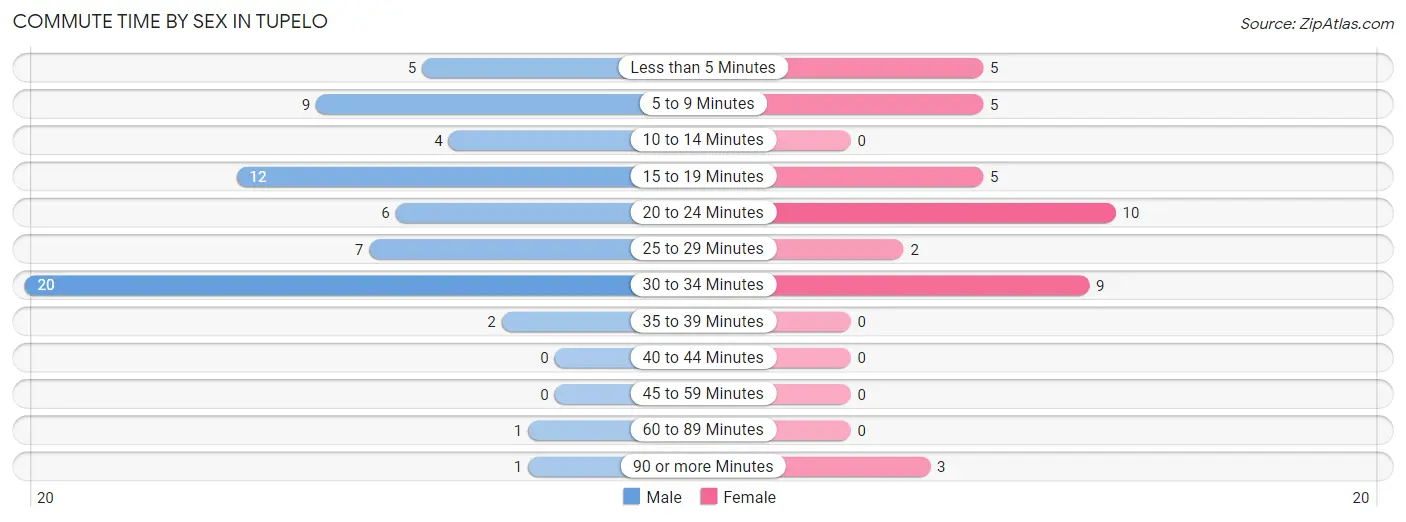
Commute Time by Sex in Tupelo
The most common commute times in Tupelo are 30 to 34 minutes (20 commuters, 29.8%) for males and 20 to 24 minutes (10 commuters, 25.6%) for females.
| Commute Time | Male | Female |
| Less than 5 Minutes | 5 (7.5%) | 5 (12.8%) |
| 5 to 9 Minutes | 9 (13.4%) | 5 (12.8%) |
| 10 to 14 Minutes | 4 (6.0%) | 0 (0.0%) |
| 15 to 19 Minutes | 12 (17.9%) | 5 (12.8%) |
| 20 to 24 Minutes | 6 (9.0%) | 10 (25.6%) |
| 25 to 29 Minutes | 7 (10.4%) | 2 (5.1%) |
| 30 to 34 Minutes | 20 (29.8%) | 9 (23.1%) |
| 35 to 39 Minutes | 2 (3.0%) | 0 (0.0%) |
| 40 to 44 Minutes | 0 (0.0%) | 0 (0.0%) |
| 45 to 59 Minutes | 0 (0.0%) | 0 (0.0%) |
| 60 to 89 Minutes | 1 (1.5%) | 0 (0.0%) |
| 90 or more Minutes | 1 (1.5%) | 3 (7.7%) |
Time of Departure to Work by Sex in Tupelo
The most frequent times of departure to work in Tupelo are 7:00 AM to 7:29 AM (15, 22.4%) for males and 6:30 AM to 6:59 AM (7, 17.9%) for females.
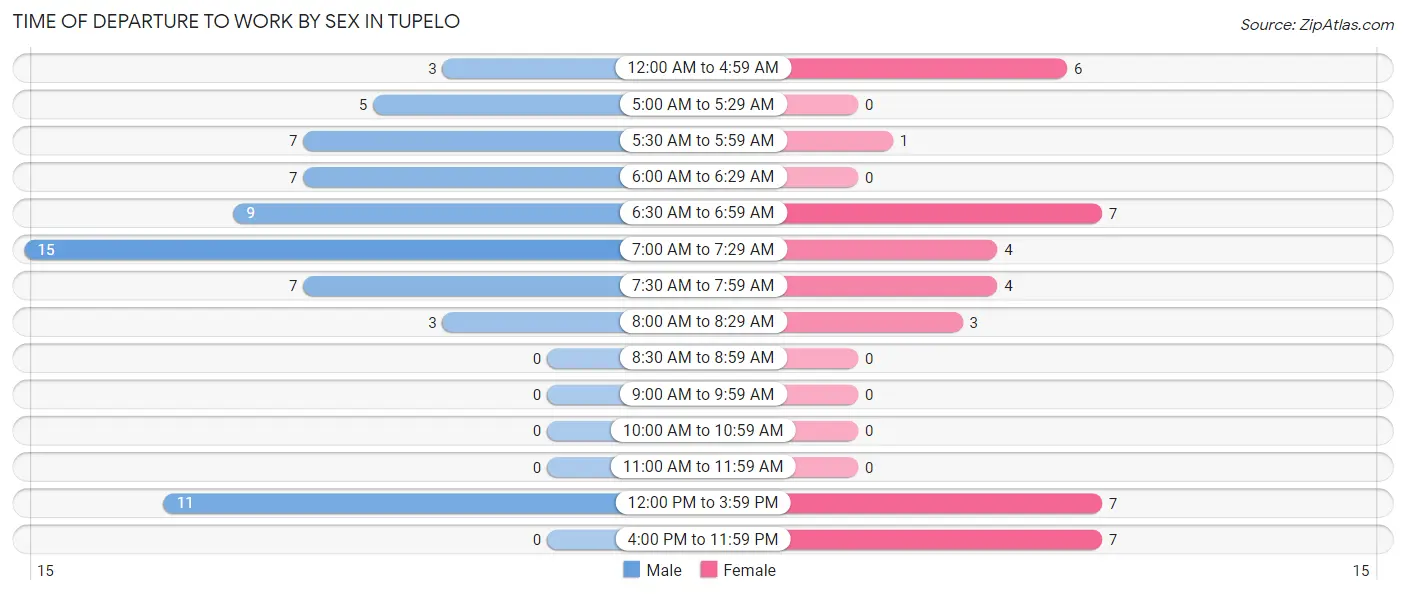
| Time of Departure | Male | Female |
| 12:00 AM to 4:59 AM | 3 (4.5%) | 6 (15.4%) |
| 5:00 AM to 5:29 AM | 5 (7.5%) | 0 (0.0%) |
| 5:30 AM to 5:59 AM | 7 (10.4%) | 1 (2.6%) |
| 6:00 AM to 6:29 AM | 7 (10.4%) | 0 (0.0%) |
| 6:30 AM to 6:59 AM | 9 (13.4%) | 7 (17.9%) |
| 7:00 AM to 7:29 AM | 15 (22.4%) | 4 (10.3%) |
| 7:30 AM to 7:59 AM | 7 (10.4%) | 4 (10.3%) |
| 8:00 AM to 8:29 AM | 3 (4.5%) | 3 (7.7%) |
| 8:30 AM to 8:59 AM | 0 (0.0%) | 0 (0.0%) |
| 9:00 AM to 9:59 AM | 0 (0.0%) | 0 (0.0%) |
| 10:00 AM to 10:59 AM | 0 (0.0%) | 0 (0.0%) |
| 11:00 AM to 11:59 AM | 0 (0.0%) | 0 (0.0%) |
| 12:00 PM to 3:59 PM | 11 (16.4%) | 7 (17.9%) |
| 4:00 PM to 11:59 PM | 0 (0.0%) | 7 (17.9%) |
| Total | 67 (100.0%) | 39 (100.0%) |
Housing Occupancy in Tupelo
Occupancy by Ownership in Tupelo
Of the total 133 dwellings in Tupelo, owner-occupied units account for 93 (69.9%), while renter-occupied units make up 40 (30.1%).
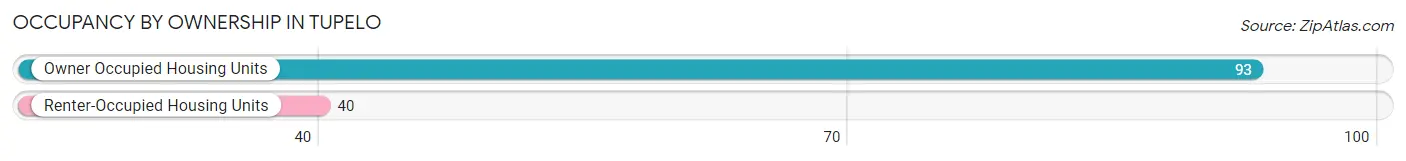
| Occupancy | # Housing Units | % Housing Units |
| Owner Occupied Housing Units | 93 | 69.9% |
| Renter-Occupied Housing Units | 40 | 30.1% |
| Total Occupied Housing Units | 133 | 100.0% |
Occupancy by Household Size in Tupelo
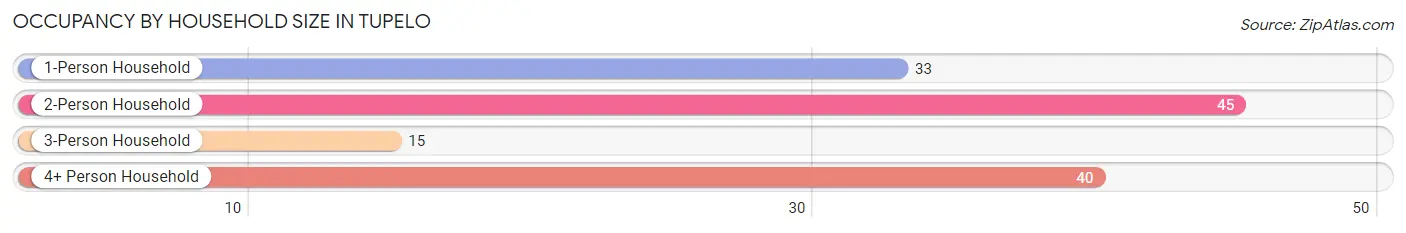
| Household Size | # Housing Units | % Housing Units |
| 1-Person Household | 33 | 24.8% |
| 2-Person Household | 45 | 33.8% |
| 3-Person Household | 15 | 11.3% |
| 4+ Person Household | 40 | 30.1% |
| Total Housing Units | 133 | 100.0% |
Occupancy by Ownership by Household Size in Tupelo
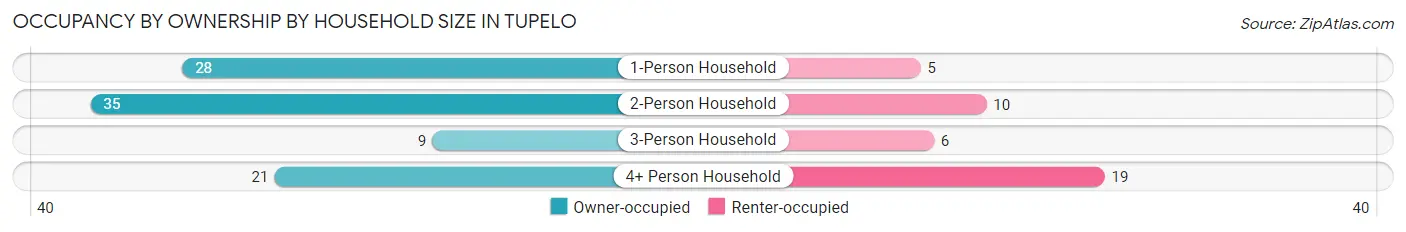
| Household Size | Owner-occupied | Renter-occupied |
| 1-Person Household | 28 (84.9%) | 5 (15.1%) |
| 2-Person Household | 35 (77.8%) | 10 (22.2%) |
| 3-Person Household | 9 (60.0%) | 6 (40.0%) |
| 4+ Person Household | 21 (52.5%) | 19 (47.5%) |
| Total Housing Units | 93 (69.9%) | 40 (30.1%) |
Occupancy by Educational Attainment in Tupelo
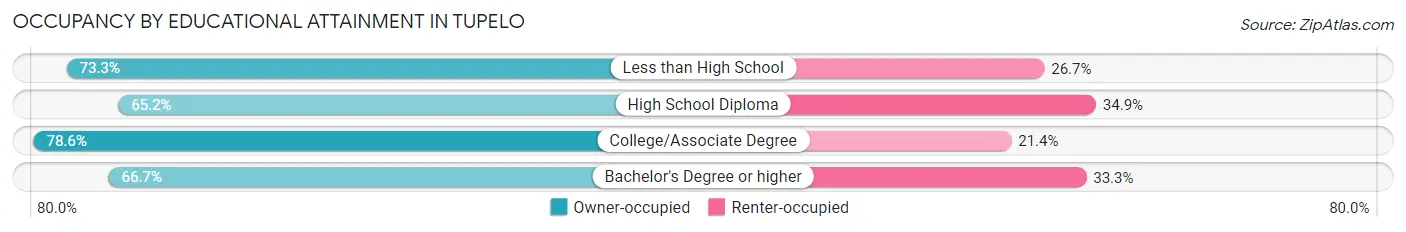
| Household Size | Owner-occupied | Renter-occupied |
| Less than High School | 22 (73.3%) | 8 (26.7%) |
| High School Diploma | 43 (65.1%) | 23 (34.8%) |
| College/Associate Degree | 22 (78.6%) | 6 (21.4%) |
| Bachelor's Degree or higher | 6 (66.7%) | 3 (33.3%) |
Occupancy by Age of Householder in Tupelo
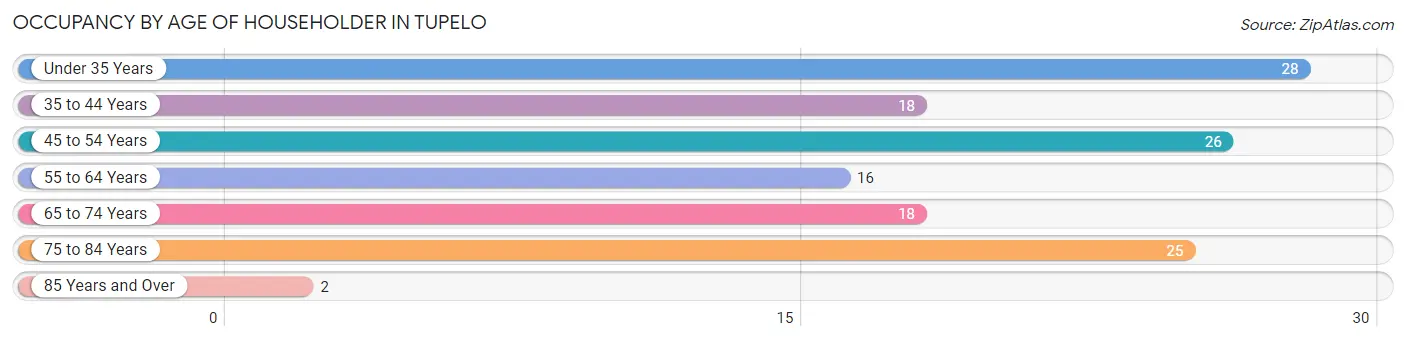
| Age Bracket | # Households | % Households |
| Under 35 Years | 28 | 21.0% |
| 35 to 44 Years | 18 | 13.5% |
| 45 to 54 Years | 26 | 19.6% |
| 55 to 64 Years | 16 | 12.0% |
| 65 to 74 Years | 18 | 13.5% |
| 75 to 84 Years | 25 | 18.8% |
| 85 Years and Over | 2 | 1.5% |
| Total | 133 | 100.0% |
Housing Finances in Tupelo
Median Income by Occupancy in Tupelo
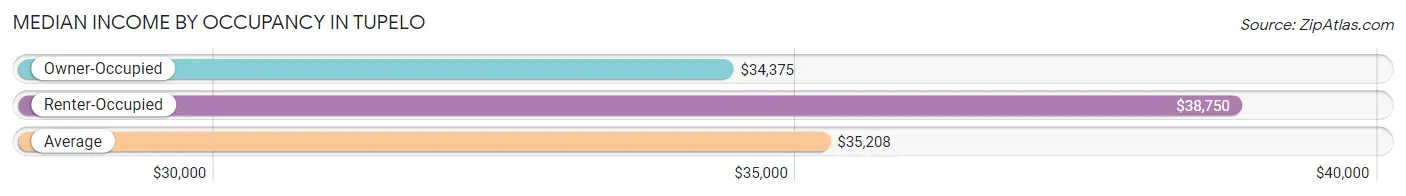
| Occupancy Type | # Households | Median Income |
| Owner-Occupied | 93 (69.9%) | $34,375 |
| Renter-Occupied | 40 (30.1%) | $38,750 |
| Average | 133 (100.0%) | $35,208 |
Occupancy by Householder Income Bracket in Tupelo
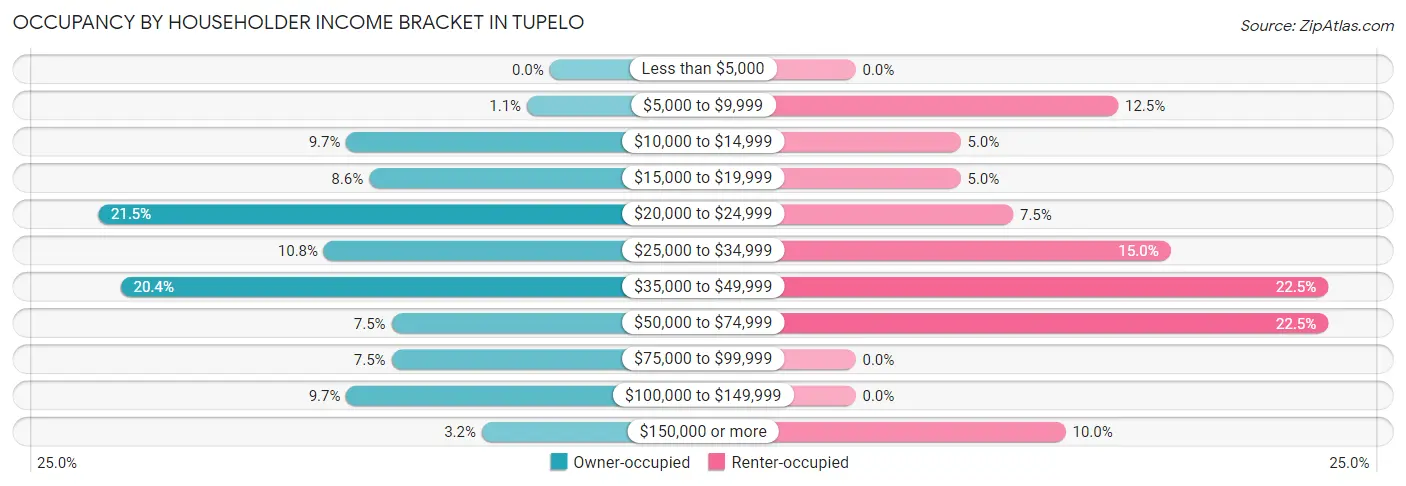
| Income Bracket | Owner-occupied | Renter-occupied |
| Less than $5,000 | 0 (0.0%) | 0 (0.0%) |
| $5,000 to $9,999 | 1 (1.1%) | 5 (12.5%) |
| $10,000 to $14,999 | 9 (9.7%) | 2 (5.0%) |
| $15,000 to $19,999 | 8 (8.6%) | 2 (5.0%) |
| $20,000 to $24,999 | 20 (21.5%) | 3 (7.5%) |
| $25,000 to $34,999 | 10 (10.7%) | 6 (15.0%) |
| $35,000 to $49,999 | 19 (20.4%) | 9 (22.5%) |
| $50,000 to $74,999 | 7 (7.5%) | 9 (22.5%) |
| $75,000 to $99,999 | 7 (7.5%) | 0 (0.0%) |
| $100,000 to $149,999 | 9 (9.7%) | 0 (0.0%) |
| $150,000 or more | 3 (3.2%) | 4 (10.0%) |
| Total | 93 (100.0%) | 40 (100.0%) |
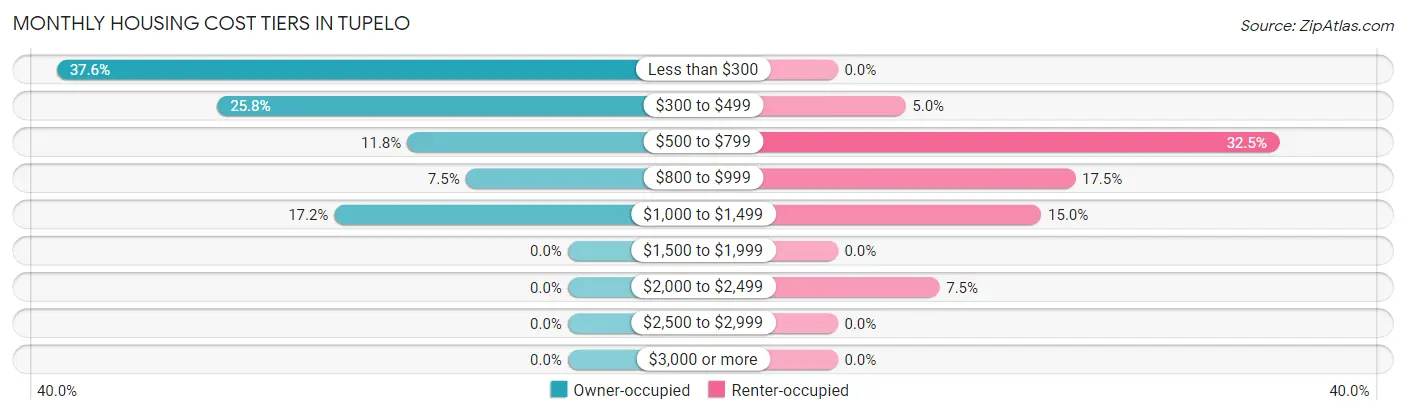
Monthly Housing Cost Tiers in Tupelo
| Monthly Cost | Owner-occupied | Renter-occupied |
| Less than $300 | 35 (37.6%) | 0 (0.0%) |
| $300 to $499 | 24 (25.8%) | 2 (5.0%) |
| $500 to $799 | 11 (11.8%) | 13 (32.5%) |
| $800 to $999 | 7 (7.5%) | 7 (17.5%) |
| $1,000 to $1,499 | 16 (17.2%) | 6 (15.0%) |
| $1,500 to $1,999 | 0 (0.0%) | 0 (0.0%) |
| $2,000 to $2,499 | 0 (0.0%) | 3 (7.5%) |
| $2,500 to $2,999 | 0 (0.0%) | 0 (0.0%) |
| $3,000 or more | 0 (0.0%) | 0 (0.0%) |
| Total | 93 (100.0%) | 40 (100.0%) |
Physical Housing Characteristics in Tupelo
Housing Structures in Tupelo
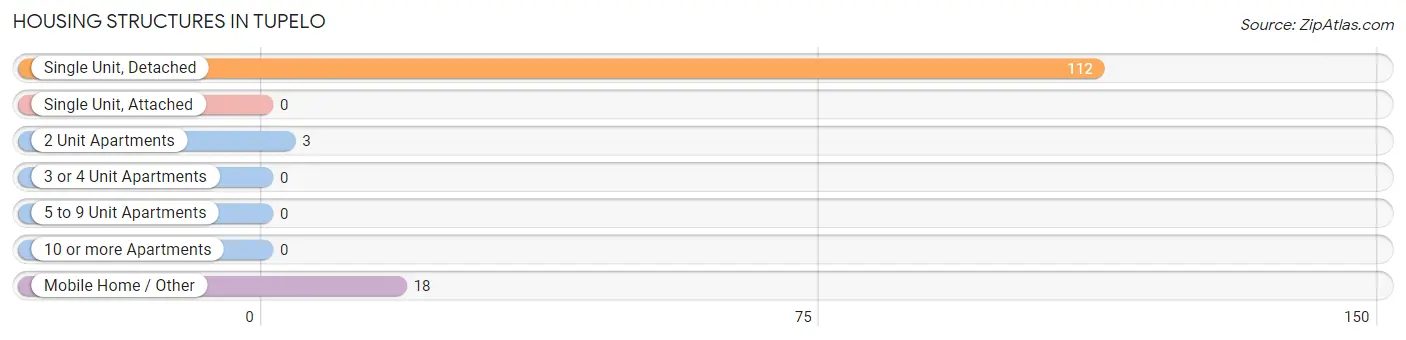
| Structure Type | # Housing Units | % Housing Units |
| Single Unit, Detached | 112 | 84.2% |
| Single Unit, Attached | 0 | 0.0% |
| 2 Unit Apartments | 3 | 2.3% |
| 3 or 4 Unit Apartments | 0 | 0.0% |
| 5 to 9 Unit Apartments | 0 | 0.0% |
| 10 or more Apartments | 0 | 0.0% |
| Mobile Home / Other | 18 | 13.5% |
| Total | 133 | 100.0% |
Housing Structures by Occupancy in Tupelo
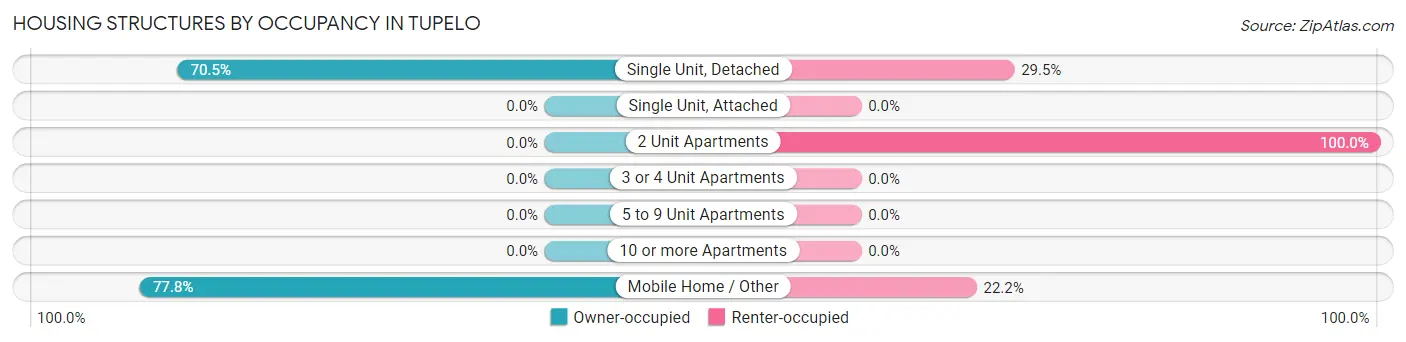
| Structure Type | Owner-occupied | Renter-occupied |
| Single Unit, Detached | 79 (70.5%) | 33 (29.5%) |
| Single Unit, Attached | 0 (0.0%) | 0 (0.0%) |
| 2 Unit Apartments | 0 (0.0%) | 3 (100.0%) |
| 3 or 4 Unit Apartments | 0 (0.0%) | 0 (0.0%) |
| 5 to 9 Unit Apartments | 0 (0.0%) | 0 (0.0%) |
| 10 or more Apartments | 0 (0.0%) | 0 (0.0%) |
| Mobile Home / Other | 14 (77.8%) | 4 (22.2%) |
| Total | 93 (69.9%) | 40 (30.1%) |
Housing Structures by Number of Rooms in Tupelo
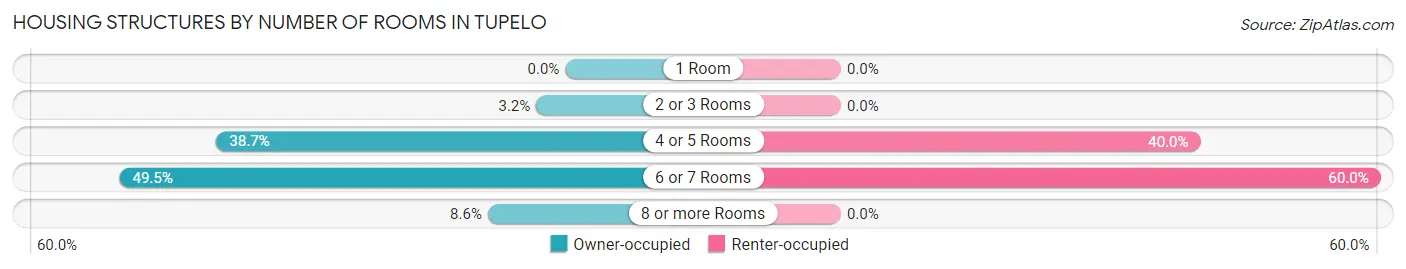
| Number of Rooms | Owner-occupied | Renter-occupied |
| 1 Room | 0 (0.0%) | 0 (0.0%) |
| 2 or 3 Rooms | 3 (3.2%) | 0 (0.0%) |
| 4 or 5 Rooms | 36 (38.7%) | 16 (40.0%) |
| 6 or 7 Rooms | 46 (49.5%) | 24 (60.0%) |
| 8 or more Rooms | 8 (8.6%) | 0 (0.0%) |
| Total | 93 (100.0%) | 40 (100.0%) |
Housing Structure by Heating Type in Tupelo
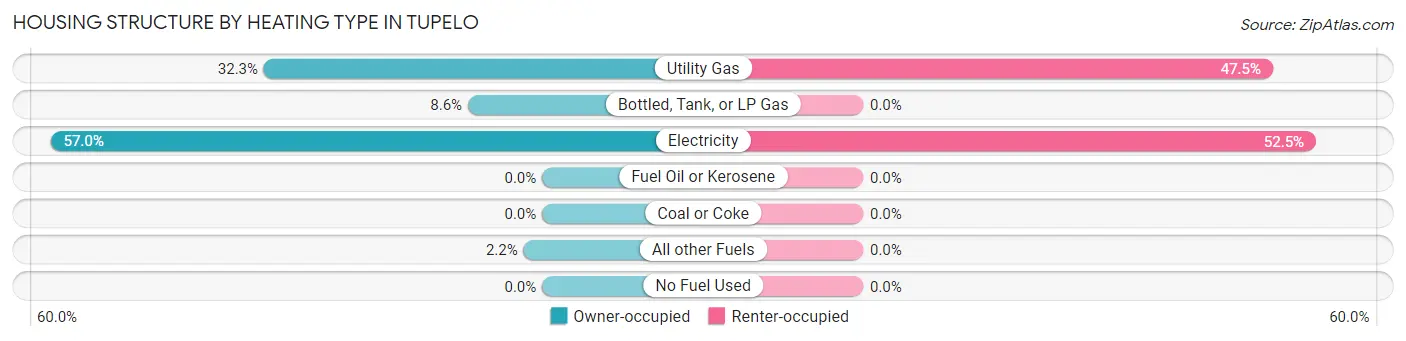
| Heating Type | Owner-occupied | Renter-occupied |
| Utility Gas | 30 (32.3%) | 19 (47.5%) |
| Bottled, Tank, or LP Gas | 8 (8.6%) | 0 (0.0%) |
| Electricity | 53 (57.0%) | 21 (52.5%) |
| Fuel Oil or Kerosene | 0 (0.0%) | 0 (0.0%) |
| Coal or Coke | 0 (0.0%) | 0 (0.0%) |
| All other Fuels | 2 (2.1%) | 0 (0.0%) |
| No Fuel Used | 0 (0.0%) | 0 (0.0%) |
| Total | 93 (100.0%) | 40 (100.0%) |
Household Vehicle Usage in Tupelo
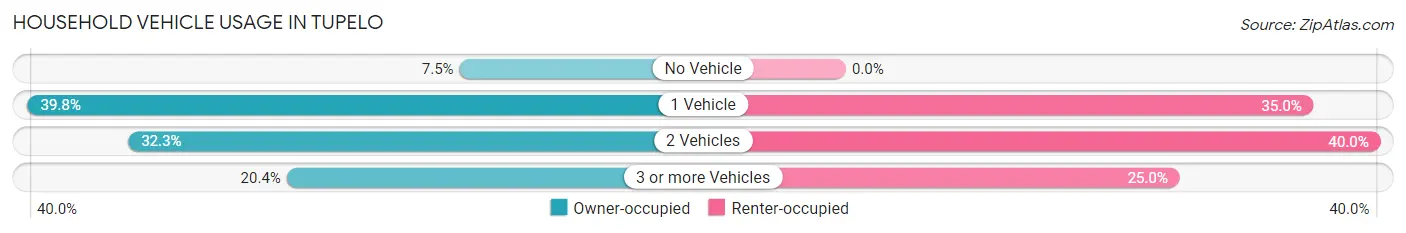
| Vehicles per Household | Owner-occupied | Renter-occupied |
| No Vehicle | 7 (7.5%) | 0 (0.0%) |
| 1 Vehicle | 37 (39.8%) | 14 (35.0%) |
| 2 Vehicles | 30 (32.3%) | 16 (40.0%) |
| 3 or more Vehicles | 19 (20.4%) | 10 (25.0%) |
| Total | 93 (100.0%) | 40 (100.0%) |
Real Estate & Mortgages in Tupelo
Real Estate and Mortgage Overview in Tupelo
| Characteristic | Without Mortgage | With Mortgage |
| Housing Units | 58 | 35 |
| Median Property Value | $43,300 | $68,300 |
| Median Household Income | $28,750 | $3 |
| Monthly Housing Costs | $280 | $0 |
| Real Estate Taxes | $199 | $12 |
Property Value by Mortgage Status in Tupelo
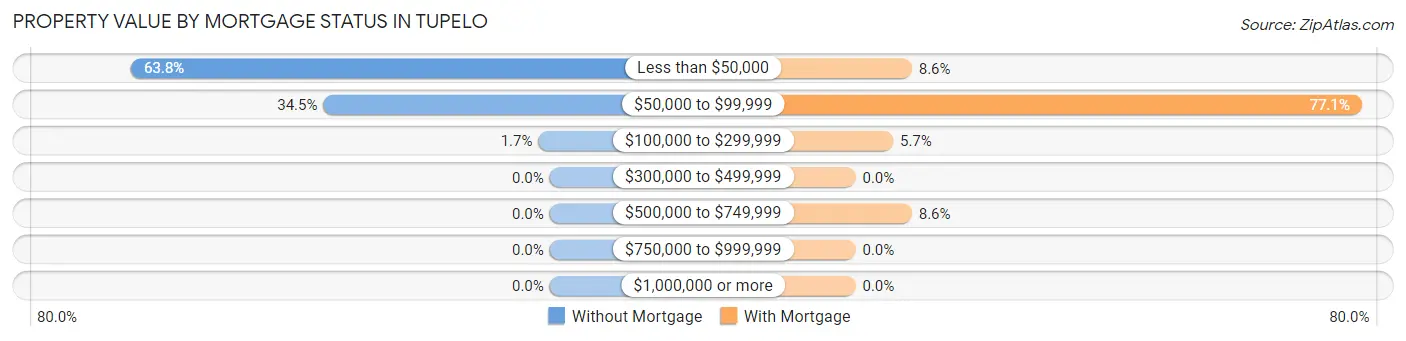
| Property Value | Without Mortgage | With Mortgage |
| Less than $50,000 | 37 (63.8%) | 3 (8.6%) |
| $50,000 to $99,999 | 20 (34.5%) | 27 (77.1%) |
| $100,000 to $299,999 | 1 (1.7%) | 2 (5.7%) |
| $300,000 to $499,999 | 0 (0.0%) | 0 (0.0%) |
| $500,000 to $749,999 | 0 (0.0%) | 3 (8.6%) |
| $750,000 to $999,999 | 0 (0.0%) | 0 (0.0%) |
| $1,000,000 or more | 0 (0.0%) | 0 (0.0%) |
| Total | 58 (100.0%) | 35 (100.0%) |
Household Income by Mortgage Status in Tupelo
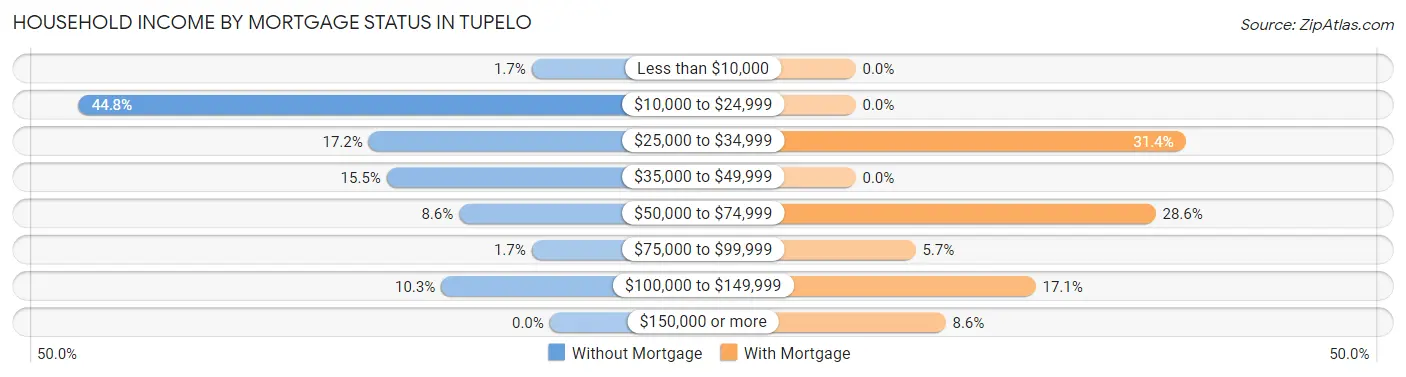
| Household Income | Without Mortgage | With Mortgage |
| Less than $10,000 | 1 (1.7%) | 0 (0.0%) |
| $10,000 to $24,999 | 26 (44.8%) | 0 (0.0%) |
| $25,000 to $34,999 | 10 (17.2%) | 11 (31.4%) |
| $35,000 to $49,999 | 9 (15.5%) | 0 (0.0%) |
| $50,000 to $74,999 | 5 (8.6%) | 10 (28.6%) |
| $75,000 to $99,999 | 1 (1.7%) | 2 (5.7%) |
| $100,000 to $149,999 | 6 (10.3%) | 6 (17.1%) |
| $150,000 or more | 0 (0.0%) | 3 (8.6%) |
| Total | 58 (100.0%) | 35 (100.0%) |
Property Value to Household Income Ratio in Tupelo
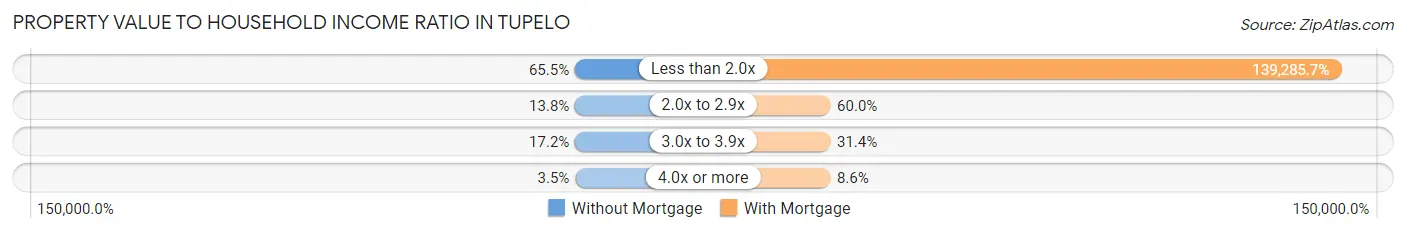
| Value-to-Income Ratio | Without Mortgage | With Mortgage |
| Less than 2.0x | 38 (65.5%) | 48,750 (139,285.7%) |
| 2.0x to 2.9x | 8 (13.8%) | 21 (60.0%) |
| 3.0x to 3.9x | 10 (17.2%) | 11 (31.4%) |
| 4.0x or more | 2 (3.5%) | 3 (8.6%) |
| Total | 58 (100.0%) | 35 (100.0%) |
Real Estate Taxes by Mortgage Status in Tupelo
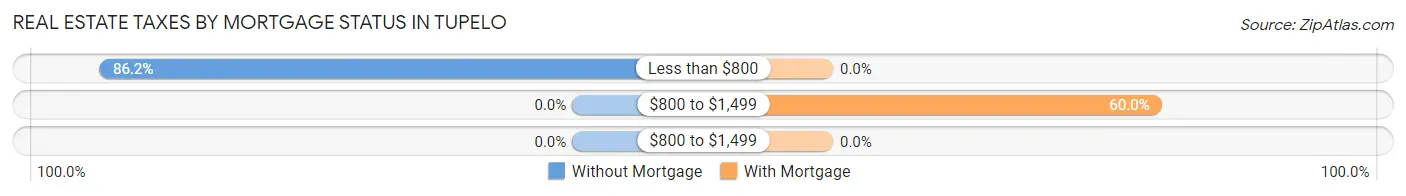
| Property Taxes | Without Mortgage | With Mortgage |
| Less than $800 | 50 (86.2%) | 0 (0.0%) |
| $800 to $1,499 | 0 (0.0%) | 21 (60.0%) |
| $800 to $1,499 | 0 (0.0%) | 0 (0.0%) |
| Total | 58 (100.0%) | 35 (100.0%) |
Health & Disability in Tupelo
Health Insurance Coverage by Age in Tupelo
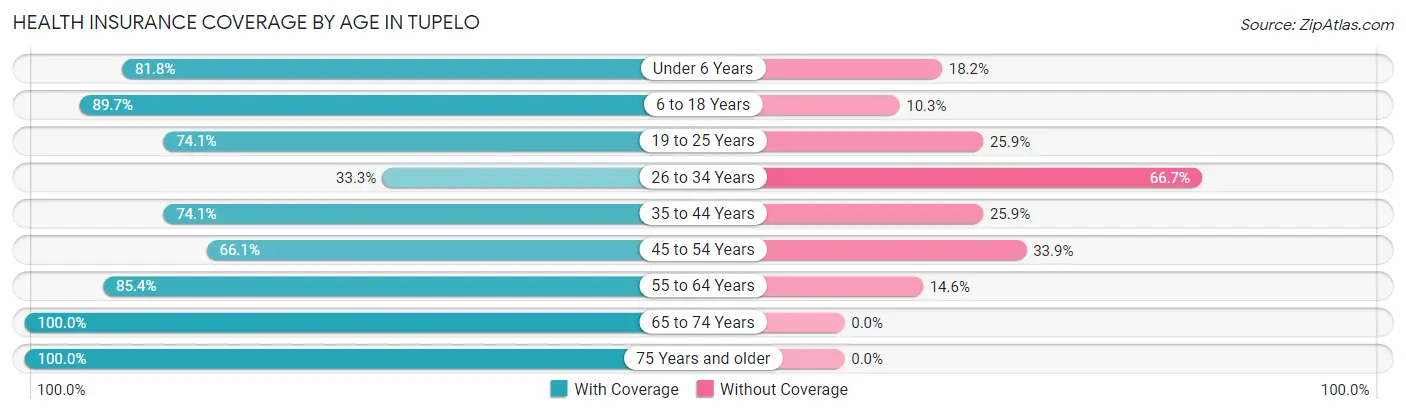
| Age Bracket | With Coverage | Without Coverage |
| Under 6 Years | 9 (81.8%) | 2 (18.2%) |
| 6 to 18 Years | 70 (89.7%) | 8 (10.3%) |
| 19 to 25 Years | 43 (74.1%) | 15 (25.9%) |
| 26 to 34 Years | 9 (33.3%) | 18 (66.7%) |
| 35 to 44 Years | 43 (74.1%) | 15 (25.9%) |
| 45 to 54 Years | 37 (66.1%) | 19 (33.9%) |
| 55 to 64 Years | 35 (85.4%) | 6 (14.6%) |
| 65 to 74 Years | 21 (100.0%) | 0 (0.0%) |
| 75 Years and older | 38 (100.0%) | 0 (0.0%) |
| Total | 305 (78.6%) | 83 (21.4%) |
Health Insurance Coverage by Citizenship Status in Tupelo
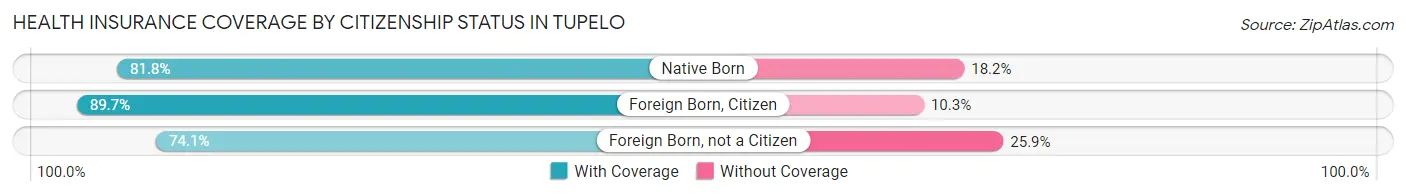
| Citizenship Status | With Coverage | Without Coverage |
| Native Born | 9 (81.8%) | 2 (18.2%) |
| Foreign Born, Citizen | 70 (89.7%) | 8 (10.3%) |
| Foreign Born, not a Citizen | 43 (74.1%) | 15 (25.9%) |
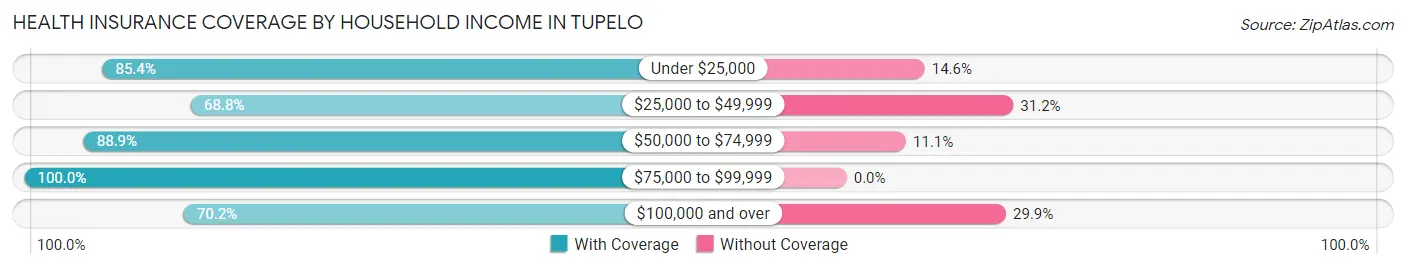
Health Insurance Coverage by Household Income in Tupelo
| Household Income | With Coverage | Without Coverage |
| Under $25,000 | 76 (85.4%) | 13 (14.6%) |
| $25,000 to $49,999 | 97 (68.8%) | 44 (31.2%) |
| $50,000 to $74,999 | 48 (88.9%) | 6 (11.1%) |
| $75,000 to $99,999 | 37 (100.0%) | 0 (0.0%) |
| $100,000 and over | 47 (70.2%) | 20 (29.8%) |
Public vs Private Health Insurance Coverage by Age in Tupelo
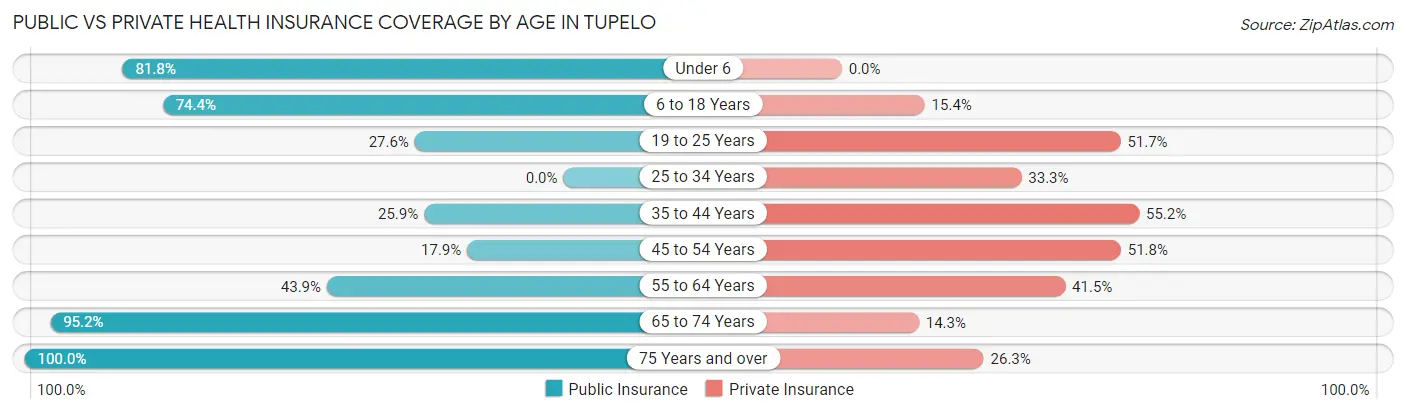
| Age Bracket | Public Insurance | Private Insurance |
| Under 6 | 9 (81.8%) | 0 (0.0%) |
| 6 to 18 Years | 58 (74.4%) | 12 (15.4%) |
| 19 to 25 Years | 16 (27.6%) | 30 (51.7%) |
| 25 to 34 Years | 0 (0.0%) | 9 (33.3%) |
| 35 to 44 Years | 15 (25.9%) | 32 (55.2%) |
| 45 to 54 Years | 10 (17.9%) | 29 (51.8%) |
| 55 to 64 Years | 18 (43.9%) | 17 (41.5%) |
| 65 to 74 Years | 20 (95.2%) | 3 (14.3%) |
| 75 Years and over | 38 (100.0%) | 10 (26.3%) |
| Total | 184 (47.4%) | 142 (36.6%) |
Disability Status by Sex by Age in Tupelo
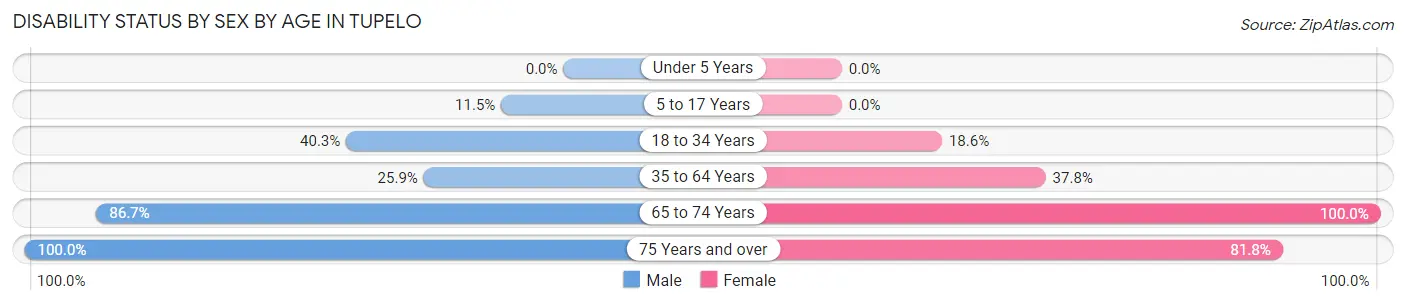
| Age Bracket | Male | Female |
| Under 5 Years | 0 (0.0%) | 0 (0.0%) |
| 5 to 17 Years | 3 (11.5%) | 0 (0.0%) |
| 18 to 34 Years | 25 (40.3%) | 8 (18.6%) |
| 35 to 64 Years | 21 (25.9%) | 28 (37.8%) |
| 65 to 74 Years | 13 (86.7%) | 6 (100.0%) |
| 75 Years and over | 16 (100.0%) | 18 (81.8%) |
Disability Class by Sex by Age in Tupelo
Disability Class: Hearing Difficulty
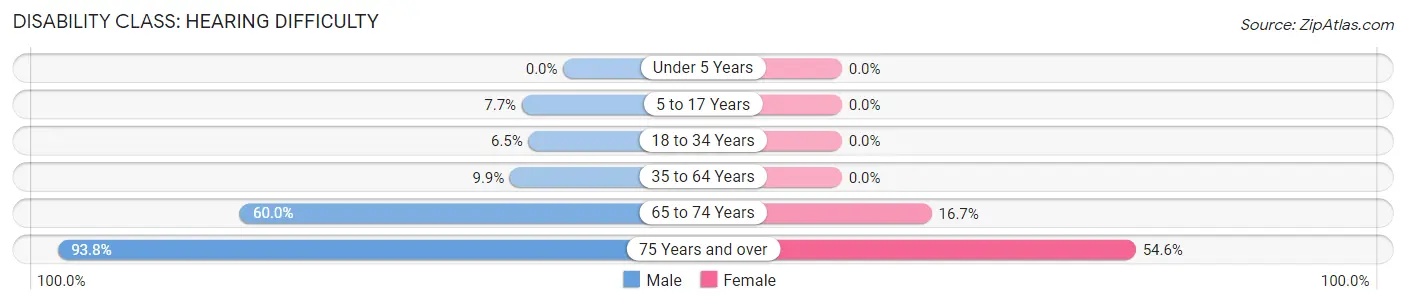
| Age Bracket | Male | Female |
| Under 5 Years | 0 (0.0%) | 0 (0.0%) |
| 5 to 17 Years | 2 (7.7%) | 0 (0.0%) |
| 18 to 34 Years | 4 (6.5%) | 0 (0.0%) |
| 35 to 64 Years | 8 (9.9%) | 0 (0.0%) |
| 65 to 74 Years | 9 (60.0%) | 1 (16.7%) |
| 75 Years and over | 15 (93.8%) | 12 (54.5%) |
Disability Class: Vision Difficulty
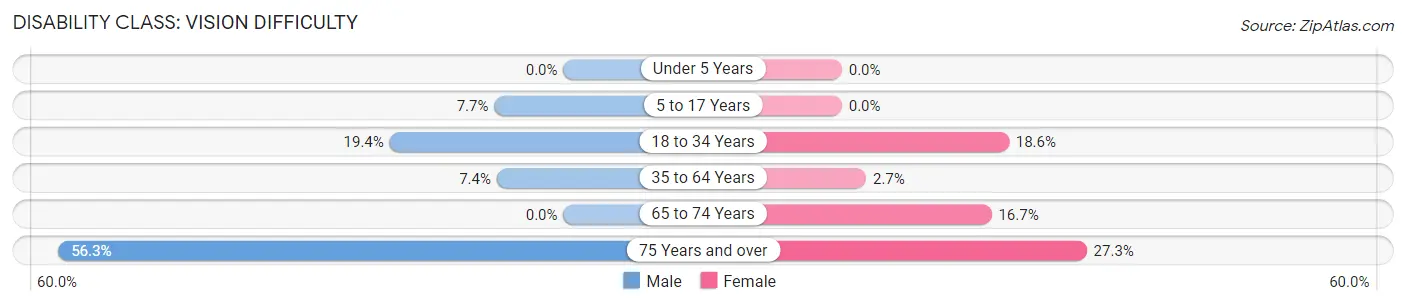
| Age Bracket | Male | Female |
| Under 5 Years | 0 (0.0%) | 0 (0.0%) |
| 5 to 17 Years | 2 (7.7%) | 0 (0.0%) |
| 18 to 34 Years | 12 (19.4%) | 8 (18.6%) |
| 35 to 64 Years | 6 (7.4%) | 2 (2.7%) |
| 65 to 74 Years | 0 (0.0%) | 1 (16.7%) |
| 75 Years and over | 9 (56.2%) | 6 (27.3%) |
Disability Class: Cognitive Difficulty
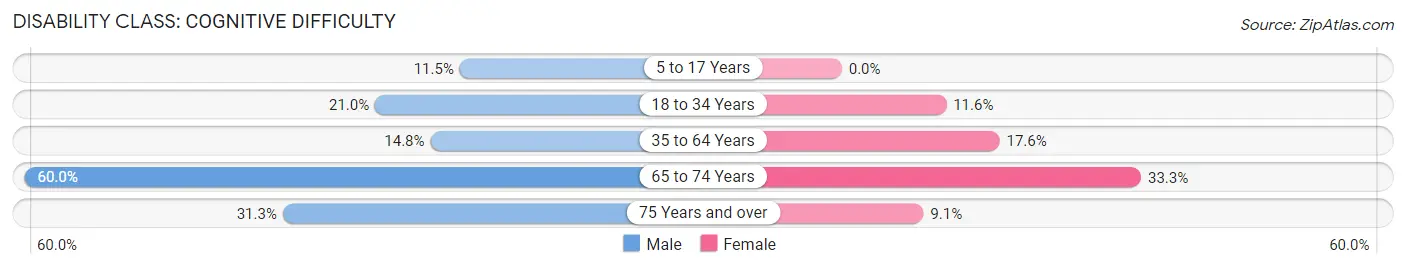
| Age Bracket | Male | Female |
| 5 to 17 Years | 3 (11.5%) | 0 (0.0%) |
| 18 to 34 Years | 13 (21.0%) | 5 (11.6%) |
| 35 to 64 Years | 12 (14.8%) | 13 (17.6%) |
| 65 to 74 Years | 9 (60.0%) | 2 (33.3%) |
| 75 Years and over | 5 (31.2%) | 2 (9.1%) |
Disability Class: Ambulatory Difficulty
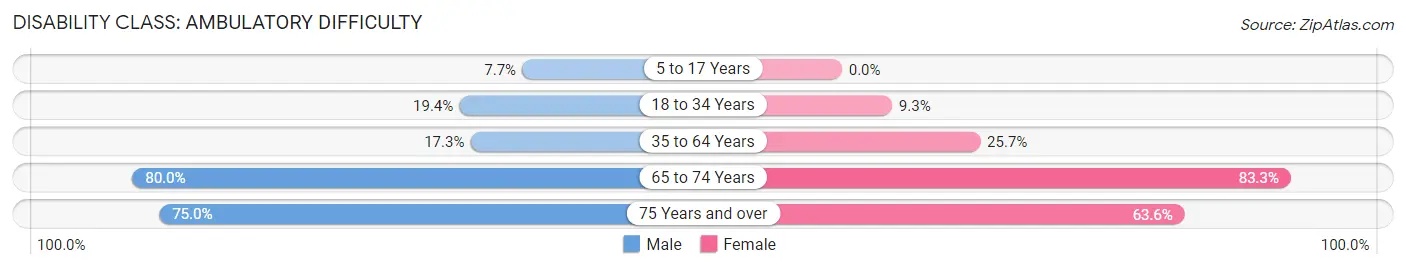
| Age Bracket | Male | Female |
| 5 to 17 Years | 2 (7.7%) | 0 (0.0%) |
| 18 to 34 Years | 12 (19.4%) | 4 (9.3%) |
| 35 to 64 Years | 14 (17.3%) | 19 (25.7%) |
| 65 to 74 Years | 12 (80.0%) | 5 (83.3%) |
| 75 Years and over | 12 (75.0%) | 14 (63.6%) |
Disability Class: Self-Care Difficulty
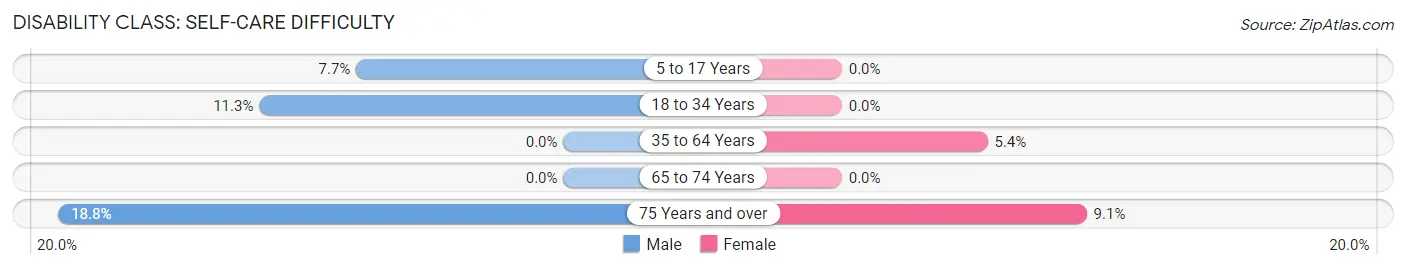
| Age Bracket | Male | Female |
| 5 to 17 Years | 2 (7.7%) | 0 (0.0%) |
| 18 to 34 Years | 7 (11.3%) | 0 (0.0%) |
| 35 to 64 Years | 0 (0.0%) | 4 (5.4%) |
| 65 to 74 Years | 0 (0.0%) | 0 (0.0%) |
| 75 Years and over | 3 (18.8%) | 2 (9.1%) |
Technology Access in Tupelo
Computing Device Access in Tupelo
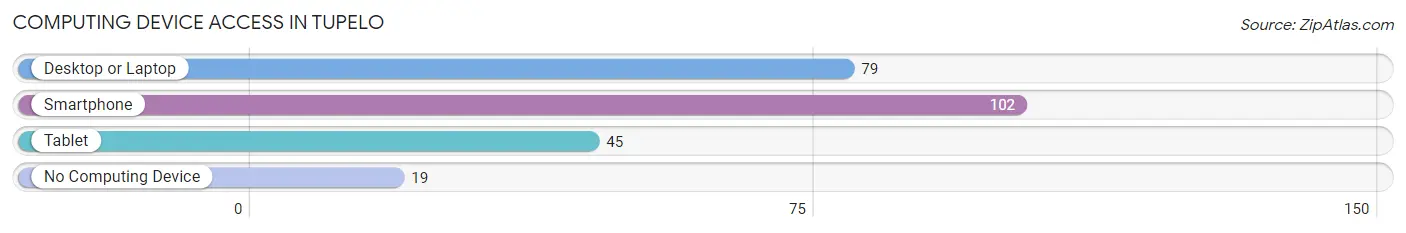
| Device Type | # Households | % Households |
| Desktop or Laptop | 79 | 59.4% |
| Smartphone | 102 | 76.7% |
| Tablet | 45 | 33.8% |
| No Computing Device | 19 | 14.3% |
| Total | 133 | 100.0% |
Internet Access in Tupelo
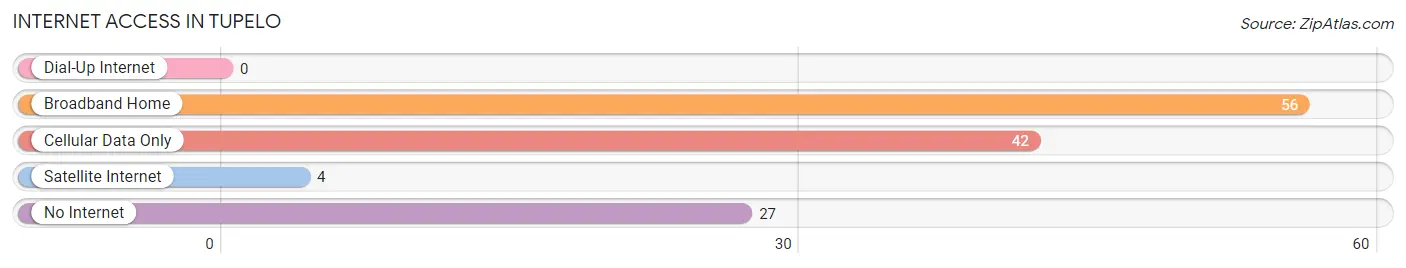
| Internet Type | # Households | % Households |
| Dial-Up Internet | 0 | 0.0% |
| Broadband Home | 56 | 42.1% |
| Cellular Data Only | 42 | 31.6% |
| Satellite Internet | 4 | 3.0% |
| No Internet | 27 | 20.3% |
| Total | 133 | 100.0% |
Tupelo Summary
Tupelo is a small town located in Pushmataha County, Oklahoma. It is situated in the southeastern part of the state, about 20 miles south of Antlers. The town was founded in 1891 and was named after the Tupelo tree, which is native to the area. The population of Tupelo was estimated to be around 500 people in 2020.
Geography
Tupelo is located in the foothills of the Ouachita Mountains, which are part of the larger Appalachian Mountains. The town is situated in a valley surrounded by hills and mountains. The town is located at an elevation of 890 feet above sea level. The climate in Tupelo is humid subtropical, with hot summers and mild winters. The average annual temperature is around 65 degrees Fahrenheit.
Economy
Tupelo’s economy is largely based on agriculture and forestry. The town is home to several farms and ranches, as well as a sawmill. The town also has a few small businesses, including a grocery store, a hardware store, and a few restaurants.
Demographics
Tupelo is a predominantly white town, with a population that is 97.3% white. The remaining 2.7% of the population is made up of African Americans, Native Americans, and other races. The median household income in Tupelo is $35,000, and the median home value is $90,000.
History
Tupelo was founded in 1891 by a group of settlers from Arkansas. The town was named after the Tupelo tree, which is native to the area. The town was originally a farming community, but it soon became a center for timber production. The town was incorporated in 1901, and the first mayor was elected in 1902.
In the early 20th century, Tupelo was a thriving community. The town had a bank, a hotel, a post office, and several stores. The town also had a school, which was built in 1910. The school was later expanded and is now known as the Tupelo Public School.
In the late 20th century, Tupelo began to decline. The timber industry declined, and the population began to decline as well. The town was hit hard by the Great Depression, and many of the businesses closed. The population of Tupelo has been steadily declining since the 1950s, and the town now has a population of around 500 people.
Despite its decline, Tupelo is still a vibrant community. The town has a few small businesses, and the school is still in operation. The town also has a few churches, and there are several parks and recreational areas in the area. Tupelo is a quiet, rural town, and it is a great place to live for those who enjoy a slower pace of life.
Common Questions
What is Per Capita Income in Tupelo?
Per Capita income in Tupelo is $18,308.
What is the Median Family Income in Tupelo?
Median Family Income in Tupelo is $35,750.
What is the Median Household income in Tupelo?
Median Household Income in Tupelo is $35,208.
What is Income or Wage Gap in Tupelo?
Income or Wage Gap in Tupelo is 32.8%.
Women in Tupelo earn 67.2 cents for every dollar earned by a man.
What is Inequality or Gini Index in Tupelo?
Inequality or Gini Index in Tupelo is 0.43.
What is the Total Population of Tupelo?
Total Population of Tupelo is 388.
What is the Total Male Population of Tupelo?
Total Male Population of Tupelo is 204.
What is the Total Female Population of Tupelo?
Total Female Population of Tupelo is 184.
What is the Ratio of Males per 100 Females in Tupelo?
There are 110.87 Males per 100 Females in Tupelo.
What is the Ratio of Females per 100 Males in Tupelo?
There are 90.20 Females per 100 Males in Tupelo.
What is the Median Population Age in Tupelo?
Median Population Age in Tupelo is 40.1 Years.
What is the Average Family Size in Tupelo
Average Family Size in Tupelo is 3.4 People.
What is the Average Household Size in Tupelo
Average Household Size in Tupelo is 2.9 People.
How Large is the Labor Force in Tupelo?
There are 133 People in the Labor Forcein in Tupelo.
What is the Percentage of People in the Labor Force in Tupelo?
40.2% of People are in the Labor Force in Tupelo.
What is the Unemployment Rate in Tupelo?
Unemployment Rate in Tupelo is 12.0%.