Tenkiller, OK Map & Demographics
Tenkiller Map
Tenkiller Overview
$21,659
PER CAPITA INCOME
$25,972
AVG FAMILY INCOME
$26,389
AVG HOUSEHOLD INCOME
51.0%
WAGE / INCOME GAP [ % ]
49.0¢/ $1
WAGE / INCOME GAP [ $ ]
0.48
INEQUALITY / GINI INDEX
313
TOTAL POPULATION
157
MALE POPULATION
156
FEMALE POPULATION
100.64
MALES / 100 FEMALES
99.36
FEMALES / 100 MALES
44.6
MEDIAN AGE
2.8
AVG FAMILY SIZE
2.0
AVG HOUSEHOLD SIZE
107
LABOR FORCE [ PEOPLE ]
43.5%
PERCENT IN LABOR FORCE
Income in Tenkiller
Income Overview in Tenkiller
Per Capita Income in Tenkiller is $21,659, while median incomes of families and households are $25,972 and $26,389 respectively.
| Characteristic | Number | Measure |
| Per Capita Income | 313 | $21,659 |
| Median Family Income | 72 | $25,972 |
| Mean Family Income | 72 | $47,872 |
| Median Household Income | 122 | $26,389 |
| Mean Household Income | 122 | $51,566 |
| Income Deficit | 72 | $0 |
| Wage / Income Gap (%) | 313 | 51.04% |
| Wage / Income Gap ($) | 313 | 48.96¢ per $1 |
| Gini / Inequality Index | 313 | 0.48 |
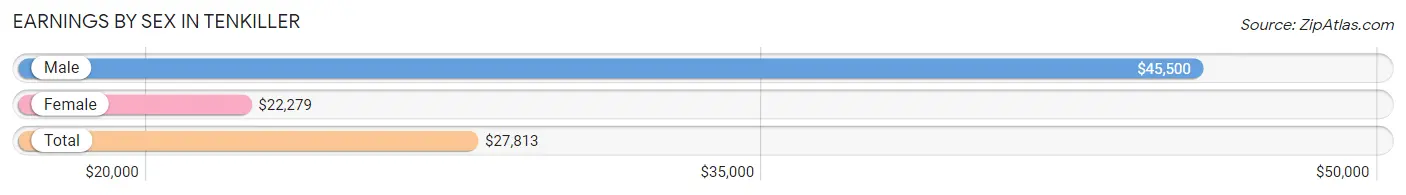
Earnings by Sex in Tenkiller
Average Earnings in Tenkiller are $27,813, $45,500 for men and $22,279 for women, a difference of 51.0%.
| Sex | Number | Average Earnings |
| Male | 62 (54.9%) | $45,500 |
| Female | 51 (45.1%) | $22,279 |
| Total | 113 (100.0%) | $27,813 |
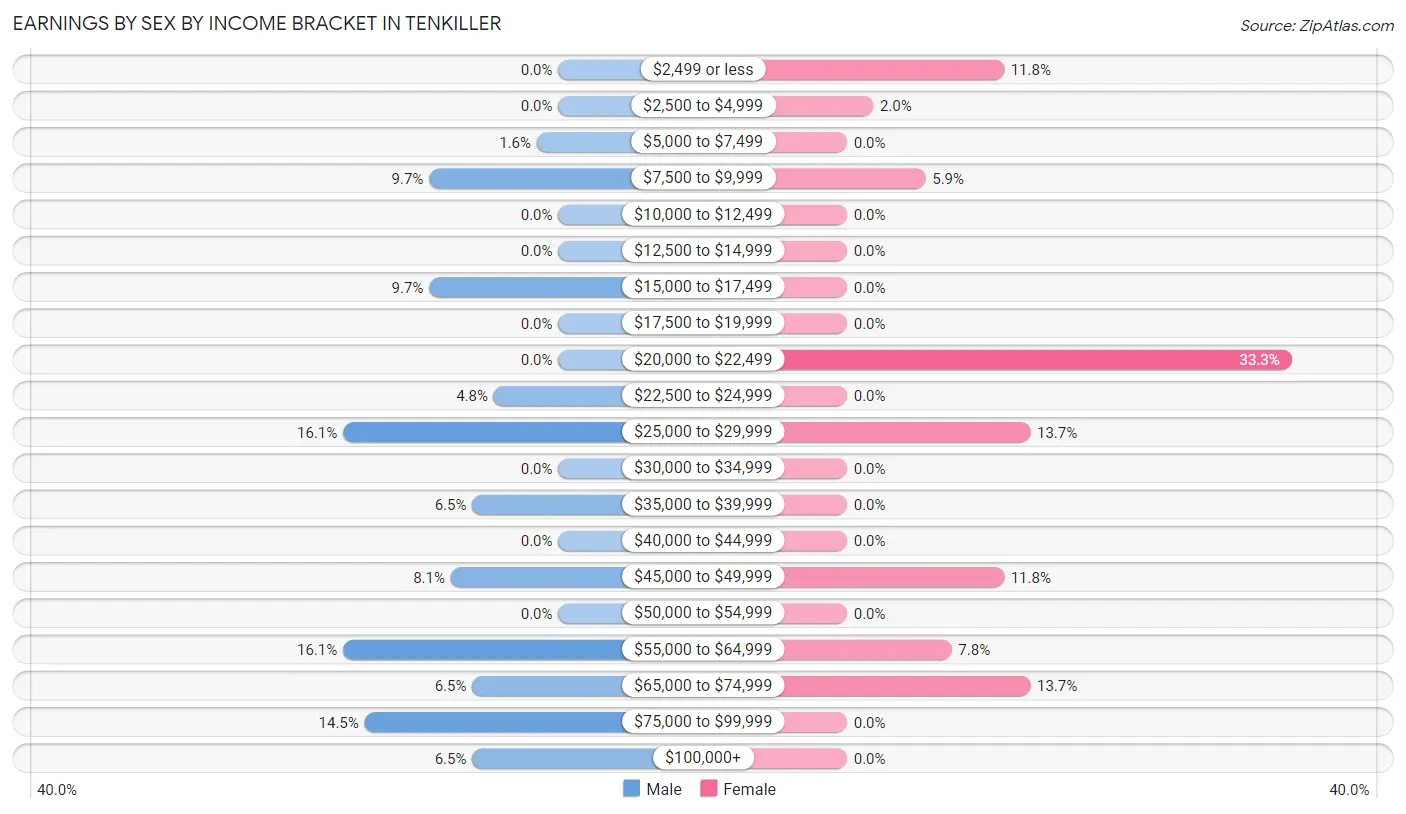
Earnings by Sex by Income Bracket in Tenkiller
The most common earnings brackets in Tenkiller are $25,000 to $29,999 for men (10 | 16.1%) and $20,000 to $22,499 for women (17 | 33.3%).
| Income | Male | Female |
| $2,499 or less | 0 (0.0%) | 6 (11.8%) |
| $2,500 to $4,999 | 0 (0.0%) | 1 (2.0%) |
| $5,000 to $7,499 | 1 (1.6%) | 0 (0.0%) |
| $7,500 to $9,999 | 6 (9.7%) | 3 (5.9%) |
| $10,000 to $12,499 | 0 (0.0%) | 0 (0.0%) |
| $12,500 to $14,999 | 0 (0.0%) | 0 (0.0%) |
| $15,000 to $17,499 | 6 (9.7%) | 0 (0.0%) |
| $17,500 to $19,999 | 0 (0.0%) | 0 (0.0%) |
| $20,000 to $22,499 | 0 (0.0%) | 17 (33.3%) |
| $22,500 to $24,999 | 3 (4.8%) | 0 (0.0%) |
| $25,000 to $29,999 | 10 (16.1%) | 7 (13.7%) |
| $30,000 to $34,999 | 0 (0.0%) | 0 (0.0%) |
| $35,000 to $39,999 | 4 (6.5%) | 0 (0.0%) |
| $40,000 to $44,999 | 0 (0.0%) | 0 (0.0%) |
| $45,000 to $49,999 | 5 (8.1%) | 6 (11.8%) |
| $50,000 to $54,999 | 0 (0.0%) | 0 (0.0%) |
| $55,000 to $64,999 | 10 (16.1%) | 4 (7.8%) |
| $65,000 to $74,999 | 4 (6.5%) | 7 (13.7%) |
| $75,000 to $99,999 | 9 (14.5%) | 0 (0.0%) |
| $100,000+ | 4 (6.5%) | 0 (0.0%) |
| Total | 62 (100.0%) | 51 (100.0%) |
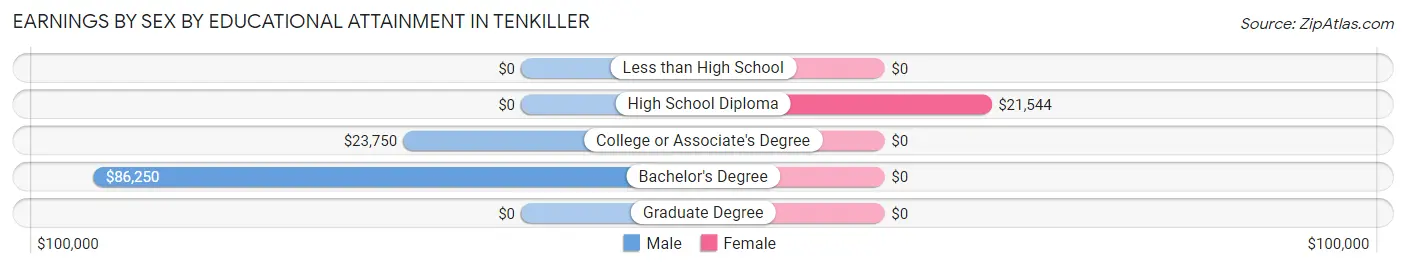
Earnings by Sex by Educational Attainment in Tenkiller
Average earnings in Tenkiller are $52,500 for men and $26,667 for women, a difference of 49.2%. Men with an educational attainment of bachelor's degree enjoy the highest average annual earnings of $86,250, while those with college or associate's degree education earn the least with $23,750. Women with an educational attainment of high school diploma earn the most with the average annual earnings of $21,544, while those with high school diploma education have the smallest earnings of $21,544.
| Educational Attainment | Male Income | Female Income |
| Less than High School | - | - |
| High School Diploma | - | - |
| College or Associate's Degree | $23,750 | $0 |
| Bachelor's Degree | $86,250 | $0 |
| Graduate Degree | - | - |
| Total | $52,500 | $26,667 |
Family Income in Tenkiller
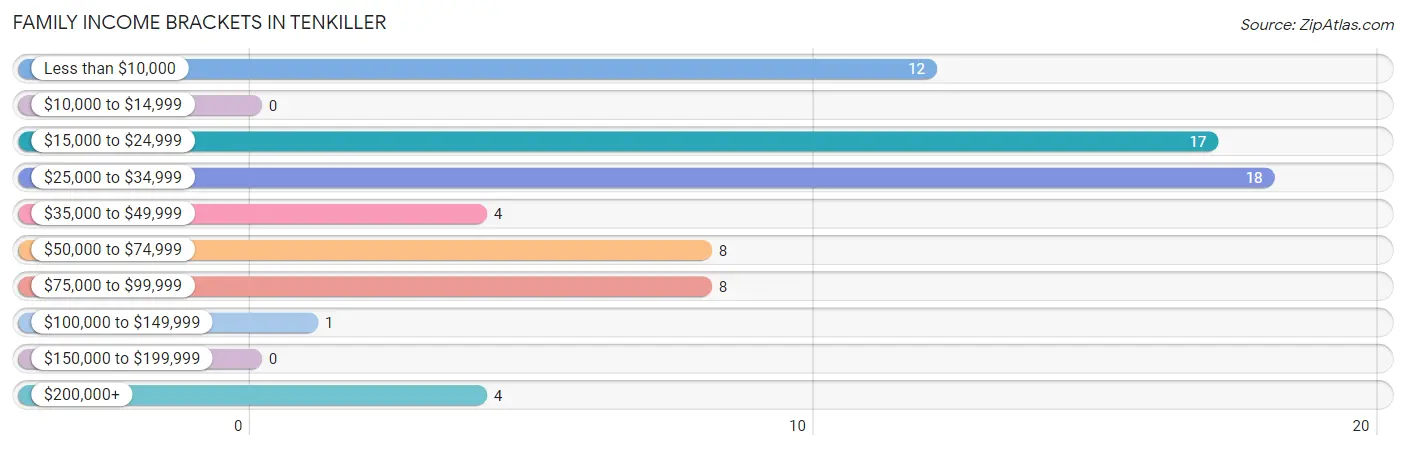
Family Income Brackets in Tenkiller
According to the Tenkiller family income data, there are 18 families falling into the $25,000 to $34,999 income range, which is the most common income bracket and makes up 25.0% of all families.
| Income Bracket | # Families | % Families |
| Less than $10,000 | 12 | 16.7% |
| $10,000 to $14,999 | 0 | 0.0% |
| $15,000 to $24,999 | 17 | 23.6% |
| $25,000 to $34,999 | 18 | 25.0% |
| $35,000 to $49,999 | 4 | 5.6% |
| $50,000 to $74,999 | 8 | 11.1% |
| $75,000 to $99,999 | 8 | 11.1% |
| $100,000 to $149,999 | 1 | 1.4% |
| $150,000 to $199,999 | 0 | 0.0% |
| $200,000+ | 4 | 5.6% |
Family Income by Famaliy Size in Tenkiller
| Income Bracket | # Families | Median Income |
| 2-Person Families | 26 (36.1%) | $0 |
| 3-Person Families | 14 (19.4%) | $0 |
| 4-Person Families | 31 (43.1%) | $0 |
| 5-Person Families | 0 (0.0%) | $0 |
| 6-Person Families | 0 (0.0%) | $0 |
| 7+ Person Families | 1 (1.4%) | $0 |
| Total | 72 (100.0%) | $25,972 |
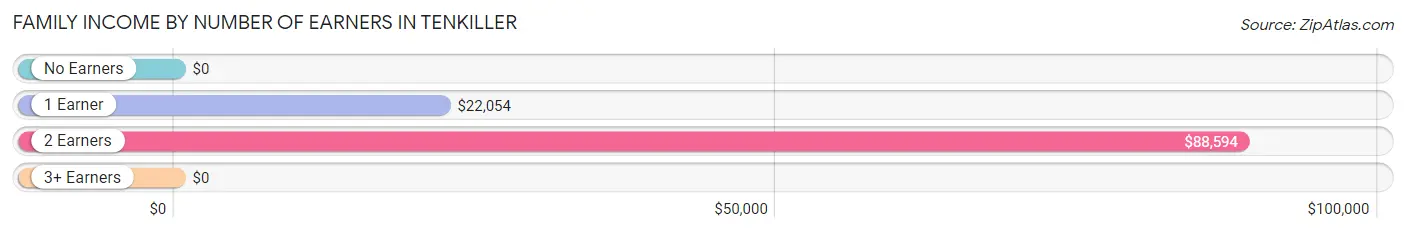
Family Income by Number of Earners in Tenkiller
| Number of Earners | # Families | Median Income |
| No Earners | 7 (9.7%) | $0 |
| 1 Earner | 47 (65.3%) | $22,054 |
| 2 Earners | 17 (23.6%) | $88,594 |
| 3+ Earners | 1 (1.4%) | $0 |
| Total | 72 (100.0%) | $25,972 |
Household Income in Tenkiller
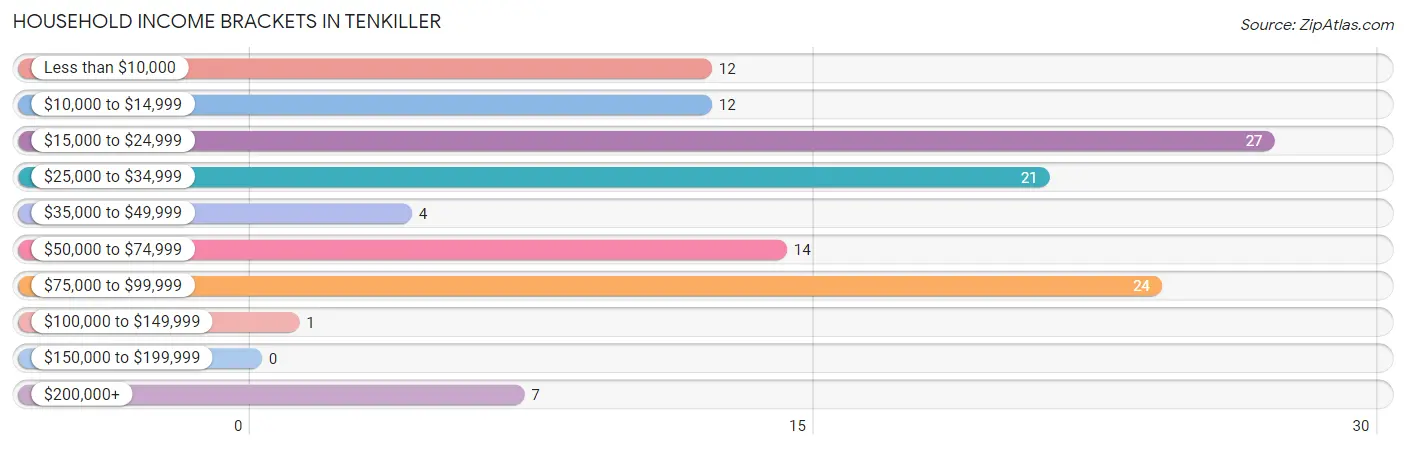
Household Income Brackets in Tenkiller
With 27 households falling in the category, the $15,000 to $24,999 income range is the most frequent in Tenkiller, accounting for 22.1% of all households.
| Income Bracket | # Households | % Households |
| Less than $10,000 | 12 | 9.8% |
| $10,000 to $14,999 | 12 | 9.8% |
| $15,000 to $24,999 | 27 | 22.1% |
| $25,000 to $34,999 | 21 | 17.2% |
| $35,000 to $49,999 | 4 | 3.3% |
| $50,000 to $74,999 | 14 | 11.5% |
| $75,000 to $99,999 | 24 | 19.7% |
| $100,000 to $149,999 | 1 | 0.8% |
| $150,000 to $199,999 | 0 | 0.0% |
| $200,000+ | 7 | 5.7% |
Household Income by Householder Age in Tenkiller
The median household income in Tenkiller is $26,389, with the highest median household income of $73,000 found in the 25 to 44 years age bracket for the primary householder. A total of 26 households (21.3%) fall into this category.
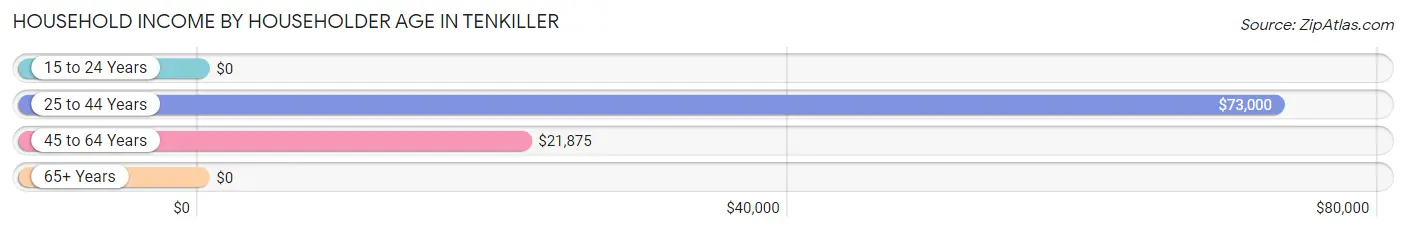
| Income Bracket | # Households | Median Income |
| 15 to 24 Years | 0 (0.0%) | $0 |
| 25 to 44 Years | 26 (21.3%) | $73,000 |
| 45 to 64 Years | 61 (50.0%) | $21,875 |
| 65+ Years | 35 (28.7%) | $0 |
| Total | 122 (100.0%) | $26,389 |
Poverty in Tenkiller
Income Below Poverty by Sex and Age in Tenkiller
With 42.0% poverty level for males and 61.5% for females among the residents of Tenkiller, 15 year old males and 45 to 54 year old females are the most vulnerable to poverty, with 2 males (100.0%) and 46 females (100.0%) in their respective age groups living below the poverty level.
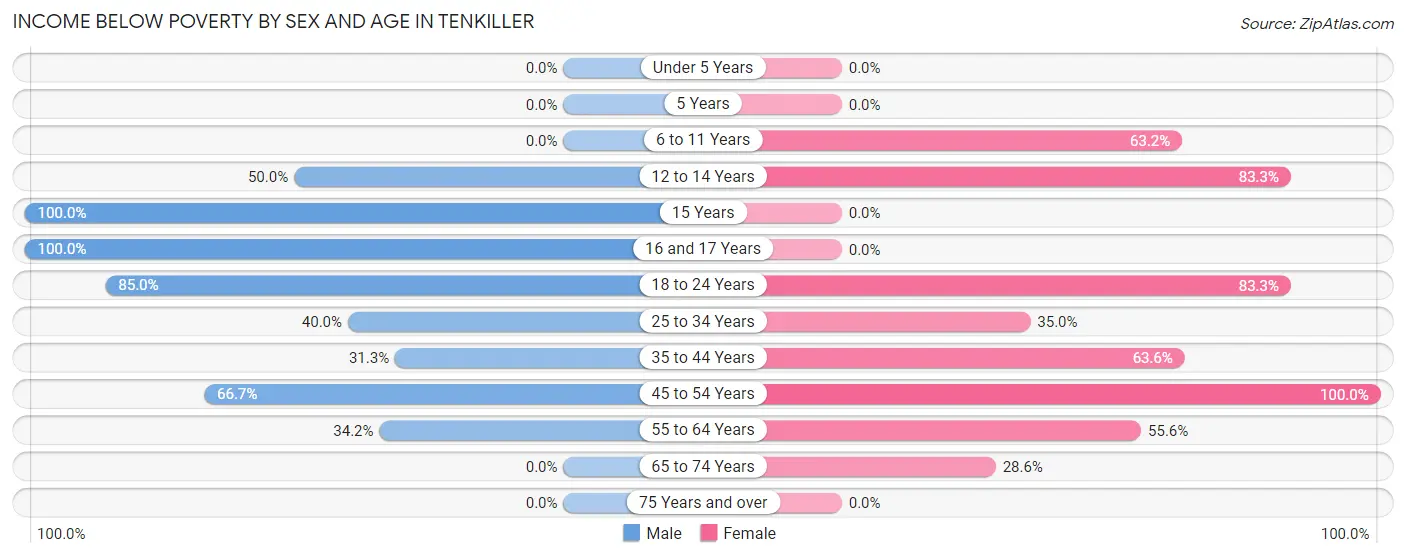
| Age Bracket | Male | Female |
| Under 5 Years | 0 (0.0%) | 0 (0.0%) |
| 5 Years | 0 (0.0%) | 0 (0.0%) |
| 6 to 11 Years | 0 (0.0%) | 12 (63.2%) |
| 12 to 14 Years | 9 (50.0%) | 10 (83.3%) |
| 15 Years | 2 (100.0%) | 0 (0.0%) |
| 16 and 17 Years | 3 (100.0%) | 0 (0.0%) |
| 18 to 24 Years | 17 (85.0%) | 5 (83.3%) |
| 25 to 34 Years | 6 (40.0%) | 7 (35.0%) |
| 35 to 44 Years | 5 (31.2%) | 7 (63.6%) |
| 45 to 54 Years | 10 (66.7%) | 46 (100.0%) |
| 55 to 64 Years | 14 (34.2%) | 5 (55.6%) |
| 65 to 74 Years | 0 (0.0%) | 4 (28.6%) |
| 75 Years and over | 0 (0.0%) | 0 (0.0%) |
| Total | 66 (42.0%) | 96 (61.5%) |
Income Above Poverty by Sex and Age in Tenkiller
According to the poverty statistics in Tenkiller, males aged under 5 years and females aged 16 and 17 years are the age groups that are most secure financially, with 100.0% of males and 100.0% of females in these age groups living above the poverty line.
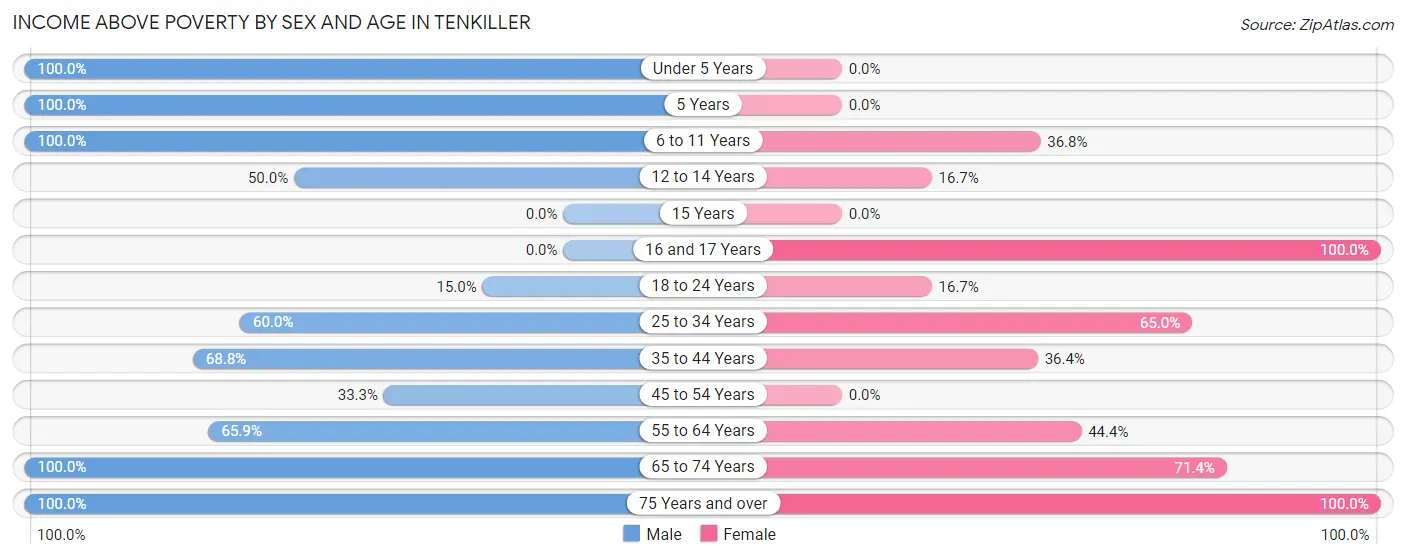
| Age Bracket | Male | Female |
| Under 5 Years | 4 (100.0%) | 0 (0.0%) |
| 5 Years | 4 (100.0%) | 0 (0.0%) |
| 6 to 11 Years | 8 (100.0%) | 7 (36.8%) |
| 12 to 14 Years | 9 (50.0%) | 2 (16.7%) |
| 15 Years | 0 (0.0%) | 0 (0.0%) |
| 16 and 17 Years | 0 (0.0%) | 1 (100.0%) |
| 18 to 24 Years | 3 (15.0%) | 1 (16.7%) |
| 25 to 34 Years | 9 (60.0%) | 13 (65.0%) |
| 35 to 44 Years | 11 (68.8%) | 4 (36.4%) |
| 45 to 54 Years | 5 (33.3%) | 0 (0.0%) |
| 55 to 64 Years | 27 (65.8%) | 4 (44.4%) |
| 65 to 74 Years | 4 (100.0%) | 10 (71.4%) |
| 75 Years and over | 7 (100.0%) | 18 (100.0%) |
| Total | 91 (58.0%) | 60 (38.5%) |
Income Below Poverty Among Married-Couple Families in Tenkiller
The poverty statistics for married-couple families in Tenkiller show that 54.5% or 30 of the total 55 families live below the poverty line. Families with 1 or 2 children have the highest poverty rate of 58.1%, comprising of 18 families. On the other hand, families with 3 or 4 children have the lowest poverty rate of 0.0%, which includes 0 families.
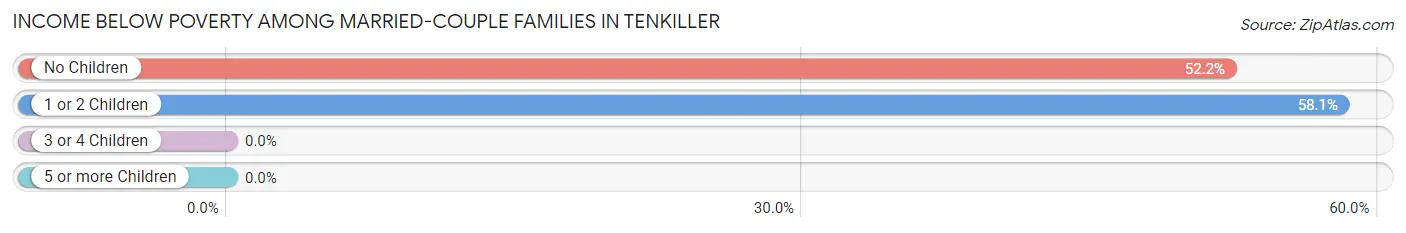
| Children | Above Poverty | Below Poverty |
| No Children | 11 (47.8%) | 12 (52.2%) |
| 1 or 2 Children | 13 (41.9%) | 18 (58.1%) |
| 3 or 4 Children | 1 (100.0%) | 0 (0.0%) |
| 5 or more Children | 0 (0.0%) | 0 (0.0%) |
| Total | 25 (45.5%) | 30 (54.5%) |
Income Below Poverty Among Single-Parent Households in Tenkiller
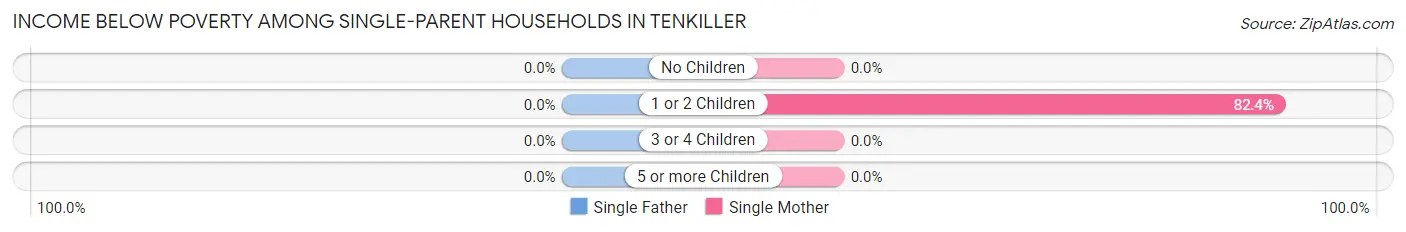
| Children | Single Father | Single Mother |
| No Children | 0 (0.0%) | 0 (0.0%) |
| 1 or 2 Children | 0 (0.0%) | 14 (82.4%) |
| 3 or 4 Children | 0 (0.0%) | 0 (0.0%) |
| 5 or more Children | 0 (0.0%) | 0 (0.0%) |
| Total | 0 (0.0%) | 14 (82.4%) |
Income Below Poverty Among Married-Couple vs Single-Parent Households in Tenkiller
The poverty data for Tenkiller shows that 30 of the married-couple family households (54.5%) and 14 of the single-parent households (82.4%) are living below the poverty level. Within the married-couple family households, those with 1 or 2 children have the highest poverty rate, with 18 households (58.1%) falling below the poverty line. Among the single-parent households, those with 1 or 2 children have the highest poverty rate, with 14 household (82.4%) living below poverty.
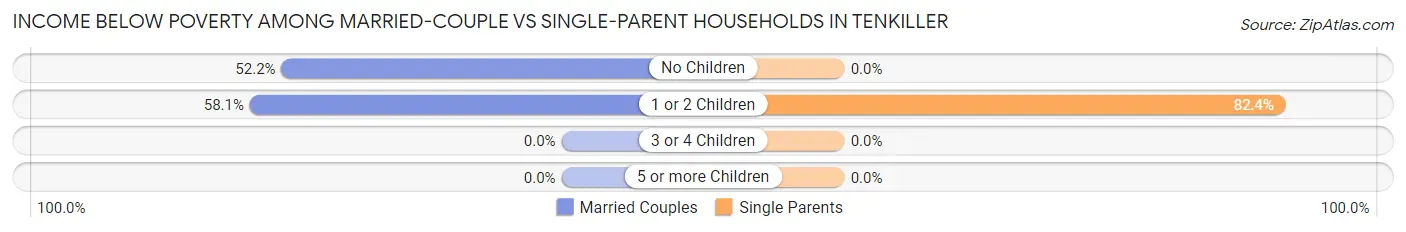
| Children | Married-Couple Families | Single-Parent Households |
| No Children | 12 (52.2%) | 0 (0.0%) |
| 1 or 2 Children | 18 (58.1%) | 14 (82.4%) |
| 3 or 4 Children | 0 (0.0%) | 0 (0.0%) |
| 5 or more Children | 0 (0.0%) | 0 (0.0%) |
| Total | 30 (54.5%) | 14 (82.4%) |
Race in Tenkiller
The most populous races in Tenkiller are White / Caucasian (148 | 47.3%), Native / Alaskan (147 | 47.0%), and Hispanic or Latino (13 | 4.2%).
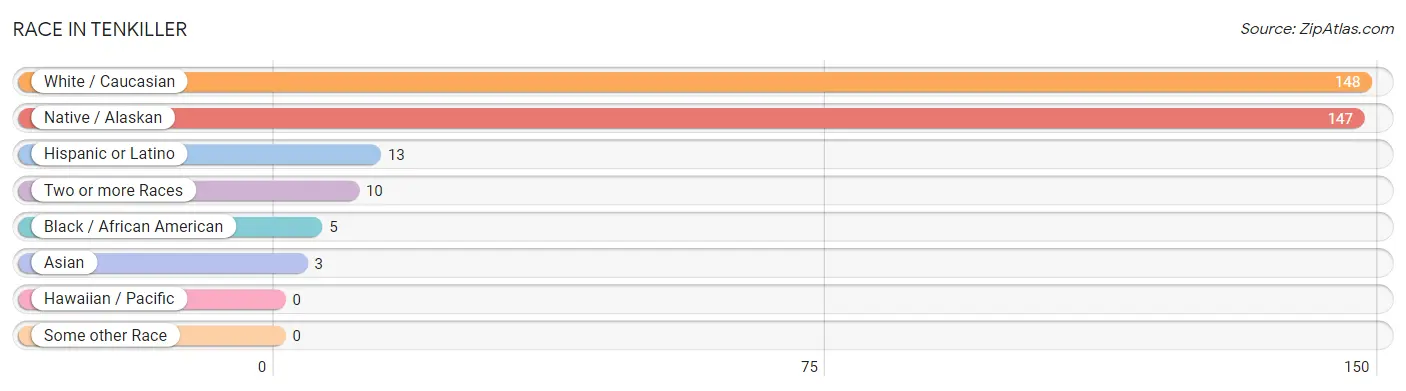
| Race | # Population | % Population |
| Asian | 3 | 1.0% |
| Black / African American | 5 | 1.6% |
| Hawaiian / Pacific | 0 | 0.0% |
| Hispanic or Latino | 13 | 4.2% |
| Native / Alaskan | 147 | 47.0% |
| White / Caucasian | 148 | 47.3% |
| Two or more Races | 10 | 3.2% |
| Some other Race | 0 | 0.0% |
| Total | 313 | 100.0% |
Ancestry in Tenkiller
The most populous ancestries reported in Tenkiller are Cherokee (101 | 32.3%), German (27 | 8.6%), Seminole (22 | 7.0%), Dutch (14 | 4.5%), and Scottish (12 | 3.8%), together accounting for 56.2% of all Tenkiller residents.
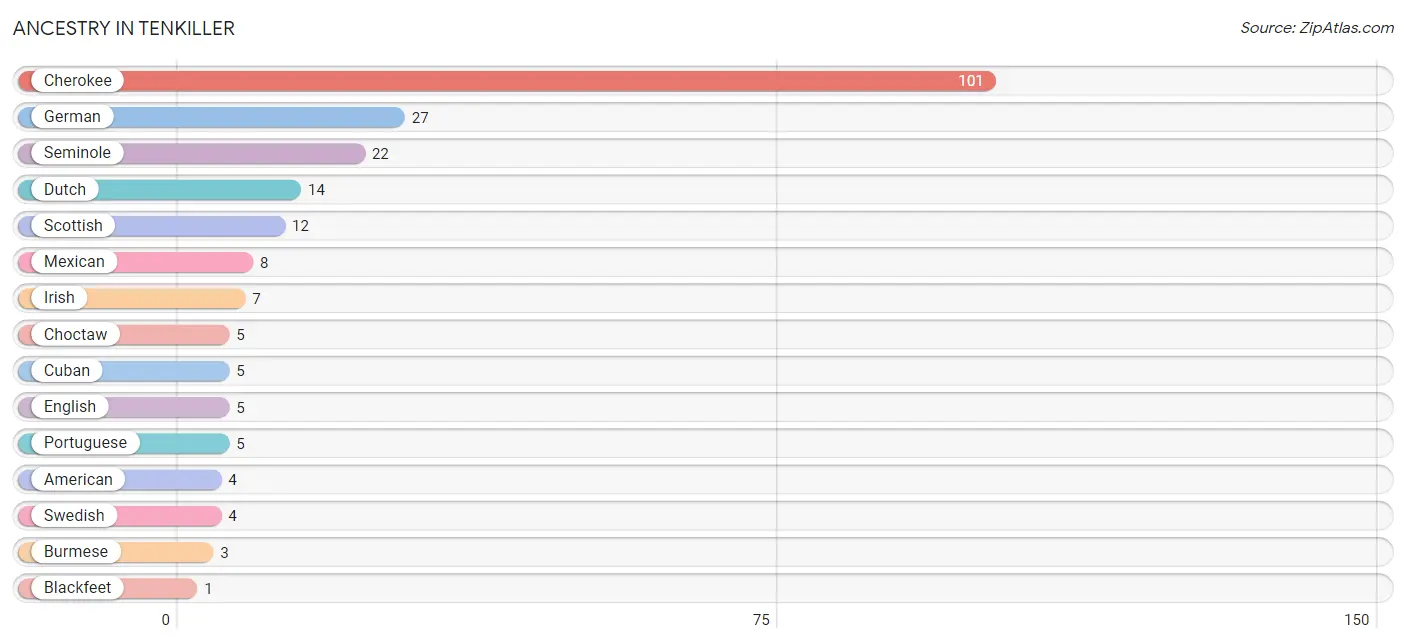
| Ancestry | # Population | % Population |
| American | 4 | 1.3% |
| Blackfeet | 1 | 0.3% |
| Burmese | 3 | 1.0% |
| Cherokee | 101 | 32.3% |
| Chickasaw | 1 | 0.3% |
| Choctaw | 5 | 1.6% |
| Cuban | 5 | 1.6% |
| Dutch | 14 | 4.5% |
| English | 5 | 1.6% |
| German | 27 | 8.6% |
| Irish | 7 | 2.2% |
| Mexican | 8 | 2.6% |
| Portuguese | 5 | 1.6% |
| Scottish | 12 | 3.8% |
| Seminole | 22 | 7.0% |
| Swedish | 4 | 1.3% | View All 16 Rows |
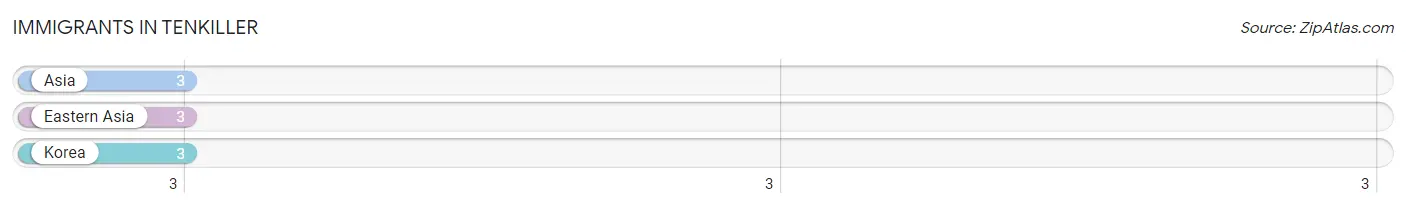
Immigrants in Tenkiller
The most numerous immigrant groups reported in Tenkiller came from Asia (3 | 1.0%), Eastern Asia (3 | 1.0%), and Korea (3 | 1.0%), together accounting for 2.9% of all Tenkiller residents.
| Immigration Origin | # Population | % Population |
| Asia | 3 | 1.0% |
| Eastern Asia | 3 | 1.0% |
| Korea | 3 | 1.0% | View All 3 Rows |
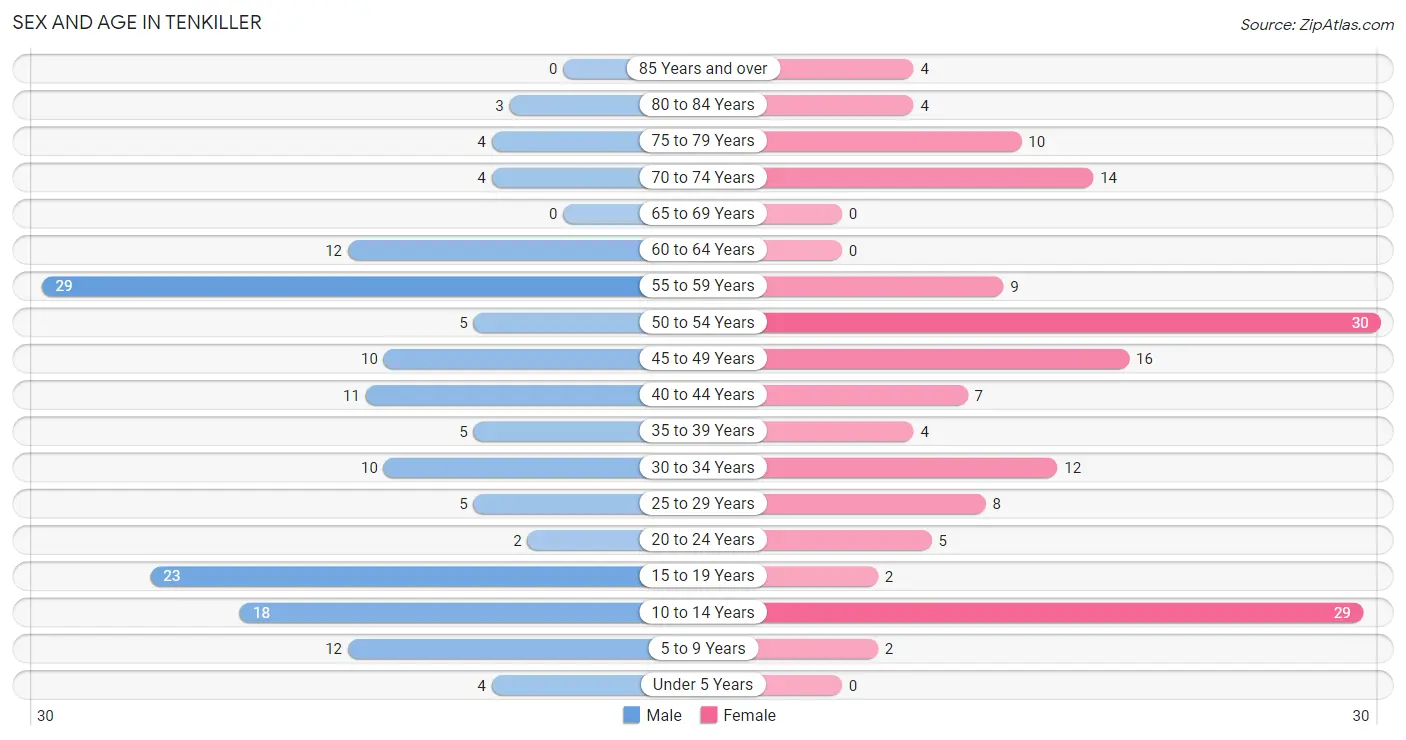
Sex and Age in Tenkiller
Sex and Age in Tenkiller
The most populous age groups in Tenkiller are 55 to 59 Years (29 | 18.5%) for men and 50 to 54 Years (30 | 19.2%) for women.
| Age Bracket | Male | Female |
| Under 5 Years | 4 (2.5%) | 0 (0.0%) |
| 5 to 9 Years | 12 (7.6%) | 2 (1.3%) |
| 10 to 14 Years | 18 (11.5%) | 29 (18.6%) |
| 15 to 19 Years | 23 (14.6%) | 2 (1.3%) |
| 20 to 24 Years | 2 (1.3%) | 5 (3.2%) |
| 25 to 29 Years | 5 (3.2%) | 8 (5.1%) |
| 30 to 34 Years | 10 (6.4%) | 12 (7.7%) |
| 35 to 39 Years | 5 (3.2%) | 4 (2.6%) |
| 40 to 44 Years | 11 (7.0%) | 7 (4.5%) |
| 45 to 49 Years | 10 (6.4%) | 16 (10.3%) |
| 50 to 54 Years | 5 (3.2%) | 30 (19.2%) |
| 55 to 59 Years | 29 (18.5%) | 9 (5.8%) |
| 60 to 64 Years | 12 (7.6%) | 0 (0.0%) |
| 65 to 69 Years | 0 (0.0%) | 0 (0.0%) |
| 70 to 74 Years | 4 (2.5%) | 14 (9.0%) |
| 75 to 79 Years | 4 (2.5%) | 10 (6.4%) |
| 80 to 84 Years | 3 (1.9%) | 4 (2.6%) |
| 85 Years and over | 0 (0.0%) | 4 (2.6%) |
| Total | 157 (100.0%) | 156 (100.0%) |
Families and Households in Tenkiller
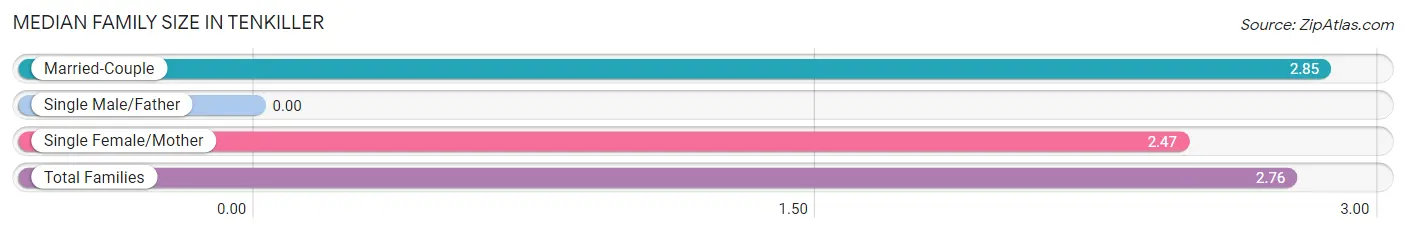
Median Family Size in Tenkiller
| Family Type | # Families | Family Size |
| Married-Couple | 55 (76.4%) | 2.85 |
| Single Male/Father | 0 (0.0%) | - |
| Single Female/Mother | 17 (23.6%) | 2.47 |
| Total Families | 72 (100.0%) | 2.76 |
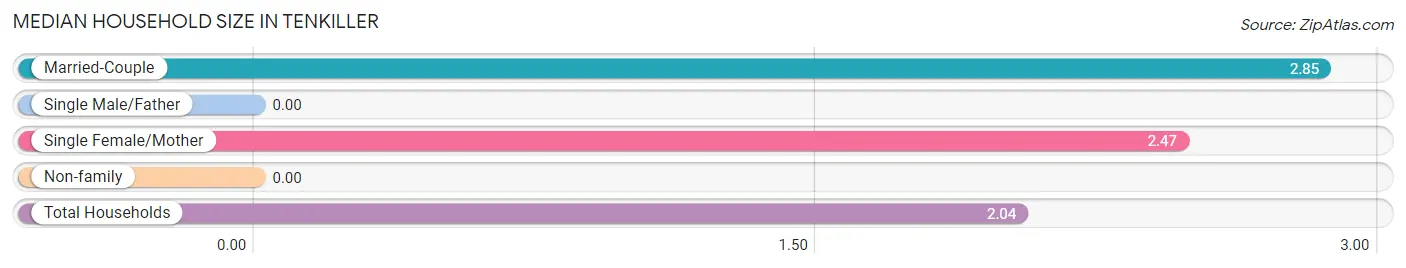
Median Household Size in Tenkiller
| Household Type | # Households | Household Size |
| Married-Couple | 55 (45.1%) | 2.85 |
| Single Male/Father | 0 (0.0%) | - |
| Single Female/Mother | 17 (13.9%) | 2.47 |
| Non-family | 50 (41.0%) | - |
| Total Households | 122 (100.0%) | 2.04 |
Household Size by Marriage Status in Tenkiller
Out of a total of 122 households in Tenkiller, 72 (59.0%) are family households, while 50 (41.0%) are nonfamily households. The most numerous type of family households are 4-person households, comprising 31, and the most common type of nonfamily households are 1-person households, comprising 50.
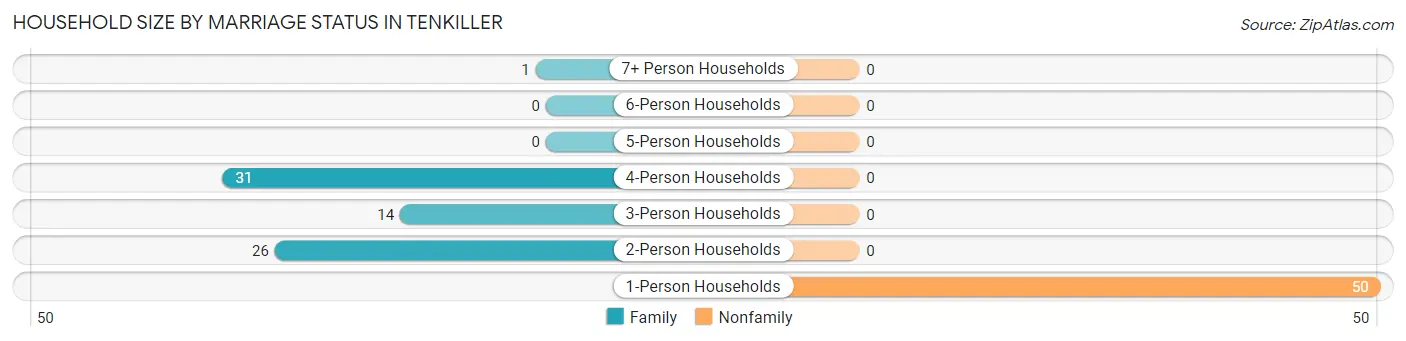
| Household Size | Family Households | Nonfamily Households |
| 1-Person Households | - | 50 (41.0%) |
| 2-Person Households | 26 (21.3%) | 0 (0.0%) |
| 3-Person Households | 14 (11.5%) | 0 (0.0%) |
| 4-Person Households | 31 (25.4%) | 0 (0.0%) |
| 5-Person Households | 0 (0.0%) | 0 (0.0%) |
| 6-Person Households | 0 (0.0%) | 0 (0.0%) |
| 7+ Person Households | 1 (0.8%) | 0 (0.0%) |
| Total | 72 (59.0%) | 50 (41.0%) |
Female Fertility in Tenkiller
Fertility by Age in Tenkiller
| Age Bracket | Women with Births | Births / 1,000 Women |
| 15 to 19 years | 0 (0.0%) | 0.0 |
| 20 to 34 years | 0 (0.0%) | 0.0 |
| 35 to 50 years | 0 (0.0%) | 0.0 |
| Total | 0 (0.0%) | 0.0 |
Fertility by Age by Marriage Status in Tenkiller
| Age Bracket | Married | Unmarried |
| 15 to 19 years | 0 (0.0%) | 0 (0.0%) |
| 20 to 34 years | 0 (0.0%) | 0 (0.0%) |
| 35 to 50 years | 0 (0.0%) | 0 (0.0%) |
| Total | 0 (0.0%) | 0 (0.0%) |
Fertility by Education in Tenkiller
| Educational Attainment | Women with Births | Births / 1,000 Women |
| Less than High School | 0 (0.0%) | 0.0 |
| High School Diploma | 0 (0.0%) | 0.0 |
| College or Associate's Degree | 0 (0.0%) | 0.0 |
| Bachelor's Degree | 0 (0.0%) | 0.0 |
| Graduate Degree | 0 (0.0%) | 0.0 |
| Total | 0 (0.0%) | 0.0 |
Fertility by Education by Marriage Status in Tenkiller
| Educational Attainment | Married | Unmarried |
| Less than High School | 0 (0.0%) | 0 (0.0%) |
| High School Diploma | 0 (0.0%) | 0 (0.0%) |
| College or Associate's Degree | 0 (0.0%) | 0 (0.0%) |
| Bachelor's Degree | 0 (0.0%) | 0 (0.0%) |
| Graduate Degree | 0 (0.0%) | 0 (0.0%) |
| Total | 0 (0.0%) | 0 (0.0%) |
Employment Characteristics in Tenkiller
Employment by Class of Employer in Tenkiller
Among the 107 employed individuals in Tenkiller, private company employees (55 | 51.4%), local government employees (20 | 18.7%), and not-for-profit organizations (19 | 17.8%) make up the most common classes of employment.
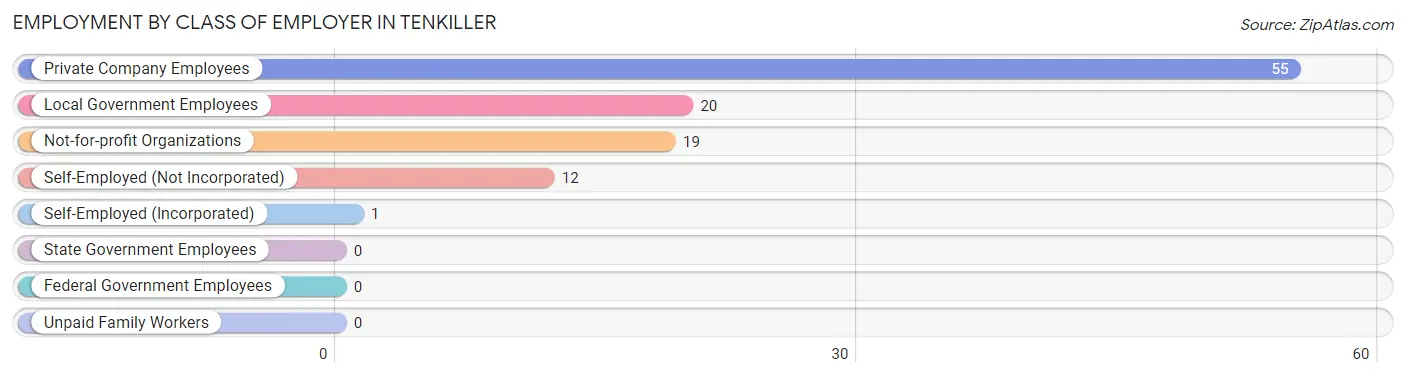
| Employer Class | # Employees | % Employees |
| Private Company Employees | 55 | 51.4% |
| Self-Employed (Incorporated) | 1 | 0.9% |
| Self-Employed (Not Incorporated) | 12 | 11.2% |
| Not-for-profit Organizations | 19 | 17.8% |
| Local Government Employees | 20 | 18.7% |
| State Government Employees | 0 | 0.0% |
| Federal Government Employees | 0 | 0.0% |
| Unpaid Family Workers | 0 | 0.0% |
| Total | 107 | 100.0% |
Employment Status by Age in Tenkiller
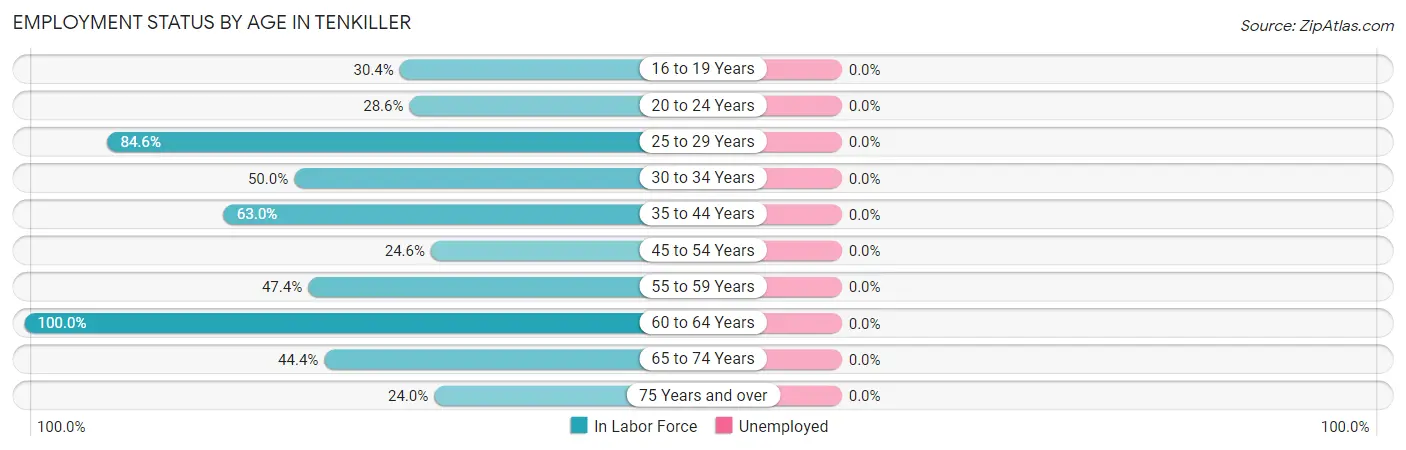
| Age Bracket | In Labor Force | Unemployed |
| 16 to 19 Years | 7 (30.4%) | 0 (0.0%) |
| 20 to 24 Years | 2 (28.6%) | 0 (0.0%) |
| 25 to 29 Years | 11 (84.6%) | 0 (0.0%) |
| 30 to 34 Years | 11 (50.0%) | 0 (0.0%) |
| 35 to 44 Years | 17 (63.0%) | 0 (0.0%) |
| 45 to 54 Years | 15 (24.6%) | 0 (0.0%) |
| 55 to 59 Years | 18 (47.4%) | 0 (0.0%) |
| 60 to 64 Years | 12 (100.0%) | 0 (0.0%) |
| 65 to 74 Years | 8 (44.4%) | 0 (0.0%) |
| 75 Years and over | 6 (24.0%) | 0 (0.0%) |
| Total | 107 (43.5%) | 0 (0.0%) |
Employment Status by Educational Attainment in Tenkiller
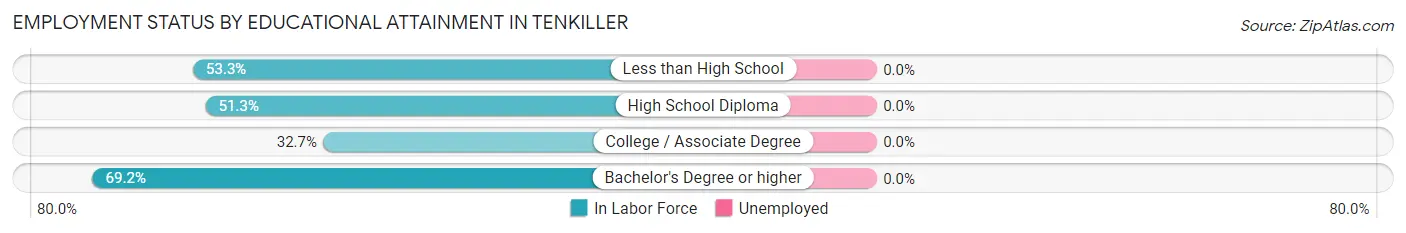
| Educational Attainment | In Labor Force | Unemployed |
| Less than High School | 8 (53.3%) | 0 (0.0%) |
| High School Diploma | 41 (51.3%) | 0 (0.0%) |
| College / Associate Degree | 17 (32.7%) | 0 (0.0%) |
| Bachelor's Degree or higher | 18 (69.2%) | 0 (0.0%) |
| Total | 84 (48.6%) | 0 (0.0%) |
Employment Occupations by Sex in Tenkiller
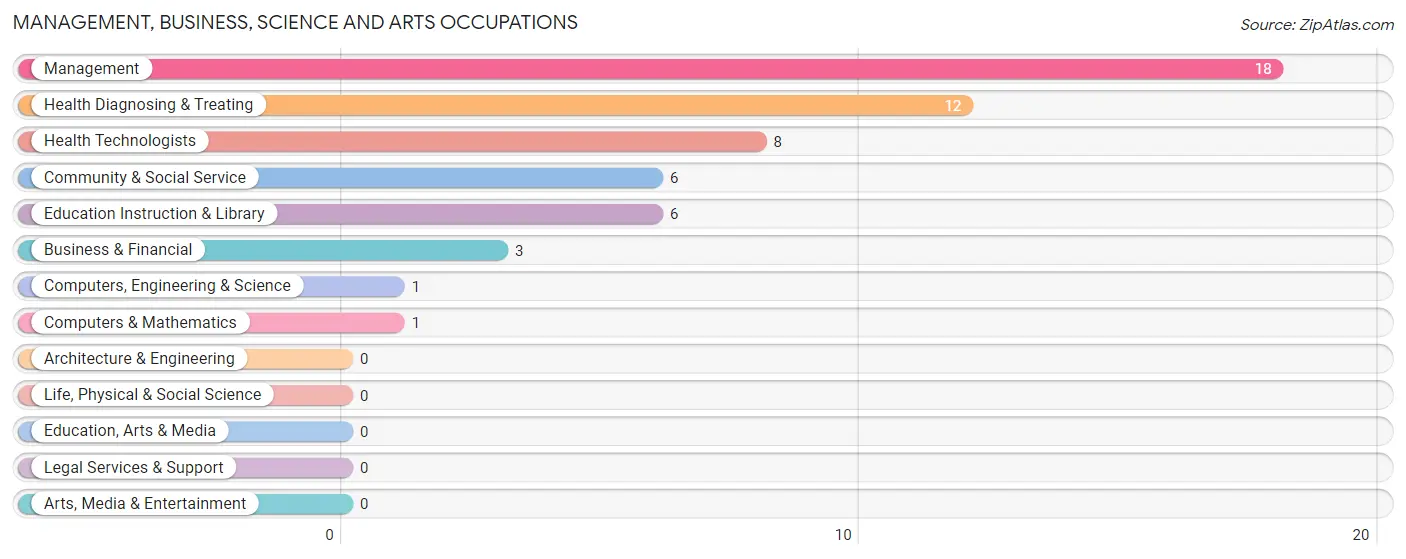
Management, Business, Science and Arts Occupations
The most common Management, Business, Science and Arts occupations in Tenkiller are Management (18 | 16.8%), Health Diagnosing & Treating (12 | 11.2%), Health Technologists (8 | 7.5%), Community & Social Service (6 | 5.6%), and Education Instruction & Library (6 | 5.6%).
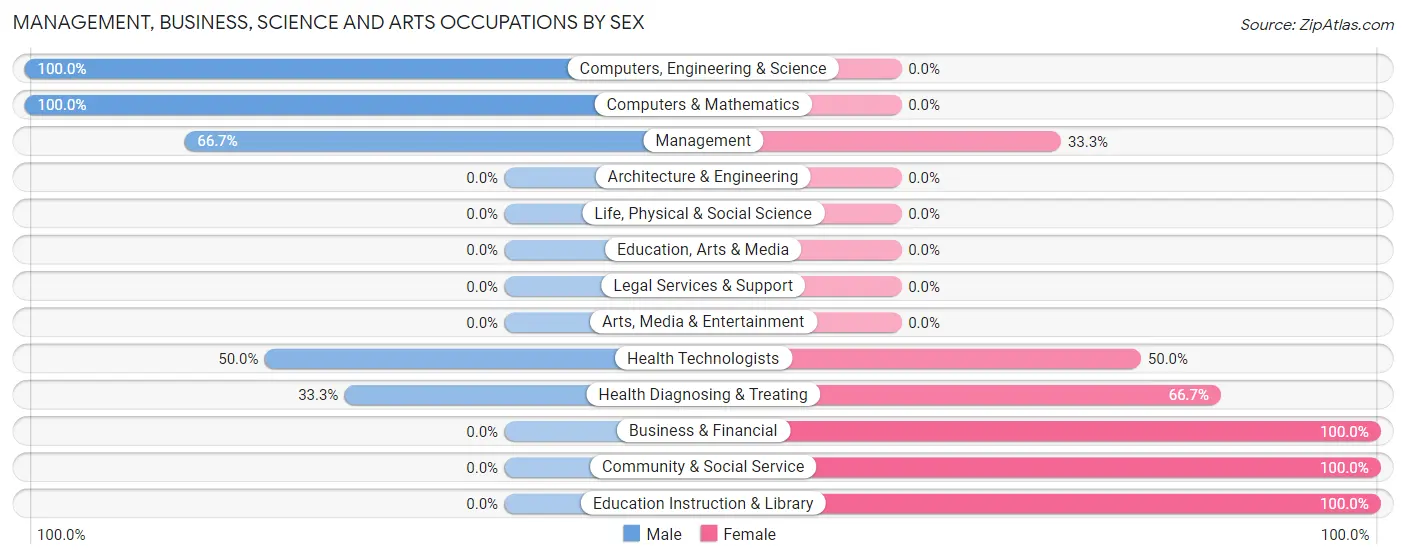
Management, Business, Science and Arts Occupations by Sex
Within the Management, Business, Science and Arts occupations in Tenkiller, the most male-oriented occupations are Computers, Engineering & Science (100.0%), Computers & Mathematics (100.0%), and Management (66.7%), while the most female-oriented occupations are Business & Financial (100.0%), Community & Social Service (100.0%), and Education Instruction & Library (100.0%).
| Occupation | Male | Female |
| Management | 12 (66.7%) | 6 (33.3%) |
| Business & Financial | 0 (0.0%) | 3 (100.0%) |
| Computers, Engineering & Science | 1 (100.0%) | 0 (0.0%) |
| Computers & Mathematics | 1 (100.0%) | 0 (0.0%) |
| Architecture & Engineering | 0 (0.0%) | 0 (0.0%) |
| Life, Physical & Social Science | 0 (0.0%) | 0 (0.0%) |
| Community & Social Service | 0 (0.0%) | 6 (100.0%) |
| Education, Arts & Media | 0 (0.0%) | 0 (0.0%) |
| Legal Services & Support | 0 (0.0%) | 0 (0.0%) |
| Education Instruction & Library | 0 (0.0%) | 6 (100.0%) |
| Arts, Media & Entertainment | 0 (0.0%) | 0 (0.0%) |
| Health Diagnosing & Treating | 4 (33.3%) | 8 (66.7%) |
| Health Technologists | 4 (50.0%) | 4 (50.0%) |
| Total (Category) | 17 (42.5%) | 23 (57.5%) |
| Total (Overall) | 62 (57.9%) | 45 (42.1%) |
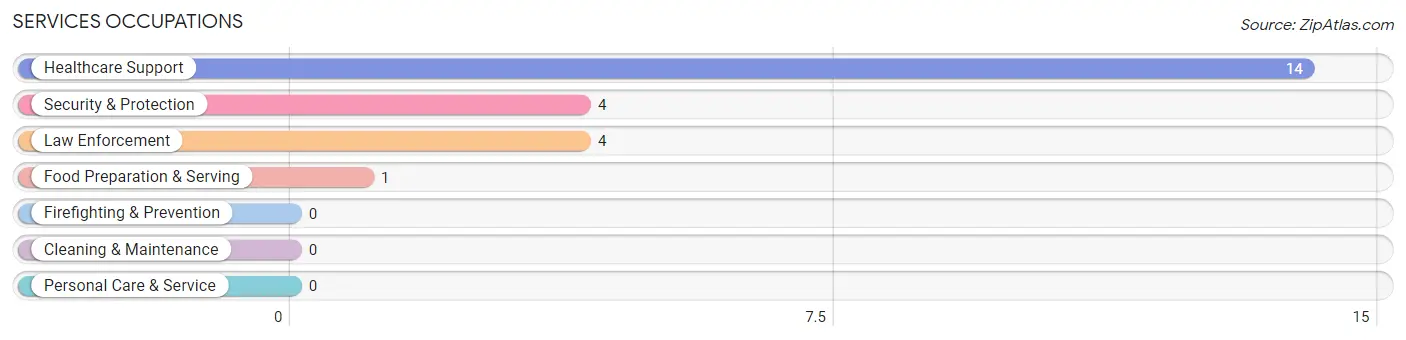
Services Occupations
The most common Services occupations in Tenkiller are Healthcare Support (14 | 13.1%), Security & Protection (4 | 3.7%), Law Enforcement (4 | 3.7%), and Food Preparation & Serving (1 | 0.9%).
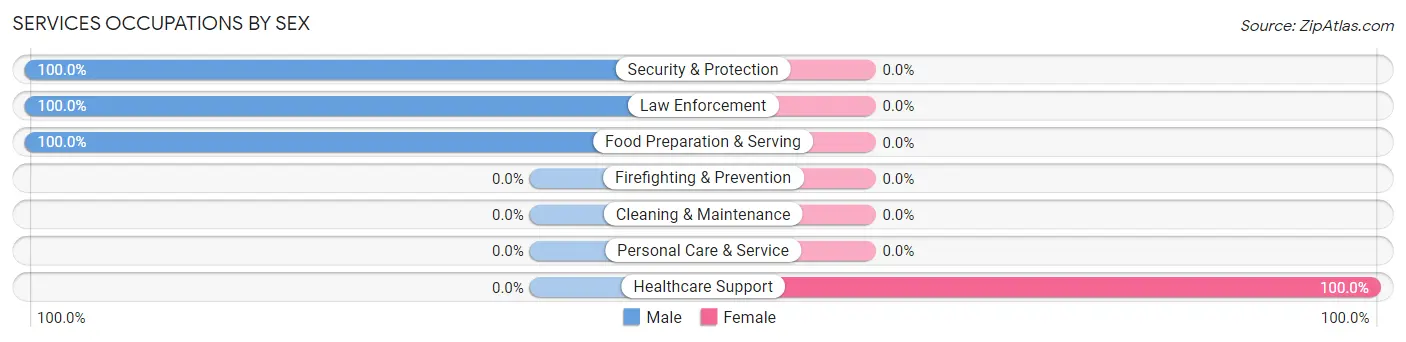
Services Occupations by Sex
| Occupation | Male | Female |
| Healthcare Support | 0 (0.0%) | 14 (100.0%) |
| Security & Protection | 4 (100.0%) | 0 (0.0%) |
| Firefighting & Prevention | 0 (0.0%) | 0 (0.0%) |
| Law Enforcement | 4 (100.0%) | 0 (0.0%) |
| Food Preparation & Serving | 1 (100.0%) | 0 (0.0%) |
| Cleaning & Maintenance | 0 (0.0%) | 0 (0.0%) |
| Personal Care & Service | 0 (0.0%) | 0 (0.0%) |
| Total (Category) | 5 (26.3%) | 14 (73.7%) |
| Total (Overall) | 62 (57.9%) | 45 (42.1%) |
Sales and Office Occupations
The most common Sales and Office occupations in Tenkiller are Office & Administration (7 | 6.5%), and Sales & Related (1 | 0.9%).
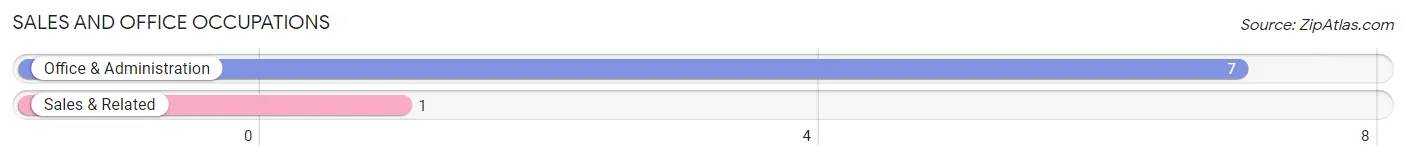
Sales and Office Occupations by Sex
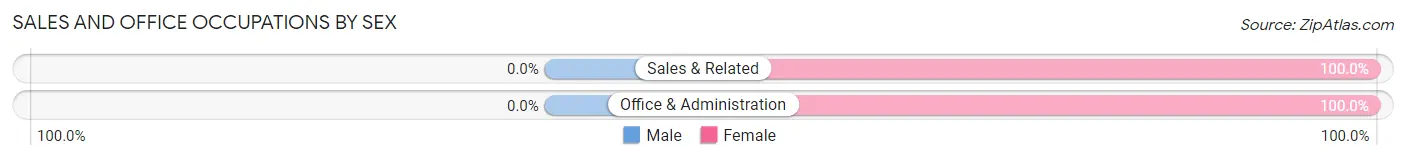
| Occupation | Male | Female |
| Sales & Related | 0 (0.0%) | 1 (100.0%) |
| Office & Administration | 0 (0.0%) | 7 (100.0%) |
| Total (Category) | 0 (0.0%) | 8 (100.0%) |
| Total (Overall) | 62 (57.9%) | 45 (42.1%) |
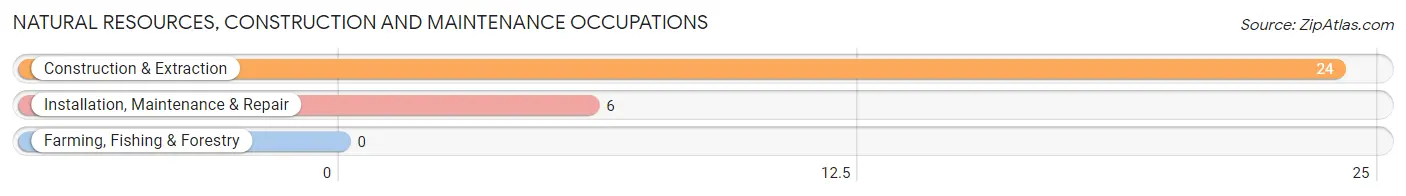
Natural Resources, Construction and Maintenance Occupations
The most common Natural Resources, Construction and Maintenance occupations in Tenkiller are Construction & Extraction (24 | 22.4%), and Installation, Maintenance & Repair (6 | 5.6%).
Natural Resources, Construction and Maintenance Occupations by Sex
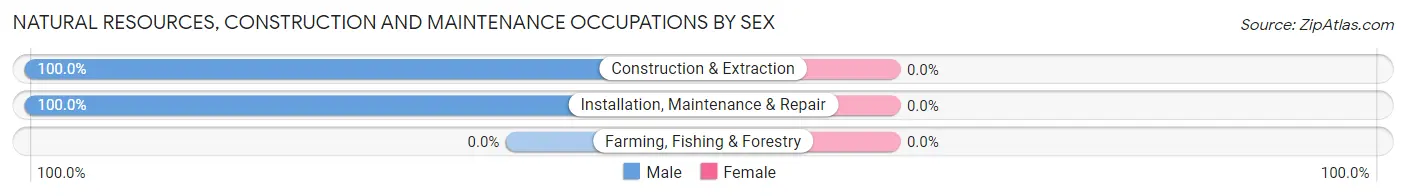
| Occupation | Male | Female |
| Farming, Fishing & Forestry | 0 (0.0%) | 0 (0.0%) |
| Construction & Extraction | 24 (100.0%) | 0 (0.0%) |
| Installation, Maintenance & Repair | 6 (100.0%) | 0 (0.0%) |
| Total (Category) | 30 (100.0%) | 0 (0.0%) |
| Total (Overall) | 62 (57.9%) | 45 (42.1%) |
Production, Transportation and Moving Occupations
The most common Production, Transportation and Moving occupations in Tenkiller are Production (5 | 4.7%), Transportation (3 | 2.8%), and Material Moving (2 | 1.9%).
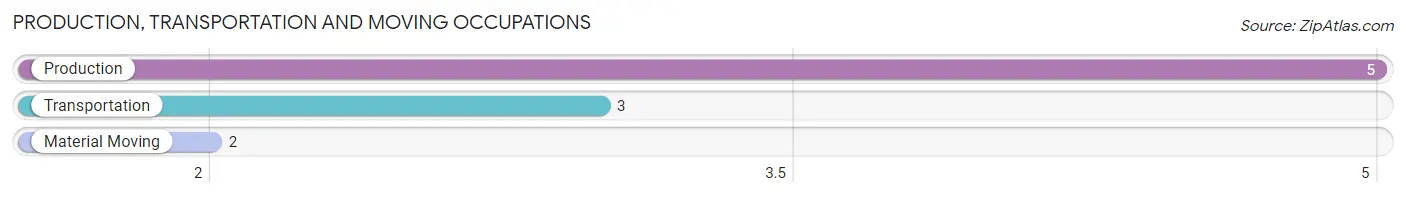
Production, Transportation and Moving Occupations by Sex
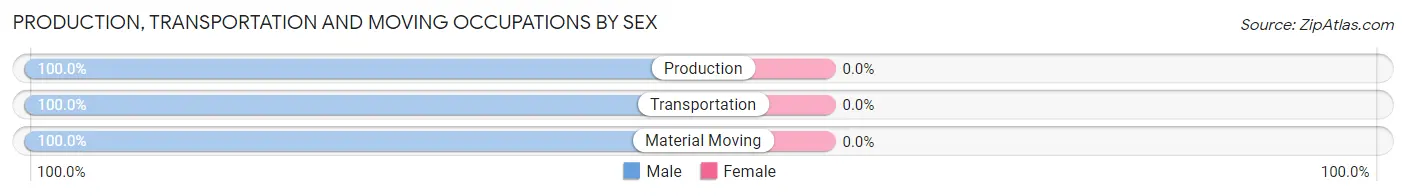
| Occupation | Male | Female |
| Production | 5 (100.0%) | 0 (0.0%) |
| Transportation | 3 (100.0%) | 0 (0.0%) |
| Material Moving | 2 (100.0%) | 0 (0.0%) |
| Total (Category) | 10 (100.0%) | 0 (0.0%) |
| Total (Overall) | 62 (57.9%) | 45 (42.1%) |
Employment Industries by Sex in Tenkiller
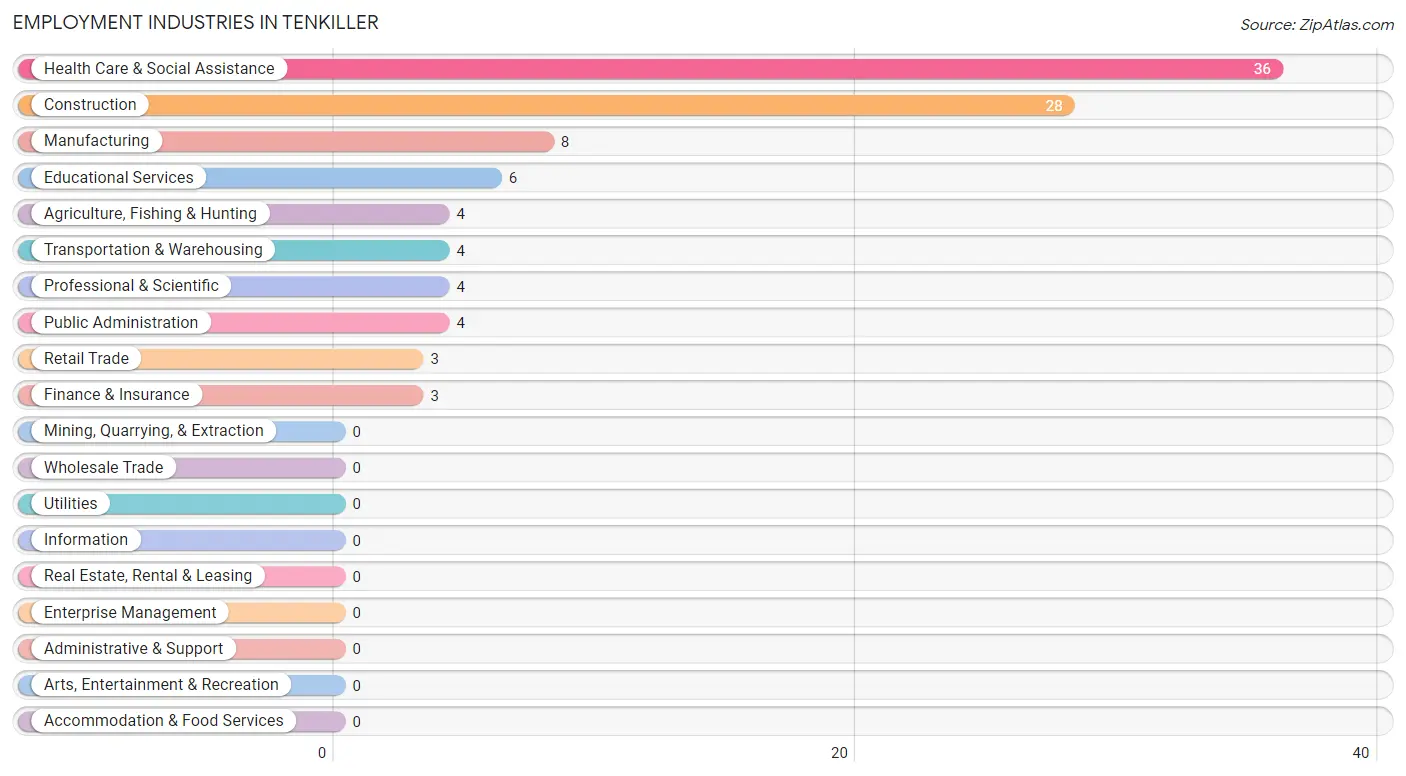
Employment Industries in Tenkiller
The major employment industries in Tenkiller include Health Care & Social Assistance (36 | 33.6%), Construction (28 | 26.2%), Manufacturing (8 | 7.5%), Educational Services (6 | 5.6%), and Agriculture, Fishing & Hunting (4 | 3.7%).
Employment Industries by Sex in Tenkiller
The Tenkiller industries that see more men than women are Agriculture, Fishing & Hunting (100.0%), Construction (100.0%), and Manufacturing (100.0%), whereas the industries that tend to have a higher number of women are Finance & Insurance (100.0%), Educational Services (100.0%), and Health Care & Social Assistance (88.9%).
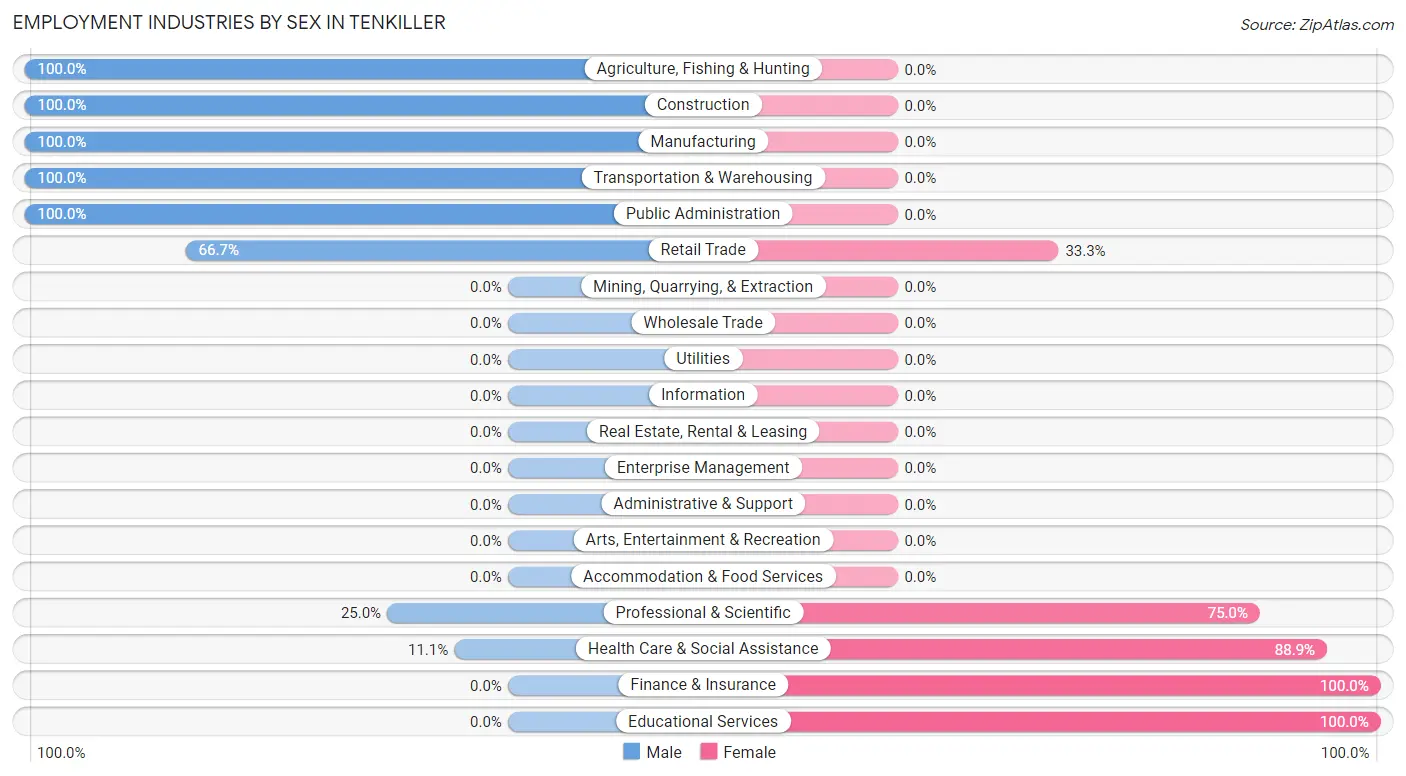
| Industry | Male | Female |
| Agriculture, Fishing & Hunting | 4 (100.0%) | 0 (0.0%) |
| Mining, Quarrying, & Extraction | 0 (0.0%) | 0 (0.0%) |
| Construction | 28 (100.0%) | 0 (0.0%) |
| Manufacturing | 8 (100.0%) | 0 (0.0%) |
| Wholesale Trade | 0 (0.0%) | 0 (0.0%) |
| Retail Trade | 2 (66.7%) | 1 (33.3%) |
| Transportation & Warehousing | 4 (100.0%) | 0 (0.0%) |
| Utilities | 0 (0.0%) | 0 (0.0%) |
| Information | 0 (0.0%) | 0 (0.0%) |
| Finance & Insurance | 0 (0.0%) | 3 (100.0%) |
| Real Estate, Rental & Leasing | 0 (0.0%) | 0 (0.0%) |
| Professional & Scientific | 1 (25.0%) | 3 (75.0%) |
| Enterprise Management | 0 (0.0%) | 0 (0.0%) |
| Administrative & Support | 0 (0.0%) | 0 (0.0%) |
| Educational Services | 0 (0.0%) | 6 (100.0%) |
| Health Care & Social Assistance | 4 (11.1%) | 32 (88.9%) |
| Arts, Entertainment & Recreation | 0 (0.0%) | 0 (0.0%) |
| Accommodation & Food Services | 0 (0.0%) | 0 (0.0%) |
| Public Administration | 4 (100.0%) | 0 (0.0%) |
| Total | 62 (57.9%) | 45 (42.1%) |
Education in Tenkiller
School Enrollment in Tenkiller
The most common levels of schooling among the 96 students in Tenkiller are high school (30 | 31.2%), middle school (23 | 24.0%), and elementary school (22 | 22.9%).
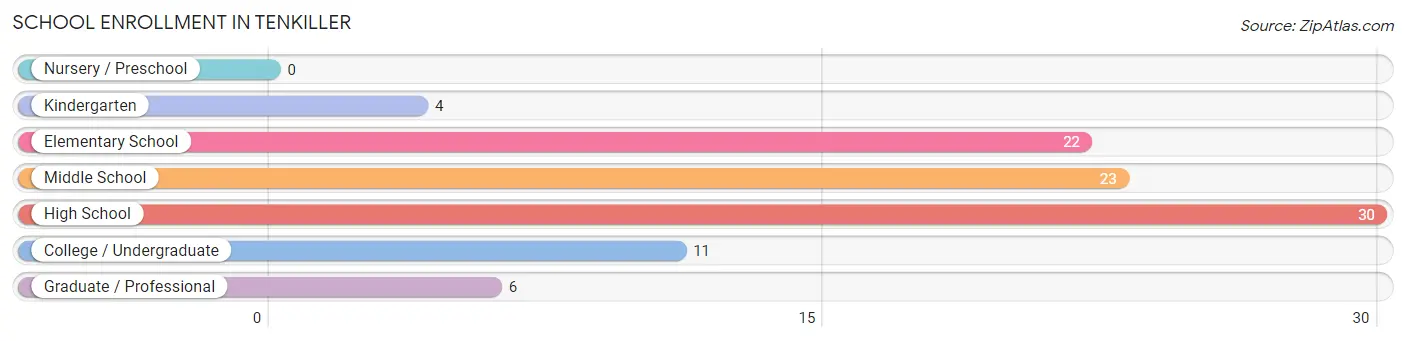
| School Level | # Students | % Students |
| Nursery / Preschool | 0 | 0.0% |
| Kindergarten | 4 | 4.2% |
| Elementary School | 22 | 22.9% |
| Middle School | 23 | 24.0% |
| High School | 30 | 31.2% |
| College / Undergraduate | 11 | 11.5% |
| Graduate / Professional | 6 | 6.2% |
| Total | 96 | 100.0% |
School Enrollment by Age by Funding Source in Tenkiller
Out of a total of 96 students who are enrolled in schools in Tenkiller, 4 (4.2%) attend a private institution, while the remaining 92 (95.8%) are enrolled in public schools. The age group of 20 to 24 year olds has the highest likelihood of being enrolled in private schools, with 2 (100.0% in the age bracket) enrolled. Conversely, the age group of 5 to 9 year old has the lowest likelihood of being enrolled in a private school, with 14 (100.0% in the age bracket) attending a public institution.
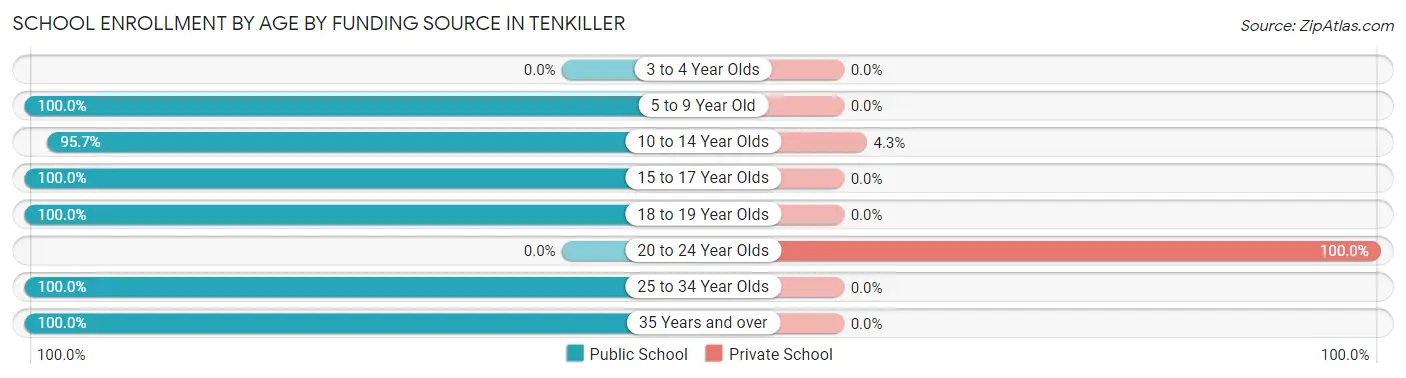
| Age Bracket | Public School | Private School |
| 3 to 4 Year Olds | 0 (0.0%) | 0 (0.0%) |
| 5 to 9 Year Old | 14 (100.0%) | 0 (0.0%) |
| 10 to 14 Year Olds | 45 (95.7%) | 2 (4.3%) |
| 15 to 17 Year Olds | 6 (100.0%) | 0 (0.0%) |
| 18 to 19 Year Olds | 12 (100.0%) | 0 (0.0%) |
| 20 to 24 Year Olds | 0 (0.0%) | 2 (100.0%) |
| 25 to 34 Year Olds | 6 (100.0%) | 0 (0.0%) |
| 35 Years and over | 9 (100.0%) | 0 (0.0%) |
| Total | 92 (95.8%) | 4 (4.2%) |
Educational Attainment by Field of Study in Tenkiller
Science & technology (12 | 31.6%), engineering (8 | 21.0%), education (6 | 15.8%), bio, nature & agricultural (4 | 10.5%), and business (4 | 10.5%) are the most common fields of study among 38 individuals in Tenkiller who have obtained a bachelor's degree or higher.
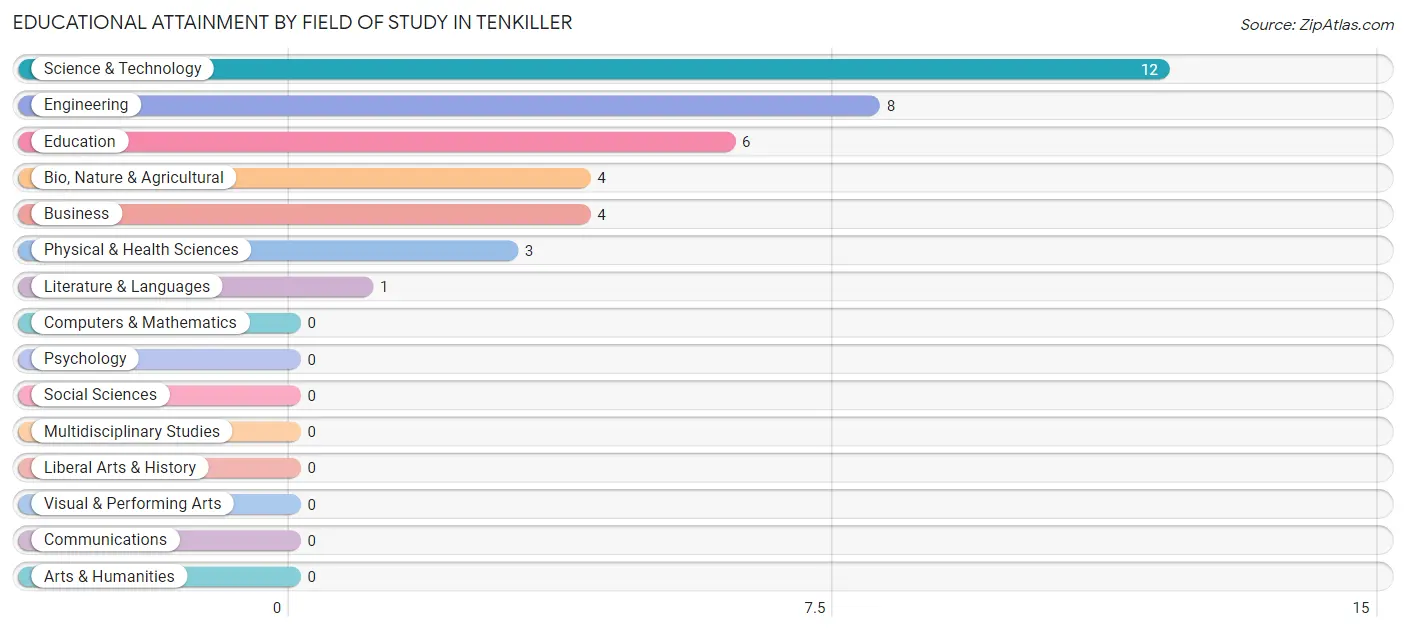
| Field of Study | # Graduates | % Graduates |
| Computers & Mathematics | 0 | 0.0% |
| Bio, Nature & Agricultural | 4 | 10.5% |
| Physical & Health Sciences | 3 | 7.9% |
| Psychology | 0 | 0.0% |
| Social Sciences | 0 | 0.0% |
| Engineering | 8 | 21.0% |
| Multidisciplinary Studies | 0 | 0.0% |
| Science & Technology | 12 | 31.6% |
| Business | 4 | 10.5% |
| Education | 6 | 15.8% |
| Literature & Languages | 1 | 2.6% |
| Liberal Arts & History | 0 | 0.0% |
| Visual & Performing Arts | 0 | 0.0% |
| Communications | 0 | 0.0% |
| Arts & Humanities | 0 | 0.0% |
| Total | 38 | 100.0% |
Transportation & Commute in Tenkiller
Vehicle Availability by Sex in Tenkiller
The most prevalent vehicle ownership categories in Tenkiller are males with 2 vehicles (27, accounting for 47.4%) and females with 2 vehicles (14, making up 60.0%).
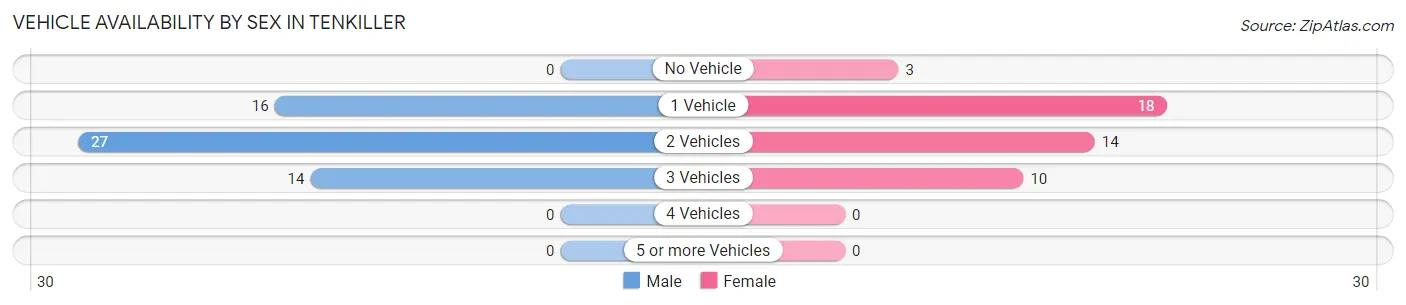
| Vehicles Available | Male | Female |
| No Vehicle | 0 (0.0%) | 3 (6.7%) |
| 1 Vehicle | 16 (28.1%) | 18 (40.0%) |
| 2 Vehicles | 27 (47.4%) | 14 (31.1%) |
| 3 Vehicles | 14 (24.6%) | 10 (22.2%) |
| 4 Vehicles | 0 (0.0%) | 0 (0.0%) |
| 5 or more Vehicles | 0 (0.0%) | 0 (0.0%) |
| Total | 57 (100.0%) | 45 (100.0%) |
Commute Time in Tenkiller
The most frequently occuring commute durations in Tenkiller are 30 to 34 minutes (26 commuters, 26.3%), 60 to 89 minutes (26 commuters, 26.3%), and 20 to 24 minutes (20 commuters, 20.2%).
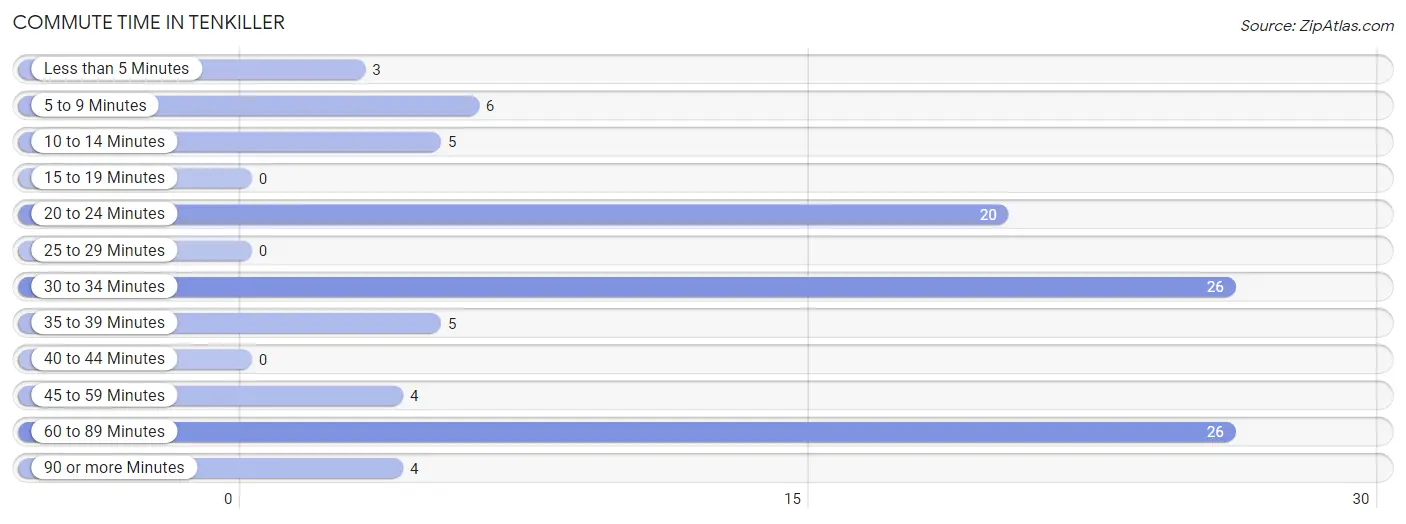
| Commute Time | # Commuters | % Commuters |
| Less than 5 Minutes | 3 | 3.0% |
| 5 to 9 Minutes | 6 | 6.1% |
| 10 to 14 Minutes | 5 | 5.1% |
| 15 to 19 Minutes | 0 | 0.0% |
| 20 to 24 Minutes | 20 | 20.2% |
| 25 to 29 Minutes | 0 | 0.0% |
| 30 to 34 Minutes | 26 | 26.3% |
| 35 to 39 Minutes | 5 | 5.1% |
| 40 to 44 Minutes | 0 | 0.0% |
| 45 to 59 Minutes | 4 | 4.0% |
| 60 to 89 Minutes | 26 | 26.3% |
| 90 or more Minutes | 4 | 4.0% |
Commute Time by Sex in Tenkiller
The most common commute times in Tenkiller are 20 to 24 minutes (20 commuters, 37.0%) for males and 30 to 34 minutes (18 commuters, 40.0%) for females.
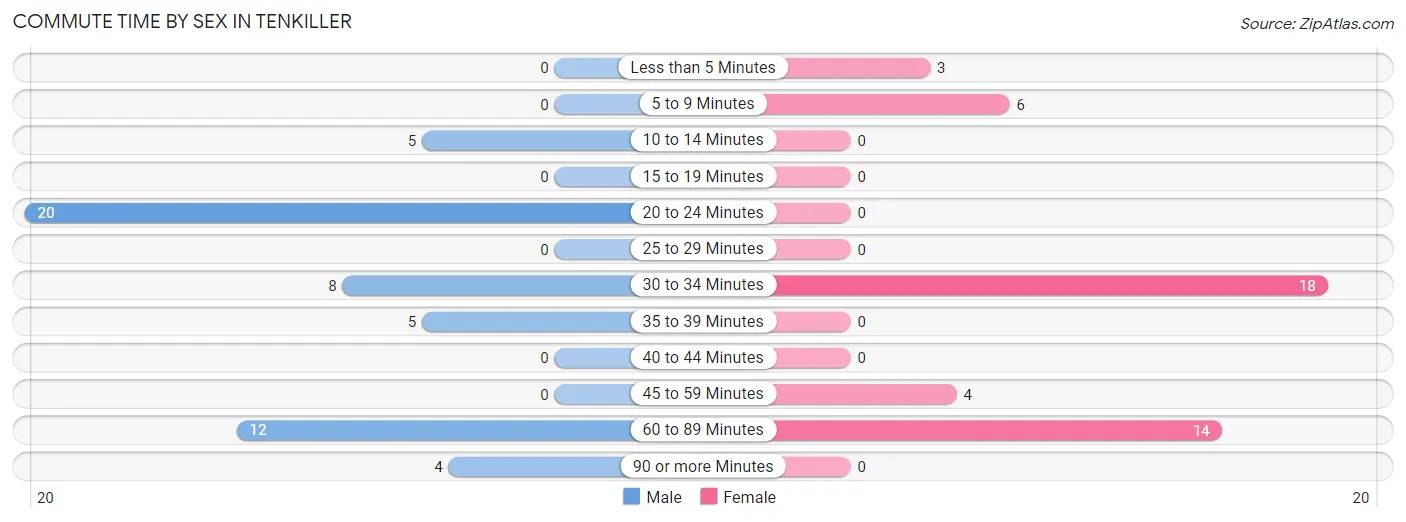
| Commute Time | Male | Female |
| Less than 5 Minutes | 0 (0.0%) | 3 (6.7%) |
| 5 to 9 Minutes | 0 (0.0%) | 6 (13.3%) |
| 10 to 14 Minutes | 5 (9.3%) | 0 (0.0%) |
| 15 to 19 Minutes | 0 (0.0%) | 0 (0.0%) |
| 20 to 24 Minutes | 20 (37.0%) | 0 (0.0%) |
| 25 to 29 Minutes | 0 (0.0%) | 0 (0.0%) |
| 30 to 34 Minutes | 8 (14.8%) | 18 (40.0%) |
| 35 to 39 Minutes | 5 (9.3%) | 0 (0.0%) |
| 40 to 44 Minutes | 0 (0.0%) | 0 (0.0%) |
| 45 to 59 Minutes | 0 (0.0%) | 4 (8.9%) |
| 60 to 89 Minutes | 12 (22.2%) | 14 (31.1%) |
| 90 or more Minutes | 4 (7.4%) | 0 (0.0%) |
Time of Departure to Work by Sex in Tenkiller
The most frequent times of departure to work in Tenkiller are 12:00 AM to 4:59 AM (17, 31.5%) for males and 12:00 PM to 3:59 PM (14, 31.1%) for females.
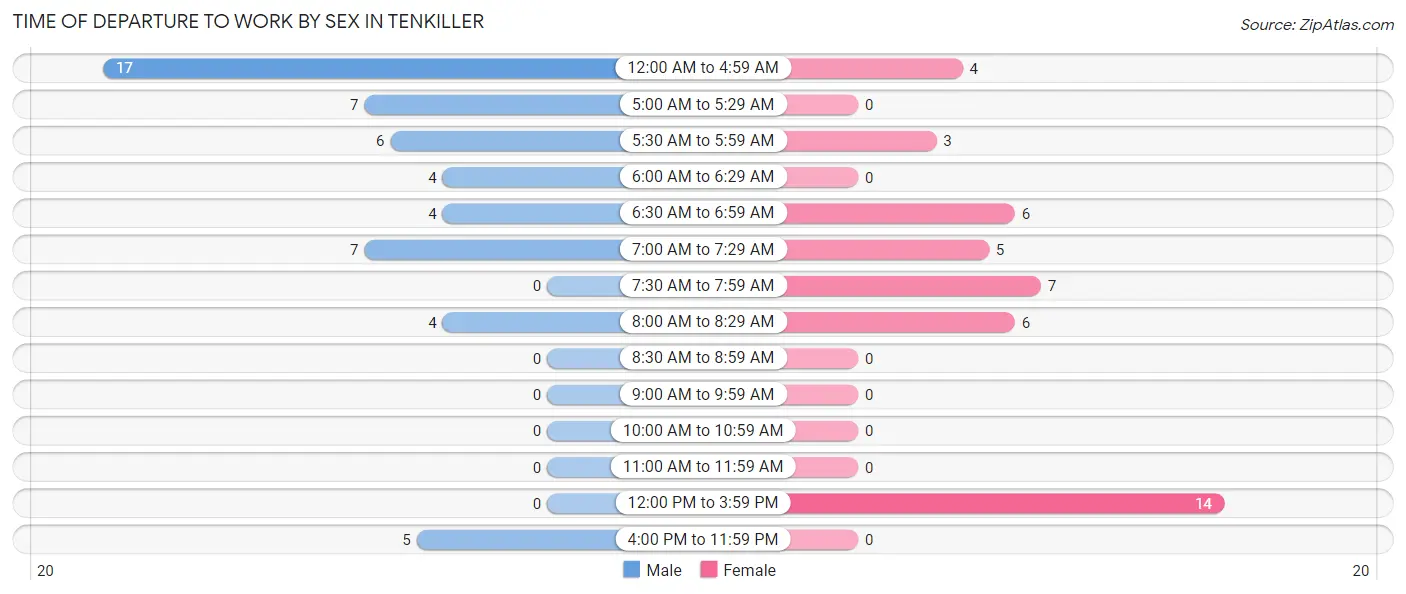
| Time of Departure | Male | Female |
| 12:00 AM to 4:59 AM | 17 (31.5%) | 4 (8.9%) |
| 5:00 AM to 5:29 AM | 7 (13.0%) | 0 (0.0%) |
| 5:30 AM to 5:59 AM | 6 (11.1%) | 3 (6.7%) |
| 6:00 AM to 6:29 AM | 4 (7.4%) | 0 (0.0%) |
| 6:30 AM to 6:59 AM | 4 (7.4%) | 6 (13.3%) |
| 7:00 AM to 7:29 AM | 7 (13.0%) | 5 (11.1%) |
| 7:30 AM to 7:59 AM | 0 (0.0%) | 7 (15.6%) |
| 8:00 AM to 8:29 AM | 4 (7.4%) | 6 (13.3%) |
| 8:30 AM to 8:59 AM | 0 (0.0%) | 0 (0.0%) |
| 9:00 AM to 9:59 AM | 0 (0.0%) | 0 (0.0%) |
| 10:00 AM to 10:59 AM | 0 (0.0%) | 0 (0.0%) |
| 11:00 AM to 11:59 AM | 0 (0.0%) | 0 (0.0%) |
| 12:00 PM to 3:59 PM | 0 (0.0%) | 14 (31.1%) |
| 4:00 PM to 11:59 PM | 5 (9.3%) | 0 (0.0%) |
| Total | 54 (100.0%) | 45 (100.0%) |
Housing Occupancy in Tenkiller
Occupancy by Ownership in Tenkiller
Of the total 122 dwellings in Tenkiller, owner-occupied units account for 104 (85.3%), while renter-occupied units make up 18 (14.7%).
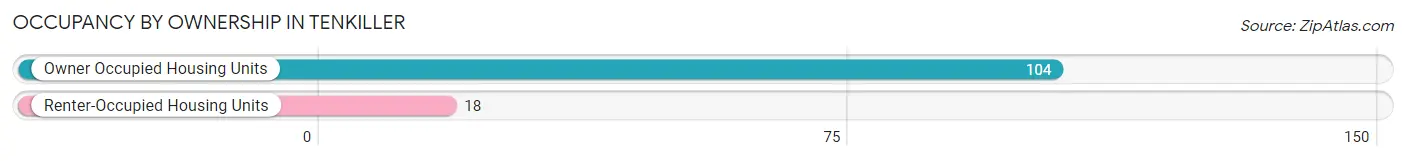
| Occupancy | # Housing Units | % Housing Units |
| Owner Occupied Housing Units | 104 | 85.3% |
| Renter-Occupied Housing Units | 18 | 14.7% |
| Total Occupied Housing Units | 122 | 100.0% |
Occupancy by Household Size in Tenkiller
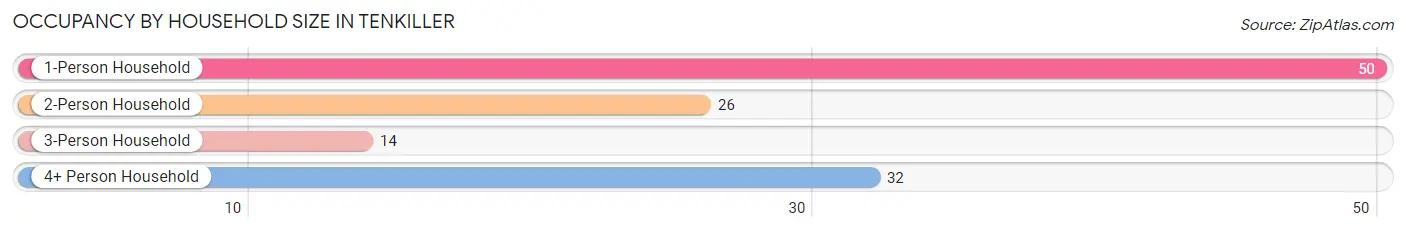
| Household Size | # Housing Units | % Housing Units |
| 1-Person Household | 50 | 41.0% |
| 2-Person Household | 26 | 21.3% |
| 3-Person Household | 14 | 11.5% |
| 4+ Person Household | 32 | 26.2% |
| Total Housing Units | 122 | 100.0% |
Occupancy by Ownership by Household Size in Tenkiller
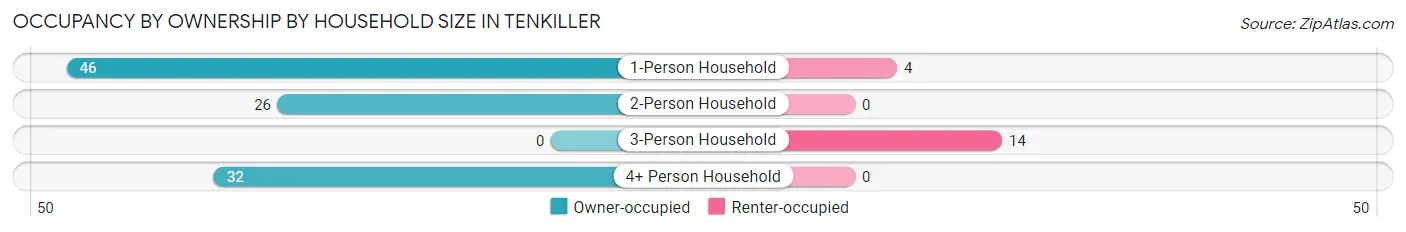
| Household Size | Owner-occupied | Renter-occupied |
| 1-Person Household | 46 (92.0%) | 4 (8.0%) |
| 2-Person Household | 26 (100.0%) | 0 (0.0%) |
| 3-Person Household | 0 (0.0%) | 14 (100.0%) |
| 4+ Person Household | 32 (100.0%) | 0 (0.0%) |
| Total Housing Units | 104 (85.3%) | 18 (14.7%) |
Occupancy by Educational Attainment in Tenkiller
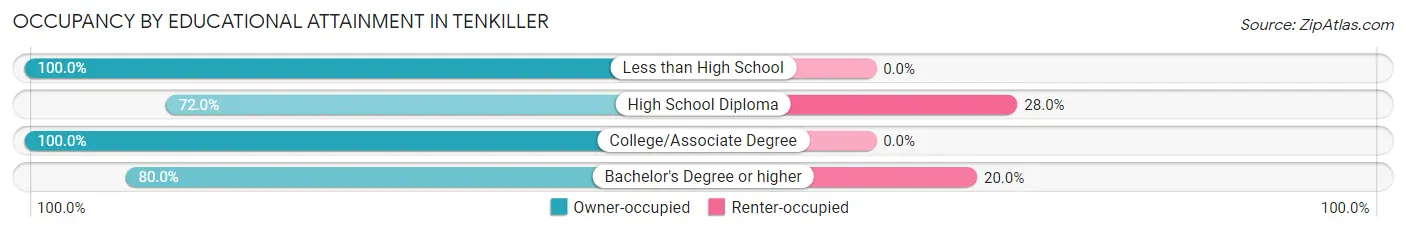
| Household Size | Owner-occupied | Renter-occupied |
| Less than High School | 20 (100.0%) | 0 (0.0%) |
| High School Diploma | 36 (72.0%) | 14 (28.0%) |
| College/Associate Degree | 32 (100.0%) | 0 (0.0%) |
| Bachelor's Degree or higher | 16 (80.0%) | 4 (20.0%) |
Occupancy by Age of Householder in Tenkiller
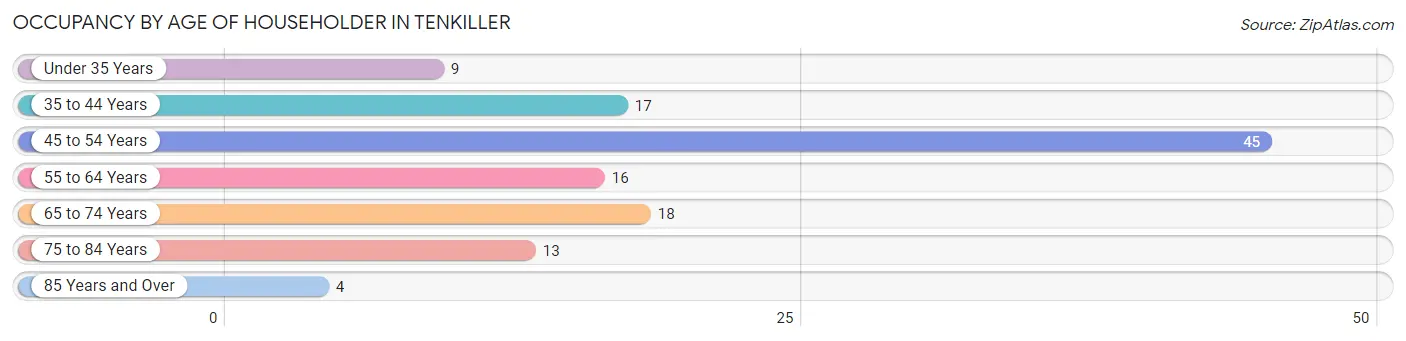
| Age Bracket | # Households | % Households |
| Under 35 Years | 9 | 7.4% |
| 35 to 44 Years | 17 | 13.9% |
| 45 to 54 Years | 45 | 36.9% |
| 55 to 64 Years | 16 | 13.1% |
| 65 to 74 Years | 18 | 14.7% |
| 75 to 84 Years | 13 | 10.7% |
| 85 Years and Over | 4 | 3.3% |
| Total | 122 | 100.0% |
Housing Finances in Tenkiller
Median Income by Occupancy in Tenkiller
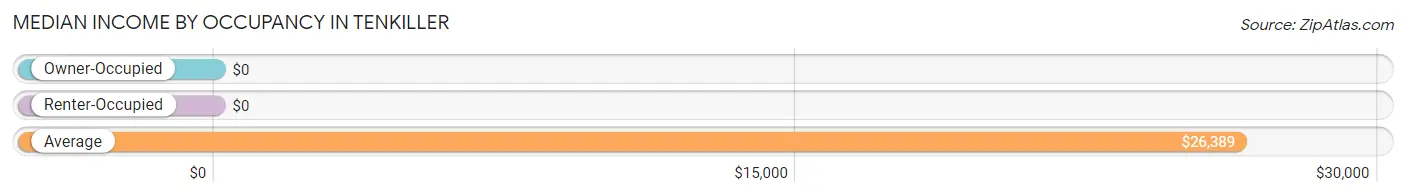
| Occupancy Type | # Households | Median Income |
| Owner-Occupied | 104 (85.3%) | $0 |
| Renter-Occupied | 18 (14.7%) | $0 |
| Average | 122 (100.0%) | $26,389 |
Occupancy by Householder Income Bracket in Tenkiller
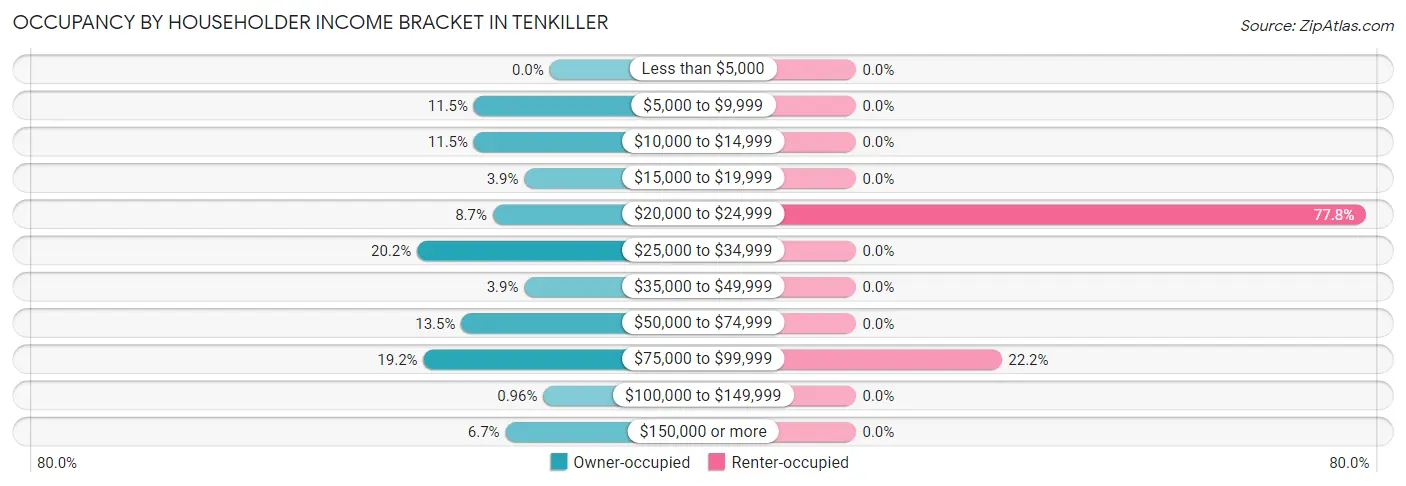
| Income Bracket | Owner-occupied | Renter-occupied |
| Less than $5,000 | 0 (0.0%) | 0 (0.0%) |
| $5,000 to $9,999 | 12 (11.5%) | 0 (0.0%) |
| $10,000 to $14,999 | 12 (11.5%) | 0 (0.0%) |
| $15,000 to $19,999 | 4 (3.8%) | 0 (0.0%) |
| $20,000 to $24,999 | 9 (8.6%) | 14 (77.8%) |
| $25,000 to $34,999 | 21 (20.2%) | 0 (0.0%) |
| $35,000 to $49,999 | 4 (3.8%) | 0 (0.0%) |
| $50,000 to $74,999 | 14 (13.5%) | 0 (0.0%) |
| $75,000 to $99,999 | 20 (19.2%) | 4 (22.2%) |
| $100,000 to $149,999 | 1 (1.0%) | 0 (0.0%) |
| $150,000 or more | 7 (6.7%) | 0 (0.0%) |
| Total | 104 (100.0%) | 18 (100.0%) |
Monthly Housing Cost Tiers in Tenkiller
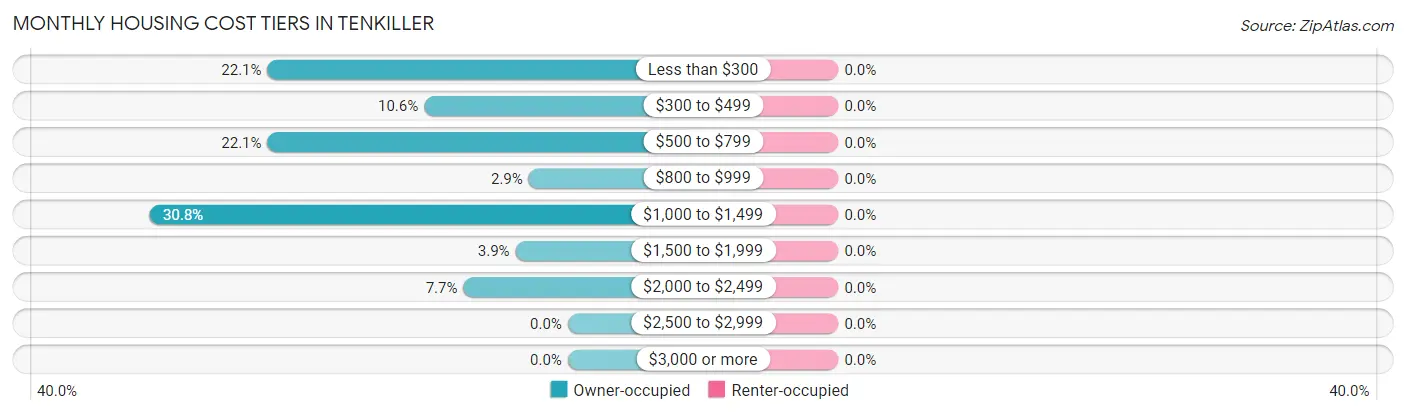
| Monthly Cost | Owner-occupied | Renter-occupied |
| Less than $300 | 23 (22.1%) | 0 (0.0%) |
| $300 to $499 | 11 (10.6%) | 0 (0.0%) |
| $500 to $799 | 23 (22.1%) | 0 (0.0%) |
| $800 to $999 | 3 (2.9%) | 0 (0.0%) |
| $1,000 to $1,499 | 32 (30.8%) | 0 (0.0%) |
| $1,500 to $1,999 | 4 (3.8%) | 0 (0.0%) |
| $2,000 to $2,499 | 8 (7.7%) | 0 (0.0%) |
| $2,500 to $2,999 | 0 (0.0%) | 0 (0.0%) |
| $3,000 or more | 0 (0.0%) | 0 (0.0%) |
| Total | 104 (100.0%) | 18 (100.0%) |
Physical Housing Characteristics in Tenkiller
Housing Structures in Tenkiller
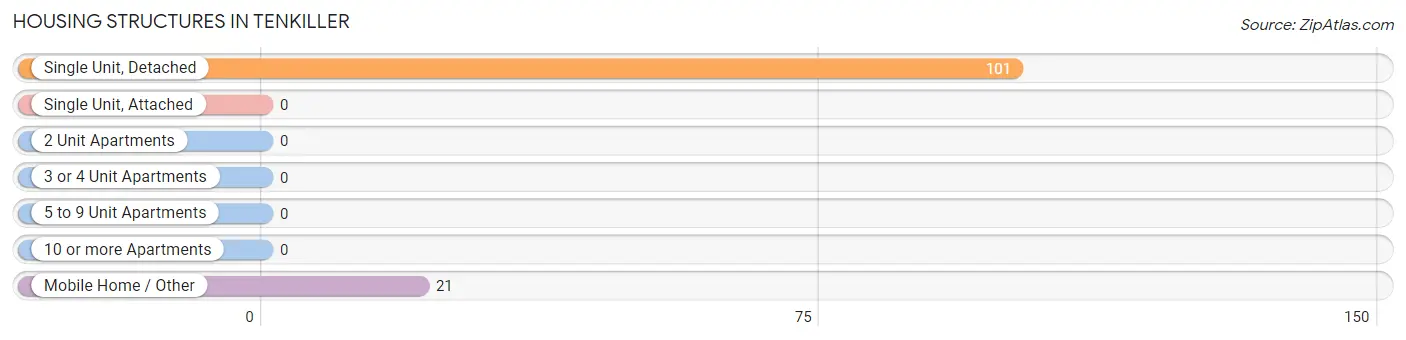
| Structure Type | # Housing Units | % Housing Units |
| Single Unit, Detached | 101 | 82.8% |
| Single Unit, Attached | 0 | 0.0% |
| 2 Unit Apartments | 0 | 0.0% |
| 3 or 4 Unit Apartments | 0 | 0.0% |
| 5 to 9 Unit Apartments | 0 | 0.0% |
| 10 or more Apartments | 0 | 0.0% |
| Mobile Home / Other | 21 | 17.2% |
| Total | 122 | 100.0% |
Housing Structures by Occupancy in Tenkiller
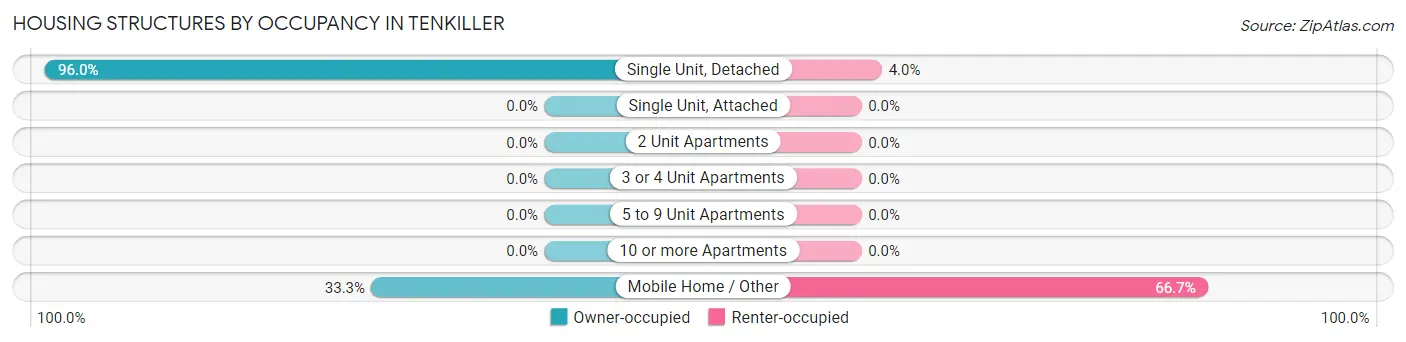
| Structure Type | Owner-occupied | Renter-occupied |
| Single Unit, Detached | 97 (96.0%) | 4 (4.0%) |
| Single Unit, Attached | 0 (0.0%) | 0 (0.0%) |
| 2 Unit Apartments | 0 (0.0%) | 0 (0.0%) |
| 3 or 4 Unit Apartments | 0 (0.0%) | 0 (0.0%) |
| 5 to 9 Unit Apartments | 0 (0.0%) | 0 (0.0%) |
| 10 or more Apartments | 0 (0.0%) | 0 (0.0%) |
| Mobile Home / Other | 7 (33.3%) | 14 (66.7%) |
| Total | 104 (85.3%) | 18 (14.7%) |
Housing Structures by Number of Rooms in Tenkiller
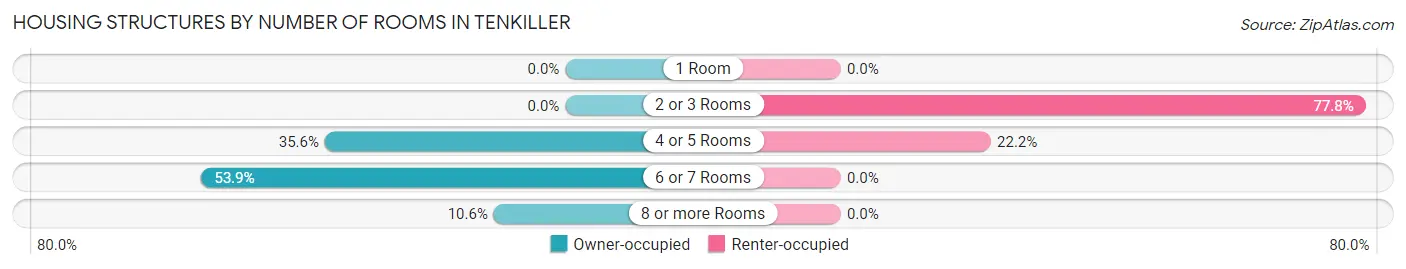
| Number of Rooms | Owner-occupied | Renter-occupied |
| 1 Room | 0 (0.0%) | 0 (0.0%) |
| 2 or 3 Rooms | 0 (0.0%) | 14 (77.8%) |
| 4 or 5 Rooms | 37 (35.6%) | 4 (22.2%) |
| 6 or 7 Rooms | 56 (53.8%) | 0 (0.0%) |
| 8 or more Rooms | 11 (10.6%) | 0 (0.0%) |
| Total | 104 (100.0%) | 18 (100.0%) |
Housing Structure by Heating Type in Tenkiller
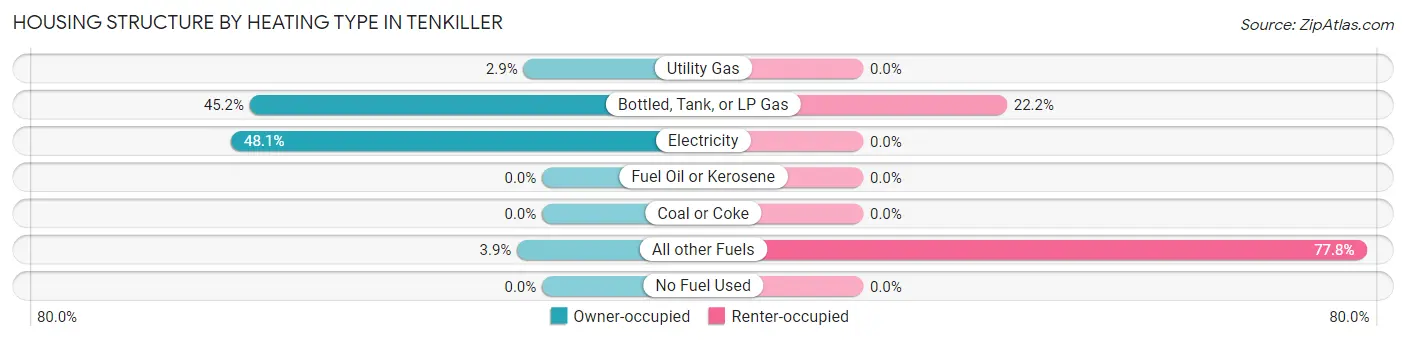
| Heating Type | Owner-occupied | Renter-occupied |
| Utility Gas | 3 (2.9%) | 0 (0.0%) |
| Bottled, Tank, or LP Gas | 47 (45.2%) | 4 (22.2%) |
| Electricity | 50 (48.1%) | 0 (0.0%) |
| Fuel Oil or Kerosene | 0 (0.0%) | 0 (0.0%) |
| Coal or Coke | 0 (0.0%) | 0 (0.0%) |
| All other Fuels | 4 (3.8%) | 14 (77.8%) |
| No Fuel Used | 0 (0.0%) | 0 (0.0%) |
| Total | 104 (100.0%) | 18 (100.0%) |
Household Vehicle Usage in Tenkiller
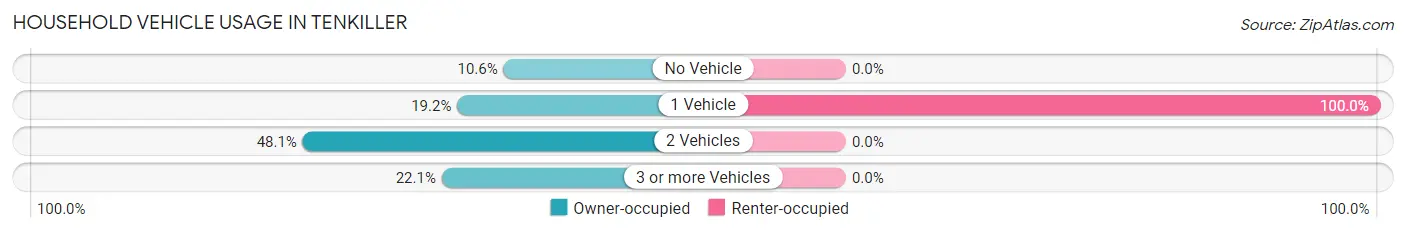
| Vehicles per Household | Owner-occupied | Renter-occupied |
| No Vehicle | 11 (10.6%) | 0 (0.0%) |
| 1 Vehicle | 20 (19.2%) | 18 (100.0%) |
| 2 Vehicles | 50 (48.1%) | 0 (0.0%) |
| 3 or more Vehicles | 23 (22.1%) | 0 (0.0%) |
| Total | 104 (100.0%) | 18 (100.0%) |
Real Estate & Mortgages in Tenkiller
Real Estate and Mortgage Overview in Tenkiller
| Characteristic | Without Mortgage | With Mortgage |
| Housing Units | 61 | 43 |
| Median Property Value | $97,100 | $153,400 |
| Median Household Income | $25,764 | $4 |
| Monthly Housing Costs | $413 | $0 |
| Real Estate Taxes | $911 | $18 |
Property Value by Mortgage Status in Tenkiller
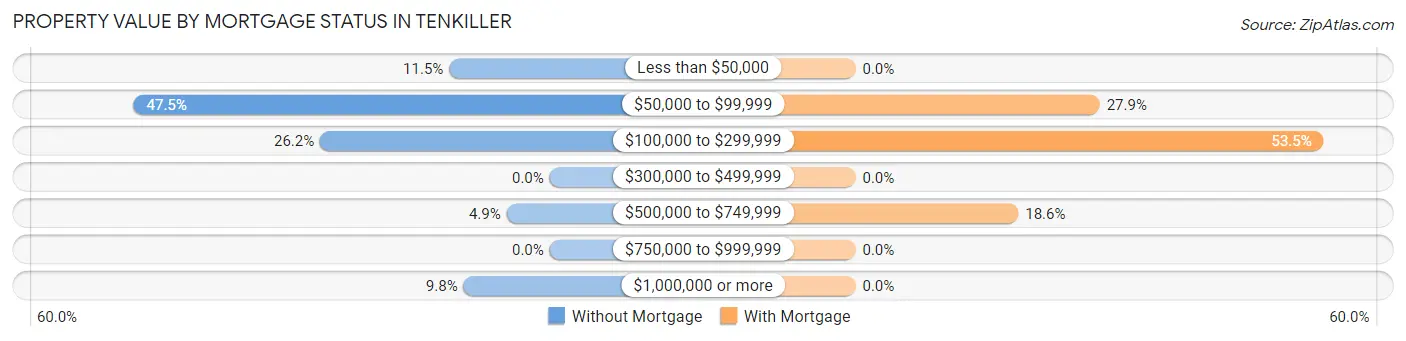
| Property Value | Without Mortgage | With Mortgage |
| Less than $50,000 | 7 (11.5%) | 0 (0.0%) |
| $50,000 to $99,999 | 29 (47.5%) | 12 (27.9%) |
| $100,000 to $299,999 | 16 (26.2%) | 23 (53.5%) |
| $300,000 to $499,999 | 0 (0.0%) | 0 (0.0%) |
| $500,000 to $749,999 | 3 (4.9%) | 8 (18.6%) |
| $750,000 to $999,999 | 0 (0.0%) | 0 (0.0%) |
| $1,000,000 or more | 6 (9.8%) | 0 (0.0%) |
| Total | 61 (100.0%) | 43 (100.0%) |
Household Income by Mortgage Status in Tenkiller
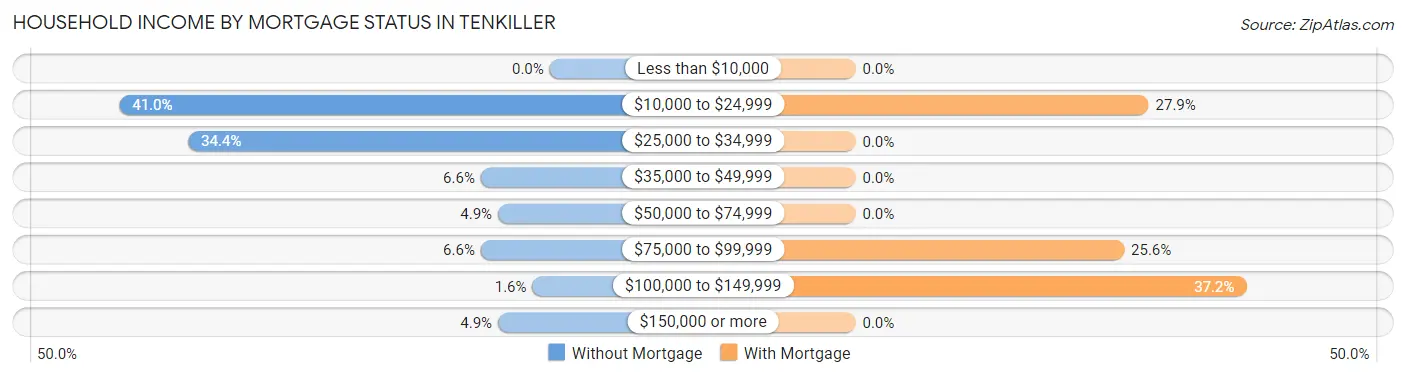
| Household Income | Without Mortgage | With Mortgage |
| Less than $10,000 | 0 (0.0%) | 0 (0.0%) |
| $10,000 to $24,999 | 25 (41.0%) | 12 (27.9%) |
| $25,000 to $34,999 | 21 (34.4%) | 0 (0.0%) |
| $35,000 to $49,999 | 4 (6.6%) | 0 (0.0%) |
| $50,000 to $74,999 | 3 (4.9%) | 0 (0.0%) |
| $75,000 to $99,999 | 4 (6.6%) | 11 (25.6%) |
| $100,000 to $149,999 | 1 (1.6%) | 16 (37.2%) |
| $150,000 or more | 3 (4.9%) | 0 (0.0%) |
| Total | 61 (100.0%) | 43 (100.0%) |
Property Value to Household Income Ratio in Tenkiller
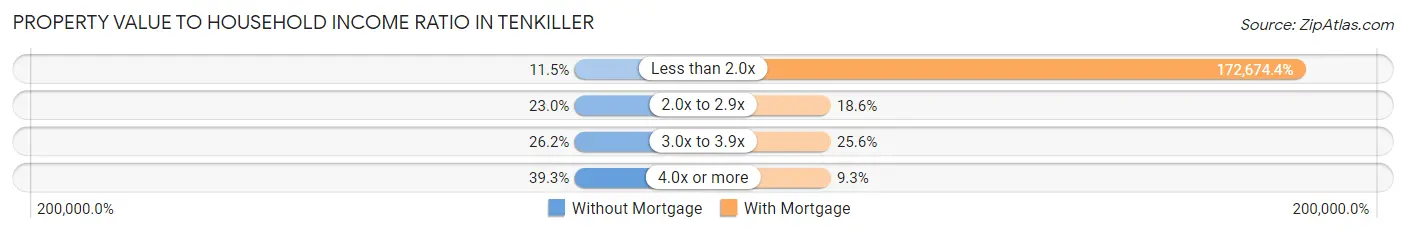
| Value-to-Income Ratio | Without Mortgage | With Mortgage |
| Less than 2.0x | 7 (11.5%) | 74,250 (172,674.4%) |
| 2.0x to 2.9x | 14 (23.0%) | 8 (18.6%) |
| 3.0x to 3.9x | 16 (26.2%) | 11 (25.6%) |
| 4.0x or more | 24 (39.3%) | 4 (9.3%) |
| Total | 61 (100.0%) | 43 (100.0%) |
Real Estate Taxes by Mortgage Status in Tenkiller
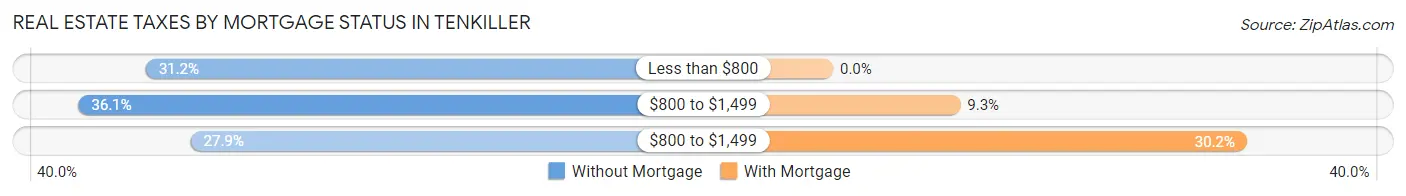
| Property Taxes | Without Mortgage | With Mortgage |
| Less than $800 | 19 (31.1%) | 0 (0.0%) |
| $800 to $1,499 | 22 (36.1%) | 4 (9.3%) |
| $800 to $1,499 | 17 (27.9%) | 13 (30.2%) |
| Total | 61 (100.0%) | 43 (100.0%) |
Health & Disability in Tenkiller
Health Insurance Coverage by Age in Tenkiller
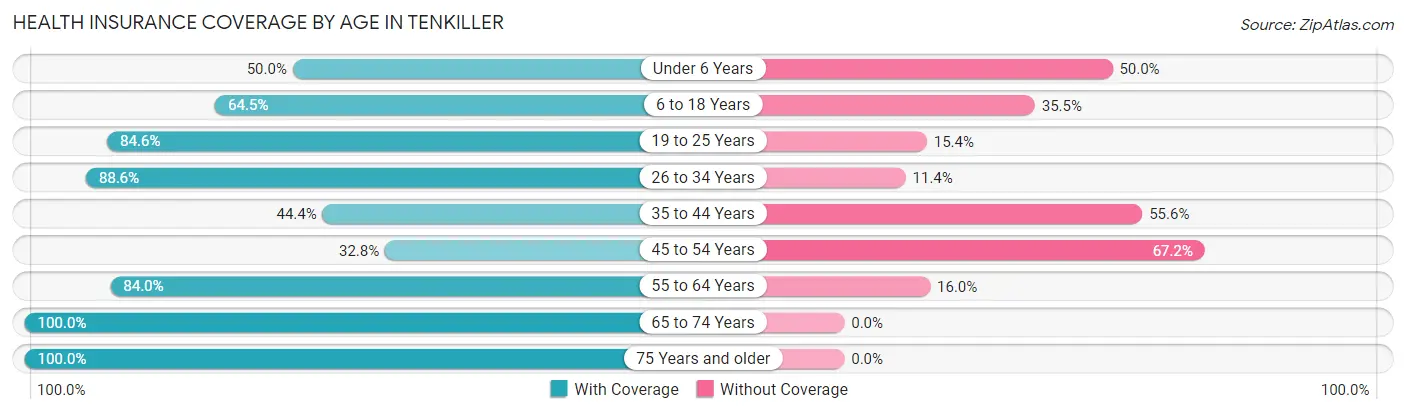
| Age Bracket | With Coverage | Without Coverage |
| Under 6 Years | 4 (50.0%) | 4 (50.0%) |
| 6 to 18 Years | 49 (64.5%) | 27 (35.5%) |
| 19 to 25 Years | 11 (84.6%) | 2 (15.4%) |
| 26 to 34 Years | 31 (88.6%) | 4 (11.4%) |
| 35 to 44 Years | 12 (44.4%) | 15 (55.6%) |
| 45 to 54 Years | 20 (32.8%) | 41 (67.2%) |
| 55 to 64 Years | 42 (84.0%) | 8 (16.0%) |
| 65 to 74 Years | 18 (100.0%) | 0 (0.0%) |
| 75 Years and older | 25 (100.0%) | 0 (0.0%) |
| Total | 212 (67.7%) | 101 (32.3%) |
Health Insurance Coverage by Citizenship Status in Tenkiller
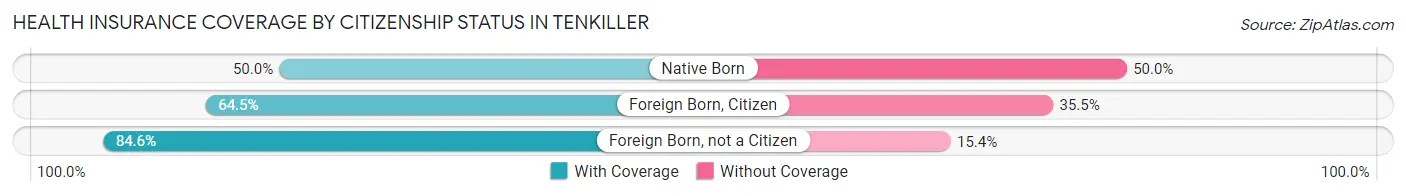
| Citizenship Status | With Coverage | Without Coverage |
| Native Born | 4 (50.0%) | 4 (50.0%) |
| Foreign Born, Citizen | 49 (64.5%) | 27 (35.5%) |
| Foreign Born, not a Citizen | 11 (84.6%) | 2 (15.4%) |
Health Insurance Coverage by Household Income in Tenkiller
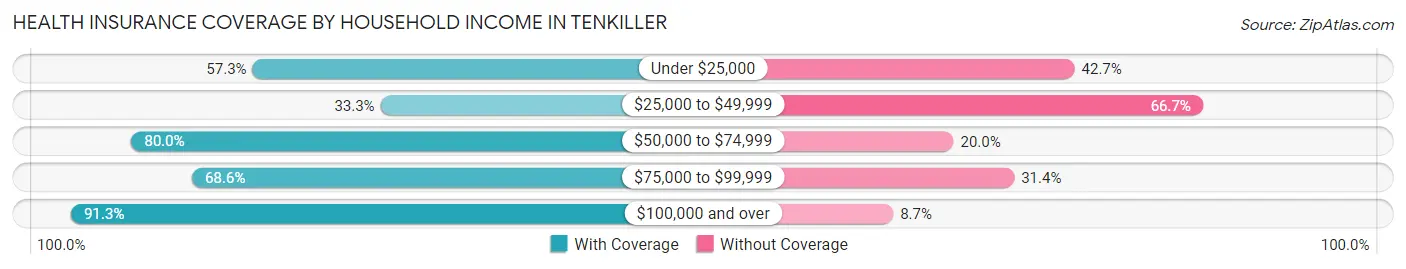
| Household Income | With Coverage | Without Coverage |
| Under $25,000 | 47 (57.3%) | 35 (42.7%) |
| $25,000 to $49,999 | 21 (33.3%) | 42 (66.7%) |
| $50,000 to $74,999 | 24 (80.0%) | 6 (20.0%) |
| $75,000 to $99,999 | 35 (68.6%) | 16 (31.4%) |
| $100,000 and over | 21 (91.3%) | 2 (8.7%) |
Public vs Private Health Insurance Coverage by Age in Tenkiller
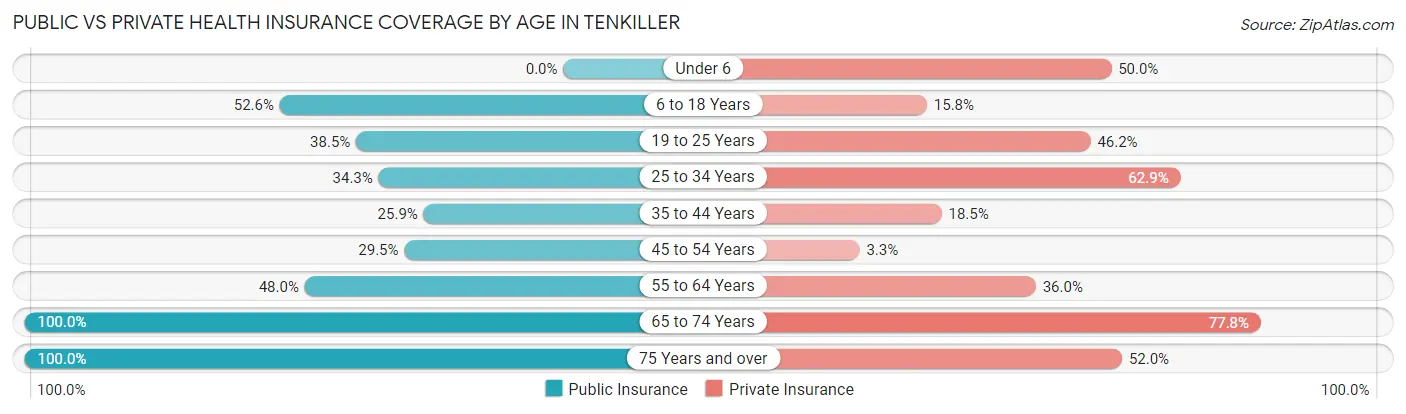
| Age Bracket | Public Insurance | Private Insurance |
| Under 6 | 0 (0.0%) | 4 (50.0%) |
| 6 to 18 Years | 40 (52.6%) | 12 (15.8%) |
| 19 to 25 Years | 5 (38.5%) | 6 (46.2%) |
| 25 to 34 Years | 12 (34.3%) | 22 (62.9%) |
| 35 to 44 Years | 7 (25.9%) | 5 (18.5%) |
| 45 to 54 Years | 18 (29.5%) | 2 (3.3%) |
| 55 to 64 Years | 24 (48.0%) | 18 (36.0%) |
| 65 to 74 Years | 18 (100.0%) | 14 (77.8%) |
| 75 Years and over | 25 (100.0%) | 13 (52.0%) |
| Total | 149 (47.6%) | 96 (30.7%) |
Disability Status by Sex by Age in Tenkiller
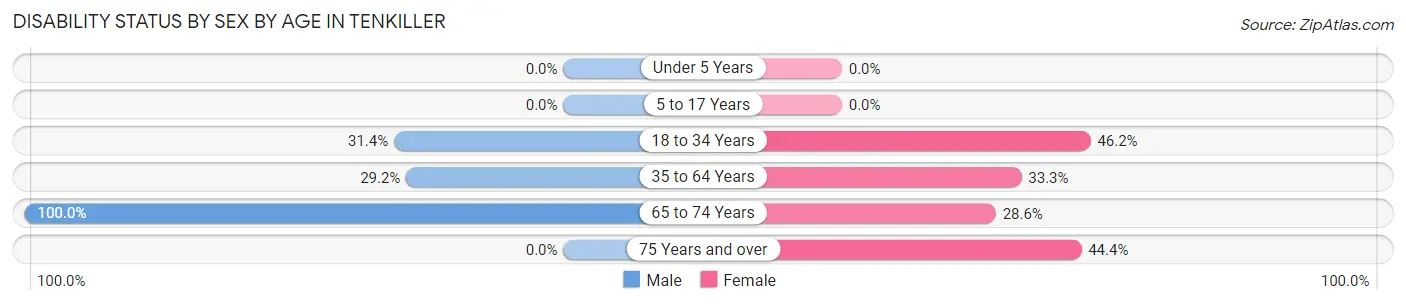
| Age Bracket | Male | Female |
| Under 5 Years | 0 (0.0%) | 0 (0.0%) |
| 5 to 17 Years | 0 (0.0%) | 0 (0.0%) |
| 18 to 34 Years | 11 (31.4%) | 12 (46.2%) |
| 35 to 64 Years | 21 (29.2%) | 22 (33.3%) |
| 65 to 74 Years | 4 (100.0%) | 4 (28.6%) |
| 75 Years and over | 0 (0.0%) | 8 (44.4%) |
Disability Class by Sex by Age in Tenkiller
Disability Class: Hearing Difficulty
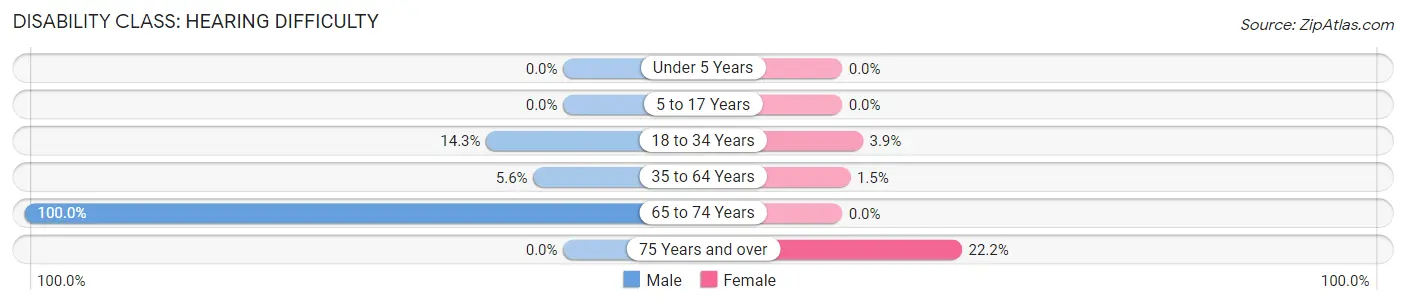
| Age Bracket | Male | Female |
| Under 5 Years | 0 (0.0%) | 0 (0.0%) |
| 5 to 17 Years | 0 (0.0%) | 0 (0.0%) |
| 18 to 34 Years | 5 (14.3%) | 1 (3.8%) |
| 35 to 64 Years | 4 (5.6%) | 1 (1.5%) |
| 65 to 74 Years | 4 (100.0%) | 0 (0.0%) |
| 75 Years and over | 0 (0.0%) | 4 (22.2%) |
Disability Class: Vision Difficulty
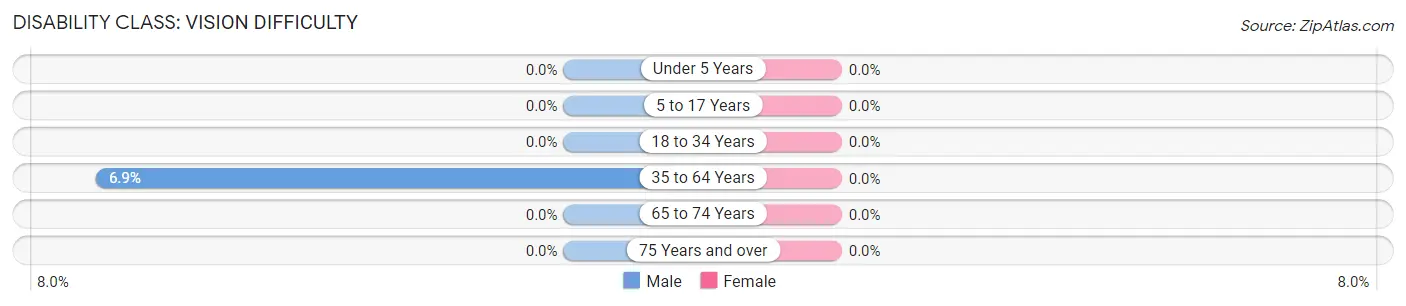
| Age Bracket | Male | Female |
| Under 5 Years | 0 (0.0%) | 0 (0.0%) |
| 5 to 17 Years | 0 (0.0%) | 0 (0.0%) |
| 18 to 34 Years | 0 (0.0%) | 0 (0.0%) |
| 35 to 64 Years | 5 (6.9%) | 0 (0.0%) |
| 65 to 74 Years | 0 (0.0%) | 0 (0.0%) |
| 75 Years and over | 0 (0.0%) | 0 (0.0%) |
Disability Class: Cognitive Difficulty
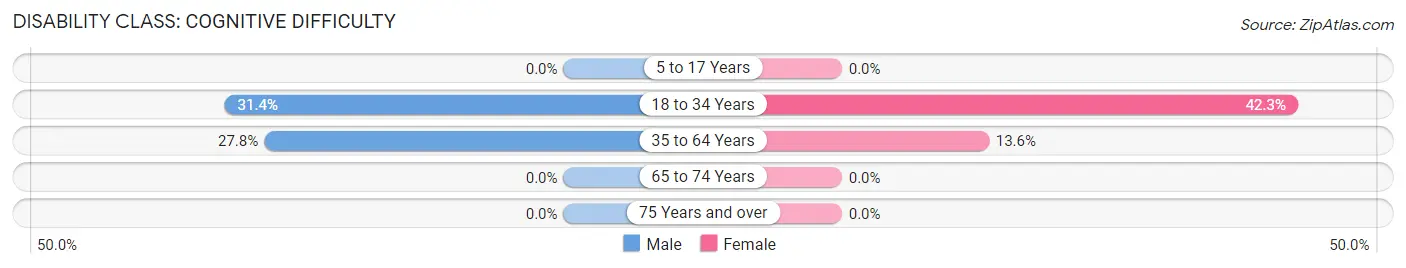
| Age Bracket | Male | Female |
| 5 to 17 Years | 0 (0.0%) | 0 (0.0%) |
| 18 to 34 Years | 11 (31.4%) | 11 (42.3%) |
| 35 to 64 Years | 20 (27.8%) | 9 (13.6%) |
| 65 to 74 Years | 0 (0.0%) | 0 (0.0%) |
| 75 Years and over | 0 (0.0%) | 0 (0.0%) |
Disability Class: Ambulatory Difficulty
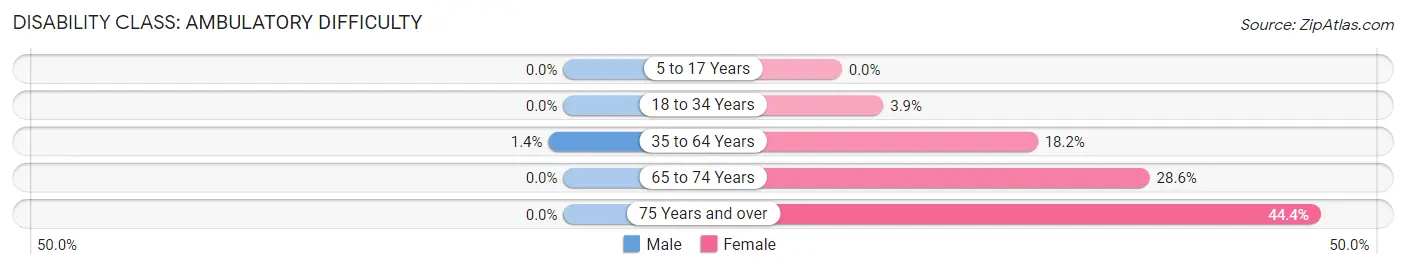
| Age Bracket | Male | Female |
| 5 to 17 Years | 0 (0.0%) | 0 (0.0%) |
| 18 to 34 Years | 0 (0.0%) | 1 (3.8%) |
| 35 to 64 Years | 1 (1.4%) | 12 (18.2%) |
| 65 to 74 Years | 0 (0.0%) | 4 (28.6%) |
| 75 Years and over | 0 (0.0%) | 8 (44.4%) |
Disability Class: Self-Care Difficulty
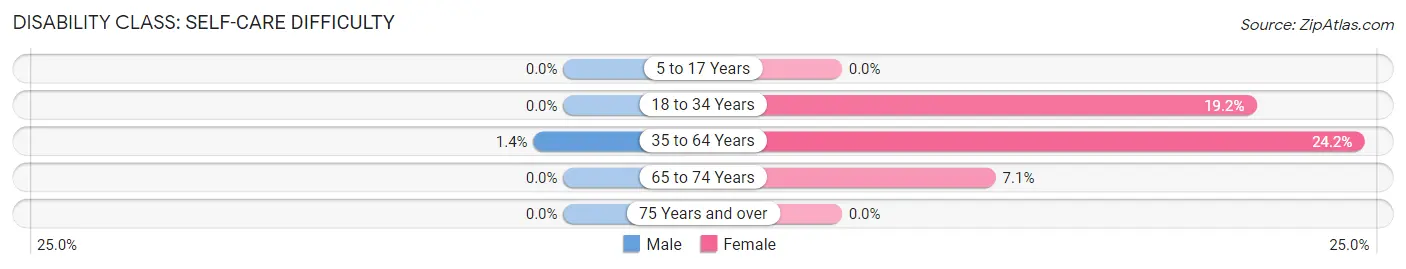
| Age Bracket | Male | Female |
| 5 to 17 Years | 0 (0.0%) | 0 (0.0%) |
| 18 to 34 Years | 0 (0.0%) | 5 (19.2%) |
| 35 to 64 Years | 1 (1.4%) | 16 (24.2%) |
| 65 to 74 Years | 0 (0.0%) | 1 (7.1%) |
| 75 Years and over | 0 (0.0%) | 0 (0.0%) |
Technology Access in Tenkiller
Computing Device Access in Tenkiller
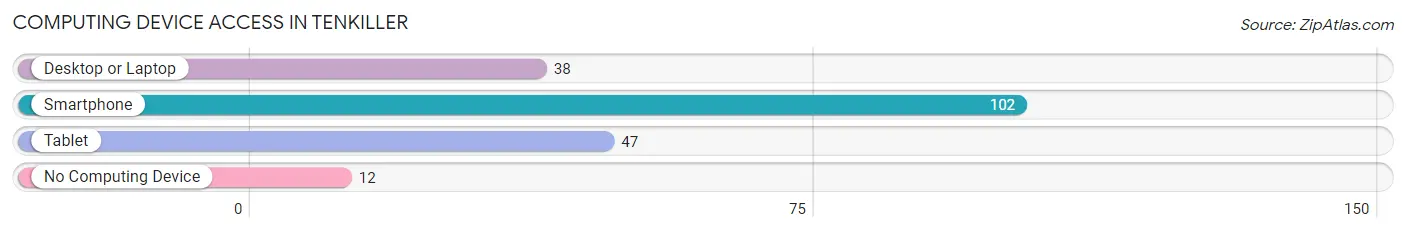
| Device Type | # Households | % Households |
| Desktop or Laptop | 38 | 31.1% |
| Smartphone | 102 | 83.6% |
| Tablet | 47 | 38.5% |
| No Computing Device | 12 | 9.8% |
| Total | 122 | 100.0% |
Internet Access in Tenkiller
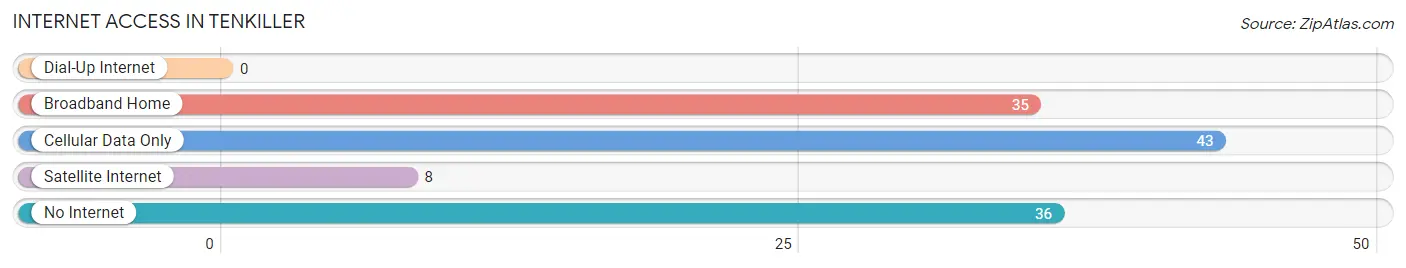
| Internet Type | # Households | % Households |
| Dial-Up Internet | 0 | 0.0% |
| Broadband Home | 35 | 28.7% |
| Cellular Data Only | 43 | 35.2% |
| Satellite Internet | 8 | 6.6% |
| No Internet | 36 | 29.5% |
| Total | 122 | 100.0% |
Tenkiller Summary
Tenkiller, Oklahoma is a small town located in Cherokee County, Oklahoma. It is situated on the banks of Tenkiller Lake, a 12,900-acre reservoir created by the U.S. Army Corps of Engineers in the 1940s. The town was named after the Tenkiller family, who were prominent members of the Cherokee Nation. Tenkiller is a rural community with a population of just over 500 people, according to the 2010 census.
Geography
Tenkiller is located in the foothills of the Ozark Mountains in northeastern Oklahoma. The town is situated on the banks of Tenkiller Lake, a 12,900-acre reservoir created by the U.S. Army Corps of Engineers in the 1940s. The lake is a popular destination for fishing, boating, and other recreational activities. The town is also located near the Illinois River, which is a popular spot for canoeing and kayaking.
The town is located in a rural area, with the nearest major city being Tulsa, which is about an hour away. The town is also close to the Arkansas border, with the nearest Arkansas city being Fort Smith, which is about an hour and a half away.
Economy
The economy of Tenkiller is largely based on tourism and agriculture. The town is a popular destination for fishing, boating, and other recreational activities. The town is also home to several farms, which produce a variety of crops, including corn, soybeans, and wheat.
The town is also home to several small businesses, including a grocery store, a hardware store, and a few restaurants. The town also has a post office and a library.
Demographics
According to the 2010 census, Tenkiller had a population of 514 people. The town is predominantly white, with the majority of the population being of European descent. The town also has a small Native American population, with the majority of the Native American population being of Cherokee descent.
The median household income in Tenkiller is $35,000, which is slightly lower than the national median of $50,000. The median age in Tenkiller is 44, which is slightly higher than the national median of 37.
Conclusion
Tenkiller, Oklahoma is a small rural town located in Cherokee County, Oklahoma. The town is situated on the banks of Tenkiller Lake, a 12,900-acre reservoir created by the U.S. Army Corps of Engineers in the 1940s. The town is a popular destination for fishing, boating, and other recreational activities. The town is also home to several farms, which produce a variety of crops, including corn, soybeans, and wheat. The town is predominantly white, with the majority of the population being of European descent. The median household income in Tenkiller is $35,000, which is slightly lower than the national median of $50,000.
Common Questions
What is Per Capita Income in Tenkiller?
Per Capita income in Tenkiller is $21,659.
What is the Median Family Income in Tenkiller?
Median Family Income in Tenkiller is $25,972.
What is the Median Household income in Tenkiller?
Median Household Income in Tenkiller is $26,389.
What is Income or Wage Gap in Tenkiller?
Income or Wage Gap in Tenkiller is 51.0%.
Women in Tenkiller earn 49.0 cents for every dollar earned by a man.
What is Inequality or Gini Index in Tenkiller?
Inequality or Gini Index in Tenkiller is 0.48.
What is the Total Population of Tenkiller?
Total Population of Tenkiller is 313.
What is the Total Male Population of Tenkiller?
Total Male Population of Tenkiller is 157.
What is the Total Female Population of Tenkiller?
Total Female Population of Tenkiller is 156.
What is the Ratio of Males per 100 Females in Tenkiller?
There are 100.64 Males per 100 Females in Tenkiller.
What is the Ratio of Females per 100 Males in Tenkiller?
There are 99.36 Females per 100 Males in Tenkiller.
What is the Median Population Age in Tenkiller?
Median Population Age in Tenkiller is 44.6 Years.
What is the Average Family Size in Tenkiller
Average Family Size in Tenkiller is 2.8 People.
What is the Average Household Size in Tenkiller
Average Household Size in Tenkiller is 2.0 People.
How Large is the Labor Force in Tenkiller?
There are 107 People in the Labor Forcein in Tenkiller.
What is the Percentage of People in the Labor Force in Tenkiller?
43.5% of People are in the Labor Force in Tenkiller.