Tahlequah, OK Map & Demographics
Tahlequah Map
Tahlequah Overview
$26,948
PER CAPITA INCOME
$68,194
AVG FAMILY INCOME
$49,444
AVG HOUSEHOLD INCOME
16.2%
WAGE / INCOME GAP [ % ]
83.8¢/ $1
WAGE / INCOME GAP [ $ ]
$11,874
FAMILY INCOME DEFICIT
0.50
INEQUALITY / GINI INDEX
16,389
TOTAL POPULATION
7,856
MALE POPULATION
8,533
FEMALE POPULATION
92.07
MALES / 100 FEMALES
108.62
FEMALES / 100 MALES
30.5
MEDIAN AGE
3.1
AVG FAMILY SIZE
2.3
AVG HOUSEHOLD SIZE
8,136
LABOR FORCE [ PEOPLE ]
60.2%
PERCENT IN LABOR FORCE
7.1%
UNEMPLOYMENT RATE
Tahlequah Zip Codes
Tahlequah Area Codes
Income in Tahlequah
Income Overview in Tahlequah
Per Capita Income in Tahlequah is $26,948, while median incomes of families and households are $68,194 and $49,444 respectively.
| Characteristic | Number | Measure |
| Per Capita Income | 16,389 | $26,948 |
| Median Family Income | 3,419 | $68,194 |
| Mean Family Income | 3,419 | $91,686 |
| Median Household Income | 6,274 | $49,444 |
| Mean Household Income | 6,274 | $67,684 |
| Income Deficit | 3,419 | $11,874 |
| Wage / Income Gap (%) | 16,389 | 16.20% |
| Wage / Income Gap ($) | 16,389 | 83.80¢ per $1 |
| Gini / Inequality Index | 16,389 | 0.50 |
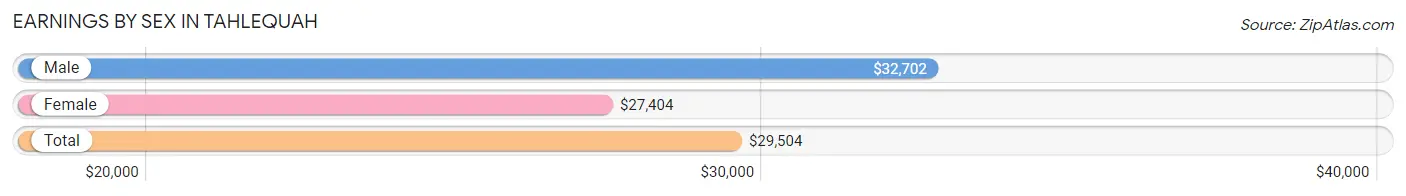
Earnings by Sex in Tahlequah
Average Earnings in Tahlequah are $29,504, $32,702 for men and $27,404 for women, a difference of 16.2%.
| Sex | Number | Average Earnings |
| Male | 4,310 (50.0%) | $32,702 |
| Female | 4,312 (50.0%) | $27,404 |
| Total | 8,622 (100.0%) | $29,504 |
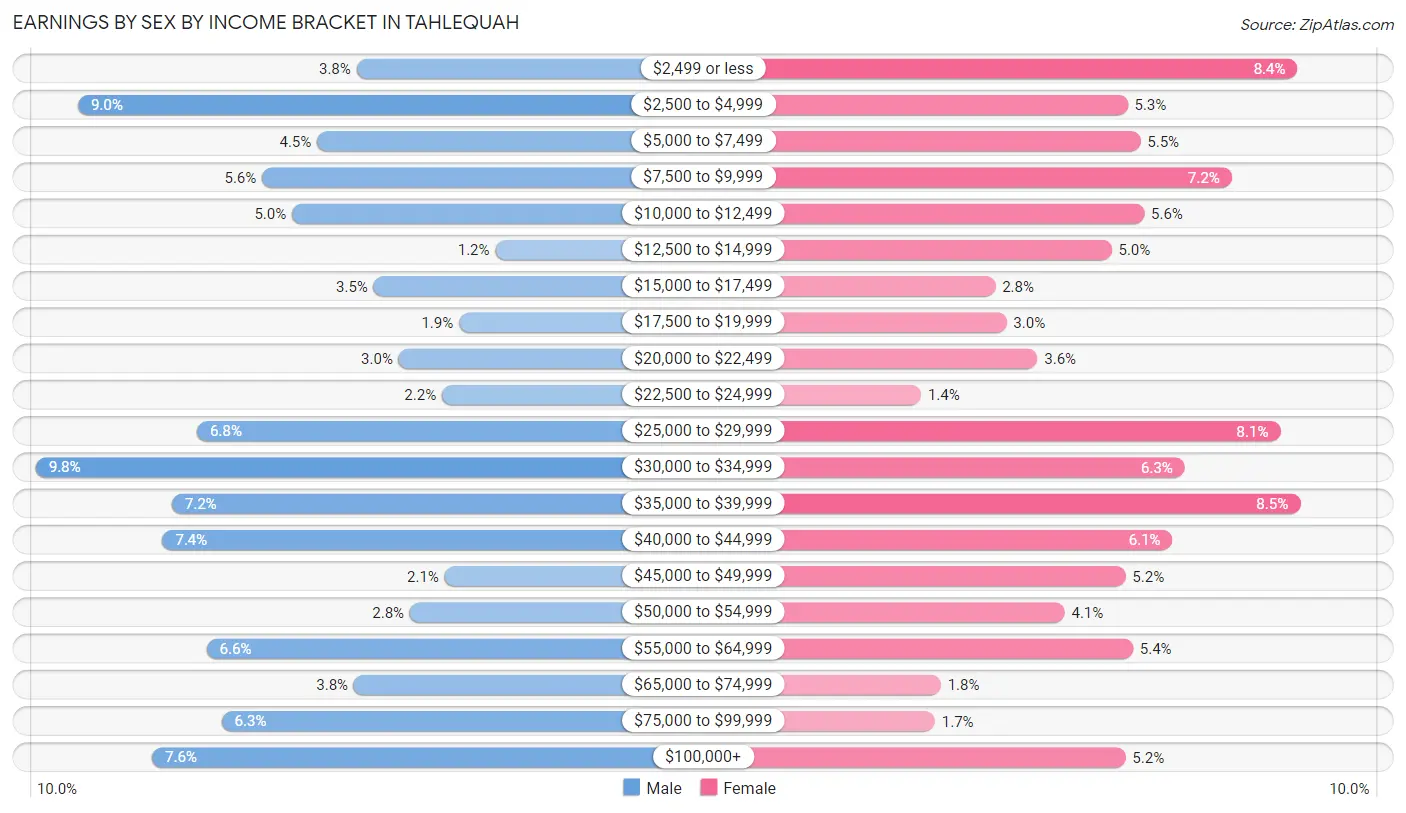
Earnings by Sex by Income Bracket in Tahlequah
The most common earnings brackets in Tahlequah are $30,000 to $34,999 for men (422 | 9.8%) and $35,000 to $39,999 for women (366 | 8.5%).
| Income | Male | Female |
| $2,499 or less | 163 (3.8%) | 364 (8.4%) |
| $2,500 to $4,999 | 388 (9.0%) | 227 (5.3%) |
| $5,000 to $7,499 | 195 (4.5%) | 237 (5.5%) |
| $7,500 to $9,999 | 239 (5.6%) | 311 (7.2%) |
| $10,000 to $12,499 | 215 (5.0%) | 240 (5.6%) |
| $12,500 to $14,999 | 51 (1.2%) | 214 (5.0%) |
| $15,000 to $17,499 | 149 (3.5%) | 120 (2.8%) |
| $17,500 to $19,999 | 80 (1.9%) | 129 (3.0%) |
| $20,000 to $22,499 | 129 (3.0%) | 154 (3.6%) |
| $22,500 to $24,999 | 94 (2.2%) | 60 (1.4%) |
| $25,000 to $29,999 | 292 (6.8%) | 350 (8.1%) |
| $30,000 to $34,999 | 422 (9.8%) | 273 (6.3%) |
| $35,000 to $39,999 | 312 (7.2%) | 366 (8.5%) |
| $40,000 to $44,999 | 320 (7.4%) | 263 (6.1%) |
| $45,000 to $49,999 | 92 (2.1%) | 225 (5.2%) |
| $50,000 to $54,999 | 120 (2.8%) | 176 (4.1%) |
| $55,000 to $64,999 | 284 (6.6%) | 231 (5.4%) |
| $65,000 to $74,999 | 165 (3.8%) | 76 (1.8%) |
| $75,000 to $99,999 | 272 (6.3%) | 71 (1.7%) |
| $100,000+ | 328 (7.6%) | 225 (5.2%) |
| Total | 4,310 (100.0%) | 4,312 (100.0%) |
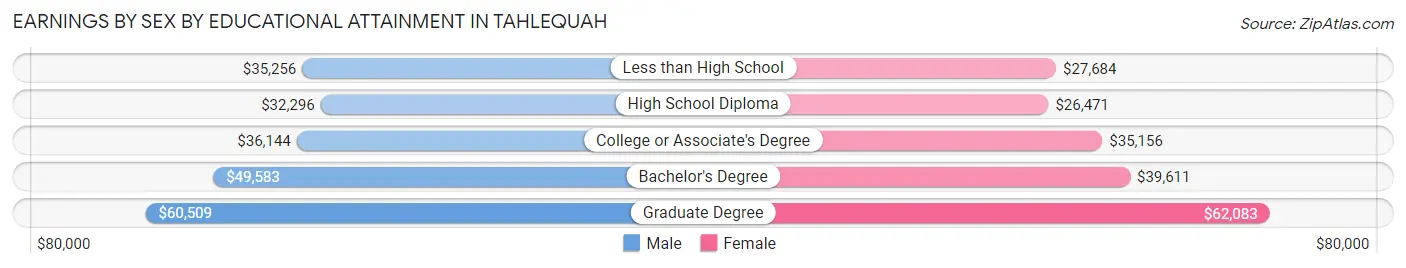
Earnings by Sex by Educational Attainment in Tahlequah
Average earnings in Tahlequah are $40,672 for men and $36,969 for women, a difference of 9.1%. Men with an educational attainment of graduate degree enjoy the highest average annual earnings of $60,509, while those with high school diploma education earn the least with $32,296. Women with an educational attainment of graduate degree earn the most with the average annual earnings of $62,083, while those with high school diploma education have the smallest earnings of $26,471.
| Educational Attainment | Male Income | Female Income |
| Less than High School | $35,256 | $27,684 |
| High School Diploma | $32,296 | $26,471 |
| College or Associate's Degree | $36,144 | $35,156 |
| Bachelor's Degree | $49,583 | $39,611 |
| Graduate Degree | $60,509 | $62,083 |
| Total | $40,672 | $36,969 |
Family Income in Tahlequah
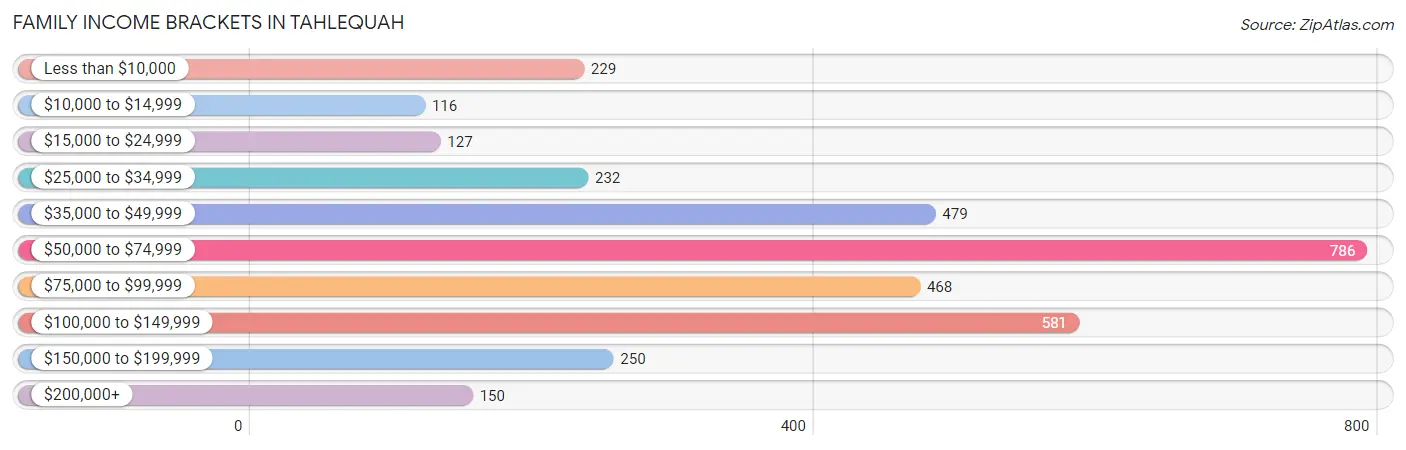
Family Income Brackets in Tahlequah
According to the Tahlequah family income data, there are 786 families falling into the $50,000 to $74,999 income range, which is the most common income bracket and makes up 23.0% of all families. Conversely, the $10,000 to $14,999 income bracket is the least frequent group with only 116 families (3.4%) belonging to this category.
| Income Bracket | # Families | % Families |
| Less than $10,000 | 229 | 6.7% |
| $10,000 to $14,999 | 116 | 3.4% |
| $15,000 to $24,999 | 127 | 3.7% |
| $25,000 to $34,999 | 232 | 6.8% |
| $35,000 to $49,999 | 479 | 14.0% |
| $50,000 to $74,999 | 786 | 23.0% |
| $75,000 to $99,999 | 468 | 13.7% |
| $100,000 to $149,999 | 581 | 17.0% |
| $150,000 to $199,999 | 250 | 7.3% |
| $200,000+ | 150 | 4.4% |
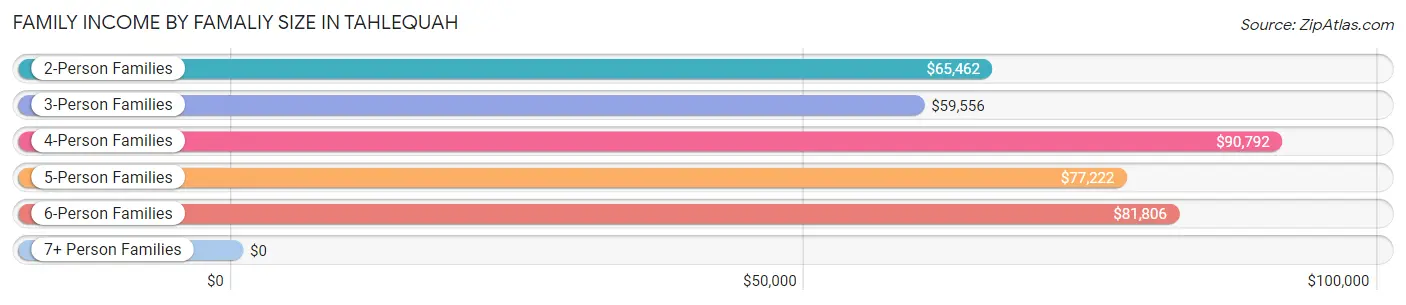
Family Income by Famaliy Size in Tahlequah
4-person families (557 | 16.3%) account for the highest median family income in Tahlequah with $90,792 per family, while 2-person families (1,765 | 51.6%) have the highest median income of $32,731 per family member.
| Income Bracket | # Families | Median Income |
| 2-Person Families | 1,765 (51.6%) | $65,462 |
| 3-Person Families | 713 (20.8%) | $59,556 |
| 4-Person Families | 557 (16.3%) | $90,792 |
| 5-Person Families | 204 (6.0%) | $77,222 |
| 6-Person Families | 129 (3.8%) | $81,806 |
| 7+ Person Families | 51 (1.5%) | $0 |
| Total | 3,419 (100.0%) | $68,194 |
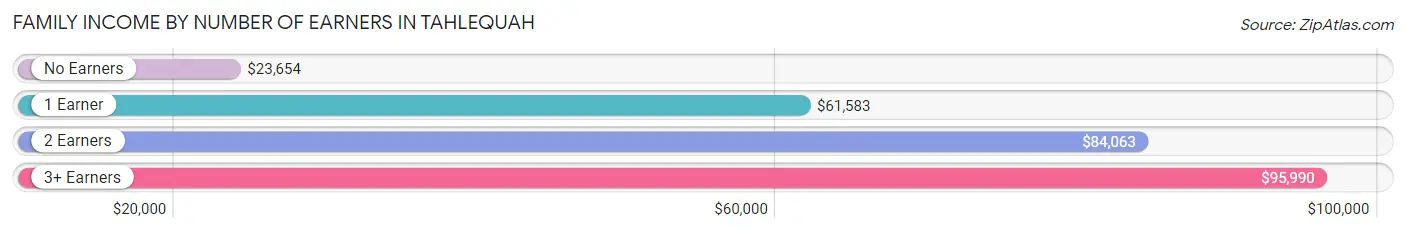
Family Income by Number of Earners in Tahlequah
The median family income in Tahlequah is $68,194, with families comprising 3+ earners (281) having the highest median family income of $95,990, while families with no earners (548) have the lowest median family income of $23,654, accounting for 8.2% and 16.0% of families, respectively.
| Number of Earners | # Families | Median Income |
| No Earners | 548 (16.0%) | $23,654 |
| 1 Earner | 1,335 (39.1%) | $61,583 |
| 2 Earners | 1,255 (36.7%) | $84,063 |
| 3+ Earners | 281 (8.2%) | $95,990 |
| Total | 3,419 (100.0%) | $68,194 |
Household Income in Tahlequah
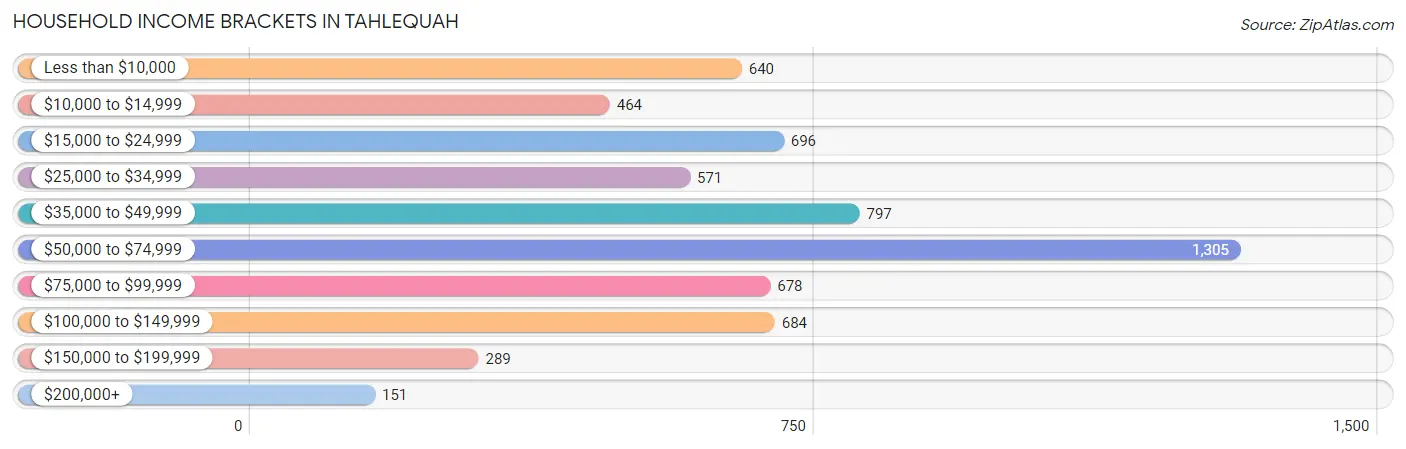
Household Income Brackets in Tahlequah
With 1,305 households falling in the category, the $50,000 to $74,999 income range is the most frequent in Tahlequah, accounting for 20.8% of all households. In contrast, only 151 households (2.4%) fall into the $200,000+ income bracket, making it the least populous group.
| Income Bracket | # Households | % Households |
| Less than $10,000 | 640 | 10.2% |
| $10,000 to $14,999 | 464 | 7.4% |
| $15,000 to $24,999 | 696 | 11.1% |
| $25,000 to $34,999 | 571 | 9.1% |
| $35,000 to $49,999 | 797 | 12.7% |
| $50,000 to $74,999 | 1,305 | 20.8% |
| $75,000 to $99,999 | 678 | 10.8% |
| $100,000 to $149,999 | 684 | 10.9% |
| $150,000 to $199,999 | 289 | 4.6% |
| $200,000+ | 151 | 2.4% |
Household Income by Householder Age in Tahlequah
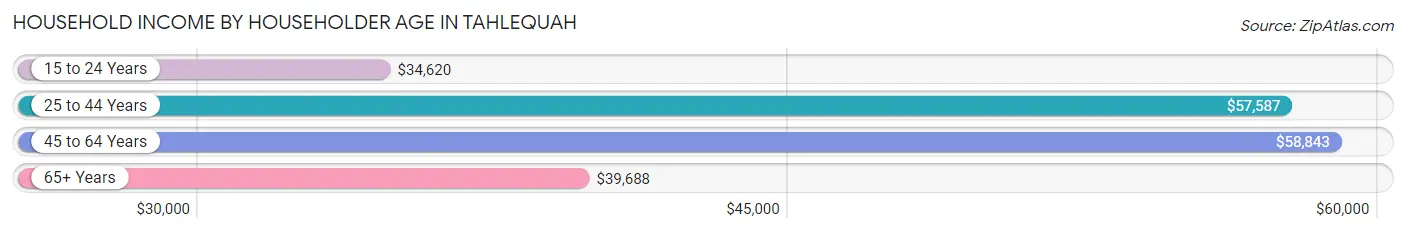
The median household income in Tahlequah is $49,444, with the highest median household income of $58,843 found in the 45 to 64 years age bracket for the primary householder. A total of 1,561 households (24.9%) fall into this category. Meanwhile, the 15 to 24 years age bracket for the primary householder has the lowest median household income of $34,620, with 949 households (15.1%) in this group.
| Income Bracket | # Households | Median Income |
| 15 to 24 Years | 949 (15.1%) | $34,620 |
| 25 to 44 Years | 2,161 (34.4%) | $57,587 |
| 45 to 64 Years | 1,561 (24.9%) | $58,843 |
| 65+ Years | 1,603 (25.6%) | $39,688 |
| Total | 6,274 (100.0%) | $49,444 |
Poverty in Tahlequah
Income Below Poverty by Sex and Age in Tahlequah
With 20.4% poverty level for males and 21.1% for females among the residents of Tahlequah, 16 and 17 year old males and 18 to 24 year old females are the most vulnerable to poverty, with 68 males (46.0%) and 565 females (40.7%) in their respective age groups living below the poverty level.
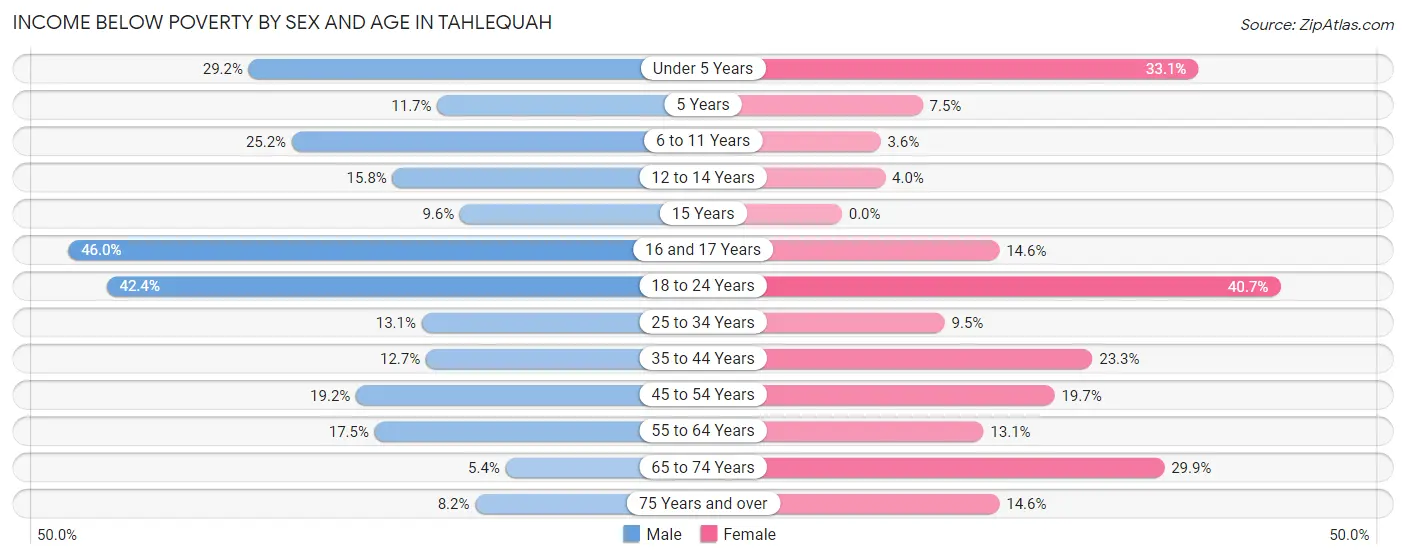
| Age Bracket | Male | Female |
| Under 5 Years | 108 (29.2%) | 124 (33.1%) |
| 5 Years | 9 (11.7%) | 9 (7.5%) |
| 6 to 11 Years | 134 (25.2%) | 15 (3.6%) |
| 12 to 14 Years | 54 (15.8%) | 14 (4.0%) |
| 15 Years | 14 (9.6%) | 0 (0.0%) |
| 16 and 17 Years | 68 (46.0%) | 26 (14.6%) |
| 18 to 24 Years | 476 (42.4%) | 565 (40.7%) |
| 25 to 34 Years | 138 (13.1%) | 91 (9.5%) |
| 35 to 44 Years | 119 (12.7%) | 269 (23.3%) |
| 45 to 54 Years | 145 (19.2%) | 122 (19.7%) |
| 55 to 64 Years | 91 (17.5%) | 102 (13.1%) |
| 65 to 74 Years | 28 (5.3%) | 190 (29.9%) |
| 75 Years and over | 37 (8.2%) | 100 (14.6%) |
| Total | 1,421 (20.4%) | 1,627 (21.1%) |
Income Above Poverty by Sex and Age in Tahlequah
According to the poverty statistics in Tahlequah, males aged 65 to 74 years and females aged 15 years are the age groups that are most secure financially, with 94.7% of males and 100.0% of females in these age groups living above the poverty line.
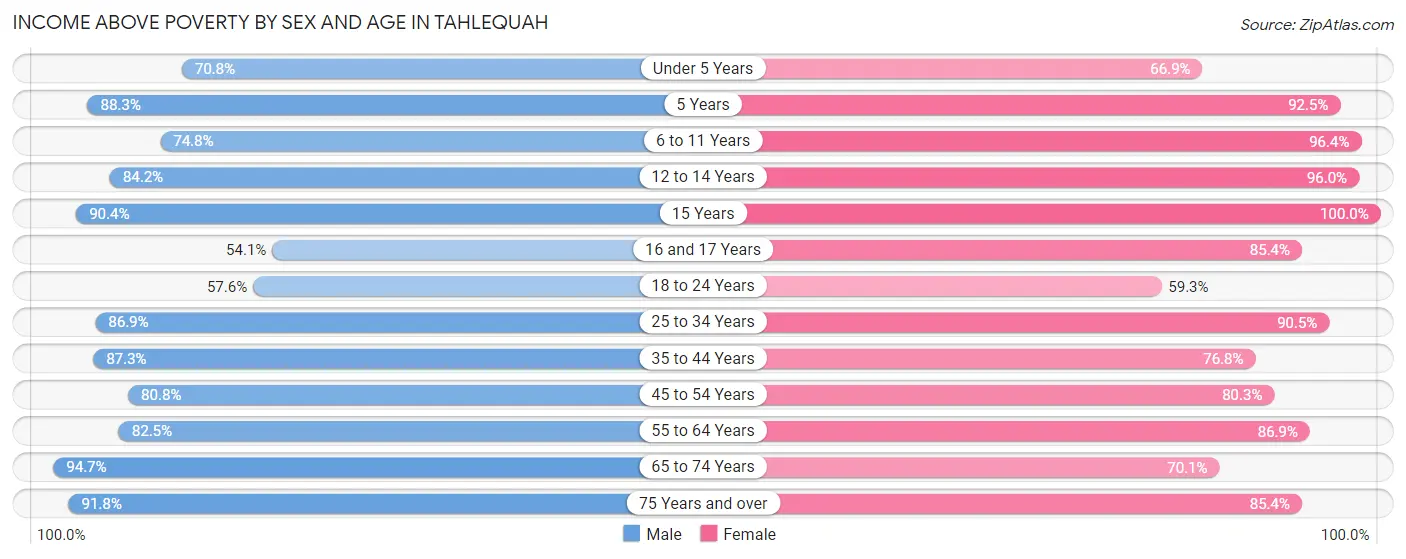
| Age Bracket | Male | Female |
| Under 5 Years | 262 (70.8%) | 251 (66.9%) |
| 5 Years | 68 (88.3%) | 111 (92.5%) |
| 6 to 11 Years | 398 (74.8%) | 403 (96.4%) |
| 12 to 14 Years | 287 (84.2%) | 334 (96.0%) |
| 15 Years | 132 (90.4%) | 71 (100.0%) |
| 16 and 17 Years | 80 (54.0%) | 152 (85.4%) |
| 18 to 24 Years | 647 (57.6%) | 824 (59.3%) |
| 25 to 34 Years | 912 (86.9%) | 863 (90.5%) |
| 35 to 44 Years | 815 (87.3%) | 888 (76.7%) |
| 45 to 54 Years | 609 (80.8%) | 496 (80.3%) |
| 55 to 64 Years | 429 (82.5%) | 674 (86.9%) |
| 65 to 74 Years | 495 (94.7%) | 445 (70.1%) |
| 75 Years and over | 416 (91.8%) | 584 (85.4%) |
| Total | 5,550 (79.6%) | 6,096 (78.9%) |
Income Below Poverty Among Married-Couple Families in Tahlequah
The poverty statistics for married-couple families in Tahlequah show that 3.4% or 80 of the total 2,343 families live below the poverty line. Families with 1 or 2 children have the highest poverty rate of 7.4%, comprising of 56 families. On the other hand, families with 3 or 4 children have the lowest poverty rate of 0.0%, which includes 0 families.
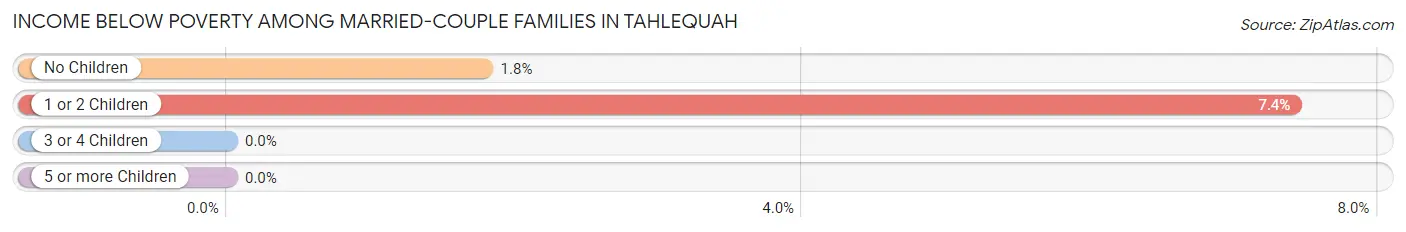
| Children | Above Poverty | Below Poverty |
| No Children | 1,321 (98.2%) | 24 (1.8%) |
| 1 or 2 Children | 700 (92.6%) | 56 (7.4%) |
| 3 or 4 Children | 201 (100.0%) | 0 (0.0%) |
| 5 or more Children | 41 (100.0%) | 0 (0.0%) |
| Total | 2,263 (96.6%) | 80 (3.4%) |
Income Below Poverty Among Single-Parent Households in Tahlequah
According to the poverty data in Tahlequah, 17.7% or 50 single-father households and 39.2% or 311 single-mother households are living below the poverty line. Among single-father households, those with 1 or 2 children have the highest poverty rate, with 21 households (23.3%) experiencing poverty. Likewise, among single-mother households, those with 3 or 4 children have the highest poverty rate, with 30 households (81.1%) falling below the poverty line.
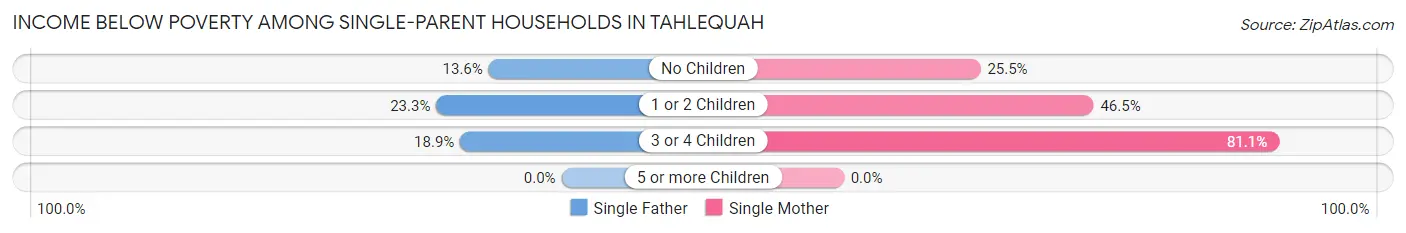
| Children | Single Father | Single Mother |
| No Children | 19 (13.6%) | 80 (25.5%) |
| 1 or 2 Children | 21 (23.3%) | 201 (46.5%) |
| 3 or 4 Children | 10 (18.9%) | 30 (81.1%) |
| 5 or more Children | 0 (0.0%) | 0 (0.0%) |
| Total | 50 (17.7%) | 311 (39.2%) |
Income Below Poverty Among Married-Couple vs Single-Parent Households in Tahlequah
The poverty data for Tahlequah shows that 80 of the married-couple family households (3.4%) and 361 of the single-parent households (33.6%) are living below the poverty level. Within the married-couple family households, those with 1 or 2 children have the highest poverty rate, with 56 households (7.4%) falling below the poverty line. Among the single-parent households, those with 3 or 4 children have the highest poverty rate, with 40 household (44.4%) living below poverty.
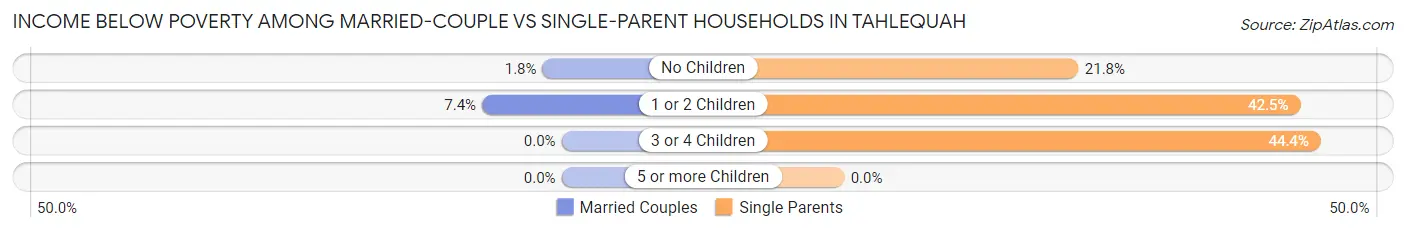
| Children | Married-Couple Families | Single-Parent Households |
| No Children | 24 (1.8%) | 99 (21.8%) |
| 1 or 2 Children | 56 (7.4%) | 222 (42.5%) |
| 3 or 4 Children | 0 (0.0%) | 40 (44.4%) |
| 5 or more Children | 0 (0.0%) | 0 (0.0%) |
| Total | 80 (3.4%) | 361 (33.6%) |
Race in Tahlequah
The most populous races in Tahlequah are White / Caucasian (7,960 | 48.6%), Native / Alaskan (4,920 | 30.0%), and Two or more Races (2,618 | 16.0%).
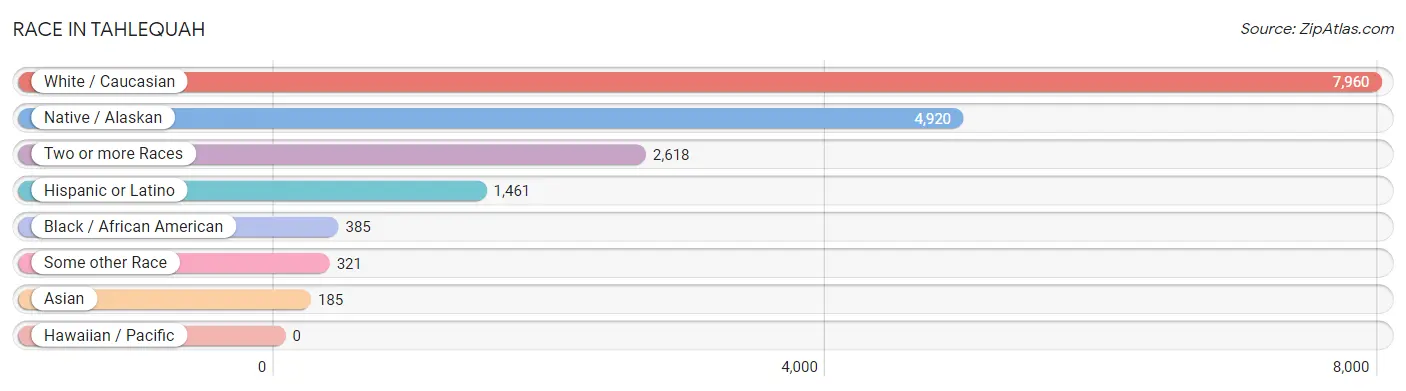
| Race | # Population | % Population |
| Asian | 185 | 1.1% |
| Black / African American | 385 | 2.4% |
| Hawaiian / Pacific | 0 | 0.0% |
| Hispanic or Latino | 1,461 | 8.9% |
| Native / Alaskan | 4,920 | 30.0% |
| White / Caucasian | 7,960 | 48.6% |
| Two or more Races | 2,618 | 16.0% |
| Some other Race | 321 | 2.0% |
| Total | 16,389 | 100.0% |
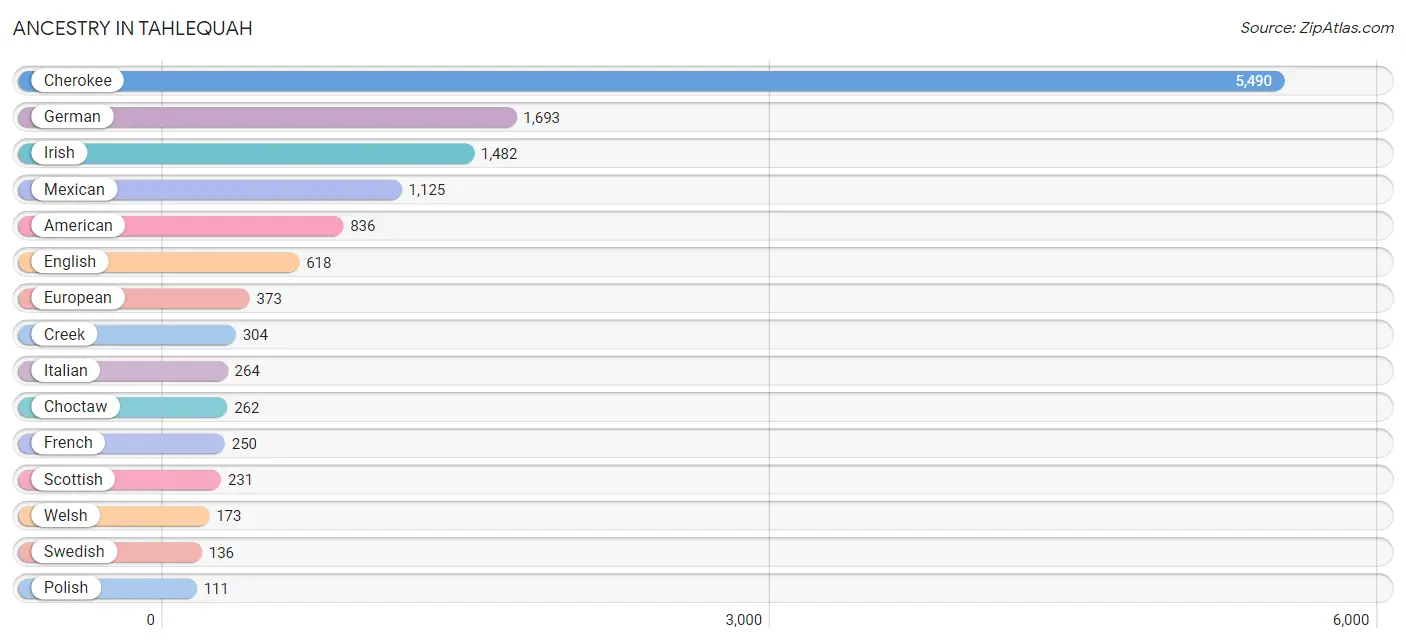
Ancestry in Tahlequah
The most populous ancestries reported in Tahlequah are Cherokee (5,490 | 33.5%), German (1,693 | 10.3%), Irish (1,482 | 9.0%), Mexican (1,125 | 6.9%), and American (836 | 5.1%), together accounting for 64.8% of all Tahlequah residents.
| Ancestry | # Population | % Population |
| African | 9 | 0.1% |
| Aleut | 12 | 0.1% |
| American | 836 | 5.1% |
| Apache | 33 | 0.2% |
| Armenian | 7 | 0.0% |
| Belizean | 18 | 0.1% |
| Bhutanese | 47 | 0.3% |
| Blackfeet | 21 | 0.1% |
| British | 54 | 0.3% |
| Burmese | 36 | 0.2% |
| Canadian | 12 | 0.1% |
| Central American | 30 | 0.2% |
| Cherokee | 5,490 | 33.5% |
| Chickasaw | 102 | 0.6% |
| Chippewa | 78 | 0.5% |
| Choctaw | 262 | 1.6% |
| Colville | 30 | 0.2% |
| Comanche | 10 | 0.1% |
| Creek | 304 | 1.8% |
| Czech | 31 | 0.2% |
| Czechoslovakian | 14 | 0.1% |
| Danish | 39 | 0.2% |
| Delaware | 47 | 0.3% |
| Dutch | 58 | 0.4% |
| Eastern European | 43 | 0.3% |
| English | 618 | 3.8% |
| European | 373 | 2.3% |
| Finnish | 25 | 0.2% |
| French | 250 | 1.5% |
| French Canadian | 10 | 0.1% |
| German | 1,693 | 10.3% |
| German Russian | 12 | 0.1% |
| Guamanian / Chamorro | 48 | 0.3% |
| Guatemalan | 30 | 0.2% |
| Indian (Asian) | 40 | 0.2% |
| Irish | 1,482 | 9.0% |
| Italian | 264 | 1.6% |
| Kiowa | 99 | 0.6% |
| Korean | 60 | 0.4% |
| Lithuanian | 12 | 0.1% |
| Mexican | 1,125 | 6.9% |
| Navajo | 15 | 0.1% |
| Norwegian | 107 | 0.6% |
| Osage | 66 | 0.4% |
| Polish | 111 | 0.7% |
| Potawatomi | 13 | 0.1% |
| Puerto Rican | 102 | 0.6% |
| Romanian | 11 | 0.1% |
| Scandinavian | 45 | 0.3% |
| Scotch-Irish | 97 | 0.6% |
| Scottish | 231 | 1.4% |
| Seminole | 17 | 0.1% |
| Spaniard | 81 | 0.5% |
| Spanish | 27 | 0.2% |
| Sri Lankan | 72 | 0.4% |
| Subsaharan African | 9 | 0.1% |
| Swedish | 136 | 0.8% |
| Swiss | 30 | 0.2% |
| Tohono O'Odham | 20 | 0.1% |
| Tongan | 56 | 0.3% |
| Welsh | 173 | 1.1% |
| West Indian | 48 | 0.3% | View All 62 Rows |
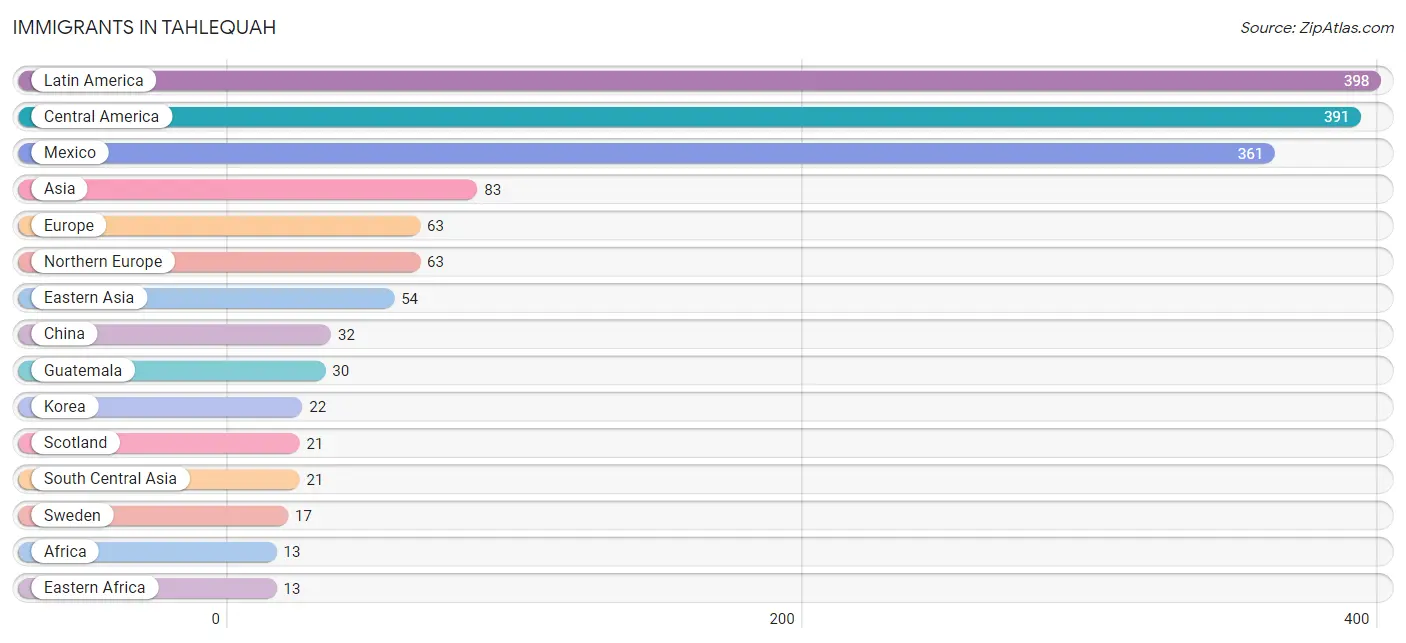
Immigrants in Tahlequah
The most numerous immigrant groups reported in Tahlequah came from Latin America (398 | 2.4%), Central America (391 | 2.4%), Mexico (361 | 2.2%), Asia (83 | 0.5%), and Europe (63 | 0.4%), together accounting for 7.9% of all Tahlequah residents.
| Immigration Origin | # Population | % Population |
| Africa | 13 | 0.1% |
| Asia | 83 | 0.5% |
| Caribbean | 7 | 0.0% |
| Central America | 391 | 2.4% |
| China | 32 | 0.2% |
| Eastern Africa | 13 | 0.1% |
| Eastern Asia | 54 | 0.3% |
| Europe | 63 | 0.4% |
| Guatemala | 30 | 0.2% |
| Kenya | 13 | 0.1% |
| Korea | 22 | 0.1% |
| Latin America | 398 | 2.4% |
| Mexico | 361 | 2.2% |
| Nepal | 11 | 0.1% |
| Northern Europe | 63 | 0.4% |
| Pakistan | 10 | 0.1% |
| Scotland | 21 | 0.1% |
| South Central Asia | 21 | 0.1% |
| South Eastern Asia | 8 | 0.1% |
| Sweden | 17 | 0.1% |
| Trinidad and Tobago | 7 | 0.0% |
| Vietnam | 8 | 0.1% | View All 22 Rows |
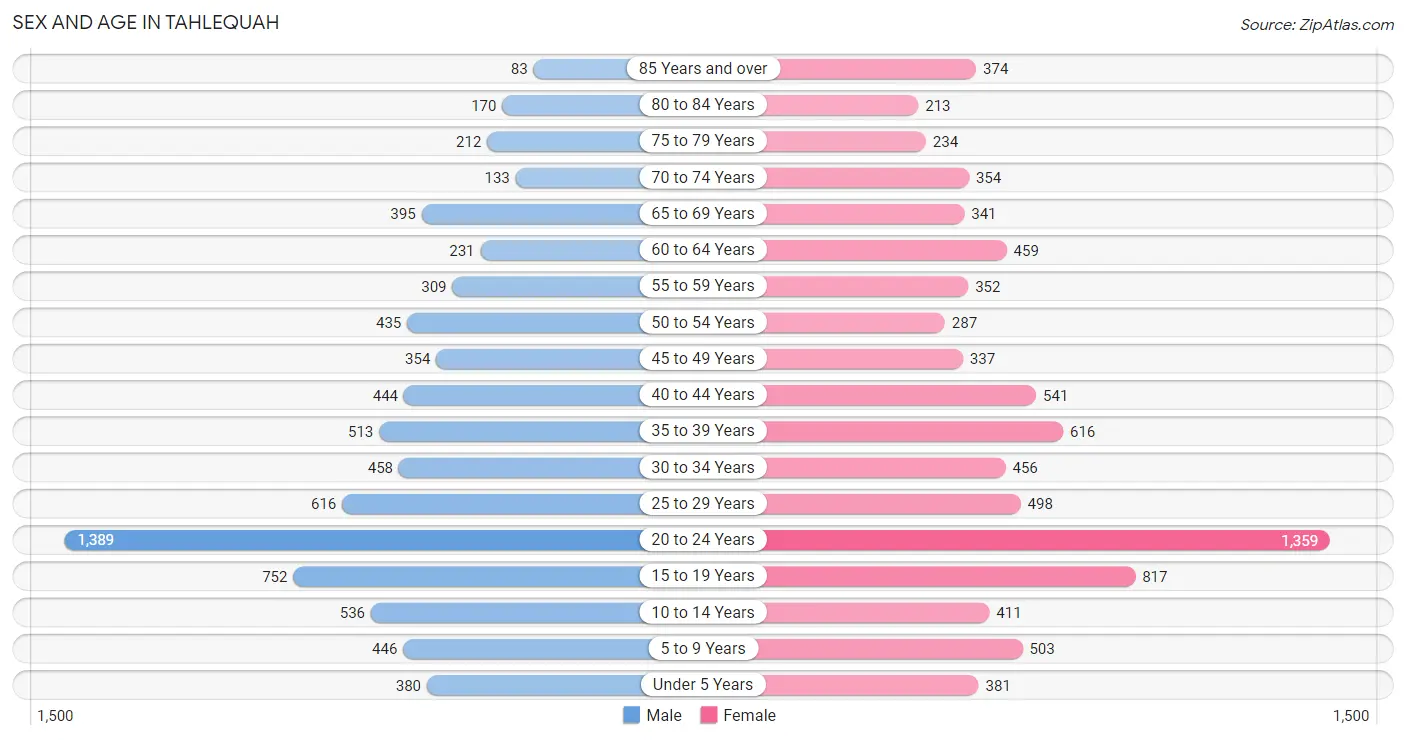
Sex and Age in Tahlequah
Sex and Age in Tahlequah
The most populous age groups in Tahlequah are 20 to 24 Years (1,389 | 17.7%) for men and 20 to 24 Years (1,359 | 15.9%) for women.
| Age Bracket | Male | Female |
| Under 5 Years | 380 (4.8%) | 381 (4.5%) |
| 5 to 9 Years | 446 (5.7%) | 503 (5.9%) |
| 10 to 14 Years | 536 (6.8%) | 411 (4.8%) |
| 15 to 19 Years | 752 (9.6%) | 817 (9.6%) |
| 20 to 24 Years | 1,389 (17.7%) | 1,359 (15.9%) |
| 25 to 29 Years | 616 (7.8%) | 498 (5.8%) |
| 30 to 34 Years | 458 (5.8%) | 456 (5.3%) |
| 35 to 39 Years | 513 (6.5%) | 616 (7.2%) |
| 40 to 44 Years | 444 (5.7%) | 541 (6.3%) |
| 45 to 49 Years | 354 (4.5%) | 337 (4.0%) |
| 50 to 54 Years | 435 (5.5%) | 287 (3.4%) |
| 55 to 59 Years | 309 (3.9%) | 352 (4.1%) |
| 60 to 64 Years | 231 (2.9%) | 459 (5.4%) |
| 65 to 69 Years | 395 (5.0%) | 341 (4.0%) |
| 70 to 74 Years | 133 (1.7%) | 354 (4.2%) |
| 75 to 79 Years | 212 (2.7%) | 234 (2.7%) |
| 80 to 84 Years | 170 (2.2%) | 213 (2.5%) |
| 85 Years and over | 83 (1.1%) | 374 (4.4%) |
| Total | 7,856 (100.0%) | 8,533 (100.0%) |
Families and Households in Tahlequah
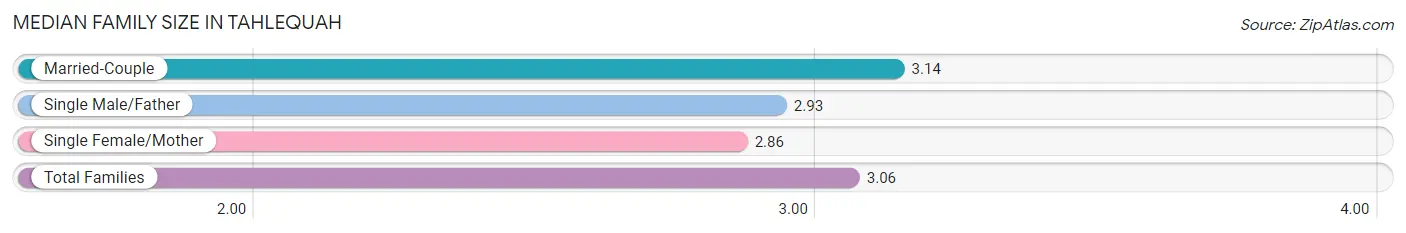
Median Family Size in Tahlequah
The median family size in Tahlequah is 3.06 persons per family, with married-couple families (2,343 | 68.5%) accounting for the largest median family size of 3.14 persons per family. On the other hand, single female/mother families (793 | 23.2%) represent the smallest median family size with 2.86 persons per family.
| Family Type | # Families | Family Size |
| Married-Couple | 2,343 (68.5%) | 3.14 |
| Single Male/Father | 283 (8.3%) | 2.93 |
| Single Female/Mother | 793 (23.2%) | 2.86 |
| Total Families | 3,419 (100.0%) | 3.06 |
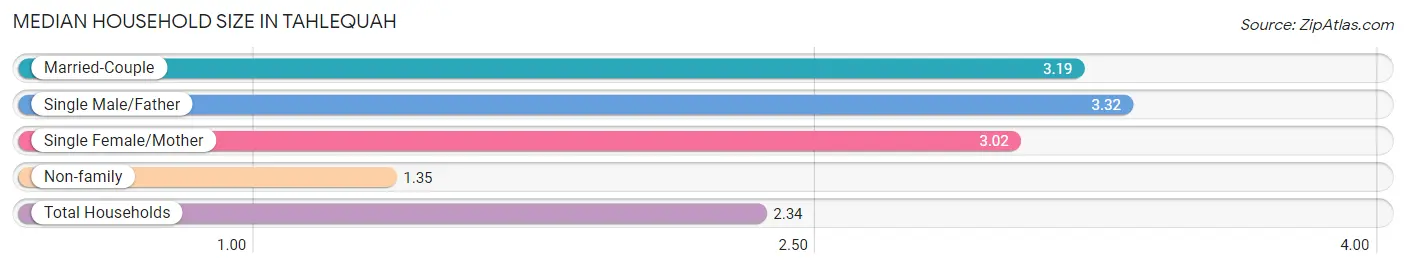
Median Household Size in Tahlequah
The median household size in Tahlequah is 2.34 persons per household, with single male/father households (283 | 4.5%) accounting for the largest median household size of 3.32 persons per household. non-family households (2,855 | 45.5%) represent the smallest median household size with 1.35 persons per household.
| Household Type | # Households | Household Size |
| Married-Couple | 2,343 (37.3%) | 3.19 |
| Single Male/Father | 283 (4.5%) | 3.32 |
| Single Female/Mother | 793 (12.6%) | 3.02 |
| Non-family | 2,855 (45.5%) | 1.35 |
| Total Households | 6,274 (100.0%) | 2.34 |
Household Size by Marriage Status in Tahlequah
Out of a total of 6,274 households in Tahlequah, 3,419 (54.5%) are family households, while 2,855 (45.5%) are nonfamily households. The most numerous type of family households are 2-person households, comprising 1,676, and the most common type of nonfamily households are 1-person households, comprising 2,205.
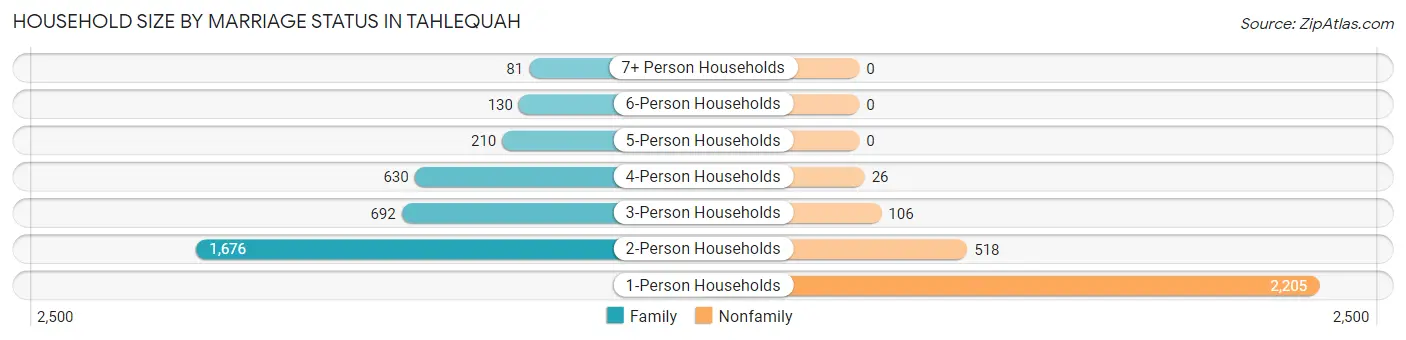
| Household Size | Family Households | Nonfamily Households |
| 1-Person Households | - | 2,205 (35.1%) |
| 2-Person Households | 1,676 (26.7%) | 518 (8.3%) |
| 3-Person Households | 692 (11.0%) | 106 (1.7%) |
| 4-Person Households | 630 (10.0%) | 26 (0.4%) |
| 5-Person Households | 210 (3.4%) | 0 (0.0%) |
| 6-Person Households | 130 (2.1%) | 0 (0.0%) |
| 7+ Person Households | 81 (1.3%) | 0 (0.0%) |
| Total | 3,419 (54.5%) | 2,855 (45.5%) |
Female Fertility in Tahlequah
Fertility by Age in Tahlequah
Average fertility rate in Tahlequah is 41.0 births per 1,000 women. Women in the age bracket of 35 to 50 years have the highest fertility rate with 60.0 births per 1,000 women. Women in the age bracket of 35 to 50 years acount for 47.6% of all women with births.
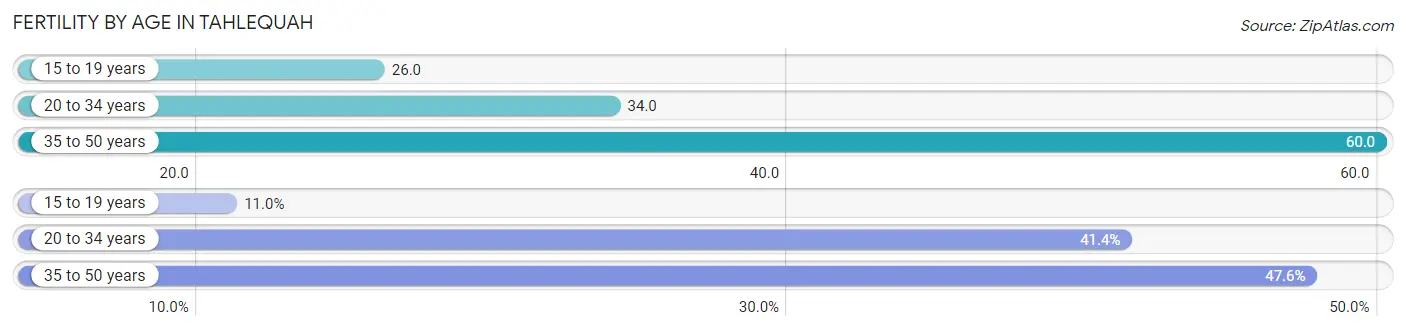
| Age Bracket | Women with Births | Births / 1,000 Women |
| 15 to 19 years | 21 (11.0%) | 26.0 |
| 20 to 34 years | 79 (41.4%) | 34.0 |
| 35 to 50 years | 91 (47.6%) | 60.0 |
| Total | 191 (100.0%) | 41.0 |
Fertility by Age by Marriage Status in Tahlequah
45.5% of women with births (191) in Tahlequah are married. The highest percentage of unmarried women with births falls into 15 to 19 years age bracket with 100.0% of them unmarried at the time of birth, while the lowest percentage of unmarried women with births belong to 20 to 34 years age bracket with 31.7% of them unmarried.
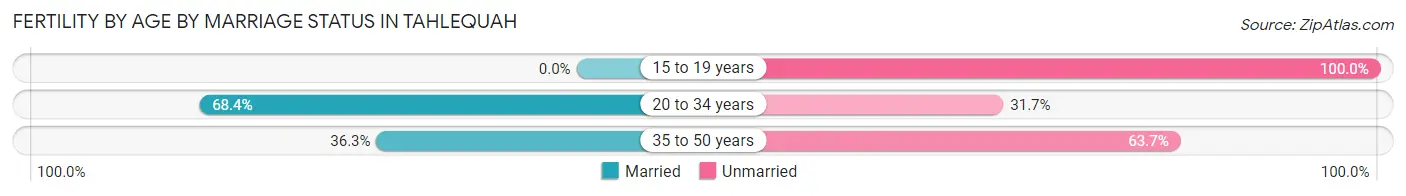
| Age Bracket | Married | Unmarried |
| 15 to 19 years | 0 (0.0%) | 21 (100.0%) |
| 20 to 34 years | 54 (68.3%) | 25 (31.7%) |
| 35 to 50 years | 33 (36.3%) | 58 (63.7%) |
| Total | 87 (45.6%) | 104 (54.4%) |
Fertility by Education in Tahlequah
Average fertility rate in Tahlequah is 41.0 births per 1,000 women. Women with the education attainment of graduate degree have the highest fertility rate of 82.0 births per 1,000 women, while women with the education attainment of less than high school have the lowest fertility at 16.0 births per 1,000 women. Women with the education attainment of high school diploma represent 33.0% of all women with births.
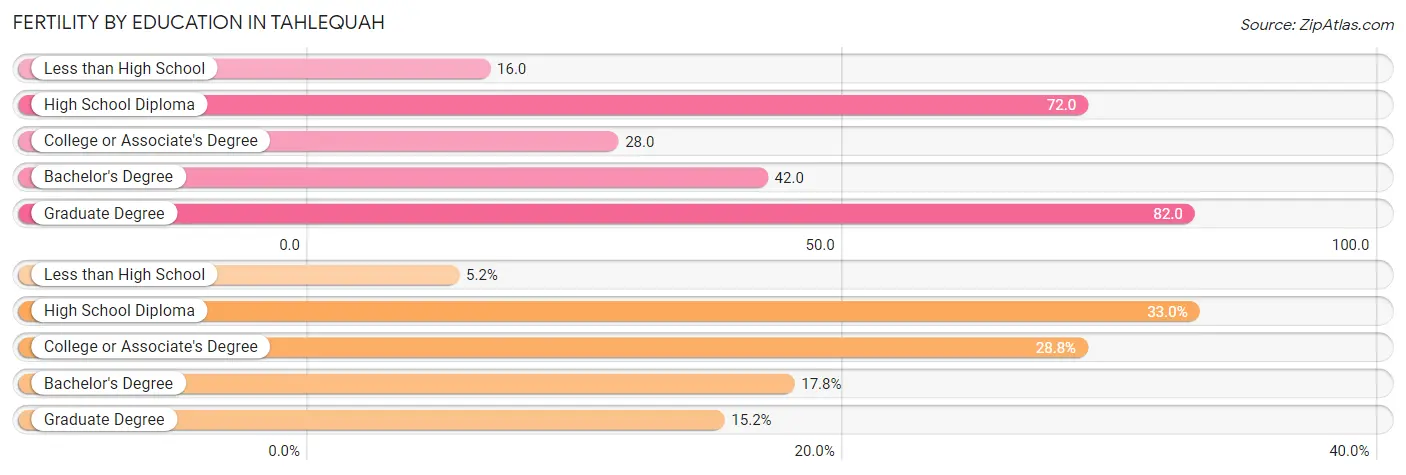
| Educational Attainment | Women with Births | Births / 1,000 Women |
| Less than High School | 10 (5.2%) | 16.0 |
| High School Diploma | 63 (33.0%) | 72.0 |
| College or Associate's Degree | 55 (28.8%) | 28.0 |
| Bachelor's Degree | 34 (17.8%) | 42.0 |
| Graduate Degree | 29 (15.2%) | 82.0 |
| Total | 191 (100.0%) | 41.0 |
Fertility by Education by Marriage Status in Tahlequah
54.4% of women with births in Tahlequah are unmarried. Women with the educational attainment of graduate degree are most likely to be married with 100.0% of them married at childbirth, while women with the educational attainment of less than high school are least likely to be married with 100.0% of them unmarried at childbirth.
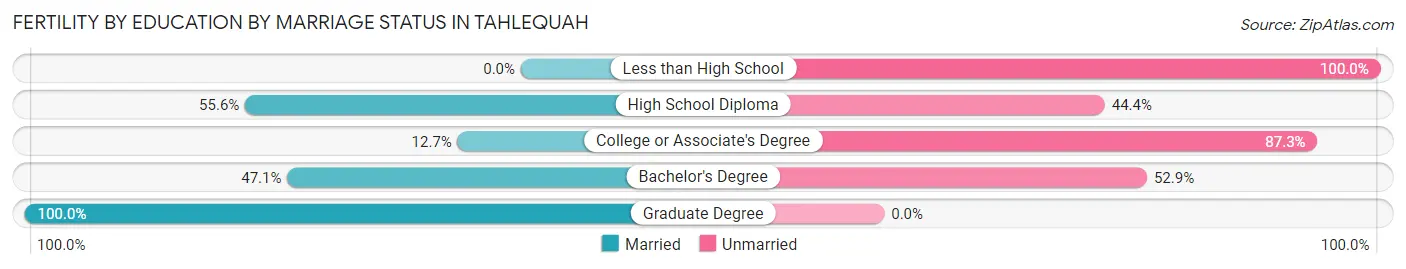
| Educational Attainment | Married | Unmarried |
| Less than High School | 0 (0.0%) | 10 (100.0%) |
| High School Diploma | 35 (55.6%) | 28 (44.4%) |
| College or Associate's Degree | 7 (12.7%) | 48 (87.3%) |
| Bachelor's Degree | 16 (47.1%) | 18 (52.9%) |
| Graduate Degree | 29 (100.0%) | 0 (0.0%) |
| Total | 87 (45.6%) | 104 (54.4%) |
Employment Characteristics in Tahlequah
Employment by Class of Employer in Tahlequah
Among the 7,447 employed individuals in Tahlequah, private company employees (3,973 | 53.3%), state government employees (758 | 10.2%), and local government employees (748 | 10.0%) make up the most common classes of employment.
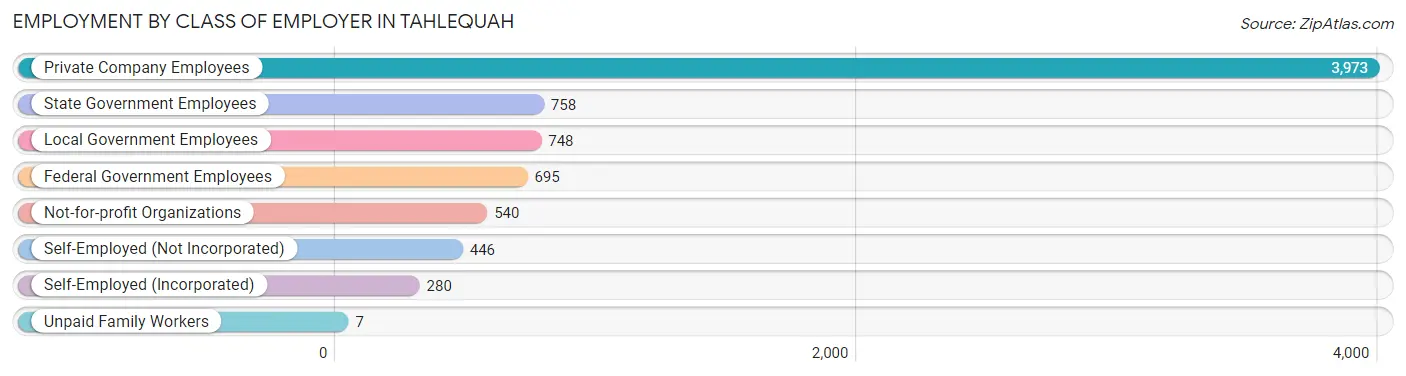
| Employer Class | # Employees | % Employees |
| Private Company Employees | 3,973 | 53.3% |
| Self-Employed (Incorporated) | 280 | 3.8% |
| Self-Employed (Not Incorporated) | 446 | 6.0% |
| Not-for-profit Organizations | 540 | 7.2% |
| Local Government Employees | 748 | 10.0% |
| State Government Employees | 758 | 10.2% |
| Federal Government Employees | 695 | 9.3% |
| Unpaid Family Workers | 7 | 0.1% |
| Total | 7,447 | 100.0% |
Employment Status by Age in Tahlequah
According to the labor force statistics for Tahlequah, out of the total population over 16 years of age (13,515), 60.2% or 8,136 individuals are in the labor force, with 7.1% or 578 of them unemployed. The age group with the highest labor force participation rate is 30 to 34 years, with 86.0% or 786 individuals in the labor force. Within the labor force, the 16 to 19 years age range has the highest percentage of unemployed individuals, with 13.0% or 82 of them being unemployed.
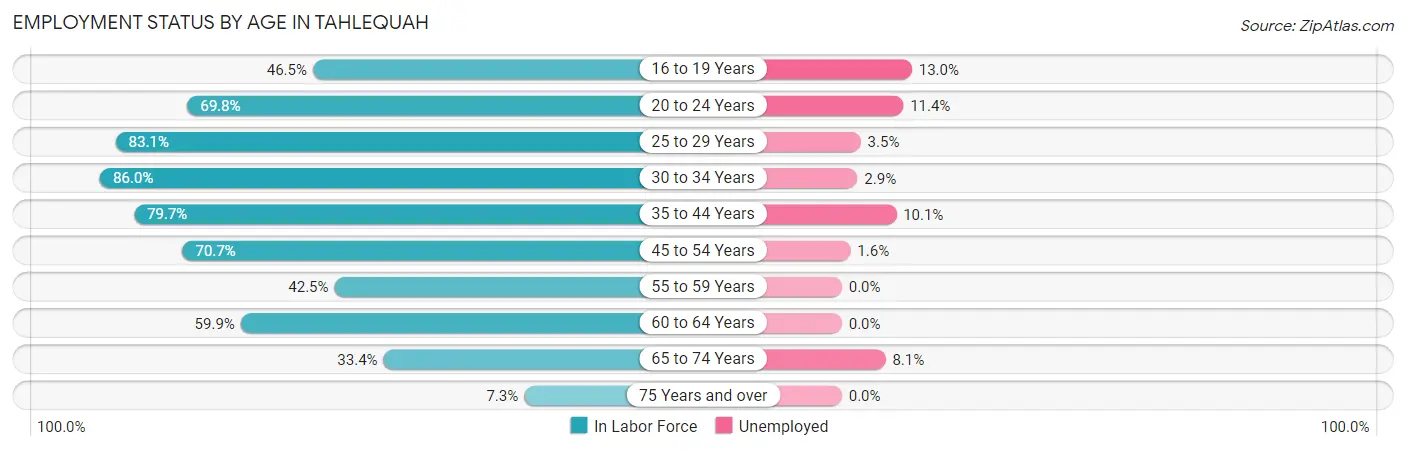
| Age Bracket | In Labor Force | Unemployed |
| 16 to 19 Years | 629 (46.5%) | 82 (13.0%) |
| 20 to 24 Years | 1,918 (69.8%) | 219 (11.4%) |
| 25 to 29 Years | 926 (83.1%) | 32 (3.5%) |
| 30 to 34 Years | 786 (86.0%) | 23 (2.9%) |
| 35 to 44 Years | 1,685 (79.7%) | 170 (10.1%) |
| 45 to 54 Years | 999 (70.7%) | 16 (1.6%) |
| 55 to 59 Years | 281 (42.5%) | 0 (0.0%) |
| 60 to 64 Years | 413 (59.9%) | 0 (0.0%) |
| 65 to 74 Years | 408 (33.4%) | 33 (8.1%) |
| 75 Years and over | 94 (7.3%) | 0 (0.0%) |
| Total | 8,136 (60.2%) | 578 (7.1%) |
Employment Status by Educational Attainment in Tahlequah
According to labor force statistics for Tahlequah, 73.7% of individuals (5,090) out of the total population between 25 and 64 years of age (6,906) are in the labor force, with 4.7% or 239 of them being unemployed. The group with the highest labor force participation rate are those with the educational attainment of bachelor's degree or higher, with 93.2% or 2,409 individuals in the labor force. Within the labor force, individuals with less than high school education have the highest percentage of unemployment, with 7.6% or 28 of them being unemployed.
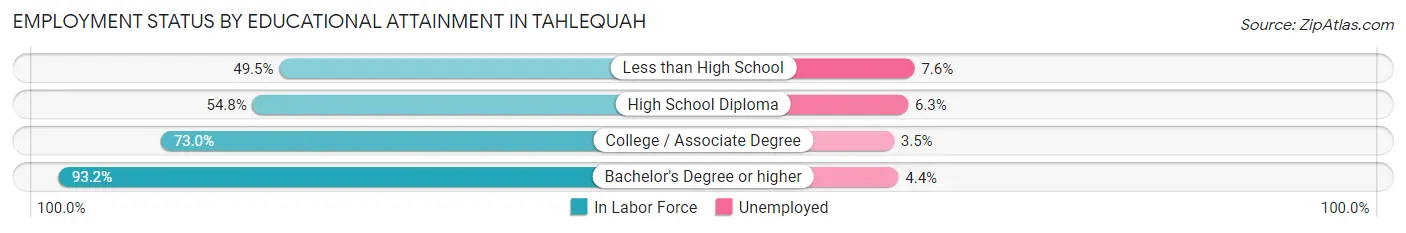
| Educational Attainment | In Labor Force | Unemployed |
| Less than High School | 368 (49.5%) | 56 (7.6%) |
| High School Diploma | 899 (54.8%) | 103 (6.3%) |
| College / Associate Degree | 1,415 (73.0%) | 68 (3.5%) |
| Bachelor's Degree or higher | 2,409 (93.2%) | 114 (4.4%) |
| Total | 5,090 (73.7%) | 325 (4.7%) |
Employment Occupations by Sex in Tahlequah
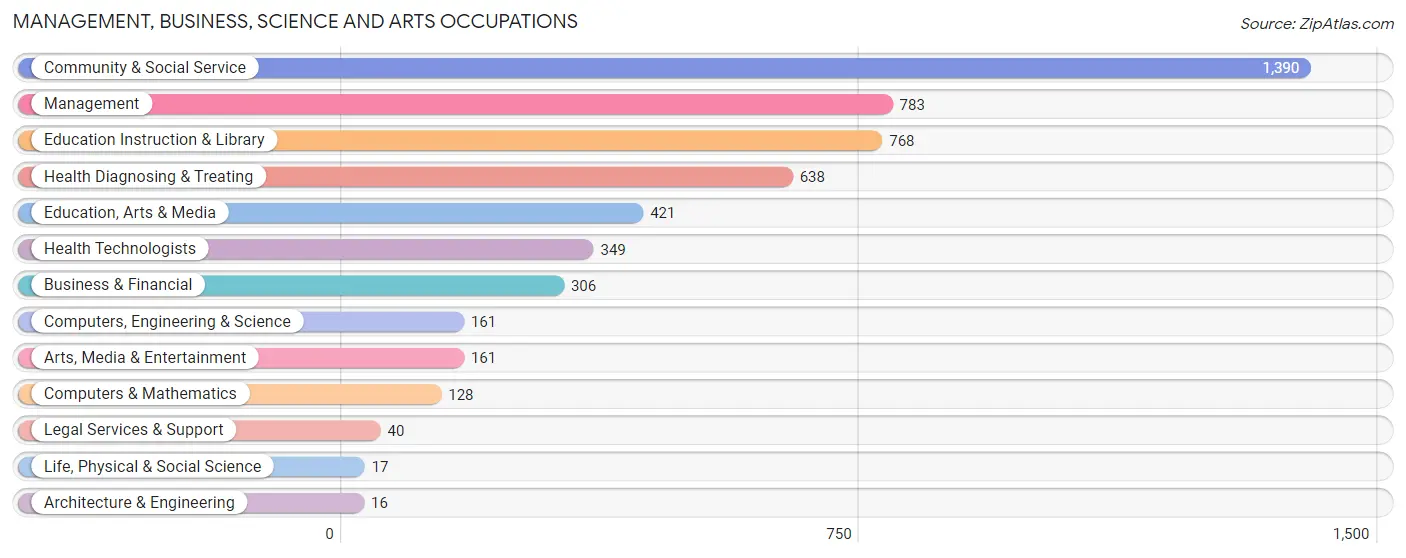
Management, Business, Science and Arts Occupations
The most common Management, Business, Science and Arts occupations in Tahlequah are Community & Social Service (1,390 | 18.5%), Management (783 | 10.4%), Education Instruction & Library (768 | 10.2%), Health Diagnosing & Treating (638 | 8.5%), and Education, Arts & Media (421 | 5.6%).
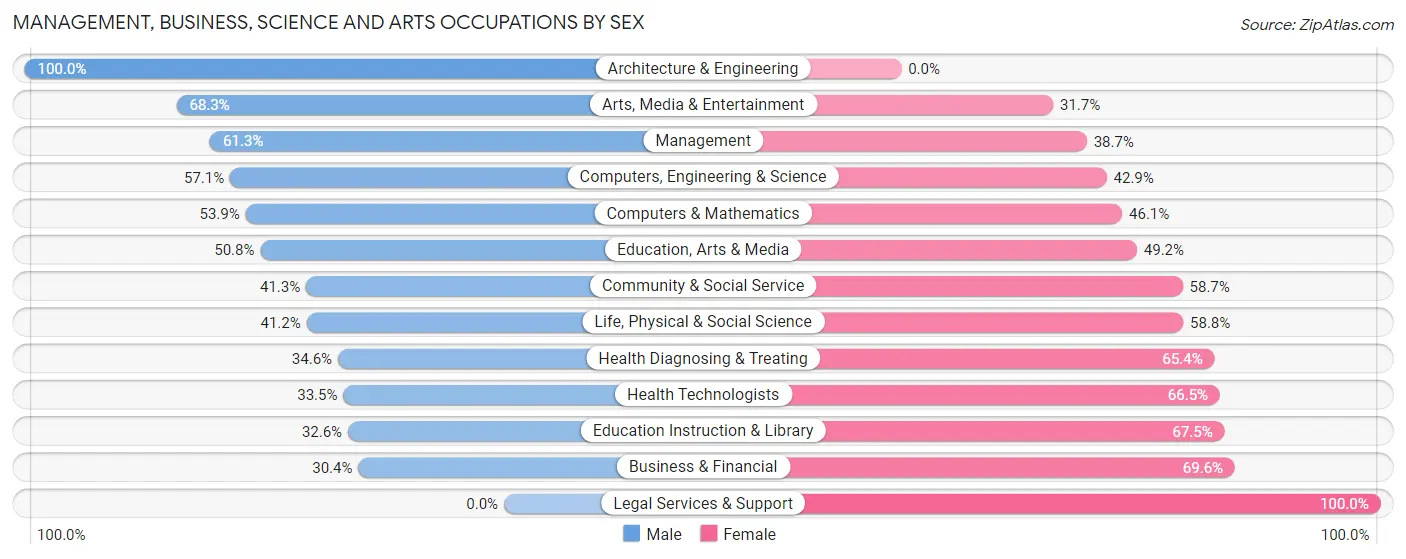
Management, Business, Science and Arts Occupations by Sex
Within the Management, Business, Science and Arts occupations in Tahlequah, the most male-oriented occupations are Architecture & Engineering (100.0%), Arts, Media & Entertainment (68.3%), and Management (61.3%), while the most female-oriented occupations are Legal Services & Support (100.0%), Business & Financial (69.6%), and Education Instruction & Library (67.4%).
| Occupation | Male | Female |
| Management | 480 (61.3%) | 303 (38.7%) |
| Business & Financial | 93 (30.4%) | 213 (69.6%) |
| Computers, Engineering & Science | 92 (57.1%) | 69 (42.9%) |
| Computers & Mathematics | 69 (53.9%) | 59 (46.1%) |
| Architecture & Engineering | 16 (100.0%) | 0 (0.0%) |
| Life, Physical & Social Science | 7 (41.2%) | 10 (58.8%) |
| Community & Social Service | 574 (41.3%) | 816 (58.7%) |
| Education, Arts & Media | 214 (50.8%) | 207 (49.2%) |
| Legal Services & Support | 0 (0.0%) | 40 (100.0%) |
| Education Instruction & Library | 250 (32.6%) | 518 (67.4%) |
| Arts, Media & Entertainment | 110 (68.3%) | 51 (31.7%) |
| Health Diagnosing & Treating | 221 (34.6%) | 417 (65.4%) |
| Health Technologists | 117 (33.5%) | 232 (66.5%) |
| Total (Category) | 1,460 (44.5%) | 1,818 (55.5%) |
| Total (Overall) | 3,720 (49.4%) | 3,804 (50.6%) |
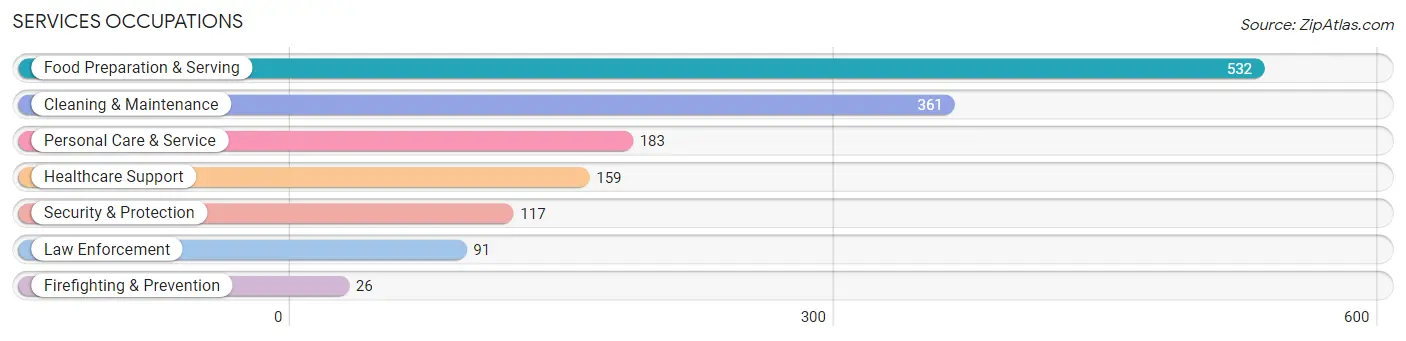
Services Occupations
The most common Services occupations in Tahlequah are Food Preparation & Serving (532 | 7.1%), Cleaning & Maintenance (361 | 4.8%), Personal Care & Service (183 | 2.4%), Healthcare Support (159 | 2.1%), and Security & Protection (117 | 1.6%).
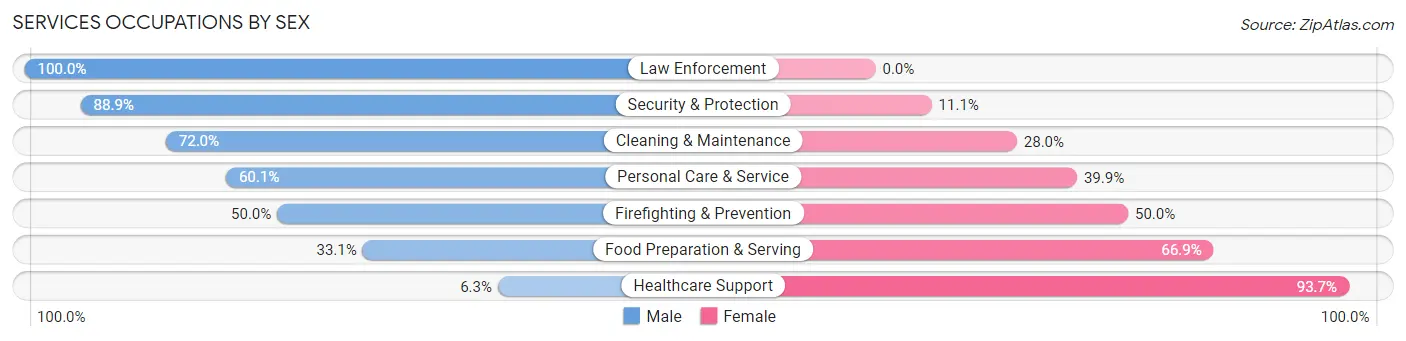
Services Occupations by Sex
Within the Services occupations in Tahlequah, the most male-oriented occupations are Law Enforcement (100.0%), Security & Protection (88.9%), and Cleaning & Maintenance (72.0%), while the most female-oriented occupations are Healthcare Support (93.7%), Food Preparation & Serving (66.9%), and Firefighting & Prevention (50.0%).
| Occupation | Male | Female |
| Healthcare Support | 10 (6.3%) | 149 (93.7%) |
| Security & Protection | 104 (88.9%) | 13 (11.1%) |
| Firefighting & Prevention | 13 (50.0%) | 13 (50.0%) |
| Law Enforcement | 91 (100.0%) | 0 (0.0%) |
| Food Preparation & Serving | 176 (33.1%) | 356 (66.9%) |
| Cleaning & Maintenance | 260 (72.0%) | 101 (28.0%) |
| Personal Care & Service | 110 (60.1%) | 73 (39.9%) |
| Total (Category) | 660 (48.8%) | 692 (51.2%) |
| Total (Overall) | 3,720 (49.4%) | 3,804 (50.6%) |
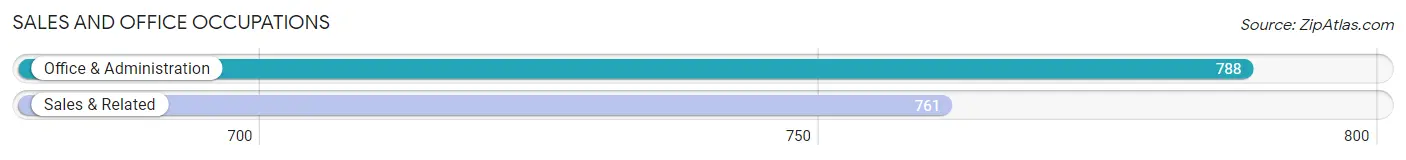
Sales and Office Occupations
The most common Sales and Office occupations in Tahlequah are Office & Administration (788 | 10.5%), and Sales & Related (761 | 10.1%).
Sales and Office Occupations by Sex
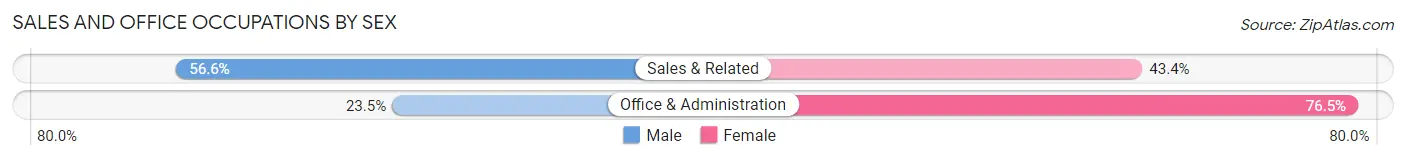
| Occupation | Male | Female |
| Sales & Related | 431 (56.6%) | 330 (43.4%) |
| Office & Administration | 185 (23.5%) | 603 (76.5%) |
| Total (Category) | 616 (39.8%) | 933 (60.2%) |
| Total (Overall) | 3,720 (49.4%) | 3,804 (50.6%) |
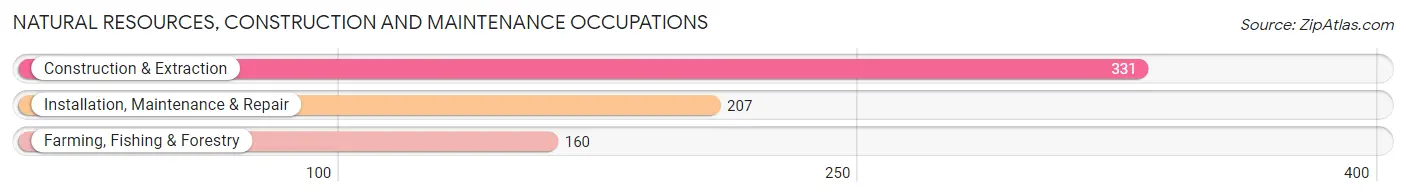
Natural Resources, Construction and Maintenance Occupations
The most common Natural Resources, Construction and Maintenance occupations in Tahlequah are Construction & Extraction (331 | 4.4%), Installation, Maintenance & Repair (207 | 2.8%), and Farming, Fishing & Forestry (160 | 2.1%).
Natural Resources, Construction and Maintenance Occupations by Sex
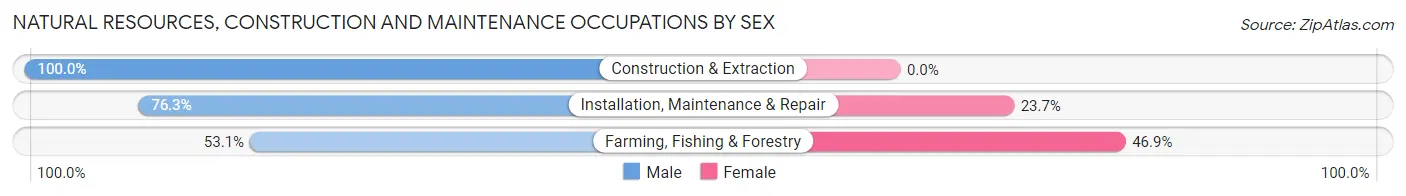
| Occupation | Male | Female |
| Farming, Fishing & Forestry | 85 (53.1%) | 75 (46.9%) |
| Construction & Extraction | 331 (100.0%) | 0 (0.0%) |
| Installation, Maintenance & Repair | 158 (76.3%) | 49 (23.7%) |
| Total (Category) | 574 (82.2%) | 124 (17.8%) |
| Total (Overall) | 3,720 (49.4%) | 3,804 (50.6%) |
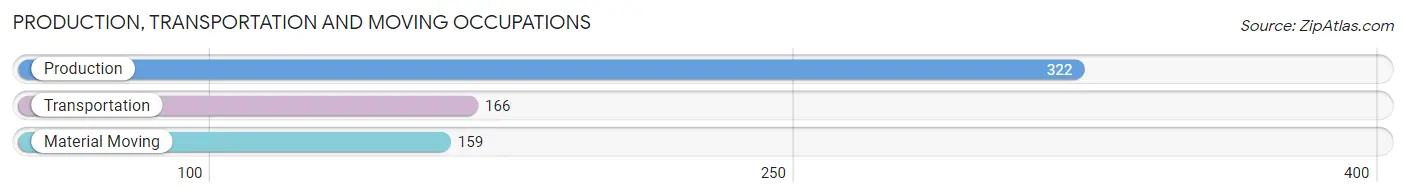
Production, Transportation and Moving Occupations
The most common Production, Transportation and Moving occupations in Tahlequah are Production (322 | 4.3%), Transportation (166 | 2.2%), and Material Moving (159 | 2.1%).
Production, Transportation and Moving Occupations by Sex
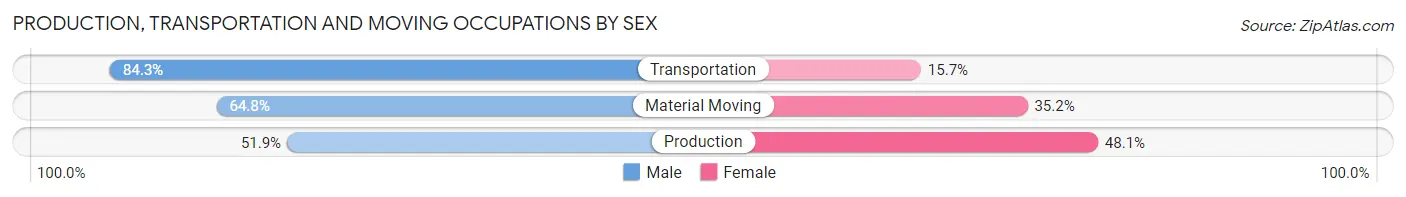
| Occupation | Male | Female |
| Production | 167 (51.9%) | 155 (48.1%) |
| Transportation | 140 (84.3%) | 26 (15.7%) |
| Material Moving | 103 (64.8%) | 56 (35.2%) |
| Total (Category) | 410 (63.4%) | 237 (36.6%) |
| Total (Overall) | 3,720 (49.4%) | 3,804 (50.6%) |
Employment Industries by Sex in Tahlequah
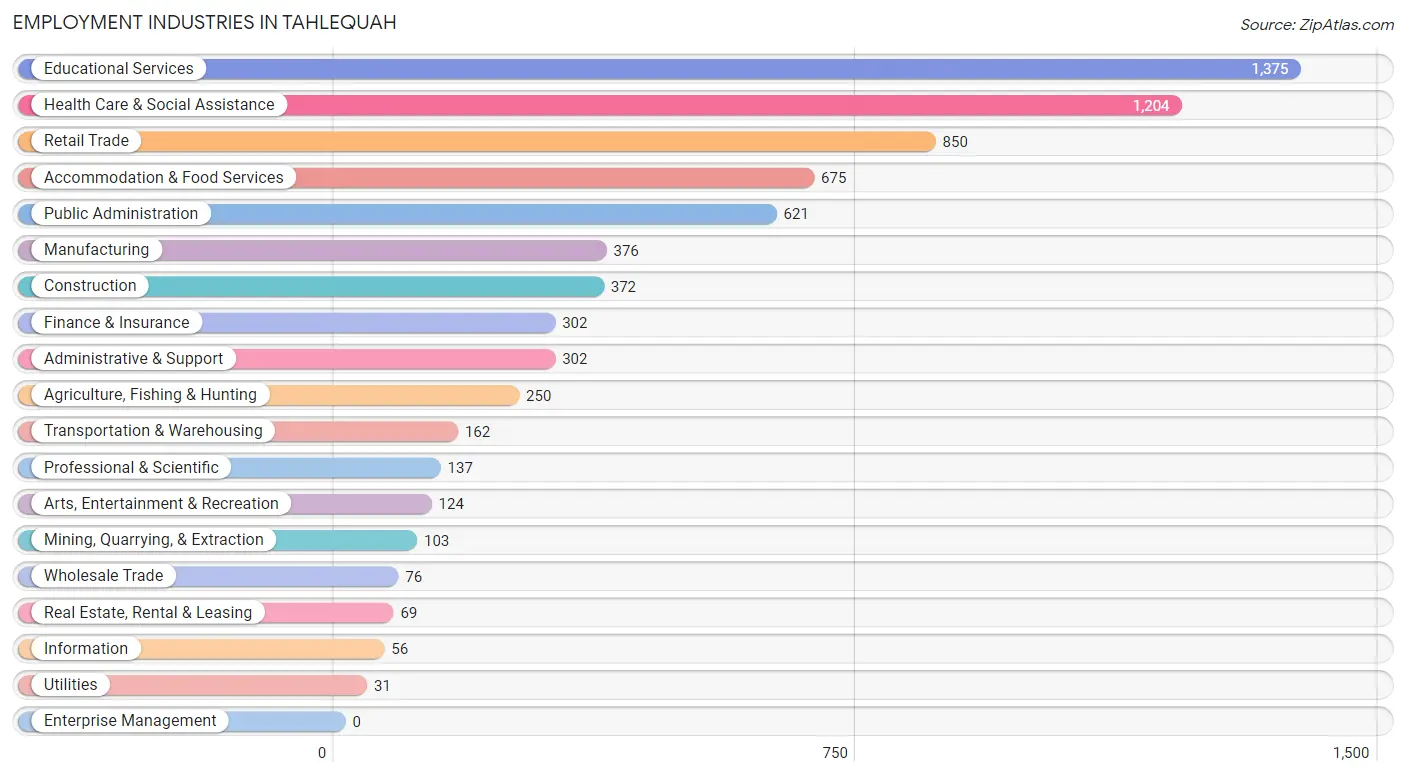
Employment Industries in Tahlequah
The major employment industries in Tahlequah include Educational Services (1,375 | 18.3%), Health Care & Social Assistance (1,204 | 16.0%), Retail Trade (850 | 11.3%), Accommodation & Food Services (675 | 9.0%), and Public Administration (621 | 8.3%).
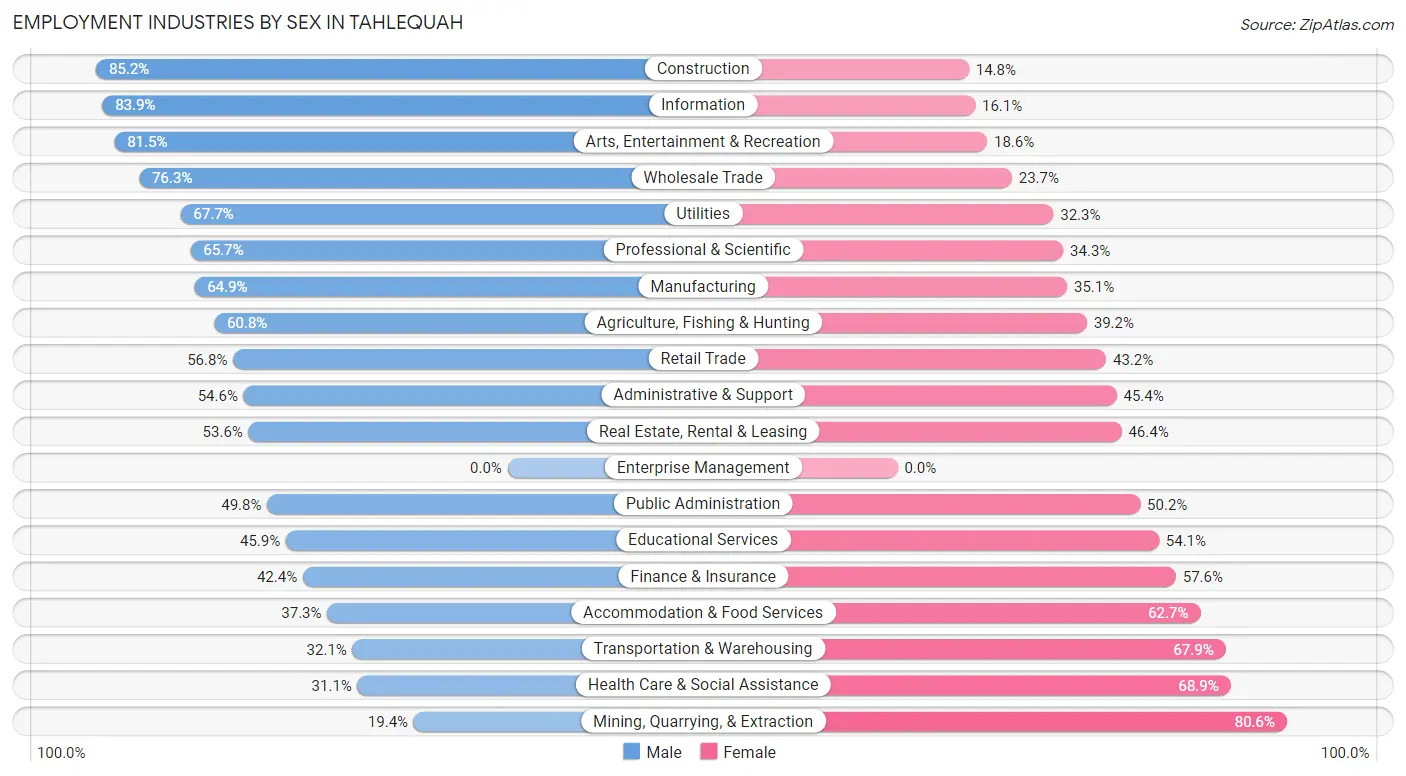
Employment Industries by Sex in Tahlequah
The Tahlequah industries that see more men than women are Construction (85.2%), Information (83.9%), and Arts, Entertainment & Recreation (81.5%), whereas the industries that tend to have a higher number of women are Mining, Quarrying, & Extraction (80.6%), Health Care & Social Assistance (68.9%), and Transportation & Warehousing (67.9%).
| Industry | Male | Female |
| Agriculture, Fishing & Hunting | 152 (60.8%) | 98 (39.2%) |
| Mining, Quarrying, & Extraction | 20 (19.4%) | 83 (80.6%) |
| Construction | 317 (85.2%) | 55 (14.8%) |
| Manufacturing | 244 (64.9%) | 132 (35.1%) |
| Wholesale Trade | 58 (76.3%) | 18 (23.7%) |
| Retail Trade | 483 (56.8%) | 367 (43.2%) |
| Transportation & Warehousing | 52 (32.1%) | 110 (67.9%) |
| Utilities | 21 (67.7%) | 10 (32.3%) |
| Information | 47 (83.9%) | 9 (16.1%) |
| Finance & Insurance | 128 (42.4%) | 174 (57.6%) |
| Real Estate, Rental & Leasing | 37 (53.6%) | 32 (46.4%) |
| Professional & Scientific | 90 (65.7%) | 47 (34.3%) |
| Enterprise Management | 0 (0.0%) | 0 (0.0%) |
| Administrative & Support | 165 (54.6%) | 137 (45.4%) |
| Educational Services | 631 (45.9%) | 744 (54.1%) |
| Health Care & Social Assistance | 374 (31.1%) | 830 (68.9%) |
| Arts, Entertainment & Recreation | 101 (81.5%) | 23 (18.5%) |
| Accommodation & Food Services | 252 (37.3%) | 423 (62.7%) |
| Public Administration | 309 (49.8%) | 312 (50.2%) |
| Total | 3,720 (49.4%) | 3,804 (50.6%) |
Education in Tahlequah
School Enrollment in Tahlequah
The most common levels of schooling among the 5,380 students in Tahlequah are college / undergraduate (2,417 | 44.9%), middle school (827 | 15.4%), and high school (751 | 14.0%).
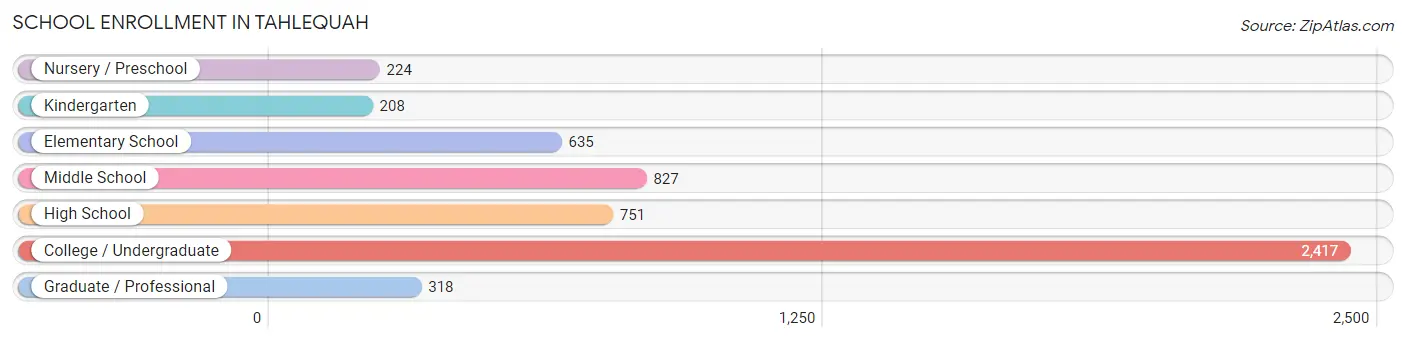
| School Level | # Students | % Students |
| Nursery / Preschool | 224 | 4.2% |
| Kindergarten | 208 | 3.9% |
| Elementary School | 635 | 11.8% |
| Middle School | 827 | 15.4% |
| High School | 751 | 14.0% |
| College / Undergraduate | 2,417 | 44.9% |
| Graduate / Professional | 318 | 5.9% |
| Total | 5,380 | 100.0% |
School Enrollment by Age by Funding Source in Tahlequah
Out of a total of 5,380 students who are enrolled in schools in Tahlequah, 463 (8.6%) attend a private institution, while the remaining 4,917 (91.4%) are enrolled in public schools. The age group of 3 to 4 year olds has the highest likelihood of being enrolled in private schools, with 41 (31.3% in the age bracket) enrolled. Conversely, the age group of 25 to 34 year olds has the lowest likelihood of being enrolled in a private school, with 296 (100.0% in the age bracket) attending a public institution.
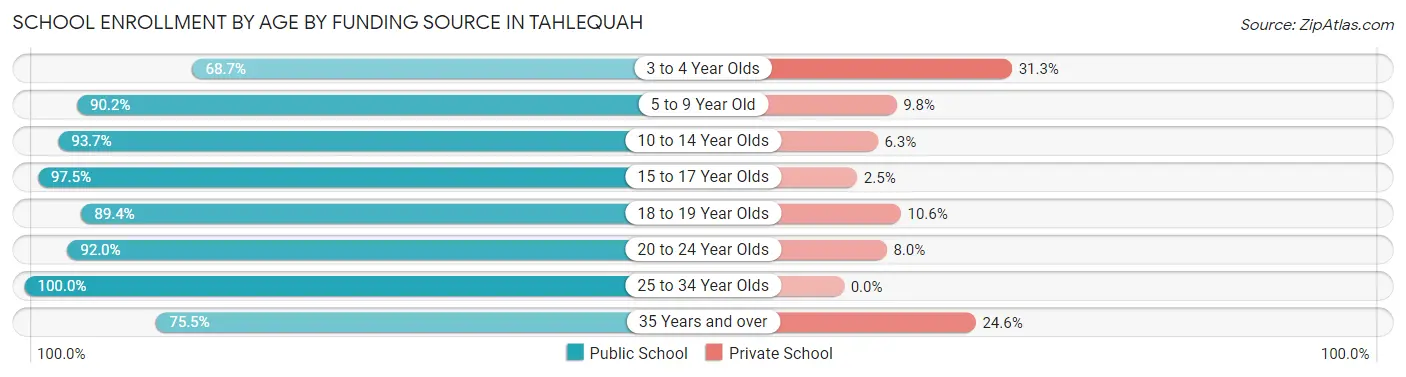
| Age Bracket | Public School | Private School |
| 3 to 4 Year Olds | 90 (68.7%) | 41 (31.3%) |
| 5 to 9 Year Old | 812 (90.2%) | 88 (9.8%) |
| 10 to 14 Year Olds | 849 (93.7%) | 57 (6.3%) |
| 15 to 17 Year Olds | 552 (97.5%) | 14 (2.5%) |
| 18 to 19 Year Olds | 743 (89.4%) | 88 (10.6%) |
| 20 to 24 Year Olds | 1,408 (92.0%) | 122 (8.0%) |
| 25 to 34 Year Olds | 296 (100.0%) | 0 (0.0%) |
| 35 Years and over | 166 (75.4%) | 54 (24.5%) |
| Total | 4,917 (91.4%) | 463 (8.6%) |
Educational Attainment by Field of Study in Tahlequah
Education (740 | 20.6%), business (708 | 19.8%), science & technology (367 | 10.2%), arts & humanities (270 | 7.5%), and psychology (233 | 6.5%) are the most common fields of study among 3,583 individuals in Tahlequah who have obtained a bachelor's degree or higher.
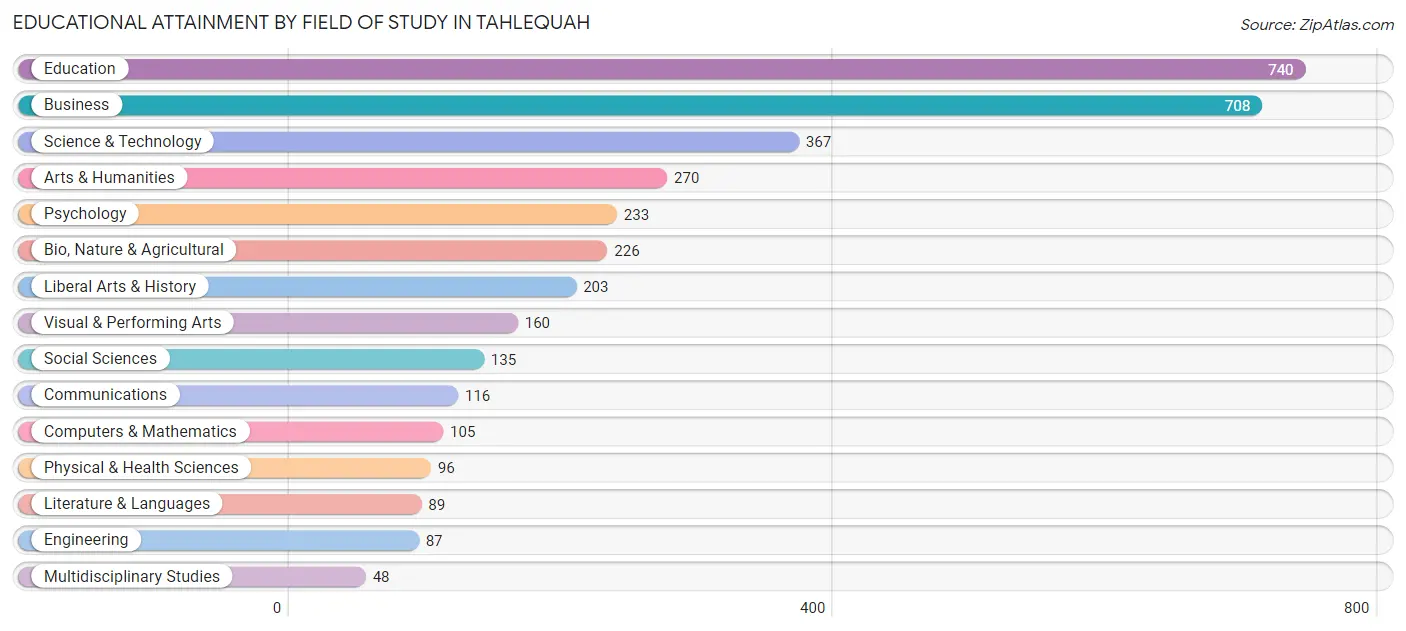
| Field of Study | # Graduates | % Graduates |
| Computers & Mathematics | 105 | 2.9% |
| Bio, Nature & Agricultural | 226 | 6.3% |
| Physical & Health Sciences | 96 | 2.7% |
| Psychology | 233 | 6.5% |
| Social Sciences | 135 | 3.8% |
| Engineering | 87 | 2.4% |
| Multidisciplinary Studies | 48 | 1.3% |
| Science & Technology | 367 | 10.2% |
| Business | 708 | 19.8% |
| Education | 740 | 20.6% |
| Literature & Languages | 89 | 2.5% |
| Liberal Arts & History | 203 | 5.7% |
| Visual & Performing Arts | 160 | 4.5% |
| Communications | 116 | 3.2% |
| Arts & Humanities | 270 | 7.5% |
| Total | 3,583 | 100.0% |
Transportation & Commute in Tahlequah
Vehicle Availability by Sex in Tahlequah
The most prevalent vehicle ownership categories in Tahlequah are males with 2 vehicles (1,534, accounting for 45.1%) and females with 2 vehicles (1,404, making up 43.0%).
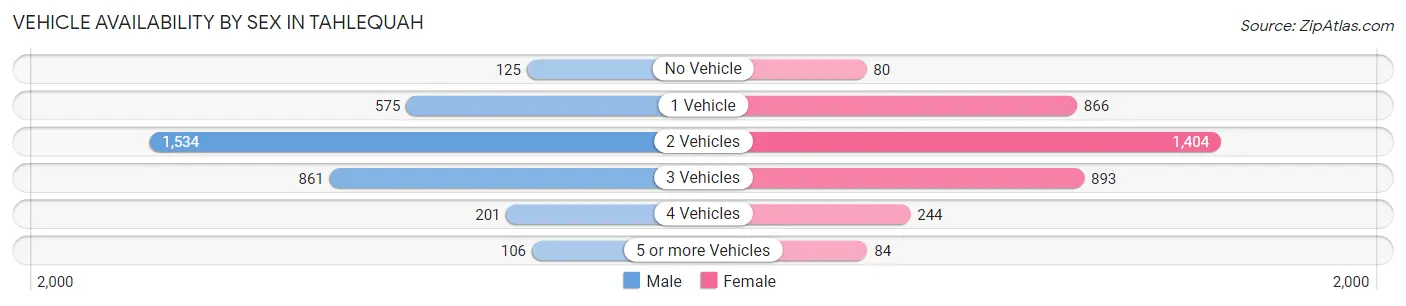
| Vehicles Available | Male | Female |
| No Vehicle | 125 (3.7%) | 80 (2.2%) |
| 1 Vehicle | 575 (16.9%) | 866 (24.2%) |
| 2 Vehicles | 1,534 (45.1%) | 1,404 (39.3%) |
| 3 Vehicles | 861 (25.3%) | 893 (25.0%) |
| 4 Vehicles | 201 (5.9%) | 244 (6.8%) |
| 5 or more Vehicles | 106 (3.1%) | 84 (2.4%) |
| Total | 3,402 (100.0%) | 3,571 (100.0%) |
Commute Time in Tahlequah
The most frequently occuring commute durations in Tahlequah are 5 to 9 minutes (1,832 commuters, 25.8%), 10 to 14 minutes (1,795 commuters, 25.3%), and 15 to 19 minutes (1,108 commuters, 15.6%).
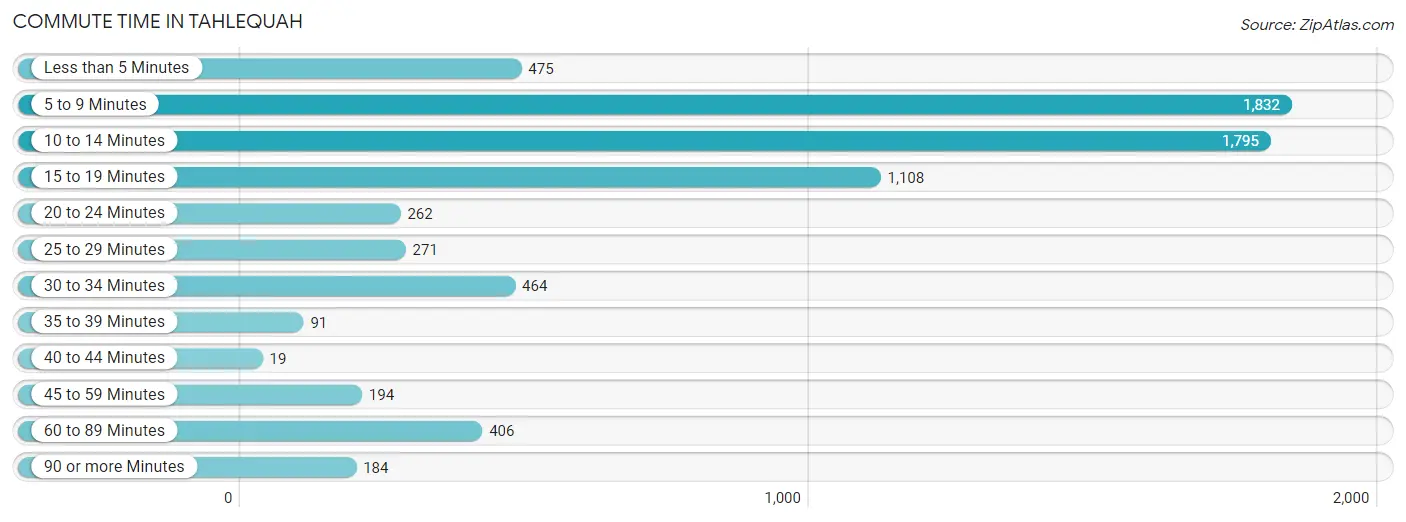
| Commute Time | # Commuters | % Commuters |
| Less than 5 Minutes | 475 | 6.7% |
| 5 to 9 Minutes | 1,832 | 25.8% |
| 10 to 14 Minutes | 1,795 | 25.3% |
| 15 to 19 Minutes | 1,108 | 15.6% |
| 20 to 24 Minutes | 262 | 3.7% |
| 25 to 29 Minutes | 271 | 3.8% |
| 30 to 34 Minutes | 464 | 6.5% |
| 35 to 39 Minutes | 91 | 1.3% |
| 40 to 44 Minutes | 19 | 0.3% |
| 45 to 59 Minutes | 194 | 2.7% |
| 60 to 89 Minutes | 406 | 5.7% |
| 90 or more Minutes | 184 | 2.6% |
Commute Time by Sex in Tahlequah
The most common commute times in Tahlequah are 5 to 9 minutes (769 commuters, 22.0%) for males and 5 to 9 minutes (1,063 commuters, 29.5%) for females.
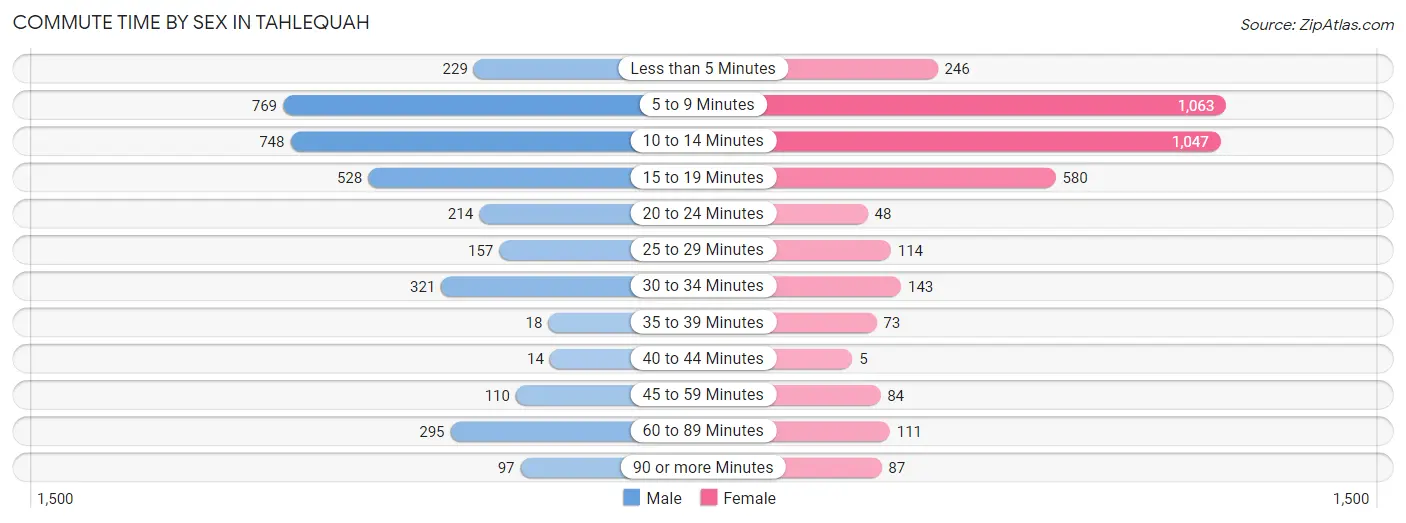
| Commute Time | Male | Female |
| Less than 5 Minutes | 229 (6.5%) | 246 (6.8%) |
| 5 to 9 Minutes | 769 (22.0%) | 1,063 (29.5%) |
| 10 to 14 Minutes | 748 (21.4%) | 1,047 (29.1%) |
| 15 to 19 Minutes | 528 (15.1%) | 580 (16.1%) |
| 20 to 24 Minutes | 214 (6.1%) | 48 (1.3%) |
| 25 to 29 Minutes | 157 (4.5%) | 114 (3.2%) |
| 30 to 34 Minutes | 321 (9.2%) | 143 (4.0%) |
| 35 to 39 Minutes | 18 (0.5%) | 73 (2.0%) |
| 40 to 44 Minutes | 14 (0.4%) | 5 (0.1%) |
| 45 to 59 Minutes | 110 (3.1%) | 84 (2.3%) |
| 60 to 89 Minutes | 295 (8.4%) | 111 (3.1%) |
| 90 or more Minutes | 97 (2.8%) | 87 (2.4%) |
Time of Departure to Work by Sex in Tahlequah
The most frequent times of departure to work in Tahlequah are 7:30 AM to 7:59 AM (798, 22.8%) for males and 7:30 AM to 7:59 AM (1,026, 28.5%) for females.
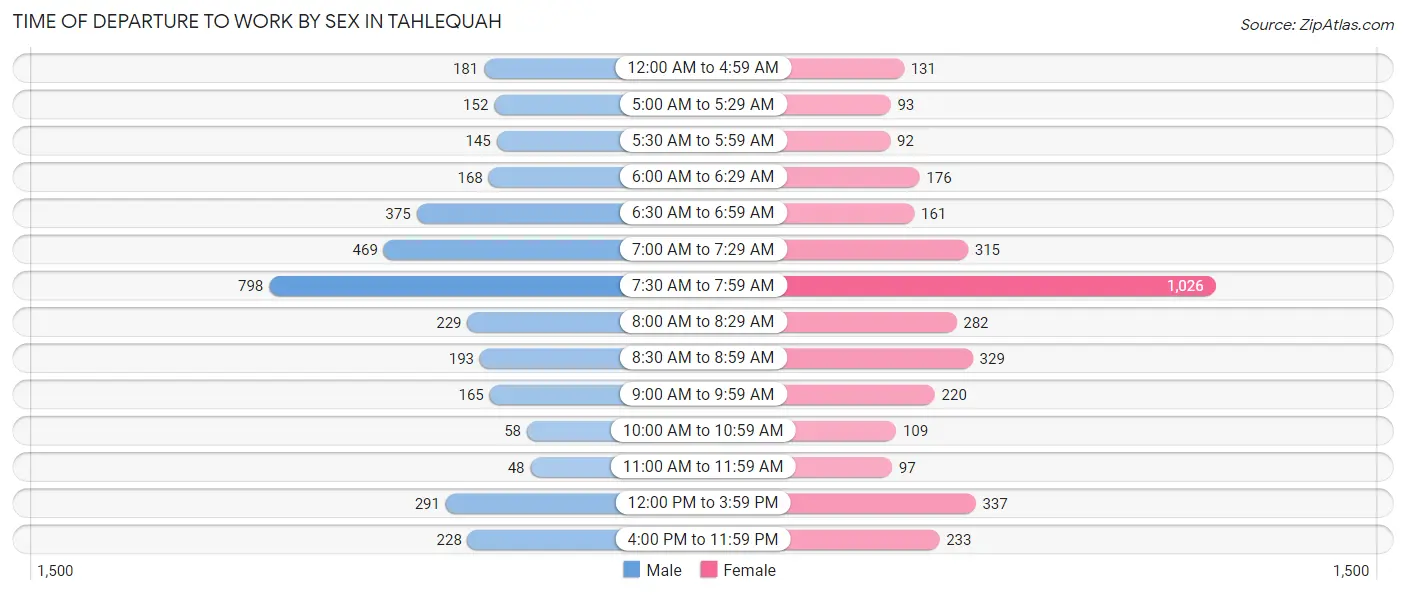
| Time of Departure | Male | Female |
| 12:00 AM to 4:59 AM | 181 (5.2%) | 131 (3.6%) |
| 5:00 AM to 5:29 AM | 152 (4.3%) | 93 (2.6%) |
| 5:30 AM to 5:59 AM | 145 (4.1%) | 92 (2.5%) |
| 6:00 AM to 6:29 AM | 168 (4.8%) | 176 (4.9%) |
| 6:30 AM to 6:59 AM | 375 (10.7%) | 161 (4.5%) |
| 7:00 AM to 7:29 AM | 469 (13.4%) | 315 (8.7%) |
| 7:30 AM to 7:59 AM | 798 (22.8%) | 1,026 (28.5%) |
| 8:00 AM to 8:29 AM | 229 (6.5%) | 282 (7.8%) |
| 8:30 AM to 8:59 AM | 193 (5.5%) | 329 (9.1%) |
| 9:00 AM to 9:59 AM | 165 (4.7%) | 220 (6.1%) |
| 10:00 AM to 10:59 AM | 58 (1.7%) | 109 (3.0%) |
| 11:00 AM to 11:59 AM | 48 (1.4%) | 97 (2.7%) |
| 12:00 PM to 3:59 PM | 291 (8.3%) | 337 (9.4%) |
| 4:00 PM to 11:59 PM | 228 (6.5%) | 233 (6.5%) |
| Total | 3,500 (100.0%) | 3,601 (100.0%) |
Housing Occupancy in Tahlequah
Occupancy by Ownership in Tahlequah
Of the total 6,274 dwellings in Tahlequah, owner-occupied units account for 2,664 (42.5%), while renter-occupied units make up 3,610 (57.5%).
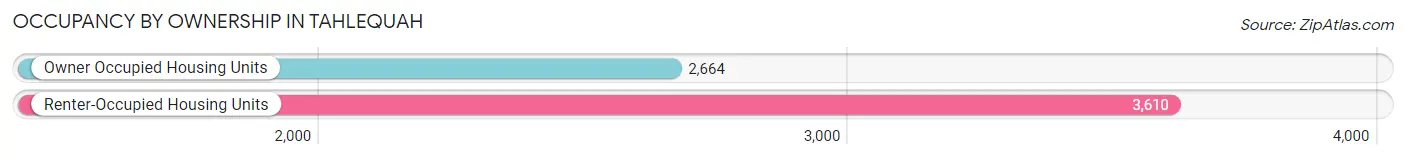
| Occupancy | # Housing Units | % Housing Units |
| Owner Occupied Housing Units | 2,664 | 42.5% |
| Renter-Occupied Housing Units | 3,610 | 57.5% |
| Total Occupied Housing Units | 6,274 | 100.0% |
Occupancy by Household Size in Tahlequah
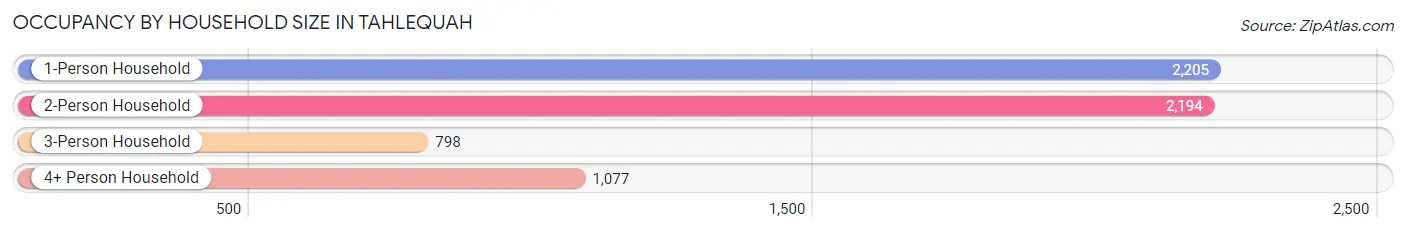
| Household Size | # Housing Units | % Housing Units |
| 1-Person Household | 2,205 | 35.1% |
| 2-Person Household | 2,194 | 35.0% |
| 3-Person Household | 798 | 12.7% |
| 4+ Person Household | 1,077 | 17.2% |
| Total Housing Units | 6,274 | 100.0% |
Occupancy by Ownership by Household Size in Tahlequah
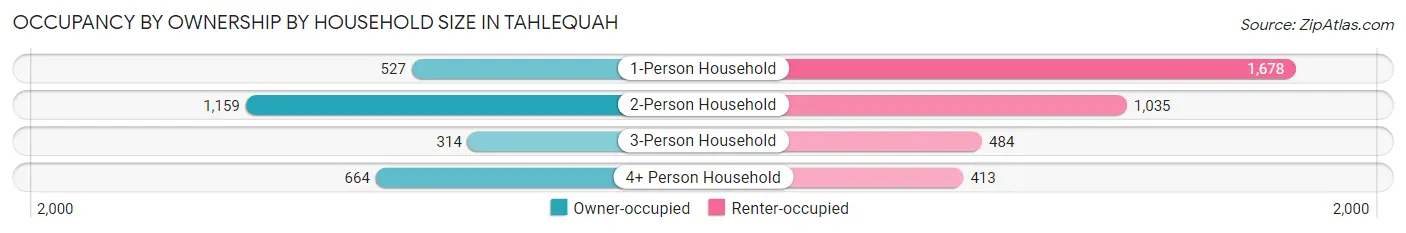
| Household Size | Owner-occupied | Renter-occupied |
| 1-Person Household | 527 (23.9%) | 1,678 (76.1%) |
| 2-Person Household | 1,159 (52.8%) | 1,035 (47.2%) |
| 3-Person Household | 314 (39.4%) | 484 (60.7%) |
| 4+ Person Household | 664 (61.7%) | 413 (38.4%) |
| Total Housing Units | 2,664 (42.5%) | 3,610 (57.5%) |
Occupancy by Educational Attainment in Tahlequah
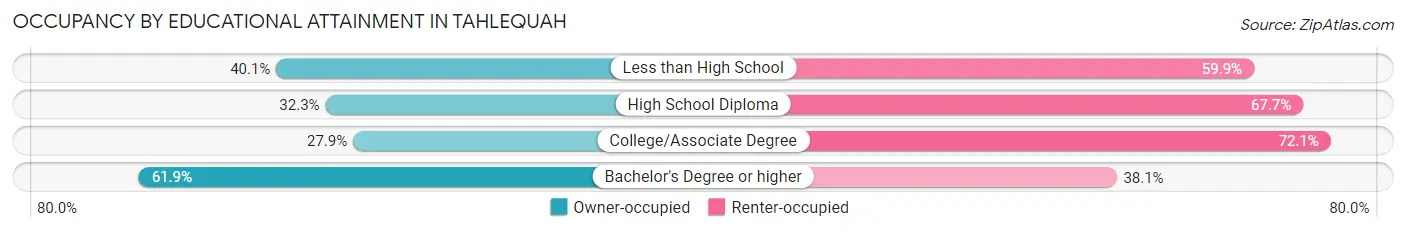
| Household Size | Owner-occupied | Renter-occupied |
| Less than High School | 257 (40.1%) | 384 (59.9%) |
| High School Diploma | 476 (32.3%) | 998 (67.7%) |
| College/Associate Degree | 528 (27.9%) | 1,364 (72.1%) |
| Bachelor's Degree or higher | 1,403 (61.9%) | 864 (38.1%) |
Occupancy by Age of Householder in Tahlequah
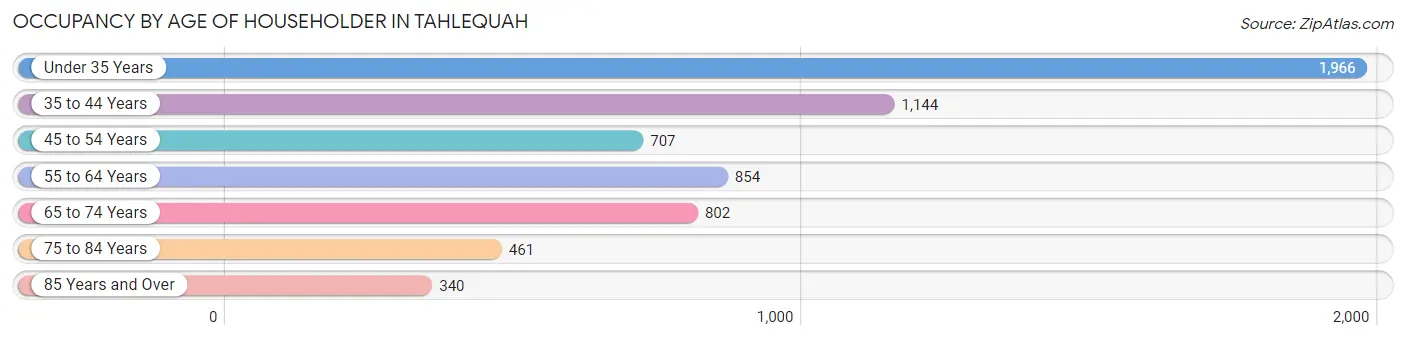
| Age Bracket | # Households | % Households |
| Under 35 Years | 1,966 | 31.3% |
| 35 to 44 Years | 1,144 | 18.2% |
| 45 to 54 Years | 707 | 11.3% |
| 55 to 64 Years | 854 | 13.6% |
| 65 to 74 Years | 802 | 12.8% |
| 75 to 84 Years | 461 | 7.3% |
| 85 Years and Over | 340 | 5.4% |
| Total | 6,274 | 100.0% |
Housing Finances in Tahlequah
Median Income by Occupancy in Tahlequah
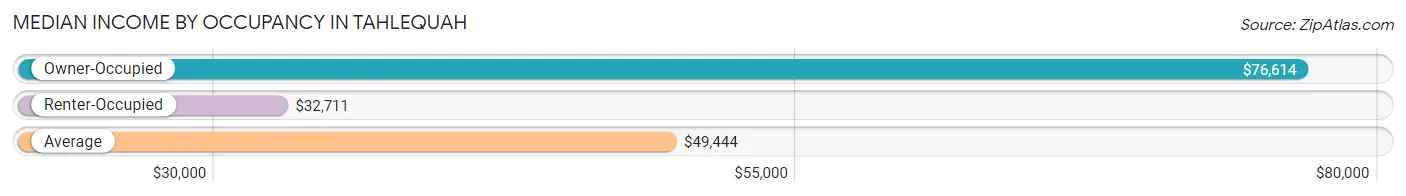
| Occupancy Type | # Households | Median Income |
| Owner-Occupied | 2,664 (42.5%) | $76,614 |
| Renter-Occupied | 3,610 (57.5%) | $32,711 |
| Average | 6,274 (100.0%) | $49,444 |
Occupancy by Householder Income Bracket in Tahlequah
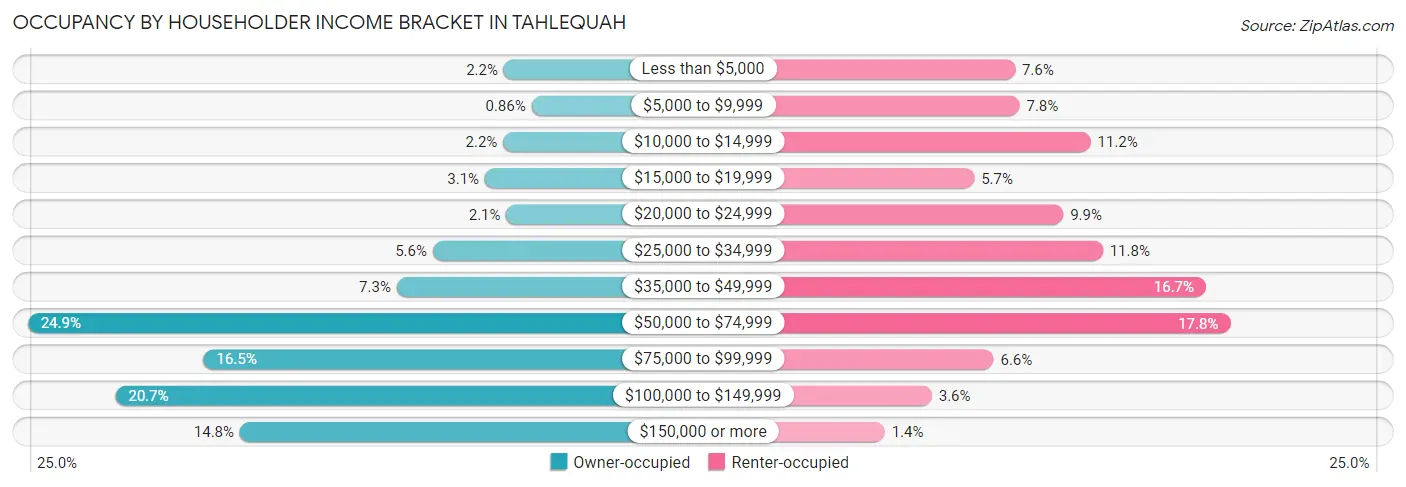
| Income Bracket | Owner-occupied | Renter-occupied |
| Less than $5,000 | 58 (2.2%) | 274 (7.6%) |
| $5,000 to $9,999 | 23 (0.9%) | 282 (7.8%) |
| $10,000 to $14,999 | 59 (2.2%) | 404 (11.2%) |
| $15,000 to $19,999 | 82 (3.1%) | 204 (5.7%) |
| $20,000 to $24,999 | 55 (2.1%) | 357 (9.9%) |
| $25,000 to $34,999 | 148 (5.6%) | 425 (11.8%) |
| $35,000 to $49,999 | 194 (7.3%) | 602 (16.7%) |
| $50,000 to $74,999 | 662 (24.8%) | 644 (17.8%) |
| $75,000 to $99,999 | 439 (16.5%) | 237 (6.6%) |
| $100,000 to $149,999 | 551 (20.7%) | 131 (3.6%) |
| $150,000 or more | 393 (14.7%) | 50 (1.4%) |
| Total | 2,664 (100.0%) | 3,610 (100.0%) |
Monthly Housing Cost Tiers in Tahlequah
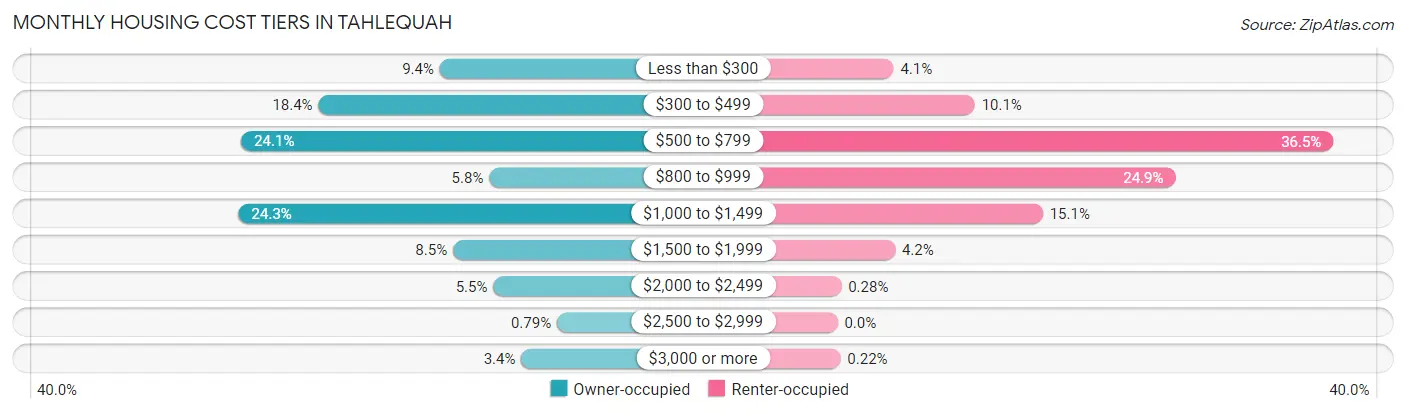
| Monthly Cost | Owner-occupied | Renter-occupied |
| Less than $300 | 251 (9.4%) | 149 (4.1%) |
| $300 to $499 | 489 (18.4%) | 365 (10.1%) |
| $500 to $799 | 641 (24.1%) | 1,318 (36.5%) |
| $800 to $999 | 154 (5.8%) | 898 (24.9%) |
| $1,000 to $1,499 | 646 (24.2%) | 546 (15.1%) |
| $1,500 to $1,999 | 225 (8.5%) | 153 (4.2%) |
| $2,000 to $2,499 | 146 (5.5%) | 10 (0.3%) |
| $2,500 to $2,999 | 21 (0.8%) | 0 (0.0%) |
| $3,000 or more | 91 (3.4%) | 8 (0.2%) |
| Total | 2,664 (100.0%) | 3,610 (100.0%) |
Physical Housing Characteristics in Tahlequah
Housing Structures in Tahlequah
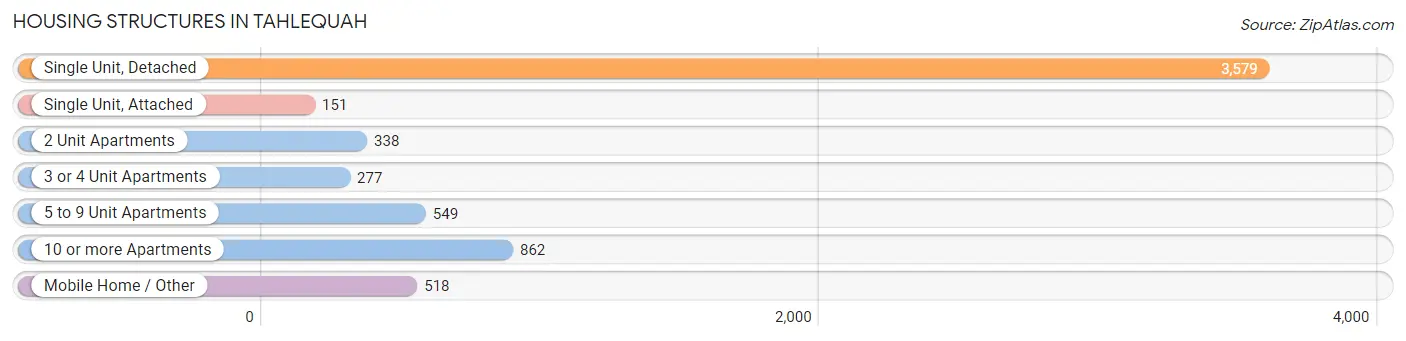
| Structure Type | # Housing Units | % Housing Units |
| Single Unit, Detached | 3,579 | 57.0% |
| Single Unit, Attached | 151 | 2.4% |
| 2 Unit Apartments | 338 | 5.4% |
| 3 or 4 Unit Apartments | 277 | 4.4% |
| 5 to 9 Unit Apartments | 549 | 8.7% |
| 10 or more Apartments | 862 | 13.7% |
| Mobile Home / Other | 518 | 8.3% |
| Total | 6,274 | 100.0% |
Housing Structures by Occupancy in Tahlequah
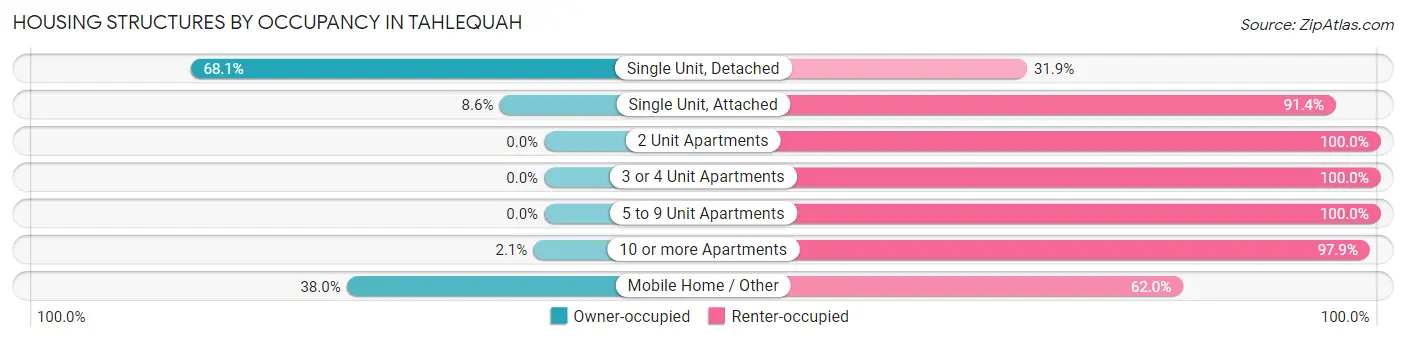
| Structure Type | Owner-occupied | Renter-occupied |
| Single Unit, Detached | 2,436 (68.1%) | 1,143 (31.9%) |
| Single Unit, Attached | 13 (8.6%) | 138 (91.4%) |
| 2 Unit Apartments | 0 (0.0%) | 338 (100.0%) |
| 3 or 4 Unit Apartments | 0 (0.0%) | 277 (100.0%) |
| 5 to 9 Unit Apartments | 0 (0.0%) | 549 (100.0%) |
| 10 or more Apartments | 18 (2.1%) | 844 (97.9%) |
| Mobile Home / Other | 197 (38.0%) | 321 (62.0%) |
| Total | 2,664 (42.5%) | 3,610 (57.5%) |
Housing Structures by Number of Rooms in Tahlequah
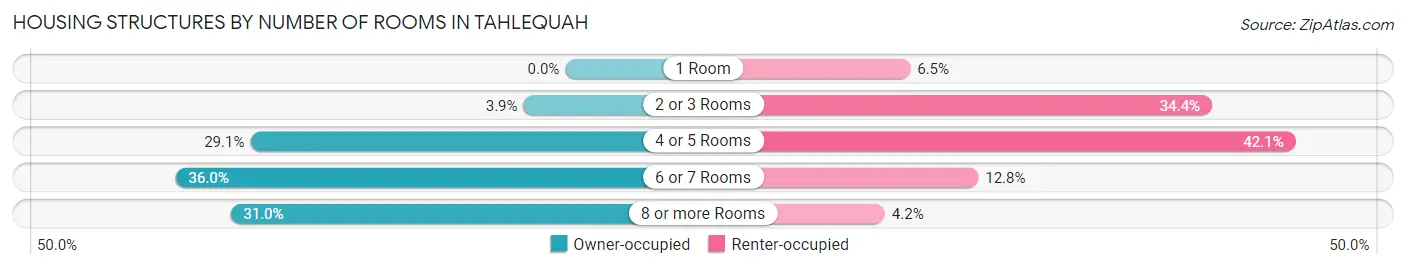
| Number of Rooms | Owner-occupied | Renter-occupied |
| 1 Room | 0 (0.0%) | 235 (6.5%) |
| 2 or 3 Rooms | 103 (3.9%) | 1,242 (34.4%) |
| 4 or 5 Rooms | 776 (29.1%) | 1,521 (42.1%) |
| 6 or 7 Rooms | 960 (36.0%) | 462 (12.8%) |
| 8 or more Rooms | 825 (31.0%) | 150 (4.2%) |
| Total | 2,664 (100.0%) | 3,610 (100.0%) |
Housing Structure by Heating Type in Tahlequah
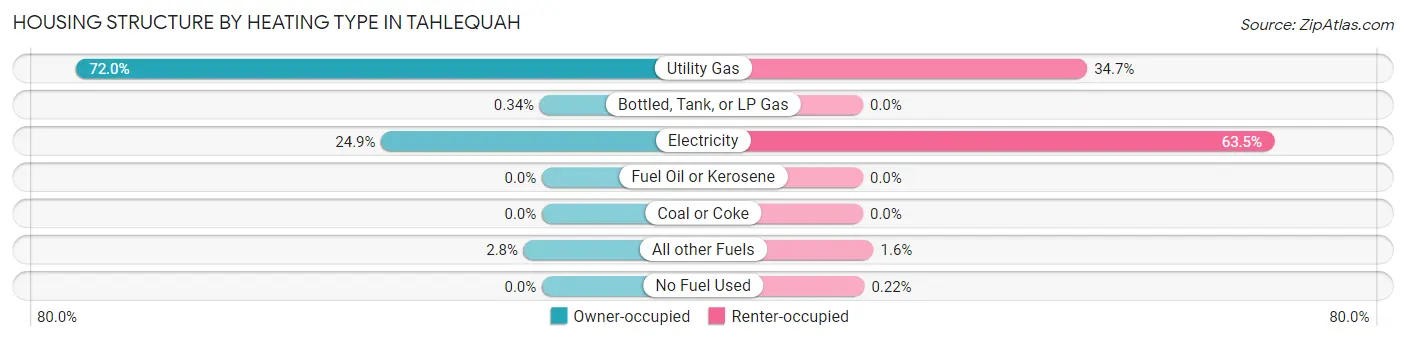
| Heating Type | Owner-occupied | Renter-occupied |
| Utility Gas | 1,918 (72.0%) | 1,251 (34.6%) |
| Bottled, Tank, or LP Gas | 9 (0.3%) | 0 (0.0%) |
| Electricity | 662 (24.8%) | 2,292 (63.5%) |
| Fuel Oil or Kerosene | 0 (0.0%) | 0 (0.0%) |
| Coal or Coke | 0 (0.0%) | 0 (0.0%) |
| All other Fuels | 75 (2.8%) | 59 (1.6%) |
| No Fuel Used | 0 (0.0%) | 8 (0.2%) |
| Total | 2,664 (100.0%) | 3,610 (100.0%) |
Household Vehicle Usage in Tahlequah
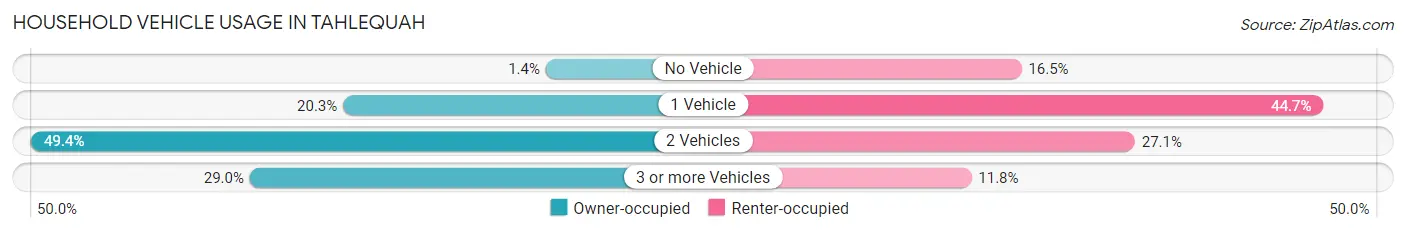
| Vehicles per Household | Owner-occupied | Renter-occupied |
| No Vehicle | 36 (1.3%) | 595 (16.5%) |
| 1 Vehicle | 540 (20.3%) | 1,612 (44.7%) |
| 2 Vehicles | 1,316 (49.4%) | 977 (27.1%) |
| 3 or more Vehicles | 772 (29.0%) | 426 (11.8%) |
| Total | 2,664 (100.0%) | 3,610 (100.0%) |
Real Estate & Mortgages in Tahlequah
Real Estate and Mortgage Overview in Tahlequah
| Characteristic | Without Mortgage | With Mortgage |
| Housing Units | 1,244 | 1,420 |
| Median Property Value | $162,200 | $164,800 |
| Median Household Income | $73,457 | $234 |
| Monthly Housing Costs | $469 | $91 |
| Real Estate Taxes | $947 | $85 |
Property Value by Mortgage Status in Tahlequah
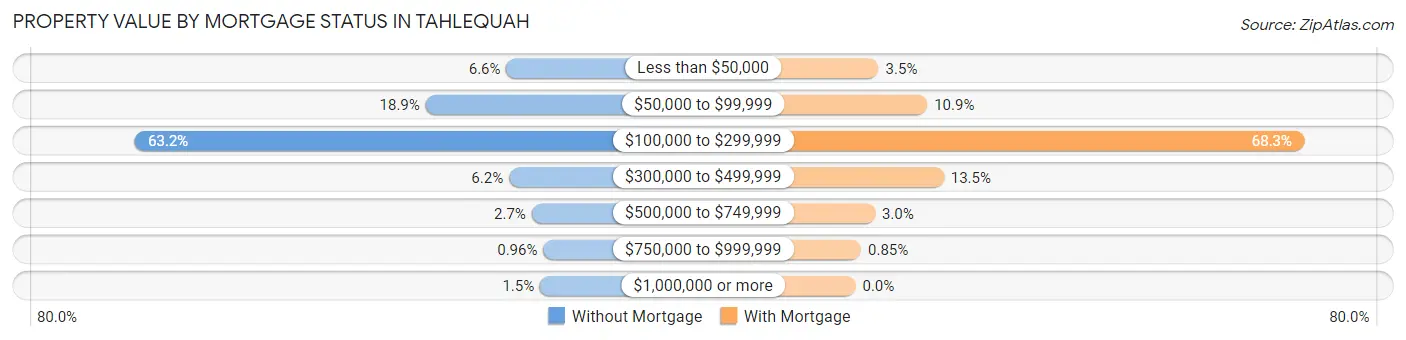
| Property Value | Without Mortgage | With Mortgage |
| Less than $50,000 | 82 (6.6%) | 50 (3.5%) |
| $50,000 to $99,999 | 235 (18.9%) | 155 (10.9%) |
| $100,000 to $299,999 | 786 (63.2%) | 970 (68.3%) |
| $300,000 to $499,999 | 77 (6.2%) | 191 (13.5%) |
| $500,000 to $749,999 | 34 (2.7%) | 42 (3.0%) |
| $750,000 to $999,999 | 12 (1.0%) | 12 (0.9%) |
| $1,000,000 or more | 18 (1.5%) | 0 (0.0%) |
| Total | 1,244 (100.0%) | 1,420 (100.0%) |
Household Income by Mortgage Status in Tahlequah
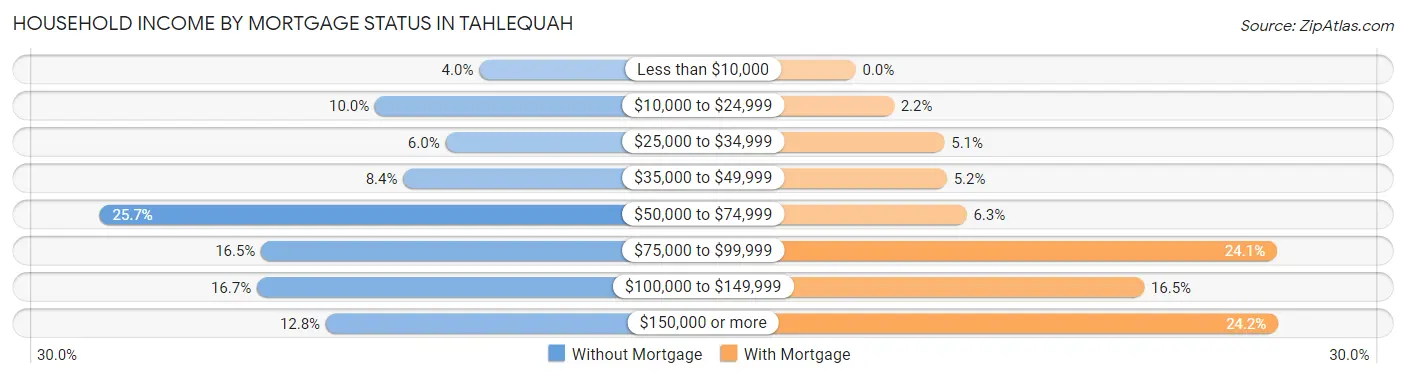
| Household Income | Without Mortgage | With Mortgage |
| Less than $10,000 | 50 (4.0%) | 0 (0.0%) |
| $10,000 to $24,999 | 124 (10.0%) | 31 (2.2%) |
| $25,000 to $34,999 | 74 (5.9%) | 72 (5.1%) |
| $35,000 to $49,999 | 104 (8.4%) | 74 (5.2%) |
| $50,000 to $74,999 | 320 (25.7%) | 90 (6.3%) |
| $75,000 to $99,999 | 205 (16.5%) | 342 (24.1%) |
| $100,000 to $149,999 | 208 (16.7%) | 234 (16.5%) |
| $150,000 or more | 159 (12.8%) | 343 (24.1%) |
| Total | 1,244 (100.0%) | 1,420 (100.0%) |
Property Value to Household Income Ratio in Tahlequah
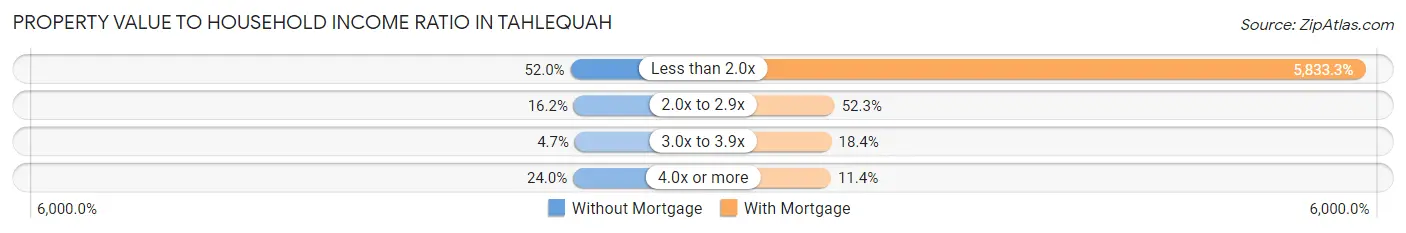
| Value-to-Income Ratio | Without Mortgage | With Mortgage |
| Less than 2.0x | 647 (52.0%) | 82,833 (5,833.3%) |
| 2.0x to 2.9x | 202 (16.2%) | 742 (52.2%) |
| 3.0x to 3.9x | 58 (4.7%) | 261 (18.4%) |
| 4.0x or more | 298 (23.9%) | 162 (11.4%) |
| Total | 1,244 (100.0%) | 1,420 (100.0%) |
Real Estate Taxes by Mortgage Status in Tahlequah
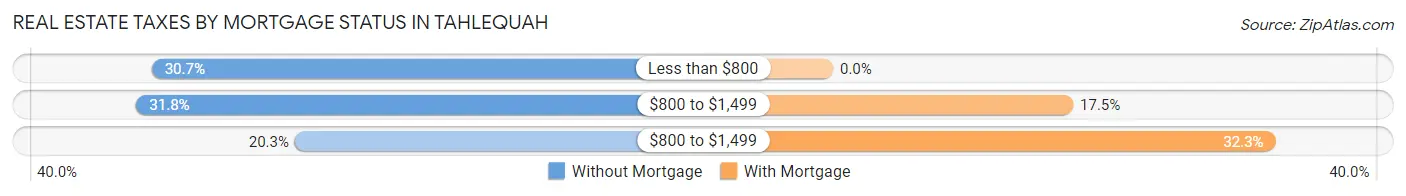
| Property Taxes | Without Mortgage | With Mortgage |
| Less than $800 | 382 (30.7%) | 0 (0.0%) |
| $800 to $1,499 | 396 (31.8%) | 249 (17.5%) |
| $800 to $1,499 | 252 (20.3%) | 459 (32.3%) |
| Total | 1,244 (100.0%) | 1,420 (100.0%) |
Health & Disability in Tahlequah
Health Insurance Coverage by Age in Tahlequah
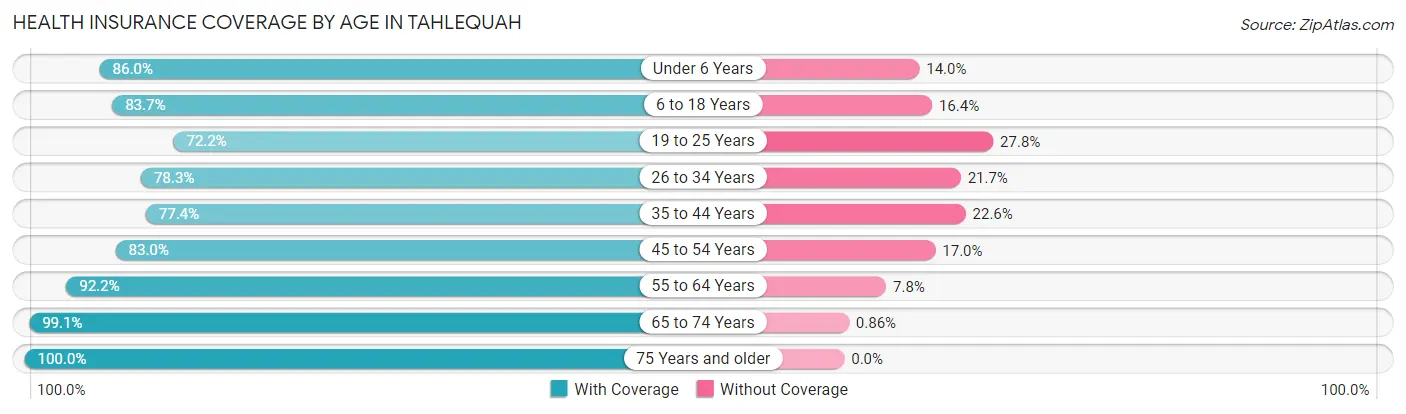
| Age Bracket | With Coverage | Without Coverage |
| Under 6 Years | 824 (86.0%) | 134 (14.0%) |
| 6 to 18 Years | 2,272 (83.7%) | 444 (16.4%) |
| 19 to 25 Years | 2,654 (72.2%) | 1,020 (27.8%) |
| 26 to 34 Years | 1,262 (78.3%) | 350 (21.7%) |
| 35 to 44 Years | 1,598 (77.4%) | 467 (22.6%) |
| 45 to 54 Years | 1,139 (83.0%) | 233 (17.0%) |
| 55 to 64 Years | 1,195 (92.2%) | 101 (7.8%) |
| 65 to 74 Years | 1,148 (99.1%) | 10 (0.9%) |
| 75 Years and older | 1,137 (100.0%) | 0 (0.0%) |
| Total | 13,229 (82.7%) | 2,759 (17.3%) |
Health Insurance Coverage by Citizenship Status in Tahlequah
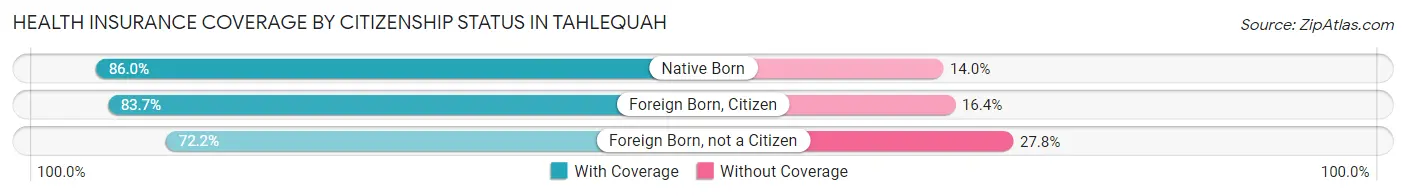
| Citizenship Status | With Coverage | Without Coverage |
| Native Born | 824 (86.0%) | 134 (14.0%) |
| Foreign Born, Citizen | 2,272 (83.7%) | 444 (16.4%) |
| Foreign Born, not a Citizen | 2,654 (72.2%) | 1,020 (27.8%) |
Health Insurance Coverage by Household Income in Tahlequah
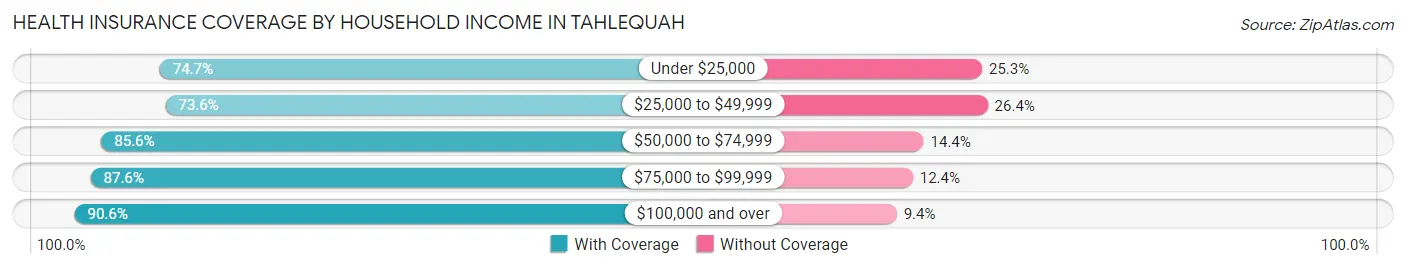
| Household Income | With Coverage | Without Coverage |
| Under $25,000 | 2,281 (74.7%) | 774 (25.3%) |
| $25,000 to $49,999 | 2,053 (73.6%) | 736 (26.4%) |
| $50,000 to $74,999 | 2,963 (85.6%) | 498 (14.4%) |
| $75,000 to $99,999 | 1,849 (87.6%) | 261 (12.4%) |
| $100,000 and over | 2,916 (90.6%) | 301 (9.4%) |
Public vs Private Health Insurance Coverage by Age in Tahlequah
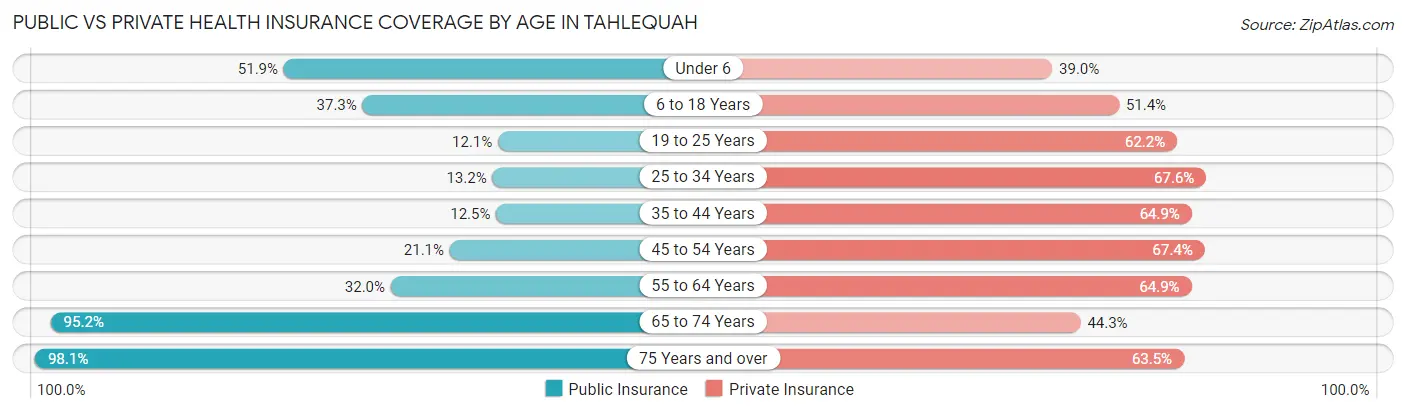
| Age Bracket | Public Insurance | Private Insurance |
| Under 6 | 497 (51.9%) | 374 (39.0%) |
| 6 to 18 Years | 1,012 (37.3%) | 1,397 (51.4%) |
| 19 to 25 Years | 445 (12.1%) | 2,286 (62.2%) |
| 25 to 34 Years | 212 (13.2%) | 1,090 (67.6%) |
| 35 to 44 Years | 257 (12.4%) | 1,341 (64.9%) |
| 45 to 54 Years | 289 (21.1%) | 924 (67.3%) |
| 55 to 64 Years | 415 (32.0%) | 841 (64.9%) |
| 65 to 74 Years | 1,102 (95.2%) | 513 (44.3%) |
| 75 Years and over | 1,115 (98.1%) | 722 (63.5%) |
| Total | 5,344 (33.4%) | 9,488 (59.3%) |
Disability Status by Sex by Age in Tahlequah
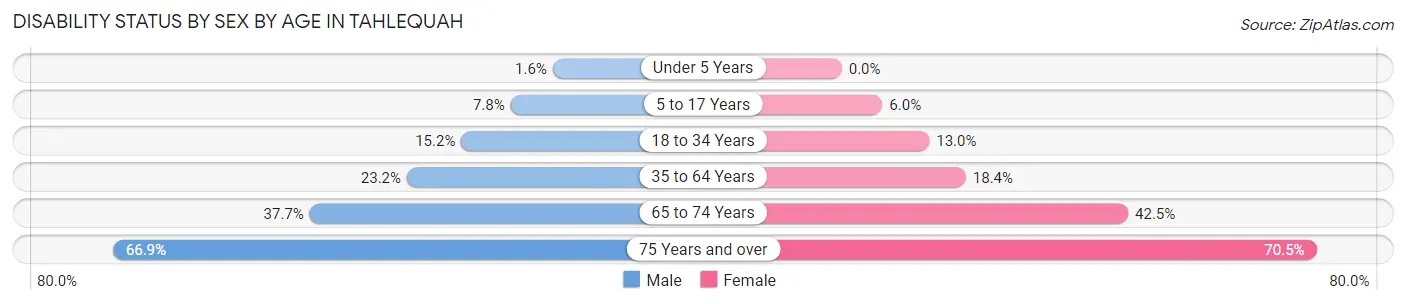
| Age Bracket | Male | Female |
| Under 5 Years | 6 (1.6%) | 0 (0.0%) |
| 5 to 17 Years | 100 (7.8%) | 72 (6.0%) |
| 18 to 34 Years | 439 (15.2%) | 368 (13.0%) |
| 35 to 64 Years | 507 (23.2%) | 470 (18.4%) |
| 65 to 74 Years | 197 (37.7%) | 270 (42.5%) |
| 75 Years and over | 303 (66.9%) | 482 (70.5%) |
Disability Class by Sex by Age in Tahlequah
Disability Class: Hearing Difficulty
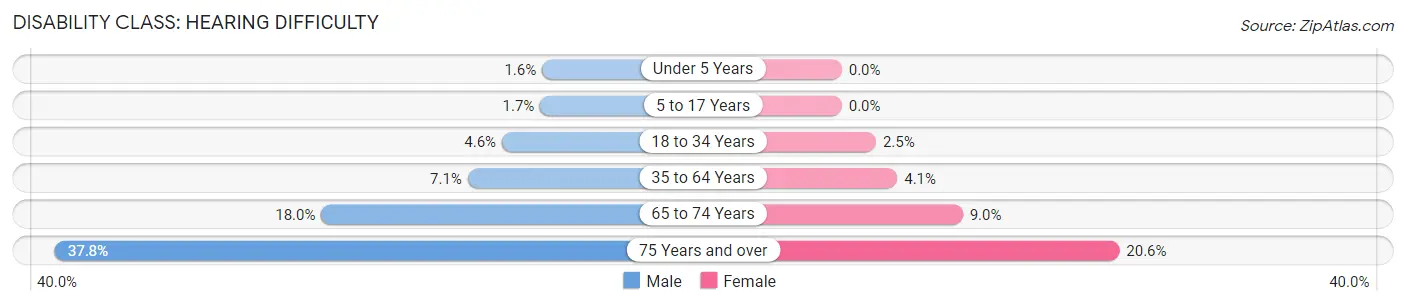
| Age Bracket | Male | Female |
| Under 5 Years | 6 (1.6%) | 0 (0.0%) |
| 5 to 17 Years | 22 (1.7%) | 0 (0.0%) |
| 18 to 34 Years | 132 (4.6%) | 72 (2.5%) |
| 35 to 64 Years | 155 (7.1%) | 105 (4.1%) |
| 65 to 74 Years | 94 (18.0%) | 57 (9.0%) |
| 75 Years and over | 171 (37.8%) | 141 (20.6%) |
Disability Class: Vision Difficulty
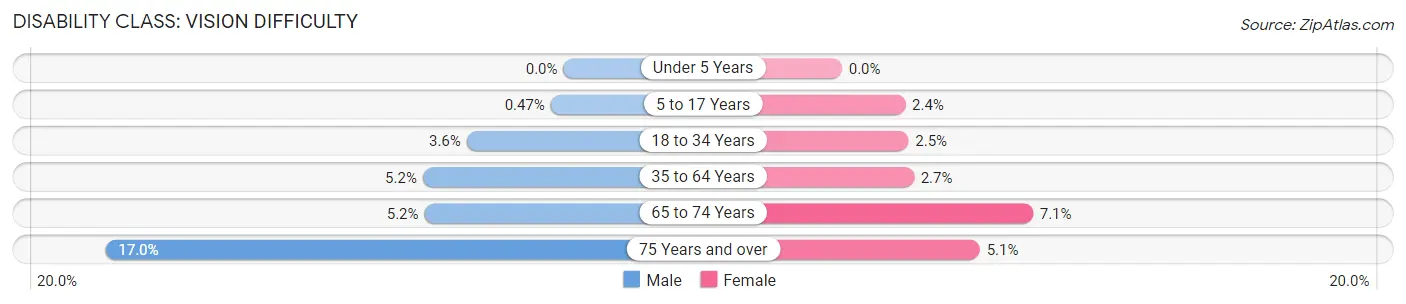
| Age Bracket | Male | Female |
| Under 5 Years | 0 (0.0%) | 0 (0.0%) |
| 5 to 17 Years | 6 (0.5%) | 28 (2.4%) |
| 18 to 34 Years | 104 (3.6%) | 70 (2.5%) |
| 35 to 64 Years | 114 (5.2%) | 68 (2.7%) |
| 65 to 74 Years | 27 (5.2%) | 45 (7.1%) |
| 75 Years and over | 77 (17.0%) | 35 (5.1%) |
Disability Class: Cognitive Difficulty
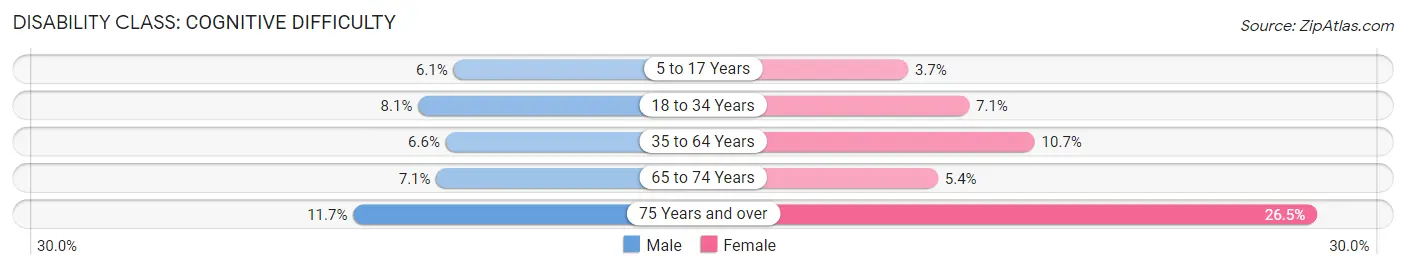
| Age Bracket | Male | Female |
| 5 to 17 Years | 78 (6.1%) | 44 (3.7%) |
| 18 to 34 Years | 234 (8.1%) | 201 (7.1%) |
| 35 to 64 Years | 143 (6.6%) | 274 (10.7%) |
| 65 to 74 Years | 37 (7.1%) | 34 (5.3%) |
| 75 Years and over | 53 (11.7%) | 181 (26.5%) |
Disability Class: Ambulatory Difficulty
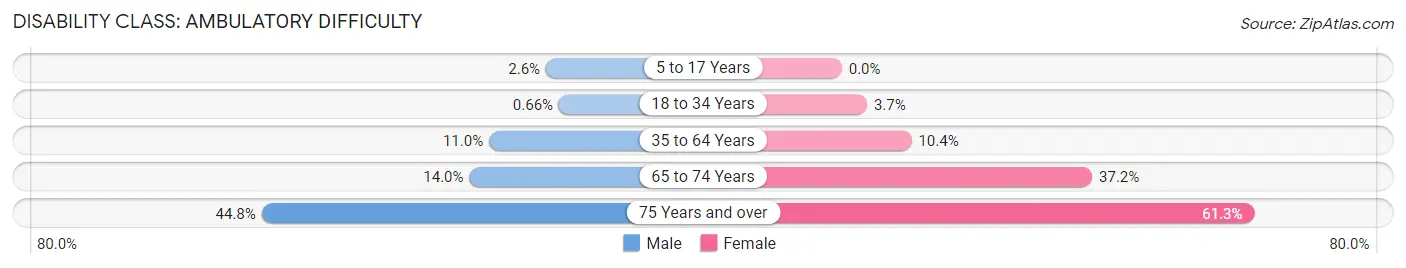
| Age Bracket | Male | Female |
| 5 to 17 Years | 33 (2.6%) | 0 (0.0%) |
| 18 to 34 Years | 19 (0.7%) | 106 (3.7%) |
| 35 to 64 Years | 241 (11.0%) | 264 (10.3%) |
| 65 to 74 Years | 73 (14.0%) | 236 (37.2%) |
| 75 Years and over | 203 (44.8%) | 419 (61.3%) |
Disability Class: Self-Care Difficulty
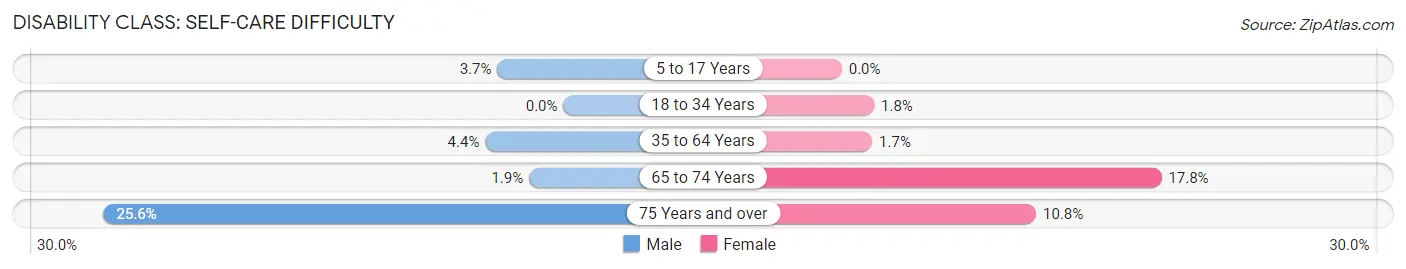
| Age Bracket | Male | Female |
| 5 to 17 Years | 47 (3.7%) | 0 (0.0%) |
| 18 to 34 Years | 0 (0.0%) | 51 (1.8%) |
| 35 to 64 Years | 95 (4.3%) | 43 (1.7%) |
| 65 to 74 Years | 10 (1.9%) | 113 (17.8%) |
| 75 Years and over | 116 (25.6%) | 74 (10.8%) |
Technology Access in Tahlequah
Computing Device Access in Tahlequah
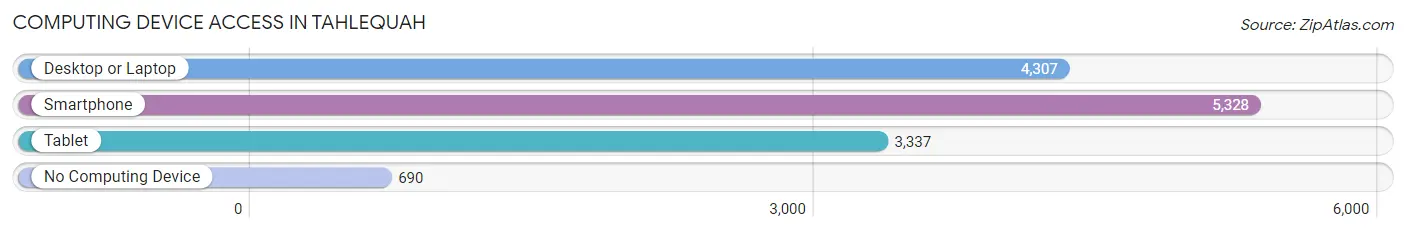
| Device Type | # Households | % Households |
| Desktop or Laptop | 4,307 | 68.6% |
| Smartphone | 5,328 | 84.9% |
| Tablet | 3,337 | 53.2% |
| No Computing Device | 690 | 11.0% |
| Total | 6,274 | 100.0% |
Internet Access in Tahlequah
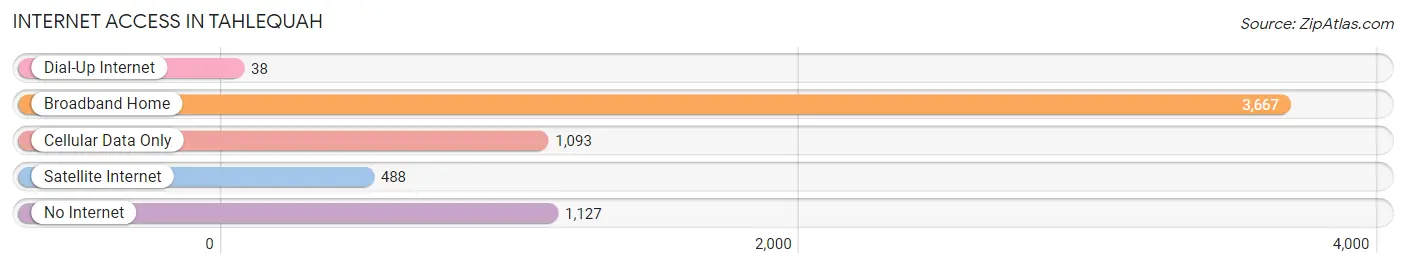
| Internet Type | # Households | % Households |
| Dial-Up Internet | 38 | 0.6% |
| Broadband Home | 3,667 | 58.5% |
| Cellular Data Only | 1,093 | 17.4% |
| Satellite Internet | 488 | 7.8% |
| No Internet | 1,127 | 18.0% |
| Total | 6,274 | 100.0% |
Tahlequah Summary
Tahlequah is a city located in Cherokee County, Oklahoma, United States. It is the county seat of Cherokee County and the capital of the Cherokee Nation. The population was 15,753 at the 2010 census, an increase of 8.96 percent from 14,458 at the 2000 census. It is the largest city within the Cherokee Nation.
History
Tahlequah was established in 1839 as the capital of the Cherokee Nation. The city was named after the Cherokee word for “two waters”, referring to the nearby Illinois and Arkansas rivers. The city was originally located in the Going Snake District of the Cherokee Nation, but was moved to its current location in 1851.
Tahlequah was the site of the Cherokee Female Seminary, the first women’s college in Indian Territory. The school was established in 1851 and operated until 1909. The building is now the home of the Northeastern State University College of Education.
Tahlequah was also the site of the Cherokee National Capitol Building, which served as the seat of government for the Cherokee Nation from 1839 to 1907. The building was destroyed by fire in 1907 and the site is now a park.
Geography
Tahlequah is located in the foothills of the Ozark Mountains in northeastern Oklahoma. The city is situated on the Illinois River, which is a tributary of the Arkansas River. The city is located in the Ozark Highlands ecoregion.
The city has a total area of 11.2 square miles, of which 11.1 square miles is land and 0.1 square miles is water.
Economy
Tahlequah’s economy is largely based on government, education, and health care. The city is home to Northeastern State University, the Cherokee Nation, and the W.W. Hastings Indian Hospital.
The city is also home to several manufacturing companies, including a large poultry processing plant and a large furniture manufacturing plant.
Demographics
As of the 2010 census, there were 15,753 people, 6,068 households, and 3,845 families residing in the city. The population density was 1,421.2 people per square mile. There were 6,717 housing units at an average density of 602.3 per square mile.
The racial makeup of the city was 68.2% White, 0.7% African American, 16.3% Native American, 0.7% Asian, 0.1% Pacific Islander, 0.7% from other races, and 2.5% from two or more races. Hispanic or Latino of any race were 3.2% of the population.
The median income for a household in the city was $30,945, and the median income for a family was $37,945. Males had a median income of $30,945 versus $25,945 for females. The per capita income for the city was $17,945. About 14.2% of families and 18.2% of the population were below the poverty line, including 25.2% of those under age 18 and 11.2% of those age 65 or over.
Conclusion
Tahlequah is a city located in Cherokee County, Oklahoma, United States. It is the county seat of Cherokee County and the capital of the Cherokee Nation. The city has a rich history, with its roots in the Cherokee Nation and the establishment of the Cherokee Female Seminary. The city’s economy is largely based on government, education, and health care. The population of Tahlequah was 15,753 at the 2010 census, with a median household income of $30,945.
Common Questions
What is Per Capita Income in Tahlequah?
Per Capita income in Tahlequah is $26,948.
What is the Median Family Income in Tahlequah?
Median Family Income in Tahlequah is $68,194.
What is the Median Household income in Tahlequah?
Median Household Income in Tahlequah is $49,444.
What is Income or Wage Gap in Tahlequah?
Income or Wage Gap in Tahlequah is 16.2%.
Women in Tahlequah earn 83.8 cents for every dollar earned by a man.
What is Family Income Deficit in Tahlequah?
Family Income Deficit in Tahlequah is $11,874.
Families that are below poverty line in Tahlequah earn $11,874 less on average than the poverty threshold level.
What is Inequality or Gini Index in Tahlequah?
Inequality or Gini Index in Tahlequah is 0.50.
What is the Total Population of Tahlequah?
Total Population of Tahlequah is 16,389.
What is the Total Male Population of Tahlequah?
Total Male Population of Tahlequah is 7,856.
What is the Total Female Population of Tahlequah?
Total Female Population of Tahlequah is 8,533.
What is the Ratio of Males per 100 Females in Tahlequah?
There are 92.07 Males per 100 Females in Tahlequah.
What is the Ratio of Females per 100 Males in Tahlequah?
There are 108.62 Females per 100 Males in Tahlequah.
What is the Median Population Age in Tahlequah?
Median Population Age in Tahlequah is 30.5 Years.
What is the Average Family Size in Tahlequah
Average Family Size in Tahlequah is 3.1 People.
What is the Average Household Size in Tahlequah
Average Household Size in Tahlequah is 2.3 People.
How Large is the Labor Force in Tahlequah?
There are 8,136 People in the Labor Forcein in Tahlequah.
What is the Percentage of People in the Labor Force in Tahlequah?
60.2% of People are in the Labor Force in Tahlequah.
What is the Unemployment Rate in Tahlequah?
Unemployment Rate in Tahlequah is 7.1%.