Stigler, OK Map & Demographics
Stigler Map
Stigler Overview
$20,707
PER CAPITA INCOME
$45,652
AVG FAMILY INCOME
$34,415
AVG HOUSEHOLD INCOME
19.7%
WAGE / INCOME GAP [ % ]
80.3¢/ $1
WAGE / INCOME GAP [ $ ]
$11,531
FAMILY INCOME DEFICIT
0.43
INEQUALITY / GINI INDEX
2,687
TOTAL POPULATION
1,279
MALE POPULATION
1,408
FEMALE POPULATION
90.84
MALES / 100 FEMALES
110.09
FEMALES / 100 MALES
41.1
MEDIAN AGE
3.1
AVG FAMILY SIZE
2.5
AVG HOUSEHOLD SIZE
1,142
LABOR FORCE [ PEOPLE ]
52.5%
PERCENT IN LABOR FORCE
12.6%
UNEMPLOYMENT RATE
Stigler Zip Codes
Stigler Area Codes
Income in Stigler
Income Overview in Stigler
Per Capita Income in Stigler is $20,707, while median incomes of families and households are $45,652 and $34,415 respectively.
| Characteristic | Number | Measure |
| Per Capita Income | 2,687 | $20,707 |
| Median Family Income | 646 | $45,652 |
| Mean Family Income | 646 | $56,357 |
| Median Household Income | 1,068 | $34,415 |
| Mean Household Income | 1,068 | $47,377 |
| Income Deficit | 646 | $11,531 |
| Wage / Income Gap (%) | 2,687 | 19.68% |
| Wage / Income Gap ($) | 2,687 | 80.32¢ per $1 |
| Gini / Inequality Index | 2,687 | 0.43 |
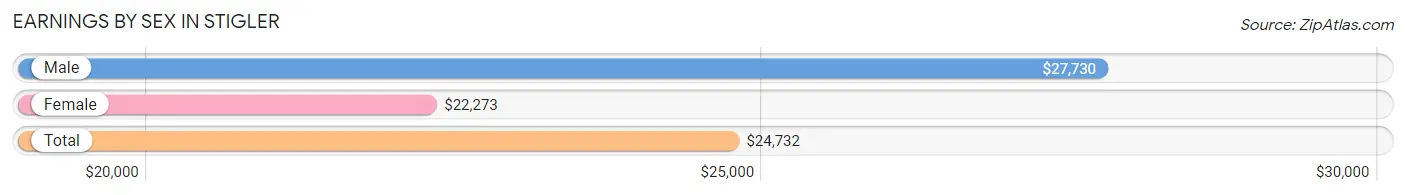
Earnings by Sex in Stigler
Average Earnings in Stigler are $24,732, $27,730 for men and $22,273 for women, a difference of 19.7%.
| Sex | Number | Average Earnings |
| Male | 619 (51.8%) | $27,730 |
| Female | 576 (48.2%) | $22,273 |
| Total | 1,195 (100.0%) | $24,732 |
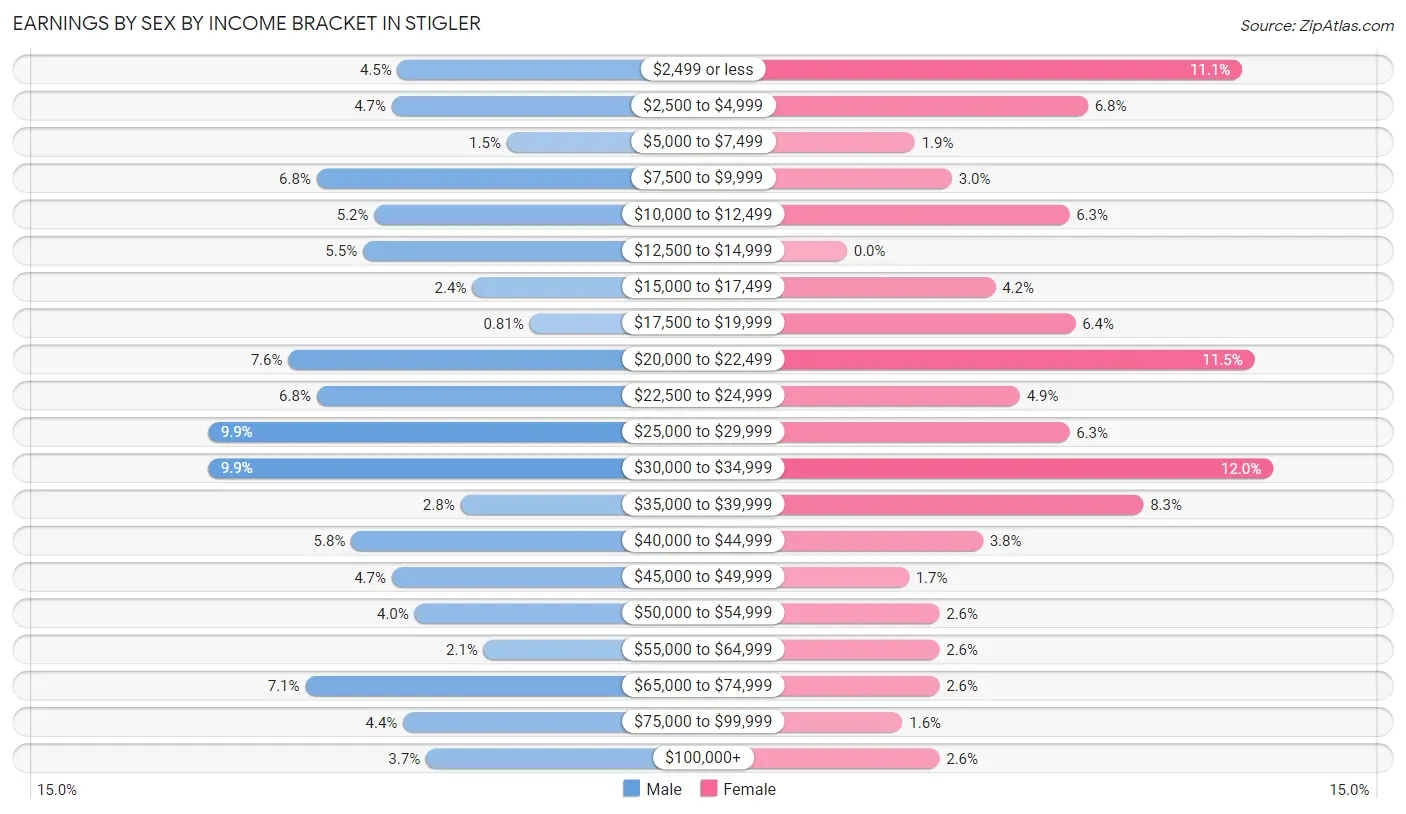
Earnings by Sex by Income Bracket in Stigler
The most common earnings brackets in Stigler are $25,000 to $29,999 for men (61 | 9.9%) and $30,000 to $34,999 for women (69 | 12.0%).
| Income | Male | Female |
| $2,499 or less | 28 (4.5%) | 64 (11.1%) |
| $2,500 to $4,999 | 29 (4.7%) | 39 (6.8%) |
| $5,000 to $7,499 | 9 (1.5%) | 11 (1.9%) |
| $7,500 to $9,999 | 42 (6.8%) | 17 (2.9%) |
| $10,000 to $12,499 | 32 (5.2%) | 36 (6.2%) |
| $12,500 to $14,999 | 34 (5.5%) | 0 (0.0%) |
| $15,000 to $17,499 | 15 (2.4%) | 24 (4.2%) |
| $17,500 to $19,999 | 5 (0.8%) | 37 (6.4%) |
| $20,000 to $22,499 | 47 (7.6%) | 66 (11.5%) |
| $22,500 to $24,999 | 42 (6.8%) | 28 (4.9%) |
| $25,000 to $29,999 | 61 (9.9%) | 36 (6.2%) |
| $30,000 to $34,999 | 61 (9.9%) | 69 (12.0%) |
| $35,000 to $39,999 | 17 (2.8%) | 48 (8.3%) |
| $40,000 to $44,999 | 36 (5.8%) | 22 (3.8%) |
| $45,000 to $49,999 | 29 (4.7%) | 10 (1.7%) |
| $50,000 to $54,999 | 25 (4.0%) | 15 (2.6%) |
| $55,000 to $64,999 | 13 (2.1%) | 15 (2.6%) |
| $65,000 to $74,999 | 44 (7.1%) | 15 (2.6%) |
| $75,000 to $99,999 | 27 (4.4%) | 9 (1.6%) |
| $100,000+ | 23 (3.7%) | 15 (2.6%) |
| Total | 619 (100.0%) | 576 (100.0%) |
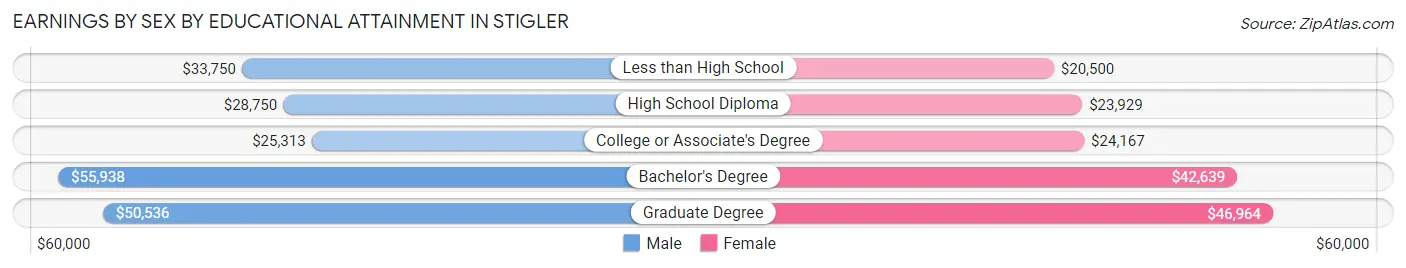
Earnings by Sex by Educational Attainment in Stigler
Average earnings in Stigler are $31,000 for men and $26,000 for women, a difference of 16.1%. Men with an educational attainment of bachelor's degree enjoy the highest average annual earnings of $55,938, while those with college or associate's degree education earn the least with $25,313. Women with an educational attainment of graduate degree earn the most with the average annual earnings of $46,964, while those with less than high school education have the smallest earnings of $20,500.
| Educational Attainment | Male Income | Female Income |
| Less than High School | $33,750 | $20,500 |
| High School Diploma | $28,750 | $23,929 |
| College or Associate's Degree | $25,313 | $24,167 |
| Bachelor's Degree | $55,938 | $42,639 |
| Graduate Degree | $50,536 | $46,964 |
| Total | $31,000 | $26,000 |
Family Income in Stigler
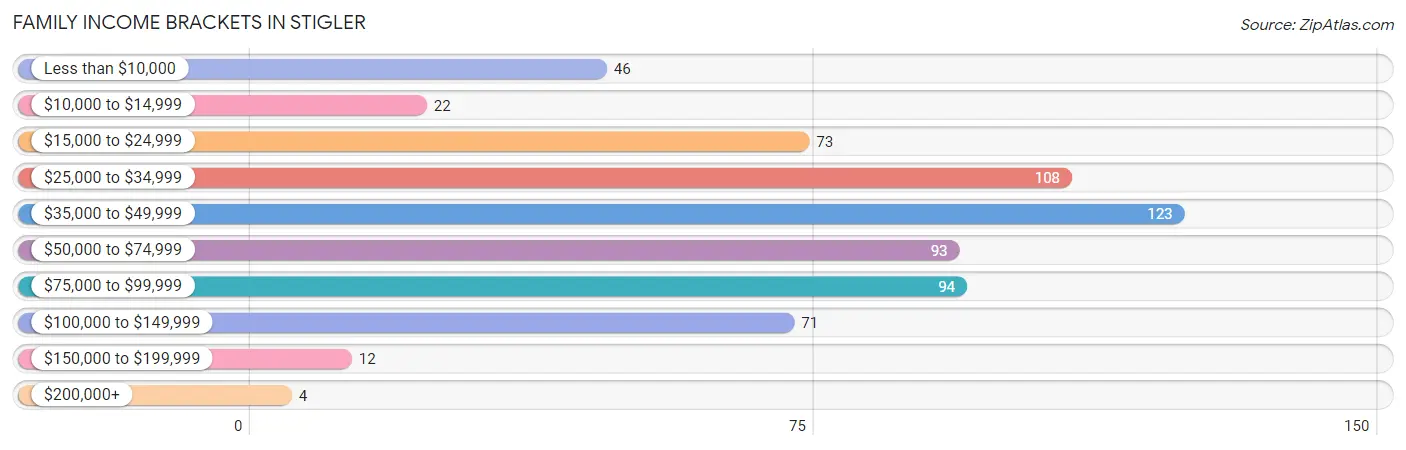
Family Income Brackets in Stigler
According to the Stigler family income data, there are 123 families falling into the $35,000 to $49,999 income range, which is the most common income bracket and makes up 19.0% of all families. Conversely, the $200,000+ income bracket is the least frequent group with only 4 families (0.6%) belonging to this category.
| Income Bracket | # Families | % Families |
| Less than $10,000 | 46 | 7.1% |
| $10,000 to $14,999 | 22 | 3.4% |
| $15,000 to $24,999 | 73 | 11.3% |
| $25,000 to $34,999 | 108 | 16.7% |
| $35,000 to $49,999 | 123 | 19.0% |
| $50,000 to $74,999 | 93 | 14.4% |
| $75,000 to $99,999 | 94 | 14.6% |
| $100,000 to $149,999 | 71 | 11.0% |
| $150,000 to $199,999 | 12 | 1.9% |
| $200,000+ | 4 | 0.6% |
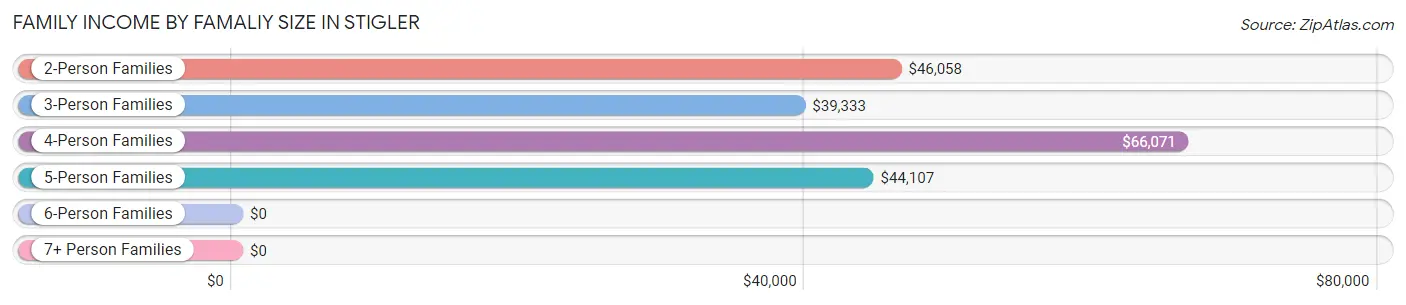
Family Income by Famaliy Size in Stigler
4-person families (74 | 11.5%) account for the highest median family income in Stigler with $66,071 per family, while 2-person families (291 | 45.1%) have the highest median income of $23,029 per family member.
| Income Bracket | # Families | Median Income |
| 2-Person Families | 291 (45.1%) | $46,058 |
| 3-Person Families | 214 (33.1%) | $39,333 |
| 4-Person Families | 74 (11.5%) | $66,071 |
| 5-Person Families | 35 (5.4%) | $44,107 |
| 6-Person Families | 32 (5.0%) | $0 |
| 7+ Person Families | 0 (0.0%) | $0 |
| Total | 646 (100.0%) | $45,652 |
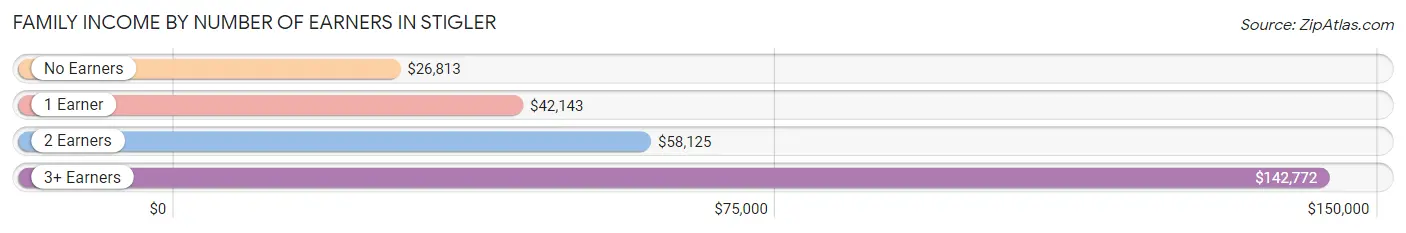
Family Income by Number of Earners in Stigler
The median family income in Stigler is $45,652, with families comprising 3+ earners (41) having the highest median family income of $142,772, while families with no earners (123) have the lowest median family income of $26,813, accounting for 6.4% and 19.0% of families, respectively.
| Number of Earners | # Families | Median Income |
| No Earners | 123 (19.0%) | $26,813 |
| 1 Earner | 286 (44.3%) | $42,143 |
| 2 Earners | 196 (30.3%) | $58,125 |
| 3+ Earners | 41 (6.4%) | $142,772 |
| Total | 646 (100.0%) | $45,652 |
Household Income in Stigler
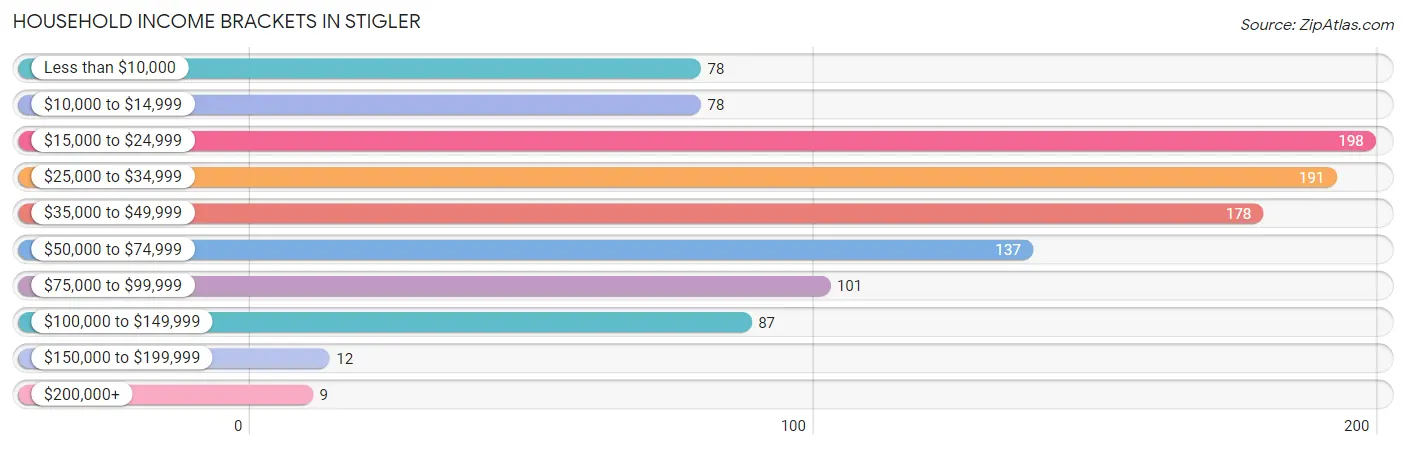
Household Income Brackets in Stigler
With 198 households falling in the category, the $15,000 to $24,999 income range is the most frequent in Stigler, accounting for 18.5% of all households. In contrast, only 9 households (0.8%) fall into the $200,000+ income bracket, making it the least populous group.
| Income Bracket | # Households | % Households |
| Less than $10,000 | 78 | 7.3% |
| $10,000 to $14,999 | 78 | 7.3% |
| $15,000 to $24,999 | 198 | 18.5% |
| $25,000 to $34,999 | 191 | 17.9% |
| $35,000 to $49,999 | 178 | 16.7% |
| $50,000 to $74,999 | 137 | 12.8% |
| $75,000 to $99,999 | 101 | 9.5% |
| $100,000 to $149,999 | 87 | 8.1% |
| $150,000 to $199,999 | 12 | 1.1% |
| $200,000+ | 9 | 0.8% |
Household Income by Householder Age in Stigler
The median household income in Stigler is $34,415, with the highest median household income of $43,929 found in the 25 to 44 years age bracket for the primary householder. A total of 312 households (29.2%) fall into this category. Meanwhile, the 15 to 24 years age bracket for the primary householder has the lowest median household income of $26,563, with 61 households (5.7%) in this group.
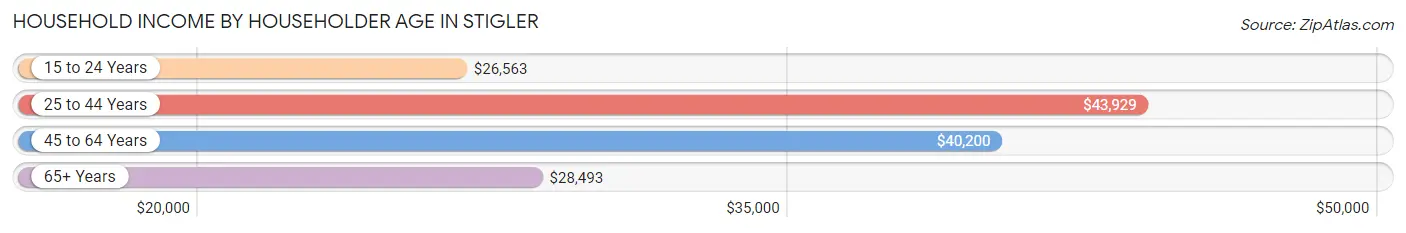
| Income Bracket | # Households | Median Income |
| 15 to 24 Years | 61 (5.7%) | $26,563 |
| 25 to 44 Years | 312 (29.2%) | $43,929 |
| 45 to 64 Years | 364 (34.1%) | $40,200 |
| 65+ Years | 331 (31.0%) | $28,493 |
| Total | 1,068 (100.0%) | $34,415 |
Poverty in Stigler
Income Below Poverty by Sex and Age in Stigler
With 18.6% poverty level for males and 27.8% for females among the residents of Stigler, under 5 year old males and 15 year old females are the most vulnerable to poverty, with 44 males (51.2%) and 9 females (75.0%) in their respective age groups living below the poverty level.
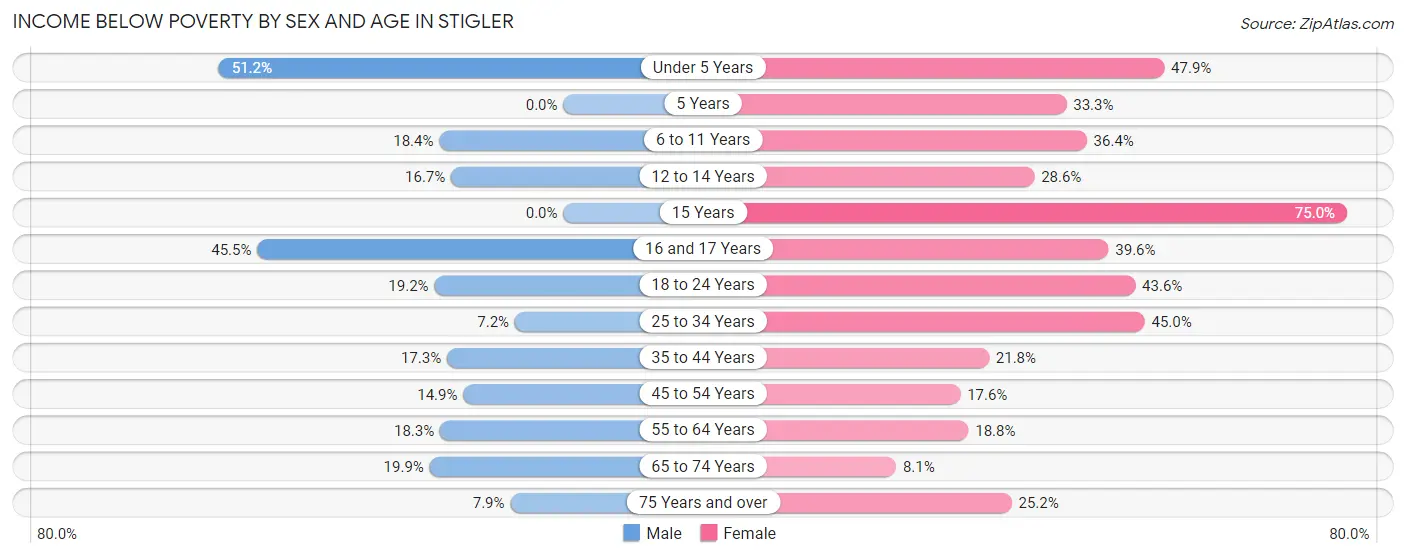
| Age Bracket | Male | Female |
| Under 5 Years | 44 (51.2%) | 45 (47.9%) |
| 5 Years | 0 (0.0%) | 12 (33.3%) |
| 6 to 11 Years | 7 (18.4%) | 28 (36.4%) |
| 12 to 14 Years | 10 (16.7%) | 12 (28.6%) |
| 15 Years | 0 (0.0%) | 9 (75.0%) |
| 16 and 17 Years | 20 (45.5%) | 19 (39.6%) |
| 18 to 24 Years | 27 (19.2%) | 44 (43.6%) |
| 25 to 34 Years | 12 (7.2%) | 58 (45.0%) |
| 35 to 44 Years | 28 (17.3%) | 38 (21.8%) |
| 45 to 54 Years | 22 (14.9%) | 29 (17.6%) |
| 55 to 64 Years | 26 (18.3%) | 37 (18.8%) |
| 65 to 74 Years | 26 (19.9%) | 12 (8.1%) |
| 75 Years and over | 7 (7.9%) | 30 (25.2%) |
| Total | 229 (18.6%) | 373 (27.8%) |
Income Above Poverty by Sex and Age in Stigler
According to the poverty statistics in Stigler, males aged 5 years and females aged 65 to 74 years are the age groups that are most secure financially, with 100.0% of males and 91.9% of females in these age groups living above the poverty line.
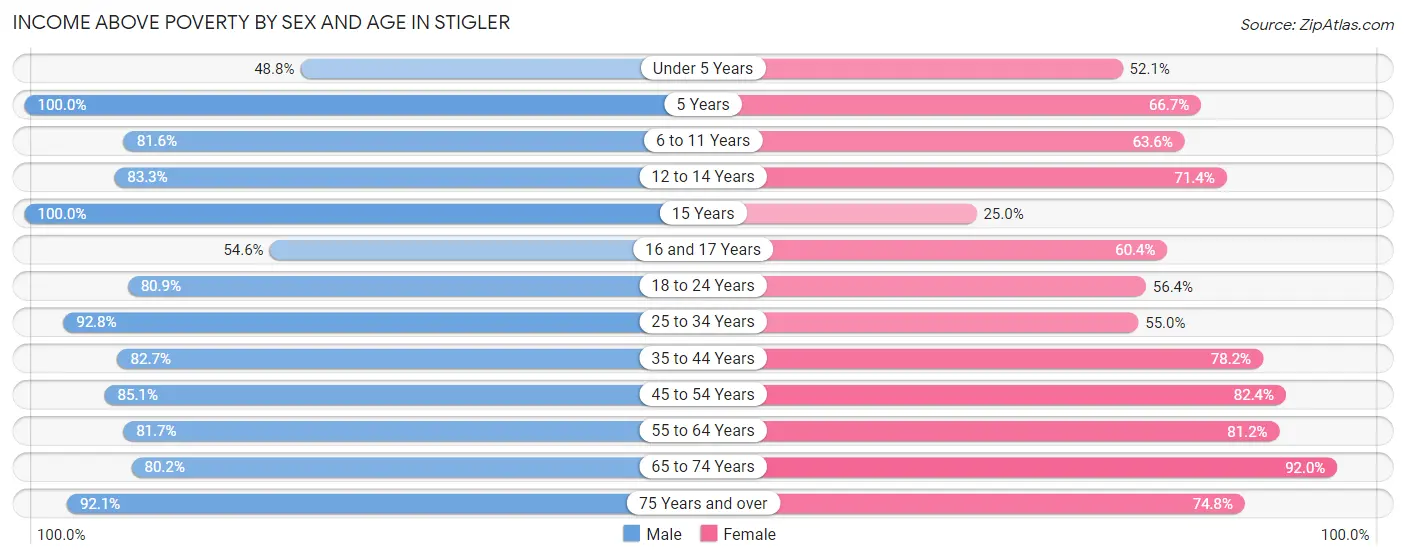
| Age Bracket | Male | Female |
| Under 5 Years | 42 (48.8%) | 49 (52.1%) |
| 5 Years | 8 (100.0%) | 24 (66.7%) |
| 6 to 11 Years | 31 (81.6%) | 49 (63.6%) |
| 12 to 14 Years | 50 (83.3%) | 30 (71.4%) |
| 15 Years | 18 (100.0%) | 3 (25.0%) |
| 16 and 17 Years | 24 (54.5%) | 29 (60.4%) |
| 18 to 24 Years | 114 (80.8%) | 57 (56.4%) |
| 25 to 34 Years | 155 (92.8%) | 71 (55.0%) |
| 35 to 44 Years | 134 (82.7%) | 136 (78.2%) |
| 45 to 54 Years | 126 (85.1%) | 136 (82.4%) |
| 55 to 64 Years | 116 (81.7%) | 160 (81.2%) |
| 65 to 74 Years | 105 (80.1%) | 137 (91.9%) |
| 75 Years and over | 82 (92.1%) | 89 (74.8%) |
| Total | 1,005 (81.4%) | 970 (72.2%) |
Income Below Poverty Among Married-Couple Families in Stigler
The poverty statistics for married-couple families in Stigler show that 10.8% or 43 of the total 399 families live below the poverty line. Families with 3 or 4 children have the highest poverty rate of 15.6%, comprising of 7 families. On the other hand, families with no children have the lowest poverty rate of 8.9%, which includes 23 families.
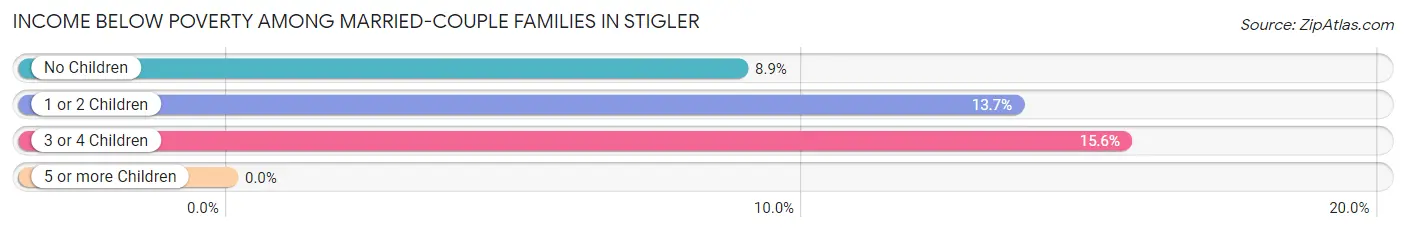
| Children | Above Poverty | Below Poverty |
| No Children | 236 (91.1%) | 23 (8.9%) |
| 1 or 2 Children | 82 (86.3%) | 13 (13.7%) |
| 3 or 4 Children | 38 (84.4%) | 7 (15.6%) |
| 5 or more Children | 0 (0.0%) | 0 (0.0%) |
| Total | 356 (89.2%) | 43 (10.8%) |
Income Below Poverty Among Single-Parent Households in Stigler
According to the poverty data in Stigler, 17.9% or 12 single-father households and 38.3% or 69 single-mother households are living below the poverty line. Among single-father households, those with 1 or 2 children have the highest poverty rate, with 9 households (32.1%) experiencing poverty. Likewise, among single-mother households, those with 3 or 4 children have the highest poverty rate, with 16 households (100.0%) falling below the poverty line.
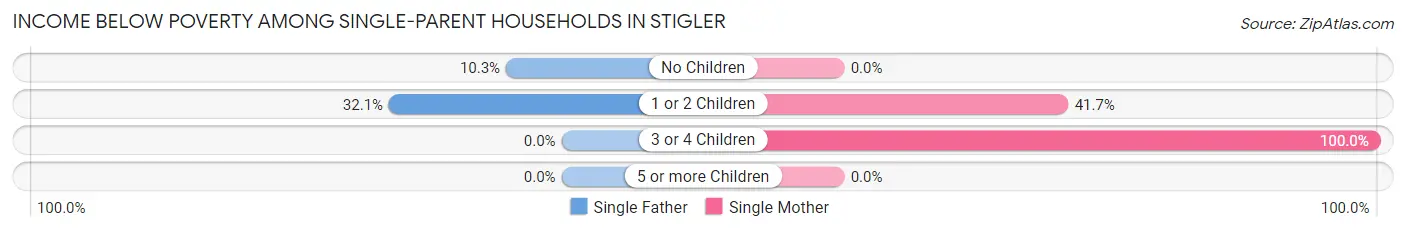
| Children | Single Father | Single Mother |
| No Children | 3 (10.3%) | 0 (0.0%) |
| 1 or 2 Children | 9 (32.1%) | 53 (41.7%) |
| 3 or 4 Children | 0 (0.0%) | 16 (100.0%) |
| 5 or more Children | 0 (0.0%) | 0 (0.0%) |
| Total | 12 (17.9%) | 69 (38.3%) |
Income Below Poverty Among Married-Couple vs Single-Parent Households in Stigler
The poverty data for Stigler shows that 43 of the married-couple family households (10.8%) and 81 of the single-parent households (32.8%) are living below the poverty level. Within the married-couple family households, those with 3 or 4 children have the highest poverty rate, with 7 households (15.6%) falling below the poverty line. Among the single-parent households, those with 3 or 4 children have the highest poverty rate, with 16 household (61.5%) living below poverty.
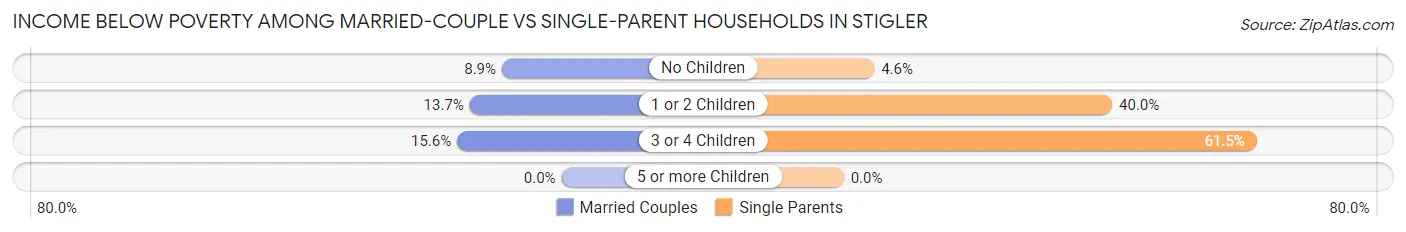
| Children | Married-Couple Families | Single-Parent Households |
| No Children | 23 (8.9%) | 3 (4.5%) |
| 1 or 2 Children | 13 (13.7%) | 62 (40.0%) |
| 3 or 4 Children | 7 (15.6%) | 16 (61.5%) |
| 5 or more Children | 0 (0.0%) | 0 (0.0%) |
| Total | 43 (10.8%) | 81 (32.8%) |
Race in Stigler
The most populous races in Stigler are White / Caucasian (1,871 | 69.6%), Two or more Races (481 | 17.9%), and Hispanic or Latino (345 | 12.8%).
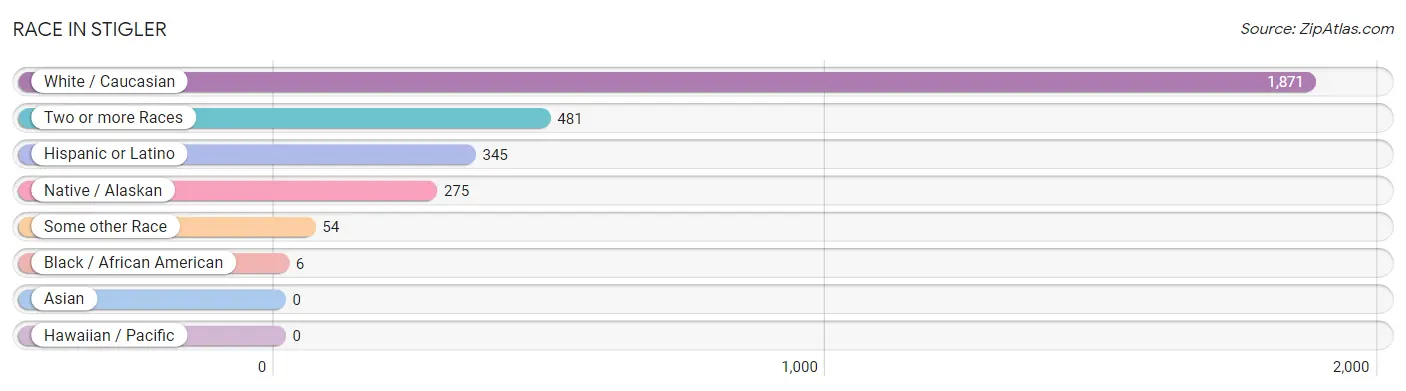
| Race | # Population | % Population |
| Asian | 0 | 0.0% |
| Black / African American | 6 | 0.2% |
| Hawaiian / Pacific | 0 | 0.0% |
| Hispanic or Latino | 345 | 12.8% |
| Native / Alaskan | 275 | 10.2% |
| White / Caucasian | 1,871 | 69.6% |
| Two or more Races | 481 | 17.9% |
| Some other Race | 54 | 2.0% |
| Total | 2,687 | 100.0% |
Ancestry in Stigler
The most populous ancestries reported in Stigler are American (460 | 17.1%), Mexican (332 | 12.4%), Choctaw (319 | 11.9%), Irish (262 | 9.8%), and Cherokee (248 | 9.2%), together accounting for 60.3% of all Stigler residents.
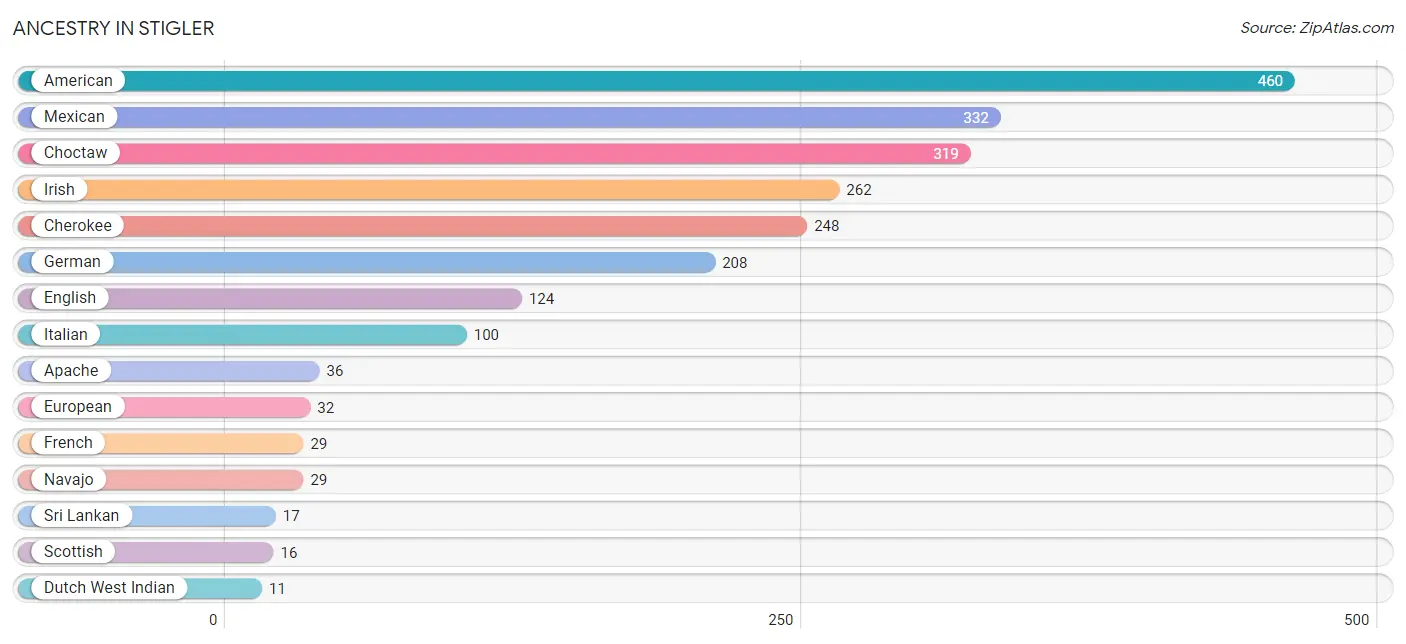
| Ancestry | # Population | % Population |
| American | 460 | 17.1% |
| Apache | 36 | 1.3% |
| Belgian | 1 | 0.0% |
| Bhutanese | 1 | 0.0% |
| Blackfeet | 10 | 0.4% |
| Cherokee | 248 | 9.2% |
| Choctaw | 319 | 11.9% |
| Czech | 10 | 0.4% |
| Czechoslovakian | 3 | 0.1% |
| Danish | 4 | 0.2% |
| Dutch | 8 | 0.3% |
| Dutch West Indian | 11 | 0.4% |
| English | 124 | 4.6% |
| European | 32 | 1.2% |
| Finnish | 10 | 0.4% |
| French | 29 | 1.1% |
| German | 208 | 7.7% |
| Irish | 262 | 9.8% |
| Italian | 100 | 3.7% |
| Mexican | 332 | 12.4% |
| Navajo | 29 | 1.1% |
| Norwegian | 7 | 0.3% |
| Polish | 7 | 0.3% |
| Portuguese | 2 | 0.1% |
| Potawatomi | 6 | 0.2% |
| Puerto Rican | 5 | 0.2% |
| Scotch-Irish | 5 | 0.2% |
| Scottish | 16 | 0.6% |
| Seminole | 5 | 0.2% |
| Sioux | 3 | 0.1% |
| Spanish | 8 | 0.3% |
| Sri Lankan | 17 | 0.6% |
| Swedish | 3 | 0.1% |
| Welsh | 3 | 0.1% | View All 34 Rows |
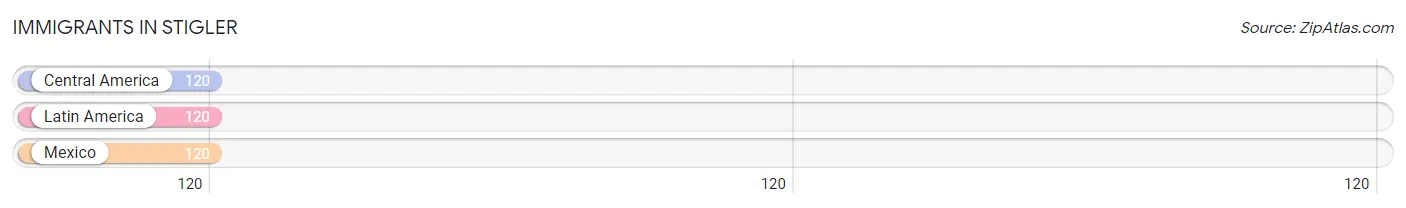
Immigrants in Stigler
The most numerous immigrant groups reported in Stigler came from Central America (120 | 4.5%), Latin America (120 | 4.5%), and Mexico (120 | 4.5%), together accounting for 13.4% of all Stigler residents.
| Immigration Origin | # Population | % Population |
| Central America | 120 | 4.5% |
| Latin America | 120 | 4.5% |
| Mexico | 120 | 4.5% | View All 3 Rows |
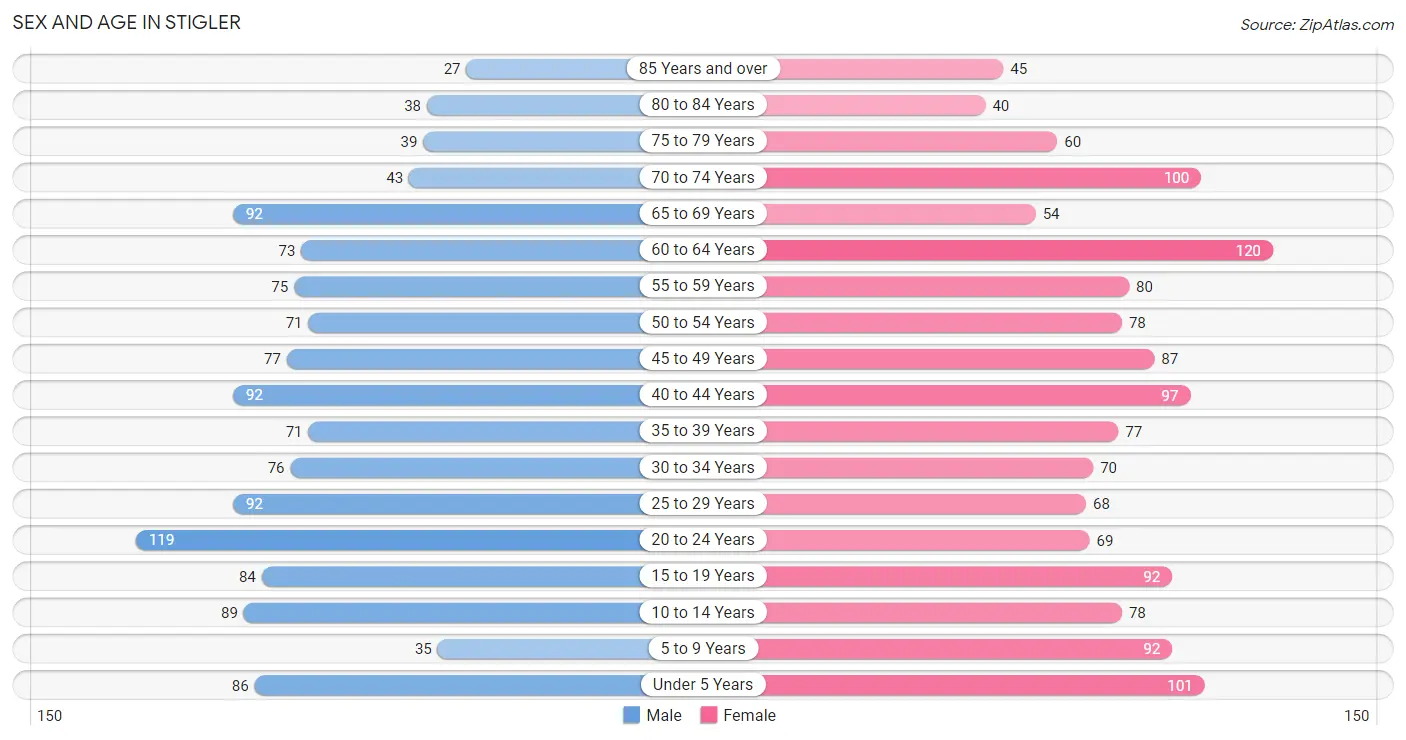
Sex and Age in Stigler
Sex and Age in Stigler
The most populous age groups in Stigler are 20 to 24 Years (119 | 9.3%) for men and 60 to 64 Years (120 | 8.5%) for women.
| Age Bracket | Male | Female |
| Under 5 Years | 86 (6.7%) | 101 (7.2%) |
| 5 to 9 Years | 35 (2.7%) | 92 (6.5%) |
| 10 to 14 Years | 89 (7.0%) | 78 (5.5%) |
| 15 to 19 Years | 84 (6.6%) | 92 (6.5%) |
| 20 to 24 Years | 119 (9.3%) | 69 (4.9%) |
| 25 to 29 Years | 92 (7.2%) | 68 (4.8%) |
| 30 to 34 Years | 76 (5.9%) | 70 (5.0%) |
| 35 to 39 Years | 71 (5.6%) | 77 (5.5%) |
| 40 to 44 Years | 92 (7.2%) | 97 (6.9%) |
| 45 to 49 Years | 77 (6.0%) | 87 (6.2%) |
| 50 to 54 Years | 71 (5.6%) | 78 (5.5%) |
| 55 to 59 Years | 75 (5.9%) | 80 (5.7%) |
| 60 to 64 Years | 73 (5.7%) | 120 (8.5%) |
| 65 to 69 Years | 92 (7.2%) | 54 (3.8%) |
| 70 to 74 Years | 43 (3.4%) | 100 (7.1%) |
| 75 to 79 Years | 39 (3.0%) | 60 (4.3%) |
| 80 to 84 Years | 38 (3.0%) | 40 (2.8%) |
| 85 Years and over | 27 (2.1%) | 45 (3.2%) |
| Total | 1,279 (100.0%) | 1,408 (100.0%) |
Families and Households in Stigler
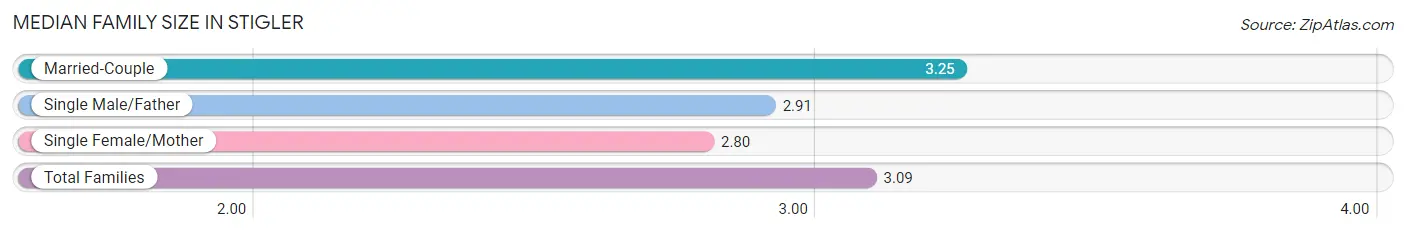
Median Family Size in Stigler
The median family size in Stigler is 3.09 persons per family, with married-couple families (399 | 61.8%) accounting for the largest median family size of 3.25 persons per family. On the other hand, single female/mother families (180 | 27.9%) represent the smallest median family size with 2.80 persons per family.
| Family Type | # Families | Family Size |
| Married-Couple | 399 (61.8%) | 3.25 |
| Single Male/Father | 67 (10.4%) | 2.91 |
| Single Female/Mother | 180 (27.9%) | 2.80 |
| Total Families | 646 (100.0%) | 3.09 |
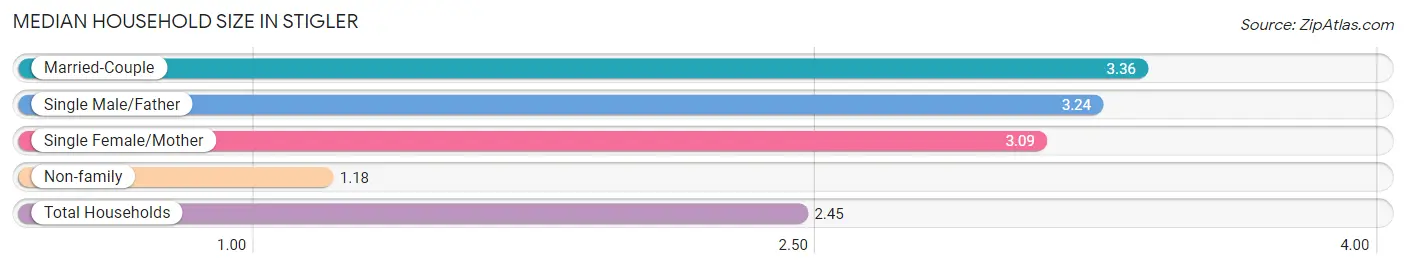
Median Household Size in Stigler
The median household size in Stigler is 2.45 persons per household, with married-couple households (399 | 37.4%) accounting for the largest median household size of 3.36 persons per household. non-family households (422 | 39.5%) represent the smallest median household size with 1.18 persons per household.
| Household Type | # Households | Household Size |
| Married-Couple | 399 (37.4%) | 3.36 |
| Single Male/Father | 67 (6.3%) | 3.24 |
| Single Female/Mother | 180 (16.9%) | 3.09 |
| Non-family | 422 (39.5%) | 1.18 |
| Total Households | 1,068 (100.0%) | 2.45 |
Household Size by Marriage Status in Stigler
Out of a total of 1,068 households in Stigler, 646 (60.5%) are family households, while 422 (39.5%) are nonfamily households. The most numerous type of family households are 2-person households, comprising 269, and the most common type of nonfamily households are 1-person households, comprising 366.
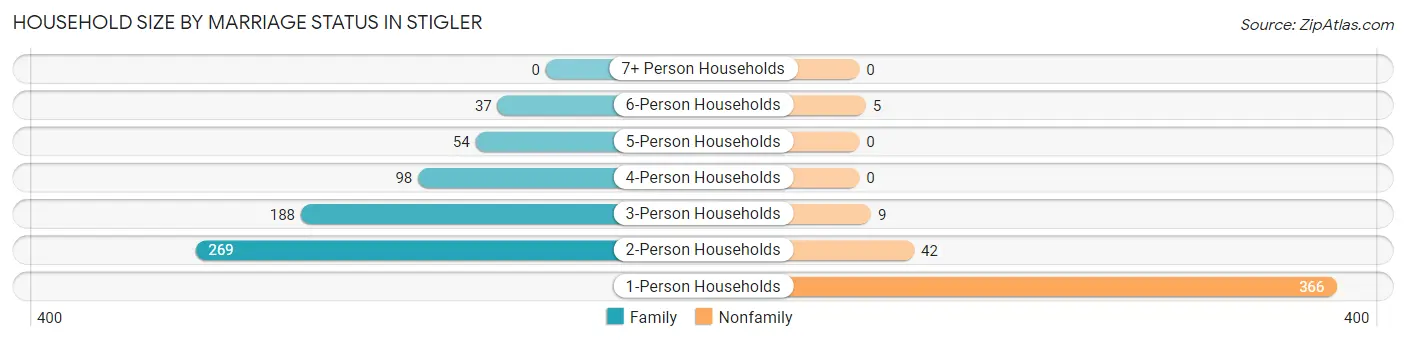
| Household Size | Family Households | Nonfamily Households |
| 1-Person Households | - | 366 (34.3%) |
| 2-Person Households | 269 (25.2%) | 42 (3.9%) |
| 3-Person Households | 188 (17.6%) | 9 (0.8%) |
| 4-Person Households | 98 (9.2%) | 0 (0.0%) |
| 5-Person Households | 54 (5.1%) | 0 (0.0%) |
| 6-Person Households | 37 (3.5%) | 5 (0.5%) |
| 7+ Person Households | 0 (0.0%) | 0 (0.0%) |
| Total | 646 (60.5%) | 422 (39.5%) |
Female Fertility in Stigler
Fertility by Age in Stigler
Average fertility rate in Stigler is 60.0 births per 1,000 women. Women in the age bracket of 20 to 34 years have the highest fertility rate with 145.0 births per 1,000 women. Women in the age bracket of 20 to 34 years acount for 85.7% of all women with births.
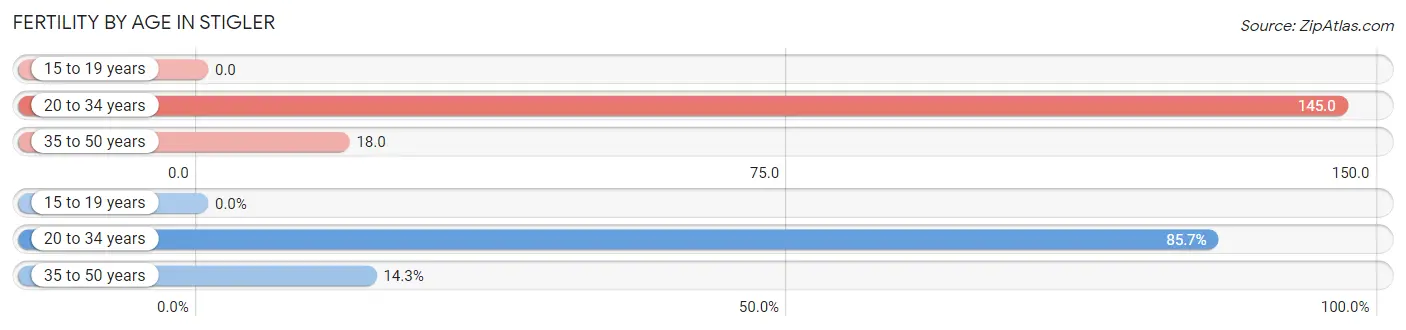
| Age Bracket | Women with Births | Births / 1,000 Women |
| 15 to 19 years | 0 (0.0%) | 0.0 |
| 20 to 34 years | 30 (85.7%) | 145.0 |
| 35 to 50 years | 5 (14.3%) | 18.0 |
| Total | 35 (100.0%) | 60.0 |
Fertility by Age by Marriage Status in Stigler
62.9% of women with births (35) in Stigler are married. The highest percentage of unmarried women with births falls into 35 to 50 years age bracket with 100.0% of them unmarried at the time of birth, while the lowest percentage of unmarried women with births belong to 20 to 34 years age bracket with 26.7% of them unmarried.
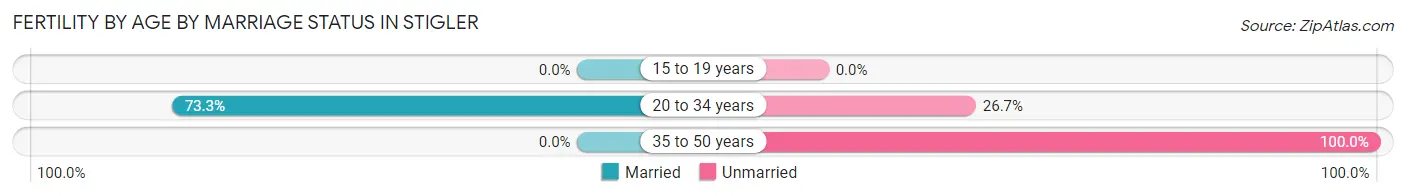
| Age Bracket | Married | Unmarried |
| 15 to 19 years | 0 (0.0%) | 0 (0.0%) |
| 20 to 34 years | 22 (73.3%) | 8 (26.7%) |
| 35 to 50 years | 0 (0.0%) | 5 (100.0%) |
| Total | 22 (62.9%) | 13 (37.1%) |
Fertility by Education in Stigler
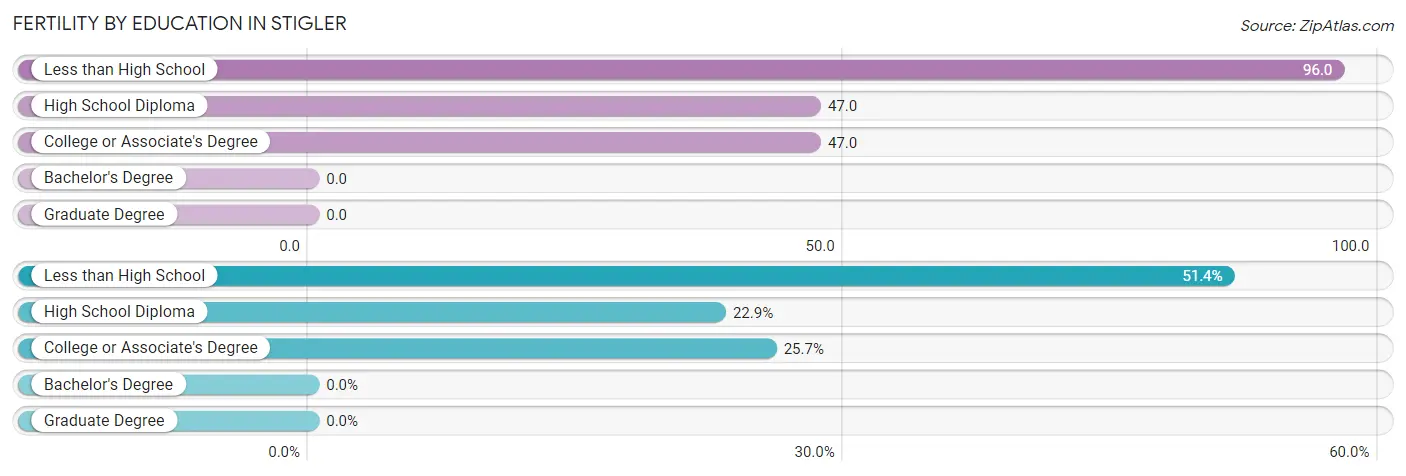
| Educational Attainment | Women with Births | Births / 1,000 Women |
| Less than High School | 18 (51.4%) | 96.0 |
| High School Diploma | 8 (22.9%) | 47.0 |
| College or Associate's Degree | 9 (25.7%) | 47.0 |
| Bachelor's Degree | 0 (0.0%) | 0.0 |
| Graduate Degree | 0 (0.0%) | 0.0 |
| Total | 35 (100.0%) | 60.0 |
Fertility by Education by Marriage Status in Stigler
37.1% of women with births in Stigler are unmarried. Women with the educational attainment of high school diploma are most likely to be married with 100.0% of them married at childbirth, while women with the educational attainment of less than high school are least likely to be married with 72.2% of them unmarried at childbirth.
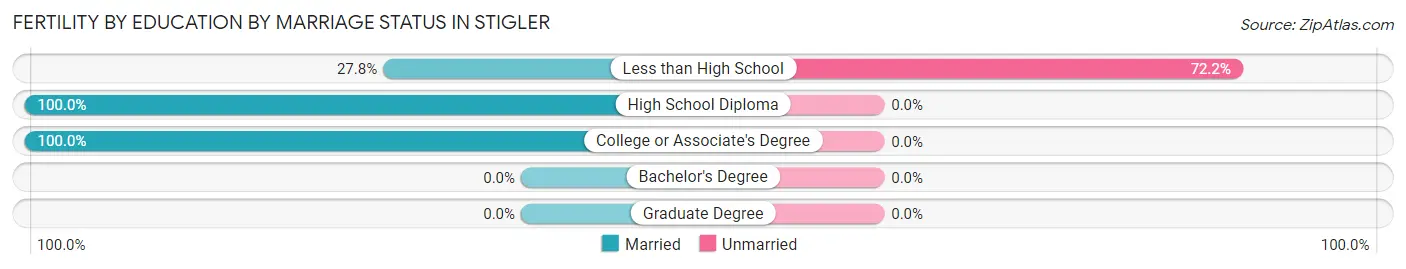
| Educational Attainment | Married | Unmarried |
| Less than High School | 5 (27.8%) | 13 (72.2%) |
| High School Diploma | 8 (100.0%) | 0 (0.0%) |
| College or Associate's Degree | 9 (100.0%) | 0 (0.0%) |
| Bachelor's Degree | 0 (0.0%) | 0 (0.0%) |
| Graduate Degree | 0 (0.0%) | 0 (0.0%) |
| Total | 22 (62.9%) | 13 (37.1%) |
Employment Characteristics in Stigler
Employment by Class of Employer in Stigler
Among the 962 employed individuals in Stigler, private company employees (581 | 60.4%), self-employed (not incorporated) (143 | 14.9%), and local government employees (81 | 8.4%) make up the most common classes of employment.
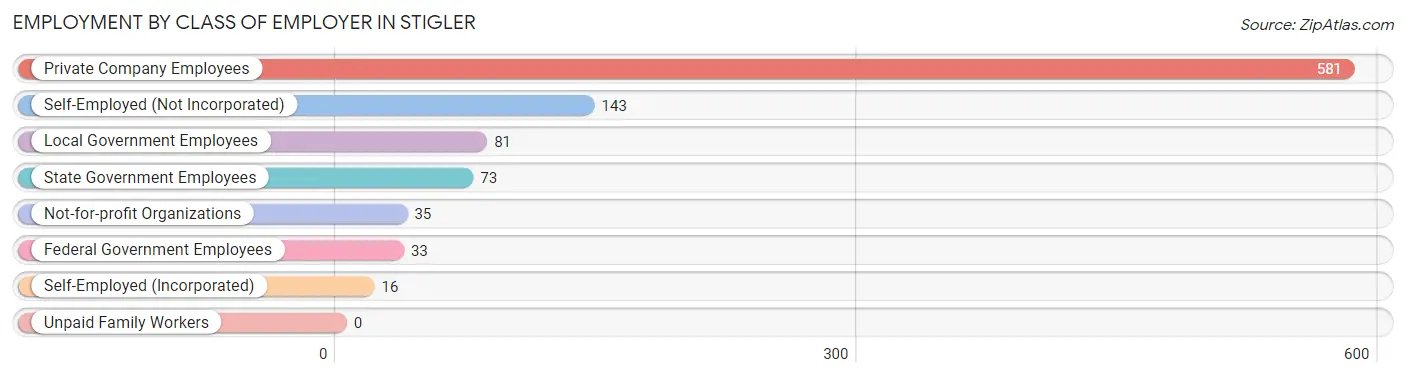
| Employer Class | # Employees | % Employees |
| Private Company Employees | 581 | 60.4% |
| Self-Employed (Incorporated) | 16 | 1.7% |
| Self-Employed (Not Incorporated) | 143 | 14.9% |
| Not-for-profit Organizations | 35 | 3.6% |
| Local Government Employees | 81 | 8.4% |
| State Government Employees | 73 | 7.6% |
| Federal Government Employees | 33 | 3.4% |
| Unpaid Family Workers | 0 | 0.0% |
| Total | 962 | 100.0% |
Employment Status by Age in Stigler
According to the labor force statistics for Stigler, out of the total population over 16 years of age (2,176), 52.5% or 1,142 individuals are in the labor force, with 12.6% or 144 of them unemployed. The age group with the highest labor force participation rate is 35 to 44 years, with 85.8% or 289 individuals in the labor force. Within the labor force, the 16 to 19 years age range has the highest percentage of unemployed individuals, with 52.4% or 25 of them being unemployed.
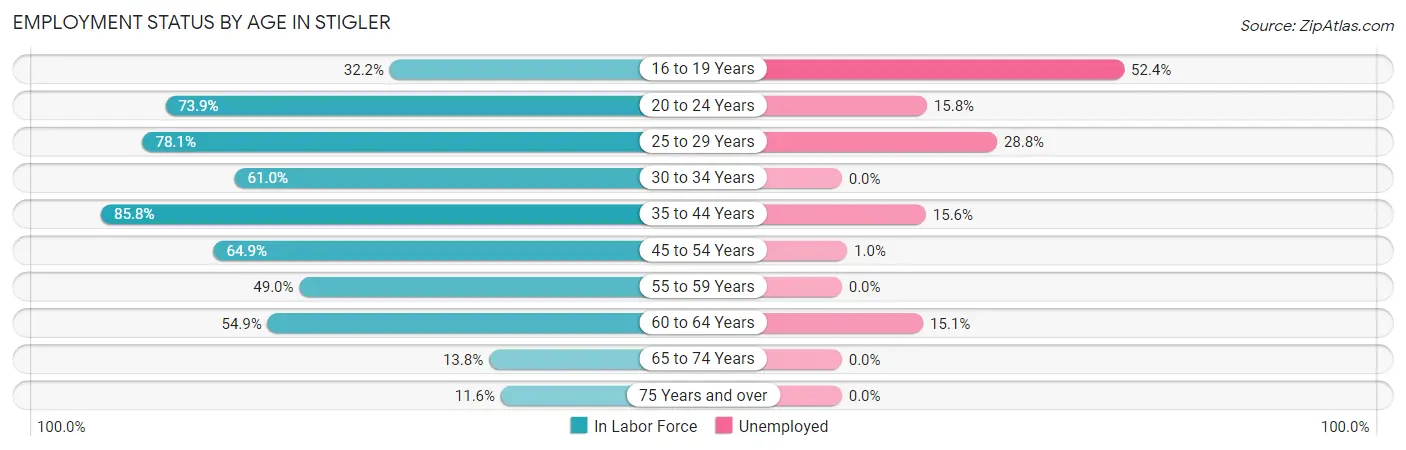
| Age Bracket | In Labor Force | Unemployed |
| 16 to 19 Years | 47 (32.2%) | 25 (52.4%) |
| 20 to 24 Years | 139 (73.9%) | 22 (15.8%) |
| 25 to 29 Years | 125 (78.1%) | 36 (28.8%) |
| 30 to 34 Years | 89 (61.0%) | 0 (0.0%) |
| 35 to 44 Years | 289 (85.8%) | 45 (15.6%) |
| 45 to 54 Years | 203 (64.9%) | 2 (1.0%) |
| 55 to 59 Years | 76 (49.0%) | 0 (0.0%) |
| 60 to 64 Years | 106 (54.9%) | 16 (15.1%) |
| 65 to 74 Years | 40 (13.8%) | 0 (0.0%) |
| 75 Years and over | 29 (11.6%) | 0 (0.0%) |
| Total | 1,142 (52.5%) | 144 (12.6%) |
Employment Status by Educational Attainment in Stigler
According to labor force statistics for Stigler, 68.1% of individuals (888) out of the total population between 25 and 64 years of age (1,304) are in the labor force, with 11.1% or 99 of them being unemployed. The group with the highest labor force participation rate are those with the educational attainment of bachelor's degree or higher, with 87.8% or 130 individuals in the labor force. Within the labor force, individuals with less than high school education have the highest percentage of unemployment, with 17.2% or 21 of them being unemployed.
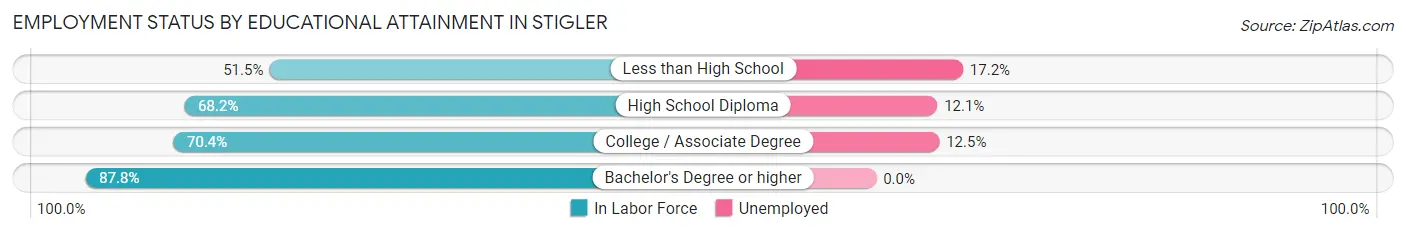
| Educational Attainment | In Labor Force | Unemployed |
| Less than High School | 122 (51.5%) | 41 (17.2%) |
| High School Diploma | 348 (68.2%) | 62 (12.1%) |
| College / Associate Degree | 288 (70.4%) | 51 (12.5%) |
| Bachelor's Degree or higher | 130 (87.8%) | 0 (0.0%) |
| Total | 888 (68.1%) | 145 (11.1%) |
Employment Occupations by Sex in Stigler
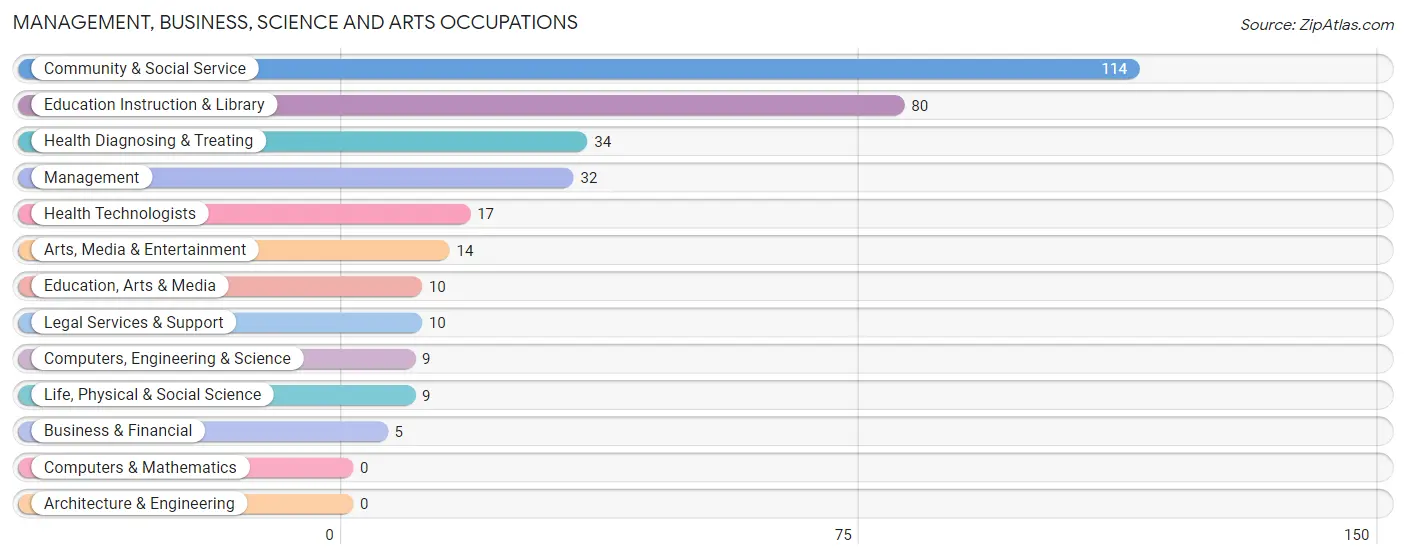
Management, Business, Science and Arts Occupations
The most common Management, Business, Science and Arts occupations in Stigler are Community & Social Service (114 | 11.5%), Education Instruction & Library (80 | 8.0%), Health Diagnosing & Treating (34 | 3.4%), Management (32 | 3.2%), and Health Technologists (17 | 1.7%).
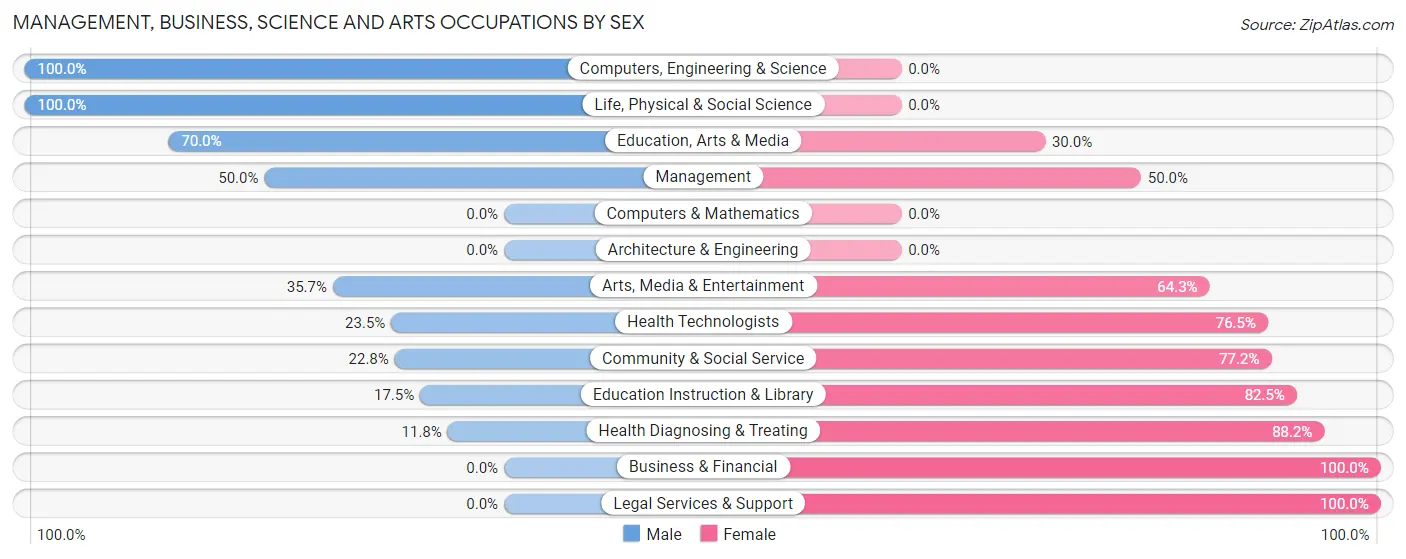
Management, Business, Science and Arts Occupations by Sex
Within the Management, Business, Science and Arts occupations in Stigler, the most male-oriented occupations are Computers, Engineering & Science (100.0%), Life, Physical & Social Science (100.0%), and Education, Arts & Media (70.0%), while the most female-oriented occupations are Business & Financial (100.0%), Legal Services & Support (100.0%), and Health Diagnosing & Treating (88.2%).
| Occupation | Male | Female |
| Management | 16 (50.0%) | 16 (50.0%) |
| Business & Financial | 0 (0.0%) | 5 (100.0%) |
| Computers, Engineering & Science | 9 (100.0%) | 0 (0.0%) |
| Computers & Mathematics | 0 (0.0%) | 0 (0.0%) |
| Architecture & Engineering | 0 (0.0%) | 0 (0.0%) |
| Life, Physical & Social Science | 9 (100.0%) | 0 (0.0%) |
| Community & Social Service | 26 (22.8%) | 88 (77.2%) |
| Education, Arts & Media | 7 (70.0%) | 3 (30.0%) |
| Legal Services & Support | 0 (0.0%) | 10 (100.0%) |
| Education Instruction & Library | 14 (17.5%) | 66 (82.5%) |
| Arts, Media & Entertainment | 5 (35.7%) | 9 (64.3%) |
| Health Diagnosing & Treating | 4 (11.8%) | 30 (88.2%) |
| Health Technologists | 4 (23.5%) | 13 (76.5%) |
| Total (Category) | 55 (28.3%) | 139 (71.7%) |
| Total (Overall) | 503 (50.5%) | 492 (49.4%) |
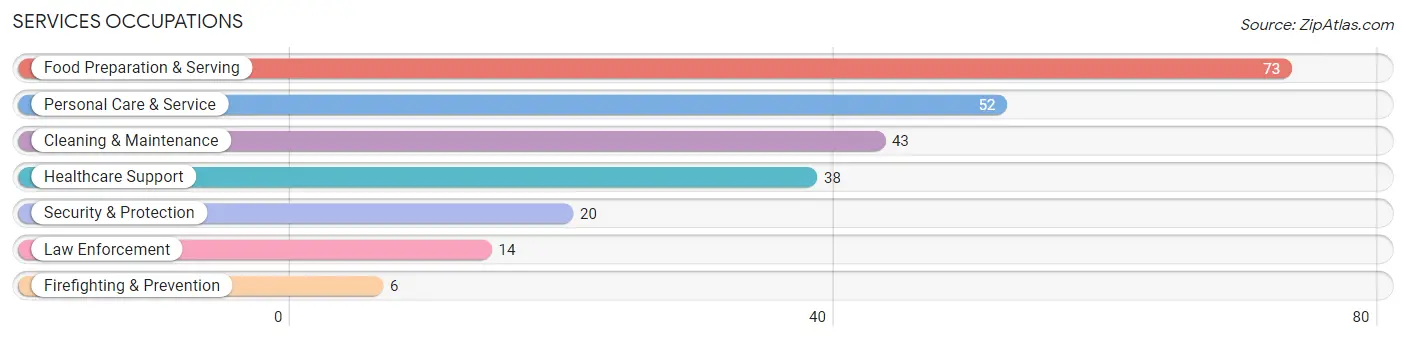
Services Occupations
The most common Services occupations in Stigler are Food Preparation & Serving (73 | 7.3%), Personal Care & Service (52 | 5.2%), Cleaning & Maintenance (43 | 4.3%), Healthcare Support (38 | 3.8%), and Security & Protection (20 | 2.0%).
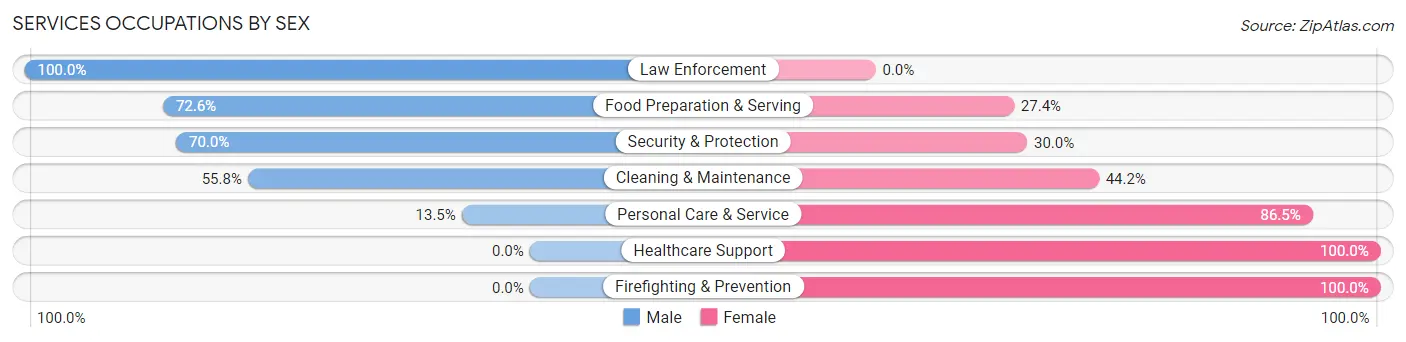
Services Occupations by Sex
Within the Services occupations in Stigler, the most male-oriented occupations are Law Enforcement (100.0%), Food Preparation & Serving (72.6%), and Security & Protection (70.0%), while the most female-oriented occupations are Healthcare Support (100.0%), Firefighting & Prevention (100.0%), and Personal Care & Service (86.5%).
| Occupation | Male | Female |
| Healthcare Support | 0 (0.0%) | 38 (100.0%) |
| Security & Protection | 14 (70.0%) | 6 (30.0%) |
| Firefighting & Prevention | 0 (0.0%) | 6 (100.0%) |
| Law Enforcement | 14 (100.0%) | 0 (0.0%) |
| Food Preparation & Serving | 53 (72.6%) | 20 (27.4%) |
| Cleaning & Maintenance | 24 (55.8%) | 19 (44.2%) |
| Personal Care & Service | 7 (13.5%) | 45 (86.5%) |
| Total (Category) | 98 (43.4%) | 128 (56.6%) |
| Total (Overall) | 503 (50.5%) | 492 (49.4%) |
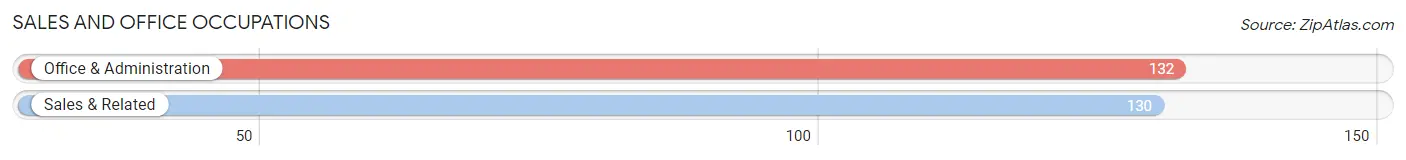
Sales and Office Occupations
The most common Sales and Office occupations in Stigler are Office & Administration (132 | 13.3%), and Sales & Related (130 | 13.1%).
Sales and Office Occupations by Sex
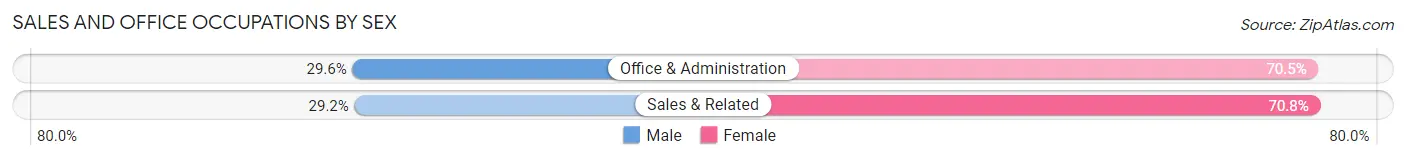
| Occupation | Male | Female |
| Sales & Related | 38 (29.2%) | 92 (70.8%) |
| Office & Administration | 39 (29.5%) | 93 (70.5%) |
| Total (Category) | 77 (29.4%) | 185 (70.6%) |
| Total (Overall) | 503 (50.5%) | 492 (49.4%) |
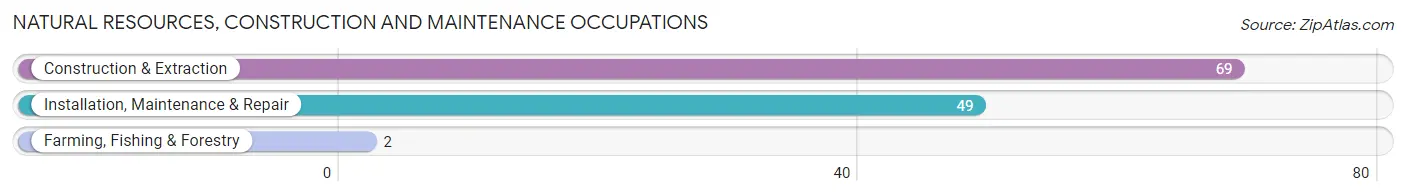
Natural Resources, Construction and Maintenance Occupations
The most common Natural Resources, Construction and Maintenance occupations in Stigler are Construction & Extraction (69 | 6.9%), Installation, Maintenance & Repair (49 | 4.9%), and Farming, Fishing & Forestry (2 | 0.2%).
Natural Resources, Construction and Maintenance Occupations by Sex
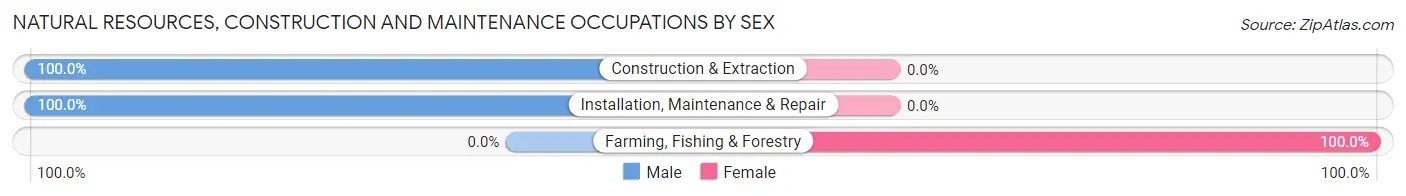
| Occupation | Male | Female |
| Farming, Fishing & Forestry | 0 (0.0%) | 2 (100.0%) |
| Construction & Extraction | 69 (100.0%) | 0 (0.0%) |
| Installation, Maintenance & Repair | 49 (100.0%) | 0 (0.0%) |
| Total (Category) | 118 (98.3%) | 2 (1.7%) |
| Total (Overall) | 503 (50.5%) | 492 (49.4%) |
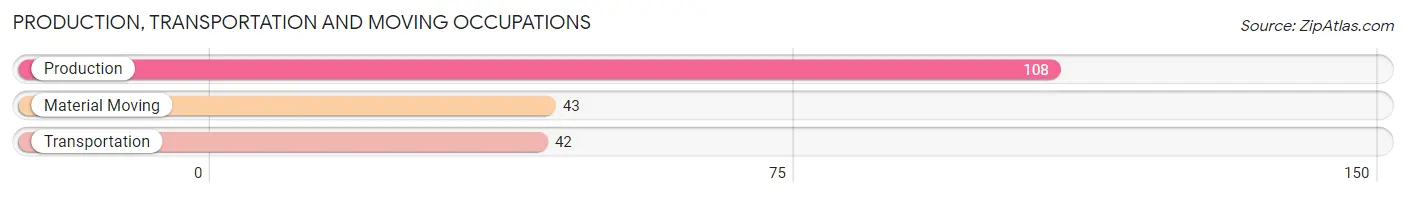
Production, Transportation and Moving Occupations
The most common Production, Transportation and Moving occupations in Stigler are Production (108 | 10.8%), Material Moving (43 | 4.3%), and Transportation (42 | 4.2%).
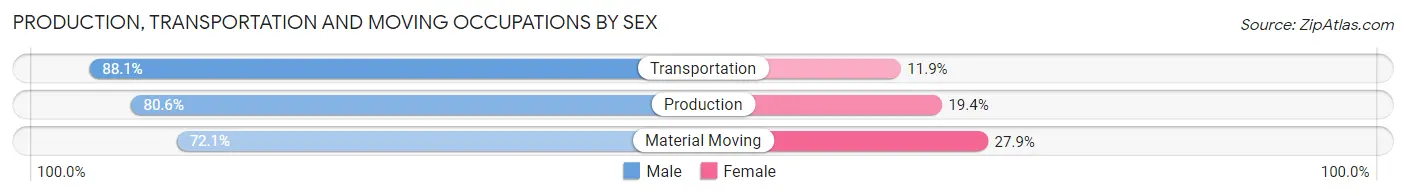
Production, Transportation and Moving Occupations by Sex
| Occupation | Male | Female |
| Production | 87 (80.6%) | 21 (19.4%) |
| Transportation | 37 (88.1%) | 5 (11.9%) |
| Material Moving | 31 (72.1%) | 12 (27.9%) |
| Total (Category) | 155 (80.3%) | 38 (19.7%) |
| Total (Overall) | 503 (50.5%) | 492 (49.4%) |
Employment Industries by Sex in Stigler
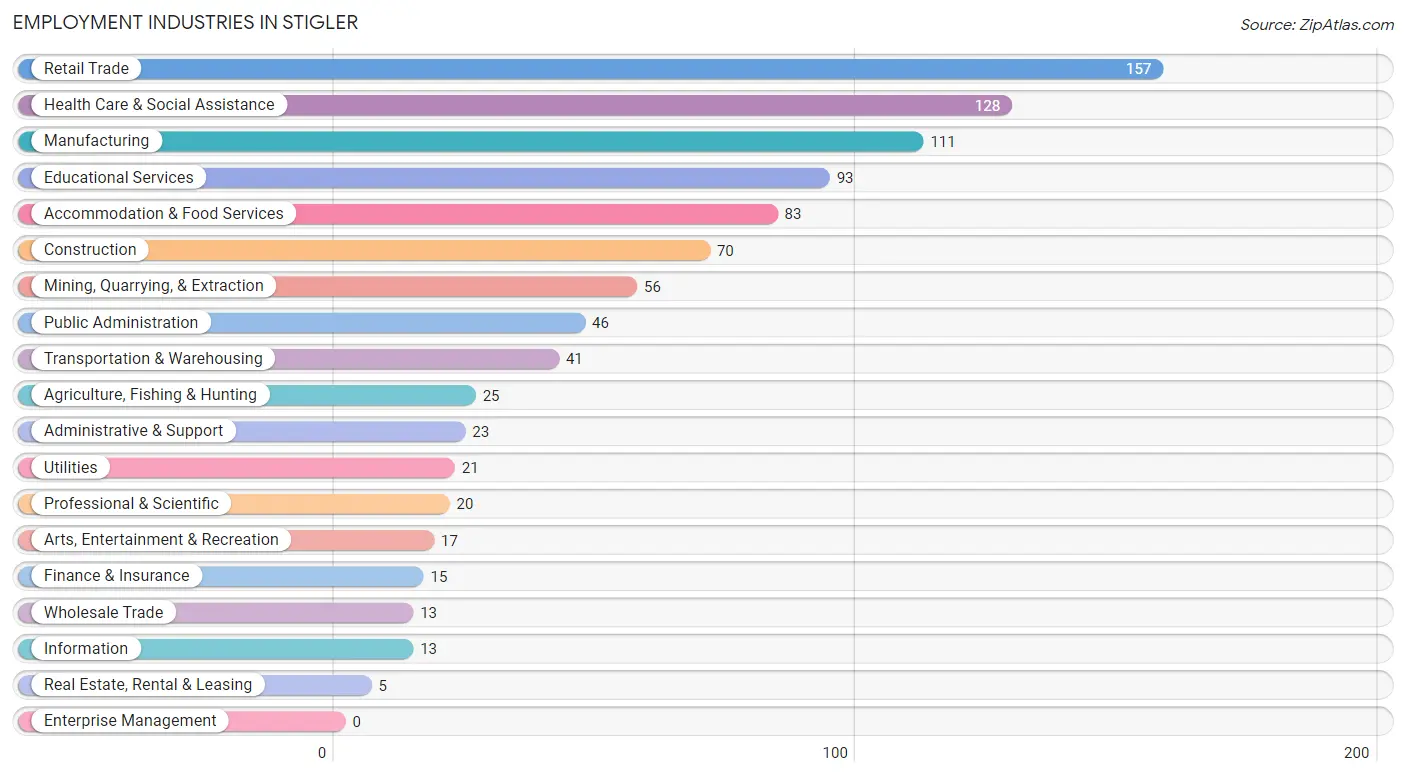
Employment Industries in Stigler
The major employment industries in Stigler include Retail Trade (157 | 15.8%), Health Care & Social Assistance (128 | 12.9%), Manufacturing (111 | 11.2%), Educational Services (93 | 9.3%), and Accommodation & Food Services (83 | 8.3%).
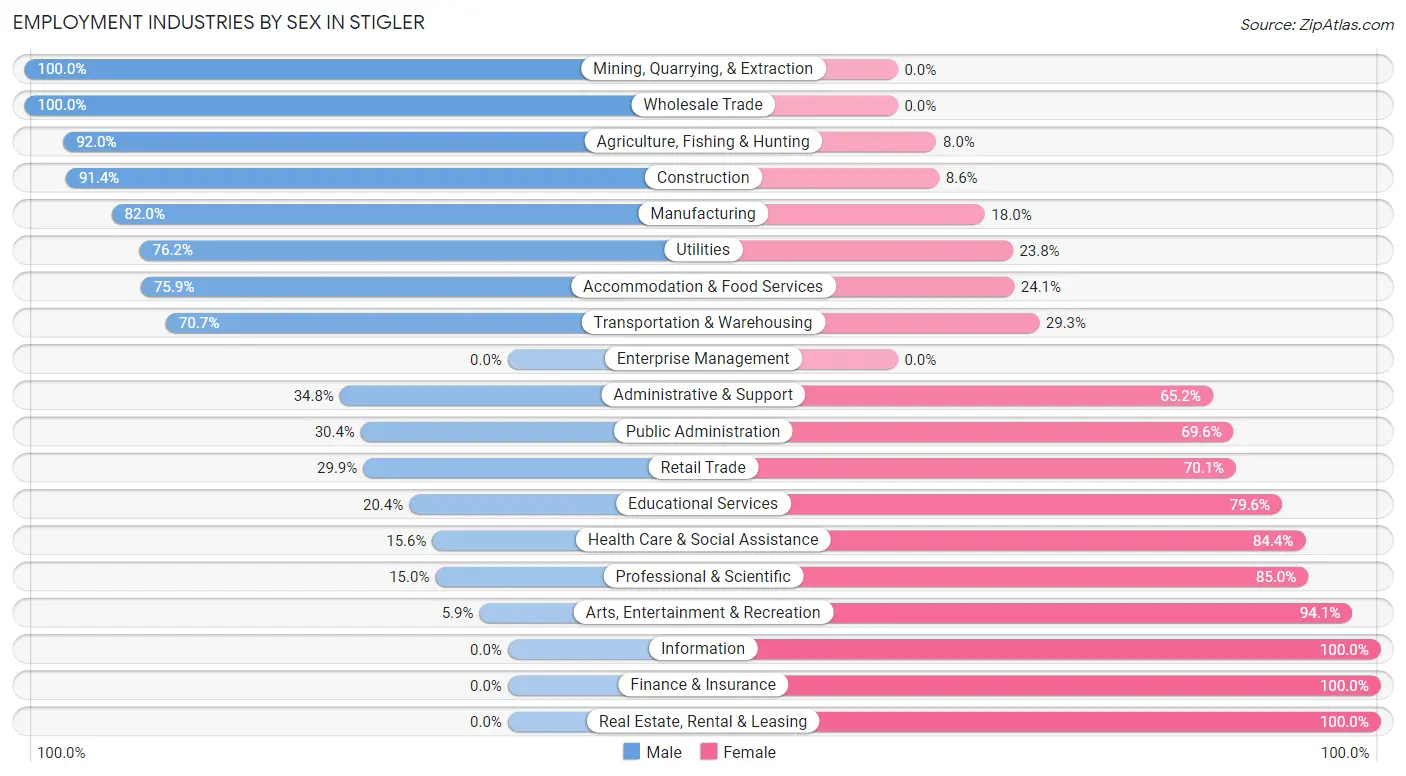
Employment Industries by Sex in Stigler
The Stigler industries that see more men than women are Mining, Quarrying, & Extraction (100.0%), Wholesale Trade (100.0%), and Agriculture, Fishing & Hunting (92.0%), whereas the industries that tend to have a higher number of women are Information (100.0%), Finance & Insurance (100.0%), and Real Estate, Rental & Leasing (100.0%).
| Industry | Male | Female |
| Agriculture, Fishing & Hunting | 23 (92.0%) | 2 (8.0%) |
| Mining, Quarrying, & Extraction | 56 (100.0%) | 0 (0.0%) |
| Construction | 64 (91.4%) | 6 (8.6%) |
| Manufacturing | 91 (82.0%) | 20 (18.0%) |
| Wholesale Trade | 13 (100.0%) | 0 (0.0%) |
| Retail Trade | 47 (29.9%) | 110 (70.1%) |
| Transportation & Warehousing | 29 (70.7%) | 12 (29.3%) |
| Utilities | 16 (76.2%) | 5 (23.8%) |
| Information | 0 (0.0%) | 13 (100.0%) |
| Finance & Insurance | 0 (0.0%) | 15 (100.0%) |
| Real Estate, Rental & Leasing | 0 (0.0%) | 5 (100.0%) |
| Professional & Scientific | 3 (15.0%) | 17 (85.0%) |
| Enterprise Management | 0 (0.0%) | 0 (0.0%) |
| Administrative & Support | 8 (34.8%) | 15 (65.2%) |
| Educational Services | 19 (20.4%) | 74 (79.6%) |
| Health Care & Social Assistance | 20 (15.6%) | 108 (84.4%) |
| Arts, Entertainment & Recreation | 1 (5.9%) | 16 (94.1%) |
| Accommodation & Food Services | 63 (75.9%) | 20 (24.1%) |
| Public Administration | 14 (30.4%) | 32 (69.6%) |
| Total | 503 (50.5%) | 492 (49.4%) |
Education in Stigler
School Enrollment in Stigler
The most common levels of schooling among the 506 students in Stigler are high school (140 | 27.7%), middle school (137 | 27.1%), and elementary school (66 | 13.0%).
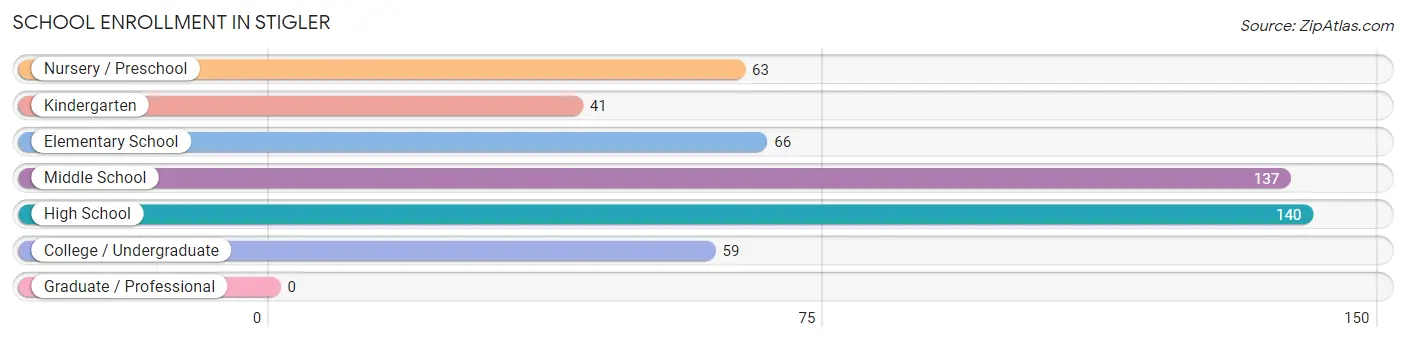
| School Level | # Students | % Students |
| Nursery / Preschool | 63 | 12.4% |
| Kindergarten | 41 | 8.1% |
| Elementary School | 66 | 13.0% |
| Middle School | 137 | 27.1% |
| High School | 140 | 27.7% |
| College / Undergraduate | 59 | 11.7% |
| Graduate / Professional | 0 | 0.0% |
| Total | 506 | 100.0% |
School Enrollment by Age by Funding Source in Stigler
Out of a total of 506 students who are enrolled in schools in Stigler, 12 (2.4%) attend a private institution, while the remaining 494 (97.6%) are enrolled in public schools. The age group of 25 to 34 year olds has the highest likelihood of being enrolled in private schools, with 5 (45.5% in the age bracket) enrolled. Conversely, the age group of 3 to 4 year olds has the lowest likelihood of being enrolled in a private school, with 34 (100.0% in the age bracket) attending a public institution.
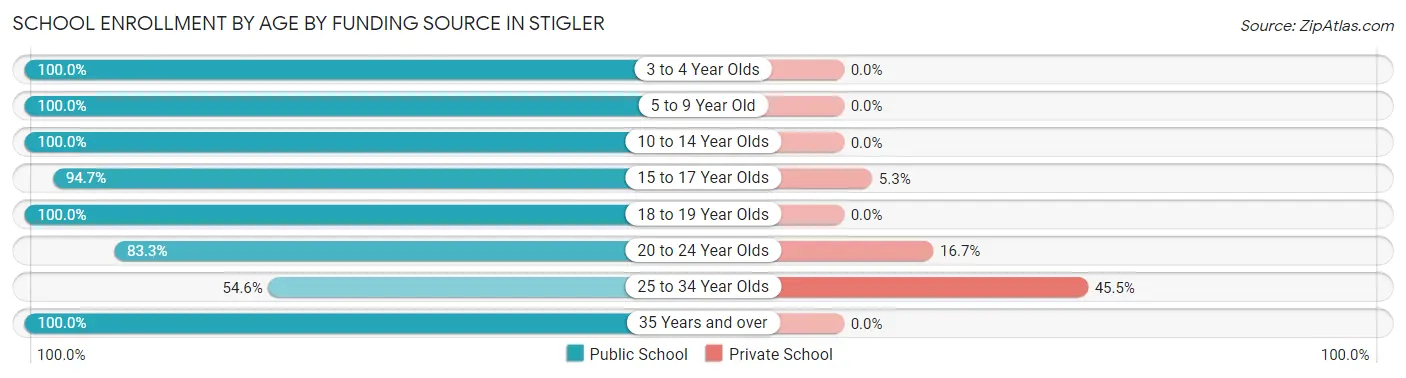
| Age Bracket | Public School | Private School |
| 3 to 4 Year Olds | 34 (100.0%) | 0 (0.0%) |
| 5 to 9 Year Old | 127 (100.0%) | 0 (0.0%) |
| 10 to 14 Year Olds | 161 (100.0%) | 0 (0.0%) |
| 15 to 17 Year Olds | 90 (94.7%) | 5 (5.3%) |
| 18 to 19 Year Olds | 40 (100.0%) | 0 (0.0%) |
| 20 to 24 Year Olds | 10 (83.3%) | 2 (16.7%) |
| 25 to 34 Year Olds | 6 (54.5%) | 5 (45.5%) |
| 35 Years and over | 26 (100.0%) | 0 (0.0%) |
| Total | 494 (97.6%) | 12 (2.4%) |
Educational Attainment by Field of Study in Stigler
Education (112 | 44.6%), business (64 | 25.5%), psychology (19 | 7.6%), arts & humanities (12 | 4.8%), and bio, nature & agricultural (9 | 3.6%) are the most common fields of study among 251 individuals in Stigler who have obtained a bachelor's degree or higher.
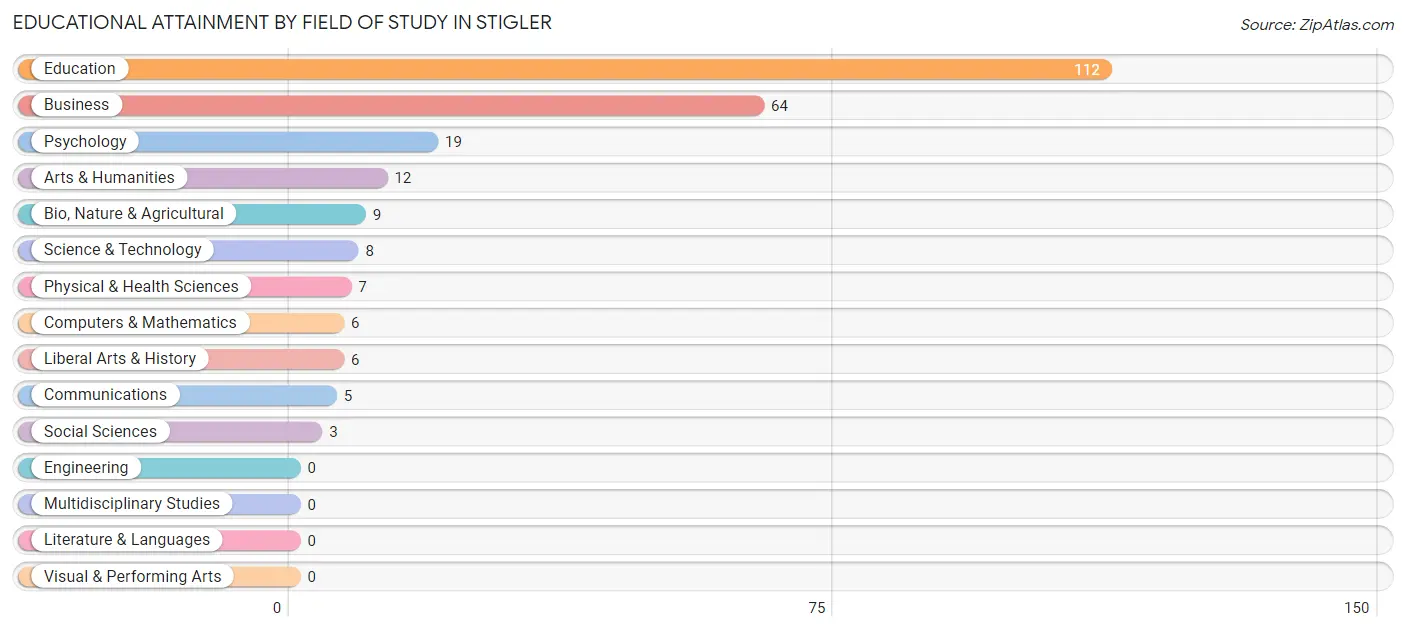
| Field of Study | # Graduates | % Graduates |
| Computers & Mathematics | 6 | 2.4% |
| Bio, Nature & Agricultural | 9 | 3.6% |
| Physical & Health Sciences | 7 | 2.8% |
| Psychology | 19 | 7.6% |
| Social Sciences | 3 | 1.2% |
| Engineering | 0 | 0.0% |
| Multidisciplinary Studies | 0 | 0.0% |
| Science & Technology | 8 | 3.2% |
| Business | 64 | 25.5% |
| Education | 112 | 44.6% |
| Literature & Languages | 0 | 0.0% |
| Liberal Arts & History | 6 | 2.4% |
| Visual & Performing Arts | 0 | 0.0% |
| Communications | 5 | 2.0% |
| Arts & Humanities | 12 | 4.8% |
| Total | 251 | 100.0% |
Transportation & Commute in Stigler
Vehicle Availability by Sex in Stigler
The most prevalent vehicle ownership categories in Stigler are males with 2 vehicles (198, accounting for 41.1%) and females with 2 vehicles (147, making up 41.2%).
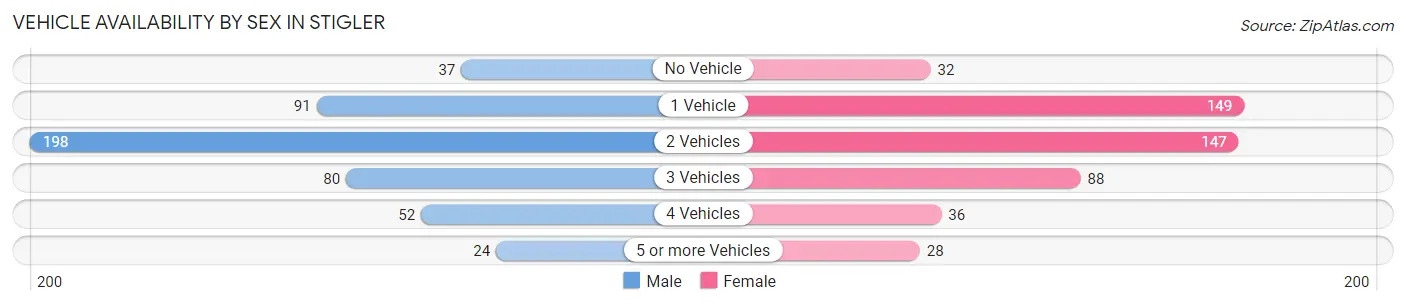
| Vehicles Available | Male | Female |
| No Vehicle | 37 (7.7%) | 32 (6.7%) |
| 1 Vehicle | 91 (18.9%) | 149 (31.0%) |
| 2 Vehicles | 198 (41.1%) | 147 (30.6%) |
| 3 Vehicles | 80 (16.6%) | 88 (18.3%) |
| 4 Vehicles | 52 (10.8%) | 36 (7.5%) |
| 5 or more Vehicles | 24 (5.0%) | 28 (5.8%) |
| Total | 482 (100.0%) | 480 (100.0%) |
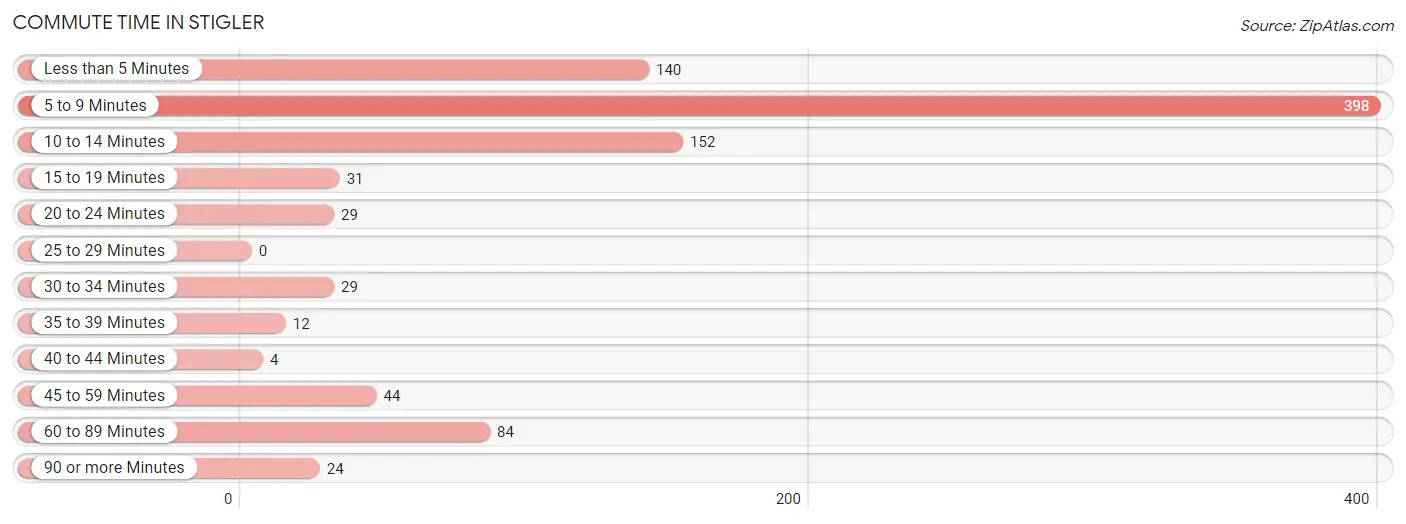
Commute Time in Stigler
The most frequently occuring commute durations in Stigler are 5 to 9 minutes (398 commuters, 42.0%), 10 to 14 minutes (152 commuters, 16.1%), and less than 5 minutes (140 commuters, 14.8%).
| Commute Time | # Commuters | % Commuters |
| Less than 5 Minutes | 140 | 14.8% |
| 5 to 9 Minutes | 398 | 42.0% |
| 10 to 14 Minutes | 152 | 16.1% |
| 15 to 19 Minutes | 31 | 3.3% |
| 20 to 24 Minutes | 29 | 3.1% |
| 25 to 29 Minutes | 0 | 0.0% |
| 30 to 34 Minutes | 29 | 3.1% |
| 35 to 39 Minutes | 12 | 1.3% |
| 40 to 44 Minutes | 4 | 0.4% |
| 45 to 59 Minutes | 44 | 4.6% |
| 60 to 89 Minutes | 84 | 8.9% |
| 90 or more Minutes | 24 | 2.5% |
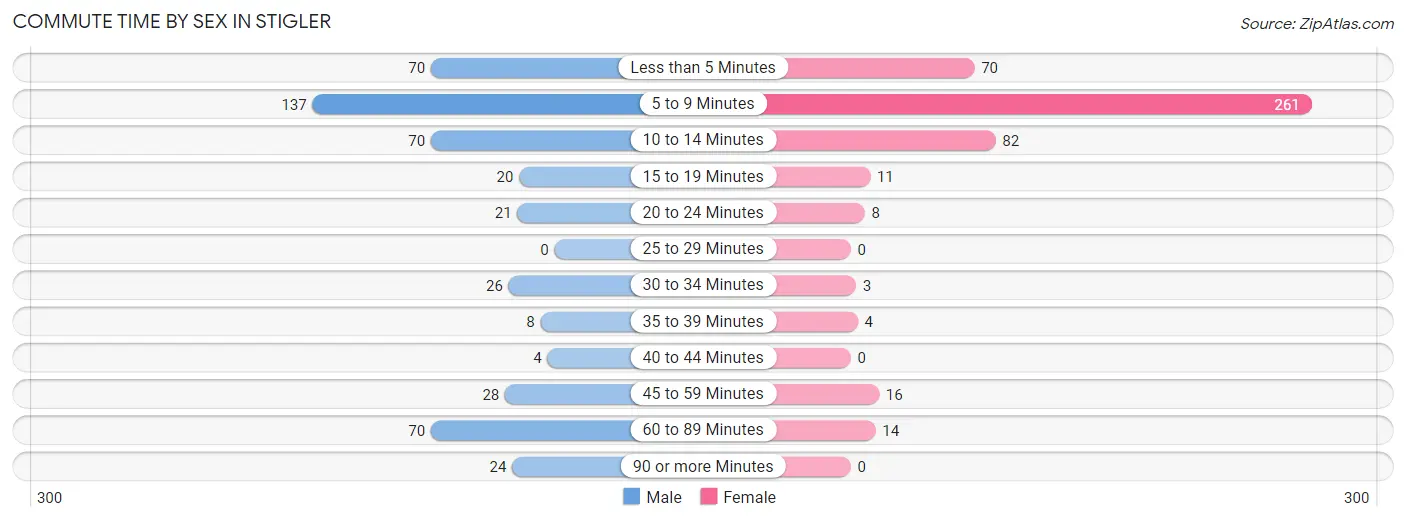
Commute Time by Sex in Stigler
The most common commute times in Stigler are 5 to 9 minutes (137 commuters, 28.7%) for males and 5 to 9 minutes (261 commuters, 55.6%) for females.
| Commute Time | Male | Female |
| Less than 5 Minutes | 70 (14.6%) | 70 (14.9%) |
| 5 to 9 Minutes | 137 (28.7%) | 261 (55.6%) |
| 10 to 14 Minutes | 70 (14.6%) | 82 (17.5%) |
| 15 to 19 Minutes | 20 (4.2%) | 11 (2.4%) |
| 20 to 24 Minutes | 21 (4.4%) | 8 (1.7%) |
| 25 to 29 Minutes | 0 (0.0%) | 0 (0.0%) |
| 30 to 34 Minutes | 26 (5.4%) | 3 (0.6%) |
| 35 to 39 Minutes | 8 (1.7%) | 4 (0.9%) |
| 40 to 44 Minutes | 4 (0.8%) | 0 (0.0%) |
| 45 to 59 Minutes | 28 (5.9%) | 16 (3.4%) |
| 60 to 89 Minutes | 70 (14.6%) | 14 (3.0%) |
| 90 or more Minutes | 24 (5.0%) | 0 (0.0%) |
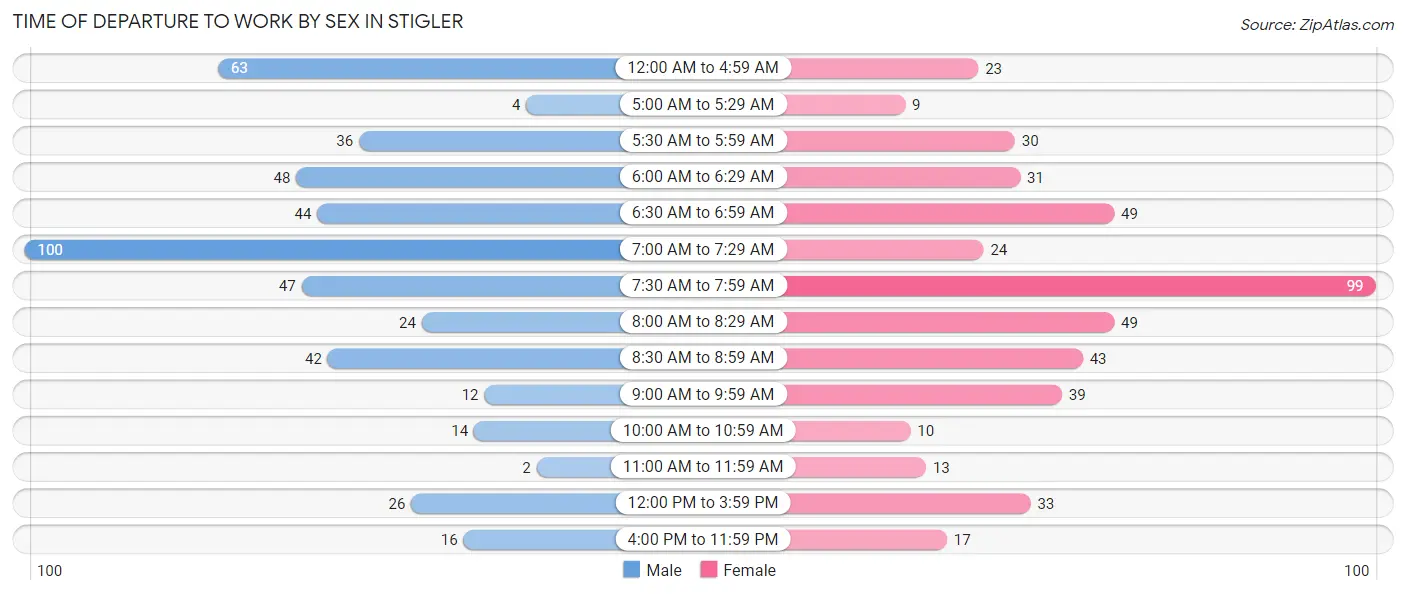
Time of Departure to Work by Sex in Stigler
The most frequent times of departure to work in Stigler are 7:00 AM to 7:29 AM (100, 20.9%) for males and 7:30 AM to 7:59 AM (99, 21.1%) for females.
| Time of Departure | Male | Female |
| 12:00 AM to 4:59 AM | 63 (13.2%) | 23 (4.9%) |
| 5:00 AM to 5:29 AM | 4 (0.8%) | 9 (1.9%) |
| 5:30 AM to 5:59 AM | 36 (7.5%) | 30 (6.4%) |
| 6:00 AM to 6:29 AM | 48 (10.0%) | 31 (6.6%) |
| 6:30 AM to 6:59 AM | 44 (9.2%) | 49 (10.4%) |
| 7:00 AM to 7:29 AM | 100 (20.9%) | 24 (5.1%) |
| 7:30 AM to 7:59 AM | 47 (9.8%) | 99 (21.1%) |
| 8:00 AM to 8:29 AM | 24 (5.0%) | 49 (10.4%) |
| 8:30 AM to 8:59 AM | 42 (8.8%) | 43 (9.2%) |
| 9:00 AM to 9:59 AM | 12 (2.5%) | 39 (8.3%) |
| 10:00 AM to 10:59 AM | 14 (2.9%) | 10 (2.1%) |
| 11:00 AM to 11:59 AM | 2 (0.4%) | 13 (2.8%) |
| 12:00 PM to 3:59 PM | 26 (5.4%) | 33 (7.0%) |
| 4:00 PM to 11:59 PM | 16 (3.4%) | 17 (3.6%) |
| Total | 478 (100.0%) | 469 (100.0%) |
Housing Occupancy in Stigler
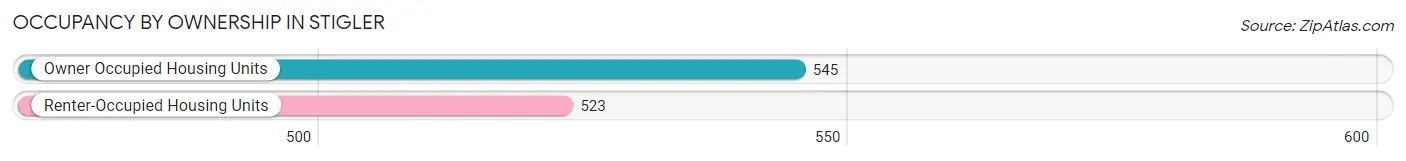
Occupancy by Ownership in Stigler
Of the total 1,068 dwellings in Stigler, owner-occupied units account for 545 (51.0%), while renter-occupied units make up 523 (49.0%).
| Occupancy | # Housing Units | % Housing Units |
| Owner Occupied Housing Units | 545 | 51.0% |
| Renter-Occupied Housing Units | 523 | 49.0% |
| Total Occupied Housing Units | 1,068 | 100.0% |
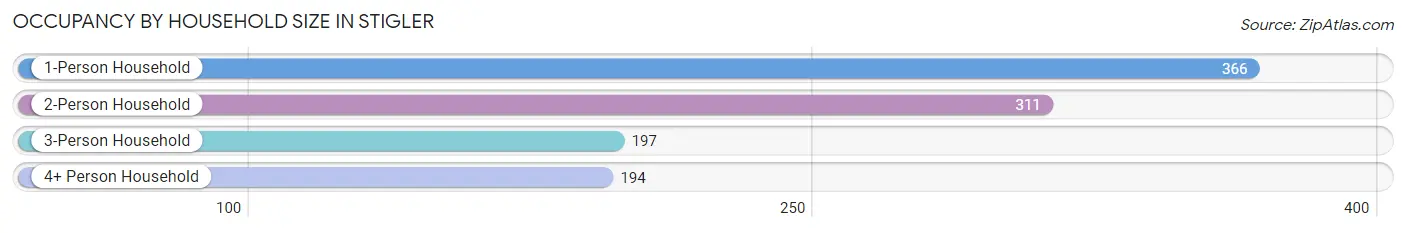
Occupancy by Household Size in Stigler
| Household Size | # Housing Units | % Housing Units |
| 1-Person Household | 366 | 34.3% |
| 2-Person Household | 311 | 29.1% |
| 3-Person Household | 197 | 18.4% |
| 4+ Person Household | 194 | 18.2% |
| Total Housing Units | 1,068 | 100.0% |
Occupancy by Ownership by Household Size in Stigler
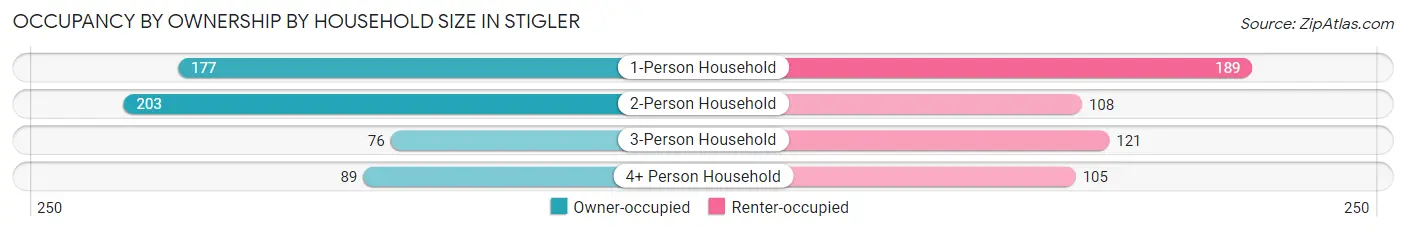
| Household Size | Owner-occupied | Renter-occupied |
| 1-Person Household | 177 (48.4%) | 189 (51.6%) |
| 2-Person Household | 203 (65.3%) | 108 (34.7%) |
| 3-Person Household | 76 (38.6%) | 121 (61.4%) |
| 4+ Person Household | 89 (45.9%) | 105 (54.1%) |
| Total Housing Units | 545 (51.0%) | 523 (49.0%) |
Occupancy by Educational Attainment in Stigler
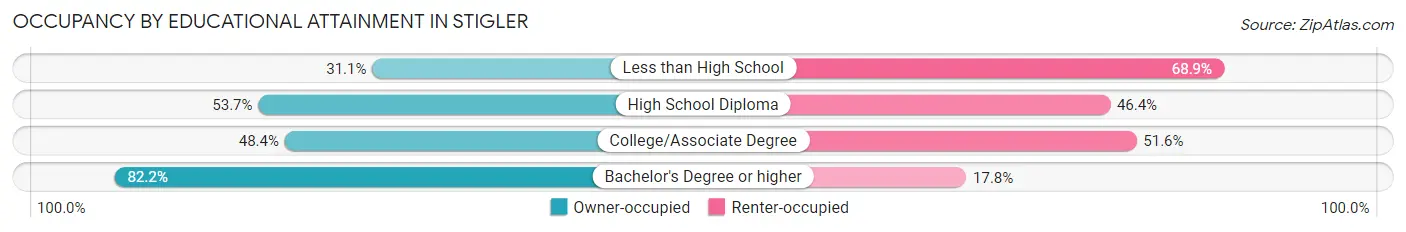
| Household Size | Owner-occupied | Renter-occupied |
| Less than High School | 64 (31.1%) | 142 (68.9%) |
| High School Diploma | 206 (53.6%) | 178 (46.4%) |
| College/Associate Degree | 169 (48.4%) | 180 (51.6%) |
| Bachelor's Degree or higher | 106 (82.2%) | 23 (17.8%) |
Occupancy by Age of Householder in Stigler
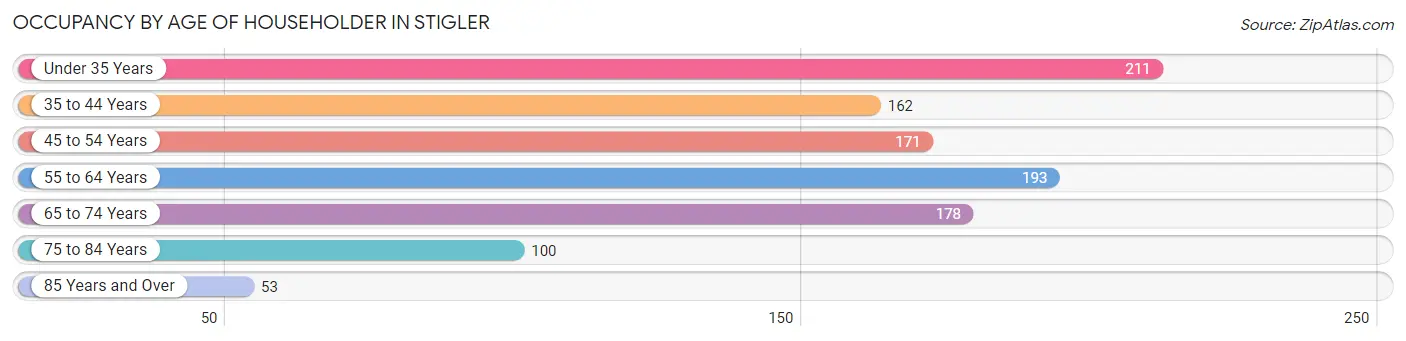
| Age Bracket | # Households | % Households |
| Under 35 Years | 211 | 19.8% |
| 35 to 44 Years | 162 | 15.2% |
| 45 to 54 Years | 171 | 16.0% |
| 55 to 64 Years | 193 | 18.1% |
| 65 to 74 Years | 178 | 16.7% |
| 75 to 84 Years | 100 | 9.4% |
| 85 Years and Over | 53 | 5.0% |
| Total | 1,068 | 100.0% |
Housing Finances in Stigler
Median Income by Occupancy in Stigler
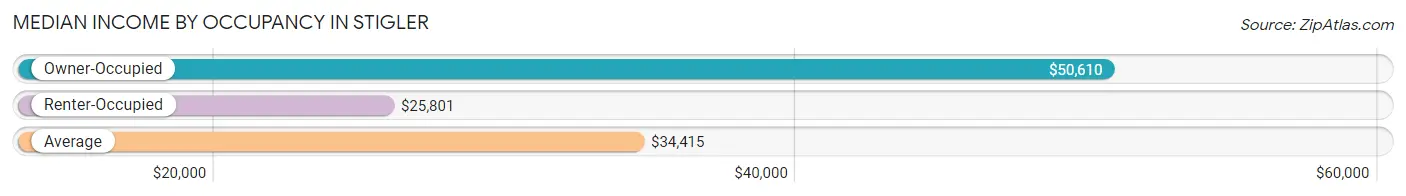
| Occupancy Type | # Households | Median Income |
| Owner-Occupied | 545 (51.0%) | $50,610 |
| Renter-Occupied | 523 (49.0%) | $25,801 |
| Average | 1,068 (100.0%) | $34,415 |
Occupancy by Householder Income Bracket in Stigler
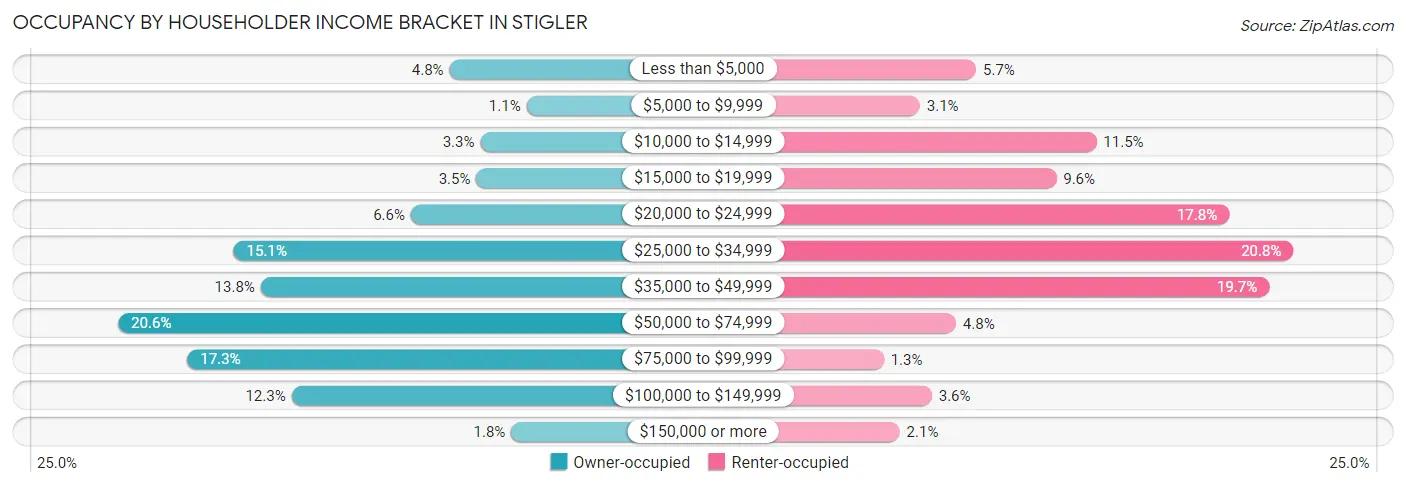
| Income Bracket | Owner-occupied | Renter-occupied |
| Less than $5,000 | 26 (4.8%) | 30 (5.7%) |
| $5,000 to $9,999 | 6 (1.1%) | 16 (3.1%) |
| $10,000 to $14,999 | 18 (3.3%) | 60 (11.5%) |
| $15,000 to $19,999 | 19 (3.5%) | 50 (9.6%) |
| $20,000 to $24,999 | 36 (6.6%) | 93 (17.8%) |
| $25,000 to $34,999 | 82 (15.0%) | 109 (20.8%) |
| $35,000 to $49,999 | 75 (13.8%) | 103 (19.7%) |
| $50,000 to $74,999 | 112 (20.5%) | 25 (4.8%) |
| $75,000 to $99,999 | 94 (17.2%) | 7 (1.3%) |
| $100,000 to $149,999 | 67 (12.3%) | 19 (3.6%) |
| $150,000 or more | 10 (1.8%) | 11 (2.1%) |
| Total | 545 (100.0%) | 523 (100.0%) |
Monthly Housing Cost Tiers in Stigler
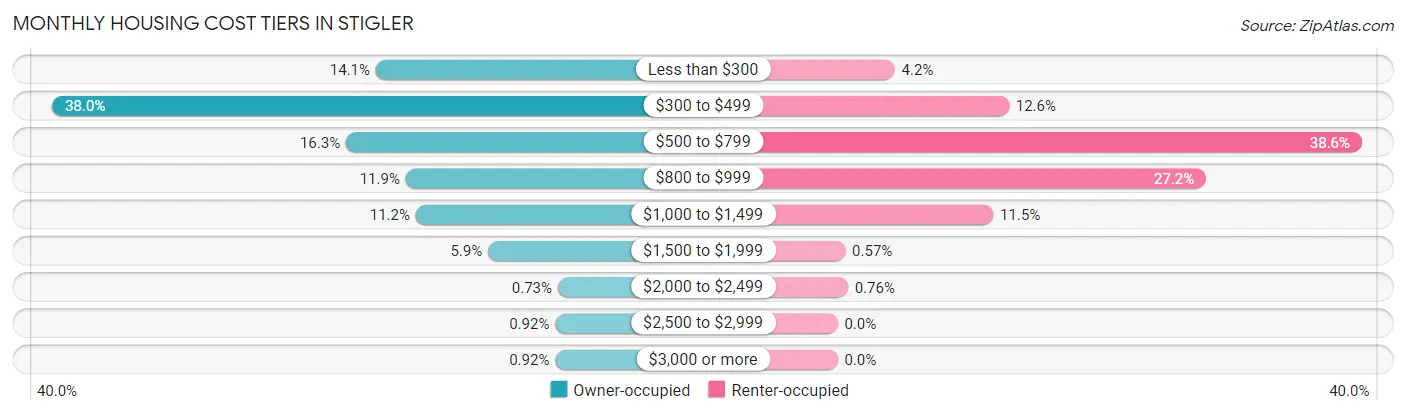
| Monthly Cost | Owner-occupied | Renter-occupied |
| Less than $300 | 77 (14.1%) | 22 (4.2%) |
| $300 to $499 | 207 (38.0%) | 66 (12.6%) |
| $500 to $799 | 89 (16.3%) | 202 (38.6%) |
| $800 to $999 | 65 (11.9%) | 142 (27.2%) |
| $1,000 to $1,499 | 61 (11.2%) | 60 (11.5%) |
| $1,500 to $1,999 | 32 (5.9%) | 3 (0.6%) |
| $2,000 to $2,499 | 4 (0.7%) | 4 (0.8%) |
| $2,500 to $2,999 | 5 (0.9%) | 0 (0.0%) |
| $3,000 or more | 5 (0.9%) | 0 (0.0%) |
| Total | 545 (100.0%) | 523 (100.0%) |
Physical Housing Characteristics in Stigler
Housing Structures in Stigler
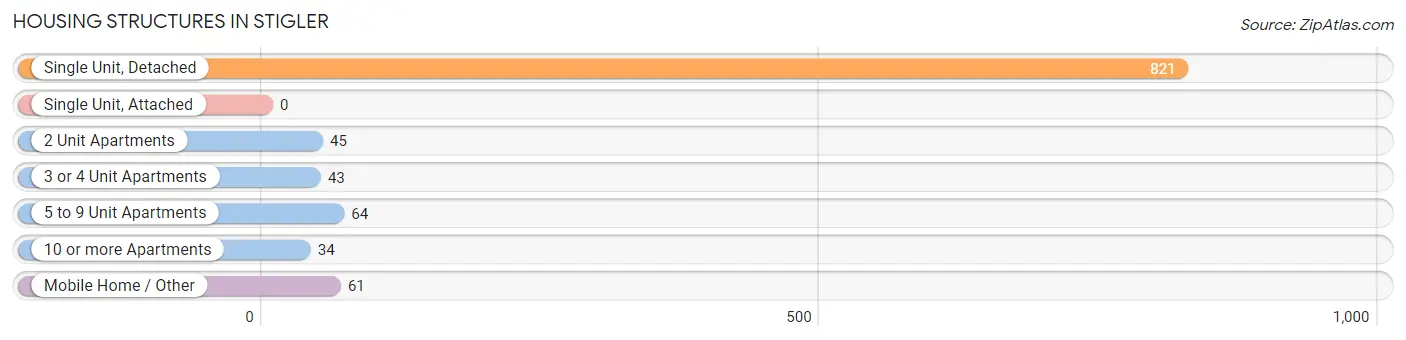
| Structure Type | # Housing Units | % Housing Units |
| Single Unit, Detached | 821 | 76.9% |
| Single Unit, Attached | 0 | 0.0% |
| 2 Unit Apartments | 45 | 4.2% |
| 3 or 4 Unit Apartments | 43 | 4.0% |
| 5 to 9 Unit Apartments | 64 | 6.0% |
| 10 or more Apartments | 34 | 3.2% |
| Mobile Home / Other | 61 | 5.7% |
| Total | 1,068 | 100.0% |
Housing Structures by Occupancy in Stigler
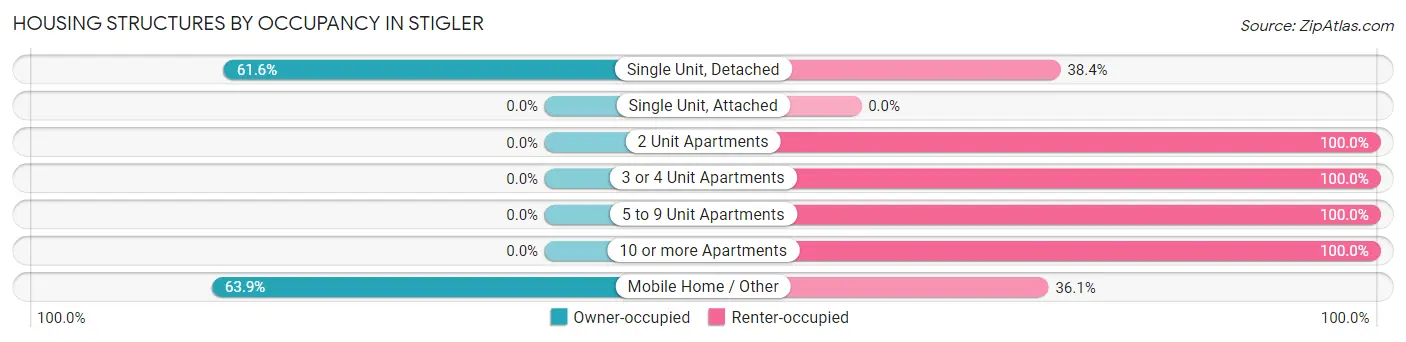
| Structure Type | Owner-occupied | Renter-occupied |
| Single Unit, Detached | 506 (61.6%) | 315 (38.4%) |
| Single Unit, Attached | 0 (0.0%) | 0 (0.0%) |
| 2 Unit Apartments | 0 (0.0%) | 45 (100.0%) |
| 3 or 4 Unit Apartments | 0 (0.0%) | 43 (100.0%) |
| 5 to 9 Unit Apartments | 0 (0.0%) | 64 (100.0%) |
| 10 or more Apartments | 0 (0.0%) | 34 (100.0%) |
| Mobile Home / Other | 39 (63.9%) | 22 (36.1%) |
| Total | 545 (51.0%) | 523 (49.0%) |
Housing Structures by Number of Rooms in Stigler
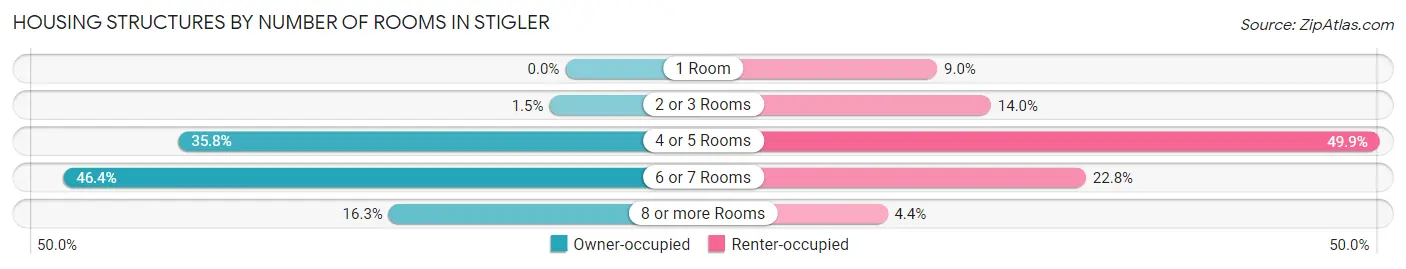
| Number of Rooms | Owner-occupied | Renter-occupied |
| 1 Room | 0 (0.0%) | 47 (9.0%) |
| 2 or 3 Rooms | 8 (1.5%) | 73 (14.0%) |
| 4 or 5 Rooms | 195 (35.8%) | 261 (49.9%) |
| 6 or 7 Rooms | 253 (46.4%) | 119 (22.8%) |
| 8 or more Rooms | 89 (16.3%) | 23 (4.4%) |
| Total | 545 (100.0%) | 523 (100.0%) |
Housing Structure by Heating Type in Stigler
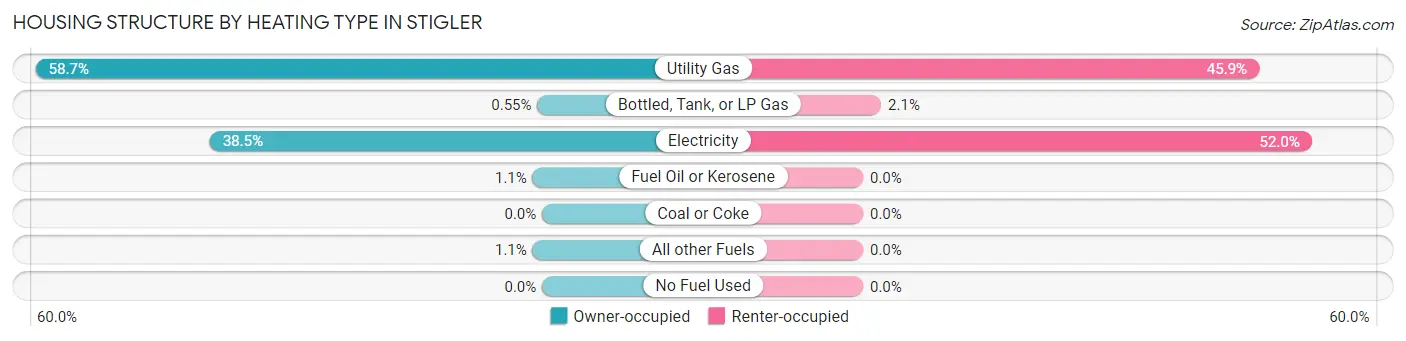
| Heating Type | Owner-occupied | Renter-occupied |
| Utility Gas | 320 (58.7%) | 240 (45.9%) |
| Bottled, Tank, or LP Gas | 3 (0.5%) | 11 (2.1%) |
| Electricity | 210 (38.5%) | 272 (52.0%) |
| Fuel Oil or Kerosene | 6 (1.1%) | 0 (0.0%) |
| Coal or Coke | 0 (0.0%) | 0 (0.0%) |
| All other Fuels | 6 (1.1%) | 0 (0.0%) |
| No Fuel Used | 0 (0.0%) | 0 (0.0%) |
| Total | 545 (100.0%) | 523 (100.0%) |
Household Vehicle Usage in Stigler
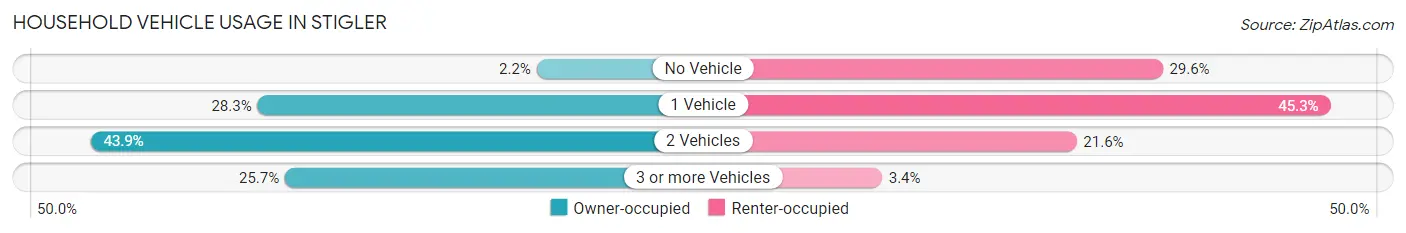
| Vehicles per Household | Owner-occupied | Renter-occupied |
| No Vehicle | 12 (2.2%) | 155 (29.6%) |
| 1 Vehicle | 154 (28.3%) | 237 (45.3%) |
| 2 Vehicles | 239 (43.9%) | 113 (21.6%) |
| 3 or more Vehicles | 140 (25.7%) | 18 (3.4%) |
| Total | 545 (100.0%) | 523 (100.0%) |
Real Estate & Mortgages in Stigler
Real Estate and Mortgage Overview in Stigler
| Characteristic | Without Mortgage | With Mortgage |
| Housing Units | 346 | 199 |
| Median Property Value | $123,800 | $144,600 |
| Median Household Income | $42,500 | $4 |
| Monthly Housing Costs | $397 | $0 |
| Real Estate Taxes | $469 | $11 |
Property Value by Mortgage Status in Stigler
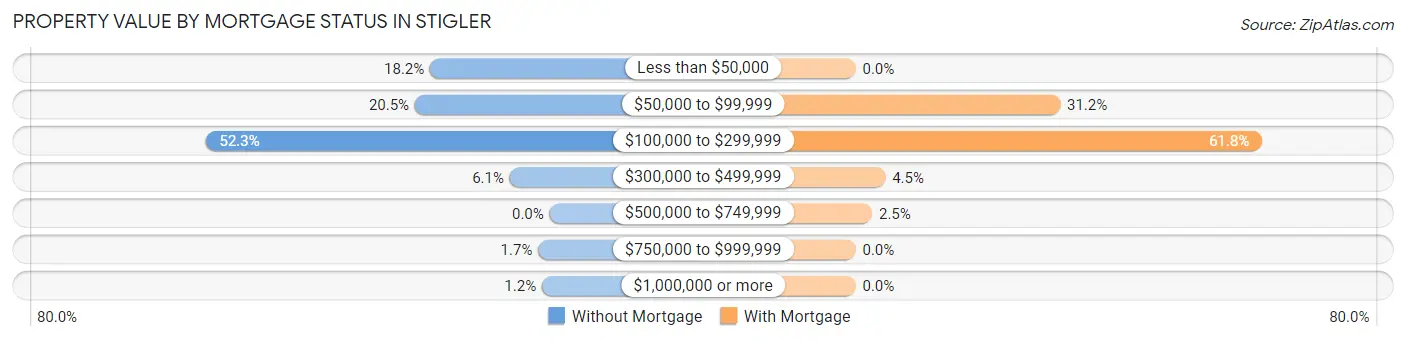
| Property Value | Without Mortgage | With Mortgage |
| Less than $50,000 | 63 (18.2%) | 0 (0.0%) |
| $50,000 to $99,999 | 71 (20.5%) | 62 (31.2%) |
| $100,000 to $299,999 | 181 (52.3%) | 123 (61.8%) |
| $300,000 to $499,999 | 21 (6.1%) | 9 (4.5%) |
| $500,000 to $749,999 | 0 (0.0%) | 5 (2.5%) |
| $750,000 to $999,999 | 6 (1.7%) | 0 (0.0%) |
| $1,000,000 or more | 4 (1.2%) | 0 (0.0%) |
| Total | 346 (100.0%) | 199 (100.0%) |
Household Income by Mortgage Status in Stigler
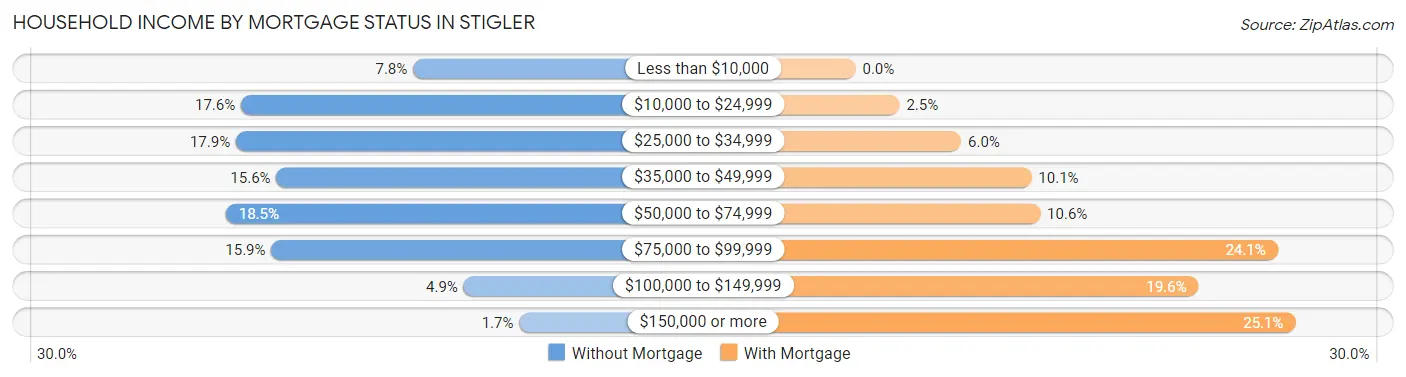
| Household Income | Without Mortgage | With Mortgage |
| Less than $10,000 | 27 (7.8%) | 0 (0.0%) |
| $10,000 to $24,999 | 61 (17.6%) | 5 (2.5%) |
| $25,000 to $34,999 | 62 (17.9%) | 12 (6.0%) |
| $35,000 to $49,999 | 54 (15.6%) | 20 (10.1%) |
| $50,000 to $74,999 | 64 (18.5%) | 21 (10.5%) |
| $75,000 to $99,999 | 55 (15.9%) | 48 (24.1%) |
| $100,000 to $149,999 | 17 (4.9%) | 39 (19.6%) |
| $150,000 or more | 6 (1.7%) | 50 (25.1%) |
| Total | 346 (100.0%) | 199 (100.0%) |
Property Value to Household Income Ratio in Stigler
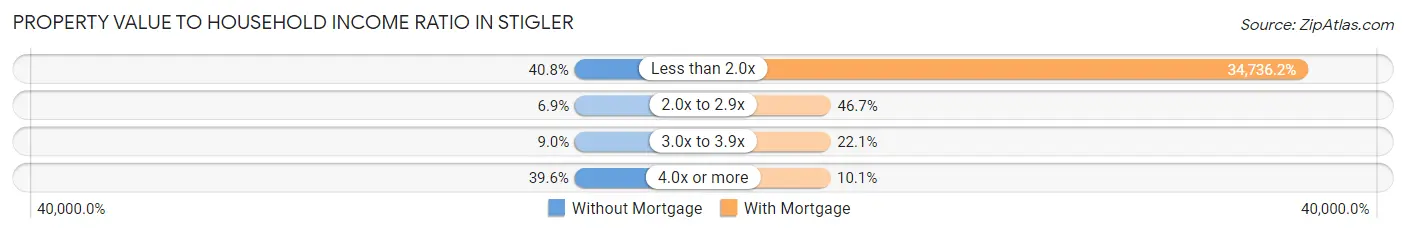
| Value-to-Income Ratio | Without Mortgage | With Mortgage |
| Less than 2.0x | 141 (40.7%) | 69,125 (34,736.2%) |
| 2.0x to 2.9x | 24 (6.9%) | 93 (46.7%) |
| 3.0x to 3.9x | 31 (9.0%) | 44 (22.1%) |
| 4.0x or more | 137 (39.6%) | 20 (10.1%) |
| Total | 346 (100.0%) | 199 (100.0%) |
Real Estate Taxes by Mortgage Status in Stigler
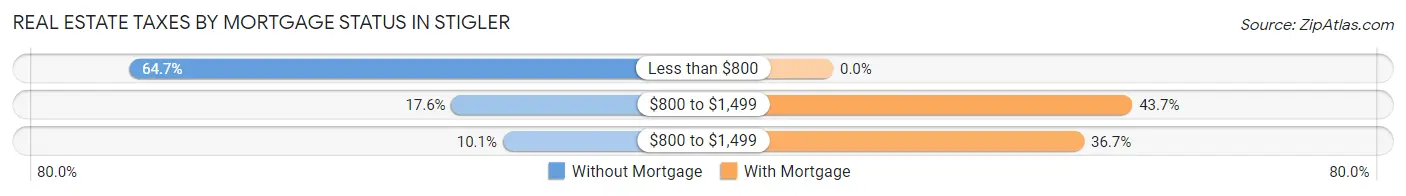
| Property Taxes | Without Mortgage | With Mortgage |
| Less than $800 | 224 (64.7%) | 0 (0.0%) |
| $800 to $1,499 | 61 (17.6%) | 87 (43.7%) |
| $800 to $1,499 | 35 (10.1%) | 73 (36.7%) |
| Total | 346 (100.0%) | 199 (100.0%) |
Health & Disability in Stigler
Health Insurance Coverage by Age in Stigler
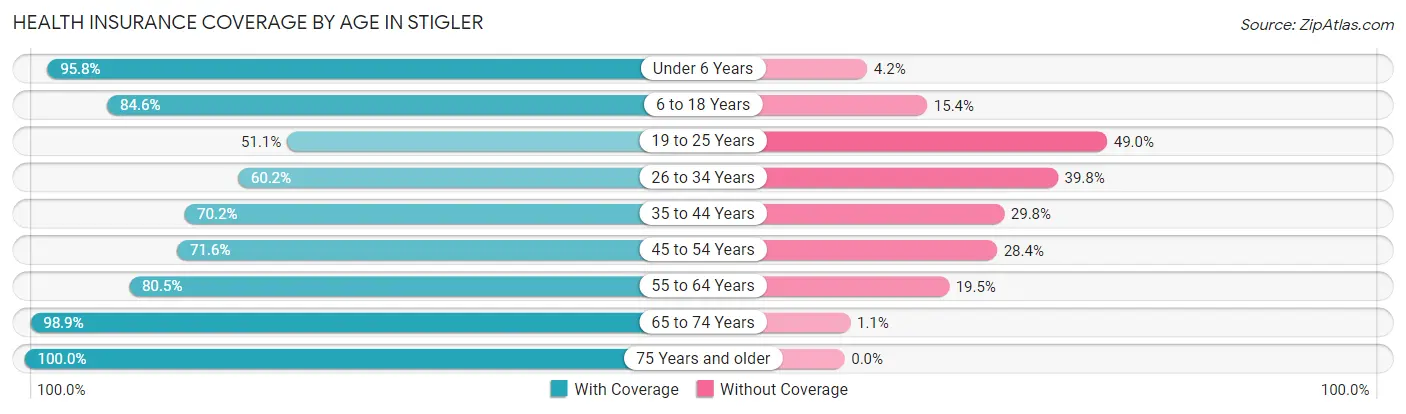
| Age Bracket | With Coverage | Without Coverage |
| Under 6 Years | 227 (95.8%) | 10 (4.2%) |
| 6 to 18 Years | 335 (84.6%) | 61 (15.4%) |
| 19 to 25 Years | 122 (51.0%) | 117 (48.9%) |
| 26 to 34 Years | 159 (60.2%) | 105 (39.8%) |
| 35 to 44 Years | 236 (70.2%) | 100 (29.8%) |
| 45 to 54 Years | 224 (71.6%) | 89 (28.4%) |
| 55 to 64 Years | 273 (80.5%) | 66 (19.5%) |
| 65 to 74 Years | 277 (98.9%) | 3 (1.1%) |
| 75 Years and older | 208 (100.0%) | 0 (0.0%) |
| Total | 2,061 (78.9%) | 551 (21.1%) |
Health Insurance Coverage by Citizenship Status in Stigler
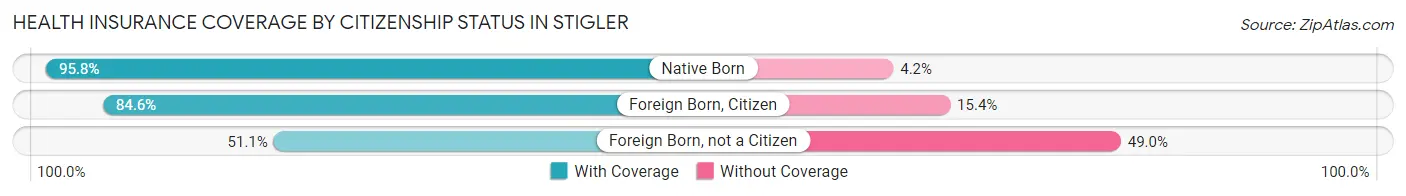
| Citizenship Status | With Coverage | Without Coverage |
| Native Born | 227 (95.8%) | 10 (4.2%) |
| Foreign Born, Citizen | 335 (84.6%) | 61 (15.4%) |
| Foreign Born, not a Citizen | 122 (51.0%) | 117 (48.9%) |
Health Insurance Coverage by Household Income in Stigler
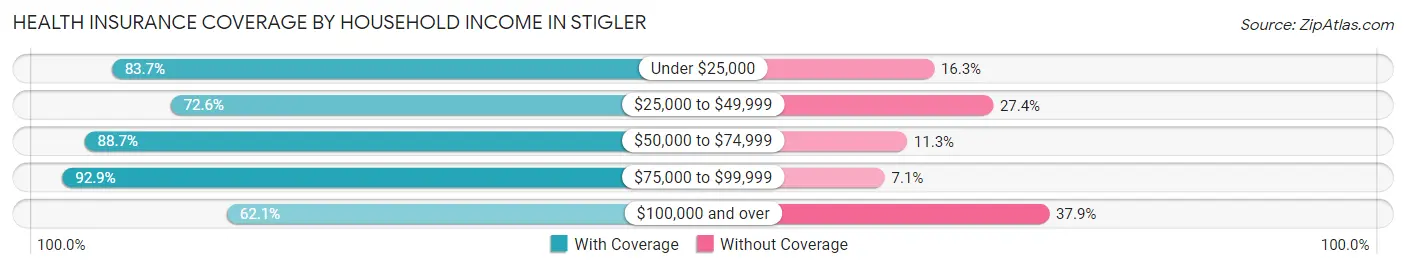
| Household Income | With Coverage | Without Coverage |
| Under $25,000 | 579 (83.7%) | 113 (16.3%) |
| $25,000 to $49,999 | 626 (72.6%) | 236 (27.4%) |
| $50,000 to $74,999 | 323 (88.7%) | 41 (11.3%) |
| $75,000 to $99,999 | 302 (92.9%) | 23 (7.1%) |
| $100,000 and over | 226 (62.1%) | 138 (37.9%) |
Public vs Private Health Insurance Coverage by Age in Stigler
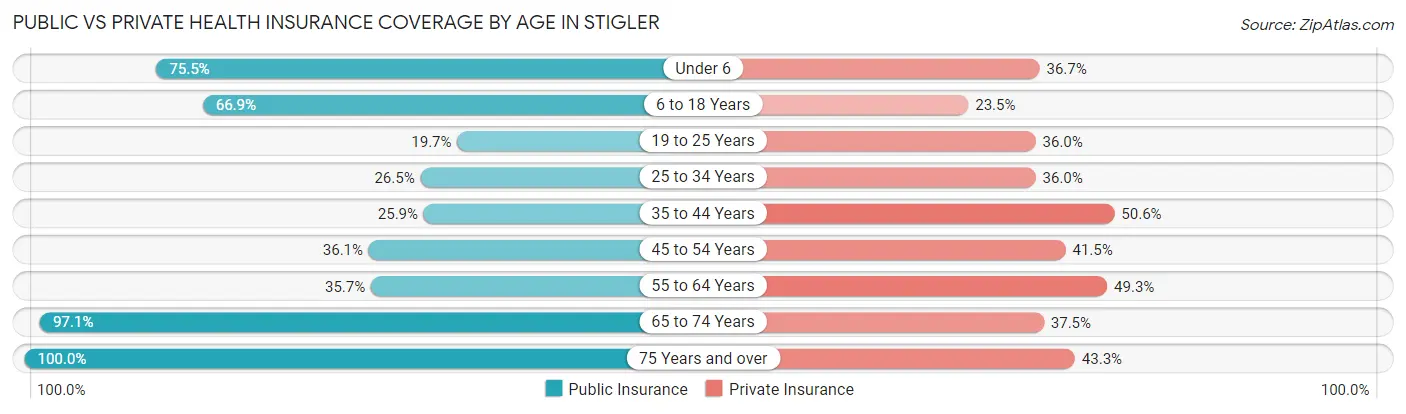
| Age Bracket | Public Insurance | Private Insurance |
| Under 6 | 179 (75.5%) | 87 (36.7%) |
| 6 to 18 Years | 265 (66.9%) | 93 (23.5%) |
| 19 to 25 Years | 47 (19.7%) | 86 (36.0%) |
| 25 to 34 Years | 70 (26.5%) | 95 (36.0%) |
| 35 to 44 Years | 87 (25.9%) | 170 (50.6%) |
| 45 to 54 Years | 113 (36.1%) | 130 (41.5%) |
| 55 to 64 Years | 121 (35.7%) | 167 (49.3%) |
| 65 to 74 Years | 272 (97.1%) | 105 (37.5%) |
| 75 Years and over | 208 (100.0%) | 90 (43.3%) |
| Total | 1,362 (52.1%) | 1,023 (39.2%) |
Disability Status by Sex by Age in Stigler
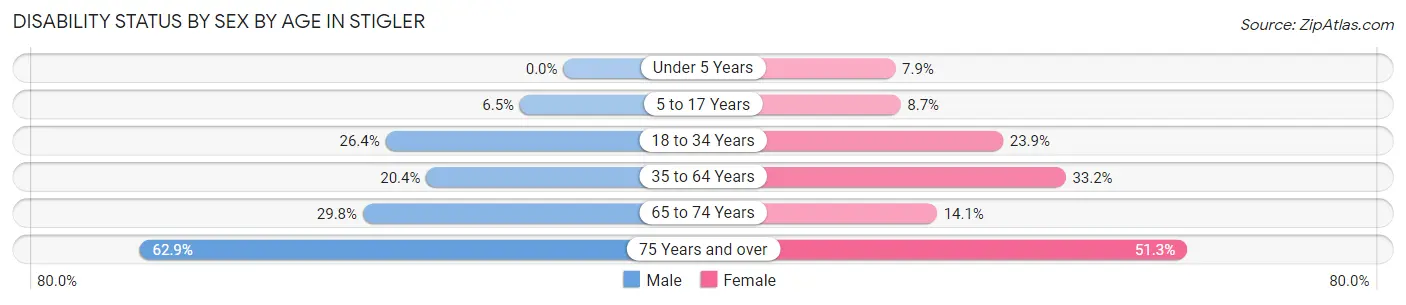
| Age Bracket | Male | Female |
| Under 5 Years | 0 (0.0%) | 8 (7.9%) |
| 5 to 17 Years | 12 (6.5%) | 20 (8.7%) |
| 18 to 34 Years | 80 (26.4%) | 55 (23.9%) |
| 35 to 64 Years | 92 (20.3%) | 178 (33.2%) |
| 65 to 74 Years | 39 (29.8%) | 21 (14.1%) |
| 75 Years and over | 56 (62.9%) | 61 (51.3%) |
Disability Class by Sex by Age in Stigler
Disability Class: Hearing Difficulty
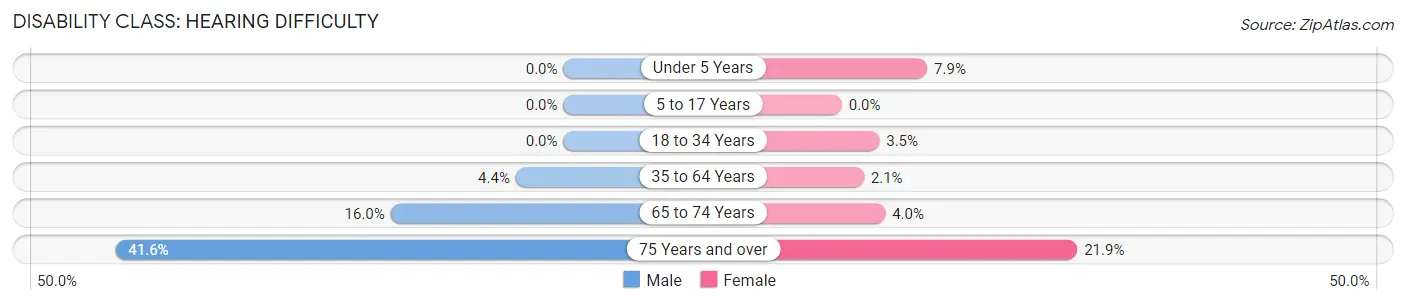
| Age Bracket | Male | Female |
| Under 5 Years | 0 (0.0%) | 8 (7.9%) |
| 5 to 17 Years | 0 (0.0%) | 0 (0.0%) |
| 18 to 34 Years | 0 (0.0%) | 8 (3.5%) |
| 35 to 64 Years | 20 (4.4%) | 11 (2.1%) |
| 65 to 74 Years | 21 (16.0%) | 6 (4.0%) |
| 75 Years and over | 37 (41.6%) | 26 (21.8%) |
Disability Class: Vision Difficulty
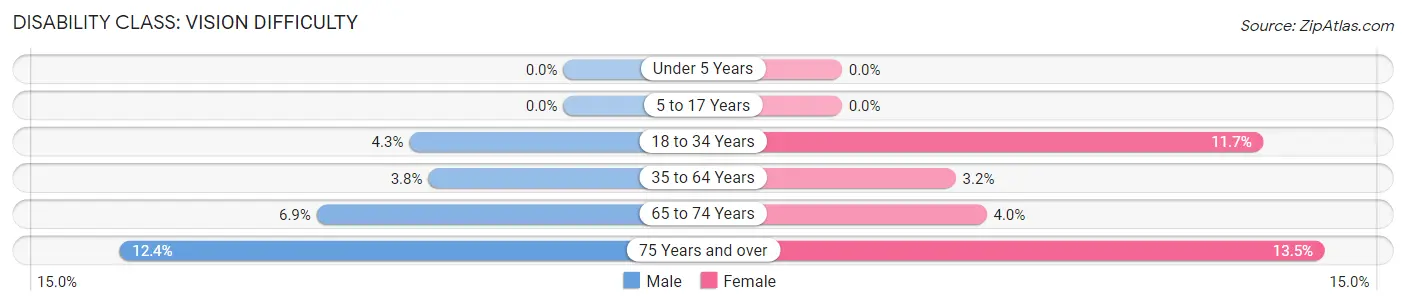
| Age Bracket | Male | Female |
| Under 5 Years | 0 (0.0%) | 0 (0.0%) |
| 5 to 17 Years | 0 (0.0%) | 0 (0.0%) |
| 18 to 34 Years | 13 (4.3%) | 27 (11.7%) |
| 35 to 64 Years | 17 (3.8%) | 17 (3.2%) |
| 65 to 74 Years | 9 (6.9%) | 6 (4.0%) |
| 75 Years and over | 11 (12.4%) | 16 (13.5%) |
Disability Class: Cognitive Difficulty
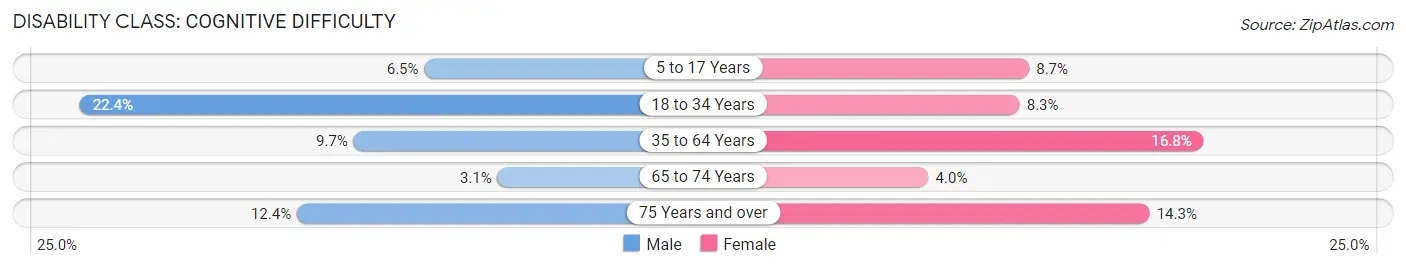
| Age Bracket | Male | Female |
| 5 to 17 Years | 12 (6.5%) | 20 (8.7%) |
| 18 to 34 Years | 68 (22.4%) | 19 (8.3%) |
| 35 to 64 Years | 44 (9.7%) | 90 (16.8%) |
| 65 to 74 Years | 4 (3.0%) | 6 (4.0%) |
| 75 Years and over | 11 (12.4%) | 17 (14.3%) |
Disability Class: Ambulatory Difficulty
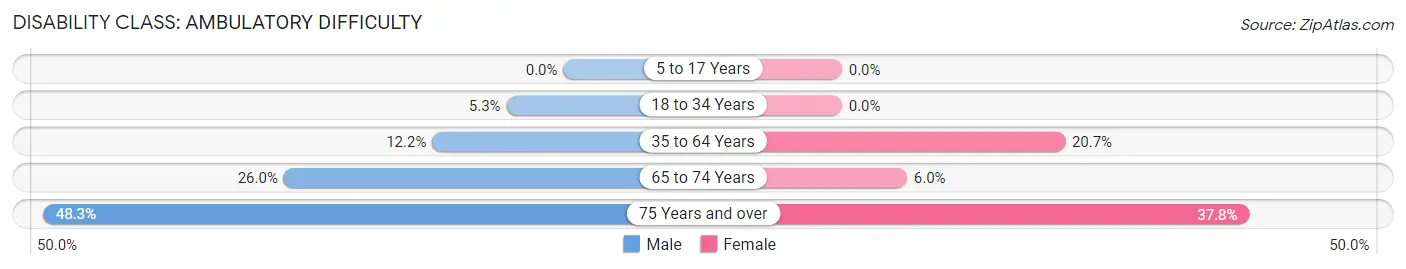
| Age Bracket | Male | Female |
| 5 to 17 Years | 0 (0.0%) | 0 (0.0%) |
| 18 to 34 Years | 16 (5.3%) | 0 (0.0%) |
| 35 to 64 Years | 55 (12.2%) | 111 (20.7%) |
| 65 to 74 Years | 34 (26.0%) | 9 (6.0%) |
| 75 Years and over | 43 (48.3%) | 45 (37.8%) |
Disability Class: Self-Care Difficulty
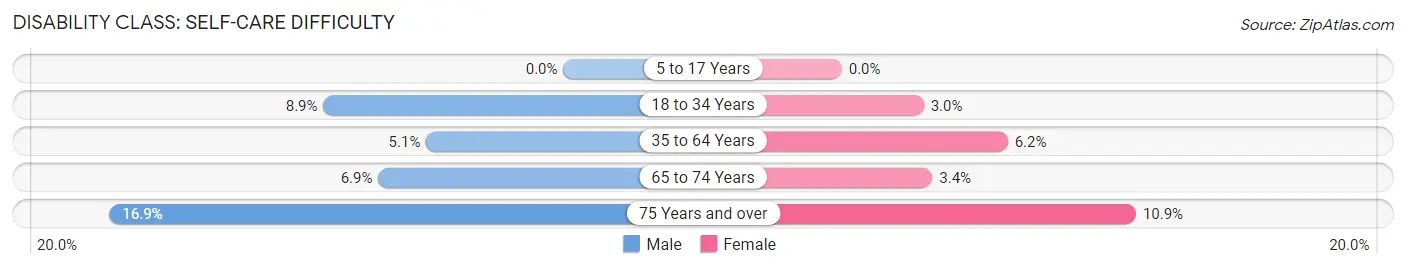
| Age Bracket | Male | Female |
| 5 to 17 Years | 0 (0.0%) | 0 (0.0%) |
| 18 to 34 Years | 27 (8.9%) | 7 (3.0%) |
| 35 to 64 Years | 23 (5.1%) | 33 (6.2%) |
| 65 to 74 Years | 9 (6.9%) | 5 (3.4%) |
| 75 Years and over | 15 (16.9%) | 13 (10.9%) |
Technology Access in Stigler
Computing Device Access in Stigler
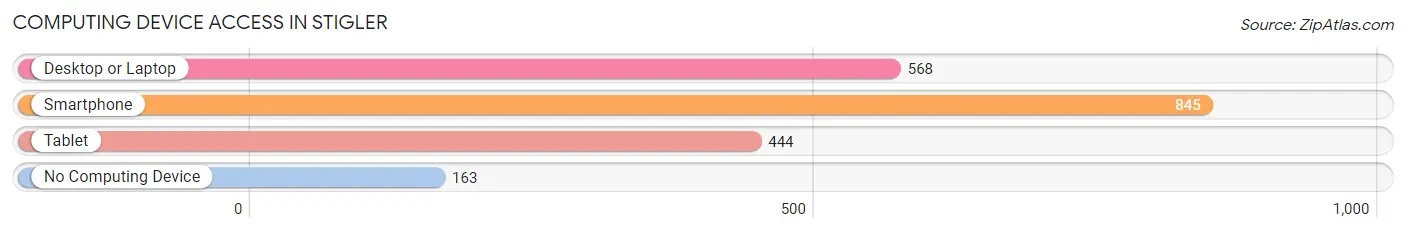
| Device Type | # Households | % Households |
| Desktop or Laptop | 568 | 53.2% |
| Smartphone | 845 | 79.1% |
| Tablet | 444 | 41.6% |
| No Computing Device | 163 | 15.3% |
| Total | 1,068 | 100.0% |
Internet Access in Stigler
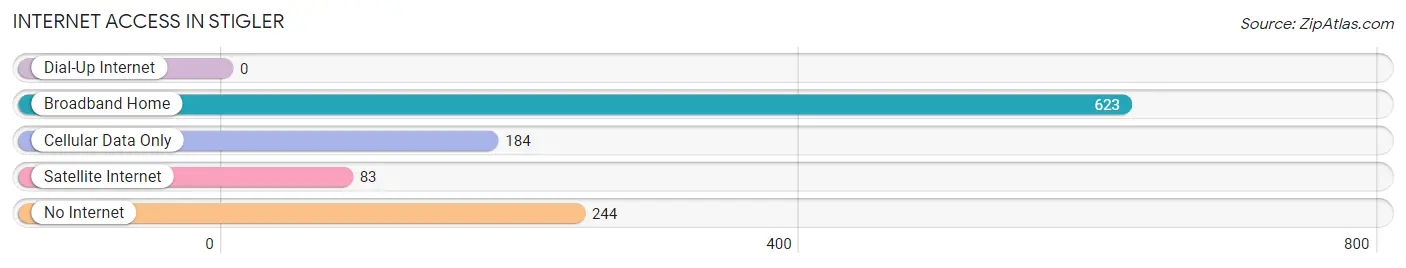
| Internet Type | # Households | % Households |
| Dial-Up Internet | 0 | 0.0% |
| Broadband Home | 623 | 58.3% |
| Cellular Data Only | 184 | 17.2% |
| Satellite Internet | 83 | 7.8% |
| No Internet | 244 | 22.9% |
| Total | 1,068 | 100.0% |
Stigler Summary
Stigler is a small town located in Haskell County, Oklahoma. It is situated in the foothills of the Ozark Mountains, and is surrounded by rolling hills and lush forests. The town was founded in 1891 by William Stigler, a German immigrant who had come to the area in search of a better life. Stigler has a population of approximately 2,000 people, and is the county seat of Haskell County.
Geography
Stigler is located in the foothills of the Ozark Mountains, and is surrounded by rolling hills and lush forests. The town is situated in the Arkansas River Valley, and is bordered by the Arkansas River to the east and the Poteau River to the west. The town is located approximately 30 miles south of Muskogee, Oklahoma, and is approximately 90 miles east of Tulsa, Oklahoma.
Economy
Stigler’s economy is largely based on agriculture and timber production. The town is home to several large farms, as well as several small family-owned farms. The town is also home to several timber companies, which harvest and process timber for use in construction and other industries.
In addition to agriculture and timber production, Stigler is also home to several small businesses, including restaurants, retail stores, and service providers. The town is also home to several manufacturing companies, which produce a variety of products, including furniture, clothing, and automotive parts.
Demographics
As of the 2010 census, Stigler had a population of 2,000 people. The racial makeup of the town was 95.2% White, 0.7% African American, 0.3% Native American, 0.2% Asian, 0.1% Pacific Islander, and 3.5% from other races. The median household income in Stigler was $30,000, and the median family income was $35,000.
Stigler is home to a variety of religious denominations, including Baptist, Methodist, and Catholic. The town is also home to several churches, including the First Baptist Church of Stigler, the First United Methodist Church of Stigler, and the St. Mary’s Catholic Church.
Conclusion
Stigler is a small town located in Haskell County, Oklahoma. It is situated in the foothills of the Ozark Mountains, and is surrounded by rolling hills and lush forests. The town was founded in 1891 by William Stigler, a German immigrant who had come to the area in search of a better life. Stigler has a population of approximately 2,000 people, and is the county seat of Haskell County. The town’s economy is largely based on agriculture and timber production, and is also home to several small businesses, manufacturing companies, and churches. The racial makeup of the town is 95.2% White, 0.7% African American, 0.3% Native American, 0.2% Asian, 0.1% Pacific Islander, and 3.5% from other races. The median household income in Stigler was $30,000, and the median family income was $35,000.
Common Questions
What is Per Capita Income in Stigler?
Per Capita income in Stigler is $20,707.
What is the Median Family Income in Stigler?
Median Family Income in Stigler is $45,652.
What is the Median Household income in Stigler?
Median Household Income in Stigler is $34,415.
What is Income or Wage Gap in Stigler?
Income or Wage Gap in Stigler is 19.7%.
Women in Stigler earn 80.3 cents for every dollar earned by a man.
What is Family Income Deficit in Stigler?
Family Income Deficit in Stigler is $11,531.
Families that are below poverty line in Stigler earn $11,531 less on average than the poverty threshold level.
What is Inequality or Gini Index in Stigler?
Inequality or Gini Index in Stigler is 0.43.
What is the Total Population of Stigler?
Total Population of Stigler is 2,687.
What is the Total Male Population of Stigler?
Total Male Population of Stigler is 1,279.
What is the Total Female Population of Stigler?
Total Female Population of Stigler is 1,408.
What is the Ratio of Males per 100 Females in Stigler?
There are 90.84 Males per 100 Females in Stigler.
What is the Ratio of Females per 100 Males in Stigler?
There are 110.09 Females per 100 Males in Stigler.
What is the Median Population Age in Stigler?
Median Population Age in Stigler is 41.1 Years.
What is the Average Family Size in Stigler
Average Family Size in Stigler is 3.1 People.
What is the Average Household Size in Stigler
Average Household Size in Stigler is 2.5 People.
How Large is the Labor Force in Stigler?
There are 1,142 People in the Labor Forcein in Stigler.
What is the Percentage of People in the Labor Force in Stigler?
52.5% of People are in the Labor Force in Stigler.
What is the Unemployment Rate in Stigler?
Unemployment Rate in Stigler is 12.6%.