Spiro, OK Map & Demographics
Spiro Map
Spiro Overview
$21,825
PER CAPITA INCOME
$43,523
AVG FAMILY INCOME
$33,295
AVG HOUSEHOLD INCOME
18.5%
WAGE / INCOME GAP [ % ]
81.5¢/ $1
WAGE / INCOME GAP [ $ ]
$13,170
FAMILY INCOME DEFICIT
0.49
INEQUALITY / GINI INDEX
2,095
TOTAL POPULATION
1,055
MALE POPULATION
1,040
FEMALE POPULATION
101.44
MALES / 100 FEMALES
98.58
FEMALES / 100 MALES
37.0
MEDIAN AGE
3.2
AVG FAMILY SIZE
2.4
AVG HOUSEHOLD SIZE
800
LABOR FORCE [ PEOPLE ]
49.0%
PERCENT IN LABOR FORCE
10.4%
UNEMPLOYMENT RATE
Spiro Zip Codes
Spiro Area Codes
Income in Spiro
Income Overview in Spiro
Per Capita Income in Spiro is $21,825, while median incomes of families and households are $43,523 and $33,295 respectively.
| Characteristic | Number | Measure |
| Per Capita Income | 2,095 | $21,825 |
| Median Family Income | 499 | $43,523 |
| Mean Family Income | 499 | $61,054 |
| Median Household Income | 835 | $33,295 |
| Mean Household Income | 835 | $51,749 |
| Income Deficit | 499 | $13,170 |
| Wage / Income Gap (%) | 2,095 | 18.53% |
| Wage / Income Gap ($) | 2,095 | 81.47¢ per $1 |
| Gini / Inequality Index | 2,095 | 0.49 |
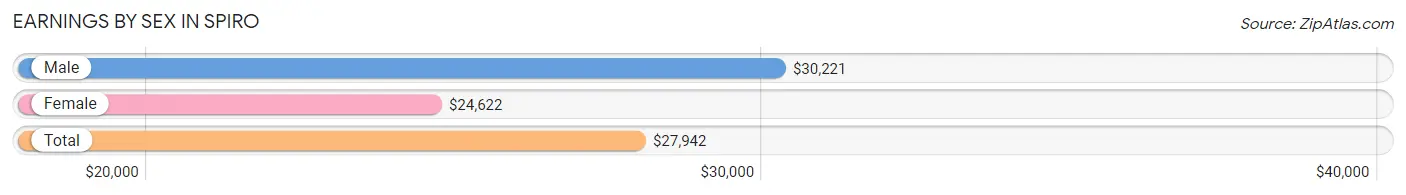
Earnings by Sex in Spiro
Average Earnings in Spiro are $27,942, $30,221 for men and $24,622 for women, a difference of 18.5%.
| Sex | Number | Average Earnings |
| Male | 438 (55.8%) | $30,221 |
| Female | 347 (44.2%) | $24,622 |
| Total | 785 (100.0%) | $27,942 |
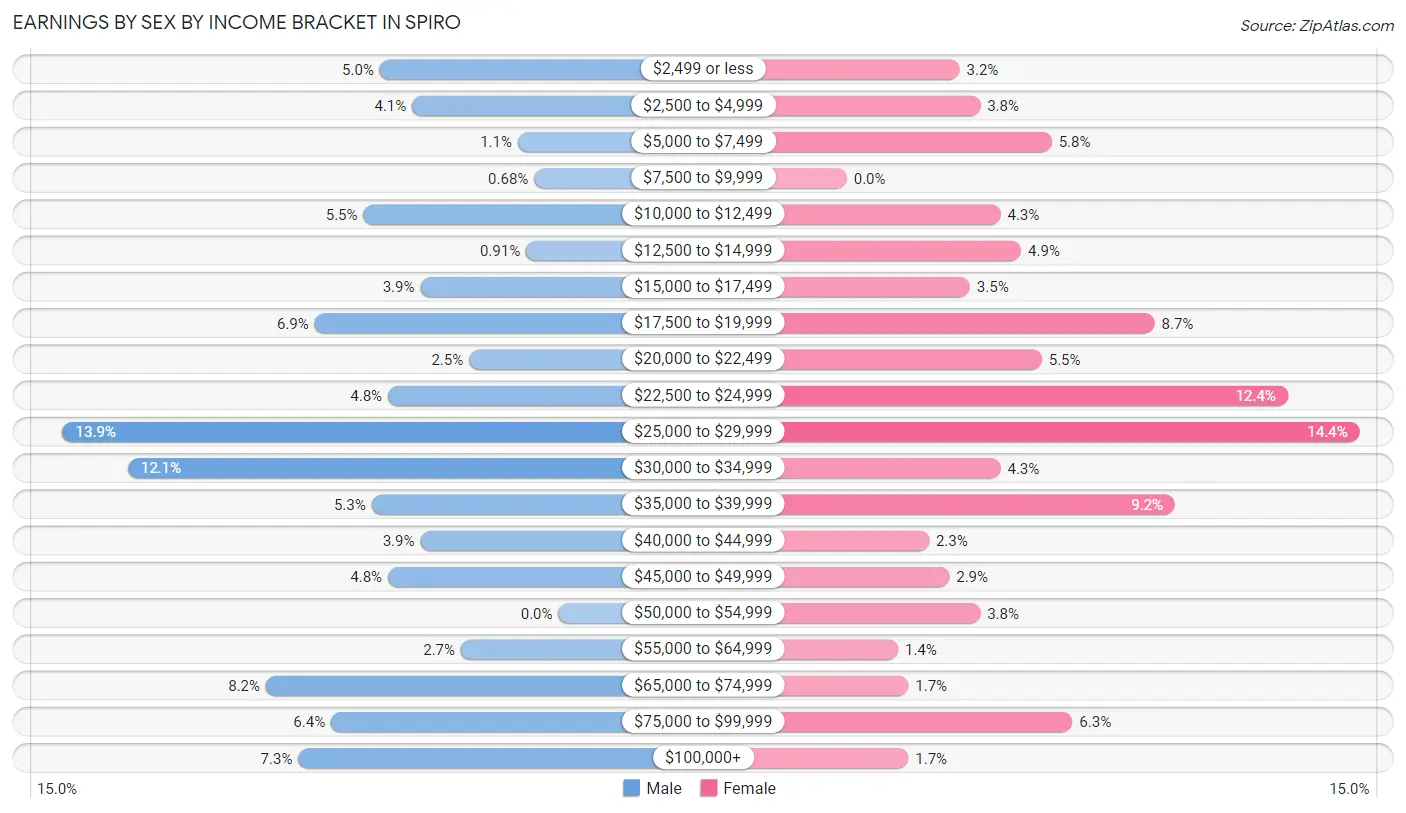
Earnings by Sex by Income Bracket in Spiro
The most common earnings brackets in Spiro are $25,000 to $29,999 for men (61 | 13.9%) and $25,000 to $29,999 for women (50 | 14.4%).
| Income | Male | Female |
| $2,499 or less | 22 (5.0%) | 11 (3.2%) |
| $2,500 to $4,999 | 18 (4.1%) | 13 (3.7%) |
| $5,000 to $7,499 | 5 (1.1%) | 20 (5.8%) |
| $7,500 to $9,999 | 3 (0.7%) | 0 (0.0%) |
| $10,000 to $12,499 | 24 (5.5%) | 15 (4.3%) |
| $12,500 to $14,999 | 4 (0.9%) | 17 (4.9%) |
| $15,000 to $17,499 | 17 (3.9%) | 12 (3.5%) |
| $17,500 to $19,999 | 30 (6.9%) | 30 (8.6%) |
| $20,000 to $22,499 | 11 (2.5%) | 19 (5.5%) |
| $22,500 to $24,999 | 21 (4.8%) | 43 (12.4%) |
| $25,000 to $29,999 | 61 (13.9%) | 50 (14.4%) |
| $30,000 to $34,999 | 53 (12.1%) | 15 (4.3%) |
| $35,000 to $39,999 | 23 (5.2%) | 32 (9.2%) |
| $40,000 to $44,999 | 17 (3.9%) | 8 (2.3%) |
| $45,000 to $49,999 | 21 (4.8%) | 10 (2.9%) |
| $50,000 to $54,999 | 0 (0.0%) | 13 (3.7%) |
| $55,000 to $64,999 | 12 (2.7%) | 5 (1.4%) |
| $65,000 to $74,999 | 36 (8.2%) | 6 (1.7%) |
| $75,000 to $99,999 | 28 (6.4%) | 22 (6.3%) |
| $100,000+ | 32 (7.3%) | 6 (1.7%) |
| Total | 438 (100.0%) | 347 (100.0%) |
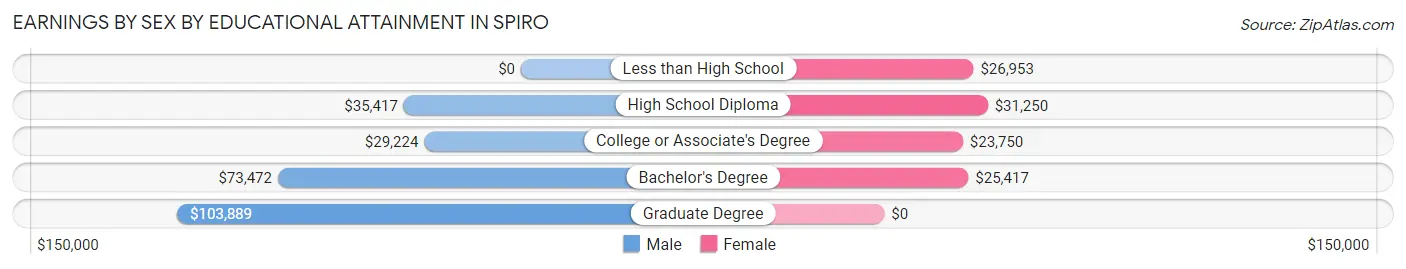
Earnings by Sex by Educational Attainment in Spiro
Average earnings in Spiro are $31,827 for men and $25,862 for women, a difference of 18.7%. Men with an educational attainment of graduate degree enjoy the highest average annual earnings of $103,889, while those with college or associate's degree education earn the least with $29,224. Women with an educational attainment of high school diploma earn the most with the average annual earnings of $31,250, while those with college or associate's degree education have the smallest earnings of $23,750.
| Educational Attainment | Male Income | Female Income |
| Less than High School | - | - |
| High School Diploma | $35,417 | $31,250 |
| College or Associate's Degree | $29,224 | $23,750 |
| Bachelor's Degree | $73,472 | $25,417 |
| Graduate Degree | $103,889 | $0 |
| Total | $31,827 | $25,862 |
Family Income in Spiro
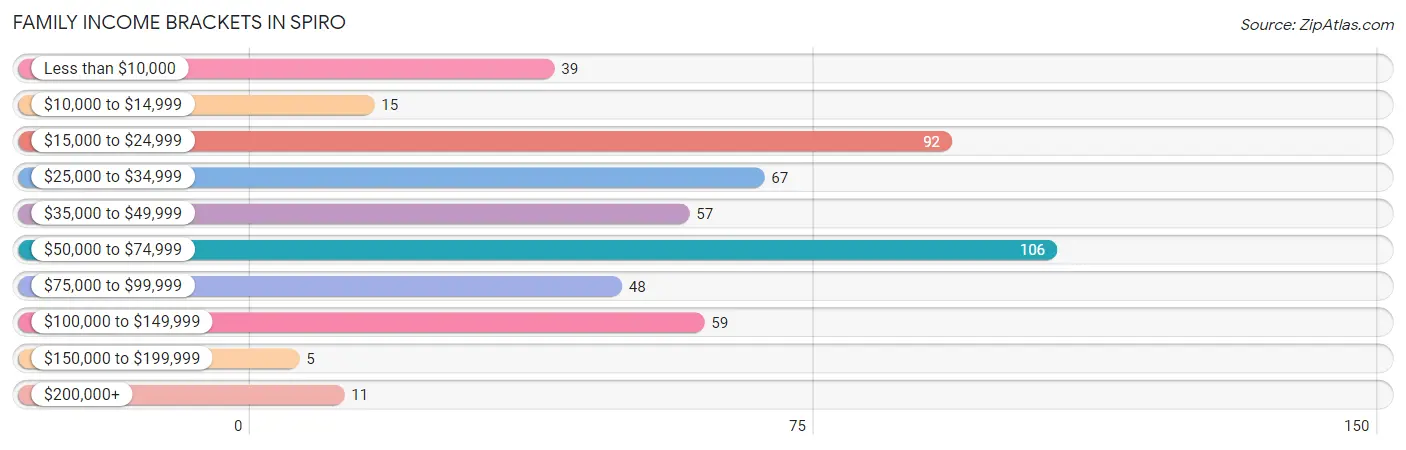
Family Income Brackets in Spiro
According to the Spiro family income data, there are 106 families falling into the $50,000 to $74,999 income range, which is the most common income bracket and makes up 21.2% of all families. Conversely, the $150,000 to $199,999 income bracket is the least frequent group with only 5 families (1.0%) belonging to this category.
| Income Bracket | # Families | % Families |
| Less than $10,000 | 39 | 7.8% |
| $10,000 to $14,999 | 15 | 3.0% |
| $15,000 to $24,999 | 92 | 18.4% |
| $25,000 to $34,999 | 67 | 13.4% |
| $35,000 to $49,999 | 57 | 11.4% |
| $50,000 to $74,999 | 106 | 21.2% |
| $75,000 to $99,999 | 48 | 9.6% |
| $100,000 to $149,999 | 59 | 11.8% |
| $150,000 to $199,999 | 5 | 1.0% |
| $200,000+ | 11 | 2.2% |
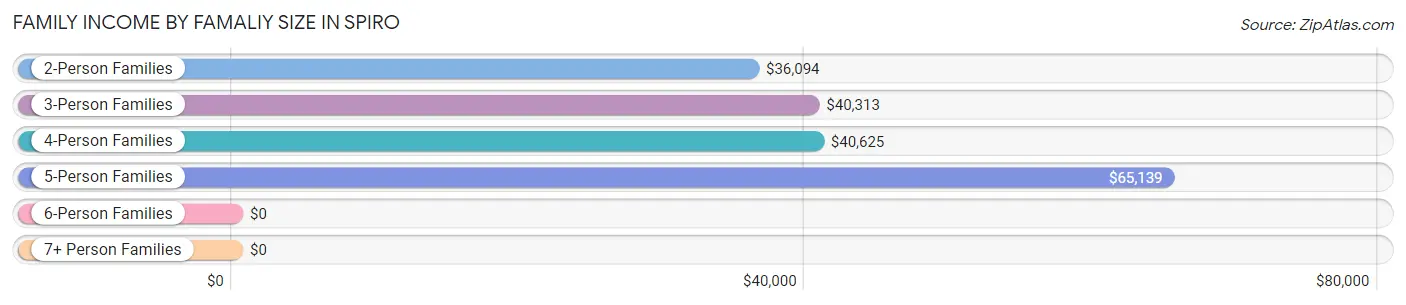
Family Income by Famaliy Size in Spiro
5-person families (49 | 9.8%) account for the highest median family income in Spiro with $65,139 per family, while 2-person families (229 | 45.9%) have the highest median income of $18,047 per family member.
| Income Bracket | # Families | Median Income |
| 2-Person Families | 229 (45.9%) | $36,094 |
| 3-Person Families | 118 (23.6%) | $40,313 |
| 4-Person Families | 96 (19.2%) | $40,625 |
| 5-Person Families | 49 (9.8%) | $65,139 |
| 6-Person Families | 7 (1.4%) | $0 |
| 7+ Person Families | 0 (0.0%) | $0 |
| Total | 499 (100.0%) | $43,523 |
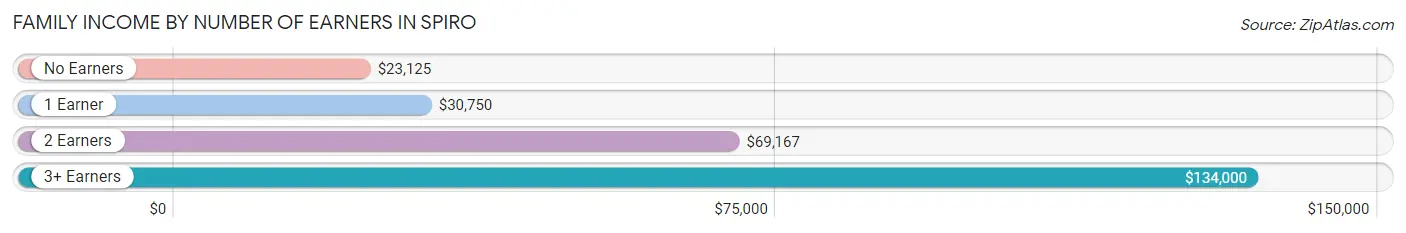
Family Income by Number of Earners in Spiro
The median family income in Spiro is $43,523, with families comprising 3+ earners (14) having the highest median family income of $134,000, while families with no earners (132) have the lowest median family income of $23,125, accounting for 2.8% and 26.5% of families, respectively.
| Number of Earners | # Families | Median Income |
| No Earners | 132 (26.5%) | $23,125 |
| 1 Earner | 217 (43.5%) | $30,750 |
| 2 Earners | 136 (27.3%) | $69,167 |
| 3+ Earners | 14 (2.8%) | $134,000 |
| Total | 499 (100.0%) | $43,523 |
Household Income in Spiro
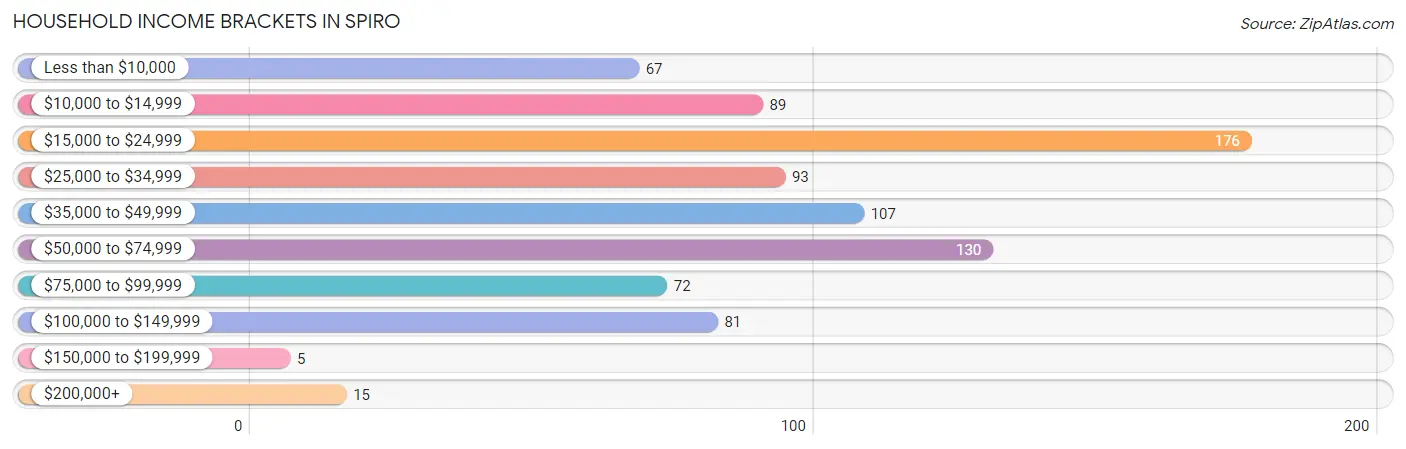
Household Income Brackets in Spiro
With 176 households falling in the category, the $15,000 to $24,999 income range is the most frequent in Spiro, accounting for 21.1% of all households. In contrast, only 5 households (0.6%) fall into the $150,000 to $199,999 income bracket, making it the least populous group.
| Income Bracket | # Households | % Households |
| Less than $10,000 | 67 | 8.0% |
| $10,000 to $14,999 | 89 | 10.7% |
| $15,000 to $24,999 | 176 | 21.1% |
| $25,000 to $34,999 | 93 | 11.1% |
| $35,000 to $49,999 | 107 | 12.8% |
| $50,000 to $74,999 | 130 | 15.6% |
| $75,000 to $99,999 | 72 | 8.6% |
| $100,000 to $149,999 | 81 | 9.7% |
| $150,000 to $199,999 | 5 | 0.6% |
| $200,000+ | 15 | 1.8% |
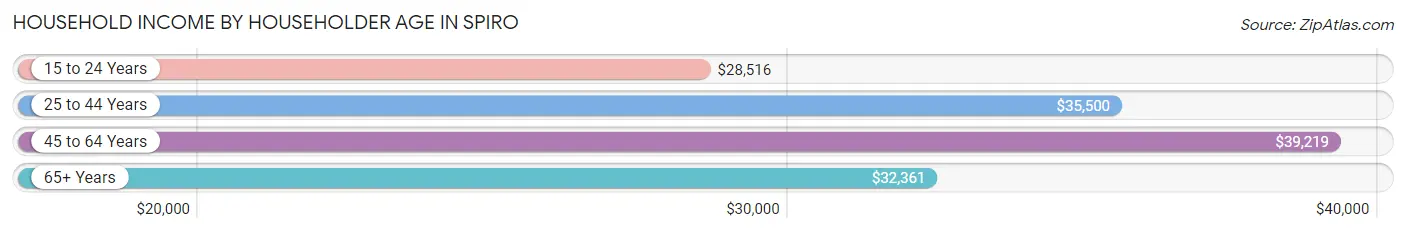
Household Income by Householder Age in Spiro
The median household income in Spiro is $33,295, with the highest median household income of $39,219 found in the 45 to 64 years age bracket for the primary householder. A total of 297 households (35.6%) fall into this category. Meanwhile, the 15 to 24 years age bracket for the primary householder has the lowest median household income of $28,516, with 51 households (6.1%) in this group.
| Income Bracket | # Households | Median Income |
| 15 to 24 Years | 51 (6.1%) | $28,516 |
| 25 to 44 Years | 262 (31.4%) | $35,500 |
| 45 to 64 Years | 297 (35.6%) | $39,219 |
| 65+ Years | 225 (27.0%) | $32,361 |
| Total | 835 (100.0%) | $33,295 |
Poverty in Spiro
Income Below Poverty by Sex and Age in Spiro
With 14.9% poverty level for males and 33.1% for females among the residents of Spiro, under 5 year old males and under 5 year old females are the most vulnerable to poverty, with 38 males (33.0%) and 34 females (100.0%) in their respective age groups living below the poverty level.
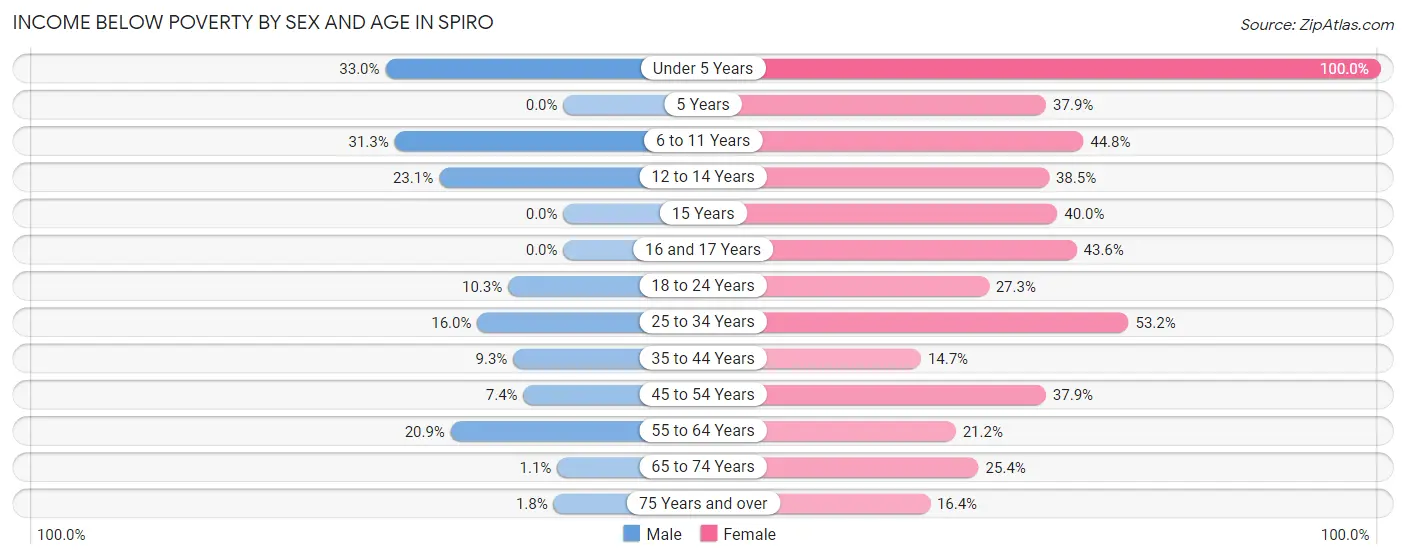
| Age Bracket | Male | Female |
| Under 5 Years | 38 (33.0%) | 34 (100.0%) |
| 5 Years | 0 (0.0%) | 11 (37.9%) |
| 6 to 11 Years | 21 (31.3%) | 39 (44.8%) |
| 12 to 14 Years | 21 (23.1%) | 5 (38.5%) |
| 15 Years | 0 (0.0%) | 4 (40.0%) |
| 16 and 17 Years | 0 (0.0%) | 17 (43.6%) |
| 18 to 24 Years | 12 (10.3%) | 24 (27.3%) |
| 25 to 34 Years | 19 (16.0%) | 66 (53.2%) |
| 35 to 44 Years | 11 (9.3%) | 26 (14.7%) |
| 45 to 54 Years | 10 (7.4%) | 36 (37.9%) |
| 55 to 64 Years | 23 (20.9%) | 22 (21.1%) |
| 65 to 74 Years | 1 (1.1%) | 32 (25.4%) |
| 75 Years and over | 1 (1.8%) | 9 (16.4%) |
| Total | 157 (14.9%) | 325 (33.1%) |
Income Above Poverty by Sex and Age in Spiro
According to the poverty statistics in Spiro, males aged 5 years and females aged 35 to 44 years are the age groups that are most secure financially, with 100.0% of males and 85.3% of females in these age groups living above the poverty line.
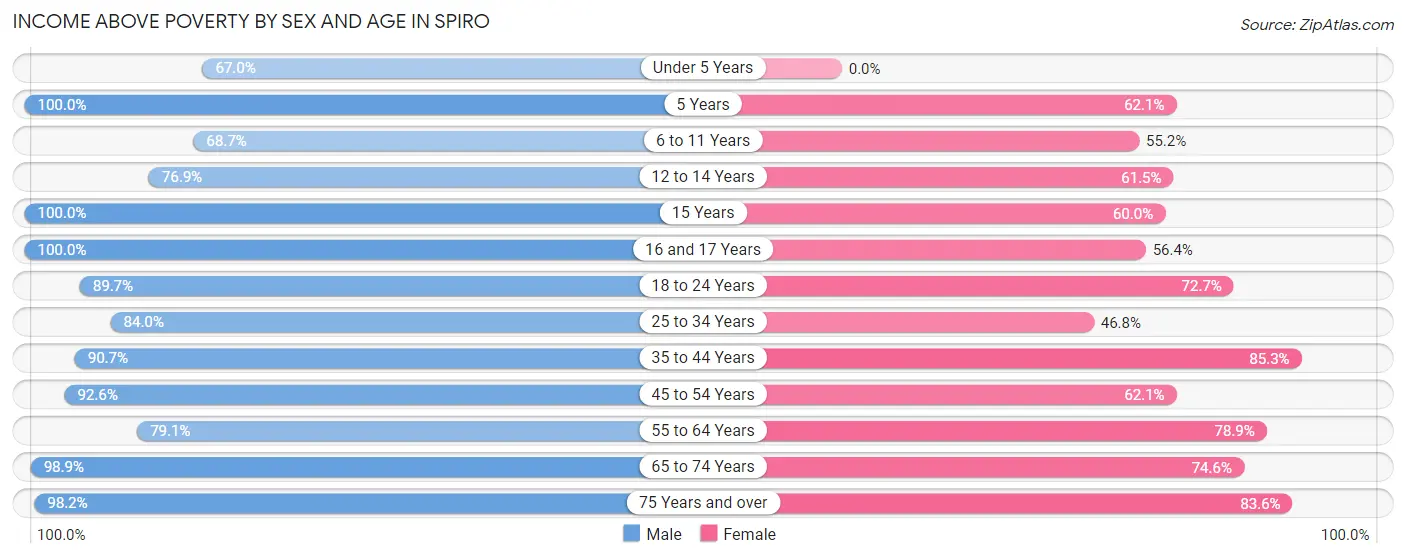
| Age Bracket | Male | Female |
| Under 5 Years | 77 (67.0%) | 0 (0.0%) |
| 5 Years | 7 (100.0%) | 18 (62.1%) |
| 6 to 11 Years | 46 (68.7%) | 48 (55.2%) |
| 12 to 14 Years | 70 (76.9%) | 8 (61.5%) |
| 15 Years | 10 (100.0%) | 6 (60.0%) |
| 16 and 17 Years | 23 (100.0%) | 22 (56.4%) |
| 18 to 24 Years | 105 (89.7%) | 64 (72.7%) |
| 25 to 34 Years | 100 (84.0%) | 58 (46.8%) |
| 35 to 44 Years | 107 (90.7%) | 151 (85.3%) |
| 45 to 54 Years | 125 (92.6%) | 59 (62.1%) |
| 55 to 64 Years | 87 (79.1%) | 82 (78.8%) |
| 65 to 74 Years | 87 (98.9%) | 94 (74.6%) |
| 75 Years and over | 54 (98.2%) | 46 (83.6%) |
| Total | 898 (85.1%) | 656 (66.9%) |
Income Below Poverty Among Married-Couple Families in Spiro
The poverty statistics for married-couple families in Spiro show that 14.8% or 45 of the total 303 families live below the poverty line. Families with 1 or 2 children have the highest poverty rate of 24.5%, comprising of 25 families. On the other hand, families with 3 or 4 children have the lowest poverty rate of 7.8%, which includes 4 families.
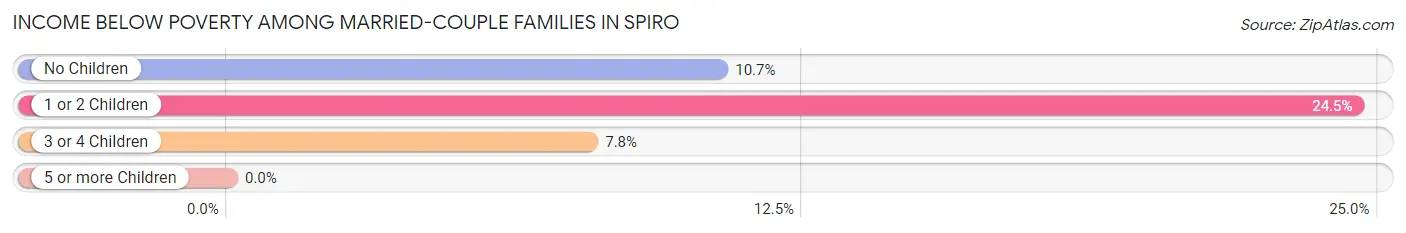
| Children | Above Poverty | Below Poverty |
| No Children | 134 (89.3%) | 16 (10.7%) |
| 1 or 2 Children | 77 (75.5%) | 25 (24.5%) |
| 3 or 4 Children | 47 (92.2%) | 4 (7.8%) |
| 5 or more Children | 0 (0.0%) | 0 (0.0%) |
| Total | 258 (85.2%) | 45 (14.8%) |
Income Below Poverty Among Single-Parent Households in Spiro
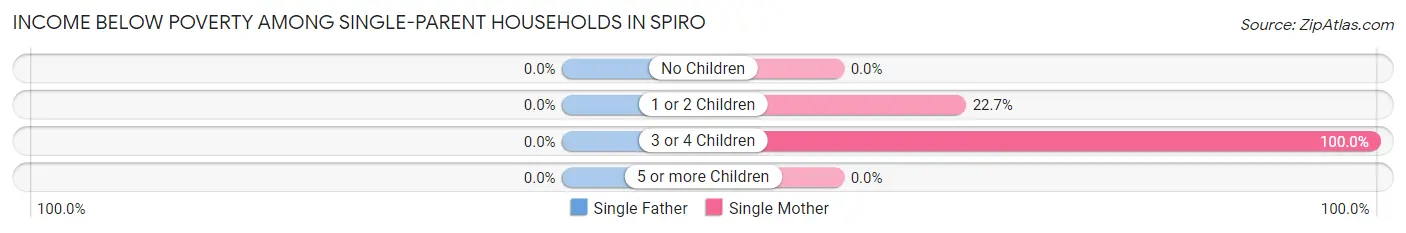
| Children | Single Father | Single Mother |
| No Children | 0 (0.0%) | 0 (0.0%) |
| 1 or 2 Children | 0 (0.0%) | 20 (22.7%) |
| 3 or 4 Children | 0 (0.0%) | 27 (100.0%) |
| 5 or more Children | 0 (0.0%) | 0 (0.0%) |
| Total | 0 (0.0%) | 47 (28.5%) |
Income Below Poverty Among Married-Couple vs Single-Parent Households in Spiro
The poverty data for Spiro shows that 45 of the married-couple family households (14.8%) and 47 of the single-parent households (24.0%) are living below the poverty level. Within the married-couple family households, those with 1 or 2 children have the highest poverty rate, with 25 households (24.5%) falling below the poverty line. Among the single-parent households, those with 3 or 4 children have the highest poverty rate, with 27 household (100.0%) living below poverty.
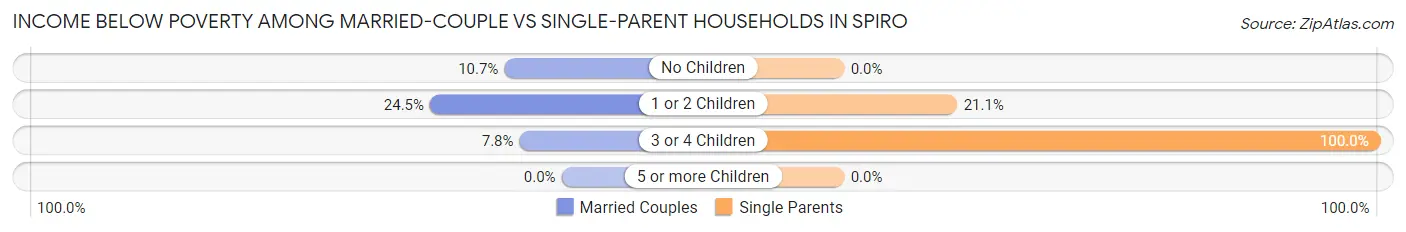
| Children | Married-Couple Families | Single-Parent Households |
| No Children | 16 (10.7%) | 0 (0.0%) |
| 1 or 2 Children | 25 (24.5%) | 20 (21.0%) |
| 3 or 4 Children | 4 (7.8%) | 27 (100.0%) |
| 5 or more Children | 0 (0.0%) | 0 (0.0%) |
| Total | 45 (14.8%) | 47 (24.0%) |
Race in Spiro
The most populous races in Spiro are White / Caucasian (1,487 | 71.0%), Native / Alaskan (274 | 13.1%), and Two or more Races (157 | 7.5%).
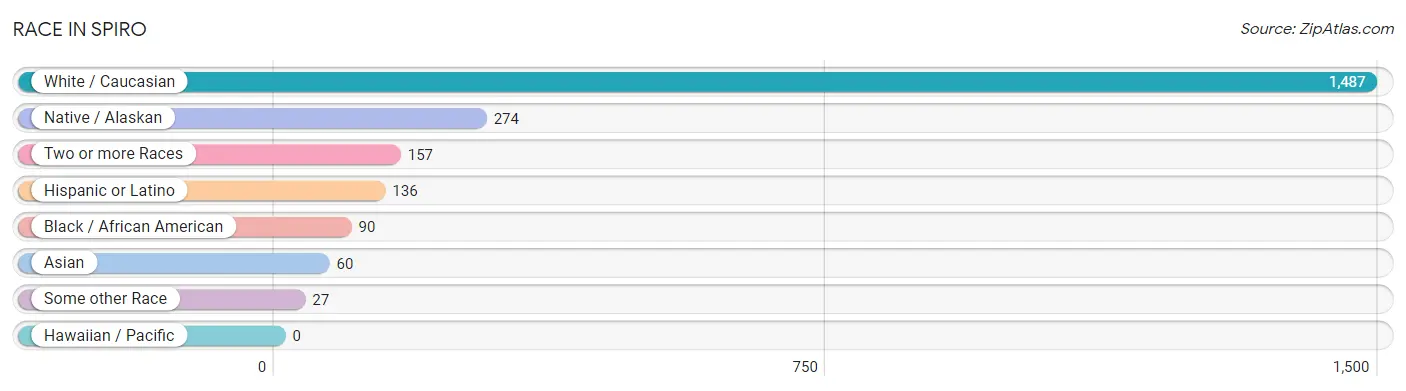
| Race | # Population | % Population |
| Asian | 60 | 2.9% |
| Black / African American | 90 | 4.3% |
| Hawaiian / Pacific | 0 | 0.0% |
| Hispanic or Latino | 136 | 6.5% |
| Native / Alaskan | 274 | 13.1% |
| White / Caucasian | 1,487 | 71.0% |
| Two or more Races | 157 | 7.5% |
| Some other Race | 27 | 1.3% |
| Total | 2,095 | 100.0% |
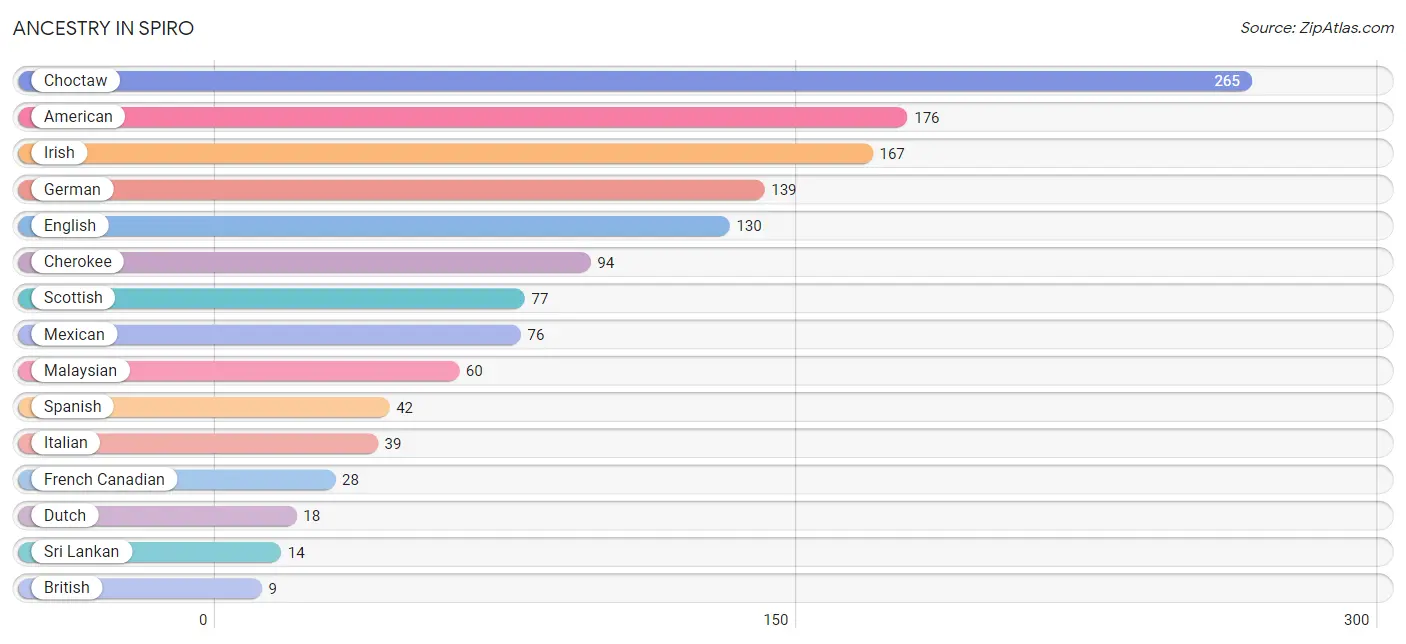
Ancestry in Spiro
The most populous ancestries reported in Spiro are Choctaw (265 | 12.7%), American (176 | 8.4%), Irish (167 | 8.0%), German (139 | 6.6%), and English (130 | 6.2%), together accounting for 41.9% of all Spiro residents.
| Ancestry | # Population | % Population |
| American | 176 | 8.4% |
| Bhutanese | 7 | 0.3% |
| British | 9 | 0.4% |
| Central American | 5 | 0.2% |
| Cherokee | 94 | 4.5% |
| Choctaw | 265 | 12.7% |
| Creek | 2 | 0.1% |
| Cuban | 8 | 0.4% |
| Dutch | 18 | 0.9% |
| Dutch West Indian | 2 | 0.1% |
| English | 130 | 6.2% |
| European | 5 | 0.2% |
| French | 4 | 0.2% |
| French Canadian | 28 | 1.3% |
| German | 139 | 6.6% |
| Honduran | 5 | 0.2% |
| Irish | 167 | 8.0% |
| Iroquois | 5 | 0.2% |
| Italian | 39 | 1.9% |
| Malaysian | 60 | 2.9% |
| Mexican | 76 | 3.6% |
| Osage | 4 | 0.2% |
| Polish | 8 | 0.4% |
| Portuguese | 2 | 0.1% |
| Puerto Rican | 5 | 0.2% |
| Scotch-Irish | 9 | 0.4% |
| Scottish | 77 | 3.7% |
| Spanish | 42 | 2.0% |
| Sri Lankan | 14 | 0.7% |
| Ute | 3 | 0.1% | View All 30 Rows |
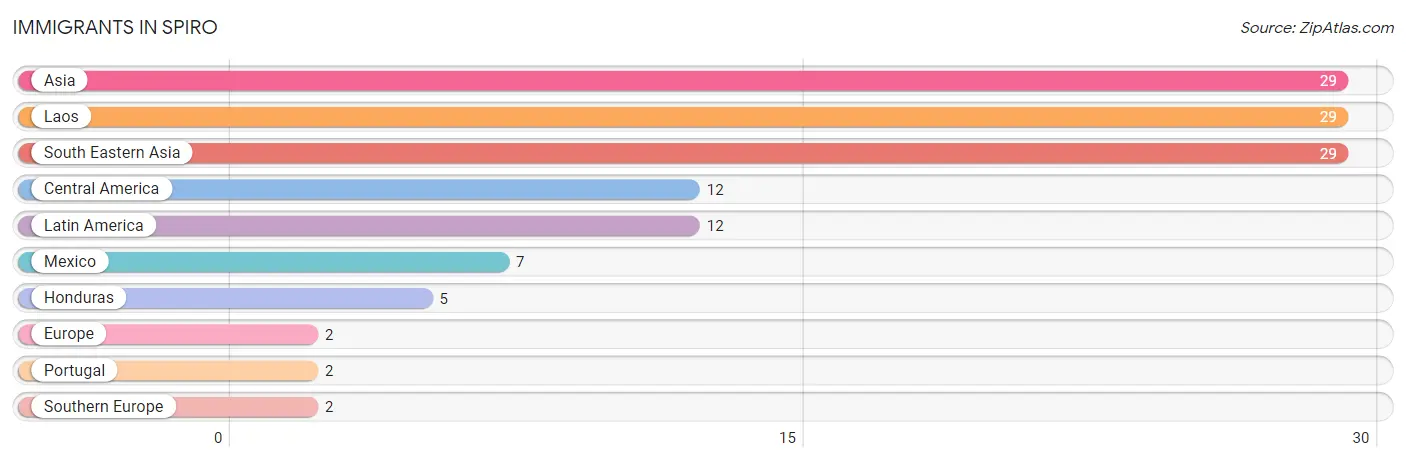
Immigrants in Spiro
The most numerous immigrant groups reported in Spiro came from Asia (29 | 1.4%), Laos (29 | 1.4%), South Eastern Asia (29 | 1.4%), Central America (12 | 0.6%), and Latin America (12 | 0.6%), together accounting for 5.3% of all Spiro residents.
| Immigration Origin | # Population | % Population |
| Asia | 29 | 1.4% |
| Central America | 12 | 0.6% |
| Europe | 2 | 0.1% |
| Honduras | 5 | 0.2% |
| Laos | 29 | 1.4% |
| Latin America | 12 | 0.6% |
| Mexico | 7 | 0.3% |
| Portugal | 2 | 0.1% |
| South Eastern Asia | 29 | 1.4% |
| Southern Europe | 2 | 0.1% | View All 10 Rows |
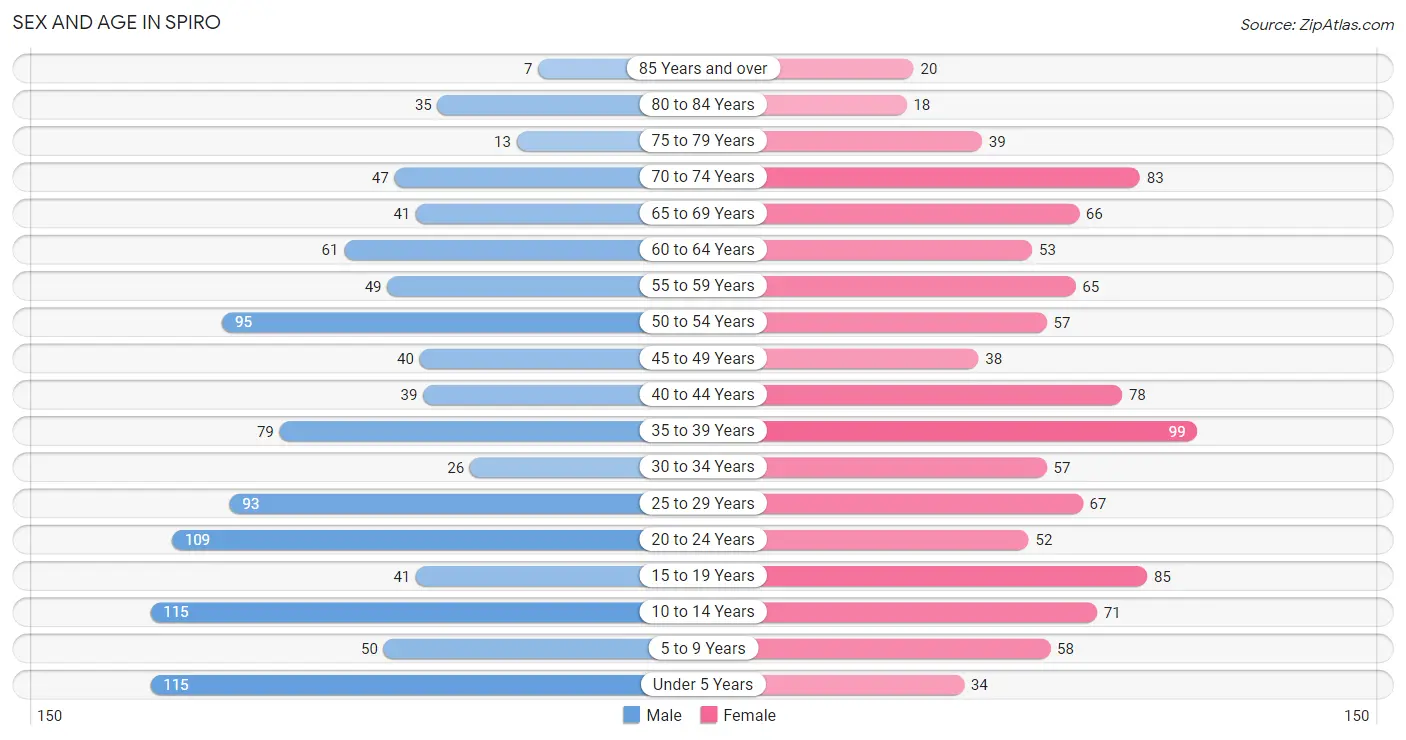
Sex and Age in Spiro
Sex and Age in Spiro
The most populous age groups in Spiro are Under 5 Years (115 | 10.9%) for men and 35 to 39 Years (99 | 9.5%) for women.
| Age Bracket | Male | Female |
| Under 5 Years | 115 (10.9%) | 34 (3.3%) |
| 5 to 9 Years | 50 (4.7%) | 58 (5.6%) |
| 10 to 14 Years | 115 (10.9%) | 71 (6.8%) |
| 15 to 19 Years | 41 (3.9%) | 85 (8.2%) |
| 20 to 24 Years | 109 (10.3%) | 52 (5.0%) |
| 25 to 29 Years | 93 (8.8%) | 67 (6.4%) |
| 30 to 34 Years | 26 (2.5%) | 57 (5.5%) |
| 35 to 39 Years | 79 (7.5%) | 99 (9.5%) |
| 40 to 44 Years | 39 (3.7%) | 78 (7.5%) |
| 45 to 49 Years | 40 (3.8%) | 38 (3.6%) |
| 50 to 54 Years | 95 (9.0%) | 57 (5.5%) |
| 55 to 59 Years | 49 (4.6%) | 65 (6.2%) |
| 60 to 64 Years | 61 (5.8%) | 53 (5.1%) |
| 65 to 69 Years | 41 (3.9%) | 66 (6.4%) |
| 70 to 74 Years | 47 (4.4%) | 83 (8.0%) |
| 75 to 79 Years | 13 (1.2%) | 39 (3.7%) |
| 80 to 84 Years | 35 (3.3%) | 18 (1.7%) |
| 85 Years and over | 7 (0.7%) | 20 (1.9%) |
| Total | 1,055 (100.0%) | 1,040 (100.0%) |
Families and Households in Spiro
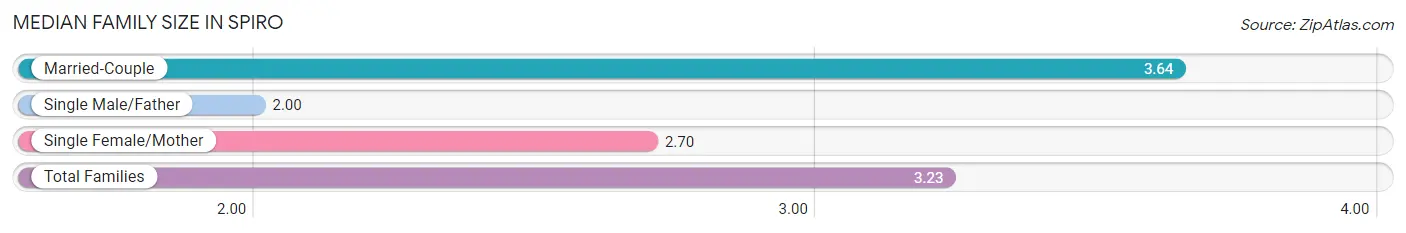
Median Family Size in Spiro
The median family size in Spiro is 3.23 persons per family, with married-couple families (303 | 60.7%) accounting for the largest median family size of 3.64 persons per family. On the other hand, single male/father families (31 | 6.2%) represent the smallest median family size with 2.00 persons per family.
| Family Type | # Families | Family Size |
| Married-Couple | 303 (60.7%) | 3.64 |
| Single Male/Father | 31 (6.2%) | 2.00 |
| Single Female/Mother | 165 (33.1%) | 2.70 |
| Total Families | 499 (100.0%) | 3.23 |
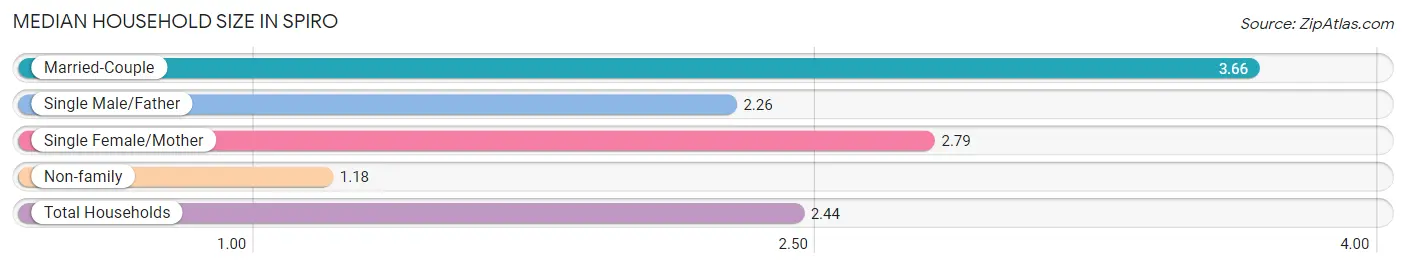
Median Household Size in Spiro
The median household size in Spiro is 2.44 persons per household, with married-couple households (303 | 36.3%) accounting for the largest median household size of 3.66 persons per household. non-family households (336 | 40.2%) represent the smallest median household size with 1.18 persons per household.
| Household Type | # Households | Household Size |
| Married-Couple | 303 (36.3%) | 3.66 |
| Single Male/Father | 31 (3.7%) | 2.26 |
| Single Female/Mother | 165 (19.8%) | 2.79 |
| Non-family | 336 (40.2%) | 1.18 |
| Total Households | 835 (100.0%) | 2.44 |
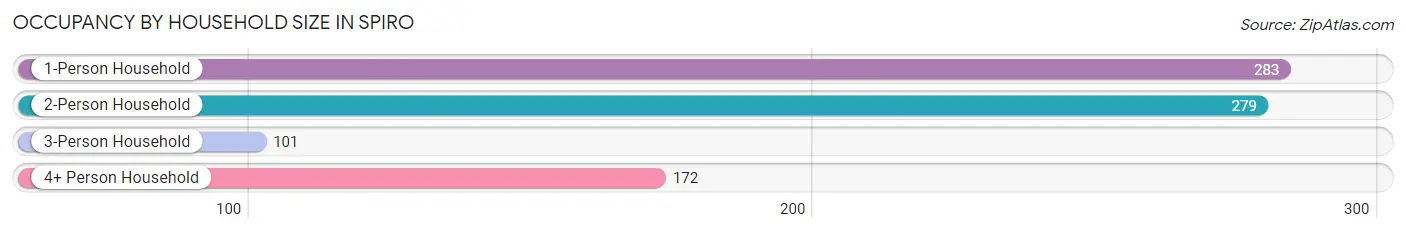
Household Size by Marriage Status in Spiro
Out of a total of 835 households in Spiro, 499 (59.8%) are family households, while 336 (40.2%) are nonfamily households. The most numerous type of family households are 2-person households, comprising 226, and the most common type of nonfamily households are 1-person households, comprising 283.
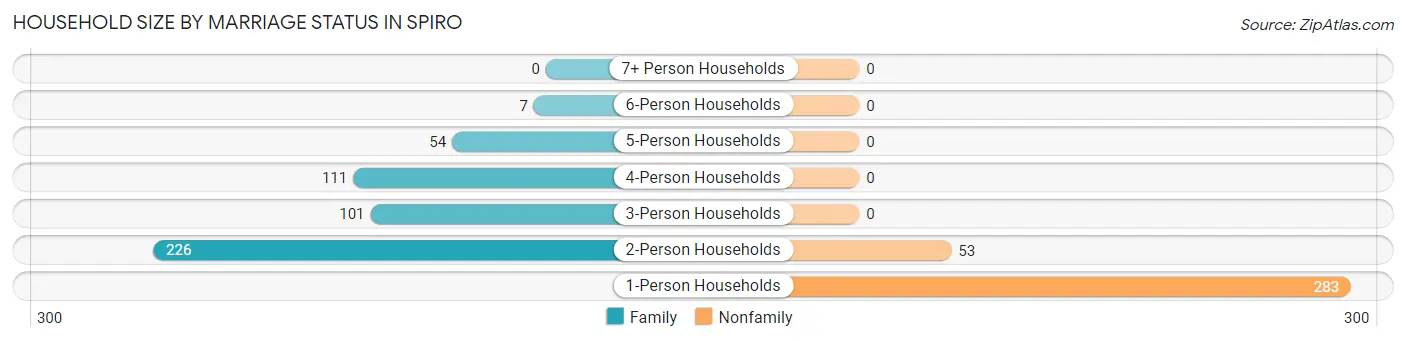
| Household Size | Family Households | Nonfamily Households |
| 1-Person Households | - | 283 (33.9%) |
| 2-Person Households | 226 (27.1%) | 53 (6.4%) |
| 3-Person Households | 101 (12.1%) | 0 (0.0%) |
| 4-Person Households | 111 (13.3%) | 0 (0.0%) |
| 5-Person Households | 54 (6.5%) | 0 (0.0%) |
| 6-Person Households | 7 (0.8%) | 0 (0.0%) |
| 7+ Person Households | 0 (0.0%) | 0 (0.0%) |
| Total | 499 (59.8%) | 336 (40.2%) |
Female Fertility in Spiro
Fertility by Age in Spiro
Average fertility rate in Spiro is 8.0 births per 1,000 women. Women in the age bracket of 20 to 34 years have the highest fertility rate with 23.0 births per 1,000 women. Women in the age bracket of 20 to 34 years acount for 100.0% of all women with births.
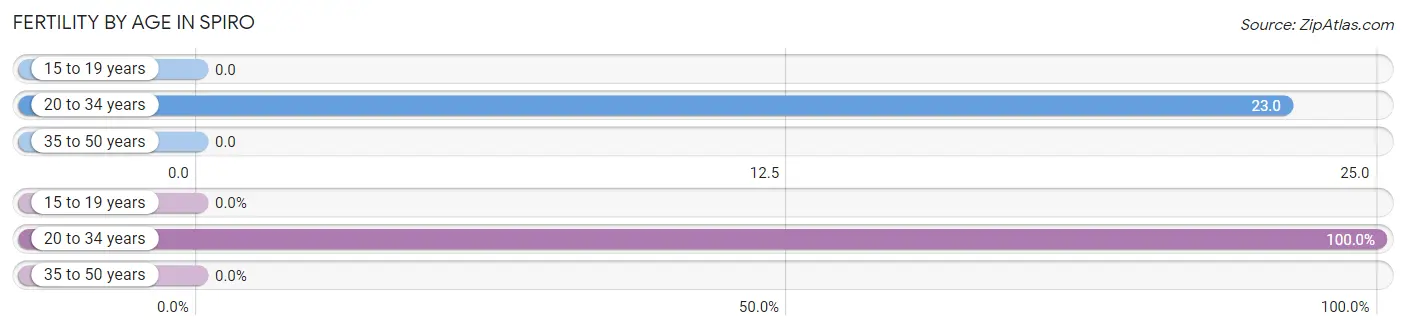
| Age Bracket | Women with Births | Births / 1,000 Women |
| 15 to 19 years | 0 (0.0%) | 0.0 |
| 20 to 34 years | 4 (100.0%) | 23.0 |
| 35 to 50 years | 0 (0.0%) | 0.0 |
| Total | 4 (100.0%) | 8.0 |
Fertility by Age by Marriage Status in Spiro
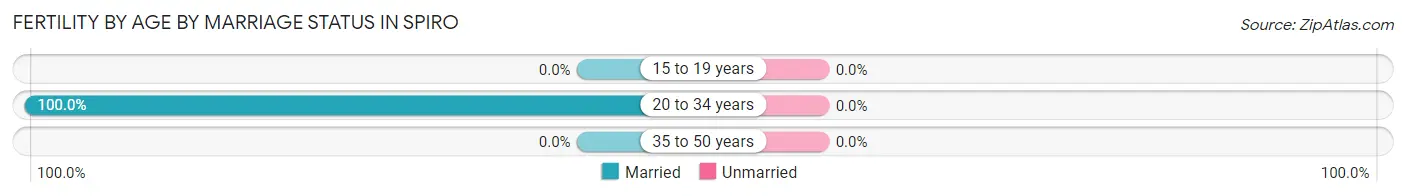
| Age Bracket | Married | Unmarried |
| 15 to 19 years | 0 (0.0%) | 0 (0.0%) |
| 20 to 34 years | 4 (100.0%) | 0 (0.0%) |
| 35 to 50 years | 0 (0.0%) | 0 (0.0%) |
| Total | 4 (100.0%) | 0 (0.0%) |
Fertility by Education in Spiro
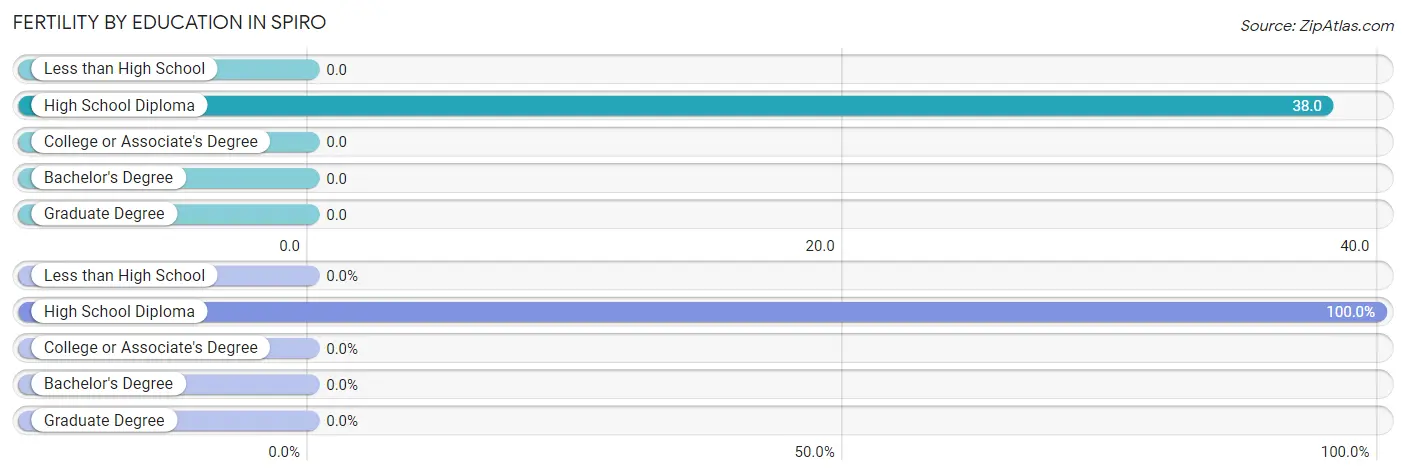
| Educational Attainment | Women with Births | Births / 1,000 Women |
| Less than High School | 0 (0.0%) | 0.0 |
| High School Diploma | 4 (100.0%) | 38.0 |
| College or Associate's Degree | 0 (0.0%) | 0.0 |
| Bachelor's Degree | 0 (0.0%) | 0.0 |
| Graduate Degree | 0 (0.0%) | 0.0 |
| Total | 4 (100.0%) | 8.0 |
Fertility by Education by Marriage Status in Spiro
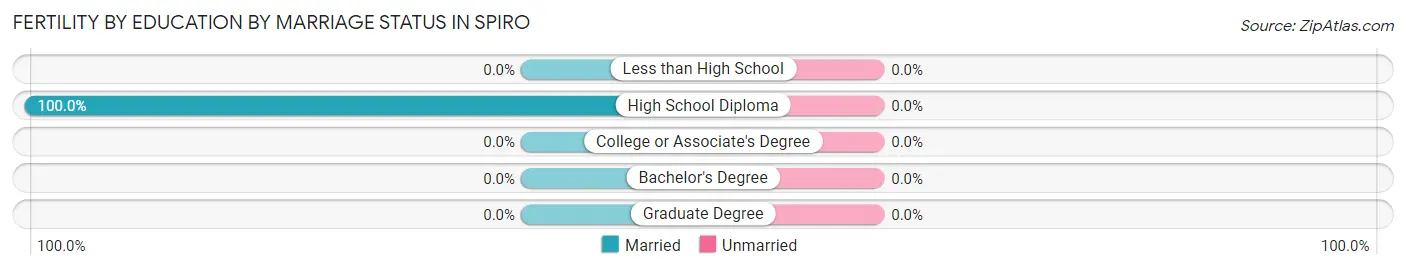
| Educational Attainment | Married | Unmarried |
| Less than High School | 0 (0.0%) | 0 (0.0%) |
| High School Diploma | 4 (100.0%) | 0 (0.0%) |
| College or Associate's Degree | 0 (0.0%) | 0 (0.0%) |
| Bachelor's Degree | 0 (0.0%) | 0 (0.0%) |
| Graduate Degree | 0 (0.0%) | 0 (0.0%) |
| Total | 4 (100.0%) | 0 (0.0%) |
Employment Characteristics in Spiro
Employment by Class of Employer in Spiro
Among the 705 employed individuals in Spiro, private company employees (459 | 65.1%), not-for-profit organizations (67 | 9.5%), and local government employees (53 | 7.5%) make up the most common classes of employment.
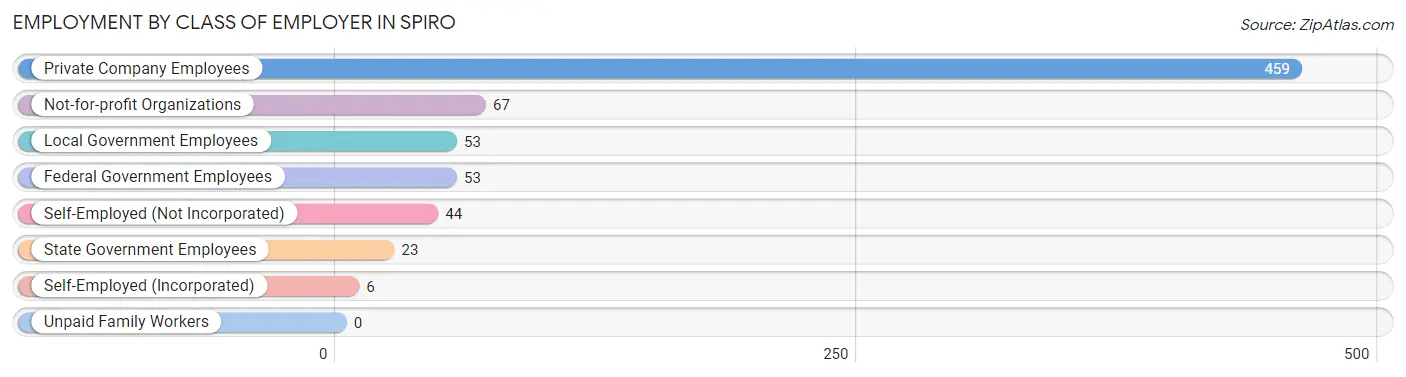
| Employer Class | # Employees | % Employees |
| Private Company Employees | 459 | 65.1% |
| Self-Employed (Incorporated) | 6 | 0.9% |
| Self-Employed (Not Incorporated) | 44 | 6.2% |
| Not-for-profit Organizations | 67 | 9.5% |
| Local Government Employees | 53 | 7.5% |
| State Government Employees | 23 | 3.3% |
| Federal Government Employees | 53 | 7.5% |
| Unpaid Family Workers | 0 | 0.0% |
| Total | 705 | 100.0% |
Employment Status by Age in Spiro
According to the labor force statistics for Spiro, out of the total population over 16 years of age (1,632), 49.0% or 800 individuals are in the labor force, with 10.4% or 83 of them unemployed. The age group with the highest labor force participation rate is 30 to 34 years, with 83.1% or 69 individuals in the labor force. Within the labor force, the 16 to 19 years age range has the highest percentage of unemployed individuals, with 43.8% or 7 of them being unemployed.
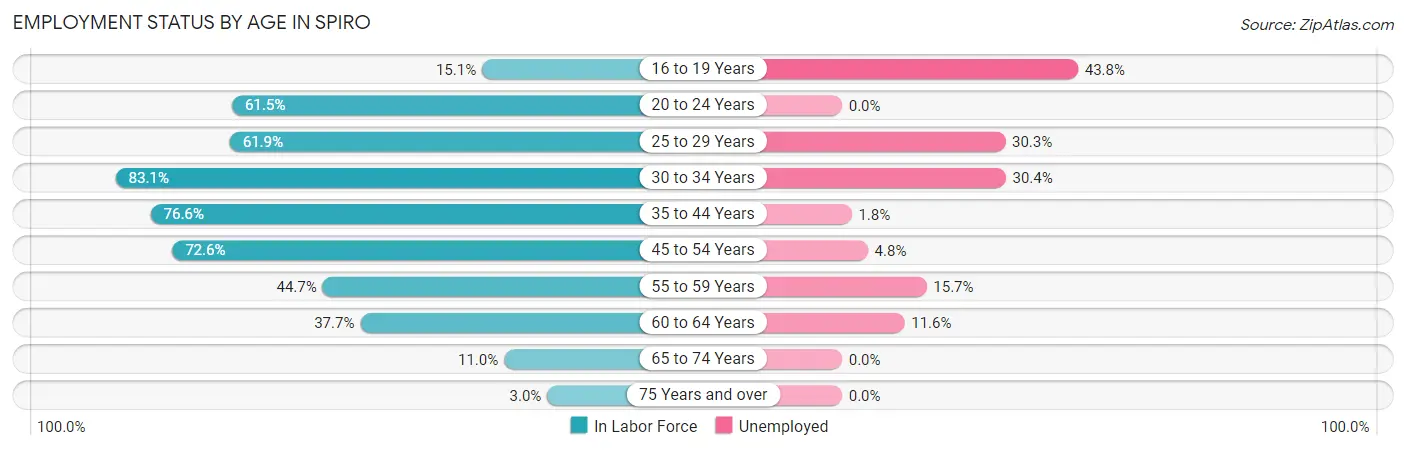
| Age Bracket | In Labor Force | Unemployed |
| 16 to 19 Years | 16 (15.1%) | 7 (43.8%) |
| 20 to 24 Years | 99 (61.5%) | 0 (0.0%) |
| 25 to 29 Years | 99 (61.9%) | 30 (30.3%) |
| 30 to 34 Years | 69 (83.1%) | 21 (30.4%) |
| 35 to 44 Years | 226 (76.6%) | 4 (1.8%) |
| 45 to 54 Years | 167 (72.6%) | 8 (4.8%) |
| 55 to 59 Years | 51 (44.7%) | 8 (15.7%) |
| 60 to 64 Years | 43 (37.7%) | 5 (11.6%) |
| 65 to 74 Years | 26 (11.0%) | 0 (0.0%) |
| 75 Years and over | 4 (3.0%) | 0 (0.0%) |
| Total | 800 (49.0%) | 83 (10.4%) |
Employment Status by Educational Attainment in Spiro
According to labor force statistics for Spiro, 65.8% of individuals (655) out of the total population between 25 and 64 years of age (996) are in the labor force, with 11.7% or 77 of them being unemployed. The group with the highest labor force participation rate are those with the educational attainment of bachelor's degree or higher, with 83.3% or 105 individuals in the labor force. Within the labor force, individuals with less than high school education have the highest percentage of unemployment, with 18.0% or 16 of them being unemployed.
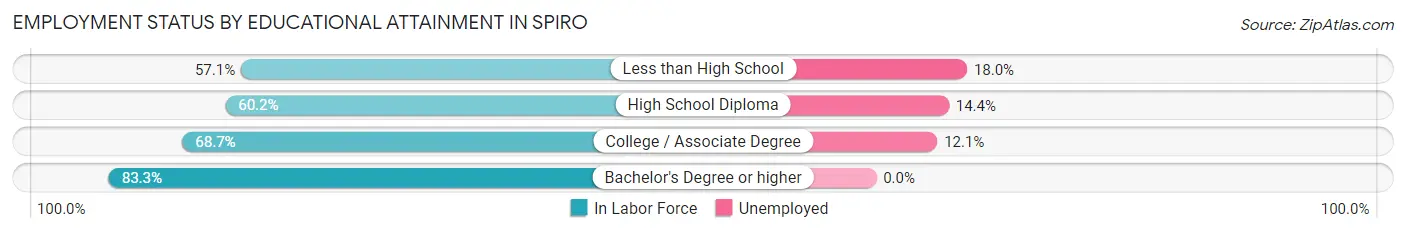
| Educational Attainment | In Labor Force | Unemployed |
| Less than High School | 89 (57.1%) | 28 (18.0%) |
| High School Diploma | 209 (60.2%) | 50 (14.4%) |
| College / Associate Degree | 252 (68.7%) | 44 (12.1%) |
| Bachelor's Degree or higher | 105 (83.3%) | 0 (0.0%) |
| Total | 655 (65.8%) | 117 (11.7%) |
Employment Occupations by Sex in Spiro
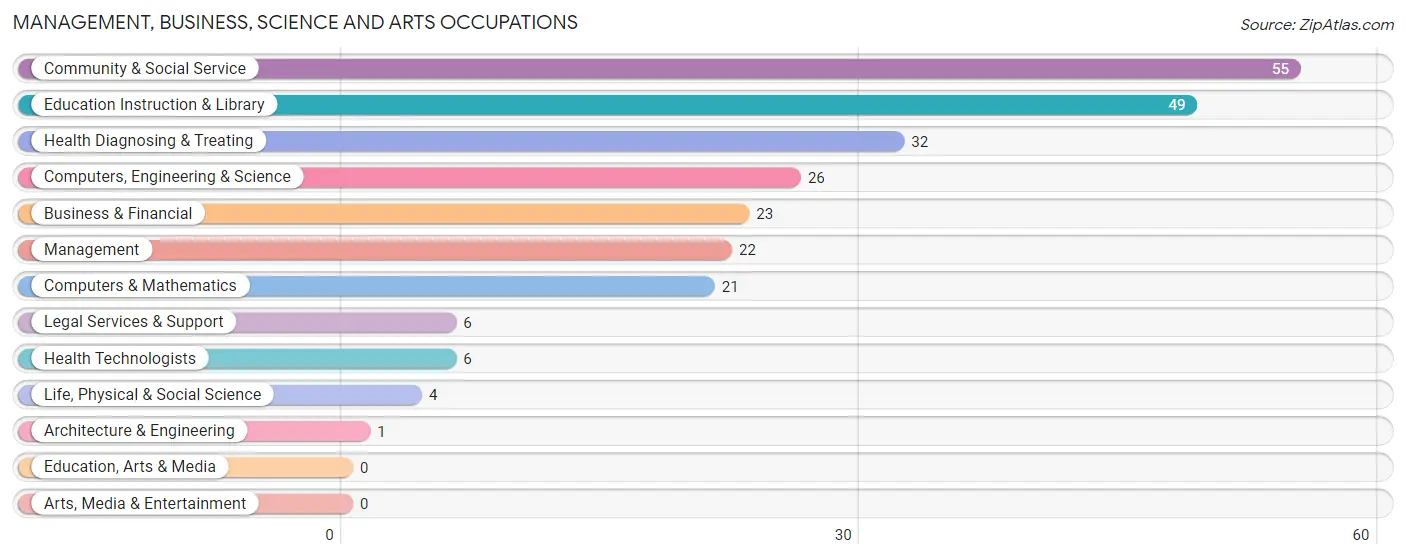
Management, Business, Science and Arts Occupations
The most common Management, Business, Science and Arts occupations in Spiro are Community & Social Service (55 | 7.7%), Education Instruction & Library (49 | 6.9%), Health Diagnosing & Treating (32 | 4.5%), Computers, Engineering & Science (26 | 3.6%), and Business & Financial (23 | 3.2%).
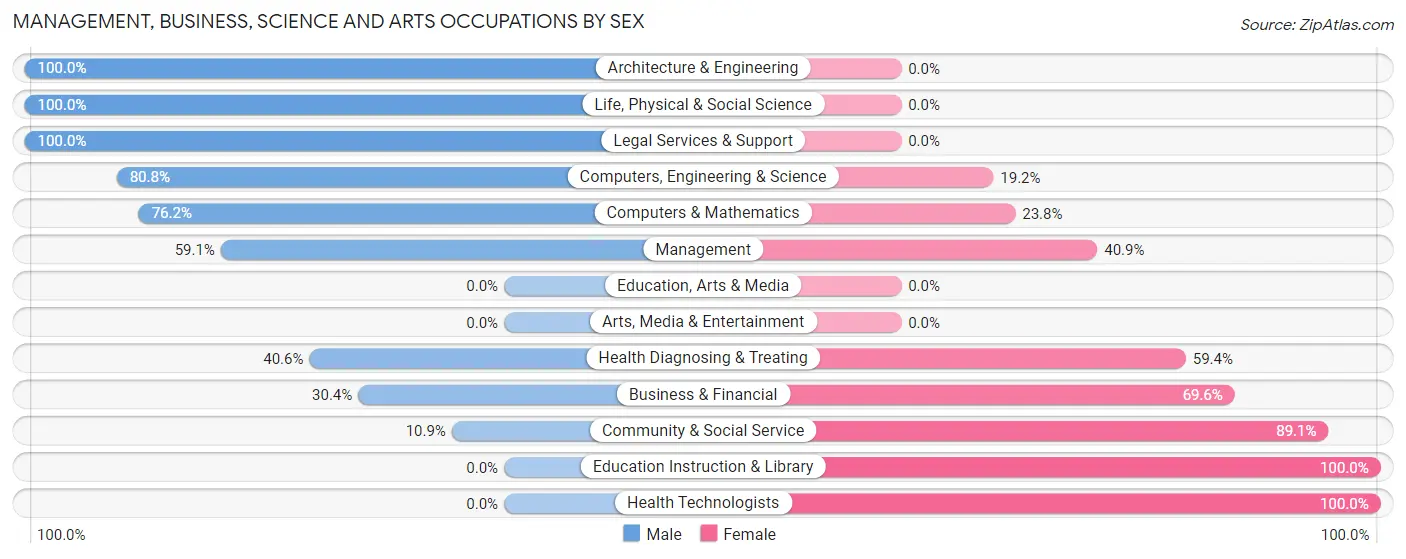
Management, Business, Science and Arts Occupations by Sex
Within the Management, Business, Science and Arts occupations in Spiro, the most male-oriented occupations are Architecture & Engineering (100.0%), Life, Physical & Social Science (100.0%), and Legal Services & Support (100.0%), while the most female-oriented occupations are Education Instruction & Library (100.0%), Health Technologists (100.0%), and Community & Social Service (89.1%).
| Occupation | Male | Female |
| Management | 13 (59.1%) | 9 (40.9%) |
| Business & Financial | 7 (30.4%) | 16 (69.6%) |
| Computers, Engineering & Science | 21 (80.8%) | 5 (19.2%) |
| Computers & Mathematics | 16 (76.2%) | 5 (23.8%) |
| Architecture & Engineering | 1 (100.0%) | 0 (0.0%) |
| Life, Physical & Social Science | 4 (100.0%) | 0 (0.0%) |
| Community & Social Service | 6 (10.9%) | 49 (89.1%) |
| Education, Arts & Media | 0 (0.0%) | 0 (0.0%) |
| Legal Services & Support | 6 (100.0%) | 0 (0.0%) |
| Education Instruction & Library | 0 (0.0%) | 49 (100.0%) |
| Arts, Media & Entertainment | 0 (0.0%) | 0 (0.0%) |
| Health Diagnosing & Treating | 13 (40.6%) | 19 (59.4%) |
| Health Technologists | 0 (0.0%) | 6 (100.0%) |
| Total (Category) | 60 (38.0%) | 98 (62.0%) |
| Total (Overall) | 379 (53.2%) | 333 (46.8%) |
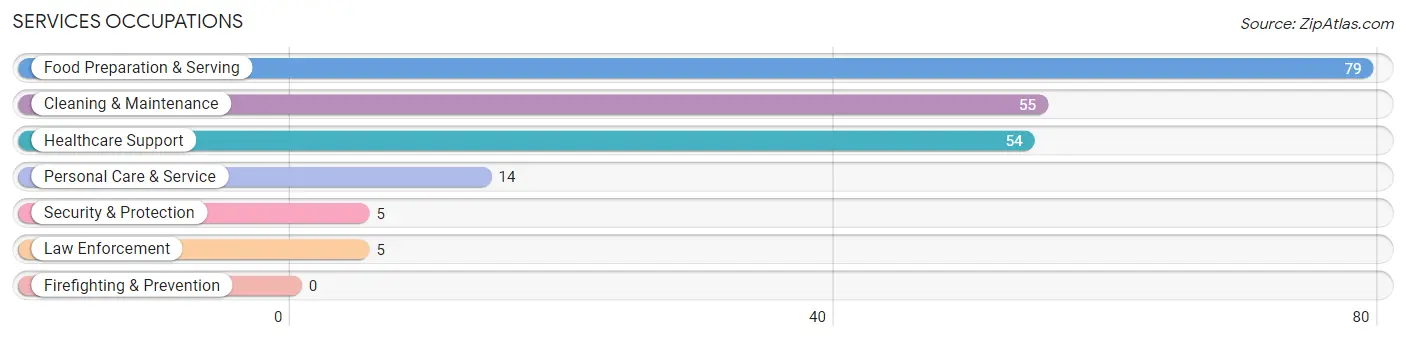
Services Occupations
The most common Services occupations in Spiro are Food Preparation & Serving (79 | 11.1%), Cleaning & Maintenance (55 | 7.7%), Healthcare Support (54 | 7.6%), Personal Care & Service (14 | 2.0%), and Security & Protection (5 | 0.7%).
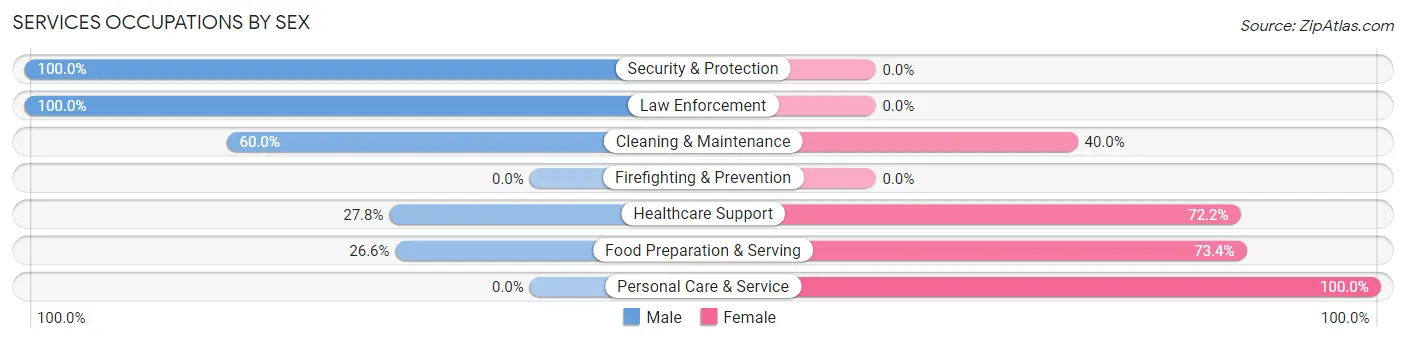
Services Occupations by Sex
Within the Services occupations in Spiro, the most male-oriented occupations are Security & Protection (100.0%), Law Enforcement (100.0%), and Cleaning & Maintenance (60.0%), while the most female-oriented occupations are Personal Care & Service (100.0%), Food Preparation & Serving (73.4%), and Healthcare Support (72.2%).
| Occupation | Male | Female |
| Healthcare Support | 15 (27.8%) | 39 (72.2%) |
| Security & Protection | 5 (100.0%) | 0 (0.0%) |
| Firefighting & Prevention | 0 (0.0%) | 0 (0.0%) |
| Law Enforcement | 5 (100.0%) | 0 (0.0%) |
| Food Preparation & Serving | 21 (26.6%) | 58 (73.4%) |
| Cleaning & Maintenance | 33 (60.0%) | 22 (40.0%) |
| Personal Care & Service | 0 (0.0%) | 14 (100.0%) |
| Total (Category) | 74 (35.7%) | 133 (64.2%) |
| Total (Overall) | 379 (53.2%) | 333 (46.8%) |
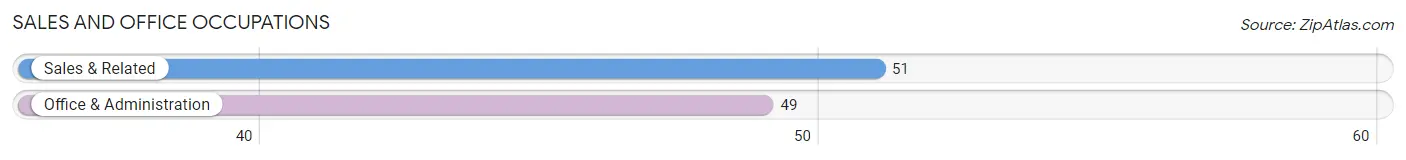
Sales and Office Occupations
The most common Sales and Office occupations in Spiro are Sales & Related (51 | 7.2%), and Office & Administration (49 | 6.9%).
Sales and Office Occupations by Sex
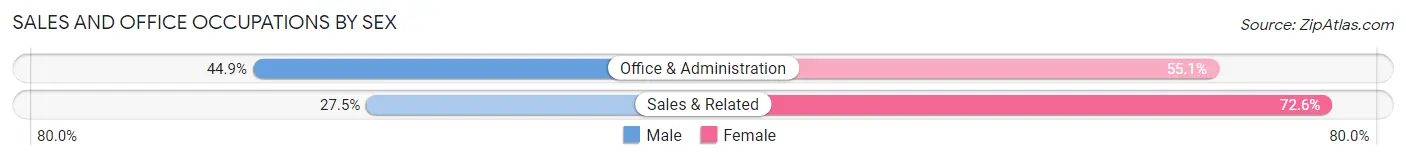
| Occupation | Male | Female |
| Sales & Related | 14 (27.5%) | 37 (72.6%) |
| Office & Administration | 22 (44.9%) | 27 (55.1%) |
| Total (Category) | 36 (36.0%) | 64 (64.0%) |
| Total (Overall) | 379 (53.2%) | 333 (46.8%) |
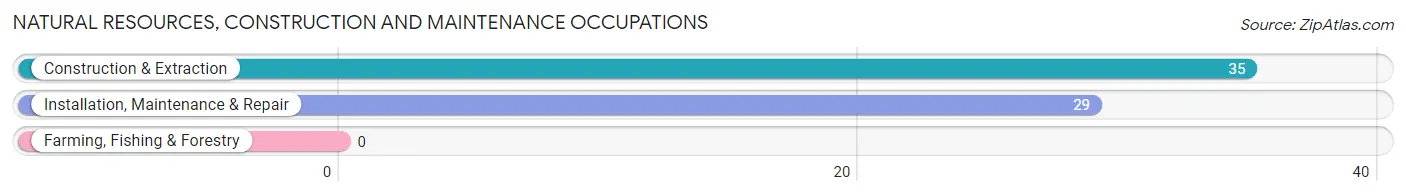
Natural Resources, Construction and Maintenance Occupations
The most common Natural Resources, Construction and Maintenance occupations in Spiro are Construction & Extraction (35 | 4.9%), and Installation, Maintenance & Repair (29 | 4.1%).
Natural Resources, Construction and Maintenance Occupations by Sex
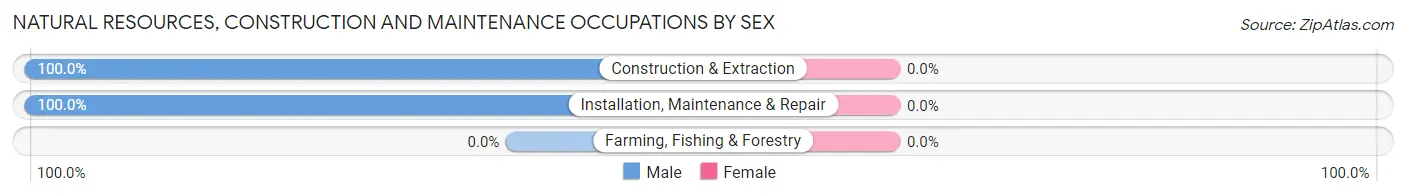
| Occupation | Male | Female |
| Farming, Fishing & Forestry | 0 (0.0%) | 0 (0.0%) |
| Construction & Extraction | 35 (100.0%) | 0 (0.0%) |
| Installation, Maintenance & Repair | 29 (100.0%) | 0 (0.0%) |
| Total (Category) | 64 (100.0%) | 0 (0.0%) |
| Total (Overall) | 379 (53.2%) | 333 (46.8%) |
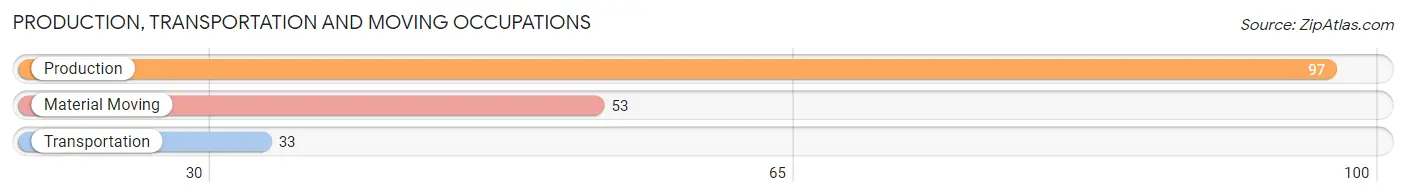
Production, Transportation and Moving Occupations
The most common Production, Transportation and Moving occupations in Spiro are Production (97 | 13.6%), Material Moving (53 | 7.4%), and Transportation (33 | 4.6%).
Production, Transportation and Moving Occupations by Sex
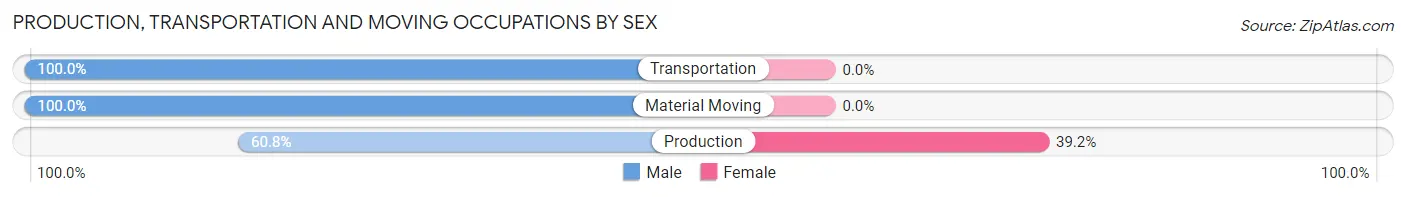
| Occupation | Male | Female |
| Production | 59 (60.8%) | 38 (39.2%) |
| Transportation | 33 (100.0%) | 0 (0.0%) |
| Material Moving | 53 (100.0%) | 0 (0.0%) |
| Total (Category) | 145 (79.2%) | 38 (20.8%) |
| Total (Overall) | 379 (53.2%) | 333 (46.8%) |
Employment Industries by Sex in Spiro
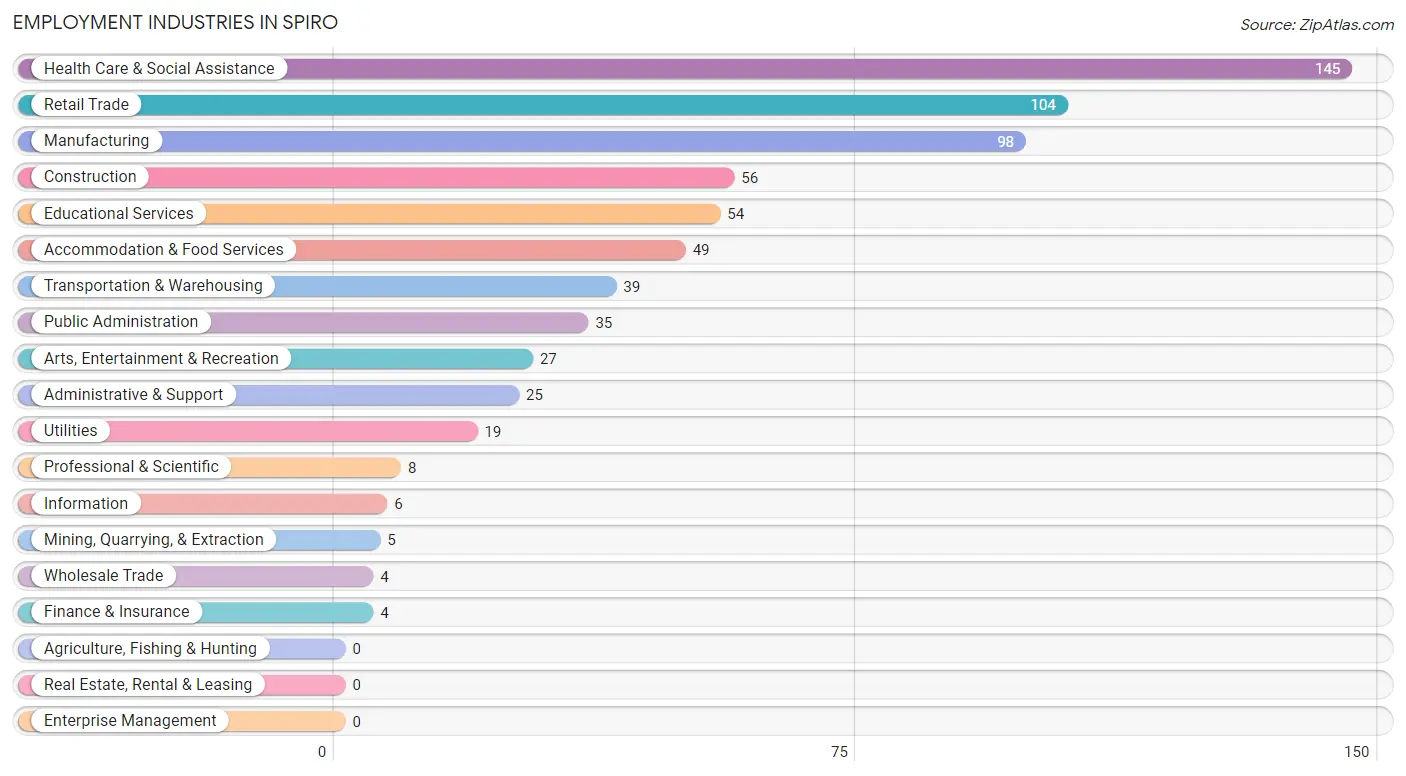
Employment Industries in Spiro
The major employment industries in Spiro include Health Care & Social Assistance (145 | 20.4%), Retail Trade (104 | 14.6%), Manufacturing (98 | 13.8%), Construction (56 | 7.9%), and Educational Services (54 | 7.6%).
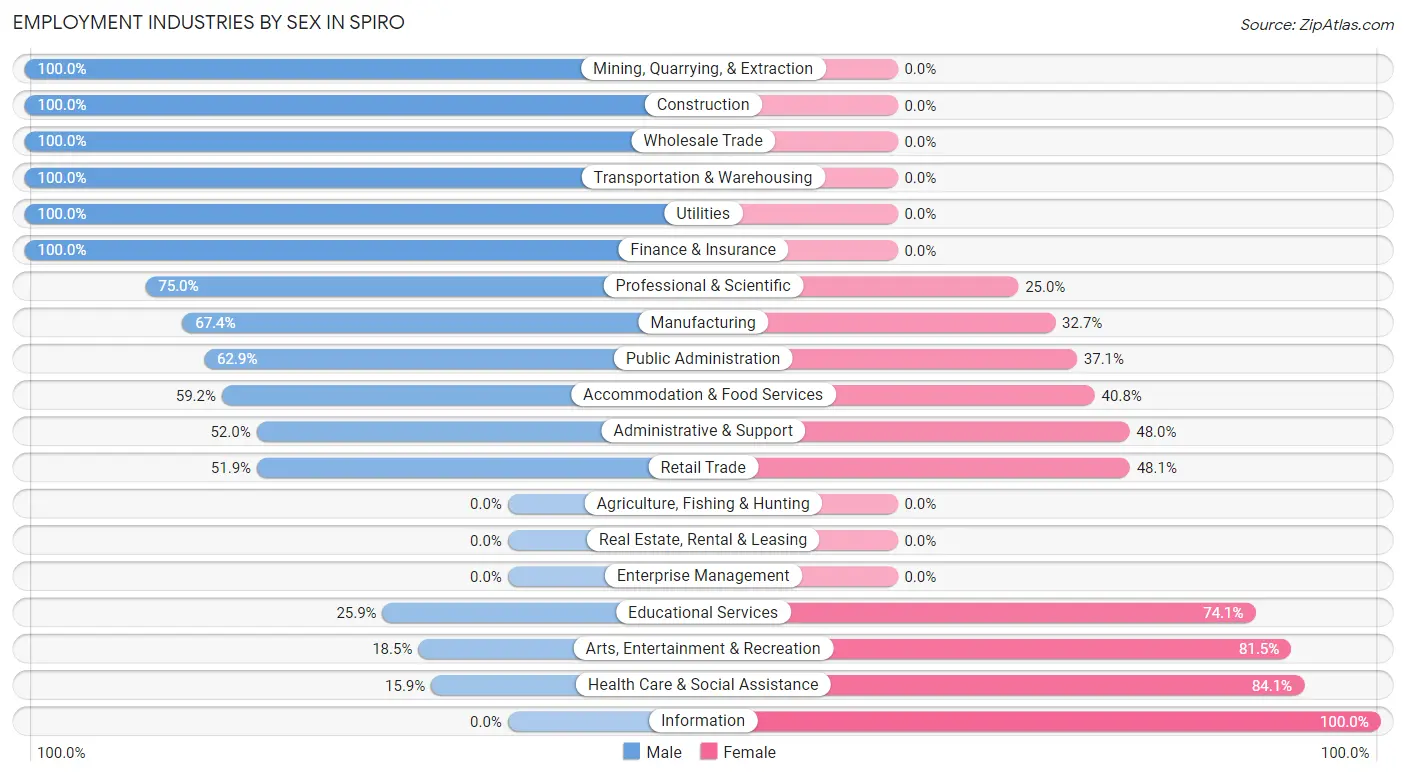
Employment Industries by Sex in Spiro
The Spiro industries that see more men than women are Mining, Quarrying, & Extraction (100.0%), Construction (100.0%), and Wholesale Trade (100.0%), whereas the industries that tend to have a higher number of women are Information (100.0%), Health Care & Social Assistance (84.1%), and Arts, Entertainment & Recreation (81.5%).
| Industry | Male | Female |
| Agriculture, Fishing & Hunting | 0 (0.0%) | 0 (0.0%) |
| Mining, Quarrying, & Extraction | 5 (100.0%) | 0 (0.0%) |
| Construction | 56 (100.0%) | 0 (0.0%) |
| Manufacturing | 66 (67.3%) | 32 (32.7%) |
| Wholesale Trade | 4 (100.0%) | 0 (0.0%) |
| Retail Trade | 54 (51.9%) | 50 (48.1%) |
| Transportation & Warehousing | 39 (100.0%) | 0 (0.0%) |
| Utilities | 19 (100.0%) | 0 (0.0%) |
| Information | 0 (0.0%) | 6 (100.0%) |
| Finance & Insurance | 4 (100.0%) | 0 (0.0%) |
| Real Estate, Rental & Leasing | 0 (0.0%) | 0 (0.0%) |
| Professional & Scientific | 6 (75.0%) | 2 (25.0%) |
| Enterprise Management | 0 (0.0%) | 0 (0.0%) |
| Administrative & Support | 13 (52.0%) | 12 (48.0%) |
| Educational Services | 14 (25.9%) | 40 (74.1%) |
| Health Care & Social Assistance | 23 (15.9%) | 122 (84.1%) |
| Arts, Entertainment & Recreation | 5 (18.5%) | 22 (81.5%) |
| Accommodation & Food Services | 29 (59.2%) | 20 (40.8%) |
| Public Administration | 22 (62.9%) | 13 (37.1%) |
| Total | 379 (53.2%) | 333 (46.8%) |
Education in Spiro
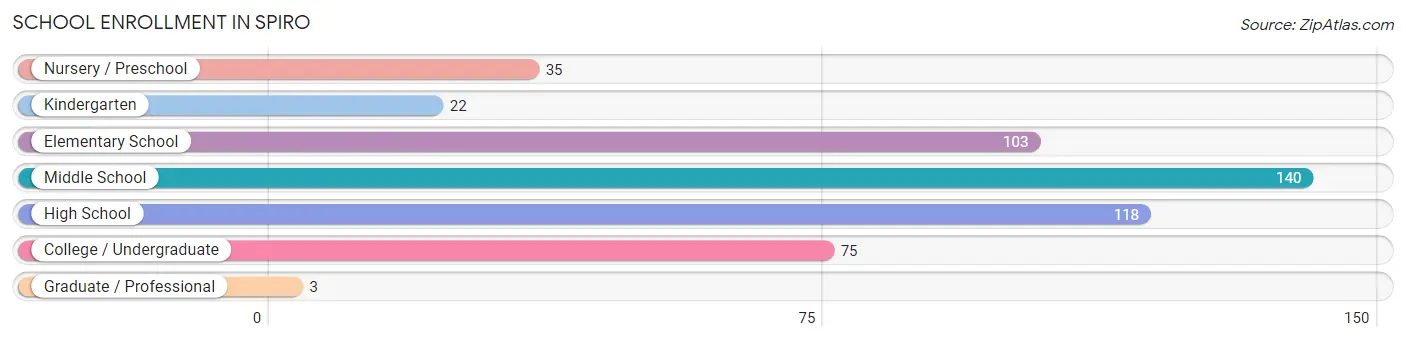
School Enrollment in Spiro
The most common levels of schooling among the 496 students in Spiro are middle school (140 | 28.2%), high school (118 | 23.8%), and elementary school (103 | 20.8%).
| School Level | # Students | % Students |
| Nursery / Preschool | 35 | 7.1% |
| Kindergarten | 22 | 4.4% |
| Elementary School | 103 | 20.8% |
| Middle School | 140 | 28.2% |
| High School | 118 | 23.8% |
| College / Undergraduate | 75 | 15.1% |
| Graduate / Professional | 3 | 0.6% |
| Total | 496 | 100.0% |
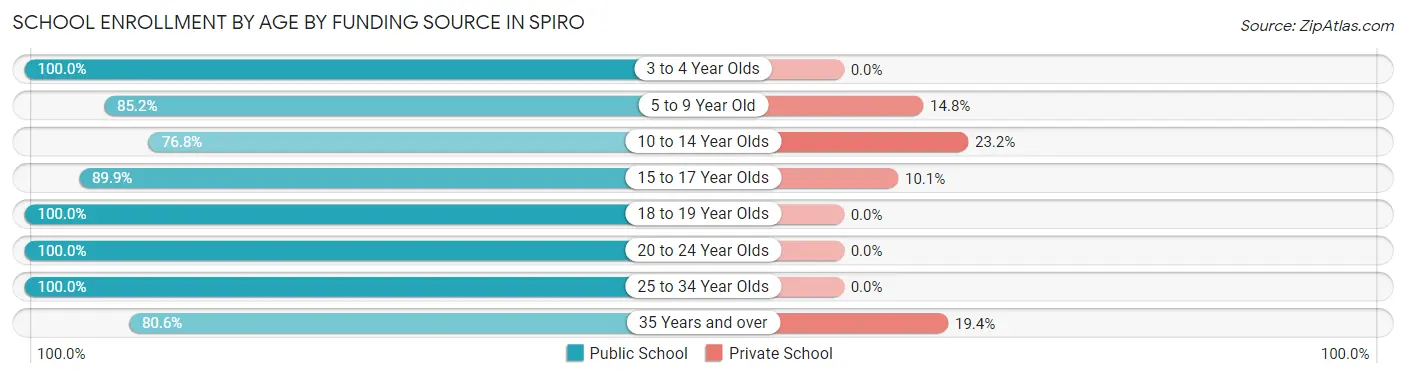
School Enrollment by Age by Funding Source in Spiro
Out of a total of 496 students who are enrolled in schools in Spiro, 72 (14.5%) attend a private institution, while the remaining 424 (85.5%) are enrolled in public schools. The age group of 10 to 14 year olds has the highest likelihood of being enrolled in private schools, with 41 (23.2% in the age bracket) enrolled. Conversely, the age group of 3 to 4 year olds has the lowest likelihood of being enrolled in a private school, with 23 (100.0% in the age bracket) attending a public institution.
| Age Bracket | Public School | Private School |
| 3 to 4 Year Olds | 23 (100.0%) | 0 (0.0%) |
| 5 to 9 Year Old | 92 (85.2%) | 16 (14.8%) |
| 10 to 14 Year Olds | 136 (76.8%) | 41 (23.2%) |
| 15 to 17 Year Olds | 71 (89.9%) | 8 (10.1%) |
| 18 to 19 Year Olds | 35 (100.0%) | 0 (0.0%) |
| 20 to 24 Year Olds | 25 (100.0%) | 0 (0.0%) |
| 25 to 34 Year Olds | 13 (100.0%) | 0 (0.0%) |
| 35 Years and over | 29 (80.6%) | 7 (19.4%) |
| Total | 424 (85.5%) | 72 (14.5%) |
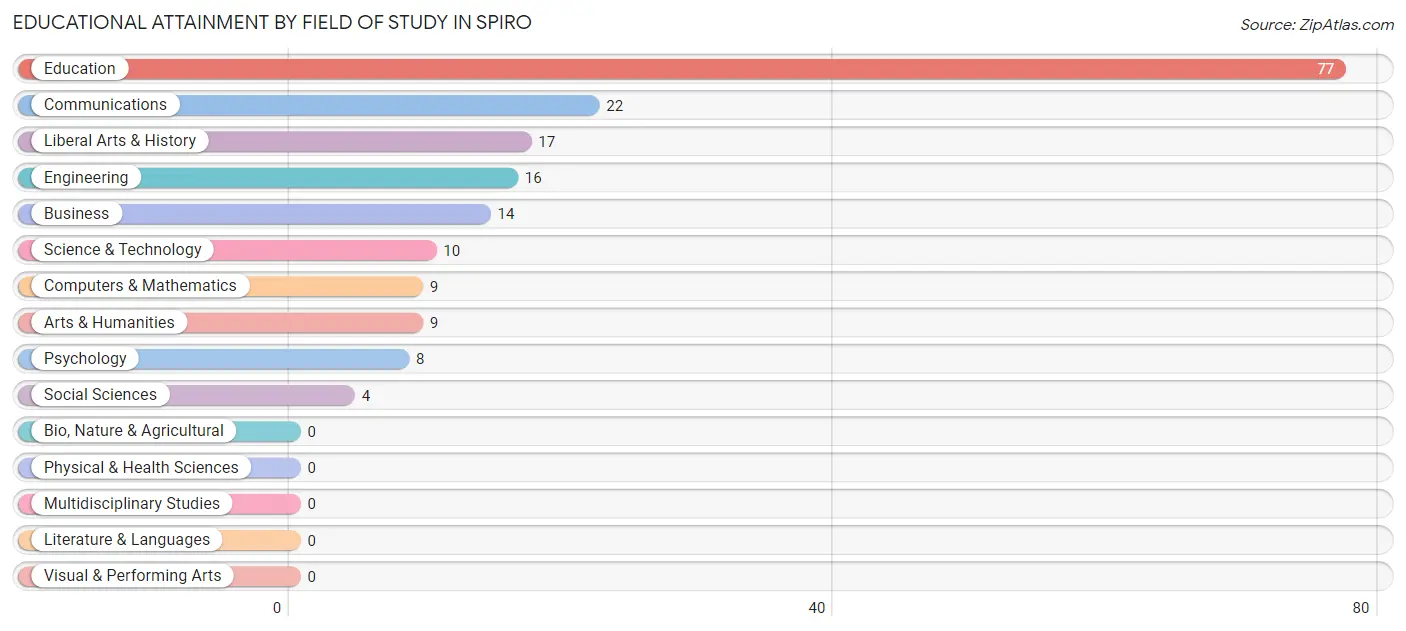
Educational Attainment by Field of Study in Spiro
Education (77 | 41.4%), communications (22 | 11.8%), liberal arts & history (17 | 9.1%), engineering (16 | 8.6%), and business (14 | 7.5%) are the most common fields of study among 186 individuals in Spiro who have obtained a bachelor's degree or higher.
| Field of Study | # Graduates | % Graduates |
| Computers & Mathematics | 9 | 4.8% |
| Bio, Nature & Agricultural | 0 | 0.0% |
| Physical & Health Sciences | 0 | 0.0% |
| Psychology | 8 | 4.3% |
| Social Sciences | 4 | 2.1% |
| Engineering | 16 | 8.6% |
| Multidisciplinary Studies | 0 | 0.0% |
| Science & Technology | 10 | 5.4% |
| Business | 14 | 7.5% |
| Education | 77 | 41.4% |
| Literature & Languages | 0 | 0.0% |
| Liberal Arts & History | 17 | 9.1% |
| Visual & Performing Arts | 0 | 0.0% |
| Communications | 22 | 11.8% |
| Arts & Humanities | 9 | 4.8% |
| Total | 186 | 100.0% |
Transportation & Commute in Spiro
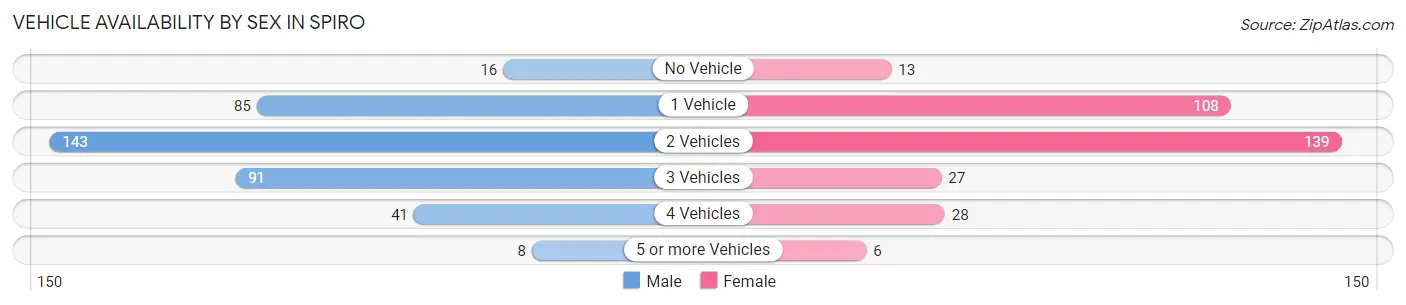
Vehicle Availability by Sex in Spiro
The most prevalent vehicle ownership categories in Spiro are males with 2 vehicles (143, accounting for 37.2%) and females with 2 vehicles (139, making up 44.6%).
| Vehicles Available | Male | Female |
| No Vehicle | 16 (4.2%) | 13 (4.1%) |
| 1 Vehicle | 85 (22.1%) | 108 (33.6%) |
| 2 Vehicles | 143 (37.2%) | 139 (43.3%) |
| 3 Vehicles | 91 (23.7%) | 27 (8.4%) |
| 4 Vehicles | 41 (10.7%) | 28 (8.7%) |
| 5 or more Vehicles | 8 (2.1%) | 6 (1.9%) |
| Total | 384 (100.0%) | 321 (100.0%) |
Commute Time in Spiro
The most frequently occuring commute durations in Spiro are 20 to 24 minutes (158 commuters, 22.9%), 30 to 34 minutes (110 commuters, 15.9%), and 5 to 9 minutes (98 commuters, 14.2%).
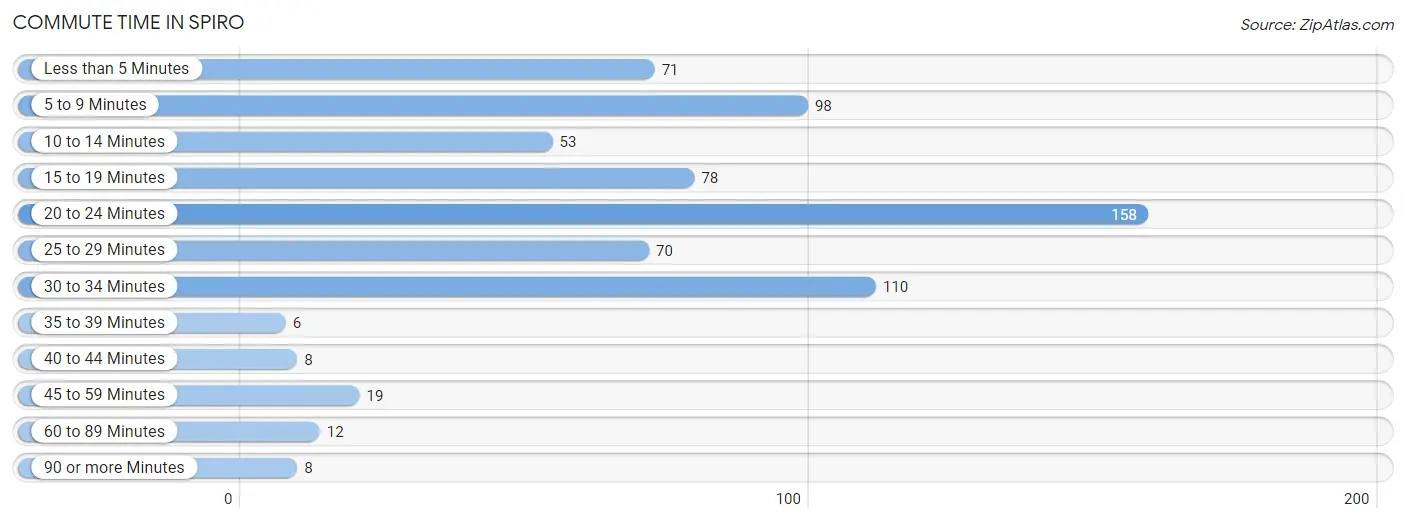
| Commute Time | # Commuters | % Commuters |
| Less than 5 Minutes | 71 | 10.3% |
| 5 to 9 Minutes | 98 | 14.2% |
| 10 to 14 Minutes | 53 | 7.7% |
| 15 to 19 Minutes | 78 | 11.3% |
| 20 to 24 Minutes | 158 | 22.9% |
| 25 to 29 Minutes | 70 | 10.1% |
| 30 to 34 Minutes | 110 | 15.9% |
| 35 to 39 Minutes | 6 | 0.9% |
| 40 to 44 Minutes | 8 | 1.2% |
| 45 to 59 Minutes | 19 | 2.8% |
| 60 to 89 Minutes | 12 | 1.7% |
| 90 or more Minutes | 8 | 1.2% |
Commute Time by Sex in Spiro
The most common commute times in Spiro are 20 to 24 minutes (128 commuters, 33.3%) for males and 5 to 9 minutes (58 commuters, 18.9%) for females.
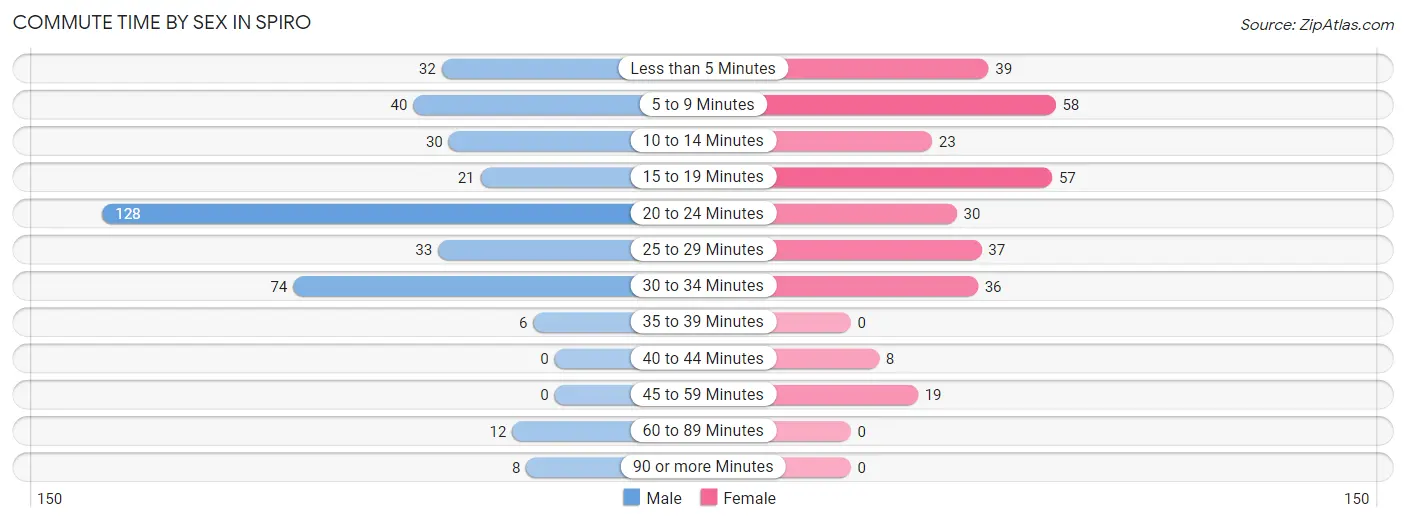
| Commute Time | Male | Female |
| Less than 5 Minutes | 32 (8.3%) | 39 (12.7%) |
| 5 to 9 Minutes | 40 (10.4%) | 58 (18.9%) |
| 10 to 14 Minutes | 30 (7.8%) | 23 (7.5%) |
| 15 to 19 Minutes | 21 (5.5%) | 57 (18.6%) |
| 20 to 24 Minutes | 128 (33.3%) | 30 (9.8%) |
| 25 to 29 Minutes | 33 (8.6%) | 37 (12.0%) |
| 30 to 34 Minutes | 74 (19.3%) | 36 (11.7%) |
| 35 to 39 Minutes | 6 (1.6%) | 0 (0.0%) |
| 40 to 44 Minutes | 0 (0.0%) | 8 (2.6%) |
| 45 to 59 Minutes | 0 (0.0%) | 19 (6.2%) |
| 60 to 89 Minutes | 12 (3.1%) | 0 (0.0%) |
| 90 or more Minutes | 8 (2.1%) | 0 (0.0%) |
Time of Departure to Work by Sex in Spiro
The most frequent times of departure to work in Spiro are 7:00 AM to 7:29 AM (77, 20.1%) for males and 7:00 AM to 7:29 AM (64, 20.8%) for females.
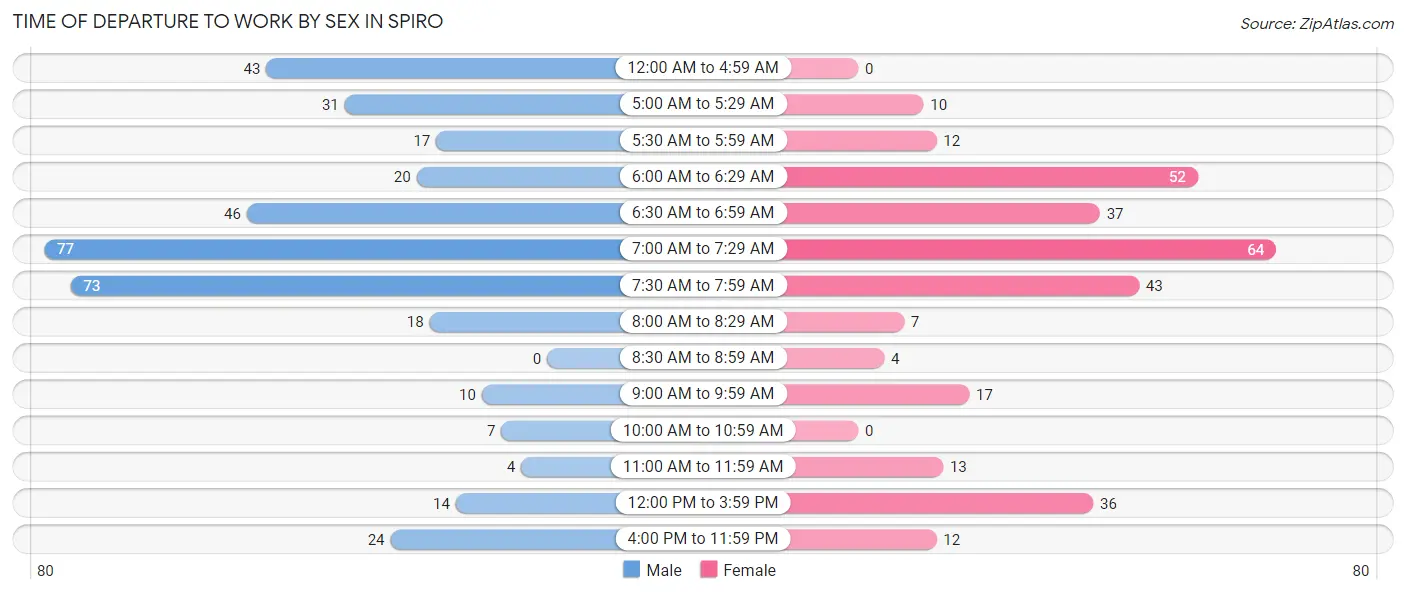
| Time of Departure | Male | Female |
| 12:00 AM to 4:59 AM | 43 (11.2%) | 0 (0.0%) |
| 5:00 AM to 5:29 AM | 31 (8.1%) | 10 (3.3%) |
| 5:30 AM to 5:59 AM | 17 (4.4%) | 12 (3.9%) |
| 6:00 AM to 6:29 AM | 20 (5.2%) | 52 (16.9%) |
| 6:30 AM to 6:59 AM | 46 (12.0%) | 37 (12.0%) |
| 7:00 AM to 7:29 AM | 77 (20.1%) | 64 (20.8%) |
| 7:30 AM to 7:59 AM | 73 (19.0%) | 43 (14.0%) |
| 8:00 AM to 8:29 AM | 18 (4.7%) | 7 (2.3%) |
| 8:30 AM to 8:59 AM | 0 (0.0%) | 4 (1.3%) |
| 9:00 AM to 9:59 AM | 10 (2.6%) | 17 (5.5%) |
| 10:00 AM to 10:59 AM | 7 (1.8%) | 0 (0.0%) |
| 11:00 AM to 11:59 AM | 4 (1.0%) | 13 (4.2%) |
| 12:00 PM to 3:59 PM | 14 (3.6%) | 36 (11.7%) |
| 4:00 PM to 11:59 PM | 24 (6.2%) | 12 (3.9%) |
| Total | 384 (100.0%) | 307 (100.0%) |
Housing Occupancy in Spiro
Occupancy by Ownership in Spiro
Of the total 835 dwellings in Spiro, owner-occupied units account for 433 (51.9%), while renter-occupied units make up 402 (48.1%).
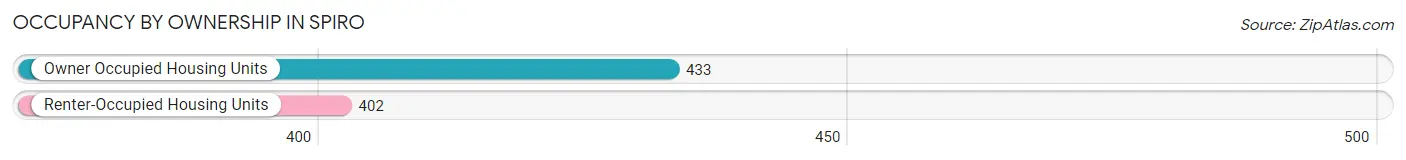
| Occupancy | # Housing Units | % Housing Units |
| Owner Occupied Housing Units | 433 | 51.9% |
| Renter-Occupied Housing Units | 402 | 48.1% |
| Total Occupied Housing Units | 835 | 100.0% |
Occupancy by Household Size in Spiro
| Household Size | # Housing Units | % Housing Units |
| 1-Person Household | 283 | 33.9% |
| 2-Person Household | 279 | 33.4% |
| 3-Person Household | 101 | 12.1% |
| 4+ Person Household | 172 | 20.6% |
| Total Housing Units | 835 | 100.0% |
Occupancy by Ownership by Household Size in Spiro
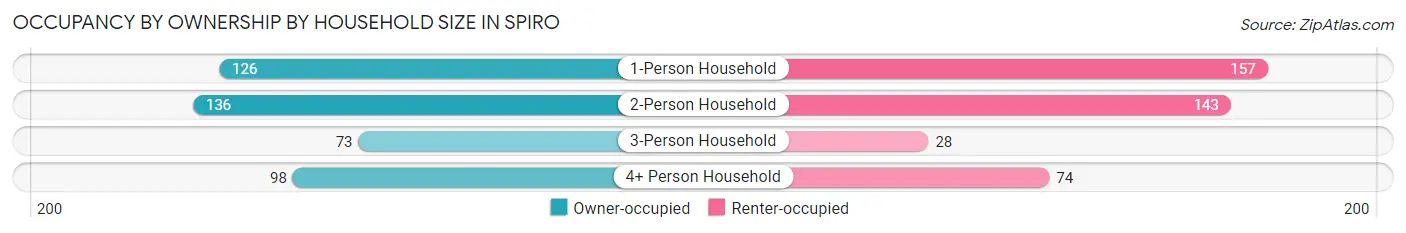
| Household Size | Owner-occupied | Renter-occupied |
| 1-Person Household | 126 (44.5%) | 157 (55.5%) |
| 2-Person Household | 136 (48.7%) | 143 (51.2%) |
| 3-Person Household | 73 (72.3%) | 28 (27.7%) |
| 4+ Person Household | 98 (57.0%) | 74 (43.0%) |
| Total Housing Units | 433 (51.9%) | 402 (48.1%) |
Occupancy by Educational Attainment in Spiro
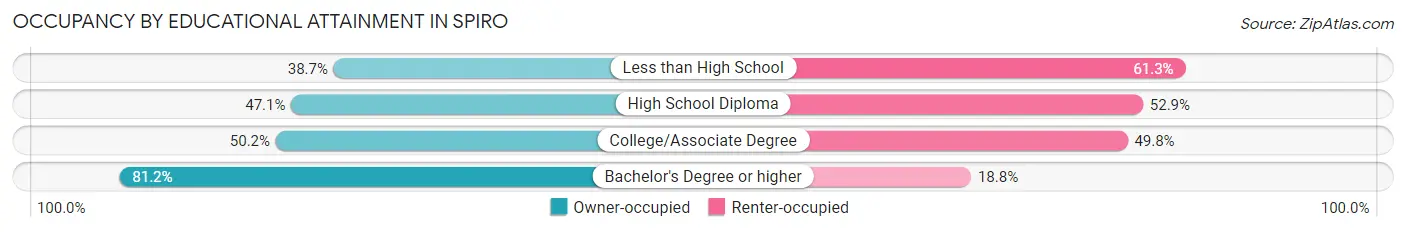
| Household Size | Owner-occupied | Renter-occupied |
| Less than High School | 65 (38.7%) | 103 (61.3%) |
| High School Diploma | 123 (47.1%) | 138 (52.9%) |
| College/Associate Degree | 137 (50.2%) | 136 (49.8%) |
| Bachelor's Degree or higher | 108 (81.2%) | 25 (18.8%) |
Occupancy by Age of Householder in Spiro
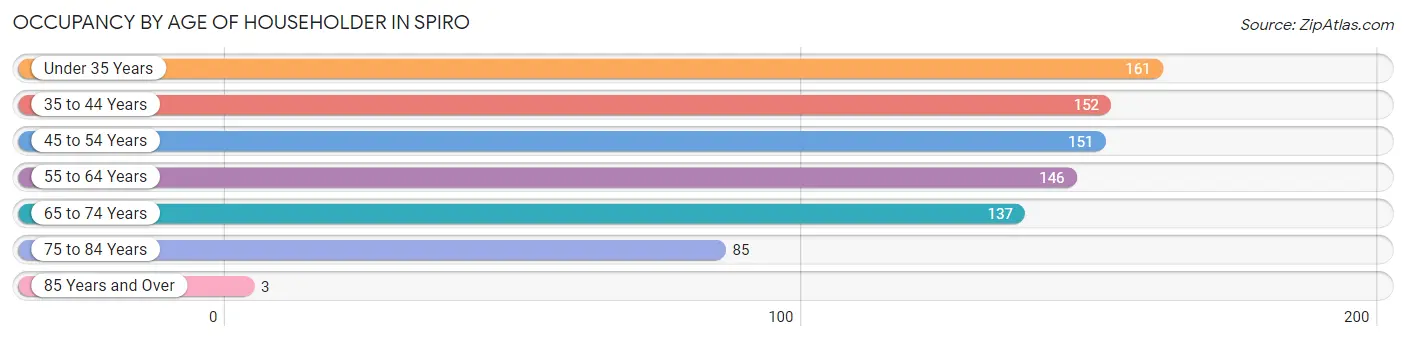
| Age Bracket | # Households | % Households |
| Under 35 Years | 161 | 19.3% |
| 35 to 44 Years | 152 | 18.2% |
| 45 to 54 Years | 151 | 18.1% |
| 55 to 64 Years | 146 | 17.5% |
| 65 to 74 Years | 137 | 16.4% |
| 75 to 84 Years | 85 | 10.2% |
| 85 Years and Over | 3 | 0.4% |
| Total | 835 | 100.0% |
Housing Finances in Spiro
Median Income by Occupancy in Spiro
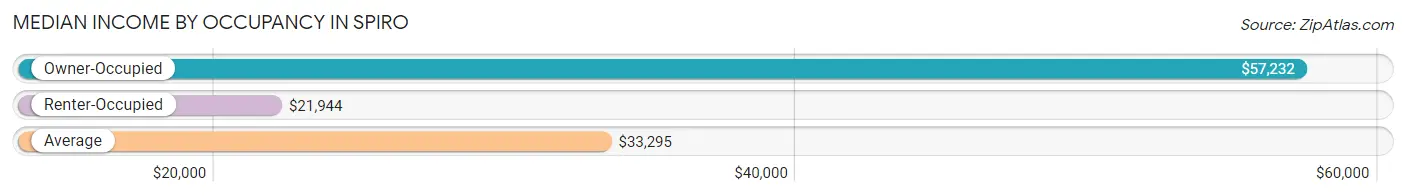
| Occupancy Type | # Households | Median Income |
| Owner-Occupied | 433 (51.9%) | $57,232 |
| Renter-Occupied | 402 (48.1%) | $21,944 |
| Average | 835 (100.0%) | $33,295 |
Occupancy by Householder Income Bracket in Spiro
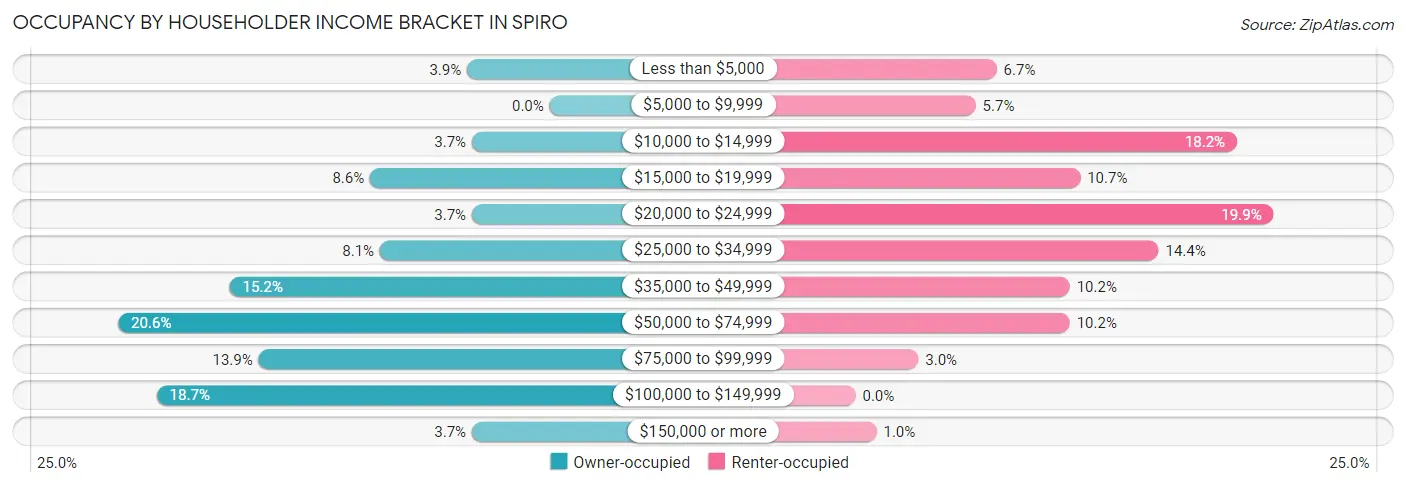
| Income Bracket | Owner-occupied | Renter-occupied |
| Less than $5,000 | 17 (3.9%) | 27 (6.7%) |
| $5,000 to $9,999 | 0 (0.0%) | 23 (5.7%) |
| $10,000 to $14,999 | 16 (3.7%) | 73 (18.2%) |
| $15,000 to $19,999 | 37 (8.6%) | 43 (10.7%) |
| $20,000 to $24,999 | 16 (3.7%) | 80 (19.9%) |
| $25,000 to $34,999 | 35 (8.1%) | 58 (14.4%) |
| $35,000 to $49,999 | 66 (15.2%) | 41 (10.2%) |
| $50,000 to $74,999 | 89 (20.5%) | 41 (10.2%) |
| $75,000 to $99,999 | 60 (13.9%) | 12 (3.0%) |
| $100,000 to $149,999 | 81 (18.7%) | 0 (0.0%) |
| $150,000 or more | 16 (3.7%) | 4 (1.0%) |
| Total | 433 (100.0%) | 402 (100.0%) |
Monthly Housing Cost Tiers in Spiro
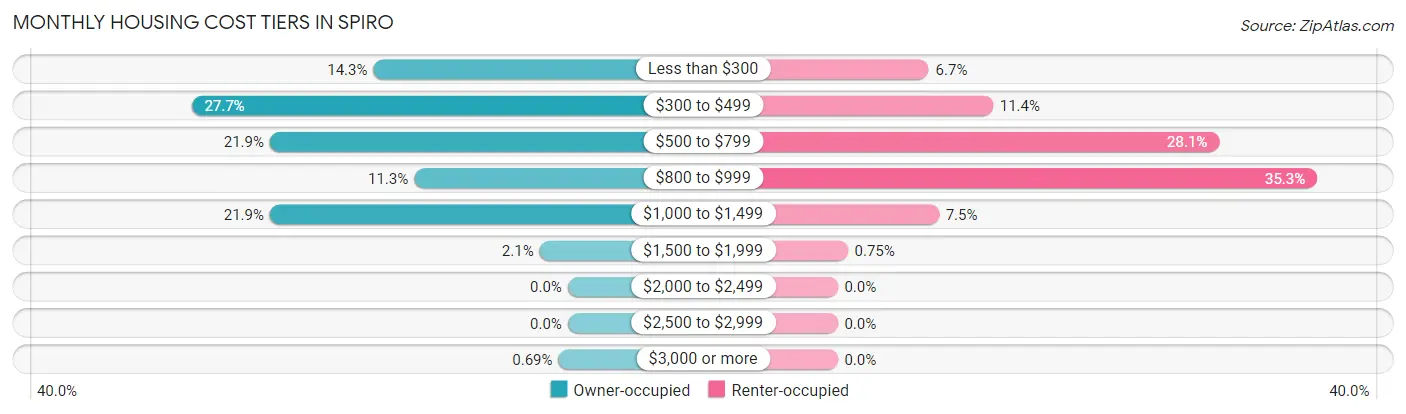
| Monthly Cost | Owner-occupied | Renter-occupied |
| Less than $300 | 62 (14.3%) | 27 (6.7%) |
| $300 to $499 | 120 (27.7%) | 46 (11.4%) |
| $500 to $799 | 95 (21.9%) | 113 (28.1%) |
| $800 to $999 | 49 (11.3%) | 142 (35.3%) |
| $1,000 to $1,499 | 95 (21.9%) | 30 (7.5%) |
| $1,500 to $1,999 | 9 (2.1%) | 3 (0.7%) |
| $2,000 to $2,499 | 0 (0.0%) | 0 (0.0%) |
| $2,500 to $2,999 | 0 (0.0%) | 0 (0.0%) |
| $3,000 or more | 3 (0.7%) | 0 (0.0%) |
| Total | 433 (100.0%) | 402 (100.0%) |
Physical Housing Characteristics in Spiro
Housing Structures in Spiro
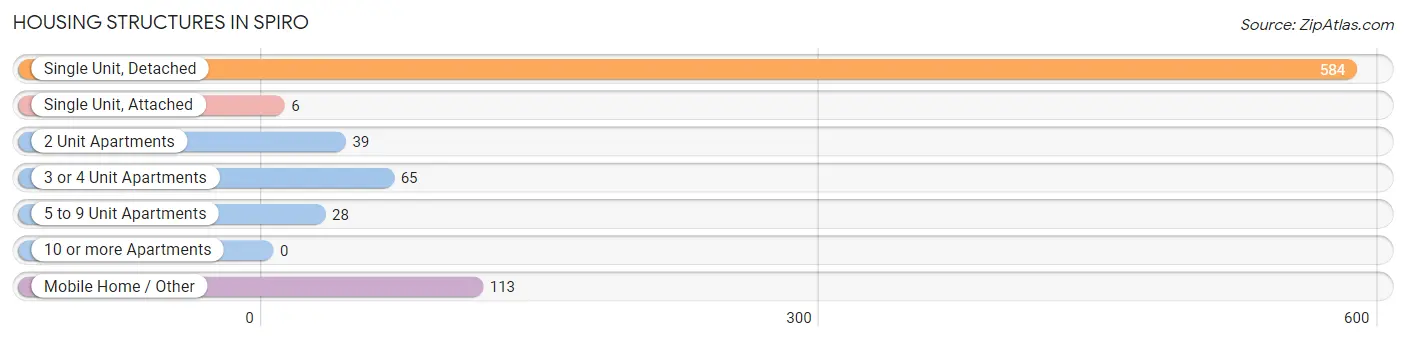
| Structure Type | # Housing Units | % Housing Units |
| Single Unit, Detached | 584 | 69.9% |
| Single Unit, Attached | 6 | 0.7% |
| 2 Unit Apartments | 39 | 4.7% |
| 3 or 4 Unit Apartments | 65 | 7.8% |
| 5 to 9 Unit Apartments | 28 | 3.4% |
| 10 or more Apartments | 0 | 0.0% |
| Mobile Home / Other | 113 | 13.5% |
| Total | 835 | 100.0% |
Housing Structures by Occupancy in Spiro
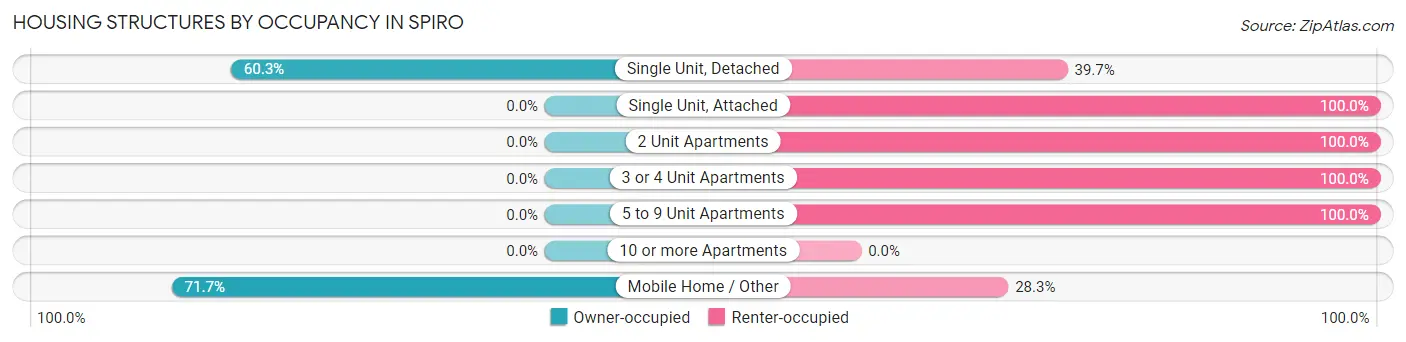
| Structure Type | Owner-occupied | Renter-occupied |
| Single Unit, Detached | 352 (60.3%) | 232 (39.7%) |
| Single Unit, Attached | 0 (0.0%) | 6 (100.0%) |
| 2 Unit Apartments | 0 (0.0%) | 39 (100.0%) |
| 3 or 4 Unit Apartments | 0 (0.0%) | 65 (100.0%) |
| 5 to 9 Unit Apartments | 0 (0.0%) | 28 (100.0%) |
| 10 or more Apartments | 0 (0.0%) | 0 (0.0%) |
| Mobile Home / Other | 81 (71.7%) | 32 (28.3%) |
| Total | 433 (51.9%) | 402 (48.1%) |
Housing Structures by Number of Rooms in Spiro
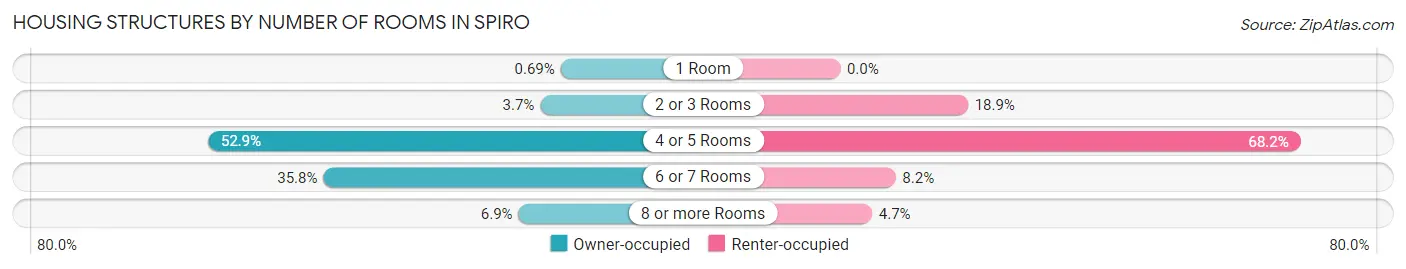
| Number of Rooms | Owner-occupied | Renter-occupied |
| 1 Room | 3 (0.7%) | 0 (0.0%) |
| 2 or 3 Rooms | 16 (3.7%) | 76 (18.9%) |
| 4 or 5 Rooms | 229 (52.9%) | 274 (68.2%) |
| 6 or 7 Rooms | 155 (35.8%) | 33 (8.2%) |
| 8 or more Rooms | 30 (6.9%) | 19 (4.7%) |
| Total | 433 (100.0%) | 402 (100.0%) |
Housing Structure by Heating Type in Spiro
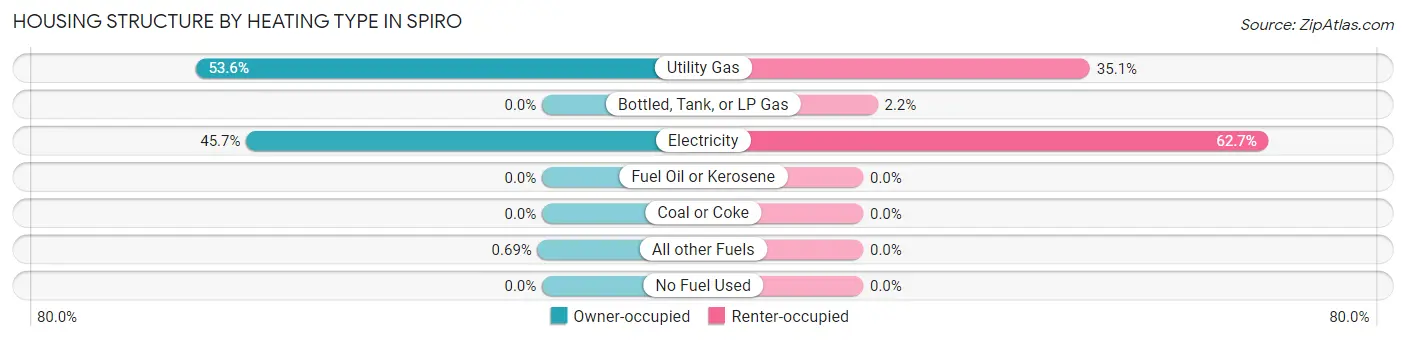
| Heating Type | Owner-occupied | Renter-occupied |
| Utility Gas | 232 (53.6%) | 141 (35.1%) |
| Bottled, Tank, or LP Gas | 0 (0.0%) | 9 (2.2%) |
| Electricity | 198 (45.7%) | 252 (62.7%) |
| Fuel Oil or Kerosene | 0 (0.0%) | 0 (0.0%) |
| Coal or Coke | 0 (0.0%) | 0 (0.0%) |
| All other Fuels | 3 (0.7%) | 0 (0.0%) |
| No Fuel Used | 0 (0.0%) | 0 (0.0%) |
| Total | 433 (100.0%) | 402 (100.0%) |
Household Vehicle Usage in Spiro
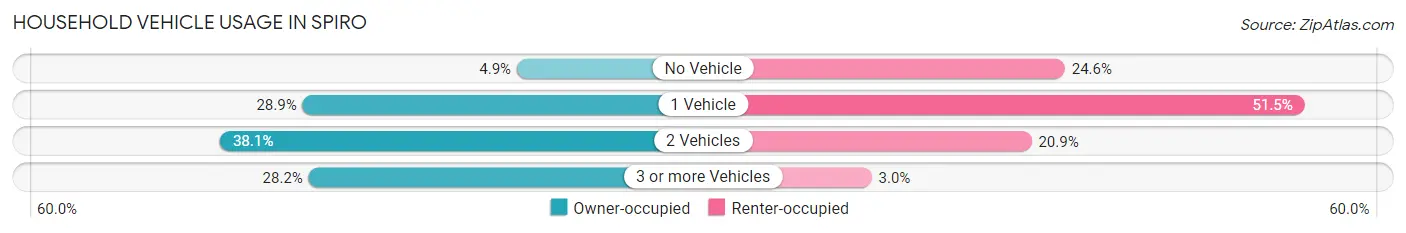
| Vehicles per Household | Owner-occupied | Renter-occupied |
| No Vehicle | 21 (4.9%) | 99 (24.6%) |
| 1 Vehicle | 125 (28.9%) | 207 (51.5%) |
| 2 Vehicles | 165 (38.1%) | 84 (20.9%) |
| 3 or more Vehicles | 122 (28.2%) | 12 (3.0%) |
| Total | 433 (100.0%) | 402 (100.0%) |
Real Estate & Mortgages in Spiro
Real Estate and Mortgage Overview in Spiro
| Characteristic | Without Mortgage | With Mortgage |
| Housing Units | 205 | 228 |
| Median Property Value | $77,100 | $99,200 |
| Median Household Income | $56,964 | $6 |
| Monthly Housing Costs | $366 | $3 |
| Real Estate Taxes | $568 | $29 |
Property Value by Mortgage Status in Spiro
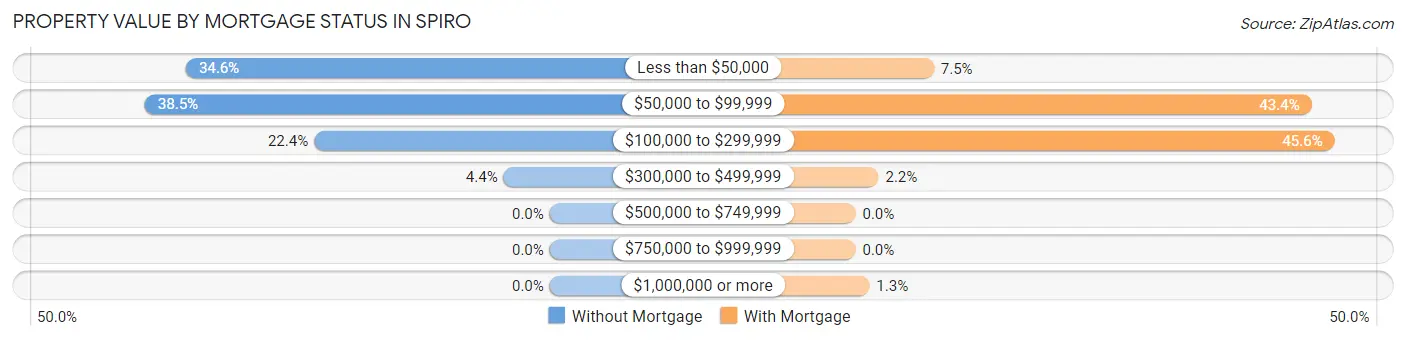
| Property Value | Without Mortgage | With Mortgage |
| Less than $50,000 | 71 (34.6%) | 17 (7.5%) |
| $50,000 to $99,999 | 79 (38.5%) | 99 (43.4%) |
| $100,000 to $299,999 | 46 (22.4%) | 104 (45.6%) |
| $300,000 to $499,999 | 9 (4.4%) | 5 (2.2%) |
| $500,000 to $749,999 | 0 (0.0%) | 0 (0.0%) |
| $750,000 to $999,999 | 0 (0.0%) | 0 (0.0%) |
| $1,000,000 or more | 0 (0.0%) | 3 (1.3%) |
| Total | 205 (100.0%) | 228 (100.0%) |
Household Income by Mortgage Status in Spiro
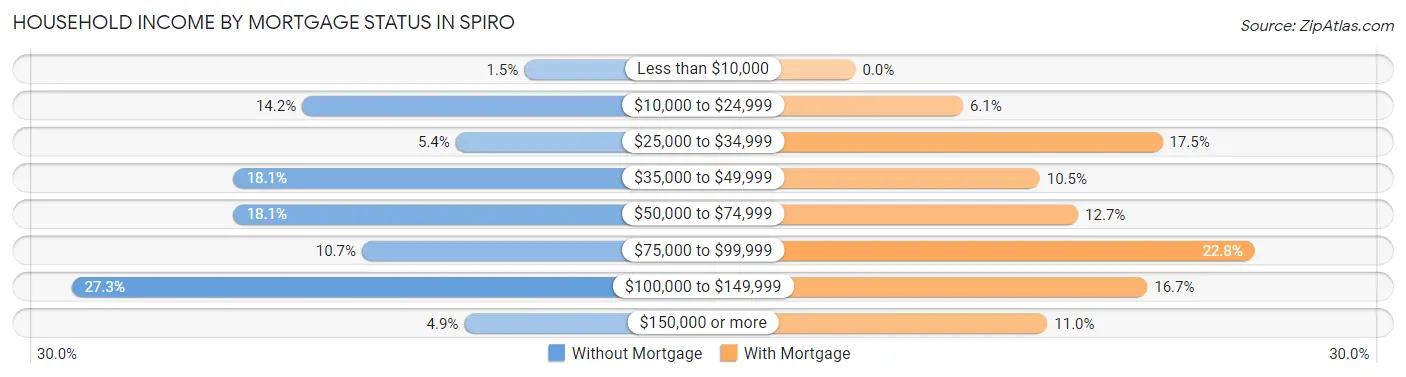
| Household Income | Without Mortgage | With Mortgage |
| Less than $10,000 | 3 (1.5%) | 0 (0.0%) |
| $10,000 to $24,999 | 29 (14.1%) | 14 (6.1%) |
| $25,000 to $34,999 | 11 (5.4%) | 40 (17.5%) |
| $35,000 to $49,999 | 37 (18.0%) | 24 (10.5%) |
| $50,000 to $74,999 | 37 (18.0%) | 29 (12.7%) |
| $75,000 to $99,999 | 22 (10.7%) | 52 (22.8%) |
| $100,000 to $149,999 | 56 (27.3%) | 38 (16.7%) |
| $150,000 or more | 10 (4.9%) | 25 (11.0%) |
| Total | 205 (100.0%) | 228 (100.0%) |
Property Value to Household Income Ratio in Spiro
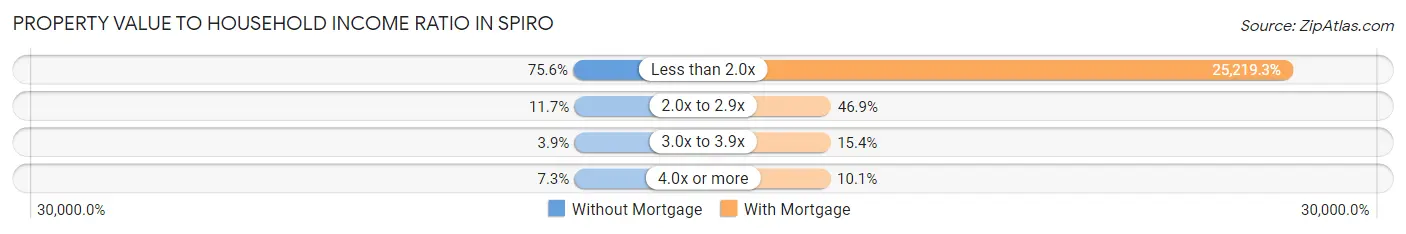
| Value-to-Income Ratio | Without Mortgage | With Mortgage |
| Less than 2.0x | 155 (75.6%) | 57,500 (25,219.3%) |
| 2.0x to 2.9x | 24 (11.7%) | 107 (46.9%) |
| 3.0x to 3.9x | 8 (3.9%) | 35 (15.3%) |
| 4.0x or more | 15 (7.3%) | 23 (10.1%) |
| Total | 205 (100.0%) | 228 (100.0%) |
Real Estate Taxes by Mortgage Status in Spiro
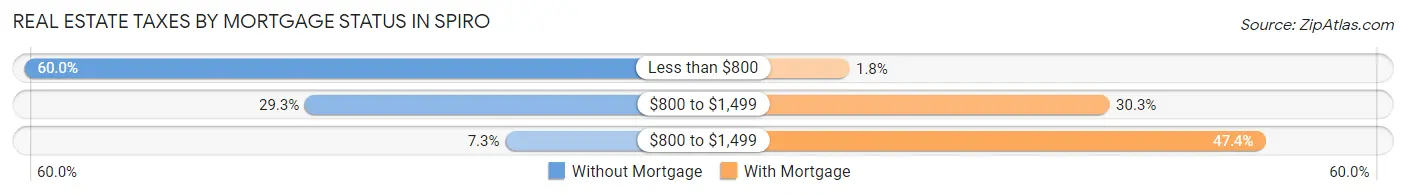
| Property Taxes | Without Mortgage | With Mortgage |
| Less than $800 | 123 (60.0%) | 4 (1.8%) |
| $800 to $1,499 | 60 (29.3%) | 69 (30.3%) |
| $800 to $1,499 | 15 (7.3%) | 108 (47.4%) |
| Total | 205 (100.0%) | 228 (100.0%) |
Health & Disability in Spiro
Health Insurance Coverage by Age in Spiro
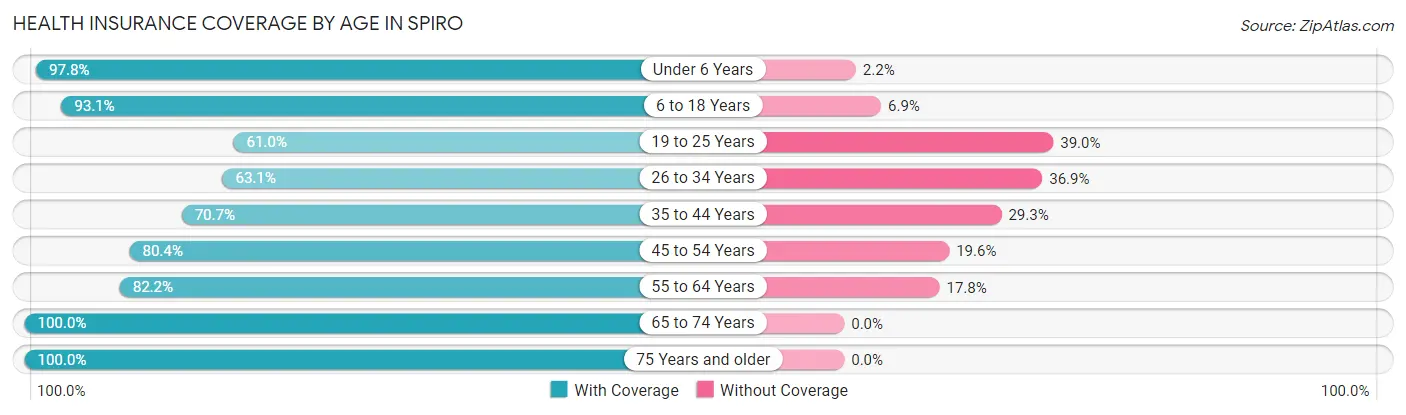
| Age Bracket | With Coverage | Without Coverage |
| Under 6 Years | 181 (97.8%) | 4 (2.2%) |
| 6 to 18 Years | 353 (93.1%) | 26 (6.9%) |
| 19 to 25 Years | 119 (61.0%) | 76 (39.0%) |
| 26 to 34 Years | 135 (63.1%) | 79 (36.9%) |
| 35 to 44 Years | 205 (70.7%) | 85 (29.3%) |
| 45 to 54 Years | 185 (80.4%) | 45 (19.6%) |
| 55 to 64 Years | 176 (82.2%) | 38 (17.8%) |
| 65 to 74 Years | 214 (100.0%) | 0 (0.0%) |
| 75 Years and older | 110 (100.0%) | 0 (0.0%) |
| Total | 1,678 (82.6%) | 353 (17.4%) |
Health Insurance Coverage by Citizenship Status in Spiro
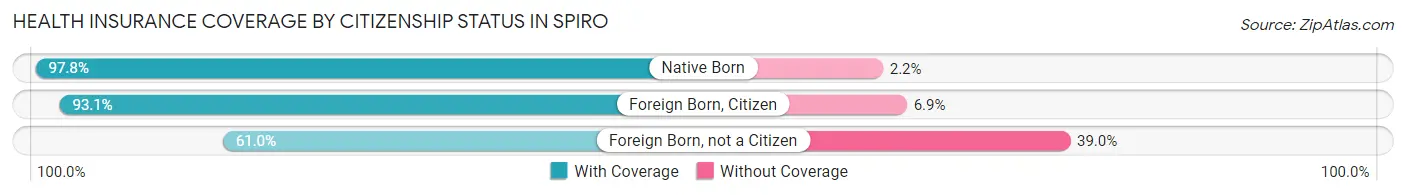
| Citizenship Status | With Coverage | Without Coverage |
| Native Born | 181 (97.8%) | 4 (2.2%) |
| Foreign Born, Citizen | 353 (93.1%) | 26 (6.9%) |
| Foreign Born, not a Citizen | 119 (61.0%) | 76 (39.0%) |
Health Insurance Coverage by Household Income in Spiro
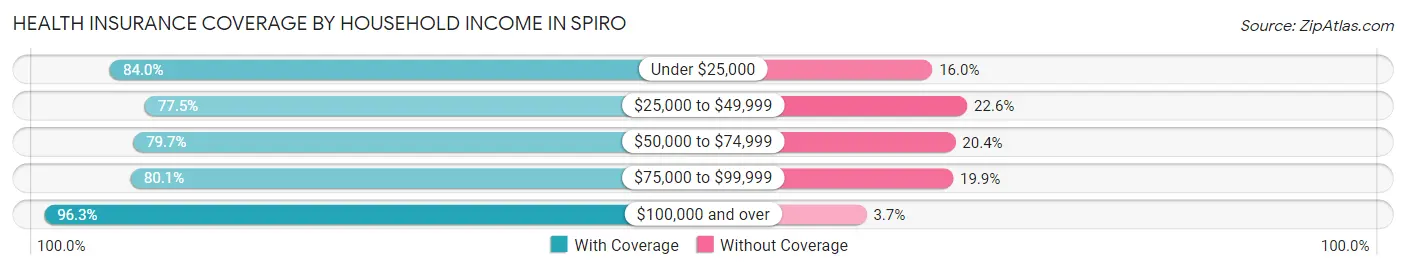
| Household Income | With Coverage | Without Coverage |
| Under $25,000 | 488 (84.0%) | 93 (16.0%) |
| $25,000 to $49,999 | 395 (77.4%) | 115 (22.6%) |
| $50,000 to $74,999 | 364 (79.6%) | 93 (20.3%) |
| $75,000 to $99,999 | 169 (80.1%) | 42 (19.9%) |
| $100,000 and over | 262 (96.3%) | 10 (3.7%) |
Public vs Private Health Insurance Coverage by Age in Spiro
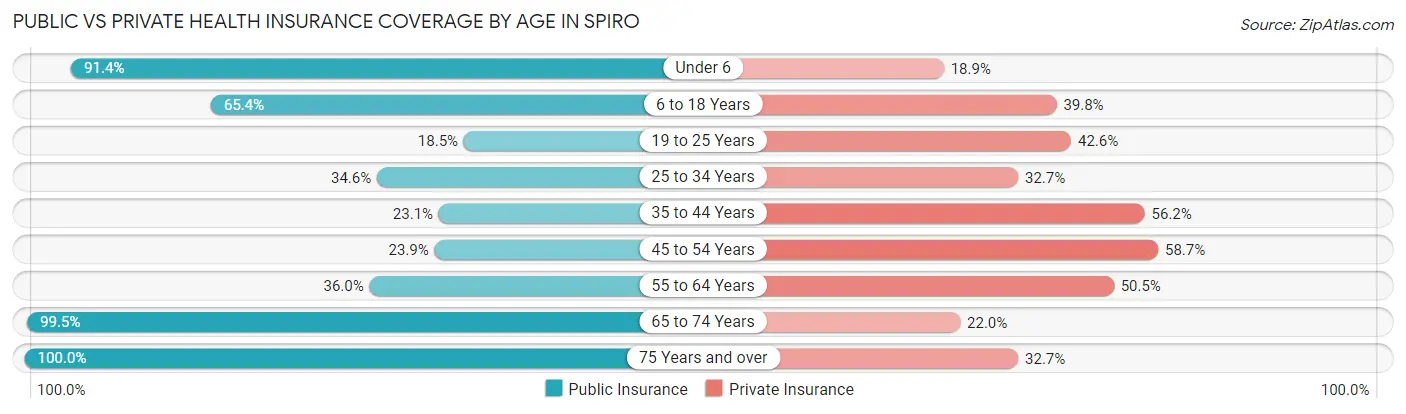
| Age Bracket | Public Insurance | Private Insurance |
| Under 6 | 169 (91.3%) | 35 (18.9%) |
| 6 to 18 Years | 248 (65.4%) | 151 (39.8%) |
| 19 to 25 Years | 36 (18.5%) | 83 (42.6%) |
| 25 to 34 Years | 74 (34.6%) | 70 (32.7%) |
| 35 to 44 Years | 67 (23.1%) | 163 (56.2%) |
| 45 to 54 Years | 55 (23.9%) | 135 (58.7%) |
| 55 to 64 Years | 77 (36.0%) | 108 (50.5%) |
| 65 to 74 Years | 213 (99.5%) | 47 (22.0%) |
| 75 Years and over | 110 (100.0%) | 36 (32.7%) |
| Total | 1,049 (51.6%) | 828 (40.8%) |
Disability Status by Sex by Age in Spiro
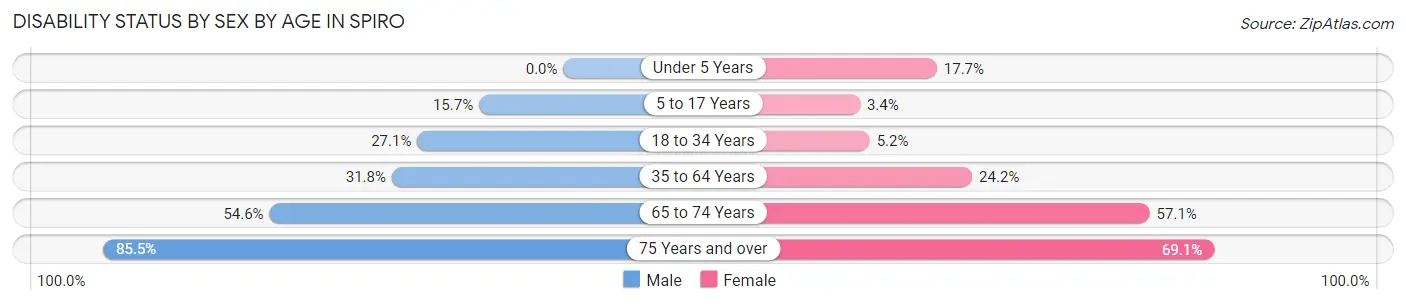
| Age Bracket | Male | Female |
| Under 5 Years | 0 (0.0%) | 6 (17.6%) |
| 5 to 17 Years | 31 (15.7%) | 6 (3.4%) |
| 18 to 34 Years | 64 (27.1%) | 11 (5.2%) |
| 35 to 64 Years | 114 (31.8%) | 91 (24.2%) |
| 65 to 74 Years | 48 (54.5%) | 72 (57.1%) |
| 75 Years and over | 47 (85.5%) | 38 (69.1%) |
Disability Class by Sex by Age in Spiro
Disability Class: Hearing Difficulty
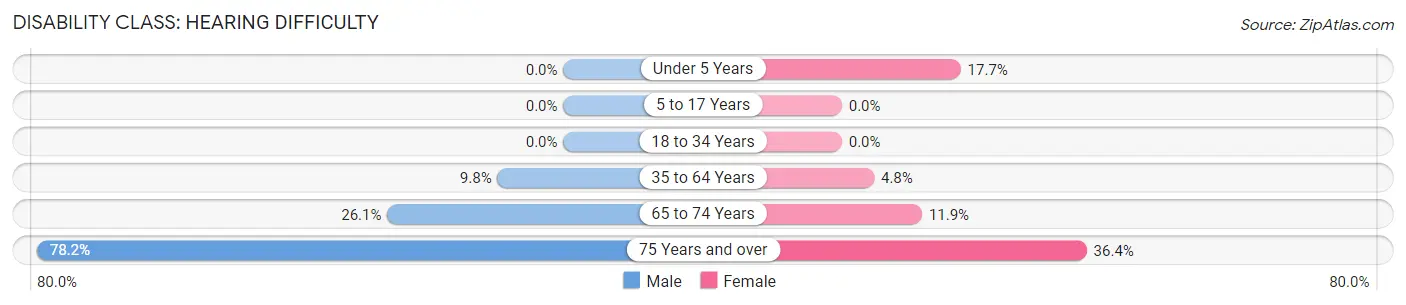
| Age Bracket | Male | Female |
| Under 5 Years | 0 (0.0%) | 6 (17.6%) |
| 5 to 17 Years | 0 (0.0%) | 0 (0.0%) |
| 18 to 34 Years | 0 (0.0%) | 0 (0.0%) |
| 35 to 64 Years | 35 (9.8%) | 18 (4.8%) |
| 65 to 74 Years | 23 (26.1%) | 15 (11.9%) |
| 75 Years and over | 43 (78.2%) | 20 (36.4%) |
Disability Class: Vision Difficulty
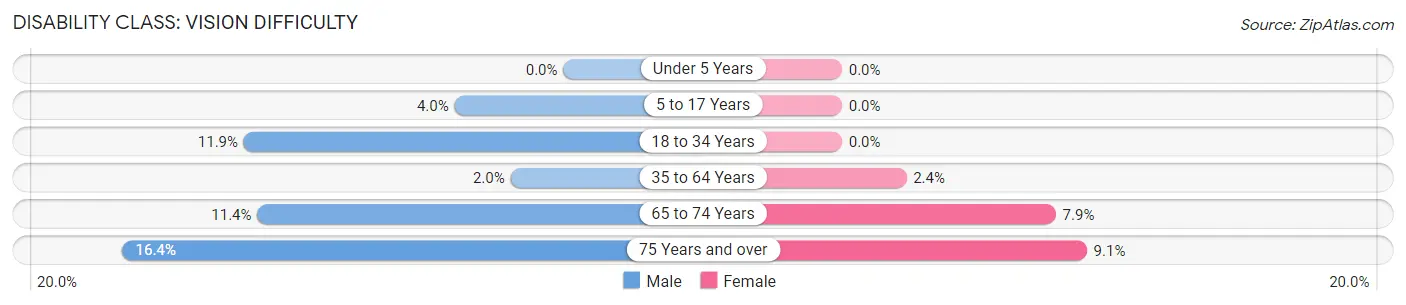
| Age Bracket | Male | Female |
| Under 5 Years | 0 (0.0%) | 0 (0.0%) |
| 5 to 17 Years | 8 (4.0%) | 0 (0.0%) |
| 18 to 34 Years | 28 (11.9%) | 0 (0.0%) |
| 35 to 64 Years | 7 (2.0%) | 9 (2.4%) |
| 65 to 74 Years | 10 (11.4%) | 10 (7.9%) |
| 75 Years and over | 9 (16.4%) | 5 (9.1%) |
Disability Class: Cognitive Difficulty
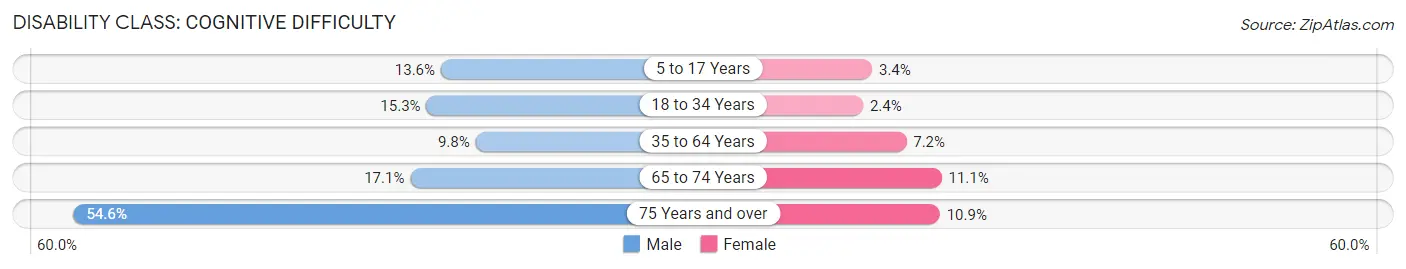
| Age Bracket | Male | Female |
| 5 to 17 Years | 27 (13.6%) | 6 (3.4%) |
| 18 to 34 Years | 36 (15.2%) | 5 (2.4%) |
| 35 to 64 Years | 35 (9.8%) | 27 (7.2%) |
| 65 to 74 Years | 15 (17.1%) | 14 (11.1%) |
| 75 Years and over | 30 (54.5%) | 6 (10.9%) |
Disability Class: Ambulatory Difficulty
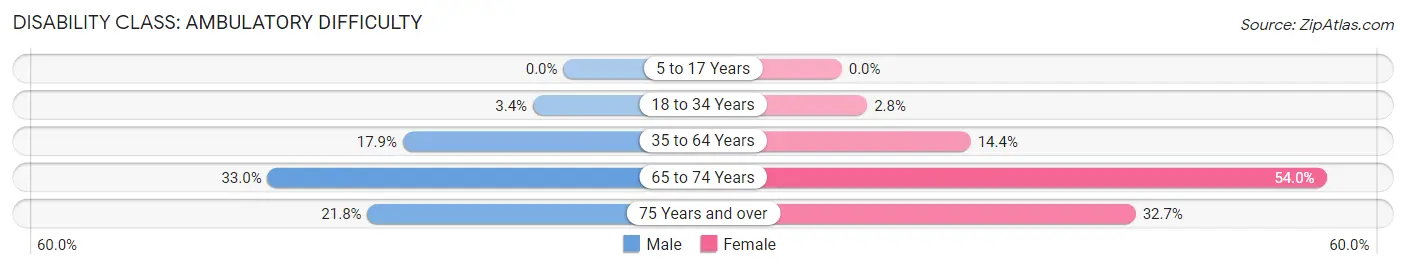
| Age Bracket | Male | Female |
| 5 to 17 Years | 0 (0.0%) | 0 (0.0%) |
| 18 to 34 Years | 8 (3.4%) | 6 (2.8%) |
| 35 to 64 Years | 64 (17.9%) | 54 (14.4%) |
| 65 to 74 Years | 29 (33.0%) | 68 (54.0%) |
| 75 Years and over | 12 (21.8%) | 18 (32.7%) |
Disability Class: Self-Care Difficulty
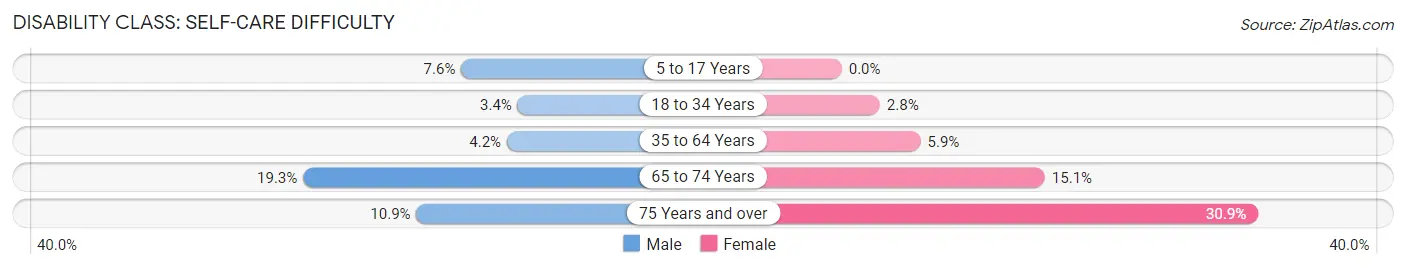
| Age Bracket | Male | Female |
| 5 to 17 Years | 15 (7.6%) | 0 (0.0%) |
| 18 to 34 Years | 8 (3.4%) | 6 (2.8%) |
| 35 to 64 Years | 15 (4.2%) | 22 (5.9%) |
| 65 to 74 Years | 17 (19.3%) | 19 (15.1%) |
| 75 Years and over | 6 (10.9%) | 17 (30.9%) |
Technology Access in Spiro
Computing Device Access in Spiro
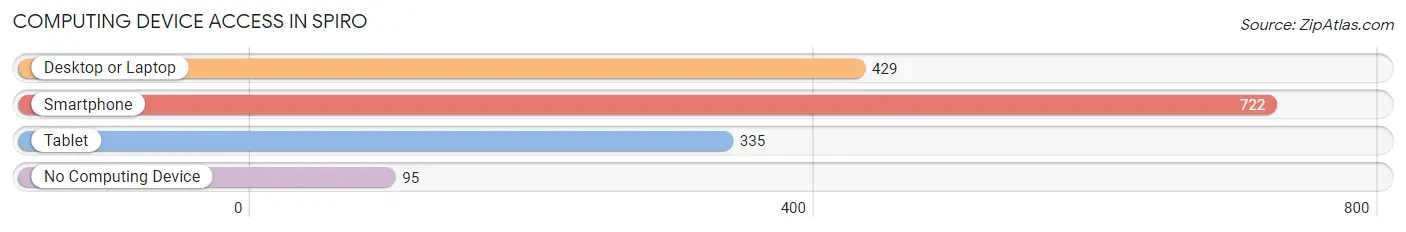
| Device Type | # Households | % Households |
| Desktop or Laptop | 429 | 51.4% |
| Smartphone | 722 | 86.5% |
| Tablet | 335 | 40.1% |
| No Computing Device | 95 | 11.4% |
| Total | 835 | 100.0% |
Internet Access in Spiro
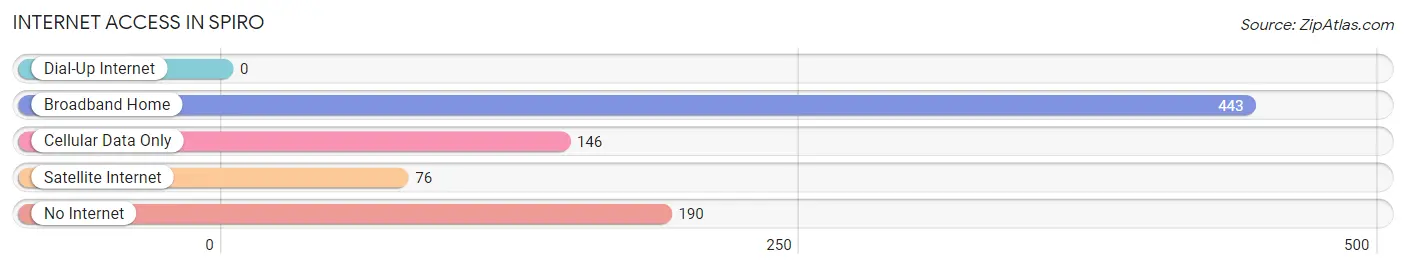
| Internet Type | # Households | % Households |
| Dial-Up Internet | 0 | 0.0% |
| Broadband Home | 443 | 53.0% |
| Cellular Data Only | 146 | 17.5% |
| Satellite Internet | 76 | 9.1% |
| No Internet | 190 | 22.8% |
| Total | 835 | 100.0% |
Spiro Summary
Spiro is a small town located in LeFlore County, Oklahoma. It is situated in the foothills of the Ozark Mountains, approximately 10 miles east of the Arkansas border. The town was founded in 1894 and was named after the nearby Spiro Mounds, an archaeological site that was once home to a Native American culture. The population of Spiro was 2,164 at the 2010 census.
Geography
Spiro is located at 35°25'25" North, 94°41'17" West (35.423, -94.688). According to the United States Census Bureau, the town has a total area of 1.2 square miles (3.1 km2), all land.
Economy
The economy of Spiro is largely based on agriculture and manufacturing. The town is home to several large poultry farms, as well as a number of small businesses. The town also has a small retail sector, with several stores and restaurants.
Demographics
As of the 2010 census, there were 2,164 people, 845 households, and 545 families residing in the town. The population density was 1,813.3 people per square mile (700.2/km2). There were 945 housing units at an average density of 795.8 per square mile (307.3/km2). The racial makeup of the town was 79.2% White, 0.7% African American, 15.2% Native American, 0.2% Asian, 0.1% Pacific Islander, 0.7% from other races, and 4.0% from two or more races. Hispanic or Latino of any race were 2.2% of the population.
There were 845 households, out of which 32.2% had children under the age of 18 living with them, 44.2% were married couples living together, 16.2% had a female householder with no husband present, and 34.2% were non-families. 29.7% of all households were made up of individuals, and 14.2% had someone living alone who was 65 years of age or older. The average household size was 2.50 and the average family size was 3.09.
In the town, the population was spread out, with 27.2% under the age of 18, 8.7% from 18 to 24, 25.2% from 25 to 44, 22.7% from 45 to 64, and 16.2% who were 65 years of age or older. The median age was 36 years. For every 100 females, there were 87.2 males. For every 100 females age 18 and over, there were 81.2 males.
The median income for a household in the town was $25,000, and the median income for a family was $30,000. Males had a median income of $27,000 versus $20,000 for females. The per capita income for the town was $13,000. About 17.2% of families and 20.2% of the population were below the poverty line, including 28.2% of those under age 18 and 16.2% of those age 65 or over.
Conclusion
Spiro is a small town located in LeFlore County, Oklahoma. It is situated in the foothills of the Ozark Mountains, approximately 10 miles east of the Arkansas border. The town was founded in 1894 and was named after the nearby Spiro Mounds, an archaeological site that was once home to a Native American culture. The population of Spiro was 2,164 at the 2010 census. The economy of Spiro is largely based on agriculture and manufacturing. The town is home to several large poultry farms, as well as a number of small businesses. The town also has a small retail sector, with several stores and restaurants. The racial makeup of the town was 79.2% White, 0.7% African American, 15.2% Native American, 0.2% Asian, 0.1% Pacific Islander, 0.7% from other races, and 4.0% from two or more races. The median income for a household in the town was $25,000, and the median income for a family was $30,000. About 17.2% of families and 20.2% of the population were below the poverty line. Spiro is a small town with a rich history and a diverse population. It is a great place to live and work, and offers a variety of opportunities for those looking to make a life in the area.
Common Questions
What is Per Capita Income in Spiro?
Per Capita income in Spiro is $21,825.
What is the Median Family Income in Spiro?
Median Family Income in Spiro is $43,523.
What is the Median Household income in Spiro?
Median Household Income in Spiro is $33,295.
What is Income or Wage Gap in Spiro?
Income or Wage Gap in Spiro is 18.5%.
Women in Spiro earn 81.5 cents for every dollar earned by a man.
What is Family Income Deficit in Spiro?
Family Income Deficit in Spiro is $13,170.
Families that are below poverty line in Spiro earn $13,170 less on average than the poverty threshold level.
What is Inequality or Gini Index in Spiro?
Inequality or Gini Index in Spiro is 0.49.
What is the Total Population of Spiro?
Total Population of Spiro is 2,095.
What is the Total Male Population of Spiro?
Total Male Population of Spiro is 1,055.
What is the Total Female Population of Spiro?
Total Female Population of Spiro is 1,040.
What is the Ratio of Males per 100 Females in Spiro?
There are 101.44 Males per 100 Females in Spiro.
What is the Ratio of Females per 100 Males in Spiro?
There are 98.58 Females per 100 Males in Spiro.
What is the Median Population Age in Spiro?
Median Population Age in Spiro is 37.0 Years.
What is the Average Family Size in Spiro
Average Family Size in Spiro is 3.2 People.
What is the Average Household Size in Spiro
Average Household Size in Spiro is 2.4 People.
How Large is the Labor Force in Spiro?
There are 800 People in the Labor Forcein in Spiro.
What is the Percentage of People in the Labor Force in Spiro?
49.0% of People are in the Labor Force in Spiro.
What is the Unemployment Rate in Spiro?
Unemployment Rate in Spiro is 10.4%.