Spavinaw, OK Map & Demographics
Spavinaw Map
Spavinaw Overview
$24,501
PER CAPITA INCOME
$28,750
AVG FAMILY INCOME
$29,000
AVG HOUSEHOLD INCOME
28.3%
WAGE / INCOME GAP [ % ]
71.7¢/ $1
WAGE / INCOME GAP [ $ ]
$10,153
FAMILY INCOME DEFICIT
0.51
INEQUALITY / GINI INDEX
423
TOTAL POPULATION
232
MALE POPULATION
191
FEMALE POPULATION
121.47
MALES / 100 FEMALES
82.33
FEMALES / 100 MALES
53.6
MEDIAN AGE
3.4
AVG FAMILY SIZE
2.5
AVG HOUSEHOLD SIZE
140
LABOR FORCE [ PEOPLE ]
38.7%
PERCENT IN LABOR FORCE
7.9%
UNEMPLOYMENT RATE
Spavinaw Zip Codes
Spavinaw Area Codes
Income in Spavinaw
Income Overview in Spavinaw
Per Capita Income in Spavinaw is $24,501, while median incomes of families and households are $28,750 and $29,000 respectively.
| Characteristic | Number | Measure |
| Per Capita Income | 423 | $24,501 |
| Median Family Income | 87 | $28,750 |
| Mean Family Income | 87 | $46,070 |
| Median Household Income | 166 | $29,000 |
| Mean Household Income | 166 | $50,654 |
| Income Deficit | 87 | $10,153 |
| Wage / Income Gap (%) | 423 | 28.30% |
| Wage / Income Gap ($) | 423 | 71.70¢ per $1 |
| Gini / Inequality Index | 423 | 0.51 |
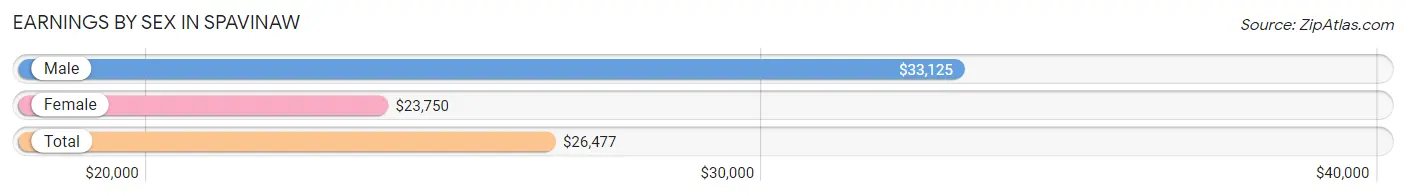
Earnings by Sex in Spavinaw
Average Earnings in Spavinaw are $26,477, $33,125 for men and $23,750 for women, a difference of 28.3%.
| Sex | Number | Average Earnings |
| Male | 69 (48.9%) | $33,125 |
| Female | 72 (51.1%) | $23,750 |
| Total | 141 (100.0%) | $26,477 |
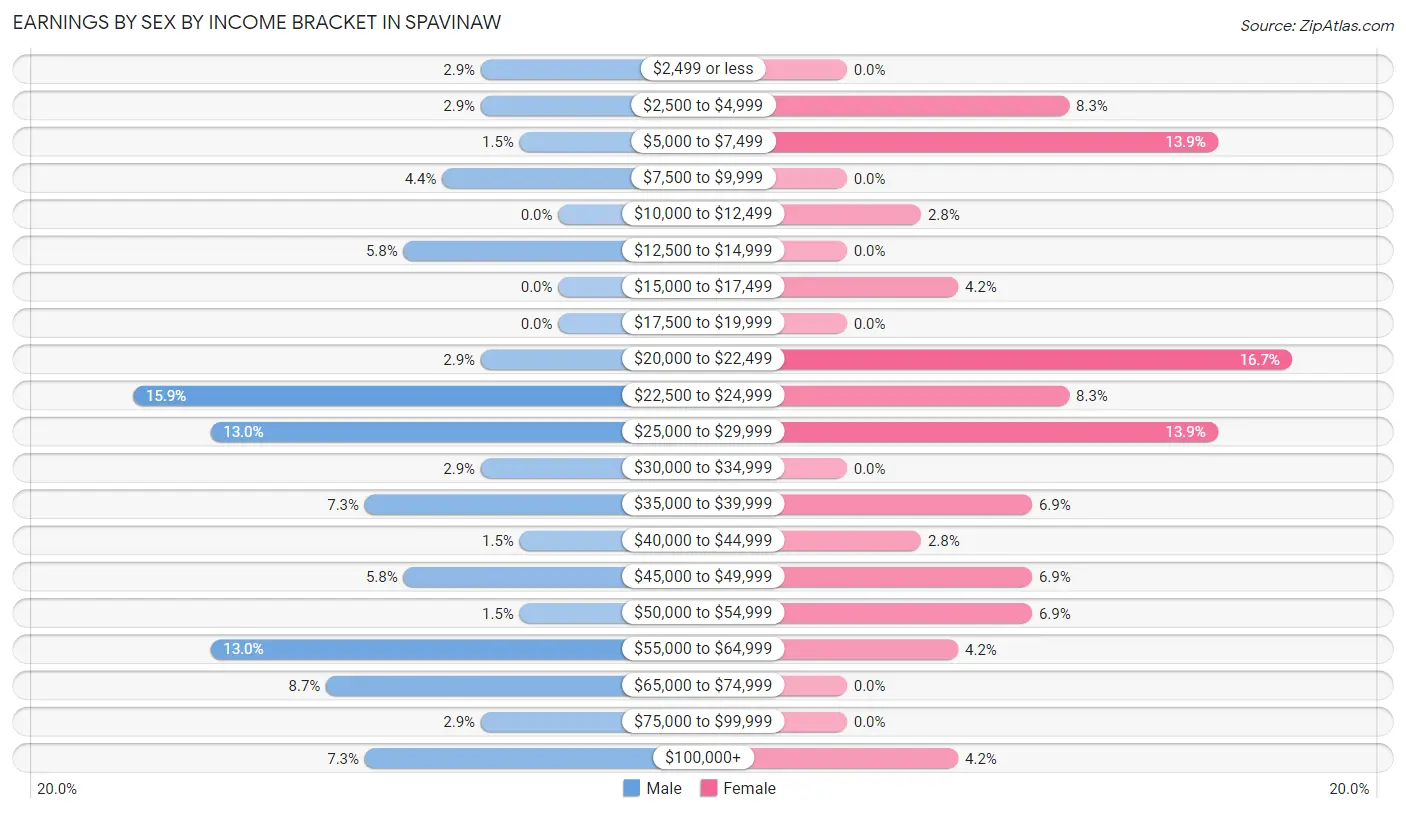
Earnings by Sex by Income Bracket in Spavinaw
The most common earnings brackets in Spavinaw are $22,500 to $24,999 for men (11 | 15.9%) and $20,000 to $22,499 for women (12 | 16.7%).
| Income | Male | Female |
| $2,499 or less | 2 (2.9%) | 0 (0.0%) |
| $2,500 to $4,999 | 2 (2.9%) | 6 (8.3%) |
| $5,000 to $7,499 | 1 (1.5%) | 10 (13.9%) |
| $7,500 to $9,999 | 3 (4.3%) | 0 (0.0%) |
| $10,000 to $12,499 | 0 (0.0%) | 2 (2.8%) |
| $12,500 to $14,999 | 4 (5.8%) | 0 (0.0%) |
| $15,000 to $17,499 | 0 (0.0%) | 3 (4.2%) |
| $17,500 to $19,999 | 0 (0.0%) | 0 (0.0%) |
| $20,000 to $22,499 | 2 (2.9%) | 12 (16.7%) |
| $22,500 to $24,999 | 11 (15.9%) | 6 (8.3%) |
| $25,000 to $29,999 | 9 (13.0%) | 10 (13.9%) |
| $30,000 to $34,999 | 2 (2.9%) | 0 (0.0%) |
| $35,000 to $39,999 | 5 (7.2%) | 5 (6.9%) |
| $40,000 to $44,999 | 1 (1.5%) | 2 (2.8%) |
| $45,000 to $49,999 | 4 (5.8%) | 5 (6.9%) |
| $50,000 to $54,999 | 1 (1.5%) | 5 (6.9%) |
| $55,000 to $64,999 | 9 (13.0%) | 3 (4.2%) |
| $65,000 to $74,999 | 6 (8.7%) | 0 (0.0%) |
| $75,000 to $99,999 | 2 (2.9%) | 0 (0.0%) |
| $100,000+ | 5 (7.2%) | 3 (4.2%) |
| Total | 69 (100.0%) | 72 (100.0%) |
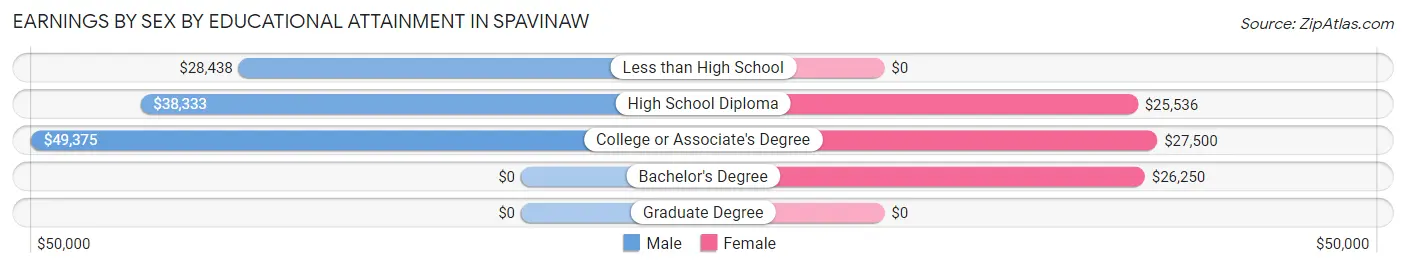
Earnings by Sex by Educational Attainment in Spavinaw
Average earnings in Spavinaw are $38,000 for men and $24,583 for women, a difference of 35.3%. Men with an educational attainment of college or associate's degree enjoy the highest average annual earnings of $49,375, while those with less than high school education earn the least with $28,438. Women with an educational attainment of college or associate's degree earn the most with the average annual earnings of $27,500, while those with high school diploma education have the smallest earnings of $25,536.
| Educational Attainment | Male Income | Female Income |
| Less than High School | $28,438 | $0 |
| High School Diploma | $38,333 | $25,536 |
| College or Associate's Degree | $49,375 | $27,500 |
| Bachelor's Degree | - | - |
| Graduate Degree | - | - |
| Total | $38,000 | $24,583 |
Family Income in Spavinaw
Family Income Brackets in Spavinaw
According to the Spavinaw family income data, there are 19 families falling into the $15,000 to $24,999 income range, which is the most common income bracket and makes up 21.8% of all families.
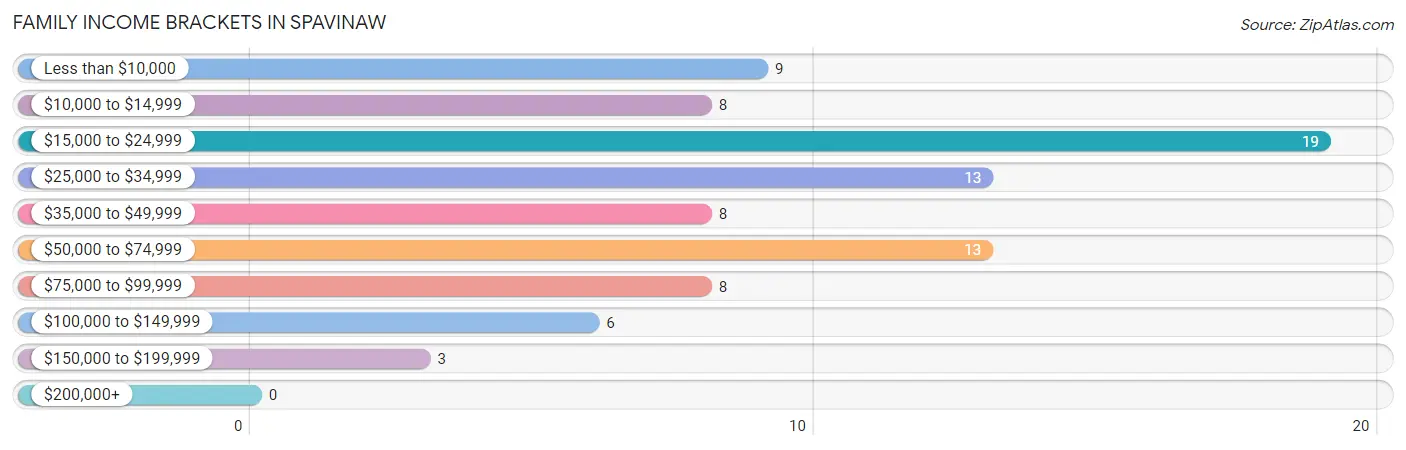
| Income Bracket | # Families | % Families |
| Less than $10,000 | 9 | 10.3% |
| $10,000 to $14,999 | 8 | 9.2% |
| $15,000 to $24,999 | 19 | 21.8% |
| $25,000 to $34,999 | 13 | 14.9% |
| $35,000 to $49,999 | 8 | 9.2% |
| $50,000 to $74,999 | 13 | 14.9% |
| $75,000 to $99,999 | 8 | 9.2% |
| $100,000 to $149,999 | 6 | 6.9% |
| $150,000 to $199,999 | 3 | 3.4% |
| $200,000+ | 0 | 0.0% |
Family Income by Famaliy Size in Spavinaw
4-person families (7 | 8.1%) account for the highest median family income in Spavinaw with $43,125 per family, while 2-person families (53 | 60.9%) have the highest median income of $14,688 per family member.
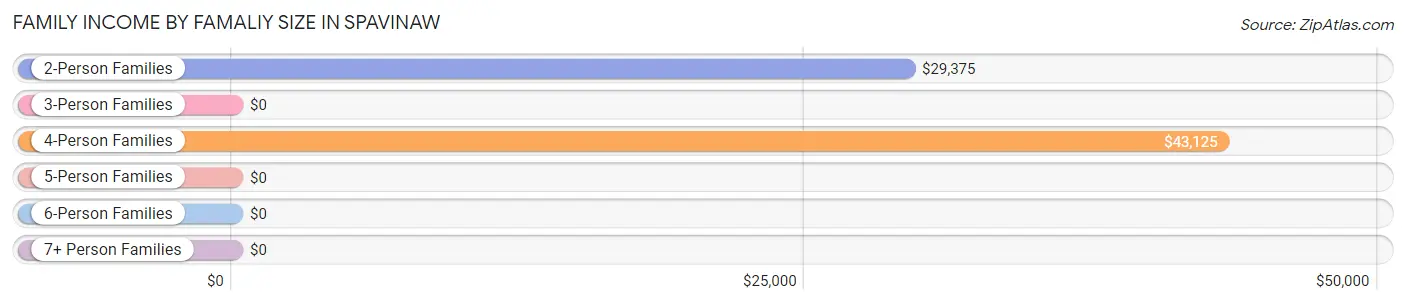
| Income Bracket | # Families | Median Income |
| 2-Person Families | 53 (60.9%) | $29,375 |
| 3-Person Families | 16 (18.4%) | $0 |
| 4-Person Families | 7 (8.1%) | $43,125 |
| 5-Person Families | 7 (8.1%) | $0 |
| 6-Person Families | 2 (2.3%) | $0 |
| 7+ Person Families | 2 (2.3%) | $0 |
| Total | 87 (100.0%) | $28,750 |
Family Income by Number of Earners in Spavinaw
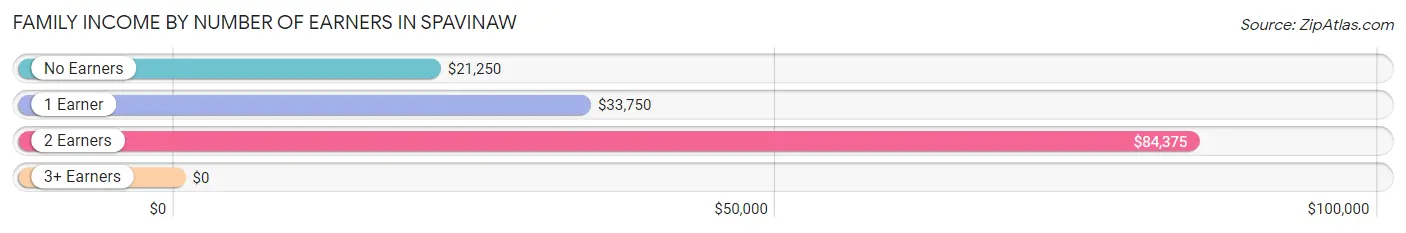
| Number of Earners | # Families | Median Income |
| No Earners | 36 (41.4%) | $21,250 |
| 1 Earner | 32 (36.8%) | $33,750 |
| 2 Earners | 15 (17.2%) | $84,375 |
| 3+ Earners | 4 (4.6%) | $0 |
| Total | 87 (100.0%) | $28,750 |
Household Income in Spavinaw
Household Income Brackets in Spavinaw
With 39 households falling in the category, the $15,000 to $24,999 income range is the most frequent in Spavinaw, accounting for 23.5% of all households. In contrast, only 1 households (0.6%) fall into the $200,000+ income bracket, making it the least populous group.
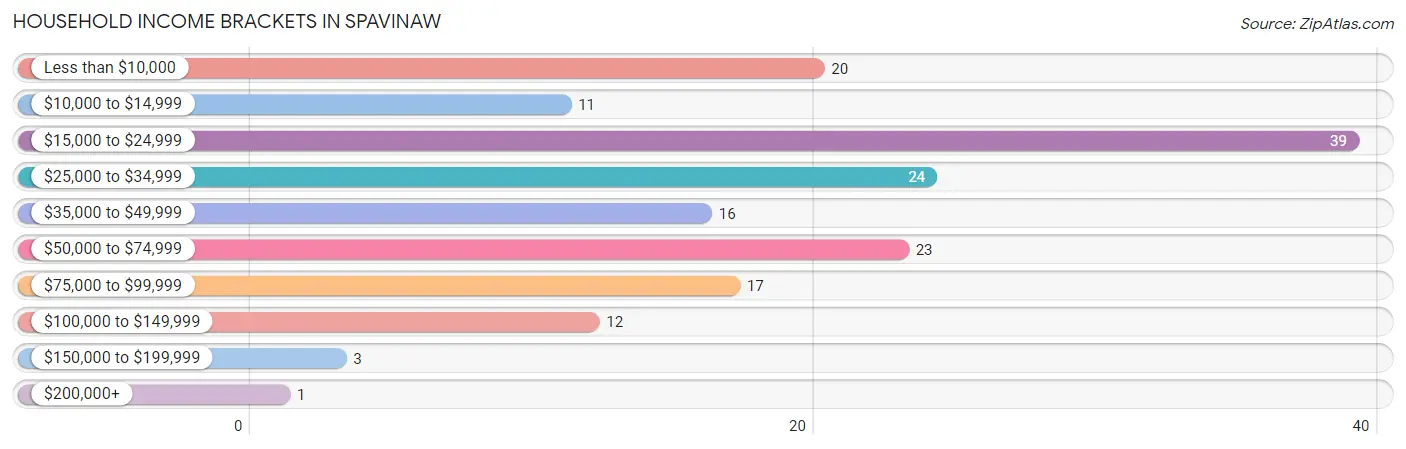
| Income Bracket | # Households | % Households |
| Less than $10,000 | 20 | 12.0% |
| $10,000 to $14,999 | 11 | 6.6% |
| $15,000 to $24,999 | 39 | 23.5% |
| $25,000 to $34,999 | 24 | 14.5% |
| $35,000 to $49,999 | 16 | 9.6% |
| $50,000 to $74,999 | 23 | 13.9% |
| $75,000 to $99,999 | 17 | 10.2% |
| $100,000 to $149,999 | 12 | 7.2% |
| $150,000 to $199,999 | 3 | 1.8% |
| $200,000+ | 1 | 0.6% |
Household Income by Householder Age in Spavinaw
The median household income in Spavinaw is $29,000, with the highest median household income of $38,125 found in the 25 to 44 years age bracket for the primary householder. A total of 33 households (19.9%) fall into this category. Meanwhile, the 65+ years age bracket for the primary householder has the lowest median household income of $24,000, with 46 households (27.7%) in this group.
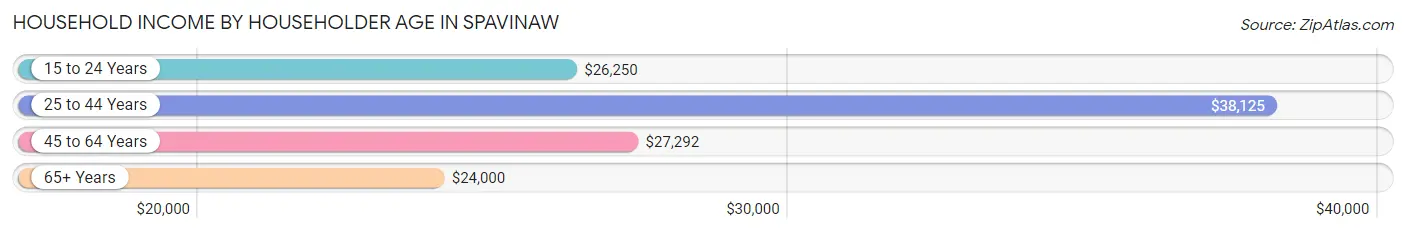
| Income Bracket | # Households | Median Income |
| 15 to 24 Years | 12 (7.2%) | $26,250 |
| 25 to 44 Years | 33 (19.9%) | $38,125 |
| 45 to 64 Years | 75 (45.2%) | $27,292 |
| 65+ Years | 46 (27.7%) | $24,000 |
| Total | 166 (100.0%) | $29,000 |
Poverty in Spavinaw
Income Below Poverty by Sex and Age in Spavinaw
With 18.9% poverty level for males and 41.8% for females among the residents of Spavinaw, 12 to 14 year old males and 6 to 11 year old females are the most vulnerable to poverty, with 5 males (100.0%) and 8 females (100.0%) in their respective age groups living below the poverty level.
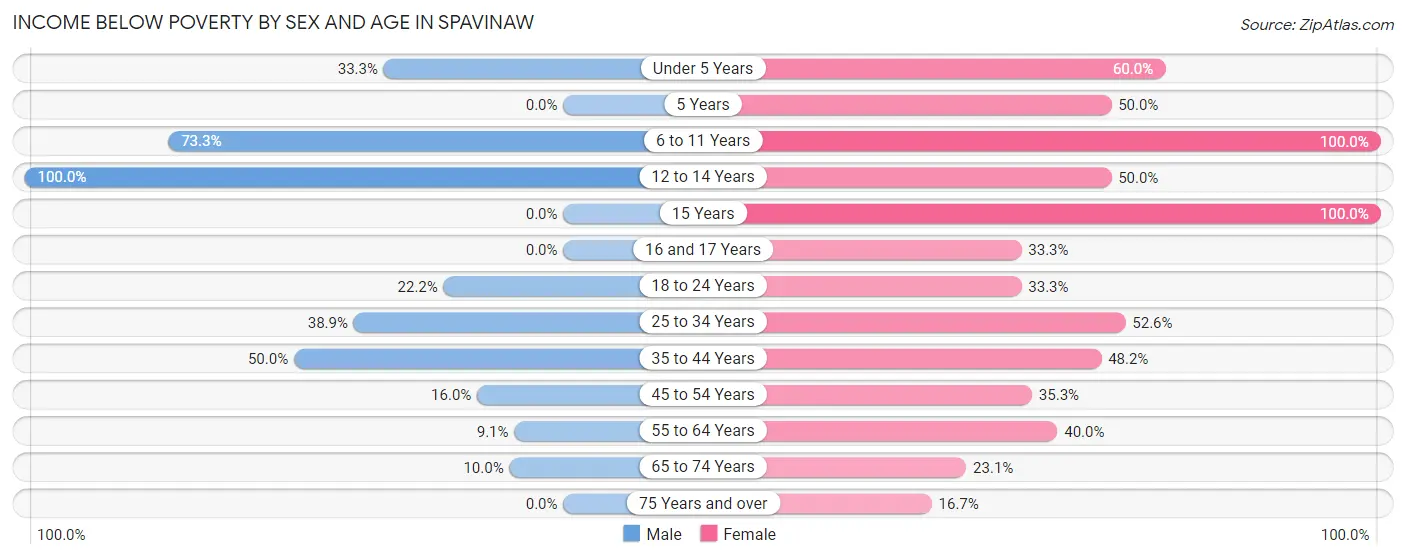
| Age Bracket | Male | Female |
| Under 5 Years | 2 (33.3%) | 6 (60.0%) |
| 5 Years | 0 (0.0%) | 1 (50.0%) |
| 6 to 11 Years | 11 (73.3%) | 8 (100.0%) |
| 12 to 14 Years | 5 (100.0%) | 2 (50.0%) |
| 15 Years | 0 (0.0%) | 2 (100.0%) |
| 16 and 17 Years | 0 (0.0%) | 1 (33.3%) |
| 18 to 24 Years | 2 (22.2%) | 4 (33.3%) |
| 25 to 34 Years | 7 (38.9%) | 10 (52.6%) |
| 35 to 44 Years | 6 (50.0%) | 13 (48.1%) |
| 45 to 54 Years | 4 (16.0%) | 12 (35.3%) |
| 55 to 64 Years | 4 (9.1%) | 12 (40.0%) |
| 65 to 74 Years | 2 (10.0%) | 6 (23.1%) |
| 75 Years and over | 0 (0.0%) | 2 (16.7%) |
| Total | 43 (18.9%) | 79 (41.8%) |
Income Above Poverty by Sex and Age in Spavinaw
According to the poverty statistics in Spavinaw, males aged 5 years and females aged 75 years and over are the age groups that are most secure financially, with 100.0% of males and 83.3% of females in these age groups living above the poverty line.
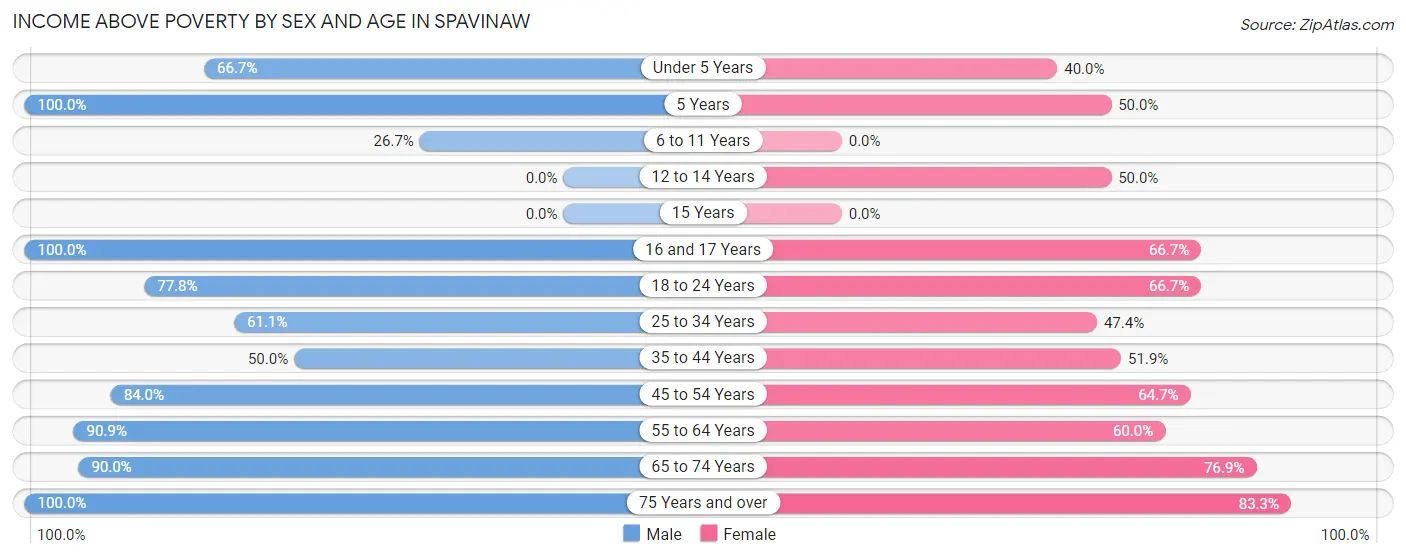
| Age Bracket | Male | Female |
| Under 5 Years | 4 (66.7%) | 4 (40.0%) |
| 5 Years | 2 (100.0%) | 1 (50.0%) |
| 6 to 11 Years | 4 (26.7%) | 0 (0.0%) |
| 12 to 14 Years | 0 (0.0%) | 2 (50.0%) |
| 15 Years | 0 (0.0%) | 0 (0.0%) |
| 16 and 17 Years | 1 (100.0%) | 2 (66.7%) |
| 18 to 24 Years | 7 (77.8%) | 8 (66.7%) |
| 25 to 34 Years | 11 (61.1%) | 9 (47.4%) |
| 35 to 44 Years | 6 (50.0%) | 14 (51.8%) |
| 45 to 54 Years | 21 (84.0%) | 22 (64.7%) |
| 55 to 64 Years | 40 (90.9%) | 18 (60.0%) |
| 65 to 74 Years | 18 (90.0%) | 20 (76.9%) |
| 75 Years and over | 70 (100.0%) | 10 (83.3%) |
| Total | 184 (81.1%) | 110 (58.2%) |
Income Below Poverty Among Married-Couple Families in Spavinaw
The poverty statistics for married-couple families in Spavinaw show that 21.8% or 12 of the total 55 families live below the poverty line. Families with 3 or 4 children have the highest poverty rate of 57.1%, comprising of 4 families. On the other hand, families with no children have the lowest poverty rate of 15.9%, which includes 7 families.
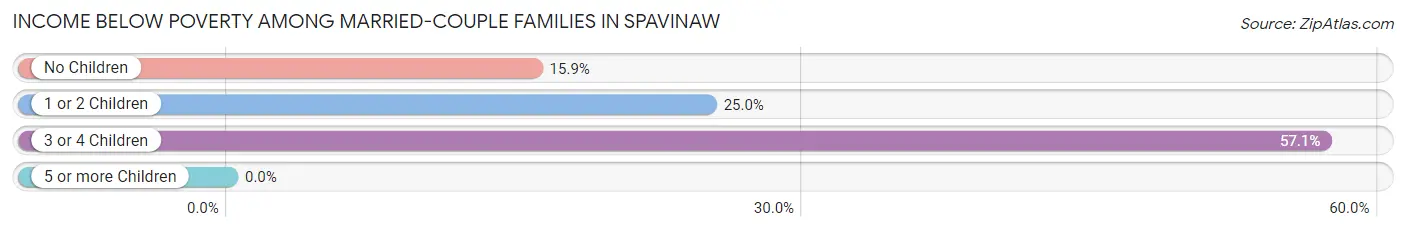
| Children | Above Poverty | Below Poverty |
| No Children | 37 (84.1%) | 7 (15.9%) |
| 1 or 2 Children | 3 (75.0%) | 1 (25.0%) |
| 3 or 4 Children | 3 (42.9%) | 4 (57.1%) |
| 5 or more Children | 0 (0.0%) | 0 (0.0%) |
| Total | 43 (78.2%) | 12 (21.8%) |
Income Below Poverty Among Single-Parent Households in Spavinaw
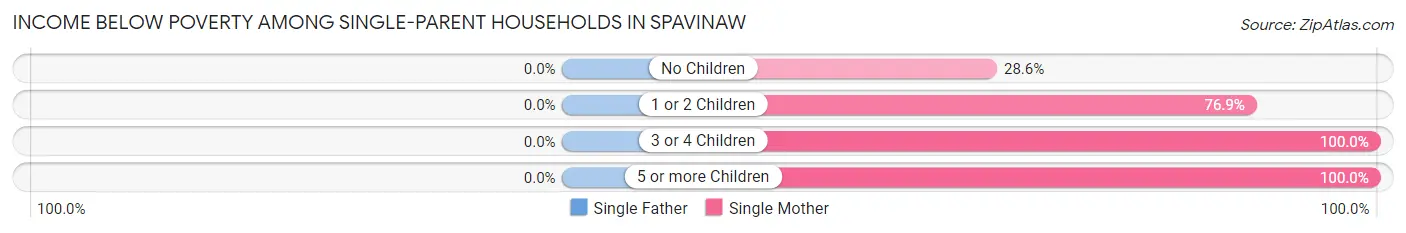
| Children | Single Father | Single Mother |
| No Children | 0 (0.0%) | 2 (28.6%) |
| 1 or 2 Children | 0 (0.0%) | 10 (76.9%) |
| 3 or 4 Children | 0 (0.0%) | 4 (100.0%) |
| 5 or more Children | 0 (0.0%) | 2 (100.0%) |
| Total | 0 (0.0%) | 18 (69.2%) |
Income Below Poverty Among Married-Couple vs Single-Parent Households in Spavinaw
The poverty data for Spavinaw shows that 12 of the married-couple family households (21.8%) and 18 of the single-parent households (56.2%) are living below the poverty level. Within the married-couple family households, those with 3 or 4 children have the highest poverty rate, with 4 households (57.1%) falling below the poverty line. Among the single-parent households, those with 3 or 4 children have the highest poverty rate, with 4 household (100.0%) living below poverty.
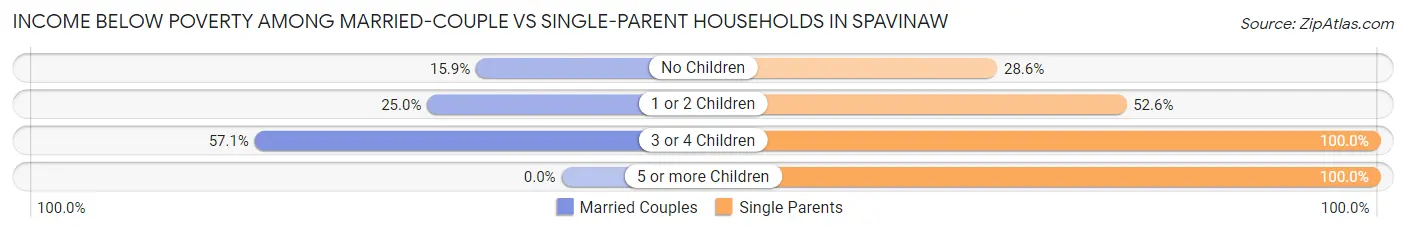
| Children | Married-Couple Families | Single-Parent Households |
| No Children | 7 (15.9%) | 2 (28.6%) |
| 1 or 2 Children | 1 (25.0%) | 10 (52.6%) |
| 3 or 4 Children | 4 (57.1%) | 4 (100.0%) |
| 5 or more Children | 0 (0.0%) | 2 (100.0%) |
| Total | 12 (21.8%) | 18 (56.2%) |
Race in Spavinaw
The most populous races in Spavinaw are White / Caucasian (288 | 68.1%), Native / Alaskan (81 | 19.2%), and Two or more Races (52 | 12.3%).
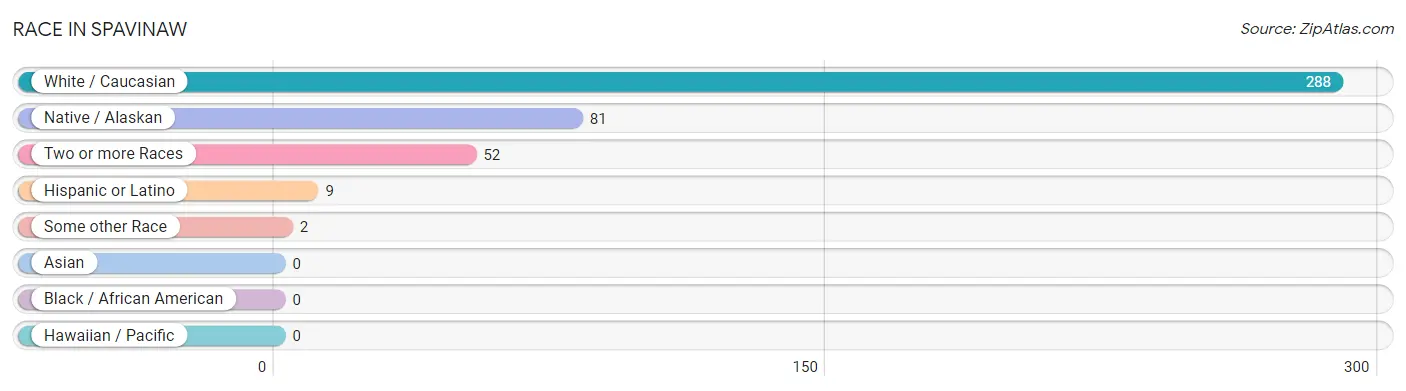
| Race | # Population | % Population |
| Asian | 0 | 0.0% |
| Black / African American | 0 | 0.0% |
| Hawaiian / Pacific | 0 | 0.0% |
| Hispanic or Latino | 9 | 2.1% |
| Native / Alaskan | 81 | 19.2% |
| White / Caucasian | 288 | 68.1% |
| Two or more Races | 52 | 12.3% |
| Some other Race | 2 | 0.5% |
| Total | 423 | 100.0% |
Ancestry in Spavinaw
The most populous ancestries reported in Spavinaw are Irish (120 | 28.4%), Cherokee (96 | 22.7%), German (44 | 10.4%), English (14 | 3.3%), and Scottish (9 | 2.1%), together accounting for 66.9% of all Spavinaw residents.
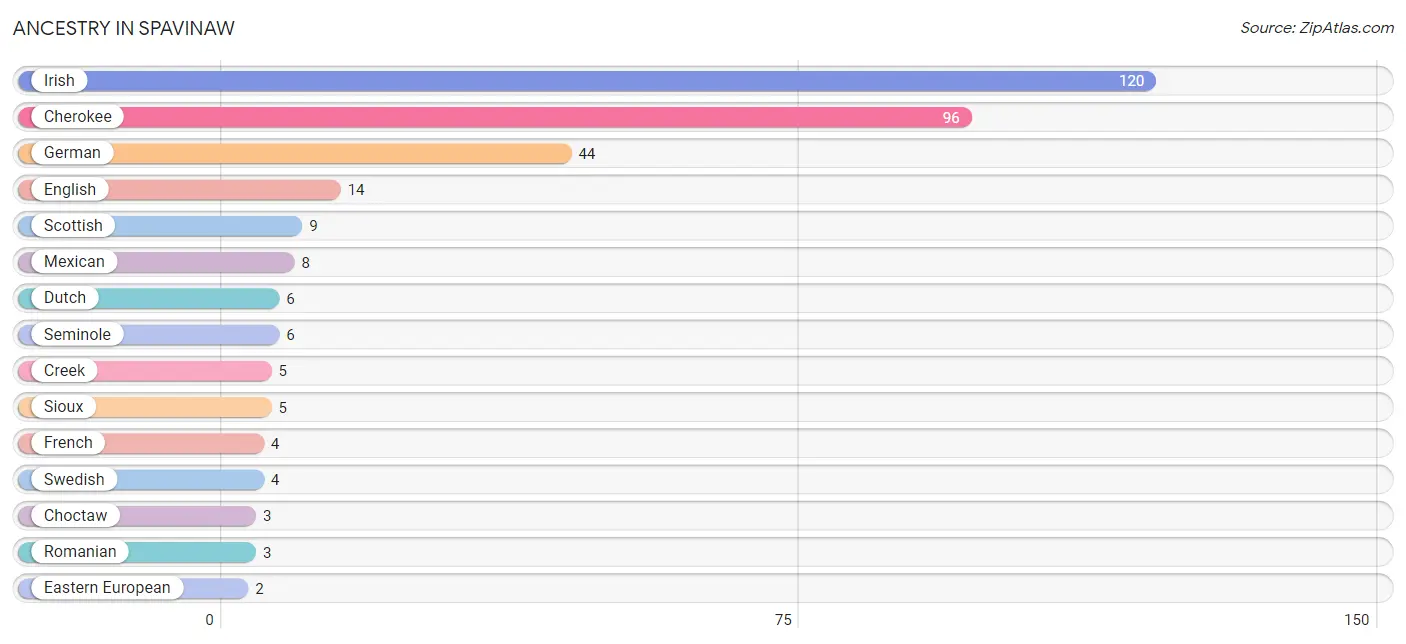
| Ancestry | # Population | % Population |
| Arab | 1 | 0.2% |
| Cherokee | 96 | 22.7% |
| Choctaw | 3 | 0.7% |
| Creek | 5 | 1.2% |
| Cuban | 1 | 0.2% |
| Dutch | 6 | 1.4% |
| Eastern European | 2 | 0.5% |
| English | 14 | 3.3% |
| European | 2 | 0.5% |
| French | 4 | 0.9% |
| German | 44 | 10.4% |
| Greek | 1 | 0.2% |
| Irish | 120 | 28.4% |
| Kiowa | 2 | 0.5% |
| Lebanese | 1 | 0.2% |
| Mexican | 8 | 1.9% |
| Native Hawaiian | 1 | 0.2% |
| Osage | 1 | 0.2% |
| Polish | 2 | 0.5% |
| Portuguese | 1 | 0.2% |
| Potawatomi | 2 | 0.5% |
| Romanian | 3 | 0.7% |
| Scandinavian | 2 | 0.5% |
| Scotch-Irish | 2 | 0.5% |
| Scottish | 9 | 2.1% |
| Seminole | 6 | 1.4% |
| Sioux | 5 | 1.2% |
| Swedish | 4 | 0.9% | View All 28 Rows |
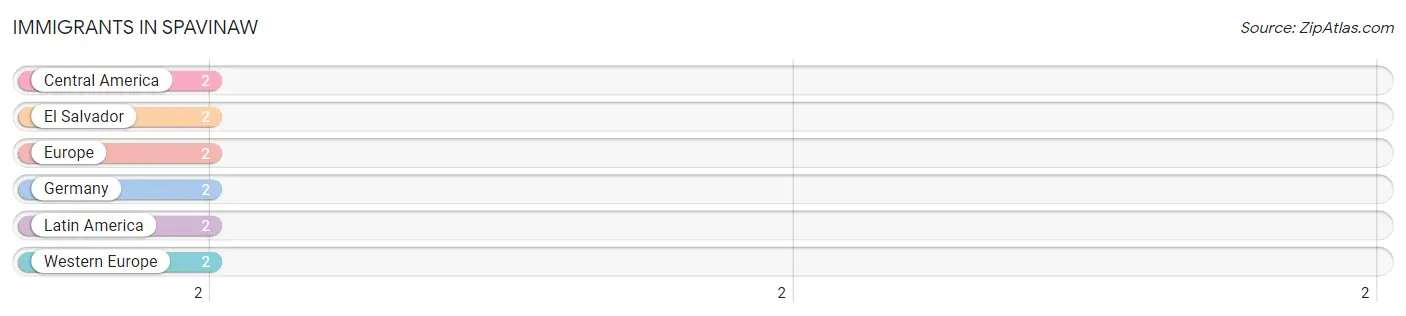
Immigrants in Spavinaw
The most numerous immigrant groups reported in Spavinaw came from Central America (2 | 0.5%), El Salvador (2 | 0.5%), Europe (2 | 0.5%), Germany (2 | 0.5%), and Latin America (2 | 0.5%), together accounting for 2.4% of all Spavinaw residents.
| Immigration Origin | # Population | % Population |
| Central America | 2 | 0.5% |
| El Salvador | 2 | 0.5% |
| Europe | 2 | 0.5% |
| Germany | 2 | 0.5% |
| Latin America | 2 | 0.5% |
| Western Europe | 2 | 0.5% | View All 6 Rows |
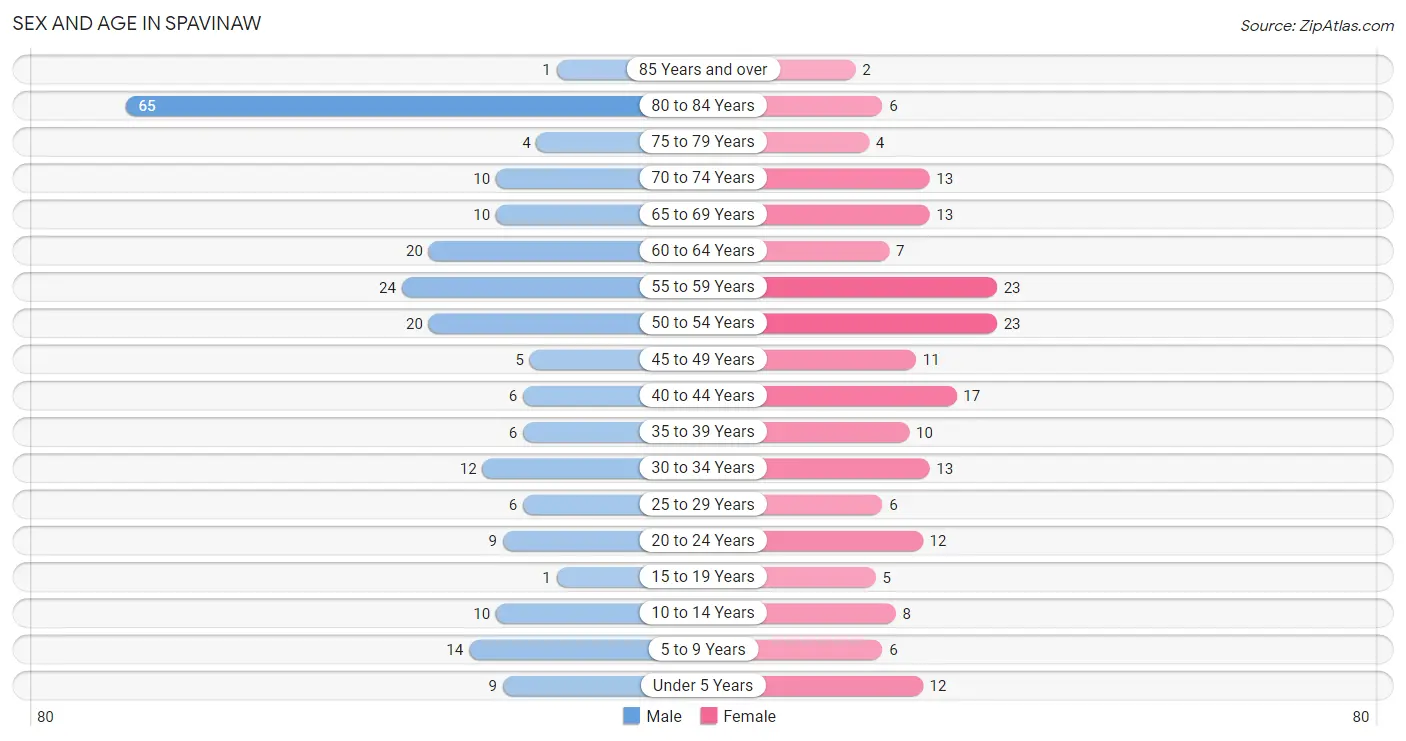
Sex and Age in Spavinaw
Sex and Age in Spavinaw
The most populous age groups in Spavinaw are 80 to 84 Years (65 | 28.0%) for men and 50 to 54 Years (23 | 12.0%) for women.
| Age Bracket | Male | Female |
| Under 5 Years | 9 (3.9%) | 12 (6.3%) |
| 5 to 9 Years | 14 (6.0%) | 6 (3.1%) |
| 10 to 14 Years | 10 (4.3%) | 8 (4.2%) |
| 15 to 19 Years | 1 (0.4%) | 5 (2.6%) |
| 20 to 24 Years | 9 (3.9%) | 12 (6.3%) |
| 25 to 29 Years | 6 (2.6%) | 6 (3.1%) |
| 30 to 34 Years | 12 (5.2%) | 13 (6.8%) |
| 35 to 39 Years | 6 (2.6%) | 10 (5.2%) |
| 40 to 44 Years | 6 (2.6%) | 17 (8.9%) |
| 45 to 49 Years | 5 (2.2%) | 11 (5.8%) |
| 50 to 54 Years | 20 (8.6%) | 23 (12.0%) |
| 55 to 59 Years | 24 (10.3%) | 23 (12.0%) |
| 60 to 64 Years | 20 (8.6%) | 7 (3.7%) |
| 65 to 69 Years | 10 (4.3%) | 13 (6.8%) |
| 70 to 74 Years | 10 (4.3%) | 13 (6.8%) |
| 75 to 79 Years | 4 (1.7%) | 4 (2.1%) |
| 80 to 84 Years | 65 (28.0%) | 6 (3.1%) |
| 85 Years and over | 1 (0.4%) | 2 (1.1%) |
| Total | 232 (100.0%) | 191 (100.0%) |
Families and Households in Spavinaw
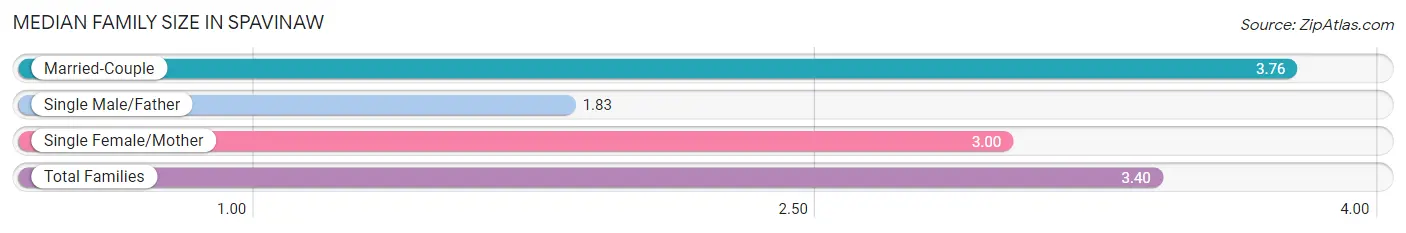
Median Family Size in Spavinaw
The median family size in Spavinaw is 3.40 persons per family, with married-couple families (55 | 63.2%) accounting for the largest median family size of 3.76 persons per family. On the other hand, single male/father families (6 | 6.9%) represent the smallest median family size with 1.83 persons per family.
| Family Type | # Families | Family Size |
| Married-Couple | 55 (63.2%) | 3.76 |
| Single Male/Father | 6 (6.9%) | 1.83 |
| Single Female/Mother | 26 (29.9%) | 3.00 |
| Total Families | 87 (100.0%) | 3.40 |
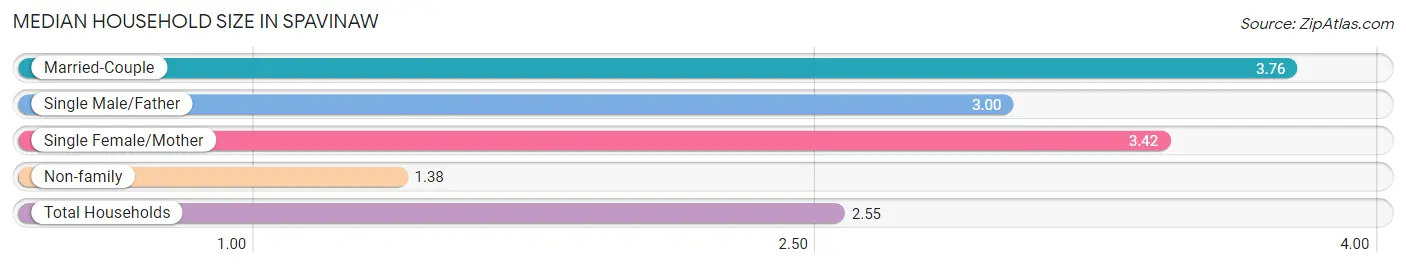
Median Household Size in Spavinaw
The median household size in Spavinaw is 2.55 persons per household, with married-couple households (55 | 33.1%) accounting for the largest median household size of 3.76 persons per household. non-family households (79 | 47.6%) represent the smallest median household size with 1.38 persons per household.
| Household Type | # Households | Household Size |
| Married-Couple | 55 (33.1%) | 3.76 |
| Single Male/Father | 6 (3.6%) | 3.00 |
| Single Female/Mother | 26 (15.7%) | 3.42 |
| Non-family | 79 (47.6%) | 1.38 |
| Total Households | 166 (100.0%) | 2.55 |
Household Size by Marriage Status in Spavinaw
Out of a total of 166 households in Spavinaw, 87 (52.4%) are family households, while 79 (47.6%) are nonfamily households. The most numerous type of family households are 2-person households, comprising 45, and the most common type of nonfamily households are 1-person households, comprising 58.
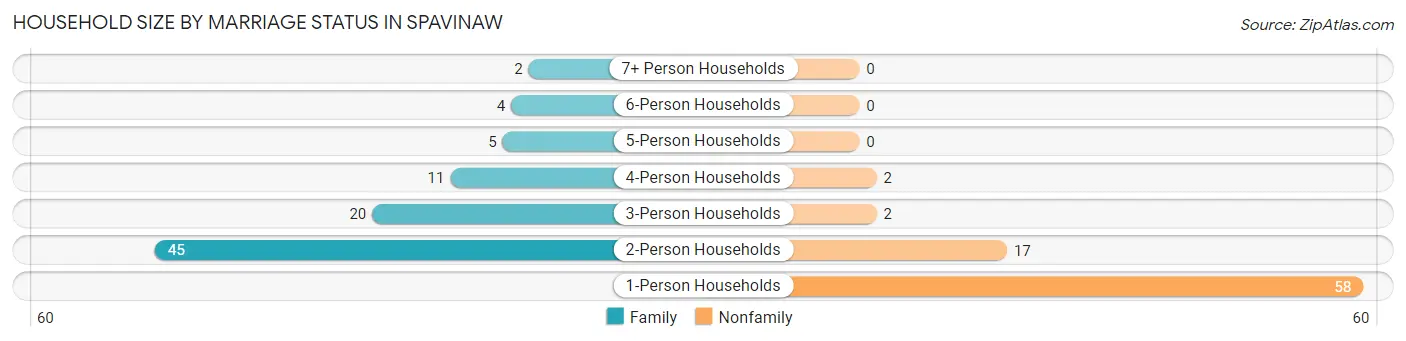
| Household Size | Family Households | Nonfamily Households |
| 1-Person Households | - | 58 (34.9%) |
| 2-Person Households | 45 (27.1%) | 17 (10.2%) |
| 3-Person Households | 20 (12.0%) | 2 (1.2%) |
| 4-Person Households | 11 (6.6%) | 2 (1.2%) |
| 5-Person Households | 5 (3.0%) | 0 (0.0%) |
| 6-Person Households | 4 (2.4%) | 0 (0.0%) |
| 7+ Person Households | 2 (1.2%) | 0 (0.0%) |
| Total | 87 (52.4%) | 79 (47.6%) |
Female Fertility in Spavinaw
Fertility by Age in Spavinaw
Average fertility rate in Spavinaw is 52.0 births per 1,000 women. Women in the age bracket of 15 to 19 years have the highest fertility rate with 400.0 births per 1,000 women. Women in the age bracket of 15 to 19 years acount for 50.0% of all women with births.
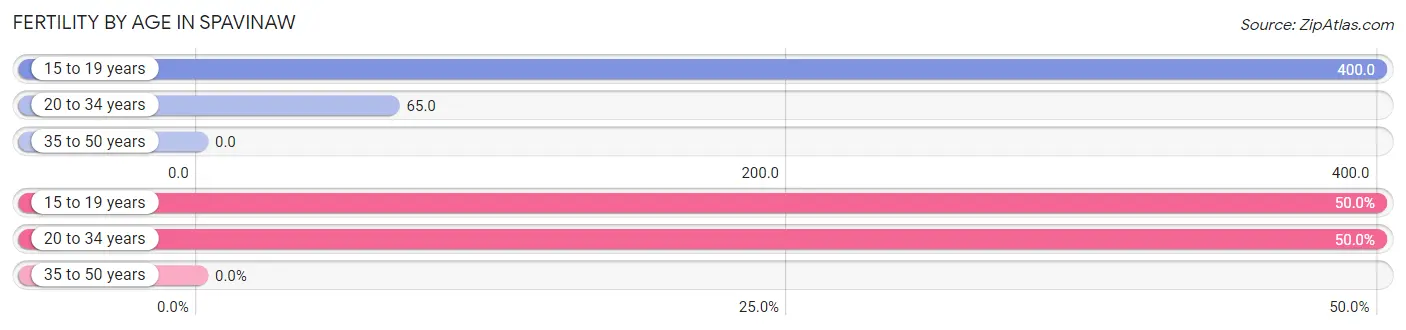
| Age Bracket | Women with Births | Births / 1,000 Women |
| 15 to 19 years | 2 (50.0%) | 400.0 |
| 20 to 34 years | 2 (50.0%) | 65.0 |
| 35 to 50 years | 0 (0.0%) | 0.0 |
| Total | 4 (100.0%) | 52.0 |
Fertility by Age by Marriage Status in Spavinaw
50.0% of women with births (4) in Spavinaw are married. The highest percentage of unmarried women with births falls into 15 to 19 years age bracket with 100.0% of them unmarried at the time of birth, while the lowest percentage of unmarried women with births belong to 20 to 34 years age bracket with 0.0% of them unmarried.
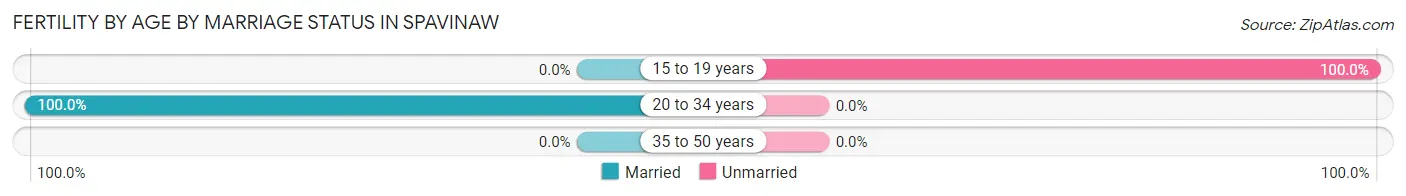
| Age Bracket | Married | Unmarried |
| 15 to 19 years | 0 (0.0%) | 2 (100.0%) |
| 20 to 34 years | 2 (100.0%) | 0 (0.0%) |
| 35 to 50 years | 0 (0.0%) | 0 (0.0%) |
| Total | 2 (50.0%) | 2 (50.0%) |
Fertility by Education in Spavinaw
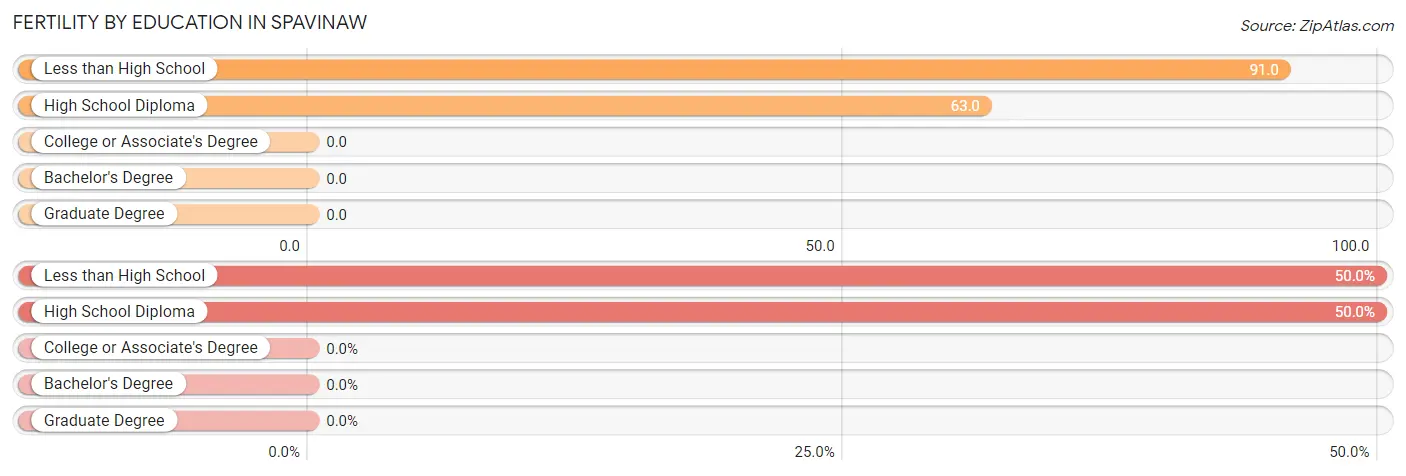
| Educational Attainment | Women with Births | Births / 1,000 Women |
| Less than High School | 2 (50.0%) | 91.0 |
| High School Diploma | 2 (50.0%) | 63.0 |
| College or Associate's Degree | 0 (0.0%) | 0.0 |
| Bachelor's Degree | 0 (0.0%) | 0.0 |
| Graduate Degree | 0 (0.0%) | 0.0 |
| Total | 4 (100.0%) | 52.0 |
Fertility by Education by Marriage Status in Spavinaw
50.0% of women with births in Spavinaw are unmarried. Women with the educational attainment of high school diploma are most likely to be married with 100.0% of them married at childbirth, while women with the educational attainment of less than high school are least likely to be married with 100.0% of them unmarried at childbirth.
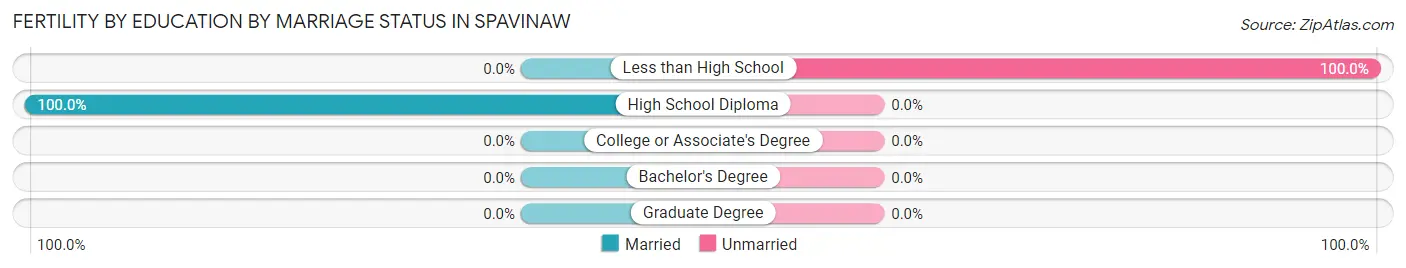
| Educational Attainment | Married | Unmarried |
| Less than High School | 0 (0.0%) | 2 (100.0%) |
| High School Diploma | 2 (100.0%) | 0 (0.0%) |
| College or Associate's Degree | 0 (0.0%) | 0 (0.0%) |
| Bachelor's Degree | 0 (0.0%) | 0 (0.0%) |
| Graduate Degree | 0 (0.0%) | 0 (0.0%) |
| Total | 2 (50.0%) | 2 (50.0%) |
Employment Characteristics in Spavinaw
Employment by Class of Employer in Spavinaw
Among the 128 employed individuals in Spavinaw, private company employees (90 | 70.3%), self-employed (not incorporated) (15 | 11.7%), and state government employees (12 | 9.4%) make up the most common classes of employment.
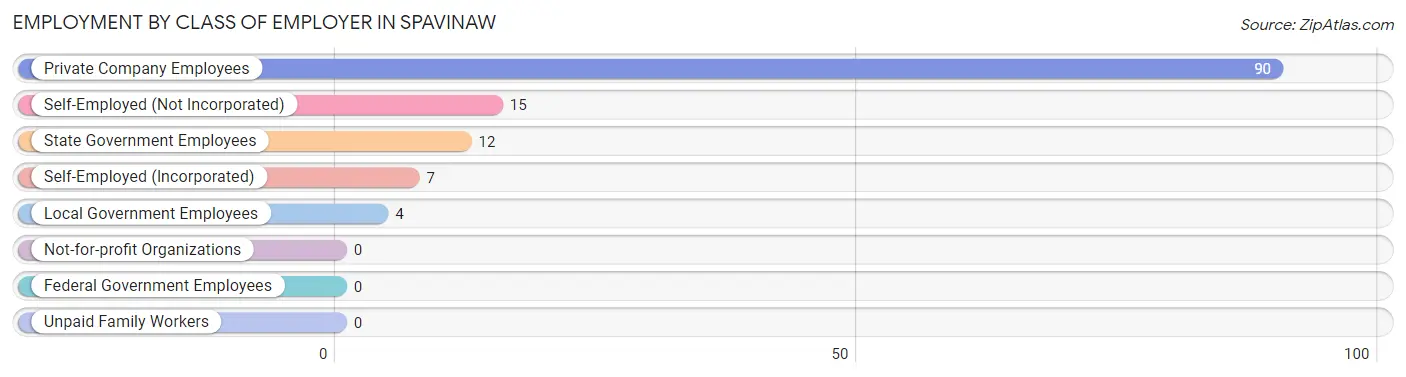
| Employer Class | # Employees | % Employees |
| Private Company Employees | 90 | 70.3% |
| Self-Employed (Incorporated) | 7 | 5.5% |
| Self-Employed (Not Incorporated) | 15 | 11.7% |
| Not-for-profit Organizations | 0 | 0.0% |
| Local Government Employees | 4 | 3.1% |
| State Government Employees | 12 | 9.4% |
| Federal Government Employees | 0 | 0.0% |
| Unpaid Family Workers | 0 | 0.0% |
| Total | 128 | 100.0% |
Employment Status by Age in Spavinaw
According to the labor force statistics for Spavinaw, out of the total population over 16 years of age (362), 38.7% or 140 individuals are in the labor force, with 7.9% or 11 of them unemployed. The age group with the highest labor force participation rate is 20 to 24 years, with 90.5% or 19 individuals in the labor force. Within the labor force, the 16 to 19 years age range has the highest percentage of unemployed individuals, with 100.0% or 1 of them being unemployed.
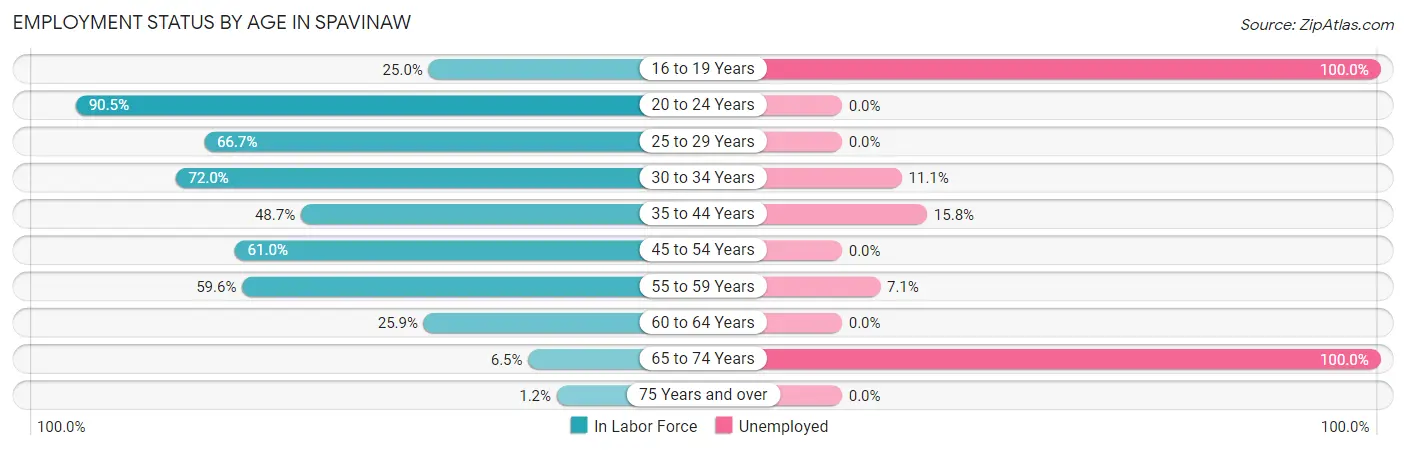
| Age Bracket | In Labor Force | Unemployed |
| 16 to 19 Years | 1 (25.0%) | 1 (100.0%) |
| 20 to 24 Years | 19 (90.5%) | 0 (0.0%) |
| 25 to 29 Years | 8 (66.7%) | 0 (0.0%) |
| 30 to 34 Years | 18 (72.0%) | 2 (11.1%) |
| 35 to 44 Years | 19 (48.7%) | 3 (15.8%) |
| 45 to 54 Years | 36 (61.0%) | 0 (0.0%) |
| 55 to 59 Years | 28 (59.6%) | 2 (7.1%) |
| 60 to 64 Years | 7 (25.9%) | 0 (0.0%) |
| 65 to 74 Years | 3 (6.5%) | 3 (100.0%) |
| 75 Years and over | 1 (1.2%) | 0 (0.0%) |
| Total | 140 (38.7%) | 11 (7.9%) |
Employment Status by Educational Attainment in Spavinaw
According to labor force statistics for Spavinaw, 55.5% of individuals (116) out of the total population between 25 and 64 years of age (209) are in the labor force, with 6.0% or 7 of them being unemployed. The group with the highest labor force participation rate are those with the educational attainment of bachelor's degree or higher, with 76.9% or 10 individuals in the labor force. Within the labor force, individuals with less than high school education have the highest percentage of unemployment, with 35.7% or 5 of them being unemployed.
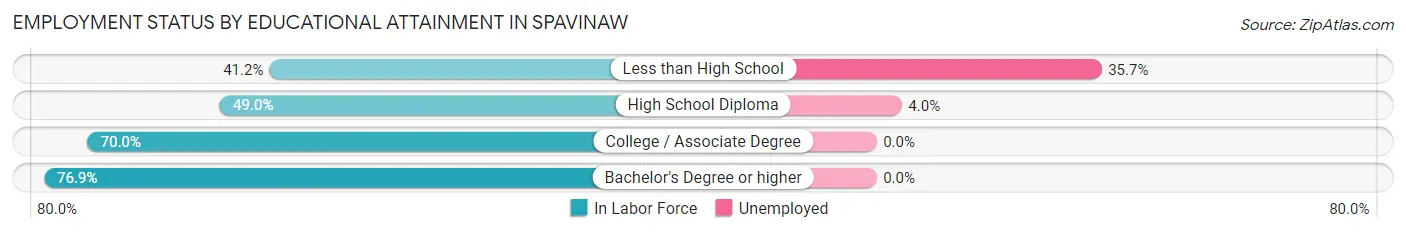
| Educational Attainment | In Labor Force | Unemployed |
| Less than High School | 14 (41.2%) | 12 (35.7%) |
| High School Diploma | 50 (49.0%) | 4 (4.0%) |
| College / Associate Degree | 42 (70.0%) | 0 (0.0%) |
| Bachelor's Degree or higher | 10 (76.9%) | 0 (0.0%) |
| Total | 116 (55.5%) | 13 (6.0%) |
Employment Occupations by Sex in Spavinaw
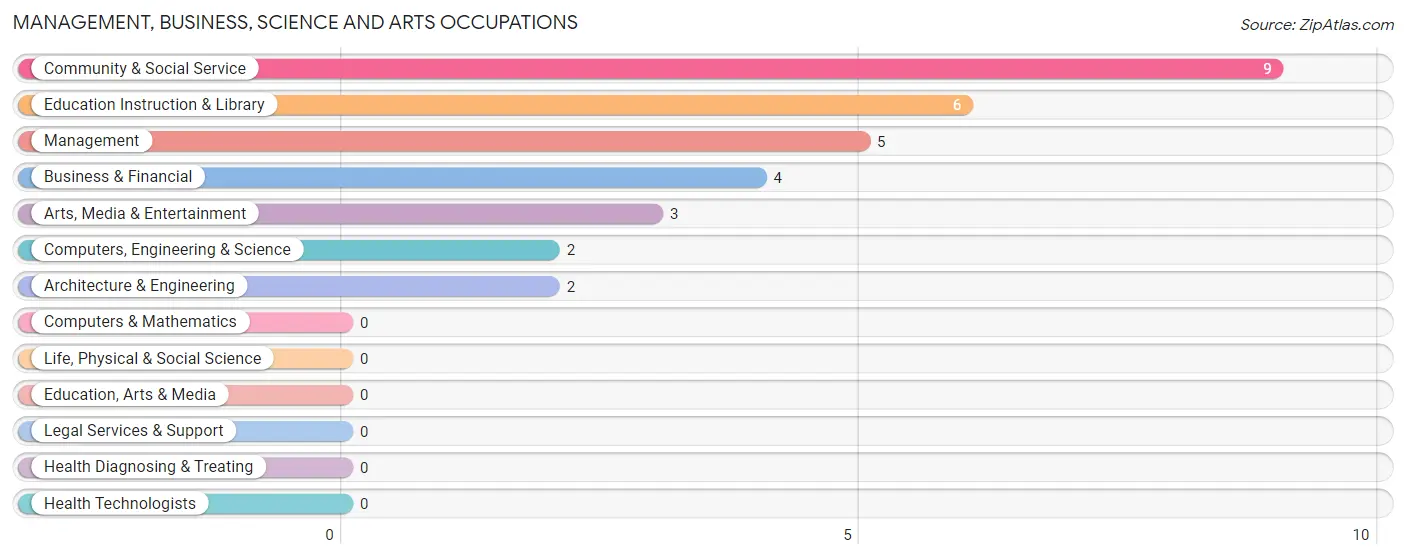
Management, Business, Science and Arts Occupations
The most common Management, Business, Science and Arts occupations in Spavinaw are Community & Social Service (9 | 7.0%), Education Instruction & Library (6 | 4.6%), Management (5 | 3.9%), Business & Financial (4 | 3.1%), and Arts, Media & Entertainment (3 | 2.3%).
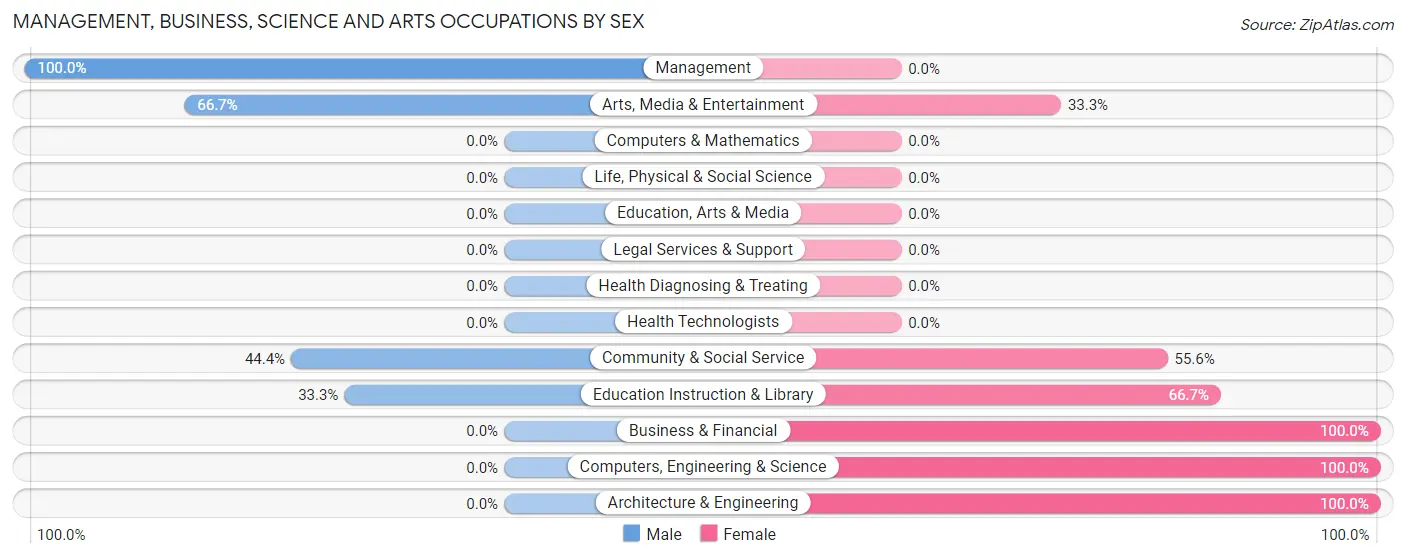
Management, Business, Science and Arts Occupations by Sex
Within the Management, Business, Science and Arts occupations in Spavinaw, the most male-oriented occupations are Management (100.0%), Arts, Media & Entertainment (66.7%), and Community & Social Service (44.4%), while the most female-oriented occupations are Business & Financial (100.0%), Computers, Engineering & Science (100.0%), and Architecture & Engineering (100.0%).
| Occupation | Male | Female |
| Management | 5 (100.0%) | 0 (0.0%) |
| Business & Financial | 0 (0.0%) | 4 (100.0%) |
| Computers, Engineering & Science | 0 (0.0%) | 2 (100.0%) |
| Computers & Mathematics | 0 (0.0%) | 0 (0.0%) |
| Architecture & Engineering | 0 (0.0%) | 2 (100.0%) |
| Life, Physical & Social Science | 0 (0.0%) | 0 (0.0%) |
| Community & Social Service | 4 (44.4%) | 5 (55.6%) |
| Education, Arts & Media | 0 (0.0%) | 0 (0.0%) |
| Legal Services & Support | 0 (0.0%) | 0 (0.0%) |
| Education Instruction & Library | 2 (33.3%) | 4 (66.7%) |
| Arts, Media & Entertainment | 2 (66.7%) | 1 (33.3%) |
| Health Diagnosing & Treating | 0 (0.0%) | 0 (0.0%) |
| Health Technologists | 0 (0.0%) | 0 (0.0%) |
| Total (Category) | 9 (45.0%) | 11 (55.0%) |
| Total (Overall) | 68 (52.7%) | 61 (47.3%) |
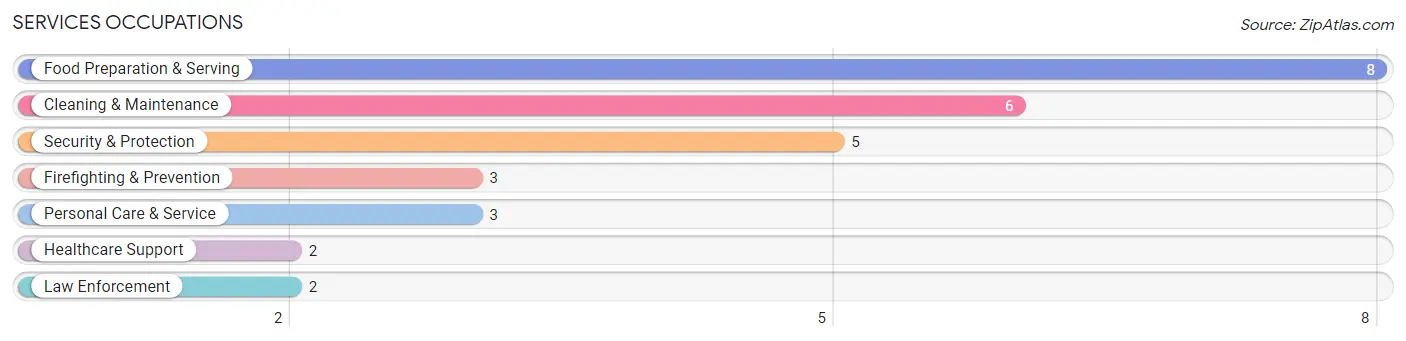
Services Occupations
The most common Services occupations in Spavinaw are Food Preparation & Serving (8 | 6.2%), Cleaning & Maintenance (6 | 4.6%), Security & Protection (5 | 3.9%), Firefighting & Prevention (3 | 2.3%), and Personal Care & Service (3 | 2.3%).
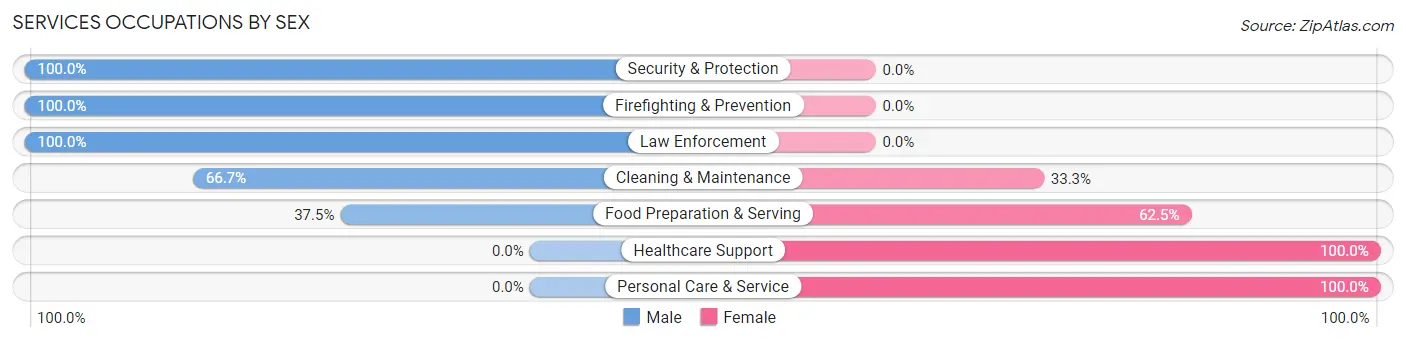
Services Occupations by Sex
Within the Services occupations in Spavinaw, the most male-oriented occupations are Security & Protection (100.0%), Firefighting & Prevention (100.0%), and Law Enforcement (100.0%), while the most female-oriented occupations are Healthcare Support (100.0%), Personal Care & Service (100.0%), and Food Preparation & Serving (62.5%).
| Occupation | Male | Female |
| Healthcare Support | 0 (0.0%) | 2 (100.0%) |
| Security & Protection | 5 (100.0%) | 0 (0.0%) |
| Firefighting & Prevention | 3 (100.0%) | 0 (0.0%) |
| Law Enforcement | 2 (100.0%) | 0 (0.0%) |
| Food Preparation & Serving | 3 (37.5%) | 5 (62.5%) |
| Cleaning & Maintenance | 4 (66.7%) | 2 (33.3%) |
| Personal Care & Service | 0 (0.0%) | 3 (100.0%) |
| Total (Category) | 12 (50.0%) | 12 (50.0%) |
| Total (Overall) | 68 (52.7%) | 61 (47.3%) |
Sales and Office Occupations
The most common Sales and Office occupations in Spavinaw are Sales & Related (19 | 14.7%), and Office & Administration (19 | 14.7%).
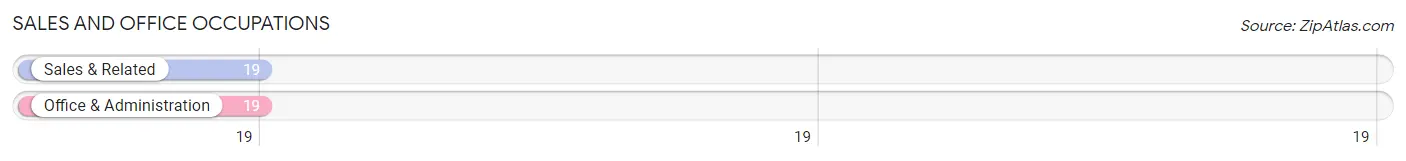
Sales and Office Occupations by Sex
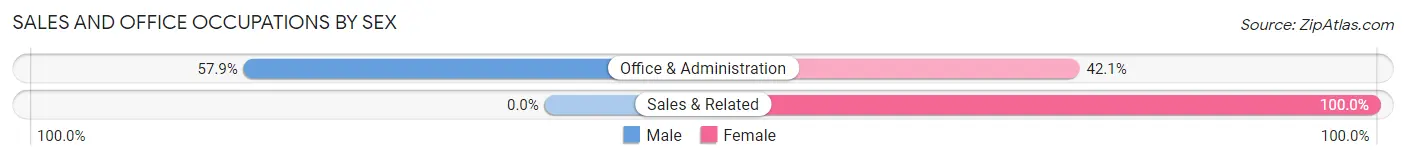
| Occupation | Male | Female |
| Sales & Related | 0 (0.0%) | 19 (100.0%) |
| Office & Administration | 11 (57.9%) | 8 (42.1%) |
| Total (Category) | 11 (28.9%) | 27 (71.1%) |
| Total (Overall) | 68 (52.7%) | 61 (47.3%) |
Natural Resources, Construction and Maintenance Occupations
The most common Natural Resources, Construction and Maintenance occupations in Spavinaw are Construction & Extraction (13 | 10.1%), Installation, Maintenance & Repair (8 | 6.2%), and Farming, Fishing & Forestry (6 | 4.6%).
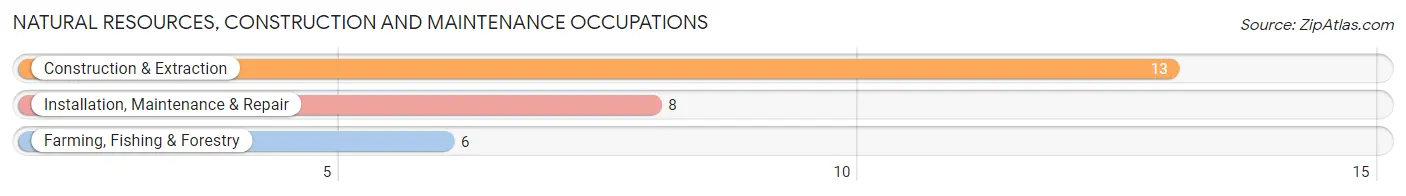
Natural Resources, Construction and Maintenance Occupations by Sex
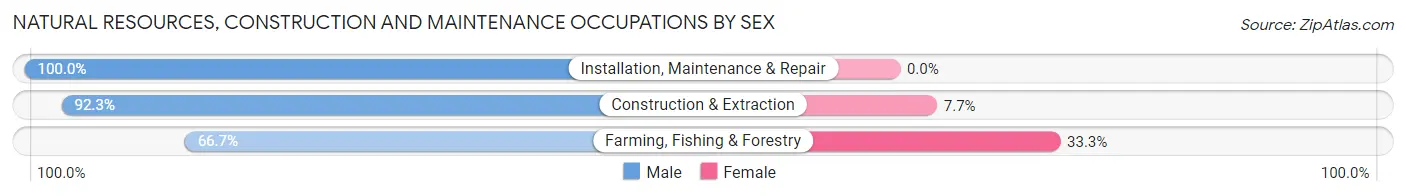
| Occupation | Male | Female |
| Farming, Fishing & Forestry | 4 (66.7%) | 2 (33.3%) |
| Construction & Extraction | 12 (92.3%) | 1 (7.7%) |
| Installation, Maintenance & Repair | 8 (100.0%) | 0 (0.0%) |
| Total (Category) | 24 (88.9%) | 3 (11.1%) |
| Total (Overall) | 68 (52.7%) | 61 (47.3%) |
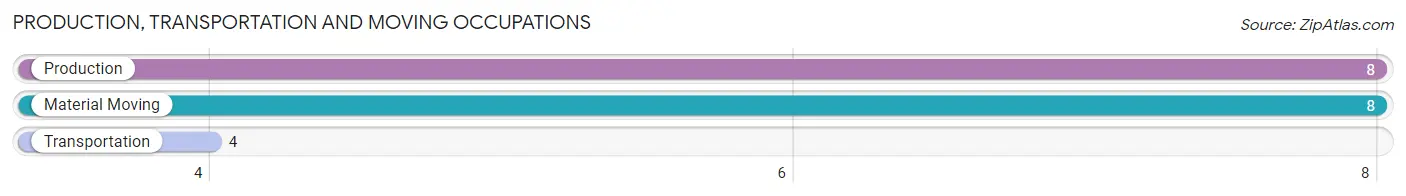
Production, Transportation and Moving Occupations
The most common Production, Transportation and Moving occupations in Spavinaw are Production (8 | 6.2%), Material Moving (8 | 6.2%), and Transportation (4 | 3.1%).
Production, Transportation and Moving Occupations by Sex
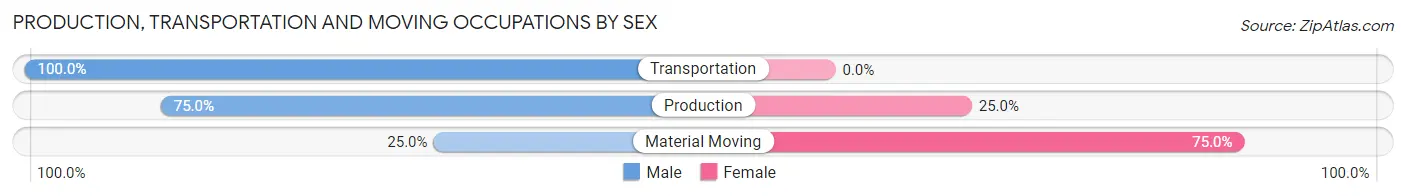
| Occupation | Male | Female |
| Production | 6 (75.0%) | 2 (25.0%) |
| Transportation | 4 (100.0%) | 0 (0.0%) |
| Material Moving | 2 (25.0%) | 6 (75.0%) |
| Total (Category) | 12 (60.0%) | 8 (40.0%) |
| Total (Overall) | 68 (52.7%) | 61 (47.3%) |
Employment Industries by Sex in Spavinaw
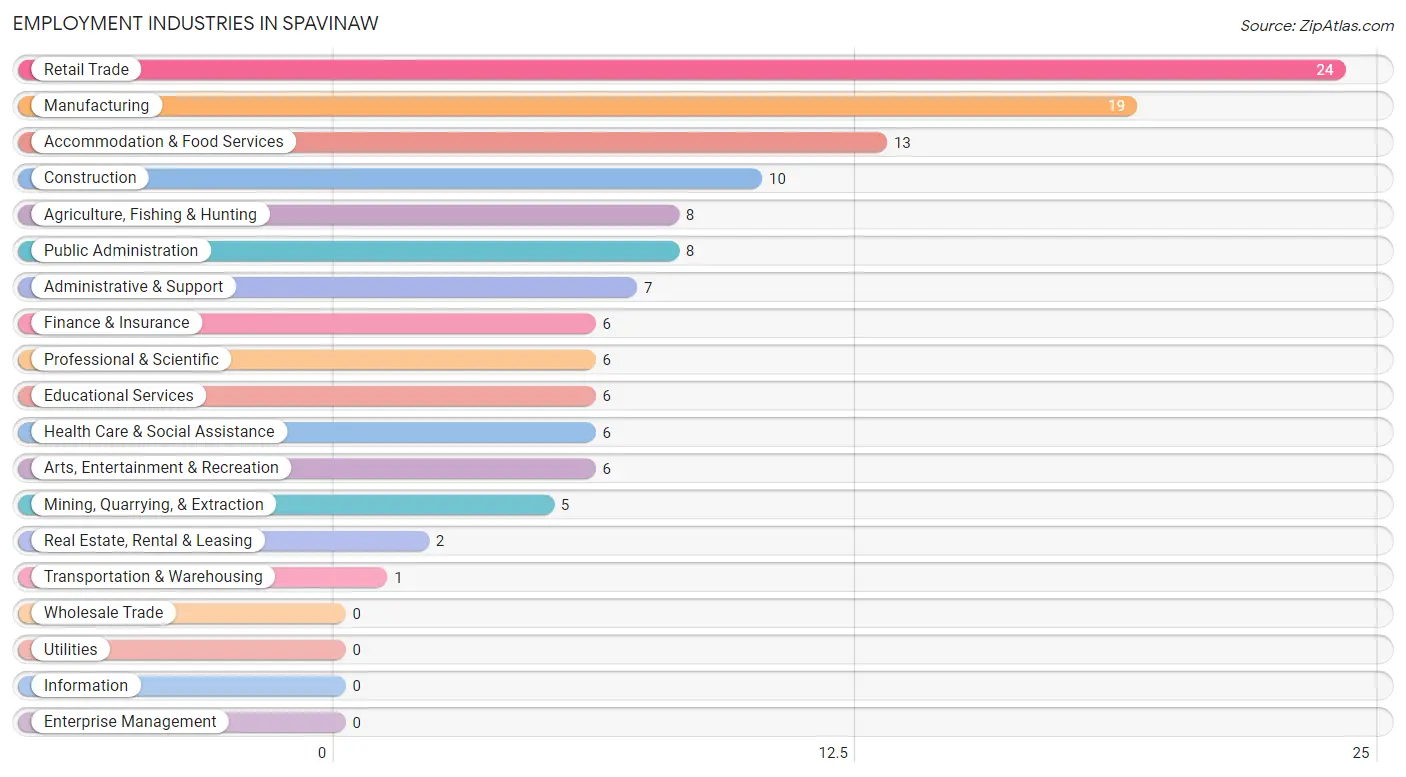
Employment Industries in Spavinaw
The major employment industries in Spavinaw include Retail Trade (24 | 18.6%), Manufacturing (19 | 14.7%), Accommodation & Food Services (13 | 10.1%), Construction (10 | 7.7%), and Agriculture, Fishing & Hunting (8 | 6.2%).
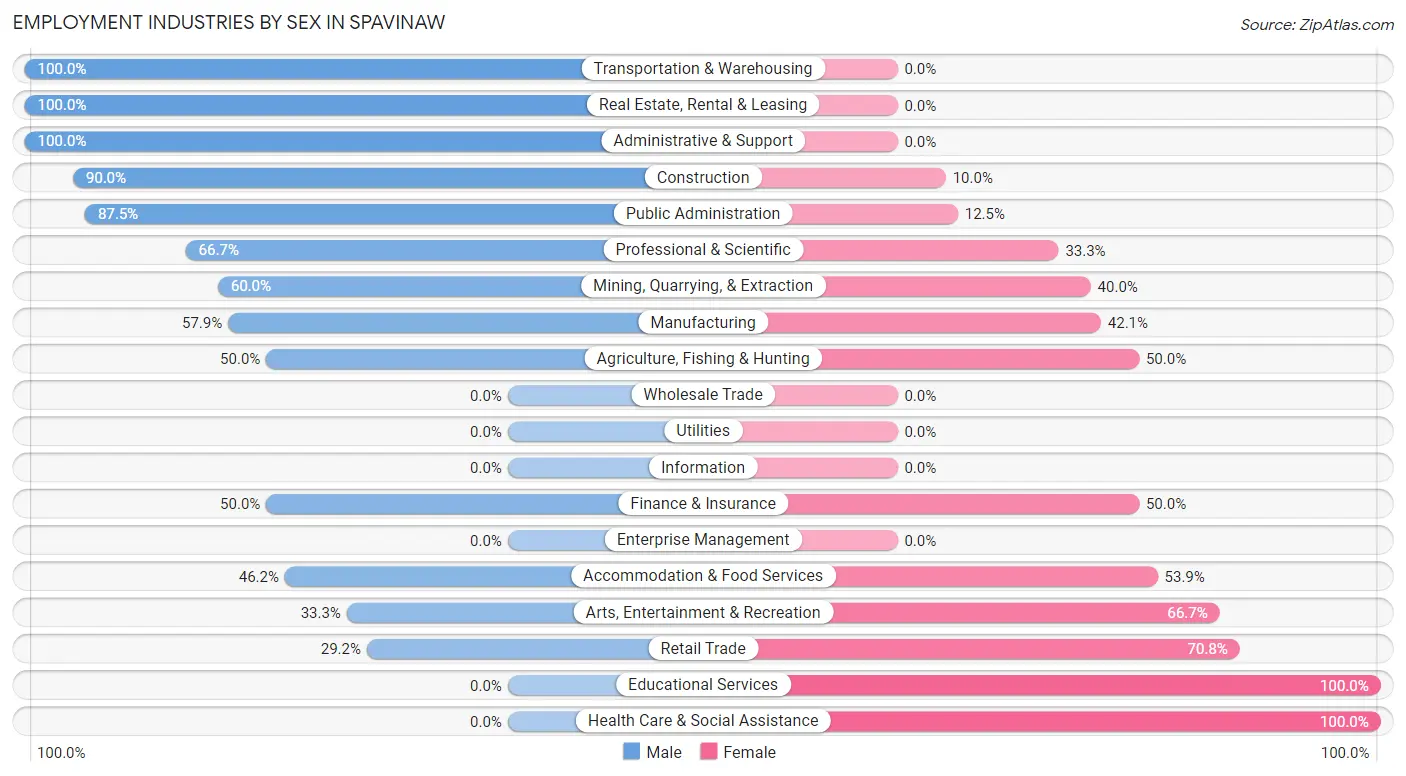
Employment Industries by Sex in Spavinaw
The Spavinaw industries that see more men than women are Transportation & Warehousing (100.0%), Real Estate, Rental & Leasing (100.0%), and Administrative & Support (100.0%), whereas the industries that tend to have a higher number of women are Educational Services (100.0%), Health Care & Social Assistance (100.0%), and Retail Trade (70.8%).
| Industry | Male | Female |
| Agriculture, Fishing & Hunting | 4 (50.0%) | 4 (50.0%) |
| Mining, Quarrying, & Extraction | 3 (60.0%) | 2 (40.0%) |
| Construction | 9 (90.0%) | 1 (10.0%) |
| Manufacturing | 11 (57.9%) | 8 (42.1%) |
| Wholesale Trade | 0 (0.0%) | 0 (0.0%) |
| Retail Trade | 7 (29.2%) | 17 (70.8%) |
| Transportation & Warehousing | 1 (100.0%) | 0 (0.0%) |
| Utilities | 0 (0.0%) | 0 (0.0%) |
| Information | 0 (0.0%) | 0 (0.0%) |
| Finance & Insurance | 3 (50.0%) | 3 (50.0%) |
| Real Estate, Rental & Leasing | 2 (100.0%) | 0 (0.0%) |
| Professional & Scientific | 4 (66.7%) | 2 (33.3%) |
| Enterprise Management | 0 (0.0%) | 0 (0.0%) |
| Administrative & Support | 7 (100.0%) | 0 (0.0%) |
| Educational Services | 0 (0.0%) | 6 (100.0%) |
| Health Care & Social Assistance | 0 (0.0%) | 6 (100.0%) |
| Arts, Entertainment & Recreation | 2 (33.3%) | 4 (66.7%) |
| Accommodation & Food Services | 6 (46.2%) | 7 (53.8%) |
| Public Administration | 7 (87.5%) | 1 (12.5%) |
| Total | 68 (52.7%) | 61 (47.3%) |
Education in Spavinaw
School Enrollment in Spavinaw
The most common levels of schooling among the 50 students in Spavinaw are elementary school (16 | 32.0%), middle school (16 | 32.0%), and nursery / preschool (7 | 14.0%).
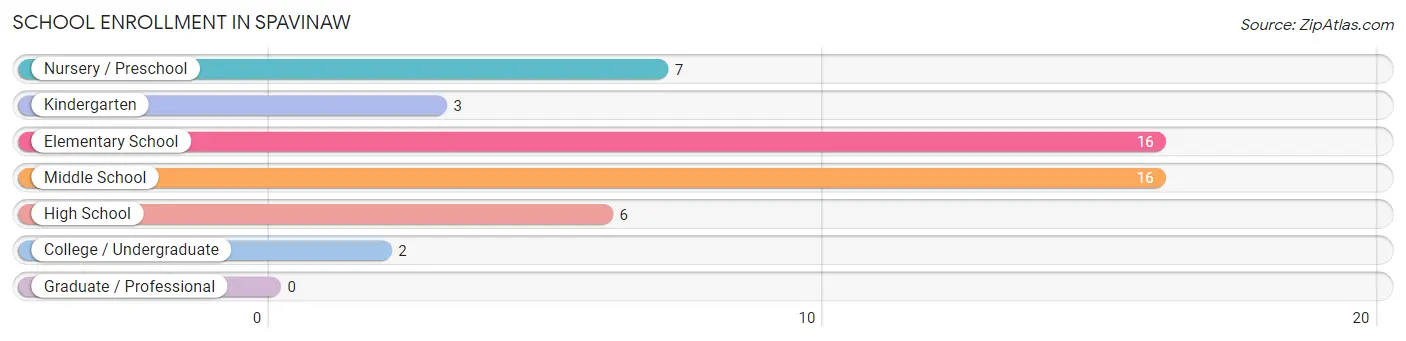
| School Level | # Students | % Students |
| Nursery / Preschool | 7 | 14.0% |
| Kindergarten | 3 | 6.0% |
| Elementary School | 16 | 32.0% |
| Middle School | 16 | 32.0% |
| High School | 6 | 12.0% |
| College / Undergraduate | 2 | 4.0% |
| Graduate / Professional | 0 | 0.0% |
| Total | 50 | 100.0% |
School Enrollment by Age by Funding Source in Spavinaw
Out of a total of 50 students who are enrolled in schools in Spavinaw, 11 (22.0%) attend a private institution, while the remaining 39 (78.0%) are enrolled in public schools. The age group of 5 to 9 year old has the highest likelihood of being enrolled in private schools, with 6 (33.3% in the age bracket) enrolled. Conversely, the age group of 3 to 4 year olds has the lowest likelihood of being enrolled in a private school, with 6 (100.0% in the age bracket) attending a public institution.
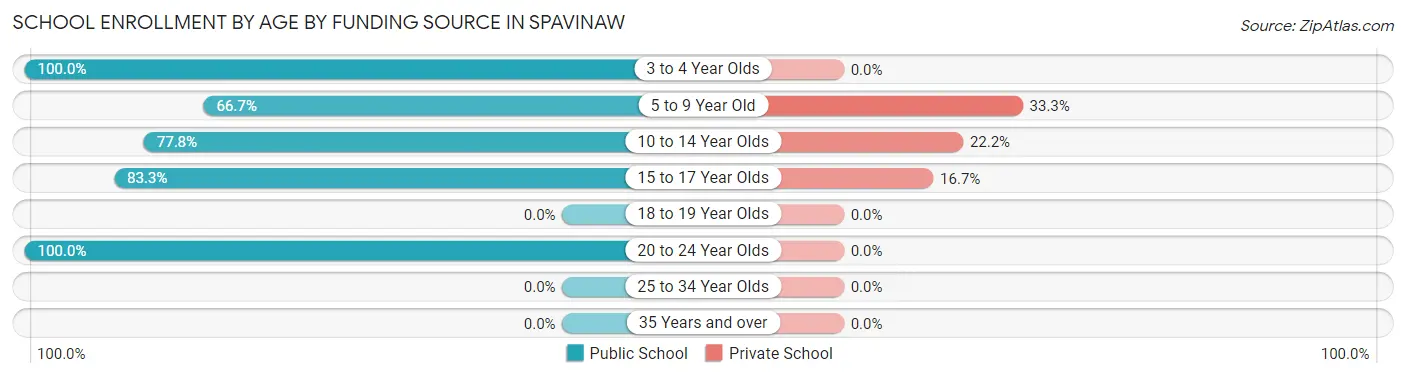
| Age Bracket | Public School | Private School |
| 3 to 4 Year Olds | 6 (100.0%) | 0 (0.0%) |
| 5 to 9 Year Old | 12 (66.7%) | 6 (33.3%) |
| 10 to 14 Year Olds | 14 (77.8%) | 4 (22.2%) |
| 15 to 17 Year Olds | 5 (83.3%) | 1 (16.7%) |
| 18 to 19 Year Olds | 0 (0.0%) | 0 (0.0%) |
| 20 to 24 Year Olds | 2 (100.0%) | 0 (0.0%) |
| 25 to 34 Year Olds | 0 (0.0%) | 0 (0.0%) |
| 35 Years and over | 0 (0.0%) | 0 (0.0%) |
| Total | 39 (78.0%) | 11 (22.0%) |
Educational Attainment by Field of Study in Spavinaw
Education (9 | 42.9%), arts & humanities (5 | 23.8%), physical & health sciences (3 | 14.3%), business (3 | 14.3%), and visual & performing arts (1 | 4.8%) are the most common fields of study among 21 individuals in Spavinaw who have obtained a bachelor's degree or higher.
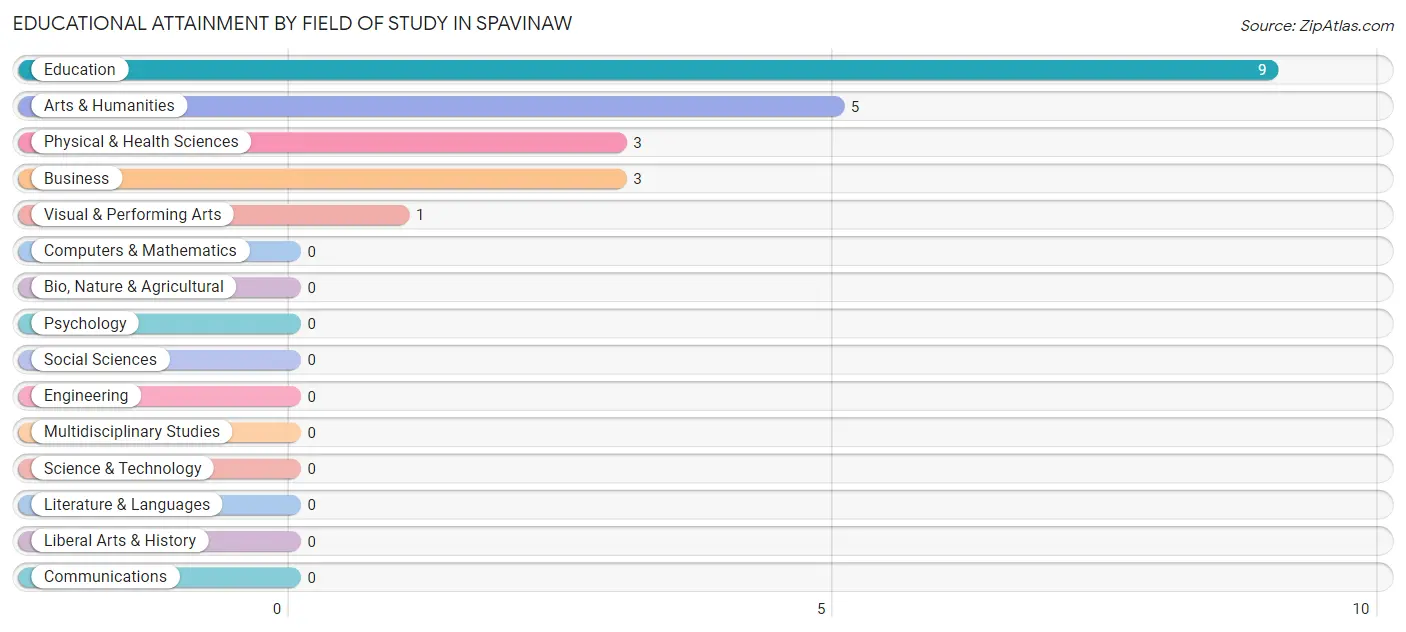
| Field of Study | # Graduates | % Graduates |
| Computers & Mathematics | 0 | 0.0% |
| Bio, Nature & Agricultural | 0 | 0.0% |
| Physical & Health Sciences | 3 | 14.3% |
| Psychology | 0 | 0.0% |
| Social Sciences | 0 | 0.0% |
| Engineering | 0 | 0.0% |
| Multidisciplinary Studies | 0 | 0.0% |
| Science & Technology | 0 | 0.0% |
| Business | 3 | 14.3% |
| Education | 9 | 42.9% |
| Literature & Languages | 0 | 0.0% |
| Liberal Arts & History | 0 | 0.0% |
| Visual & Performing Arts | 1 | 4.8% |
| Communications | 0 | 0.0% |
| Arts & Humanities | 5 | 23.8% |
| Total | 21 | 100.0% |
Transportation & Commute in Spavinaw
Vehicle Availability by Sex in Spavinaw
The most prevalent vehicle ownership categories in Spavinaw are males with 2 vehicles (35, accounting for 52.2%) and females with 2 vehicles (24, making up 57.4%).
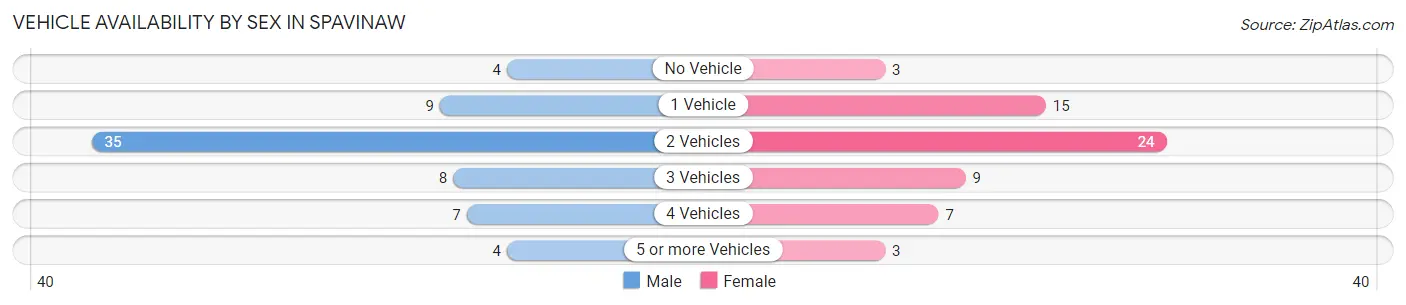
| Vehicles Available | Male | Female |
| No Vehicle | 4 (6.0%) | 3 (4.9%) |
| 1 Vehicle | 9 (13.4%) | 15 (24.6%) |
| 2 Vehicles | 35 (52.2%) | 24 (39.3%) |
| 3 Vehicles | 8 (11.9%) | 9 (14.7%) |
| 4 Vehicles | 7 (10.4%) | 7 (11.5%) |
| 5 or more Vehicles | 4 (6.0%) | 3 (4.9%) |
| Total | 67 (100.0%) | 61 (100.0%) |
Commute Time in Spavinaw
The most frequently occuring commute durations in Spavinaw are 10 to 14 minutes (29 commuters, 23.8%), 30 to 34 minutes (20 commuters, 16.4%), and 15 to 19 minutes (12 commuters, 9.8%).
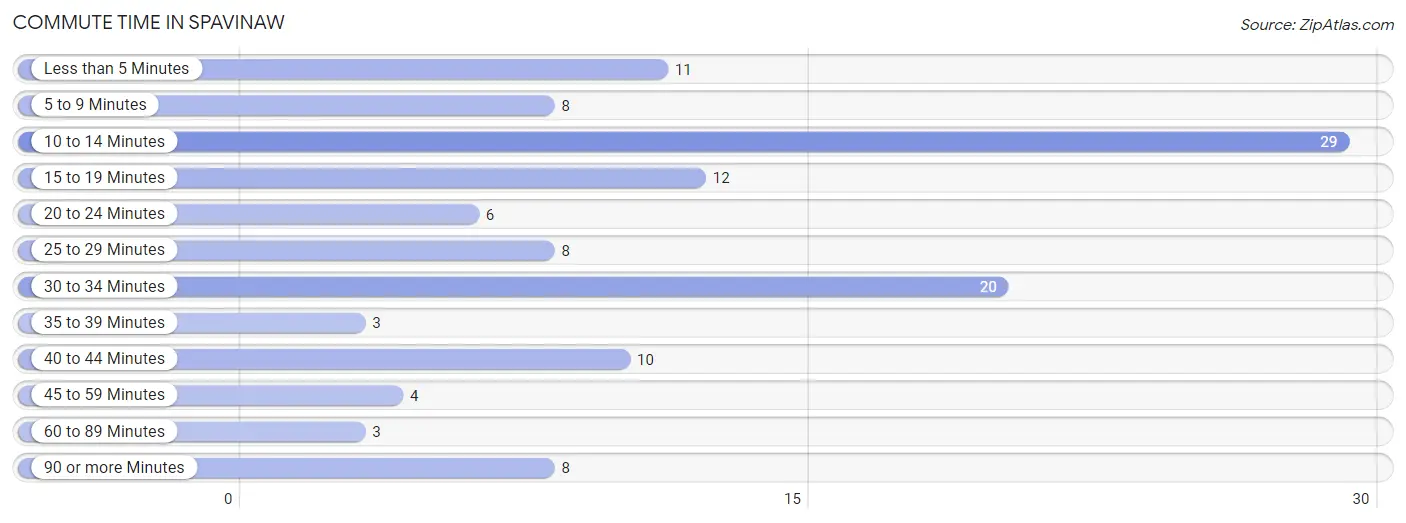
| Commute Time | # Commuters | % Commuters |
| Less than 5 Minutes | 11 | 9.0% |
| 5 to 9 Minutes | 8 | 6.6% |
| 10 to 14 Minutes | 29 | 23.8% |
| 15 to 19 Minutes | 12 | 9.8% |
| 20 to 24 Minutes | 6 | 4.9% |
| 25 to 29 Minutes | 8 | 6.6% |
| 30 to 34 Minutes | 20 | 16.4% |
| 35 to 39 Minutes | 3 | 2.5% |
| 40 to 44 Minutes | 10 | 8.2% |
| 45 to 59 Minutes | 4 | 3.3% |
| 60 to 89 Minutes | 3 | 2.5% |
| 90 or more Minutes | 8 | 6.6% |
Commute Time by Sex in Spavinaw
The most common commute times in Spavinaw are 30 to 34 minutes (15 commuters, 23.8%) for males and 10 to 14 minutes (22 commuters, 37.3%) for females.
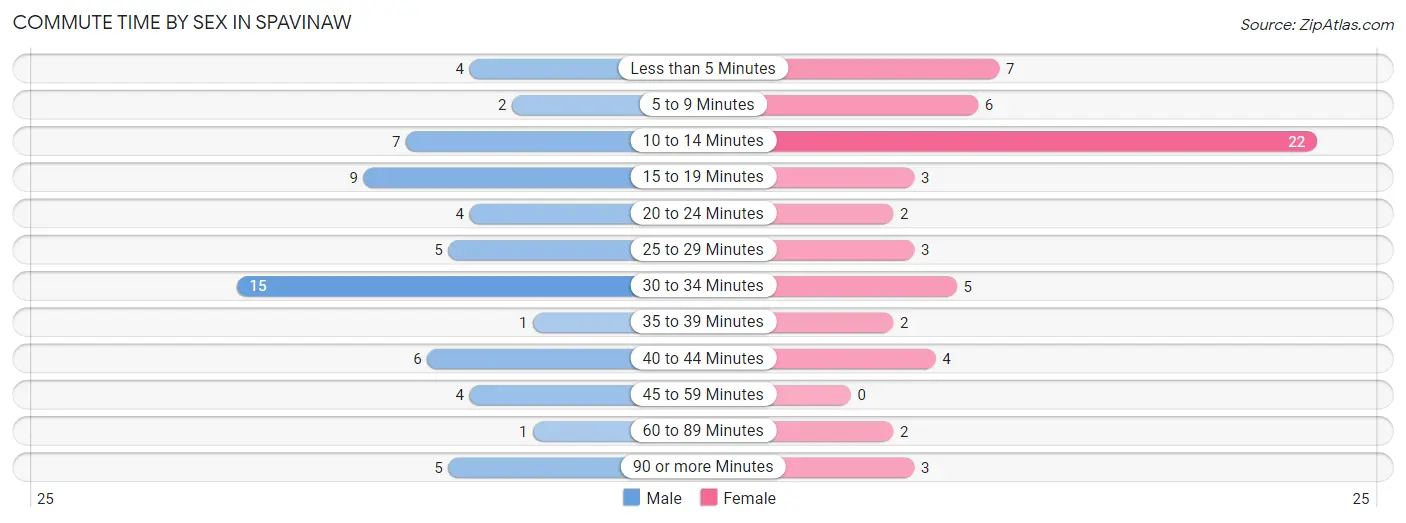
| Commute Time | Male | Female |
| Less than 5 Minutes | 4 (6.4%) | 7 (11.9%) |
| 5 to 9 Minutes | 2 (3.2%) | 6 (10.2%) |
| 10 to 14 Minutes | 7 (11.1%) | 22 (37.3%) |
| 15 to 19 Minutes | 9 (14.3%) | 3 (5.1%) |
| 20 to 24 Minutes | 4 (6.4%) | 2 (3.4%) |
| 25 to 29 Minutes | 5 (7.9%) | 3 (5.1%) |
| 30 to 34 Minutes | 15 (23.8%) | 5 (8.5%) |
| 35 to 39 Minutes | 1 (1.6%) | 2 (3.4%) |
| 40 to 44 Minutes | 6 (9.5%) | 4 (6.8%) |
| 45 to 59 Minutes | 4 (6.4%) | 0 (0.0%) |
| 60 to 89 Minutes | 1 (1.6%) | 2 (3.4%) |
| 90 or more Minutes | 5 (7.9%) | 3 (5.1%) |
Time of Departure to Work by Sex in Spavinaw
The most frequent times of departure to work in Spavinaw are 6:30 AM to 6:59 AM (14, 22.2%) for males and 5:30 AM to 5:59 AM (15, 25.4%) for females.
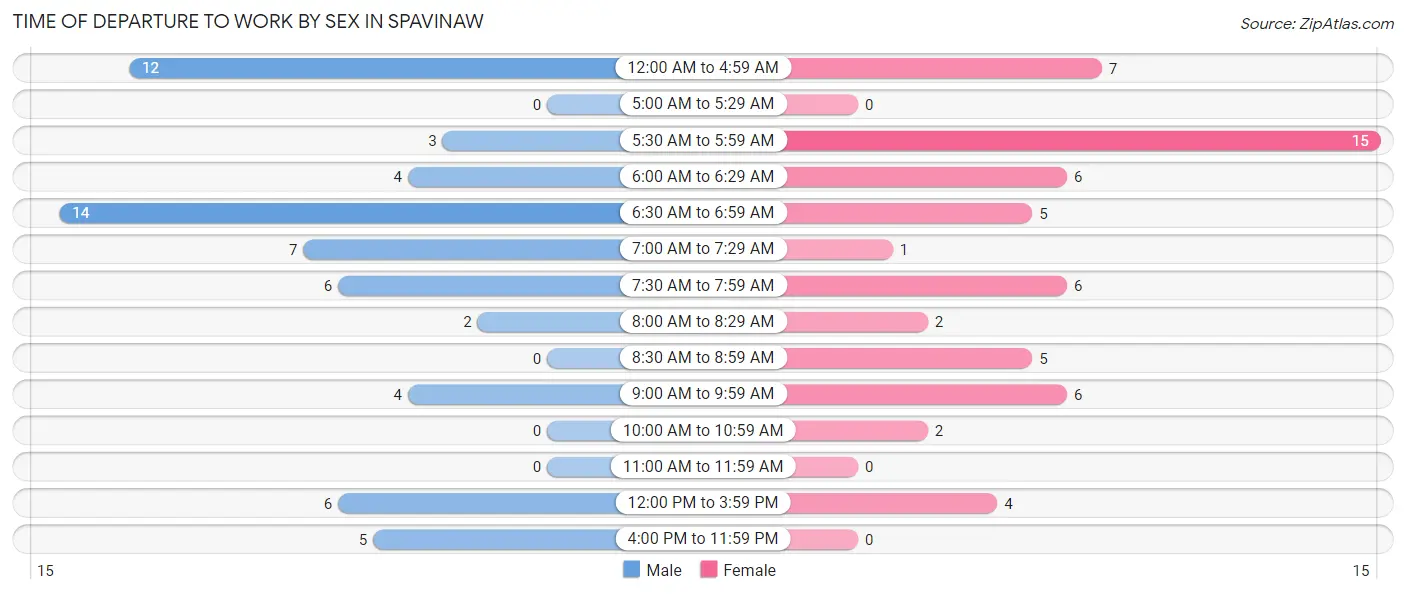
| Time of Departure | Male | Female |
| 12:00 AM to 4:59 AM | 12 (19.1%) | 7 (11.9%) |
| 5:00 AM to 5:29 AM | 0 (0.0%) | 0 (0.0%) |
| 5:30 AM to 5:59 AM | 3 (4.8%) | 15 (25.4%) |
| 6:00 AM to 6:29 AM | 4 (6.4%) | 6 (10.2%) |
| 6:30 AM to 6:59 AM | 14 (22.2%) | 5 (8.5%) |
| 7:00 AM to 7:29 AM | 7 (11.1%) | 1 (1.7%) |
| 7:30 AM to 7:59 AM | 6 (9.5%) | 6 (10.2%) |
| 8:00 AM to 8:29 AM | 2 (3.2%) | 2 (3.4%) |
| 8:30 AM to 8:59 AM | 0 (0.0%) | 5 (8.5%) |
| 9:00 AM to 9:59 AM | 4 (6.4%) | 6 (10.2%) |
| 10:00 AM to 10:59 AM | 0 (0.0%) | 2 (3.4%) |
| 11:00 AM to 11:59 AM | 0 (0.0%) | 0 (0.0%) |
| 12:00 PM to 3:59 PM | 6 (9.5%) | 4 (6.8%) |
| 4:00 PM to 11:59 PM | 5 (7.9%) | 0 (0.0%) |
| Total | 63 (100.0%) | 59 (100.0%) |
Housing Occupancy in Spavinaw
Occupancy by Ownership in Spavinaw
Of the total 166 dwellings in Spavinaw, owner-occupied units account for 116 (69.9%), while renter-occupied units make up 50 (30.1%).
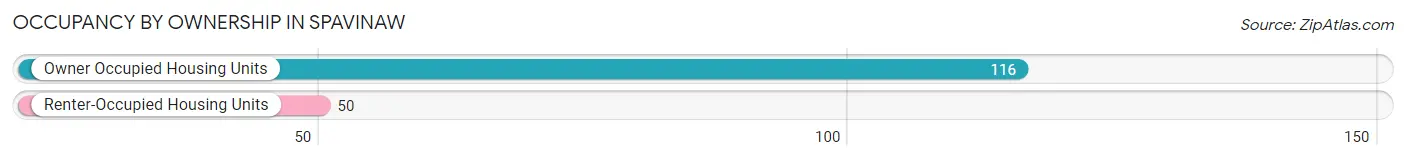
| Occupancy | # Housing Units | % Housing Units |
| Owner Occupied Housing Units | 116 | 69.9% |
| Renter-Occupied Housing Units | 50 | 30.1% |
| Total Occupied Housing Units | 166 | 100.0% |
Occupancy by Household Size in Spavinaw
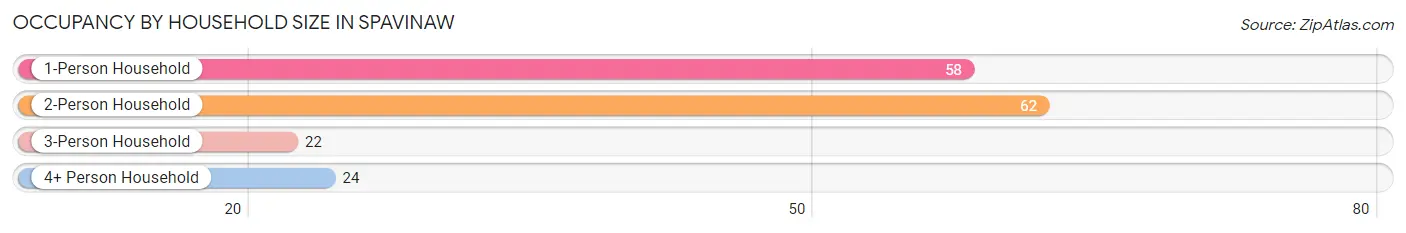
| Household Size | # Housing Units | % Housing Units |
| 1-Person Household | 58 | 34.9% |
| 2-Person Household | 62 | 37.3% |
| 3-Person Household | 22 | 13.3% |
| 4+ Person Household | 24 | 14.5% |
| Total Housing Units | 166 | 100.0% |
Occupancy by Ownership by Household Size in Spavinaw
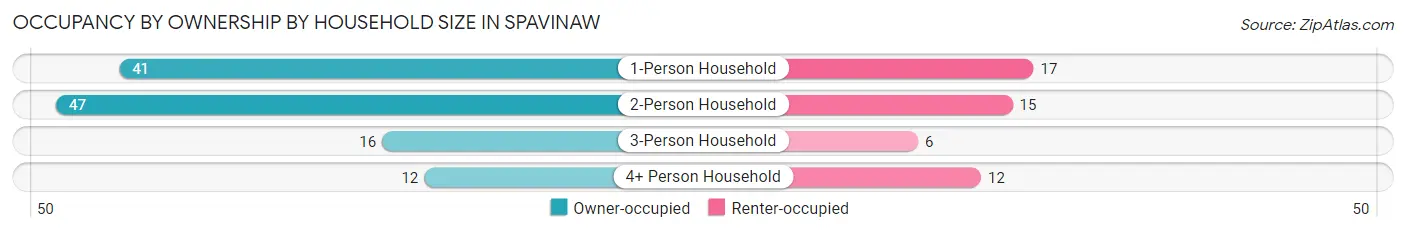
| Household Size | Owner-occupied | Renter-occupied |
| 1-Person Household | 41 (70.7%) | 17 (29.3%) |
| 2-Person Household | 47 (75.8%) | 15 (24.2%) |
| 3-Person Household | 16 (72.7%) | 6 (27.3%) |
| 4+ Person Household | 12 (50.0%) | 12 (50.0%) |
| Total Housing Units | 116 (69.9%) | 50 (30.1%) |
Occupancy by Educational Attainment in Spavinaw
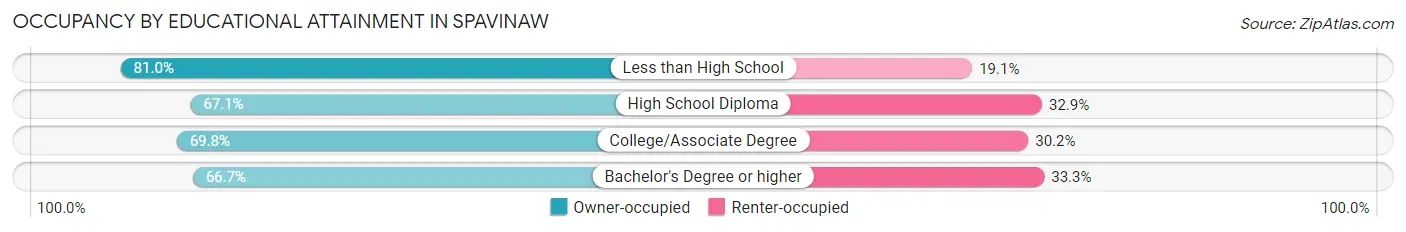
| Household Size | Owner-occupied | Renter-occupied |
| Less than High School | 17 (80.9%) | 4 (19.1%) |
| High School Diploma | 51 (67.1%) | 25 (32.9%) |
| College/Associate Degree | 44 (69.8%) | 19 (30.2%) |
| Bachelor's Degree or higher | 4 (66.7%) | 2 (33.3%) |
Occupancy by Age of Householder in Spavinaw
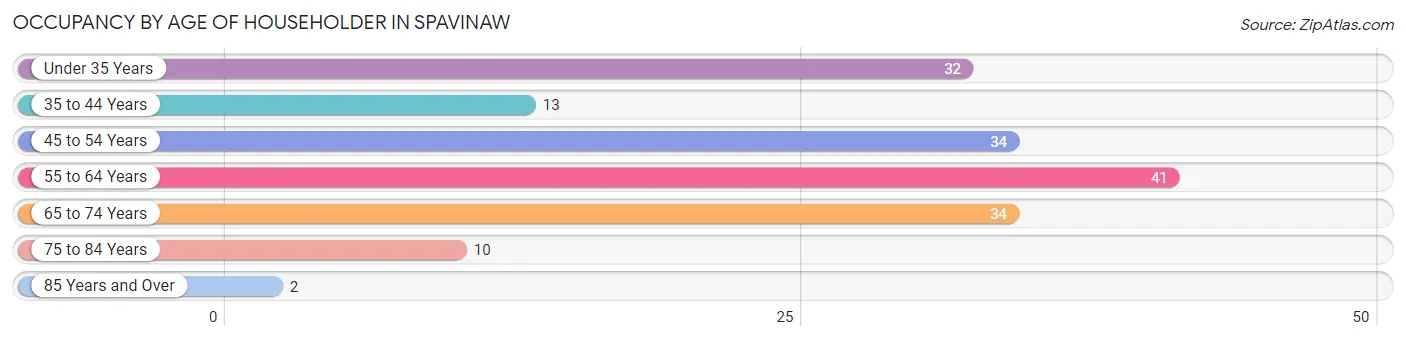
| Age Bracket | # Households | % Households |
| Under 35 Years | 32 | 19.3% |
| 35 to 44 Years | 13 | 7.8% |
| 45 to 54 Years | 34 | 20.5% |
| 55 to 64 Years | 41 | 24.7% |
| 65 to 74 Years | 34 | 20.5% |
| 75 to 84 Years | 10 | 6.0% |
| 85 Years and Over | 2 | 1.2% |
| Total | 166 | 100.0% |
Housing Finances in Spavinaw
Median Income by Occupancy in Spavinaw
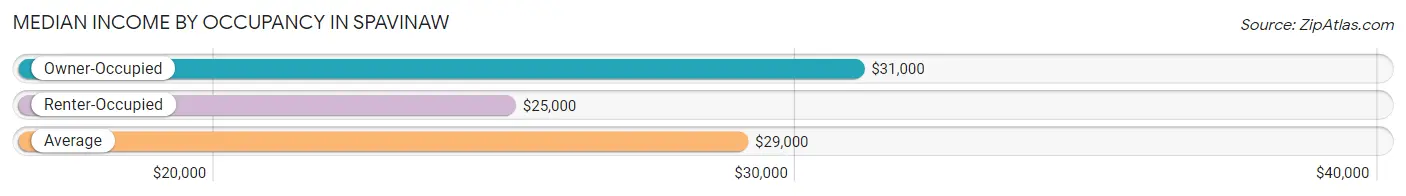
| Occupancy Type | # Households | Median Income |
| Owner-Occupied | 116 (69.9%) | $31,000 |
| Renter-Occupied | 50 (30.1%) | $25,000 |
| Average | 166 (100.0%) | $29,000 |
Occupancy by Householder Income Bracket in Spavinaw
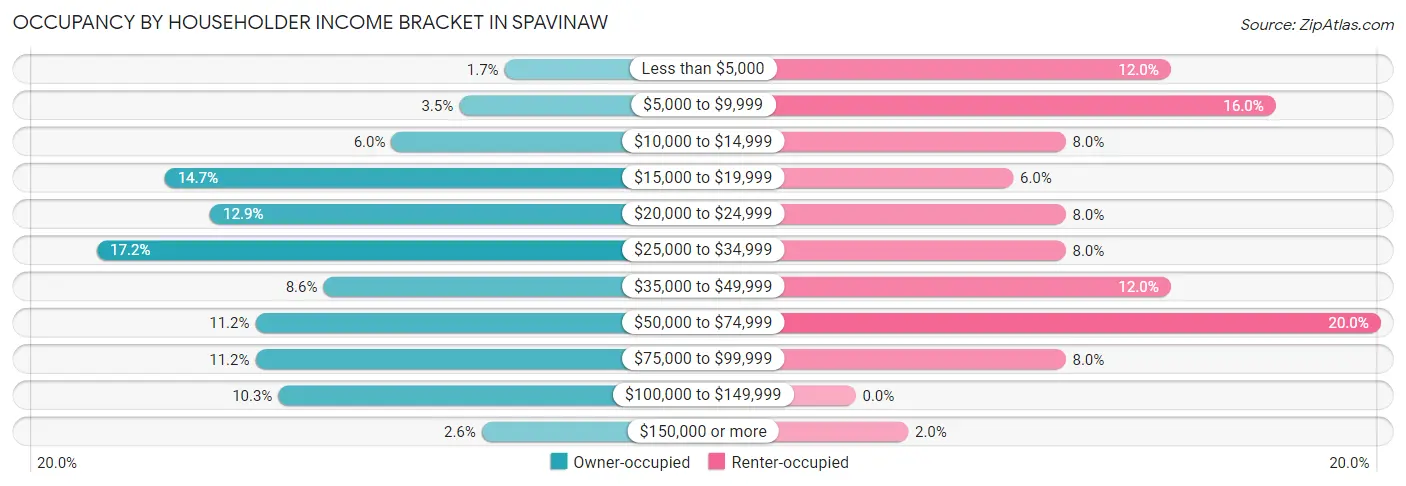
| Income Bracket | Owner-occupied | Renter-occupied |
| Less than $5,000 | 2 (1.7%) | 6 (12.0%) |
| $5,000 to $9,999 | 4 (3.5%) | 8 (16.0%) |
| $10,000 to $14,999 | 7 (6.0%) | 4 (8.0%) |
| $15,000 to $19,999 | 17 (14.7%) | 3 (6.0%) |
| $20,000 to $24,999 | 15 (12.9%) | 4 (8.0%) |
| $25,000 to $34,999 | 20 (17.2%) | 4 (8.0%) |
| $35,000 to $49,999 | 10 (8.6%) | 6 (12.0%) |
| $50,000 to $74,999 | 13 (11.2%) | 10 (20.0%) |
| $75,000 to $99,999 | 13 (11.2%) | 4 (8.0%) |
| $100,000 to $149,999 | 12 (10.3%) | 0 (0.0%) |
| $150,000 or more | 3 (2.6%) | 1 (2.0%) |
| Total | 116 (100.0%) | 50 (100.0%) |
Monthly Housing Cost Tiers in Spavinaw
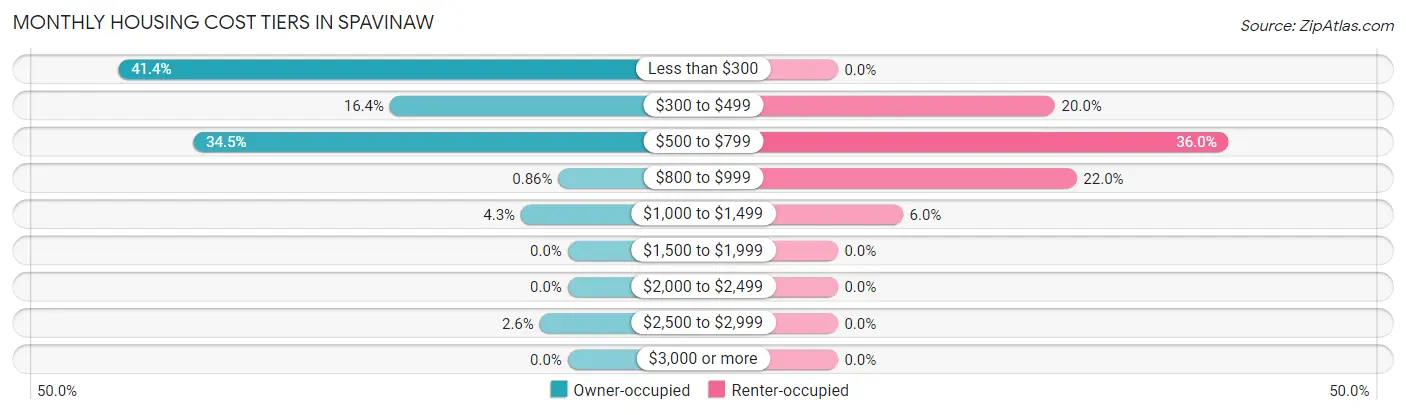
| Monthly Cost | Owner-occupied | Renter-occupied |
| Less than $300 | 48 (41.4%) | 0 (0.0%) |
| $300 to $499 | 19 (16.4%) | 10 (20.0%) |
| $500 to $799 | 40 (34.5%) | 18 (36.0%) |
| $800 to $999 | 1 (0.9%) | 11 (22.0%) |
| $1,000 to $1,499 | 5 (4.3%) | 3 (6.0%) |
| $1,500 to $1,999 | 0 (0.0%) | 0 (0.0%) |
| $2,000 to $2,499 | 0 (0.0%) | 0 (0.0%) |
| $2,500 to $2,999 | 3 (2.6%) | 0 (0.0%) |
| $3,000 or more | 0 (0.0%) | 0 (0.0%) |
| Total | 116 (100.0%) | 50 (100.0%) |
Physical Housing Characteristics in Spavinaw
Housing Structures in Spavinaw
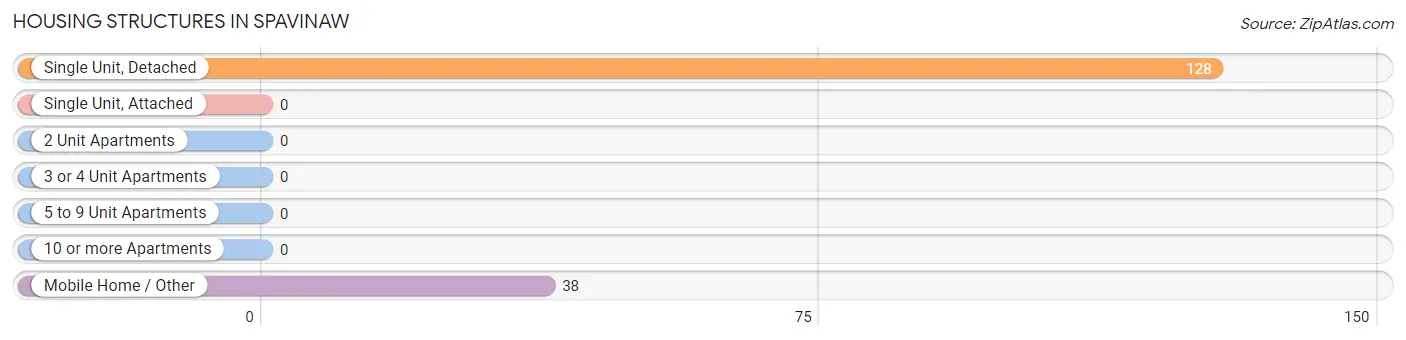
| Structure Type | # Housing Units | % Housing Units |
| Single Unit, Detached | 128 | 77.1% |
| Single Unit, Attached | 0 | 0.0% |
| 2 Unit Apartments | 0 | 0.0% |
| 3 or 4 Unit Apartments | 0 | 0.0% |
| 5 to 9 Unit Apartments | 0 | 0.0% |
| 10 or more Apartments | 0 | 0.0% |
| Mobile Home / Other | 38 | 22.9% |
| Total | 166 | 100.0% |
Housing Structures by Occupancy in Spavinaw
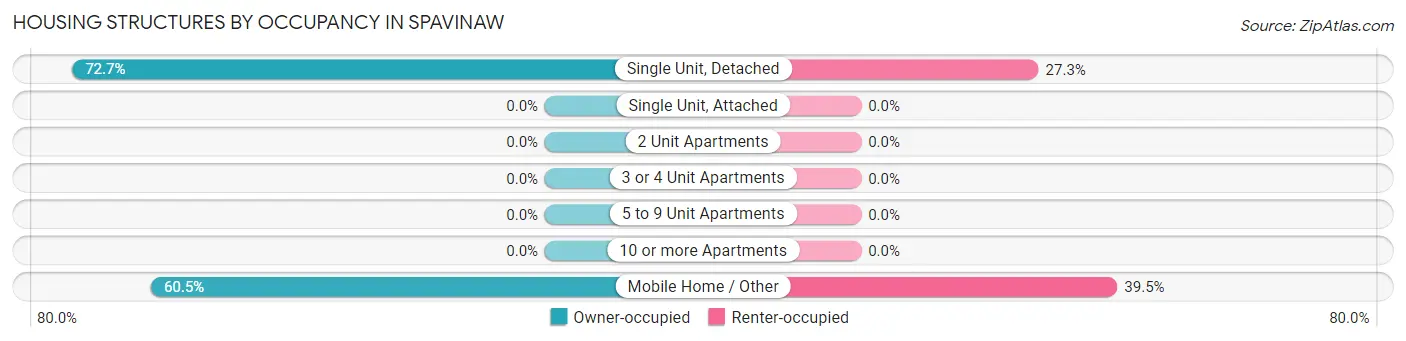
| Structure Type | Owner-occupied | Renter-occupied |
| Single Unit, Detached | 93 (72.7%) | 35 (27.3%) |
| Single Unit, Attached | 0 (0.0%) | 0 (0.0%) |
| 2 Unit Apartments | 0 (0.0%) | 0 (0.0%) |
| 3 or 4 Unit Apartments | 0 (0.0%) | 0 (0.0%) |
| 5 to 9 Unit Apartments | 0 (0.0%) | 0 (0.0%) |
| 10 or more Apartments | 0 (0.0%) | 0 (0.0%) |
| Mobile Home / Other | 23 (60.5%) | 15 (39.5%) |
| Total | 116 (69.9%) | 50 (30.1%) |
Housing Structures by Number of Rooms in Spavinaw
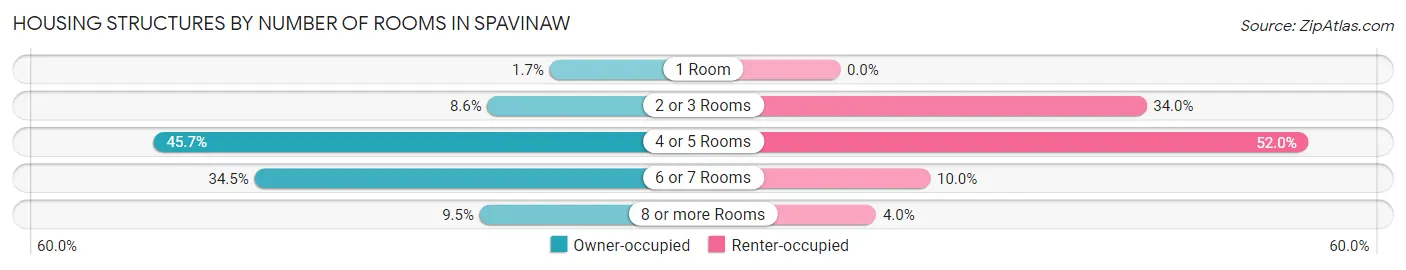
| Number of Rooms | Owner-occupied | Renter-occupied |
| 1 Room | 2 (1.7%) | 0 (0.0%) |
| 2 or 3 Rooms | 10 (8.6%) | 17 (34.0%) |
| 4 or 5 Rooms | 53 (45.7%) | 26 (52.0%) |
| 6 or 7 Rooms | 40 (34.5%) | 5 (10.0%) |
| 8 or more Rooms | 11 (9.5%) | 2 (4.0%) |
| Total | 116 (100.0%) | 50 (100.0%) |
Housing Structure by Heating Type in Spavinaw
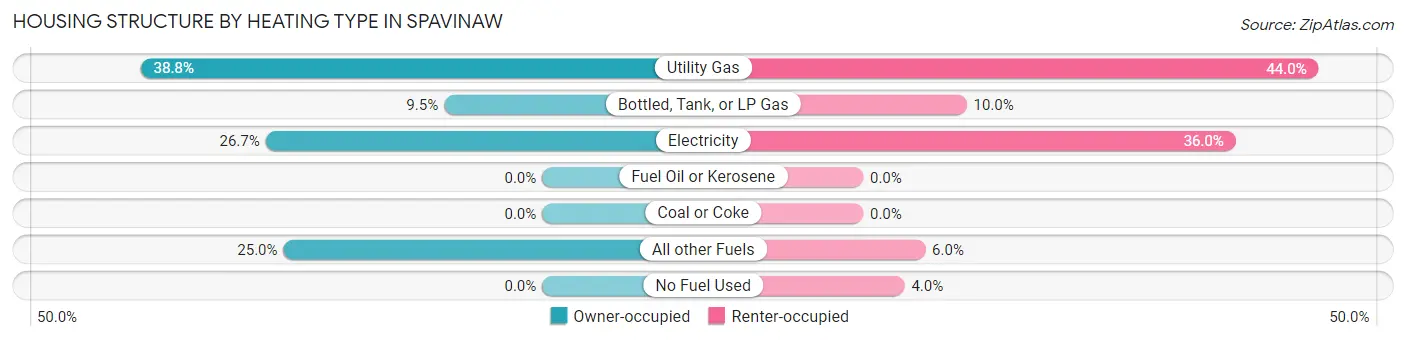
| Heating Type | Owner-occupied | Renter-occupied |
| Utility Gas | 45 (38.8%) | 22 (44.0%) |
| Bottled, Tank, or LP Gas | 11 (9.5%) | 5 (10.0%) |
| Electricity | 31 (26.7%) | 18 (36.0%) |
| Fuel Oil or Kerosene | 0 (0.0%) | 0 (0.0%) |
| Coal or Coke | 0 (0.0%) | 0 (0.0%) |
| All other Fuels | 29 (25.0%) | 3 (6.0%) |
| No Fuel Used | 0 (0.0%) | 2 (4.0%) |
| Total | 116 (100.0%) | 50 (100.0%) |
Household Vehicle Usage in Spavinaw
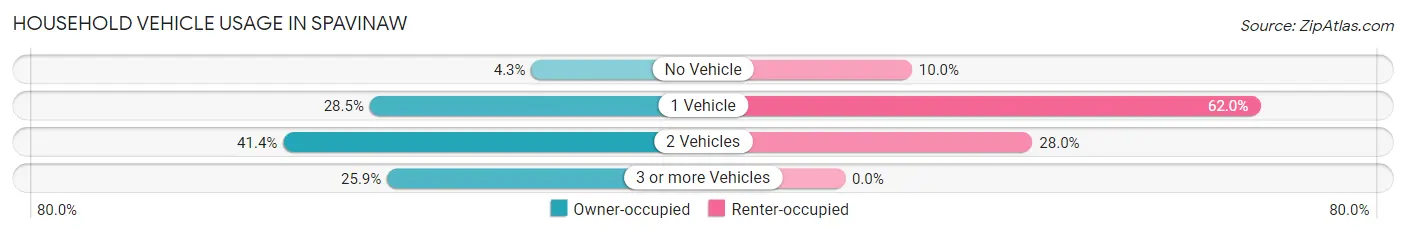
| Vehicles per Household | Owner-occupied | Renter-occupied |
| No Vehicle | 5 (4.3%) | 5 (10.0%) |
| 1 Vehicle | 33 (28.4%) | 31 (62.0%) |
| 2 Vehicles | 48 (41.4%) | 14 (28.0%) |
| 3 or more Vehicles | 30 (25.9%) | 0 (0.0%) |
| Total | 116 (100.0%) | 50 (100.0%) |
Real Estate & Mortgages in Spavinaw
Real Estate and Mortgage Overview in Spavinaw
| Characteristic | Without Mortgage | With Mortgage |
| Housing Units | 80 | 36 |
| Median Property Value | $44,600 | $0 |
| Median Household Income | $33,750 | $3 |
| Monthly Housing Costs | $264 | $0 |
| Real Estate Taxes | $228 | $2 |
Property Value by Mortgage Status in Spavinaw
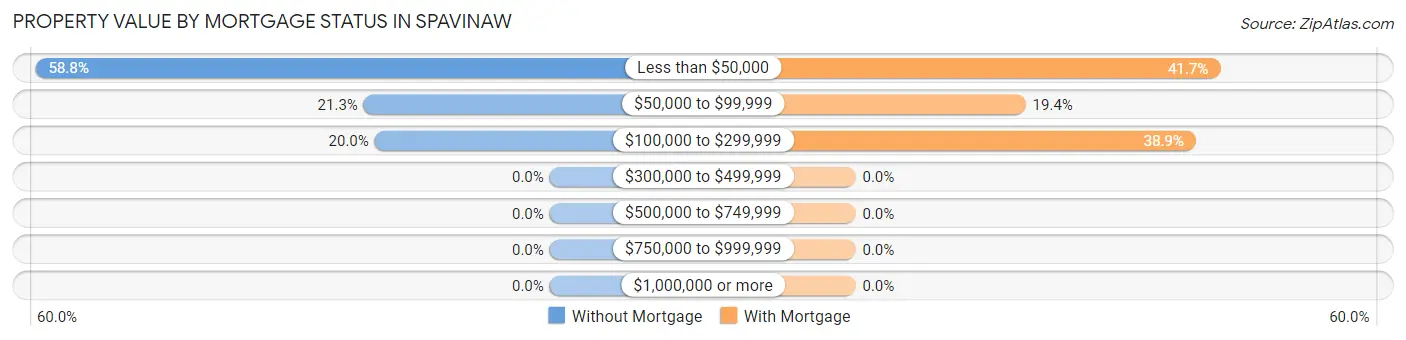
| Property Value | Without Mortgage | With Mortgage |
| Less than $50,000 | 47 (58.8%) | 15 (41.7%) |
| $50,000 to $99,999 | 17 (21.2%) | 7 (19.4%) |
| $100,000 to $299,999 | 16 (20.0%) | 14 (38.9%) |
| $300,000 to $499,999 | 0 (0.0%) | 0 (0.0%) |
| $500,000 to $749,999 | 0 (0.0%) | 0 (0.0%) |
| $750,000 to $999,999 | 0 (0.0%) | 0 (0.0%) |
| $1,000,000 or more | 0 (0.0%) | 0 (0.0%) |
| Total | 80 (100.0%) | 36 (100.0%) |
Household Income by Mortgage Status in Spavinaw
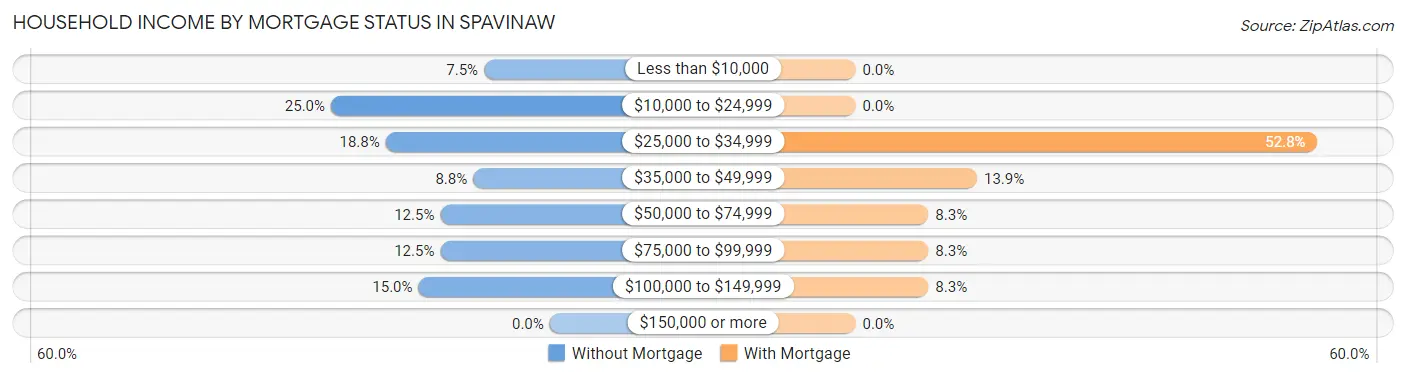
| Household Income | Without Mortgage | With Mortgage |
| Less than $10,000 | 6 (7.5%) | 0 (0.0%) |
| $10,000 to $24,999 | 20 (25.0%) | 0 (0.0%) |
| $25,000 to $34,999 | 15 (18.8%) | 19 (52.8%) |
| $35,000 to $49,999 | 7 (8.7%) | 5 (13.9%) |
| $50,000 to $74,999 | 10 (12.5%) | 3 (8.3%) |
| $75,000 to $99,999 | 10 (12.5%) | 3 (8.3%) |
| $100,000 to $149,999 | 12 (15.0%) | 3 (8.3%) |
| $150,000 or more | 0 (0.0%) | 0 (0.0%) |
| Total | 80 (100.0%) | 36 (100.0%) |
Property Value to Household Income Ratio in Spavinaw
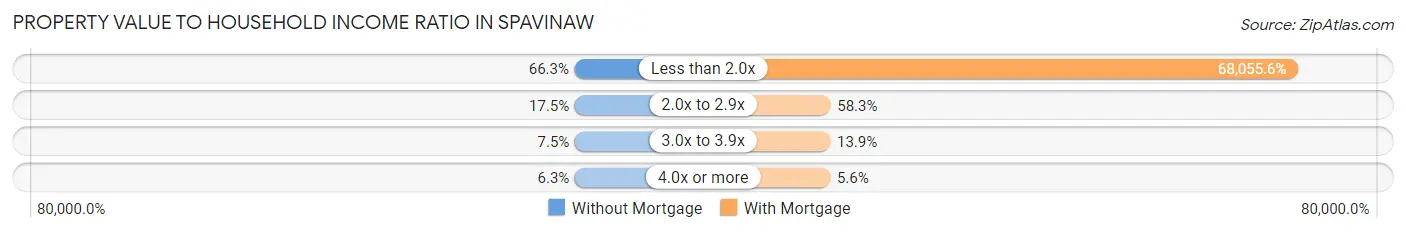
| Value-to-Income Ratio | Without Mortgage | With Mortgage |
| Less than 2.0x | 53 (66.2%) | 24,500 (68,055.6%) |
| 2.0x to 2.9x | 14 (17.5%) | 21 (58.3%) |
| 3.0x to 3.9x | 6 (7.5%) | 5 (13.9%) |
| 4.0x or more | 5 (6.2%) | 2 (5.6%) |
| Total | 80 (100.0%) | 36 (100.0%) |
Real Estate Taxes by Mortgage Status in Spavinaw
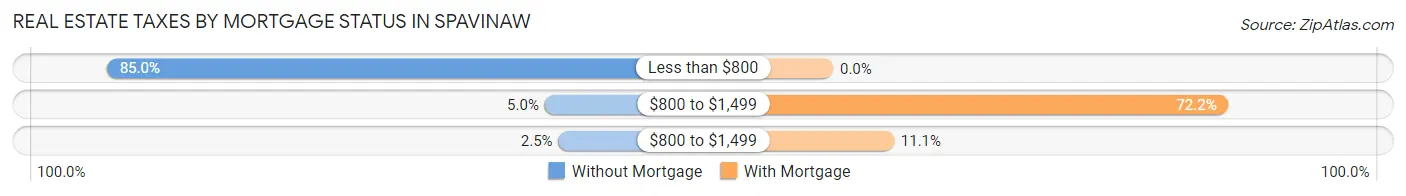
| Property Taxes | Without Mortgage | With Mortgage |
| Less than $800 | 68 (85.0%) | 0 (0.0%) |
| $800 to $1,499 | 4 (5.0%) | 26 (72.2%) |
| $800 to $1,499 | 2 (2.5%) | 4 (11.1%) |
| Total | 80 (100.0%) | 36 (100.0%) |
Health & Disability in Spavinaw
Health Insurance Coverage by Age in Spavinaw
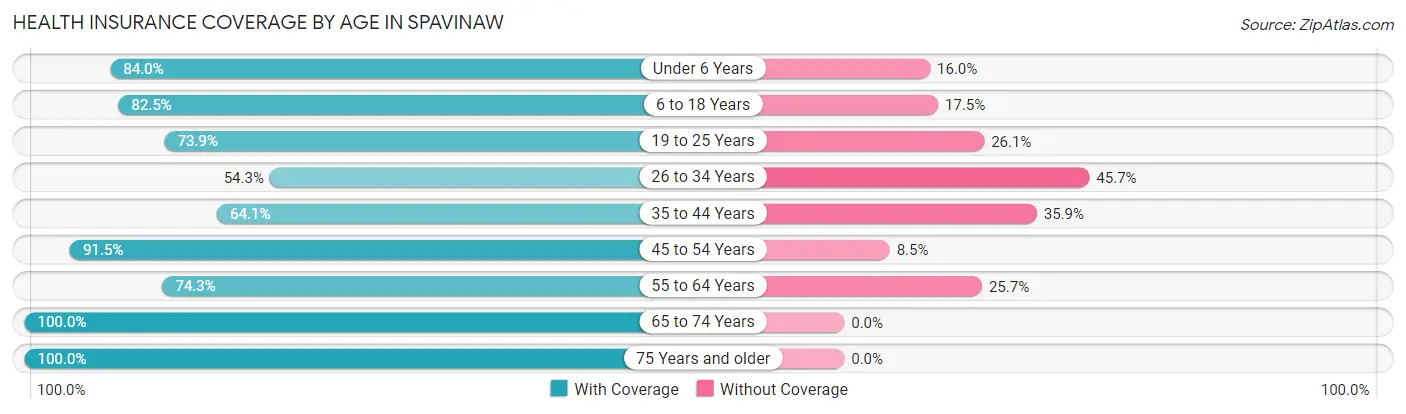
| Age Bracket | With Coverage | Without Coverage |
| Under 6 Years | 21 (84.0%) | 4 (16.0%) |
| 6 to 18 Years | 33 (82.5%) | 7 (17.5%) |
| 19 to 25 Years | 17 (73.9%) | 6 (26.1%) |
| 26 to 34 Years | 19 (54.3%) | 16 (45.7%) |
| 35 to 44 Years | 25 (64.1%) | 14 (35.9%) |
| 45 to 54 Years | 54 (91.5%) | 5 (8.5%) |
| 55 to 64 Years | 55 (74.3%) | 19 (25.7%) |
| 65 to 74 Years | 46 (100.0%) | 0 (0.0%) |
| 75 Years and older | 82 (100.0%) | 0 (0.0%) |
| Total | 352 (83.2%) | 71 (16.8%) |
Health Insurance Coverage by Citizenship Status in Spavinaw
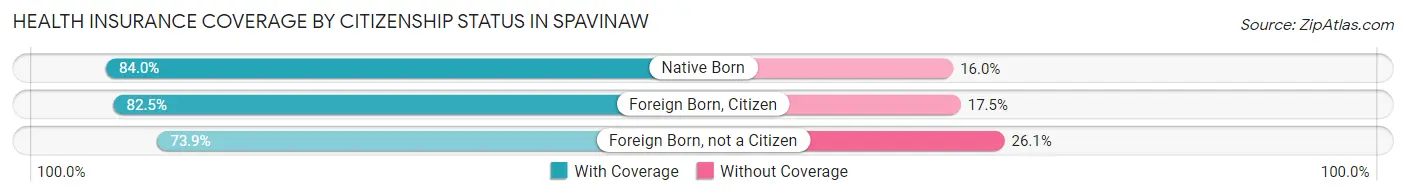
| Citizenship Status | With Coverage | Without Coverage |
| Native Born | 21 (84.0%) | 4 (16.0%) |
| Foreign Born, Citizen | 33 (82.5%) | 7 (17.5%) |
| Foreign Born, not a Citizen | 17 (73.9%) | 6 (26.1%) |
Health Insurance Coverage by Household Income in Spavinaw
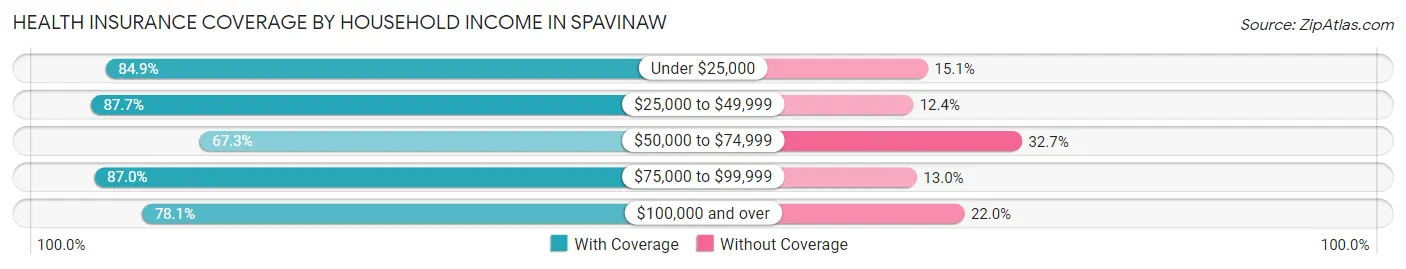
| Household Income | With Coverage | Without Coverage |
| Under $25,000 | 101 (84.9%) | 18 (15.1%) |
| $25,000 to $49,999 | 142 (87.6%) | 20 (12.3%) |
| $50,000 to $74,999 | 37 (67.3%) | 18 (32.7%) |
| $75,000 to $99,999 | 40 (87.0%) | 6 (13.0%) |
| $100,000 and over | 32 (78.0%) | 9 (22.0%) |
Public vs Private Health Insurance Coverage by Age in Spavinaw
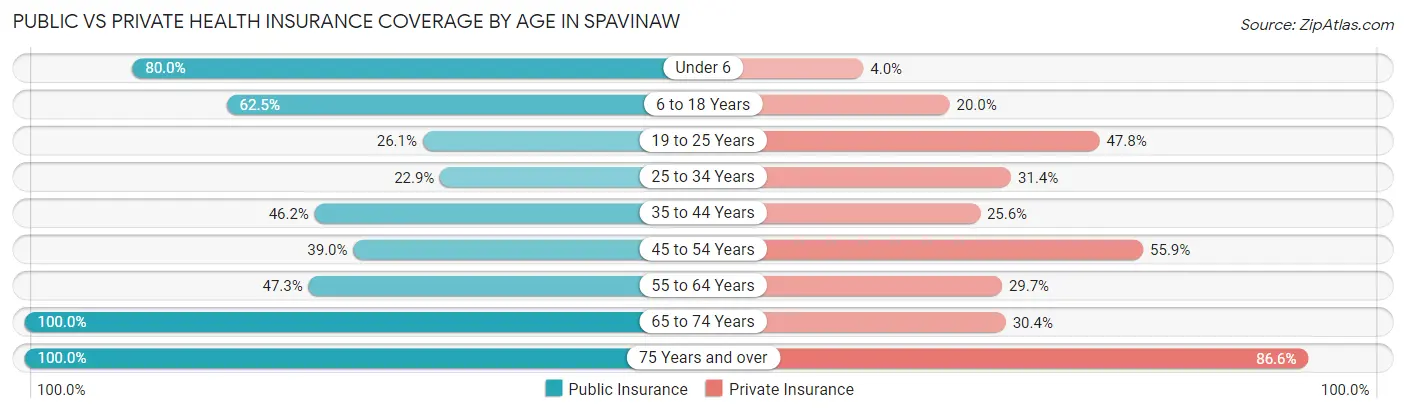
| Age Bracket | Public Insurance | Private Insurance |
| Under 6 | 20 (80.0%) | 1 (4.0%) |
| 6 to 18 Years | 25 (62.5%) | 8 (20.0%) |
| 19 to 25 Years | 6 (26.1%) | 11 (47.8%) |
| 25 to 34 Years | 8 (22.9%) | 11 (31.4%) |
| 35 to 44 Years | 18 (46.2%) | 10 (25.6%) |
| 45 to 54 Years | 23 (39.0%) | 33 (55.9%) |
| 55 to 64 Years | 35 (47.3%) | 22 (29.7%) |
| 65 to 74 Years | 46 (100.0%) | 14 (30.4%) |
| 75 Years and over | 82 (100.0%) | 71 (86.6%) |
| Total | 263 (62.2%) | 181 (42.8%) |
Disability Status by Sex by Age in Spavinaw
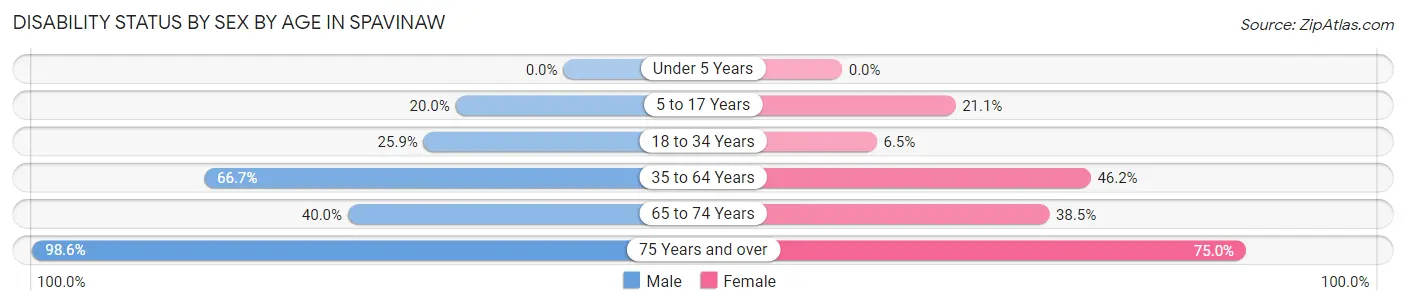
| Age Bracket | Male | Female |
| Under 5 Years | 0 (0.0%) | 0 (0.0%) |
| 5 to 17 Years | 5 (20.0%) | 4 (21.0%) |
| 18 to 34 Years | 7 (25.9%) | 2 (6.5%) |
| 35 to 64 Years | 54 (66.7%) | 42 (46.2%) |
| 65 to 74 Years | 8 (40.0%) | 10 (38.5%) |
| 75 Years and over | 69 (98.6%) | 9 (75.0%) |
Disability Class by Sex by Age in Spavinaw
Disability Class: Hearing Difficulty
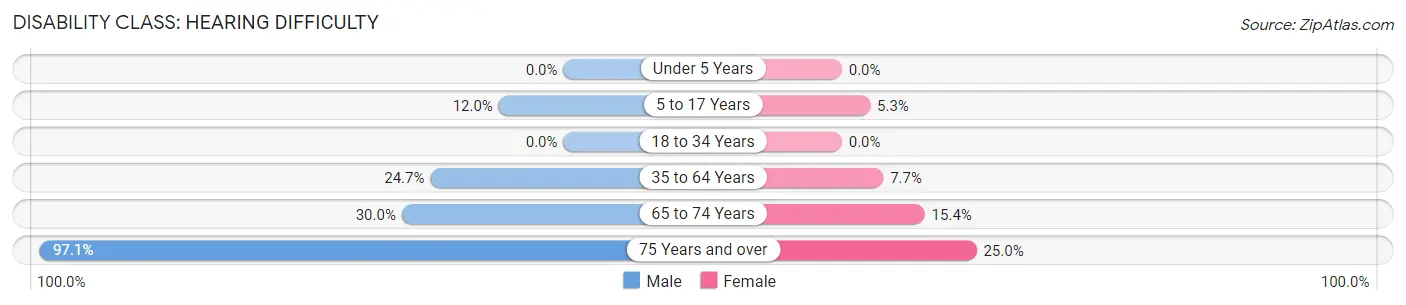
| Age Bracket | Male | Female |
| Under 5 Years | 0 (0.0%) | 0 (0.0%) |
| 5 to 17 Years | 3 (12.0%) | 1 (5.3%) |
| 18 to 34 Years | 0 (0.0%) | 0 (0.0%) |
| 35 to 64 Years | 20 (24.7%) | 7 (7.7%) |
| 65 to 74 Years | 6 (30.0%) | 4 (15.4%) |
| 75 Years and over | 68 (97.1%) | 3 (25.0%) |
Disability Class: Vision Difficulty
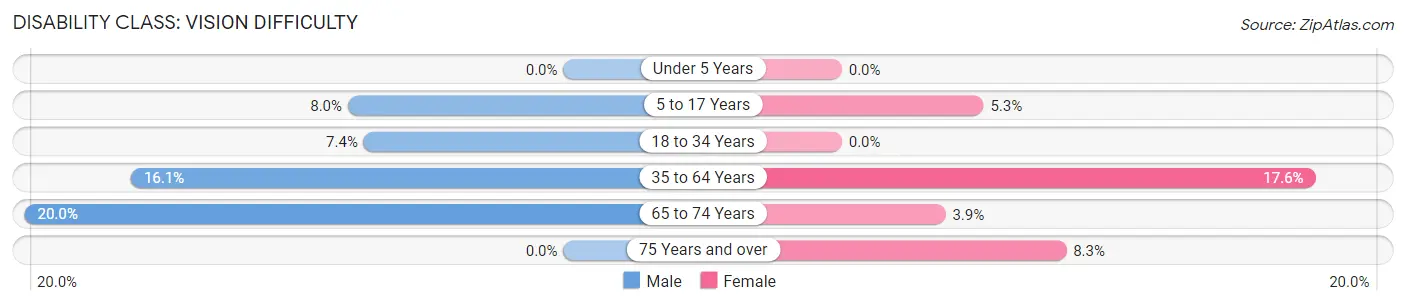
| Age Bracket | Male | Female |
| Under 5 Years | 0 (0.0%) | 0 (0.0%) |
| 5 to 17 Years | 2 (8.0%) | 1 (5.3%) |
| 18 to 34 Years | 2 (7.4%) | 0 (0.0%) |
| 35 to 64 Years | 13 (16.1%) | 16 (17.6%) |
| 65 to 74 Years | 4 (20.0%) | 1 (3.8%) |
| 75 Years and over | 0 (0.0%) | 1 (8.3%) |
Disability Class: Cognitive Difficulty
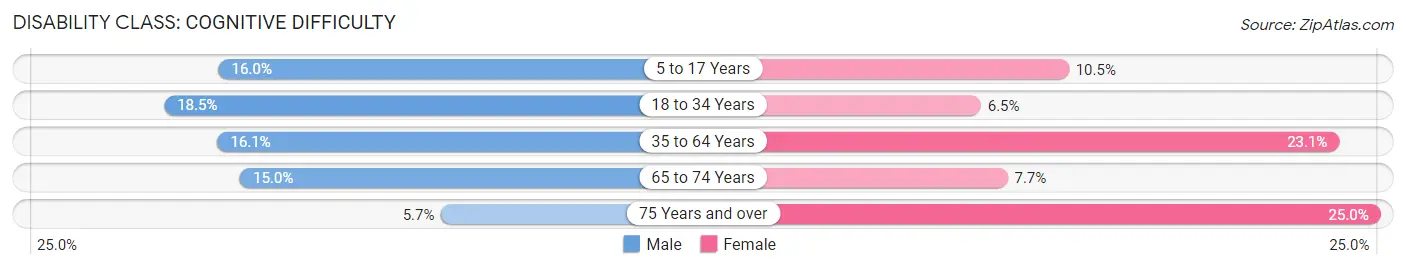
| Age Bracket | Male | Female |
| 5 to 17 Years | 4 (16.0%) | 2 (10.5%) |
| 18 to 34 Years | 5 (18.5%) | 2 (6.5%) |
| 35 to 64 Years | 13 (16.1%) | 21 (23.1%) |
| 65 to 74 Years | 3 (15.0%) | 2 (7.7%) |
| 75 Years and over | 4 (5.7%) | 3 (25.0%) |
Disability Class: Ambulatory Difficulty
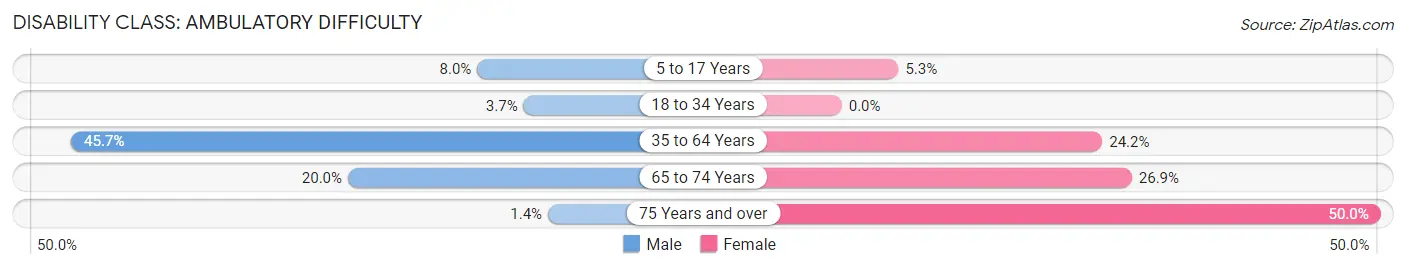
| Age Bracket | Male | Female |
| 5 to 17 Years | 2 (8.0%) | 1 (5.3%) |
| 18 to 34 Years | 1 (3.7%) | 0 (0.0%) |
| 35 to 64 Years | 37 (45.7%) | 22 (24.2%) |
| 65 to 74 Years | 4 (20.0%) | 7 (26.9%) |
| 75 Years and over | 1 (1.4%) | 6 (50.0%) |
Disability Class: Self-Care Difficulty
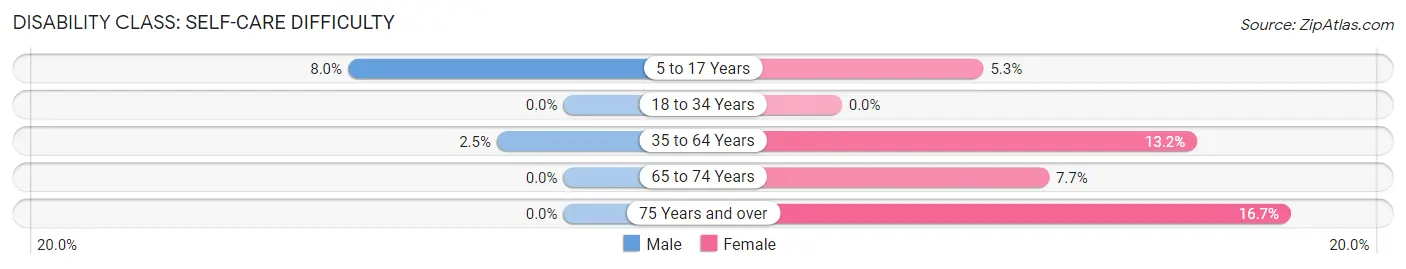
| Age Bracket | Male | Female |
| 5 to 17 Years | 2 (8.0%) | 1 (5.3%) |
| 18 to 34 Years | 0 (0.0%) | 0 (0.0%) |
| 35 to 64 Years | 2 (2.5%) | 12 (13.2%) |
| 65 to 74 Years | 0 (0.0%) | 2 (7.7%) |
| 75 Years and over | 0 (0.0%) | 2 (16.7%) |
Technology Access in Spavinaw
Computing Device Access in Spavinaw
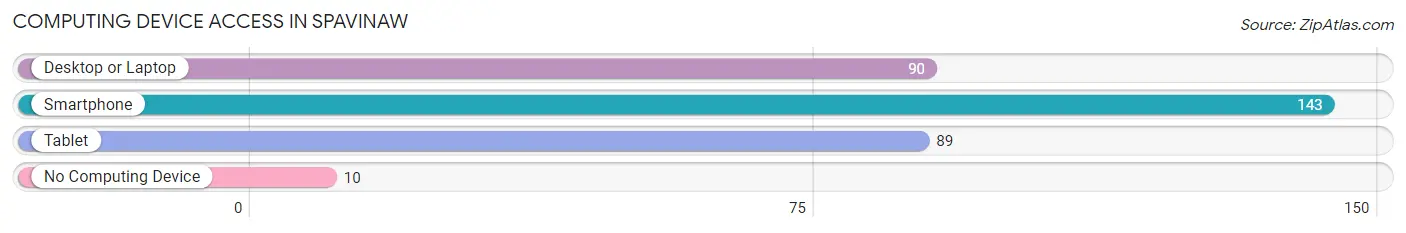
| Device Type | # Households | % Households |
| Desktop or Laptop | 90 | 54.2% |
| Smartphone | 143 | 86.1% |
| Tablet | 89 | 53.6% |
| No Computing Device | 10 | 6.0% |
| Total | 166 | 100.0% |
Internet Access in Spavinaw
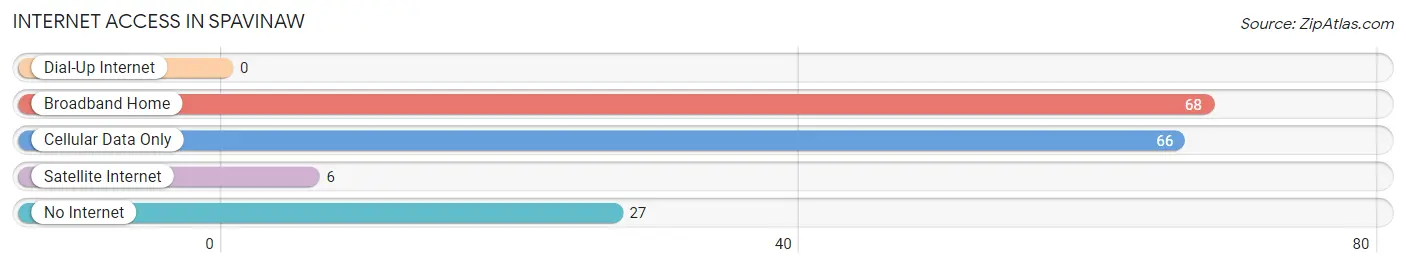
| Internet Type | # Households | % Households |
| Dial-Up Internet | 0 | 0.0% |
| Broadband Home | 68 | 41.0% |
| Cellular Data Only | 66 | 39.8% |
| Satellite Internet | 6 | 3.6% |
| No Internet | 27 | 16.3% |
| Total | 166 | 100.0% |
Spavinaw Summary
Spavinaw, Oklahoma is a small town located in Mayes County, Oklahoma. It is situated on the banks of Spavinaw Creek, a tributary of the Grand River. The town was founded in 1891 and was named after the creek. The population of Spavinaw was 545 in the 2010 census.
History
The area around Spavinaw was originally inhabited by the Osage Indians. The first white settlers arrived in the area in the late 1800s. The town was founded in 1891 and was named after the creek. The first post office was established in 1892.
The town grew slowly but steadily over the years. In the early 1900s, the town was home to a number of businesses, including a general store, a blacksmith shop, a hotel, and a cotton gin. The town also had a school and a church.
In the 1920s, the town was connected to the outside world by the Missouri-Kansas-Texas Railroad. This allowed for the transportation of goods and people to and from the town.
In the 1930s, the Great Depression hit the town hard. Many businesses closed and the population declined. However, the town was able to survive and slowly began to recover.
In the 1950s, the town was connected to the outside world by the construction of a bridge over the Grand River. This allowed for the transportation of goods and people to and from the town.
In the 1960s, the town was connected to the outside world by the construction of a bridge over the Grand River. This allowed for the transportation of goods and people to and from the town.
In the 1970s, the town was connected to the outside world by the construction of a bridge over the Grand River. This allowed for the transportation of goods and people to and from the town.
In the 1980s, the town was connected to the outside world by the construction of a bridge over the Grand River. This allowed for the transportation of goods and people to and from the town.
In the 1990s, the town was connected to the outside world by the construction of a bridge over the Grand River. This allowed for the transportation of goods and people to and from the town.
Geography
Spavinaw is located in Mayes County, Oklahoma. It is situated on the banks of Spavinaw Creek, a tributary of the Grand River. The town is located in the foothills of the Ozark Mountains. The town is surrounded by rolling hills and wooded areas.
The climate in Spavinaw is humid subtropical, with hot summers and mild winters. The average annual temperature is around 64°F (18°C). The average annual precipitation is around 44 inches (112 cm).
Economy
The economy of Spavinaw is largely based on agriculture. The town is home to a number of farms, which produce a variety of crops, including corn, soybeans, wheat, and hay. The town is also home to a number of small businesses, including restaurants, stores, and service providers.
Demographics
The population of Spavinaw was 545 in the 2010 census. The population is largely white (94.3%), with a small percentage of African Americans (2.2%) and Native Americans (1.5%). The median household income is $31,250, and the median age is 44.7 years. The town has a high rate of poverty, with 28.3% of the population living below the poverty line.
Common Questions
What is Per Capita Income in Spavinaw?
Per Capita income in Spavinaw is $24,501.
What is the Median Family Income in Spavinaw?
Median Family Income in Spavinaw is $28,750.
What is the Median Household income in Spavinaw?
Median Household Income in Spavinaw is $29,000.
What is Income or Wage Gap in Spavinaw?
Income or Wage Gap in Spavinaw is 28.3%.
Women in Spavinaw earn 71.7 cents for every dollar earned by a man.
What is Family Income Deficit in Spavinaw?
Family Income Deficit in Spavinaw is $10,153.
Families that are below poverty line in Spavinaw earn $10,153 less on average than the poverty threshold level.
What is Inequality or Gini Index in Spavinaw?
Inequality or Gini Index in Spavinaw is 0.51.
What is the Total Population of Spavinaw?
Total Population of Spavinaw is 423.
What is the Total Male Population of Spavinaw?
Total Male Population of Spavinaw is 232.
What is the Total Female Population of Spavinaw?
Total Female Population of Spavinaw is 191.
What is the Ratio of Males per 100 Females in Spavinaw?
There are 121.47 Males per 100 Females in Spavinaw.
What is the Ratio of Females per 100 Males in Spavinaw?
There are 82.33 Females per 100 Males in Spavinaw.
What is the Median Population Age in Spavinaw?
Median Population Age in Spavinaw is 53.6 Years.
What is the Average Family Size in Spavinaw
Average Family Size in Spavinaw is 3.4 People.
What is the Average Household Size in Spavinaw
Average Household Size in Spavinaw is 2.5 People.
How Large is the Labor Force in Spavinaw?
There are 140 People in the Labor Forcein in Spavinaw.
What is the Percentage of People in the Labor Force in Spavinaw?
38.7% of People are in the Labor Force in Spavinaw.
What is the Unemployment Rate in Spavinaw?
Unemployment Rate in Spavinaw is 7.9%.