Snyder, OK Map & Demographics
Snyder Map
Snyder Overview
$23,069
PER CAPITA INCOME
$62,708
AVG FAMILY INCOME
$47,448
AVG HOUSEHOLD INCOME
24.8%
WAGE / INCOME GAP [ % ]
75.2¢/ $1
WAGE / INCOME GAP [ $ ]
0.38
INEQUALITY / GINI INDEX
1,322
TOTAL POPULATION
637
MALE POPULATION
685
FEMALE POPULATION
92.99
MALES / 100 FEMALES
107.54
FEMALES / 100 MALES
36.7
MEDIAN AGE
3.0
AVG FAMILY SIZE
2.5
AVG HOUSEHOLD SIZE
511
LABOR FORCE [ PEOPLE ]
52.2%
PERCENT IN LABOR FORCE
3.2%
UNEMPLOYMENT RATE
Snyder Zip Codes
Snyder Area Codes
Income in Snyder
Income Overview in Snyder
Per Capita Income in Snyder is $23,069, while median incomes of families and households are $62,708 and $47,448 respectively.
| Characteristic | Number | Measure |
| Per Capita Income | 1,322 | $23,069 |
| Median Family Income | 342 | $62,708 |
| Mean Family Income | 342 | $67,635 |
| Median Household Income | 489 | $47,448 |
| Mean Household Income | 489 | $58,397 |
| Income Deficit | 342 | $0 |
| Wage / Income Gap (%) | 1,322 | 24.78% |
| Wage / Income Gap ($) | 1,322 | 75.22¢ per $1 |
| Gini / Inequality Index | 1,322 | 0.38 |
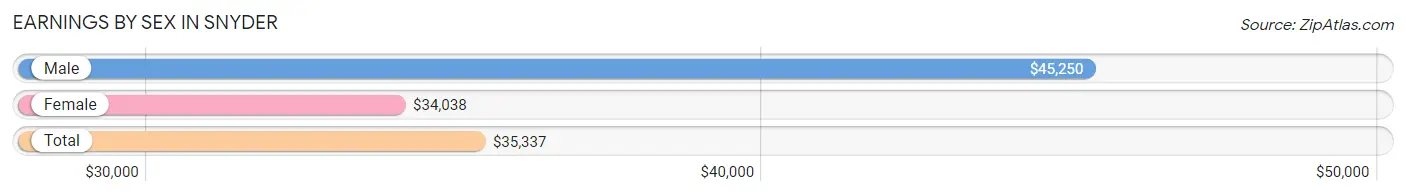
Earnings by Sex in Snyder
Average Earnings in Snyder are $35,337, $45,250 for men and $34,038 for women, a difference of 24.8%.
| Sex | Number | Average Earnings |
| Male | 275 (50.6%) | $45,250 |
| Female | 268 (49.4%) | $34,038 |
| Total | 543 (100.0%) | $35,337 |
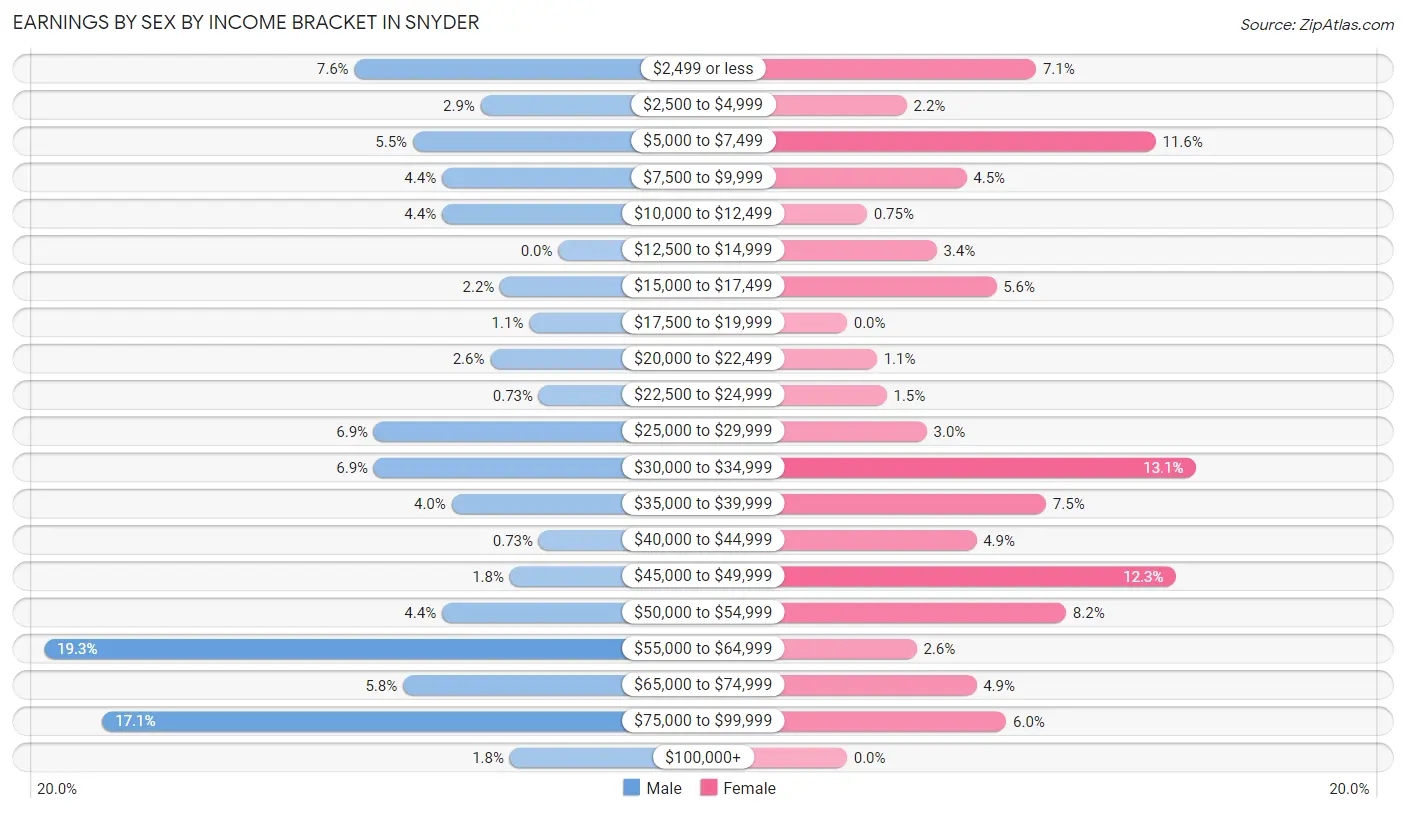
Earnings by Sex by Income Bracket in Snyder
The most common earnings brackets in Snyder are $55,000 to $64,999 for men (53 | 19.3%) and $30,000 to $34,999 for women (35 | 13.1%).
| Income | Male | Female |
| $2,499 or less | 21 (7.6%) | 19 (7.1%) |
| $2,500 to $4,999 | 8 (2.9%) | 6 (2.2%) |
| $5,000 to $7,499 | 15 (5.4%) | 31 (11.6%) |
| $7,500 to $9,999 | 12 (4.4%) | 12 (4.5%) |
| $10,000 to $12,499 | 12 (4.4%) | 2 (0.7%) |
| $12,500 to $14,999 | 0 (0.0%) | 9 (3.4%) |
| $15,000 to $17,499 | 6 (2.2%) | 15 (5.6%) |
| $17,500 to $19,999 | 3 (1.1%) | 0 (0.0%) |
| $20,000 to $22,499 | 7 (2.5%) | 3 (1.1%) |
| $22,500 to $24,999 | 2 (0.7%) | 4 (1.5%) |
| $25,000 to $29,999 | 19 (6.9%) | 8 (3.0%) |
| $30,000 to $34,999 | 19 (6.9%) | 35 (13.1%) |
| $35,000 to $39,999 | 11 (4.0%) | 20 (7.5%) |
| $40,000 to $44,999 | 2 (0.7%) | 13 (4.9%) |
| $45,000 to $49,999 | 5 (1.8%) | 33 (12.3%) |
| $50,000 to $54,999 | 12 (4.4%) | 22 (8.2%) |
| $55,000 to $64,999 | 53 (19.3%) | 7 (2.6%) |
| $65,000 to $74,999 | 16 (5.8%) | 13 (4.9%) |
| $75,000 to $99,999 | 47 (17.1%) | 16 (6.0%) |
| $100,000+ | 5 (1.8%) | 0 (0.0%) |
| Total | 275 (100.0%) | 268 (100.0%) |
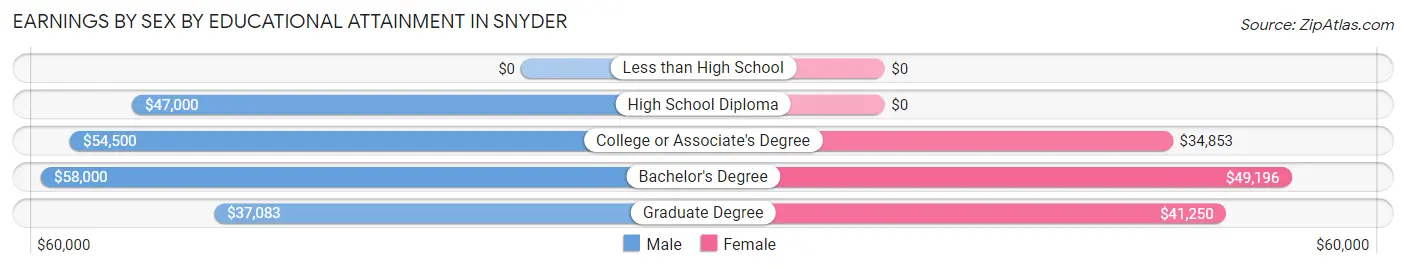
Earnings by Sex by Educational Attainment in Snyder
Average earnings in Snyder are $54,000 for men and $34,511 for women, a difference of 36.1%. Men with an educational attainment of bachelor's degree enjoy the highest average annual earnings of $58,000, while those with graduate degree education earn the least with $37,083. Women with an educational attainment of bachelor's degree earn the most with the average annual earnings of $49,196, while those with college or associate's degree education have the smallest earnings of $34,853.
| Educational Attainment | Male Income | Female Income |
| Less than High School | - | - |
| High School Diploma | $47,000 | $0 |
| College or Associate's Degree | $54,500 | $34,853 |
| Bachelor's Degree | $58,000 | $49,196 |
| Graduate Degree | $37,083 | $41,250 |
| Total | $54,000 | $34,511 |
Family Income in Snyder
Family Income Brackets in Snyder
According to the Snyder family income data, there are 82 families falling into the $35,000 to $49,999 income range, which is the most common income bracket and makes up 24.0% of all families. Conversely, the $200,000+ income bracket is the least frequent group with only 4 families (1.2%) belonging to this category.
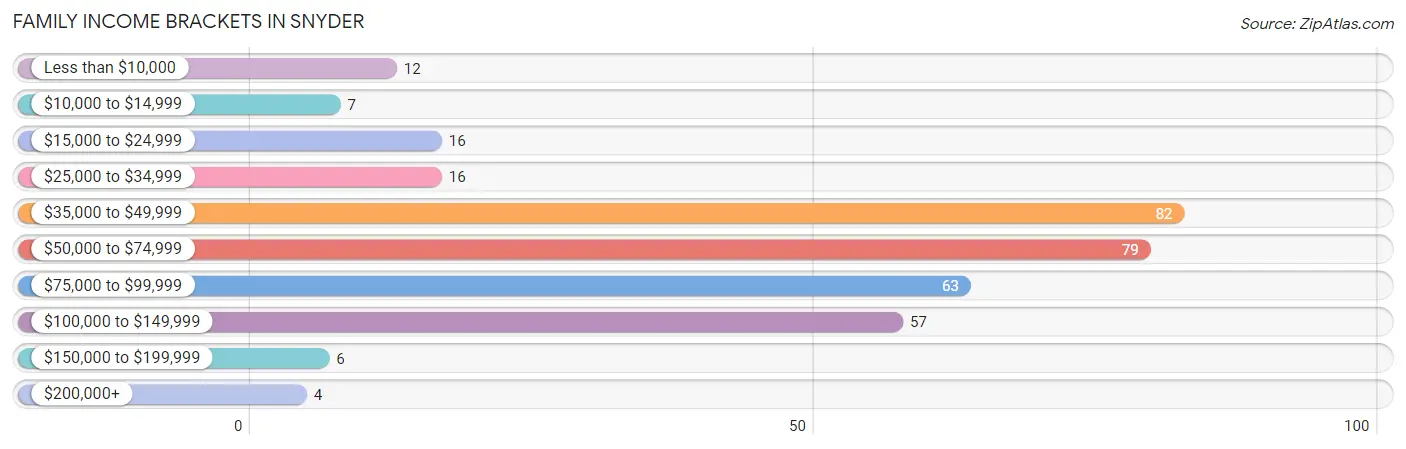
| Income Bracket | # Families | % Families |
| Less than $10,000 | 12 | 3.5% |
| $10,000 to $14,999 | 7 | 2.0% |
| $15,000 to $24,999 | 16 | 4.7% |
| $25,000 to $34,999 | 16 | 4.7% |
| $35,000 to $49,999 | 82 | 24.0% |
| $50,000 to $74,999 | 79 | 23.1% |
| $75,000 to $99,999 | 63 | 18.4% |
| $100,000 to $149,999 | 57 | 16.7% |
| $150,000 to $199,999 | 6 | 1.8% |
| $200,000+ | 4 | 1.2% |
Family Income by Famaliy Size in Snyder
5-person families (42 | 12.3%) account for the highest median family income in Snyder with $80,833 per family, while 2-person families (164 | 47.9%) have the highest median income of $25,416 per family member.
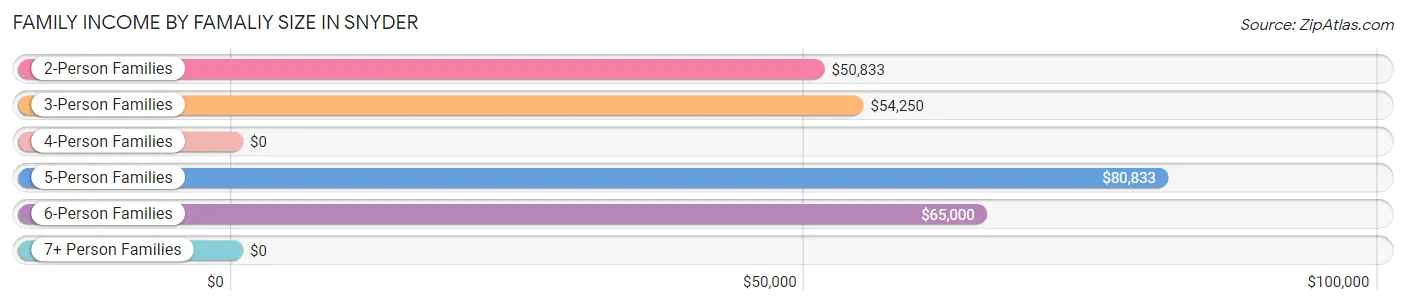
| Income Bracket | # Families | Median Income |
| 2-Person Families | 164 (47.9%) | $50,833 |
| 3-Person Families | 81 (23.7%) | $54,250 |
| 4-Person Families | 28 (8.2%) | $0 |
| 5-Person Families | 42 (12.3%) | $80,833 |
| 6-Person Families | 24 (7.0%) | $65,000 |
| 7+ Person Families | 3 (0.9%) | $0 |
| Total | 342 (100.0%) | $62,708 |
Family Income by Number of Earners in Snyder
The median family income in Snyder is $62,708, with families comprising 3+ earners (19) having the highest median family income of $140,417, while families with no earners (67) have the lowest median family income of $38,995, accounting for 5.6% and 19.6% of families, respectively.
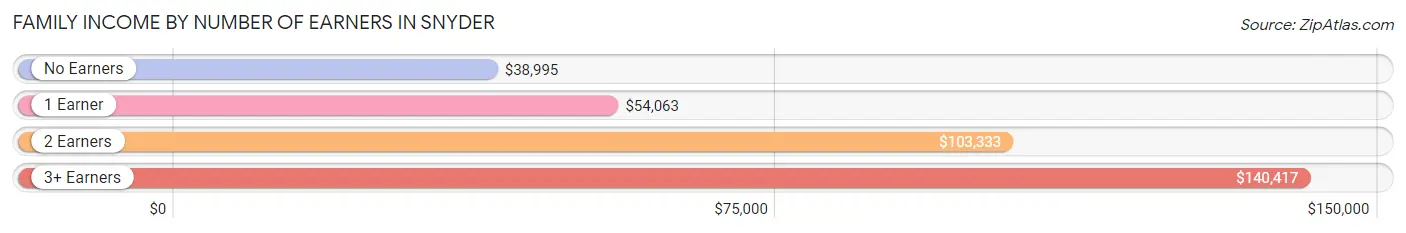
| Number of Earners | # Families | Median Income |
| No Earners | 67 (19.6%) | $38,995 |
| 1 Earner | 178 (52.0%) | $54,063 |
| 2 Earners | 78 (22.8%) | $103,333 |
| 3+ Earners | 19 (5.6%) | $140,417 |
| Total | 342 (100.0%) | $62,708 |
Household Income in Snyder
Household Income Brackets in Snyder
With 96 households falling in the category, the $35,000 to $49,999 income range is the most frequent in Snyder, accounting for 19.6% of all households. In contrast, only 4 households (0.8%) fall into the $200,000+ income bracket, making it the least populous group.
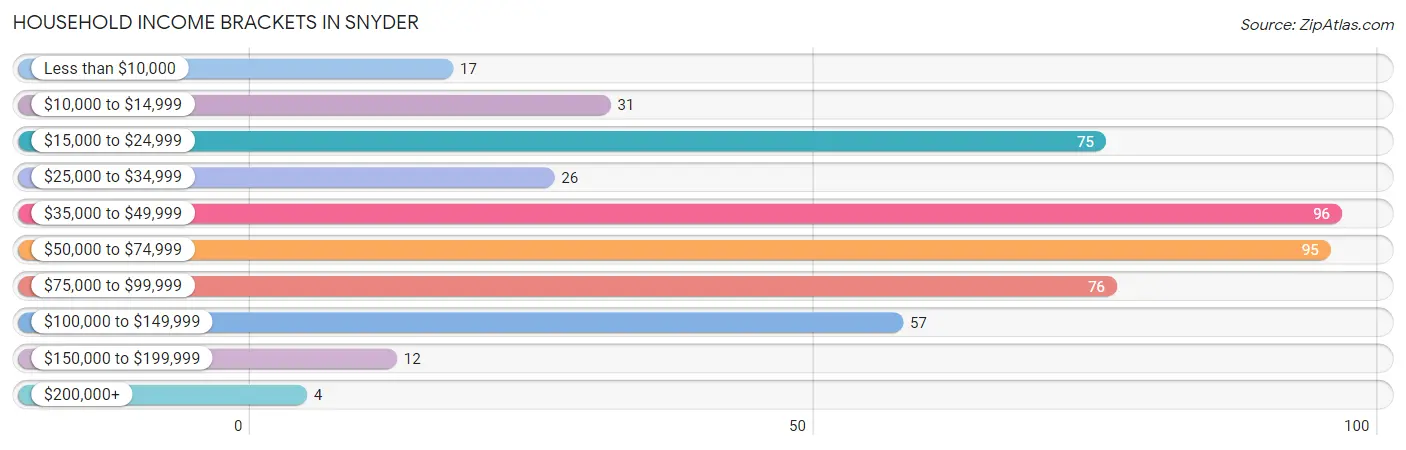
| Income Bracket | # Households | % Households |
| Less than $10,000 | 17 | 3.5% |
| $10,000 to $14,999 | 31 | 6.3% |
| $15,000 to $24,999 | 75 | 15.3% |
| $25,000 to $34,999 | 26 | 5.3% |
| $35,000 to $49,999 | 96 | 19.6% |
| $50,000 to $74,999 | 95 | 19.4% |
| $75,000 to $99,999 | 76 | 15.5% |
| $100,000 to $149,999 | 57 | 11.7% |
| $150,000 to $199,999 | 12 | 2.5% |
| $200,000+ | 4 | 0.8% |
Household Income by Householder Age in Snyder
The median household income in Snyder is $47,448, with the highest median household income of $70,556 found in the 45 to 64 years age bracket for the primary householder. A total of 160 households (32.7%) fall into this category. Meanwhile, the 15 to 24 years age bracket for the primary householder has the lowest median household income of $0, with 5 households (1.0%) in this group.
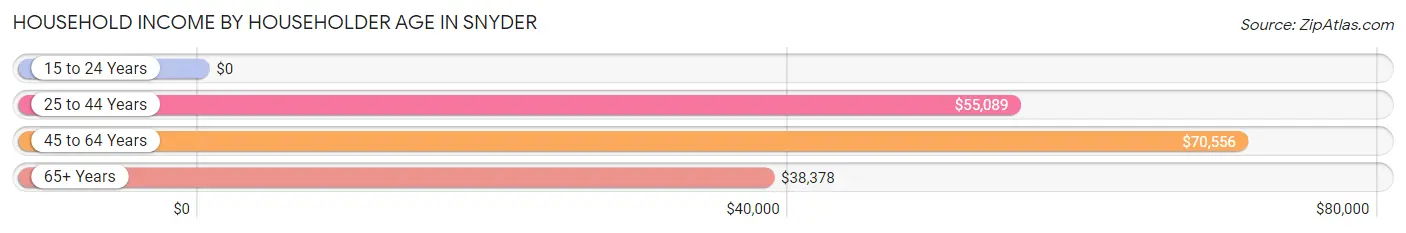
| Income Bracket | # Households | Median Income |
| 15 to 24 Years | 5 (1.0%) | $0 |
| 25 to 44 Years | 159 (32.5%) | $55,089 |
| 45 to 64 Years | 160 (32.7%) | $70,556 |
| 65+ Years | 165 (33.7%) | $38,378 |
| Total | 489 (100.0%) | $47,448 |
Poverty in Snyder
Income Below Poverty by Sex and Age in Snyder
With 15.5% poverty level for males and 15.7% for females among the residents of Snyder, 5 year old males and 5 year old females are the most vulnerable to poverty, with 4 males (100.0%) and 4 females (80.0%) in their respective age groups living below the poverty level.
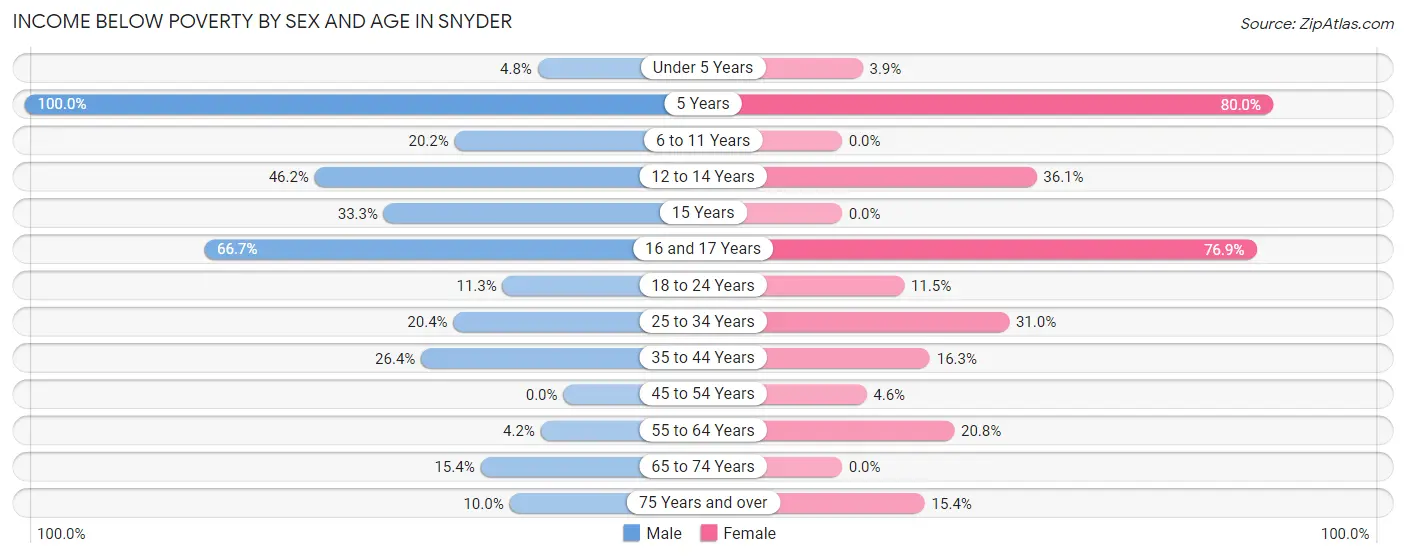
| Age Bracket | Male | Female |
| Under 5 Years | 2 (4.8%) | 3 (3.8%) |
| 5 Years | 4 (100.0%) | 4 (80.0%) |
| 6 to 11 Years | 21 (20.2%) | 0 (0.0%) |
| 12 to 14 Years | 6 (46.2%) | 13 (36.1%) |
| 15 Years | 4 (33.3%) | 0 (0.0%) |
| 16 and 17 Years | 6 (66.7%) | 10 (76.9%) |
| 18 to 24 Years | 7 (11.3%) | 3 (11.5%) |
| 25 to 34 Years | 10 (20.4%) | 36 (31.0%) |
| 35 to 44 Years | 19 (26.4%) | 8 (16.3%) |
| 45 to 54 Years | 0 (0.0%) | 3 (4.5%) |
| 55 to 64 Years | 4 (4.2%) | 15 (20.8%) |
| 65 to 74 Years | 6 (15.4%) | 0 (0.0%) |
| 75 Years and over | 4 (10.0%) | 6 (15.4%) |
| Total | 93 (15.5%) | 101 (15.7%) |
Income Above Poverty by Sex and Age in Snyder
According to the poverty statistics in Snyder, males aged 45 to 54 years and females aged 6 to 11 years are the age groups that are most secure financially, with 100.0% of males and 100.0% of females in these age groups living above the poverty line.
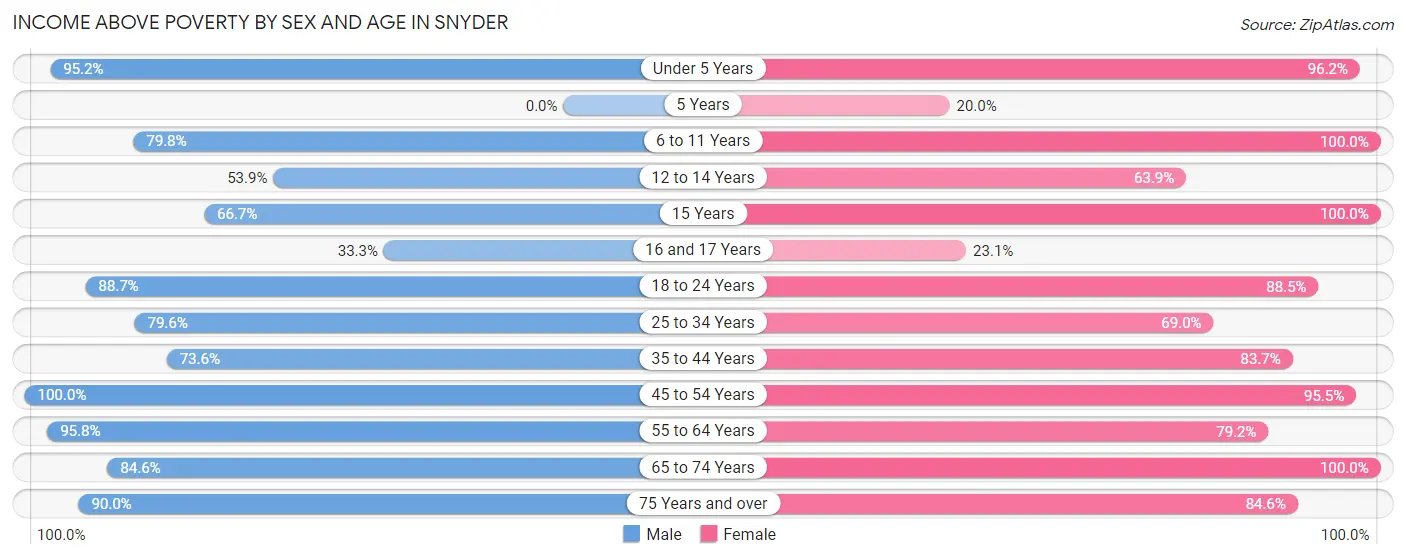
| Age Bracket | Male | Female |
| Under 5 Years | 40 (95.2%) | 75 (96.2%) |
| 5 Years | 0 (0.0%) | 1 (20.0%) |
| 6 to 11 Years | 83 (79.8%) | 30 (100.0%) |
| 12 to 14 Years | 7 (53.8%) | 23 (63.9%) |
| 15 Years | 8 (66.7%) | 20 (100.0%) |
| 16 and 17 Years | 3 (33.3%) | 3 (23.1%) |
| 18 to 24 Years | 55 (88.7%) | 23 (88.5%) |
| 25 to 34 Years | 39 (79.6%) | 80 (69.0%) |
| 35 to 44 Years | 53 (73.6%) | 41 (83.7%) |
| 45 to 54 Years | 57 (100.0%) | 63 (95.5%) |
| 55 to 64 Years | 91 (95.8%) | 57 (79.2%) |
| 65 to 74 Years | 33 (84.6%) | 92 (100.0%) |
| 75 Years and over | 36 (90.0%) | 33 (84.6%) |
| Total | 505 (84.5%) | 541 (84.3%) |
Income Below Poverty Among Married-Couple Families in Snyder
The poverty statistics for married-couple families in Snyder show that 4.0% or 10 of the total 253 families live below the poverty line. Families with 5 or more children have the highest poverty rate of 100.0%, comprising of 3 families. On the other hand, families with 3 or 4 children have the lowest poverty rate of 0.0%, which includes 0 families.
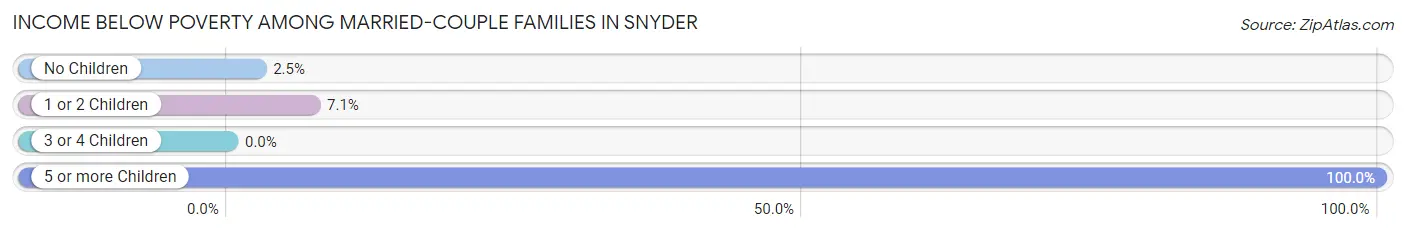
| Children | Above Poverty | Below Poverty |
| No Children | 159 (97.6%) | 4 (2.5%) |
| 1 or 2 Children | 39 (92.9%) | 3 (7.1%) |
| 3 or 4 Children | 45 (100.0%) | 0 (0.0%) |
| 5 or more Children | 0 (0.0%) | 3 (100.0%) |
| Total | 243 (96.1%) | 10 (4.0%) |
Income Below Poverty Among Single-Parent Households in Snyder
According to the poverty data in Snyder, 19.1% or 4 single-father households and 27.9% or 19 single-mother households are living below the poverty line. Among single-father households, those with 1 or 2 children have the highest poverty rate, with 4 households (19.1%) experiencing poverty. Likewise, among single-mother households, those with 1 or 2 children have the highest poverty rate, with 19 households (36.5%) falling below the poverty line.
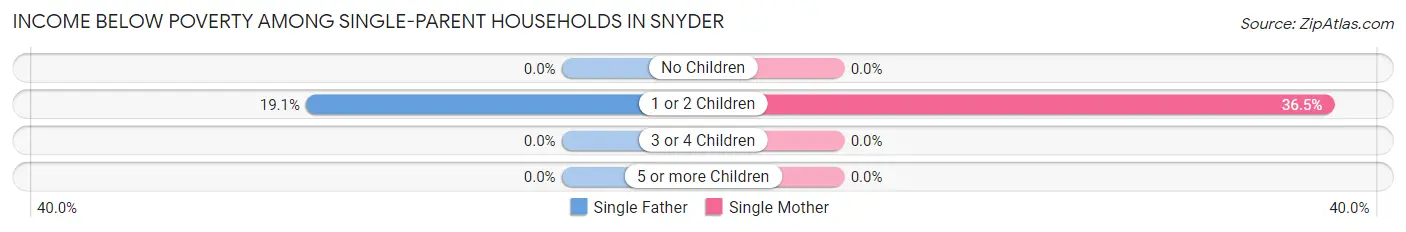
| Children | Single Father | Single Mother |
| No Children | 0 (0.0%) | 0 (0.0%) |
| 1 or 2 Children | 4 (19.1%) | 19 (36.5%) |
| 3 or 4 Children | 0 (0.0%) | 0 (0.0%) |
| 5 or more Children | 0 (0.0%) | 0 (0.0%) |
| Total | 4 (19.1%) | 19 (27.9%) |
Income Below Poverty Among Married-Couple vs Single-Parent Households in Snyder
The poverty data for Snyder shows that 10 of the married-couple family households (4.0%) and 23 of the single-parent households (25.8%) are living below the poverty level. Within the married-couple family households, those with 5 or more children have the highest poverty rate, with 3 households (100.0%) falling below the poverty line. Among the single-parent households, those with 1 or 2 children have the highest poverty rate, with 23 household (31.5%) living below poverty.
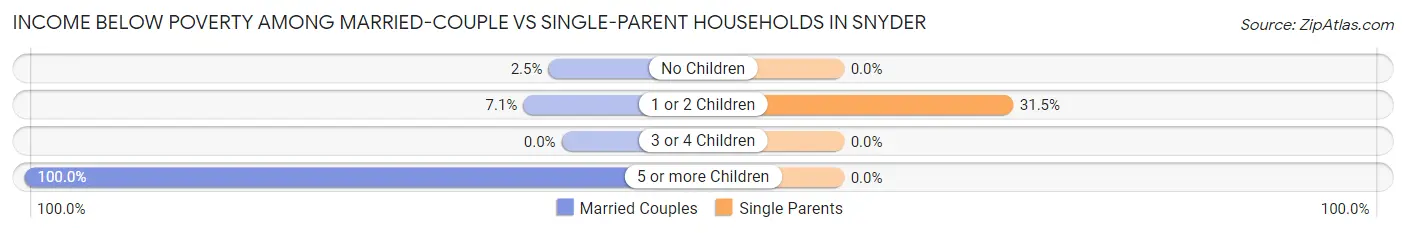
| Children | Married-Couple Families | Single-Parent Households |
| No Children | 4 (2.5%) | 0 (0.0%) |
| 1 or 2 Children | 3 (7.1%) | 23 (31.5%) |
| 3 or 4 Children | 0 (0.0%) | 0 (0.0%) |
| 5 or more Children | 3 (100.0%) | 0 (0.0%) |
| Total | 10 (4.0%) | 23 (25.8%) |
Race in Snyder
The most populous races in Snyder are White / Caucasian (1,106 | 83.7%), Hispanic or Latino (186 | 14.1%), and Two or more Races (155 | 11.7%).
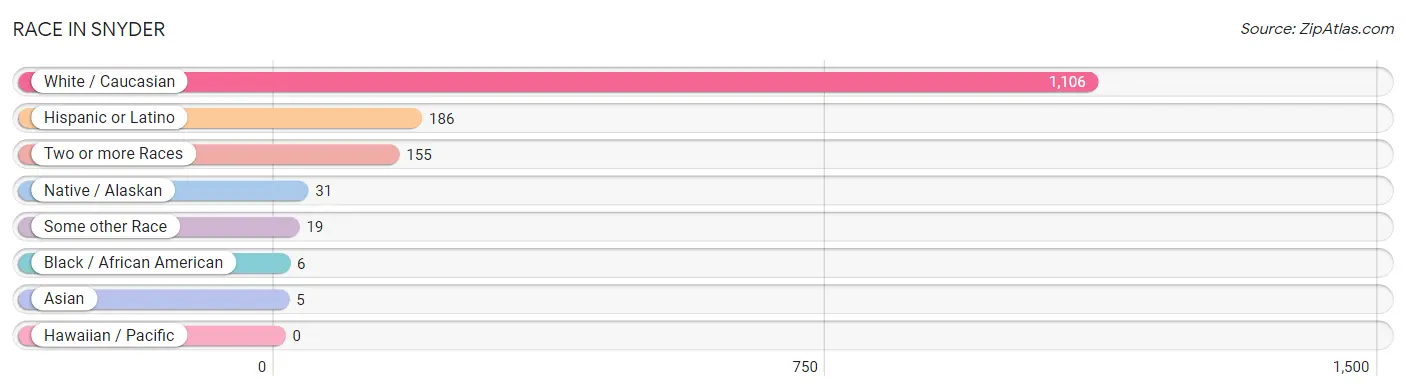
| Race | # Population | % Population |
| Asian | 5 | 0.4% |
| Black / African American | 6 | 0.4% |
| Hawaiian / Pacific | 0 | 0.0% |
| Hispanic or Latino | 186 | 14.1% |
| Native / Alaskan | 31 | 2.3% |
| White / Caucasian | 1,106 | 83.7% |
| Two or more Races | 155 | 11.7% |
| Some other Race | 19 | 1.4% |
| Total | 1,322 | 100.0% |
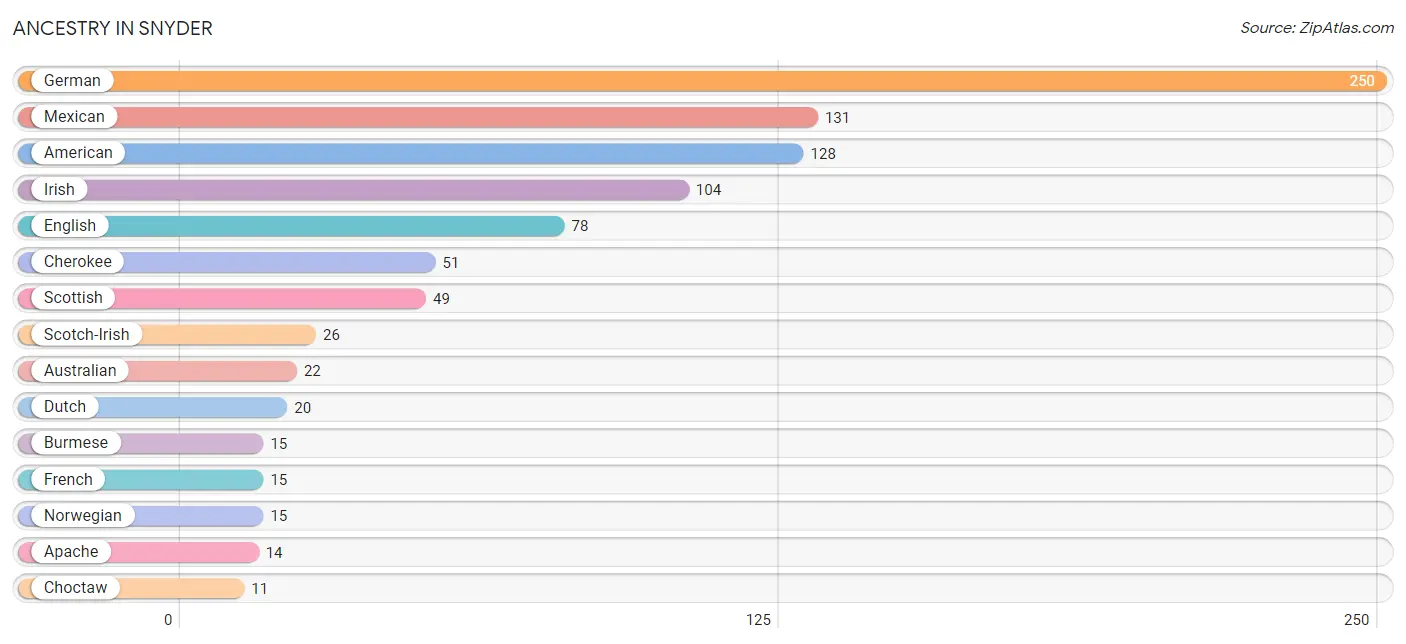
Ancestry in Snyder
The most populous ancestries reported in Snyder are German (250 | 18.9%), Mexican (131 | 9.9%), American (128 | 9.7%), Irish (104 | 7.9%), and English (78 | 5.9%), together accounting for 52.3% of all Snyder residents.
| Ancestry | # Population | % Population |
| American | 128 | 9.7% |
| Apache | 14 | 1.1% |
| Australian | 22 | 1.7% |
| Burmese | 15 | 1.1% |
| Central American | 5 | 0.4% |
| Central American Indian | 2 | 0.2% |
| Cherokee | 51 | 3.9% |
| Choctaw | 11 | 0.8% |
| Czech | 6 | 0.4% |
| Dutch | 20 | 1.5% |
| Dutch West Indian | 3 | 0.2% |
| Eastern European | 4 | 0.3% |
| English | 78 | 5.9% |
| European | 5 | 0.4% |
| French | 15 | 1.1% |
| German | 250 | 18.9% |
| Irish | 104 | 7.9% |
| Italian | 4 | 0.3% |
| Mexican | 131 | 9.9% |
| Norwegian | 15 | 1.1% |
| Pakistani | 5 | 0.4% |
| Polish | 4 | 0.3% |
| Puerto Rican | 9 | 0.7% |
| Russian | 11 | 0.8% |
| Salvadoran | 5 | 0.4% |
| Scandinavian | 3 | 0.2% |
| Scotch-Irish | 26 | 2.0% |
| Scottish | 49 | 3.7% |
| Spaniard | 4 | 0.3% |
| Sri Lankan | 3 | 0.2% |
| Swedish | 8 | 0.6% |
| Swiss | 8 | 0.6% |
| Welsh | 8 | 0.6% | View All 33 Rows |
Immigrants in Snyder
The most numerous immigrant groups reported in Snyder came from Europe (13 | 1.0%), Western Europe (13 | 1.0%), Germany (8 | 0.6%), Asia (5 | 0.4%), and Central America (5 | 0.4%), together accounting for 3.3% of all Snyder residents.
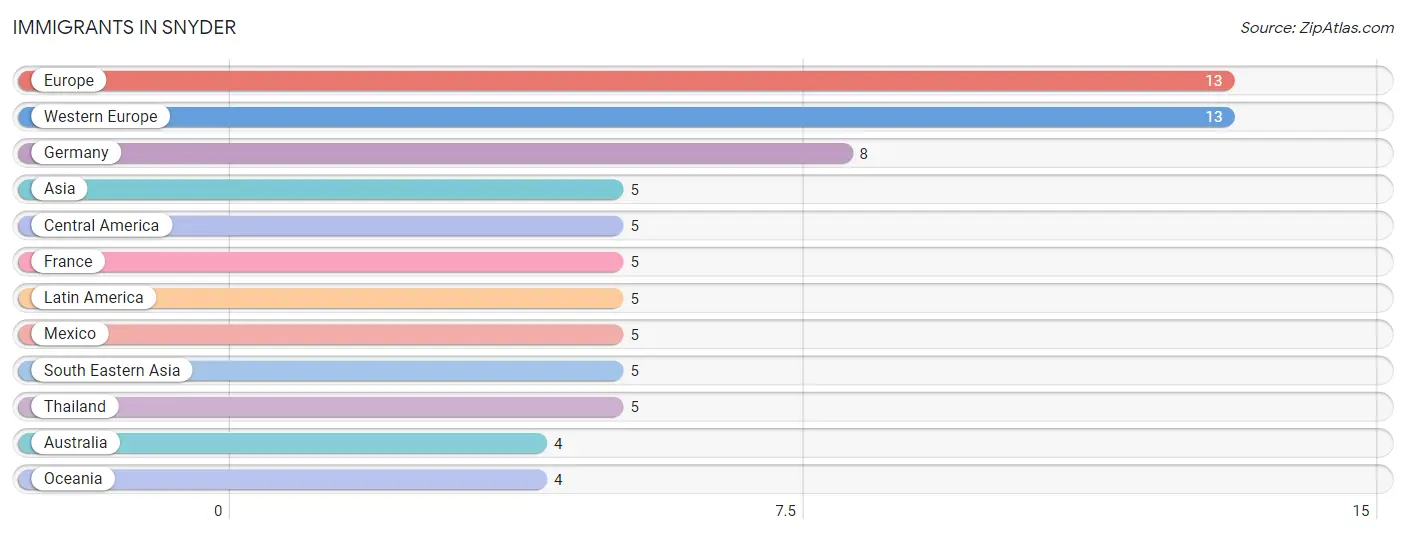
| Immigration Origin | # Population | % Population |
| Asia | 5 | 0.4% |
| Australia | 4 | 0.3% |
| Central America | 5 | 0.4% |
| Europe | 13 | 1.0% |
| France | 5 | 0.4% |
| Germany | 8 | 0.6% |
| Latin America | 5 | 0.4% |
| Mexico | 5 | 0.4% |
| Oceania | 4 | 0.3% |
| South Eastern Asia | 5 | 0.4% |
| Thailand | 5 | 0.4% |
| Western Europe | 13 | 1.0% | View All 12 Rows |
Sex and Age in Snyder
Sex and Age in Snyder
The most populous age groups in Snyder are 5 to 9 Years (68 | 10.7%) for men and 25 to 29 Years (82 | 12.0%) for women.
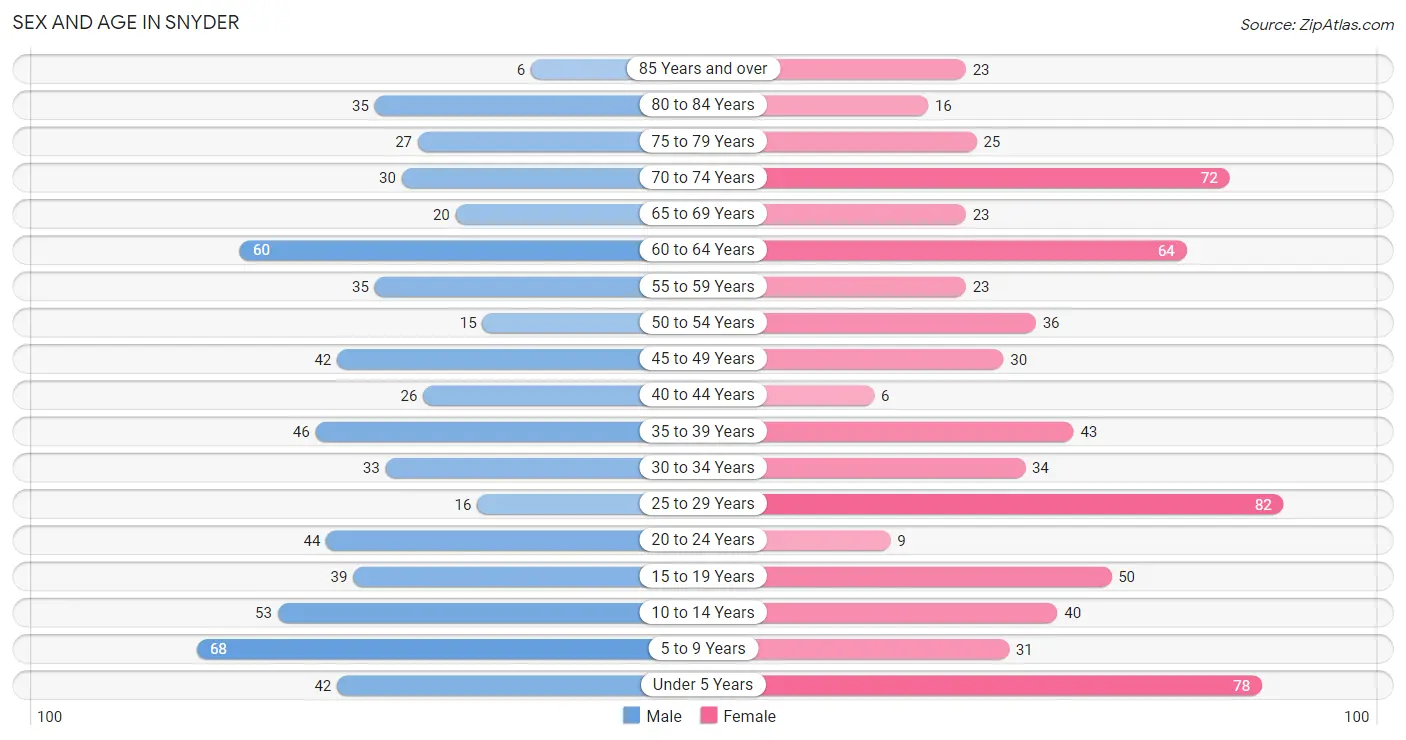
| Age Bracket | Male | Female |
| Under 5 Years | 42 (6.6%) | 78 (11.4%) |
| 5 to 9 Years | 68 (10.7%) | 31 (4.5%) |
| 10 to 14 Years | 53 (8.3%) | 40 (5.8%) |
| 15 to 19 Years | 39 (6.1%) | 50 (7.3%) |
| 20 to 24 Years | 44 (6.9%) | 9 (1.3%) |
| 25 to 29 Years | 16 (2.5%) | 82 (12.0%) |
| 30 to 34 Years | 33 (5.2%) | 34 (5.0%) |
| 35 to 39 Years | 46 (7.2%) | 43 (6.3%) |
| 40 to 44 Years | 26 (4.1%) | 6 (0.9%) |
| 45 to 49 Years | 42 (6.6%) | 30 (4.4%) |
| 50 to 54 Years | 15 (2.4%) | 36 (5.3%) |
| 55 to 59 Years | 35 (5.5%) | 23 (3.4%) |
| 60 to 64 Years | 60 (9.4%) | 64 (9.3%) |
| 65 to 69 Years | 20 (3.1%) | 23 (3.4%) |
| 70 to 74 Years | 30 (4.7%) | 72 (10.5%) |
| 75 to 79 Years | 27 (4.2%) | 25 (3.6%) |
| 80 to 84 Years | 35 (5.5%) | 16 (2.3%) |
| 85 Years and over | 6 (0.9%) | 23 (3.4%) |
| Total | 637 (100.0%) | 685 (100.0%) |
Families and Households in Snyder
Median Family Size in Snyder
The median family size in Snyder is 3.02 persons per family, with single female/mother families (68 | 19.9%) accounting for the largest median family size of 3.44 persons per family. On the other hand, single male/father families (21 | 6.1%) represent the smallest median family size with 2.62 persons per family.
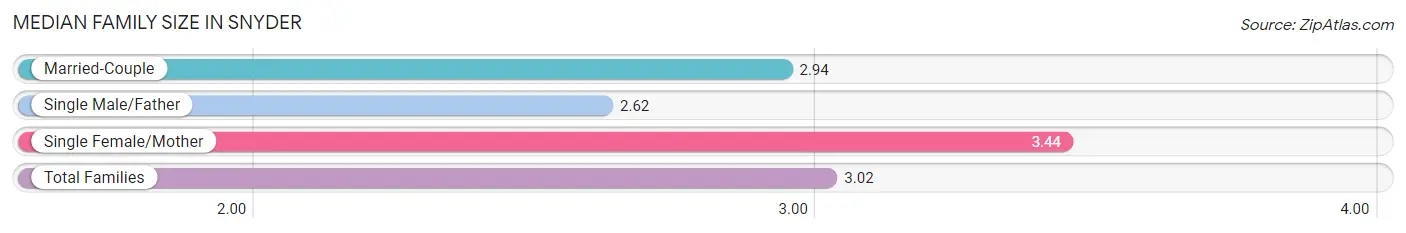
| Family Type | # Families | Family Size |
| Married-Couple | 253 (74.0%) | 2.94 |
| Single Male/Father | 21 (6.1%) | 2.62 |
| Single Female/Mother | 68 (19.9%) | 3.44 |
| Total Families | 342 (100.0%) | 3.02 |
Median Household Size in Snyder
The median household size in Snyder is 2.54 persons per household, with single male/father households (21 | 4.3%) accounting for the largest median household size of 3.71 persons per household. non-family households (147 | 30.1%) represent the smallest median household size with 1.20 persons per household.
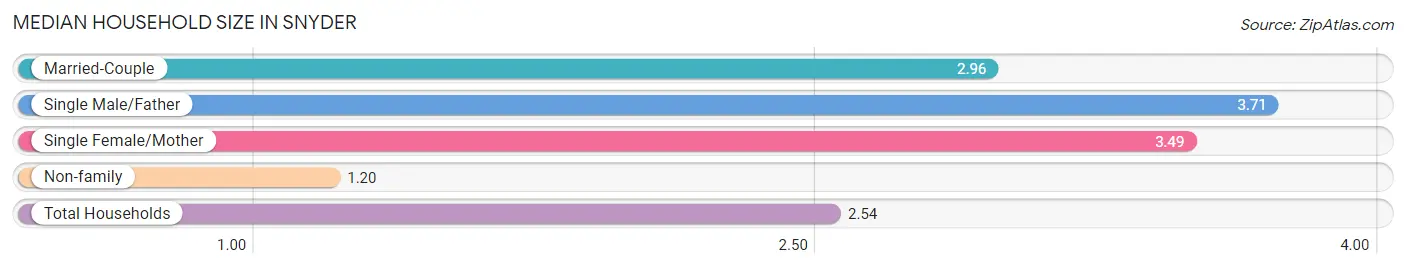
| Household Type | # Households | Household Size |
| Married-Couple | 253 (51.7%) | 2.96 |
| Single Male/Father | 21 (4.3%) | 3.71 |
| Single Female/Mother | 68 (13.9%) | 3.49 |
| Non-family | 147 (30.1%) | 1.20 |
| Total Households | 489 (100.0%) | 2.54 |
Household Size by Marriage Status in Snyder
Out of a total of 489 households in Snyder, 342 (69.9%) are family households, while 147 (30.1%) are nonfamily households. The most numerous type of family households are 2-person households, comprising 158, and the most common type of nonfamily households are 1-person households, comprising 127.
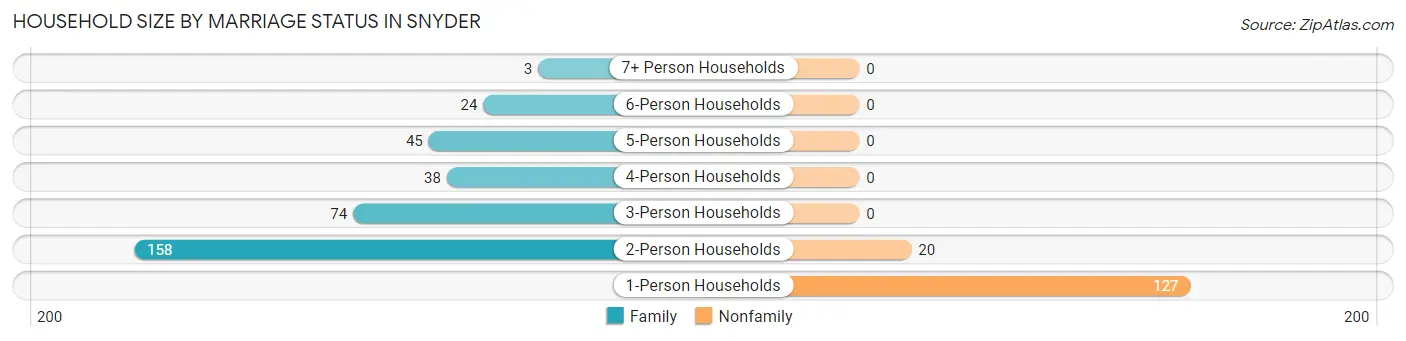
| Household Size | Family Households | Nonfamily Households |
| 1-Person Households | - | 127 (26.0%) |
| 2-Person Households | 158 (32.3%) | 20 (4.1%) |
| 3-Person Households | 74 (15.1%) | 0 (0.0%) |
| 4-Person Households | 38 (7.8%) | 0 (0.0%) |
| 5-Person Households | 45 (9.2%) | 0 (0.0%) |
| 6-Person Households | 24 (4.9%) | 0 (0.0%) |
| 7+ Person Households | 3 (0.6%) | 0 (0.0%) |
| Total | 342 (69.9%) | 147 (30.1%) |
Female Fertility in Snyder
Fertility by Age in Snyder
Average fertility rate in Snyder is 117.0 births per 1,000 women. Women in the age bracket of 20 to 34 years have the highest fertility rate with 224.0 births per 1,000 women. Women in the age bracket of 20 to 34 years acount for 90.3% of all women with births.
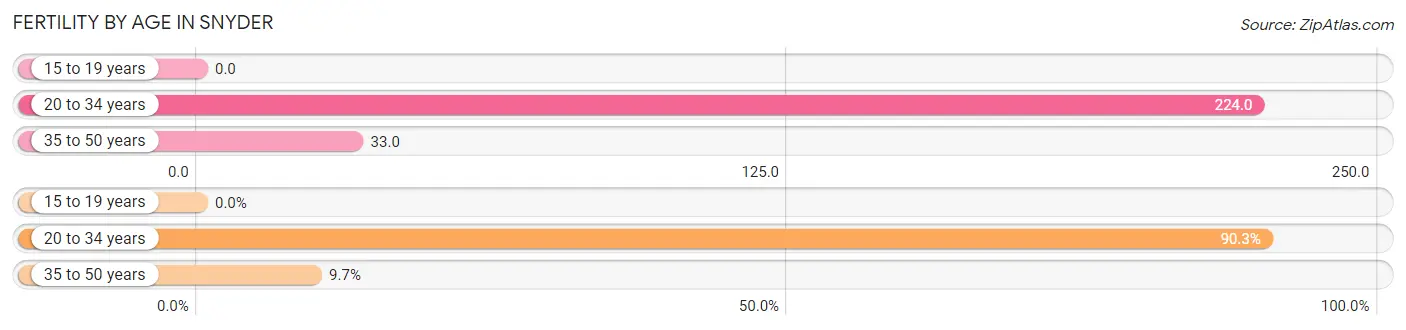
| Age Bracket | Women with Births | Births / 1,000 Women |
| 15 to 19 years | 0 (0.0%) | 0.0 |
| 20 to 34 years | 28 (90.3%) | 224.0 |
| 35 to 50 years | 3 (9.7%) | 33.0 |
| Total | 31 (100.0%) | 117.0 |
Fertility by Age by Marriage Status in Snyder
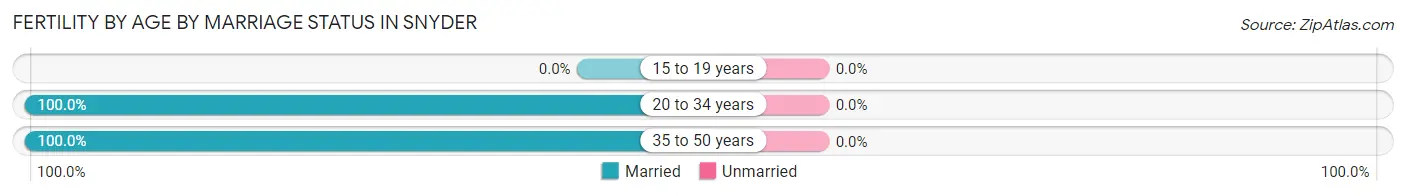
| Age Bracket | Married | Unmarried |
| 15 to 19 years | 0 (0.0%) | 0 (0.0%) |
| 20 to 34 years | 28 (100.0%) | 0 (0.0%) |
| 35 to 50 years | 3 (100.0%) | 0 (0.0%) |
| Total | 31 (100.0%) | 0 (0.0%) |
Fertility by Education in Snyder
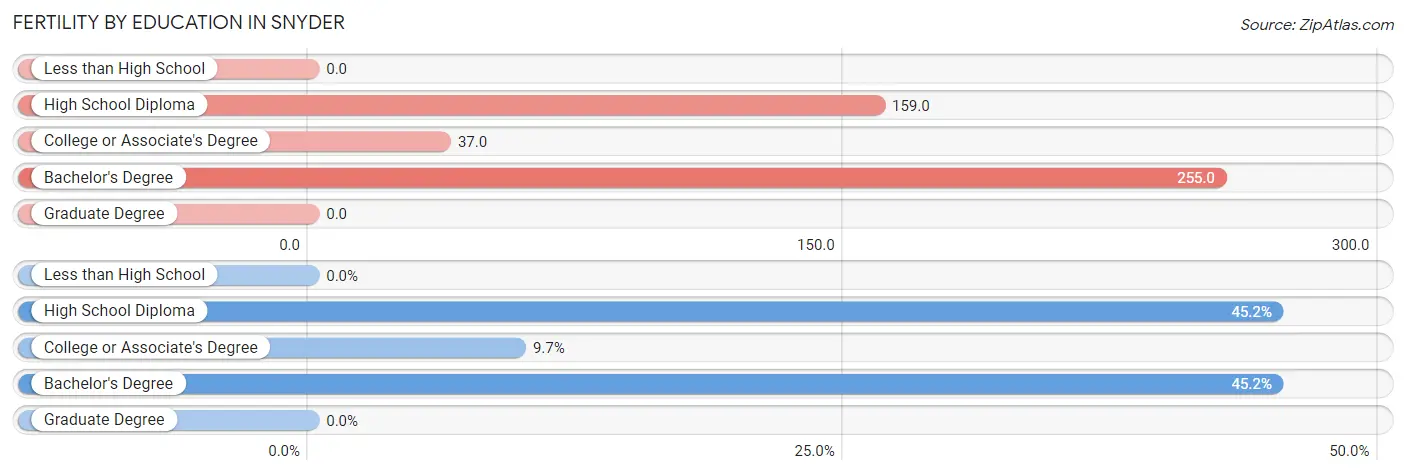
| Educational Attainment | Women with Births | Births / 1,000 Women |
| Less than High School | 0 (0.0%) | 0.0 |
| High School Diploma | 14 (45.2%) | 159.0 |
| College or Associate's Degree | 3 (9.7%) | 37.0 |
| Bachelor's Degree | 14 (45.2%) | 255.0 |
| Graduate Degree | 0 (0.0%) | 0.0 |
| Total | 31 (100.0%) | 117.0 |
Fertility by Education by Marriage Status in Snyder
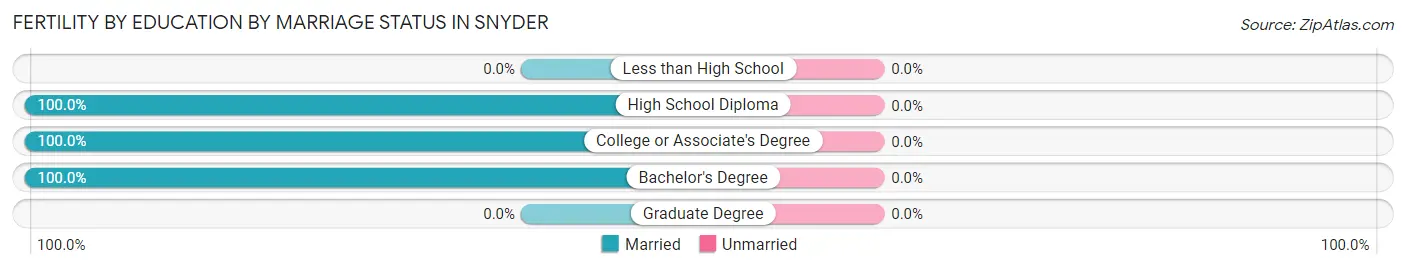
| Educational Attainment | Married | Unmarried |
| Less than High School | 0 (0.0%) | 0 (0.0%) |
| High School Diploma | 14 (100.0%) | 0 (0.0%) |
| College or Associate's Degree | 3 (100.0%) | 0 (0.0%) |
| Bachelor's Degree | 14 (100.0%) | 0 (0.0%) |
| Graduate Degree | 0 (0.0%) | 0 (0.0%) |
| Total | 31 (100.0%) | 0 (0.0%) |
Employment Characteristics in Snyder
Employment by Class of Employer in Snyder
Among the 458 employed individuals in Snyder, private company employees (214 | 46.7%), local government employees (57 | 12.4%), and federal government employees (51 | 11.1%) make up the most common classes of employment.
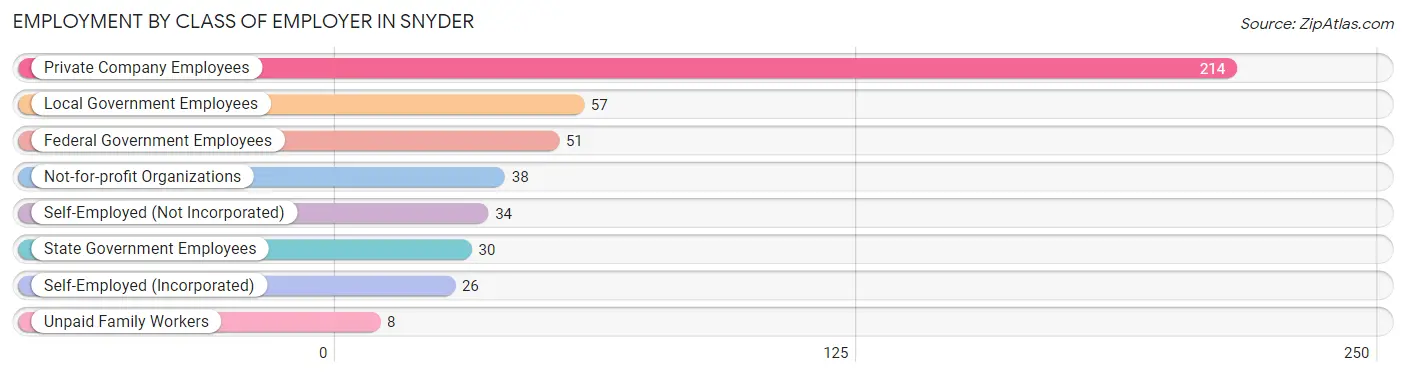
| Employer Class | # Employees | % Employees |
| Private Company Employees | 214 | 46.7% |
| Self-Employed (Incorporated) | 26 | 5.7% |
| Self-Employed (Not Incorporated) | 34 | 7.4% |
| Not-for-profit Organizations | 38 | 8.3% |
| Local Government Employees | 57 | 12.4% |
| State Government Employees | 30 | 6.6% |
| Federal Government Employees | 51 | 11.1% |
| Unpaid Family Workers | 8 | 1.8% |
| Total | 458 | 100.0% |
Employment Status by Age in Snyder
According to the labor force statistics for Snyder, out of the total population over 16 years of age (978), 52.2% or 511 individuals are in the labor force, with 3.2% or 16 of them unemployed. The age group with the highest labor force participation rate is 45 to 54 years, with 97.6% or 120 individuals in the labor force. Within the labor force, the 20 to 24 years age range has the highest percentage of unemployed individuals, with 22.7% or 5 of them being unemployed.
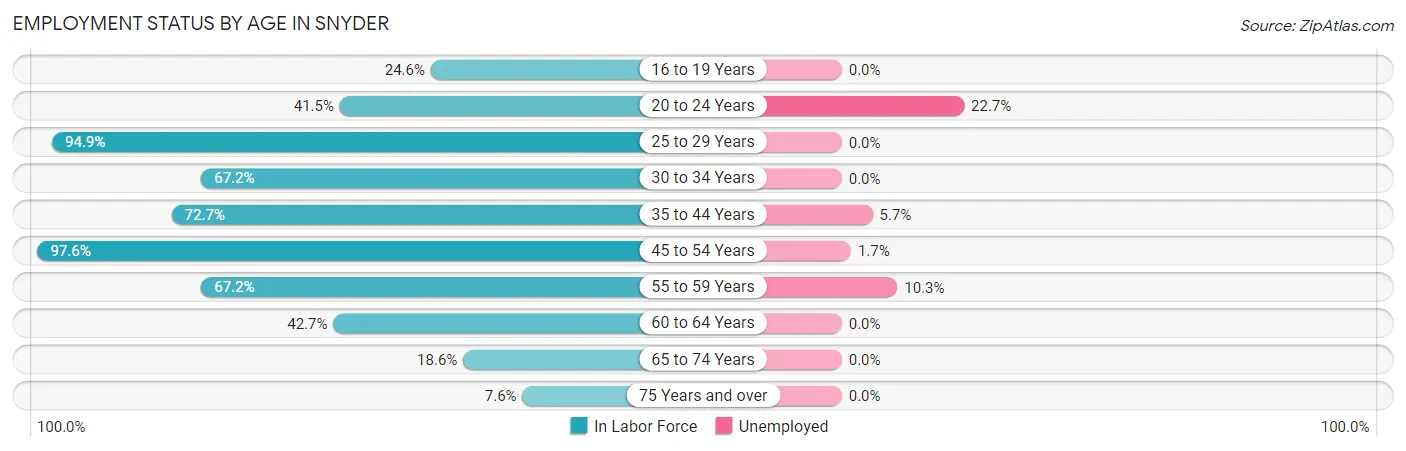
| Age Bracket | In Labor Force | Unemployed |
| 16 to 19 Years | 14 (24.6%) | 0 (0.0%) |
| 20 to 24 Years | 22 (41.5%) | 5 (22.7%) |
| 25 to 29 Years | 93 (94.9%) | 0 (0.0%) |
| 30 to 34 Years | 45 (67.2%) | 0 (0.0%) |
| 35 to 44 Years | 88 (72.7%) | 5 (5.7%) |
| 45 to 54 Years | 120 (97.6%) | 2 (1.7%) |
| 55 to 59 Years | 39 (67.2%) | 4 (10.3%) |
| 60 to 64 Years | 53 (42.7%) | 0 (0.0%) |
| 65 to 74 Years | 27 (18.6%) | 0 (0.0%) |
| 75 Years and over | 10 (7.6%) | 0 (0.0%) |
| Total | 511 (52.2%) | 16 (3.2%) |
Employment Status by Educational Attainment in Snyder
According to labor force statistics for Snyder, 74.1% of individuals (438) out of the total population between 25 and 64 years of age (591) are in the labor force, with 2.5% or 11 of them being unemployed. The group with the highest labor force participation rate are those with the educational attainment of college / associate degree, with 86.8% or 164 individuals in the labor force. Within the labor force, individuals with less than high school education have the highest percentage of unemployment, with 8.3% or 2 of them being unemployed.
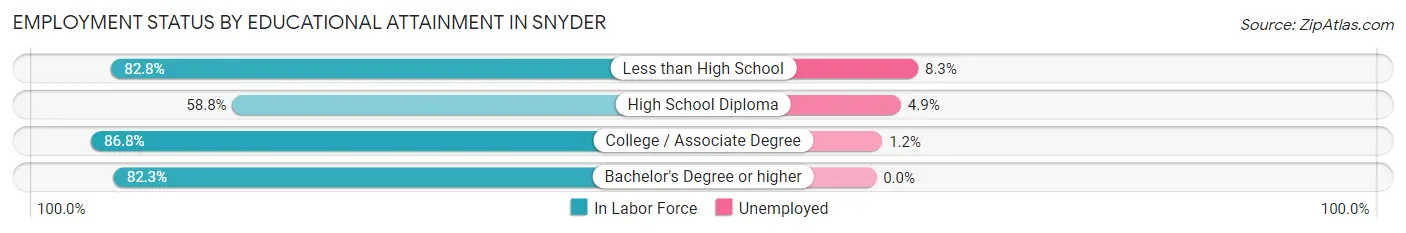
| Educational Attainment | In Labor Force | Unemployed |
| Less than High School | 24 (82.8%) | 2 (8.3%) |
| High School Diploma | 143 (58.8%) | 12 (4.9%) |
| College / Associate Degree | 164 (86.8%) | 2 (1.2%) |
| Bachelor's Degree or higher | 107 (82.3%) | 0 (0.0%) |
| Total | 438 (74.1%) | 15 (2.5%) |
Employment Occupations by Sex in Snyder
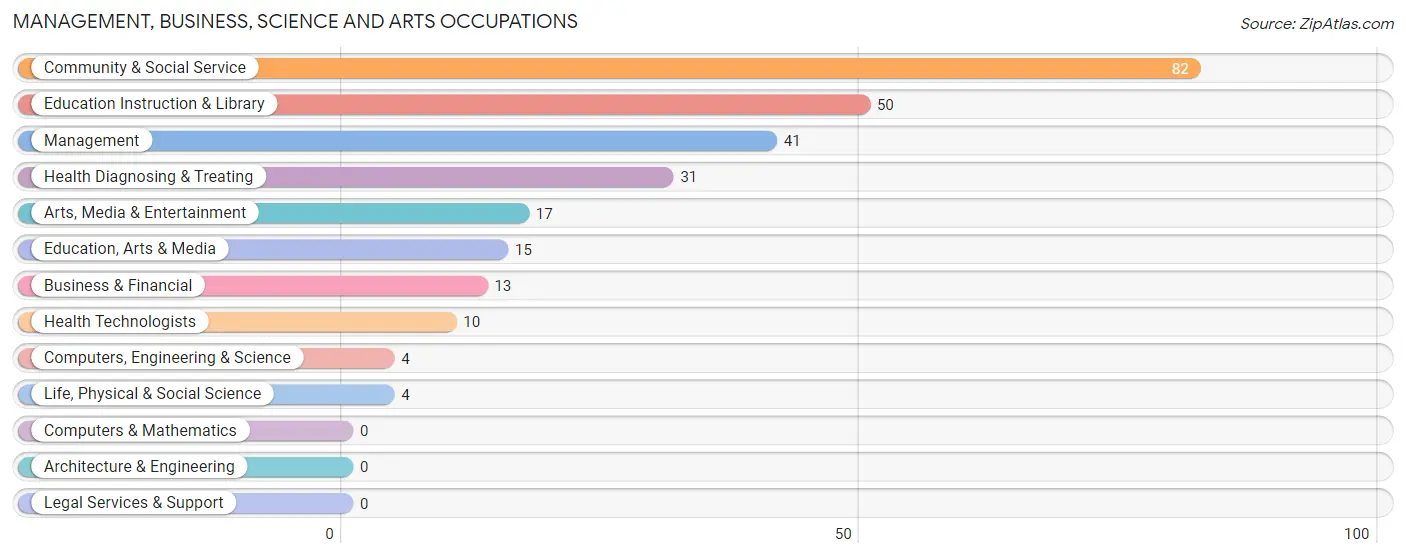
Management, Business, Science and Arts Occupations
The most common Management, Business, Science and Arts occupations in Snyder are Community & Social Service (82 | 16.8%), Education Instruction & Library (50 | 10.2%), Management (41 | 8.4%), Health Diagnosing & Treating (31 | 6.3%), and Arts, Media & Entertainment (17 | 3.5%).
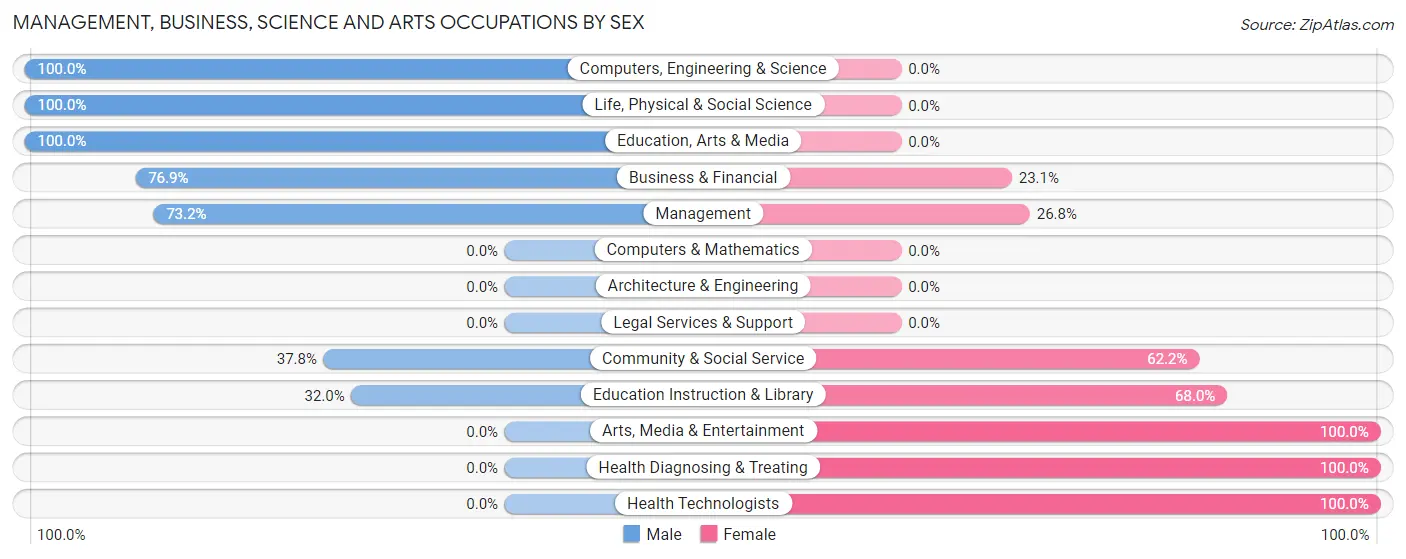
Management, Business, Science and Arts Occupations by Sex
Within the Management, Business, Science and Arts occupations in Snyder, the most male-oriented occupations are Computers, Engineering & Science (100.0%), Life, Physical & Social Science (100.0%), and Education, Arts & Media (100.0%), while the most female-oriented occupations are Arts, Media & Entertainment (100.0%), Health Diagnosing & Treating (100.0%), and Health Technologists (100.0%).
| Occupation | Male | Female |
| Management | 30 (73.2%) | 11 (26.8%) |
| Business & Financial | 10 (76.9%) | 3 (23.1%) |
| Computers, Engineering & Science | 4 (100.0%) | 0 (0.0%) |
| Computers & Mathematics | 0 (0.0%) | 0 (0.0%) |
| Architecture & Engineering | 0 (0.0%) | 0 (0.0%) |
| Life, Physical & Social Science | 4 (100.0%) | 0 (0.0%) |
| Community & Social Service | 31 (37.8%) | 51 (62.2%) |
| Education, Arts & Media | 15 (100.0%) | 0 (0.0%) |
| Legal Services & Support | 0 (0.0%) | 0 (0.0%) |
| Education Instruction & Library | 16 (32.0%) | 34 (68.0%) |
| Arts, Media & Entertainment | 0 (0.0%) | 17 (100.0%) |
| Health Diagnosing & Treating | 0 (0.0%) | 31 (100.0%) |
| Health Technologists | 0 (0.0%) | 10 (100.0%) |
| Total (Category) | 75 (43.9%) | 96 (56.1%) |
| Total (Overall) | 239 (48.9%) | 250 (51.1%) |
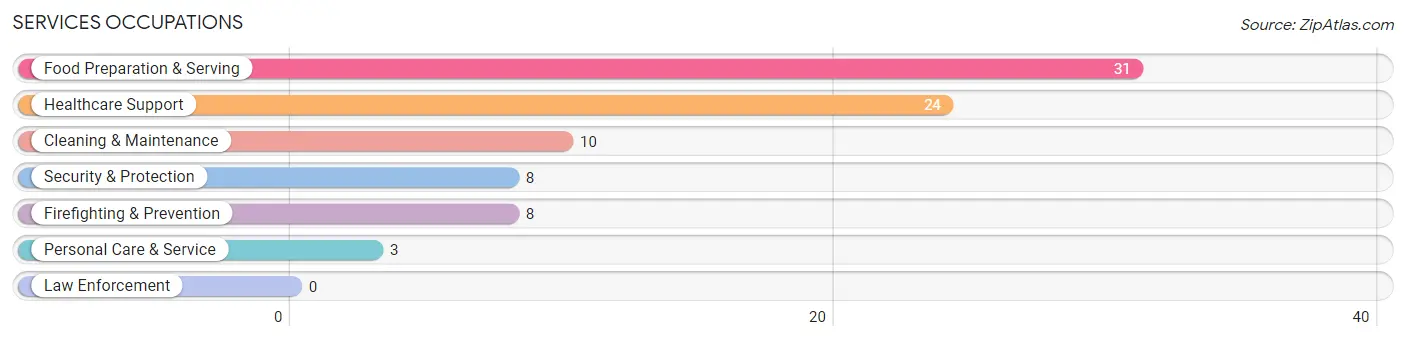
Services Occupations
The most common Services occupations in Snyder are Food Preparation & Serving (31 | 6.3%), Healthcare Support (24 | 4.9%), Cleaning & Maintenance (10 | 2.0%), Security & Protection (8 | 1.6%), and Firefighting & Prevention (8 | 1.6%).
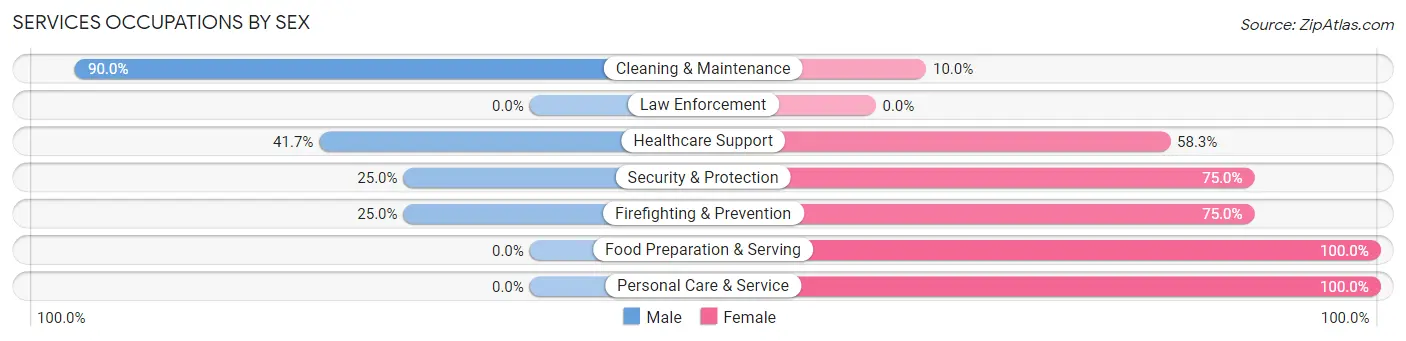
Services Occupations by Sex
Within the Services occupations in Snyder, the most male-oriented occupations are Cleaning & Maintenance (90.0%), Healthcare Support (41.7%), and Security & Protection (25.0%), while the most female-oriented occupations are Food Preparation & Serving (100.0%), Personal Care & Service (100.0%), and Security & Protection (75.0%).
| Occupation | Male | Female |
| Healthcare Support | 10 (41.7%) | 14 (58.3%) |
| Security & Protection | 2 (25.0%) | 6 (75.0%) |
| Firefighting & Prevention | 2 (25.0%) | 6 (75.0%) |
| Law Enforcement | 0 (0.0%) | 0 (0.0%) |
| Food Preparation & Serving | 0 (0.0%) | 31 (100.0%) |
| Cleaning & Maintenance | 9 (90.0%) | 1 (10.0%) |
| Personal Care & Service | 0 (0.0%) | 3 (100.0%) |
| Total (Category) | 21 (27.6%) | 55 (72.4%) |
| Total (Overall) | 239 (48.9%) | 250 (51.1%) |
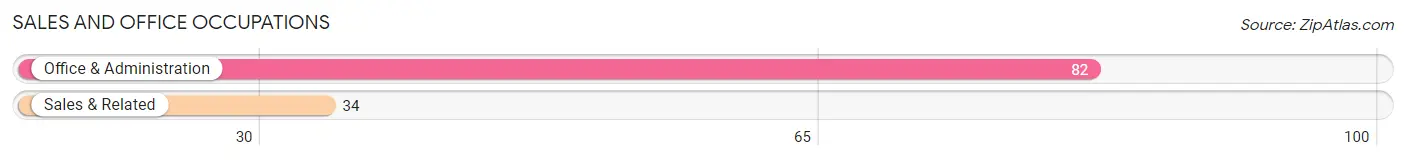
Sales and Office Occupations
The most common Sales and Office occupations in Snyder are Office & Administration (82 | 16.8%), and Sales & Related (34 | 7.0%).
Sales and Office Occupations by Sex
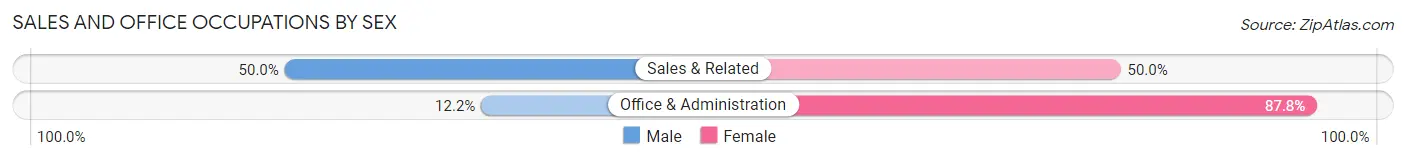
| Occupation | Male | Female |
| Sales & Related | 17 (50.0%) | 17 (50.0%) |
| Office & Administration | 10 (12.2%) | 72 (87.8%) |
| Total (Category) | 27 (23.3%) | 89 (76.7%) |
| Total (Overall) | 239 (48.9%) | 250 (51.1%) |
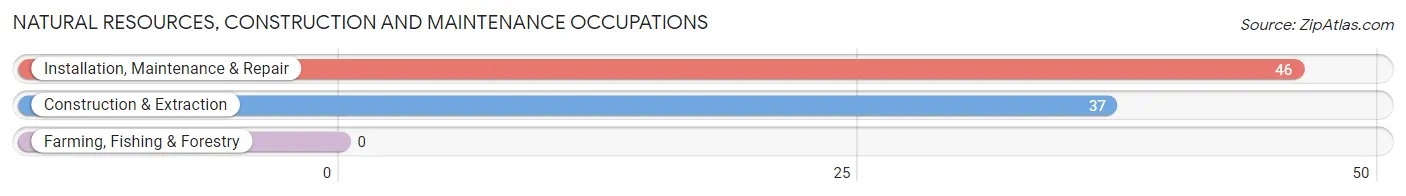
Natural Resources, Construction and Maintenance Occupations
The most common Natural Resources, Construction and Maintenance occupations in Snyder are Installation, Maintenance & Repair (46 | 9.4%), and Construction & Extraction (37 | 7.6%).
Natural Resources, Construction and Maintenance Occupations by Sex
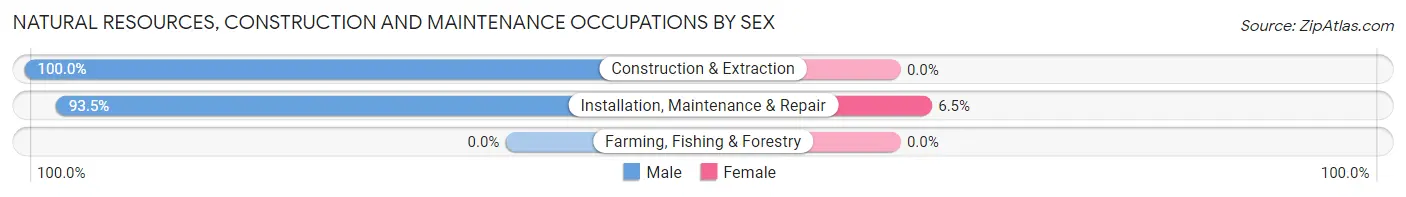
| Occupation | Male | Female |
| Farming, Fishing & Forestry | 0 (0.0%) | 0 (0.0%) |
| Construction & Extraction | 37 (100.0%) | 0 (0.0%) |
| Installation, Maintenance & Repair | 43 (93.5%) | 3 (6.5%) |
| Total (Category) | 80 (96.4%) | 3 (3.6%) |
| Total (Overall) | 239 (48.9%) | 250 (51.1%) |
Production, Transportation and Moving Occupations
The most common Production, Transportation and Moving occupations in Snyder are Transportation (20 | 4.1%), Production (13 | 2.7%), and Material Moving (10 | 2.0%).
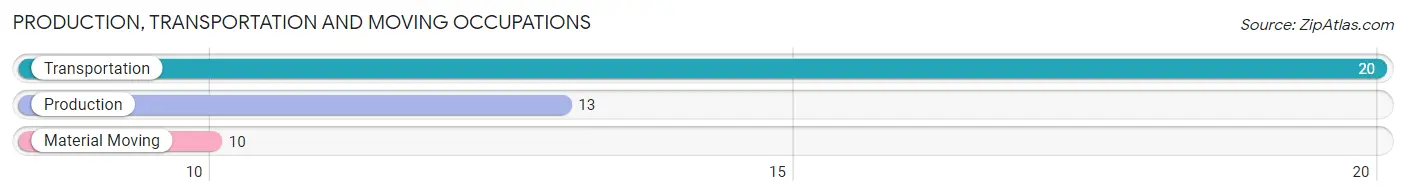
Production, Transportation and Moving Occupations by Sex
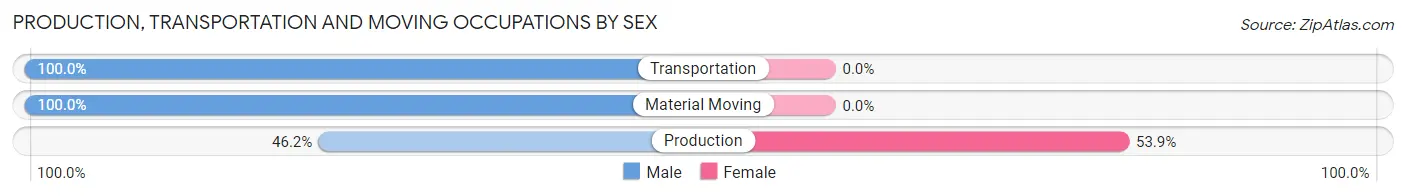
| Occupation | Male | Female |
| Production | 6 (46.2%) | 7 (53.8%) |
| Transportation | 20 (100.0%) | 0 (0.0%) |
| Material Moving | 10 (100.0%) | 0 (0.0%) |
| Total (Category) | 36 (83.7%) | 7 (16.3%) |
| Total (Overall) | 239 (48.9%) | 250 (51.1%) |
Employment Industries by Sex in Snyder
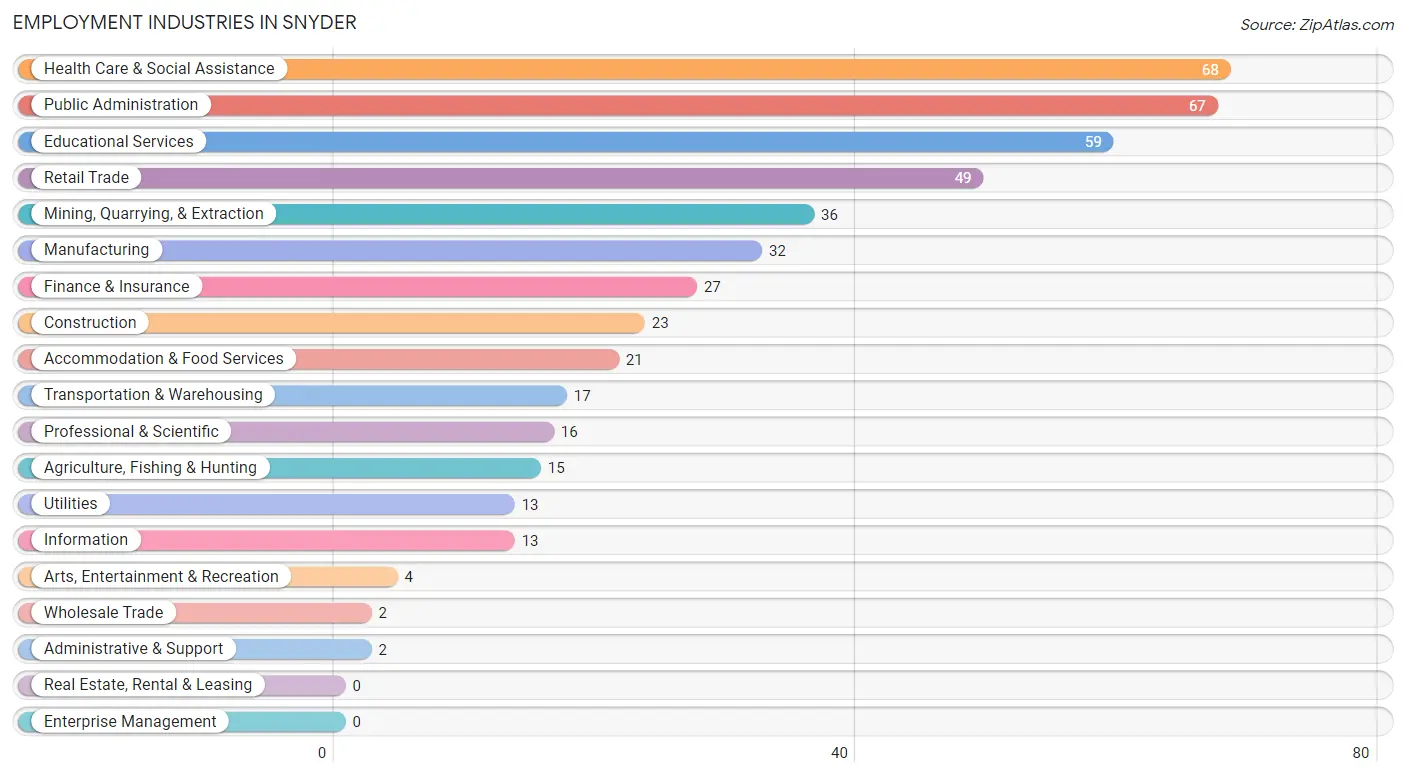
Employment Industries in Snyder
The major employment industries in Snyder include Health Care & Social Assistance (68 | 13.9%), Public Administration (67 | 13.7%), Educational Services (59 | 12.1%), Retail Trade (49 | 10.0%), and Mining, Quarrying, & Extraction (36 | 7.4%).
Employment Industries by Sex in Snyder
The Snyder industries that see more men than women are Agriculture, Fishing & Hunting (100.0%), Wholesale Trade (100.0%), and Transportation & Warehousing (100.0%), whereas the industries that tend to have a higher number of women are Information (100.0%), Administrative & Support (100.0%), and Arts, Entertainment & Recreation (100.0%).
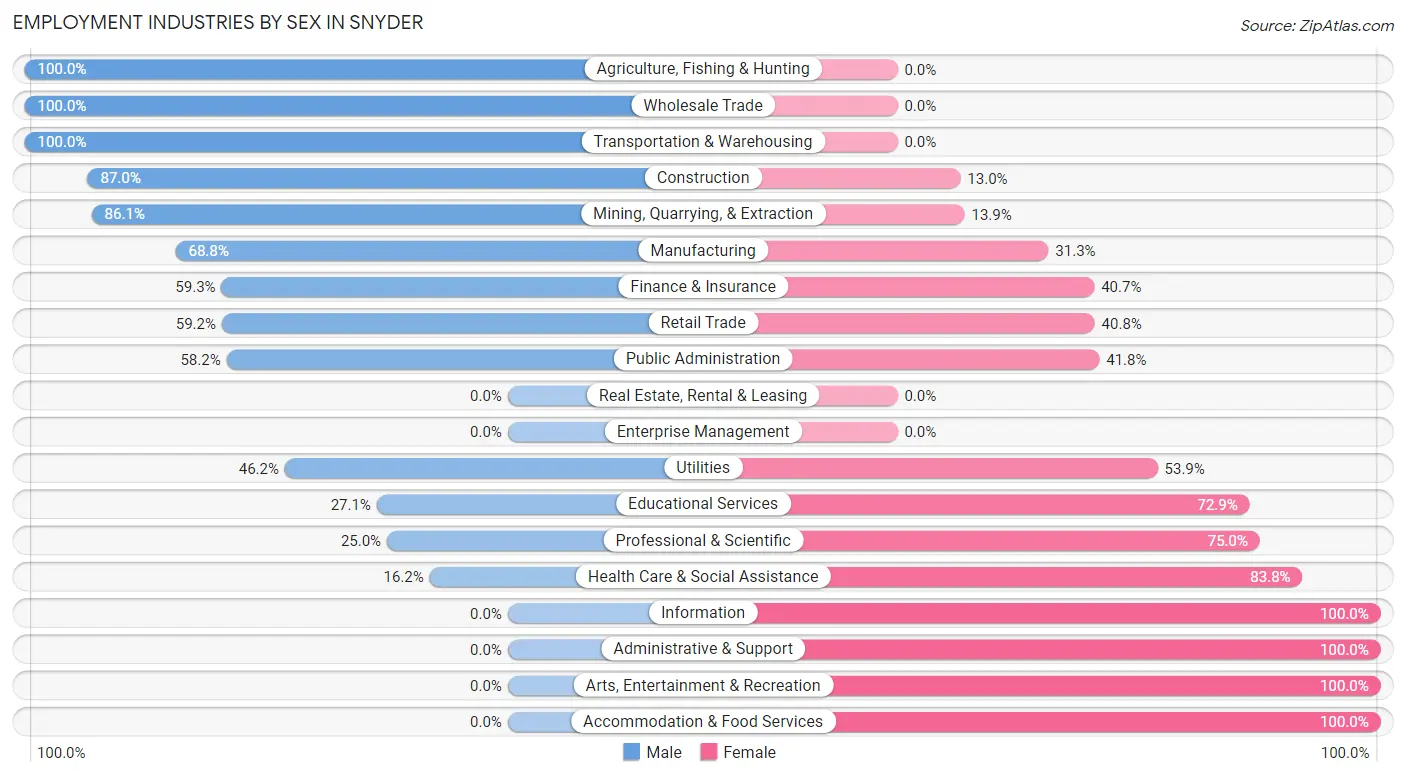
| Industry | Male | Female |
| Agriculture, Fishing & Hunting | 15 (100.0%) | 0 (0.0%) |
| Mining, Quarrying, & Extraction | 31 (86.1%) | 5 (13.9%) |
| Construction | 20 (87.0%) | 3 (13.0%) |
| Manufacturing | 22 (68.8%) | 10 (31.2%) |
| Wholesale Trade | 2 (100.0%) | 0 (0.0%) |
| Retail Trade | 29 (59.2%) | 20 (40.8%) |
| Transportation & Warehousing | 17 (100.0%) | 0 (0.0%) |
| Utilities | 6 (46.2%) | 7 (53.8%) |
| Information | 0 (0.0%) | 13 (100.0%) |
| Finance & Insurance | 16 (59.3%) | 11 (40.7%) |
| Real Estate, Rental & Leasing | 0 (0.0%) | 0 (0.0%) |
| Professional & Scientific | 4 (25.0%) | 12 (75.0%) |
| Enterprise Management | 0 (0.0%) | 0 (0.0%) |
| Administrative & Support | 0 (0.0%) | 2 (100.0%) |
| Educational Services | 16 (27.1%) | 43 (72.9%) |
| Health Care & Social Assistance | 11 (16.2%) | 57 (83.8%) |
| Arts, Entertainment & Recreation | 0 (0.0%) | 4 (100.0%) |
| Accommodation & Food Services | 0 (0.0%) | 21 (100.0%) |
| Public Administration | 39 (58.2%) | 28 (41.8%) |
| Total | 239 (48.9%) | 250 (51.1%) |
Education in Snyder
School Enrollment in Snyder
The most common levels of schooling among the 308 students in Snyder are elementary school (102 | 33.1%), high school (75 | 24.3%), and middle school (62 | 20.1%).
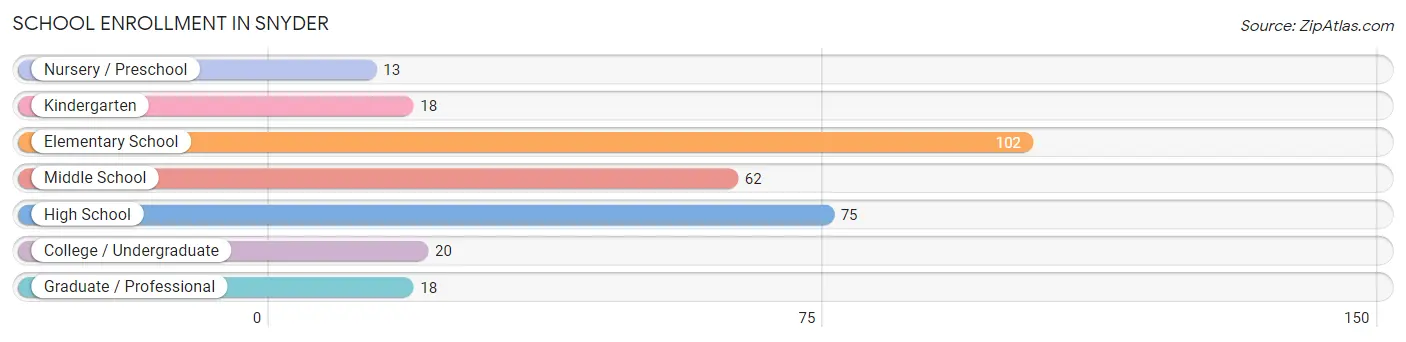
| School Level | # Students | % Students |
| Nursery / Preschool | 13 | 4.2% |
| Kindergarten | 18 | 5.8% |
| Elementary School | 102 | 33.1% |
| Middle School | 62 | 20.1% |
| High School | 75 | 24.3% |
| College / Undergraduate | 20 | 6.5% |
| Graduate / Professional | 18 | 5.8% |
| Total | 308 | 100.0% |
School Enrollment by Age by Funding Source in Snyder
Out of a total of 308 students who are enrolled in schools in Snyder, 17 (5.5%) attend a private institution, while the remaining 291 (94.5%) are enrolled in public schools. The age group of 25 to 34 year olds has the highest likelihood of being enrolled in private schools, with 5 (23.8% in the age bracket) enrolled. Conversely, the age group of 3 to 4 year olds has the lowest likelihood of being enrolled in a private school, with 16 (100.0% in the age bracket) attending a public institution.
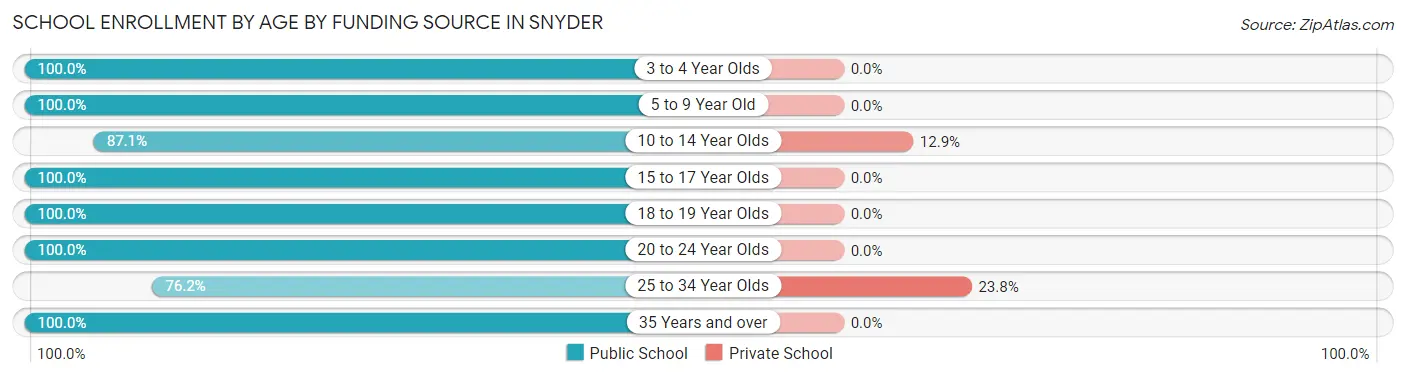
| Age Bracket | Public School | Private School |
| 3 to 4 Year Olds | 16 (100.0%) | 0 (0.0%) |
| 5 to 9 Year Old | 99 (100.0%) | 0 (0.0%) |
| 10 to 14 Year Olds | 81 (87.1%) | 12 (12.9%) |
| 15 to 17 Year Olds | 54 (100.0%) | 0 (0.0%) |
| 18 to 19 Year Olds | 20 (100.0%) | 0 (0.0%) |
| 20 to 24 Year Olds | 3 (100.0%) | 0 (0.0%) |
| 25 to 34 Year Olds | 16 (76.2%) | 5 (23.8%) |
| 35 Years and over | 2 (100.0%) | 0 (0.0%) |
| Total | 291 (94.5%) | 17 (5.5%) |
Educational Attainment by Field of Study in Snyder
Education (45 | 28.3%), business (24 | 15.1%), arts & humanities (21 | 13.2%), liberal arts & history (16 | 10.1%), and communications (13 | 8.2%) are the most common fields of study among 159 individuals in Snyder who have obtained a bachelor's degree or higher.
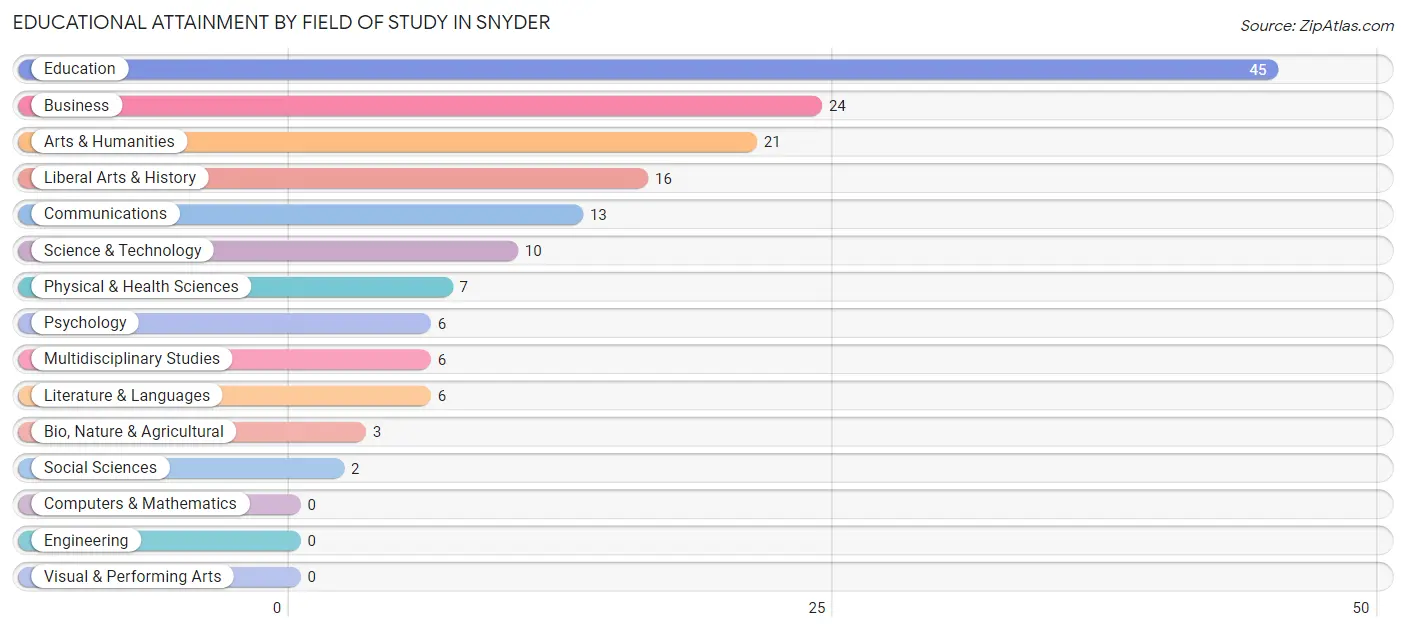
| Field of Study | # Graduates | % Graduates |
| Computers & Mathematics | 0 | 0.0% |
| Bio, Nature & Agricultural | 3 | 1.9% |
| Physical & Health Sciences | 7 | 4.4% |
| Psychology | 6 | 3.8% |
| Social Sciences | 2 | 1.3% |
| Engineering | 0 | 0.0% |
| Multidisciplinary Studies | 6 | 3.8% |
| Science & Technology | 10 | 6.3% |
| Business | 24 | 15.1% |
| Education | 45 | 28.3% |
| Literature & Languages | 6 | 3.8% |
| Liberal Arts & History | 16 | 10.1% |
| Visual & Performing Arts | 0 | 0.0% |
| Communications | 13 | 8.2% |
| Arts & Humanities | 21 | 13.2% |
| Total | 159 | 100.0% |
Transportation & Commute in Snyder
Vehicle Availability by Sex in Snyder
The most prevalent vehicle ownership categories in Snyder are males with 2 vehicles (105, accounting for 45.5%) and females with 2 vehicles (88, making up 46.3%).
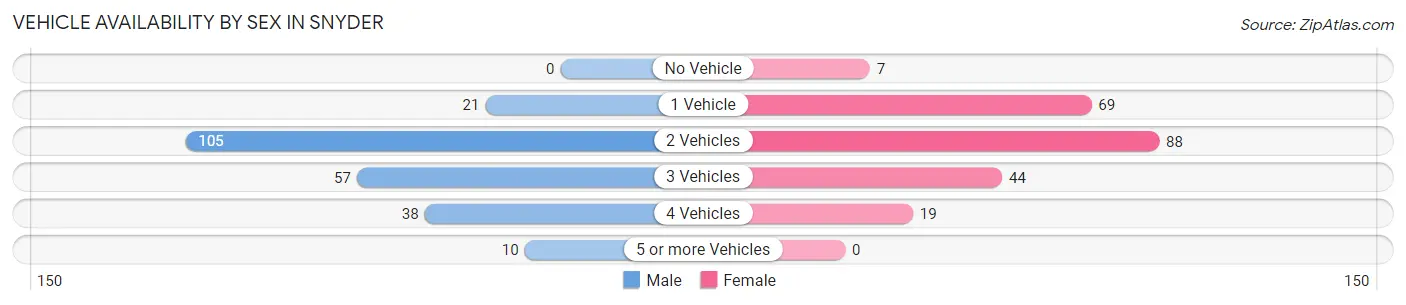
| Vehicles Available | Male | Female |
| No Vehicle | 0 (0.0%) | 7 (3.1%) |
| 1 Vehicle | 21 (9.1%) | 69 (30.4%) |
| 2 Vehicles | 105 (45.5%) | 88 (38.8%) |
| 3 Vehicles | 57 (24.7%) | 44 (19.4%) |
| 4 Vehicles | 38 (16.5%) | 19 (8.4%) |
| 5 or more Vehicles | 10 (4.3%) | 0 (0.0%) |
| Total | 231 (100.0%) | 227 (100.0%) |
Commute Time in Snyder
The most frequently occuring commute durations in Snyder are 30 to 34 minutes (88 commuters, 21.4%), 5 to 9 minutes (86 commuters, 20.9%), and less than 5 minutes (47 commuters, 11.4%).
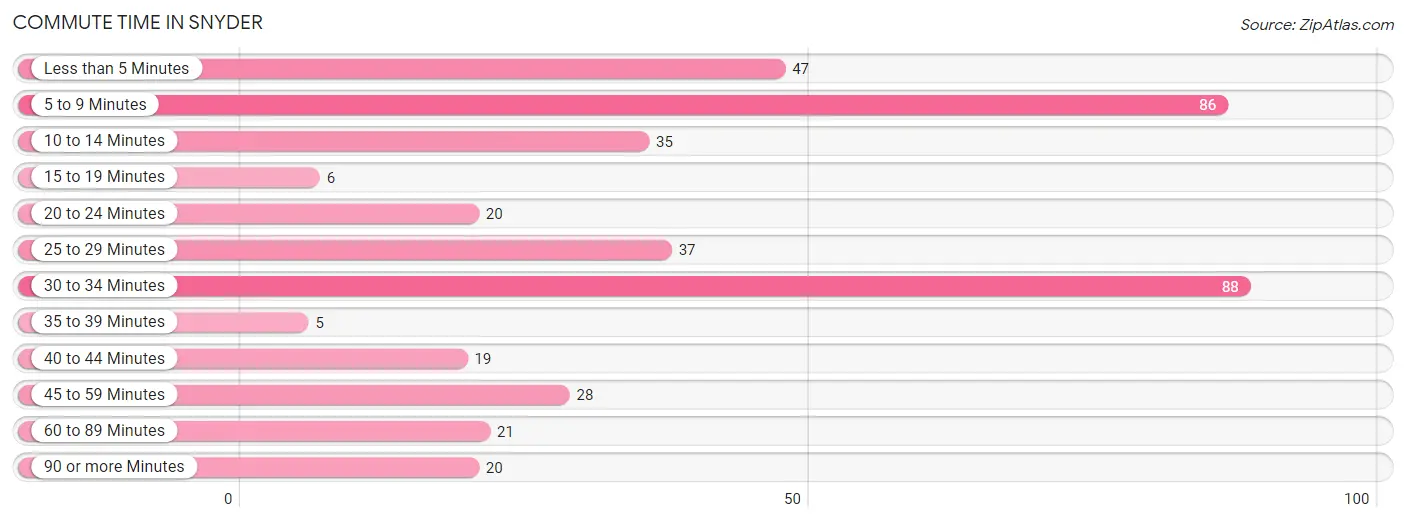
| Commute Time | # Commuters | % Commuters |
| Less than 5 Minutes | 47 | 11.4% |
| 5 to 9 Minutes | 86 | 20.9% |
| 10 to 14 Minutes | 35 | 8.5% |
| 15 to 19 Minutes | 6 | 1.5% |
| 20 to 24 Minutes | 20 | 4.9% |
| 25 to 29 Minutes | 37 | 9.0% |
| 30 to 34 Minutes | 88 | 21.4% |
| 35 to 39 Minutes | 5 | 1.2% |
| 40 to 44 Minutes | 19 | 4.6% |
| 45 to 59 Minutes | 28 | 6.8% |
| 60 to 89 Minutes | 21 | 5.1% |
| 90 or more Minutes | 20 | 4.9% |
Commute Time by Sex in Snyder
The most common commute times in Snyder are 30 to 34 minutes (47 commuters, 22.9%) for males and 5 to 9 minutes (54 commuters, 26.1%) for females.
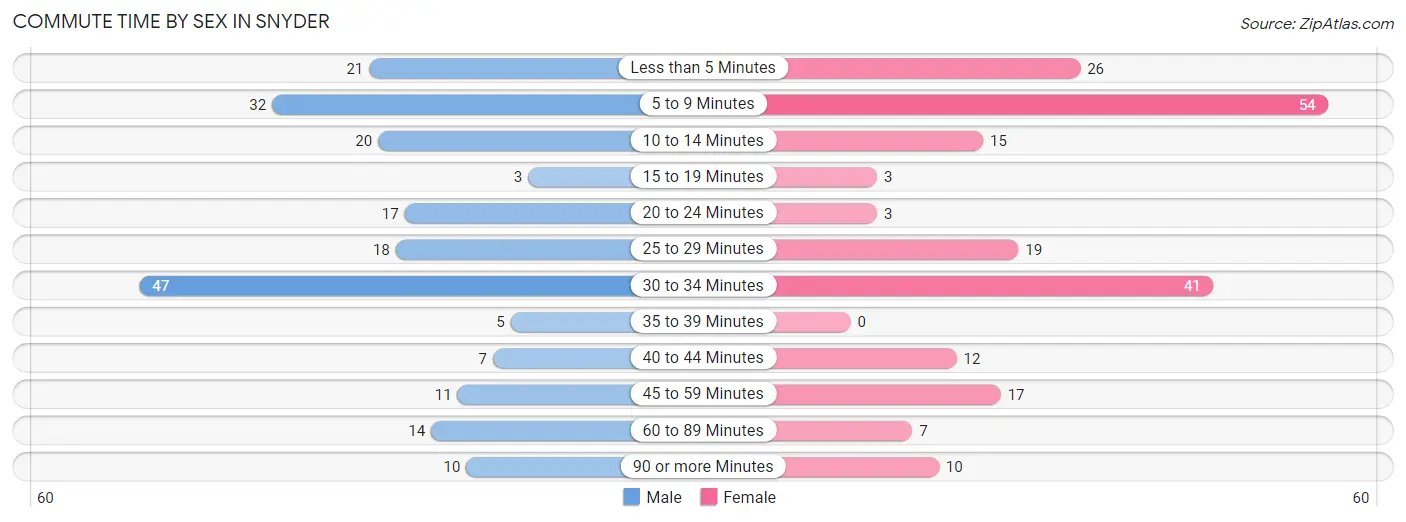
| Commute Time | Male | Female |
| Less than 5 Minutes | 21 (10.2%) | 26 (12.6%) |
| 5 to 9 Minutes | 32 (15.6%) | 54 (26.1%) |
| 10 to 14 Minutes | 20 (9.8%) | 15 (7.2%) |
| 15 to 19 Minutes | 3 (1.5%) | 3 (1.5%) |
| 20 to 24 Minutes | 17 (8.3%) | 3 (1.5%) |
| 25 to 29 Minutes | 18 (8.8%) | 19 (9.2%) |
| 30 to 34 Minutes | 47 (22.9%) | 41 (19.8%) |
| 35 to 39 Minutes | 5 (2.4%) | 0 (0.0%) |
| 40 to 44 Minutes | 7 (3.4%) | 12 (5.8%) |
| 45 to 59 Minutes | 11 (5.4%) | 17 (8.2%) |
| 60 to 89 Minutes | 14 (6.8%) | 7 (3.4%) |
| 90 or more Minutes | 10 (4.9%) | 10 (4.8%) |
Time of Departure to Work by Sex in Snyder
The most frequent times of departure to work in Snyder are 5:00 AM to 5:29 AM (30, 14.6%) for males and 7:30 AM to 7:59 AM (47, 22.7%) for females.
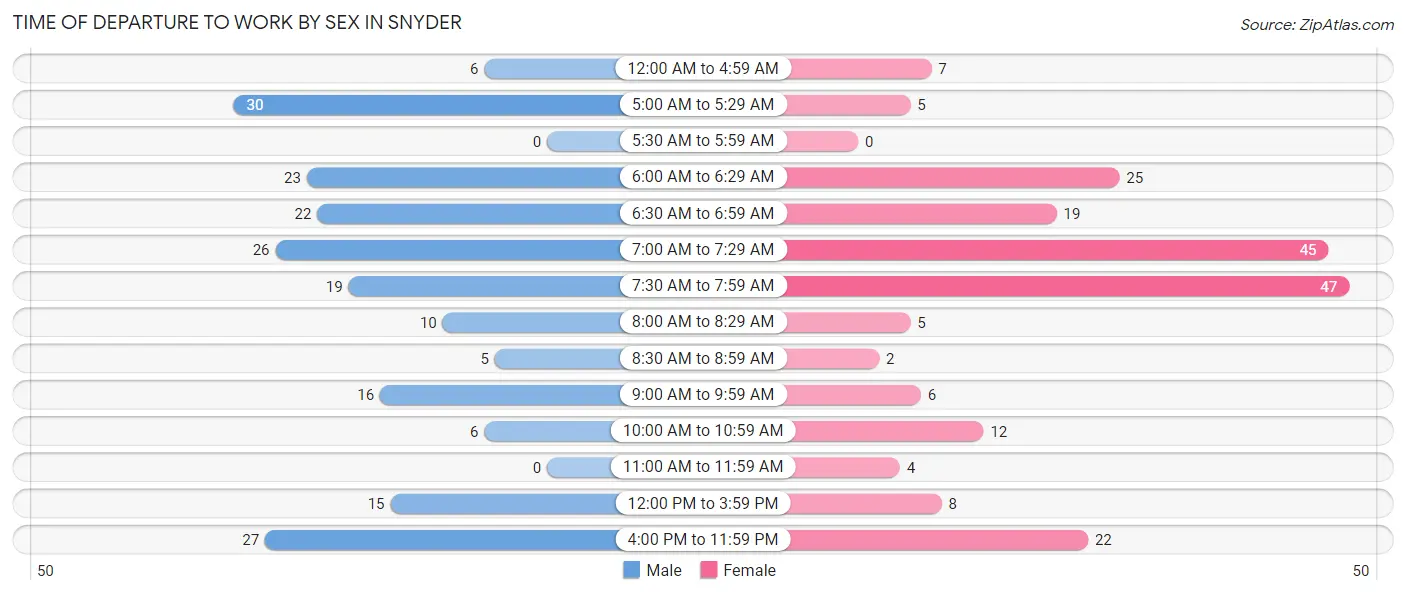
| Time of Departure | Male | Female |
| 12:00 AM to 4:59 AM | 6 (2.9%) | 7 (3.4%) |
| 5:00 AM to 5:29 AM | 30 (14.6%) | 5 (2.4%) |
| 5:30 AM to 5:59 AM | 0 (0.0%) | 0 (0.0%) |
| 6:00 AM to 6:29 AM | 23 (11.2%) | 25 (12.1%) |
| 6:30 AM to 6:59 AM | 22 (10.7%) | 19 (9.2%) |
| 7:00 AM to 7:29 AM | 26 (12.7%) | 45 (21.7%) |
| 7:30 AM to 7:59 AM | 19 (9.3%) | 47 (22.7%) |
| 8:00 AM to 8:29 AM | 10 (4.9%) | 5 (2.4%) |
| 8:30 AM to 8:59 AM | 5 (2.4%) | 2 (1.0%) |
| 9:00 AM to 9:59 AM | 16 (7.8%) | 6 (2.9%) |
| 10:00 AM to 10:59 AM | 6 (2.9%) | 12 (5.8%) |
| 11:00 AM to 11:59 AM | 0 (0.0%) | 4 (1.9%) |
| 12:00 PM to 3:59 PM | 15 (7.3%) | 8 (3.9%) |
| 4:00 PM to 11:59 PM | 27 (13.2%) | 22 (10.6%) |
| Total | 205 (100.0%) | 207 (100.0%) |
Housing Occupancy in Snyder
Occupancy by Ownership in Snyder
Of the total 489 dwellings in Snyder, owner-occupied units account for 341 (69.7%), while renter-occupied units make up 148 (30.3%).
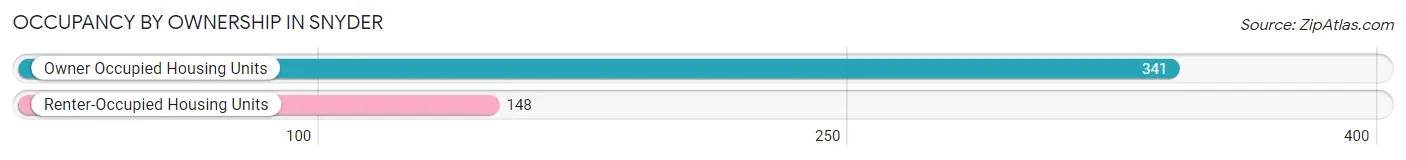
| Occupancy | # Housing Units | % Housing Units |
| Owner Occupied Housing Units | 341 | 69.7% |
| Renter-Occupied Housing Units | 148 | 30.3% |
| Total Occupied Housing Units | 489 | 100.0% |
Occupancy by Household Size in Snyder
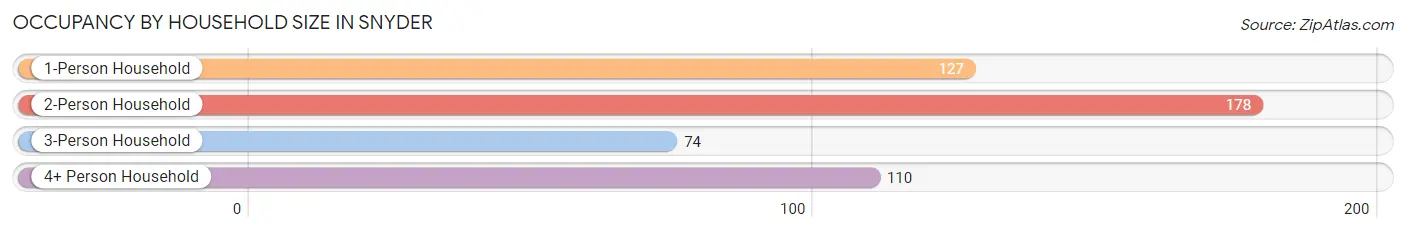
| Household Size | # Housing Units | % Housing Units |
| 1-Person Household | 127 | 26.0% |
| 2-Person Household | 178 | 36.4% |
| 3-Person Household | 74 | 15.1% |
| 4+ Person Household | 110 | 22.5% |
| Total Housing Units | 489 | 100.0% |
Occupancy by Ownership by Household Size in Snyder
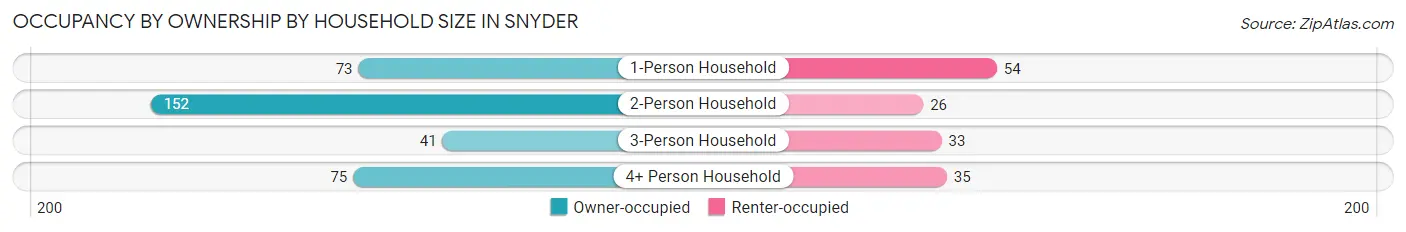
| Household Size | Owner-occupied | Renter-occupied |
| 1-Person Household | 73 (57.5%) | 54 (42.5%) |
| 2-Person Household | 152 (85.4%) | 26 (14.6%) |
| 3-Person Household | 41 (55.4%) | 33 (44.6%) |
| 4+ Person Household | 75 (68.2%) | 35 (31.8%) |
| Total Housing Units | 341 (69.7%) | 148 (30.3%) |
Occupancy by Educational Attainment in Snyder
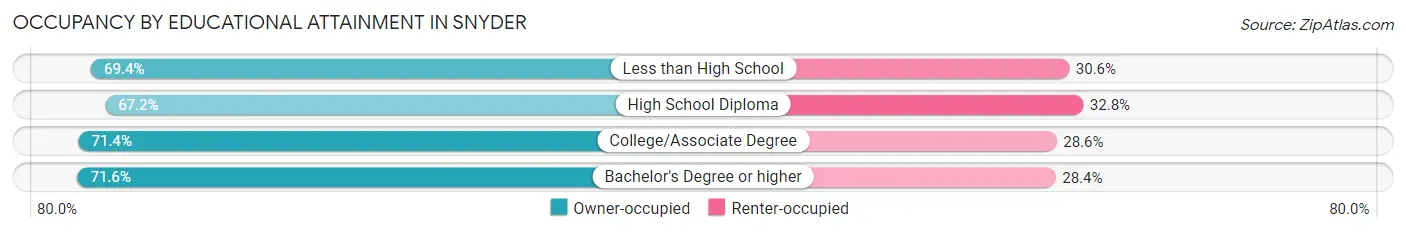
| Household Size | Owner-occupied | Renter-occupied |
| Less than High School | 25 (69.4%) | 11 (30.6%) |
| High School Diploma | 123 (67.2%) | 60 (32.8%) |
| College/Associate Degree | 130 (71.4%) | 52 (28.6%) |
| Bachelor's Degree or higher | 63 (71.6%) | 25 (28.4%) |
Occupancy by Age of Householder in Snyder
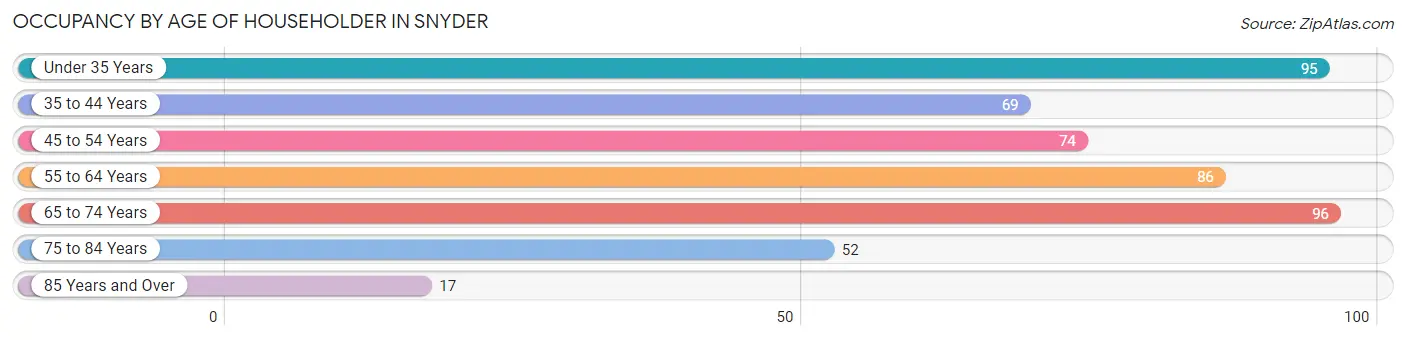
| Age Bracket | # Households | % Households |
| Under 35 Years | 95 | 19.4% |
| 35 to 44 Years | 69 | 14.1% |
| 45 to 54 Years | 74 | 15.1% |
| 55 to 64 Years | 86 | 17.6% |
| 65 to 74 Years | 96 | 19.6% |
| 75 to 84 Years | 52 | 10.6% |
| 85 Years and Over | 17 | 3.5% |
| Total | 489 | 100.0% |
Housing Finances in Snyder
Median Income by Occupancy in Snyder
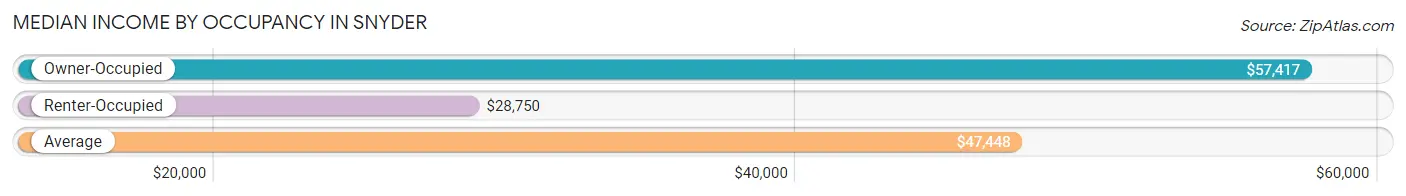
| Occupancy Type | # Households | Median Income |
| Owner-Occupied | 341 (69.7%) | $57,417 |
| Renter-Occupied | 148 (30.3%) | $28,750 |
| Average | 489 (100.0%) | $47,448 |
Occupancy by Householder Income Bracket in Snyder
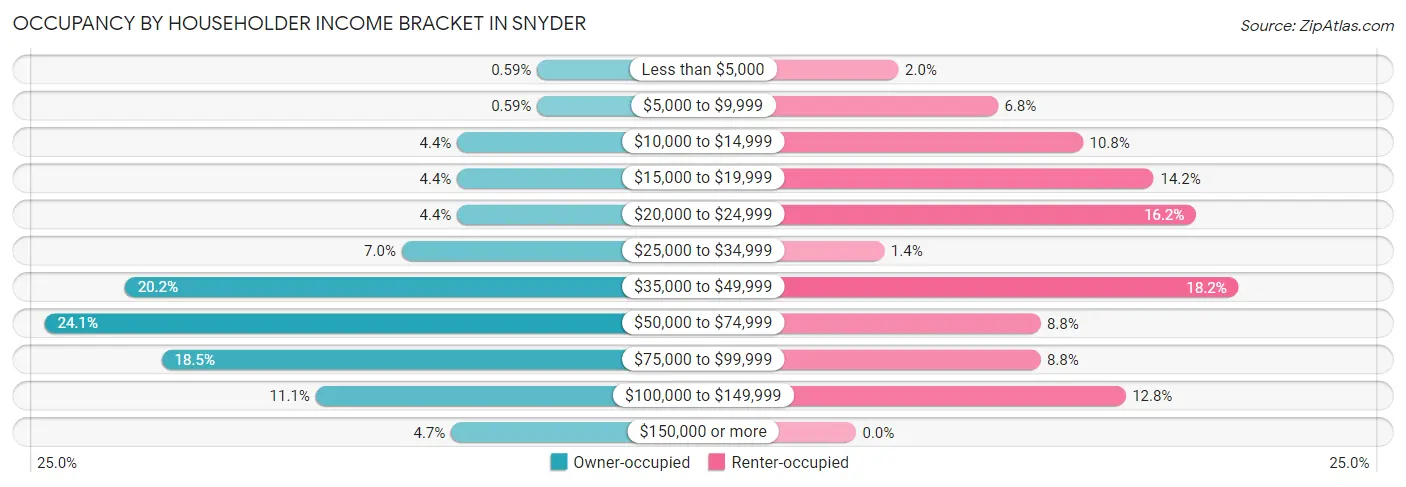
| Income Bracket | Owner-occupied | Renter-occupied |
| Less than $5,000 | 2 (0.6%) | 3 (2.0%) |
| $5,000 to $9,999 | 2 (0.6%) | 10 (6.8%) |
| $10,000 to $14,999 | 15 (4.4%) | 16 (10.8%) |
| $15,000 to $19,999 | 15 (4.4%) | 21 (14.2%) |
| $20,000 to $24,999 | 15 (4.4%) | 24 (16.2%) |
| $25,000 to $34,999 | 24 (7.0%) | 2 (1.3%) |
| $35,000 to $49,999 | 69 (20.2%) | 27 (18.2%) |
| $50,000 to $74,999 | 82 (24.0%) | 13 (8.8%) |
| $75,000 to $99,999 | 63 (18.5%) | 13 (8.8%) |
| $100,000 to $149,999 | 38 (11.1%) | 19 (12.8%) |
| $150,000 or more | 16 (4.7%) | 0 (0.0%) |
| Total | 341 (100.0%) | 148 (100.0%) |
Monthly Housing Cost Tiers in Snyder
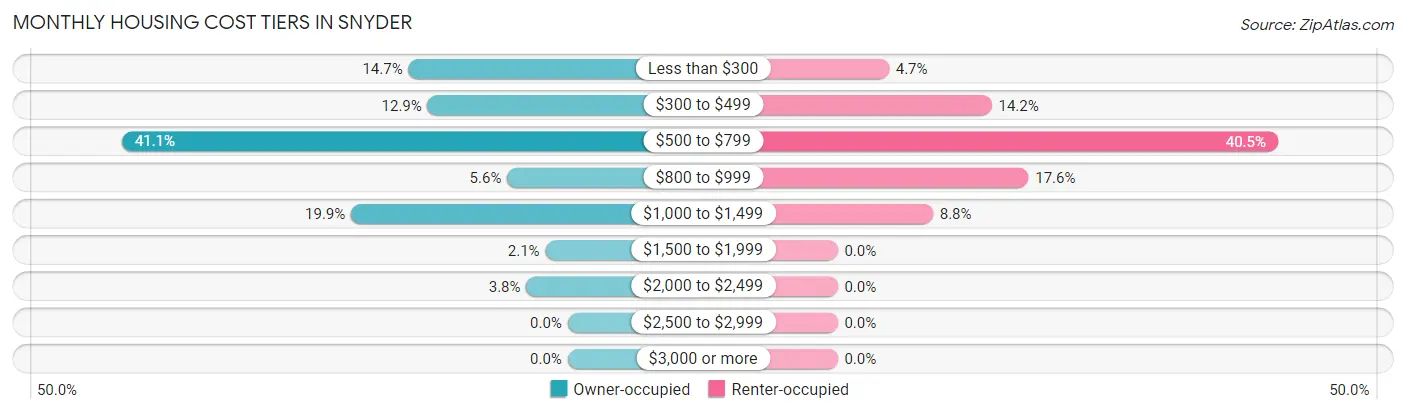
| Monthly Cost | Owner-occupied | Renter-occupied |
| Less than $300 | 50 (14.7%) | 7 (4.7%) |
| $300 to $499 | 44 (12.9%) | 21 (14.2%) |
| $500 to $799 | 140 (41.1%) | 60 (40.5%) |
| $800 to $999 | 19 (5.6%) | 26 (17.6%) |
| $1,000 to $1,499 | 68 (19.9%) | 13 (8.8%) |
| $1,500 to $1,999 | 7 (2.1%) | 0 (0.0%) |
| $2,000 to $2,499 | 13 (3.8%) | 0 (0.0%) |
| $2,500 to $2,999 | 0 (0.0%) | 0 (0.0%) |
| $3,000 or more | 0 (0.0%) | 0 (0.0%) |
| Total | 341 (100.0%) | 148 (100.0%) |
Physical Housing Characteristics in Snyder
Housing Structures in Snyder
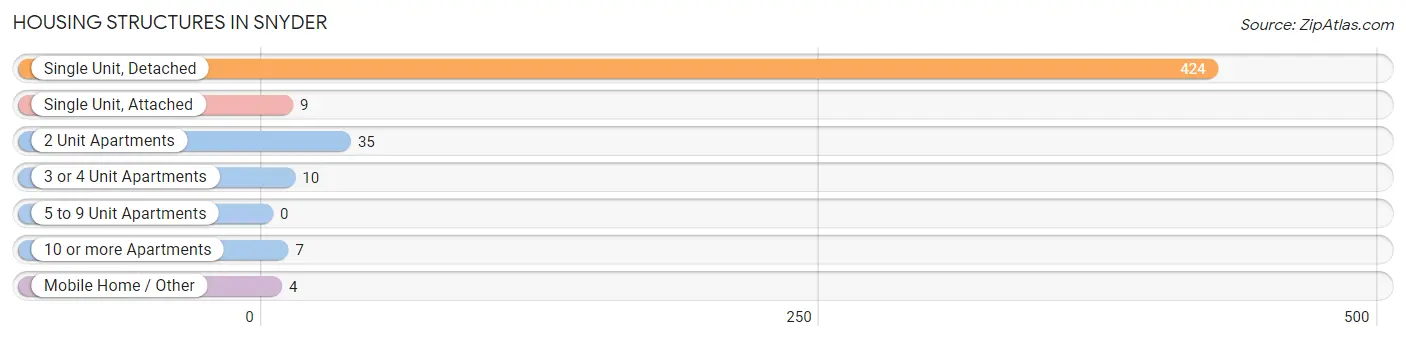
| Structure Type | # Housing Units | % Housing Units |
| Single Unit, Detached | 424 | 86.7% |
| Single Unit, Attached | 9 | 1.8% |
| 2 Unit Apartments | 35 | 7.2% |
| 3 or 4 Unit Apartments | 10 | 2.0% |
| 5 to 9 Unit Apartments | 0 | 0.0% |
| 10 or more Apartments | 7 | 1.4% |
| Mobile Home / Other | 4 | 0.8% |
| Total | 489 | 100.0% |
Housing Structures by Occupancy in Snyder
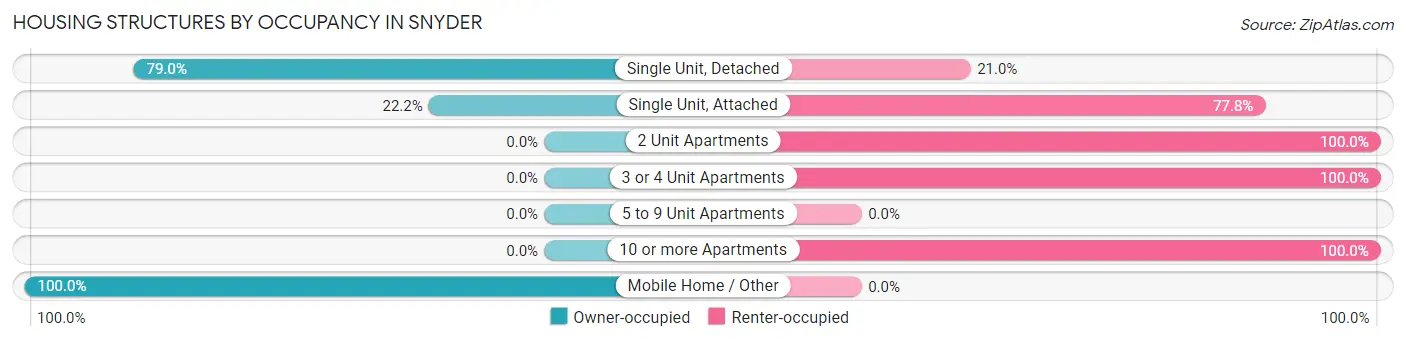
| Structure Type | Owner-occupied | Renter-occupied |
| Single Unit, Detached | 335 (79.0%) | 89 (21.0%) |
| Single Unit, Attached | 2 (22.2%) | 7 (77.8%) |
| 2 Unit Apartments | 0 (0.0%) | 35 (100.0%) |
| 3 or 4 Unit Apartments | 0 (0.0%) | 10 (100.0%) |
| 5 to 9 Unit Apartments | 0 (0.0%) | 0 (0.0%) |
| 10 or more Apartments | 0 (0.0%) | 7 (100.0%) |
| Mobile Home / Other | 4 (100.0%) | 0 (0.0%) |
| Total | 341 (69.7%) | 148 (30.3%) |
Housing Structures by Number of Rooms in Snyder
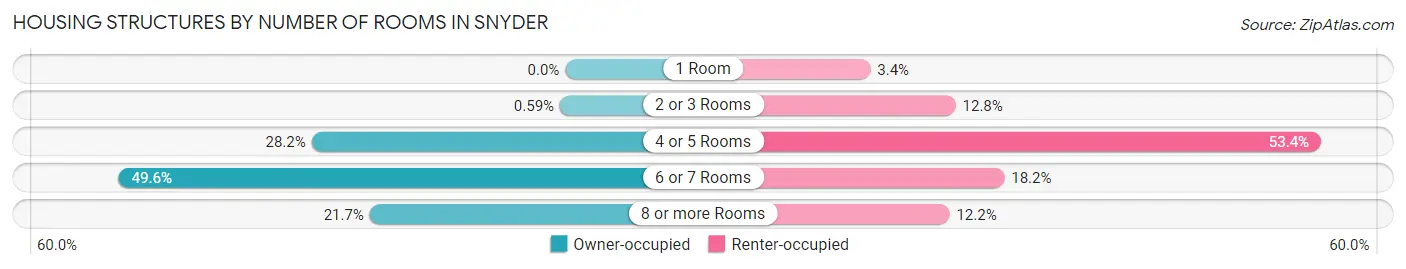
| Number of Rooms | Owner-occupied | Renter-occupied |
| 1 Room | 0 (0.0%) | 5 (3.4%) |
| 2 or 3 Rooms | 2 (0.6%) | 19 (12.8%) |
| 4 or 5 Rooms | 96 (28.1%) | 79 (53.4%) |
| 6 or 7 Rooms | 169 (49.6%) | 27 (18.2%) |
| 8 or more Rooms | 74 (21.7%) | 18 (12.2%) |
| Total | 341 (100.0%) | 148 (100.0%) |
Housing Structure by Heating Type in Snyder
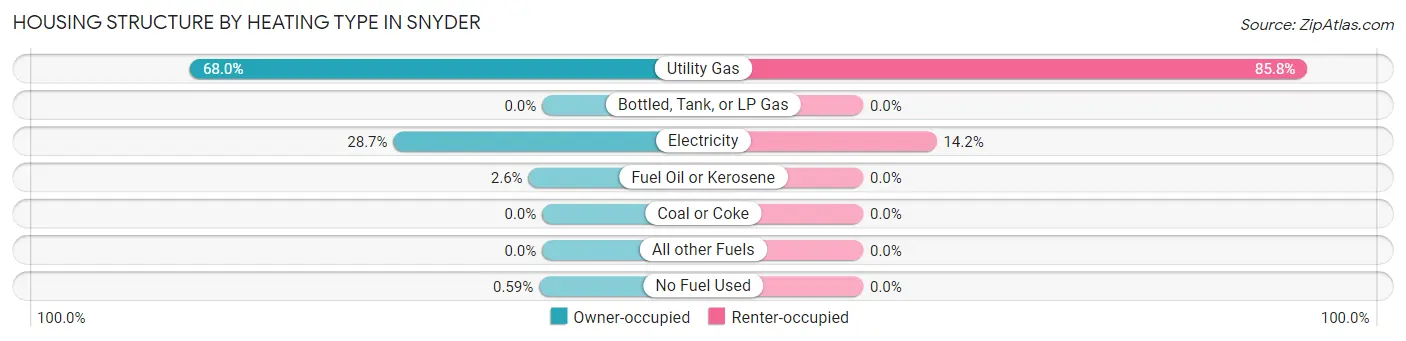
| Heating Type | Owner-occupied | Renter-occupied |
| Utility Gas | 232 (68.0%) | 127 (85.8%) |
| Bottled, Tank, or LP Gas | 0 (0.0%) | 0 (0.0%) |
| Electricity | 98 (28.7%) | 21 (14.2%) |
| Fuel Oil or Kerosene | 9 (2.6%) | 0 (0.0%) |
| Coal or Coke | 0 (0.0%) | 0 (0.0%) |
| All other Fuels | 0 (0.0%) | 0 (0.0%) |
| No Fuel Used | 2 (0.6%) | 0 (0.0%) |
| Total | 341 (100.0%) | 148 (100.0%) |
Household Vehicle Usage in Snyder
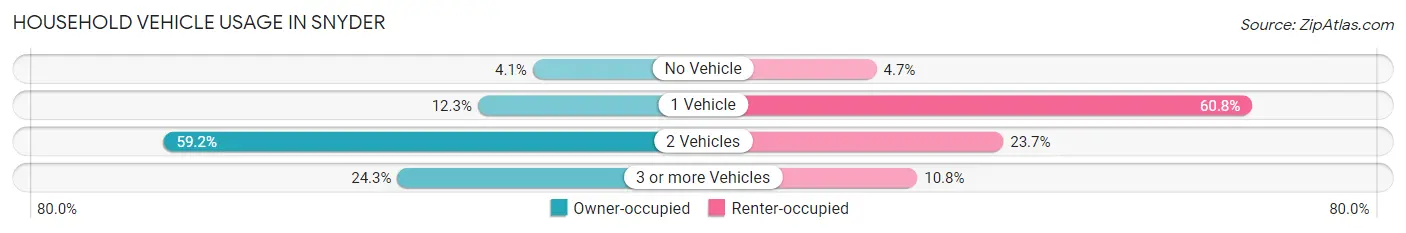
| Vehicles per Household | Owner-occupied | Renter-occupied |
| No Vehicle | 14 (4.1%) | 7 (4.7%) |
| 1 Vehicle | 42 (12.3%) | 90 (60.8%) |
| 2 Vehicles | 202 (59.2%) | 35 (23.6%) |
| 3 or more Vehicles | 83 (24.3%) | 16 (10.8%) |
| Total | 341 (100.0%) | 148 (100.0%) |
Real Estate & Mortgages in Snyder
Real Estate and Mortgage Overview in Snyder
| Characteristic | Without Mortgage | With Mortgage |
| Housing Units | 192 | 149 |
| Median Property Value | $105,300 | $98,700 |
| Median Household Income | $39,574 | $9 |
| Monthly Housing Costs | $503 | $0 |
| Real Estate Taxes | $482 | $4 |
Property Value by Mortgage Status in Snyder
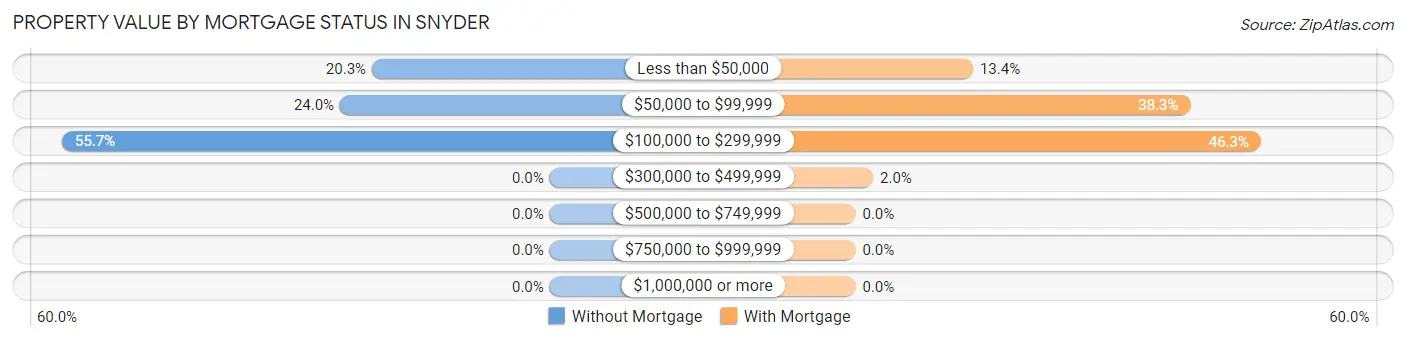
| Property Value | Without Mortgage | With Mortgage |
| Less than $50,000 | 39 (20.3%) | 20 (13.4%) |
| $50,000 to $99,999 | 46 (24.0%) | 57 (38.3%) |
| $100,000 to $299,999 | 107 (55.7%) | 69 (46.3%) |
| $300,000 to $499,999 | 0 (0.0%) | 3 (2.0%) |
| $500,000 to $749,999 | 0 (0.0%) | 0 (0.0%) |
| $750,000 to $999,999 | 0 (0.0%) | 0 (0.0%) |
| $1,000,000 or more | 0 (0.0%) | 0 (0.0%) |
| Total | 192 (100.0%) | 149 (100.0%) |
Household Income by Mortgage Status in Snyder
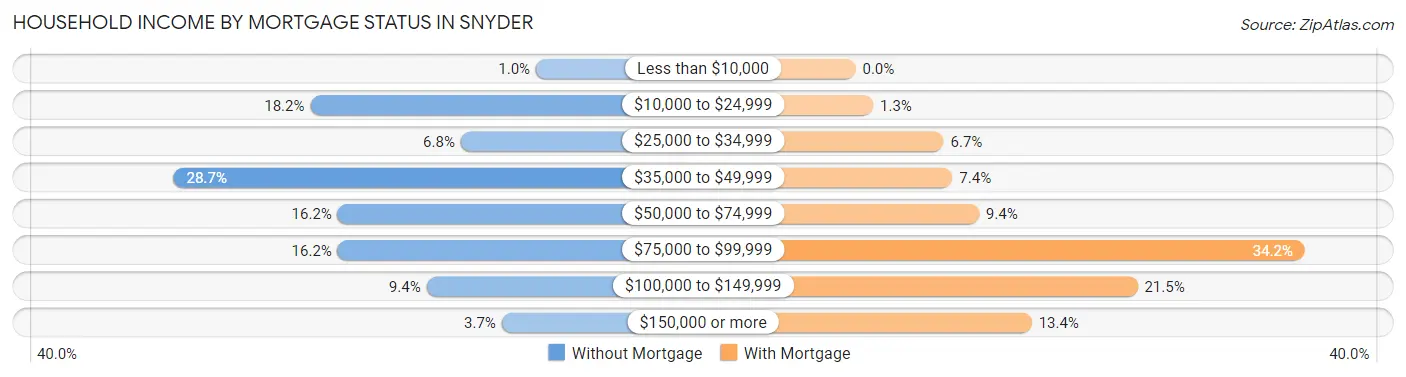
| Household Income | Without Mortgage | With Mortgage |
| Less than $10,000 | 2 (1.0%) | 0 (0.0%) |
| $10,000 to $24,999 | 35 (18.2%) | 2 (1.3%) |
| $25,000 to $34,999 | 13 (6.8%) | 10 (6.7%) |
| $35,000 to $49,999 | 55 (28.6%) | 11 (7.4%) |
| $50,000 to $74,999 | 31 (16.2%) | 14 (9.4%) |
| $75,000 to $99,999 | 31 (16.2%) | 51 (34.2%) |
| $100,000 to $149,999 | 18 (9.4%) | 32 (21.5%) |
| $150,000 or more | 7 (3.6%) | 20 (13.4%) |
| Total | 192 (100.0%) | 149 (100.0%) |
Property Value to Household Income Ratio in Snyder
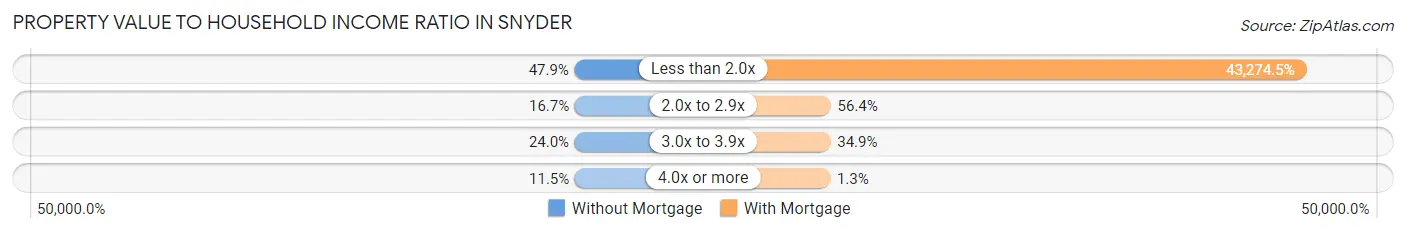
| Value-to-Income Ratio | Without Mortgage | With Mortgage |
| Less than 2.0x | 92 (47.9%) | 64,479 (43,274.5%) |
| 2.0x to 2.9x | 32 (16.7%) | 84 (56.4%) |
| 3.0x to 3.9x | 46 (24.0%) | 52 (34.9%) |
| 4.0x or more | 22 (11.5%) | 2 (1.3%) |
| Total | 192 (100.0%) | 149 (100.0%) |
Real Estate Taxes by Mortgage Status in Snyder
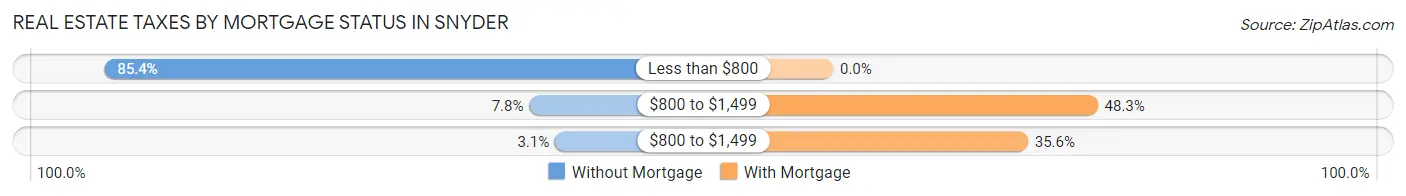
| Property Taxes | Without Mortgage | With Mortgage |
| Less than $800 | 164 (85.4%) | 0 (0.0%) |
| $800 to $1,499 | 15 (7.8%) | 72 (48.3%) |
| $800 to $1,499 | 6 (3.1%) | 53 (35.6%) |
| Total | 192 (100.0%) | 149 (100.0%) |
Health & Disability in Snyder
Health Insurance Coverage by Age in Snyder
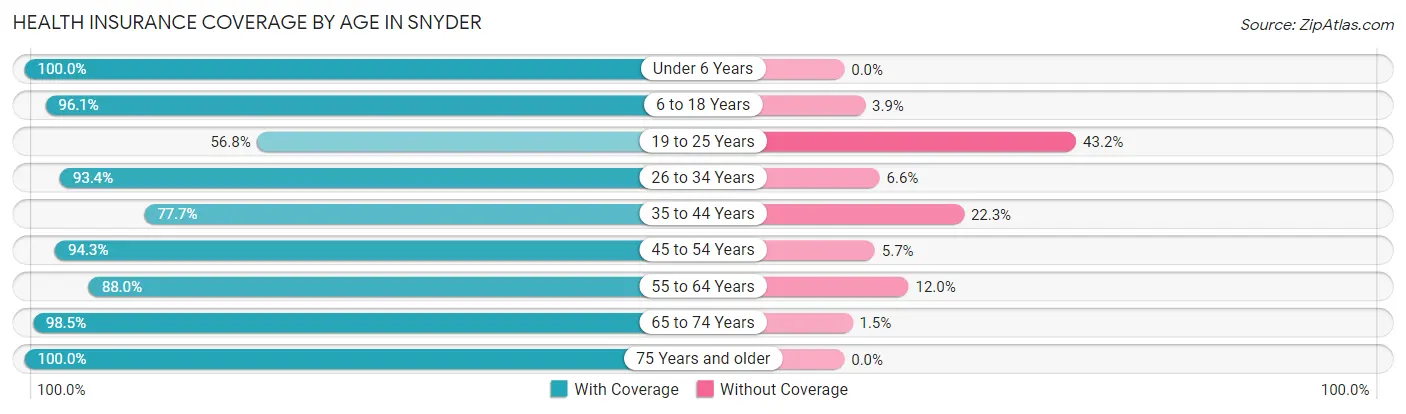
| Age Bracket | With Coverage | Without Coverage |
| Under 6 Years | 129 (100.0%) | 0 (0.0%) |
| 6 to 18 Years | 248 (96.1%) | 10 (3.9%) |
| 19 to 25 Years | 42 (56.8%) | 32 (43.2%) |
| 26 to 34 Years | 142 (93.4%) | 10 (6.6%) |
| 35 to 44 Years | 94 (77.7%) | 27 (22.3%) |
| 45 to 54 Years | 116 (94.3%) | 7 (5.7%) |
| 55 to 64 Years | 147 (88.0%) | 20 (12.0%) |
| 65 to 74 Years | 129 (98.5%) | 2 (1.5%) |
| 75 Years and older | 79 (100.0%) | 0 (0.0%) |
| Total | 1,126 (91.2%) | 108 (8.7%) |
Health Insurance Coverage by Citizenship Status in Snyder
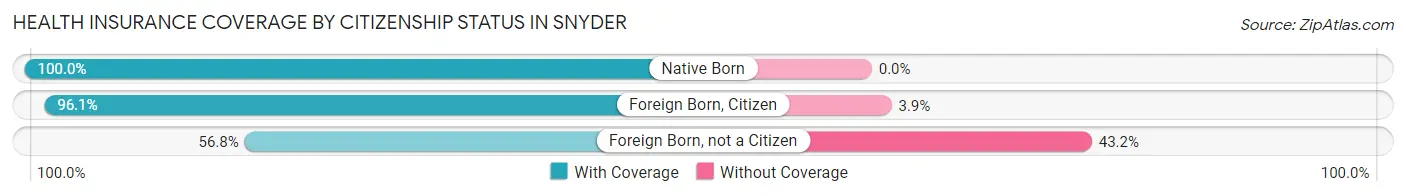
| Citizenship Status | With Coverage | Without Coverage |
| Native Born | 129 (100.0%) | 0 (0.0%) |
| Foreign Born, Citizen | 248 (96.1%) | 10 (3.9%) |
| Foreign Born, not a Citizen | 42 (56.8%) | 32 (43.2%) |
Health Insurance Coverage by Household Income in Snyder
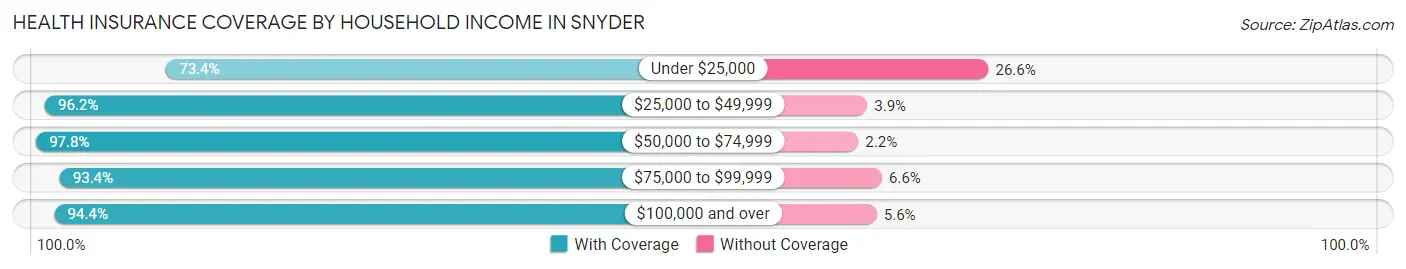
| Household Income | With Coverage | Without Coverage |
| Under $25,000 | 177 (73.4%) | 64 (26.6%) |
| $25,000 to $49,999 | 250 (96.2%) | 10 (3.8%) |
| $50,000 to $74,999 | 269 (97.8%) | 6 (2.2%) |
| $75,000 to $99,999 | 212 (93.4%) | 15 (6.6%) |
| $100,000 and over | 218 (94.4%) | 13 (5.6%) |
Public vs Private Health Insurance Coverage by Age in Snyder
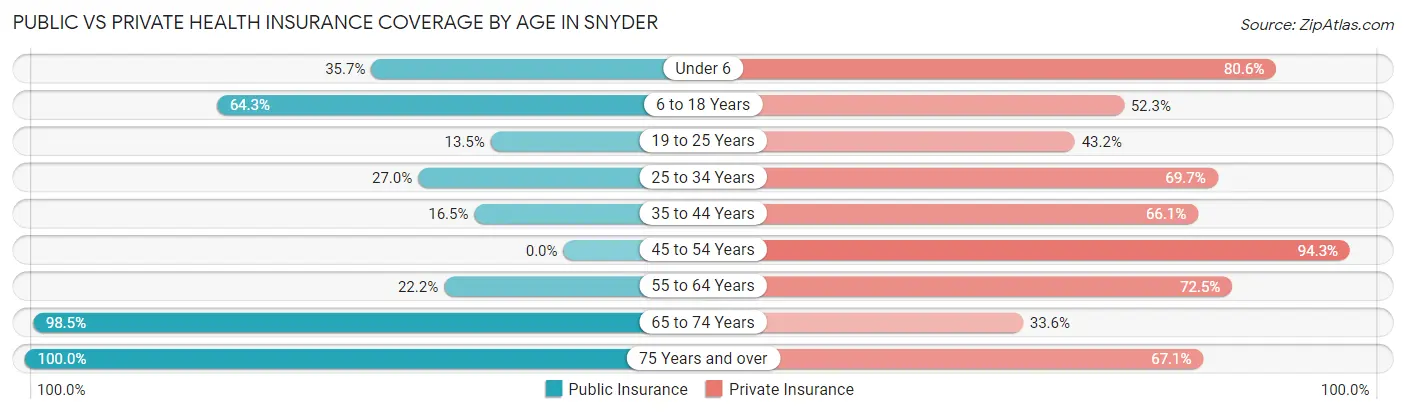
| Age Bracket | Public Insurance | Private Insurance |
| Under 6 | 46 (35.7%) | 104 (80.6%) |
| 6 to 18 Years | 166 (64.3%) | 135 (52.3%) |
| 19 to 25 Years | 10 (13.5%) | 32 (43.2%) |
| 25 to 34 Years | 41 (27.0%) | 106 (69.7%) |
| 35 to 44 Years | 20 (16.5%) | 80 (66.1%) |
| 45 to 54 Years | 0 (0.0%) | 116 (94.3%) |
| 55 to 64 Years | 37 (22.2%) | 121 (72.5%) |
| 65 to 74 Years | 129 (98.5%) | 44 (33.6%) |
| 75 Years and over | 79 (100.0%) | 53 (67.1%) |
| Total | 528 (42.8%) | 791 (64.1%) |
Disability Status by Sex by Age in Snyder
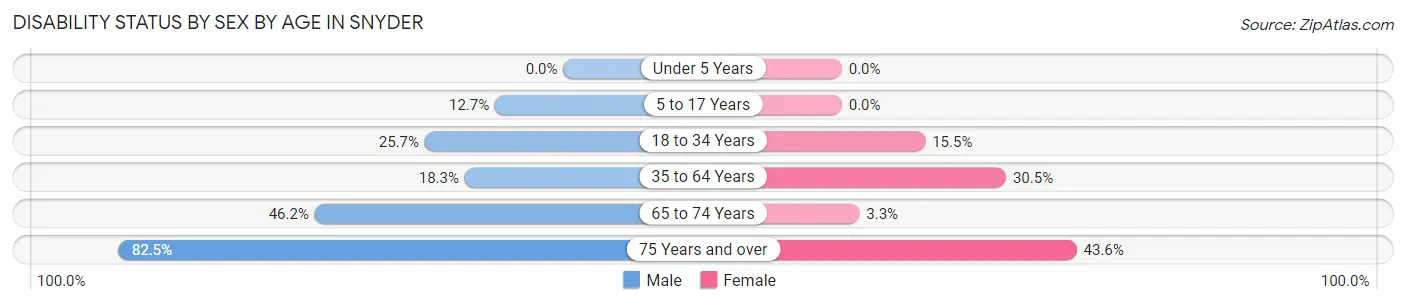
| Age Bracket | Male | Female |
| Under 5 Years | 0 (0.0%) | 0 (0.0%) |
| 5 to 17 Years | 18 (12.7%) | 0 (0.0%) |
| 18 to 34 Years | 27 (25.7%) | 22 (15.5%) |
| 35 to 64 Years | 41 (18.3%) | 57 (30.5%) |
| 65 to 74 Years | 18 (46.2%) | 3 (3.3%) |
| 75 Years and over | 33 (82.5%) | 17 (43.6%) |
Disability Class by Sex by Age in Snyder
Disability Class: Hearing Difficulty
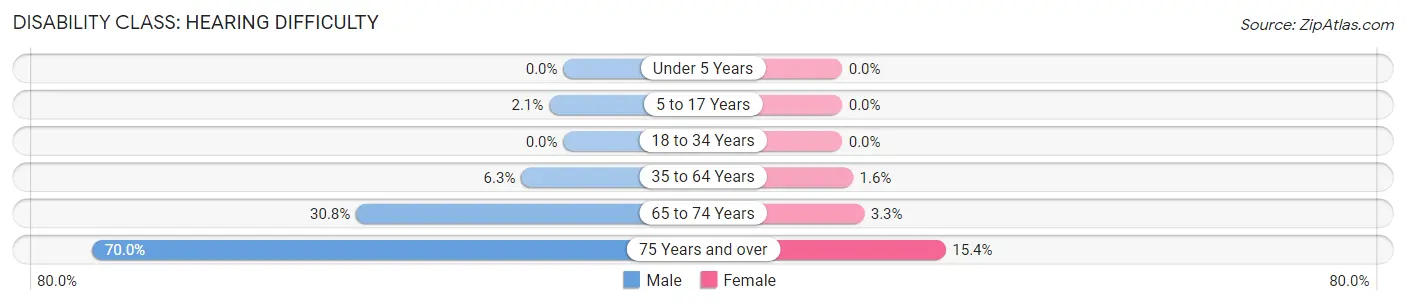
| Age Bracket | Male | Female |
| Under 5 Years | 0 (0.0%) | 0 (0.0%) |
| 5 to 17 Years | 3 (2.1%) | 0 (0.0%) |
| 18 to 34 Years | 0 (0.0%) | 0 (0.0%) |
| 35 to 64 Years | 14 (6.2%) | 3 (1.6%) |
| 65 to 74 Years | 12 (30.8%) | 3 (3.3%) |
| 75 Years and over | 28 (70.0%) | 6 (15.4%) |
Disability Class: Vision Difficulty
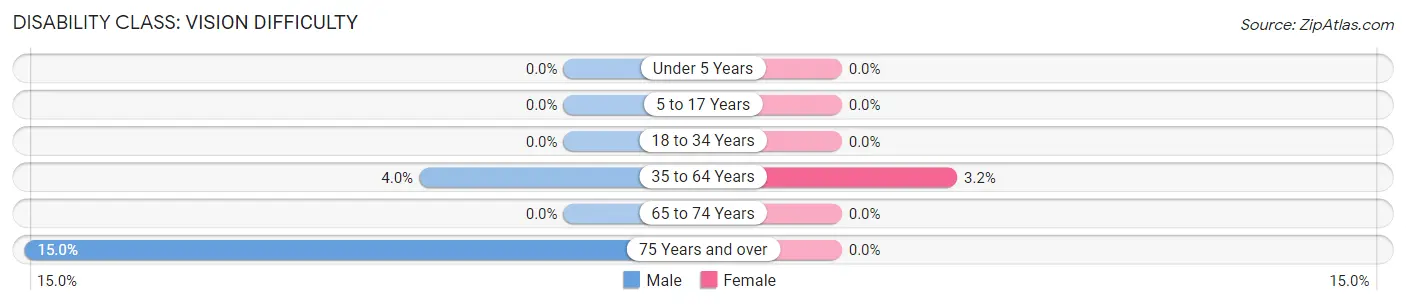
| Age Bracket | Male | Female |
| Under 5 Years | 0 (0.0%) | 0 (0.0%) |
| 5 to 17 Years | 0 (0.0%) | 0 (0.0%) |
| 18 to 34 Years | 0 (0.0%) | 0 (0.0%) |
| 35 to 64 Years | 9 (4.0%) | 6 (3.2%) |
| 65 to 74 Years | 0 (0.0%) | 0 (0.0%) |
| 75 Years and over | 6 (15.0%) | 0 (0.0%) |
Disability Class: Cognitive Difficulty
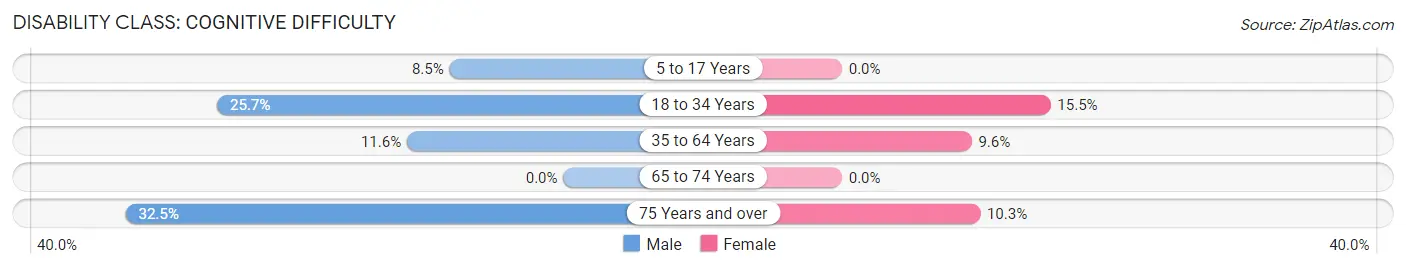
| Age Bracket | Male | Female |
| 5 to 17 Years | 12 (8.5%) | 0 (0.0%) |
| 18 to 34 Years | 27 (25.7%) | 22 (15.5%) |
| 35 to 64 Years | 26 (11.6%) | 18 (9.6%) |
| 65 to 74 Years | 0 (0.0%) | 0 (0.0%) |
| 75 Years and over | 13 (32.5%) | 4 (10.3%) |
Disability Class: Ambulatory Difficulty
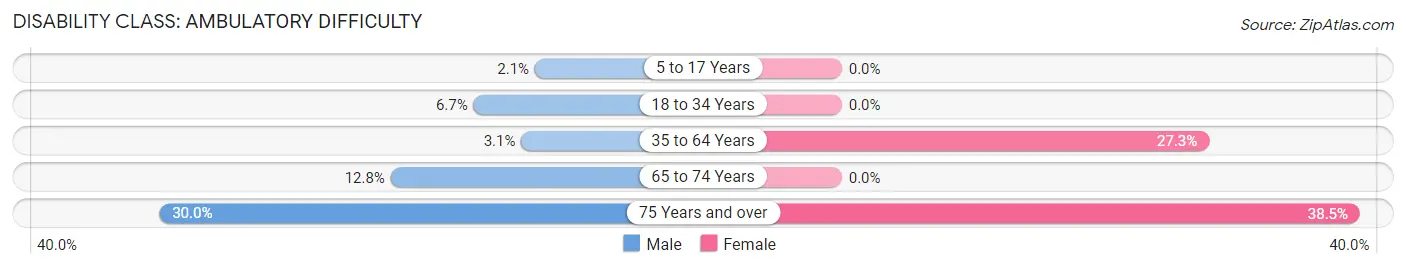
| Age Bracket | Male | Female |
| 5 to 17 Years | 3 (2.1%) | 0 (0.0%) |
| 18 to 34 Years | 7 (6.7%) | 0 (0.0%) |
| 35 to 64 Years | 7 (3.1%) | 51 (27.3%) |
| 65 to 74 Years | 5 (12.8%) | 0 (0.0%) |
| 75 Years and over | 12 (30.0%) | 15 (38.5%) |
Disability Class: Self-Care Difficulty
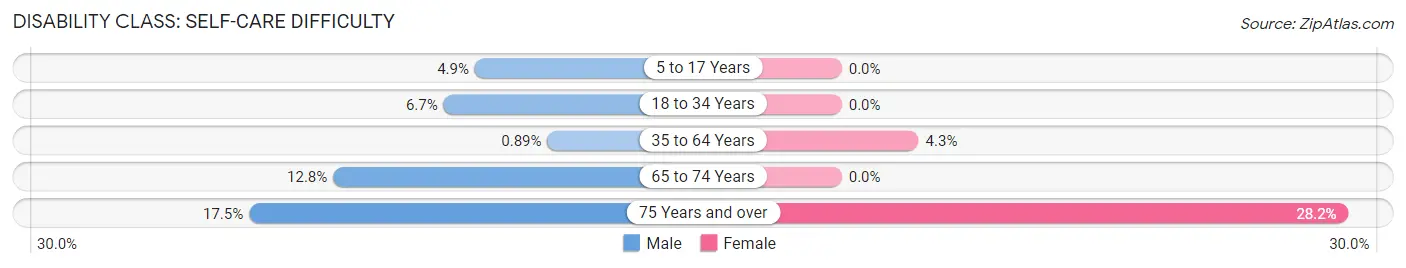
| Age Bracket | Male | Female |
| 5 to 17 Years | 7 (4.9%) | 0 (0.0%) |
| 18 to 34 Years | 7 (6.7%) | 0 (0.0%) |
| 35 to 64 Years | 2 (0.9%) | 8 (4.3%) |
| 65 to 74 Years | 5 (12.8%) | 0 (0.0%) |
| 75 Years and over | 7 (17.5%) | 11 (28.2%) |
Technology Access in Snyder
Computing Device Access in Snyder
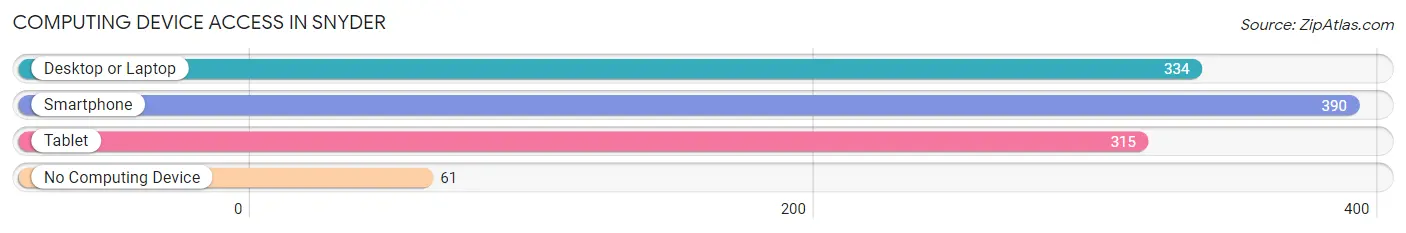
| Device Type | # Households | % Households |
| Desktop or Laptop | 334 | 68.3% |
| Smartphone | 390 | 79.7% |
| Tablet | 315 | 64.4% |
| No Computing Device | 61 | 12.5% |
| Total | 489 | 100.0% |
Internet Access in Snyder
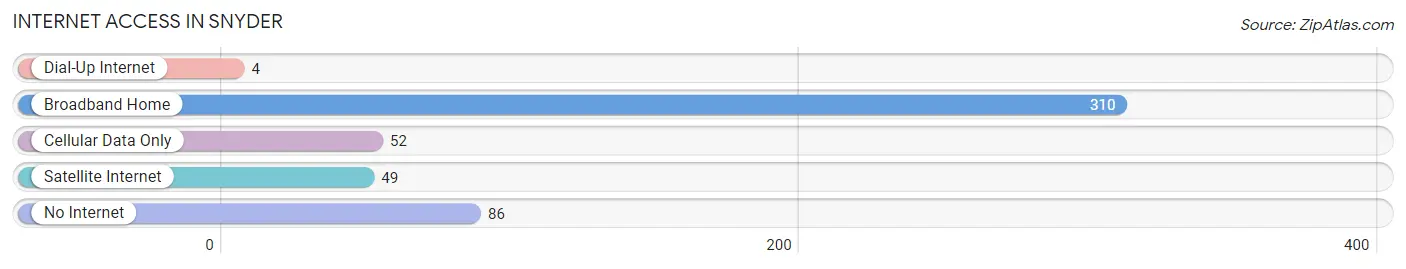
| Internet Type | # Households | % Households |
| Dial-Up Internet | 4 | 0.8% |
| Broadband Home | 310 | 63.4% |
| Cellular Data Only | 52 | 10.6% |
| Satellite Internet | 49 | 10.0% |
| No Internet | 86 | 17.6% |
| Total | 489 | 100.0% |
Snyder Summary
Snyder is a small town located in Kiowa County, Oklahoma. It is situated in the southwestern part of the state, approximately 30 miles east of Lawton and 90 miles southwest of Oklahoma City. The town was founded in 1901 and named after the local rancher, William Snyder. As of the 2010 census, the population of Snyder was 1,845.
History
The area around Snyder was originally inhabited by the Kiowa and Comanche Native American tribes. In the late 1800s, the area was opened up to white settlers, and the town of Snyder was founded in 1901. The town was named after William Snyder, a local rancher who owned a large amount of land in the area.
In the early 1900s, Snyder was a small farming community. The town was home to several stores, a post office, a bank, and a hotel. In the 1920s, the town began to grow as oil was discovered in the area. This led to an influx of people and businesses, and the population of Snyder grew to over 1,000 by the 1930s.
In the 1940s, the town was home to several businesses, including a cotton gin, a lumber yard, and a feed store. The town also had a movie theater, a bowling alley, and a swimming pool.
In the 1950s, the town began to decline as the oil industry moved away from the area. The population of Snyder dropped to just over 500 by the 1960s.
In the 1970s, the town began to experience a resurgence as the oil industry returned to the area. The population of Snyder grew to over 1,000 by the 1980s.
Geography
Snyder is located in southwestern Oklahoma, approximately 30 miles east of Lawton and 90 miles southwest of Oklahoma City. The town is situated in Kiowa County, near the Washita River. The town is located at an elevation of 1,072 feet above sea level.
The climate in Snyder is semi-arid, with hot summers and mild winters. The average annual temperature is 64°F, and the average annual precipitation is 24 inches.
Economy
The economy of Snyder is largely based on agriculture and oil production. The town is home to several farms, and the surrounding area is known for its production of wheat, corn, and cotton.
The oil industry is also an important part of the local economy. Several oil companies have operations in the area, and the town is home to several oil-related businesses.
Demographics
As of the 2010 census, the population of Snyder was 1,845. The racial makeup of the town was 79.3% White, 15.2% Native American, 0.7% Asian, 0.3% African American, and 4.5% from other races.
The median household income in Snyder was $35,938, and the median family income was $41,250. The per capita income was $17,845. Approximately 16.3% of the population was below the poverty line.
The town is served by the Snyder Public School District, which includes one elementary school, one middle school, and one high school. The town is also home to several churches, including the First United Methodist Church, the First Baptist Church, and the Church of Christ.
Common Questions
What is Per Capita Income in Snyder?
Per Capita income in Snyder is $23,069.
What is the Median Family Income in Snyder?
Median Family Income in Snyder is $62,708.
What is the Median Household income in Snyder?
Median Household Income in Snyder is $47,448.
What is Income or Wage Gap in Snyder?
Income or Wage Gap in Snyder is 24.8%.
Women in Snyder earn 75.2 cents for every dollar earned by a man.
What is Inequality or Gini Index in Snyder?
Inequality or Gini Index in Snyder is 0.38.
What is the Total Population of Snyder?
Total Population of Snyder is 1,322.
What is the Total Male Population of Snyder?
Total Male Population of Snyder is 637.
What is the Total Female Population of Snyder?
Total Female Population of Snyder is 685.
What is the Ratio of Males per 100 Females in Snyder?
There are 92.99 Males per 100 Females in Snyder.
What is the Ratio of Females per 100 Males in Snyder?
There are 107.54 Females per 100 Males in Snyder.
What is the Median Population Age in Snyder?
Median Population Age in Snyder is 36.7 Years.
What is the Average Family Size in Snyder
Average Family Size in Snyder is 3.0 People.
What is the Average Household Size in Snyder
Average Household Size in Snyder is 2.5 People.
How Large is the Labor Force in Snyder?
There are 511 People in the Labor Forcein in Snyder.
What is the Percentage of People in the Labor Force in Snyder?
52.2% of People are in the Labor Force in Snyder.
What is the Unemployment Rate in Snyder?
Unemployment Rate in Snyder is 3.2%.