Slick, OK Map & Demographics
Slick Map
Slick Overview
$18,641
PER CAPITA INCOME
$19,515
AVG HOUSEHOLD INCOME
58.0%
WAGE / INCOME GAP [ % ]
42.0¢/ $1
WAGE / INCOME GAP [ $ ]
0.44
INEQUALITY / GINI INDEX
174
TOTAL POPULATION
73
MALE POPULATION
101
FEMALE POPULATION
72.28
MALES / 100 FEMALES
138.36
FEMALES / 100 MALES
49.8
MEDIAN AGE
1.8
AVG FAMILY SIZE
1.8
AVG HOUSEHOLD SIZE
57
LABOR FORCE [ PEOPLE ]
39.6%
PERCENT IN LABOR FORCE
Slick Zip Codes
Slick Area Codes
Income in Slick
Income Overview in Slick
| Characteristic | Number | Measure |
| Per Capita Income | 174 | $18,641 |
| Median Family Income | 78 | $0 |
| Mean Family Income | 78 | $37,118 |
| Median Household Income | 99 | $19,515 |
| Mean Household Income | 99 | $35,401 |
| Income Deficit | 78 | $0 |
| Wage / Income Gap (%) | 174 | 57.99% |
| Wage / Income Gap ($) | 174 | 42.01¢ per $1 |
| Gini / Inequality Index | 174 | 0.44 |
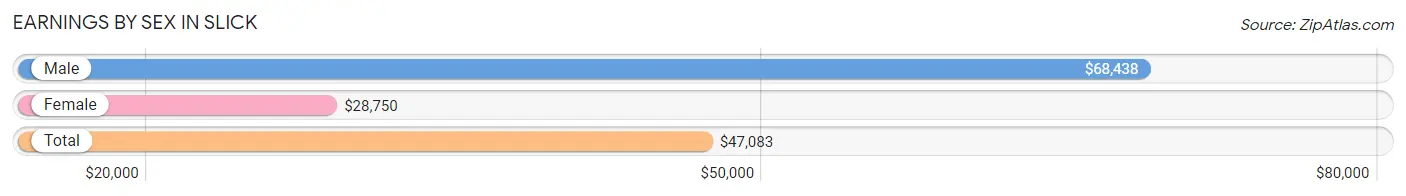
Earnings by Sex in Slick
Average Earnings in Slick are $47,083, $68,438 for men and $28,750 for women, a difference of 58.0%.
| Sex | Number | Average Earnings |
| Male | 45 (78.9%) | $68,438 |
| Female | 12 (21.0%) | $28,750 |
| Total | 57 (100.0%) | $47,083 |
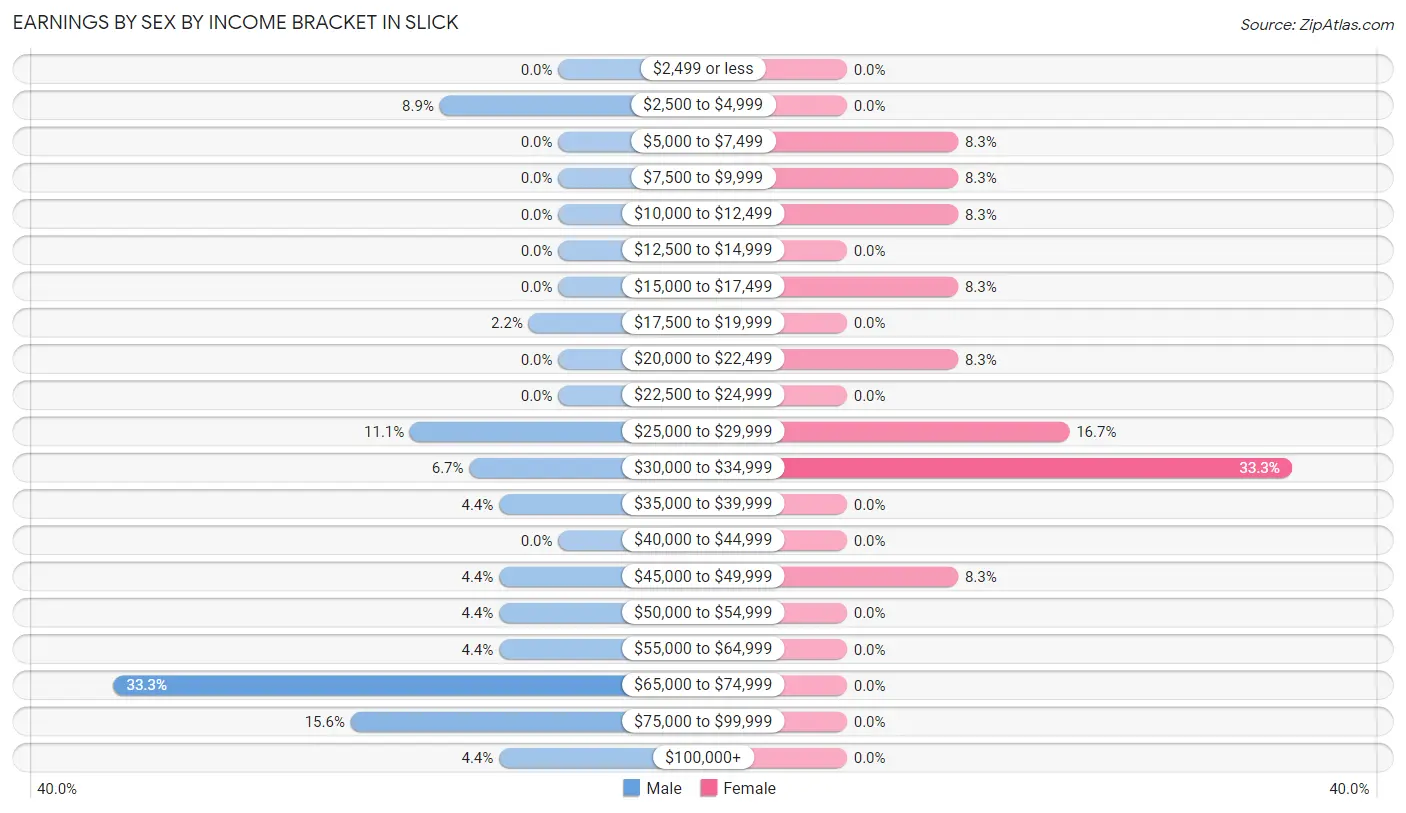
Earnings by Sex by Income Bracket in Slick
The most common earnings brackets in Slick are $65,000 to $74,999 for men (15 | 33.3%) and $30,000 to $34,999 for women (4 | 33.3%).
| Income | Male | Female |
| $2,499 or less | 0 (0.0%) | 0 (0.0%) |
| $2,500 to $4,999 | 4 (8.9%) | 0 (0.0%) |
| $5,000 to $7,499 | 0 (0.0%) | 1 (8.3%) |
| $7,500 to $9,999 | 0 (0.0%) | 1 (8.3%) |
| $10,000 to $12,499 | 0 (0.0%) | 1 (8.3%) |
| $12,500 to $14,999 | 0 (0.0%) | 0 (0.0%) |
| $15,000 to $17,499 | 0 (0.0%) | 1 (8.3%) |
| $17,500 to $19,999 | 1 (2.2%) | 0 (0.0%) |
| $20,000 to $22,499 | 0 (0.0%) | 1 (8.3%) |
| $22,500 to $24,999 | 0 (0.0%) | 0 (0.0%) |
| $25,000 to $29,999 | 5 (11.1%) | 2 (16.7%) |
| $30,000 to $34,999 | 3 (6.7%) | 4 (33.3%) |
| $35,000 to $39,999 | 2 (4.4%) | 0 (0.0%) |
| $40,000 to $44,999 | 0 (0.0%) | 0 (0.0%) |
| $45,000 to $49,999 | 2 (4.4%) | 1 (8.3%) |
| $50,000 to $54,999 | 2 (4.4%) | 0 (0.0%) |
| $55,000 to $64,999 | 2 (4.4%) | 0 (0.0%) |
| $65,000 to $74,999 | 15 (33.3%) | 0 (0.0%) |
| $75,000 to $99,999 | 7 (15.6%) | 0 (0.0%) |
| $100,000+ | 2 (4.4%) | 0 (0.0%) |
| Total | 45 (100.0%) | 12 (100.0%) |
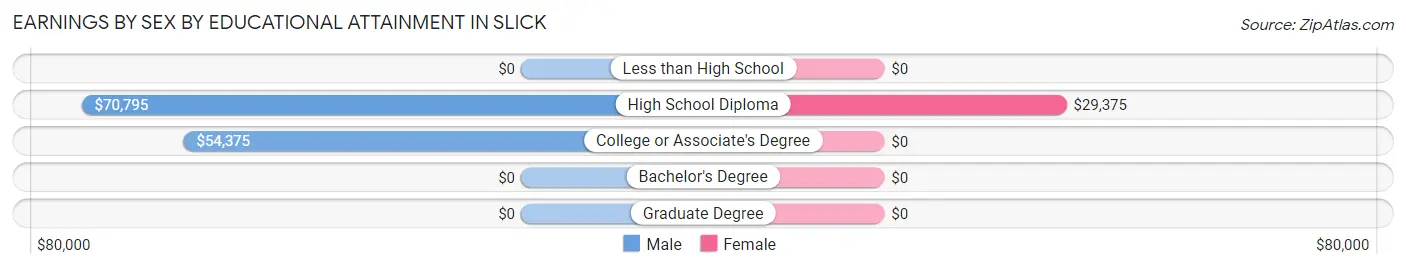
Earnings by Sex by Educational Attainment in Slick
Average earnings in Slick are $69,063 for men and $28,750 for women, a difference of 58.4%. Men with an educational attainment of high school diploma enjoy the highest average annual earnings of $70,795, while those with college or associate's degree education earn the least with $54,375. Women with an educational attainment of high school diploma earn the most with the average annual earnings of $29,375, while those with high school diploma education have the smallest earnings of $29,375.
| Educational Attainment | Male Income | Female Income |
| Less than High School | - | - |
| High School Diploma | $70,795 | $29,375 |
| College or Associate's Degree | $54,375 | $0 |
| Bachelor's Degree | - | - |
| Graduate Degree | - | - |
| Total | $69,063 | $28,750 |
Family Income in Slick
Family Income Brackets in Slick
According to the Slick family income data, there are 48 families falling into the $15,000 to $24,999 income range, which is the most common income bracket and makes up 61.5% of all families.
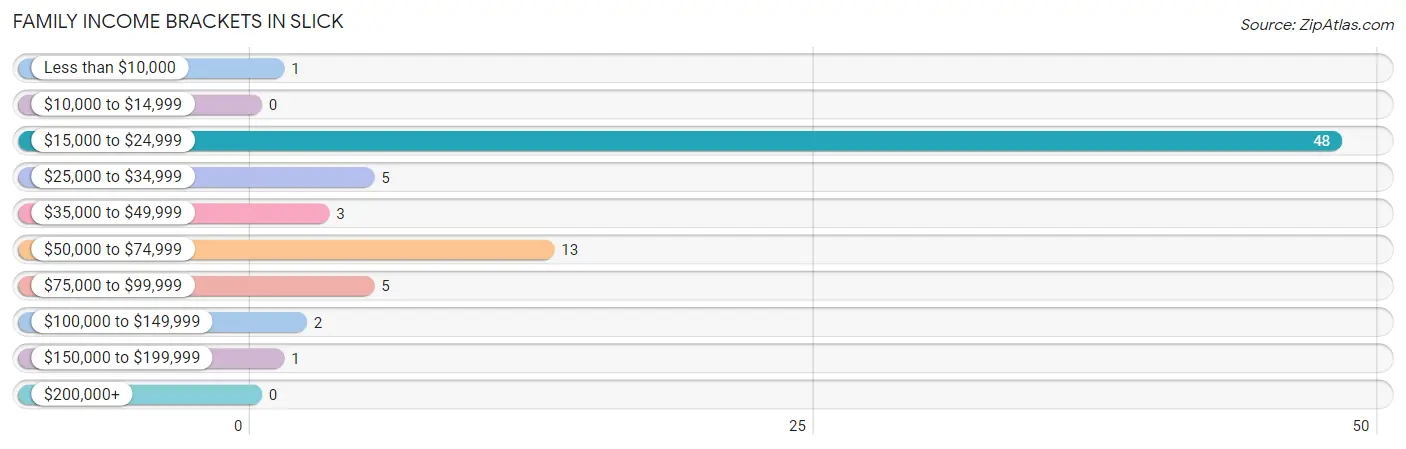
| Income Bracket | # Families | % Families |
| Less than $10,000 | 1 | 1.3% |
| $10,000 to $14,999 | 0 | 0.0% |
| $15,000 to $24,999 | 48 | 61.5% |
| $25,000 to $34,999 | 5 | 6.4% |
| $35,000 to $49,999 | 3 | 3.8% |
| $50,000 to $74,999 | 13 | 16.7% |
| $75,000 to $99,999 | 5 | 6.4% |
| $100,000 to $149,999 | 2 | 2.6% |
| $150,000 to $199,999 | 1 | 1.3% |
| $200,000+ | 0 | 0.0% |
Family Income by Famaliy Size in Slick
3-person families (15 | 19.2%) account for the highest median family income in Slick with $71,250 per family, while 3-person families (15 | 19.2%) have the highest median income of $23,750 per family member.
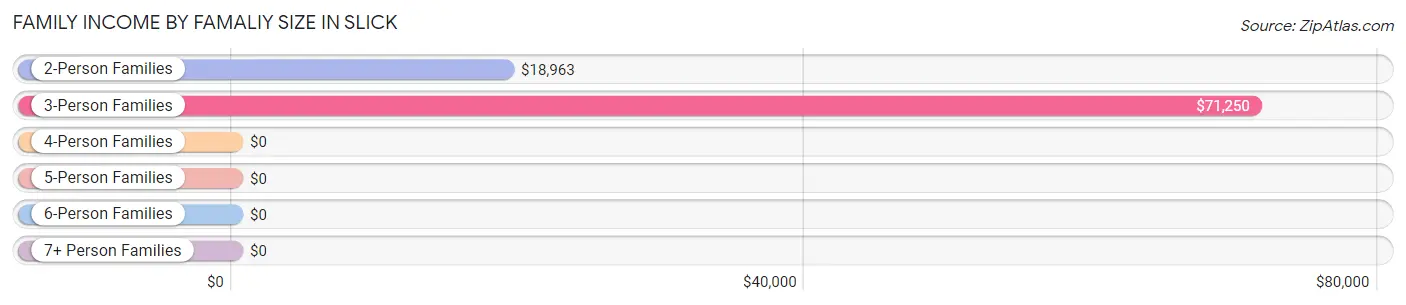
| Income Bracket | # Families | Median Income |
| 2-Person Families | 57 (73.1%) | $18,963 |
| 3-Person Families | 15 (19.2%) | $71,250 |
| 4-Person Families | 6 (7.7%) | $0 |
| 5-Person Families | 0 (0.0%) | $0 |
| 6-Person Families | 0 (0.0%) | $0 |
| 7+ Person Families | 0 (0.0%) | $0 |
| Total | 78 (100.0%) | $0 |
Family Income by Number of Earners in Slick
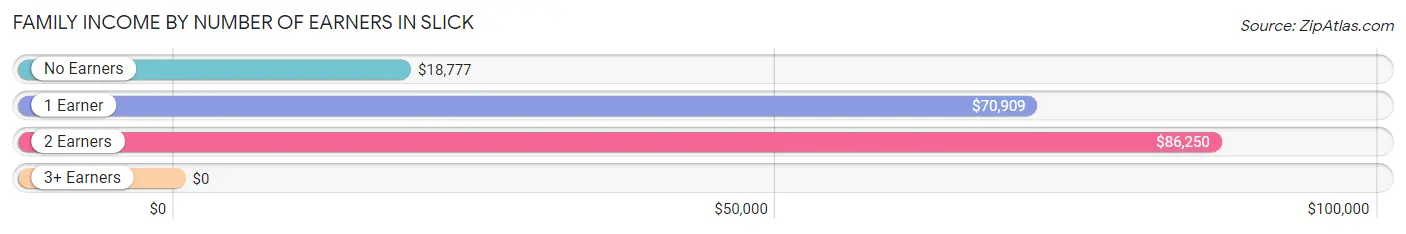
| Number of Earners | # Families | Median Income |
| No Earners | 50 (64.1%) | $18,777 |
| 1 Earner | 18 (23.1%) | $70,909 |
| 2 Earners | 10 (12.8%) | $86,250 |
| 3+ Earners | 0 (0.0%) | $0 |
| Total | 78 (100.0%) | $0 |
Household Income in Slick
Household Income Brackets in Slick
With 51 households falling in the category, the $15,000 to $24,999 income range is the most frequent in Slick, accounting for 51.5% of all households.
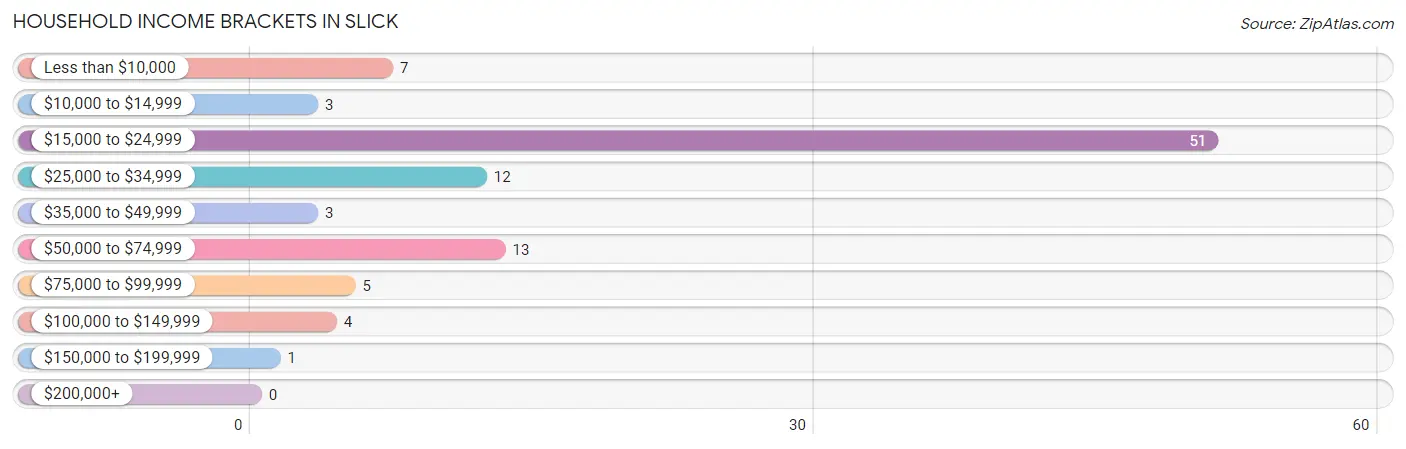
| Income Bracket | # Households | % Households |
| Less than $10,000 | 7 | 7.1% |
| $10,000 to $14,999 | 3 | 3.0% |
| $15,000 to $24,999 | 51 | 51.5% |
| $25,000 to $34,999 | 12 | 12.1% |
| $35,000 to $49,999 | 3 | 3.0% |
| $50,000 to $74,999 | 13 | 13.1% |
| $75,000 to $99,999 | 5 | 5.1% |
| $100,000 to $149,999 | 4 | 4.0% |
| $150,000 to $199,999 | 1 | 1.0% |
| $200,000+ | 0 | 0.0% |
Household Income by Householder Age in Slick
The median household income in Slick is $19,515, with the highest median household income of $70,795 found in the 25 to 44 years age bracket for the primary householder. A total of 25 households (25.3%) fall into this category.
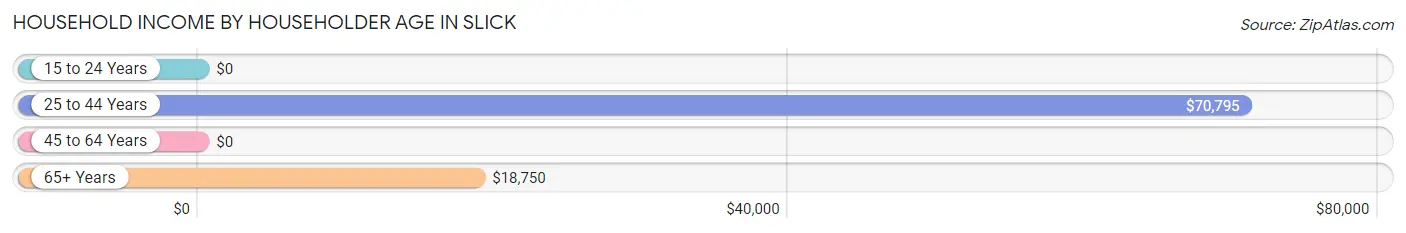
| Income Bracket | # Households | Median Income |
| 15 to 24 Years | 0 (0.0%) | $0 |
| 25 to 44 Years | 25 (25.3%) | $70,795 |
| 45 to 64 Years | 15 (15.1%) | $0 |
| 65+ Years | 59 (59.6%) | $18,750 |
| Total | 99 (100.0%) | $19,515 |
Poverty in Slick
Income Below Poverty by Sex and Age in Slick
With 16.4% poverty level for males and 57.4% for females among the residents of Slick, 65 to 74 year old males and 65 to 74 year old females are the most vulnerable to poverty, with 4 males (66.7%) and 47 females (97.9%) in their respective age groups living below the poverty level.
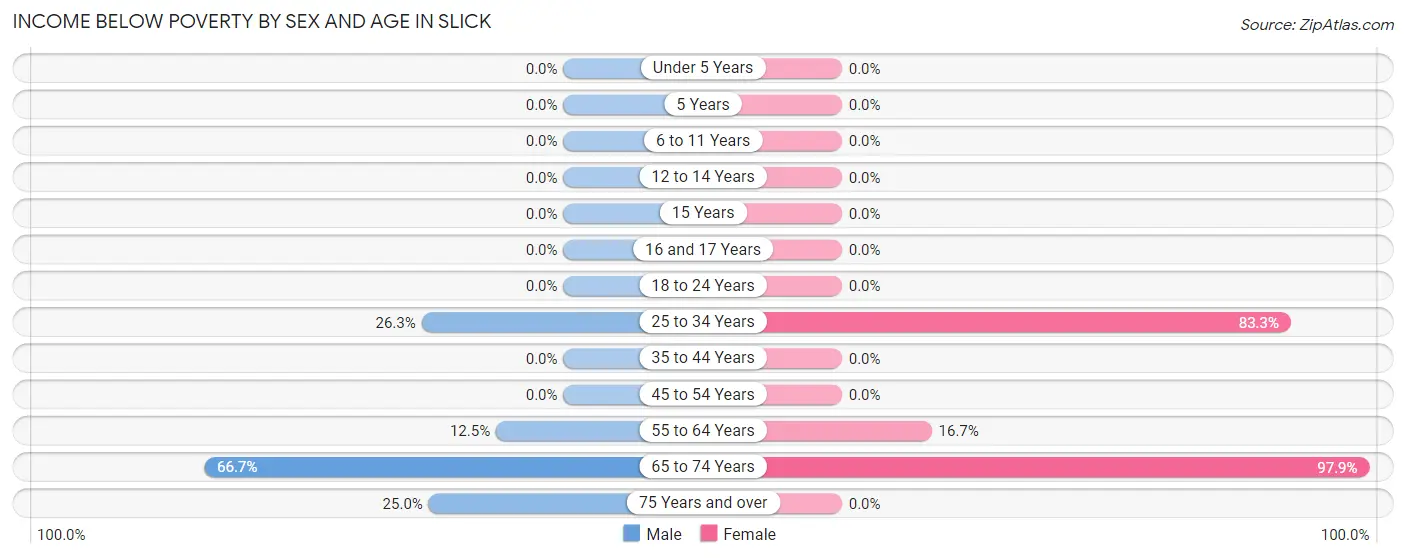
| Age Bracket | Male | Female |
| Under 5 Years | 0 (0.0%) | 0 (0.0%) |
| 5 Years | 0 (0.0%) | 0 (0.0%) |
| 6 to 11 Years | 0 (0.0%) | 0 (0.0%) |
| 12 to 14 Years | 0 (0.0%) | 0 (0.0%) |
| 15 Years | 0 (0.0%) | 0 (0.0%) |
| 16 and 17 Years | 0 (0.0%) | 0 (0.0%) |
| 18 to 24 Years | 0 (0.0%) | 0 (0.0%) |
| 25 to 34 Years | 5 (26.3%) | 10 (83.3%) |
| 35 to 44 Years | 0 (0.0%) | 0 (0.0%) |
| 45 to 54 Years | 0 (0.0%) | 0 (0.0%) |
| 55 to 64 Years | 1 (12.5%) | 1 (16.7%) |
| 65 to 74 Years | 4 (66.7%) | 47 (97.9%) |
| 75 Years and over | 2 (25.0%) | 0 (0.0%) |
| Total | 12 (16.4%) | 58 (57.4%) |
Income Above Poverty by Sex and Age in Slick
According to the poverty statistics in Slick, males aged 6 to 11 years and females aged under 5 years are the age groups that are most secure financially, with 100.0% of males and 100.0% of females in these age groups living above the poverty line.
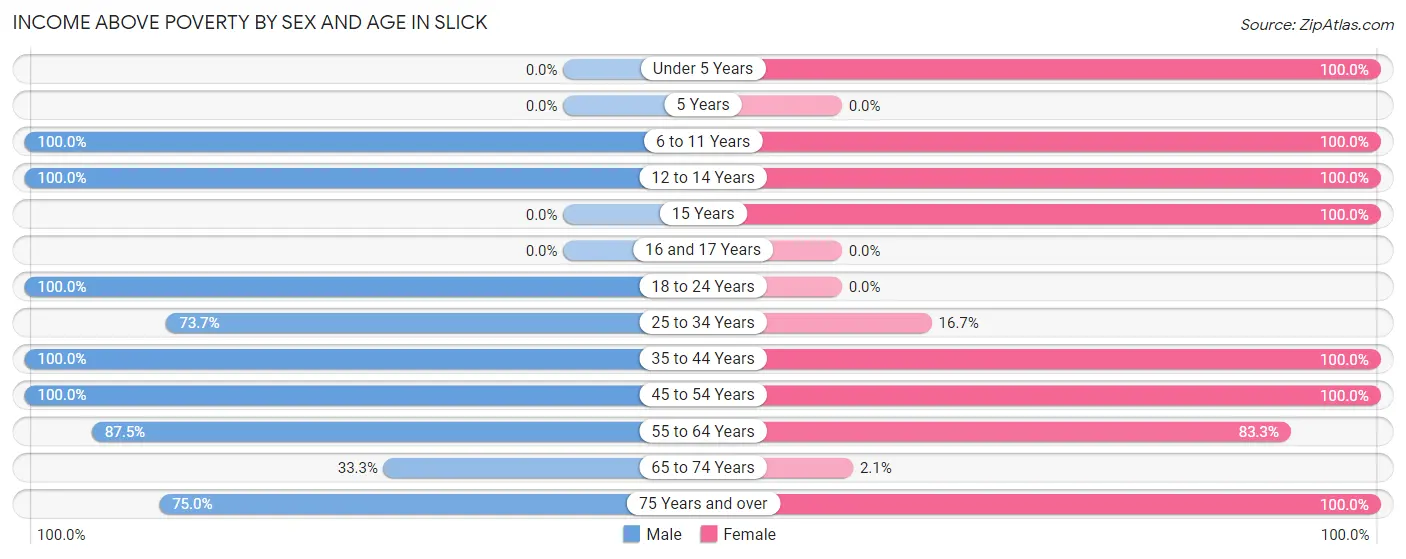
| Age Bracket | Male | Female |
| Under 5 Years | 0 (0.0%) | 17 (100.0%) |
| 5 Years | 0 (0.0%) | 0 (0.0%) |
| 6 to 11 Years | 2 (100.0%) | 1 (100.0%) |
| 12 to 14 Years | 7 (100.0%) | 1 (100.0%) |
| 15 Years | 0 (0.0%) | 2 (100.0%) |
| 16 and 17 Years | 0 (0.0%) | 0 (0.0%) |
| 18 to 24 Years | 4 (100.0%) | 0 (0.0%) |
| 25 to 34 Years | 14 (73.7%) | 2 (16.7%) |
| 35 to 44 Years | 10 (100.0%) | 4 (100.0%) |
| 45 to 54 Years | 9 (100.0%) | 6 (100.0%) |
| 55 to 64 Years | 7 (87.5%) | 5 (83.3%) |
| 65 to 74 Years | 2 (33.3%) | 1 (2.1%) |
| 75 Years and over | 6 (75.0%) | 4 (100.0%) |
| Total | 61 (83.6%) | 43 (42.6%) |
Income Below Poverty Among Married-Couple Families in Slick
The poverty statistics for married-couple families in Slick show that 75.8% or 47 of the total 62 families live below the poverty line. Families with no children have the highest poverty rate of 82.5%, comprising of 47 families. On the other hand, families with 1 or 2 children have the lowest poverty rate of 0.0%, which includes 0 families.
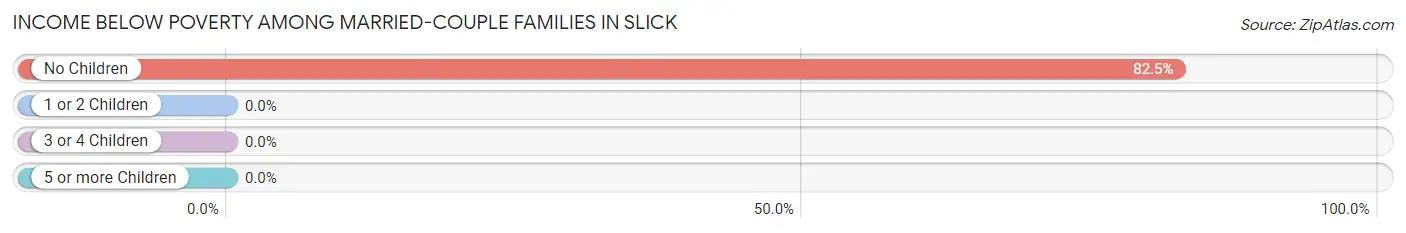
| Children | Above Poverty | Below Poverty |
| No Children | 10 (17.5%) | 47 (82.5%) |
| 1 or 2 Children | 5 (100.0%) | 0 (0.0%) |
| 3 or 4 Children | 0 (0.0%) | 0 (0.0%) |
| 5 or more Children | 0 (0.0%) | 0 (0.0%) |
| Total | 15 (24.2%) | 47 (75.8%) |
Income Below Poverty Among Single-Parent Households in Slick
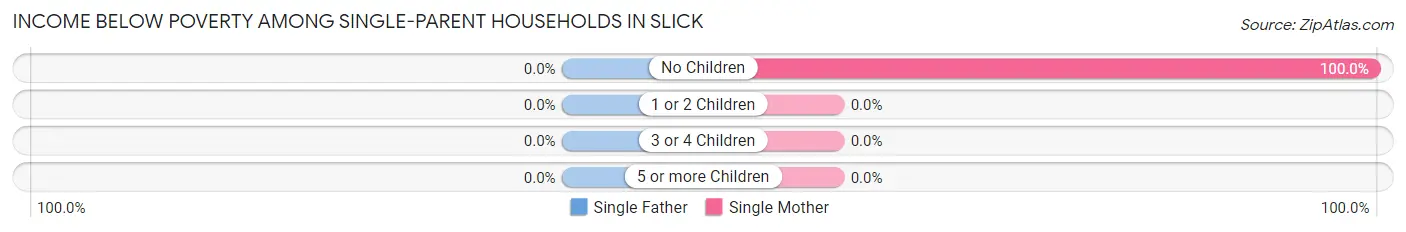
| Children | Single Father | Single Mother |
| No Children | 0 (0.0%) | 1 (100.0%) |
| 1 or 2 Children | 0 (0.0%) | 0 (0.0%) |
| 3 or 4 Children | 0 (0.0%) | 0 (0.0%) |
| 5 or more Children | 0 (0.0%) | 0 (0.0%) |
| Total | 0 (0.0%) | 1 (33.3%) |
Income Below Poverty Among Married-Couple vs Single-Parent Households in Slick
The poverty data for Slick shows that 47 of the married-couple family households (75.8%) and 1 of the single-parent households (6.2%) are living below the poverty level. Within the married-couple family households, those with no children have the highest poverty rate, with 47 households (82.5%) falling below the poverty line. Among the single-parent households, those with no children have the highest poverty rate, with 1 household (33.3%) living below poverty.
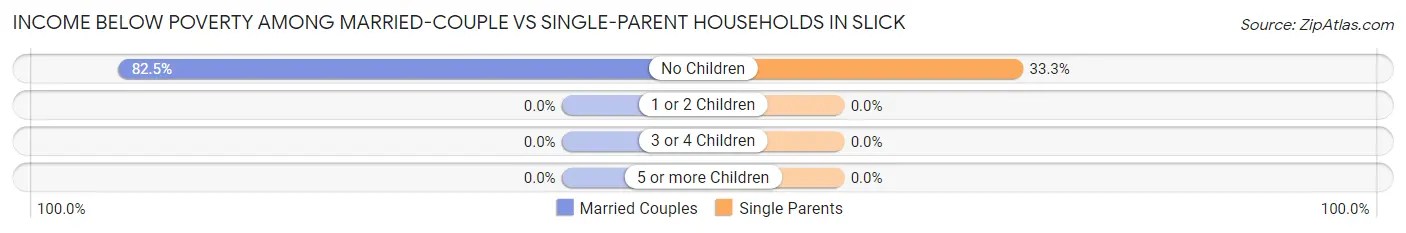
| Children | Married-Couple Families | Single-Parent Households |
| No Children | 47 (82.5%) | 1 (33.3%) |
| 1 or 2 Children | 0 (0.0%) | 0 (0.0%) |
| 3 or 4 Children | 0 (0.0%) | 0 (0.0%) |
| 5 or more Children | 0 (0.0%) | 0 (0.0%) |
| Total | 47 (75.8%) | 1 (6.2%) |
Race in Slick
The most populous races in Slick are White / Caucasian (155 | 89.1%), Native / Alaskan (15 | 8.6%), and Black / African American (4 | 2.3%).
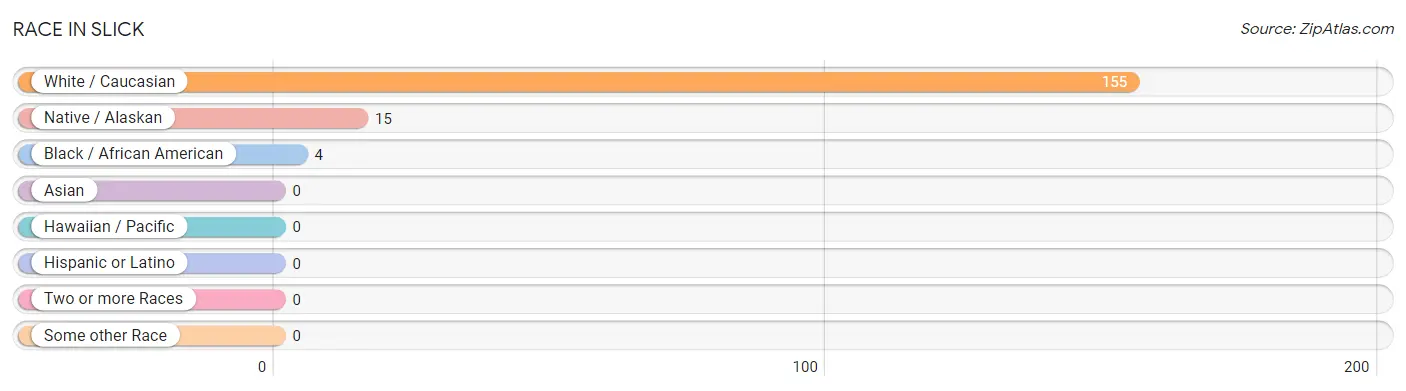
| Race | # Population | % Population |
| Asian | 0 | 0.0% |
| Black / African American | 4 | 2.3% |
| Hawaiian / Pacific | 0 | 0.0% |
| Hispanic or Latino | 0 | 0.0% |
| Native / Alaskan | 15 | 8.6% |
| White / Caucasian | 155 | 89.1% |
| Two or more Races | 0 | 0.0% |
| Some other Race | 0 | 0.0% |
| Total | 174 | 100.0% |
Ancestry in Slick
The most populous ancestries reported in Slick are German (72 | 41.4%), Irish (22 | 12.6%), French (13 | 7.5%), Creek (9 | 5.2%), and English (8 | 4.6%), together accounting for 71.3% of all Slick residents.
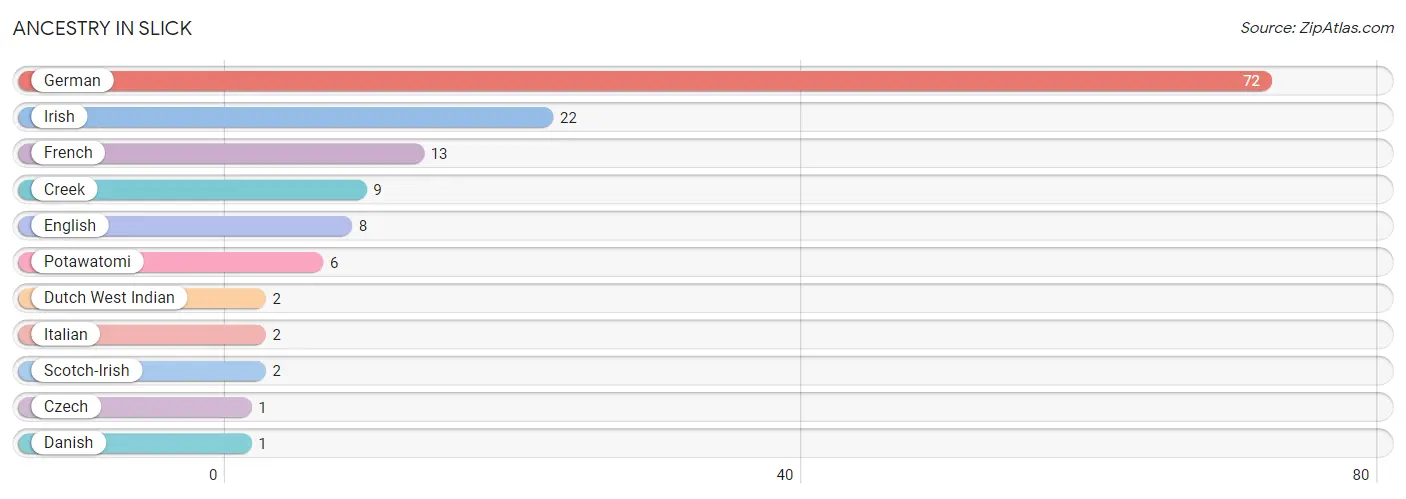
| Ancestry | # Population | % Population |
| Creek | 9 | 5.2% |
| Czech | 1 | 0.6% |
| Danish | 1 | 0.6% |
| Dutch West Indian | 2 | 1.1% |
| English | 8 | 4.6% |
| French | 13 | 7.5% |
| German | 72 | 41.4% |
| Irish | 22 | 12.6% |
| Italian | 2 | 1.1% |
| Potawatomi | 6 | 3.5% |
| Scotch-Irish | 2 | 1.1% | View All 11 Rows |
Immigrants in Slick

| Immigration Origin | # Population | % Population | View All 0 Rows |
Sex and Age in Slick
Sex and Age in Slick
The most populous age groups in Slick are 25 to 29 Years (17 | 23.3%) for men and 65 to 69 Years (47 | 46.5%) for women.
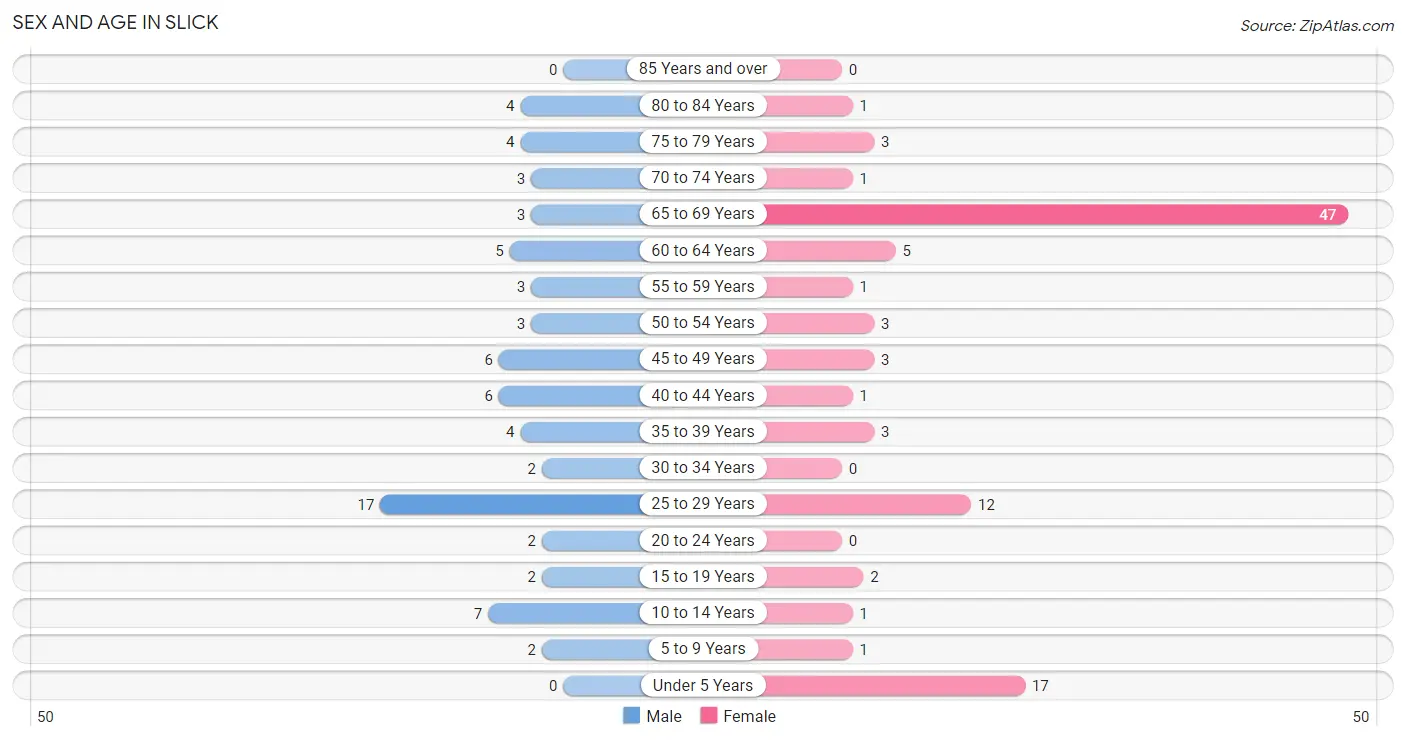
| Age Bracket | Male | Female |
| Under 5 Years | 0 (0.0%) | 17 (16.8%) |
| 5 to 9 Years | 2 (2.7%) | 1 (1.0%) |
| 10 to 14 Years | 7 (9.6%) | 1 (1.0%) |
| 15 to 19 Years | 2 (2.7%) | 2 (2.0%) |
| 20 to 24 Years | 2 (2.7%) | 0 (0.0%) |
| 25 to 29 Years | 17 (23.3%) | 12 (11.9%) |
| 30 to 34 Years | 2 (2.7%) | 0 (0.0%) |
| 35 to 39 Years | 4 (5.5%) | 3 (3.0%) |
| 40 to 44 Years | 6 (8.2%) | 1 (1.0%) |
| 45 to 49 Years | 6 (8.2%) | 3 (3.0%) |
| 50 to 54 Years | 3 (4.1%) | 3 (3.0%) |
| 55 to 59 Years | 3 (4.1%) | 1 (1.0%) |
| 60 to 64 Years | 5 (6.9%) | 5 (5.0%) |
| 65 to 69 Years | 3 (4.1%) | 47 (46.5%) |
| 70 to 74 Years | 3 (4.1%) | 1 (1.0%) |
| 75 to 79 Years | 4 (5.5%) | 3 (3.0%) |
| 80 to 84 Years | 4 (5.5%) | 1 (1.0%) |
| 85 Years and over | 0 (0.0%) | 0 (0.0%) |
| Total | 73 (100.0%) | 101 (100.0%) |
Families and Households in Slick
Median Family Size in Slick
The median family size in Slick is 1.79 persons per family, with single male/father families (13 | 16.7%) accounting for the largest median family size of 2.69 persons per family. On the other hand, married-couple families (62 | 79.5%) represent the smallest median family size with 1.56 persons per family.
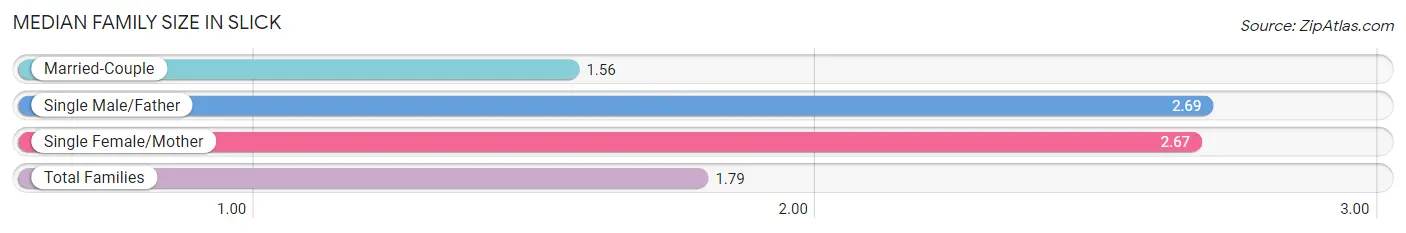
| Family Type | # Families | Family Size |
| Married-Couple | 62 (79.5%) | 1.56 |
| Single Male/Father | 13 (16.7%) | 2.69 |
| Single Female/Mother | 3 (3.8%) | 2.67 |
| Total Families | 78 (100.0%) | 1.79 |
Median Household Size in Slick
The median household size in Slick is 1.76 persons per household, with single male/father households (13 | 13.1%) accounting for the largest median household size of 3.46 persons per household. non-family households (21 | 21.2%) represent the smallest median household size with 1.14 persons per household.
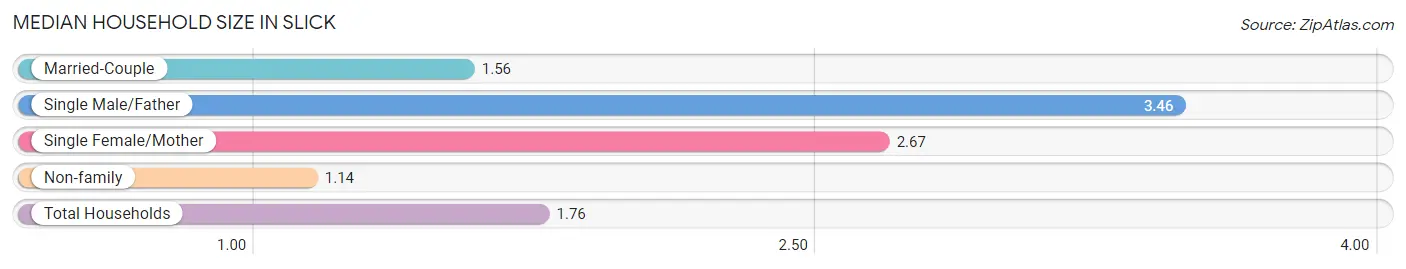
| Household Type | # Households | Household Size |
| Married-Couple | 62 (62.6%) | 1.56 |
| Single Male/Father | 13 (13.1%) | 3.46 |
| Single Female/Mother | 3 (3.0%) | 2.67 |
| Non-family | 21 (21.2%) | 1.14 |
| Total Households | 99 (100.0%) | 1.76 |
Household Size by Marriage Status in Slick
Out of a total of 99 households in Slick, 78 (78.8%) are family households, while 21 (21.2%) are nonfamily households. The most numerous type of family households are 2-person households, comprising 57, and the most common type of nonfamily households are 1-person households, comprising 19.
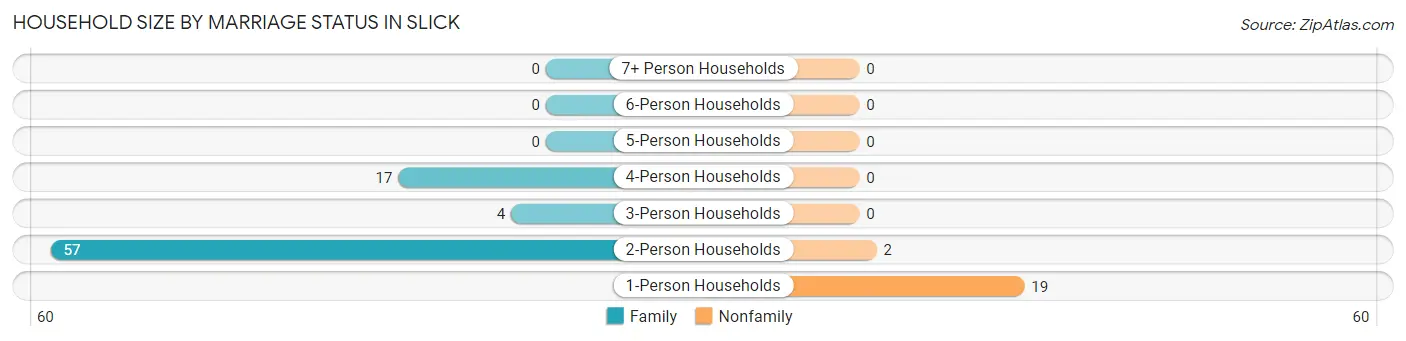
| Household Size | Family Households | Nonfamily Households |
| 1-Person Households | - | 19 (19.2%) |
| 2-Person Households | 57 (57.6%) | 2 (2.0%) |
| 3-Person Households | 4 (4.0%) | 0 (0.0%) |
| 4-Person Households | 17 (17.2%) | 0 (0.0%) |
| 5-Person Households | 0 (0.0%) | 0 (0.0%) |
| 6-Person Households | 0 (0.0%) | 0 (0.0%) |
| 7+ Person Households | 0 (0.0%) | 0 (0.0%) |
| Total | 78 (78.8%) | 21 (21.2%) |
Female Fertility in Slick
Fertility by Age in Slick
Average fertility rate in Slick is 95.0 births per 1,000 women. Women in the age bracket of 35 to 50 years have the highest fertility rate with 286.0 births per 1,000 women. Women in the age bracket of 35 to 50 years acount for 100.0% of all women with births.
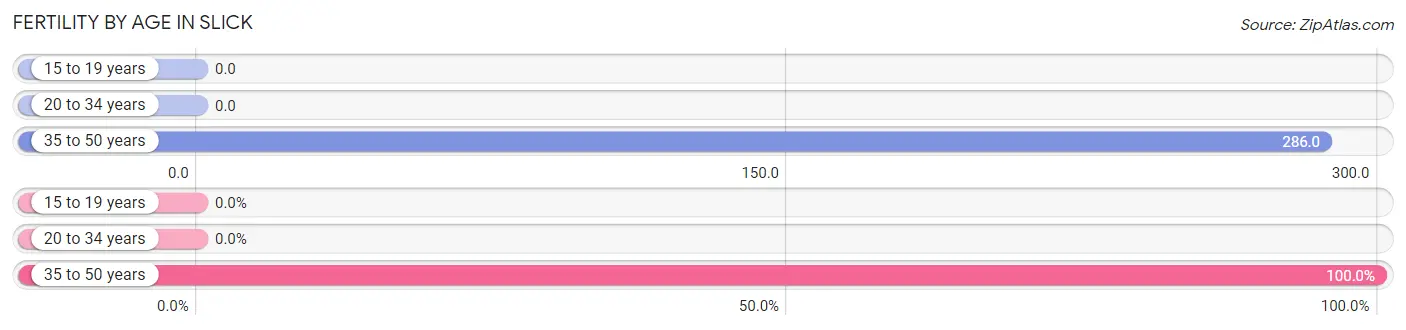
| Age Bracket | Women with Births | Births / 1,000 Women |
| 15 to 19 years | 0 (0.0%) | 0.0 |
| 20 to 34 years | 0 (0.0%) | 0.0 |
| 35 to 50 years | 2 (100.0%) | 286.0 |
| Total | 2 (100.0%) | 95.0 |
Fertility by Age by Marriage Status in Slick
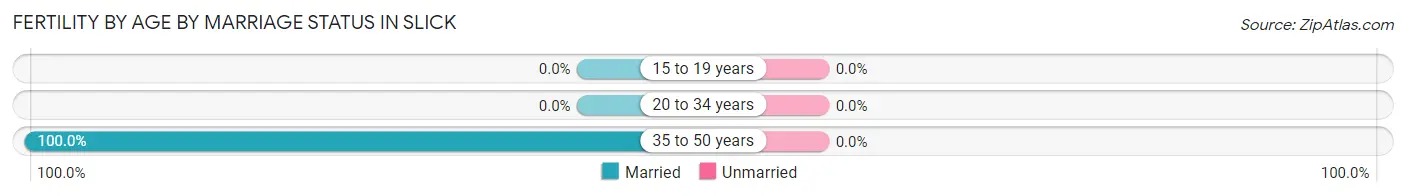
| Age Bracket | Married | Unmarried |
| 15 to 19 years | 0 (0.0%) | 0 (0.0%) |
| 20 to 34 years | 0 (0.0%) | 0 (0.0%) |
| 35 to 50 years | 2 (100.0%) | 0 (0.0%) |
| Total | 2 (100.0%) | 0 (0.0%) |
Fertility by Education in Slick
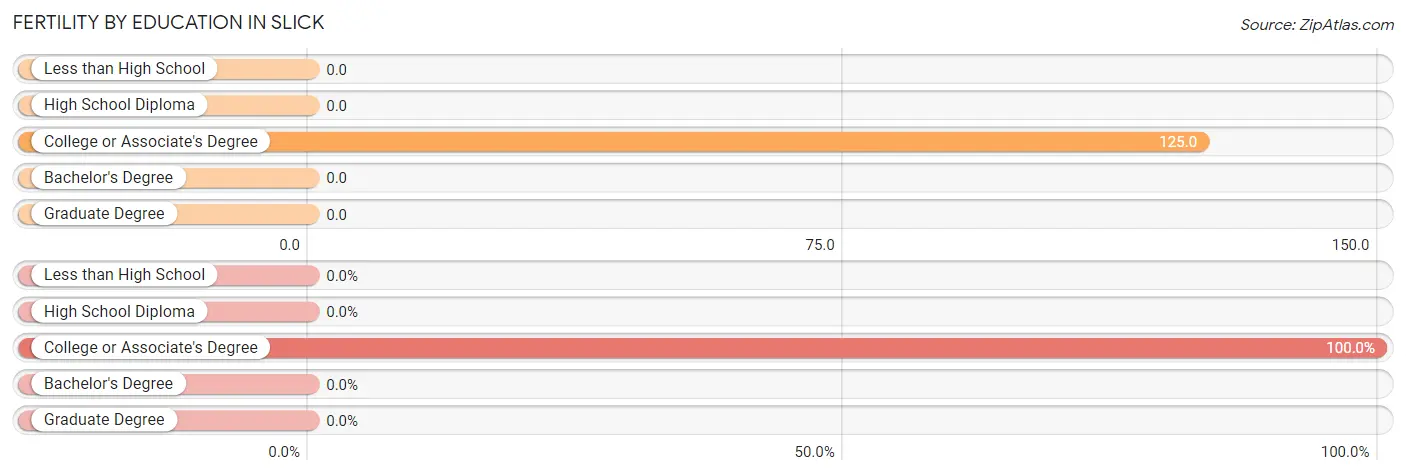
| Educational Attainment | Women with Births | Births / 1,000 Women |
| Less than High School | 0 (0.0%) | 0.0 |
| High School Diploma | 0 (0.0%) | 0.0 |
| College or Associate's Degree | 2 (100.0%) | 125.0 |
| Bachelor's Degree | 0 (0.0%) | 0.0 |
| Graduate Degree | 0 (0.0%) | 0.0 |
| Total | 2 (100.0%) | 95.0 |
Fertility by Education by Marriage Status in Slick
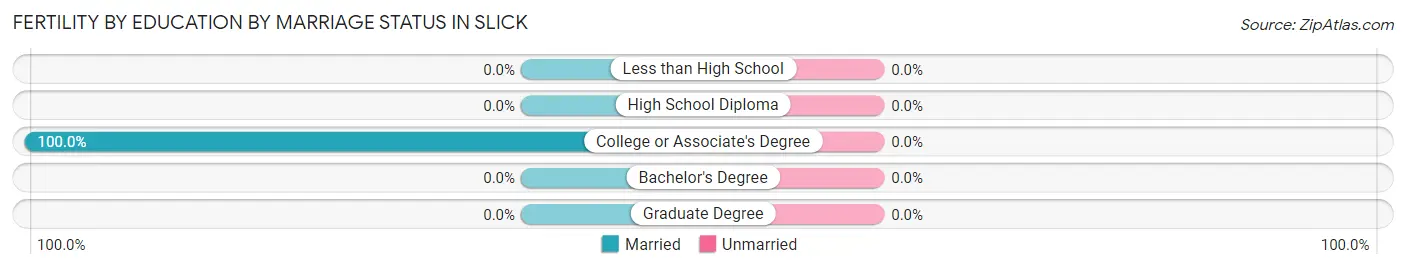
| Educational Attainment | Married | Unmarried |
| Less than High School | 0 (0.0%) | 0 (0.0%) |
| High School Diploma | 0 (0.0%) | 0 (0.0%) |
| College or Associate's Degree | 2 (100.0%) | 0 (0.0%) |
| Bachelor's Degree | 0 (0.0%) | 0 (0.0%) |
| Graduate Degree | 0 (0.0%) | 0 (0.0%) |
| Total | 2 (100.0%) | 0 (0.0%) |
Employment Characteristics in Slick
Employment by Class of Employer in Slick
Among the 57 employed individuals in Slick, private company employees (34 | 59.7%), not-for-profit organizations (14 | 24.6%), and self-employed (incorporated) (5 | 8.8%) make up the most common classes of employment.
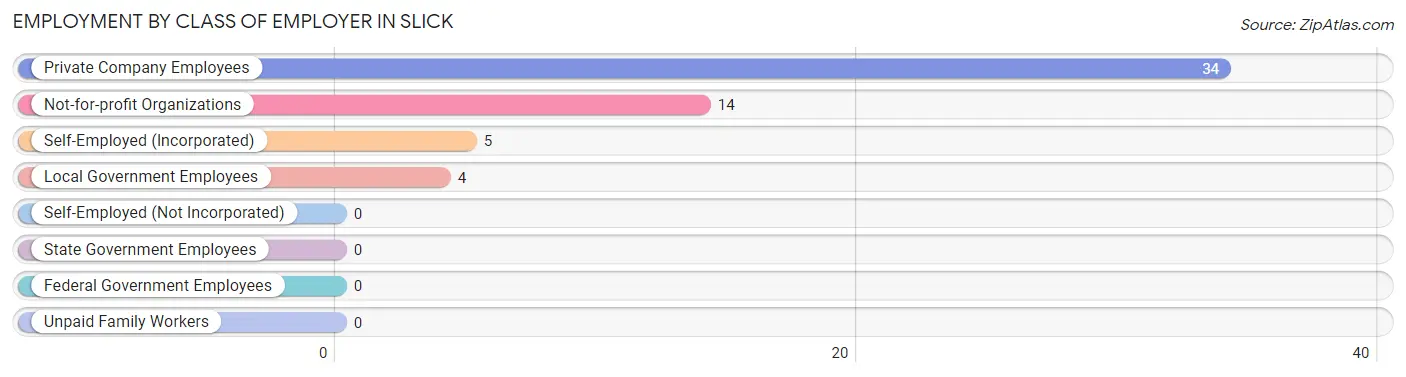
| Employer Class | # Employees | % Employees |
| Private Company Employees | 34 | 59.7% |
| Self-Employed (Incorporated) | 5 | 8.8% |
| Self-Employed (Not Incorporated) | 0 | 0.0% |
| Not-for-profit Organizations | 14 | 24.6% |
| Local Government Employees | 4 | 7.0% |
| State Government Employees | 0 | 0.0% |
| Federal Government Employees | 0 | 0.0% |
| Unpaid Family Workers | 0 | 0.0% |
| Total | 57 | 100.0% |
Employment Status by Age in Slick
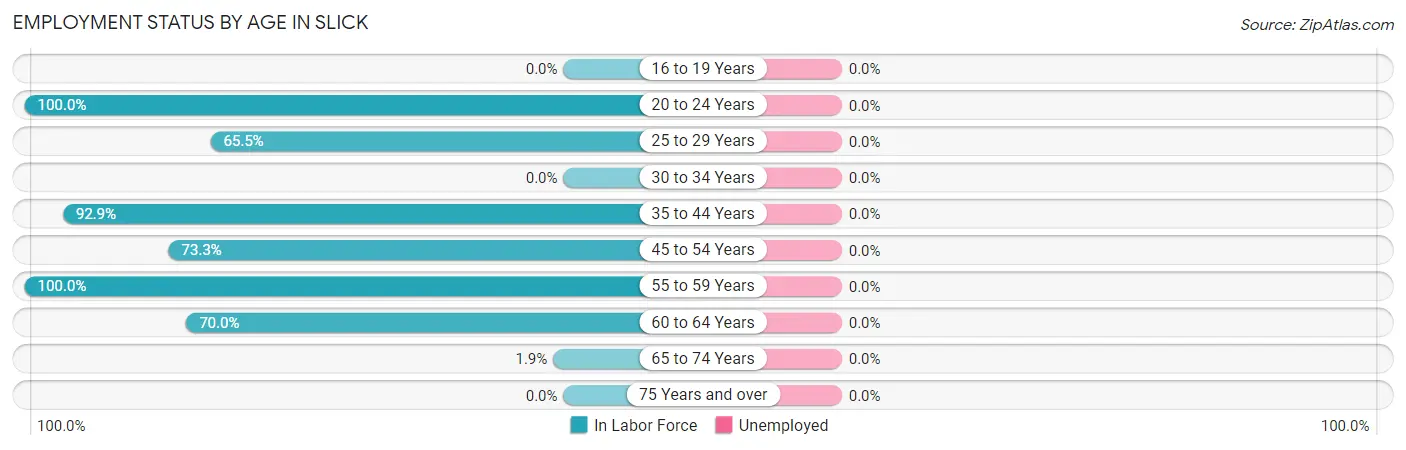
| Age Bracket | In Labor Force | Unemployed |
| 16 to 19 Years | 0 (0.0%) | 0 (0.0%) |
| 20 to 24 Years | 2 (100.0%) | 0 (0.0%) |
| 25 to 29 Years | 19 (65.5%) | 0 (0.0%) |
| 30 to 34 Years | 0 (0.0%) | 0 (0.0%) |
| 35 to 44 Years | 13 (92.9%) | 0 (0.0%) |
| 45 to 54 Years | 11 (73.3%) | 0 (0.0%) |
| 55 to 59 Years | 4 (100.0%) | 0 (0.0%) |
| 60 to 64 Years | 7 (70.0%) | 0 (0.0%) |
| 65 to 74 Years | 1 (1.9%) | 0 (0.0%) |
| 75 Years and over | 0 (0.0%) | 0 (0.0%) |
| Total | 57 (39.6%) | 0 (0.0%) |
Employment Status by Educational Attainment in Slick
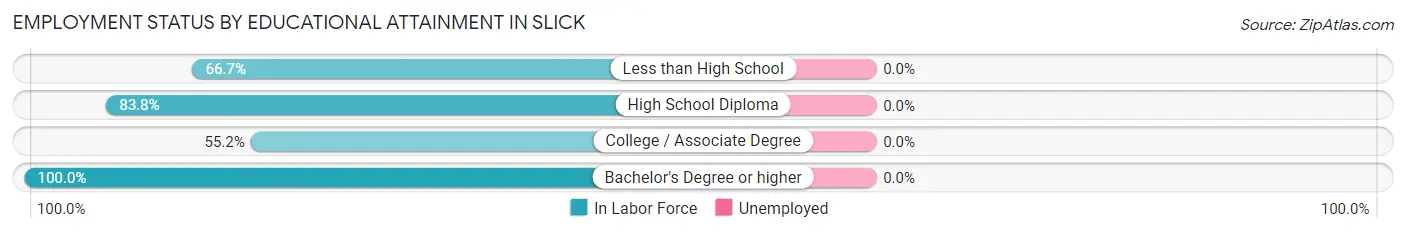
| Educational Attainment | In Labor Force | Unemployed |
| Less than High School | 2 (66.7%) | 0 (0.0%) |
| High School Diploma | 31 (83.8%) | 0 (0.0%) |
| College / Associate Degree | 16 (55.2%) | 0 (0.0%) |
| Bachelor's Degree or higher | 5 (100.0%) | 0 (0.0%) |
| Total | 54 (73.0%) | 0 (0.0%) |
Employment Occupations by Sex in Slick
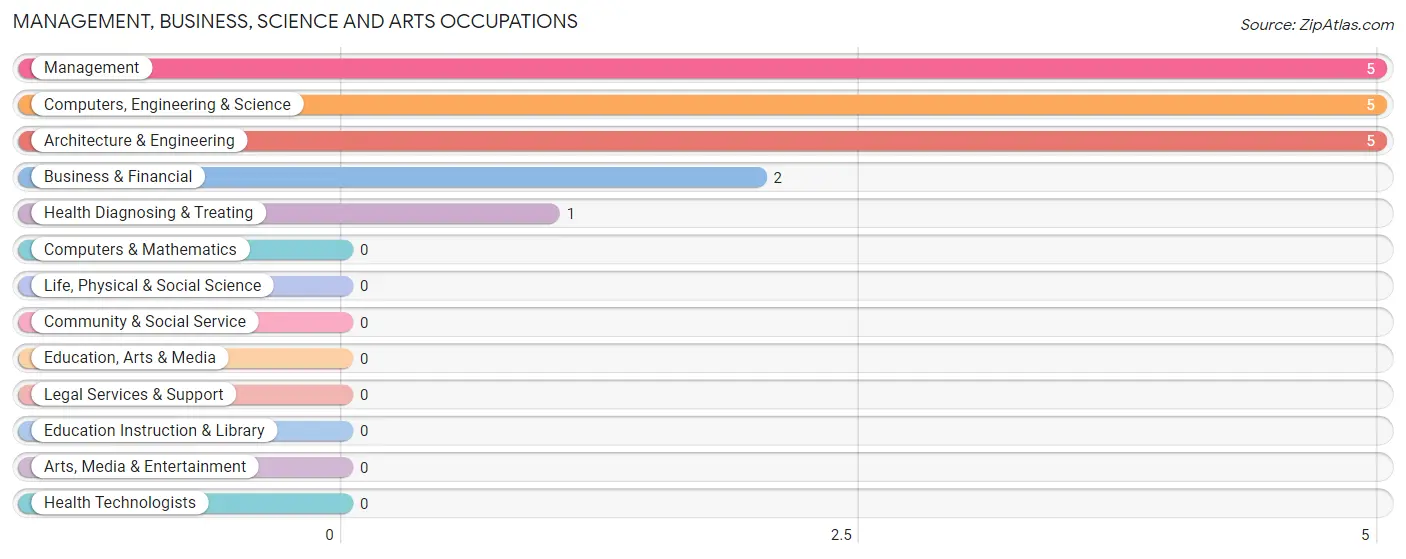
Management, Business, Science and Arts Occupations
The most common Management, Business, Science and Arts occupations in Slick are Management (5 | 8.8%), Computers, Engineering & Science (5 | 8.8%), Architecture & Engineering (5 | 8.8%), Business & Financial (2 | 3.5%), and Health Diagnosing & Treating (1 | 1.8%).
Management, Business, Science and Arts Occupations by Sex
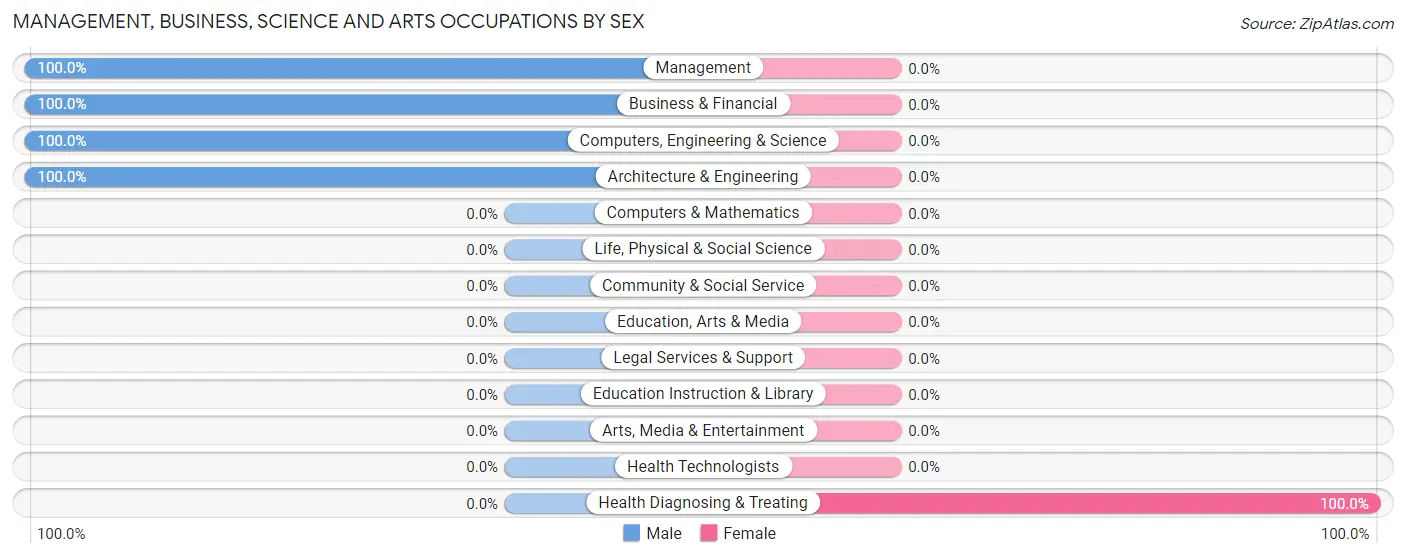
| Occupation | Male | Female |
| Management | 5 (100.0%) | 0 (0.0%) |
| Business & Financial | 2 (100.0%) | 0 (0.0%) |
| Computers, Engineering & Science | 5 (100.0%) | 0 (0.0%) |
| Computers & Mathematics | 0 (0.0%) | 0 (0.0%) |
| Architecture & Engineering | 5 (100.0%) | 0 (0.0%) |
| Life, Physical & Social Science | 0 (0.0%) | 0 (0.0%) |
| Community & Social Service | 0 (0.0%) | 0 (0.0%) |
| Education, Arts & Media | 0 (0.0%) | 0 (0.0%) |
| Legal Services & Support | 0 (0.0%) | 0 (0.0%) |
| Education Instruction & Library | 0 (0.0%) | 0 (0.0%) |
| Arts, Media & Entertainment | 0 (0.0%) | 0 (0.0%) |
| Health Diagnosing & Treating | 0 (0.0%) | 1 (100.0%) |
| Health Technologists | 0 (0.0%) | 0 (0.0%) |
| Total (Category) | 12 (92.3%) | 1 (7.7%) |
| Total (Overall) | 45 (78.9%) | 12 (21.0%) |
Services Occupations
The most common Services occupations in Slick are Healthcare Support (3 | 5.3%), Cleaning & Maintenance (2 | 3.5%), and Food Preparation & Serving (1 | 1.8%).
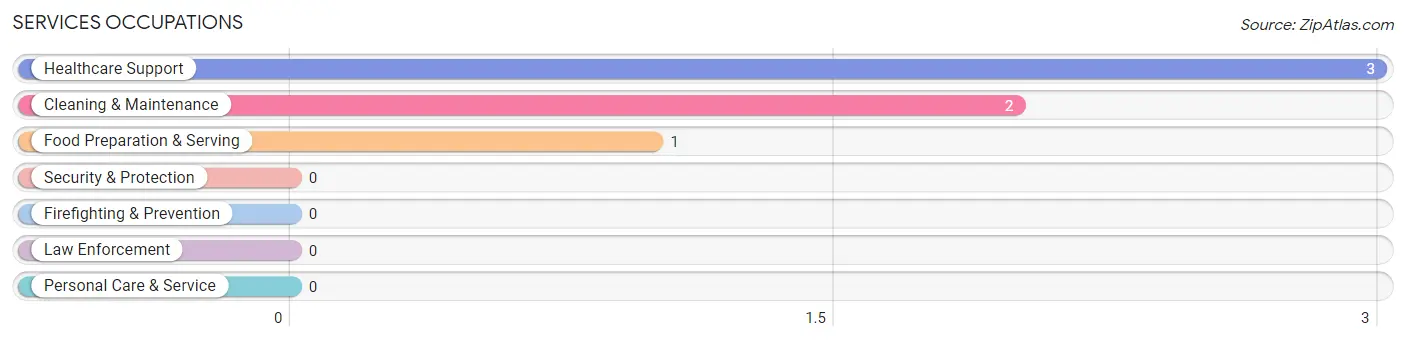
Services Occupations by Sex
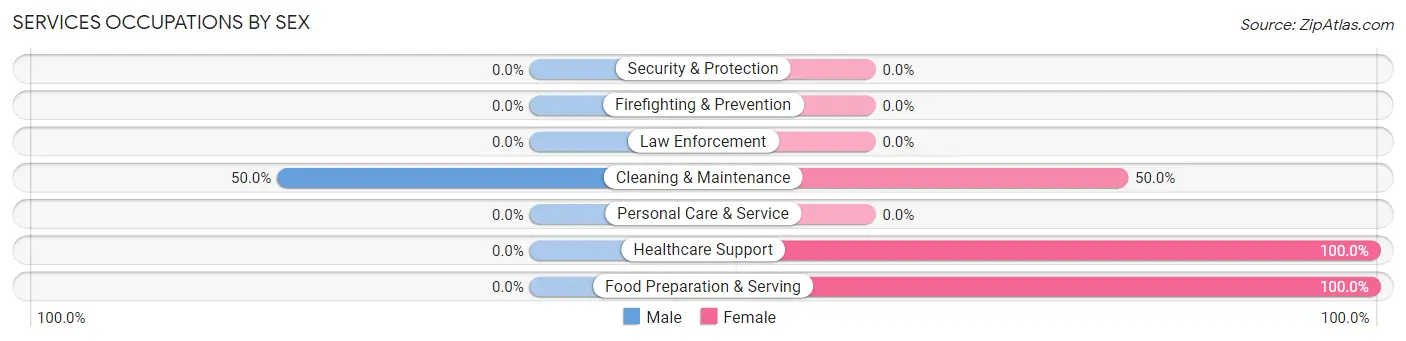
| Occupation | Male | Female |
| Healthcare Support | 0 (0.0%) | 3 (100.0%) |
| Security & Protection | 0 (0.0%) | 0 (0.0%) |
| Firefighting & Prevention | 0 (0.0%) | 0 (0.0%) |
| Law Enforcement | 0 (0.0%) | 0 (0.0%) |
| Food Preparation & Serving | 0 (0.0%) | 1 (100.0%) |
| Cleaning & Maintenance | 1 (50.0%) | 1 (50.0%) |
| Personal Care & Service | 0 (0.0%) | 0 (0.0%) |
| Total (Category) | 1 (16.7%) | 5 (83.3%) |
| Total (Overall) | 45 (78.9%) | 12 (21.0%) |
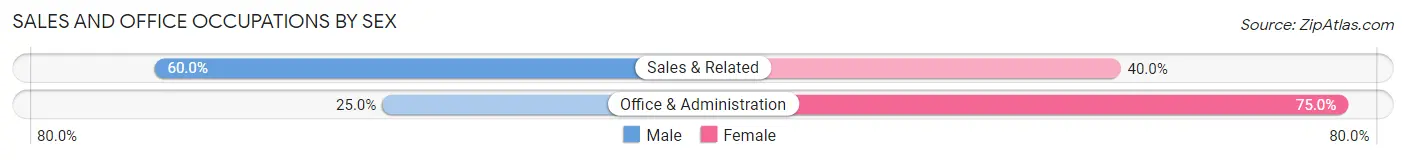
Sales and Office Occupations
The most common Sales and Office occupations in Slick are Sales & Related (5 | 8.8%), and Office & Administration (4 | 7.0%).
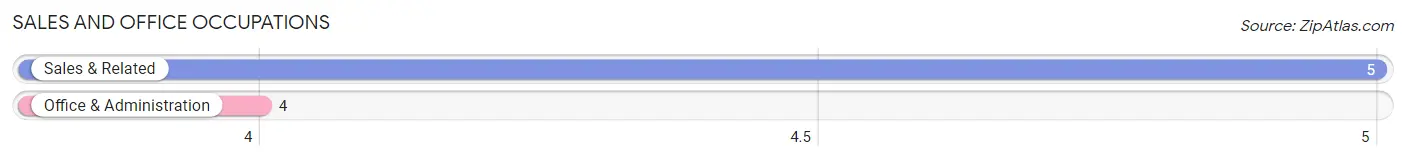
Sales and Office Occupations by Sex
| Occupation | Male | Female |
| Sales & Related | 3 (60.0%) | 2 (40.0%) |
| Office & Administration | 1 (25.0%) | 3 (75.0%) |
| Total (Category) | 4 (44.4%) | 5 (55.6%) |
| Total (Overall) | 45 (78.9%) | 12 (21.0%) |
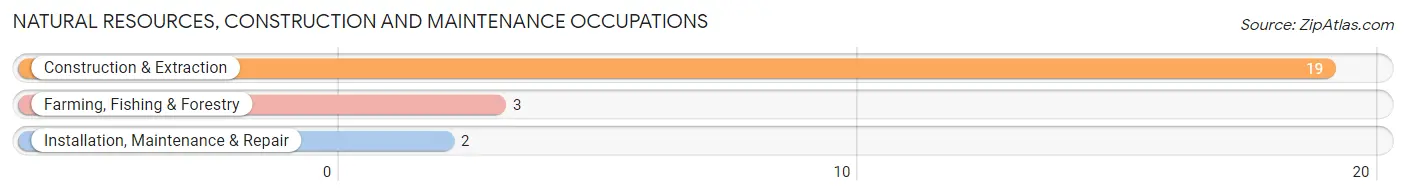
Natural Resources, Construction and Maintenance Occupations
The most common Natural Resources, Construction and Maintenance occupations in Slick are Construction & Extraction (19 | 33.3%), Farming, Fishing & Forestry (3 | 5.3%), and Installation, Maintenance & Repair (2 | 3.5%).
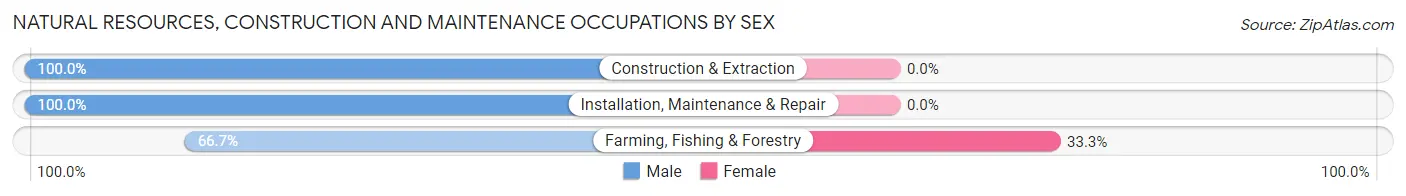
Natural Resources, Construction and Maintenance Occupations by Sex
| Occupation | Male | Female |
| Farming, Fishing & Forestry | 2 (66.7%) | 1 (33.3%) |
| Construction & Extraction | 19 (100.0%) | 0 (0.0%) |
| Installation, Maintenance & Repair | 2 (100.0%) | 0 (0.0%) |
| Total (Category) | 23 (95.8%) | 1 (4.2%) |
| Total (Overall) | 45 (78.9%) | 12 (21.0%) |
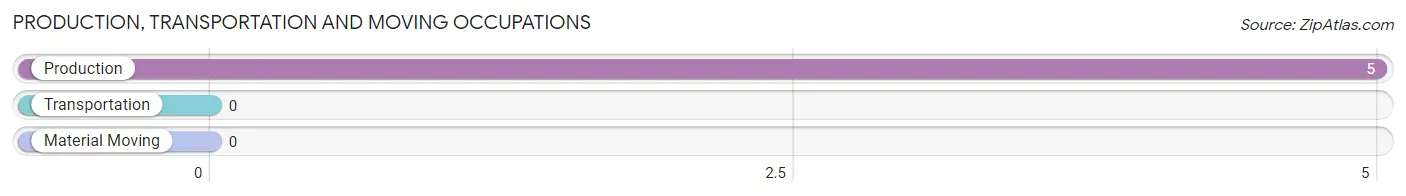
Production, Transportation and Moving Occupations
The most common Production, Transportation and Moving occupations in Slick are , and Production (5 | 8.8%).
Production, Transportation and Moving Occupations by Sex
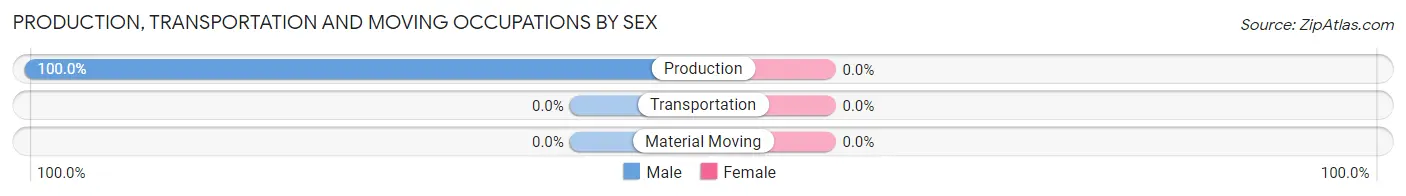
| Occupation | Male | Female |
| Production | 5 (100.0%) | 0 (0.0%) |
| Transportation | 0 (0.0%) | 0 (0.0%) |
| Material Moving | 0 (0.0%) | 0 (0.0%) |
| Total (Category) | 5 (100.0%) | 0 (0.0%) |
| Total (Overall) | 45 (78.9%) | 12 (21.0%) |
Employment Industries by Sex in Slick
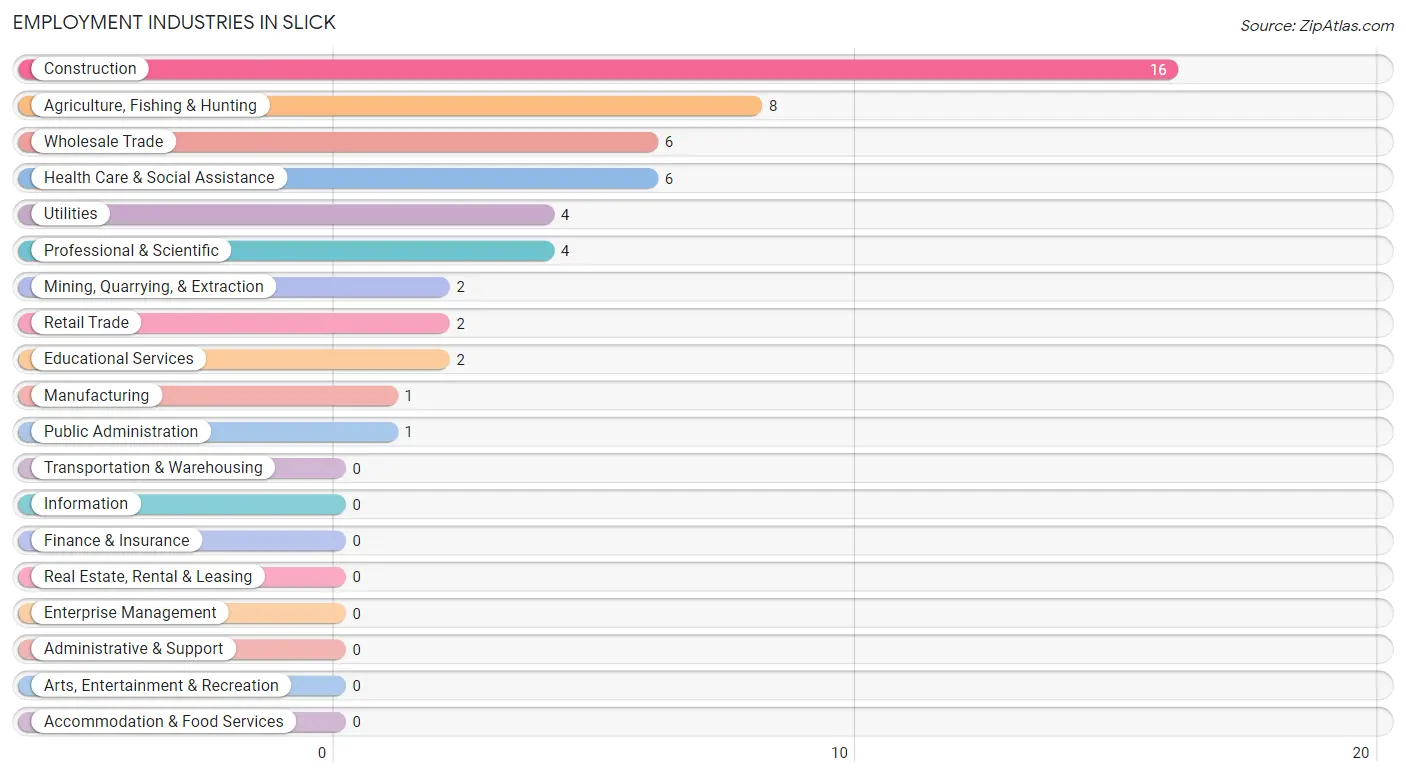
Employment Industries in Slick
The major employment industries in Slick include Construction (16 | 28.1%), Agriculture, Fishing & Hunting (8 | 14.0%), Wholesale Trade (6 | 10.5%), Health Care & Social Assistance (6 | 10.5%), and Utilities (4 | 7.0%).
Employment Industries by Sex in Slick
The Slick industries that see more men than women are Mining, Quarrying, & Extraction (100.0%), Construction (100.0%), and Manufacturing (100.0%), whereas the industries that tend to have a higher number of women are Retail Trade (100.0%), Health Care & Social Assistance (100.0%), and Public Administration (100.0%).
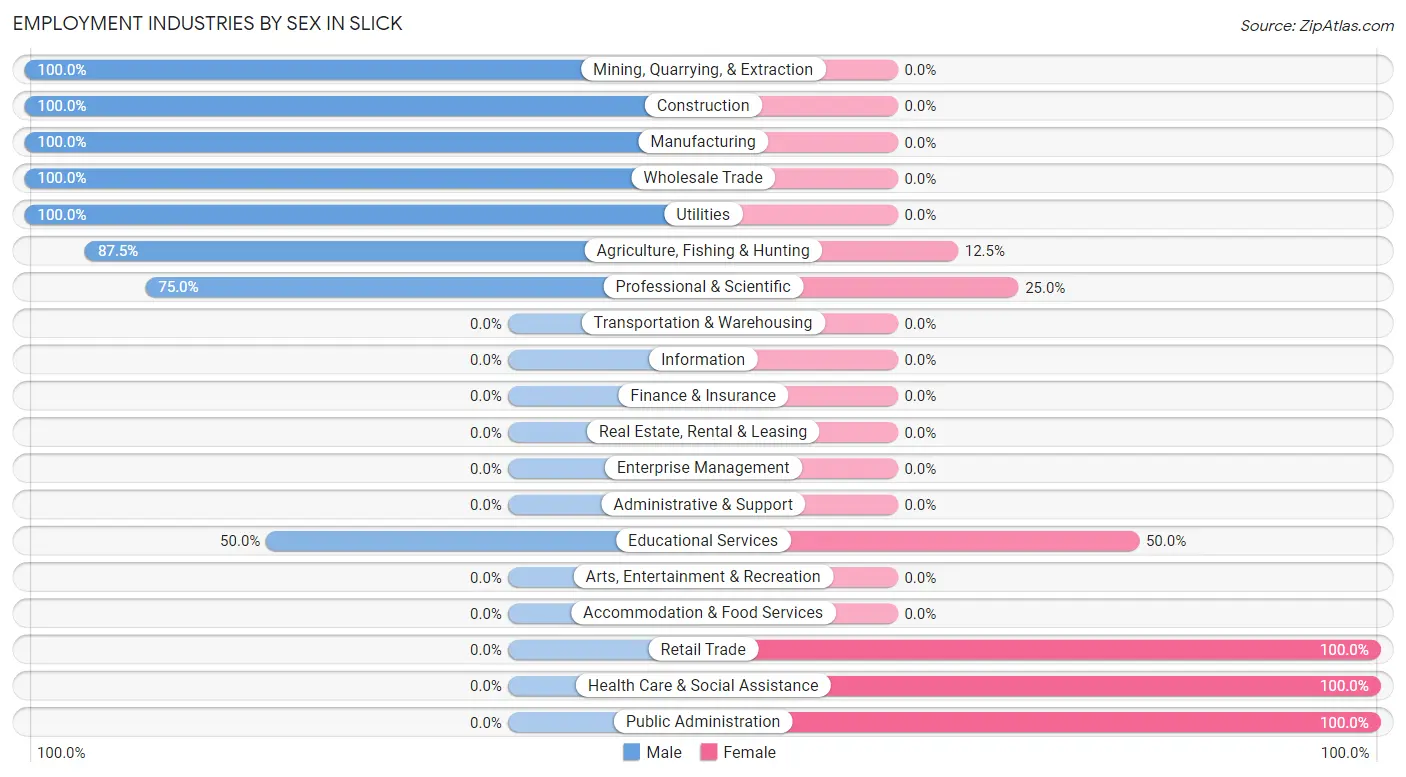
| Industry | Male | Female |
| Agriculture, Fishing & Hunting | 7 (87.5%) | 1 (12.5%) |
| Mining, Quarrying, & Extraction | 2 (100.0%) | 0 (0.0%) |
| Construction | 16 (100.0%) | 0 (0.0%) |
| Manufacturing | 1 (100.0%) | 0 (0.0%) |
| Wholesale Trade | 6 (100.0%) | 0 (0.0%) |
| Retail Trade | 0 (0.0%) | 2 (100.0%) |
| Transportation & Warehousing | 0 (0.0%) | 0 (0.0%) |
| Utilities | 4 (100.0%) | 0 (0.0%) |
| Information | 0 (0.0%) | 0 (0.0%) |
| Finance & Insurance | 0 (0.0%) | 0 (0.0%) |
| Real Estate, Rental & Leasing | 0 (0.0%) | 0 (0.0%) |
| Professional & Scientific | 3 (75.0%) | 1 (25.0%) |
| Enterprise Management | 0 (0.0%) | 0 (0.0%) |
| Administrative & Support | 0 (0.0%) | 0 (0.0%) |
| Educational Services | 1 (50.0%) | 1 (50.0%) |
| Health Care & Social Assistance | 0 (0.0%) | 6 (100.0%) |
| Arts, Entertainment & Recreation | 0 (0.0%) | 0 (0.0%) |
| Accommodation & Food Services | 0 (0.0%) | 0 (0.0%) |
| Public Administration | 0 (0.0%) | 1 (100.0%) |
| Total | 45 (78.9%) | 12 (21.0%) |
Education in Slick
School Enrollment in Slick
The most common levels of schooling among the 18 students in Slick are middle school (8 | 44.4%), high school (4 | 22.2%), and elementary school (3 | 16.7%).
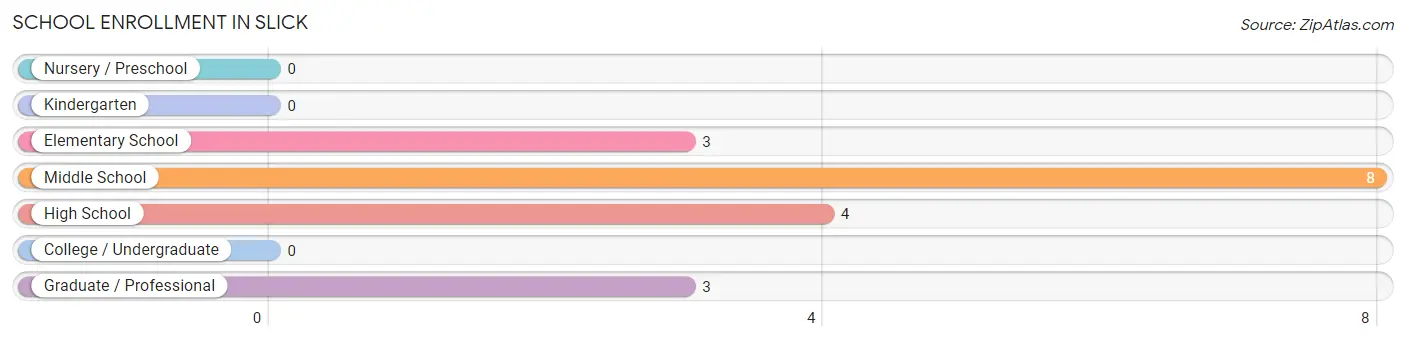
| School Level | # Students | % Students |
| Nursery / Preschool | 0 | 0.0% |
| Kindergarten | 0 | 0.0% |
| Elementary School | 3 | 16.7% |
| Middle School | 8 | 44.4% |
| High School | 4 | 22.2% |
| College / Undergraduate | 0 | 0.0% |
| Graduate / Professional | 3 | 16.7% |
| Total | 18 | 100.0% |
School Enrollment by Age by Funding Source in Slick
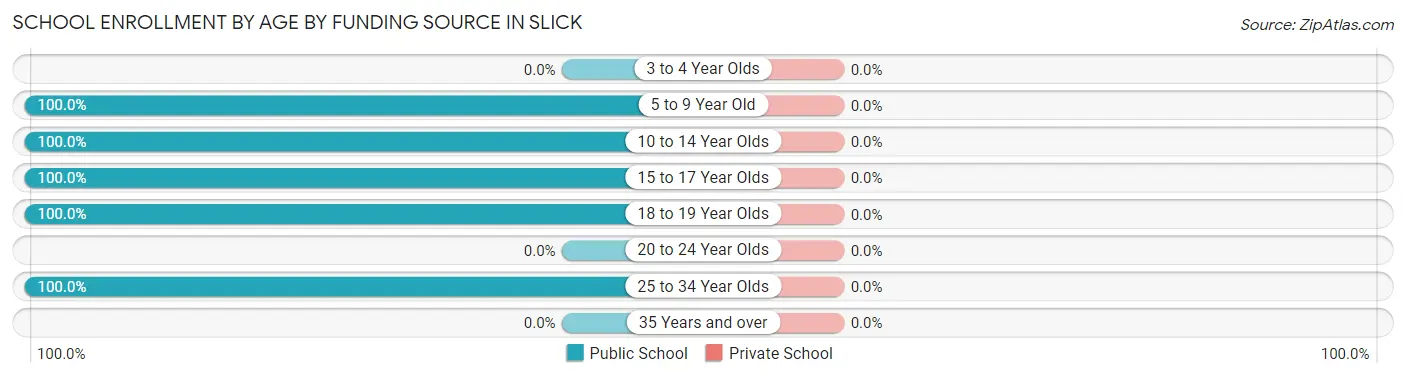
| Age Bracket | Public School | Private School |
| 3 to 4 Year Olds | 0 (0.0%) | 0 (0.0%) |
| 5 to 9 Year Old | 3 (100.0%) | 0 (0.0%) |
| 10 to 14 Year Olds | 8 (100.0%) | 0 (0.0%) |
| 15 to 17 Year Olds | 2 (100.0%) | 0 (0.0%) |
| 18 to 19 Year Olds | 2 (100.0%) | 0 (0.0%) |
| 20 to 24 Year Olds | 0 (0.0%) | 0 (0.0%) |
| 25 to 34 Year Olds | 3 (100.0%) | 0 (0.0%) |
| 35 Years and over | 0 (0.0%) | 0 (0.0%) |
| Total | 18 (100.0%) | 0 (0.0%) |
Educational Attainment by Field of Study in Slick
, and business (5 | 100.0%) are the most common fields of study among 5 individuals in Slick who have obtained a bachelor's degree or higher.
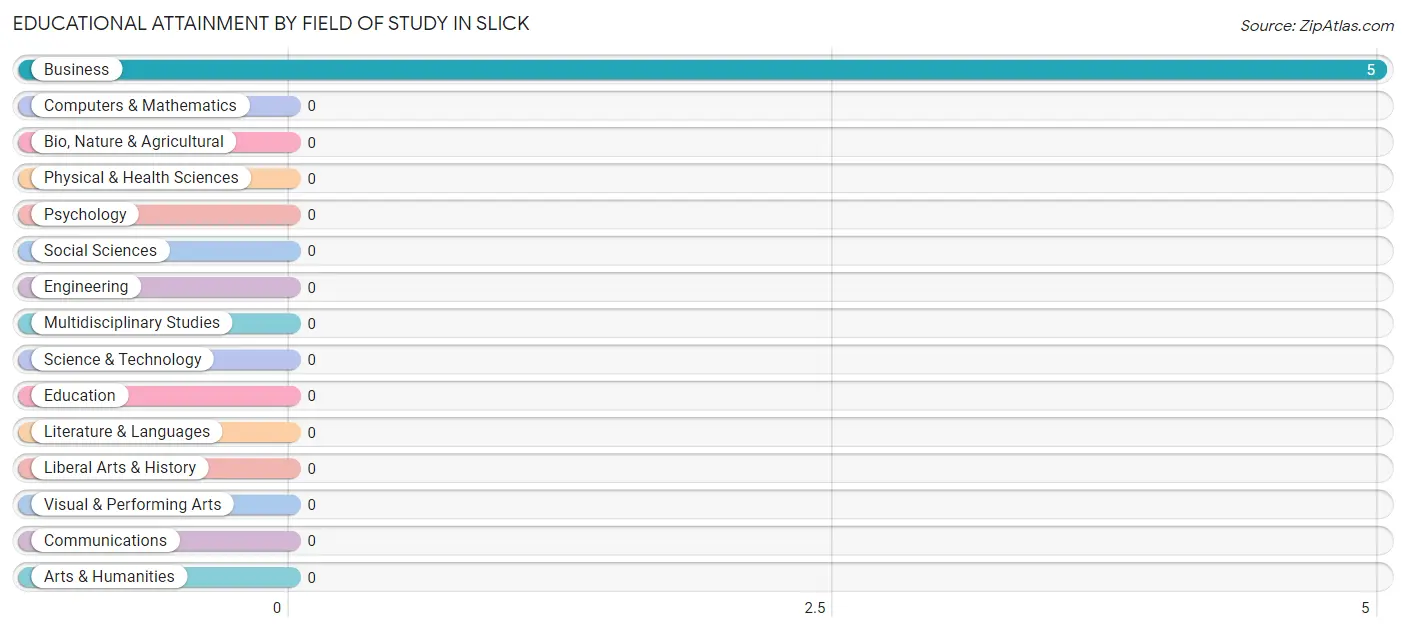
| Field of Study | # Graduates | % Graduates |
| Computers & Mathematics | 0 | 0.0% |
| Bio, Nature & Agricultural | 0 | 0.0% |
| Physical & Health Sciences | 0 | 0.0% |
| Psychology | 0 | 0.0% |
| Social Sciences | 0 | 0.0% |
| Engineering | 0 | 0.0% |
| Multidisciplinary Studies | 0 | 0.0% |
| Science & Technology | 0 | 0.0% |
| Business | 5 | 100.0% |
| Education | 0 | 0.0% |
| Literature & Languages | 0 | 0.0% |
| Liberal Arts & History | 0 | 0.0% |
| Visual & Performing Arts | 0 | 0.0% |
| Communications | 0 | 0.0% |
| Arts & Humanities | 0 | 0.0% |
| Total | 5 | 100.0% |
Transportation & Commute in Slick
Vehicle Availability by Sex in Slick
The most prevalent vehicle ownership categories in Slick are males with 3 vehicles (16, accounting for 35.6%) and females with 3 vehicles (0, making up 133.3%).
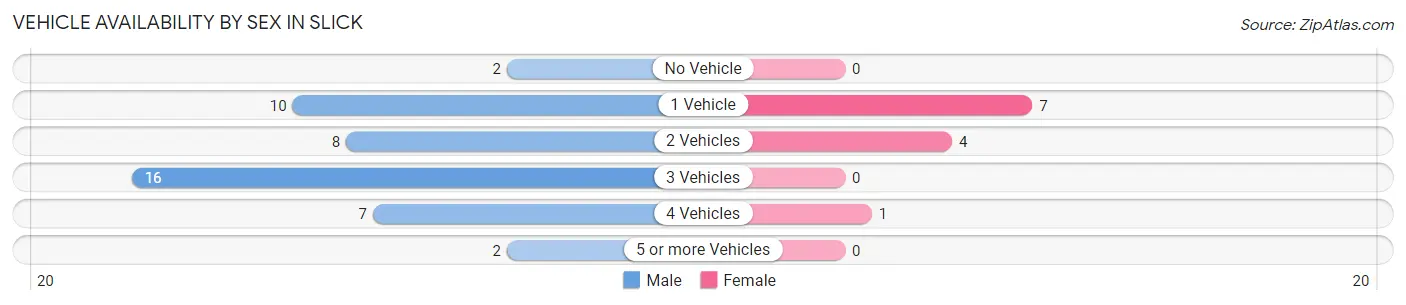
| Vehicles Available | Male | Female |
| No Vehicle | 2 (4.4%) | 0 (0.0%) |
| 1 Vehicle | 10 (22.2%) | 7 (58.3%) |
| 2 Vehicles | 8 (17.8%) | 4 (33.3%) |
| 3 Vehicles | 16 (35.6%) | 0 (0.0%) |
| 4 Vehicles | 7 (15.6%) | 1 (8.3%) |
| 5 or more Vehicles | 2 (4.4%) | 0 (0.0%) |
| Total | 45 (100.0%) | 12 (100.0%) |
Commute Time in Slick
The most frequently occuring commute durations in Slick are 15 to 19 minutes (13 commuters, 25.0%), 45 to 59 minutes (13 commuters, 25.0%), and 40 to 44 minutes (11 commuters, 21.1%).
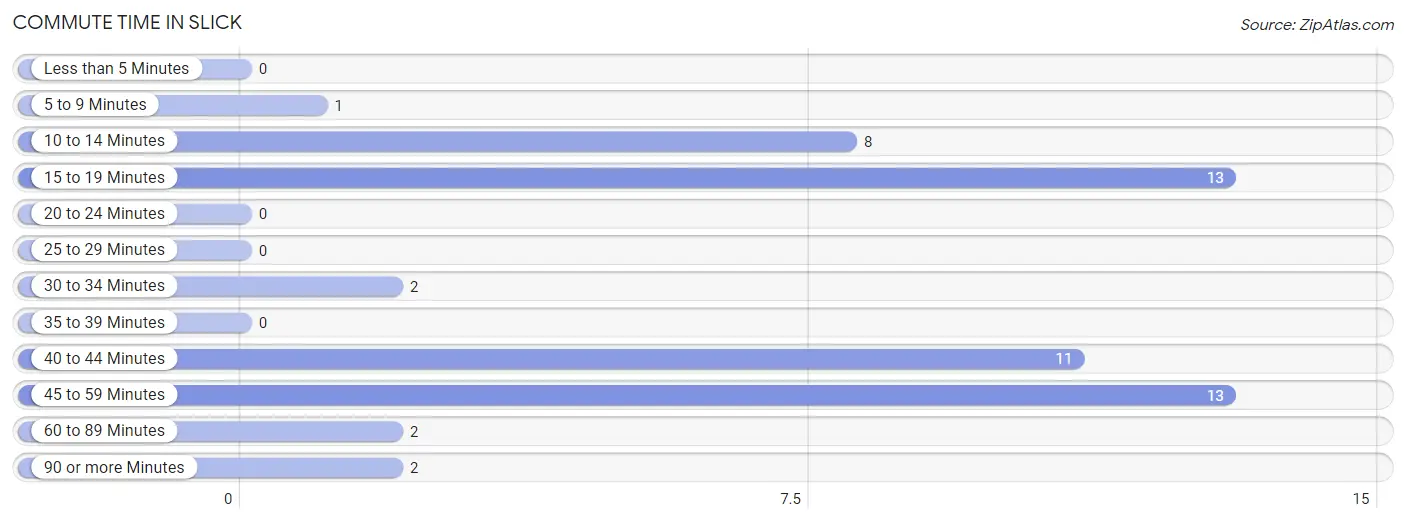
| Commute Time | # Commuters | % Commuters |
| Less than 5 Minutes | 0 | 0.0% |
| 5 to 9 Minutes | 1 | 1.9% |
| 10 to 14 Minutes | 8 | 15.4% |
| 15 to 19 Minutes | 13 | 25.0% |
| 20 to 24 Minutes | 0 | 0.0% |
| 25 to 29 Minutes | 0 | 0.0% |
| 30 to 34 Minutes | 2 | 3.8% |
| 35 to 39 Minutes | 0 | 0.0% |
| 40 to 44 Minutes | 11 | 21.1% |
| 45 to 59 Minutes | 13 | 25.0% |
| 60 to 89 Minutes | 2 | 3.8% |
| 90 or more Minutes | 2 | 3.8% |
Commute Time by Sex in Slick
The most common commute times in Slick are 40 to 44 minutes (11 commuters, 27.5%) for males and 15 to 19 minutes (8 commuters, 66.7%) for females.
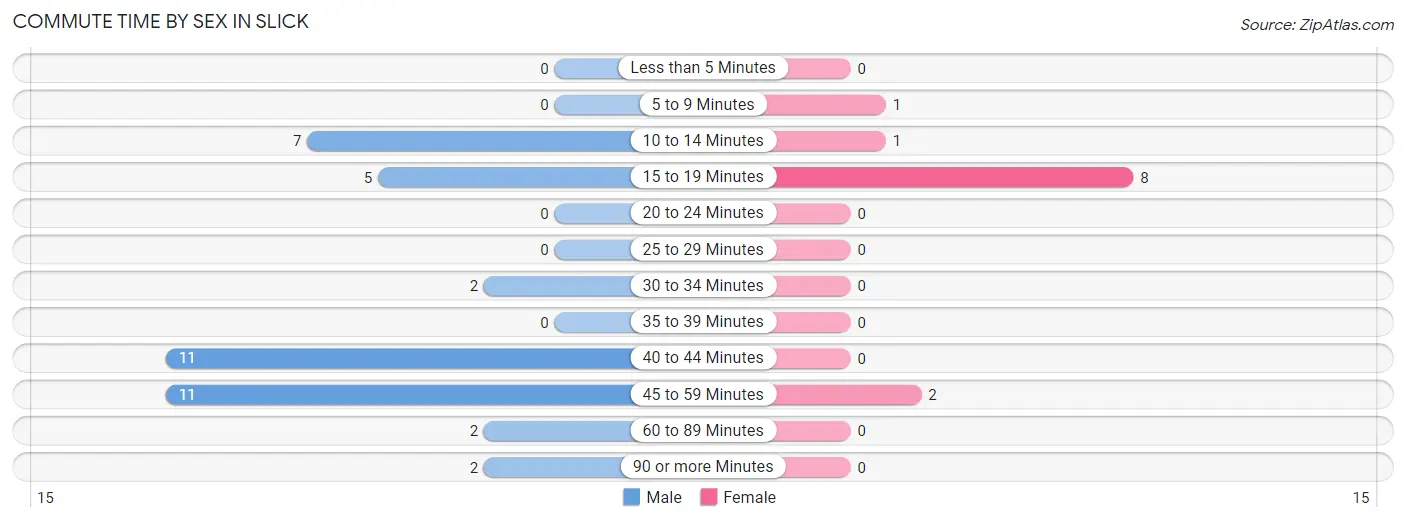
| Commute Time | Male | Female |
| Less than 5 Minutes | 0 (0.0%) | 0 (0.0%) |
| 5 to 9 Minutes | 0 (0.0%) | 1 (8.3%) |
| 10 to 14 Minutes | 7 (17.5%) | 1 (8.3%) |
| 15 to 19 Minutes | 5 (12.5%) | 8 (66.7%) |
| 20 to 24 Minutes | 0 (0.0%) | 0 (0.0%) |
| 25 to 29 Minutes | 0 (0.0%) | 0 (0.0%) |
| 30 to 34 Minutes | 2 (5.0%) | 0 (0.0%) |
| 35 to 39 Minutes | 0 (0.0%) | 0 (0.0%) |
| 40 to 44 Minutes | 11 (27.5%) | 0 (0.0%) |
| 45 to 59 Minutes | 11 (27.5%) | 2 (16.7%) |
| 60 to 89 Minutes | 2 (5.0%) | 0 (0.0%) |
| 90 or more Minutes | 2 (5.0%) | 0 (0.0%) |
Time of Departure to Work by Sex in Slick
The most frequent times of departure to work in Slick are 6:30 AM to 6:59 AM (12, 30.0%) for males and 7:30 AM to 7:59 AM (6, 50.0%) for females.
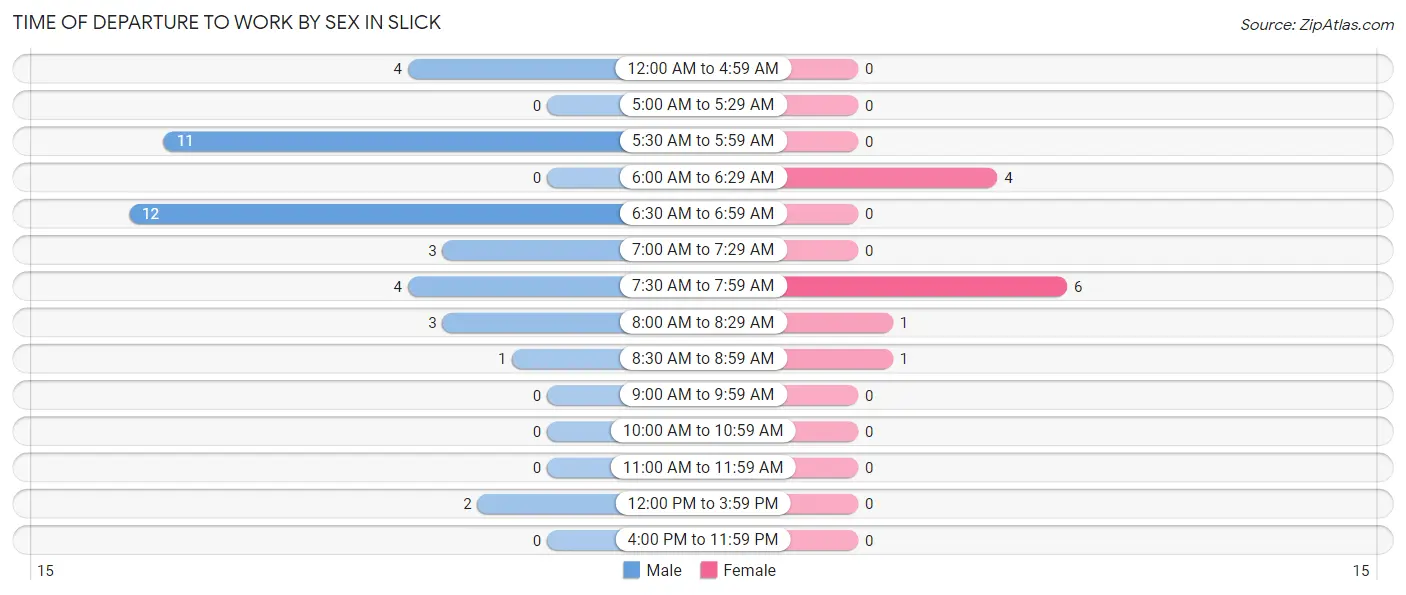
| Time of Departure | Male | Female |
| 12:00 AM to 4:59 AM | 4 (10.0%) | 0 (0.0%) |
| 5:00 AM to 5:29 AM | 0 (0.0%) | 0 (0.0%) |
| 5:30 AM to 5:59 AM | 11 (27.5%) | 0 (0.0%) |
| 6:00 AM to 6:29 AM | 0 (0.0%) | 4 (33.3%) |
| 6:30 AM to 6:59 AM | 12 (30.0%) | 0 (0.0%) |
| 7:00 AM to 7:29 AM | 3 (7.5%) | 0 (0.0%) |
| 7:30 AM to 7:59 AM | 4 (10.0%) | 6 (50.0%) |
| 8:00 AM to 8:29 AM | 3 (7.5%) | 1 (8.3%) |
| 8:30 AM to 8:59 AM | 1 (2.5%) | 1 (8.3%) |
| 9:00 AM to 9:59 AM | 0 (0.0%) | 0 (0.0%) |
| 10:00 AM to 10:59 AM | 0 (0.0%) | 0 (0.0%) |
| 11:00 AM to 11:59 AM | 0 (0.0%) | 0 (0.0%) |
| 12:00 PM to 3:59 PM | 2 (5.0%) | 0 (0.0%) |
| 4:00 PM to 11:59 PM | 0 (0.0%) | 0 (0.0%) |
| Total | 40 (100.0%) | 12 (100.0%) |
Housing Occupancy in Slick
Occupancy by Ownership in Slick
Of the total 99 dwellings in Slick, owner-occupied units account for 45 (45.5%), while renter-occupied units make up 54 (54.5%).
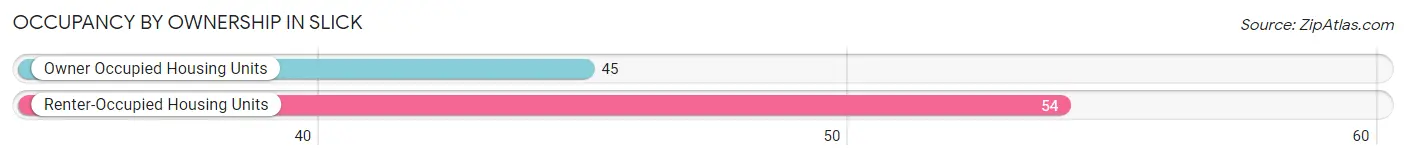
| Occupancy | # Housing Units | % Housing Units |
| Owner Occupied Housing Units | 45 | 45.5% |
| Renter-Occupied Housing Units | 54 | 54.5% |
| Total Occupied Housing Units | 99 | 100.0% |
Occupancy by Household Size in Slick
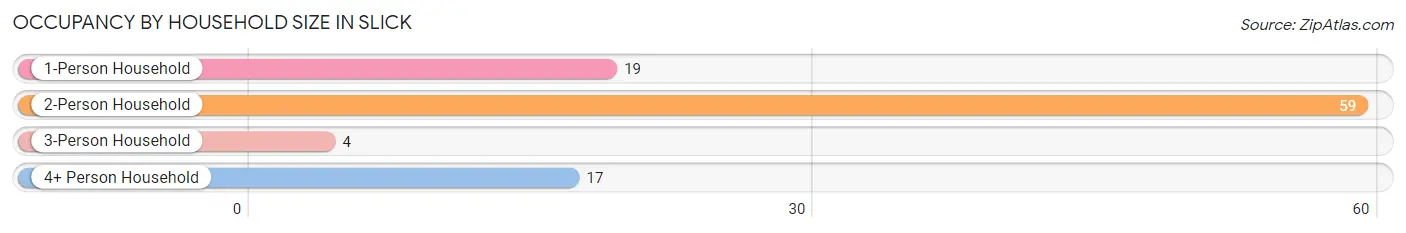
| Household Size | # Housing Units | % Housing Units |
| 1-Person Household | 19 | 19.2% |
| 2-Person Household | 59 | 59.6% |
| 3-Person Household | 4 | 4.0% |
| 4+ Person Household | 17 | 17.2% |
| Total Housing Units | 99 | 100.0% |
Occupancy by Ownership by Household Size in Slick
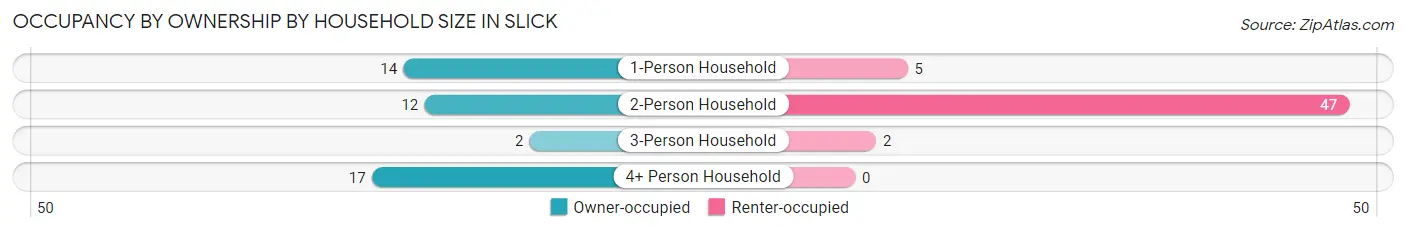
| Household Size | Owner-occupied | Renter-occupied |
| 1-Person Household | 14 (73.7%) | 5 (26.3%) |
| 2-Person Household | 12 (20.3%) | 47 (79.7%) |
| 3-Person Household | 2 (50.0%) | 2 (50.0%) |
| 4+ Person Household | 17 (100.0%) | 0 (0.0%) |
| Total Housing Units | 45 (45.5%) | 54 (54.5%) |
Occupancy by Educational Attainment in Slick
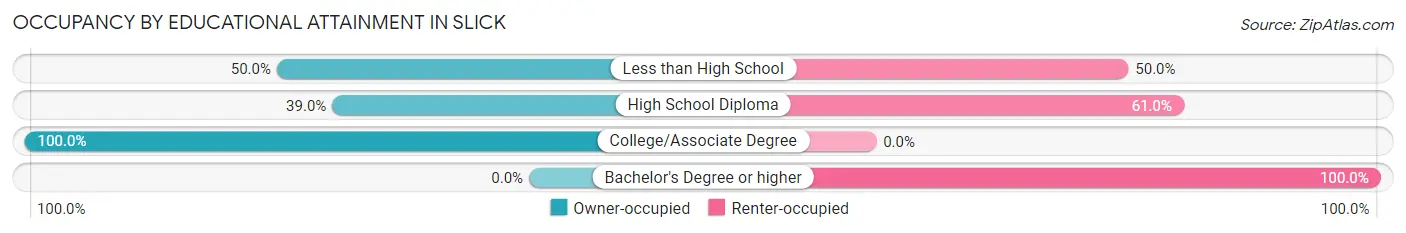
| Household Size | Owner-occupied | Renter-occupied |
| Less than High School | 2 (50.0%) | 2 (50.0%) |
| High School Diploma | 32 (39.0%) | 50 (61.0%) |
| College/Associate Degree | 11 (100.0%) | 0 (0.0%) |
| Bachelor's Degree or higher | 0 (0.0%) | 2 (100.0%) |
Occupancy by Age of Householder in Slick
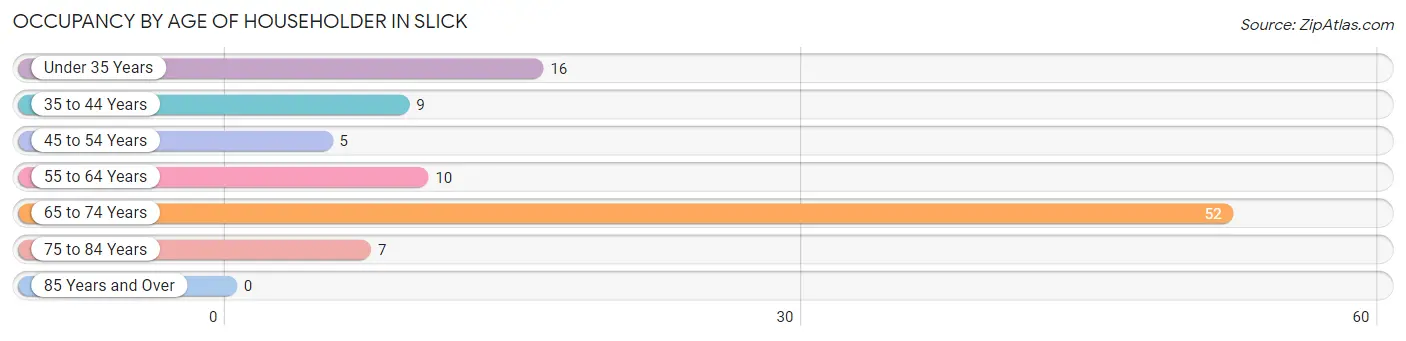
| Age Bracket | # Households | % Households |
| Under 35 Years | 16 | 16.2% |
| 35 to 44 Years | 9 | 9.1% |
| 45 to 54 Years | 5 | 5.1% |
| 55 to 64 Years | 10 | 10.1% |
| 65 to 74 Years | 52 | 52.5% |
| 75 to 84 Years | 7 | 7.1% |
| 85 Years and Over | 0 | 0.0% |
| Total | 99 | 100.0% |
Housing Finances in Slick
Median Income by Occupancy in Slick
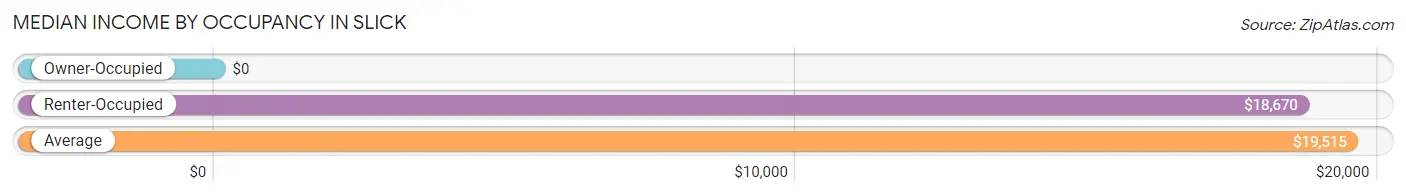
| Occupancy Type | # Households | Median Income |
| Owner-Occupied | 45 (45.5%) | $0 |
| Renter-Occupied | 54 (54.5%) | $18,670 |
| Average | 99 (100.0%) | $19,515 |
Occupancy by Householder Income Bracket in Slick
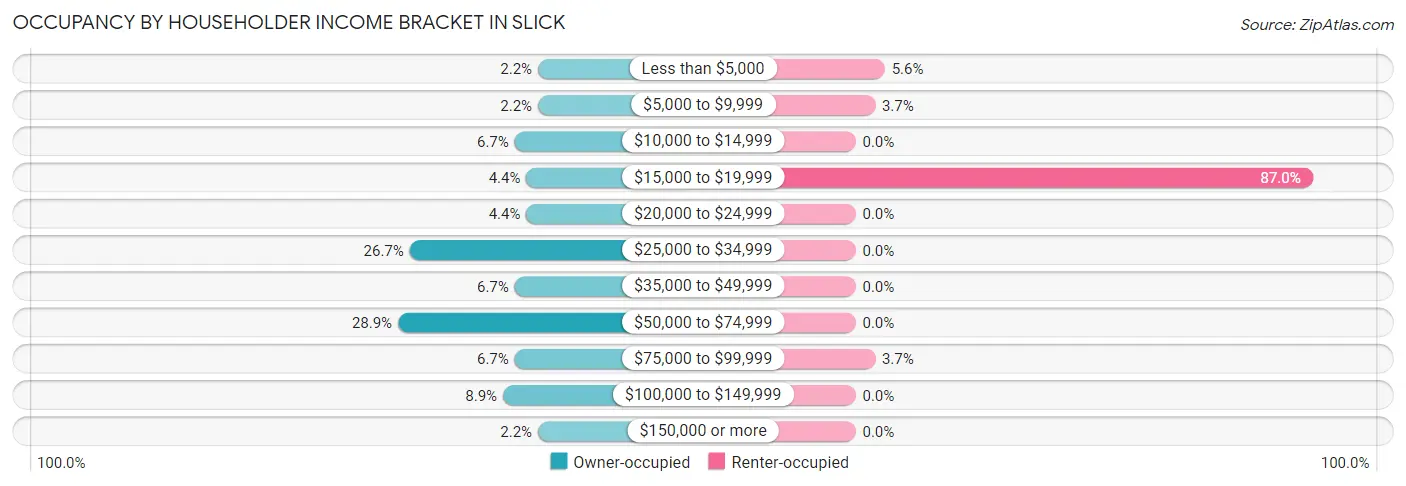
| Income Bracket | Owner-occupied | Renter-occupied |
| Less than $5,000 | 1 (2.2%) | 3 (5.6%) |
| $5,000 to $9,999 | 1 (2.2%) | 2 (3.7%) |
| $10,000 to $14,999 | 3 (6.7%) | 0 (0.0%) |
| $15,000 to $19,999 | 2 (4.4%) | 47 (87.0%) |
| $20,000 to $24,999 | 2 (4.4%) | 0 (0.0%) |
| $25,000 to $34,999 | 12 (26.7%) | 0 (0.0%) |
| $35,000 to $49,999 | 3 (6.7%) | 0 (0.0%) |
| $50,000 to $74,999 | 13 (28.9%) | 0 (0.0%) |
| $75,000 to $99,999 | 3 (6.7%) | 2 (3.7%) |
| $100,000 to $149,999 | 4 (8.9%) | 0 (0.0%) |
| $150,000 or more | 1 (2.2%) | 0 (0.0%) |
| Total | 45 (100.0%) | 54 (100.0%) |
Monthly Housing Cost Tiers in Slick
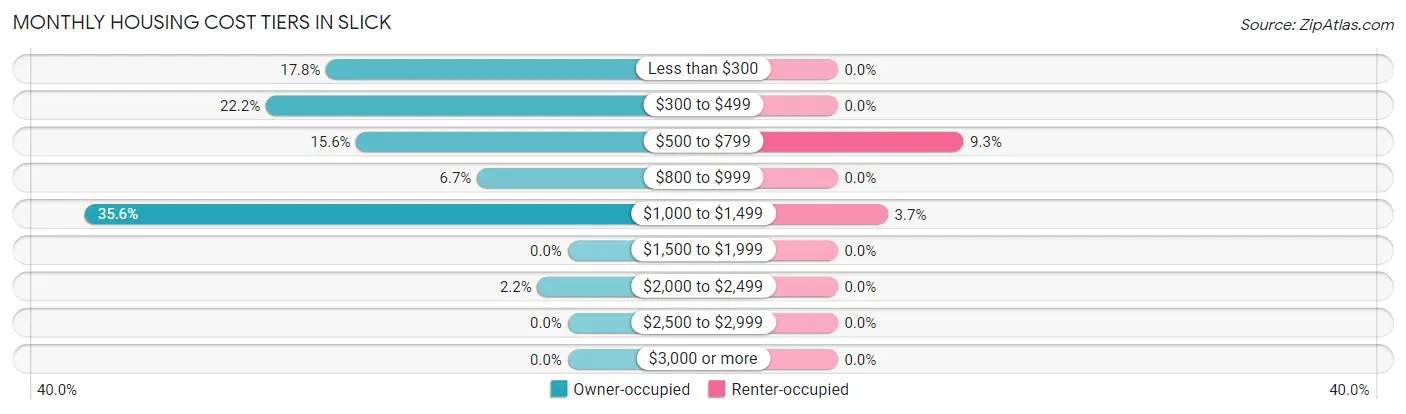
| Monthly Cost | Owner-occupied | Renter-occupied |
| Less than $300 | 8 (17.8%) | 0 (0.0%) |
| $300 to $499 | 10 (22.2%) | 0 (0.0%) |
| $500 to $799 | 7 (15.6%) | 5 (9.3%) |
| $800 to $999 | 3 (6.7%) | 0 (0.0%) |
| $1,000 to $1,499 | 16 (35.6%) | 2 (3.7%) |
| $1,500 to $1,999 | 0 (0.0%) | 0 (0.0%) |
| $2,000 to $2,499 | 1 (2.2%) | 0 (0.0%) |
| $2,500 to $2,999 | 0 (0.0%) | 0 (0.0%) |
| $3,000 or more | 0 (0.0%) | 0 (0.0%) |
| Total | 45 (100.0%) | 54 (100.0%) |
Physical Housing Characteristics in Slick
Housing Structures in Slick
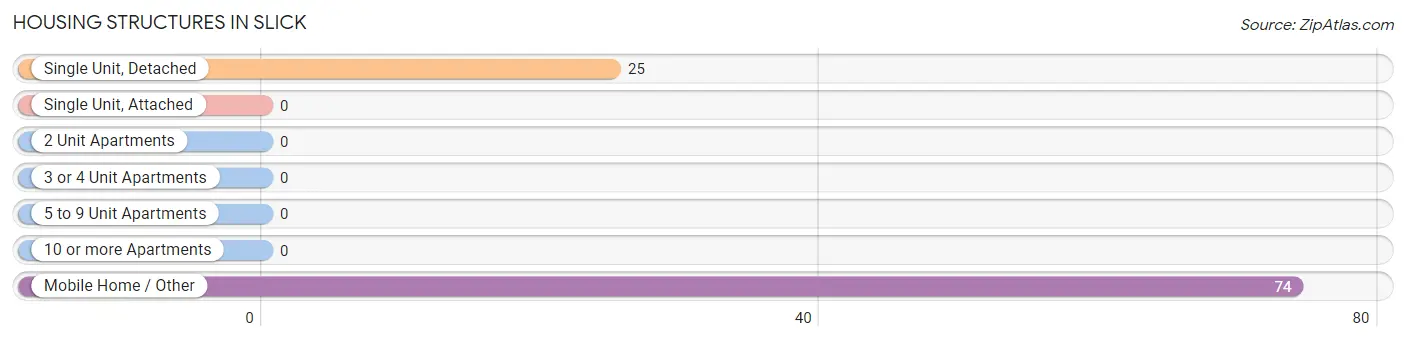
| Structure Type | # Housing Units | % Housing Units |
| Single Unit, Detached | 25 | 25.3% |
| Single Unit, Attached | 0 | 0.0% |
| 2 Unit Apartments | 0 | 0.0% |
| 3 or 4 Unit Apartments | 0 | 0.0% |
| 5 to 9 Unit Apartments | 0 | 0.0% |
| 10 or more Apartments | 0 | 0.0% |
| Mobile Home / Other | 74 | 74.8% |
| Total | 99 | 100.0% |
Housing Structures by Occupancy in Slick
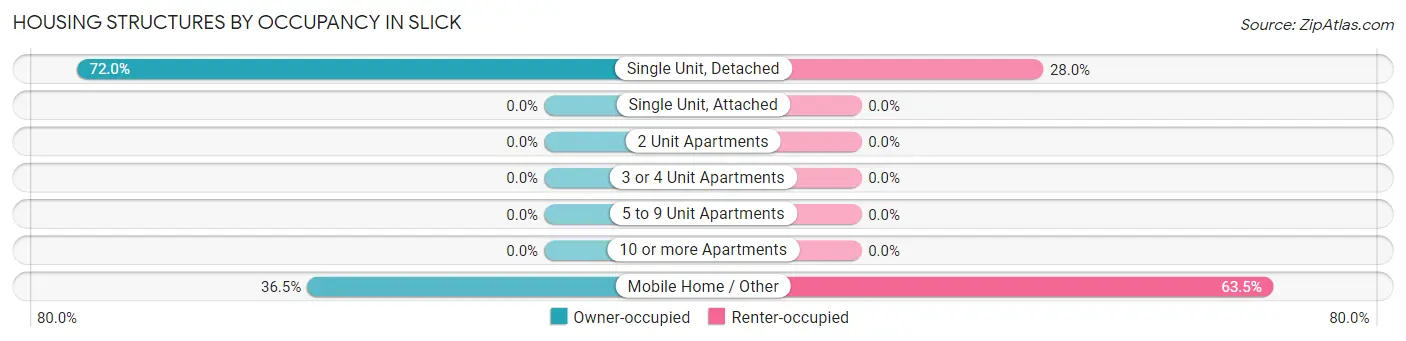
| Structure Type | Owner-occupied | Renter-occupied |
| Single Unit, Detached | 18 (72.0%) | 7 (28.0%) |
| Single Unit, Attached | 0 (0.0%) | 0 (0.0%) |
| 2 Unit Apartments | 0 (0.0%) | 0 (0.0%) |
| 3 or 4 Unit Apartments | 0 (0.0%) | 0 (0.0%) |
| 5 to 9 Unit Apartments | 0 (0.0%) | 0 (0.0%) |
| 10 or more Apartments | 0 (0.0%) | 0 (0.0%) |
| Mobile Home / Other | 27 (36.5%) | 47 (63.5%) |
| Total | 45 (45.5%) | 54 (54.5%) |
Housing Structures by Number of Rooms in Slick
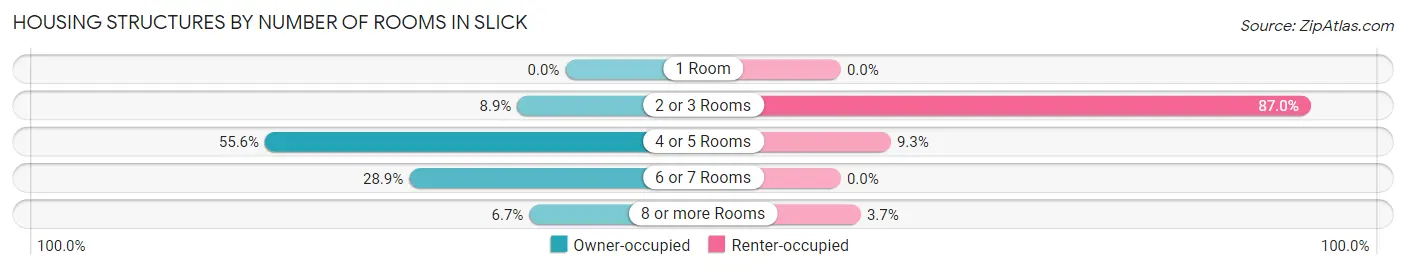
| Number of Rooms | Owner-occupied | Renter-occupied |
| 1 Room | 0 (0.0%) | 0 (0.0%) |
| 2 or 3 Rooms | 4 (8.9%) | 47 (87.0%) |
| 4 or 5 Rooms | 25 (55.6%) | 5 (9.3%) |
| 6 or 7 Rooms | 13 (28.9%) | 0 (0.0%) |
| 8 or more Rooms | 3 (6.7%) | 2 (3.7%) |
| Total | 45 (100.0%) | 54 (100.0%) |
Housing Structure by Heating Type in Slick
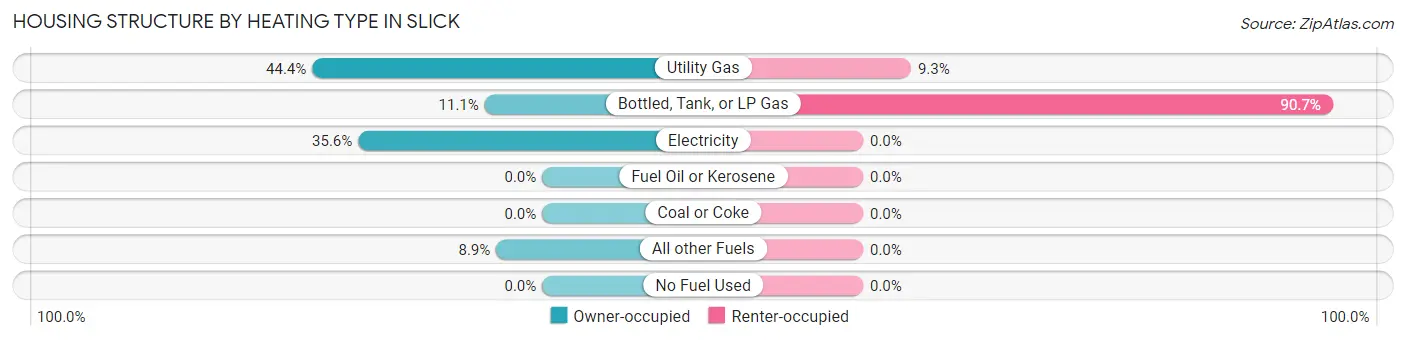
| Heating Type | Owner-occupied | Renter-occupied |
| Utility Gas | 20 (44.4%) | 5 (9.3%) |
| Bottled, Tank, or LP Gas | 5 (11.1%) | 49 (90.7%) |
| Electricity | 16 (35.6%) | 0 (0.0%) |
| Fuel Oil or Kerosene | 0 (0.0%) | 0 (0.0%) |
| Coal or Coke | 0 (0.0%) | 0 (0.0%) |
| All other Fuels | 4 (8.9%) | 0 (0.0%) |
| No Fuel Used | 0 (0.0%) | 0 (0.0%) |
| Total | 45 (100.0%) | 54 (100.0%) |
Household Vehicle Usage in Slick
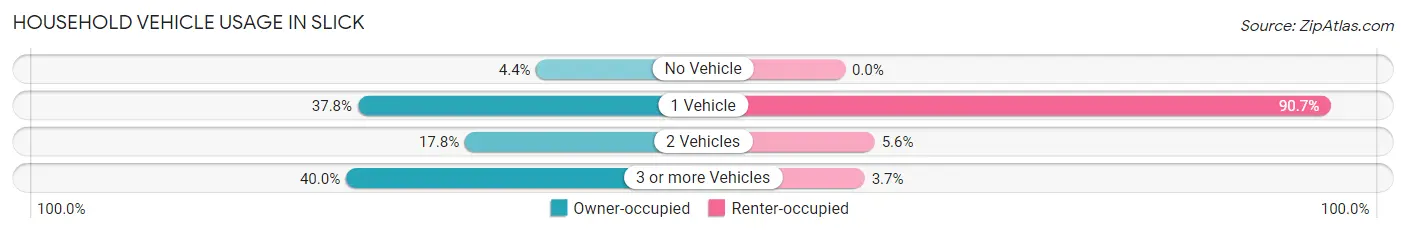
| Vehicles per Household | Owner-occupied | Renter-occupied |
| No Vehicle | 2 (4.4%) | 0 (0.0%) |
| 1 Vehicle | 17 (37.8%) | 49 (90.7%) |
| 2 Vehicles | 8 (17.8%) | 3 (5.6%) |
| 3 or more Vehicles | 18 (40.0%) | 2 (3.7%) |
| Total | 45 (100.0%) | 54 (100.0%) |
Real Estate & Mortgages in Slick
Real Estate and Mortgage Overview in Slick
| Characteristic | Without Mortgage | With Mortgage |
| Housing Units | 25 | 20 |
| Median Property Value | $95,000 | $110,700 |
| Median Household Income | $28,750 | $0 |
| Monthly Housing Costs | $363 | $0 |
| Real Estate Taxes | $450 | $0 |
Property Value by Mortgage Status in Slick
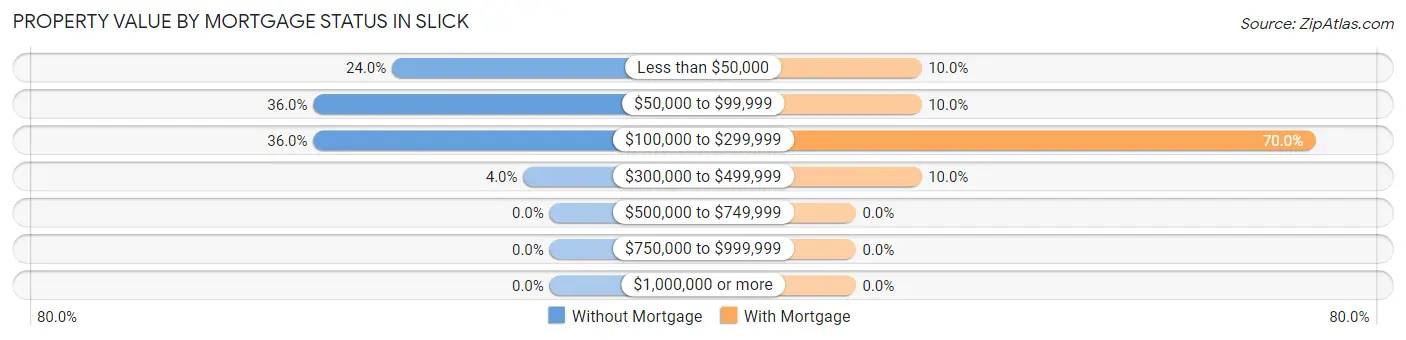
| Property Value | Without Mortgage | With Mortgage |
| Less than $50,000 | 6 (24.0%) | 2 (10.0%) |
| $50,000 to $99,999 | 9 (36.0%) | 2 (10.0%) |
| $100,000 to $299,999 | 9 (36.0%) | 14 (70.0%) |
| $300,000 to $499,999 | 1 (4.0%) | 2 (10.0%) |
| $500,000 to $749,999 | 0 (0.0%) | 0 (0.0%) |
| $750,000 to $999,999 | 0 (0.0%) | 0 (0.0%) |
| $1,000,000 or more | 0 (0.0%) | 0 (0.0%) |
| Total | 25 (100.0%) | 20 (100.0%) |
Household Income by Mortgage Status in Slick
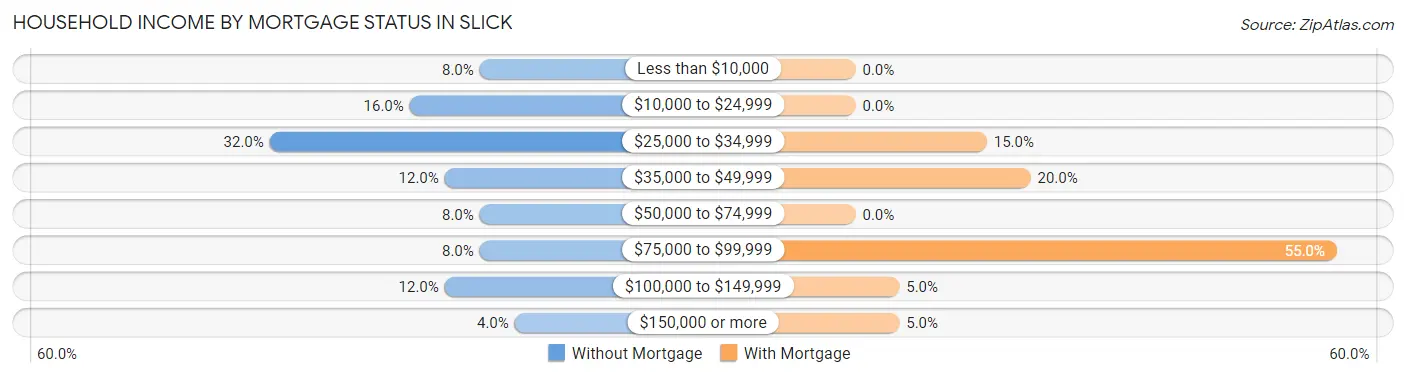
| Household Income | Without Mortgage | With Mortgage |
| Less than $10,000 | 2 (8.0%) | 0 (0.0%) |
| $10,000 to $24,999 | 4 (16.0%) | 0 (0.0%) |
| $25,000 to $34,999 | 8 (32.0%) | 3 (15.0%) |
| $35,000 to $49,999 | 3 (12.0%) | 4 (20.0%) |
| $50,000 to $74,999 | 2 (8.0%) | 0 (0.0%) |
| $75,000 to $99,999 | 2 (8.0%) | 11 (55.0%) |
| $100,000 to $149,999 | 3 (12.0%) | 1 (5.0%) |
| $150,000 or more | 1 (4.0%) | 1 (5.0%) |
| Total | 25 (100.0%) | 20 (100.0%) |
Property Value to Household Income Ratio in Slick
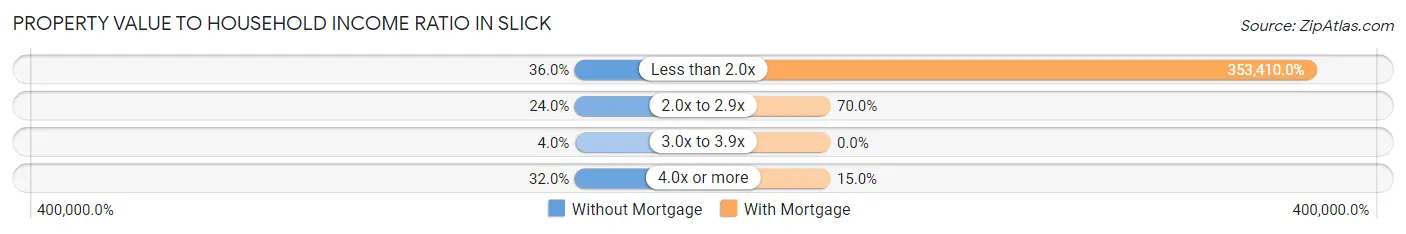
| Value-to-Income Ratio | Without Mortgage | With Mortgage |
| Less than 2.0x | 9 (36.0%) | 70,682 (353,410.0%) |
| 2.0x to 2.9x | 6 (24.0%) | 14 (70.0%) |
| 3.0x to 3.9x | 1 (4.0%) | 0 (0.0%) |
| 4.0x or more | 8 (32.0%) | 3 (15.0%) |
| Total | 25 (100.0%) | 20 (100.0%) |
Real Estate Taxes by Mortgage Status in Slick
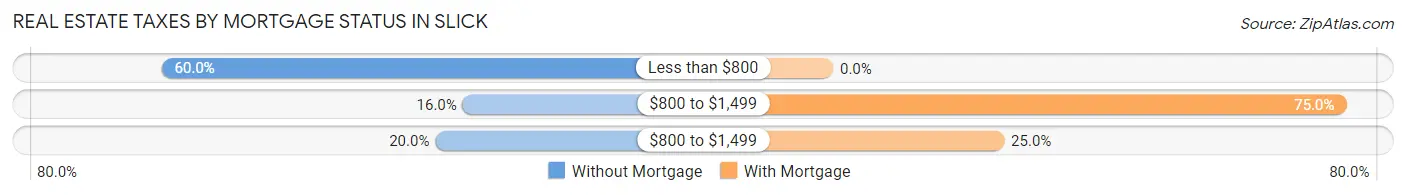
| Property Taxes | Without Mortgage | With Mortgage |
| Less than $800 | 15 (60.0%) | 0 (0.0%) |
| $800 to $1,499 | 4 (16.0%) | 15 (75.0%) |
| $800 to $1,499 | 5 (20.0%) | 5 (25.0%) |
| Total | 25 (100.0%) | 20 (100.0%) |
Health & Disability in Slick
Health Insurance Coverage by Age in Slick
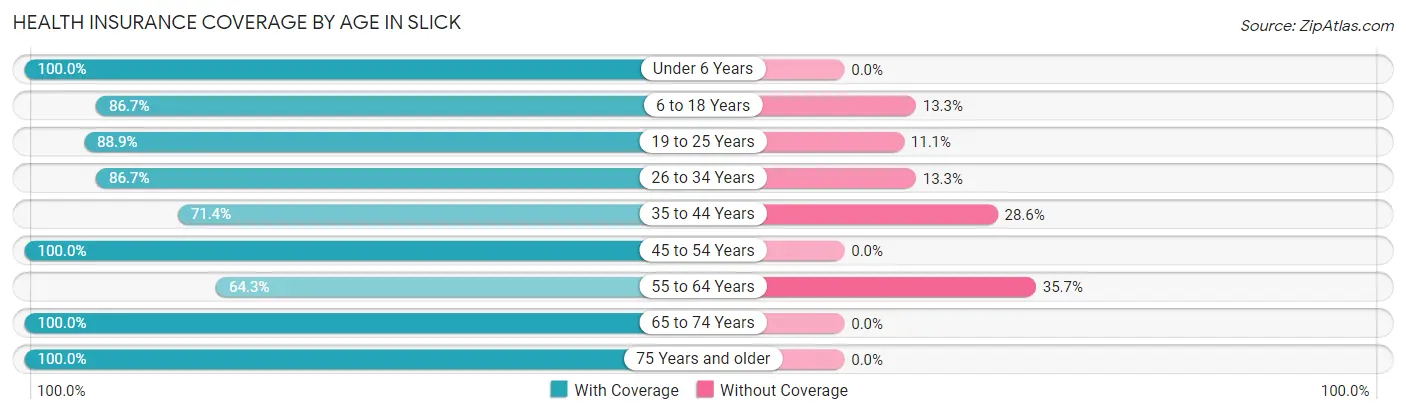
| Age Bracket | With Coverage | Without Coverage |
| Under 6 Years | 17 (100.0%) | 0 (0.0%) |
| 6 to 18 Years | 13 (86.7%) | 2 (13.3%) |
| 19 to 25 Years | 16 (88.9%) | 2 (11.1%) |
| 26 to 34 Years | 13 (86.7%) | 2 (13.3%) |
| 35 to 44 Years | 10 (71.4%) | 4 (28.6%) |
| 45 to 54 Years | 15 (100.0%) | 0 (0.0%) |
| 55 to 64 Years | 9 (64.3%) | 5 (35.7%) |
| 65 to 74 Years | 54 (100.0%) | 0 (0.0%) |
| 75 Years and older | 12 (100.0%) | 0 (0.0%) |
| Total | 159 (91.4%) | 15 (8.6%) |
Health Insurance Coverage by Citizenship Status in Slick
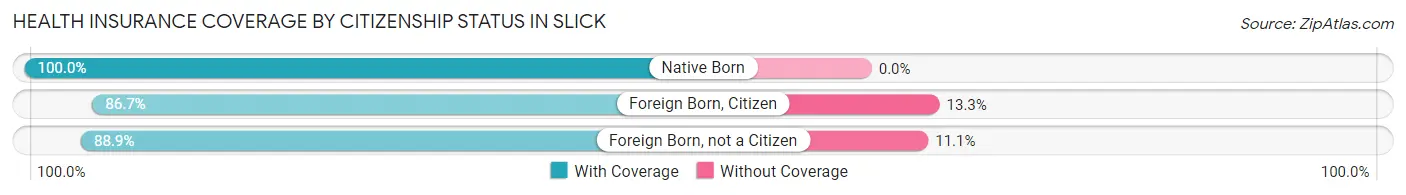
| Citizenship Status | With Coverage | Without Coverage |
| Native Born | 17 (100.0%) | 0 (0.0%) |
| Foreign Born, Citizen | 13 (86.7%) | 2 (13.3%) |
| Foreign Born, not a Citizen | 16 (88.9%) | 2 (11.1%) |
Health Insurance Coverage by Household Income in Slick
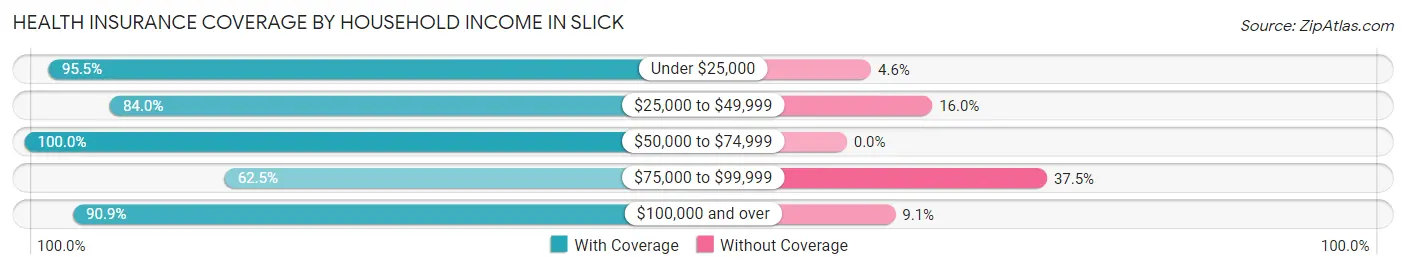
| Household Income | With Coverage | Without Coverage |
| Under $25,000 | 63 (95.5%) | 3 (4.5%) |
| $25,000 to $49,999 | 21 (84.0%) | 4 (16.0%) |
| $50,000 to $74,999 | 45 (100.0%) | 0 (0.0%) |
| $75,000 to $99,999 | 10 (62.5%) | 6 (37.5%) |
| $100,000 and over | 20 (90.9%) | 2 (9.1%) |
Public vs Private Health Insurance Coverage by Age in Slick
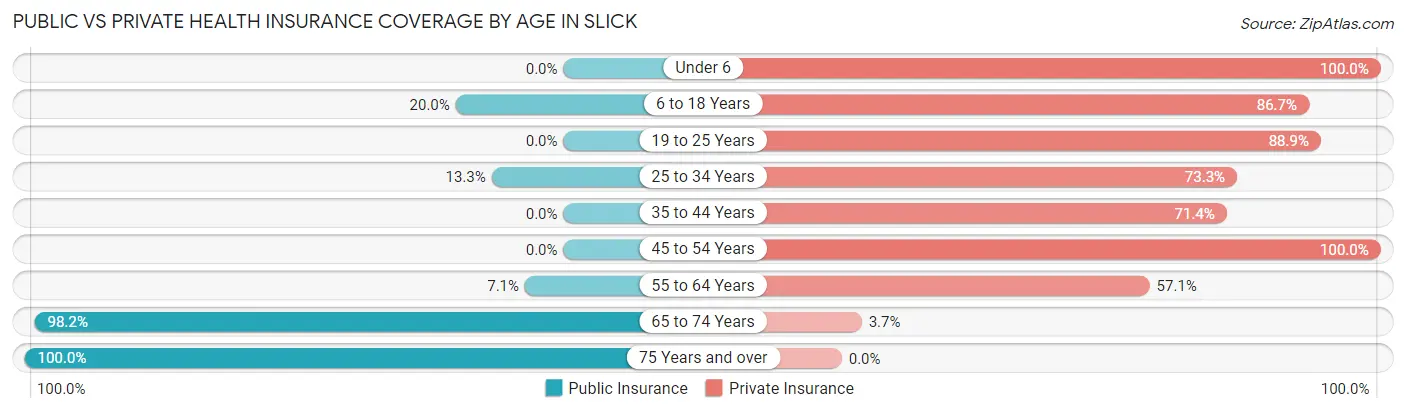
| Age Bracket | Public Insurance | Private Insurance |
| Under 6 | 0 (0.0%) | 17 (100.0%) |
| 6 to 18 Years | 3 (20.0%) | 13 (86.7%) |
| 19 to 25 Years | 0 (0.0%) | 16 (88.9%) |
| 25 to 34 Years | 2 (13.3%) | 11 (73.3%) |
| 35 to 44 Years | 0 (0.0%) | 10 (71.4%) |
| 45 to 54 Years | 0 (0.0%) | 15 (100.0%) |
| 55 to 64 Years | 1 (7.1%) | 8 (57.1%) |
| 65 to 74 Years | 53 (98.2%) | 2 (3.7%) |
| 75 Years and over | 12 (100.0%) | 0 (0.0%) |
| Total | 71 (40.8%) | 92 (52.9%) |
Disability Status by Sex by Age in Slick
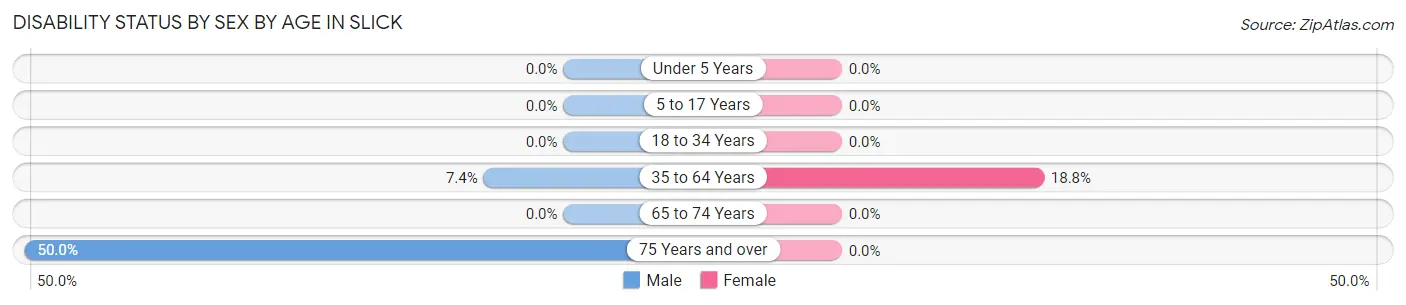
| Age Bracket | Male | Female |
| Under 5 Years | 0 (0.0%) | 0 (0.0%) |
| 5 to 17 Years | 0 (0.0%) | 0 (0.0%) |
| 18 to 34 Years | 0 (0.0%) | 0 (0.0%) |
| 35 to 64 Years | 2 (7.4%) | 3 (18.8%) |
| 65 to 74 Years | 0 (0.0%) | 0 (0.0%) |
| 75 Years and over | 4 (50.0%) | 0 (0.0%) |
Disability Class by Sex by Age in Slick
Disability Class: Hearing Difficulty
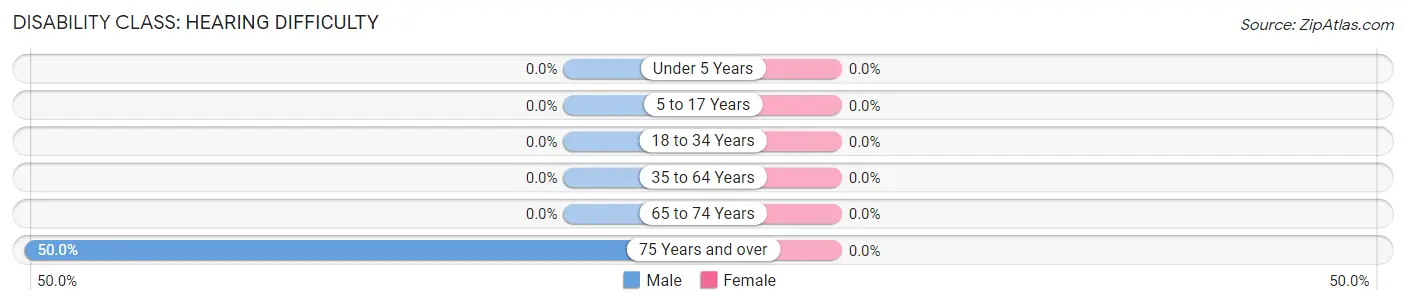
| Age Bracket | Male | Female |
| Under 5 Years | 0 (0.0%) | 0 (0.0%) |
| 5 to 17 Years | 0 (0.0%) | 0 (0.0%) |
| 18 to 34 Years | 0 (0.0%) | 0 (0.0%) |
| 35 to 64 Years | 0 (0.0%) | 0 (0.0%) |
| 65 to 74 Years | 0 (0.0%) | 0 (0.0%) |
| 75 Years and over | 4 (50.0%) | 0 (0.0%) |
Disability Class: Vision Difficulty
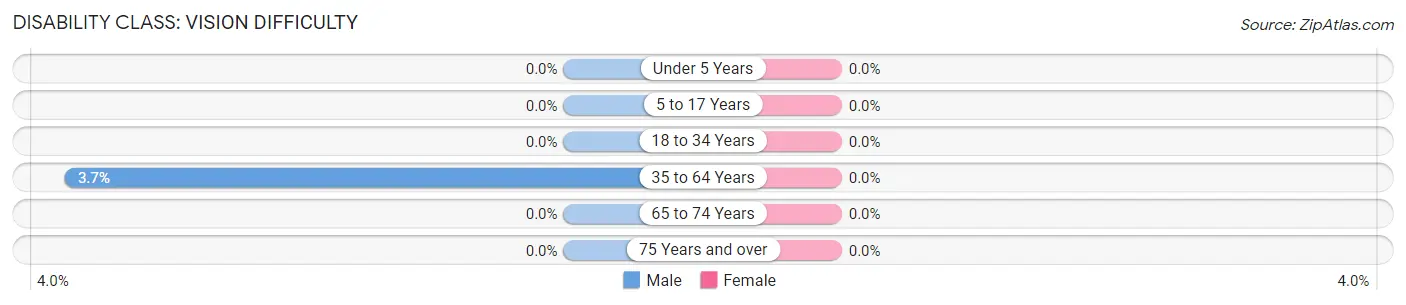
| Age Bracket | Male | Female |
| Under 5 Years | 0 (0.0%) | 0 (0.0%) |
| 5 to 17 Years | 0 (0.0%) | 0 (0.0%) |
| 18 to 34 Years | 0 (0.0%) | 0 (0.0%) |
| 35 to 64 Years | 1 (3.7%) | 0 (0.0%) |
| 65 to 74 Years | 0 (0.0%) | 0 (0.0%) |
| 75 Years and over | 0 (0.0%) | 0 (0.0%) |
Disability Class: Cognitive Difficulty
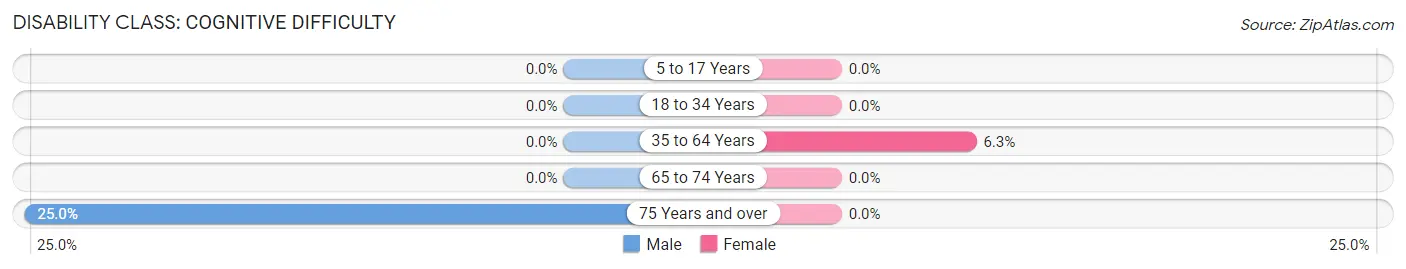
| Age Bracket | Male | Female |
| 5 to 17 Years | 0 (0.0%) | 0 (0.0%) |
| 18 to 34 Years | 0 (0.0%) | 0 (0.0%) |
| 35 to 64 Years | 0 (0.0%) | 1 (6.2%) |
| 65 to 74 Years | 0 (0.0%) | 0 (0.0%) |
| 75 Years and over | 2 (25.0%) | 0 (0.0%) |
Disability Class: Ambulatory Difficulty
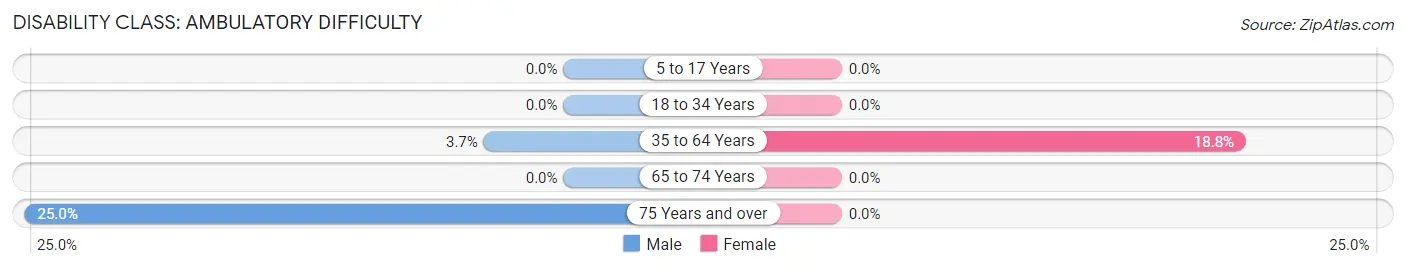
| Age Bracket | Male | Female |
| 5 to 17 Years | 0 (0.0%) | 0 (0.0%) |
| 18 to 34 Years | 0 (0.0%) | 0 (0.0%) |
| 35 to 64 Years | 1 (3.7%) | 3 (18.8%) |
| 65 to 74 Years | 0 (0.0%) | 0 (0.0%) |
| 75 Years and over | 2 (25.0%) | 0 (0.0%) |
Disability Class: Self-Care Difficulty
| Age Bracket | Male | Female |
| 5 to 17 Years | 0 (0.0%) | 0 (0.0%) |
| 18 to 34 Years | 0 (0.0%) | 0 (0.0%) |
| 35 to 64 Years | 0 (0.0%) | 0 (0.0%) |
| 65 to 74 Years | 0 (0.0%) | 0 (0.0%) |
| 75 Years and over | 0 (0.0%) | 0 (0.0%) |
Technology Access in Slick
Computing Device Access in Slick
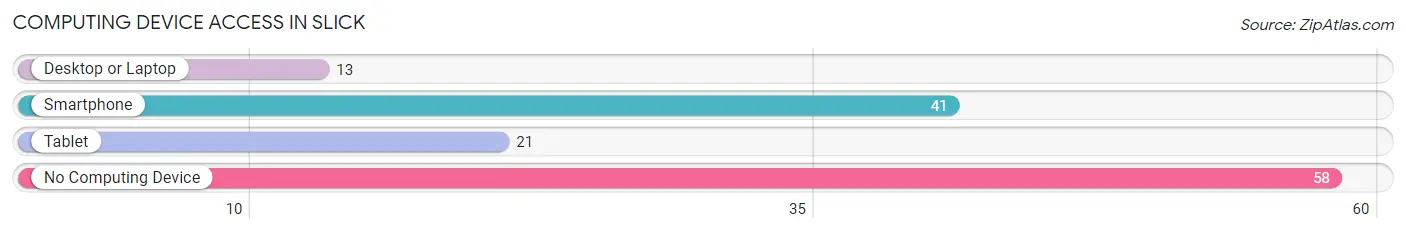
| Device Type | # Households | % Households |
| Desktop or Laptop | 13 | 13.1% |
| Smartphone | 41 | 41.4% |
| Tablet | 21 | 21.2% |
| No Computing Device | 58 | 58.6% |
| Total | 99 | 100.0% |
Internet Access in Slick
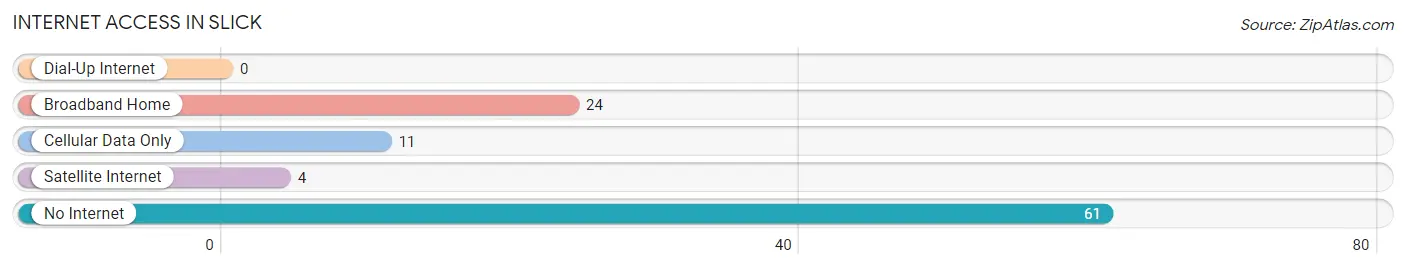
| Internet Type | # Households | % Households |
| Dial-Up Internet | 0 | 0.0% |
| Broadband Home | 24 | 24.2% |
| Cellular Data Only | 11 | 11.1% |
| Satellite Internet | 4 | 4.0% |
| No Internet | 61 | 61.6% |
| Total | 99 | 100.0% |
Slick Summary
History
Slick is a small town located in Creek County, Oklahoma. It was founded in 1891 by a group of settlers from Arkansas. The town was named after the nearby Slick Creek, which was named after a local Native American chief. The town was originally a farming community, but it soon became a center for oil production. In the early 1900s, Slick was a booming oil town, with many oil wells and refineries.
The town was also home to a number of businesses, including a bank, a hotel, a general store, and a post office. In the 1920s, Slick was a popular tourist destination, with many people coming to visit the nearby oil fields.
In the 1930s, the Great Depression hit Slick hard, and many of the businesses closed. However, the town was able to survive, and in the 1940s, it began to experience a resurgence. The oil industry was booming again, and the town was able to attract new businesses.
In the 1950s, Slick experienced a population boom, as many people moved to the area to take advantage of the oil industry. The town was also home to a number of schools, churches, and other organizations.
In the 1960s, Slick experienced a decline in population, as many people moved away to find work in other parts of the state. However, the town was able to remain stable, and in the 1970s, it began to experience a resurgence. The oil industry was booming again, and the town was able to attract new businesses.
In the 1980s, Slick experienced a population boom, as many people moved to the area to take advantage of the oil industry. The town was also home to a number of schools, churches, and other organizations.
In the 1990s, Slick experienced a decline in population, as many people moved away to find work in other parts of the state. However, the town was able to remain stable, and in the 2000s, it began to experience a resurgence. The oil industry was booming again, and the town was able to attract new businesses.
Geography
Slick is located in Creek County, Oklahoma, about 25 miles south of Tulsa. The town is situated on the banks of Slick Creek, which is a tributary of the Arkansas River. The town is surrounded by rolling hills and wooded areas, and it is located in a region known as the Ozark Plateau.
The climate in Slick is generally mild, with hot summers and cold winters. The average annual temperature is around 60 degrees Fahrenheit. The town receives an average of 40 inches of precipitation each year.
Economy
The economy of Slick is largely based on the oil industry. The town is home to several oil refineries, and it is also a center for oil production. In addition, the town is home to a number of businesses, including a bank, a hotel, a general store, and a post office.
The town is also home to a number of schools, churches, and other organizations. The town is served by the Slick Public School District, which includes two elementary schools, one middle school, and one high school.
Demographics
As of the 2010 census, the population of Slick was 1,845. The racial makeup of the town was 94.3% White, 0.7% African American, 0.3% Native American, 0.2% Asian, 0.1% Pacific Islander, and 4.4% from other races. The median household income was $35,938, and the median family income was $41,250.
The town is served by the Slick Public School District, which includes two elementary schools, one middle school, and one high school. The town is also home to a number of churches, including the First Baptist Church, the First United Methodist Church, and the Slick Church of Christ.
Common Questions
What is Per Capita Income in Slick?
Per Capita income in Slick is $18,641.
What is the Median Household income in Slick?
Median Household Income in Slick is $19,515.
What is Income or Wage Gap in Slick?
Income or Wage Gap in Slick is 58.0%.
Women in Slick earn 42.0 cents for every dollar earned by a man.
What is Inequality or Gini Index in Slick?
Inequality or Gini Index in Slick is 0.44.
What is the Total Population of Slick?
Total Population of Slick is 174.
What is the Total Male Population of Slick?
Total Male Population of Slick is 73.
What is the Total Female Population of Slick?
Total Female Population of Slick is 101.
What is the Ratio of Males per 100 Females in Slick?
There are 72.28 Males per 100 Females in Slick.
What is the Ratio of Females per 100 Males in Slick?
There are 138.36 Females per 100 Males in Slick.
What is the Median Population Age in Slick?
Median Population Age in Slick is 49.8 Years.
What is the Average Family Size in Slick
Average Family Size in Slick is 1.8 People.
What is the Average Household Size in Slick
Average Household Size in Slick is 1.8 People.
How Large is the Labor Force in Slick?
There are 57 People in the Labor Forcein in Slick.
What is the Percentage of People in the Labor Force in Slick?
39.6% of People are in the Labor Force in Slick.