Slaughterville, OK Map & Demographics
Slaughterville Map
Slaughterville Overview
$31,615
PER CAPITA INCOME
$83,218
AVG FAMILY INCOME
$76,763
AVG HOUSEHOLD INCOME
31.5%
WAGE / INCOME GAP [ % ]
68.5¢/ $1
WAGE / INCOME GAP [ $ ]
$12,606
FAMILY INCOME DEFICIT
0.40
INEQUALITY / GINI INDEX
4,187
TOTAL POPULATION
2,187
MALE POPULATION
2,000
FEMALE POPULATION
109.35
MALES / 100 FEMALES
91.45
FEMALES / 100 MALES
39.2
MEDIAN AGE
2.9
AVG FAMILY SIZE
2.8
AVG HOUSEHOLD SIZE
1,810
LABOR FORCE [ PEOPLE ]
55.6%
PERCENT IN LABOR FORCE
5.0%
UNEMPLOYMENT RATE
Slaughterville Area Codes
Income in Slaughterville
Income Overview in Slaughterville
Per Capita Income in Slaughterville is $31,615, while median incomes of families and households are $83,218 and $76,763 respectively.
| Characteristic | Number | Measure |
| Per Capita Income | 4,187 | $31,615 |
| Median Family Income | 1,289 | $83,218 |
| Mean Family Income | 1,289 | $101,094 |
| Median Household Income | 1,497 | $76,763 |
| Mean Household Income | 1,497 | $95,151 |
| Income Deficit | 1,289 | $12,606 |
| Wage / Income Gap (%) | 4,187 | 31.54% |
| Wage / Income Gap ($) | 4,187 | 68.46¢ per $1 |
| Gini / Inequality Index | 4,187 | 0.40 |
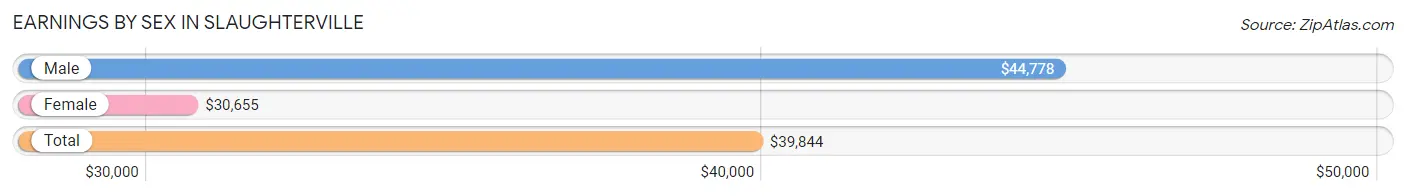
Earnings by Sex in Slaughterville
Average Earnings in Slaughterville are $39,844, $44,778 for men and $30,655 for women, a difference of 31.5%.
| Sex | Number | Average Earnings |
| Male | 958 (52.6%) | $44,778 |
| Female | 863 (47.4%) | $30,655 |
| Total | 1,821 (100.0%) | $39,844 |
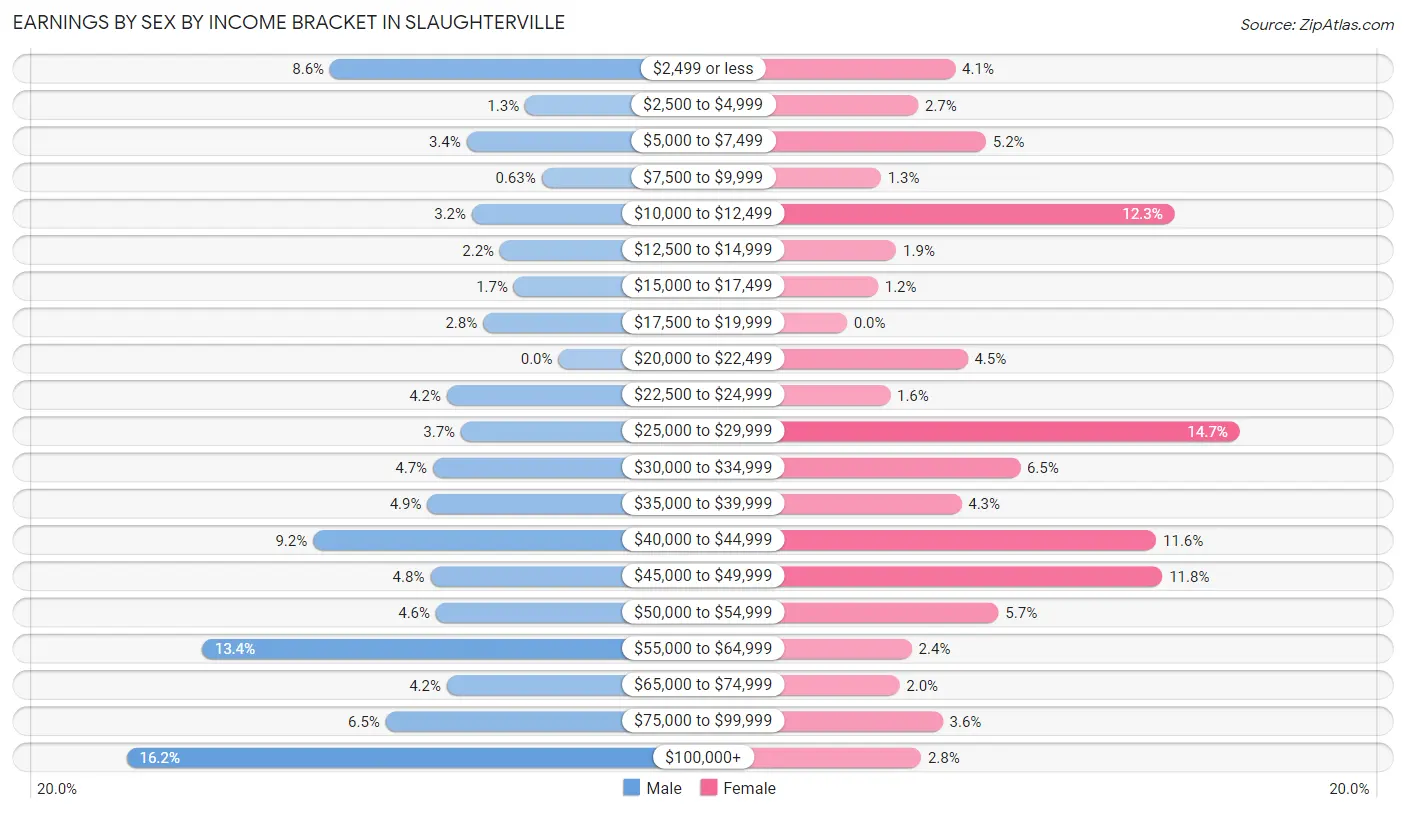
Earnings by Sex by Income Bracket in Slaughterville
The most common earnings brackets in Slaughterville are $100,000+ for men (155 | 16.2%) and $25,000 to $29,999 for women (127 | 14.7%).
| Income | Male | Female |
| $2,499 or less | 82 (8.6%) | 35 (4.1%) |
| $2,500 to $4,999 | 12 (1.3%) | 23 (2.7%) |
| $5,000 to $7,499 | 33 (3.4%) | 45 (5.2%) |
| $7,500 to $9,999 | 6 (0.6%) | 11 (1.3%) |
| $10,000 to $12,499 | 31 (3.2%) | 106 (12.3%) |
| $12,500 to $14,999 | 21 (2.2%) | 16 (1.8%) |
| $15,000 to $17,499 | 16 (1.7%) | 10 (1.2%) |
| $17,500 to $19,999 | 27 (2.8%) | 0 (0.0%) |
| $20,000 to $22,499 | 0 (0.0%) | 39 (4.5%) |
| $22,500 to $24,999 | 40 (4.2%) | 14 (1.6%) |
| $25,000 to $29,999 | 35 (3.6%) | 127 (14.7%) |
| $30,000 to $34,999 | 45 (4.7%) | 56 (6.5%) |
| $35,000 to $39,999 | 47 (4.9%) | 37 (4.3%) |
| $40,000 to $44,999 | 88 (9.2%) | 100 (11.6%) |
| $45,000 to $49,999 | 46 (4.8%) | 102 (11.8%) |
| $50,000 to $54,999 | 44 (4.6%) | 49 (5.7%) |
| $55,000 to $64,999 | 128 (13.4%) | 21 (2.4%) |
| $65,000 to $74,999 | 40 (4.2%) | 17 (2.0%) |
| $75,000 to $99,999 | 62 (6.5%) | 31 (3.6%) |
| $100,000+ | 155 (16.2%) | 24 (2.8%) |
| Total | 958 (100.0%) | 863 (100.0%) |
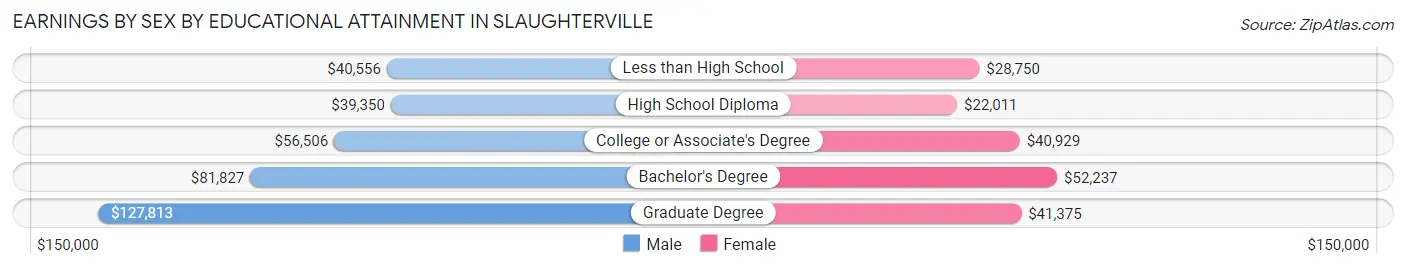
Earnings by Sex by Educational Attainment in Slaughterville
Average earnings in Slaughterville are $45,878 for men and $33,964 for women, a difference of 26.0%. Men with an educational attainment of graduate degree enjoy the highest average annual earnings of $127,813, while those with high school diploma education earn the least with $39,350. Women with an educational attainment of bachelor's degree earn the most with the average annual earnings of $52,237, while those with high school diploma education have the smallest earnings of $22,011.
| Educational Attainment | Male Income | Female Income |
| Less than High School | $40,556 | $28,750 |
| High School Diploma | $39,350 | $22,011 |
| College or Associate's Degree | $56,506 | $40,929 |
| Bachelor's Degree | $81,827 | $52,237 |
| Graduate Degree | $127,813 | $41,375 |
| Total | $45,878 | $33,964 |
Family Income in Slaughterville
Family Income Brackets in Slaughterville
According to the Slaughterville family income data, there are 309 families falling into the $100,000 to $149,999 income range, which is the most common income bracket and makes up 24.0% of all families. Conversely, the less than $10,000 income bracket is the least frequent group with only 36 families (2.8%) belonging to this category.
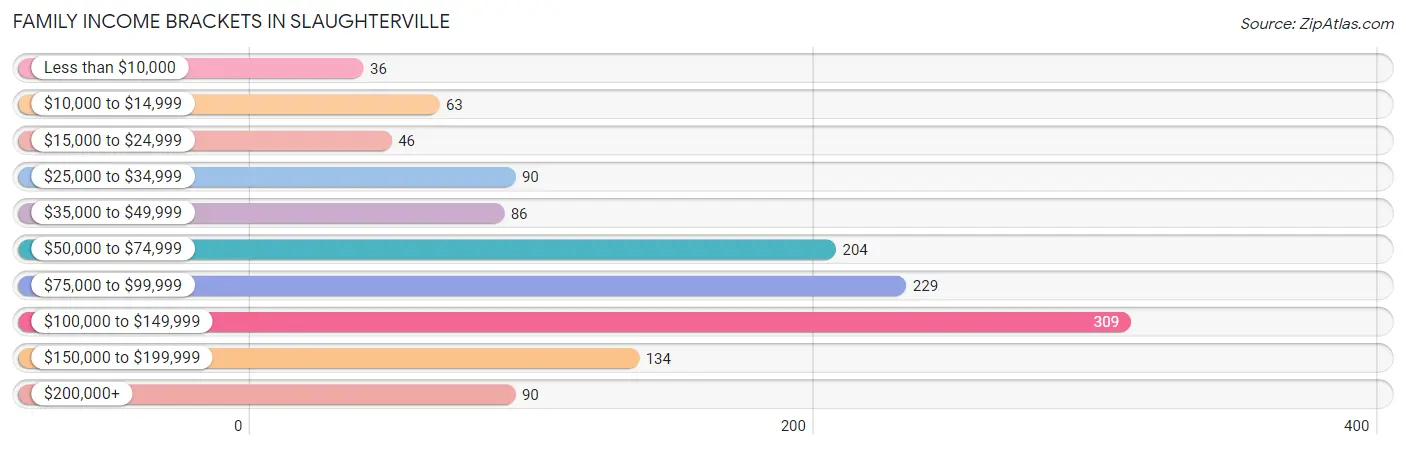
| Income Bracket | # Families | % Families |
| Less than $10,000 | 36 | 2.8% |
| $10,000 to $14,999 | 63 | 4.9% |
| $15,000 to $24,999 | 46 | 3.6% |
| $25,000 to $34,999 | 90 | 7.0% |
| $35,000 to $49,999 | 86 | 6.7% |
| $50,000 to $74,999 | 204 | 15.8% |
| $75,000 to $99,999 | 229 | 17.8% |
| $100,000 to $149,999 | 309 | 24.0% |
| $150,000 to $199,999 | 134 | 10.4% |
| $200,000+ | 90 | 7.0% |
Family Income by Famaliy Size in Slaughterville
5-person families (98 | 7.6%) account for the highest median family income in Slaughterville with $102,222 per family, while 2-person families (568 | 44.1%) have the highest median income of $41,625 per family member.
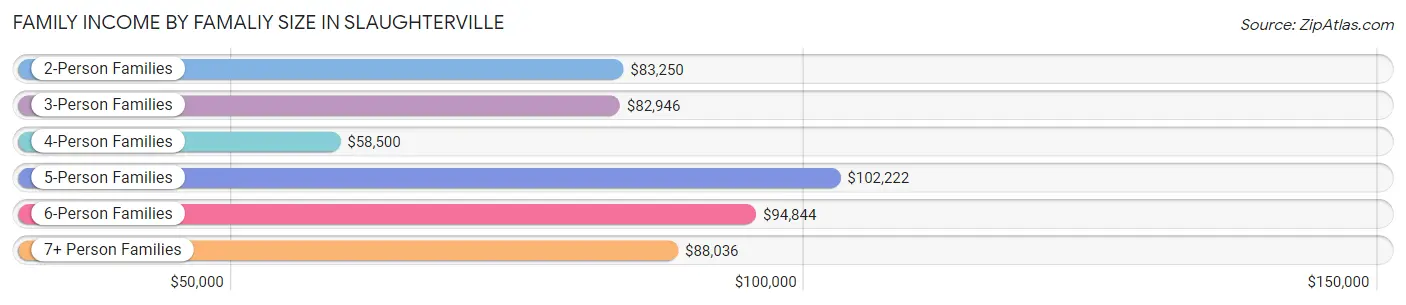
| Income Bracket | # Families | Median Income |
| 2-Person Families | 568 (44.1%) | $83,250 |
| 3-Person Families | 367 (28.5%) | $82,946 |
| 4-Person Families | 174 (13.5%) | $58,500 |
| 5-Person Families | 98 (7.6%) | $102,222 |
| 6-Person Families | 43 (3.3%) | $94,844 |
| 7+ Person Families | 39 (3.0%) | $88,036 |
| Total | 1,289 (100.0%) | $83,218 |
Family Income by Number of Earners in Slaughterville
The median family income in Slaughterville is $83,218, with families comprising 3+ earners (96) having the highest median family income of $123,750, while families with no earners (159) have the lowest median family income of $32,303, accounting for 7.4% and 12.3% of families, respectively.
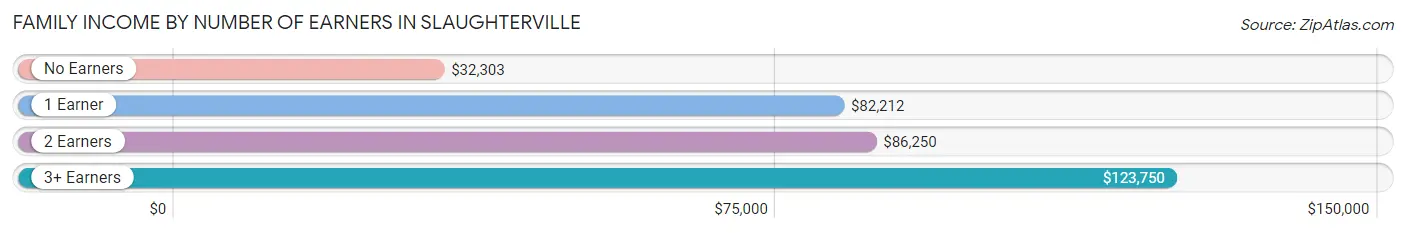
| Number of Earners | # Families | Median Income |
| No Earners | 159 (12.3%) | $32,303 |
| 1 Earner | 663 (51.4%) | $82,212 |
| 2 Earners | 371 (28.8%) | $86,250 |
| 3+ Earners | 96 (7.4%) | $123,750 |
| Total | 1,289 (100.0%) | $83,218 |
Household Income in Slaughterville
Household Income Brackets in Slaughterville
With 352 households falling in the category, the $100,000 to $149,999 income range is the most frequent in Slaughterville, accounting for 23.5% of all households. In contrast, only 36 households (2.4%) fall into the $10,000 to $14,999 income bracket, making it the least populous group.
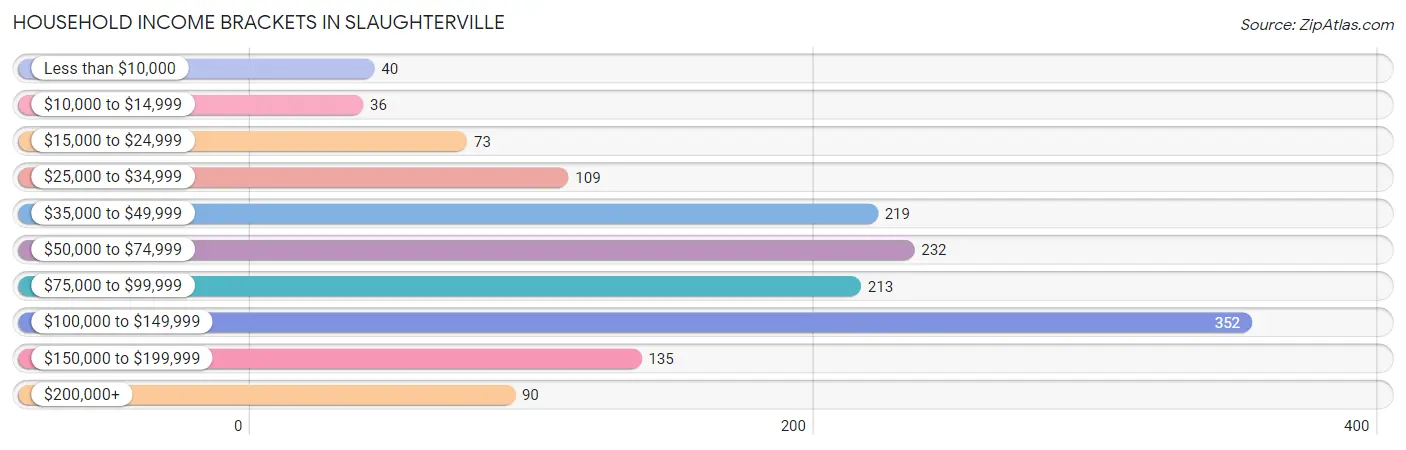
| Income Bracket | # Households | % Households |
| Less than $10,000 | 40 | 2.7% |
| $10,000 to $14,999 | 36 | 2.4% |
| $15,000 to $24,999 | 73 | 4.9% |
| $25,000 to $34,999 | 109 | 7.3% |
| $35,000 to $49,999 | 219 | 14.6% |
| $50,000 to $74,999 | 232 | 15.5% |
| $75,000 to $99,999 | 213 | 14.2% |
| $100,000 to $149,999 | 352 | 23.5% |
| $150,000 to $199,999 | 135 | 9.0% |
| $200,000+ | 90 | 6.0% |
Household Income by Householder Age in Slaughterville
The median household income in Slaughterville is $76,763, with the highest median household income of $127,734 found in the 65+ years age bracket for the primary householder. A total of 527 households (35.2%) fall into this category.
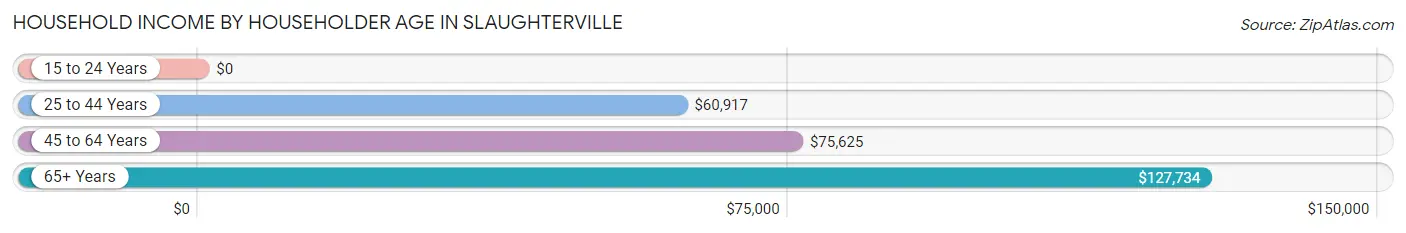
| Income Bracket | # Households | Median Income |
| 15 to 24 Years | 0 (0.0%) | $0 |
| 25 to 44 Years | 491 (32.8%) | $60,917 |
| 45 to 64 Years | 479 (32.0%) | $75,625 |
| 65+ Years | 527 (35.2%) | $127,734 |
| Total | 1,497 (100.0%) | $76,763 |
Poverty in Slaughterville
Income Below Poverty by Sex and Age in Slaughterville
With 14.2% poverty level for males and 14.4% for females among the residents of Slaughterville, 16 and 17 year old males and 25 to 34 year old females are the most vulnerable to poverty, with 105 males (70.0%) and 88 females (34.5%) in their respective age groups living below the poverty level.
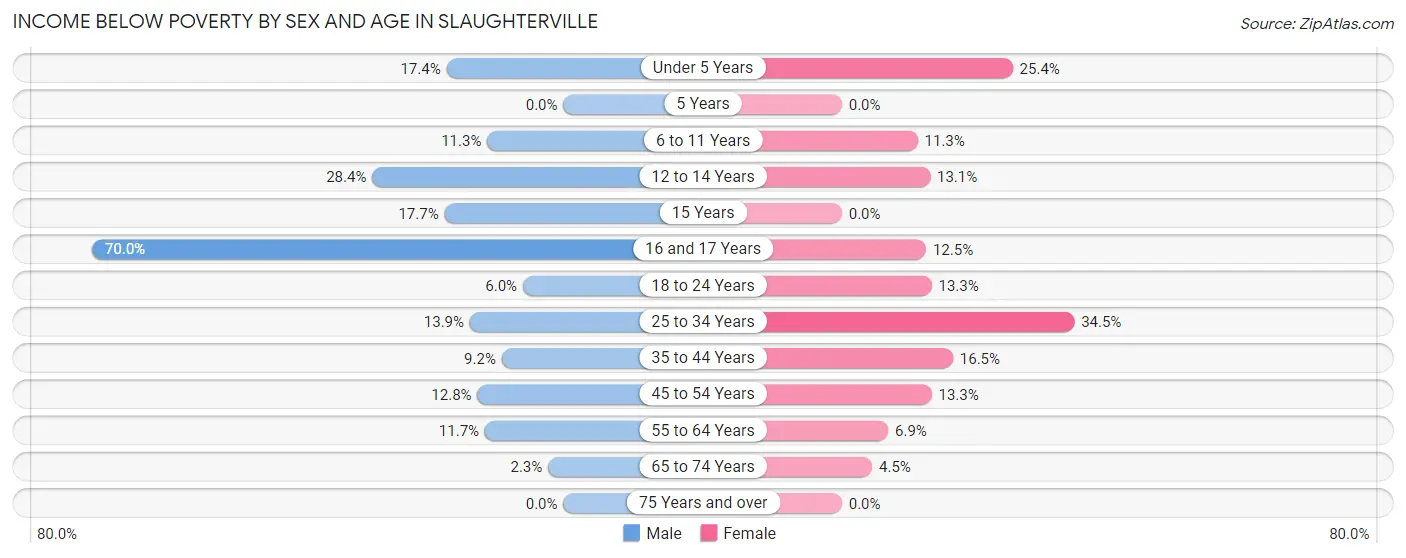
| Age Bracket | Male | Female |
| Under 5 Years | 17 (17.3%) | 34 (25.4%) |
| 5 Years | 0 (0.0%) | 0 (0.0%) |
| 6 to 11 Years | 20 (11.3%) | 25 (11.3%) |
| 12 to 14 Years | 21 (28.4%) | 11 (13.1%) |
| 15 Years | 9 (17.6%) | 0 (0.0%) |
| 16 and 17 Years | 105 (70.0%) | 6 (12.5%) |
| 18 to 24 Years | 6 (6.0%) | 12 (13.3%) |
| 25 to 34 Years | 34 (13.9%) | 88 (34.5%) |
| 35 to 44 Years | 28 (9.1%) | 47 (16.5%) |
| 45 to 54 Years | 31 (12.8%) | 40 (13.3%) |
| 55 to 64 Years | 31 (11.7%) | 15 (6.9%) |
| 65 to 74 Years | 8 (2.3%) | 10 (4.5%) |
| 75 Years and over | 0 (0.0%) | 0 (0.0%) |
| Total | 310 (14.2%) | 288 (14.4%) |
Income Above Poverty by Sex and Age in Slaughterville
According to the poverty statistics in Slaughterville, males aged 5 years and females aged 5 years are the age groups that are most secure financially, with 100.0% of males and 100.0% of females in these age groups living above the poverty line.
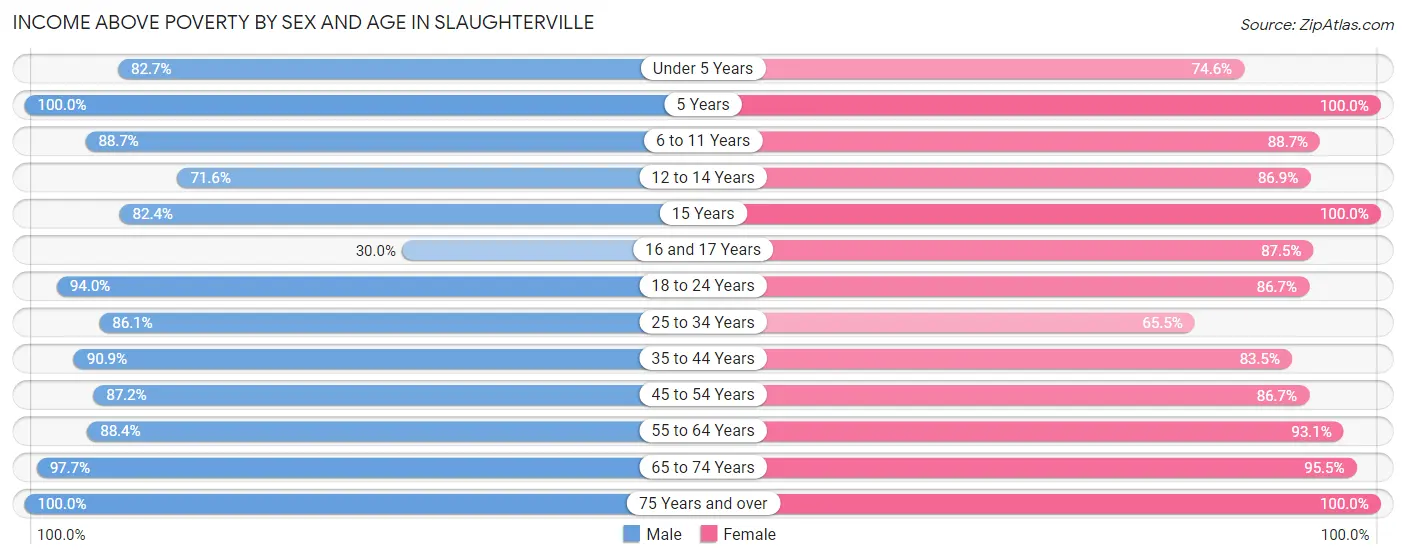
| Age Bracket | Male | Female |
| Under 5 Years | 81 (82.7%) | 100 (74.6%) |
| 5 Years | 22 (100.0%) | 15 (100.0%) |
| 6 to 11 Years | 157 (88.7%) | 197 (88.7%) |
| 12 to 14 Years | 53 (71.6%) | 73 (86.9%) |
| 15 Years | 42 (82.4%) | 45 (100.0%) |
| 16 and 17 Years | 45 (30.0%) | 42 (87.5%) |
| 18 to 24 Years | 94 (94.0%) | 78 (86.7%) |
| 25 to 34 Years | 211 (86.1%) | 167 (65.5%) |
| 35 to 44 Years | 278 (90.8%) | 238 (83.5%) |
| 45 to 54 Years | 212 (87.2%) | 260 (86.7%) |
| 55 to 64 Years | 235 (88.3%) | 203 (93.1%) |
| 65 to 74 Years | 346 (97.7%) | 212 (95.5%) |
| 75 Years and over | 91 (100.0%) | 82 (100.0%) |
| Total | 1,867 (85.8%) | 1,712 (85.6%) |
Income Below Poverty Among Married-Couple Families in Slaughterville
The poverty statistics for married-couple families in Slaughterville show that 5.5% or 56 of the total 1,023 families live below the poverty line. Families with 3 or 4 children have the highest poverty rate of 19.8%, comprising of 16 families. On the other hand, families with 5 or more children have the lowest poverty rate of 0.0%, which includes 0 families.
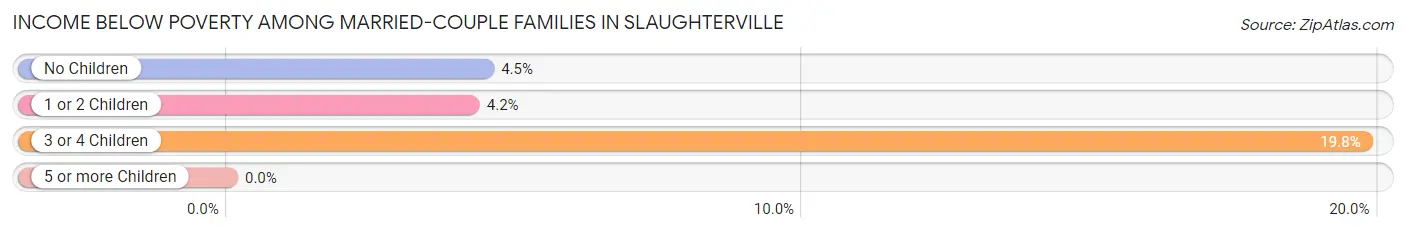
| Children | Above Poverty | Below Poverty |
| No Children | 536 (95.5%) | 25 (4.5%) |
| 1 or 2 Children | 341 (95.8%) | 15 (4.2%) |
| 3 or 4 Children | 65 (80.2%) | 16 (19.8%) |
| 5 or more Children | 25 (100.0%) | 0 (0.0%) |
| Total | 967 (94.5%) | 56 (5.5%) |
Income Below Poverty Among Single-Parent Households in Slaughterville
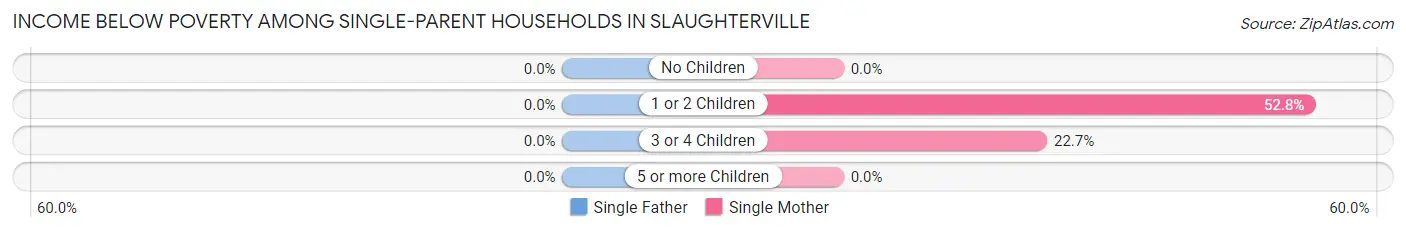
| Children | Single Father | Single Mother |
| No Children | 0 (0.0%) | 0 (0.0%) |
| 1 or 2 Children | 0 (0.0%) | 66 (52.8%) |
| 3 or 4 Children | 0 (0.0%) | 5 (22.7%) |
| 5 or more Children | 0 (0.0%) | 0 (0.0%) |
| Total | 0 (0.0%) | 71 (39.0%) |
Income Below Poverty Among Married-Couple vs Single-Parent Households in Slaughterville
The poverty data for Slaughterville shows that 56 of the married-couple family households (5.5%) and 71 of the single-parent households (26.7%) are living below the poverty level. Within the married-couple family households, those with 3 or 4 children have the highest poverty rate, with 16 households (19.8%) falling below the poverty line. Among the single-parent households, those with 1 or 2 children have the highest poverty rate, with 66 household (44.0%) living below poverty.
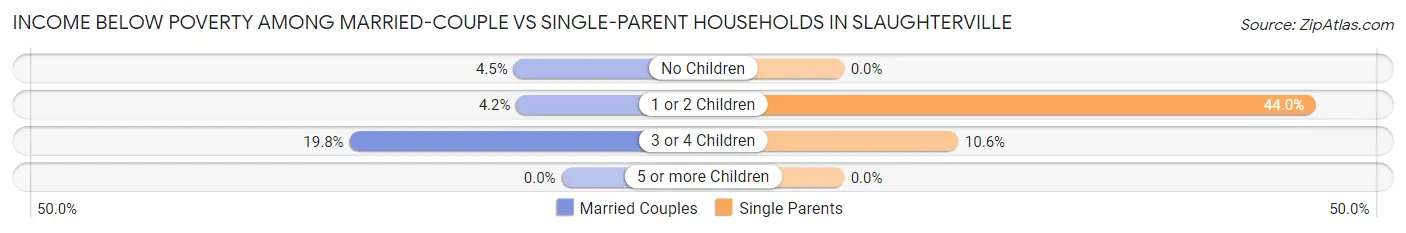
| Children | Married-Couple Families | Single-Parent Households |
| No Children | 25 (4.5%) | 0 (0.0%) |
| 1 or 2 Children | 15 (4.2%) | 66 (44.0%) |
| 3 or 4 Children | 16 (19.8%) | 5 (10.6%) |
| 5 or more Children | 0 (0.0%) | 0 (0.0%) |
| Total | 56 (5.5%) | 71 (26.7%) |
Race in Slaughterville
The most populous races in Slaughterville are White / Caucasian (3,323 | 79.4%), Two or more Races (476 | 11.4%), and Hispanic or Latino (367 | 8.8%).
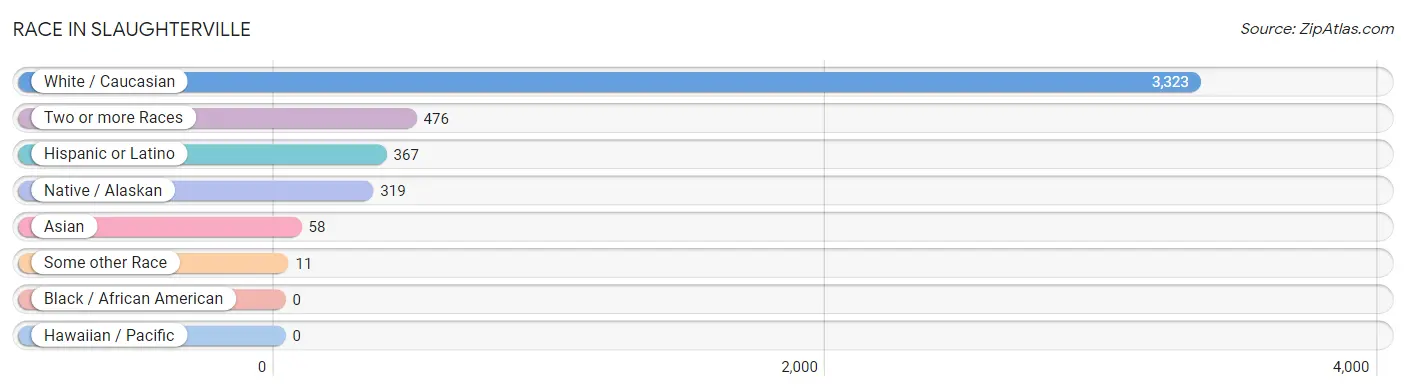
| Race | # Population | % Population |
| Asian | 58 | 1.4% |
| Black / African American | 0 | 0.0% |
| Hawaiian / Pacific | 0 | 0.0% |
| Hispanic or Latino | 367 | 8.8% |
| Native / Alaskan | 319 | 7.6% |
| White / Caucasian | 3,323 | 79.4% |
| Two or more Races | 476 | 11.4% |
| Some other Race | 11 | 0.3% |
| Total | 4,187 | 100.0% |
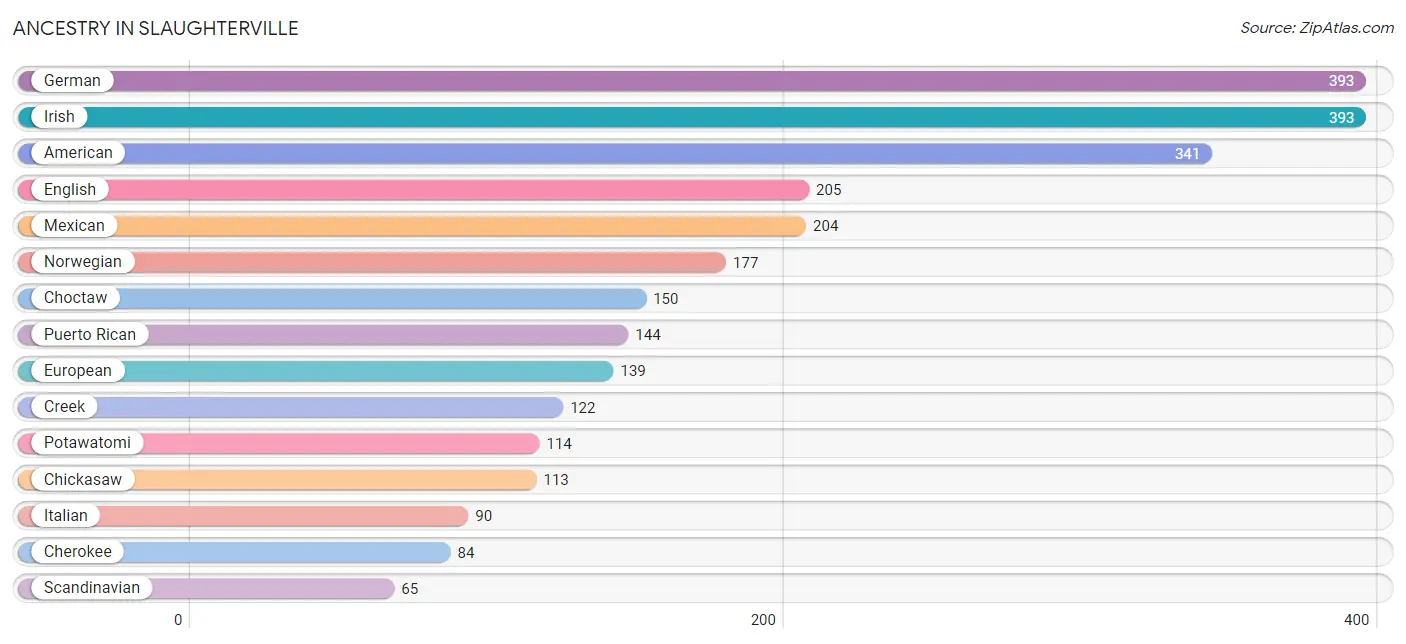
Ancestry in Slaughterville
The most populous ancestries reported in Slaughterville are German (393 | 9.4%), Irish (393 | 9.4%), American (341 | 8.1%), English (205 | 4.9%), and Mexican (204 | 4.9%), together accounting for 36.7% of all Slaughterville residents.
| Ancestry | # Population | % Population |
| African | 17 | 0.4% |
| American | 341 | 8.1% |
| Arab | 6 | 0.1% |
| British | 35 | 0.8% |
| Cherokee | 84 | 2.0% |
| Chickasaw | 113 | 2.7% |
| Choctaw | 150 | 3.6% |
| Comanche | 20 | 0.5% |
| Creek | 122 | 2.9% |
| Crow | 13 | 0.3% |
| Czech | 9 | 0.2% |
| Dutch | 32 | 0.8% |
| English | 205 | 4.9% |
| European | 139 | 3.3% |
| French | 9 | 0.2% |
| German | 393 | 9.4% |
| German Russian | 6 | 0.1% |
| Indian (Asian) | 49 | 1.2% |
| Irish | 393 | 9.4% |
| Italian | 90 | 2.1% |
| Korean | 9 | 0.2% |
| Lebanese | 6 | 0.1% |
| Mexican | 204 | 4.9% |
| Mexican American Indian | 8 | 0.2% |
| Norwegian | 177 | 4.2% |
| Polish | 11 | 0.3% |
| Potawatomi | 114 | 2.7% |
| Puerto Rican | 144 | 3.4% |
| Romanian | 10 | 0.2% |
| Russian | 22 | 0.5% |
| Scandinavian | 65 | 1.5% |
| Scotch-Irish | 12 | 0.3% |
| Scottish | 42 | 1.0% |
| Spanish | 11 | 0.3% |
| Subsaharan African | 17 | 0.4% |
| Swedish | 25 | 0.6% |
| Welsh | 11 | 0.3% | View All 37 Rows |
Immigrants in Slaughterville
The most numerous immigrant groups reported in Slaughterville came from Asia (58 | 1.4%), China (49 | 1.2%), Eastern Asia (49 | 1.2%), Hong Kong (45 | 1.1%), and Central America (41 | 1.0%), together accounting for 5.8% of all Slaughterville residents.
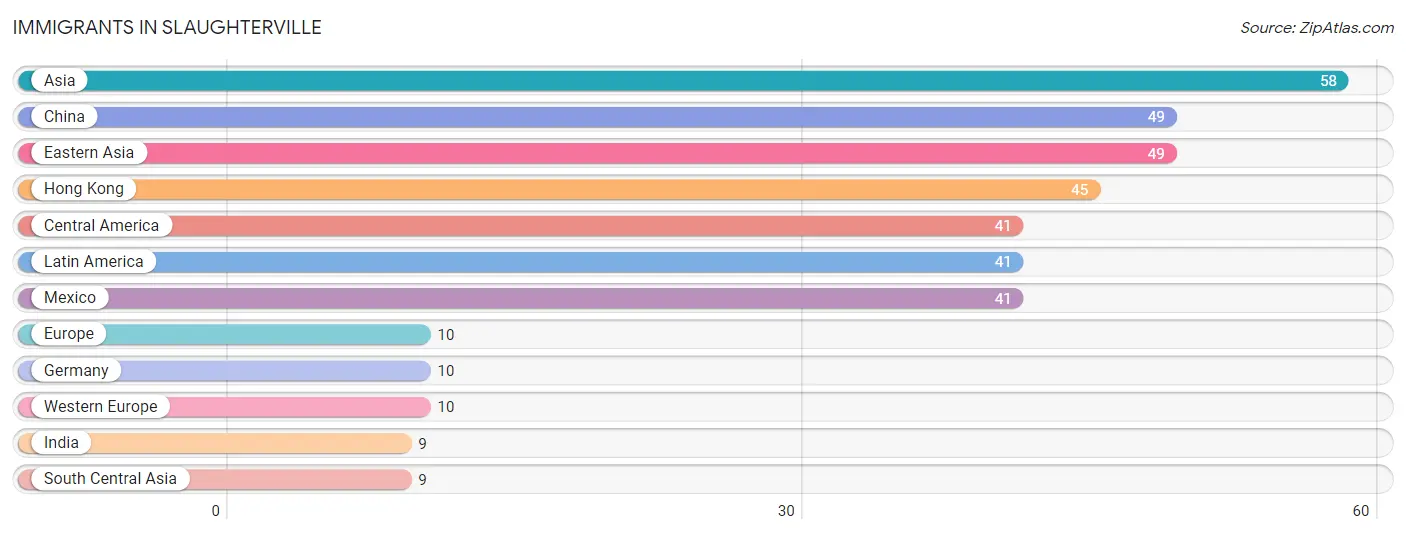
| Immigration Origin | # Population | % Population |
| Asia | 58 | 1.4% |
| Central America | 41 | 1.0% |
| China | 49 | 1.2% |
| Eastern Asia | 49 | 1.2% |
| Europe | 10 | 0.2% |
| Germany | 10 | 0.2% |
| Hong Kong | 45 | 1.1% |
| India | 9 | 0.2% |
| Latin America | 41 | 1.0% |
| Mexico | 41 | 1.0% |
| South Central Asia | 9 | 0.2% |
| Western Europe | 10 | 0.2% | View All 12 Rows |
Sex and Age in Slaughterville
Sex and Age in Slaughterville
The most populous age groups in Slaughterville are 65 to 69 Years (315 | 14.4%) for men and 5 to 9 Years (193 | 9.7%) for women.
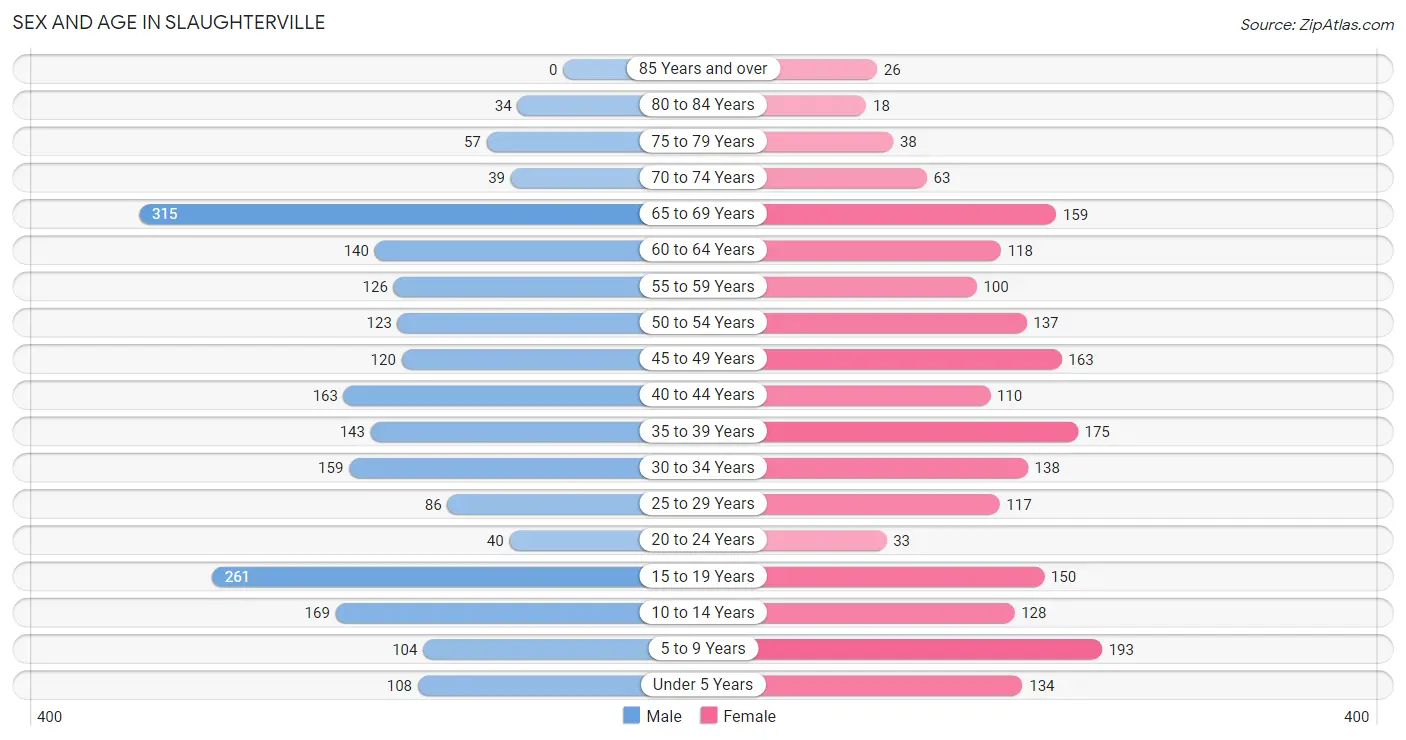
| Age Bracket | Male | Female |
| Under 5 Years | 108 (4.9%) | 134 (6.7%) |
| 5 to 9 Years | 104 (4.8%) | 193 (9.7%) |
| 10 to 14 Years | 169 (7.7%) | 128 (6.4%) |
| 15 to 19 Years | 261 (11.9%) | 150 (7.5%) |
| 20 to 24 Years | 40 (1.8%) | 33 (1.7%) |
| 25 to 29 Years | 86 (3.9%) | 117 (5.9%) |
| 30 to 34 Years | 159 (7.3%) | 138 (6.9%) |
| 35 to 39 Years | 143 (6.5%) | 175 (8.7%) |
| 40 to 44 Years | 163 (7.4%) | 110 (5.5%) |
| 45 to 49 Years | 120 (5.5%) | 163 (8.2%) |
| 50 to 54 Years | 123 (5.6%) | 137 (6.9%) |
| 55 to 59 Years | 126 (5.8%) | 100 (5.0%) |
| 60 to 64 Years | 140 (6.4%) | 118 (5.9%) |
| 65 to 69 Years | 315 (14.4%) | 159 (8.0%) |
| 70 to 74 Years | 39 (1.8%) | 63 (3.2%) |
| 75 to 79 Years | 57 (2.6%) | 38 (1.9%) |
| 80 to 84 Years | 34 (1.5%) | 18 (0.9%) |
| 85 Years and over | 0 (0.0%) | 26 (1.3%) |
| Total | 2,187 (100.0%) | 2,000 (100.0%) |
Families and Households in Slaughterville
Median Family Size in Slaughterville
The median family size in Slaughterville is 2.85 persons per family, with married-couple families (1,023 | 79.4%) accounting for the largest median family size of 2.9 persons per family. On the other hand, single female/mother families (182 | 14.1%) represent the smallest median family size with 2.59 persons per family.
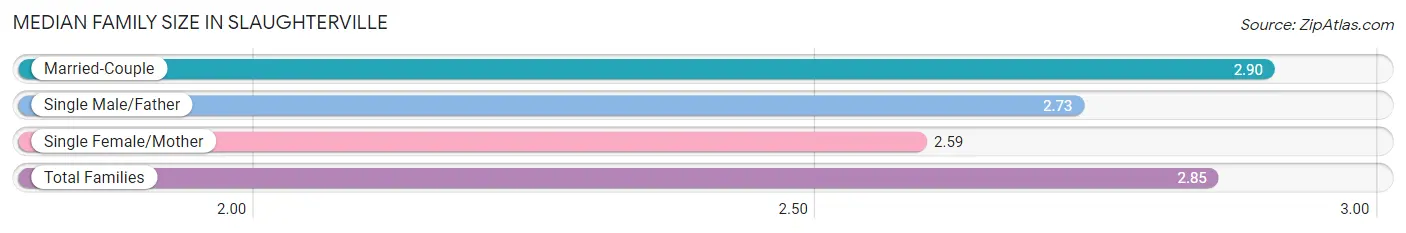
| Family Type | # Families | Family Size |
| Married-Couple | 1,023 (79.4%) | 2.90 |
| Single Male/Father | 84 (6.5%) | 2.73 |
| Single Female/Mother | 182 (14.1%) | 2.59 |
| Total Families | 1,289 (100.0%) | 2.85 |
Median Household Size in Slaughterville
The median household size in Slaughterville is 2.80 persons per household, with single male/father households (84 | 5.6%) accounting for the largest median household size of 3.19 persons per household. non-family households (208 | 13.9%) represent the smallest median household size with 1.44 persons per household.
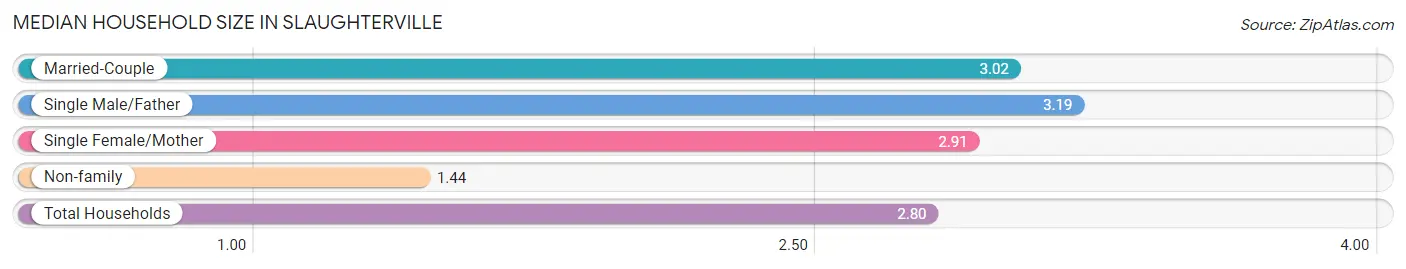
| Household Type | # Households | Household Size |
| Married-Couple | 1,023 (68.3%) | 3.02 |
| Single Male/Father | 84 (5.6%) | 3.19 |
| Single Female/Mother | 182 (12.2%) | 2.91 |
| Non-family | 208 (13.9%) | 1.44 |
| Total Households | 1,497 (100.0%) | 2.80 |
Household Size by Marriage Status in Slaughterville
Out of a total of 1,497 households in Slaughterville, 1,289 (86.1%) are family households, while 208 (13.9%) are nonfamily households. The most numerous type of family households are 2-person households, comprising 510, and the most common type of nonfamily households are 1-person households, comprising 150.
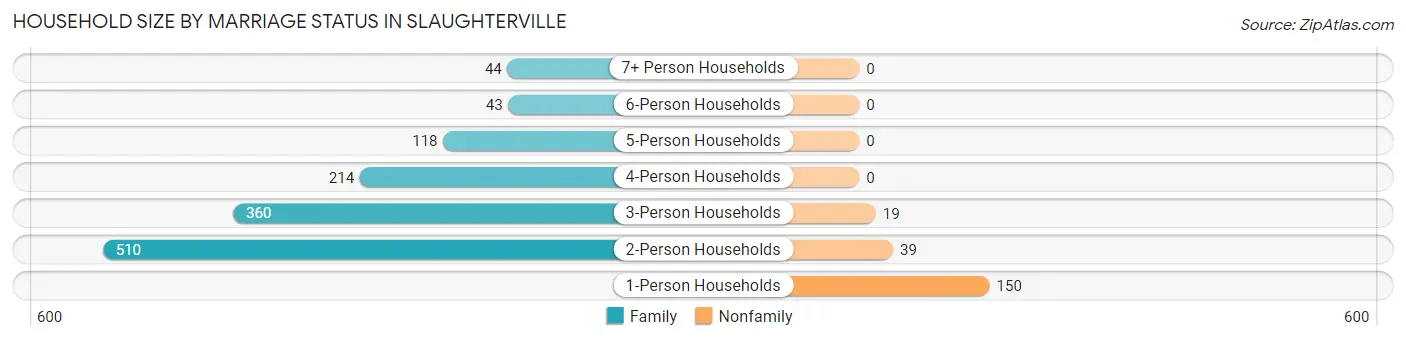
| Household Size | Family Households | Nonfamily Households |
| 1-Person Households | - | 150 (10.0%) |
| 2-Person Households | 510 (34.1%) | 39 (2.6%) |
| 3-Person Households | 360 (24.0%) | 19 (1.3%) |
| 4-Person Households | 214 (14.3%) | 0 (0.0%) |
| 5-Person Households | 118 (7.9%) | 0 (0.0%) |
| 6-Person Households | 43 (2.9%) | 0 (0.0%) |
| 7+ Person Households | 44 (2.9%) | 0 (0.0%) |
| Total | 1,289 (86.1%) | 208 (13.9%) |
Female Fertility in Slaughterville
Fertility by Age in Slaughterville
Average fertility rate in Slaughterville is 40.0 births per 1,000 women. Women in the age bracket of 20 to 34 years have the highest fertility rate with 101.0 births per 1,000 women. Women in the age bracket of 20 to 34 years acount for 78.4% of all women with births.
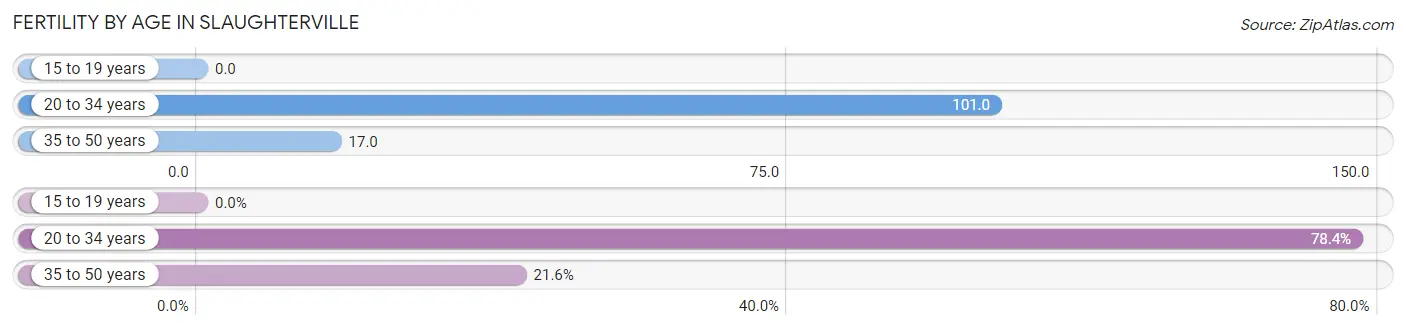
| Age Bracket | Women with Births | Births / 1,000 Women |
| 15 to 19 years | 0 (0.0%) | 0.0 |
| 20 to 34 years | 29 (78.4%) | 101.0 |
| 35 to 50 years | 8 (21.6%) | 17.0 |
| Total | 37 (100.0%) | 40.0 |
Fertility by Age by Marriage Status in Slaughterville
83.8% of women with births (37) in Slaughterville are married. The highest percentage of unmarried women with births falls into 20 to 34 years age bracket with 20.7% of them unmarried at the time of birth, while the lowest percentage of unmarried women with births belong to 35 to 50 years age bracket with 0.0% of them unmarried.
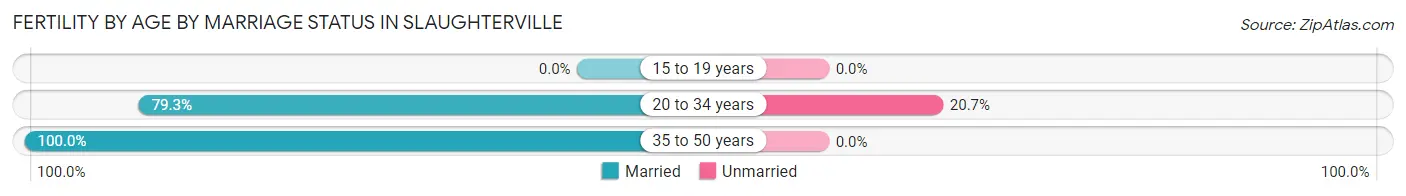
| Age Bracket | Married | Unmarried |
| 15 to 19 years | 0 (0.0%) | 0 (0.0%) |
| 20 to 34 years | 23 (79.3%) | 6 (20.7%) |
| 35 to 50 years | 8 (100.0%) | 0 (0.0%) |
| Total | 31 (83.8%) | 6 (16.2%) |
Fertility by Education in Slaughterville
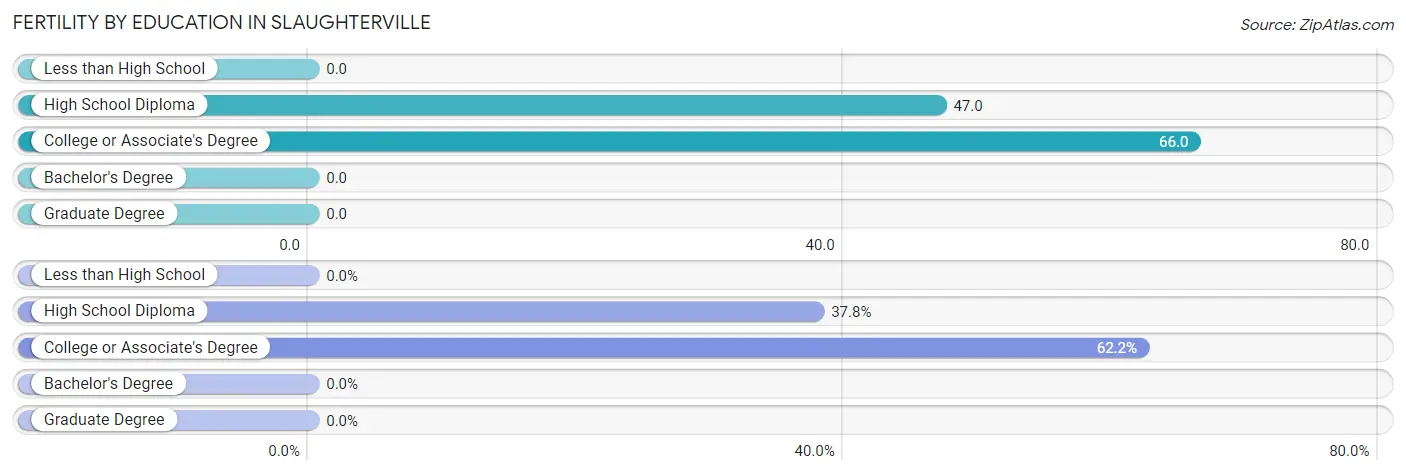
| Educational Attainment | Women with Births | Births / 1,000 Women |
| Less than High School | 0 (0.0%) | 0.0 |
| High School Diploma | 14 (37.8%) | 47.0 |
| College or Associate's Degree | 23 (62.2%) | 66.0 |
| Bachelor's Degree | 0 (0.0%) | 0.0 |
| Graduate Degree | 0 (0.0%) | 0.0 |
| Total | 37 (100.0%) | 40.0 |
Fertility by Education by Marriage Status in Slaughterville
16.2% of women with births in Slaughterville are unmarried. Women with the educational attainment of college or associate's degree are most likely to be married with 100.0% of them married at childbirth, while women with the educational attainment of high school diploma are least likely to be married with 42.9% of them unmarried at childbirth.
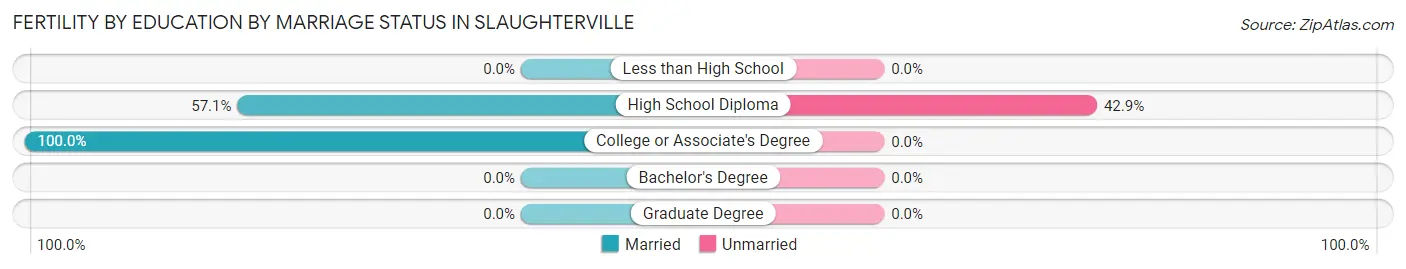
| Educational Attainment | Married | Unmarried |
| Less than High School | 0 (0.0%) | 0 (0.0%) |
| High School Diploma | 8 (57.1%) | 6 (42.9%) |
| College or Associate's Degree | 23 (100.0%) | 0 (0.0%) |
| Bachelor's Degree | 0 (0.0%) | 0 (0.0%) |
| Graduate Degree | 0 (0.0%) | 0 (0.0%) |
| Total | 31 (83.8%) | 6 (16.2%) |
Employment Characteristics in Slaughterville
Employment by Class of Employer in Slaughterville
Among the 1,659 employed individuals in Slaughterville, private company employees (938 | 56.5%), state government employees (162 | 9.8%), and local government employees (157 | 9.5%) make up the most common classes of employment.
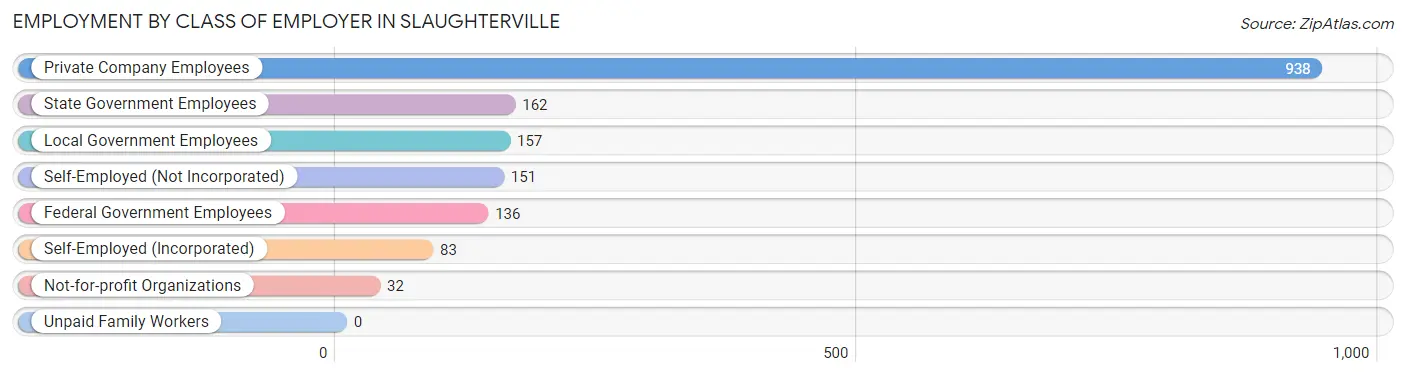
| Employer Class | # Employees | % Employees |
| Private Company Employees | 938 | 56.5% |
| Self-Employed (Incorporated) | 83 | 5.0% |
| Self-Employed (Not Incorporated) | 151 | 9.1% |
| Not-for-profit Organizations | 32 | 1.9% |
| Local Government Employees | 157 | 9.5% |
| State Government Employees | 162 | 9.8% |
| Federal Government Employees | 136 | 8.2% |
| Unpaid Family Workers | 0 | 0.0% |
| Total | 1,659 | 100.0% |
Employment Status by Age in Slaughterville
According to the labor force statistics for Slaughterville, out of the total population over 16 years of age (3,255), 55.6% or 1,810 individuals are in the labor force, with 5.0% or 90 of them unemployed. The age group with the highest labor force participation rate is 30 to 34 years, with 84.5% or 251 individuals in the labor force. Within the labor force, the 16 to 19 years age range has the highest percentage of unemployed individuals, with 13.8% or 13 of them being unemployed.
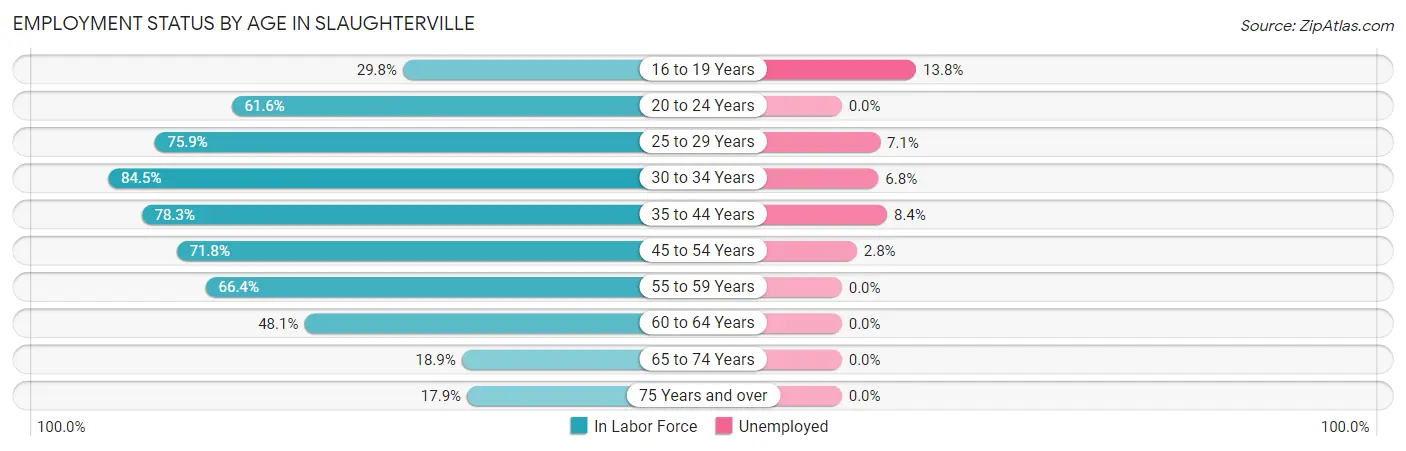
| Age Bracket | In Labor Force | Unemployed |
| 16 to 19 Years | 94 (29.8%) | 13 (13.8%) |
| 20 to 24 Years | 45 (61.6%) | 0 (0.0%) |
| 25 to 29 Years | 154 (75.9%) | 11 (7.1%) |
| 30 to 34 Years | 251 (84.5%) | 17 (6.8%) |
| 35 to 44 Years | 463 (78.3%) | 39 (8.4%) |
| 45 to 54 Years | 390 (71.8%) | 11 (2.8%) |
| 55 to 59 Years | 150 (66.4%) | 0 (0.0%) |
| 60 to 64 Years | 124 (48.1%) | 0 (0.0%) |
| 65 to 74 Years | 109 (18.9%) | 0 (0.0%) |
| 75 Years and over | 31 (17.9%) | 0 (0.0%) |
| Total | 1,810 (55.6%) | 90 (5.0%) |
Employment Status by Educational Attainment in Slaughterville
According to labor force statistics for Slaughterville, 72.3% of individuals (1,531) out of the total population between 25 and 64 years of age (2,118) are in the labor force, with 5.1% or 78 of them being unemployed. The group with the highest labor force participation rate are those with the educational attainment of college / associate degree, with 79.1% or 605 individuals in the labor force. Within the labor force, individuals with high school diploma education have the highest percentage of unemployment, with 9.8% or 62 of them being unemployed.
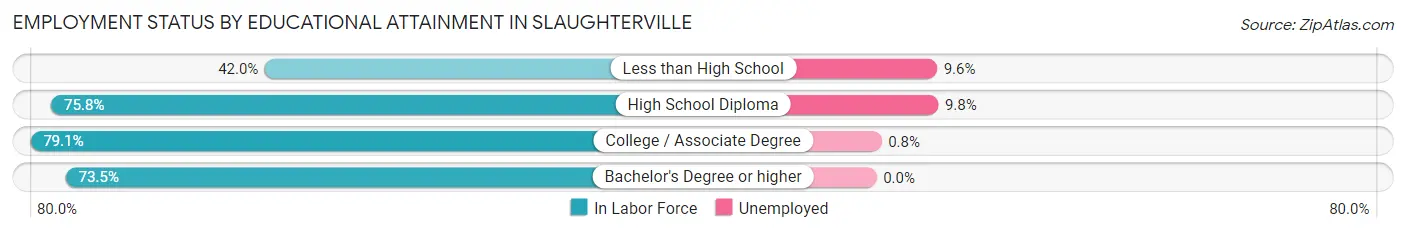
| Educational Attainment | In Labor Force | Unemployed |
| Less than High School | 115 (42.0%) | 26 (9.6%) |
| High School Diploma | 632 (75.8%) | 82 (9.8%) |
| College / Associate Degree | 605 (79.1%) | 6 (0.8%) |
| Bachelor's Degree or higher | 180 (73.5%) | 0 (0.0%) |
| Total | 1,531 (72.3%) | 108 (5.1%) |
Employment Occupations by Sex in Slaughterville
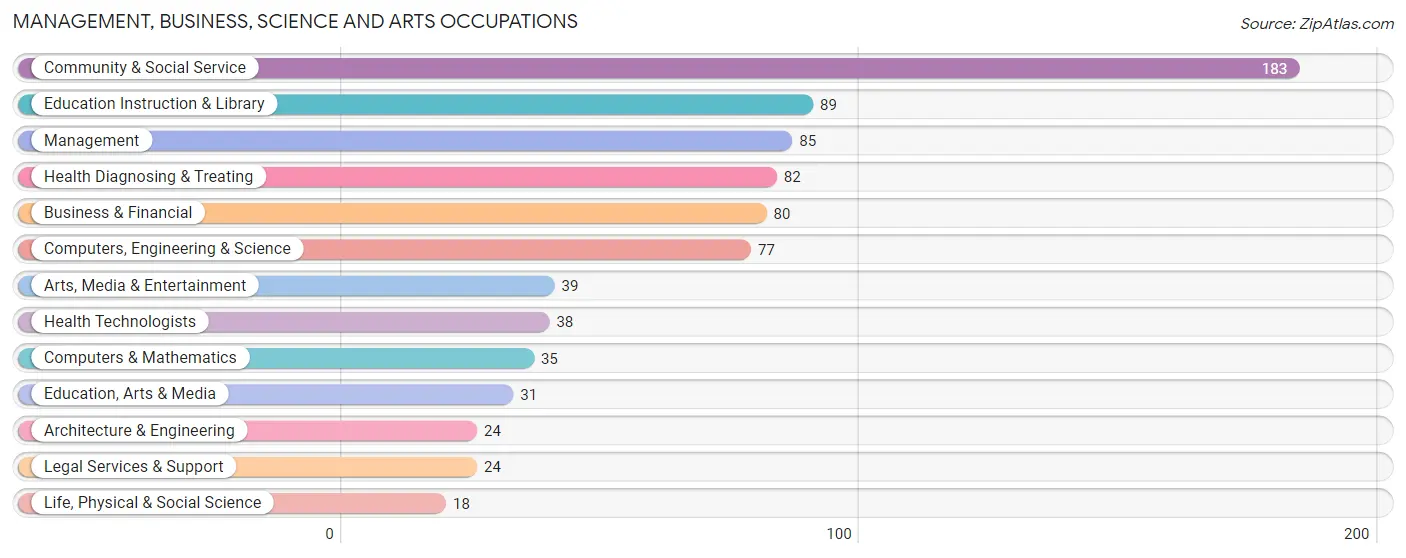
Management, Business, Science and Arts Occupations
The most common Management, Business, Science and Arts occupations in Slaughterville are Community & Social Service (183 | 10.6%), Education Instruction & Library (89 | 5.2%), Management (85 | 4.9%), Health Diagnosing & Treating (82 | 4.8%), and Business & Financial (80 | 4.6%).
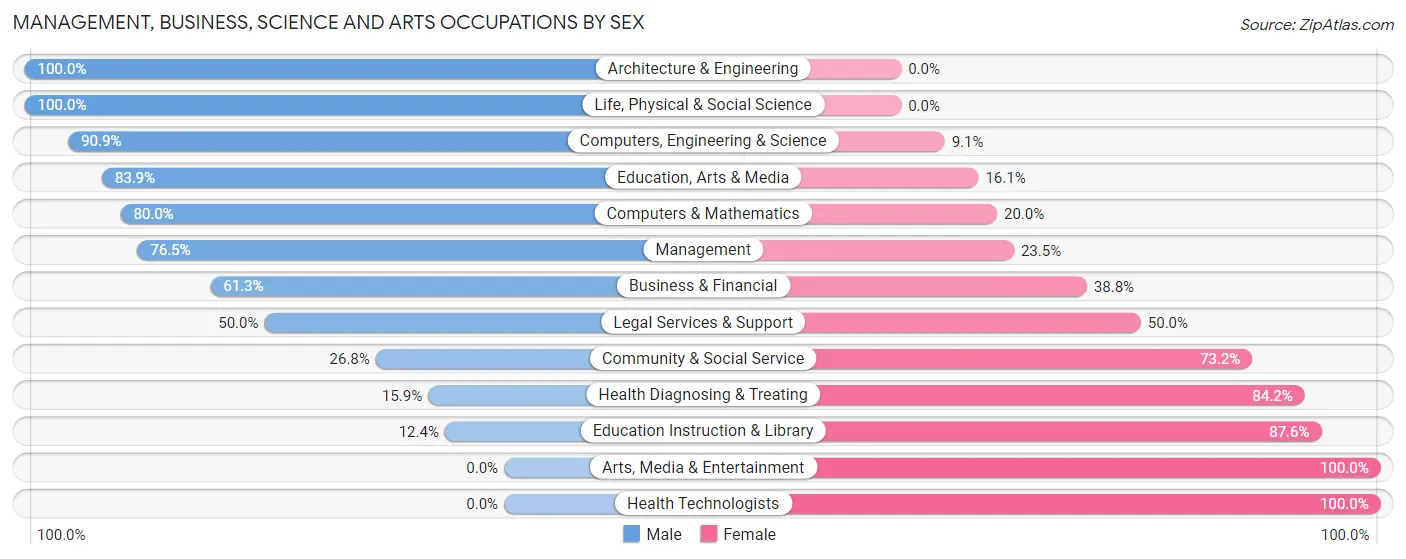
Management, Business, Science and Arts Occupations by Sex
Within the Management, Business, Science and Arts occupations in Slaughterville, the most male-oriented occupations are Architecture & Engineering (100.0%), Life, Physical & Social Science (100.0%), and Computers, Engineering & Science (90.9%), while the most female-oriented occupations are Arts, Media & Entertainment (100.0%), Health Technologists (100.0%), and Education Instruction & Library (87.6%).
| Occupation | Male | Female |
| Management | 65 (76.5%) | 20 (23.5%) |
| Business & Financial | 49 (61.3%) | 31 (38.8%) |
| Computers, Engineering & Science | 70 (90.9%) | 7 (9.1%) |
| Computers & Mathematics | 28 (80.0%) | 7 (20.0%) |
| Architecture & Engineering | 24 (100.0%) | 0 (0.0%) |
| Life, Physical & Social Science | 18 (100.0%) | 0 (0.0%) |
| Community & Social Service | 49 (26.8%) | 134 (73.2%) |
| Education, Arts & Media | 26 (83.9%) | 5 (16.1%) |
| Legal Services & Support | 12 (50.0%) | 12 (50.0%) |
| Education Instruction & Library | 11 (12.4%) | 78 (87.6%) |
| Arts, Media & Entertainment | 0 (0.0%) | 39 (100.0%) |
| Health Diagnosing & Treating | 13 (15.9%) | 69 (84.2%) |
| Health Technologists | 0 (0.0%) | 38 (100.0%) |
| Total (Category) | 246 (48.5%) | 261 (51.5%) |
| Total (Overall) | 904 (52.6%) | 816 (47.4%) |
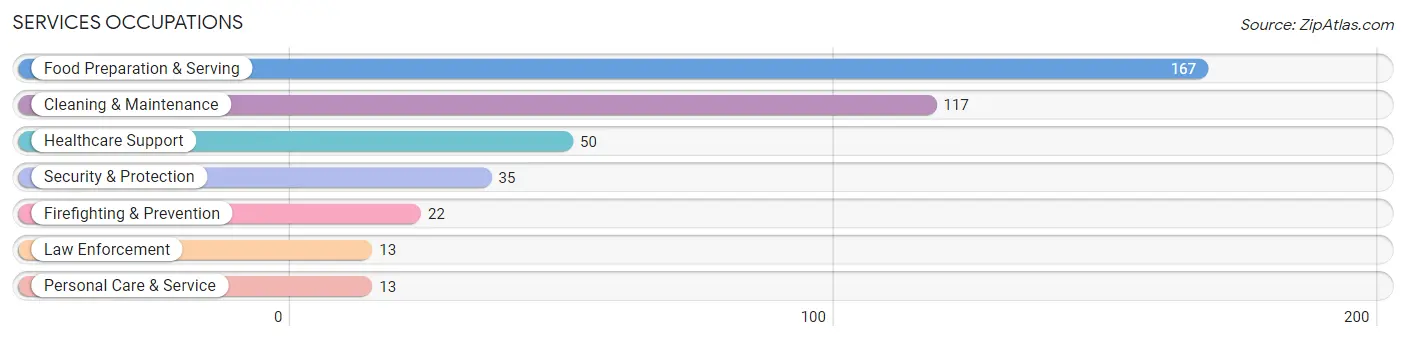
Services Occupations
The most common Services occupations in Slaughterville are Food Preparation & Serving (167 | 9.7%), Cleaning & Maintenance (117 | 6.8%), Healthcare Support (50 | 2.9%), Security & Protection (35 | 2.0%), and Firefighting & Prevention (22 | 1.3%).
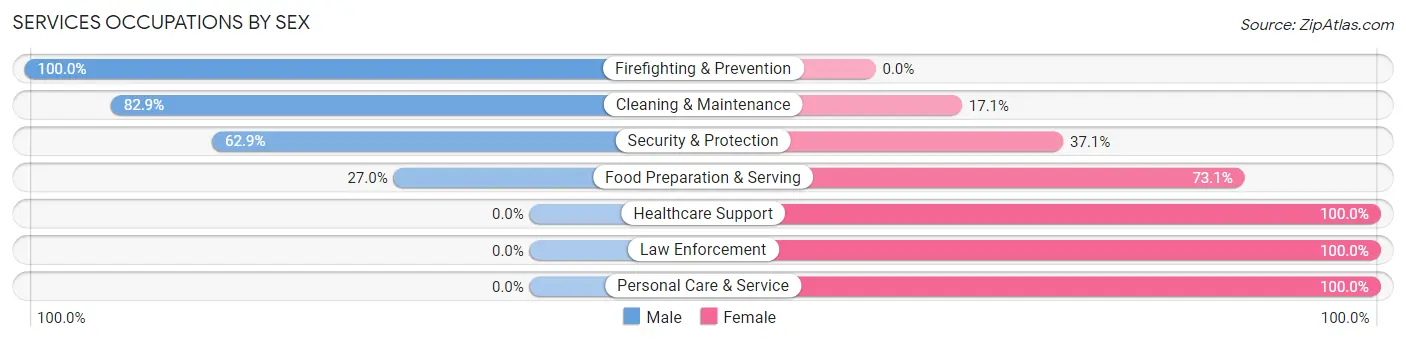
Services Occupations by Sex
Within the Services occupations in Slaughterville, the most male-oriented occupations are Firefighting & Prevention (100.0%), Cleaning & Maintenance (82.9%), and Security & Protection (62.9%), while the most female-oriented occupations are Healthcare Support (100.0%), Law Enforcement (100.0%), and Personal Care & Service (100.0%).
| Occupation | Male | Female |
| Healthcare Support | 0 (0.0%) | 50 (100.0%) |
| Security & Protection | 22 (62.9%) | 13 (37.1%) |
| Firefighting & Prevention | 22 (100.0%) | 0 (0.0%) |
| Law Enforcement | 0 (0.0%) | 13 (100.0%) |
| Food Preparation & Serving | 45 (27.0%) | 122 (73.1%) |
| Cleaning & Maintenance | 97 (82.9%) | 20 (17.1%) |
| Personal Care & Service | 0 (0.0%) | 13 (100.0%) |
| Total (Category) | 164 (42.9%) | 218 (57.1%) |
| Total (Overall) | 904 (52.6%) | 816 (47.4%) |
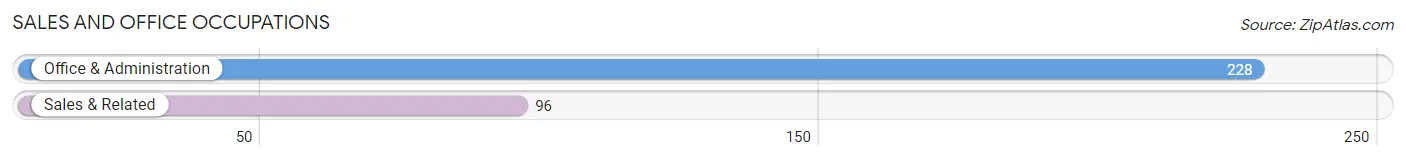
Sales and Office Occupations
The most common Sales and Office occupations in Slaughterville are Office & Administration (228 | 13.3%), and Sales & Related (96 | 5.6%).
Sales and Office Occupations by Sex
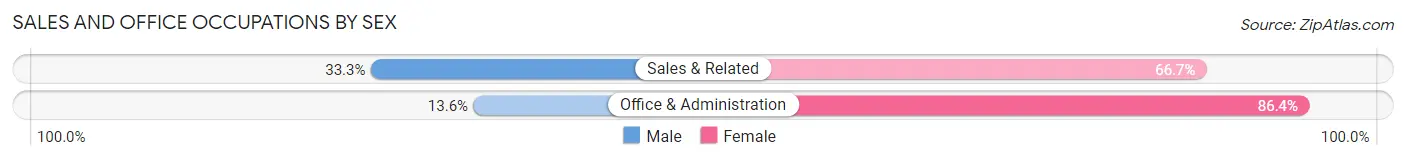
| Occupation | Male | Female |
| Sales & Related | 32 (33.3%) | 64 (66.7%) |
| Office & Administration | 31 (13.6%) | 197 (86.4%) |
| Total (Category) | 63 (19.4%) | 261 (80.6%) |
| Total (Overall) | 904 (52.6%) | 816 (47.4%) |
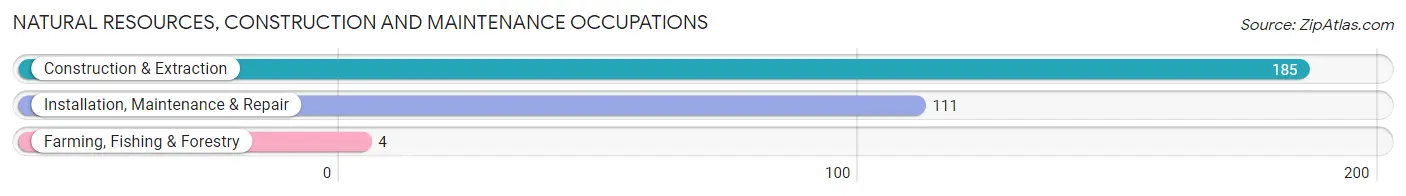
Natural Resources, Construction and Maintenance Occupations
The most common Natural Resources, Construction and Maintenance occupations in Slaughterville are Construction & Extraction (185 | 10.8%), Installation, Maintenance & Repair (111 | 6.5%), and Farming, Fishing & Forestry (4 | 0.2%).
Natural Resources, Construction and Maintenance Occupations by Sex
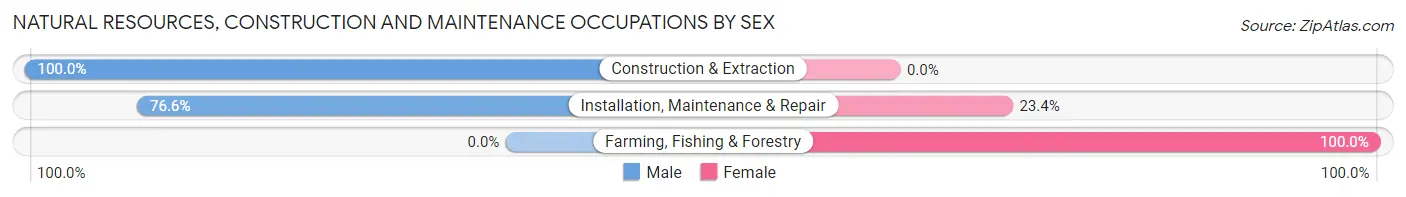
| Occupation | Male | Female |
| Farming, Fishing & Forestry | 0 (0.0%) | 4 (100.0%) |
| Construction & Extraction | 185 (100.0%) | 0 (0.0%) |
| Installation, Maintenance & Repair | 85 (76.6%) | 26 (23.4%) |
| Total (Category) | 270 (90.0%) | 30 (10.0%) |
| Total (Overall) | 904 (52.6%) | 816 (47.4%) |
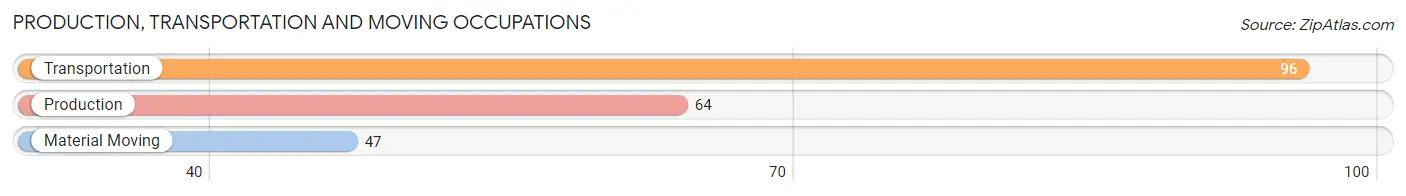
Production, Transportation and Moving Occupations
The most common Production, Transportation and Moving occupations in Slaughterville are Transportation (96 | 5.6%), Production (64 | 3.7%), and Material Moving (47 | 2.7%).
Production, Transportation and Moving Occupations by Sex
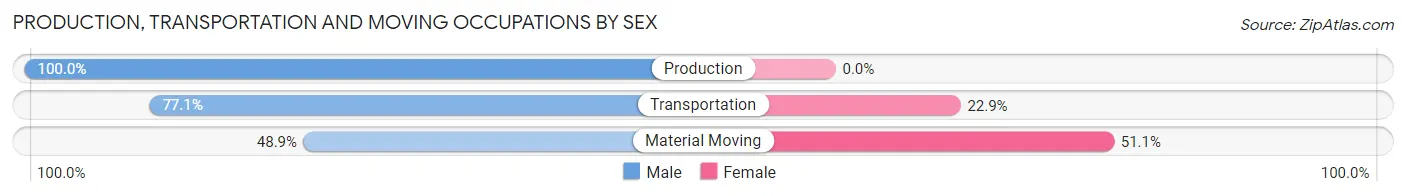
| Occupation | Male | Female |
| Production | 64 (100.0%) | 0 (0.0%) |
| Transportation | 74 (77.1%) | 22 (22.9%) |
| Material Moving | 23 (48.9%) | 24 (51.1%) |
| Total (Category) | 161 (77.8%) | 46 (22.2%) |
| Total (Overall) | 904 (52.6%) | 816 (47.4%) |
Employment Industries by Sex in Slaughterville
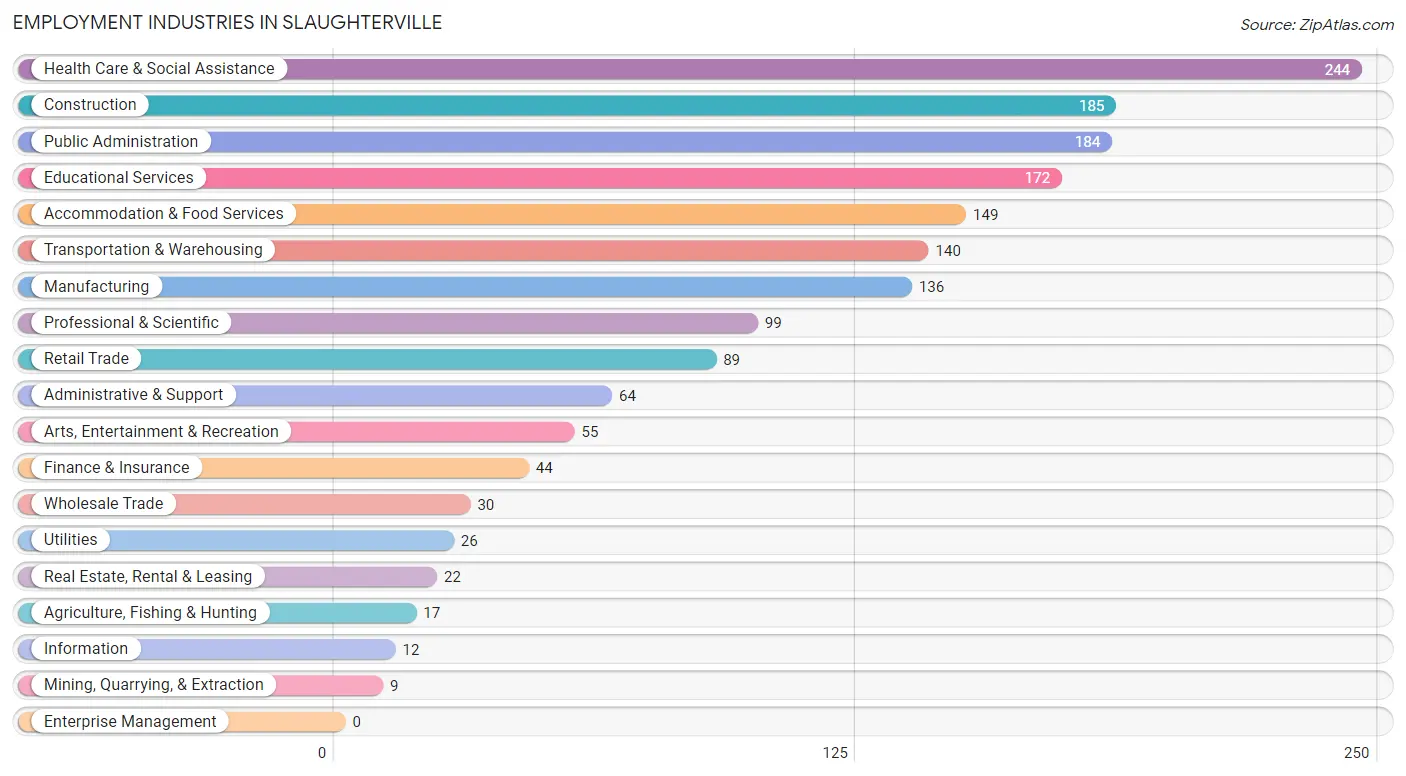
Employment Industries in Slaughterville
The major employment industries in Slaughterville include Health Care & Social Assistance (244 | 14.2%), Construction (185 | 10.8%), Public Administration (184 | 10.7%), Educational Services (172 | 10.0%), and Accommodation & Food Services (149 | 8.7%).
Employment Industries by Sex in Slaughterville
The Slaughterville industries that see more men than women are Mining, Quarrying, & Extraction (100.0%), Wholesale Trade (100.0%), and Information (100.0%), whereas the industries that tend to have a higher number of women are Retail Trade (97.8%), Health Care & Social Assistance (75.8%), and Finance & Insurance (75.0%).
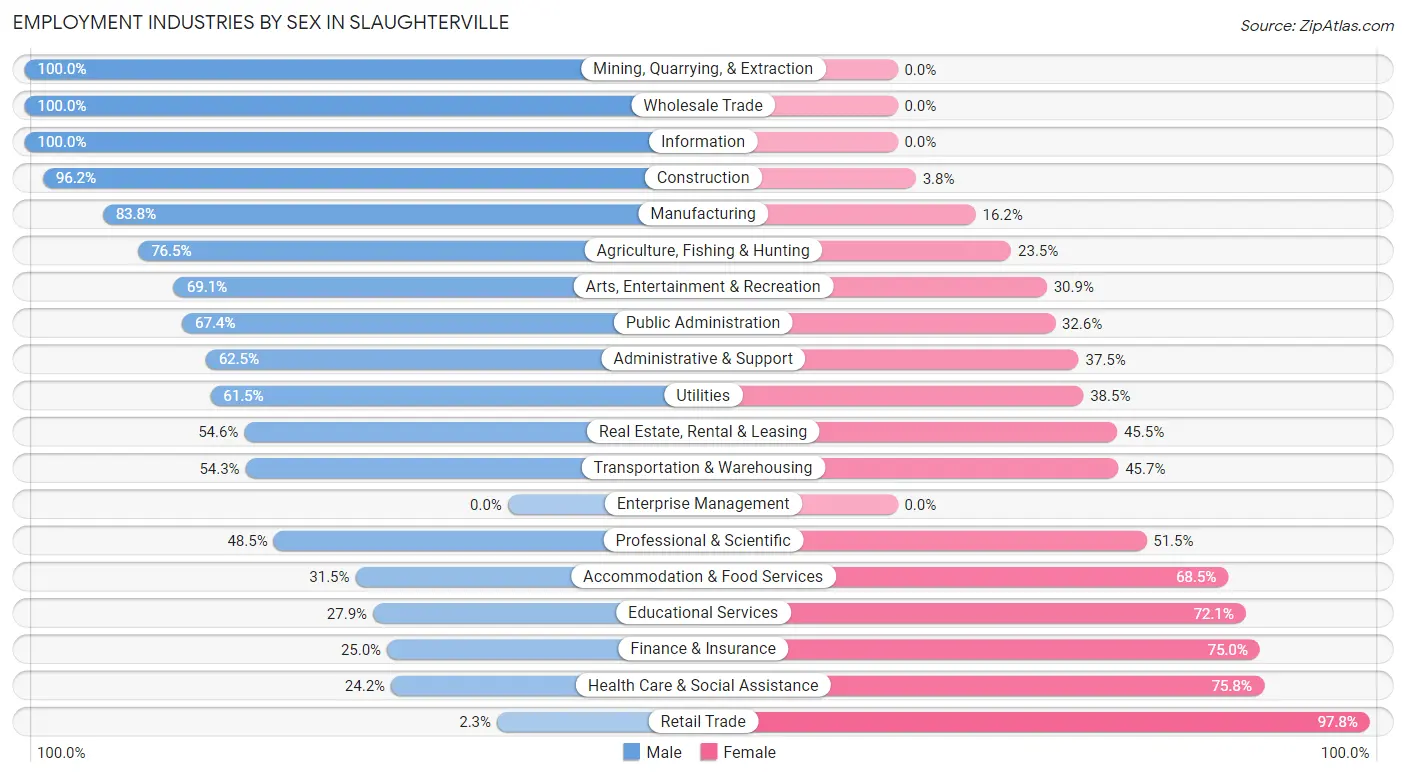
| Industry | Male | Female |
| Agriculture, Fishing & Hunting | 13 (76.5%) | 4 (23.5%) |
| Mining, Quarrying, & Extraction | 9 (100.0%) | 0 (0.0%) |
| Construction | 178 (96.2%) | 7 (3.8%) |
| Manufacturing | 114 (83.8%) | 22 (16.2%) |
| Wholesale Trade | 30 (100.0%) | 0 (0.0%) |
| Retail Trade | 2 (2.2%) | 87 (97.8%) |
| Transportation & Warehousing | 76 (54.3%) | 64 (45.7%) |
| Utilities | 16 (61.5%) | 10 (38.5%) |
| Information | 12 (100.0%) | 0 (0.0%) |
| Finance & Insurance | 11 (25.0%) | 33 (75.0%) |
| Real Estate, Rental & Leasing | 12 (54.5%) | 10 (45.5%) |
| Professional & Scientific | 48 (48.5%) | 51 (51.5%) |
| Enterprise Management | 0 (0.0%) | 0 (0.0%) |
| Administrative & Support | 40 (62.5%) | 24 (37.5%) |
| Educational Services | 48 (27.9%) | 124 (72.1%) |
| Health Care & Social Assistance | 59 (24.2%) | 185 (75.8%) |
| Arts, Entertainment & Recreation | 38 (69.1%) | 17 (30.9%) |
| Accommodation & Food Services | 47 (31.5%) | 102 (68.5%) |
| Public Administration | 124 (67.4%) | 60 (32.6%) |
| Total | 904 (52.6%) | 816 (47.4%) |
Education in Slaughterville
School Enrollment in Slaughterville
The most common levels of schooling among the 923 students in Slaughterville are high school (321 | 34.8%), elementary school (286 | 31.0%), and middle school (187 | 20.3%).
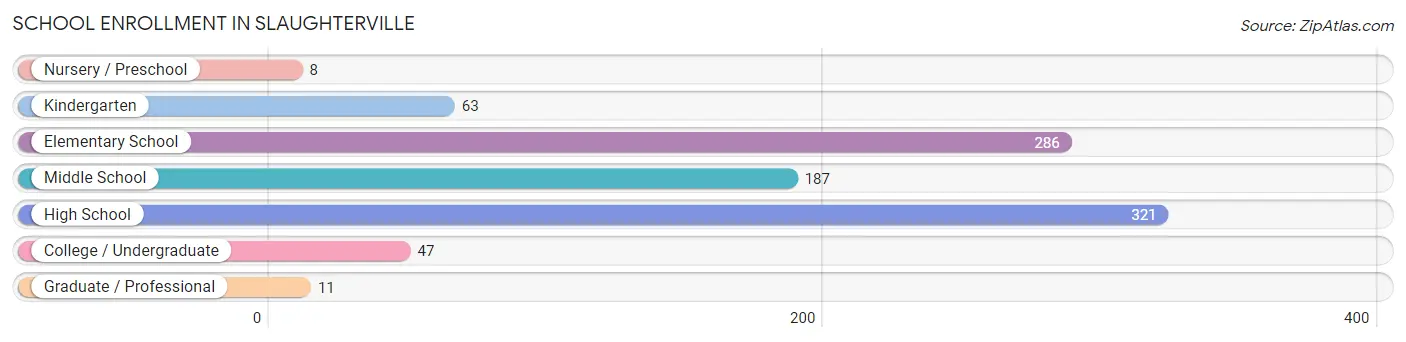
| School Level | # Students | % Students |
| Nursery / Preschool | 8 | 0.9% |
| Kindergarten | 63 | 6.8% |
| Elementary School | 286 | 31.0% |
| Middle School | 187 | 20.3% |
| High School | 321 | 34.8% |
| College / Undergraduate | 47 | 5.1% |
| Graduate / Professional | 11 | 1.2% |
| Total | 923 | 100.0% |
School Enrollment by Age by Funding Source in Slaughterville
Out of a total of 923 students who are enrolled in schools in Slaughterville, 34 (3.7%) attend a private institution, while the remaining 889 (96.3%) are enrolled in public schools. The age group of 3 to 4 year olds has the highest likelihood of being enrolled in private schools, with 7 (100.0% in the age bracket) enrolled. Conversely, the age group of 15 to 17 year olds has the lowest likelihood of being enrolled in a private school, with 287 (100.0% in the age bracket) attending a public institution.
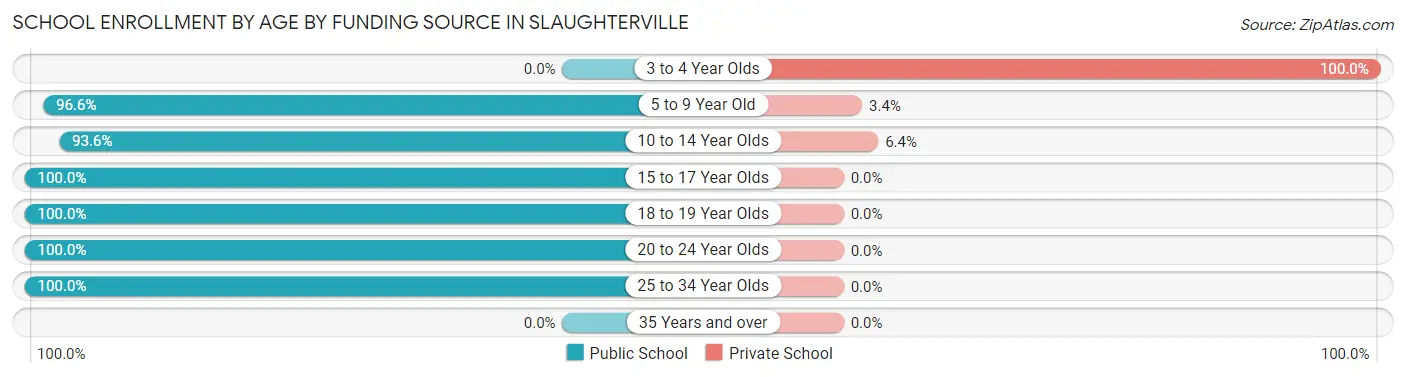
| Age Bracket | Public School | Private School |
| 3 to 4 Year Olds | 0 (0.0%) | 7 (100.0%) |
| 5 to 9 Year Old | 253 (96.6%) | 9 (3.4%) |
| 10 to 14 Year Olds | 262 (93.6%) | 18 (6.4%) |
| 15 to 17 Year Olds | 287 (100.0%) | 0 (0.0%) |
| 18 to 19 Year Olds | 55 (100.0%) | 0 (0.0%) |
| 20 to 24 Year Olds | 21 (100.0%) | 0 (0.0%) |
| 25 to 34 Year Olds | 11 (100.0%) | 0 (0.0%) |
| 35 Years and over | 0 (0.0%) | 0 (0.0%) |
| Total | 889 (96.3%) | 34 (3.7%) |
Educational Attainment by Field of Study in Slaughterville
Education (201 | 43.1%), liberal arts & history (46 | 9.9%), business (44 | 9.4%), physical & health sciences (43 | 9.2%), and science & technology (33 | 7.1%) are the most common fields of study among 466 individuals in Slaughterville who have obtained a bachelor's degree or higher.
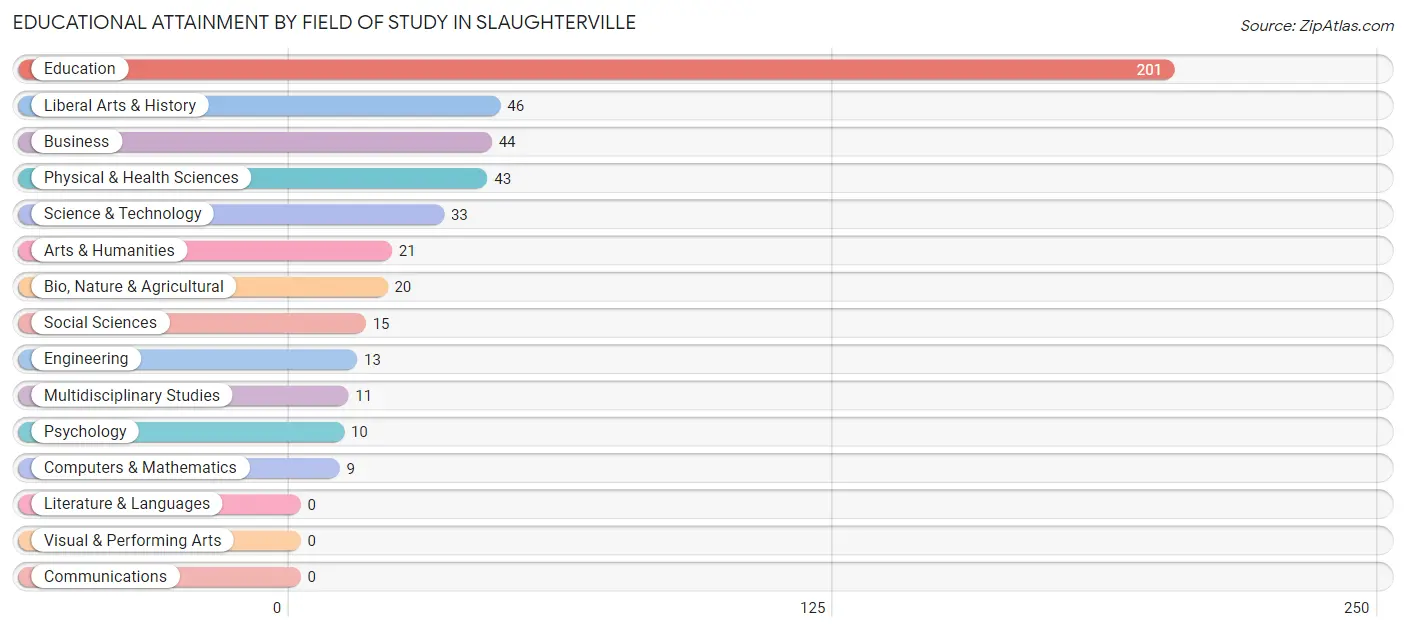
| Field of Study | # Graduates | % Graduates |
| Computers & Mathematics | 9 | 1.9% |
| Bio, Nature & Agricultural | 20 | 4.3% |
| Physical & Health Sciences | 43 | 9.2% |
| Psychology | 10 | 2.1% |
| Social Sciences | 15 | 3.2% |
| Engineering | 13 | 2.8% |
| Multidisciplinary Studies | 11 | 2.4% |
| Science & Technology | 33 | 7.1% |
| Business | 44 | 9.4% |
| Education | 201 | 43.1% |
| Literature & Languages | 0 | 0.0% |
| Liberal Arts & History | 46 | 9.9% |
| Visual & Performing Arts | 0 | 0.0% |
| Communications | 0 | 0.0% |
| Arts & Humanities | 21 | 4.5% |
| Total | 466 | 100.0% |
Transportation & Commute in Slaughterville
Vehicle Availability by Sex in Slaughterville
The most prevalent vehicle ownership categories in Slaughterville are males with 2 vehicles (333, accounting for 38.4%) and females with 2 vehicles (281, making up 42.0%).
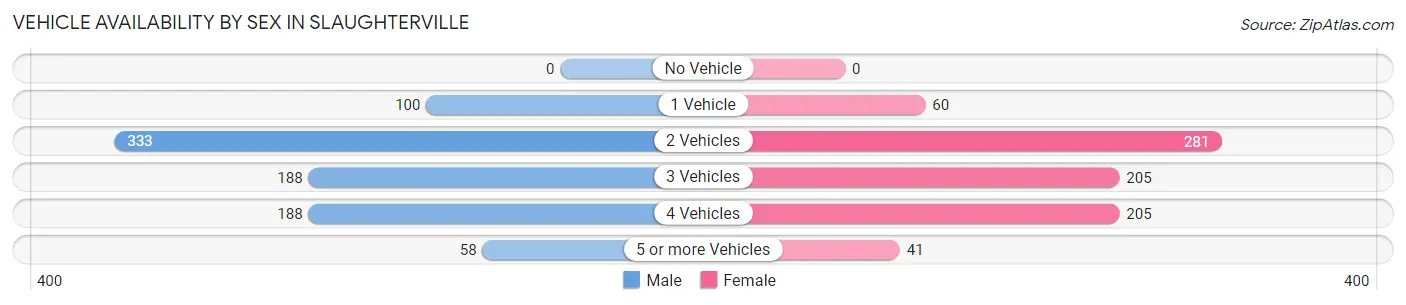
| Vehicles Available | Male | Female |
| No Vehicle | 0 (0.0%) | 0 (0.0%) |
| 1 Vehicle | 100 (11.5%) | 60 (7.6%) |
| 2 Vehicles | 333 (38.4%) | 281 (35.5%) |
| 3 Vehicles | 188 (21.7%) | 205 (25.9%) |
| 4 Vehicles | 188 (21.7%) | 205 (25.9%) |
| 5 or more Vehicles | 58 (6.7%) | 41 (5.2%) |
| Total | 867 (100.0%) | 792 (100.0%) |
Commute Time in Slaughterville
The most frequently occuring commute durations in Slaughterville are 45 to 59 minutes (343 commuters, 21.2%), 30 to 34 minutes (341 commuters, 21.1%), and 15 to 19 minutes (199 commuters, 12.3%).
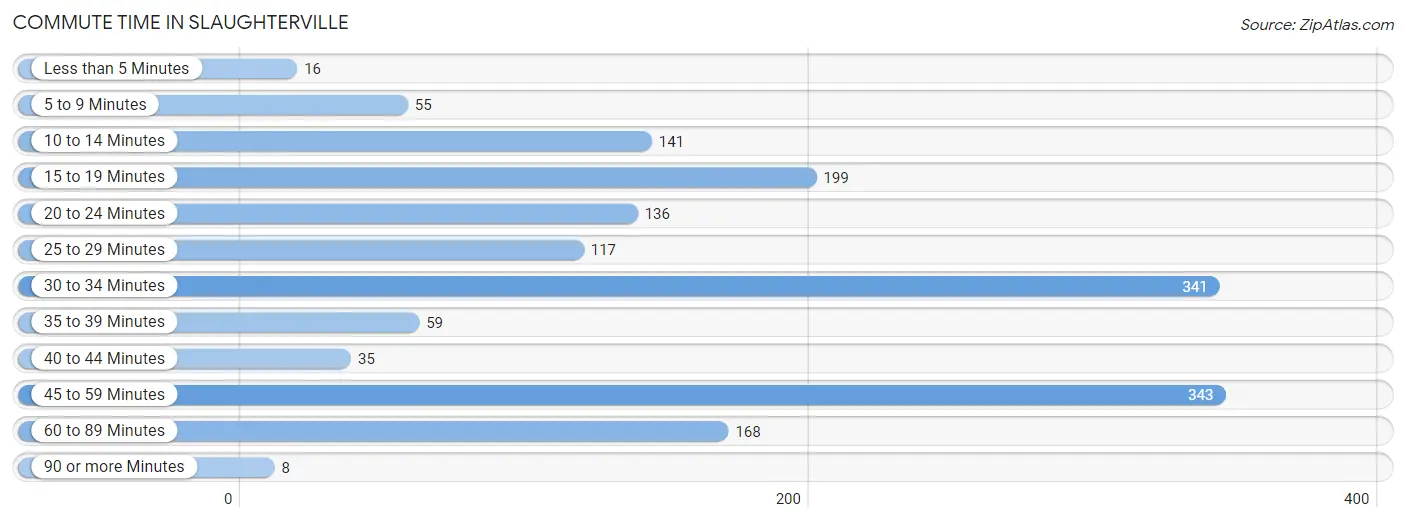
| Commute Time | # Commuters | % Commuters |
| Less than 5 Minutes | 16 | 1.0% |
| 5 to 9 Minutes | 55 | 3.4% |
| 10 to 14 Minutes | 141 | 8.7% |
| 15 to 19 Minutes | 199 | 12.3% |
| 20 to 24 Minutes | 136 | 8.4% |
| 25 to 29 Minutes | 117 | 7.2% |
| 30 to 34 Minutes | 341 | 21.1% |
| 35 to 39 Minutes | 59 | 3.6% |
| 40 to 44 Minutes | 35 | 2.2% |
| 45 to 59 Minutes | 343 | 21.2% |
| 60 to 89 Minutes | 168 | 10.4% |
| 90 or more Minutes | 8 | 0.5% |
Commute Time by Sex in Slaughterville
The most common commute times in Slaughterville are 30 to 34 minutes (216 commuters, 25.7%) for males and 45 to 59 minutes (164 commuters, 21.1%) for females.
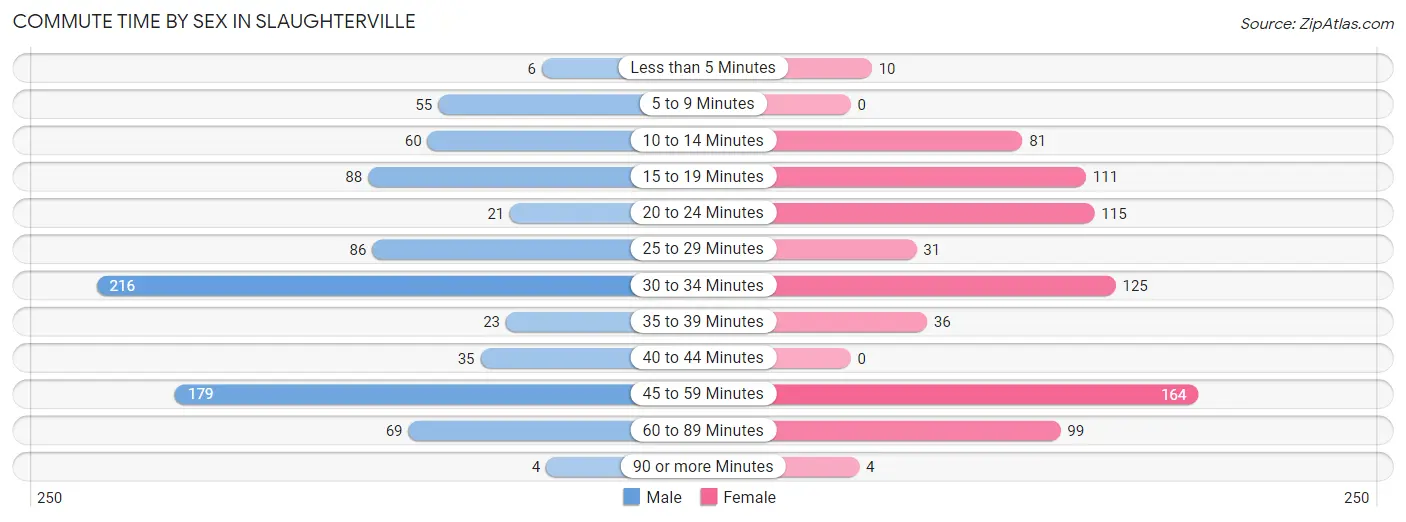
| Commute Time | Male | Female |
| Less than 5 Minutes | 6 (0.7%) | 10 (1.3%) |
| 5 to 9 Minutes | 55 (6.5%) | 0 (0.0%) |
| 10 to 14 Minutes | 60 (7.1%) | 81 (10.4%) |
| 15 to 19 Minutes | 88 (10.4%) | 111 (14.3%) |
| 20 to 24 Minutes | 21 (2.5%) | 115 (14.8%) |
| 25 to 29 Minutes | 86 (10.2%) | 31 (4.0%) |
| 30 to 34 Minutes | 216 (25.7%) | 125 (16.1%) |
| 35 to 39 Minutes | 23 (2.7%) | 36 (4.6%) |
| 40 to 44 Minutes | 35 (4.2%) | 0 (0.0%) |
| 45 to 59 Minutes | 179 (21.3%) | 164 (21.1%) |
| 60 to 89 Minutes | 69 (8.2%) | 99 (12.8%) |
| 90 or more Minutes | 4 (0.5%) | 4 (0.5%) |
Time of Departure to Work by Sex in Slaughterville
The most frequent times of departure to work in Slaughterville are 7:00 AM to 7:29 AM (175, 20.8%) for males and 7:00 AM to 7:29 AM (123, 15.9%) for females.
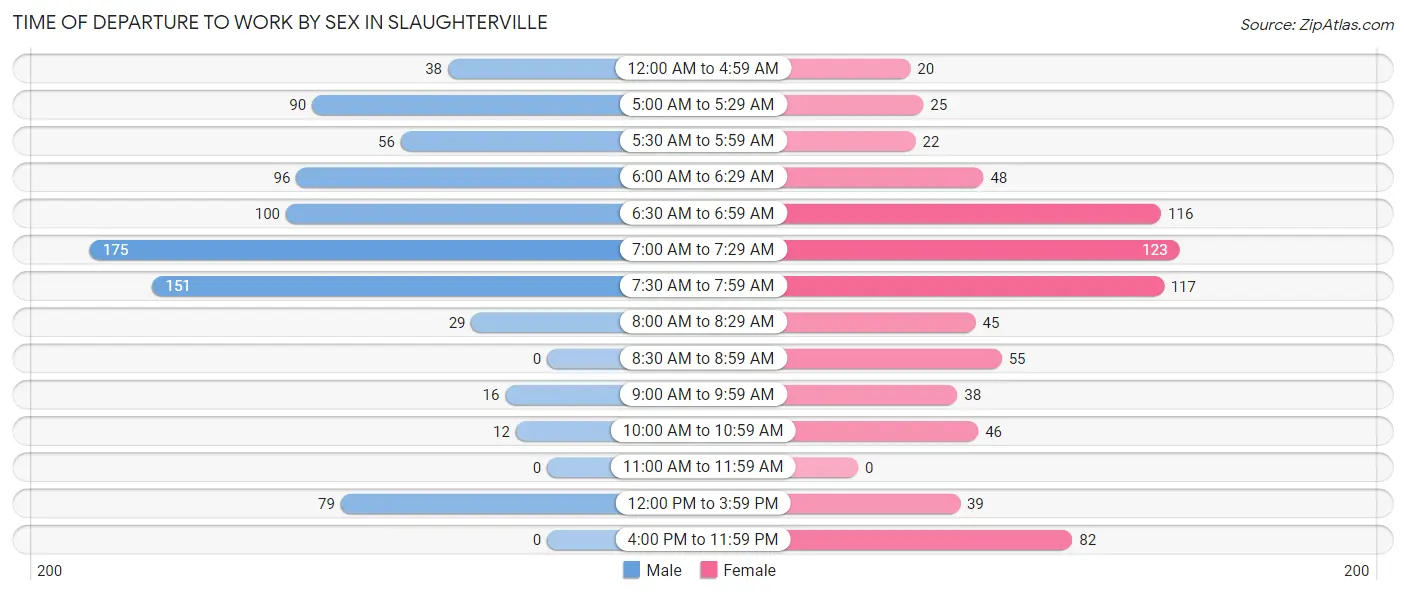
| Time of Departure | Male | Female |
| 12:00 AM to 4:59 AM | 38 (4.5%) | 20 (2.6%) |
| 5:00 AM to 5:29 AM | 90 (10.7%) | 25 (3.2%) |
| 5:30 AM to 5:59 AM | 56 (6.7%) | 22 (2.8%) |
| 6:00 AM to 6:29 AM | 96 (11.4%) | 48 (6.2%) |
| 6:30 AM to 6:59 AM | 100 (11.9%) | 116 (14.9%) |
| 7:00 AM to 7:29 AM | 175 (20.8%) | 123 (15.9%) |
| 7:30 AM to 7:59 AM | 151 (17.9%) | 117 (15.1%) |
| 8:00 AM to 8:29 AM | 29 (3.4%) | 45 (5.8%) |
| 8:30 AM to 8:59 AM | 0 (0.0%) | 55 (7.1%) |
| 9:00 AM to 9:59 AM | 16 (1.9%) | 38 (4.9%) |
| 10:00 AM to 10:59 AM | 12 (1.4%) | 46 (5.9%) |
| 11:00 AM to 11:59 AM | 0 (0.0%) | 0 (0.0%) |
| 12:00 PM to 3:59 PM | 79 (9.4%) | 39 (5.0%) |
| 4:00 PM to 11:59 PM | 0 (0.0%) | 82 (10.6%) |
| Total | 842 (100.0%) | 776 (100.0%) |
Housing Occupancy in Slaughterville
Occupancy by Ownership in Slaughterville
Of the total 1,497 dwellings in Slaughterville, owner-occupied units account for 1,222 (81.6%), while renter-occupied units make up 275 (18.4%).
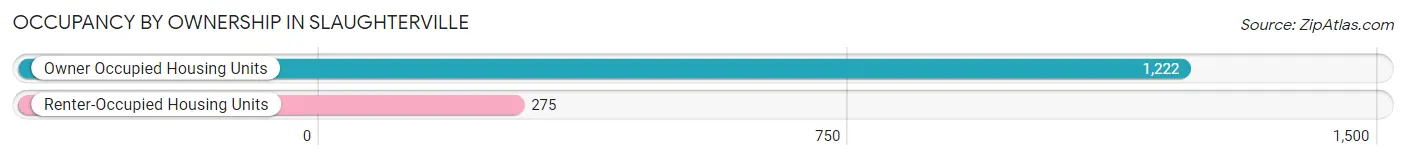
| Occupancy | # Housing Units | % Housing Units |
| Owner Occupied Housing Units | 1,222 | 81.6% |
| Renter-Occupied Housing Units | 275 | 18.4% |
| Total Occupied Housing Units | 1,497 | 100.0% |
Occupancy by Household Size in Slaughterville
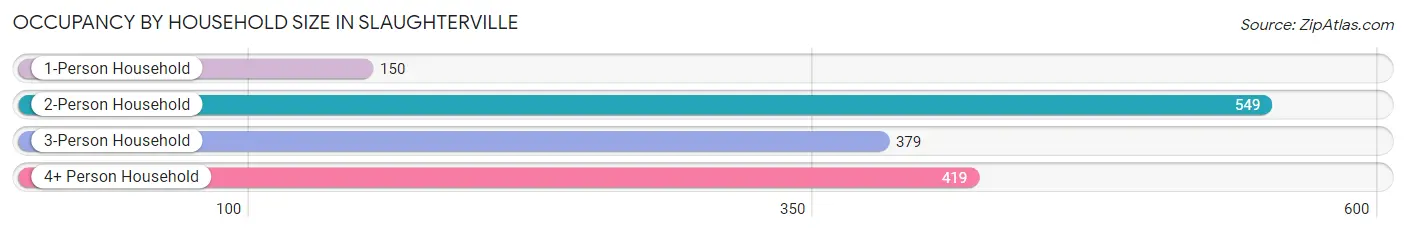
| Household Size | # Housing Units | % Housing Units |
| 1-Person Household | 150 | 10.0% |
| 2-Person Household | 549 | 36.7% |
| 3-Person Household | 379 | 25.3% |
| 4+ Person Household | 419 | 28.0% |
| Total Housing Units | 1,497 | 100.0% |
Occupancy by Ownership by Household Size in Slaughterville
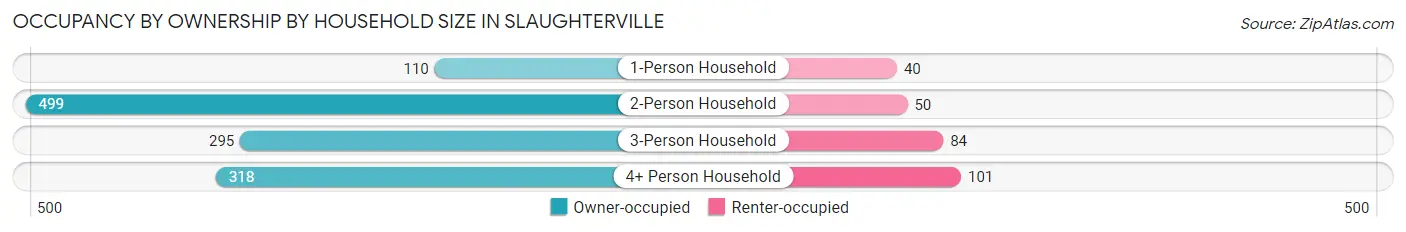
| Household Size | Owner-occupied | Renter-occupied |
| 1-Person Household | 110 (73.3%) | 40 (26.7%) |
| 2-Person Household | 499 (90.9%) | 50 (9.1%) |
| 3-Person Household | 295 (77.8%) | 84 (22.2%) |
| 4+ Person Household | 318 (75.9%) | 101 (24.1%) |
| Total Housing Units | 1,222 (81.6%) | 275 (18.4%) |
Occupancy by Educational Attainment in Slaughterville
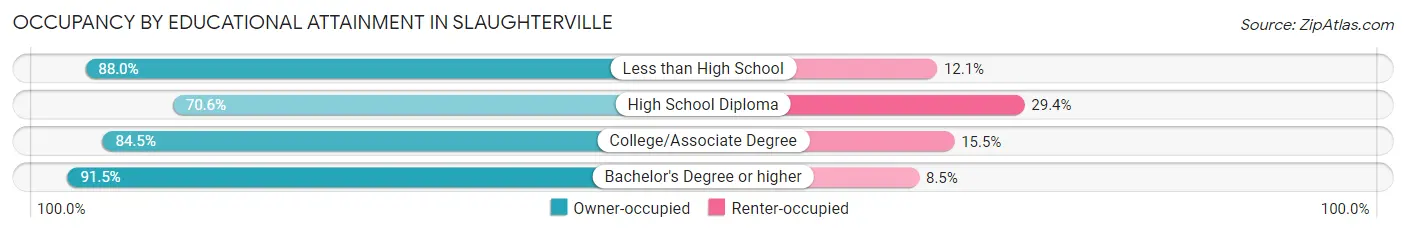
| Household Size | Owner-occupied | Renter-occupied |
| Less than High School | 73 (87.9%) | 10 (12.0%) |
| High School Diploma | 339 (70.6%) | 141 (29.4%) |
| College/Associate Degree | 541 (84.5%) | 99 (15.5%) |
| Bachelor's Degree or higher | 269 (91.5%) | 25 (8.5%) |
Occupancy by Age of Householder in Slaughterville
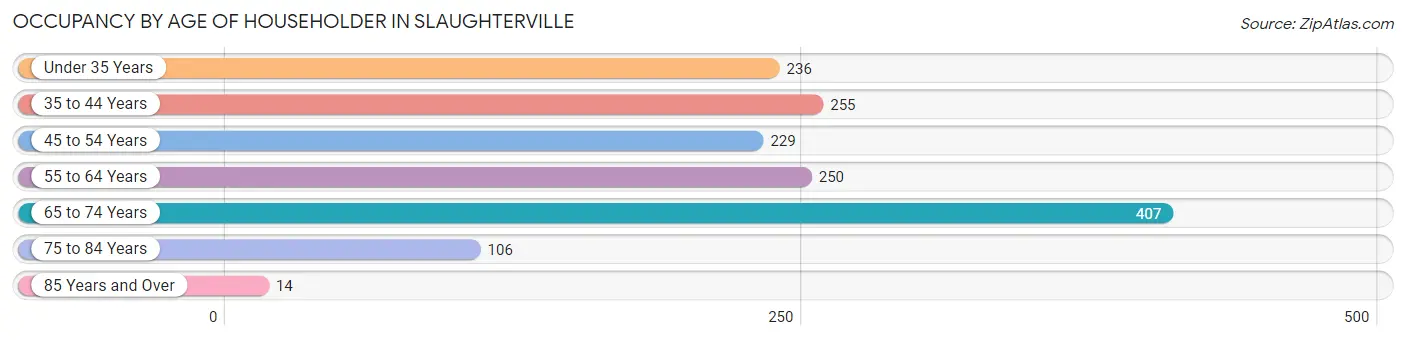
| Age Bracket | # Households | % Households |
| Under 35 Years | 236 | 15.8% |
| 35 to 44 Years | 255 | 17.0% |
| 45 to 54 Years | 229 | 15.3% |
| 55 to 64 Years | 250 | 16.7% |
| 65 to 74 Years | 407 | 27.2% |
| 75 to 84 Years | 106 | 7.1% |
| 85 Years and Over | 14 | 0.9% |
| Total | 1,497 | 100.0% |
Housing Finances in Slaughterville
Median Income by Occupancy in Slaughterville
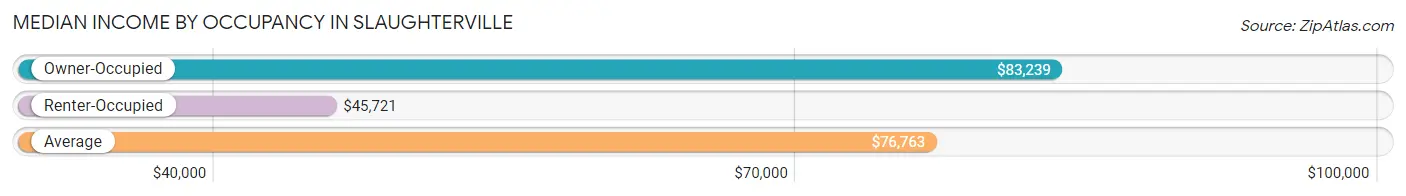
| Occupancy Type | # Households | Median Income |
| Owner-Occupied | 1,222 (81.6%) | $83,239 |
| Renter-Occupied | 275 (18.4%) | $45,721 |
| Average | 1,497 (100.0%) | $76,763 |
Occupancy by Householder Income Bracket in Slaughterville
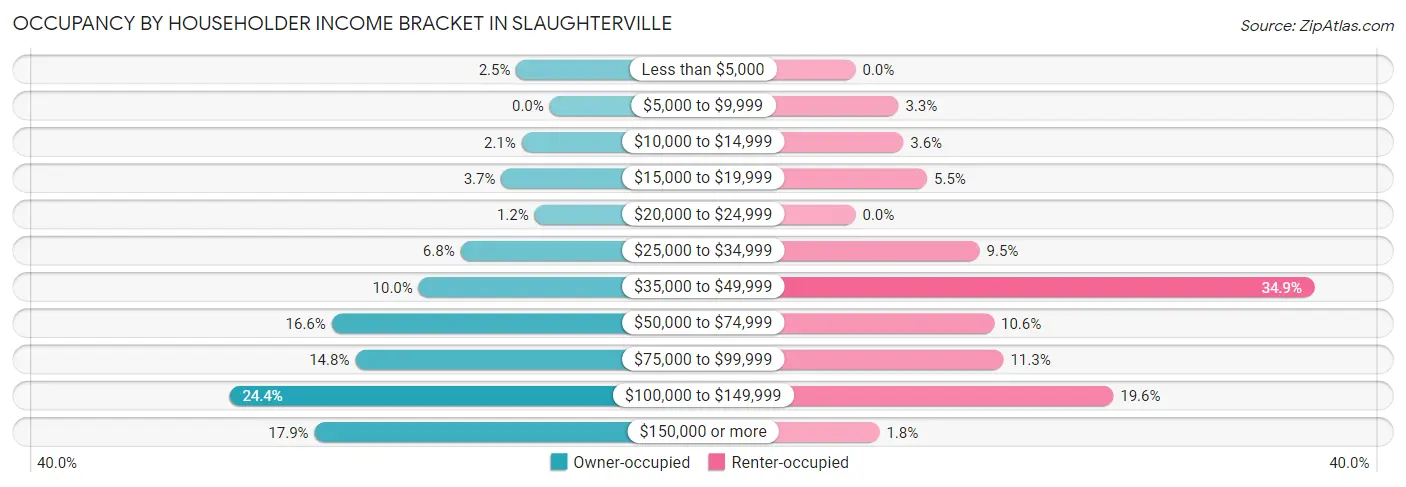
| Income Bracket | Owner-occupied | Renter-occupied |
| Less than $5,000 | 31 (2.5%) | 0 (0.0%) |
| $5,000 to $9,999 | 0 (0.0%) | 9 (3.3%) |
| $10,000 to $14,999 | 26 (2.1%) | 10 (3.6%) |
| $15,000 to $19,999 | 45 (3.7%) | 15 (5.4%) |
| $20,000 to $24,999 | 14 (1.1%) | 0 (0.0%) |
| $25,000 to $34,999 | 83 (6.8%) | 26 (9.5%) |
| $35,000 to $49,999 | 122 (10.0%) | 96 (34.9%) |
| $50,000 to $74,999 | 203 (16.6%) | 29 (10.5%) |
| $75,000 to $99,999 | 181 (14.8%) | 31 (11.3%) |
| $100,000 to $149,999 | 298 (24.4%) | 54 (19.6%) |
| $150,000 or more | 219 (17.9%) | 5 (1.8%) |
| Total | 1,222 (100.0%) | 275 (100.0%) |
Monthly Housing Cost Tiers in Slaughterville
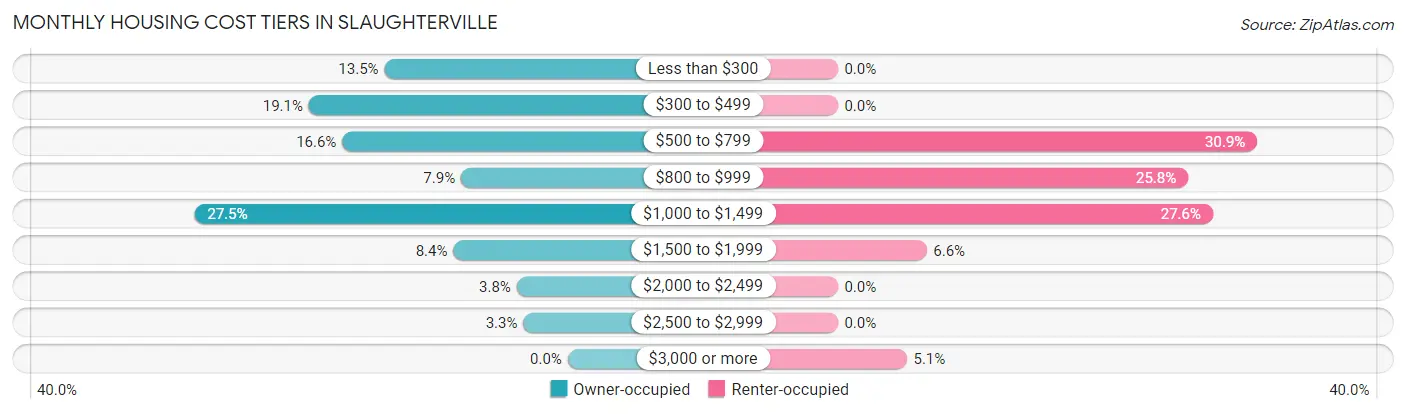
| Monthly Cost | Owner-occupied | Renter-occupied |
| Less than $300 | 165 (13.5%) | 0 (0.0%) |
| $300 to $499 | 233 (19.1%) | 0 (0.0%) |
| $500 to $799 | 203 (16.6%) | 85 (30.9%) |
| $800 to $999 | 96 (7.9%) | 71 (25.8%) |
| $1,000 to $1,499 | 336 (27.5%) | 76 (27.6%) |
| $1,500 to $1,999 | 103 (8.4%) | 18 (6.6%) |
| $2,000 to $2,499 | 46 (3.8%) | 0 (0.0%) |
| $2,500 to $2,999 | 40 (3.3%) | 0 (0.0%) |
| $3,000 or more | 0 (0.0%) | 14 (5.1%) |
| Total | 1,222 (100.0%) | 275 (100.0%) |
Physical Housing Characteristics in Slaughterville
Housing Structures in Slaughterville
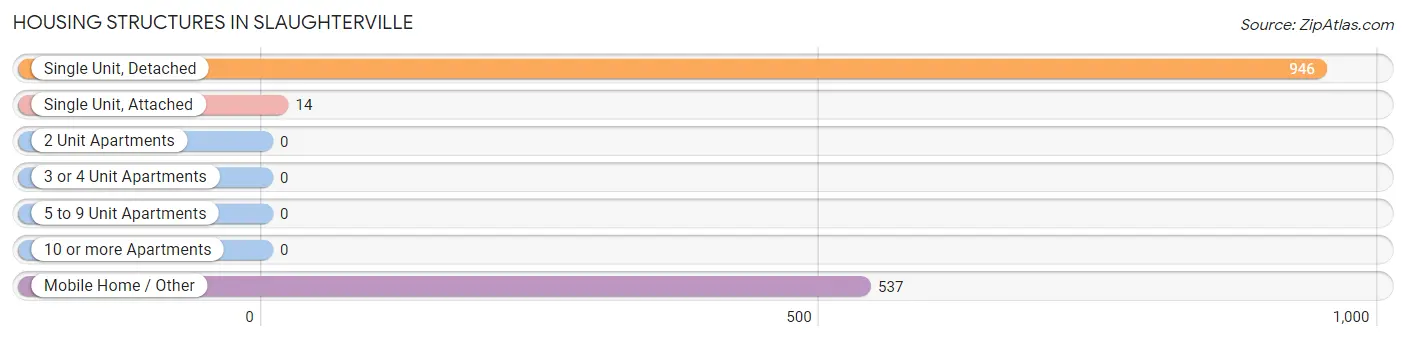
| Structure Type | # Housing Units | % Housing Units |
| Single Unit, Detached | 946 | 63.2% |
| Single Unit, Attached | 14 | 0.9% |
| 2 Unit Apartments | 0 | 0.0% |
| 3 or 4 Unit Apartments | 0 | 0.0% |
| 5 to 9 Unit Apartments | 0 | 0.0% |
| 10 or more Apartments | 0 | 0.0% |
| Mobile Home / Other | 537 | 35.9% |
| Total | 1,497 | 100.0% |
Housing Structures by Occupancy in Slaughterville
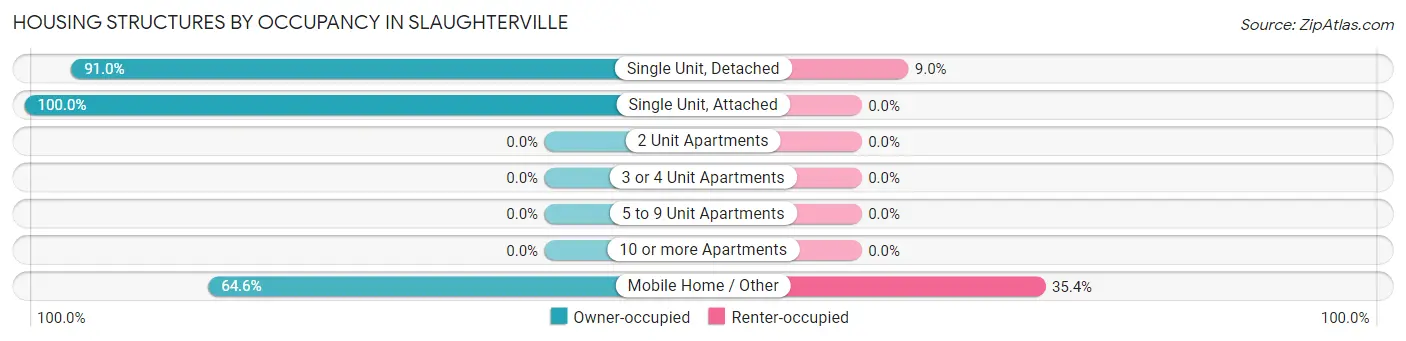
| Structure Type | Owner-occupied | Renter-occupied |
| Single Unit, Detached | 861 (91.0%) | 85 (9.0%) |
| Single Unit, Attached | 14 (100.0%) | 0 (0.0%) |
| 2 Unit Apartments | 0 (0.0%) | 0 (0.0%) |
| 3 or 4 Unit Apartments | 0 (0.0%) | 0 (0.0%) |
| 5 to 9 Unit Apartments | 0 (0.0%) | 0 (0.0%) |
| 10 or more Apartments | 0 (0.0%) | 0 (0.0%) |
| Mobile Home / Other | 347 (64.6%) | 190 (35.4%) |
| Total | 1,222 (81.6%) | 275 (18.4%) |
Housing Structures by Number of Rooms in Slaughterville
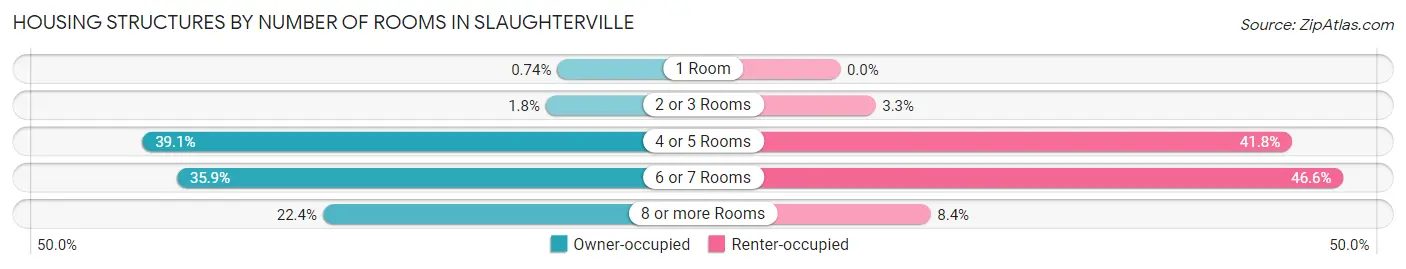
| Number of Rooms | Owner-occupied | Renter-occupied |
| 1 Room | 9 (0.7%) | 0 (0.0%) |
| 2 or 3 Rooms | 22 (1.8%) | 9 (3.3%) |
| 4 or 5 Rooms | 478 (39.1%) | 115 (41.8%) |
| 6 or 7 Rooms | 439 (35.9%) | 128 (46.6%) |
| 8 or more Rooms | 274 (22.4%) | 23 (8.4%) |
| Total | 1,222 (100.0%) | 275 (100.0%) |
Housing Structure by Heating Type in Slaughterville
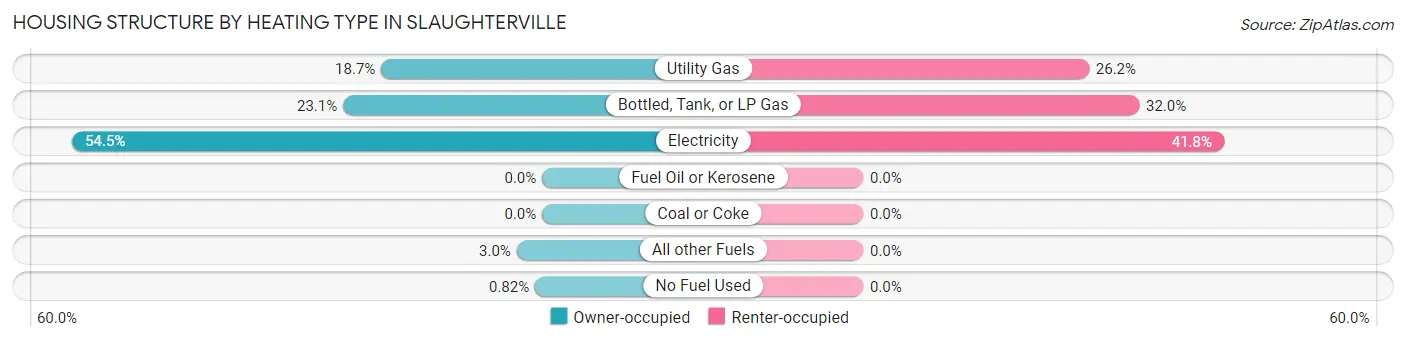
| Heating Type | Owner-occupied | Renter-occupied |
| Utility Gas | 228 (18.7%) | 72 (26.2%) |
| Bottled, Tank, or LP Gas | 282 (23.1%) | 88 (32.0%) |
| Electricity | 666 (54.5%) | 115 (41.8%) |
| Fuel Oil or Kerosene | 0 (0.0%) | 0 (0.0%) |
| Coal or Coke | 0 (0.0%) | 0 (0.0%) |
| All other Fuels | 36 (2.9%) | 0 (0.0%) |
| No Fuel Used | 10 (0.8%) | 0 (0.0%) |
| Total | 1,222 (100.0%) | 275 (100.0%) |
Household Vehicle Usage in Slaughterville
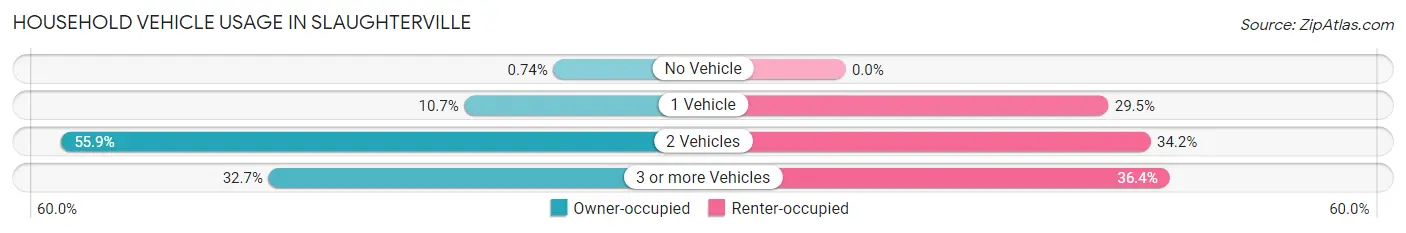
| Vehicles per Household | Owner-occupied | Renter-occupied |
| No Vehicle | 9 (0.7%) | 0 (0.0%) |
| 1 Vehicle | 131 (10.7%) | 81 (29.4%) |
| 2 Vehicles | 683 (55.9%) | 94 (34.2%) |
| 3 or more Vehicles | 399 (32.7%) | 100 (36.4%) |
| Total | 1,222 (100.0%) | 275 (100.0%) |
Real Estate & Mortgages in Slaughterville
Real Estate and Mortgage Overview in Slaughterville
| Characteristic | Without Mortgage | With Mortgage |
| Housing Units | 529 | 693 |
| Median Property Value | $164,100 | $181,300 |
| Median Household Income | $76,992 | $97 |
| Monthly Housing Costs | $444 | $0 |
| Real Estate Taxes | $580 | $48 |
Property Value by Mortgage Status in Slaughterville
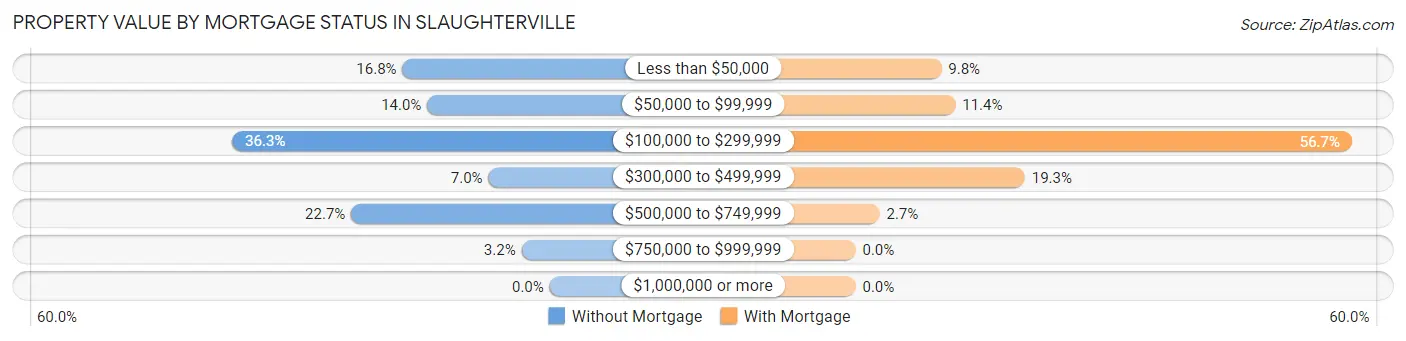
| Property Value | Without Mortgage | With Mortgage |
| Less than $50,000 | 89 (16.8%) | 68 (9.8%) |
| $50,000 to $99,999 | 74 (14.0%) | 79 (11.4%) |
| $100,000 to $299,999 | 192 (36.3%) | 393 (56.7%) |
| $300,000 to $499,999 | 37 (7.0%) | 134 (19.3%) |
| $500,000 to $749,999 | 120 (22.7%) | 19 (2.7%) |
| $750,000 to $999,999 | 17 (3.2%) | 0 (0.0%) |
| $1,000,000 or more | 0 (0.0%) | 0 (0.0%) |
| Total | 529 (100.0%) | 693 (100.0%) |
Household Income by Mortgage Status in Slaughterville
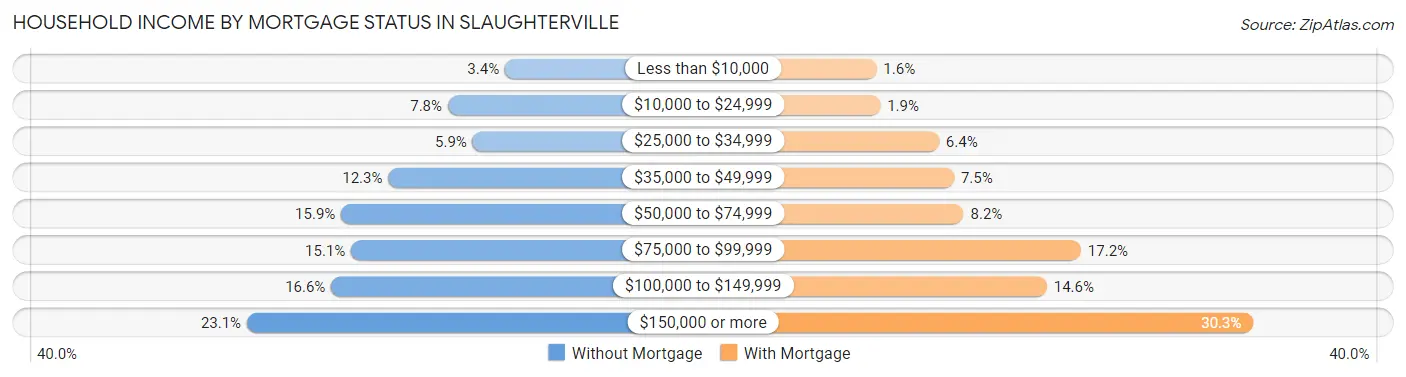
| Household Income | Without Mortgage | With Mortgage |
| Less than $10,000 | 18 (3.4%) | 11 (1.6%) |
| $10,000 to $24,999 | 41 (7.7%) | 13 (1.9%) |
| $25,000 to $34,999 | 31 (5.9%) | 44 (6.4%) |
| $35,000 to $49,999 | 65 (12.3%) | 52 (7.5%) |
| $50,000 to $74,999 | 84 (15.9%) | 57 (8.2%) |
| $75,000 to $99,999 | 80 (15.1%) | 119 (17.2%) |
| $100,000 to $149,999 | 88 (16.6%) | 101 (14.6%) |
| $150,000 or more | 122 (23.1%) | 210 (30.3%) |
| Total | 529 (100.0%) | 693 (100.0%) |
Property Value to Household Income Ratio in Slaughterville
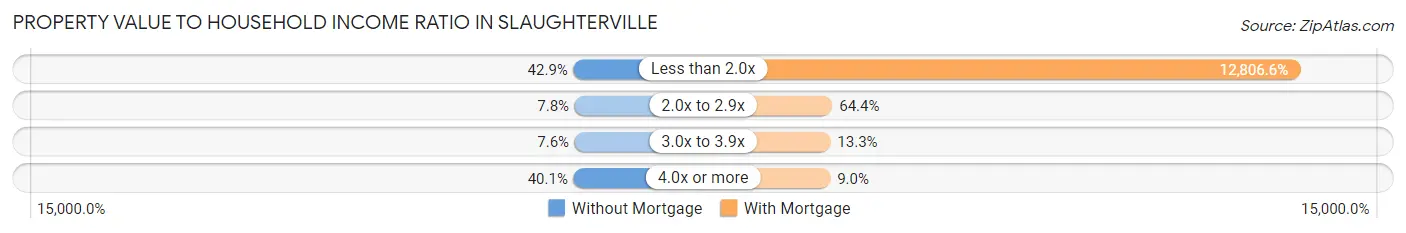
| Value-to-Income Ratio | Without Mortgage | With Mortgage |
| Less than 2.0x | 227 (42.9%) | 88,750 (12,806.6%) |
| 2.0x to 2.9x | 41 (7.7%) | 446 (64.4%) |
| 3.0x to 3.9x | 40 (7.6%) | 92 (13.3%) |
| 4.0x or more | 212 (40.1%) | 62 (8.9%) |
| Total | 529 (100.0%) | 693 (100.0%) |
Real Estate Taxes by Mortgage Status in Slaughterville
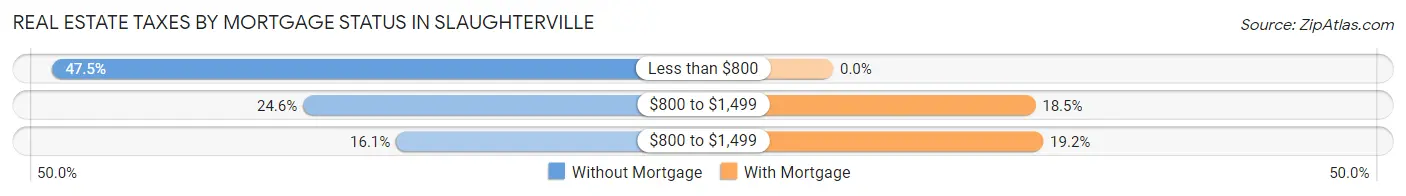
| Property Taxes | Without Mortgage | With Mortgage |
| Less than $800 | 251 (47.4%) | 0 (0.0%) |
| $800 to $1,499 | 130 (24.6%) | 128 (18.5%) |
| $800 to $1,499 | 85 (16.1%) | 133 (19.2%) |
| Total | 529 (100.0%) | 693 (100.0%) |
Health & Disability in Slaughterville
Health Insurance Coverage by Age in Slaughterville
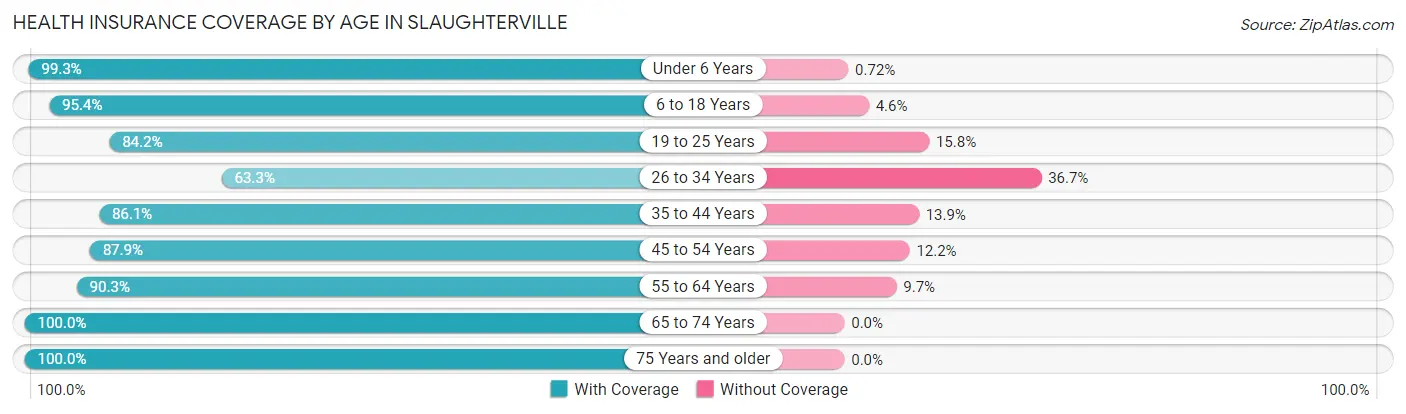
| Age Bracket | With Coverage | Without Coverage |
| Under 6 Years | 277 (99.3%) | 2 (0.7%) |
| 6 to 18 Years | 858 (95.4%) | 41 (4.6%) |
| 19 to 25 Years | 176 (84.2%) | 33 (15.8%) |
| 26 to 34 Years | 274 (63.3%) | 159 (36.7%) |
| 35 to 44 Years | 509 (86.1%) | 82 (13.9%) |
| 45 to 54 Years | 477 (87.8%) | 66 (12.1%) |
| 55 to 64 Years | 437 (90.3%) | 47 (9.7%) |
| 65 to 74 Years | 576 (100.0%) | 0 (0.0%) |
| 75 Years and older | 173 (100.0%) | 0 (0.0%) |
| Total | 3,757 (89.7%) | 430 (10.3%) |
Health Insurance Coverage by Citizenship Status in Slaughterville
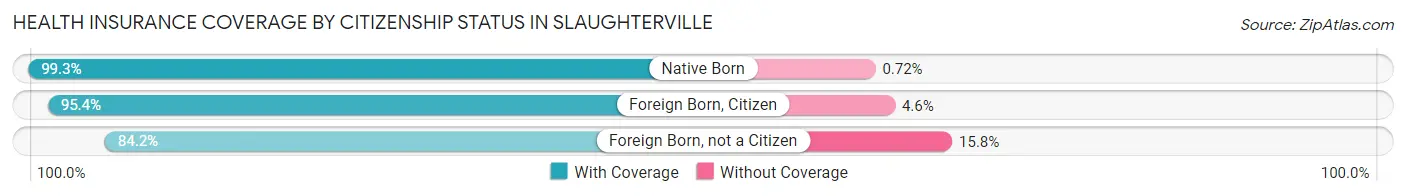
| Citizenship Status | With Coverage | Without Coverage |
| Native Born | 277 (99.3%) | 2 (0.7%) |
| Foreign Born, Citizen | 858 (95.4%) | 41 (4.6%) |
| Foreign Born, not a Citizen | 176 (84.2%) | 33 (15.8%) |
Health Insurance Coverage by Household Income in Slaughterville
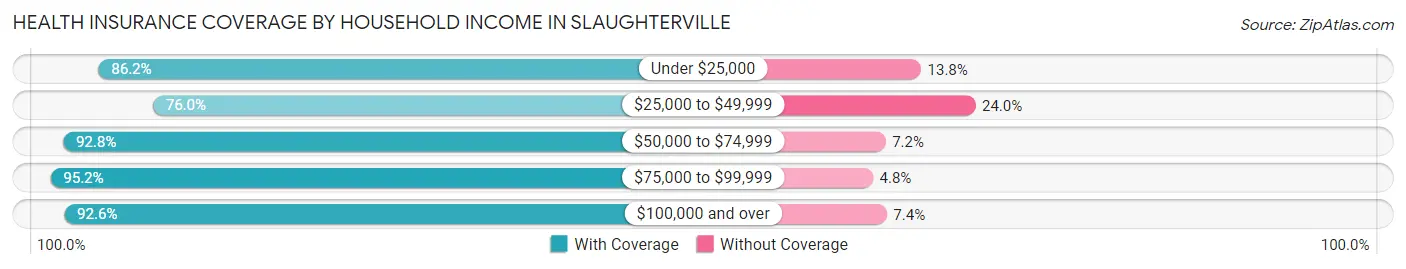
| Household Income | With Coverage | Without Coverage |
| Under $25,000 | 299 (86.2%) | 48 (13.8%) |
| $25,000 to $49,999 | 541 (76.0%) | 171 (24.0%) |
| $50,000 to $74,999 | 761 (92.8%) | 59 (7.2%) |
| $75,000 to $99,999 | 709 (95.2%) | 36 (4.8%) |
| $100,000 and over | 1,447 (92.6%) | 116 (7.4%) |
Public vs Private Health Insurance Coverage by Age in Slaughterville
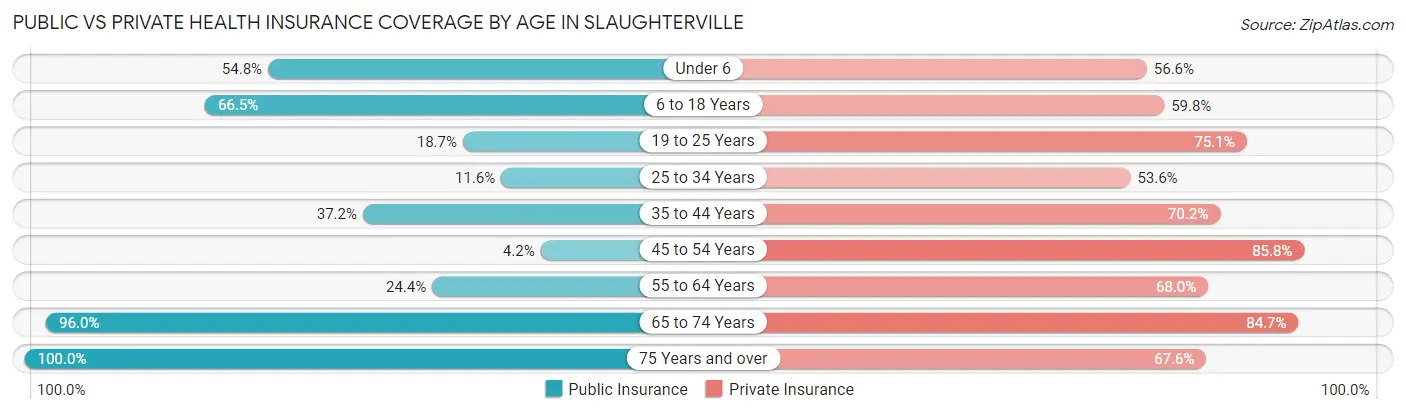
| Age Bracket | Public Insurance | Private Insurance |
| Under 6 | 153 (54.8%) | 158 (56.6%) |
| 6 to 18 Years | 598 (66.5%) | 538 (59.8%) |
| 19 to 25 Years | 39 (18.7%) | 157 (75.1%) |
| 25 to 34 Years | 50 (11.6%) | 232 (53.6%) |
| 35 to 44 Years | 220 (37.2%) | 415 (70.2%) |
| 45 to 54 Years | 23 (4.2%) | 466 (85.8%) |
| 55 to 64 Years | 118 (24.4%) | 329 (68.0%) |
| 65 to 74 Years | 553 (96.0%) | 488 (84.7%) |
| 75 Years and over | 173 (100.0%) | 117 (67.6%) |
| Total | 1,927 (46.0%) | 2,900 (69.3%) |
Disability Status by Sex by Age in Slaughterville
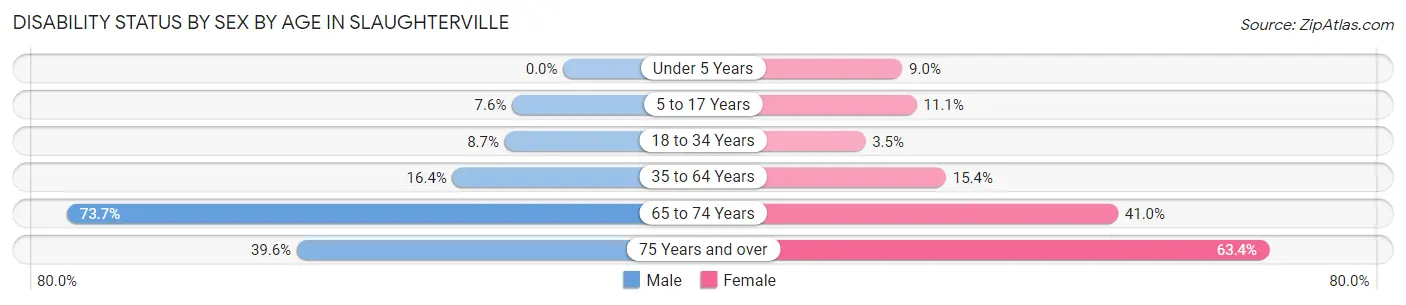
| Age Bracket | Male | Female |
| Under 5 Years | 0 (0.0%) | 12 (9.0%) |
| 5 to 17 Years | 36 (7.6%) | 46 (11.1%) |
| 18 to 34 Years | 30 (8.7%) | 12 (3.5%) |
| 35 to 64 Years | 134 (16.4%) | 124 (15.4%) |
| 65 to 74 Years | 261 (73.7%) | 91 (41.0%) |
| 75 Years and over | 36 (39.6%) | 52 (63.4%) |
Disability Class by Sex by Age in Slaughterville
Disability Class: Hearing Difficulty
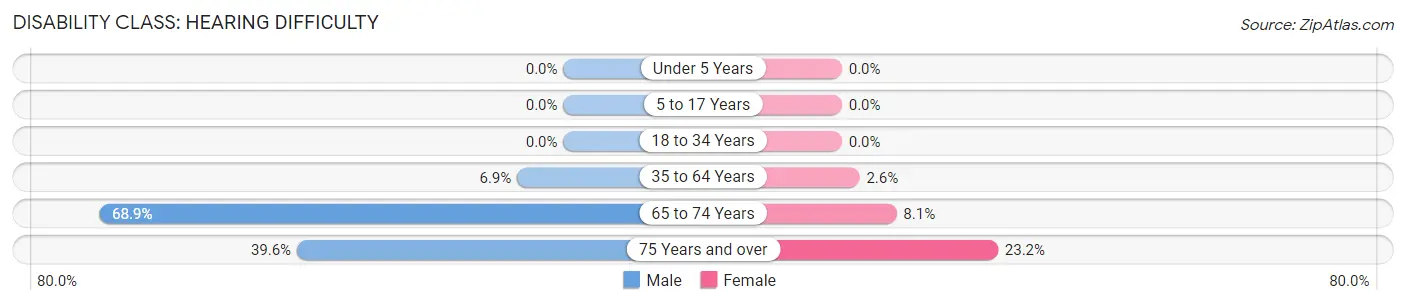
| Age Bracket | Male | Female |
| Under 5 Years | 0 (0.0%) | 0 (0.0%) |
| 5 to 17 Years | 0 (0.0%) | 0 (0.0%) |
| 18 to 34 Years | 0 (0.0%) | 0 (0.0%) |
| 35 to 64 Years | 56 (6.9%) | 21 (2.6%) |
| 65 to 74 Years | 244 (68.9%) | 18 (8.1%) |
| 75 Years and over | 36 (39.6%) | 19 (23.2%) |
Disability Class: Vision Difficulty
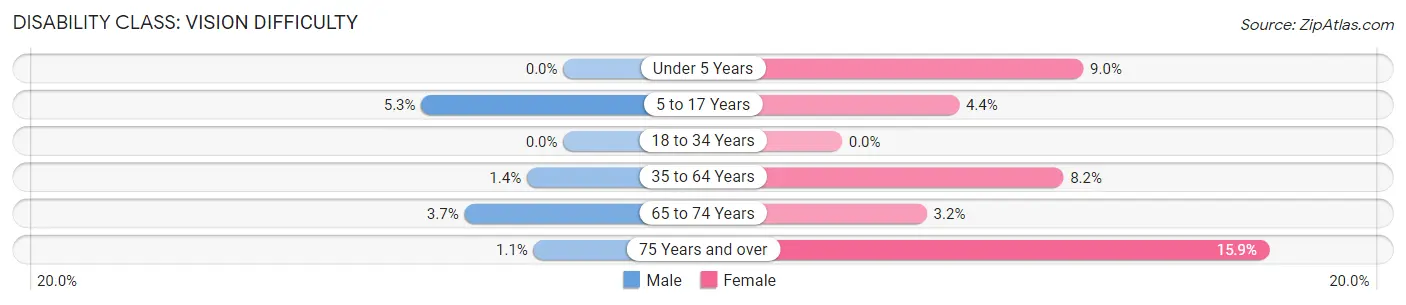
| Age Bracket | Male | Female |
| Under 5 Years | 0 (0.0%) | 12 (9.0%) |
| 5 to 17 Years | 25 (5.3%) | 18 (4.3%) |
| 18 to 34 Years | 0 (0.0%) | 0 (0.0%) |
| 35 to 64 Years | 11 (1.3%) | 66 (8.2%) |
| 65 to 74 Years | 13 (3.7%) | 7 (3.2%) |
| 75 Years and over | 1 (1.1%) | 13 (15.9%) |
Disability Class: Cognitive Difficulty
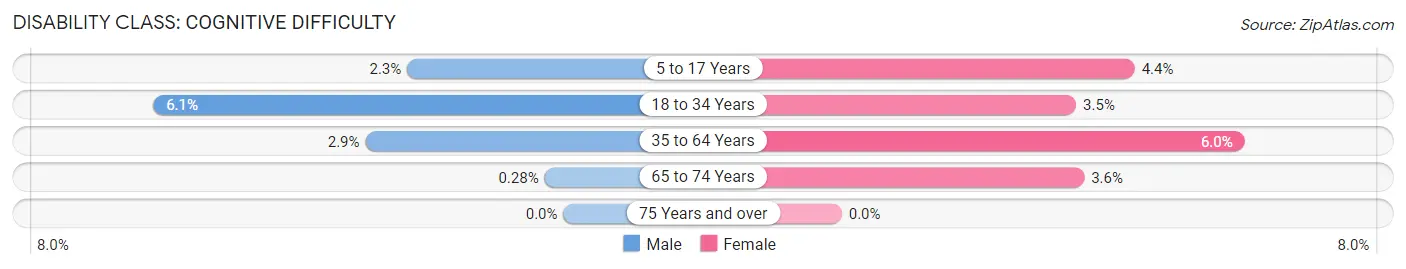
| Age Bracket | Male | Female |
| 5 to 17 Years | 11 (2.3%) | 18 (4.3%) |
| 18 to 34 Years | 21 (6.1%) | 12 (3.5%) |
| 35 to 64 Years | 24 (2.9%) | 48 (6.0%) |
| 65 to 74 Years | 1 (0.3%) | 8 (3.6%) |
| 75 Years and over | 0 (0.0%) | 0 (0.0%) |
Disability Class: Ambulatory Difficulty
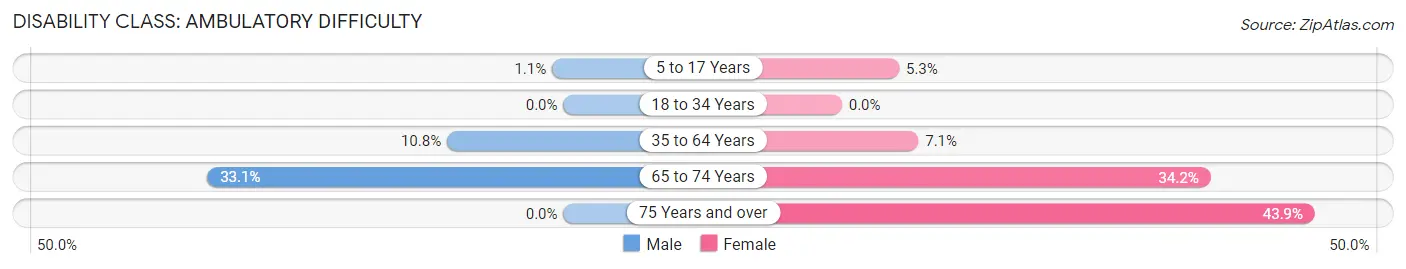
| Age Bracket | Male | Female |
| 5 to 17 Years | 5 (1.1%) | 22 (5.3%) |
| 18 to 34 Years | 0 (0.0%) | 0 (0.0%) |
| 35 to 64 Years | 88 (10.8%) | 57 (7.1%) |
| 65 to 74 Years | 117 (33.1%) | 76 (34.2%) |
| 75 Years and over | 0 (0.0%) | 36 (43.9%) |
Disability Class: Self-Care Difficulty
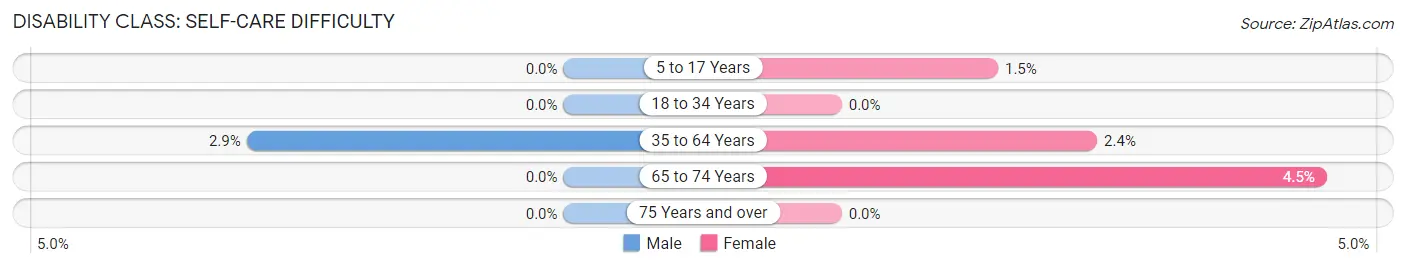
| Age Bracket | Male | Female |
| 5 to 17 Years | 0 (0.0%) | 6 (1.5%) |
| 18 to 34 Years | 0 (0.0%) | 0 (0.0%) |
| 35 to 64 Years | 24 (2.9%) | 19 (2.4%) |
| 65 to 74 Years | 0 (0.0%) | 10 (4.5%) |
| 75 Years and over | 0 (0.0%) | 0 (0.0%) |
Technology Access in Slaughterville
Computing Device Access in Slaughterville
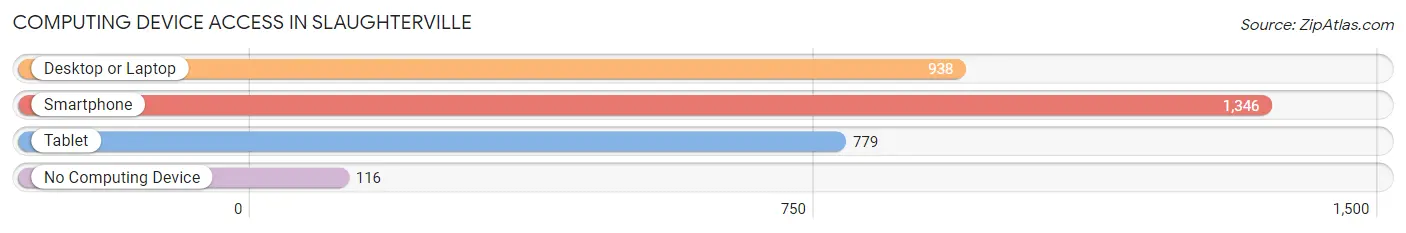
| Device Type | # Households | % Households |
| Desktop or Laptop | 938 | 62.7% |
| Smartphone | 1,346 | 89.9% |
| Tablet | 779 | 52.0% |
| No Computing Device | 116 | 7.7% |
| Total | 1,497 | 100.0% |
Internet Access in Slaughterville
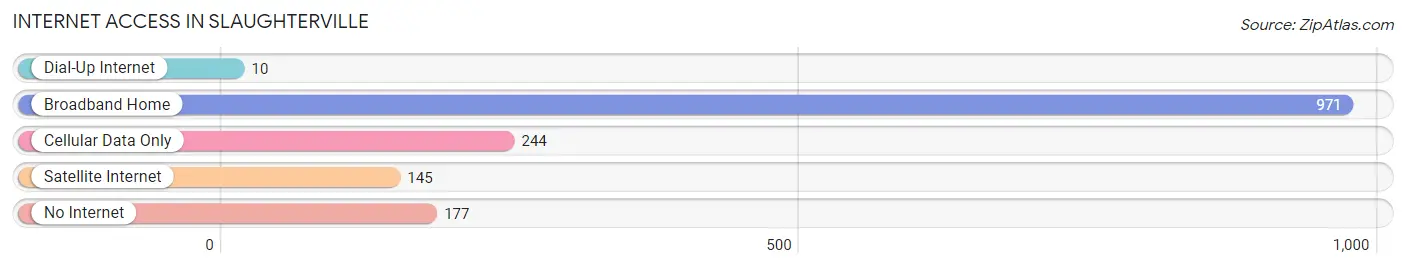
| Internet Type | # Households | % Households |
| Dial-Up Internet | 10 | 0.7% |
| Broadband Home | 971 | 64.9% |
| Cellular Data Only | 244 | 16.3% |
| Satellite Internet | 145 | 9.7% |
| No Internet | 177 | 11.8% |
| Total | 1,497 | 100.0% |
Slaughterville Summary
Slaughterville is a small town located in Cleveland County, Oklahoma. It is situated about 20 miles south of Oklahoma City and is part of the Oklahoma City metropolitan area. The town was founded in 1891 and was named after the Slaughter family, who were early settlers in the area. As of the 2010 census, the population of Slaughterville was 1,541.
Geography
Slaughterville is located at 35°25'25"N 97°25'45"W. It is situated in the rolling hills of central Oklahoma, about 20 miles south of Oklahoma City. The town is located in the Cross Timbers region of the state, which is characterized by its oak-hickory forests and tallgrass prairies. The town is situated on the banks of the South Canadian River, which flows through the area.
The climate in Slaughterville is characterized by hot, humid summers and mild winters. The average annual temperature is around 63°F, with an average high of around 90°F in the summer and an average low of around 40°F in the winter. The average annual precipitation is around 40 inches.
Economy
The economy of Slaughterville is largely based on agriculture. The town is home to several large farms, which produce a variety of crops, including wheat, corn, soybeans, and cotton. The town is also home to several small businesses, including a grocery store, a hardware store, and a few restaurants.
Demographics
As of the 2010 census, the population of Slaughterville was 1,541. The racial makeup of the town was 94.3% White, 0.7% African American, 0.7% Native American, 0.3% Asian, 0.1% Pacific Islander, and 3.0% from other races. The median household income was $41,250, and the median family income was $48,750. The per capita income was $19,945.
The town is served by the Slaughterville Public School District, which consists of one elementary school, one middle school, and one high school. The town is also home to several churches, including the First Baptist Church, the First United Methodist Church, and the Church of Christ.
Conclusion
Slaughterville is a small town located in Cleveland County, Oklahoma. It is situated about 20 miles south of Oklahoma City and is part of the Oklahoma City metropolitan area. The town was founded in 1891 and was named after the Slaughter family, who were early settlers in the area. The economy of Slaughterville is largely based on agriculture, and the town is home to several small businesses. As of the 2010 census, the population of Slaughterville was 1,541. The town is served by the Slaughterville Public School District, and is home to several churches.
Common Questions
What is Per Capita Income in Slaughterville?
Per Capita income in Slaughterville is $31,615.
What is the Median Family Income in Slaughterville?
Median Family Income in Slaughterville is $83,218.
What is the Median Household income in Slaughterville?
Median Household Income in Slaughterville is $76,763.
What is Income or Wage Gap in Slaughterville?
Income or Wage Gap in Slaughterville is 31.5%.
Women in Slaughterville earn 68.5 cents for every dollar earned by a man.
What is Family Income Deficit in Slaughterville?
Family Income Deficit in Slaughterville is $12,606.
Families that are below poverty line in Slaughterville earn $12,606 less on average than the poverty threshold level.
What is Inequality or Gini Index in Slaughterville?
Inequality or Gini Index in Slaughterville is 0.40.
What is the Total Population of Slaughterville?
Total Population of Slaughterville is 4,187.
What is the Total Male Population of Slaughterville?
Total Male Population of Slaughterville is 2,187.
What is the Total Female Population of Slaughterville?
Total Female Population of Slaughterville is 2,000.
What is the Ratio of Males per 100 Females in Slaughterville?
There are 109.35 Males per 100 Females in Slaughterville.
What is the Ratio of Females per 100 Males in Slaughterville?
There are 91.45 Females per 100 Males in Slaughterville.
What is the Median Population Age in Slaughterville?
Median Population Age in Slaughterville is 39.2 Years.
What is the Average Family Size in Slaughterville
Average Family Size in Slaughterville is 2.9 People.
What is the Average Household Size in Slaughterville
Average Household Size in Slaughterville is 2.8 People.
How Large is the Labor Force in Slaughterville?
There are 1,810 People in the Labor Forcein in Slaughterville.
What is the Percentage of People in the Labor Force in Slaughterville?
55.6% of People are in the Labor Force in Slaughterville.
What is the Unemployment Rate in Slaughterville?
Unemployment Rate in Slaughterville is 5.0%.