Skiatook, OK Map & Demographics
Skiatook Map
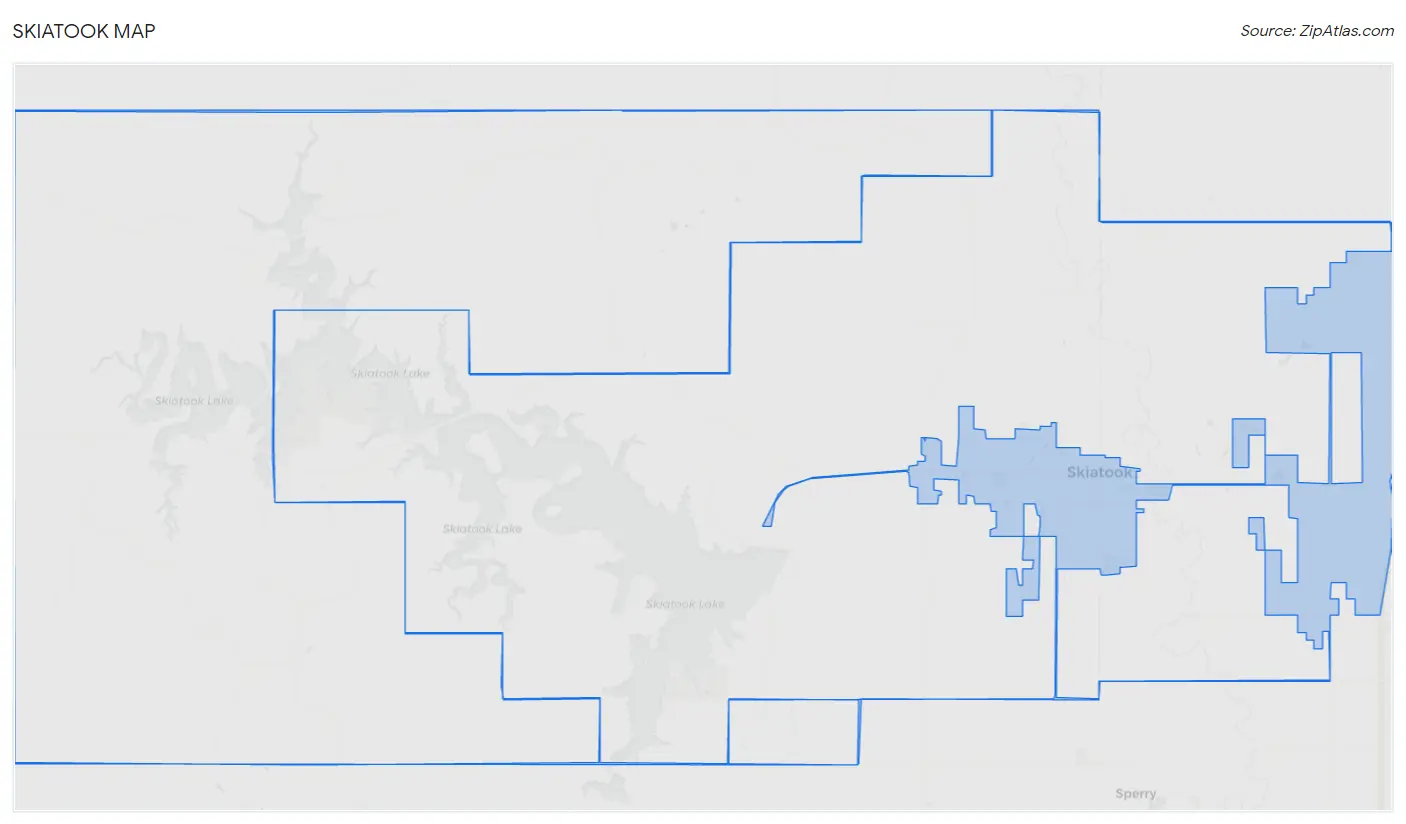
Skiatook Overview
$27,637
PER CAPITA INCOME
$70,844
AVG FAMILY INCOME
$54,444
AVG HOUSEHOLD INCOME
22.7%
WAGE / INCOME GAP [ % ]
77.3¢/ $1
WAGE / INCOME GAP [ $ ]
0.42
INEQUALITY / GINI INDEX
8,463
TOTAL POPULATION
4,053
MALE POPULATION
4,410
FEMALE POPULATION
91.90
MALES / 100 FEMALES
108.81
FEMALES / 100 MALES
36.6
MEDIAN AGE
3.3
AVG FAMILY SIZE
2.7
AVG HOUSEHOLD SIZE
4,152
LABOR FORCE [ PEOPLE ]
63.8%
PERCENT IN LABOR FORCE
5.0%
UNEMPLOYMENT RATE
Skiatook Zip Codes
Skiatook Area Codes
Income in Skiatook
Income Overview in Skiatook
Per Capita Income in Skiatook is $27,637, while median incomes of families and households are $70,844 and $54,444 respectively.
| Characteristic | Number | Measure |
| Per Capita Income | 8,463 | $27,637 |
| Median Family Income | 2,093 | $70,844 |
| Mean Family Income | 2,093 | $85,948 |
| Median Household Income | 3,108 | $54,444 |
| Mean Household Income | 3,108 | $72,748 |
| Income Deficit | 2,093 | $0 |
| Wage / Income Gap (%) | 8,463 | 22.66% |
| Wage / Income Gap ($) | 8,463 | 77.34¢ per $1 |
| Gini / Inequality Index | 8,463 | 0.42 |
Earnings by Sex in Skiatook
Average Earnings in Skiatook are $33,430, $40,399 for men and $31,243 for women, a difference of 22.7%.
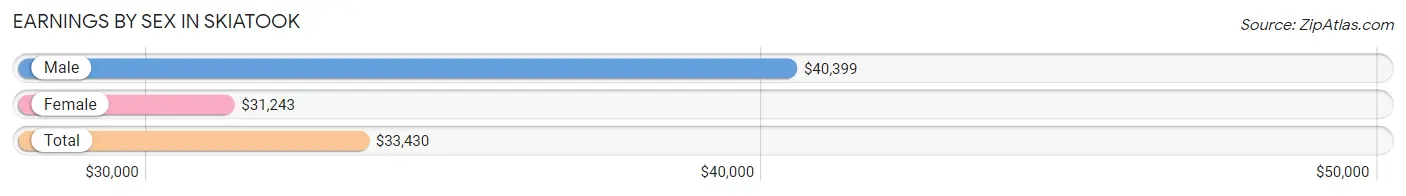
| Sex | Number | Average Earnings |
| Male | 2,221 (50.5%) | $40,399 |
| Female | 2,179 (49.5%) | $31,243 |
| Total | 4,400 (100.0%) | $33,430 |
Earnings by Sex by Income Bracket in Skiatook
The most common earnings brackets in Skiatook are $100,000+ for men (233 | 10.5%) and $30,000 to $34,999 for women (390 | 17.9%).
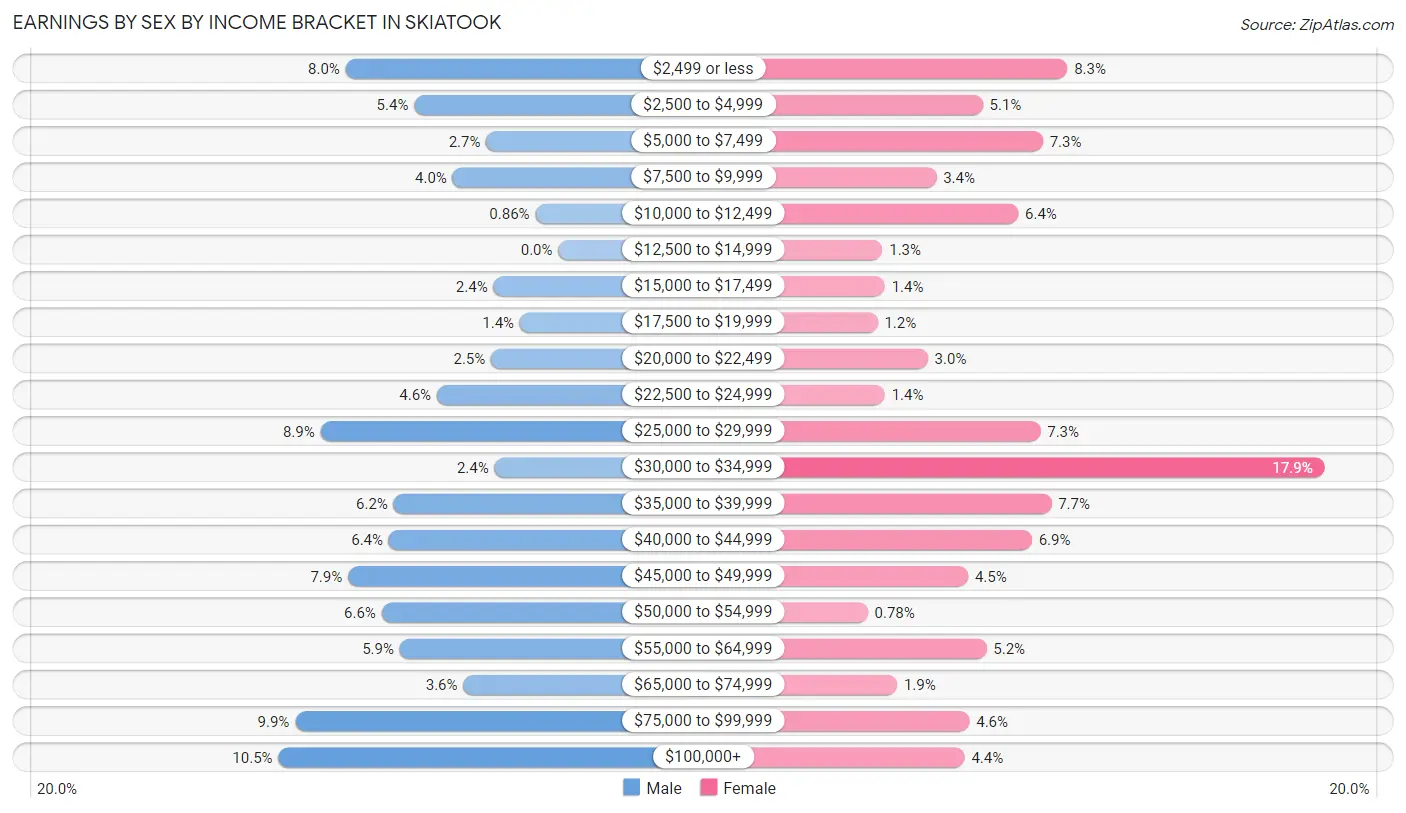
| Income | Male | Female |
| $2,499 or less | 177 (8.0%) | 180 (8.3%) |
| $2,500 to $4,999 | 120 (5.4%) | 111 (5.1%) |
| $5,000 to $7,499 | 60 (2.7%) | 160 (7.3%) |
| $7,500 to $9,999 | 88 (4.0%) | 73 (3.4%) |
| $10,000 to $12,499 | 19 (0.9%) | 140 (6.4%) |
| $12,500 to $14,999 | 0 (0.0%) | 29 (1.3%) |
| $15,000 to $17,499 | 54 (2.4%) | 31 (1.4%) |
| $17,500 to $19,999 | 32 (1.4%) | 25 (1.1%) |
| $20,000 to $22,499 | 56 (2.5%) | 66 (3.0%) |
| $22,500 to $24,999 | 101 (4.5%) | 31 (1.4%) |
| $25,000 to $29,999 | 198 (8.9%) | 158 (7.2%) |
| $30,000 to $34,999 | 53 (2.4%) | 390 (17.9%) |
| $35,000 to $39,999 | 137 (6.2%) | 167 (7.7%) |
| $40,000 to $44,999 | 141 (6.4%) | 151 (6.9%) |
| $45,000 to $49,999 | 175 (7.9%) | 99 (4.5%) |
| $50,000 to $54,999 | 147 (6.6%) | 17 (0.8%) |
| $55,000 to $64,999 | 132 (5.9%) | 114 (5.2%) |
| $65,000 to $74,999 | 79 (3.6%) | 41 (1.9%) |
| $75,000 to $99,999 | 219 (9.9%) | 100 (4.6%) |
| $100,000+ | 233 (10.5%) | 96 (4.4%) |
| Total | 2,221 (100.0%) | 2,179 (100.0%) |
Earnings by Sex by Educational Attainment in Skiatook
Average earnings in Skiatook are $46,078 for men and $33,188 for women, a difference of 28.0%. Men with an educational attainment of bachelor's degree enjoy the highest average annual earnings of $59,191, while those with high school diploma education earn the least with $36,333. Women with an educational attainment of graduate degree earn the most with the average annual earnings of $53,594, while those with less than high school education have the smallest earnings of $24,583.
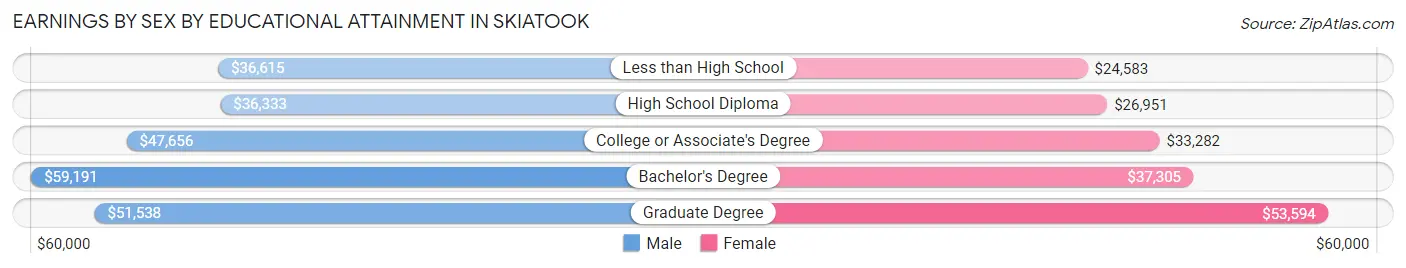
| Educational Attainment | Male Income | Female Income |
| Less than High School | $36,615 | $24,583 |
| High School Diploma | $36,333 | $26,951 |
| College or Associate's Degree | $47,656 | $33,282 |
| Bachelor's Degree | $59,191 | $37,305 |
| Graduate Degree | $51,538 | $53,594 |
| Total | $46,078 | $33,188 |
Family Income in Skiatook
Family Income Brackets in Skiatook
According to the Skiatook family income data, there are 437 families falling into the $50,000 to $74,999 income range, which is the most common income bracket and makes up 20.9% of all families. Conversely, the $10,000 to $14,999 income bracket is the least frequent group with only 23 families (1.1%) belonging to this category.
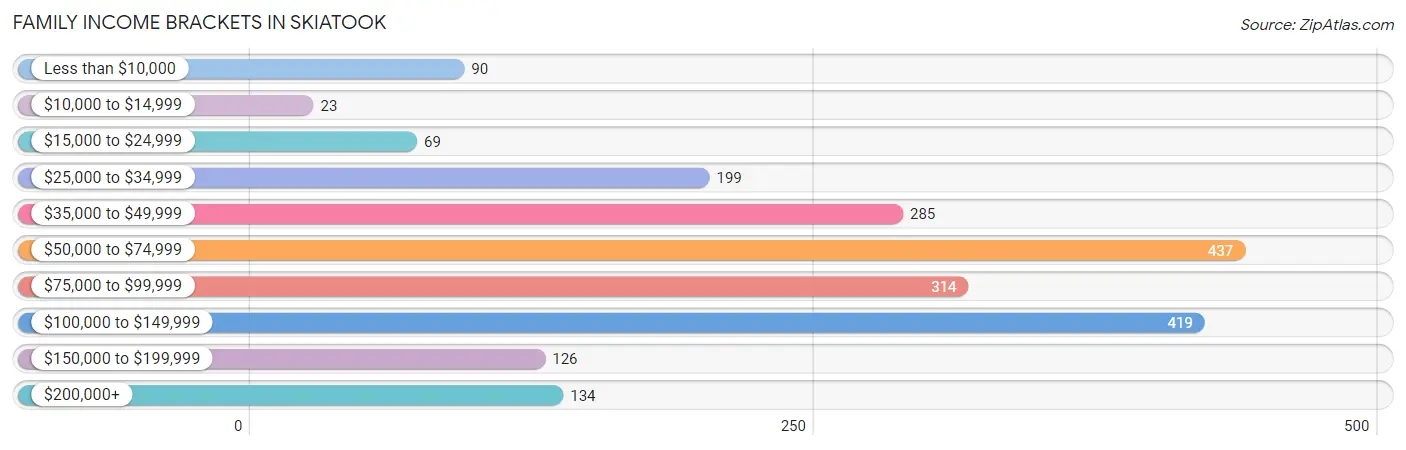
| Income Bracket | # Families | % Families |
| Less than $10,000 | 90 | 4.3% |
| $10,000 to $14,999 | 23 | 1.1% |
| $15,000 to $24,999 | 69 | 3.3% |
| $25,000 to $34,999 | 199 | 9.5% |
| $35,000 to $49,999 | 285 | 13.6% |
| $50,000 to $74,999 | 437 | 20.9% |
| $75,000 to $99,999 | 314 | 15.0% |
| $100,000 to $149,999 | 419 | 20.0% |
| $150,000 to $199,999 | 126 | 6.0% |
| $200,000+ | 134 | 6.4% |
Family Income by Famaliy Size in Skiatook
4-person families (502 | 24.0%) account for the highest median family income in Skiatook with $101,591 per family, while 2-person families (908 | 43.4%) have the highest median income of $33,000 per family member.
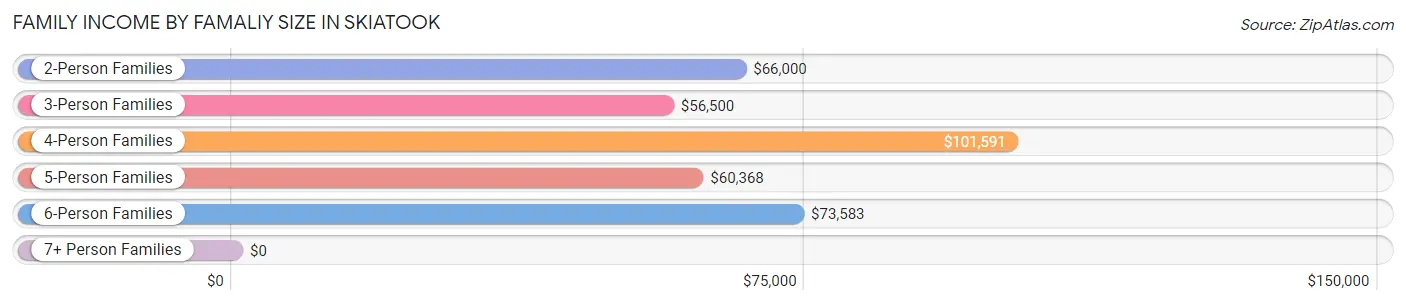
| Income Bracket | # Families | Median Income |
| 2-Person Families | 908 (43.4%) | $66,000 |
| 3-Person Families | 382 (18.2%) | $56,500 |
| 4-Person Families | 502 (24.0%) | $101,591 |
| 5-Person Families | 203 (9.7%) | $60,368 |
| 6-Person Families | 62 (3.0%) | $73,583 |
| 7+ Person Families | 36 (1.7%) | $0 |
| Total | 2,093 (100.0%) | $70,844 |
Family Income by Number of Earners in Skiatook
The median family income in Skiatook is $70,844, with families comprising 3+ earners (236) having the highest median family income of $112,500, while families with no earners (231) have the lowest median family income of $40,707, accounting for 11.3% and 11.0% of families, respectively.
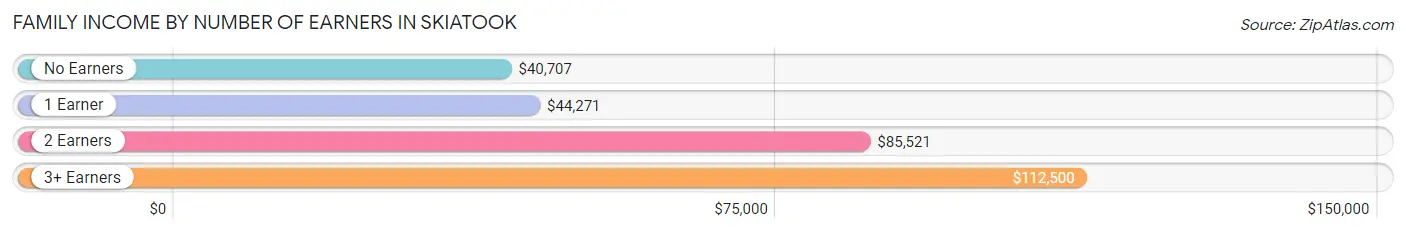
| Number of Earners | # Families | Median Income |
| No Earners | 231 (11.0%) | $40,707 |
| 1 Earner | 631 (30.1%) | $44,271 |
| 2 Earners | 995 (47.5%) | $85,521 |
| 3+ Earners | 236 (11.3%) | $112,500 |
| Total | 2,093 (100.0%) | $70,844 |
Household Income in Skiatook
Household Income Brackets in Skiatook
With 618 households falling in the category, the $50,000 to $74,999 income range is the most frequent in Skiatook, accounting for 19.9% of all households. In contrast, only 90 households (2.9%) fall into the $10,000 to $14,999 income bracket, making it the least populous group.
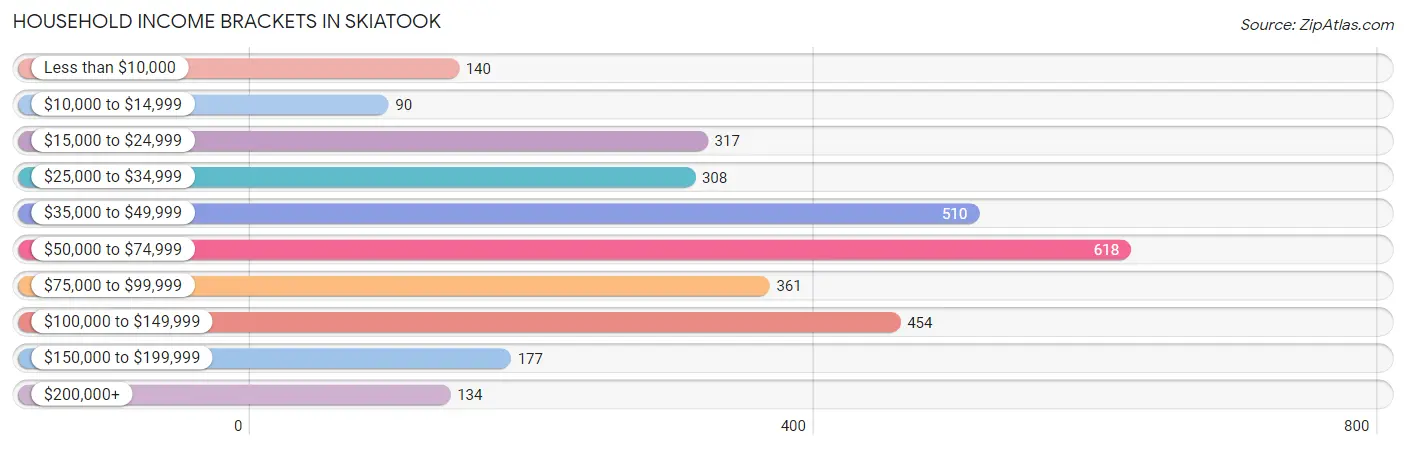
| Income Bracket | # Households | % Households |
| Less than $10,000 | 140 | 4.5% |
| $10,000 to $14,999 | 90 | 2.9% |
| $15,000 to $24,999 | 317 | 10.2% |
| $25,000 to $34,999 | 308 | 9.9% |
| $35,000 to $49,999 | 510 | 16.4% |
| $50,000 to $74,999 | 618 | 19.9% |
| $75,000 to $99,999 | 361 | 11.6% |
| $100,000 to $149,999 | 454 | 14.6% |
| $150,000 to $199,999 | 177 | 5.7% |
| $200,000+ | 134 | 4.3% |
Household Income by Householder Age in Skiatook
The median household income in Skiatook is $54,444, with the highest median household income of $65,347 found in the 25 to 44 years age bracket for the primary householder. A total of 1,123 households (36.1%) fall into this category. Meanwhile, the 15 to 24 years age bracket for the primary householder has the lowest median household income of $31,583, with 207 households (6.7%) in this group.
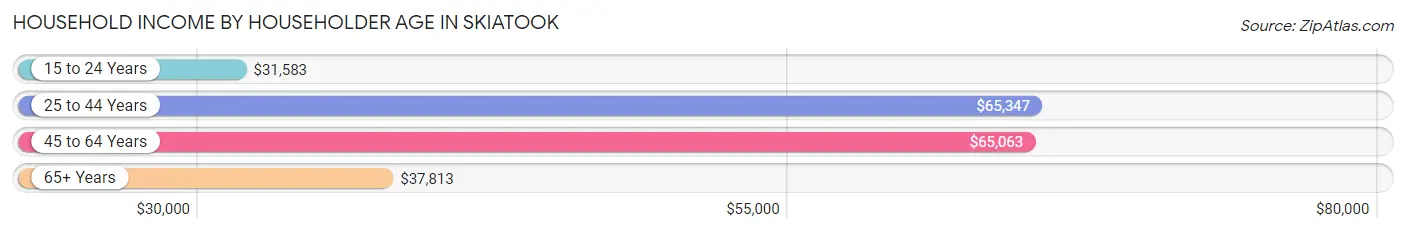
| Income Bracket | # Households | Median Income |
| 15 to 24 Years | 207 (6.7%) | $31,583 |
| 25 to 44 Years | 1,123 (36.1%) | $65,347 |
| 45 to 64 Years | 1,100 (35.4%) | $65,063 |
| 65+ Years | 678 (21.8%) | $37,813 |
| Total | 3,108 (100.0%) | $54,444 |
Poverty in Skiatook
Income Below Poverty by Sex and Age in Skiatook
With 9.7% poverty level for males and 15.5% for females among the residents of Skiatook, 18 to 24 year old males and 15 year old females are the most vulnerable to poverty, with 83 males (18.4%) and 40 females (47.1%) in their respective age groups living below the poverty level.
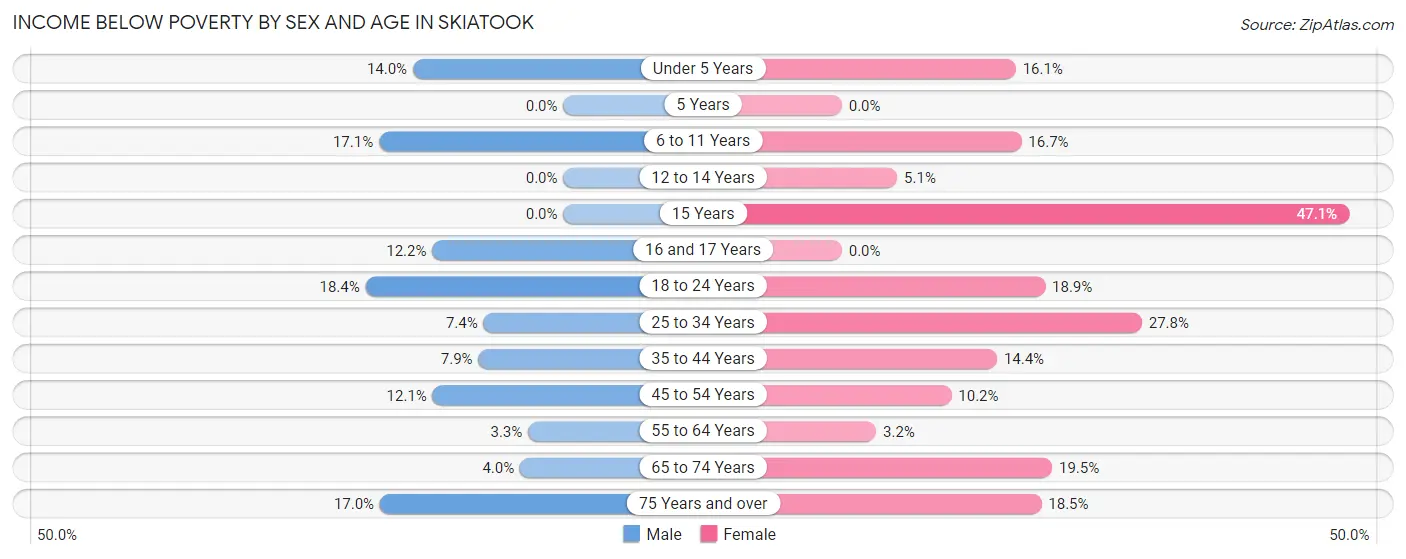
| Age Bracket | Male | Female |
| Under 5 Years | 43 (14.0%) | 36 (16.1%) |
| 5 Years | 0 (0.0%) | 0 (0.0%) |
| 6 to 11 Years | 58 (17.1%) | 64 (16.7%) |
| 12 to 14 Years | 0 (0.0%) | 9 (5.1%) |
| 15 Years | 0 (0.0%) | 40 (47.1%) |
| 16 and 17 Years | 9 (12.2%) | 0 (0.0%) |
| 18 to 24 Years | 83 (18.4%) | 77 (18.9%) |
| 25 to 34 Years | 37 (7.4%) | 162 (27.8%) |
| 35 to 44 Years | 51 (7.9%) | 93 (14.4%) |
| 45 to 54 Years | 58 (12.1%) | 55 (10.2%) |
| 55 to 64 Years | 13 (3.3%) | 15 (3.2%) |
| 65 to 74 Years | 15 (4.0%) | 64 (19.5%) |
| 75 Years and over | 24 (17.0%) | 55 (18.5%) |
| Total | 391 (9.7%) | 670 (15.5%) |
Income Above Poverty by Sex and Age in Skiatook
According to the poverty statistics in Skiatook, males aged 5 years and females aged 5 years are the age groups that are most secure financially, with 100.0% of males and 100.0% of females in these age groups living above the poverty line.
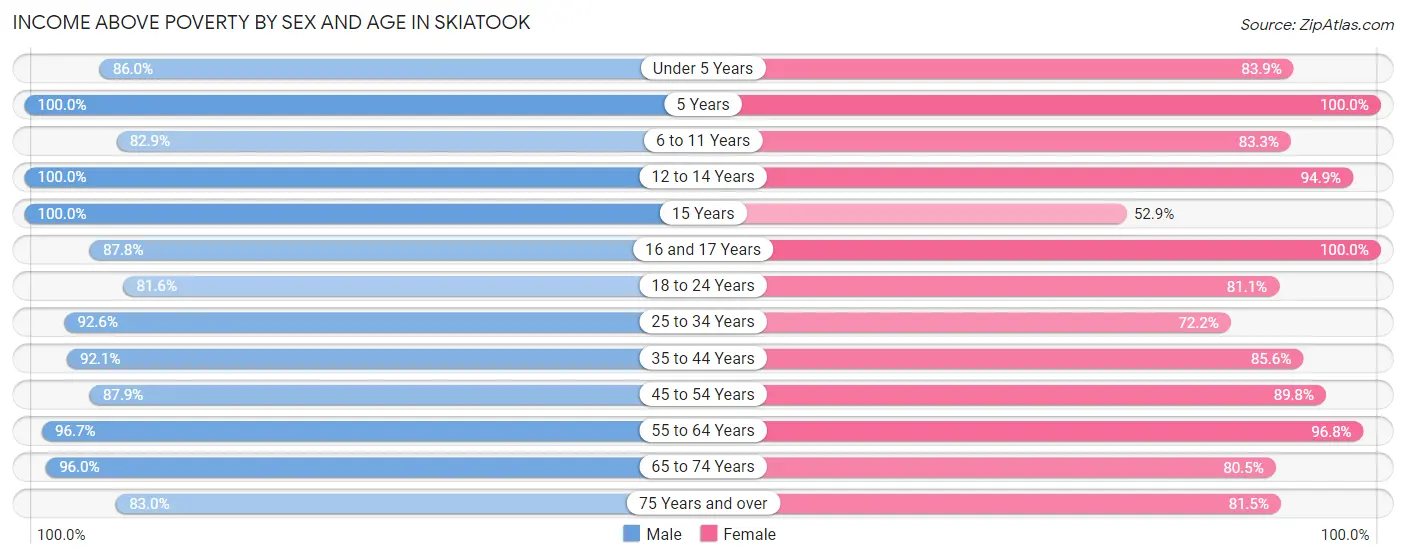
| Age Bracket | Male | Female |
| Under 5 Years | 265 (86.0%) | 187 (83.9%) |
| 5 Years | 127 (100.0%) | 61 (100.0%) |
| 6 to 11 Years | 281 (82.9%) | 320 (83.3%) |
| 12 to 14 Years | 141 (100.0%) | 166 (94.9%) |
| 15 Years | 44 (100.0%) | 45 (52.9%) |
| 16 and 17 Years | 65 (87.8%) | 131 (100.0%) |
| 18 to 24 Years | 369 (81.6%) | 331 (81.1%) |
| 25 to 34 Years | 462 (92.6%) | 420 (72.2%) |
| 35 to 44 Years | 596 (92.1%) | 553 (85.6%) |
| 45 to 54 Years | 420 (87.9%) | 486 (89.8%) |
| 55 to 64 Years | 385 (96.7%) | 457 (96.8%) |
| 65 to 74 Years | 358 (96.0%) | 264 (80.5%) |
| 75 Years and over | 117 (83.0%) | 242 (81.5%) |
| Total | 3,630 (90.3%) | 3,663 (84.5%) |
Income Below Poverty Among Married-Couple Families in Skiatook
The poverty statistics for married-couple families in Skiatook show that 6.5% or 102 of the total 1,567 families live below the poverty line. Families with 3 or 4 children have the highest poverty rate of 11.1%, comprising of 19 families. On the other hand, families with no children have the lowest poverty rate of 5.3%, which includes 44 families.
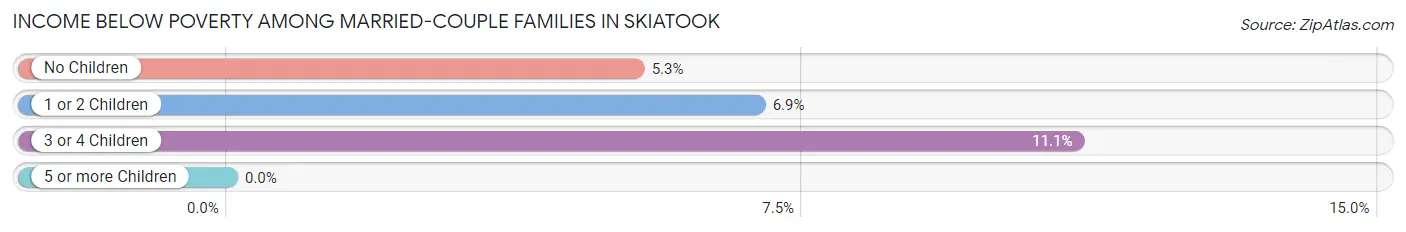
| Children | Above Poverty | Below Poverty |
| No Children | 785 (94.7%) | 44 (5.3%) |
| 1 or 2 Children | 527 (93.1%) | 39 (6.9%) |
| 3 or 4 Children | 153 (88.9%) | 19 (11.1%) |
| 5 or more Children | 0 (0.0%) | 0 (0.0%) |
| Total | 1,465 (93.5%) | 102 (6.5%) |
Income Below Poverty Among Single-Parent Households in Skiatook
According to the poverty data in Skiatook, 5.0% or 7 single-father households and 12.7% or 49 single-mother households are living below the poverty line. Among single-father households, those with no children have the highest poverty rate, with 7 households (13.7%) experiencing poverty. Likewise, among single-mother households, those with 3 or 4 children have the highest poverty rate, with 20 households (45.5%) falling below the poverty line.
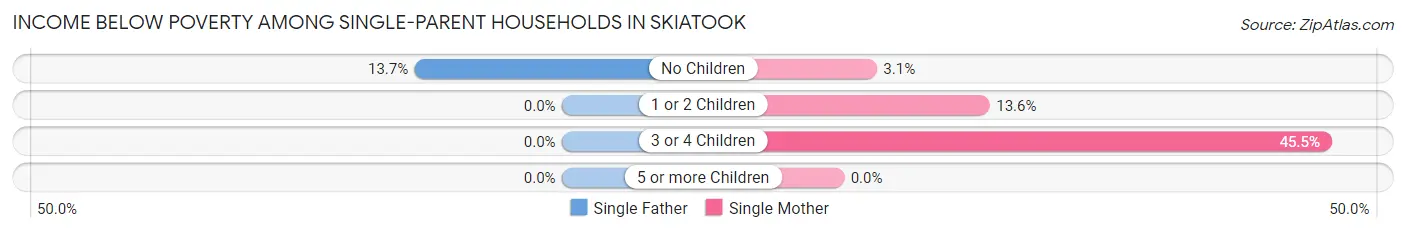
| Children | Single Father | Single Mother |
| No Children | 7 (13.7%) | 5 (3.0%) |
| 1 or 2 Children | 0 (0.0%) | 24 (13.6%) |
| 3 or 4 Children | 0 (0.0%) | 20 (45.5%) |
| 5 or more Children | 0 (0.0%) | 0 (0.0%) |
| Total | 7 (5.0%) | 49 (12.7%) |
Income Below Poverty Among Married-Couple vs Single-Parent Households in Skiatook
The poverty data for Skiatook shows that 102 of the married-couple family households (6.5%) and 56 of the single-parent households (10.6%) are living below the poverty level. Within the married-couple family households, those with 3 or 4 children have the highest poverty rate, with 19 households (11.1%) falling below the poverty line. Among the single-parent households, those with 3 or 4 children have the highest poverty rate, with 20 household (37.0%) living below poverty.
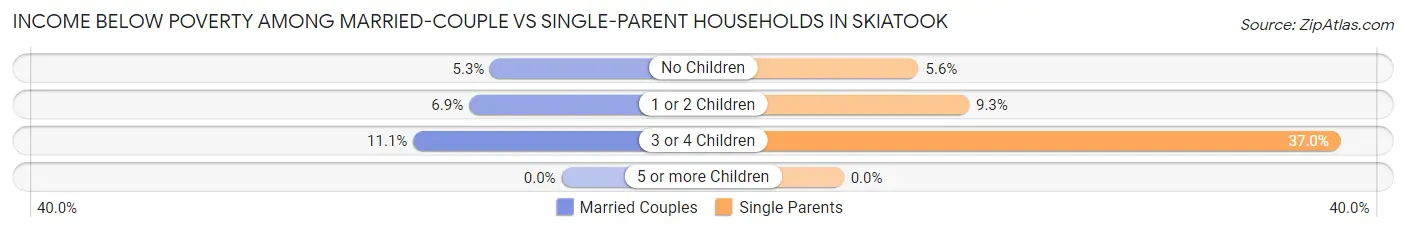
| Children | Married-Couple Families | Single-Parent Households |
| No Children | 44 (5.3%) | 12 (5.6%) |
| 1 or 2 Children | 39 (6.9%) | 24 (9.3%) |
| 3 or 4 Children | 19 (11.1%) | 20 (37.0%) |
| 5 or more Children | 0 (0.0%) | 0 (0.0%) |
| Total | 102 (6.5%) | 56 (10.6%) |
Race in Skiatook
The most populous races in Skiatook are White / Caucasian (6,126 | 72.4%), Two or more Races (1,150 | 13.6%), and Native / Alaskan (1,094 | 12.9%).
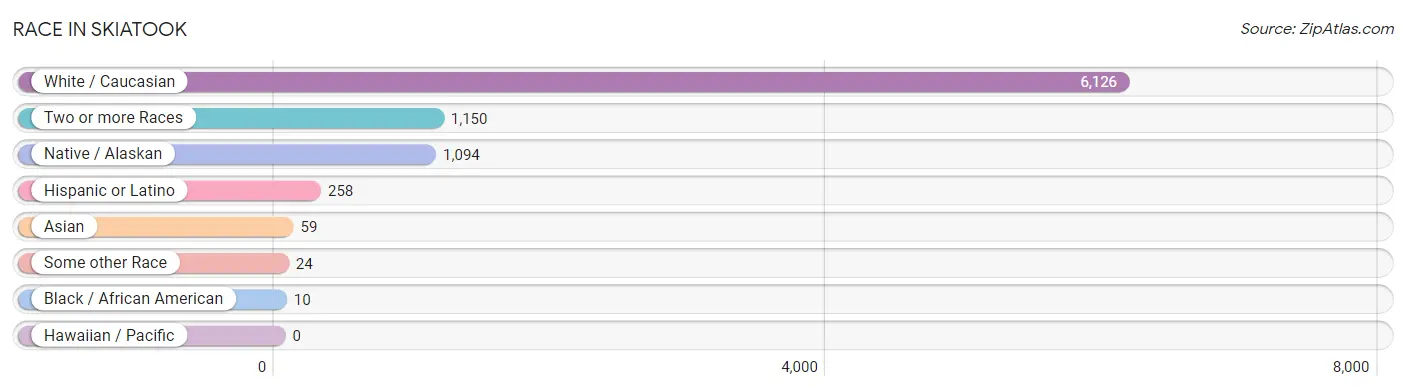
| Race | # Population | % Population |
| Asian | 59 | 0.7% |
| Black / African American | 10 | 0.1% |
| Hawaiian / Pacific | 0 | 0.0% |
| Hispanic or Latino | 258 | 3.0% |
| Native / Alaskan | 1,094 | 12.9% |
| White / Caucasian | 6,126 | 72.4% |
| Two or more Races | 1,150 | 13.6% |
| Some other Race | 24 | 0.3% |
| Total | 8,463 | 100.0% |
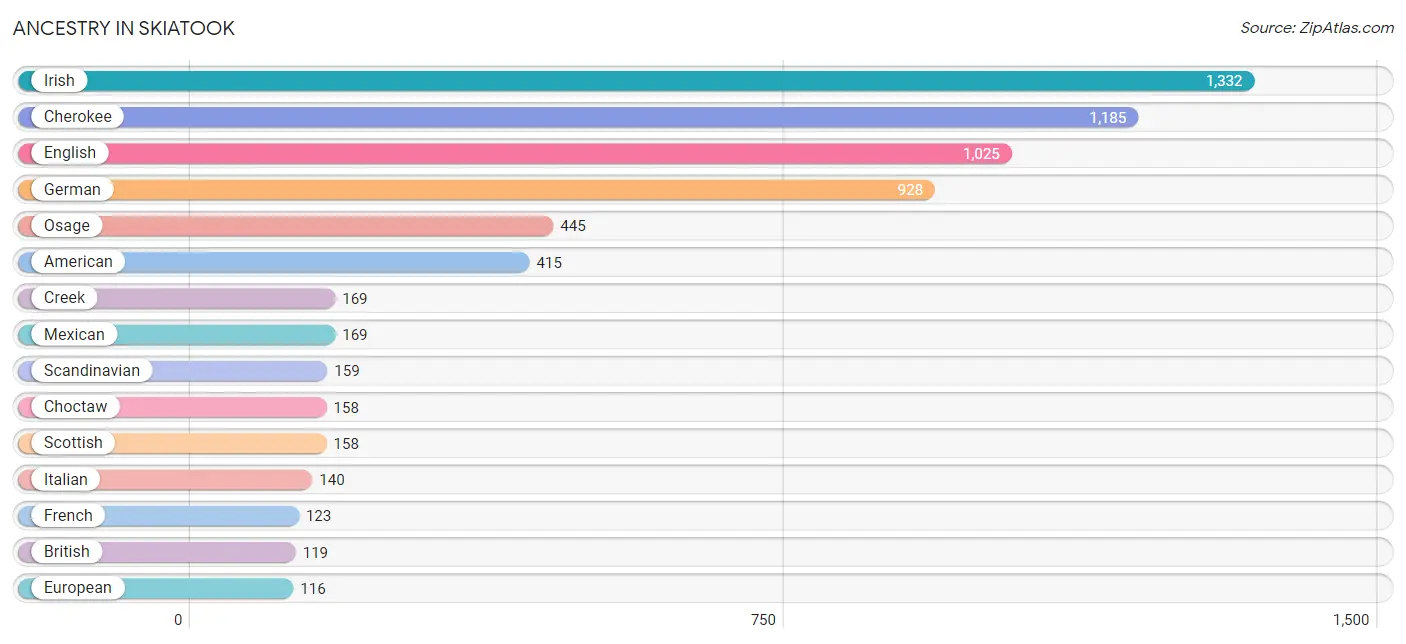
Ancestry in Skiatook
The most populous ancestries reported in Skiatook are Irish (1,332 | 15.7%), Cherokee (1,185 | 14.0%), English (1,025 | 12.1%), German (928 | 11.0%), and Osage (445 | 5.3%), together accounting for 58.1% of all Skiatook residents.
| Ancestry | # Population | % Population |
| African | 4 | 0.1% |
| American | 415 | 4.9% |
| Austrian | 11 | 0.1% |
| Bermudan | 7 | 0.1% |
| Bhutanese | 18 | 0.2% |
| Blackfeet | 26 | 0.3% |
| Brazilian | 14 | 0.2% |
| British | 119 | 1.4% |
| Central American | 13 | 0.2% |
| Cherokee | 1,185 | 14.0% |
| Chickasaw | 37 | 0.4% |
| Choctaw | 158 | 1.9% |
| Creek | 169 | 2.0% |
| Cuban | 7 | 0.1% |
| Danish | 16 | 0.2% |
| Delaware | 6 | 0.1% |
| Dutch | 58 | 0.7% |
| English | 1,025 | 12.1% |
| European | 116 | 1.4% |
| French | 123 | 1.5% |
| German | 928 | 11.0% |
| Guyanese | 9 | 0.1% |
| Honduran | 13 | 0.2% |
| Hungarian | 53 | 0.6% |
| Irish | 1,332 | 15.7% |
| Iroquois | 17 | 0.2% |
| Italian | 140 | 1.7% |
| Lithuanian | 35 | 0.4% |
| Mexican | 169 | 2.0% |
| Navajo | 88 | 1.0% |
| Norwegian | 48 | 0.6% |
| Osage | 445 | 5.3% |
| Polish | 23 | 0.3% |
| Potawatomi | 6 | 0.1% |
| Puerto Rican | 48 | 0.6% |
| Scandinavian | 159 | 1.9% |
| Scotch-Irish | 71 | 0.8% |
| Scottish | 158 | 1.9% |
| Sioux | 13 | 0.2% |
| Spaniard | 21 | 0.3% |
| Subsaharan African | 4 | 0.1% |
| Swedish | 71 | 0.8% |
| Welsh | 37 | 0.4% | View All 43 Rows |
Immigrants in Skiatook
The most numerous immigrant groups reported in Skiatook came from Asia (49 | 0.6%), Pakistan (49 | 0.6%), South Central Asia (49 | 0.6%), Latin America (23 | 0.3%), and South America (23 | 0.3%), together accounting for 2.3% of all Skiatook residents.
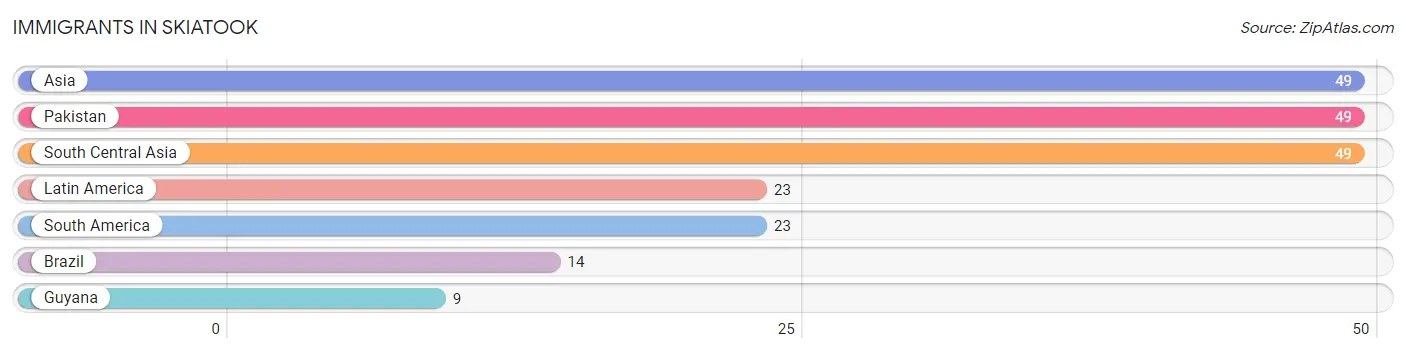
| Immigration Origin | # Population | % Population |
| Asia | 49 | 0.6% |
| Brazil | 14 | 0.2% |
| Guyana | 9 | 0.1% |
| Latin America | 23 | 0.3% |
| Pakistan | 49 | 0.6% |
| South America | 23 | 0.3% |
| South Central Asia | 49 | 0.6% | View All 7 Rows |
Sex and Age in Skiatook
Sex and Age in Skiatook
The most populous age groups in Skiatook are 40 to 44 Years (417 | 10.3%) for men and 15 to 19 Years (362 | 8.2%) for women.
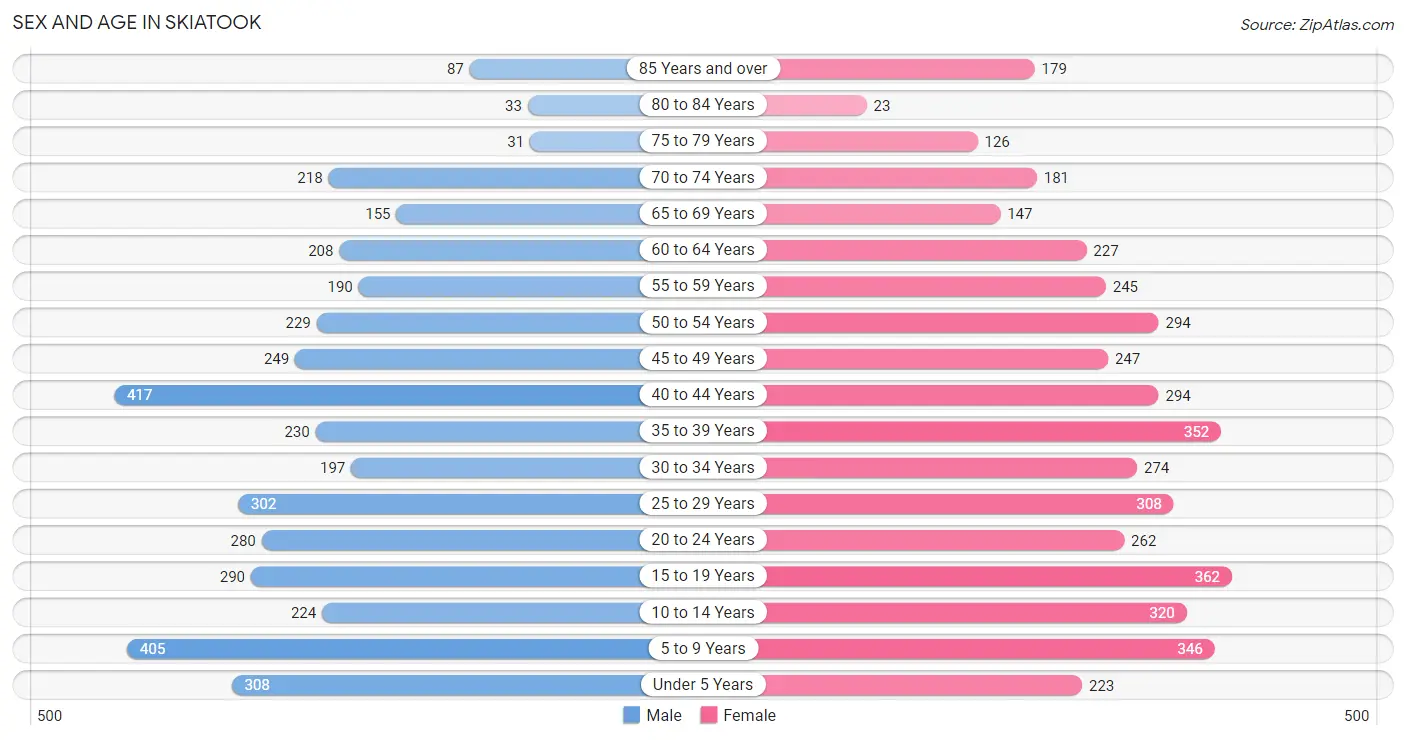
| Age Bracket | Male | Female |
| Under 5 Years | 308 (7.6%) | 223 (5.1%) |
| 5 to 9 Years | 405 (10.0%) | 346 (7.9%) |
| 10 to 14 Years | 224 (5.5%) | 320 (7.3%) |
| 15 to 19 Years | 290 (7.2%) | 362 (8.2%) |
| 20 to 24 Years | 280 (6.9%) | 262 (5.9%) |
| 25 to 29 Years | 302 (7.4%) | 308 (7.0%) |
| 30 to 34 Years | 197 (4.9%) | 274 (6.2%) |
| 35 to 39 Years | 230 (5.7%) | 352 (8.0%) |
| 40 to 44 Years | 417 (10.3%) | 294 (6.7%) |
| 45 to 49 Years | 249 (6.1%) | 247 (5.6%) |
| 50 to 54 Years | 229 (5.7%) | 294 (6.7%) |
| 55 to 59 Years | 190 (4.7%) | 245 (5.6%) |
| 60 to 64 Years | 208 (5.1%) | 227 (5.1%) |
| 65 to 69 Years | 155 (3.8%) | 147 (3.3%) |
| 70 to 74 Years | 218 (5.4%) | 181 (4.1%) |
| 75 to 79 Years | 31 (0.8%) | 126 (2.9%) |
| 80 to 84 Years | 33 (0.8%) | 23 (0.5%) |
| 85 Years and over | 87 (2.1%) | 179 (4.1%) |
| Total | 4,053 (100.0%) | 4,410 (100.0%) |
Families and Households in Skiatook
Median Family Size in Skiatook
The median family size in Skiatook is 3.30 persons per family, with married-couple families (1,567 | 74.9%) accounting for the largest median family size of 3.44 persons per family. On the other hand, single male/father families (141 | 6.7%) represent the smallest median family size with 2.64 persons per family.
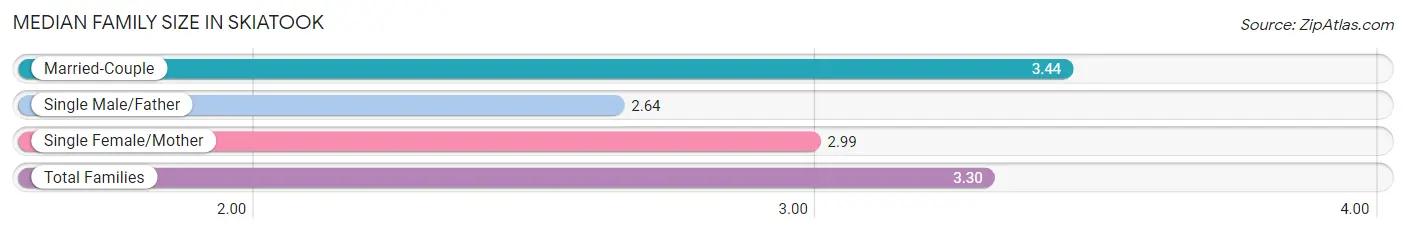
| Family Type | # Families | Family Size |
| Married-Couple | 1,567 (74.9%) | 3.44 |
| Single Male/Father | 141 (6.7%) | 2.64 |
| Single Female/Mother | 385 (18.4%) | 2.99 |
| Total Families | 2,093 (100.0%) | 3.30 |
Median Household Size in Skiatook
The median household size in Skiatook is 2.71 persons per household, with married-couple households (1,567 | 50.4%) accounting for the largest median household size of 3.44 persons per household. non-family households (1,015 | 32.7%) represent the smallest median household size with 1.29 persons per household.
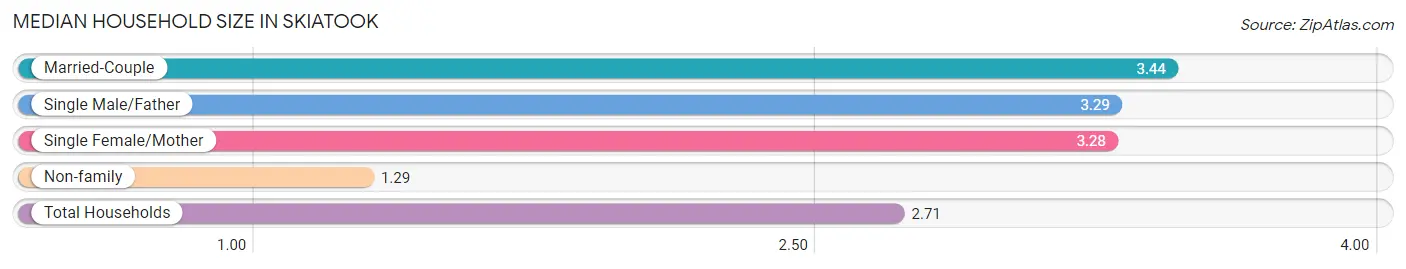
| Household Type | # Households | Household Size |
| Married-Couple | 1,567 (50.4%) | 3.44 |
| Single Male/Father | 141 (4.5%) | 3.29 |
| Single Female/Mother | 385 (12.4%) | 3.28 |
| Non-family | 1,015 (32.7%) | 1.29 |
| Total Households | 3,108 (100.0%) | 2.71 |
Household Size by Marriage Status in Skiatook
Out of a total of 3,108 households in Skiatook, 2,093 (67.3%) are family households, while 1,015 (32.7%) are nonfamily households. The most numerous type of family households are 2-person households, comprising 840, and the most common type of nonfamily households are 1-person households, comprising 799.
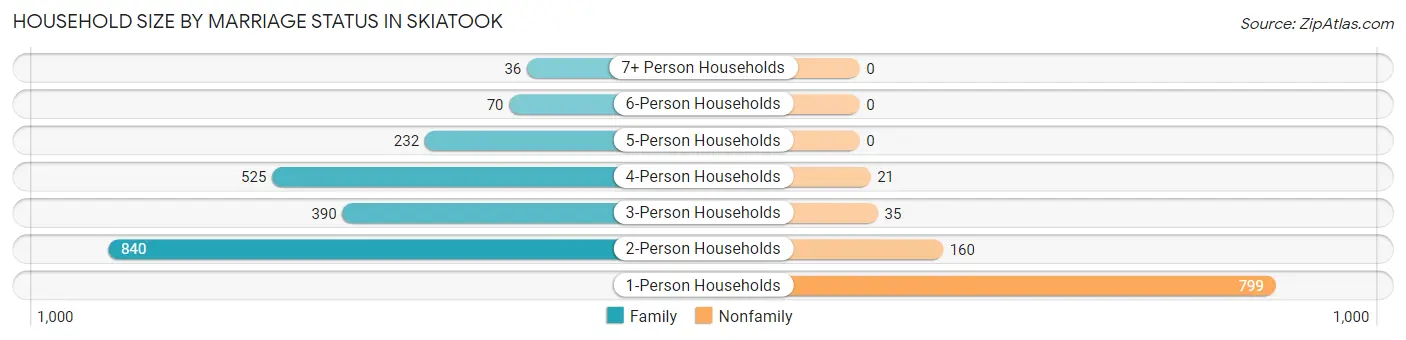
| Household Size | Family Households | Nonfamily Households |
| 1-Person Households | - | 799 (25.7%) |
| 2-Person Households | 840 (27.0%) | 160 (5.1%) |
| 3-Person Households | 390 (12.6%) | 35 (1.1%) |
| 4-Person Households | 525 (16.9%) | 21 (0.7%) |
| 5-Person Households | 232 (7.5%) | 0 (0.0%) |
| 6-Person Households | 70 (2.2%) | 0 (0.0%) |
| 7+ Person Households | 36 (1.2%) | 0 (0.0%) |
| Total | 2,093 (67.3%) | 1,015 (32.7%) |
Female Fertility in Skiatook
Fertility by Age in Skiatook
Average fertility rate in Skiatook is 52.0 births per 1,000 women. Women in the age bracket of 20 to 34 years have the highest fertility rate with 121.0 births per 1,000 women. Women in the age bracket of 20 to 34 years acount for 90.3% of all women with births.
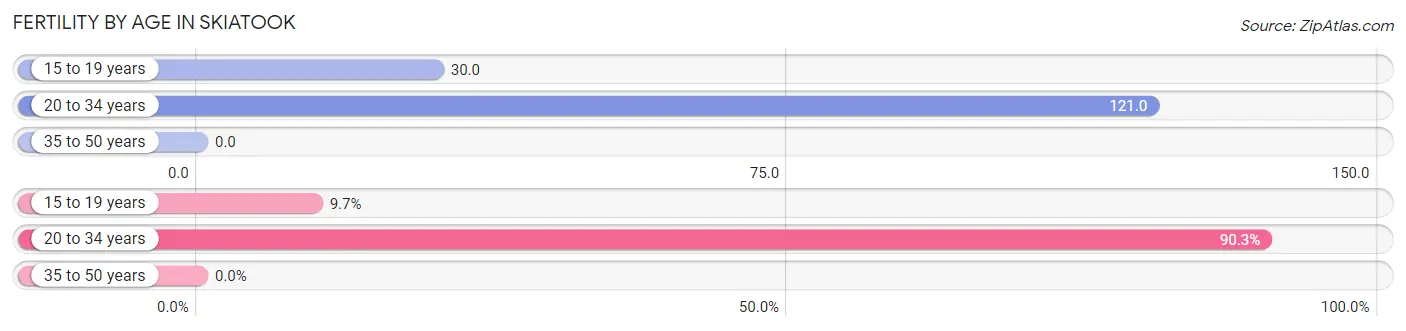
| Age Bracket | Women with Births | Births / 1,000 Women |
| 15 to 19 years | 11 (9.7%) | 30.0 |
| 20 to 34 years | 102 (90.3%) | 121.0 |
| 35 to 50 years | 0 (0.0%) | 0.0 |
| Total | 113 (100.0%) | 52.0 |
Fertility by Age by Marriage Status in Skiatook
63.7% of women with births (113) in Skiatook are married. The highest percentage of unmarried women with births falls into 20 to 34 years age bracket with 40.2% of them unmarried at the time of birth, while the lowest percentage of unmarried women with births belong to 15 to 19 years age bracket with 0.0% of them unmarried.
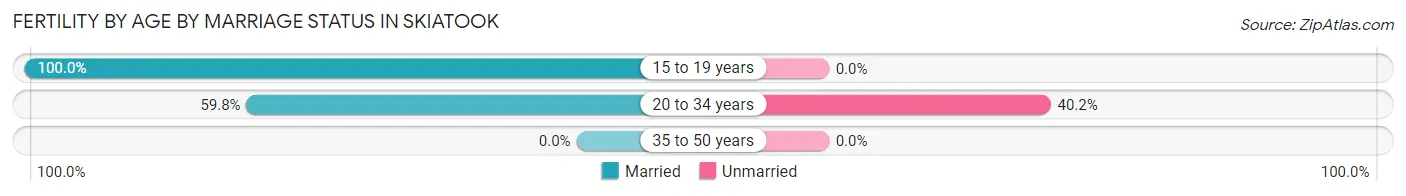
| Age Bracket | Married | Unmarried |
| 15 to 19 years | 11 (100.0%) | 0 (0.0%) |
| 20 to 34 years | 61 (59.8%) | 41 (40.2%) |
| 35 to 50 years | 0 (0.0%) | 0 (0.0%) |
| Total | 72 (63.7%) | 41 (36.3%) |
Fertility by Education in Skiatook
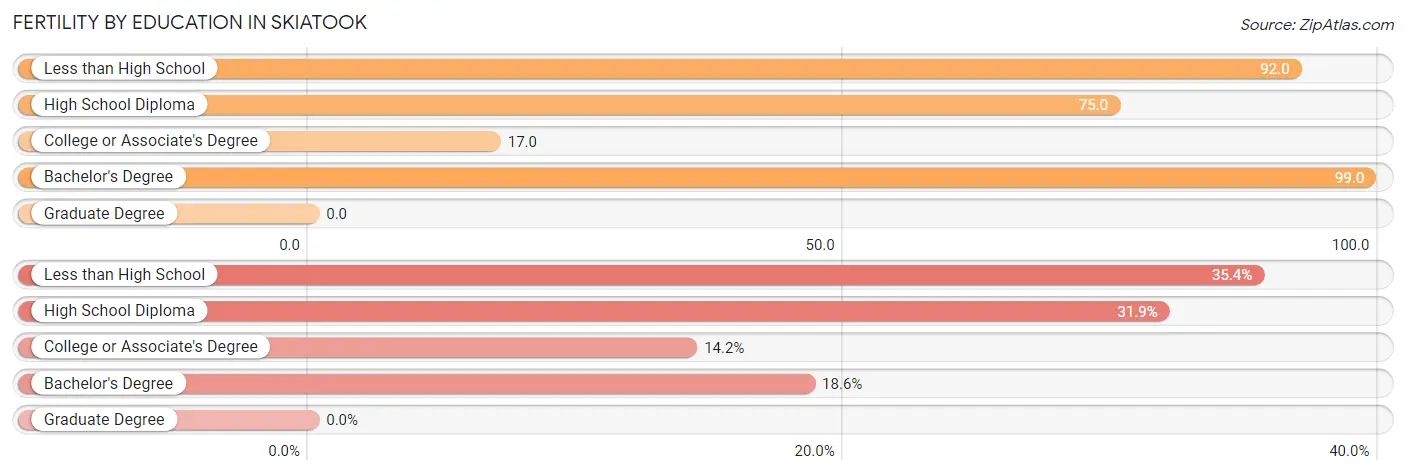
| Educational Attainment | Women with Births | Births / 1,000 Women |
| Less than High School | 40 (35.4%) | 92.0 |
| High School Diploma | 36 (31.9%) | 75.0 |
| College or Associate's Degree | 16 (14.2%) | 17.0 |
| Bachelor's Degree | 21 (18.6%) | 99.0 |
| Graduate Degree | 0 (0.0%) | 0.0 |
| Total | 113 (100.0%) | 52.0 |
Fertility by Education by Marriage Status in Skiatook
36.3% of women with births in Skiatook are unmarried. Women with the educational attainment of college or associate's degree are most likely to be married with 100.0% of them married at childbirth, while women with the educational attainment of less than high school are least likely to be married with 72.5% of them unmarried at childbirth.
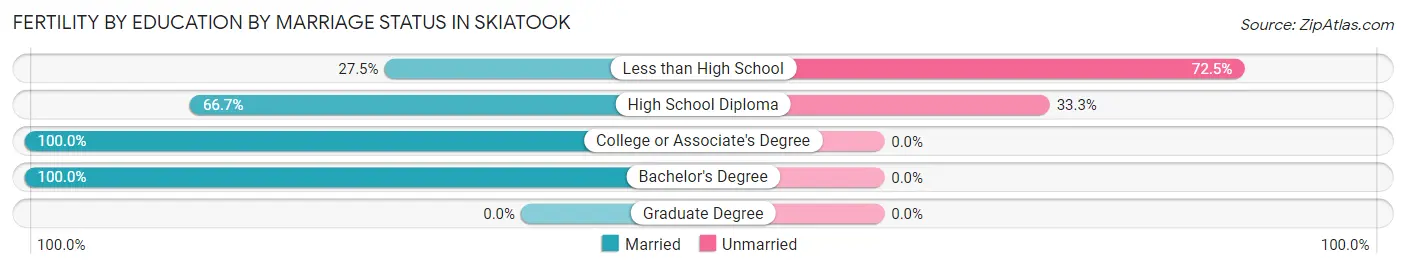
| Educational Attainment | Married | Unmarried |
| Less than High School | 11 (27.5%) | 29 (72.5%) |
| High School Diploma | 24 (66.7%) | 12 (33.3%) |
| College or Associate's Degree | 16 (100.0%) | 0 (0.0%) |
| Bachelor's Degree | 21 (100.0%) | 0 (0.0%) |
| Graduate Degree | 0 (0.0%) | 0 (0.0%) |
| Total | 72 (63.7%) | 41 (36.3%) |
Employment Characteristics in Skiatook
Employment by Class of Employer in Skiatook
Among the 3,768 employed individuals in Skiatook, private company employees (2,649 | 70.3%), not-for-profit organizations (292 | 7.7%), and local government employees (243 | 6.5%) make up the most common classes of employment.
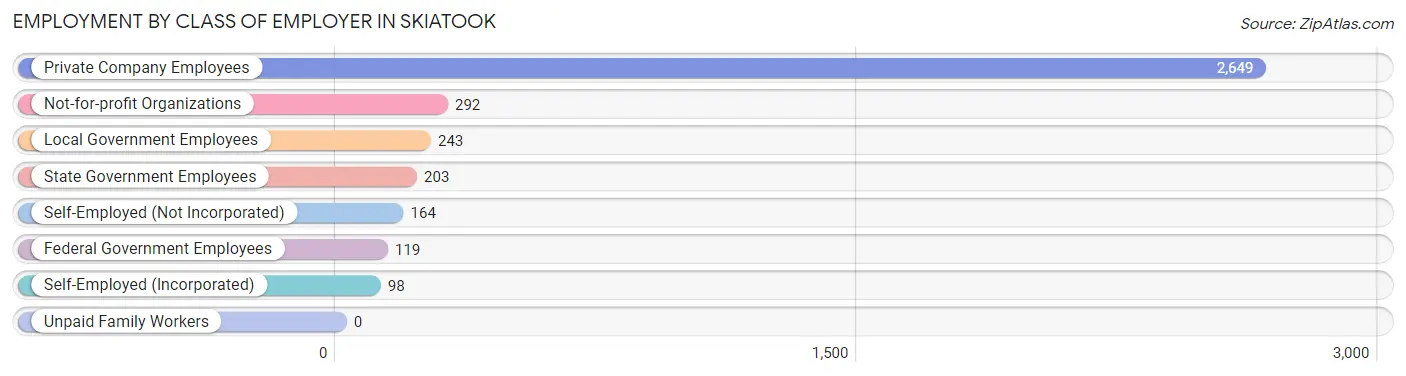
| Employer Class | # Employees | % Employees |
| Private Company Employees | 2,649 | 70.3% |
| Self-Employed (Incorporated) | 98 | 2.6% |
| Self-Employed (Not Incorporated) | 164 | 4.3% |
| Not-for-profit Organizations | 292 | 7.7% |
| Local Government Employees | 243 | 6.5% |
| State Government Employees | 203 | 5.4% |
| Federal Government Employees | 119 | 3.2% |
| Unpaid Family Workers | 0 | 0.0% |
| Total | 3,768 | 100.0% |
Employment Status by Age in Skiatook
According to the labor force statistics for Skiatook, out of the total population over 16 years of age (6,508), 63.8% or 4,152 individuals are in the labor force, with 5.0% or 208 of them unemployed. The age group with the highest labor force participation rate is 35 to 44 years, with 85.8% or 1,109 individuals in the labor force. Within the labor force, the 60 to 64 years age range has the highest percentage of unemployed individuals, with 23.7% or 65 of them being unemployed.
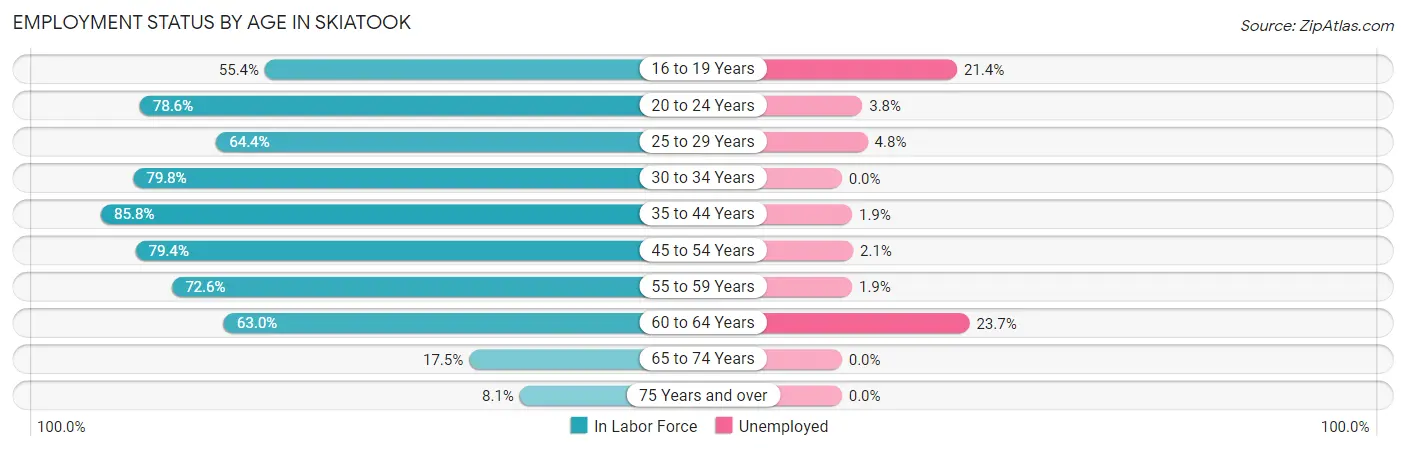
| Age Bracket | In Labor Force | Unemployed |
| 16 to 19 Years | 290 (55.4%) | 62 (21.4%) |
| 20 to 24 Years | 426 (78.6%) | 16 (3.8%) |
| 25 to 29 Years | 393 (64.4%) | 19 (4.8%) |
| 30 to 34 Years | 376 (79.8%) | 0 (0.0%) |
| 35 to 44 Years | 1,109 (85.8%) | 21 (1.9%) |
| 45 to 54 Years | 809 (79.4%) | 17 (2.1%) |
| 55 to 59 Years | 316 (72.6%) | 6 (1.9%) |
| 60 to 64 Years | 274 (63.0%) | 65 (23.7%) |
| 65 to 74 Years | 123 (17.5%) | 0 (0.0%) |
| 75 Years and over | 39 (8.1%) | 0 (0.0%) |
| Total | 4,152 (63.8%) | 208 (5.0%) |
Employment Status by Educational Attainment in Skiatook
According to labor force statistics for Skiatook, 76.9% of individuals (3,278) out of the total population between 25 and 64 years of age (4,263) are in the labor force, with 3.9% or 128 of them being unemployed. The group with the highest labor force participation rate are those with the educational attainment of bachelor's degree or higher, with 85.3% or 725 individuals in the labor force. Within the labor force, individuals with high school diploma education have the highest percentage of unemployment, with 12.9% or 128 of them being unemployed.
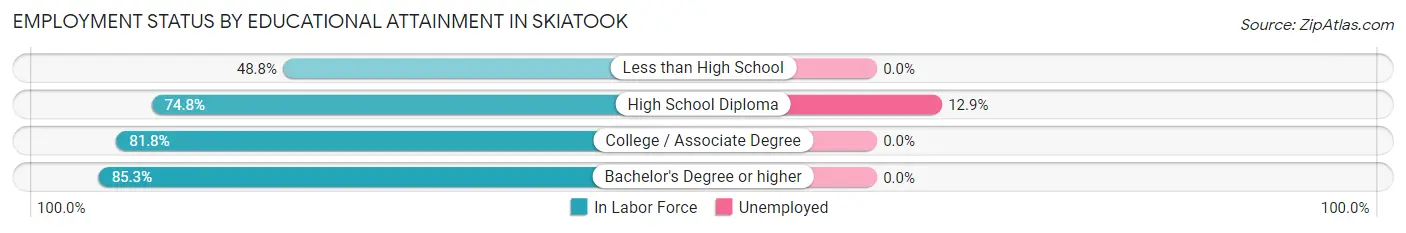
| Educational Attainment | In Labor Force | Unemployed |
| Less than High School | 216 (48.8%) | 0 (0.0%) |
| High School Diploma | 990 (74.8%) | 171 (12.9%) |
| College / Associate Degree | 1,347 (81.8%) | 0 (0.0%) |
| Bachelor's Degree or higher | 725 (85.3%) | 0 (0.0%) |
| Total | 3,278 (76.9%) | 166 (3.9%) |
Employment Occupations by Sex in Skiatook
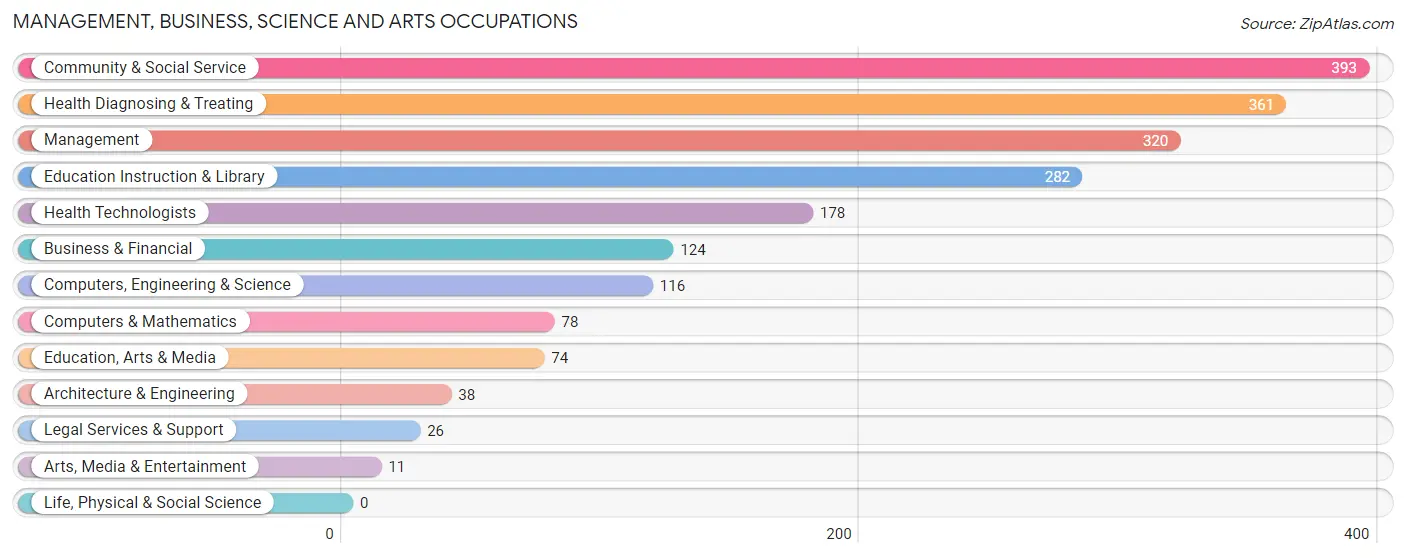
Management, Business, Science and Arts Occupations
The most common Management, Business, Science and Arts occupations in Skiatook are Community & Social Service (393 | 10.0%), Health Diagnosing & Treating (361 | 9.2%), Management (320 | 8.1%), Education Instruction & Library (282 | 7.2%), and Health Technologists (178 | 4.5%).
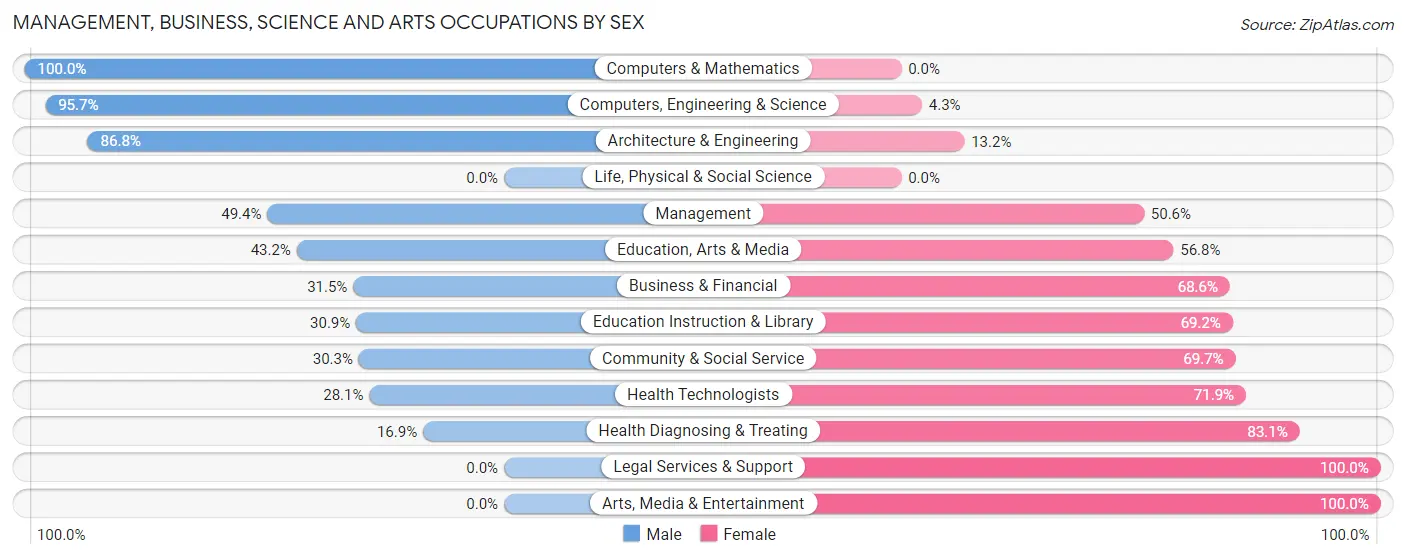
Management, Business, Science and Arts Occupations by Sex
Within the Management, Business, Science and Arts occupations in Skiatook, the most male-oriented occupations are Computers & Mathematics (100.0%), Computers, Engineering & Science (95.7%), and Architecture & Engineering (86.8%), while the most female-oriented occupations are Legal Services & Support (100.0%), Arts, Media & Entertainment (100.0%), and Health Diagnosing & Treating (83.1%).
| Occupation | Male | Female |
| Management | 158 (49.4%) | 162 (50.6%) |
| Business & Financial | 39 (31.5%) | 85 (68.5%) |
| Computers, Engineering & Science | 111 (95.7%) | 5 (4.3%) |
| Computers & Mathematics | 78 (100.0%) | 0 (0.0%) |
| Architecture & Engineering | 33 (86.8%) | 5 (13.2%) |
| Life, Physical & Social Science | 0 (0.0%) | 0 (0.0%) |
| Community & Social Service | 119 (30.3%) | 274 (69.7%) |
| Education, Arts & Media | 32 (43.2%) | 42 (56.8%) |
| Legal Services & Support | 0 (0.0%) | 26 (100.0%) |
| Education Instruction & Library | 87 (30.8%) | 195 (69.2%) |
| Arts, Media & Entertainment | 0 (0.0%) | 11 (100.0%) |
| Health Diagnosing & Treating | 61 (16.9%) | 300 (83.1%) |
| Health Technologists | 50 (28.1%) | 128 (71.9%) |
| Total (Category) | 488 (37.1%) | 826 (62.9%) |
| Total (Overall) | 2,031 (51.5%) | 1,909 (48.4%) |
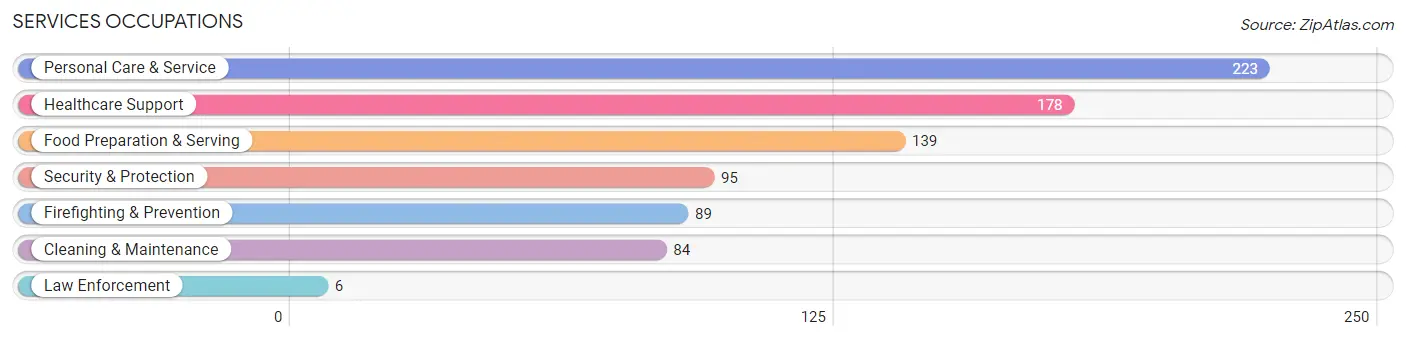
Services Occupations
The most common Services occupations in Skiatook are Personal Care & Service (223 | 5.7%), Healthcare Support (178 | 4.5%), Food Preparation & Serving (139 | 3.5%), Security & Protection (95 | 2.4%), and Firefighting & Prevention (89 | 2.3%).
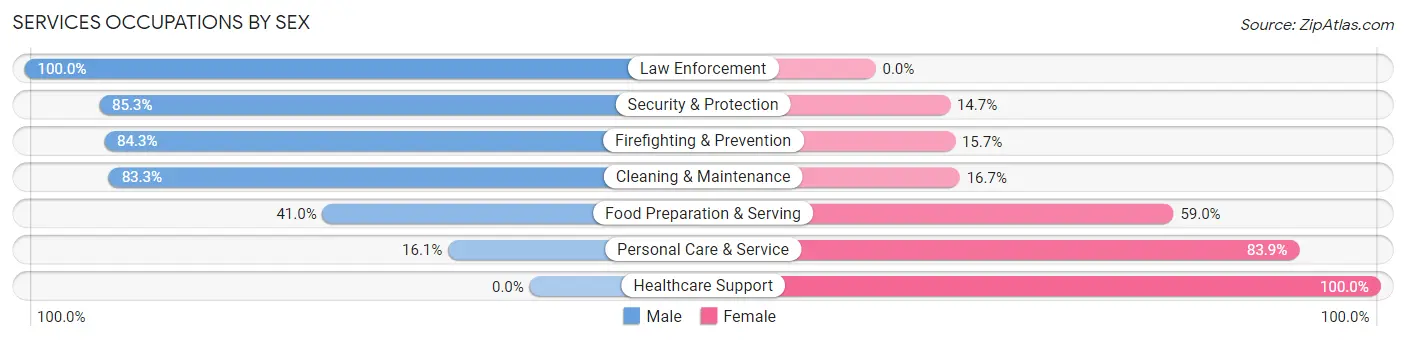
Services Occupations by Sex
Within the Services occupations in Skiatook, the most male-oriented occupations are Law Enforcement (100.0%), Security & Protection (85.3%), and Firefighting & Prevention (84.3%), while the most female-oriented occupations are Healthcare Support (100.0%), Personal Care & Service (83.9%), and Food Preparation & Serving (59.0%).
| Occupation | Male | Female |
| Healthcare Support | 0 (0.0%) | 178 (100.0%) |
| Security & Protection | 81 (85.3%) | 14 (14.7%) |
| Firefighting & Prevention | 75 (84.3%) | 14 (15.7%) |
| Law Enforcement | 6 (100.0%) | 0 (0.0%) |
| Food Preparation & Serving | 57 (41.0%) | 82 (59.0%) |
| Cleaning & Maintenance | 70 (83.3%) | 14 (16.7%) |
| Personal Care & Service | 36 (16.1%) | 187 (83.9%) |
| Total (Category) | 244 (33.9%) | 475 (66.1%) |
| Total (Overall) | 2,031 (51.5%) | 1,909 (48.4%) |
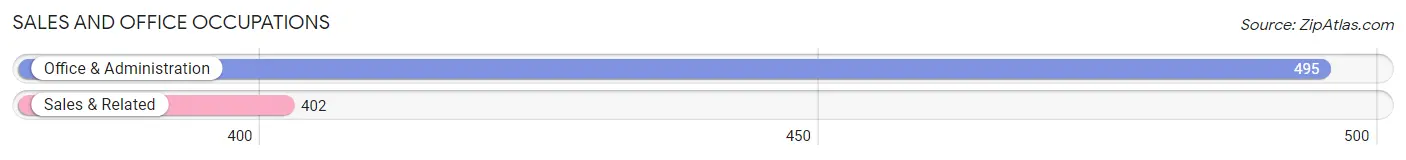
Sales and Office Occupations
The most common Sales and Office occupations in Skiatook are Office & Administration (495 | 12.6%), and Sales & Related (402 | 10.2%).
Sales and Office Occupations by Sex
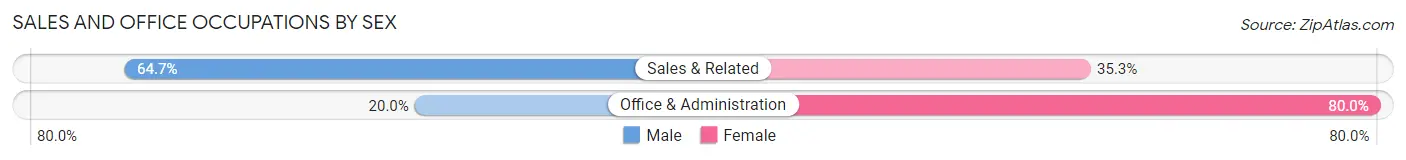
| Occupation | Male | Female |
| Sales & Related | 260 (64.7%) | 142 (35.3%) |
| Office & Administration | 99 (20.0%) | 396 (80.0%) |
| Total (Category) | 359 (40.0%) | 538 (60.0%) |
| Total (Overall) | 2,031 (51.5%) | 1,909 (48.4%) |
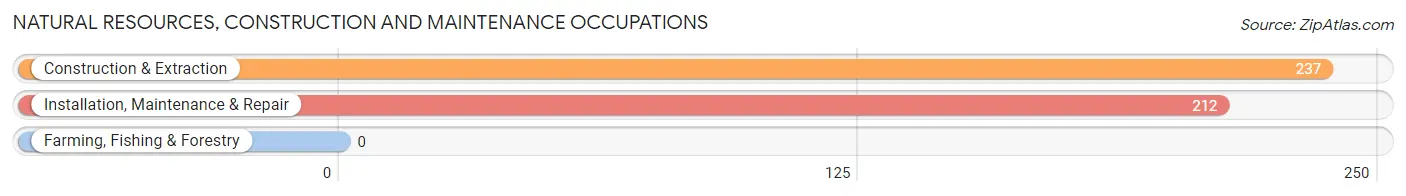
Natural Resources, Construction and Maintenance Occupations
The most common Natural Resources, Construction and Maintenance occupations in Skiatook are Construction & Extraction (237 | 6.0%), and Installation, Maintenance & Repair (212 | 5.4%).
Natural Resources, Construction and Maintenance Occupations by Sex
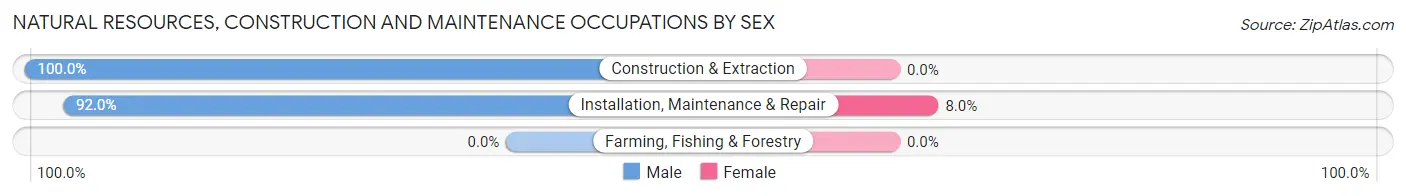
| Occupation | Male | Female |
| Farming, Fishing & Forestry | 0 (0.0%) | 0 (0.0%) |
| Construction & Extraction | 237 (100.0%) | 0 (0.0%) |
| Installation, Maintenance & Repair | 195 (92.0%) | 17 (8.0%) |
| Total (Category) | 432 (96.2%) | 17 (3.8%) |
| Total (Overall) | 2,031 (51.5%) | 1,909 (48.4%) |
Production, Transportation and Moving Occupations
The most common Production, Transportation and Moving occupations in Skiatook are Production (288 | 7.3%), Material Moving (169 | 4.3%), and Transportation (104 | 2.6%).
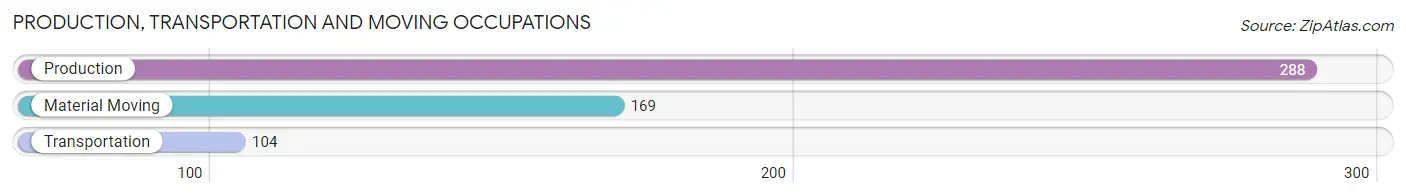
Production, Transportation and Moving Occupations by Sex
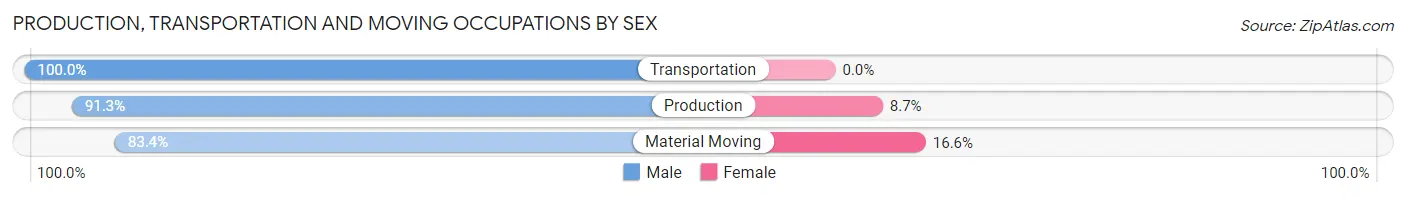
| Occupation | Male | Female |
| Production | 263 (91.3%) | 25 (8.7%) |
| Transportation | 104 (100.0%) | 0 (0.0%) |
| Material Moving | 141 (83.4%) | 28 (16.6%) |
| Total (Category) | 508 (90.5%) | 53 (9.5%) |
| Total (Overall) | 2,031 (51.5%) | 1,909 (48.4%) |
Employment Industries by Sex in Skiatook
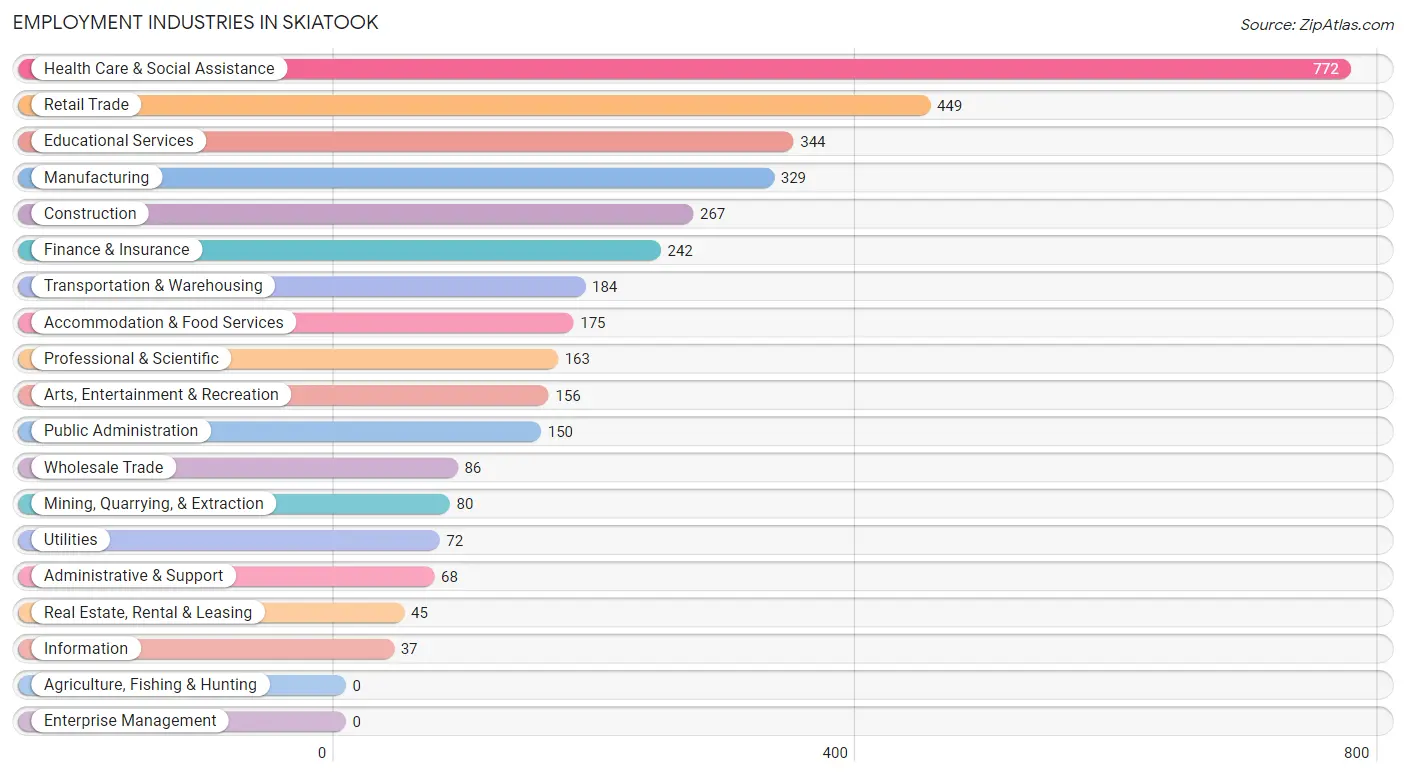
Employment Industries in Skiatook
The major employment industries in Skiatook include Health Care & Social Assistance (772 | 19.6%), Retail Trade (449 | 11.4%), Educational Services (344 | 8.7%), Manufacturing (329 | 8.4%), and Construction (267 | 6.8%).
Employment Industries by Sex in Skiatook
The Skiatook industries that see more men than women are Administrative & Support (91.2%), Manufacturing (88.7%), and Mining, Quarrying, & Extraction (86.3%), whereas the industries that tend to have a higher number of women are Health Care & Social Assistance (84.5%), Finance & Insurance (78.9%), and Educational Services (71.8%).
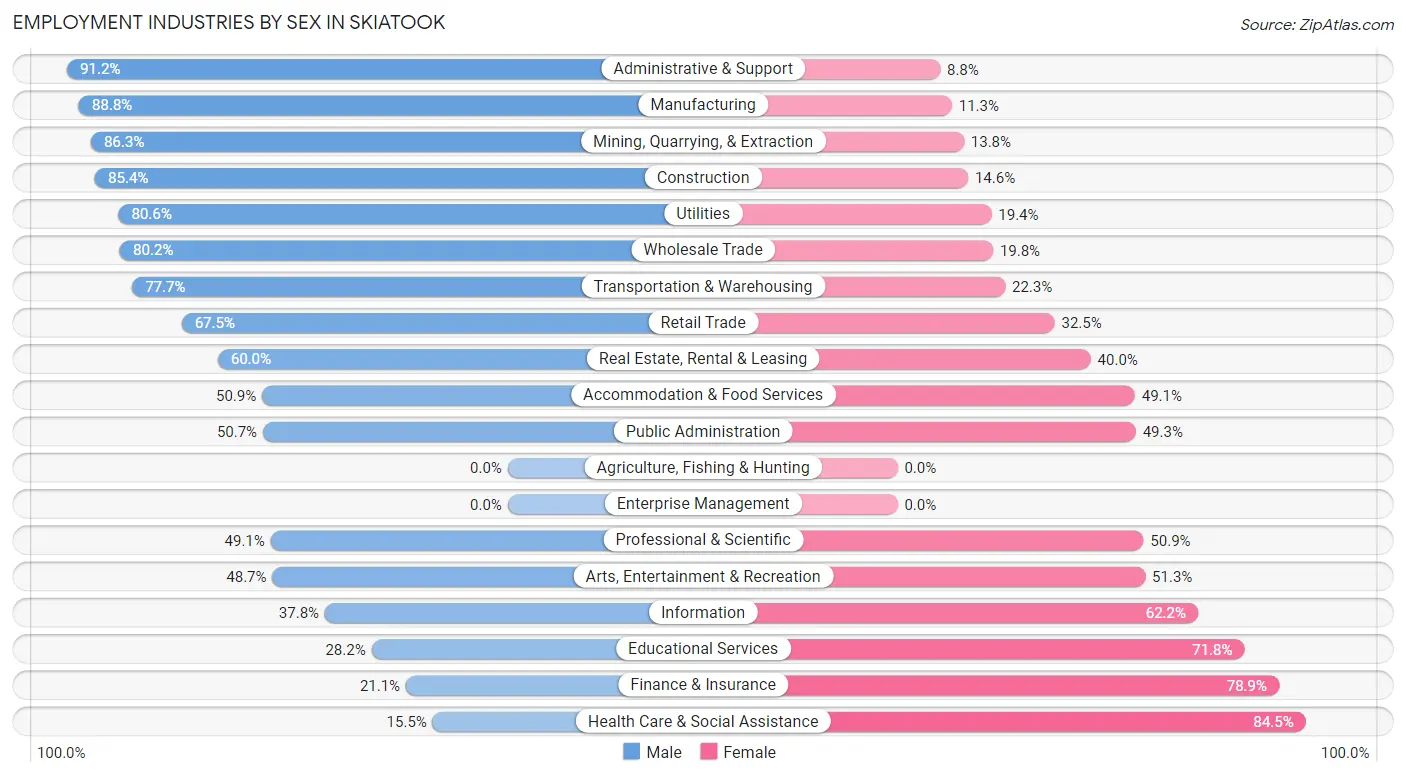
| Industry | Male | Female |
| Agriculture, Fishing & Hunting | 0 (0.0%) | 0 (0.0%) |
| Mining, Quarrying, & Extraction | 69 (86.3%) | 11 (13.8%) |
| Construction | 228 (85.4%) | 39 (14.6%) |
| Manufacturing | 292 (88.7%) | 37 (11.3%) |
| Wholesale Trade | 69 (80.2%) | 17 (19.8%) |
| Retail Trade | 303 (67.5%) | 146 (32.5%) |
| Transportation & Warehousing | 143 (77.7%) | 41 (22.3%) |
| Utilities | 58 (80.6%) | 14 (19.4%) |
| Information | 14 (37.8%) | 23 (62.2%) |
| Finance & Insurance | 51 (21.1%) | 191 (78.9%) |
| Real Estate, Rental & Leasing | 27 (60.0%) | 18 (40.0%) |
| Professional & Scientific | 80 (49.1%) | 83 (50.9%) |
| Enterprise Management | 0 (0.0%) | 0 (0.0%) |
| Administrative & Support | 62 (91.2%) | 6 (8.8%) |
| Educational Services | 97 (28.2%) | 247 (71.8%) |
| Health Care & Social Assistance | 120 (15.5%) | 652 (84.5%) |
| Arts, Entertainment & Recreation | 76 (48.7%) | 80 (51.3%) |
| Accommodation & Food Services | 89 (50.9%) | 86 (49.1%) |
| Public Administration | 76 (50.7%) | 74 (49.3%) |
| Total | 2,031 (51.5%) | 1,909 (48.4%) |
Education in Skiatook
School Enrollment in Skiatook
The most common levels of schooling among the 2,189 students in Skiatook are high school (501 | 22.9%), elementary school (481 | 22.0%), and middle school (474 | 21.6%).
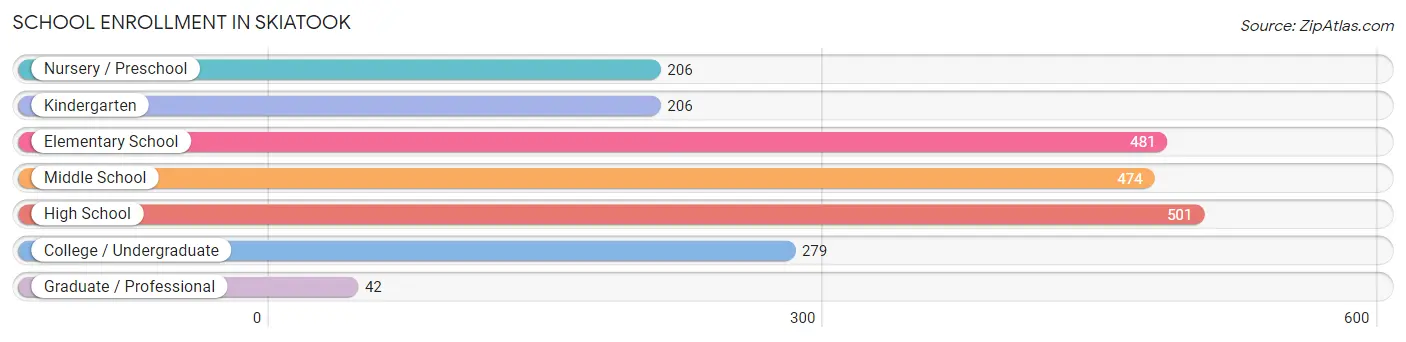
| School Level | # Students | % Students |
| Nursery / Preschool | 206 | 9.4% |
| Kindergarten | 206 | 9.4% |
| Elementary School | 481 | 22.0% |
| Middle School | 474 | 21.6% |
| High School | 501 | 22.9% |
| College / Undergraduate | 279 | 12.8% |
| Graduate / Professional | 42 | 1.9% |
| Total | 2,189 | 100.0% |
School Enrollment by Age by Funding Source in Skiatook
Out of a total of 2,189 students who are enrolled in schools in Skiatook, 293 (13.4%) attend a private institution, while the remaining 1,896 (86.6%) are enrolled in public schools. The age group of 3 to 4 year olds has the highest likelihood of being enrolled in private schools, with 84 (56.0% in the age bracket) enrolled. Conversely, the age group of 20 to 24 year olds has the lowest likelihood of being enrolled in a private school, with 85 (100.0% in the age bracket) attending a public institution.
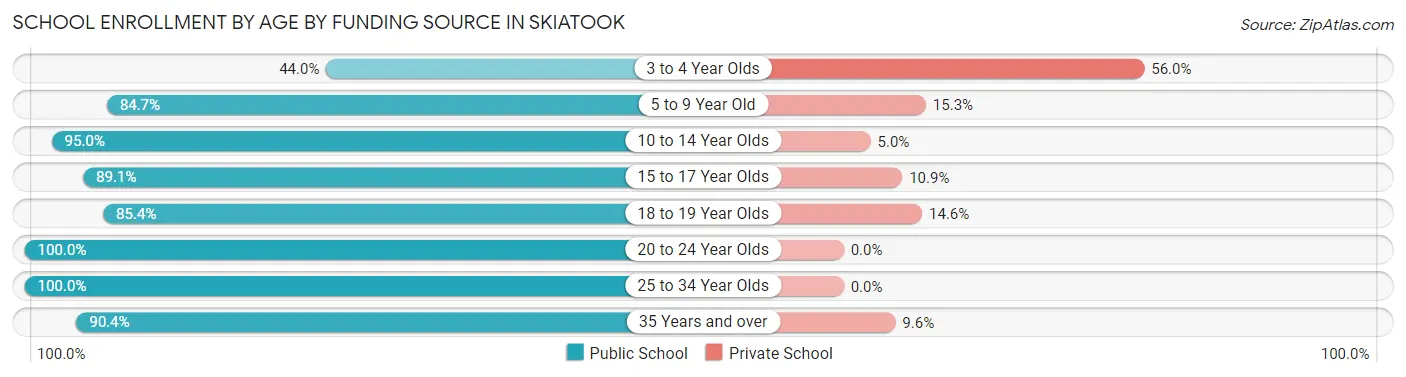
| Age Bracket | Public School | Private School |
| 3 to 4 Year Olds | 66 (44.0%) | 84 (56.0%) |
| 5 to 9 Year Old | 586 (84.7%) | 106 (15.3%) |
| 10 to 14 Year Olds | 511 (95.0%) | 27 (5.0%) |
| 15 to 17 Year Olds | 294 (89.1%) | 36 (10.9%) |
| 18 to 19 Year Olds | 187 (85.4%) | 32 (14.6%) |
| 20 to 24 Year Olds | 85 (100.0%) | 0 (0.0%) |
| 25 to 34 Year Olds | 92 (100.0%) | 0 (0.0%) |
| 35 Years and over | 75 (90.4%) | 8 (9.6%) |
| Total | 1,896 (86.6%) | 293 (13.4%) |
Educational Attainment by Field of Study in Skiatook
Business (238 | 23.2%), education (226 | 22.0%), science & technology (118 | 11.5%), arts & humanities (118 | 11.5%), and bio, nature & agricultural (65 | 6.3%) are the most common fields of study among 1,027 individuals in Skiatook who have obtained a bachelor's degree or higher.
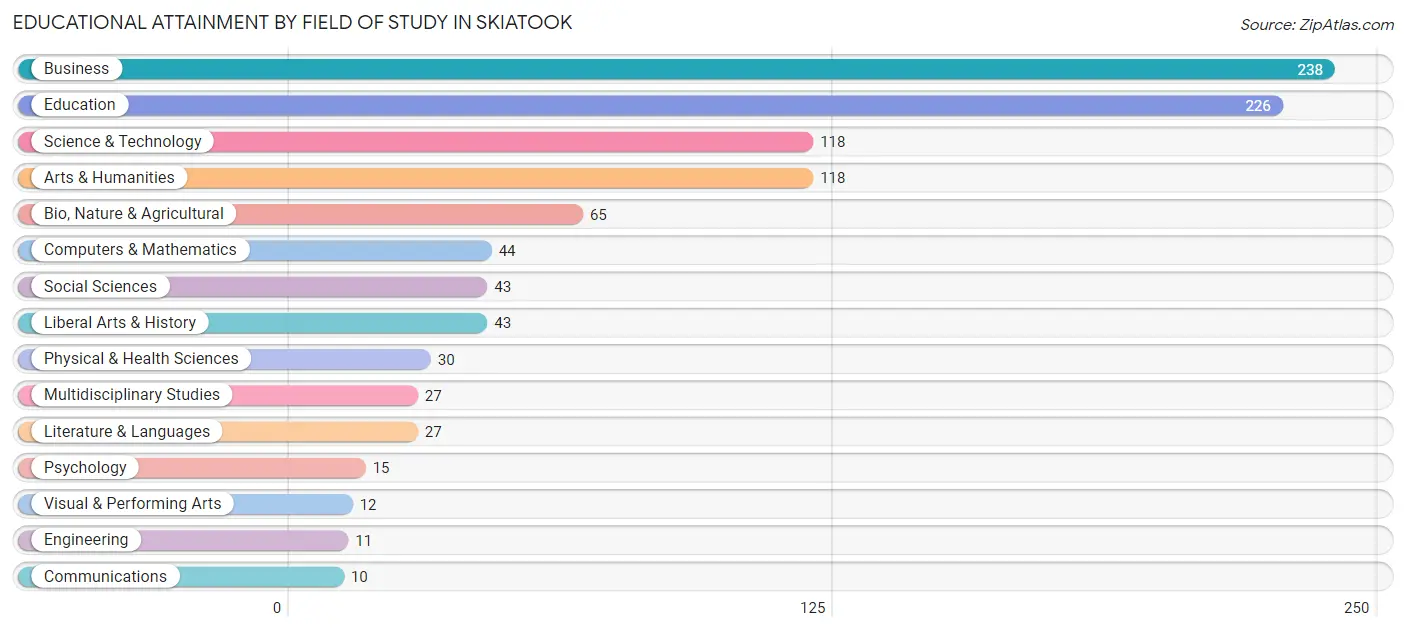
| Field of Study | # Graduates | % Graduates |
| Computers & Mathematics | 44 | 4.3% |
| Bio, Nature & Agricultural | 65 | 6.3% |
| Physical & Health Sciences | 30 | 2.9% |
| Psychology | 15 | 1.5% |
| Social Sciences | 43 | 4.2% |
| Engineering | 11 | 1.1% |
| Multidisciplinary Studies | 27 | 2.6% |
| Science & Technology | 118 | 11.5% |
| Business | 238 | 23.2% |
| Education | 226 | 22.0% |
| Literature & Languages | 27 | 2.6% |
| Liberal Arts & History | 43 | 4.2% |
| Visual & Performing Arts | 12 | 1.2% |
| Communications | 10 | 1.0% |
| Arts & Humanities | 118 | 11.5% |
| Total | 1,027 | 100.0% |
Transportation & Commute in Skiatook
Vehicle Availability by Sex in Skiatook
The most prevalent vehicle ownership categories in Skiatook are males with 2 vehicles (943, accounting for 47.8%) and females with 2 vehicles (932, making up 52.6%).
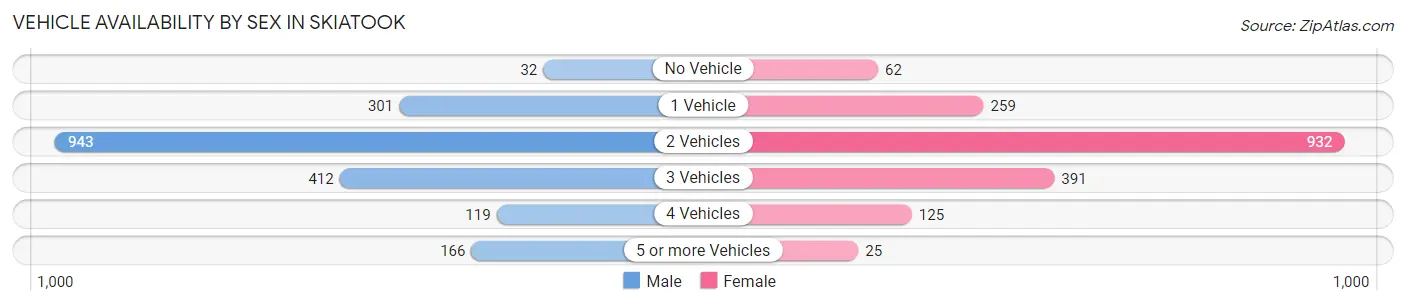
| Vehicles Available | Male | Female |
| No Vehicle | 32 (1.6%) | 62 (3.5%) |
| 1 Vehicle | 301 (15.3%) | 259 (14.4%) |
| 2 Vehicles | 943 (47.8%) | 932 (51.9%) |
| 3 Vehicles | 412 (20.9%) | 391 (21.8%) |
| 4 Vehicles | 119 (6.0%) | 125 (7.0%) |
| 5 or more Vehicles | 166 (8.4%) | 25 (1.4%) |
| Total | 1,973 (100.0%) | 1,794 (100.0%) |
Commute Time in Skiatook
The most frequently occuring commute durations in Skiatook are 30 to 34 minutes (688 commuters, 20.3%), 5 to 9 minutes (455 commuters, 13.4%), and 45 to 59 minutes (433 commuters, 12.8%).
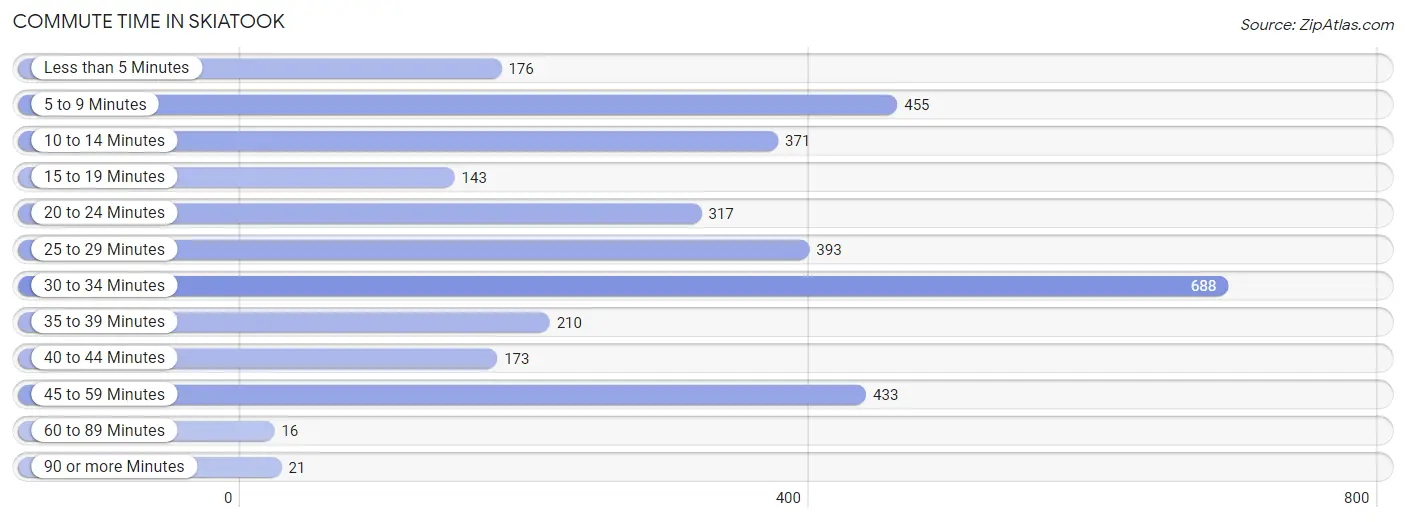
| Commute Time | # Commuters | % Commuters |
| Less than 5 Minutes | 176 | 5.2% |
| 5 to 9 Minutes | 455 | 13.4% |
| 10 to 14 Minutes | 371 | 10.9% |
| 15 to 19 Minutes | 143 | 4.2% |
| 20 to 24 Minutes | 317 | 9.3% |
| 25 to 29 Minutes | 393 | 11.6% |
| 30 to 34 Minutes | 688 | 20.3% |
| 35 to 39 Minutes | 210 | 6.2% |
| 40 to 44 Minutes | 173 | 5.1% |
| 45 to 59 Minutes | 433 | 12.8% |
| 60 to 89 Minutes | 16 | 0.5% |
| 90 or more Minutes | 21 | 0.6% |
Commute Time by Sex in Skiatook
The most common commute times in Skiatook are 30 to 34 minutes (420 commuters, 23.5%) for males and 5 to 9 minutes (284 commuters, 17.6%) for females.
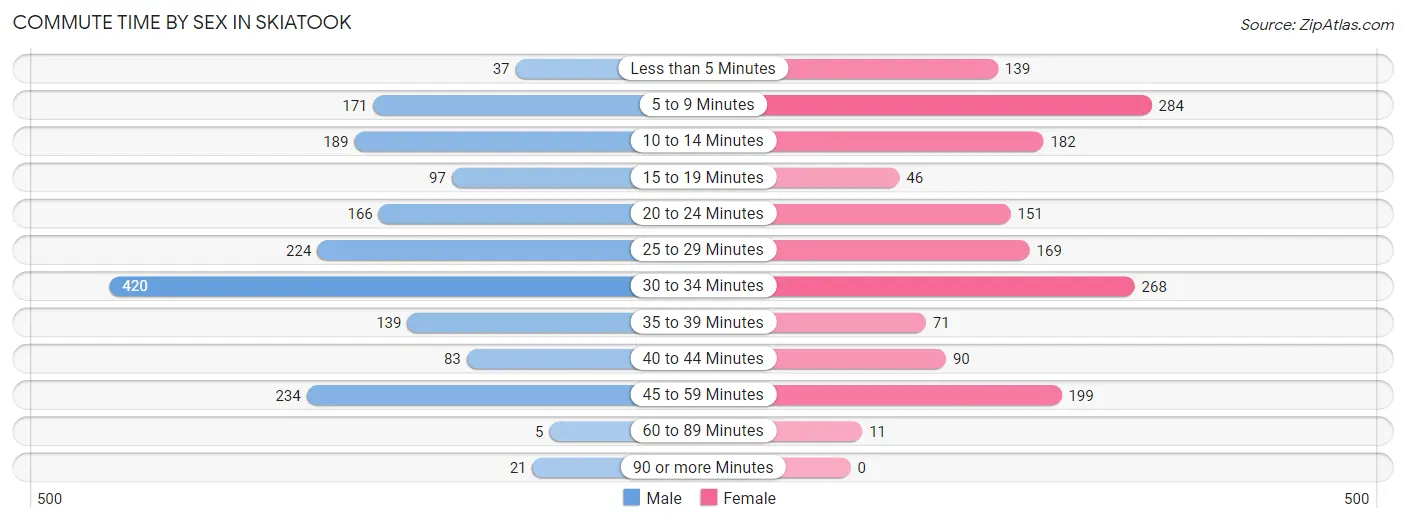
| Commute Time | Male | Female |
| Less than 5 Minutes | 37 (2.1%) | 139 (8.6%) |
| 5 to 9 Minutes | 171 (9.6%) | 284 (17.6%) |
| 10 to 14 Minutes | 189 (10.6%) | 182 (11.3%) |
| 15 to 19 Minutes | 97 (5.4%) | 46 (2.9%) |
| 20 to 24 Minutes | 166 (9.3%) | 151 (9.4%) |
| 25 to 29 Minutes | 224 (12.5%) | 169 (10.5%) |
| 30 to 34 Minutes | 420 (23.5%) | 268 (16.7%) |
| 35 to 39 Minutes | 139 (7.8%) | 71 (4.4%) |
| 40 to 44 Minutes | 83 (4.6%) | 90 (5.6%) |
| 45 to 59 Minutes | 234 (13.1%) | 199 (12.4%) |
| 60 to 89 Minutes | 5 (0.3%) | 11 (0.7%) |
| 90 or more Minutes | 21 (1.2%) | 0 (0.0%) |
Time of Departure to Work by Sex in Skiatook
The most frequent times of departure to work in Skiatook are 7:00 AM to 7:29 AM (292, 16.4%) for males and 7:30 AM to 7:59 AM (348, 21.6%) for females.
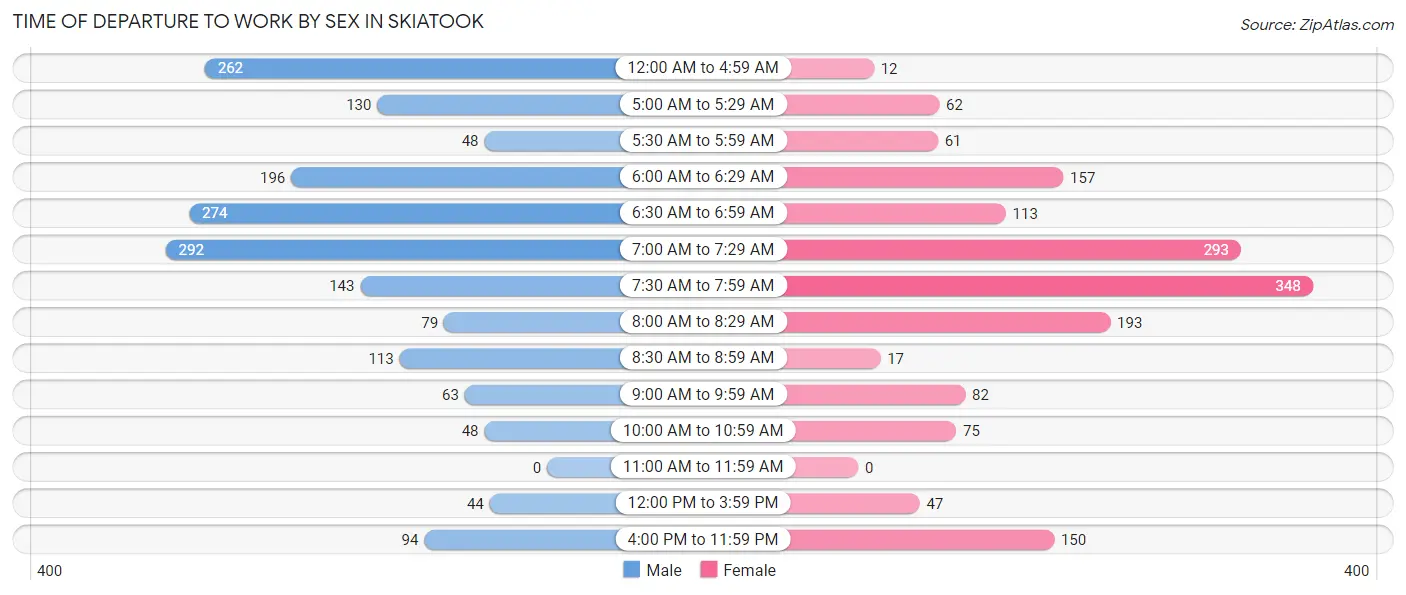
| Time of Departure | Male | Female |
| 12:00 AM to 4:59 AM | 262 (14.7%) | 12 (0.7%) |
| 5:00 AM to 5:29 AM | 130 (7.3%) | 62 (3.8%) |
| 5:30 AM to 5:59 AM | 48 (2.7%) | 61 (3.8%) |
| 6:00 AM to 6:29 AM | 196 (11.0%) | 157 (9.8%) |
| 6:30 AM to 6:59 AM | 274 (15.3%) | 113 (7.0%) |
| 7:00 AM to 7:29 AM | 292 (16.4%) | 293 (18.2%) |
| 7:30 AM to 7:59 AM | 143 (8.0%) | 348 (21.6%) |
| 8:00 AM to 8:29 AM | 79 (4.4%) | 193 (12.0%) |
| 8:30 AM to 8:59 AM | 113 (6.3%) | 17 (1.1%) |
| 9:00 AM to 9:59 AM | 63 (3.5%) | 82 (5.1%) |
| 10:00 AM to 10:59 AM | 48 (2.7%) | 75 (4.7%) |
| 11:00 AM to 11:59 AM | 0 (0.0%) | 0 (0.0%) |
| 12:00 PM to 3:59 PM | 44 (2.5%) | 47 (2.9%) |
| 4:00 PM to 11:59 PM | 94 (5.3%) | 150 (9.3%) |
| Total | 1,786 (100.0%) | 1,610 (100.0%) |
Housing Occupancy in Skiatook
Occupancy by Ownership in Skiatook
Of the total 3,108 dwellings in Skiatook, owner-occupied units account for 2,027 (65.2%), while renter-occupied units make up 1,081 (34.8%).
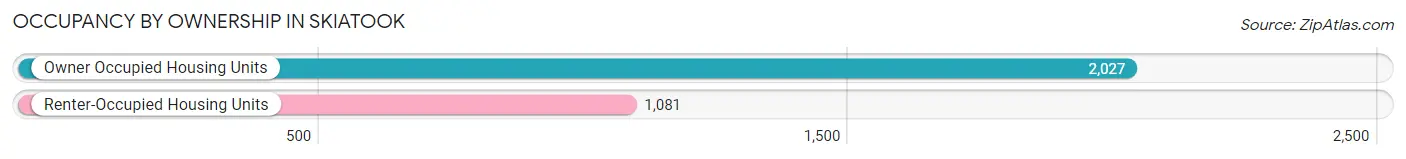
| Occupancy | # Housing Units | % Housing Units |
| Owner Occupied Housing Units | 2,027 | 65.2% |
| Renter-Occupied Housing Units | 1,081 | 34.8% |
| Total Occupied Housing Units | 3,108 | 100.0% |
Occupancy by Household Size in Skiatook
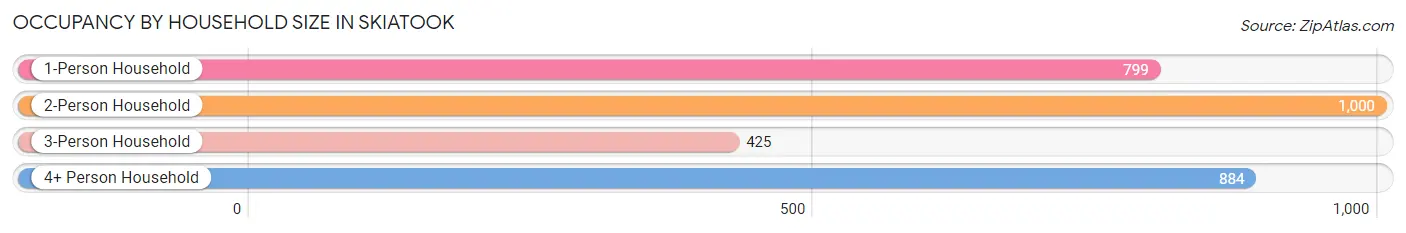
| Household Size | # Housing Units | % Housing Units |
| 1-Person Household | 799 | 25.7% |
| 2-Person Household | 1,000 | 32.2% |
| 3-Person Household | 425 | 13.7% |
| 4+ Person Household | 884 | 28.4% |
| Total Housing Units | 3,108 | 100.0% |
Occupancy by Ownership by Household Size in Skiatook
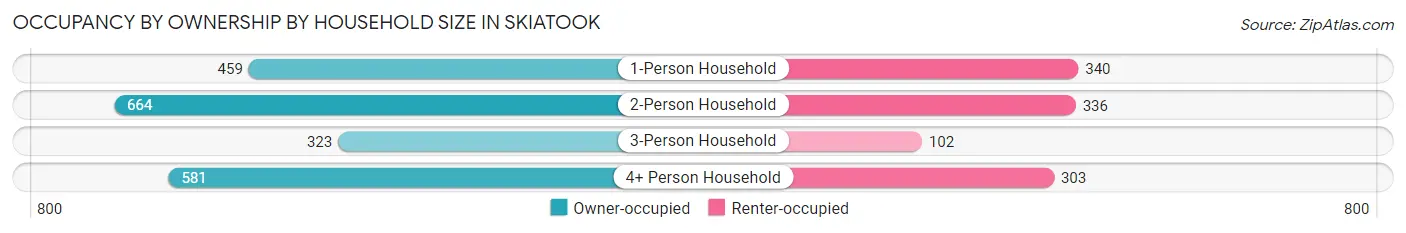
| Household Size | Owner-occupied | Renter-occupied |
| 1-Person Household | 459 (57.5%) | 340 (42.5%) |
| 2-Person Household | 664 (66.4%) | 336 (33.6%) |
| 3-Person Household | 323 (76.0%) | 102 (24.0%) |
| 4+ Person Household | 581 (65.7%) | 303 (34.3%) |
| Total Housing Units | 2,027 (65.2%) | 1,081 (34.8%) |
Occupancy by Educational Attainment in Skiatook
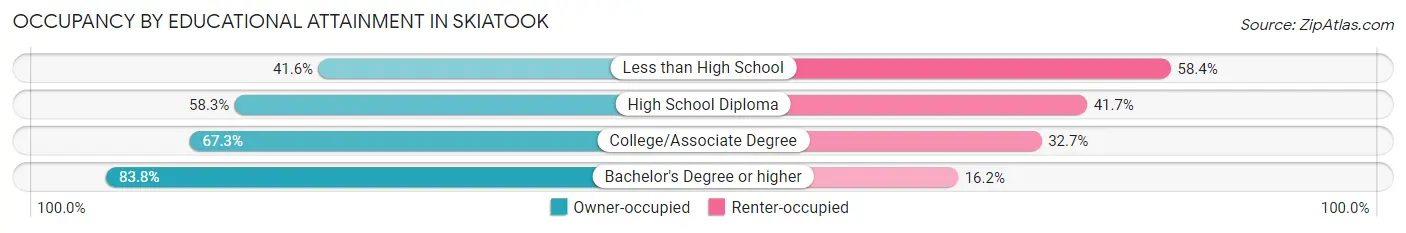
| Household Size | Owner-occupied | Renter-occupied |
| Less than High School | 117 (41.6%) | 164 (58.4%) |
| High School Diploma | 557 (58.3%) | 399 (41.7%) |
| College/Associate Degree | 876 (67.3%) | 426 (32.7%) |
| Bachelor's Degree or higher | 477 (83.8%) | 92 (16.2%) |
Occupancy by Age of Householder in Skiatook
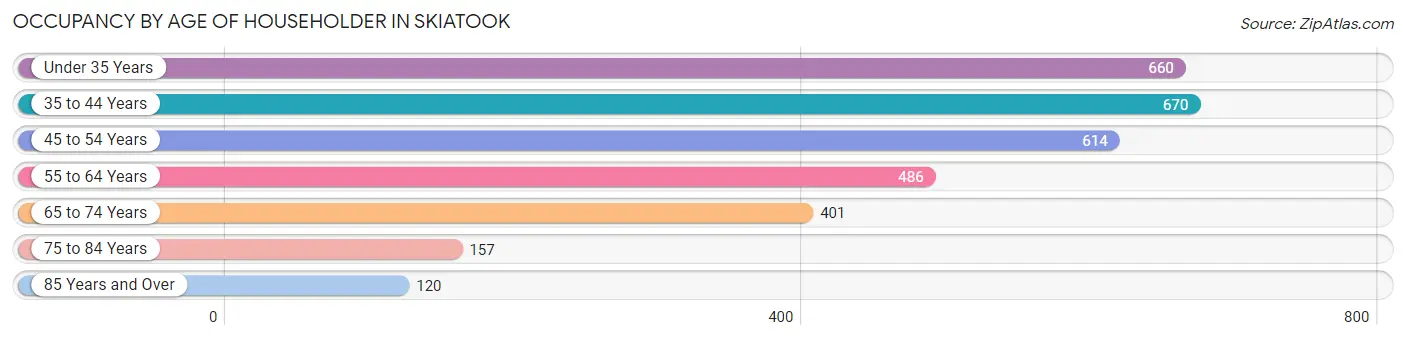
| Age Bracket | # Households | % Households |
| Under 35 Years | 660 | 21.2% |
| 35 to 44 Years | 670 | 21.6% |
| 45 to 54 Years | 614 | 19.8% |
| 55 to 64 Years | 486 | 15.6% |
| 65 to 74 Years | 401 | 12.9% |
| 75 to 84 Years | 157 | 5.1% |
| 85 Years and Over | 120 | 3.9% |
| Total | 3,108 | 100.0% |
Housing Finances in Skiatook
Median Income by Occupancy in Skiatook
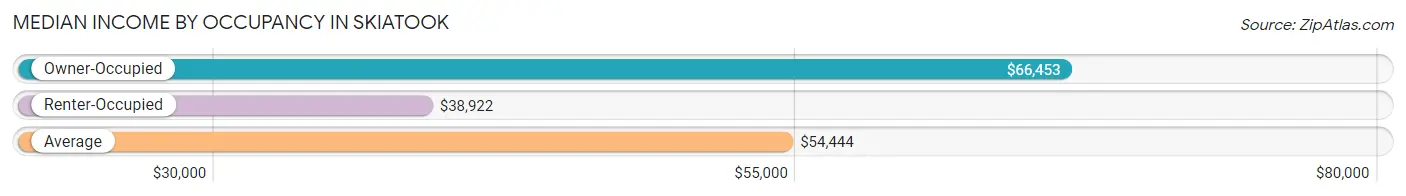
| Occupancy Type | # Households | Median Income |
| Owner-Occupied | 2,027 (65.2%) | $66,453 |
| Renter-Occupied | 1,081 (34.8%) | $38,922 |
| Average | 3,108 (100.0%) | $54,444 |
Occupancy by Householder Income Bracket in Skiatook
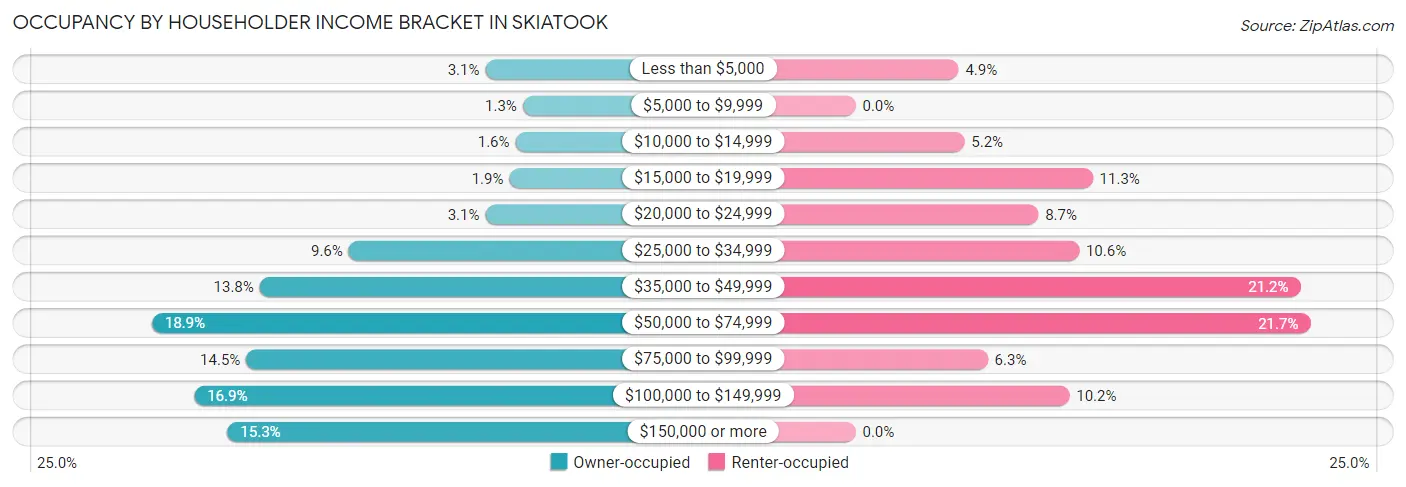
| Income Bracket | Owner-occupied | Renter-occupied |
| Less than $5,000 | 62 (3.1%) | 53 (4.9%) |
| $5,000 to $9,999 | 26 (1.3%) | 0 (0.0%) |
| $10,000 to $14,999 | 33 (1.6%) | 56 (5.2%) |
| $15,000 to $19,999 | 39 (1.9%) | 122 (11.3%) |
| $20,000 to $24,999 | 62 (3.1%) | 94 (8.7%) |
| $25,000 to $34,999 | 194 (9.6%) | 115 (10.6%) |
| $35,000 to $49,999 | 280 (13.8%) | 229 (21.2%) |
| $50,000 to $74,999 | 384 (18.9%) | 234 (21.6%) |
| $75,000 to $99,999 | 293 (14.4%) | 68 (6.3%) |
| $100,000 to $149,999 | 343 (16.9%) | 110 (10.2%) |
| $150,000 or more | 311 (15.3%) | 0 (0.0%) |
| Total | 2,027 (100.0%) | 1,081 (100.0%) |
Monthly Housing Cost Tiers in Skiatook
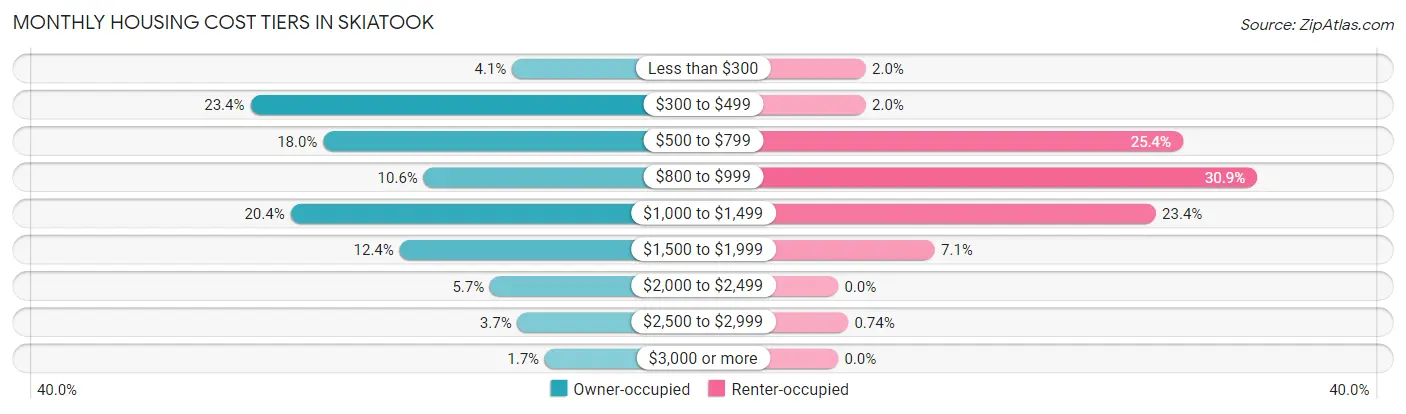
| Monthly Cost | Owner-occupied | Renter-occupied |
| Less than $300 | 83 (4.1%) | 22 (2.0%) |
| $300 to $499 | 474 (23.4%) | 22 (2.0%) |
| $500 to $799 | 365 (18.0%) | 275 (25.4%) |
| $800 to $999 | 215 (10.6%) | 334 (30.9%) |
| $1,000 to $1,499 | 414 (20.4%) | 253 (23.4%) |
| $1,500 to $1,999 | 251 (12.4%) | 77 (7.1%) |
| $2,000 to $2,499 | 116 (5.7%) | 0 (0.0%) |
| $2,500 to $2,999 | 75 (3.7%) | 8 (0.7%) |
| $3,000 or more | 34 (1.7%) | 0 (0.0%) |
| Total | 2,027 (100.0%) | 1,081 (100.0%) |
Physical Housing Characteristics in Skiatook
Housing Structures in Skiatook
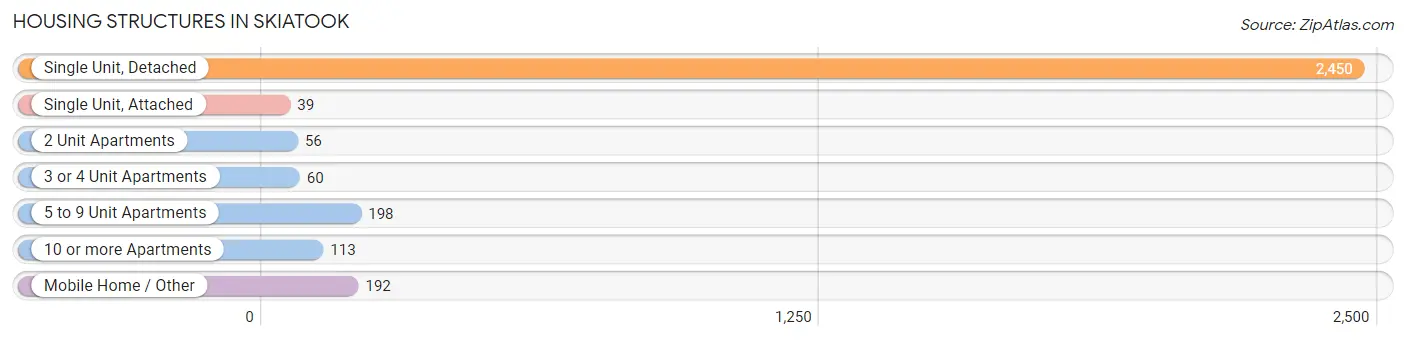
| Structure Type | # Housing Units | % Housing Units |
| Single Unit, Detached | 2,450 | 78.8% |
| Single Unit, Attached | 39 | 1.3% |
| 2 Unit Apartments | 56 | 1.8% |
| 3 or 4 Unit Apartments | 60 | 1.9% |
| 5 to 9 Unit Apartments | 198 | 6.4% |
| 10 or more Apartments | 113 | 3.6% |
| Mobile Home / Other | 192 | 6.2% |
| Total | 3,108 | 100.0% |
Housing Structures by Occupancy in Skiatook
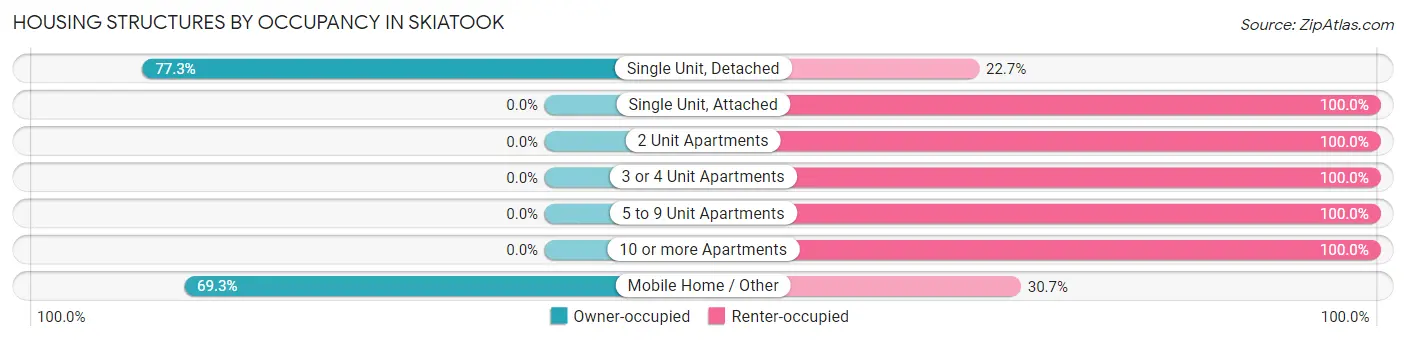
| Structure Type | Owner-occupied | Renter-occupied |
| Single Unit, Detached | 1,894 (77.3%) | 556 (22.7%) |
| Single Unit, Attached | 0 (0.0%) | 39 (100.0%) |
| 2 Unit Apartments | 0 (0.0%) | 56 (100.0%) |
| 3 or 4 Unit Apartments | 0 (0.0%) | 60 (100.0%) |
| 5 to 9 Unit Apartments | 0 (0.0%) | 198 (100.0%) |
| 10 or more Apartments | 0 (0.0%) | 113 (100.0%) |
| Mobile Home / Other | 133 (69.3%) | 59 (30.7%) |
| Total | 2,027 (65.2%) | 1,081 (34.8%) |
Housing Structures by Number of Rooms in Skiatook
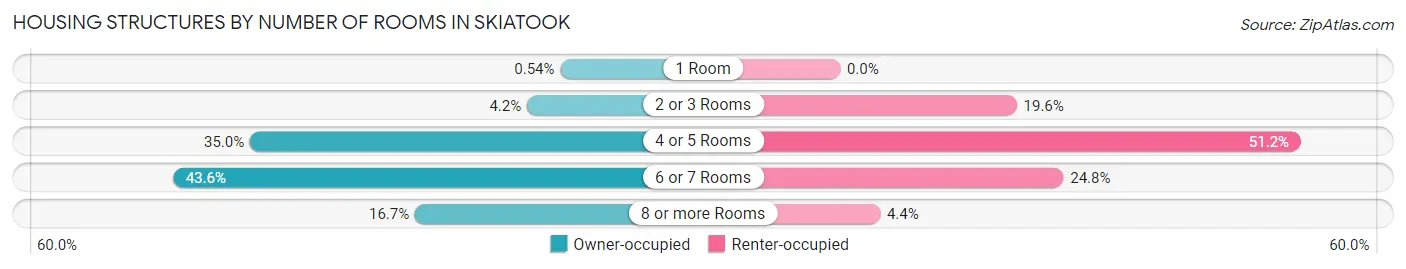
| Number of Rooms | Owner-occupied | Renter-occupied |
| 1 Room | 11 (0.5%) | 0 (0.0%) |
| 2 or 3 Rooms | 86 (4.2%) | 212 (19.6%) |
| 4 or 5 Rooms | 709 (35.0%) | 553 (51.2%) |
| 6 or 7 Rooms | 883 (43.6%) | 268 (24.8%) |
| 8 or more Rooms | 338 (16.7%) | 48 (4.4%) |
| Total | 2,027 (100.0%) | 1,081 (100.0%) |
Housing Structure by Heating Type in Skiatook
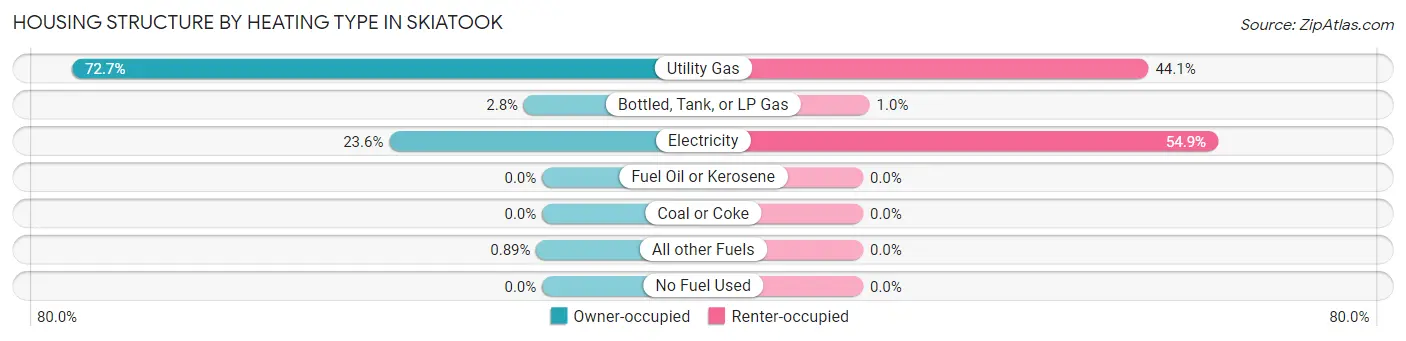
| Heating Type | Owner-occupied | Renter-occupied |
| Utility Gas | 1,473 (72.7%) | 477 (44.1%) |
| Bottled, Tank, or LP Gas | 57 (2.8%) | 11 (1.0%) |
| Electricity | 479 (23.6%) | 593 (54.9%) |
| Fuel Oil or Kerosene | 0 (0.0%) | 0 (0.0%) |
| Coal or Coke | 0 (0.0%) | 0 (0.0%) |
| All other Fuels | 18 (0.9%) | 0 (0.0%) |
| No Fuel Used | 0 (0.0%) | 0 (0.0%) |
| Total | 2,027 (100.0%) | 1,081 (100.0%) |
Household Vehicle Usage in Skiatook
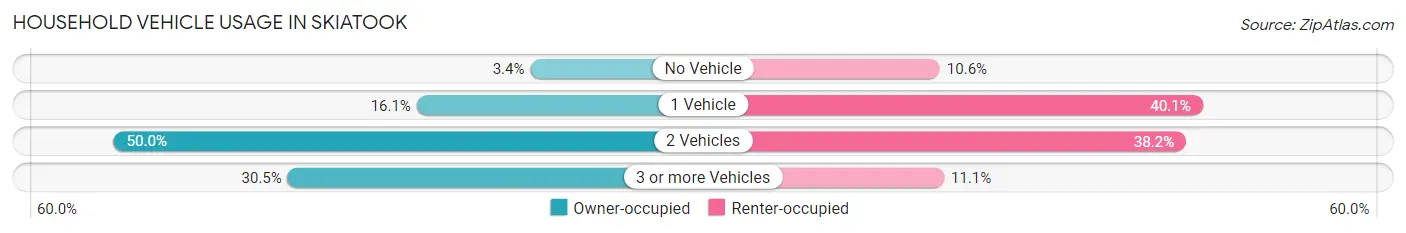
| Vehicles per Household | Owner-occupied | Renter-occupied |
| No Vehicle | 68 (3.4%) | 115 (10.6%) |
| 1 Vehicle | 326 (16.1%) | 433 (40.1%) |
| 2 Vehicles | 1,014 (50.0%) | 413 (38.2%) |
| 3 or more Vehicles | 619 (30.5%) | 120 (11.1%) |
| Total | 2,027 (100.0%) | 1,081 (100.0%) |
Real Estate & Mortgages in Skiatook
Real Estate and Mortgage Overview in Skiatook
| Characteristic | Without Mortgage | With Mortgage |
| Housing Units | 787 | 1,240 |
| Median Property Value | $98,300 | $173,400 |
| Median Household Income | $53,646 | $259 |
| Monthly Housing Costs | $435 | $34 |
| Real Estate Taxes | $906 | $132 |
Property Value by Mortgage Status in Skiatook
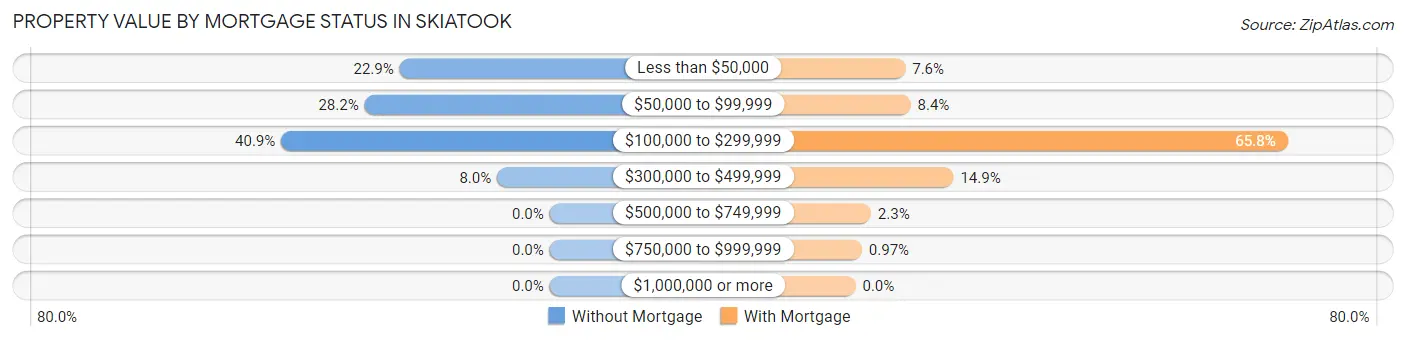
| Property Value | Without Mortgage | With Mortgage |
| Less than $50,000 | 180 (22.9%) | 94 (7.6%) |
| $50,000 to $99,999 | 222 (28.2%) | 104 (8.4%) |
| $100,000 to $299,999 | 322 (40.9%) | 816 (65.8%) |
| $300,000 to $499,999 | 63 (8.0%) | 185 (14.9%) |
| $500,000 to $749,999 | 0 (0.0%) | 29 (2.3%) |
| $750,000 to $999,999 | 0 (0.0%) | 12 (1.0%) |
| $1,000,000 or more | 0 (0.0%) | 0 (0.0%) |
| Total | 787 (100.0%) | 1,240 (100.0%) |
Household Income by Mortgage Status in Skiatook
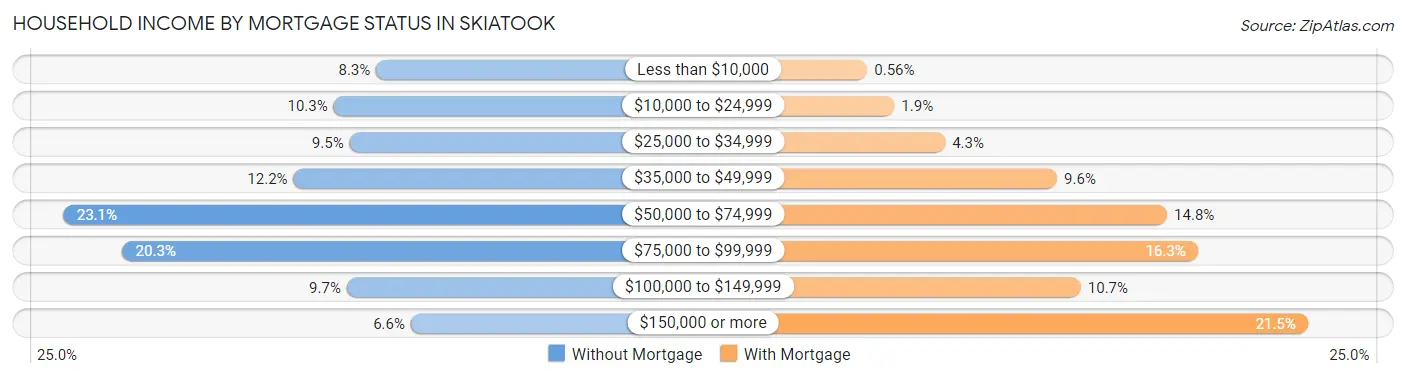
| Household Income | Without Mortgage | With Mortgage |
| Less than $10,000 | 65 (8.3%) | 7 (0.6%) |
| $10,000 to $24,999 | 81 (10.3%) | 23 (1.8%) |
| $25,000 to $34,999 | 75 (9.5%) | 53 (4.3%) |
| $35,000 to $49,999 | 96 (12.2%) | 119 (9.6%) |
| $50,000 to $74,999 | 182 (23.1%) | 184 (14.8%) |
| $75,000 to $99,999 | 160 (20.3%) | 202 (16.3%) |
| $100,000 to $149,999 | 76 (9.7%) | 133 (10.7%) |
| $150,000 or more | 52 (6.6%) | 267 (21.5%) |
| Total | 787 (100.0%) | 1,240 (100.0%) |
Property Value to Household Income Ratio in Skiatook
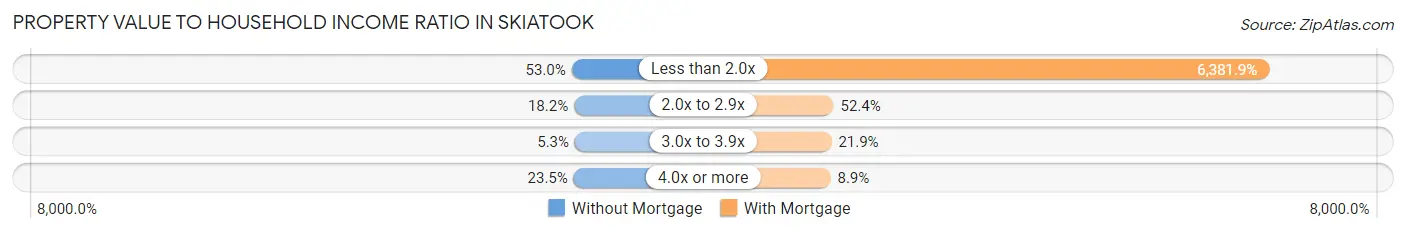
| Value-to-Income Ratio | Without Mortgage | With Mortgage |
| Less than 2.0x | 417 (53.0%) | 79,135 (6,381.9%) |
| 2.0x to 2.9x | 143 (18.2%) | 650 (52.4%) |
| 3.0x to 3.9x | 42 (5.3%) | 272 (21.9%) |
| 4.0x or more | 185 (23.5%) | 110 (8.9%) |
| Total | 787 (100.0%) | 1,240 (100.0%) |
Real Estate Taxes by Mortgage Status in Skiatook
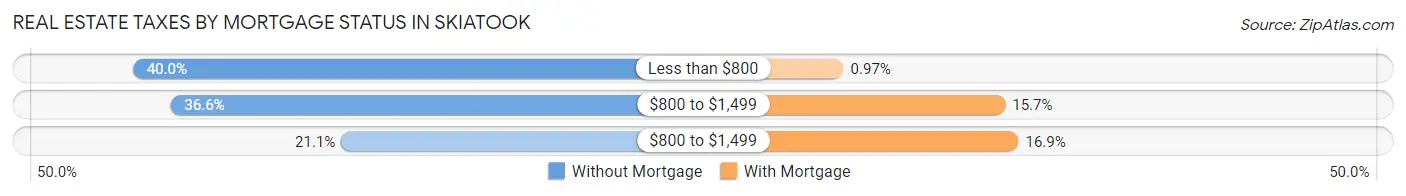
| Property Taxes | Without Mortgage | With Mortgage |
| Less than $800 | 315 (40.0%) | 12 (1.0%) |
| $800 to $1,499 | 288 (36.6%) | 195 (15.7%) |
| $800 to $1,499 | 166 (21.1%) | 210 (16.9%) |
| Total | 787 (100.0%) | 1,240 (100.0%) |
Health & Disability in Skiatook
Health Insurance Coverage by Age in Skiatook
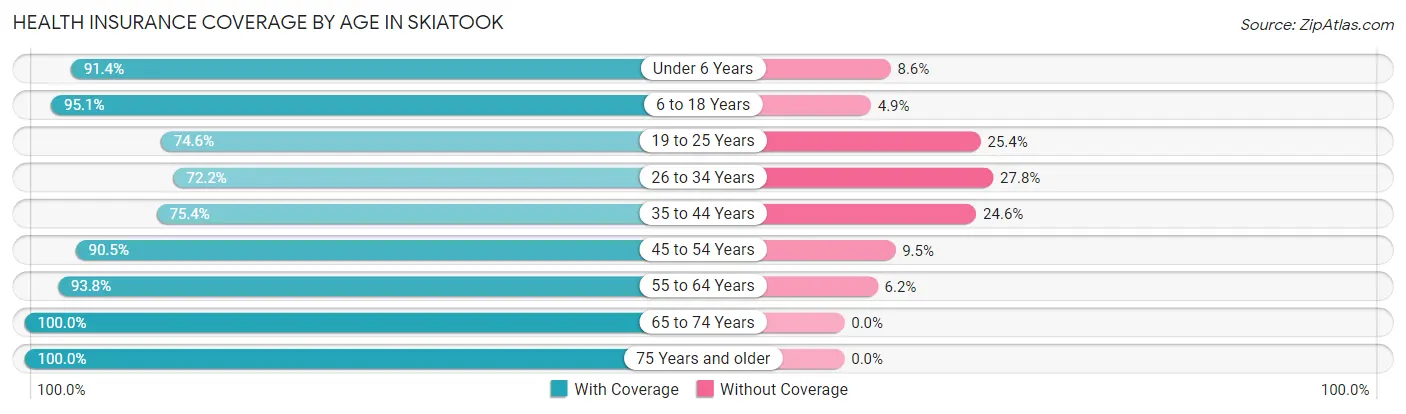
| Age Bracket | With Coverage | Without Coverage |
| Under 6 Years | 657 (91.4%) | 62 (8.6%) |
| 6 to 18 Years | 1,462 (95.1%) | 76 (4.9%) |
| 19 to 25 Years | 631 (74.6%) | 215 (25.4%) |
| 26 to 34 Years | 721 (72.2%) | 277 (27.8%) |
| 35 to 44 Years | 975 (75.4%) | 318 (24.6%) |
| 45 to 54 Years | 914 (90.5%) | 96 (9.5%) |
| 55 to 64 Years | 816 (93.8%) | 54 (6.2%) |
| 65 to 74 Years | 701 (100.0%) | 0 (0.0%) |
| 75 Years and older | 438 (100.0%) | 0 (0.0%) |
| Total | 7,315 (87.0%) | 1,098 (13.1%) |
Health Insurance Coverage by Citizenship Status in Skiatook
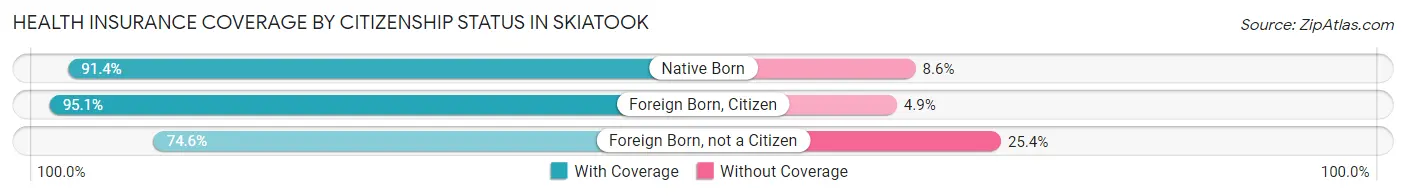
| Citizenship Status | With Coverage | Without Coverage |
| Native Born | 657 (91.4%) | 62 (8.6%) |
| Foreign Born, Citizen | 1,462 (95.1%) | 76 (4.9%) |
| Foreign Born, not a Citizen | 631 (74.6%) | 215 (25.4%) |
Health Insurance Coverage by Household Income in Skiatook
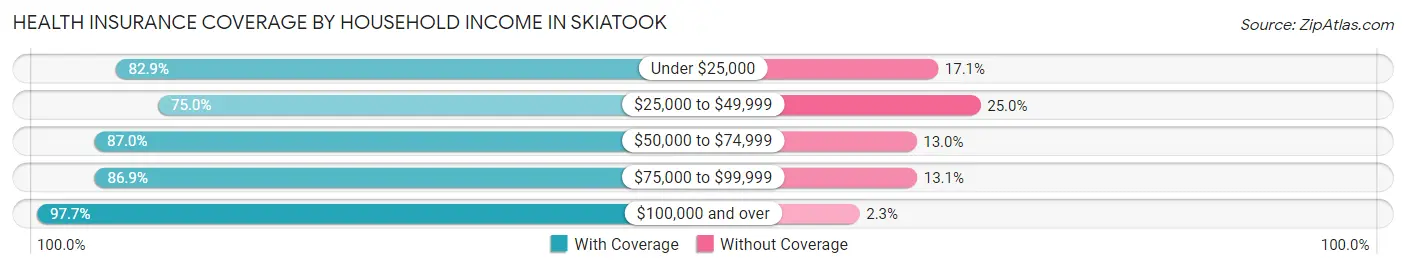
| Household Income | With Coverage | Without Coverage |
| Under $25,000 | 773 (82.9%) | 159 (17.1%) |
| $25,000 to $49,999 | 1,508 (75.0%) | 503 (25.0%) |
| $50,000 to $74,999 | 1,503 (87.0%) | 225 (13.0%) |
| $75,000 to $99,999 | 981 (86.9%) | 148 (13.1%) |
| $100,000 and over | 2,549 (97.7%) | 61 (2.3%) |
Public vs Private Health Insurance Coverage by Age in Skiatook
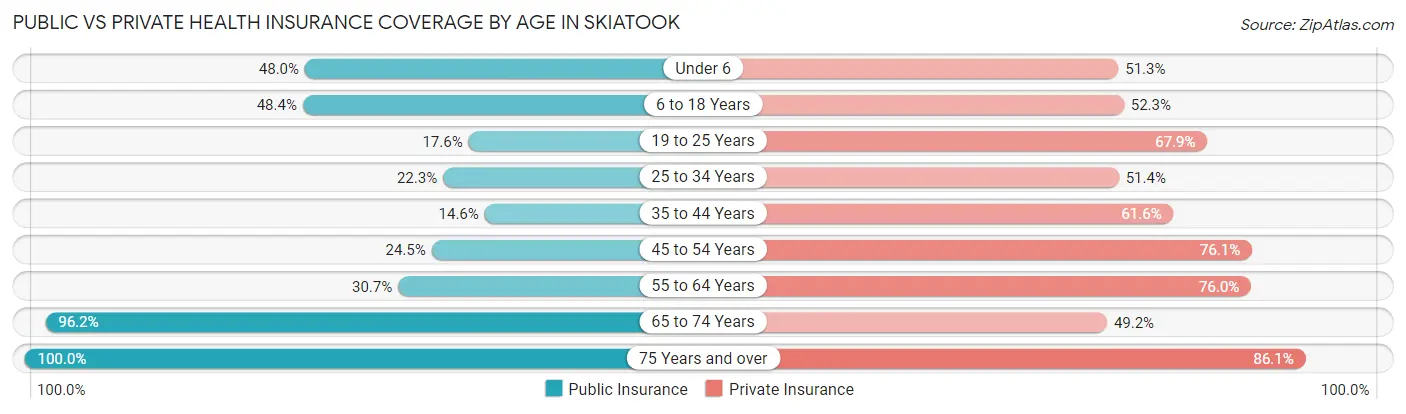
| Age Bracket | Public Insurance | Private Insurance |
| Under 6 | 345 (48.0%) | 369 (51.3%) |
| 6 to 18 Years | 744 (48.4%) | 805 (52.3%) |
| 19 to 25 Years | 149 (17.6%) | 574 (67.8%) |
| 25 to 34 Years | 223 (22.3%) | 513 (51.4%) |
| 35 to 44 Years | 189 (14.6%) | 796 (61.6%) |
| 45 to 54 Years | 247 (24.5%) | 769 (76.1%) |
| 55 to 64 Years | 267 (30.7%) | 661 (76.0%) |
| 65 to 74 Years | 674 (96.2%) | 345 (49.2%) |
| 75 Years and over | 438 (100.0%) | 377 (86.1%) |
| Total | 3,276 (38.9%) | 5,209 (61.9%) |
Disability Status by Sex by Age in Skiatook
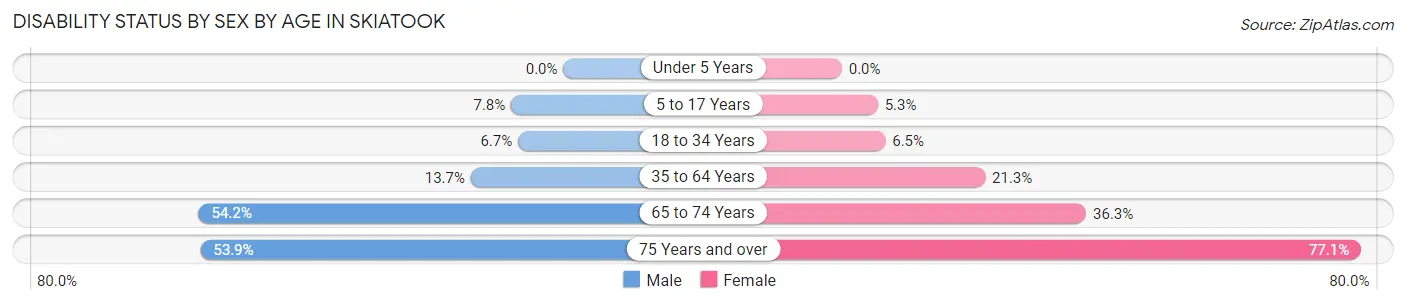
| Age Bracket | Male | Female |
| Under 5 Years | 0 (0.0%) | 0 (0.0%) |
| 5 to 17 Years | 58 (7.8%) | 47 (5.3%) |
| 18 to 34 Years | 64 (6.7%) | 64 (6.5%) |
| 35 to 64 Years | 208 (13.7%) | 353 (21.3%) |
| 65 to 74 Years | 202 (54.2%) | 119 (36.3%) |
| 75 Years and over | 76 (53.9%) | 229 (77.1%) |
Disability Class by Sex by Age in Skiatook
Disability Class: Hearing Difficulty
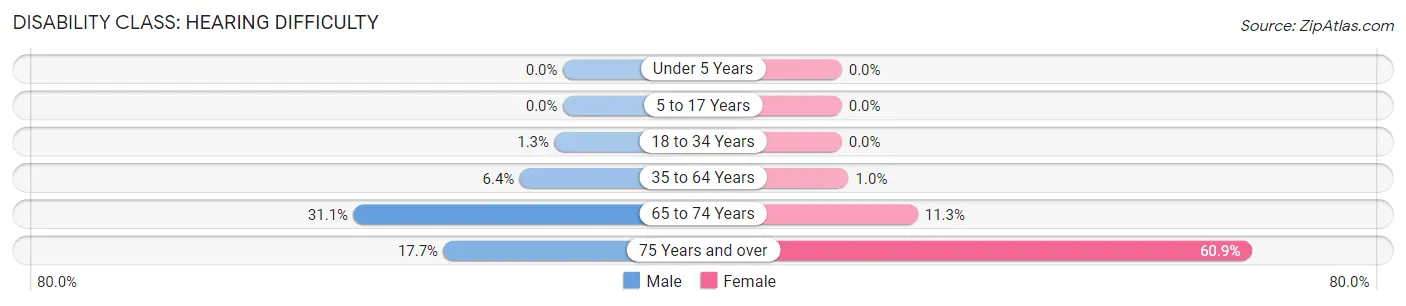
| Age Bracket | Male | Female |
| Under 5 Years | 0 (0.0%) | 0 (0.0%) |
| 5 to 17 Years | 0 (0.0%) | 0 (0.0%) |
| 18 to 34 Years | 12 (1.3%) | 0 (0.0%) |
| 35 to 64 Years | 97 (6.4%) | 17 (1.0%) |
| 65 to 74 Years | 116 (31.1%) | 37 (11.3%) |
| 75 Years and over | 25 (17.7%) | 181 (60.9%) |
Disability Class: Vision Difficulty
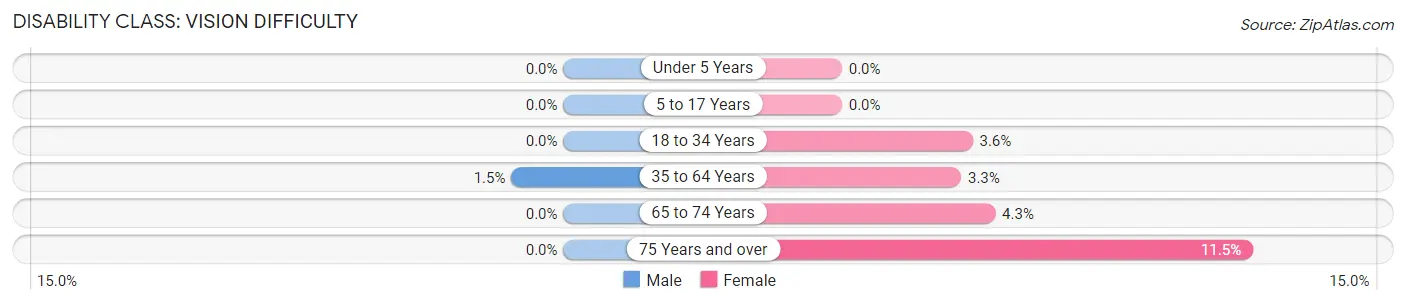
| Age Bracket | Male | Female |
| Under 5 Years | 0 (0.0%) | 0 (0.0%) |
| 5 to 17 Years | 0 (0.0%) | 0 (0.0%) |
| 18 to 34 Years | 0 (0.0%) | 36 (3.6%) |
| 35 to 64 Years | 22 (1.5%) | 55 (3.3%) |
| 65 to 74 Years | 0 (0.0%) | 14 (4.3%) |
| 75 Years and over | 0 (0.0%) | 34 (11.5%) |
Disability Class: Cognitive Difficulty
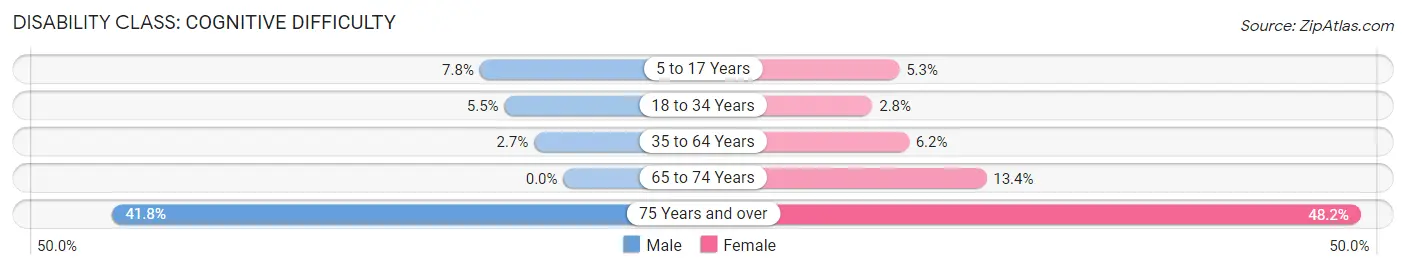
| Age Bracket | Male | Female |
| 5 to 17 Years | 58 (7.8%) | 47 (5.3%) |
| 18 to 34 Years | 52 (5.5%) | 28 (2.8%) |
| 35 to 64 Years | 41 (2.7%) | 103 (6.2%) |
| 65 to 74 Years | 0 (0.0%) | 44 (13.4%) |
| 75 Years and over | 59 (41.8%) | 143 (48.1%) |
Disability Class: Ambulatory Difficulty
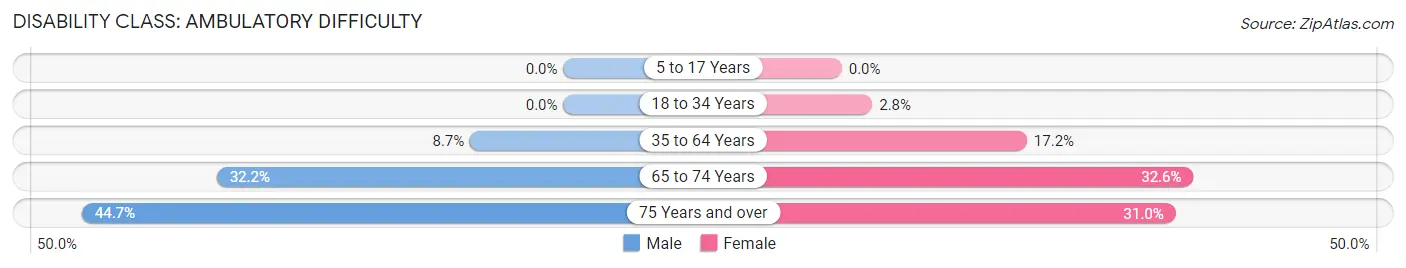
| Age Bracket | Male | Female |
| 5 to 17 Years | 0 (0.0%) | 0 (0.0%) |
| 18 to 34 Years | 0 (0.0%) | 28 (2.8%) |
| 35 to 64 Years | 131 (8.6%) | 285 (17.2%) |
| 65 to 74 Years | 120 (32.2%) | 107 (32.6%) |
| 75 Years and over | 63 (44.7%) | 92 (31.0%) |
Disability Class: Self-Care Difficulty
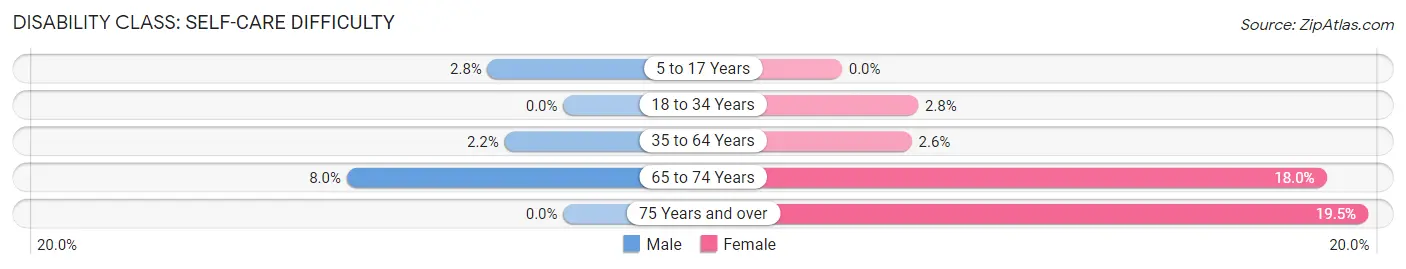
| Age Bracket | Male | Female |
| 5 to 17 Years | 21 (2.8%) | 0 (0.0%) |
| 18 to 34 Years | 0 (0.0%) | 28 (2.8%) |
| 35 to 64 Years | 33 (2.2%) | 43 (2.6%) |
| 65 to 74 Years | 30 (8.0%) | 59 (18.0%) |
| 75 Years and over | 0 (0.0%) | 58 (19.5%) |
Technology Access in Skiatook
Computing Device Access in Skiatook
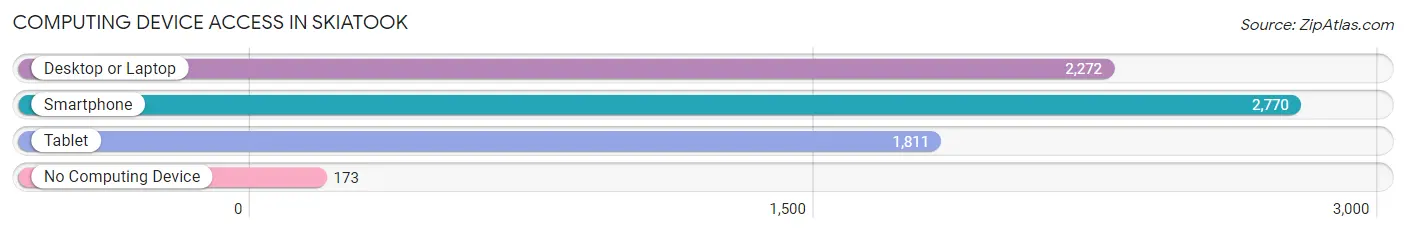
| Device Type | # Households | % Households |
| Desktop or Laptop | 2,272 | 73.1% |
| Smartphone | 2,770 | 89.1% |
| Tablet | 1,811 | 58.3% |
| No Computing Device | 173 | 5.6% |
| Total | 3,108 | 100.0% |
Internet Access in Skiatook
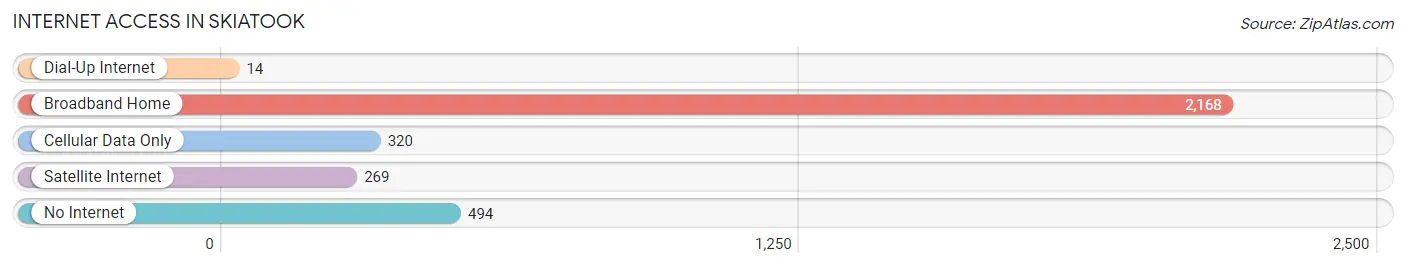
| Internet Type | # Households | % Households |
| Dial-Up Internet | 14 | 0.4% |
| Broadband Home | 2,168 | 69.8% |
| Cellular Data Only | 320 | 10.3% |
| Satellite Internet | 269 | 8.7% |
| No Internet | 494 | 15.9% |
| Total | 3,108 | 100.0% |
Skiatook Summary
Skiatook is a city located in Osage County, Oklahoma. It is situated in the northeastern part of the state, about 20 miles north of Tulsa. The city was founded in 1872 and incorporated in 1906. As of the 2010 census, the population was 1,870.
History
Skiatook was originally inhabited by the Osage Indians, who were the first to settle in the area. The town was named after Chief Skiatooka, a prominent leader of the Osage tribe. The town was founded in 1872 by a group of settlers from Missouri, who were attracted to the area by the abundance of natural resources.
The town grew rapidly in the late 19th century, and by the early 20th century, it had become a thriving community. The town was incorporated in 1906, and the first mayor was elected in 1907.
In the early 20th century, the town was a major center for oil production. The oil boom brought a large influx of people to the area, and the population grew rapidly. The town was also home to a number of businesses, including a flour mill, a cotton gin, and a brick factory.
Geography
Skiatook is located in northeastern Oklahoma, about 20 miles north of Tulsa. The city is situated in the Osage Plains, a region of rolling hills and prairies. The city is located at the intersection of two major highways, US-75 and US-169.
The city has a total area of 4.2 square miles, all of which is land. The city is located at an elevation of 745 feet above sea level.
Economy
Skiatook's economy is largely based on agriculture and oil production. The city is home to a number of agricultural businesses, including a feed mill, a grain elevator, and a fertilizer plant. The city is also home to a number of oil and gas companies, including Apache Corporation, Devon Energy, and Chesapeake Energy.
The city is also home to a number of manufacturing businesses, including a plastics plant, a metal fabrication plant, and a printing company. The city is also home to a number of retail businesses, including a grocery store, a hardware store, and a number of restaurants.
Demographics
As of the 2010 census, the population of Skiatook was 1,870. The racial makeup of the city was 79.3% White, 0.7% African American, 0.3% Native American, 0.2% Asian, 0.1% Pacific Islander, and 18.4% from other races. Hispanic or Latino of any race were 4.2% of the population.
The median household income in Skiatook was $37,917, and the median family income was $45,938. The per capita income was $19,945. About 16.2% of the population was below the poverty line.
Conclusion
Skiatook is a small city located in northeastern Oklahoma. It was founded in 1872 and incorporated in 1906. The city is home to a number of businesses, including agricultural businesses, oil and gas companies, and manufacturing businesses. The population of Skiatook was 1,870 as of the 2010 census, and the median household income was $37,917. The city is a major center for oil production, and it is also home to a number of retail businesses.
Common Questions
What is Per Capita Income in Skiatook?
Per Capita income in Skiatook is $27,637.
What is the Median Family Income in Skiatook?
Median Family Income in Skiatook is $70,844.
What is the Median Household income in Skiatook?
Median Household Income in Skiatook is $54,444.
What is Income or Wage Gap in Skiatook?
Income or Wage Gap in Skiatook is 22.7%.
Women in Skiatook earn 77.3 cents for every dollar earned by a man.
What is Inequality or Gini Index in Skiatook?
Inequality or Gini Index in Skiatook is 0.42.
What is the Total Population of Skiatook?
Total Population of Skiatook is 8,463.
What is the Total Male Population of Skiatook?
Total Male Population of Skiatook is 4,053.
What is the Total Female Population of Skiatook?
Total Female Population of Skiatook is 4,410.
What is the Ratio of Males per 100 Females in Skiatook?
There are 91.90 Males per 100 Females in Skiatook.
What is the Ratio of Females per 100 Males in Skiatook?
There are 108.81 Females per 100 Males in Skiatook.
What is the Median Population Age in Skiatook?
Median Population Age in Skiatook is 36.6 Years.
What is the Average Family Size in Skiatook
Average Family Size in Skiatook is 3.3 People.
What is the Average Household Size in Skiatook
Average Household Size in Skiatook is 2.7 People.
How Large is the Labor Force in Skiatook?
There are 4,152 People in the Labor Forcein in Skiatook.
What is the Percentage of People in the Labor Force in Skiatook?
63.8% of People are in the Labor Force in Skiatook.
What is the Unemployment Rate in Skiatook?
Unemployment Rate in Skiatook is 5.0%.