Seminole, OK Map & Demographics
Seminole Map
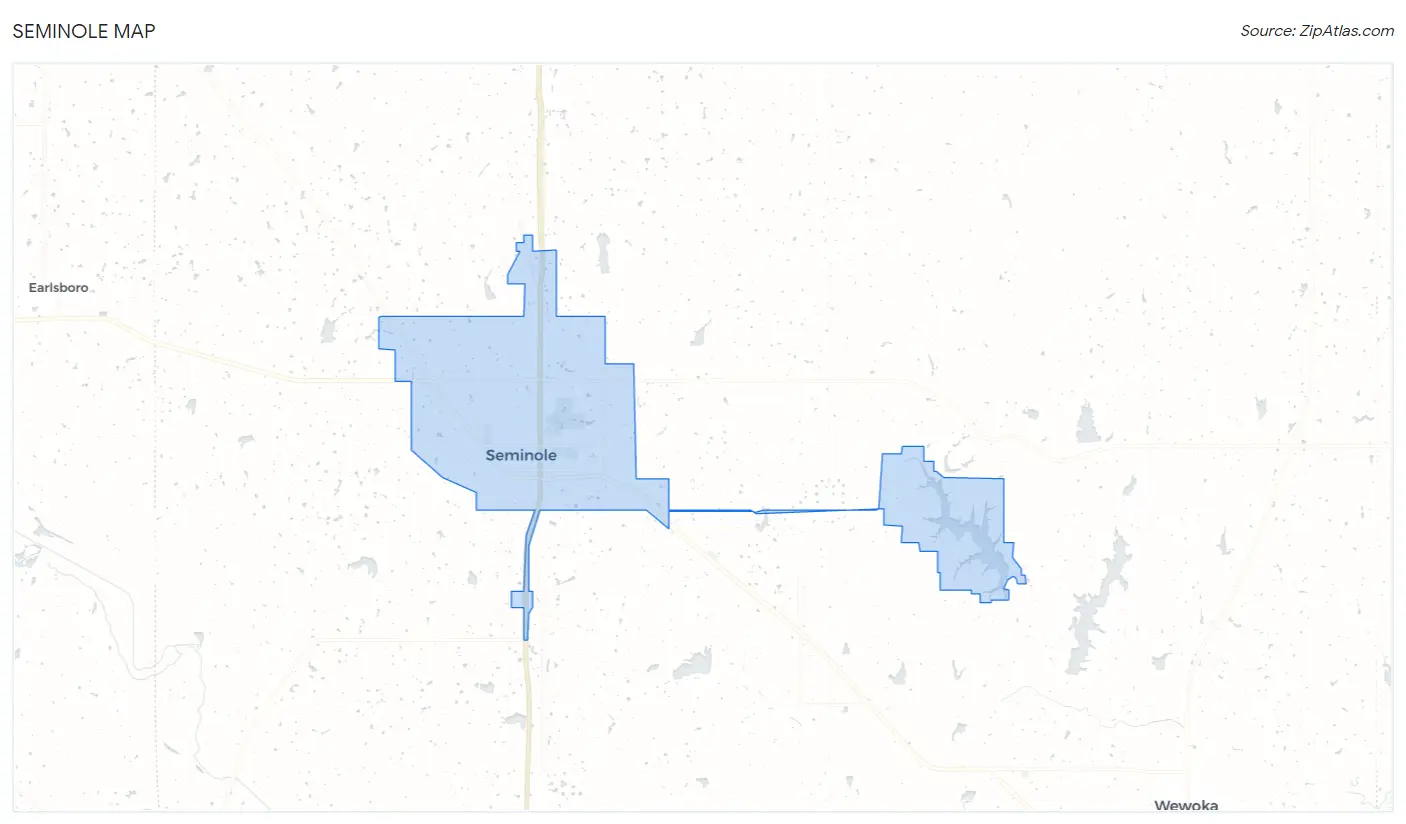
Seminole Overview
$19,919
PER CAPITA INCOME
$41,314
AVG FAMILY INCOME
$34,599
AVG HOUSEHOLD INCOME
32.6%
WAGE / INCOME GAP [ % ]
67.4¢/ $1
WAGE / INCOME GAP [ $ ]
$11,822
FAMILY INCOME DEFICIT
0.49
INEQUALITY / GINI INDEX
7,144
TOTAL POPULATION
3,159
MALE POPULATION
3,985
FEMALE POPULATION
79.27
MALES / 100 FEMALES
126.15
FEMALES / 100 MALES
32.6
MEDIAN AGE
3.4
AVG FAMILY SIZE
2.7
AVG HOUSEHOLD SIZE
2,931
LABOR FORCE [ PEOPLE ]
53.5%
PERCENT IN LABOR FORCE
7.1%
UNEMPLOYMENT RATE
Seminole Zip Codes
Seminole Area Codes
Income in Seminole
Income Overview in Seminole
Per Capita Income in Seminole is $19,919, while median incomes of families and households are $41,314 and $34,599 respectively.
| Characteristic | Number | Measure |
| Per Capita Income | 7,144 | $19,919 |
| Median Family Income | 1,655 | $41,314 |
| Mean Family Income | 1,655 | $57,493 |
| Median Household Income | 2,461 | $34,599 |
| Mean Household Income | 2,461 | $50,177 |
| Income Deficit | 1,655 | $11,822 |
| Wage / Income Gap (%) | 7,144 | 32.57% |
| Wage / Income Gap ($) | 7,144 | 67.43¢ per $1 |
| Gini / Inequality Index | 7,144 | 0.49 |
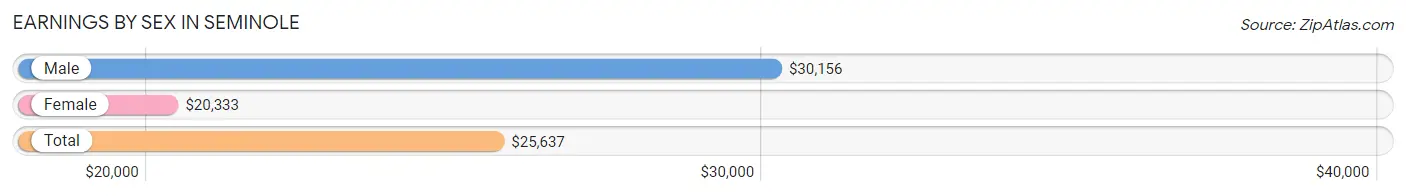
Earnings by Sex in Seminole
Average Earnings in Seminole are $25,637, $30,156 for men and $20,333 for women, a difference of 32.6%.
| Sex | Number | Average Earnings |
| Male | 1,491 (49.1%) | $30,156 |
| Female | 1,546 (50.9%) | $20,333 |
| Total | 3,037 (100.0%) | $25,637 |
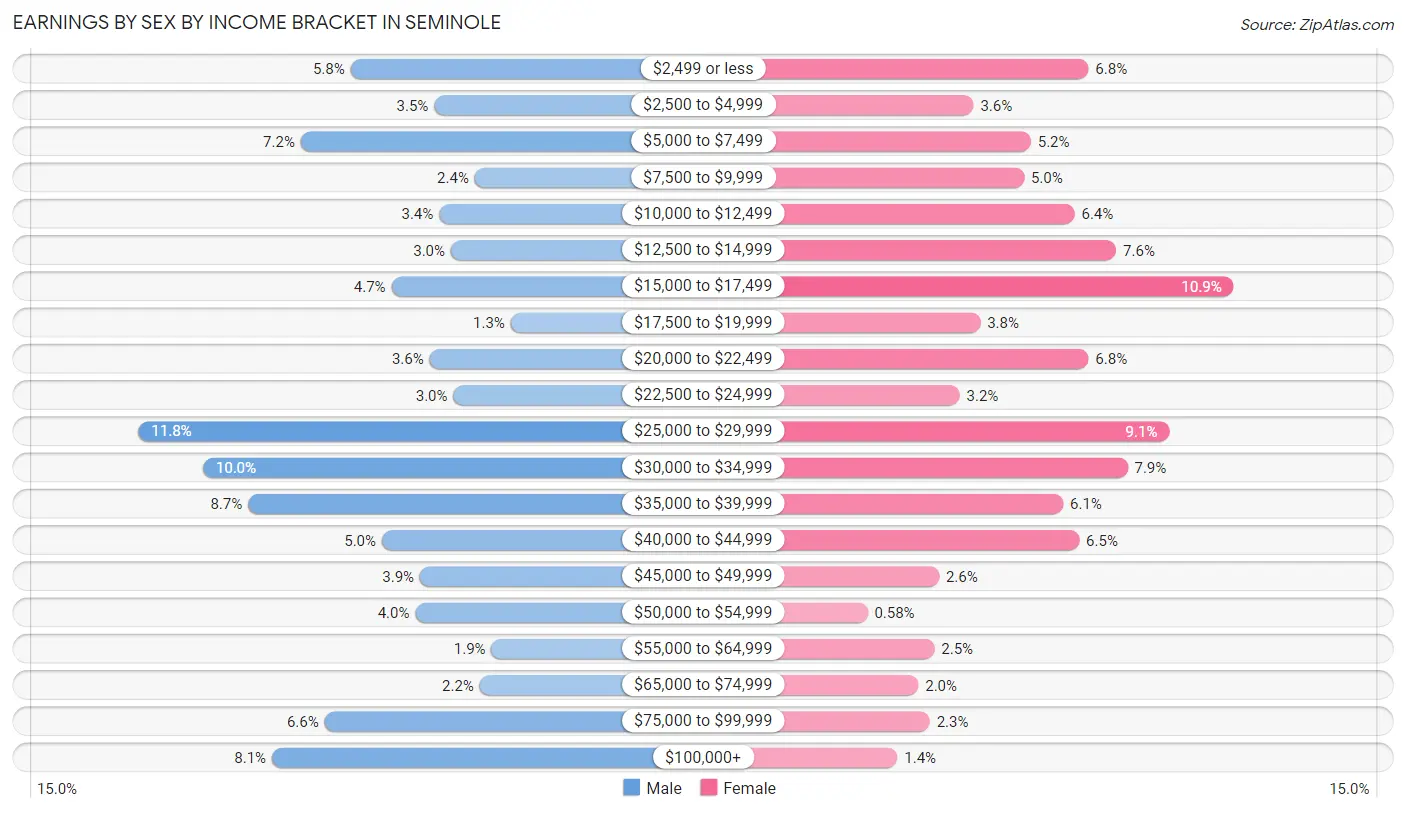
Earnings by Sex by Income Bracket in Seminole
The most common earnings brackets in Seminole are $25,000 to $29,999 for men (176 | 11.8%) and $15,000 to $17,499 for women (168 | 10.9%).
| Income | Male | Female |
| $2,499 or less | 87 (5.8%) | 105 (6.8%) |
| $2,500 to $4,999 | 52 (3.5%) | 55 (3.6%) |
| $5,000 to $7,499 | 108 (7.2%) | 80 (5.2%) |
| $7,500 to $9,999 | 35 (2.4%) | 77 (5.0%) |
| $10,000 to $12,499 | 50 (3.4%) | 99 (6.4%) |
| $12,500 to $14,999 | 45 (3.0%) | 117 (7.6%) |
| $15,000 to $17,499 | 70 (4.7%) | 168 (10.9%) |
| $17,500 to $19,999 | 20 (1.3%) | 58 (3.7%) |
| $20,000 to $22,499 | 54 (3.6%) | 105 (6.8%) |
| $22,500 to $24,999 | 44 (2.9%) | 49 (3.2%) |
| $25,000 to $29,999 | 176 (11.8%) | 140 (9.1%) |
| $30,000 to $34,999 | 149 (10.0%) | 122 (7.9%) |
| $35,000 to $39,999 | 130 (8.7%) | 94 (6.1%) |
| $40,000 to $44,999 | 74 (5.0%) | 101 (6.5%) |
| $45,000 to $49,999 | 58 (3.9%) | 40 (2.6%) |
| $50,000 to $54,999 | 60 (4.0%) | 9 (0.6%) |
| $55,000 to $64,999 | 28 (1.9%) | 38 (2.5%) |
| $65,000 to $74,999 | 33 (2.2%) | 31 (2.0%) |
| $75,000 to $99,999 | 98 (6.6%) | 36 (2.3%) |
| $100,000+ | 120 (8.1%) | 22 (1.4%) |
| Total | 1,491 (100.0%) | 1,546 (100.0%) |
Earnings by Sex by Educational Attainment in Seminole
Average earnings in Seminole are $32,772 for men and $25,431 for women, a difference of 22.4%. Men with an educational attainment of bachelor's degree enjoy the highest average annual earnings of $48,646, while those with less than high school education earn the least with $21,406. Women with an educational attainment of bachelor's degree earn the most with the average annual earnings of $37,350, while those with less than high school education have the smallest earnings of $17,159.

| Educational Attainment | Male Income | Female Income |
| Less than High School | $21,406 | $17,159 |
| High School Diploma | $33,882 | $22,100 |
| College or Associate's Degree | $33,125 | $24,583 |
| Bachelor's Degree | $48,646 | $37,350 |
| Graduate Degree | - | - |
| Total | $32,772 | $25,431 |
Family Income in Seminole
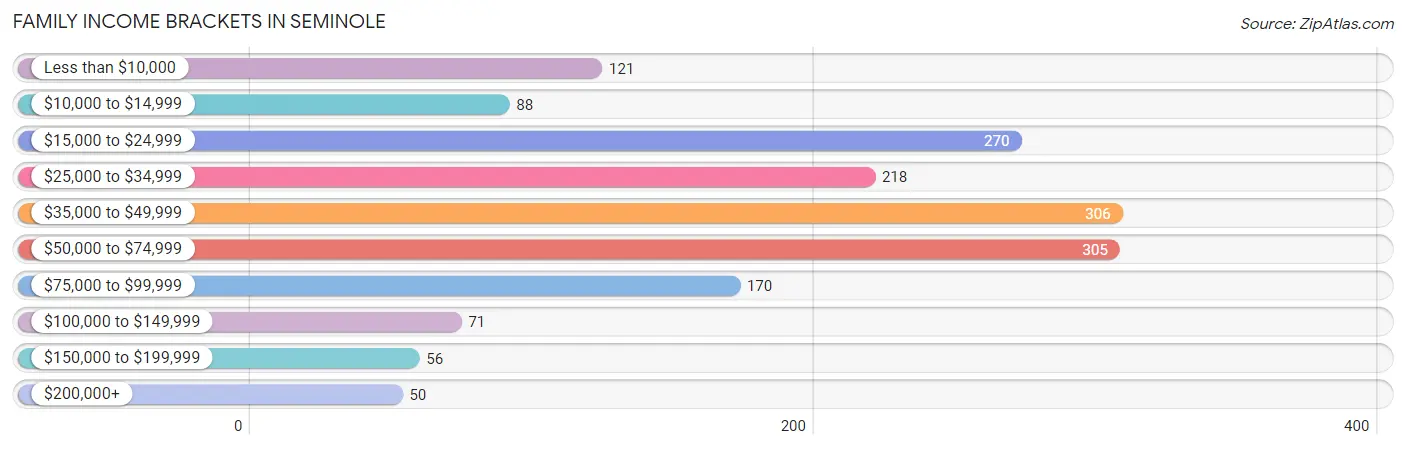
Family Income Brackets in Seminole
According to the Seminole family income data, there are 306 families falling into the $35,000 to $49,999 income range, which is the most common income bracket and makes up 18.5% of all families. Conversely, the $200,000+ income bracket is the least frequent group with only 50 families (3.0%) belonging to this category.
| Income Bracket | # Families | % Families |
| Less than $10,000 | 121 | 7.3% |
| $10,000 to $14,999 | 88 | 5.3% |
| $15,000 to $24,999 | 270 | 16.3% |
| $25,000 to $34,999 | 218 | 13.2% |
| $35,000 to $49,999 | 306 | 18.5% |
| $50,000 to $74,999 | 305 | 18.4% |
| $75,000 to $99,999 | 170 | 10.3% |
| $100,000 to $149,999 | 71 | 4.3% |
| $150,000 to $199,999 | 56 | 3.4% |
| $200,000+ | 50 | 3.0% |
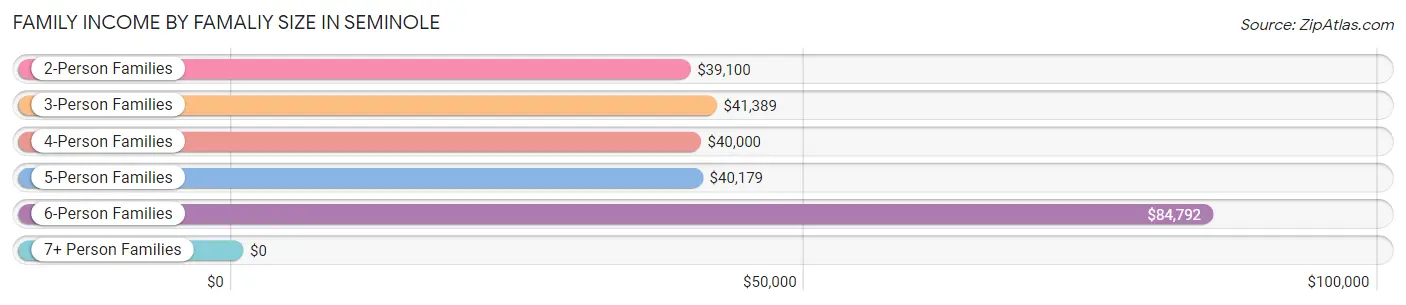
Family Income by Famaliy Size in Seminole
6-person families (43 | 2.6%) account for the highest median family income in Seminole with $84,792 per family, while 2-person families (702 | 42.4%) have the highest median income of $19,550 per family member.
| Income Bracket | # Families | Median Income |
| 2-Person Families | 702 (42.4%) | $39,100 |
| 3-Person Families | 434 (26.2%) | $41,389 |
| 4-Person Families | 260 (15.7%) | $40,000 |
| 5-Person Families | 163 (9.9%) | $40,179 |
| 6-Person Families | 43 (2.6%) | $84,792 |
| 7+ Person Families | 53 (3.2%) | $0 |
| Total | 1,655 (100.0%) | $41,314 |
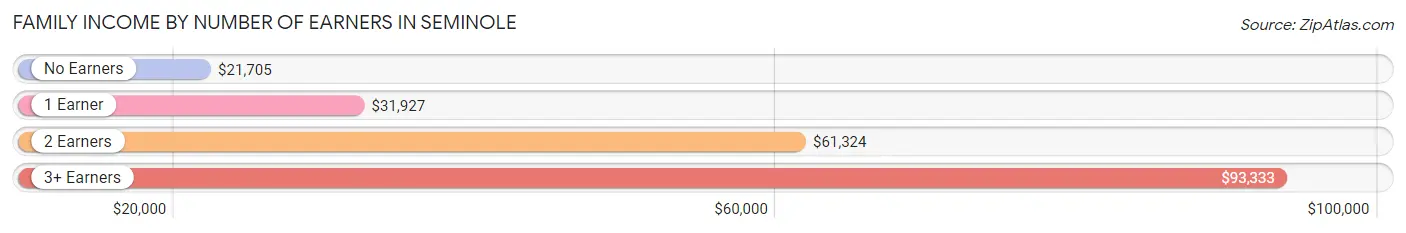
Family Income by Number of Earners in Seminole
The median family income in Seminole is $41,314, with families comprising 3+ earners (74) having the highest median family income of $93,333, while families with no earners (325) have the lowest median family income of $21,705, accounting for 4.5% and 19.6% of families, respectively.
| Number of Earners | # Families | Median Income |
| No Earners | 325 (19.6%) | $21,705 |
| 1 Earner | 704 (42.5%) | $31,927 |
| 2 Earners | 552 (33.4%) | $61,324 |
| 3+ Earners | 74 (4.5%) | $93,333 |
| Total | 1,655 (100.0%) | $41,314 |
Household Income in Seminole
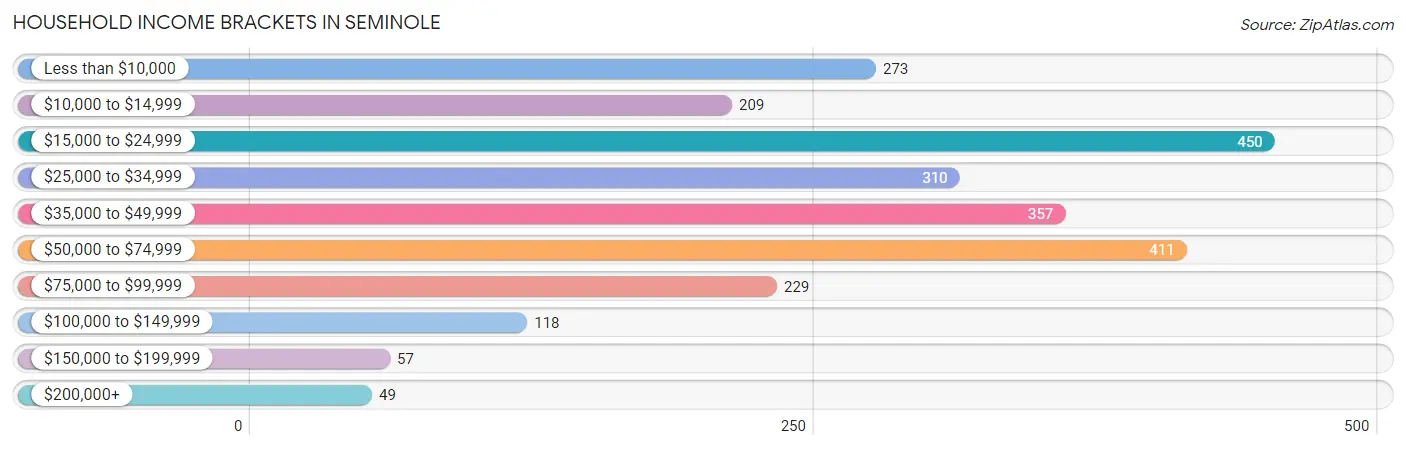
Household Income Brackets in Seminole
With 450 households falling in the category, the $15,000 to $24,999 income range is the most frequent in Seminole, accounting for 18.3% of all households. In contrast, only 49 households (2.0%) fall into the $200,000+ income bracket, making it the least populous group.
| Income Bracket | # Households | % Households |
| Less than $10,000 | 273 | 11.1% |
| $10,000 to $14,999 | 209 | 8.5% |
| $15,000 to $24,999 | 450 | 18.3% |
| $25,000 to $34,999 | 310 | 12.6% |
| $35,000 to $49,999 | 357 | 14.5% |
| $50,000 to $74,999 | 411 | 16.7% |
| $75,000 to $99,999 | 229 | 9.3% |
| $100,000 to $149,999 | 118 | 4.8% |
| $150,000 to $199,999 | 57 | 2.3% |
| $200,000+ | 49 | 2.0% |
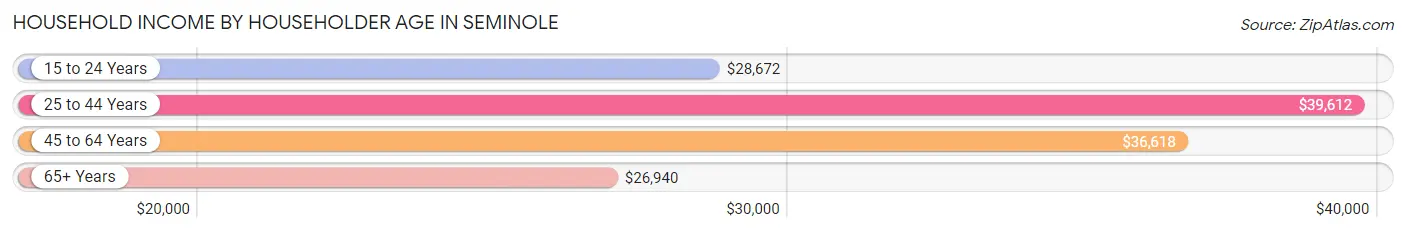
Household Income by Householder Age in Seminole
The median household income in Seminole is $34,599, with the highest median household income of $39,612 found in the 25 to 44 years age bracket for the primary householder. A total of 929 households (37.8%) fall into this category. Meanwhile, the 65+ years age bracket for the primary householder has the lowest median household income of $26,940, with 645 households (26.2%) in this group.
| Income Bracket | # Households | Median Income |
| 15 to 24 Years | 139 (5.7%) | $28,672 |
| 25 to 44 Years | 929 (37.8%) | $39,612 |
| 45 to 64 Years | 748 (30.4%) | $36,618 |
| 65+ Years | 645 (26.2%) | $26,940 |
| Total | 2,461 (100.0%) | $34,599 |
Poverty in Seminole
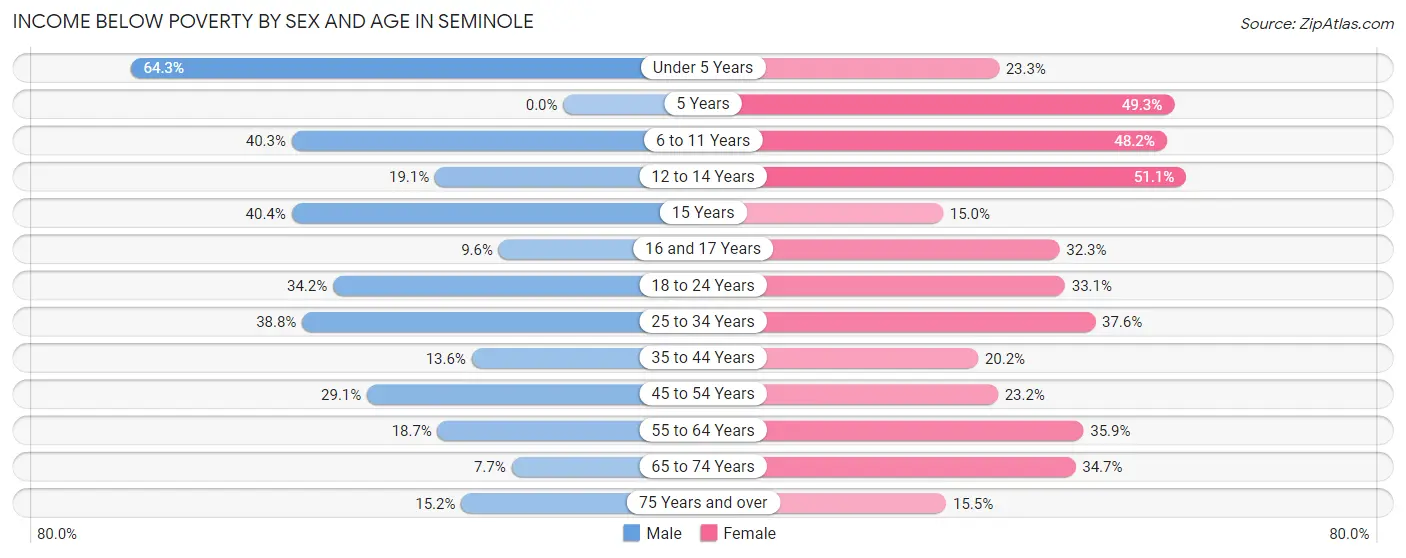
Income Below Poverty by Sex and Age in Seminole
With 29.8% poverty level for males and 31.6% for females among the residents of Seminole, under 5 year old males and 12 to 14 year old females are the most vulnerable to poverty, with 142 males (64.2%) and 92 females (51.1%) in their respective age groups living below the poverty level.
| Age Bracket | Male | Female |
| Under 5 Years | 142 (64.2%) | 72 (23.3%) |
| 5 Years | 0 (0.0%) | 37 (49.3%) |
| 6 to 11 Years | 125 (40.3%) | 150 (48.2%) |
| 12 to 14 Years | 20 (19.1%) | 92 (51.1%) |
| 15 Years | 23 (40.4%) | 9 (15.0%) |
| 16 and 17 Years | 7 (9.6%) | 21 (32.3%) |
| 18 to 24 Years | 119 (34.2%) | 105 (33.1%) |
| 25 to 34 Years | 216 (38.8%) | 211 (37.6%) |
| 35 to 44 Years | 46 (13.6%) | 73 (20.2%) |
| 45 to 54 Years | 125 (29.1%) | 94 (23.2%) |
| 55 to 64 Years | 53 (18.7%) | 156 (35.9%) |
| 65 to 74 Years | 13 (7.7%) | 95 (34.7%) |
| 75 Years and over | 20 (15.1%) | 52 (15.5%) |
| Total | 909 (29.8%) | 1,167 (31.6%) |
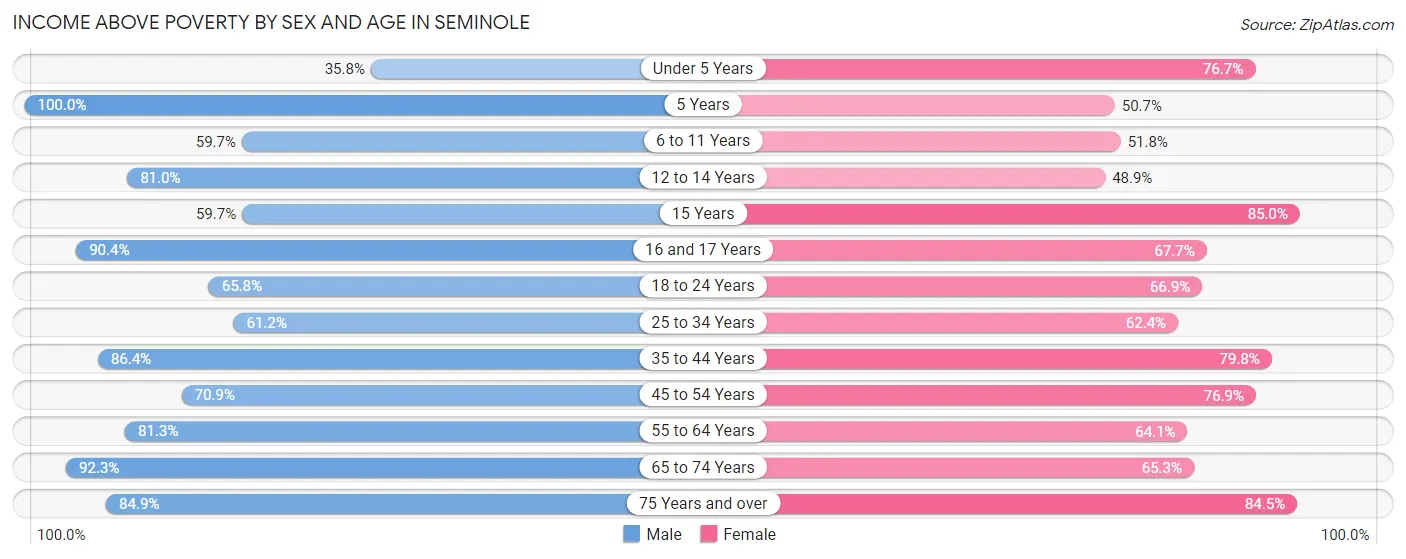
Income Above Poverty by Sex and Age in Seminole
According to the poverty statistics in Seminole, males aged 5 years and females aged 15 years are the age groups that are most secure financially, with 100.0% of males and 85.0% of females in these age groups living above the poverty line.
| Age Bracket | Male | Female |
| Under 5 Years | 79 (35.7%) | 237 (76.7%) |
| 5 Years | 22 (100.0%) | 38 (50.7%) |
| 6 to 11 Years | 185 (59.7%) | 161 (51.8%) |
| 12 to 14 Years | 85 (80.9%) | 88 (48.9%) |
| 15 Years | 34 (59.7%) | 51 (85.0%) |
| 16 and 17 Years | 66 (90.4%) | 44 (67.7%) |
| 18 to 24 Years | 229 (65.8%) | 212 (66.9%) |
| 25 to 34 Years | 341 (61.2%) | 350 (62.4%) |
| 35 to 44 Years | 292 (86.4%) | 288 (79.8%) |
| 45 to 54 Years | 304 (70.9%) | 312 (76.8%) |
| 55 to 64 Years | 231 (81.3%) | 279 (64.1%) |
| 65 to 74 Years | 156 (92.3%) | 179 (65.3%) |
| 75 Years and over | 112 (84.9%) | 284 (84.5%) |
| Total | 2,136 (70.2%) | 2,523 (68.4%) |
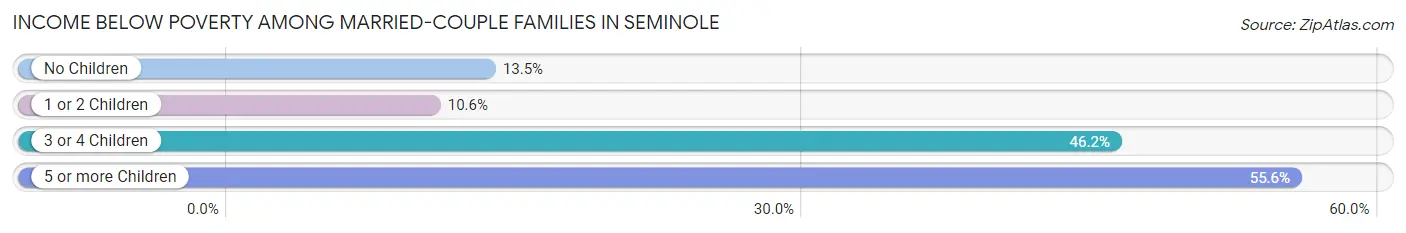
Income Below Poverty Among Married-Couple Families in Seminole
The poverty statistics for married-couple families in Seminole show that 18.3% or 166 of the total 908 families live below the poverty line. Families with 5 or more children have the highest poverty rate of 55.6%, comprising of 25 families. On the other hand, families with 1 or 2 children have the lowest poverty rate of 10.6%, which includes 34 families.
| Children | Above Poverty | Below Poverty |
| No Children | 379 (86.5%) | 59 (13.5%) |
| 1 or 2 Children | 287 (89.4%) | 34 (10.6%) |
| 3 or 4 Children | 56 (53.8%) | 48 (46.2%) |
| 5 or more Children | 20 (44.4%) | 25 (55.6%) |
| Total | 742 (81.7%) | 166 (18.3%) |
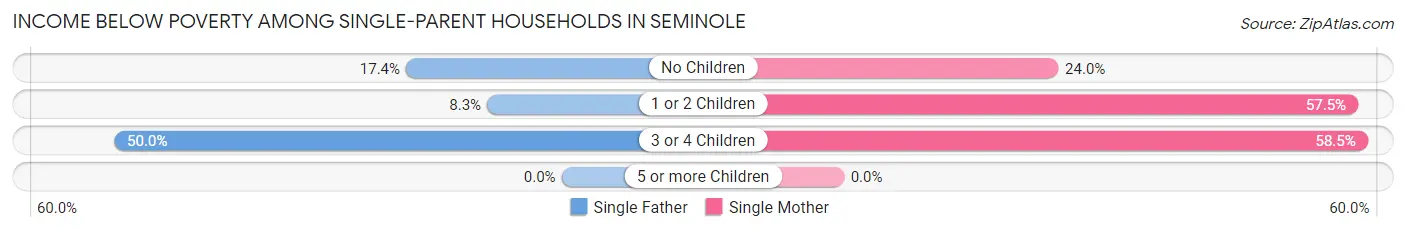
Income Below Poverty Among Single-Parent Households in Seminole
According to the poverty data in Seminole, 15.6% or 33 single-father households and 48.5% or 260 single-mother households are living below the poverty line. Among single-father households, those with 3 or 4 children have the highest poverty rate, with 6 households (50.0%) experiencing poverty. Likewise, among single-mother households, those with 3 or 4 children have the highest poverty rate, with 48 households (58.5%) falling below the poverty line.
| Children | Single Father | Single Mother |
| No Children | 20 (17.4%) | 35 (24.0%) |
| 1 or 2 Children | 7 (8.3%) | 177 (57.5%) |
| 3 or 4 Children | 6 (50.0%) | 48 (58.5%) |
| 5 or more Children | 0 (0.0%) | 0 (0.0%) |
| Total | 33 (15.6%) | 260 (48.5%) |
Income Below Poverty Among Married-Couple vs Single-Parent Households in Seminole
The poverty data for Seminole shows that 166 of the married-couple family households (18.3%) and 293 of the single-parent households (39.2%) are living below the poverty level. Within the married-couple family households, those with 5 or more children have the highest poverty rate, with 25 households (55.6%) falling below the poverty line. Among the single-parent households, those with 3 or 4 children have the highest poverty rate, with 54 household (57.5%) living below poverty.
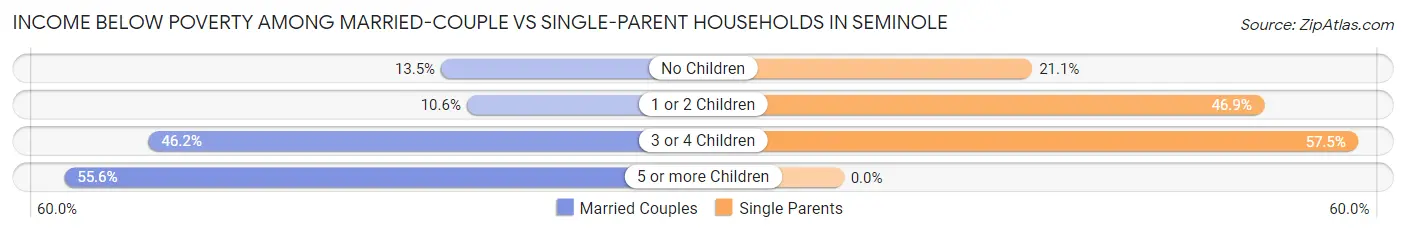
| Children | Married-Couple Families | Single-Parent Households |
| No Children | 59 (13.5%) | 55 (21.1%) |
| 1 or 2 Children | 34 (10.6%) | 184 (46.9%) |
| 3 or 4 Children | 48 (46.2%) | 54 (57.5%) |
| 5 or more Children | 25 (55.6%) | 0 (0.0%) |
| Total | 166 (18.3%) | 293 (39.2%) |
Race in Seminole
The most populous races in Seminole are White / Caucasian (4,381 | 61.3%), Native / Alaskan (1,702 | 23.8%), and Two or more Races (646 | 9.0%).
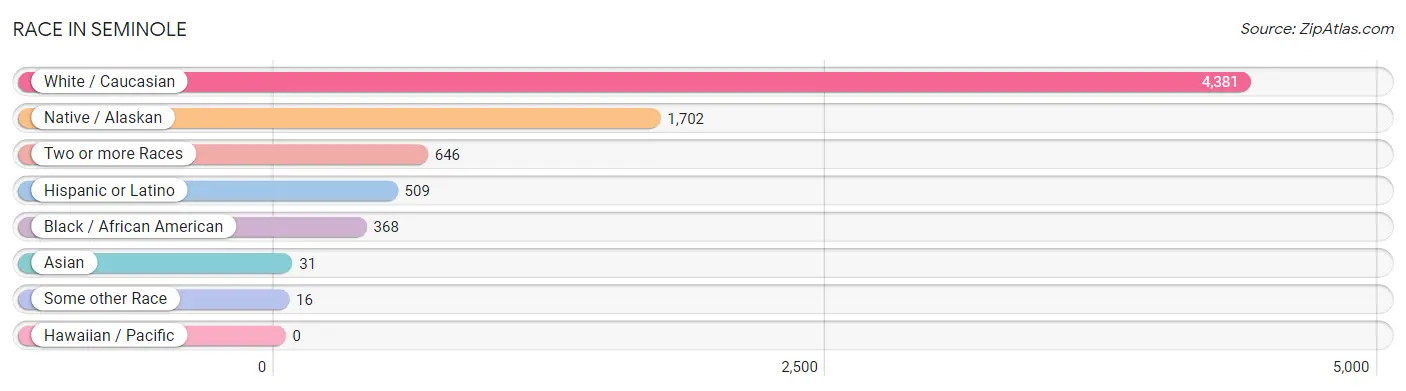
| Race | # Population | % Population |
| Asian | 31 | 0.4% |
| Black / African American | 368 | 5.1% |
| Hawaiian / Pacific | 0 | 0.0% |
| Hispanic or Latino | 509 | 7.1% |
| Native / Alaskan | 1,702 | 23.8% |
| White / Caucasian | 4,381 | 61.3% |
| Two or more Races | 646 | 9.0% |
| Some other Race | 16 | 0.2% |
| Total | 7,144 | 100.0% |
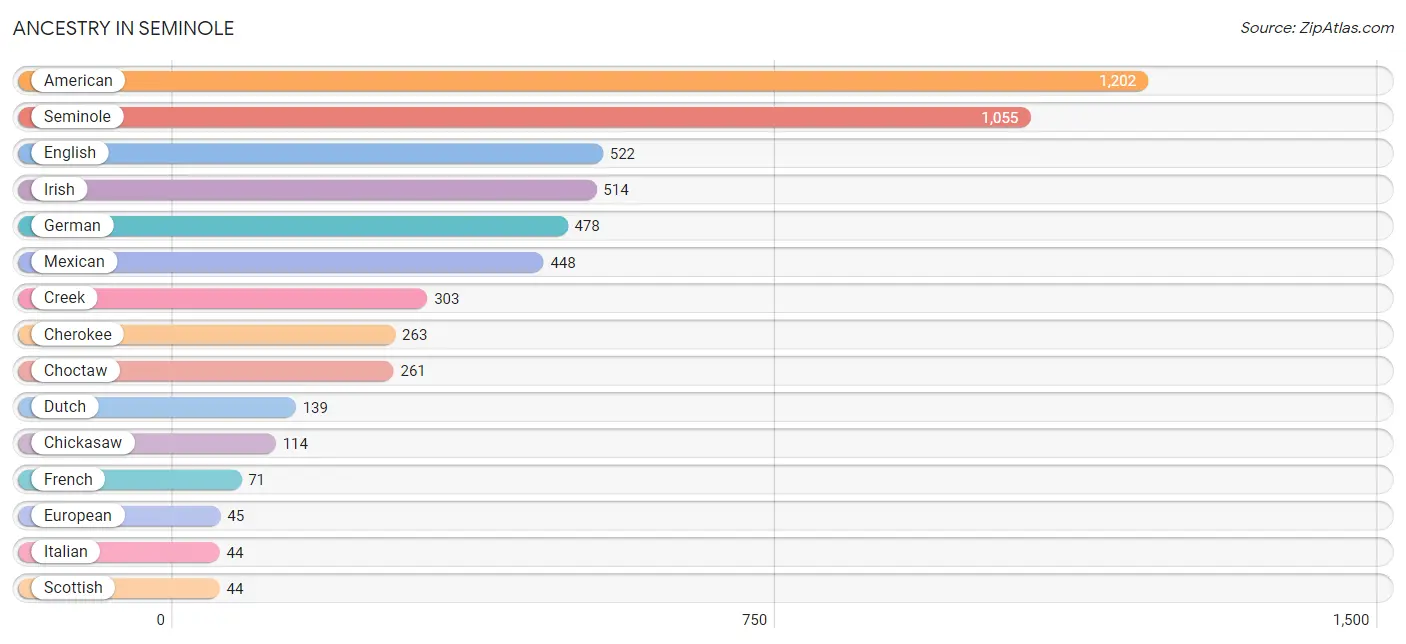
Ancestry in Seminole
The most populous ancestries reported in Seminole are American (1,202 | 16.8%), Seminole (1,055 | 14.8%), English (522 | 7.3%), Irish (514 | 7.2%), and German (478 | 6.7%), together accounting for 52.8% of all Seminole residents.
| Ancestry | # Population | % Population |
| African | 1 | 0.0% |
| American | 1,202 | 16.8% |
| Arapaho | 38 | 0.5% |
| Belgian | 7 | 0.1% |
| British | 20 | 0.3% |
| Burmese | 17 | 0.2% |
| Canadian | 9 | 0.1% |
| Celtic | 9 | 0.1% |
| Central American | 41 | 0.6% |
| Cherokee | 263 | 3.7% |
| Chickasaw | 114 | 1.6% |
| Chippewa | 3 | 0.0% |
| Choctaw | 261 | 3.6% |
| Creek | 303 | 4.2% |
| Dutch | 139 | 1.9% |
| English | 522 | 7.3% |
| European | 45 | 0.6% |
| French | 71 | 1.0% |
| German | 478 | 6.7% |
| Guatemalan | 2 | 0.0% |
| Irish | 514 | 7.2% |
| Italian | 44 | 0.6% |
| Korean | 7 | 0.1% |
| Mexican | 448 | 6.3% |
| Norwegian | 5 | 0.1% |
| Polish | 13 | 0.2% |
| Potawatomi | 39 | 0.5% |
| Puerto Rican | 10 | 0.1% |
| Russian | 3 | 0.0% |
| Salvadoran | 39 | 0.5% |
| Scandinavian | 17 | 0.2% |
| Scotch-Irish | 8 | 0.1% |
| Scottish | 44 | 0.6% |
| Seminole | 1,055 | 14.8% |
| Sioux | 5 | 0.1% |
| Subsaharan African | 1 | 0.0% |
| Swedish | 12 | 0.2% |
| Ukrainian | 3 | 0.0% |
| Yugoslavian | 13 | 0.2% | View All 39 Rows |
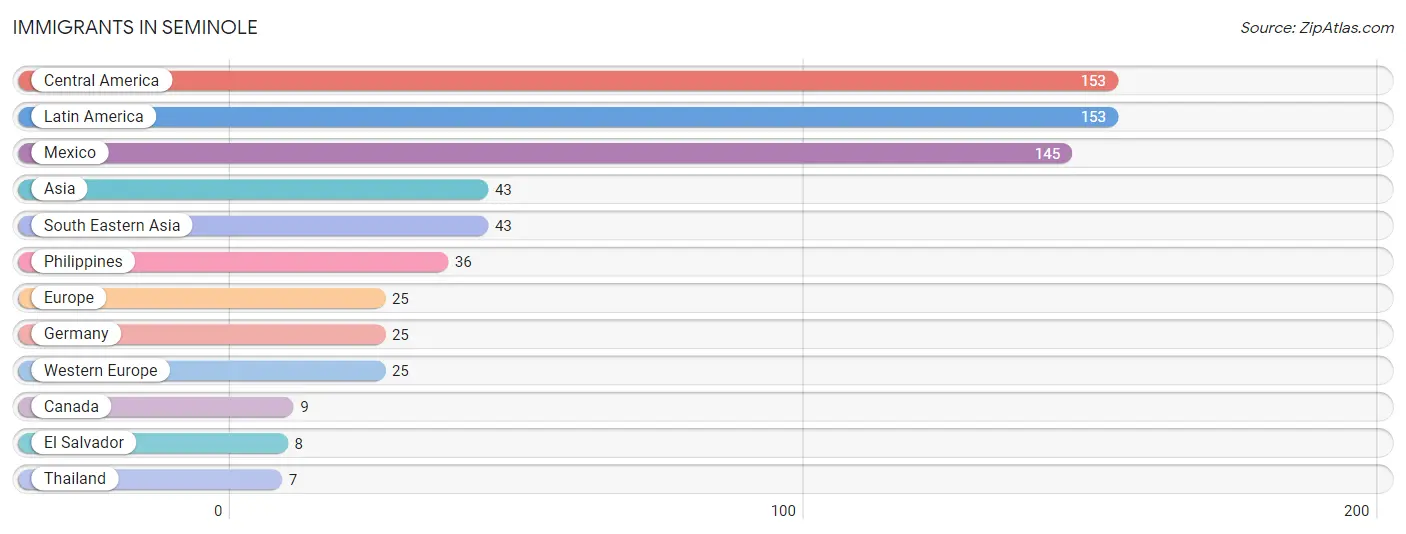
Immigrants in Seminole
The most numerous immigrant groups reported in Seminole came from Central America (153 | 2.1%), Latin America (153 | 2.1%), Mexico (145 | 2.0%), Asia (43 | 0.6%), and South Eastern Asia (43 | 0.6%), together accounting for 7.5% of all Seminole residents.
| Immigration Origin | # Population | % Population |
| Asia | 43 | 0.6% |
| Canada | 9 | 0.1% |
| Central America | 153 | 2.1% |
| El Salvador | 8 | 0.1% |
| Europe | 25 | 0.4% |
| Germany | 25 | 0.4% |
| Latin America | 153 | 2.1% |
| Mexico | 145 | 2.0% |
| Philippines | 36 | 0.5% |
| South Eastern Asia | 43 | 0.6% |
| Thailand | 7 | 0.1% |
| Western Europe | 25 | 0.4% | View All 12 Rows |
Sex and Age in Seminole
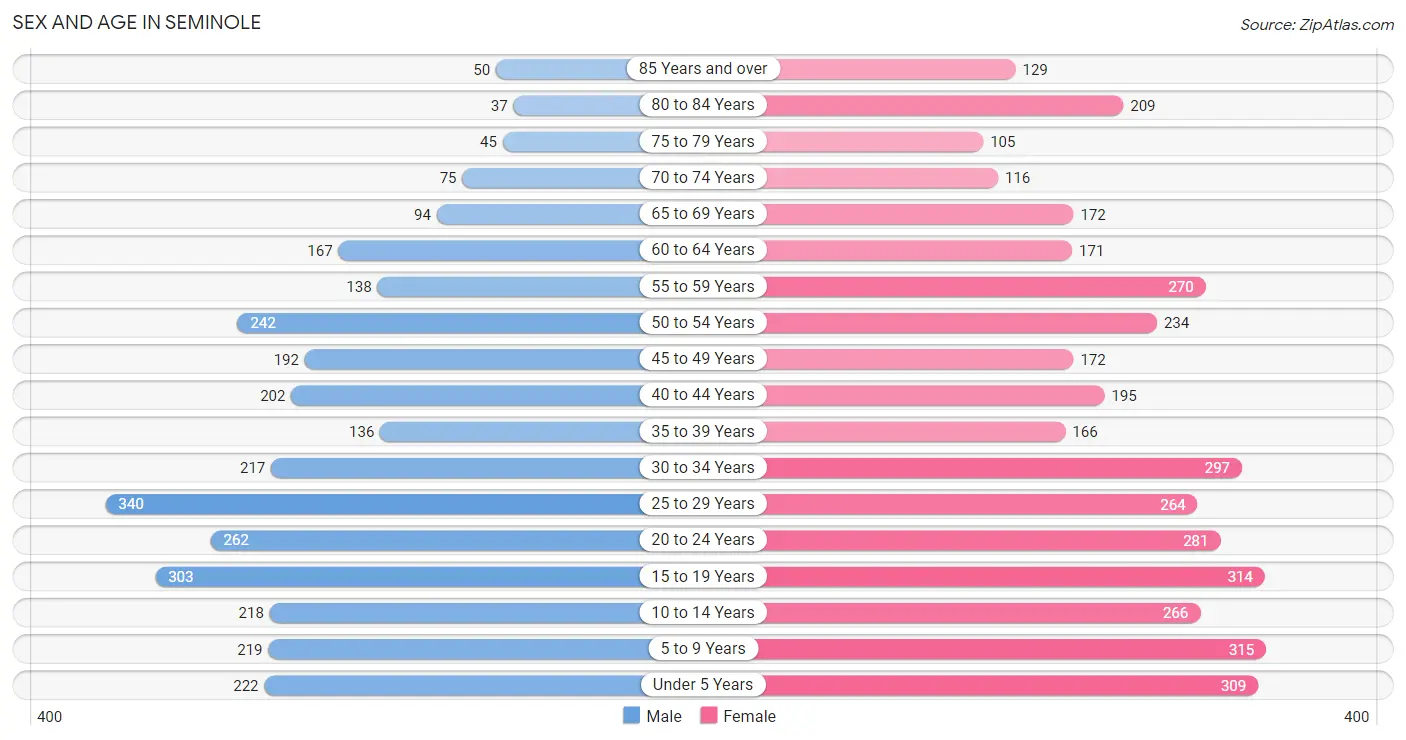
Sex and Age in Seminole
The most populous age groups in Seminole are 25 to 29 Years (340 | 10.8%) for men and 5 to 9 Years (315 | 7.9%) for women.
| Age Bracket | Male | Female |
| Under 5 Years | 222 (7.0%) | 309 (7.7%) |
| 5 to 9 Years | 219 (6.9%) | 315 (7.9%) |
| 10 to 14 Years | 218 (6.9%) | 266 (6.7%) |
| 15 to 19 Years | 303 (9.6%) | 314 (7.9%) |
| 20 to 24 Years | 262 (8.3%) | 281 (7.0%) |
| 25 to 29 Years | 340 (10.8%) | 264 (6.6%) |
| 30 to 34 Years | 217 (6.9%) | 297 (7.4%) |
| 35 to 39 Years | 136 (4.3%) | 166 (4.2%) |
| 40 to 44 Years | 202 (6.4%) | 195 (4.9%) |
| 45 to 49 Years | 192 (6.1%) | 172 (4.3%) |
| 50 to 54 Years | 242 (7.7%) | 234 (5.9%) |
| 55 to 59 Years | 138 (4.4%) | 270 (6.8%) |
| 60 to 64 Years | 167 (5.3%) | 171 (4.3%) |
| 65 to 69 Years | 94 (3.0%) | 172 (4.3%) |
| 70 to 74 Years | 75 (2.4%) | 116 (2.9%) |
| 75 to 79 Years | 45 (1.4%) | 105 (2.6%) |
| 80 to 84 Years | 37 (1.2%) | 209 (5.2%) |
| 85 Years and over | 50 (1.6%) | 129 (3.2%) |
| Total | 3,159 (100.0%) | 3,985 (100.0%) |
Families and Households in Seminole
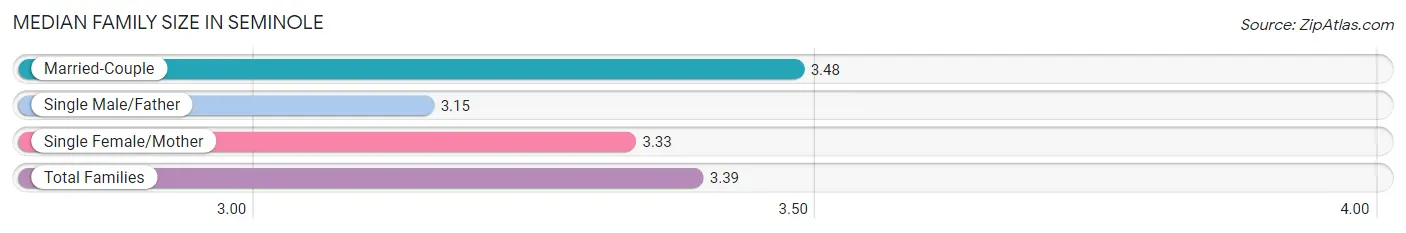
Median Family Size in Seminole
The median family size in Seminole is 3.39 persons per family, with married-couple families (908 | 54.9%) accounting for the largest median family size of 3.48 persons per family. On the other hand, single male/father families (211 | 12.8%) represent the smallest median family size with 3.15 persons per family.
| Family Type | # Families | Family Size |
| Married-Couple | 908 (54.9%) | 3.48 |
| Single Male/Father | 211 (12.8%) | 3.15 |
| Single Female/Mother | 536 (32.4%) | 3.33 |
| Total Families | 1,655 (100.0%) | 3.39 |
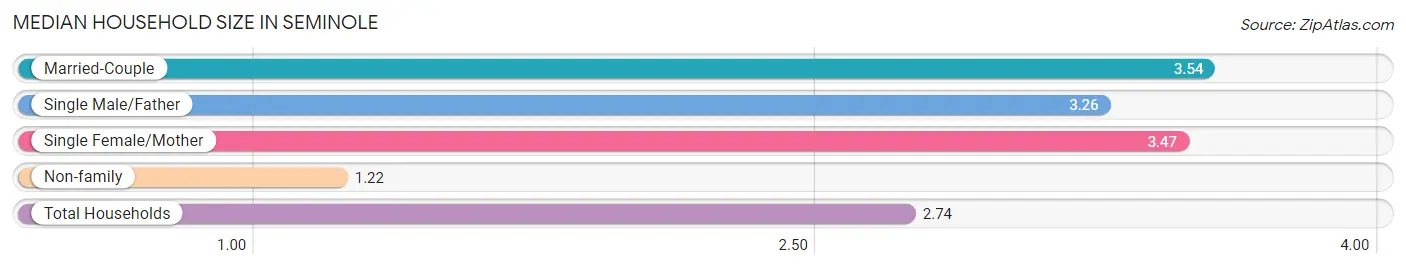
Median Household Size in Seminole
The median household size in Seminole is 2.74 persons per household, with married-couple households (908 | 36.9%) accounting for the largest median household size of 3.54 persons per household. non-family households (806 | 32.8%) represent the smallest median household size with 1.22 persons per household.
| Household Type | # Households | Household Size |
| Married-Couple | 908 (36.9%) | 3.54 |
| Single Male/Father | 211 (8.6%) | 3.26 |
| Single Female/Mother | 536 (21.8%) | 3.47 |
| Non-family | 806 (32.8%) | 1.22 |
| Total Households | 2,461 (100.0%) | 2.74 |
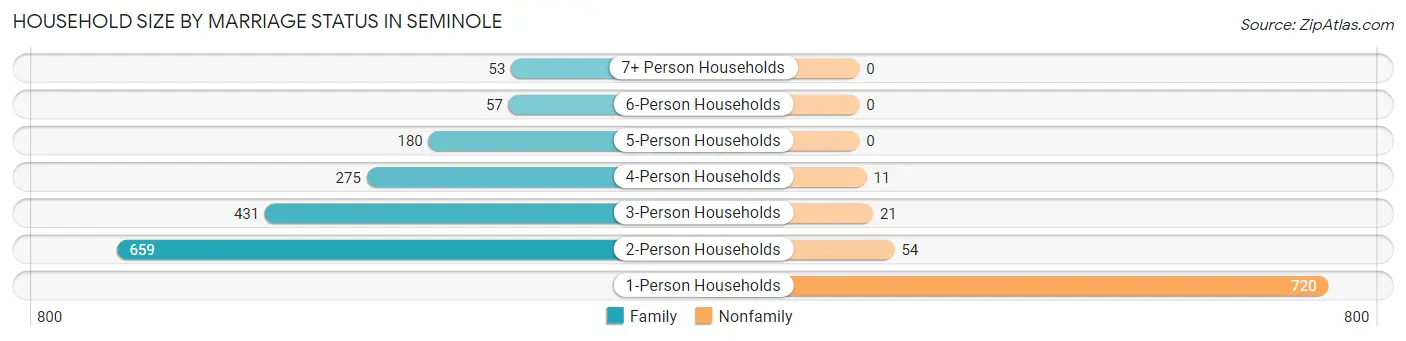
Household Size by Marriage Status in Seminole
Out of a total of 2,461 households in Seminole, 1,655 (67.2%) are family households, while 806 (32.8%) are nonfamily households. The most numerous type of family households are 2-person households, comprising 659, and the most common type of nonfamily households are 1-person households, comprising 720.
| Household Size | Family Households | Nonfamily Households |
| 1-Person Households | - | 720 (29.3%) |
| 2-Person Households | 659 (26.8%) | 54 (2.2%) |
| 3-Person Households | 431 (17.5%) | 21 (0.9%) |
| 4-Person Households | 275 (11.2%) | 11 (0.4%) |
| 5-Person Households | 180 (7.3%) | 0 (0.0%) |
| 6-Person Households | 57 (2.3%) | 0 (0.0%) |
| 7+ Person Households | 53 (2.1%) | 0 (0.0%) |
| Total | 1,655 (67.2%) | 806 (32.8%) |
Female Fertility in Seminole
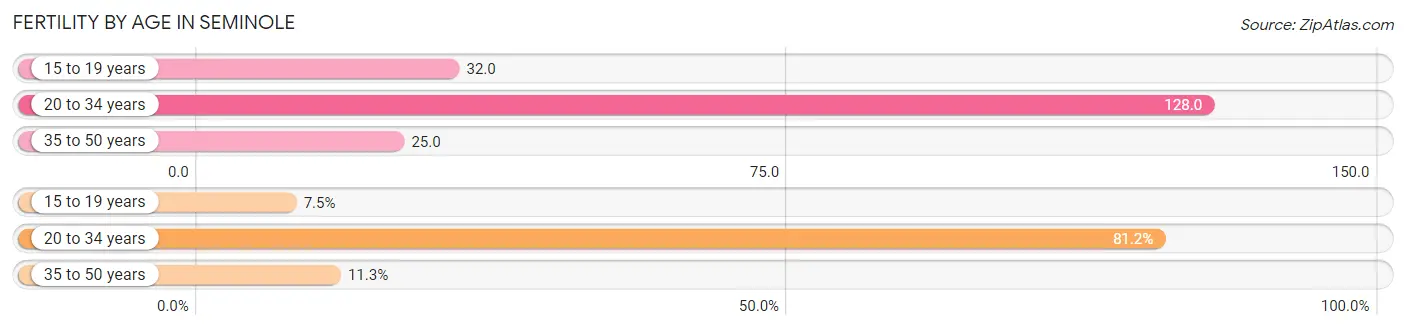
Fertility by Age in Seminole
Average fertility rate in Seminole is 75.0 births per 1,000 women. Women in the age bracket of 20 to 34 years have the highest fertility rate with 128.0 births per 1,000 women. Women in the age bracket of 20 to 34 years acount for 81.2% of all women with births.
| Age Bracket | Women with Births | Births / 1,000 Women |
| 15 to 19 years | 10 (7.5%) | 32.0 |
| 20 to 34 years | 108 (81.2%) | 128.0 |
| 35 to 50 years | 15 (11.3%) | 25.0 |
| Total | 133 (100.0%) | 75.0 |
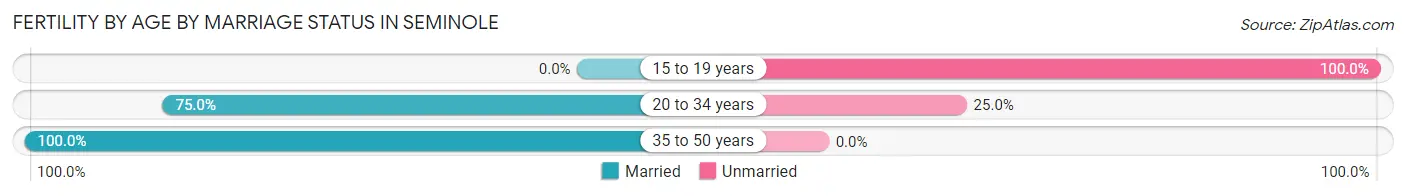
Fertility by Age by Marriage Status in Seminole
72.2% of women with births (133) in Seminole are married. The highest percentage of unmarried women with births falls into 15 to 19 years age bracket with 100.0% of them unmarried at the time of birth, while the lowest percentage of unmarried women with births belong to 35 to 50 years age bracket with 0.0% of them unmarried.
| Age Bracket | Married | Unmarried |
| 15 to 19 years | 0 (0.0%) | 10 (100.0%) |
| 20 to 34 years | 81 (75.0%) | 27 (25.0%) |
| 35 to 50 years | 15 (100.0%) | 0 (0.0%) |
| Total | 96 (72.2%) | 37 (27.8%) |
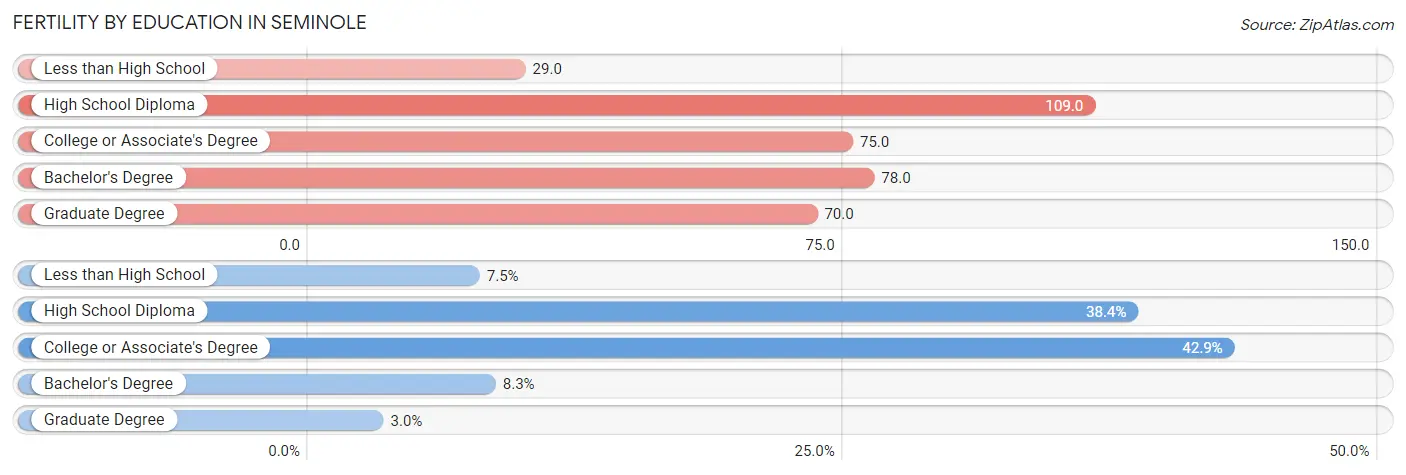
Fertility by Education in Seminole
Average fertility rate in Seminole is 75.0 births per 1,000 women. Women with the education attainment of high school diploma have the highest fertility rate of 109.0 births per 1,000 women, while women with the education attainment of less than high school have the lowest fertility at 29.0 births per 1,000 women. Women with the education attainment of college or associate's degree represent 42.9% of all women with births.
| Educational Attainment | Women with Births | Births / 1,000 Women |
| Less than High School | 10 (7.5%) | 29.0 |
| High School Diploma | 51 (38.4%) | 109.0 |
| College or Associate's Degree | 57 (42.9%) | 75.0 |
| Bachelor's Degree | 11 (8.3%) | 78.0 |
| Graduate Degree | 4 (3.0%) | 70.0 |
| Total | 133 (100.0%) | 75.0 |
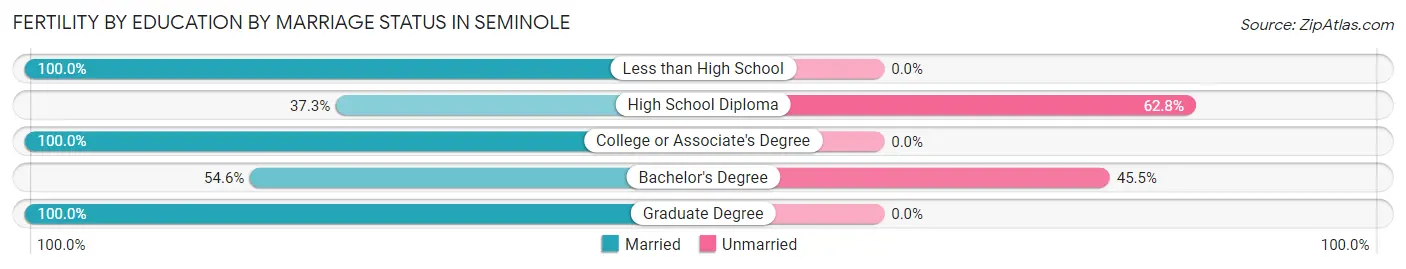
Fertility by Education by Marriage Status in Seminole
27.8% of women with births in Seminole are unmarried. Women with the educational attainment of less than high school are most likely to be married with 100.0% of them married at childbirth, while women with the educational attainment of high school diploma are least likely to be married with 62.7% of them unmarried at childbirth.
| Educational Attainment | Married | Unmarried |
| Less than High School | 10 (100.0%) | 0 (0.0%) |
| High School Diploma | 19 (37.2%) | 32 (62.7%) |
| College or Associate's Degree | 57 (100.0%) | 0 (0.0%) |
| Bachelor's Degree | 6 (54.5%) | 5 (45.5%) |
| Graduate Degree | 4 (100.0%) | 0 (0.0%) |
| Total | 96 (72.2%) | 37 (27.8%) |
Employment Characteristics in Seminole
Employment by Class of Employer in Seminole
Among the 2,711 employed individuals in Seminole, private company employees (1,982 | 73.1%), local government employees (254 | 9.4%), and self-employed (not incorporated) (136 | 5.0%) make up the most common classes of employment.
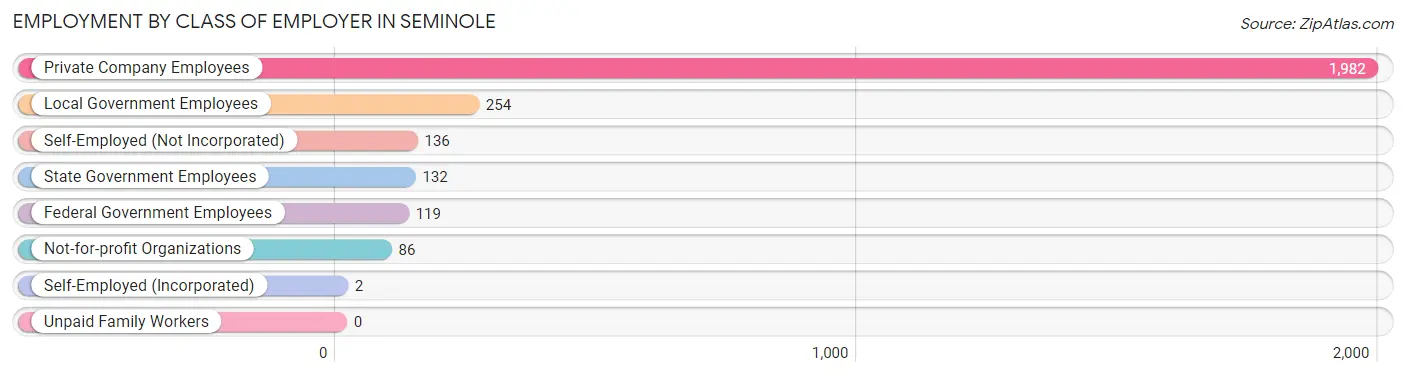
| Employer Class | # Employees | % Employees |
| Private Company Employees | 1,982 | 73.1% |
| Self-Employed (Incorporated) | 2 | 0.1% |
| Self-Employed (Not Incorporated) | 136 | 5.0% |
| Not-for-profit Organizations | 86 | 3.2% |
| Local Government Employees | 254 | 9.4% |
| State Government Employees | 132 | 4.9% |
| Federal Government Employees | 119 | 4.4% |
| Unpaid Family Workers | 0 | 0.0% |
| Total | 2,711 | 100.0% |
Employment Status by Age in Seminole
According to the labor force statistics for Seminole, out of the total population over 16 years of age (5,478), 53.5% or 2,931 individuals are in the labor force, with 7.1% or 208 of them unemployed. The age group with the highest labor force participation rate is 25 to 29 years, with 83.6% or 505 individuals in the labor force. Within the labor force, the 16 to 19 years age range has the highest percentage of unemployed individuals, with 24.2% or 55 of them being unemployed.
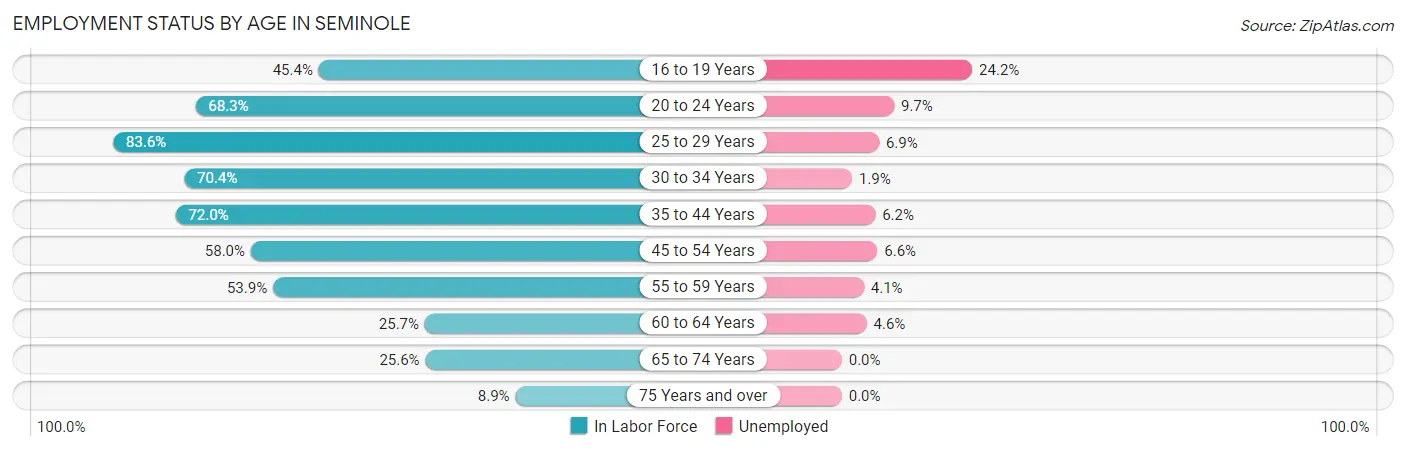
| Age Bracket | In Labor Force | Unemployed |
| 16 to 19 Years | 227 (45.4%) | 55 (24.2%) |
| 20 to 24 Years | 371 (68.3%) | 36 (9.7%) |
| 25 to 29 Years | 505 (83.6%) | 35 (6.9%) |
| 30 to 34 Years | 362 (70.4%) | 7 (1.9%) |
| 35 to 44 Years | 503 (72.0%) | 31 (6.2%) |
| 45 to 54 Years | 487 (58.0%) | 32 (6.6%) |
| 55 to 59 Years | 220 (53.9%) | 9 (4.1%) |
| 60 to 64 Years | 87 (25.7%) | 4 (4.6%) |
| 65 to 74 Years | 117 (25.6%) | 0 (0.0%) |
| 75 Years and over | 51 (8.9%) | 0 (0.0%) |
| Total | 2,931 (53.5%) | 208 (7.1%) |
Employment Status by Educational Attainment in Seminole
According to labor force statistics for Seminole, 63.6% of individuals (2,164) out of the total population between 25 and 64 years of age (3,403) are in the labor force, with 5.5% or 119 of them being unemployed. The group with the highest labor force participation rate are those with the educational attainment of bachelor's degree or higher, with 67.5% or 253 individuals in the labor force. Within the labor force, individuals with less than high school education have the highest percentage of unemployment, with 14.6% or 47 of them being unemployed.
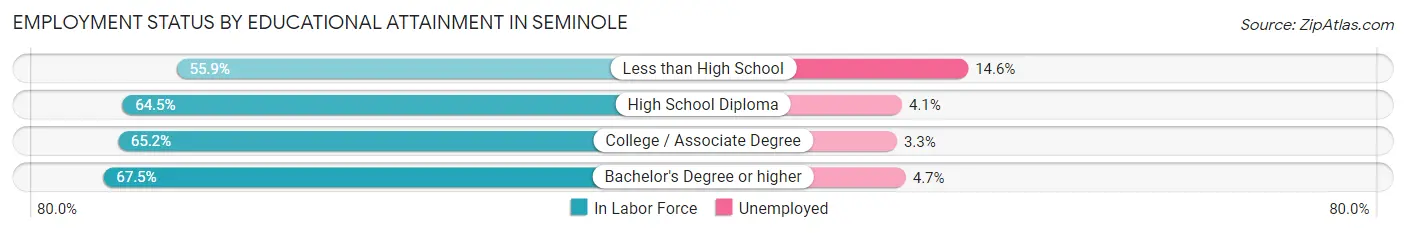
| Educational Attainment | In Labor Force | Unemployed |
| Less than High School | 323 (55.9%) | 84 (14.6%) |
| High School Diploma | 782 (64.5%) | 50 (4.1%) |
| College / Associate Degree | 807 (65.2%) | 41 (3.3%) |
| Bachelor's Degree or higher | 253 (67.5%) | 18 (4.7%) |
| Total | 2,164 (63.6%) | 187 (5.5%) |
Employment Occupations by Sex in Seminole
Management, Business, Science and Arts Occupations
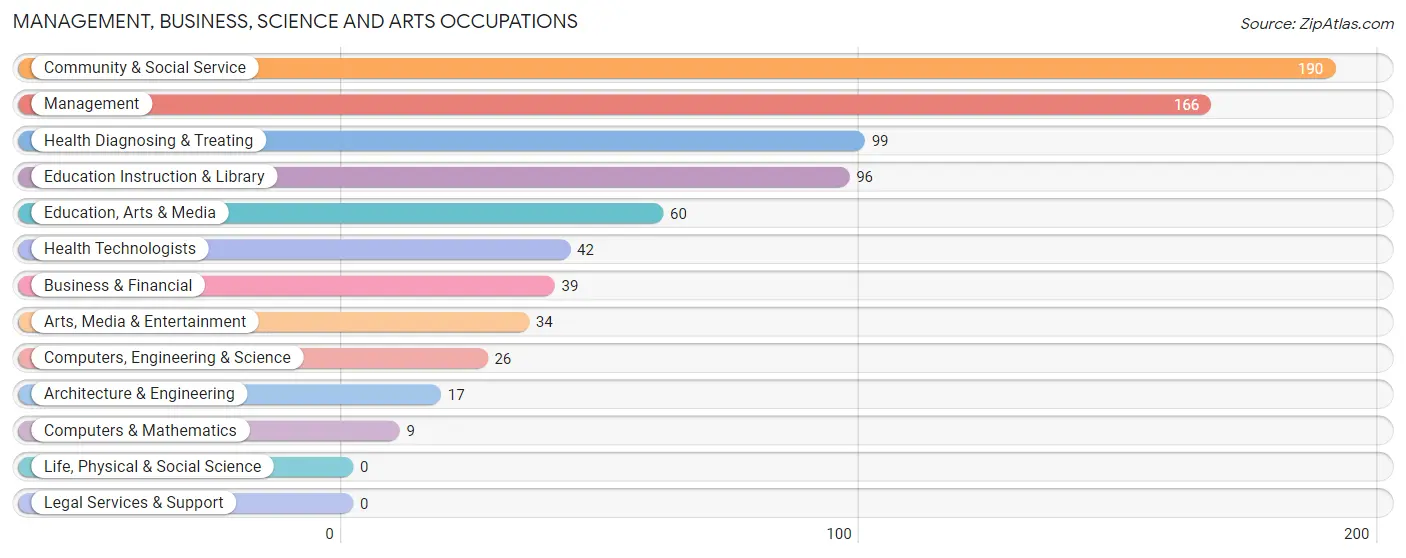
The most common Management, Business, Science and Arts occupations in Seminole are Community & Social Service (190 | 7.0%), Management (166 | 6.1%), Health Diagnosing & Treating (99 | 3.6%), Education Instruction & Library (96 | 3.5%), and Education, Arts & Media (60 | 2.2%).
Management, Business, Science and Arts Occupations by Sex
Within the Management, Business, Science and Arts occupations in Seminole, the most male-oriented occupations are Architecture & Engineering (100.0%), Computers, Engineering & Science (65.4%), and Management (54.2%), while the most female-oriented occupations are Computers & Mathematics (100.0%), Arts, Media & Entertainment (97.1%), and Health Diagnosing & Treating (97.0%).
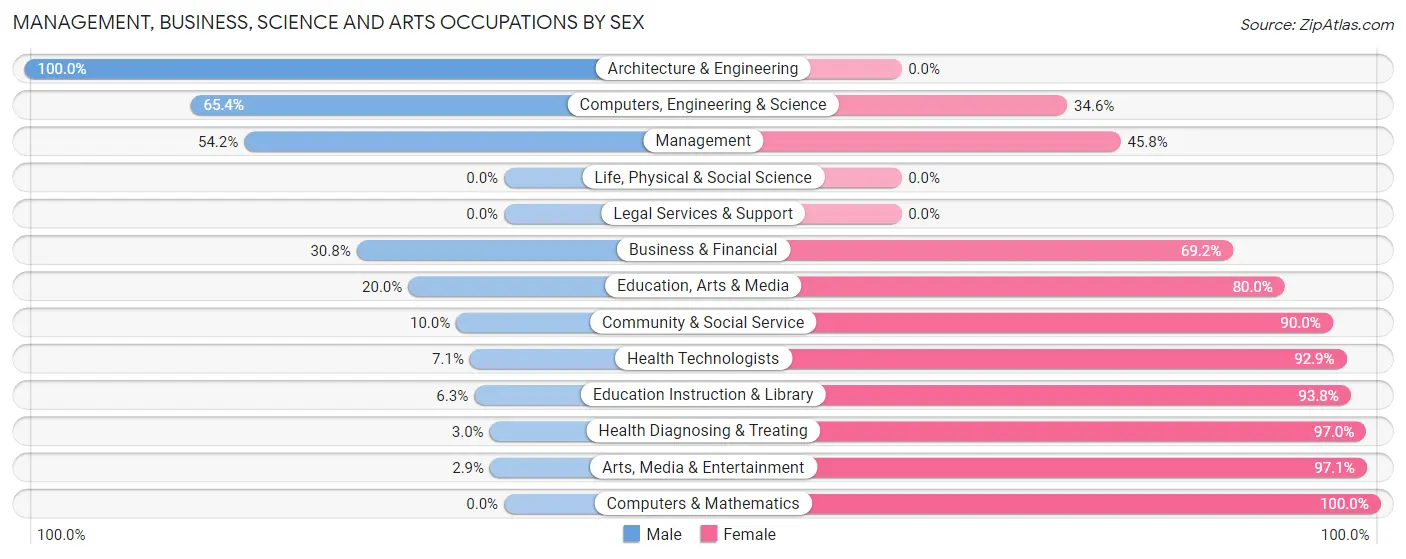
| Occupation | Male | Female |
| Management | 90 (54.2%) | 76 (45.8%) |
| Business & Financial | 12 (30.8%) | 27 (69.2%) |
| Computers, Engineering & Science | 17 (65.4%) | 9 (34.6%) |
| Computers & Mathematics | 0 (0.0%) | 9 (100.0%) |
| Architecture & Engineering | 17 (100.0%) | 0 (0.0%) |
| Life, Physical & Social Science | 0 (0.0%) | 0 (0.0%) |
| Community & Social Service | 19 (10.0%) | 171 (90.0%) |
| Education, Arts & Media | 12 (20.0%) | 48 (80.0%) |
| Legal Services & Support | 0 (0.0%) | 0 (0.0%) |
| Education Instruction & Library | 6 (6.2%) | 90 (93.8%) |
| Arts, Media & Entertainment | 1 (2.9%) | 33 (97.1%) |
| Health Diagnosing & Treating | 3 (3.0%) | 96 (97.0%) |
| Health Technologists | 3 (7.1%) | 39 (92.9%) |
| Total (Category) | 141 (27.1%) | 379 (72.9%) |
| Total (Overall) | 1,337 (49.1%) | 1,384 (50.9%) |
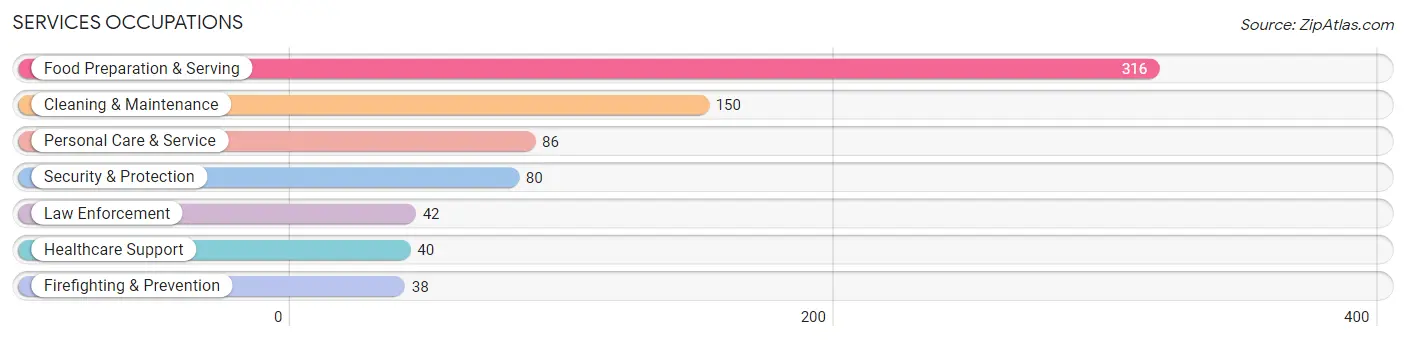
Services Occupations
The most common Services occupations in Seminole are Food Preparation & Serving (316 | 11.6%), Cleaning & Maintenance (150 | 5.5%), Personal Care & Service (86 | 3.2%), Security & Protection (80 | 2.9%), and Law Enforcement (42 | 1.5%).
Services Occupations by Sex
Within the Services occupations in Seminole, the most male-oriented occupations are Law Enforcement (100.0%), Security & Protection (78.7%), and Firefighting & Prevention (55.3%), while the most female-oriented occupations are Healthcare Support (100.0%), Personal Care & Service (73.3%), and Cleaning & Maintenance (52.0%).
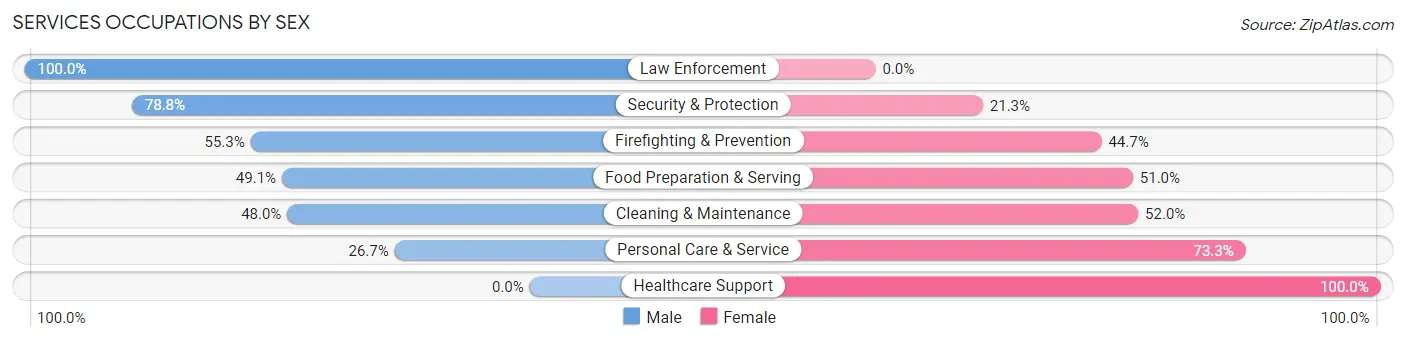
| Occupation | Male | Female |
| Healthcare Support | 0 (0.0%) | 40 (100.0%) |
| Security & Protection | 63 (78.7%) | 17 (21.2%) |
| Firefighting & Prevention | 21 (55.3%) | 17 (44.7%) |
| Law Enforcement | 42 (100.0%) | 0 (0.0%) |
| Food Preparation & Serving | 155 (49.0%) | 161 (50.9%) |
| Cleaning & Maintenance | 72 (48.0%) | 78 (52.0%) |
| Personal Care & Service | 23 (26.7%) | 63 (73.3%) |
| Total (Category) | 313 (46.6%) | 359 (53.4%) |
| Total (Overall) | 1,337 (49.1%) | 1,384 (50.9%) |
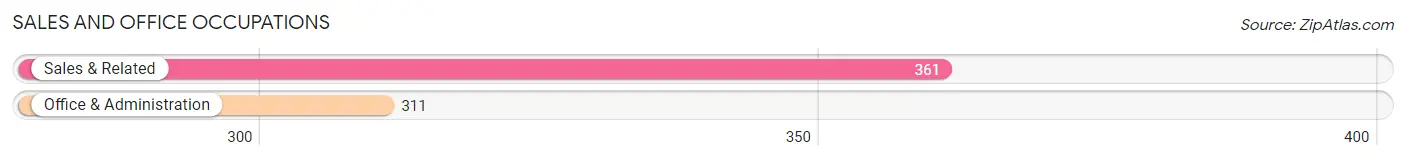
Sales and Office Occupations
The most common Sales and Office occupations in Seminole are Sales & Related (361 | 13.3%), and Office & Administration (311 | 11.4%).
Sales and Office Occupations by Sex
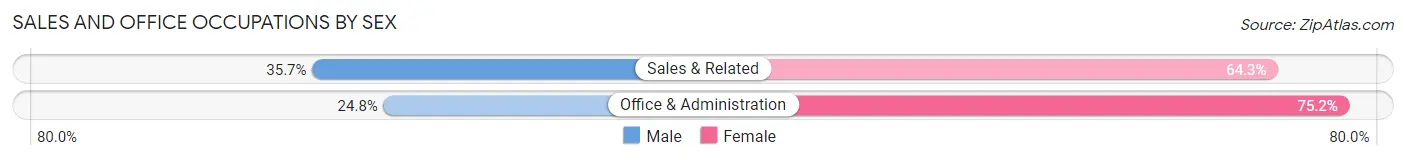
| Occupation | Male | Female |
| Sales & Related | 129 (35.7%) | 232 (64.3%) |
| Office & Administration | 77 (24.8%) | 234 (75.2%) |
| Total (Category) | 206 (30.6%) | 466 (69.4%) |
| Total (Overall) | 1,337 (49.1%) | 1,384 (50.9%) |
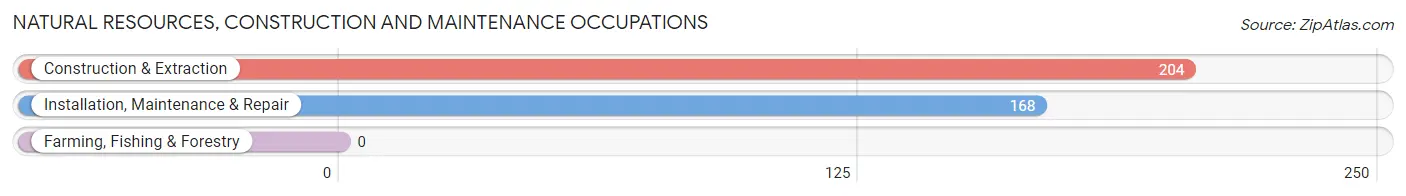
Natural Resources, Construction and Maintenance Occupations
The most common Natural Resources, Construction and Maintenance occupations in Seminole are Construction & Extraction (204 | 7.5%), and Installation, Maintenance & Repair (168 | 6.2%).
Natural Resources, Construction and Maintenance Occupations by Sex
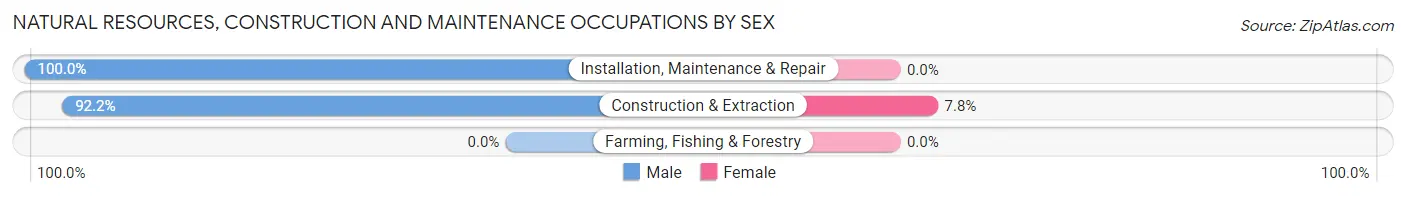
| Occupation | Male | Female |
| Farming, Fishing & Forestry | 0 (0.0%) | 0 (0.0%) |
| Construction & Extraction | 188 (92.2%) | 16 (7.8%) |
| Installation, Maintenance & Repair | 168 (100.0%) | 0 (0.0%) |
| Total (Category) | 356 (95.7%) | 16 (4.3%) |
| Total (Overall) | 1,337 (49.1%) | 1,384 (50.9%) |
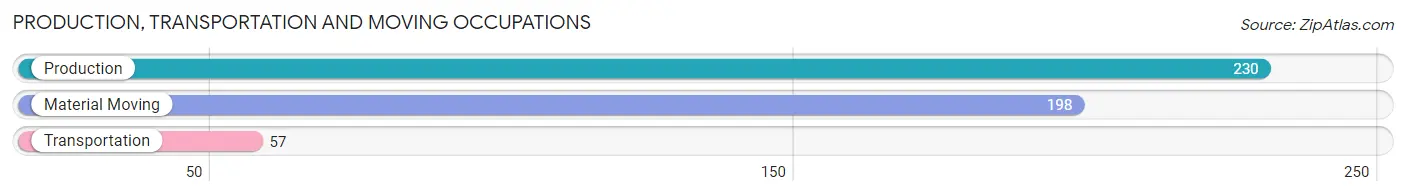
Production, Transportation and Moving Occupations
The most common Production, Transportation and Moving occupations in Seminole are Production (230 | 8.5%), Material Moving (198 | 7.3%), and Transportation (57 | 2.1%).
Production, Transportation and Moving Occupations by Sex
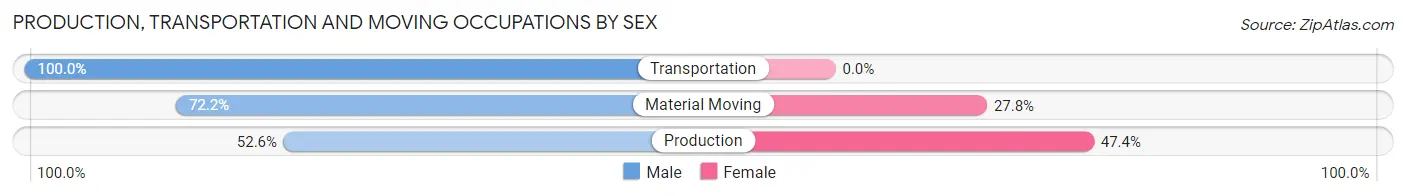
| Occupation | Male | Female |
| Production | 121 (52.6%) | 109 (47.4%) |
| Transportation | 57 (100.0%) | 0 (0.0%) |
| Material Moving | 143 (72.2%) | 55 (27.8%) |
| Total (Category) | 321 (66.2%) | 164 (33.8%) |
| Total (Overall) | 1,337 (49.1%) | 1,384 (50.9%) |
Employment Industries by Sex in Seminole
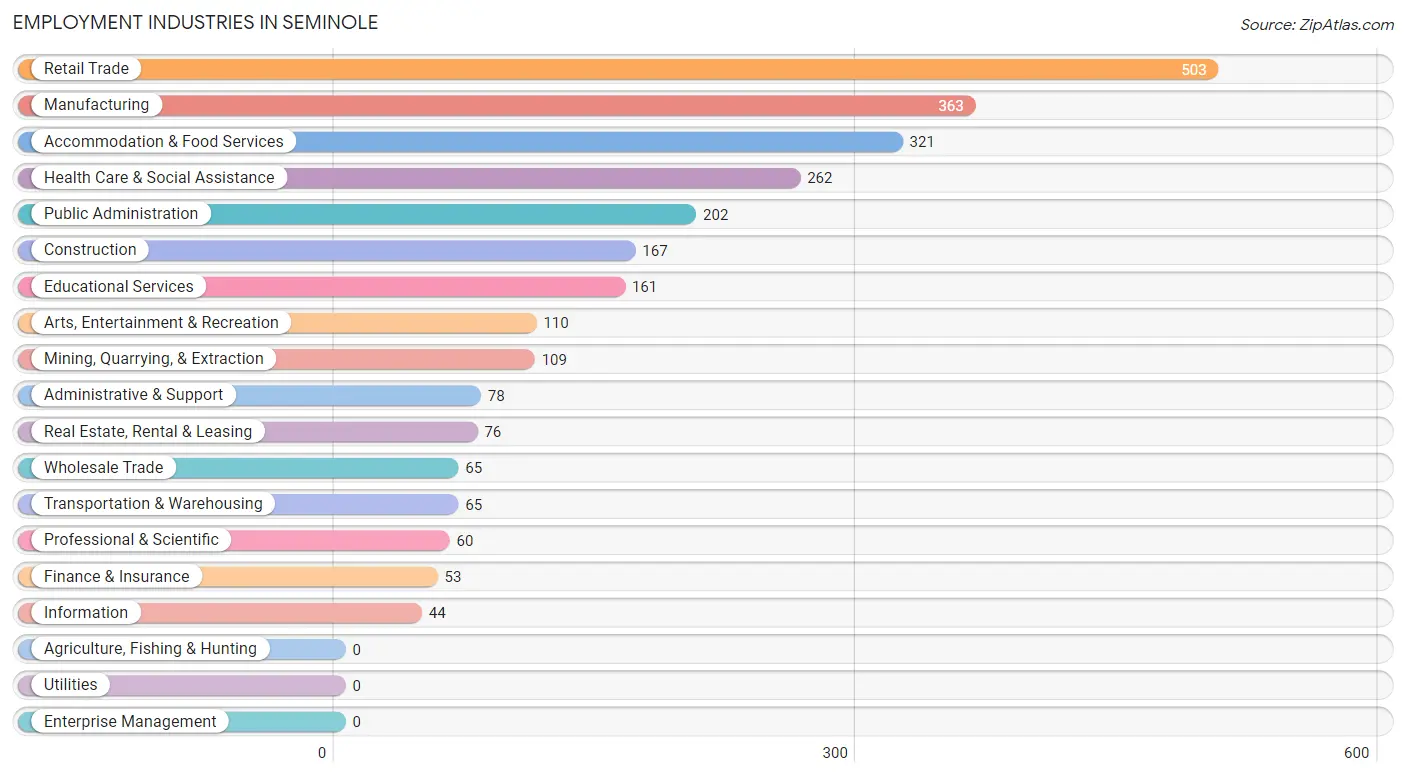
Employment Industries in Seminole
The major employment industries in Seminole include Retail Trade (503 | 18.5%), Manufacturing (363 | 13.3%), Accommodation & Food Services (321 | 11.8%), Health Care & Social Assistance (262 | 9.6%), and Public Administration (202 | 7.4%).
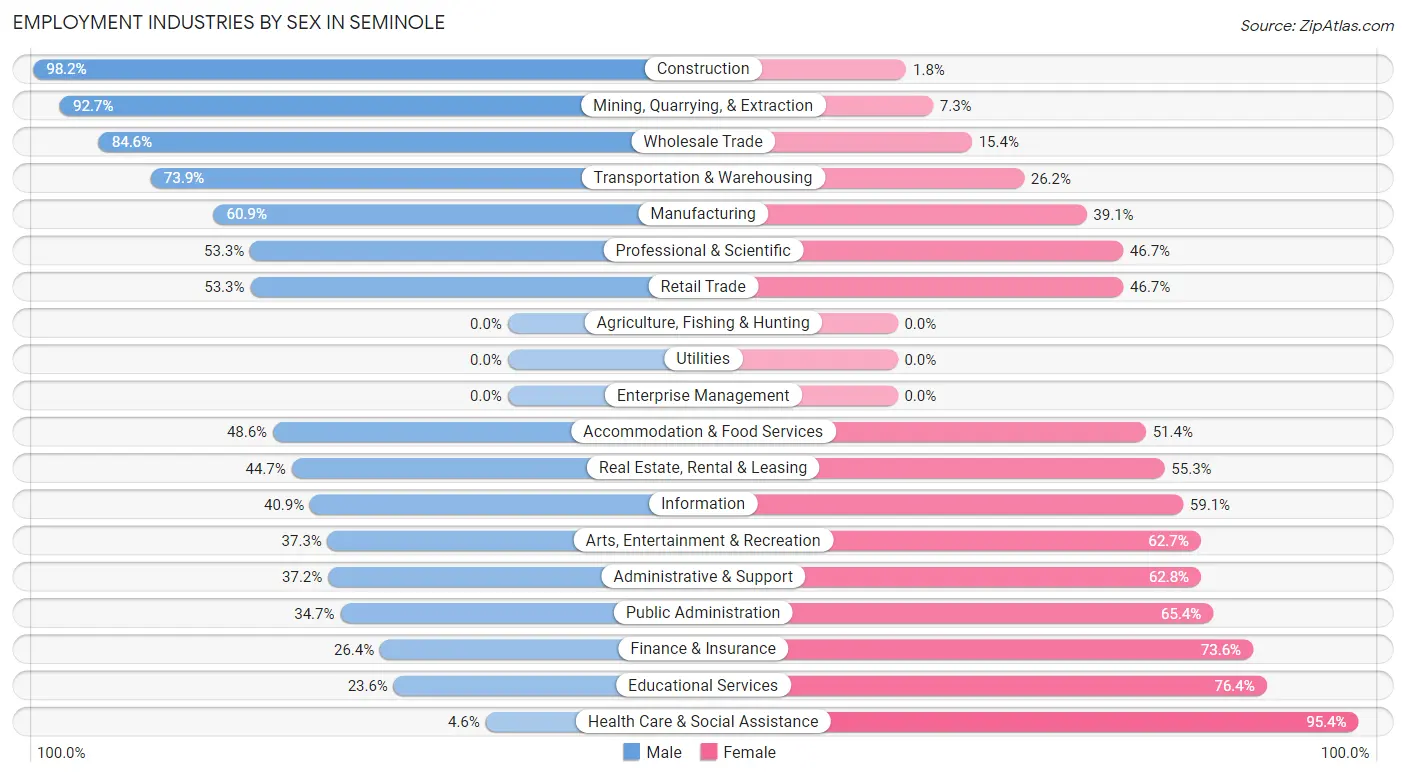
Employment Industries by Sex in Seminole
The Seminole industries that see more men than women are Construction (98.2%), Mining, Quarrying, & Extraction (92.7%), and Wholesale Trade (84.6%), whereas the industries that tend to have a higher number of women are Health Care & Social Assistance (95.4%), Educational Services (76.4%), and Finance & Insurance (73.6%).
| Industry | Male | Female |
| Agriculture, Fishing & Hunting | 0 (0.0%) | 0 (0.0%) |
| Mining, Quarrying, & Extraction | 101 (92.7%) | 8 (7.3%) |
| Construction | 164 (98.2%) | 3 (1.8%) |
| Manufacturing | 221 (60.9%) | 142 (39.1%) |
| Wholesale Trade | 55 (84.6%) | 10 (15.4%) |
| Retail Trade | 268 (53.3%) | 235 (46.7%) |
| Transportation & Warehousing | 48 (73.9%) | 17 (26.2%) |
| Utilities | 0 (0.0%) | 0 (0.0%) |
| Information | 18 (40.9%) | 26 (59.1%) |
| Finance & Insurance | 14 (26.4%) | 39 (73.6%) |
| Real Estate, Rental & Leasing | 34 (44.7%) | 42 (55.3%) |
| Professional & Scientific | 32 (53.3%) | 28 (46.7%) |
| Enterprise Management | 0 (0.0%) | 0 (0.0%) |
| Administrative & Support | 29 (37.2%) | 49 (62.8%) |
| Educational Services | 38 (23.6%) | 123 (76.4%) |
| Health Care & Social Assistance | 12 (4.6%) | 250 (95.4%) |
| Arts, Entertainment & Recreation | 41 (37.3%) | 69 (62.7%) |
| Accommodation & Food Services | 156 (48.6%) | 165 (51.4%) |
| Public Administration | 70 (34.6%) | 132 (65.3%) |
| Total | 1,337 (49.1%) | 1,384 (50.9%) |
Education in Seminole
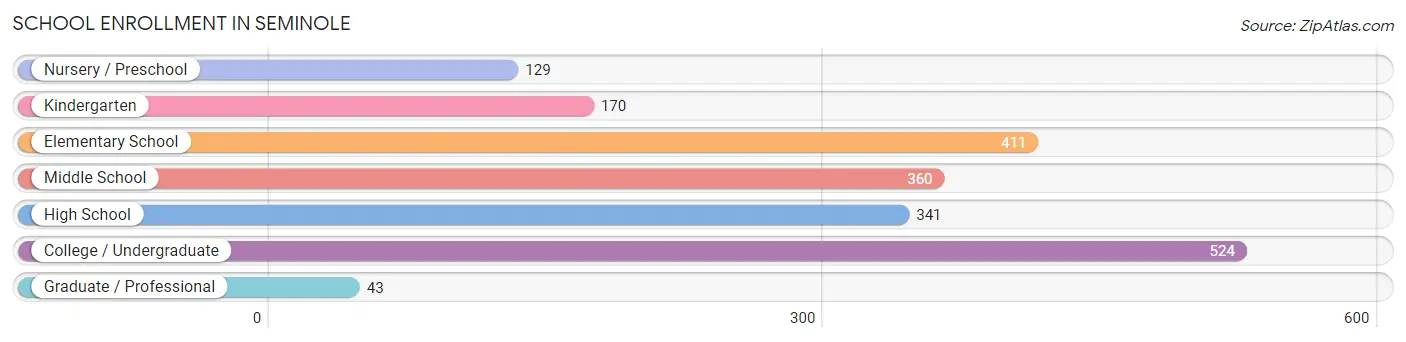
School Enrollment in Seminole
The most common levels of schooling among the 1,978 students in Seminole are college / undergraduate (524 | 26.5%), elementary school (411 | 20.8%), and middle school (360 | 18.2%).
| School Level | # Students | % Students |
| Nursery / Preschool | 129 | 6.5% |
| Kindergarten | 170 | 8.6% |
| Elementary School | 411 | 20.8% |
| Middle School | 360 | 18.2% |
| High School | 341 | 17.2% |
| College / Undergraduate | 524 | 26.5% |
| Graduate / Professional | 43 | 2.2% |
| Total | 1,978 | 100.0% |
School Enrollment by Age by Funding Source in Seminole
Out of a total of 1,978 students who are enrolled in schools in Seminole, 65 (3.3%) attend a private institution, while the remaining 1,913 (96.7%) are enrolled in public schools. The age group of 25 to 34 year olds has the highest likelihood of being enrolled in private schools, with 15 (10.8% in the age bracket) enrolled. Conversely, the age group of 3 to 4 year olds has the lowest likelihood of being enrolled in a private school, with 109 (100.0% in the age bracket) attending a public institution.
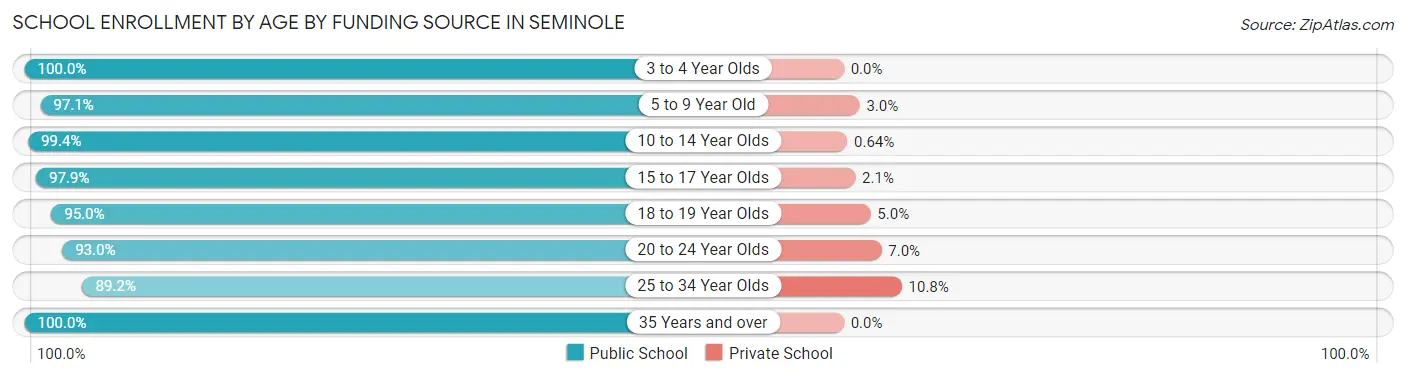
| Age Bracket | Public School | Private School |
| 3 to 4 Year Olds | 109 (100.0%) | 0 (0.0%) |
| 5 to 9 Year Old | 494 (97.1%) | 15 (2.9%) |
| 10 to 14 Year Olds | 464 (99.4%) | 3 (0.6%) |
| 15 to 17 Year Olds | 229 (97.9%) | 5 (2.1%) |
| 18 to 19 Year Olds | 229 (95.0%) | 12 (5.0%) |
| 20 to 24 Year Olds | 212 (93.0%) | 16 (7.0%) |
| 25 to 34 Year Olds | 124 (89.2%) | 15 (10.8%) |
| 35 Years and over | 51 (100.0%) | 0 (0.0%) |
| Total | 1,913 (96.7%) | 65 (3.3%) |
Educational Attainment by Field of Study in Seminole
Education (136 | 24.8%), business (131 | 23.9%), science & technology (61 | 11.1%), arts & humanities (56 | 10.2%), and literature & languages (27 | 4.9%) are the most common fields of study among 548 individuals in Seminole who have obtained a bachelor's degree or higher.
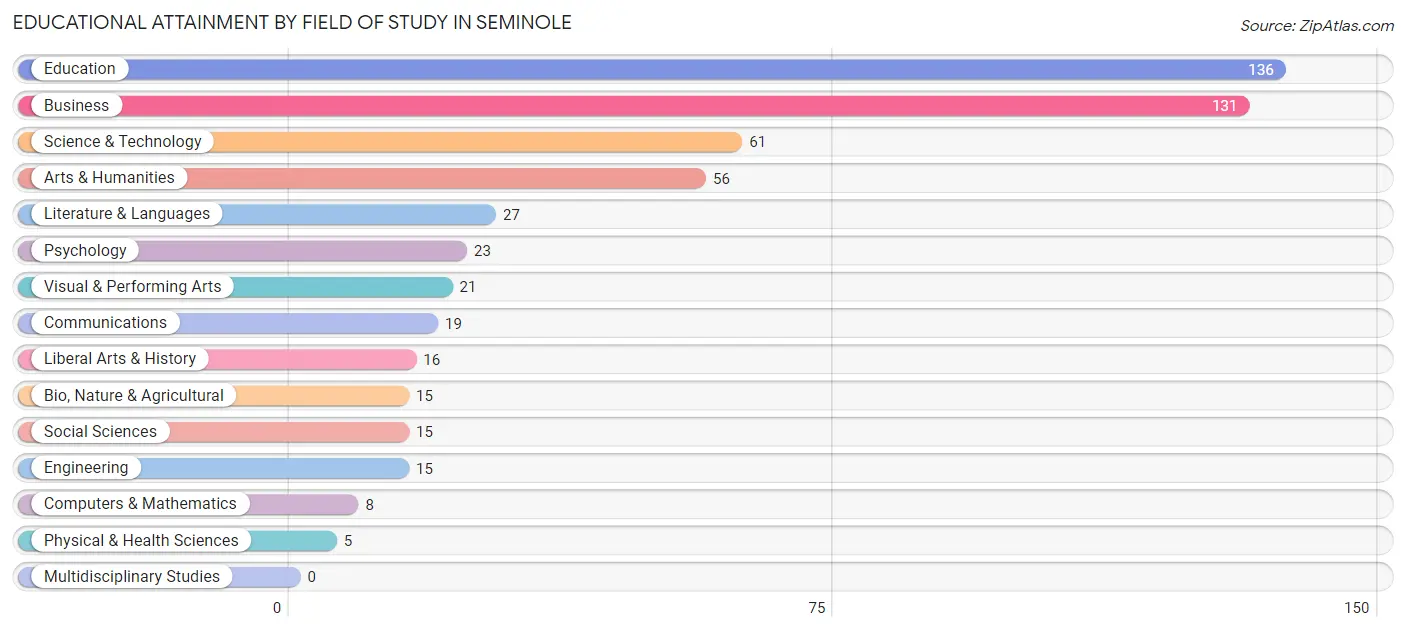
| Field of Study | # Graduates | % Graduates |
| Computers & Mathematics | 8 | 1.5% |
| Bio, Nature & Agricultural | 15 | 2.7% |
| Physical & Health Sciences | 5 | 0.9% |
| Psychology | 23 | 4.2% |
| Social Sciences | 15 | 2.7% |
| Engineering | 15 | 2.7% |
| Multidisciplinary Studies | 0 | 0.0% |
| Science & Technology | 61 | 11.1% |
| Business | 131 | 23.9% |
| Education | 136 | 24.8% |
| Literature & Languages | 27 | 4.9% |
| Liberal Arts & History | 16 | 2.9% |
| Visual & Performing Arts | 21 | 3.8% |
| Communications | 19 | 3.5% |
| Arts & Humanities | 56 | 10.2% |
| Total | 548 | 100.0% |
Transportation & Commute in Seminole
Vehicle Availability by Sex in Seminole
The most prevalent vehicle ownership categories in Seminole are males with 2 vehicles (447, accounting for 34.4%) and females with 2 vehicles (398, making up 34.5%).
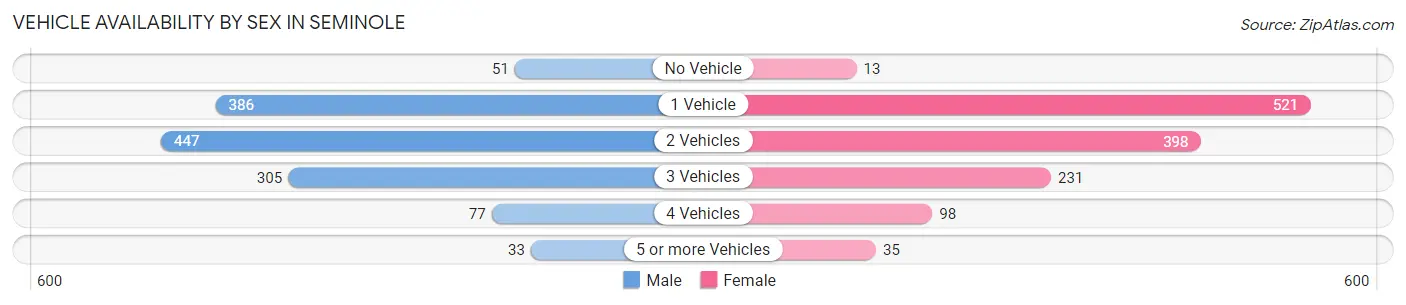
| Vehicles Available | Male | Female |
| No Vehicle | 51 (3.9%) | 13 (1.0%) |
| 1 Vehicle | 386 (29.7%) | 521 (40.2%) |
| 2 Vehicles | 447 (34.4%) | 398 (30.7%) |
| 3 Vehicles | 305 (23.5%) | 231 (17.8%) |
| 4 Vehicles | 77 (5.9%) | 98 (7.6%) |
| 5 or more Vehicles | 33 (2.5%) | 35 (2.7%) |
| Total | 1,299 (100.0%) | 1,296 (100.0%) |
Commute Time in Seminole
The most frequently occuring commute durations in Seminole are 5 to 9 minutes (993 commuters, 37.2%), 10 to 14 minutes (383 commuters, 14.3%), and 30 to 34 minutes (283 commuters, 10.6%).
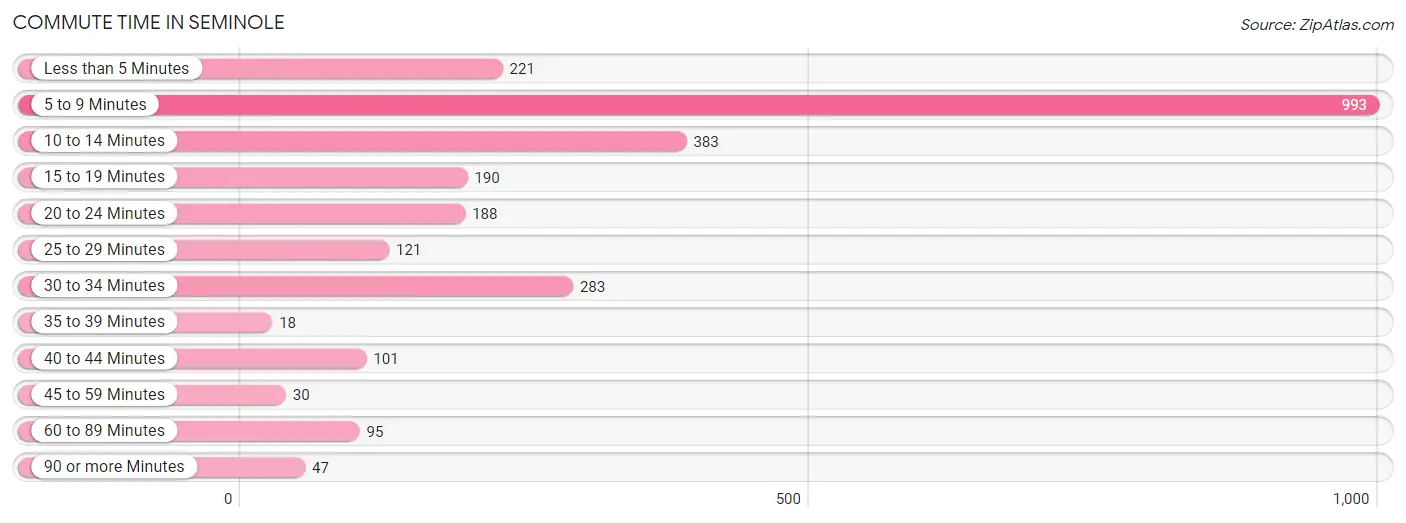
| Commute Time | # Commuters | % Commuters |
| Less than 5 Minutes | 221 | 8.3% |
| 5 to 9 Minutes | 993 | 37.2% |
| 10 to 14 Minutes | 383 | 14.3% |
| 15 to 19 Minutes | 190 | 7.1% |
| 20 to 24 Minutes | 188 | 7.0% |
| 25 to 29 Minutes | 121 | 4.5% |
| 30 to 34 Minutes | 283 | 10.6% |
| 35 to 39 Minutes | 18 | 0.7% |
| 40 to 44 Minutes | 101 | 3.8% |
| 45 to 59 Minutes | 30 | 1.1% |
| 60 to 89 Minutes | 95 | 3.6% |
| 90 or more Minutes | 47 | 1.8% |
Commute Time by Sex in Seminole
The most common commute times in Seminole are 5 to 9 minutes (487 commuters, 37.0%) for males and 5 to 9 minutes (506 commuters, 37.4%) for females.
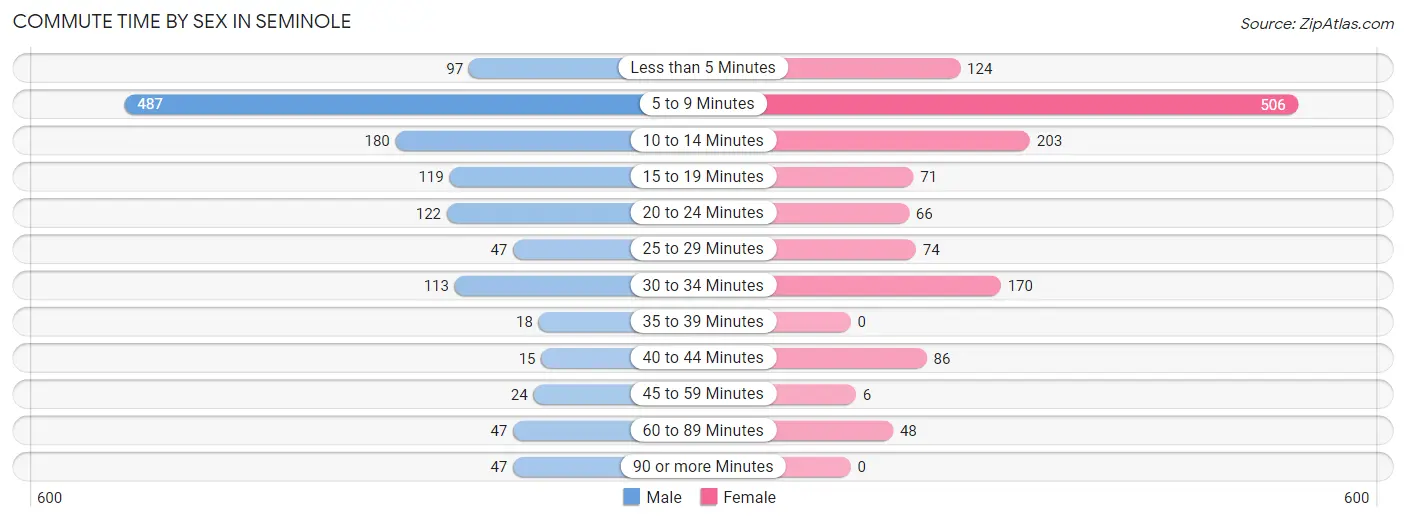
| Commute Time | Male | Female |
| Less than 5 Minutes | 97 (7.4%) | 124 (9.2%) |
| 5 to 9 Minutes | 487 (37.0%) | 506 (37.4%) |
| 10 to 14 Minutes | 180 (13.7%) | 203 (15.0%) |
| 15 to 19 Minutes | 119 (9.0%) | 71 (5.2%) |
| 20 to 24 Minutes | 122 (9.3%) | 66 (4.9%) |
| 25 to 29 Minutes | 47 (3.6%) | 74 (5.5%) |
| 30 to 34 Minutes | 113 (8.6%) | 170 (12.6%) |
| 35 to 39 Minutes | 18 (1.4%) | 0 (0.0%) |
| 40 to 44 Minutes | 15 (1.1%) | 86 (6.4%) |
| 45 to 59 Minutes | 24 (1.8%) | 6 (0.4%) |
| 60 to 89 Minutes | 47 (3.6%) | 48 (3.5%) |
| 90 or more Minutes | 47 (3.6%) | 0 (0.0%) |
Time of Departure to Work by Sex in Seminole
The most frequent times of departure to work in Seminole are 7:30 AM to 7:59 AM (165, 12.5%) for males and 7:30 AM to 7:59 AM (288, 21.3%) for females.
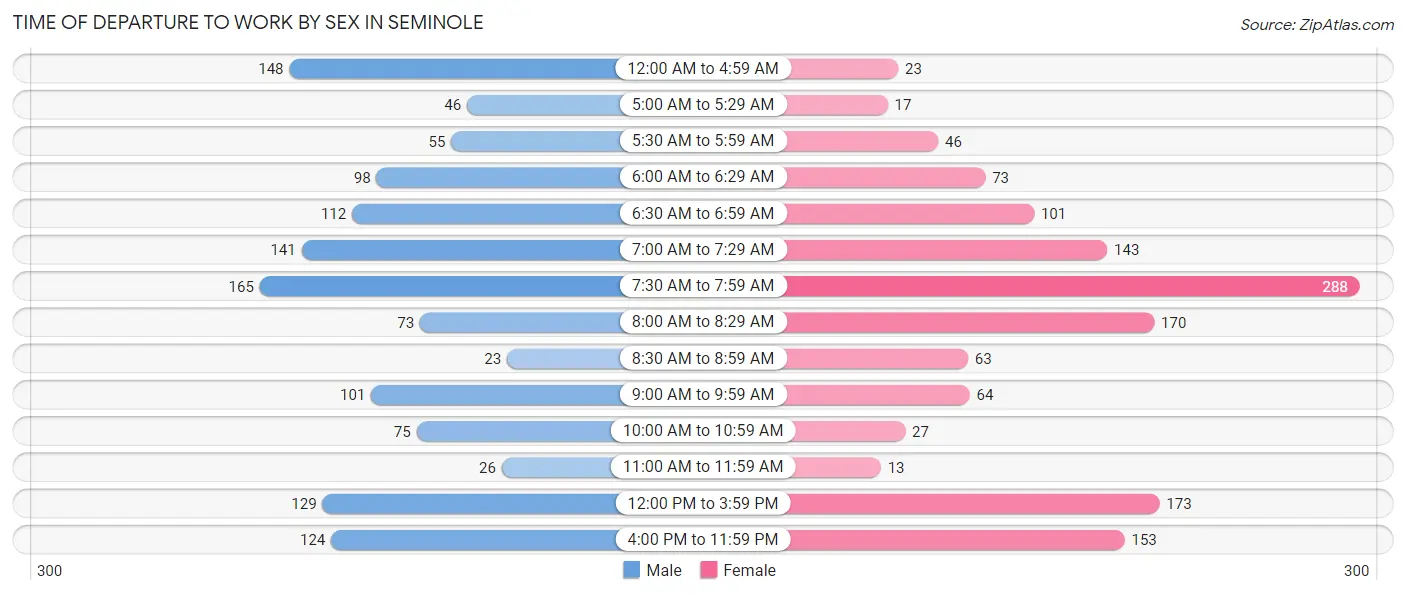
| Time of Departure | Male | Female |
| 12:00 AM to 4:59 AM | 148 (11.3%) | 23 (1.7%) |
| 5:00 AM to 5:29 AM | 46 (3.5%) | 17 (1.3%) |
| 5:30 AM to 5:59 AM | 55 (4.2%) | 46 (3.4%) |
| 6:00 AM to 6:29 AM | 98 (7.4%) | 73 (5.4%) |
| 6:30 AM to 6:59 AM | 112 (8.5%) | 101 (7.5%) |
| 7:00 AM to 7:29 AM | 141 (10.7%) | 143 (10.6%) |
| 7:30 AM to 7:59 AM | 165 (12.5%) | 288 (21.3%) |
| 8:00 AM to 8:29 AM | 73 (5.6%) | 170 (12.6%) |
| 8:30 AM to 8:59 AM | 23 (1.8%) | 63 (4.6%) |
| 9:00 AM to 9:59 AM | 101 (7.7%) | 64 (4.7%) |
| 10:00 AM to 10:59 AM | 75 (5.7%) | 27 (2.0%) |
| 11:00 AM to 11:59 AM | 26 (2.0%) | 13 (1.0%) |
| 12:00 PM to 3:59 PM | 129 (9.8%) | 173 (12.8%) |
| 4:00 PM to 11:59 PM | 124 (9.4%) | 153 (11.3%) |
| Total | 1,316 (100.0%) | 1,354 (100.0%) |
Housing Occupancy in Seminole
Occupancy by Ownership in Seminole
Of the total 2,461 dwellings in Seminole, owner-occupied units account for 1,326 (53.9%), while renter-occupied units make up 1,135 (46.1%).
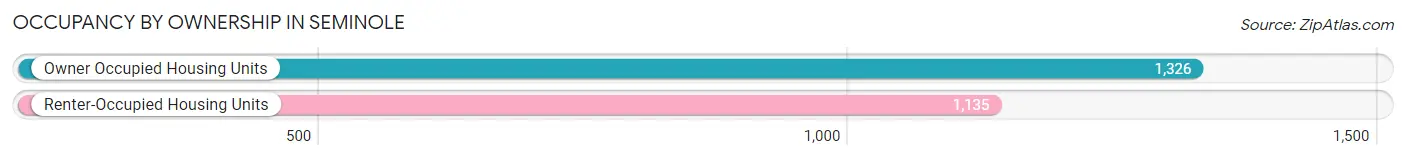
| Occupancy | # Housing Units | % Housing Units |
| Owner Occupied Housing Units | 1,326 | 53.9% |
| Renter-Occupied Housing Units | 1,135 | 46.1% |
| Total Occupied Housing Units | 2,461 | 100.0% |
Occupancy by Household Size in Seminole
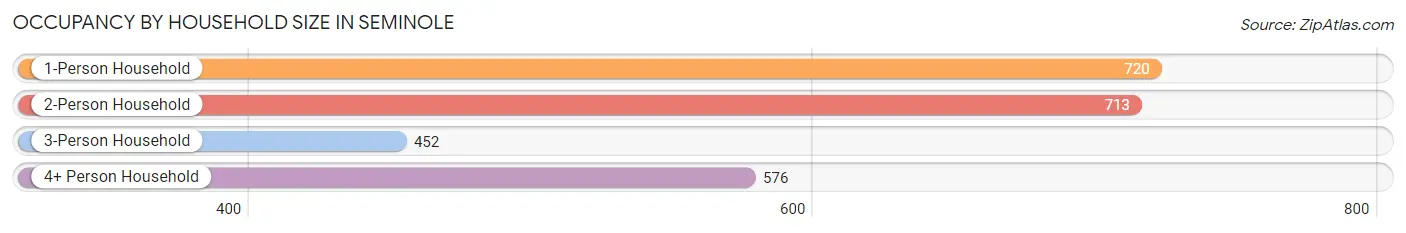
| Household Size | # Housing Units | % Housing Units |
| 1-Person Household | 720 | 29.3% |
| 2-Person Household | 713 | 29.0% |
| 3-Person Household | 452 | 18.4% |
| 4+ Person Household | 576 | 23.4% |
| Total Housing Units | 2,461 | 100.0% |
Occupancy by Ownership by Household Size in Seminole
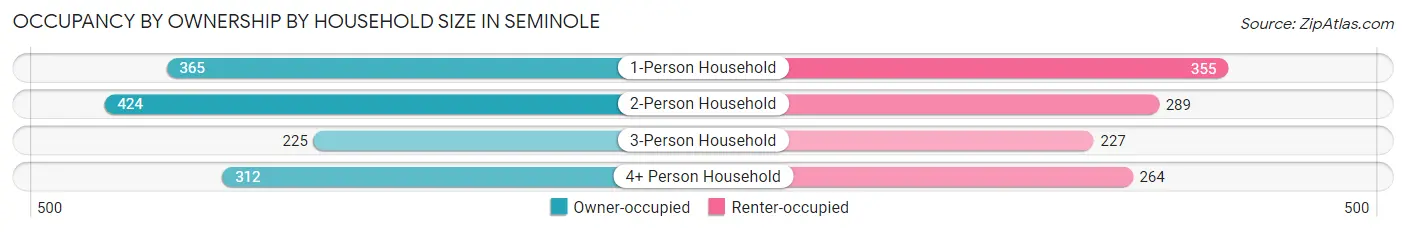
| Household Size | Owner-occupied | Renter-occupied |
| 1-Person Household | 365 (50.7%) | 355 (49.3%) |
| 2-Person Household | 424 (59.5%) | 289 (40.5%) |
| 3-Person Household | 225 (49.8%) | 227 (50.2%) |
| 4+ Person Household | 312 (54.2%) | 264 (45.8%) |
| Total Housing Units | 1,326 (53.9%) | 1,135 (46.1%) |
Occupancy by Educational Attainment in Seminole
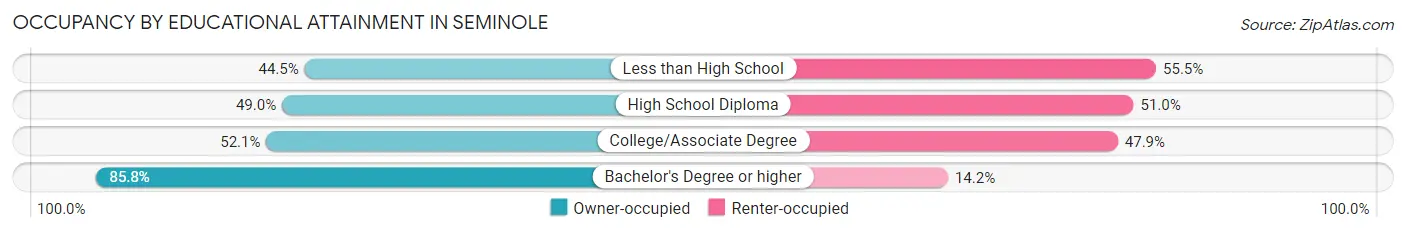
| Household Size | Owner-occupied | Renter-occupied |
| Less than High School | 190 (44.5%) | 237 (55.5%) |
| High School Diploma | 356 (49.0%) | 371 (51.0%) |
| College/Associate Degree | 527 (52.1%) | 485 (47.9%) |
| Bachelor's Degree or higher | 253 (85.8%) | 42 (14.2%) |
Occupancy by Age of Householder in Seminole
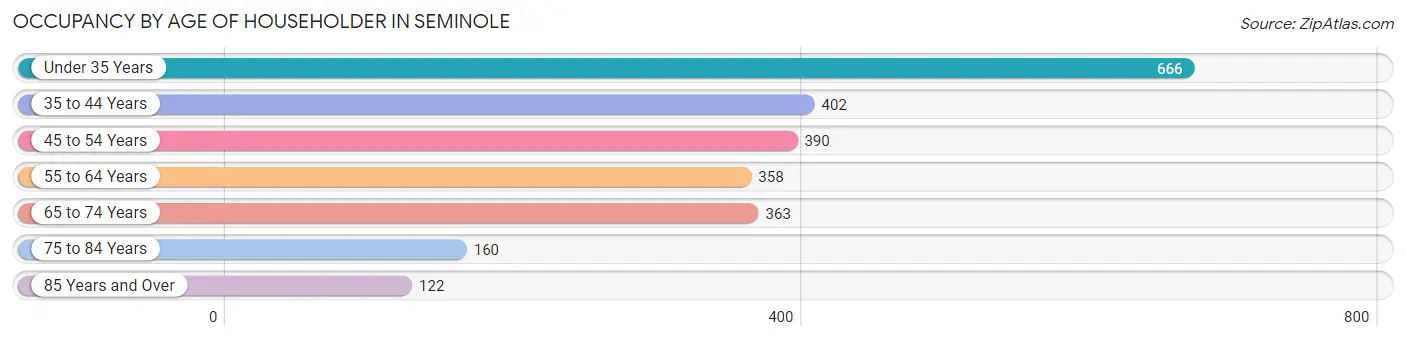
| Age Bracket | # Households | % Households |
| Under 35 Years | 666 | 27.1% |
| 35 to 44 Years | 402 | 16.3% |
| 45 to 54 Years | 390 | 15.9% |
| 55 to 64 Years | 358 | 14.5% |
| 65 to 74 Years | 363 | 14.7% |
| 75 to 84 Years | 160 | 6.5% |
| 85 Years and Over | 122 | 5.0% |
| Total | 2,461 | 100.0% |
Housing Finances in Seminole
Median Income by Occupancy in Seminole
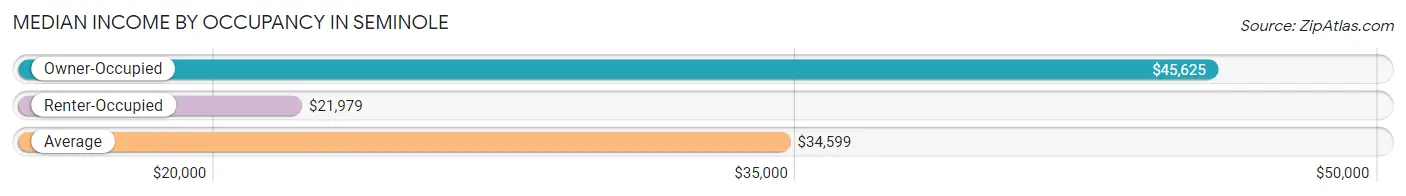
| Occupancy Type | # Households | Median Income |
| Owner-Occupied | 1,326 (53.9%) | $45,625 |
| Renter-Occupied | 1,135 (46.1%) | $21,979 |
| Average | 2,461 (100.0%) | $34,599 |
Occupancy by Householder Income Bracket in Seminole
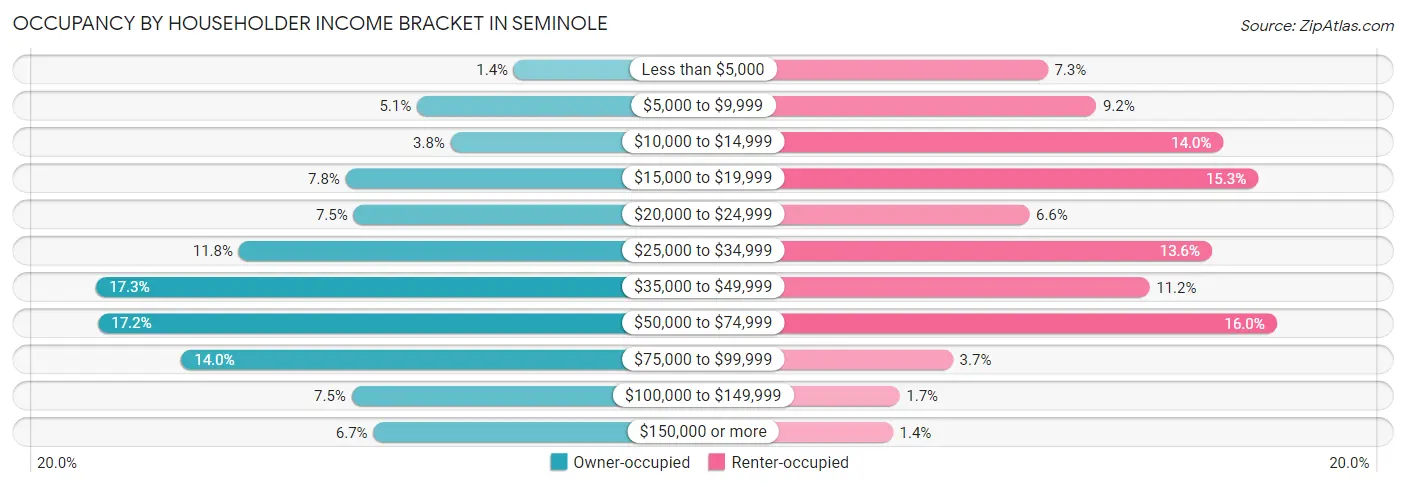
| Income Bracket | Owner-occupied | Renter-occupied |
| Less than $5,000 | 18 (1.4%) | 83 (7.3%) |
| $5,000 to $9,999 | 67 (5.1%) | 104 (9.2%) |
| $10,000 to $14,999 | 50 (3.8%) | 159 (14.0%) |
| $15,000 to $19,999 | 103 (7.8%) | 174 (15.3%) |
| $20,000 to $24,999 | 99 (7.5%) | 75 (6.6%) |
| $25,000 to $34,999 | 157 (11.8%) | 154 (13.6%) |
| $35,000 to $49,999 | 229 (17.3%) | 127 (11.2%) |
| $50,000 to $74,999 | 228 (17.2%) | 182 (16.0%) |
| $75,000 to $99,999 | 186 (14.0%) | 42 (3.7%) |
| $100,000 to $149,999 | 100 (7.5%) | 19 (1.7%) |
| $150,000 or more | 89 (6.7%) | 16 (1.4%) |
| Total | 1,326 (100.0%) | 1,135 (100.0%) |
Monthly Housing Cost Tiers in Seminole
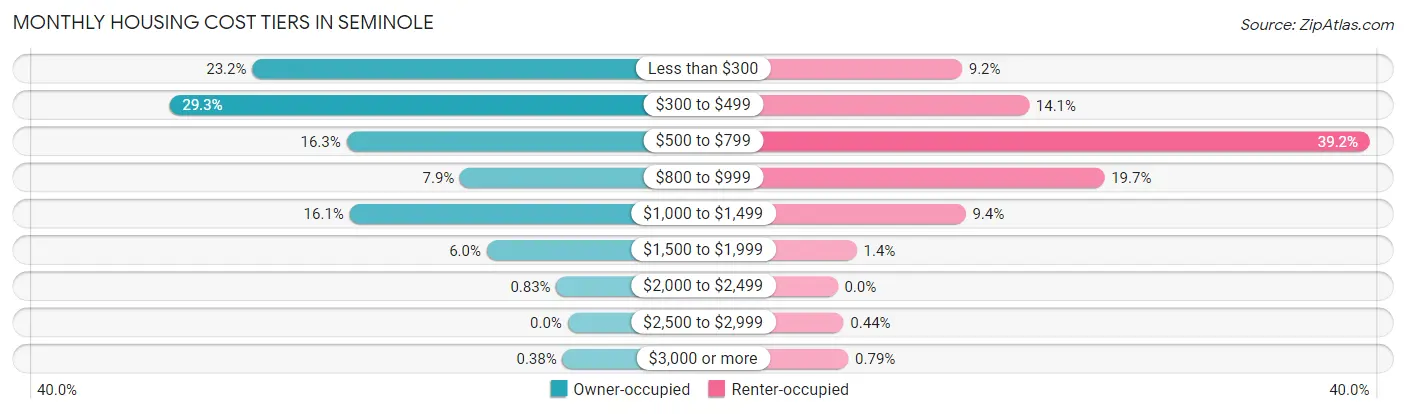
| Monthly Cost | Owner-occupied | Renter-occupied |
| Less than $300 | 308 (23.2%) | 104 (9.2%) |
| $300 to $499 | 389 (29.3%) | 160 (14.1%) |
| $500 to $799 | 216 (16.3%) | 445 (39.2%) |
| $800 to $999 | 105 (7.9%) | 223 (19.7%) |
| $1,000 to $1,499 | 213 (16.1%) | 107 (9.4%) |
| $1,500 to $1,999 | 79 (6.0%) | 16 (1.4%) |
| $2,000 to $2,499 | 11 (0.8%) | 0 (0.0%) |
| $2,500 to $2,999 | 0 (0.0%) | 5 (0.4%) |
| $3,000 or more | 5 (0.4%) | 9 (0.8%) |
| Total | 1,326 (100.0%) | 1,135 (100.0%) |
Physical Housing Characteristics in Seminole
Housing Structures in Seminole
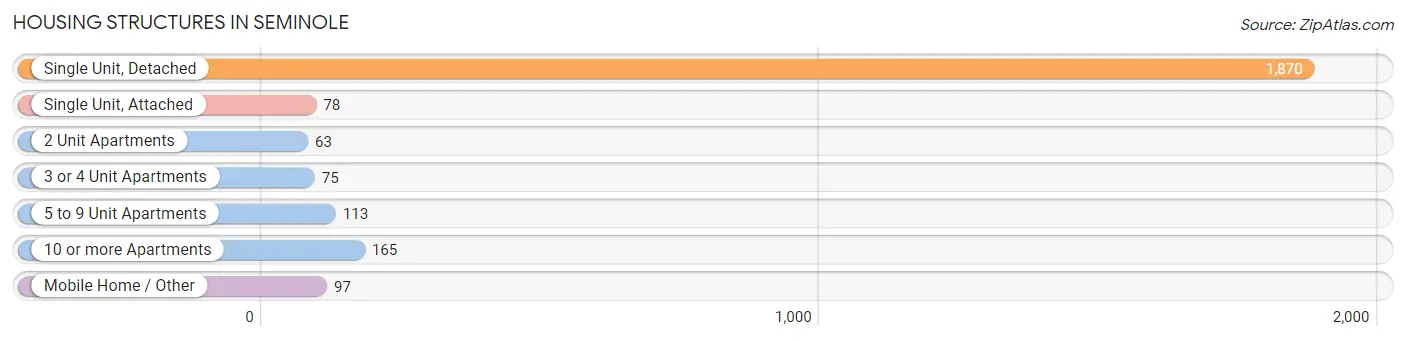
| Structure Type | # Housing Units | % Housing Units |
| Single Unit, Detached | 1,870 | 76.0% |
| Single Unit, Attached | 78 | 3.2% |
| 2 Unit Apartments | 63 | 2.6% |
| 3 or 4 Unit Apartments | 75 | 3.0% |
| 5 to 9 Unit Apartments | 113 | 4.6% |
| 10 or more Apartments | 165 | 6.7% |
| Mobile Home / Other | 97 | 3.9% |
| Total | 2,461 | 100.0% |
Housing Structures by Occupancy in Seminole
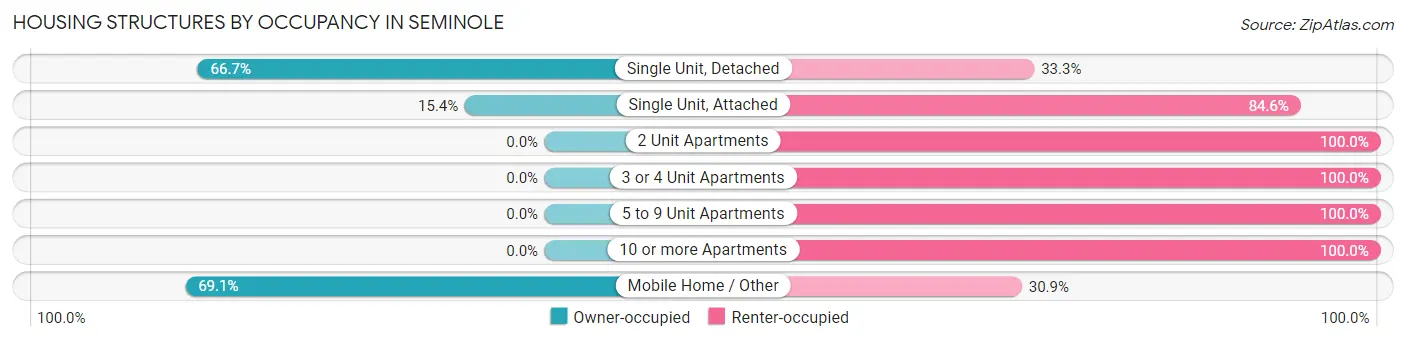
| Structure Type | Owner-occupied | Renter-occupied |
| Single Unit, Detached | 1,247 (66.7%) | 623 (33.3%) |
| Single Unit, Attached | 12 (15.4%) | 66 (84.6%) |
| 2 Unit Apartments | 0 (0.0%) | 63 (100.0%) |
| 3 or 4 Unit Apartments | 0 (0.0%) | 75 (100.0%) |
| 5 to 9 Unit Apartments | 0 (0.0%) | 113 (100.0%) |
| 10 or more Apartments | 0 (0.0%) | 165 (100.0%) |
| Mobile Home / Other | 67 (69.1%) | 30 (30.9%) |
| Total | 1,326 (53.9%) | 1,135 (46.1%) |
Housing Structures by Number of Rooms in Seminole
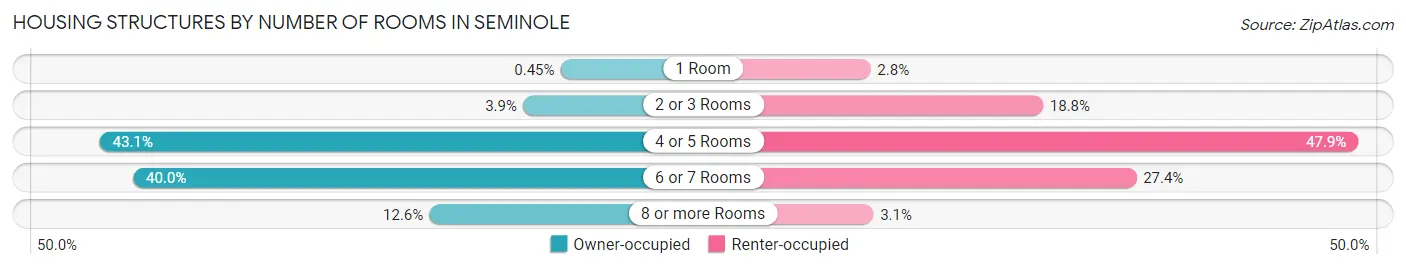
| Number of Rooms | Owner-occupied | Renter-occupied |
| 1 Room | 6 (0.4%) | 32 (2.8%) |
| 2 or 3 Rooms | 52 (3.9%) | 213 (18.8%) |
| 4 or 5 Rooms | 571 (43.1%) | 544 (47.9%) |
| 6 or 7 Rooms | 530 (40.0%) | 311 (27.4%) |
| 8 or more Rooms | 167 (12.6%) | 35 (3.1%) |
| Total | 1,326 (100.0%) | 1,135 (100.0%) |
Housing Structure by Heating Type in Seminole
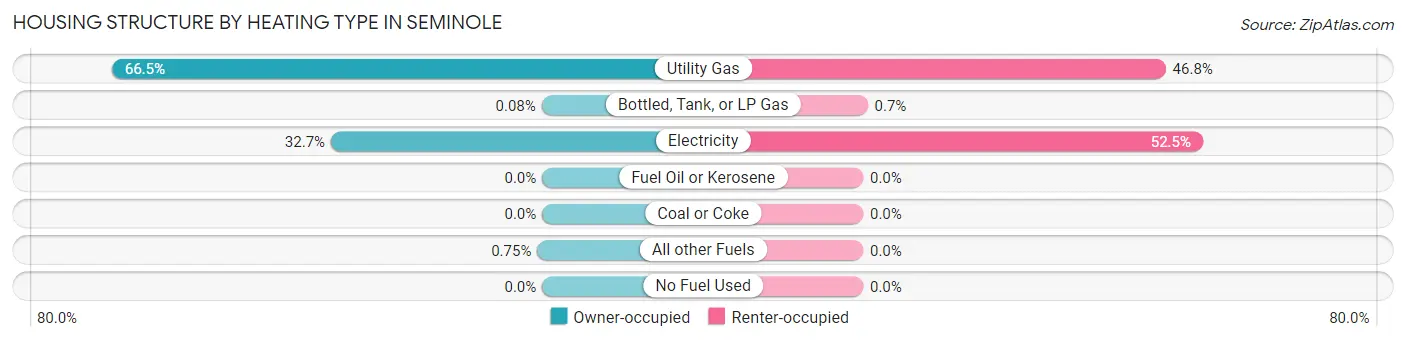
| Heating Type | Owner-occupied | Renter-occupied |
| Utility Gas | 882 (66.5%) | 531 (46.8%) |
| Bottled, Tank, or LP Gas | 1 (0.1%) | 8 (0.7%) |
| Electricity | 433 (32.7%) | 596 (52.5%) |
| Fuel Oil or Kerosene | 0 (0.0%) | 0 (0.0%) |
| Coal or Coke | 0 (0.0%) | 0 (0.0%) |
| All other Fuels | 10 (0.7%) | 0 (0.0%) |
| No Fuel Used | 0 (0.0%) | 0 (0.0%) |
| Total | 1,326 (100.0%) | 1,135 (100.0%) |
Household Vehicle Usage in Seminole
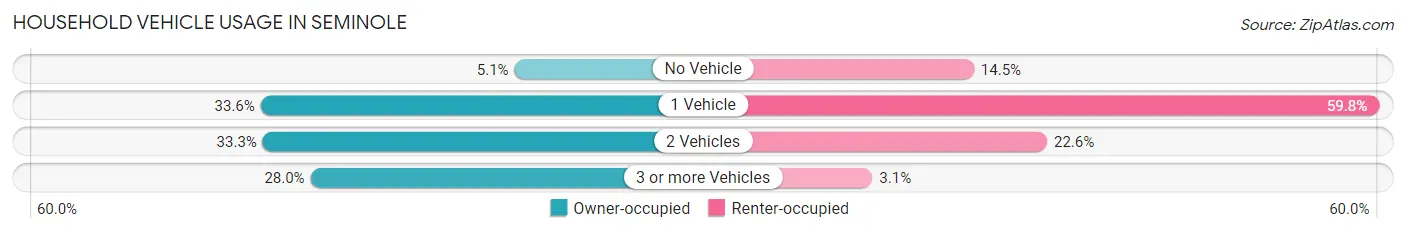
| Vehicles per Household | Owner-occupied | Renter-occupied |
| No Vehicle | 68 (5.1%) | 164 (14.4%) |
| 1 Vehicle | 445 (33.6%) | 679 (59.8%) |
| 2 Vehicles | 442 (33.3%) | 257 (22.6%) |
| 3 or more Vehicles | 371 (28.0%) | 35 (3.1%) |
| Total | 1,326 (100.0%) | 1,135 (100.0%) |
Real Estate & Mortgages in Seminole
Real Estate and Mortgage Overview in Seminole
| Characteristic | Without Mortgage | With Mortgage |
| Housing Units | 765 | 561 |
| Median Property Value | $43,200 | $107,400 |
| Median Household Income | $36,597 | $62 |
| Monthly Housing Costs | $329 | $5 |
| Real Estate Taxes | $300 | $25 |
Property Value by Mortgage Status in Seminole
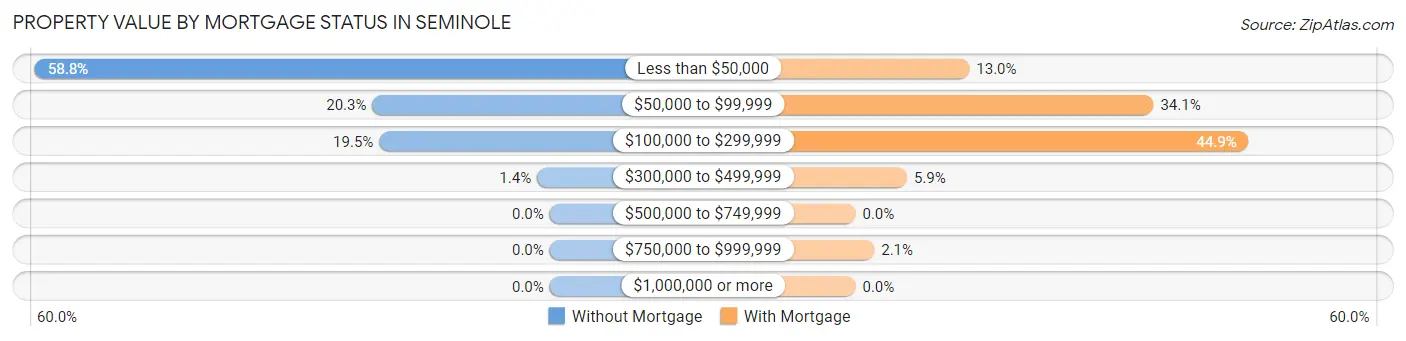
| Property Value | Without Mortgage | With Mortgage |
| Less than $50,000 | 450 (58.8%) | 73 (13.0%) |
| $50,000 to $99,999 | 155 (20.3%) | 191 (34.1%) |
| $100,000 to $299,999 | 149 (19.5%) | 252 (44.9%) |
| $300,000 to $499,999 | 11 (1.4%) | 33 (5.9%) |
| $500,000 to $749,999 | 0 (0.0%) | 0 (0.0%) |
| $750,000 to $999,999 | 0 (0.0%) | 12 (2.1%) |
| $1,000,000 or more | 0 (0.0%) | 0 (0.0%) |
| Total | 765 (100.0%) | 561 (100.0%) |
Household Income by Mortgage Status in Seminole
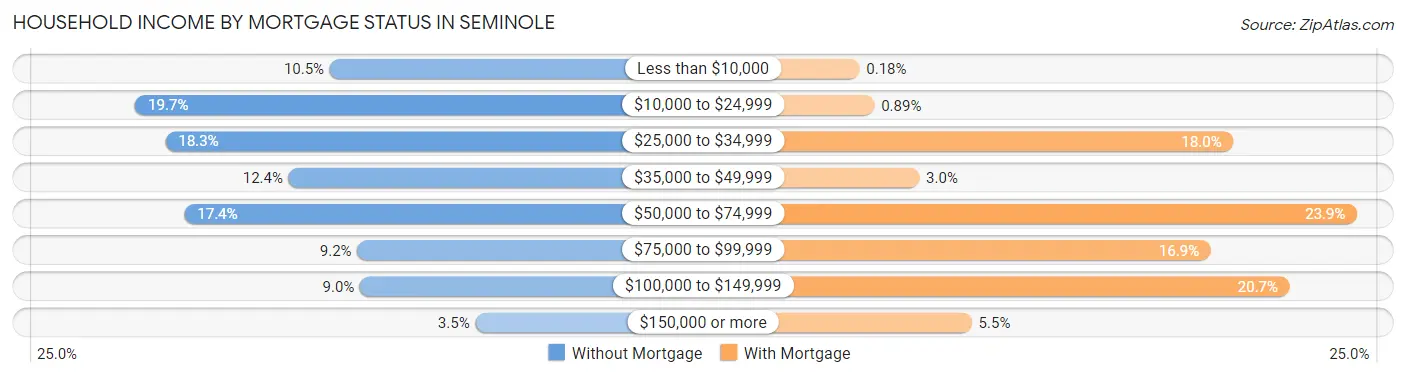
| Household Income | Without Mortgage | With Mortgage |
| Less than $10,000 | 80 (10.5%) | 1 (0.2%) |
| $10,000 to $24,999 | 151 (19.7%) | 5 (0.9%) |
| $25,000 to $34,999 | 140 (18.3%) | 101 (18.0%) |
| $35,000 to $49,999 | 95 (12.4%) | 17 (3.0%) |
| $50,000 to $74,999 | 133 (17.4%) | 134 (23.9%) |
| $75,000 to $99,999 | 70 (9.1%) | 95 (16.9%) |
| $100,000 to $149,999 | 69 (9.0%) | 116 (20.7%) |
| $150,000 or more | 27 (3.5%) | 31 (5.5%) |
| Total | 765 (100.0%) | 561 (100.0%) |
Property Value to Household Income Ratio in Seminole
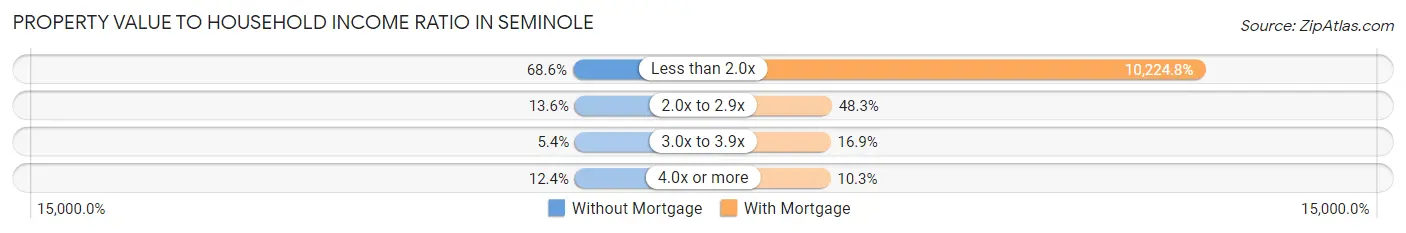
| Value-to-Income Ratio | Without Mortgage | With Mortgage |
| Less than 2.0x | 525 (68.6%) | 57,361 (10,224.8%) |
| 2.0x to 2.9x | 104 (13.6%) | 271 (48.3%) |
| 3.0x to 3.9x | 41 (5.4%) | 95 (16.9%) |
| 4.0x or more | 95 (12.4%) | 58 (10.3%) |
| Total | 765 (100.0%) | 561 (100.0%) |
Real Estate Taxes by Mortgage Status in Seminole
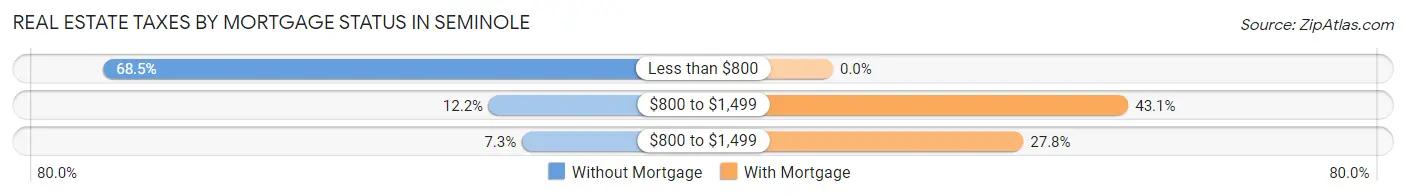
| Property Taxes | Without Mortgage | With Mortgage |
| Less than $800 | 524 (68.5%) | 0 (0.0%) |
| $800 to $1,499 | 93 (12.2%) | 242 (43.1%) |
| $800 to $1,499 | 56 (7.3%) | 156 (27.8%) |
| Total | 765 (100.0%) | 561 (100.0%) |
Health & Disability in Seminole
Health Insurance Coverage by Age in Seminole
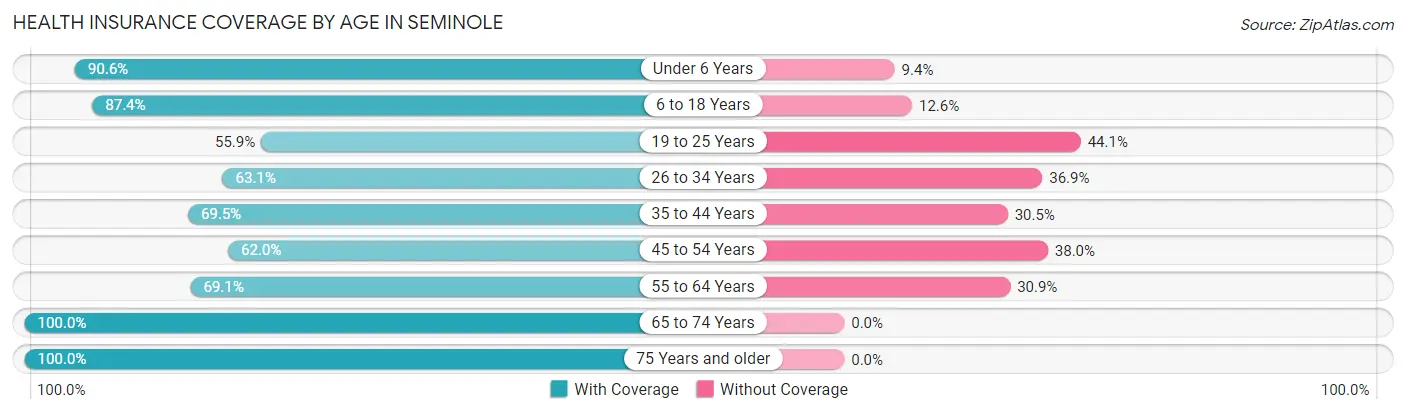
| Age Bracket | With Coverage | Without Coverage |
| Under 6 Years | 569 (90.6%) | 59 (9.4%) |
| 6 to 18 Years | 1,168 (87.4%) | 169 (12.6%) |
| 19 to 25 Years | 487 (55.9%) | 384 (44.1%) |
| 26 to 34 Years | 625 (63.1%) | 366 (36.9%) |
| 35 to 44 Years | 486 (69.5%) | 213 (30.5%) |
| 45 to 54 Years | 518 (62.0%) | 317 (38.0%) |
| 55 to 64 Years | 500 (69.1%) | 224 (30.9%) |
| 65 to 74 Years | 443 (100.0%) | 0 (0.0%) |
| 75 Years and older | 468 (100.0%) | 0 (0.0%) |
| Total | 5,264 (75.2%) | 1,732 (24.8%) |
Health Insurance Coverage by Citizenship Status in Seminole
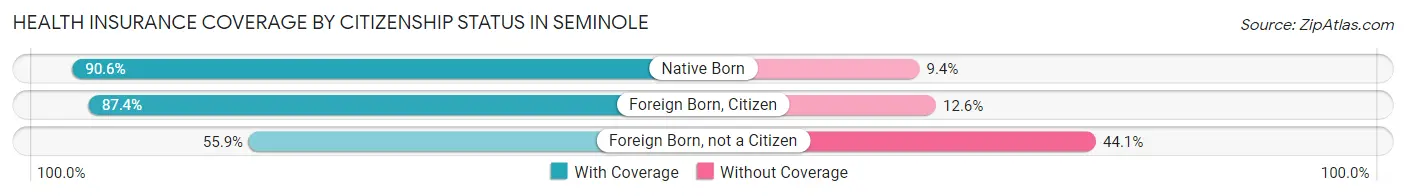
| Citizenship Status | With Coverage | Without Coverage |
| Native Born | 569 (90.6%) | 59 (9.4%) |
| Foreign Born, Citizen | 1,168 (87.4%) | 169 (12.6%) |
| Foreign Born, not a Citizen | 487 (55.9%) | 384 (44.1%) |
Health Insurance Coverage by Household Income in Seminole
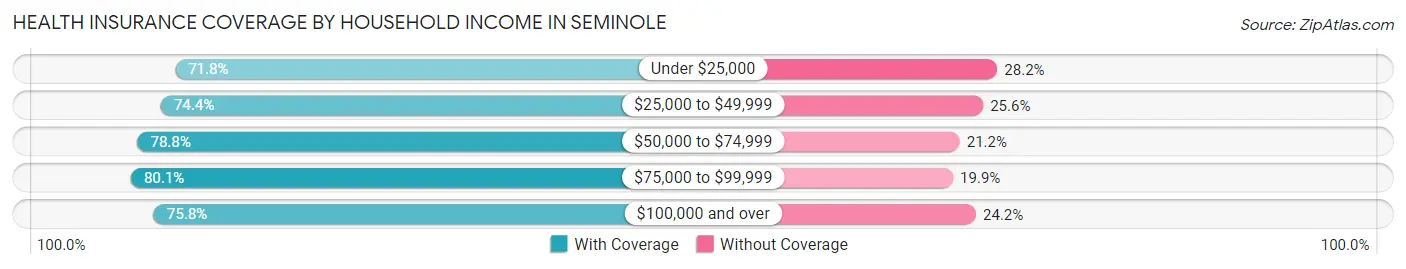
| Household Income | With Coverage | Without Coverage |
| Under $25,000 | 1,460 (71.8%) | 574 (28.2%) |
| $25,000 to $49,999 | 1,366 (74.4%) | 469 (25.6%) |
| $50,000 to $74,999 | 946 (78.8%) | 254 (21.2%) |
| $75,000 to $99,999 | 723 (80.1%) | 180 (19.9%) |
| $100,000 and over | 588 (75.8%) | 188 (24.2%) |
Public vs Private Health Insurance Coverage by Age in Seminole
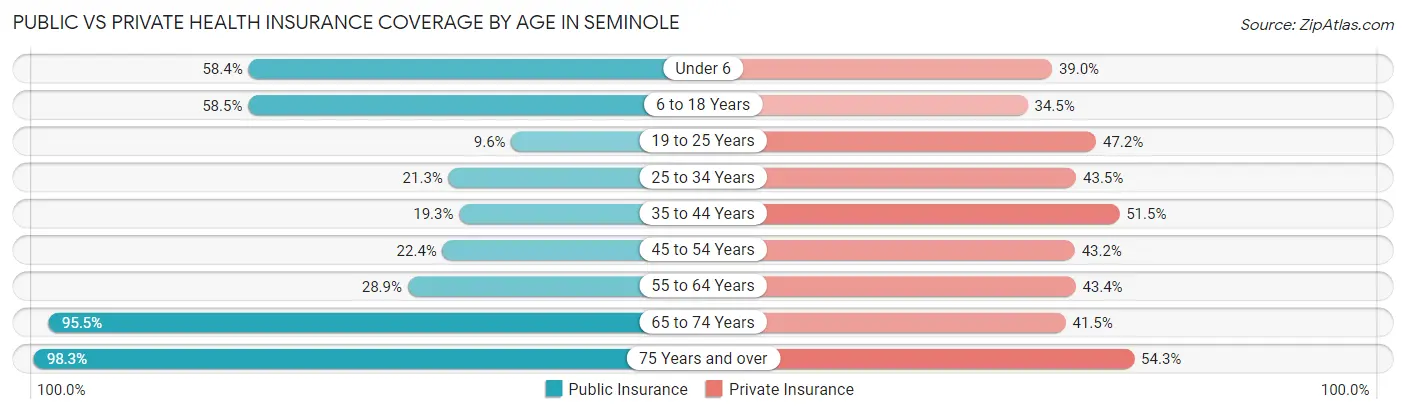
| Age Bracket | Public Insurance | Private Insurance |
| Under 6 | 367 (58.4%) | 245 (39.0%) |
| 6 to 18 Years | 782 (58.5%) | 461 (34.5%) |
| 19 to 25 Years | 84 (9.6%) | 411 (47.2%) |
| 25 to 34 Years | 211 (21.3%) | 431 (43.5%) |
| 35 to 44 Years | 135 (19.3%) | 360 (51.5%) |
| 45 to 54 Years | 187 (22.4%) | 361 (43.2%) |
| 55 to 64 Years | 209 (28.9%) | 314 (43.4%) |
| 65 to 74 Years | 423 (95.5%) | 184 (41.5%) |
| 75 Years and over | 460 (98.3%) | 254 (54.3%) |
| Total | 2,858 (40.8%) | 3,021 (43.2%) |
Disability Status by Sex by Age in Seminole
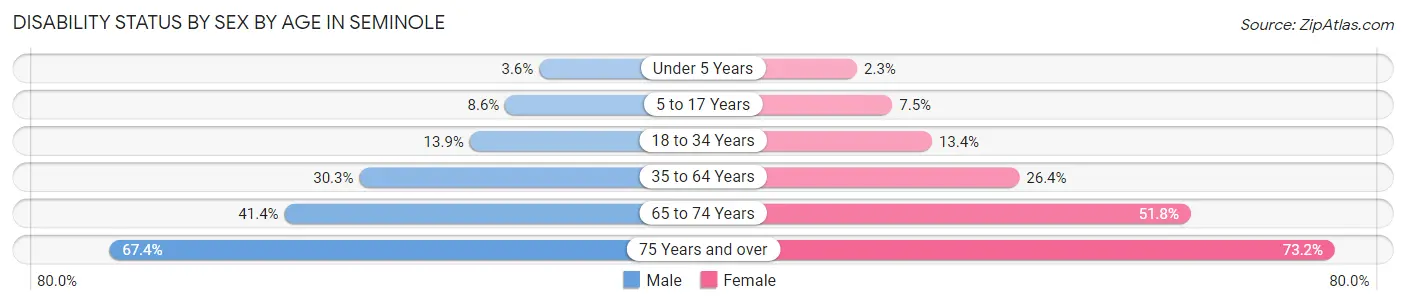
| Age Bracket | Male | Female |
| Under 5 Years | 8 (3.6%) | 7 (2.3%) |
| 5 to 17 Years | 49 (8.6%) | 53 (7.5%) |
| 18 to 34 Years | 138 (13.9%) | 138 (13.4%) |
| 35 to 64 Years | 320 (30.3%) | 317 (26.4%) |
| 65 to 74 Years | 70 (41.4%) | 142 (51.8%) |
| 75 Years and over | 89 (67.4%) | 246 (73.2%) |
Disability Class by Sex by Age in Seminole
Disability Class: Hearing Difficulty
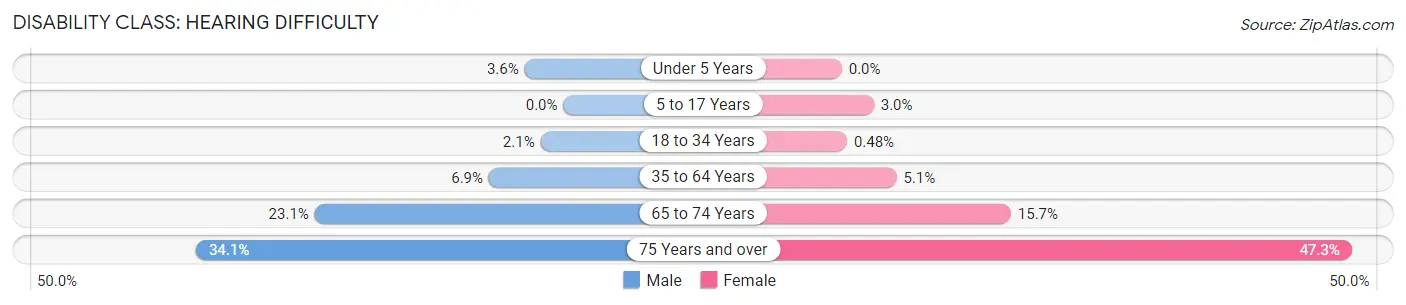
| Age Bracket | Male | Female |
| Under 5 Years | 8 (3.6%) | 0 (0.0%) |
| 5 to 17 Years | 0 (0.0%) | 21 (3.0%) |
| 18 to 34 Years | 21 (2.1%) | 5 (0.5%) |
| 35 to 64 Years | 73 (6.9%) | 61 (5.1%) |
| 65 to 74 Years | 39 (23.1%) | 43 (15.7%) |
| 75 Years and over | 45 (34.1%) | 159 (47.3%) |
Disability Class: Vision Difficulty
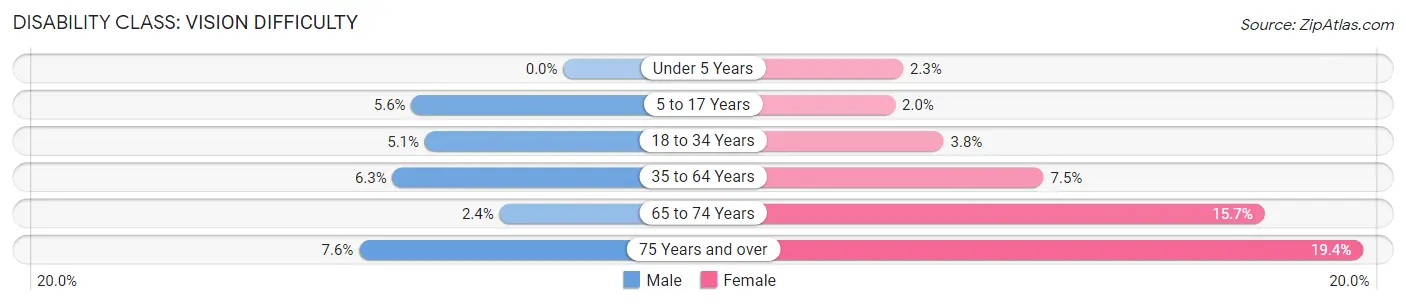
| Age Bracket | Male | Female |
| Under 5 Years | 0 (0.0%) | 7 (2.3%) |
| 5 to 17 Years | 32 (5.6%) | 14 (2.0%) |
| 18 to 34 Years | 51 (5.1%) | 39 (3.8%) |
| 35 to 64 Years | 67 (6.3%) | 90 (7.5%) |
| 65 to 74 Years | 4 (2.4%) | 43 (15.7%) |
| 75 Years and over | 10 (7.6%) | 65 (19.4%) |
Disability Class: Cognitive Difficulty
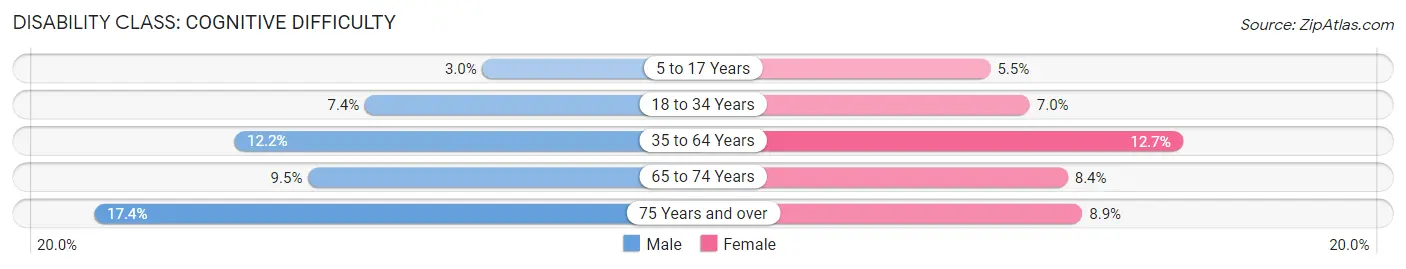
| Age Bracket | Male | Female |
| 5 to 17 Years | 17 (3.0%) | 39 (5.5%) |
| 18 to 34 Years | 73 (7.4%) | 72 (7.0%) |
| 35 to 64 Years | 129 (12.2%) | 152 (12.7%) |
| 65 to 74 Years | 16 (9.5%) | 23 (8.4%) |
| 75 Years and over | 23 (17.4%) | 30 (8.9%) |
Disability Class: Ambulatory Difficulty
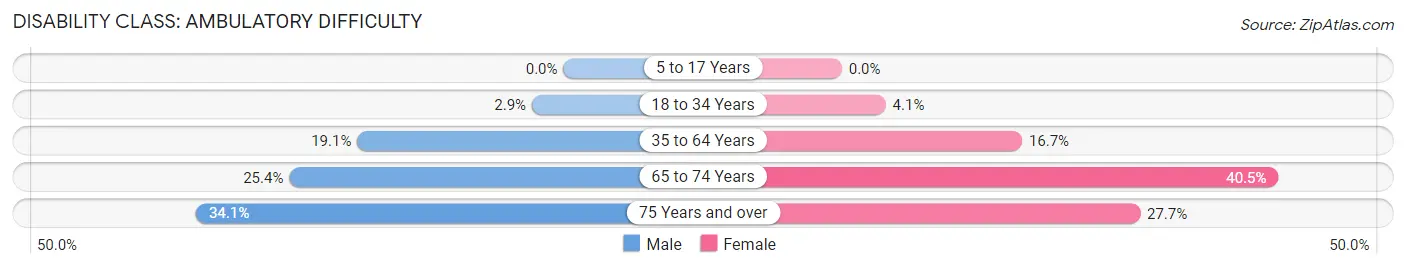
| Age Bracket | Male | Female |
| 5 to 17 Years | 0 (0.0%) | 0 (0.0%) |
| 18 to 34 Years | 29 (2.9%) | 42 (4.1%) |
| 35 to 64 Years | 202 (19.1%) | 201 (16.7%) |
| 65 to 74 Years | 43 (25.4%) | 111 (40.5%) |
| 75 Years and over | 45 (34.1%) | 93 (27.7%) |
Disability Class: Self-Care Difficulty
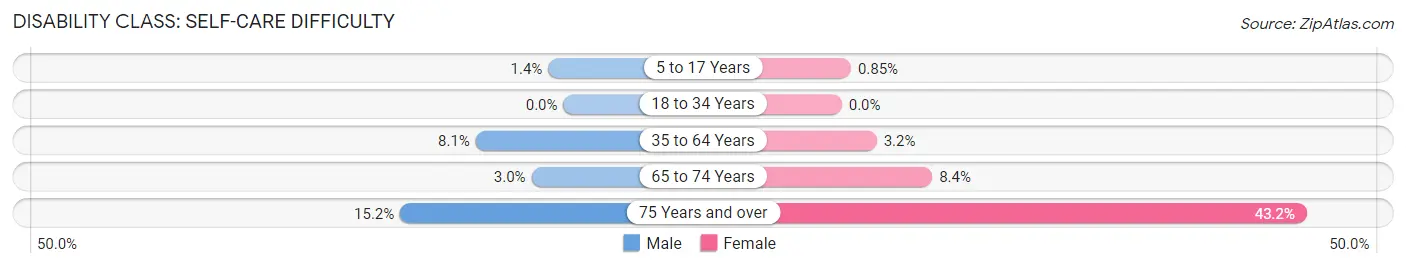
| Age Bracket | Male | Female |
| 5 to 17 Years | 8 (1.4%) | 6 (0.9%) |
| 18 to 34 Years | 0 (0.0%) | 0 (0.0%) |
| 35 to 64 Years | 86 (8.1%) | 39 (3.2%) |
| 65 to 74 Years | 5 (3.0%) | 23 (8.4%) |
| 75 Years and over | 20 (15.1%) | 145 (43.1%) |
Technology Access in Seminole
Computing Device Access in Seminole
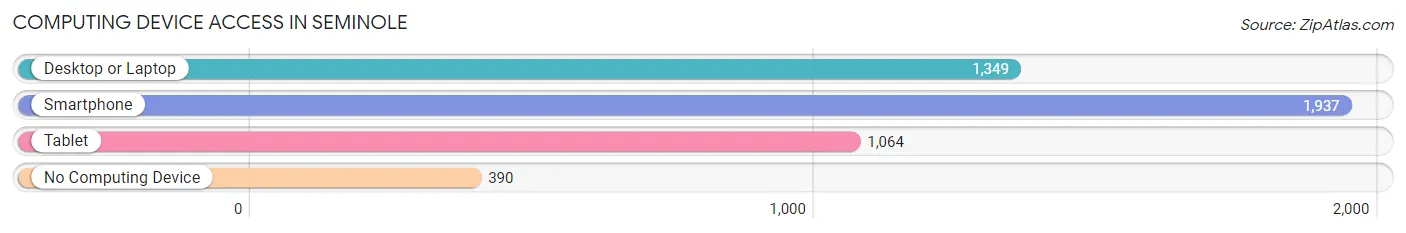
| Device Type | # Households | % Households |
| Desktop or Laptop | 1,349 | 54.8% |
| Smartphone | 1,937 | 78.7% |
| Tablet | 1,064 | 43.2% |
| No Computing Device | 390 | 15.9% |
| Total | 2,461 | 100.0% |
Internet Access in Seminole
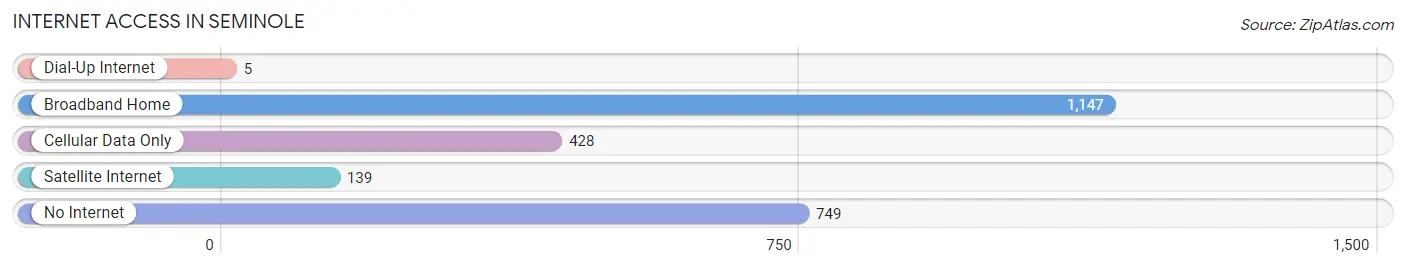
| Internet Type | # Households | % Households |
| Dial-Up Internet | 5 | 0.2% |
| Broadband Home | 1,147 | 46.6% |
| Cellular Data Only | 428 | 17.4% |
| Satellite Internet | 139 | 5.7% |
| No Internet | 749 | 30.4% |
| Total | 2,461 | 100.0% |
Seminole Summary
Seminole, Oklahoma is a city located in Seminole County, Oklahoma. It is the county seat of Seminole County and is located in the southeastern part of the state. The city is situated on the banks of the North Canadian River and is home to a population of approximately 8,000 people.
Geography
Seminole is located in the southeastern part of Oklahoma, approximately 80 miles east of Oklahoma City. The city is situated on the banks of the North Canadian River and is surrounded by a number of small towns and rural communities. The city is located in a region of rolling hills and is home to a variety of wildlife, including deer, wild turkeys, and quail. The city is also home to a number of lakes, including Lake Seminole, which is located just outside of the city limits.
History
Seminole was founded in 1891 and was named after the Seminole Nation of Native Americans who had previously inhabited the area. The city was originally a trading post for the Seminole Nation and was later incorporated in 1901. The city grew rapidly in the early 20th century and was home to a number of businesses, including a cotton gin, a flour mill, and a lumber mill.
The city was also home to a number of oil and gas wells, which helped to fuel the city’s growth. In the 1950s, the city was home to a number of manufacturing plants, including a shoe factory and a furniture factory. The city also became a popular tourist destination, with a number of hotels and motels being built in the area.
Economy
Seminole’s economy is largely based on agriculture and oil and gas production. The city is home to a number of agricultural businesses, including a number of farms and ranches. The city is also home to a number of oil and gas wells, which provide a significant portion of the city’s income.
The city is also home to a number of manufacturing businesses, including a furniture factory and a shoe factory. The city is also home to a number of retail businesses, including a number of restaurants, grocery stores, and other retail outlets.
Demographics
As of the 2010 census, the population of Seminole was 8,000. The city is predominantly white, with approximately 75% of the population being white. The city is also home to a number of Native American tribes, including the Seminole Nation, the Choctaw Nation, and the Creek Nation. The city is also home to a number of Hispanic and Latino residents, with approximately 10% of the population being Hispanic or Latino.
Conclusion
Seminole, Oklahoma is a city located in Seminole County, Oklahoma. It is the county seat of Seminole County and is located in the southeastern part of the state. The city is situated on the banks of the North Canadian River and is home to a population of approximately 8,000 people. The city’s economy is largely based on agriculture and oil and gas production, and the city is also home to a number of manufacturing businesses and retail outlets. The city is predominantly white, with a number of Native American tribes and Hispanic and Latino residents also living in the city.
Common Questions
What is Per Capita Income in Seminole?
Per Capita income in Seminole is $19,919.
What is the Median Family Income in Seminole?
Median Family Income in Seminole is $41,314.
What is the Median Household income in Seminole?
Median Household Income in Seminole is $34,599.
What is Income or Wage Gap in Seminole?
Income or Wage Gap in Seminole is 32.6%.
Women in Seminole earn 67.4 cents for every dollar earned by a man.
What is Family Income Deficit in Seminole?
Family Income Deficit in Seminole is $11,822.
Families that are below poverty line in Seminole earn $11,822 less on average than the poverty threshold level.
What is Inequality or Gini Index in Seminole?
Inequality or Gini Index in Seminole is 0.49.
What is the Total Population of Seminole?
Total Population of Seminole is 7,144.
What is the Total Male Population of Seminole?
Total Male Population of Seminole is 3,159.
What is the Total Female Population of Seminole?
Total Female Population of Seminole is 3,985.
What is the Ratio of Males per 100 Females in Seminole?
There are 79.27 Males per 100 Females in Seminole.
What is the Ratio of Females per 100 Males in Seminole?
There are 126.15 Females per 100 Males in Seminole.
What is the Median Population Age in Seminole?
Median Population Age in Seminole is 32.6 Years.
What is the Average Family Size in Seminole
Average Family Size in Seminole is 3.4 People.
What is the Average Household Size in Seminole
Average Household Size in Seminole is 2.7 People.
How Large is the Labor Force in Seminole?
There are 2,931 People in the Labor Forcein in Seminole.
What is the Percentage of People in the Labor Force in Seminole?
53.5% of People are in the Labor Force in Seminole.
What is the Unemployment Rate in Seminole?
Unemployment Rate in Seminole is 7.1%.