Schulter, OK Map & Demographics
Schulter Map
Schulter Overview
$27,594
PER CAPITA INCOME
$85,107
AVG FAMILY INCOME
$71,429
AVG HOUSEHOLD INCOME
41.7%
WAGE / INCOME GAP [ % ]
58.3¢/ $1
WAGE / INCOME GAP [ $ ]
0.30
INEQUALITY / GINI INDEX
510
TOTAL POPULATION
213
MALE POPULATION
297
FEMALE POPULATION
71.72
MALES / 100 FEMALES
139.44
FEMALES / 100 MALES
47.8
MEDIAN AGE
2.4
AVG FAMILY SIZE
2.2
AVG HOUSEHOLD SIZE
184
LABOR FORCE [ PEOPLE ]
44.1%
PERCENT IN LABOR FORCE
2.7%
UNEMPLOYMENT RATE
Schulter Zip Codes
Schulter Area Codes
Income in Schulter
Income Overview in Schulter
Per Capita Income in Schulter is $27,594, while median incomes of families and households are $85,107 and $71,429 respectively.
| Characteristic | Number | Measure |
| Per Capita Income | 510 | $27,594 |
| Median Family Income | 188 | $85,107 |
| Mean Family Income | 188 | $71,873 |
| Median Household Income | 236 | $71,429 |
| Mean Household Income | 236 | $65,908 |
| Income Deficit | 188 | $0 |
| Wage / Income Gap (%) | 510 | 41.73% |
| Wage / Income Gap ($) | 510 | 58.27¢ per $1 |
| Gini / Inequality Index | 510 | 0.30 |
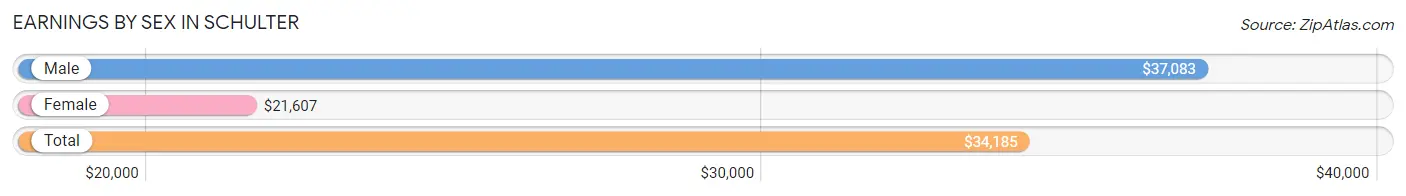
Earnings by Sex in Schulter
Average Earnings in Schulter are $34,185, $37,083 for men and $21,607 for women, a difference of 41.7%.
| Sex | Number | Average Earnings |
| Male | 114 (62.3%) | $37,083 |
| Female | 69 (37.7%) | $21,607 |
| Total | 183 (100.0%) | $34,185 |
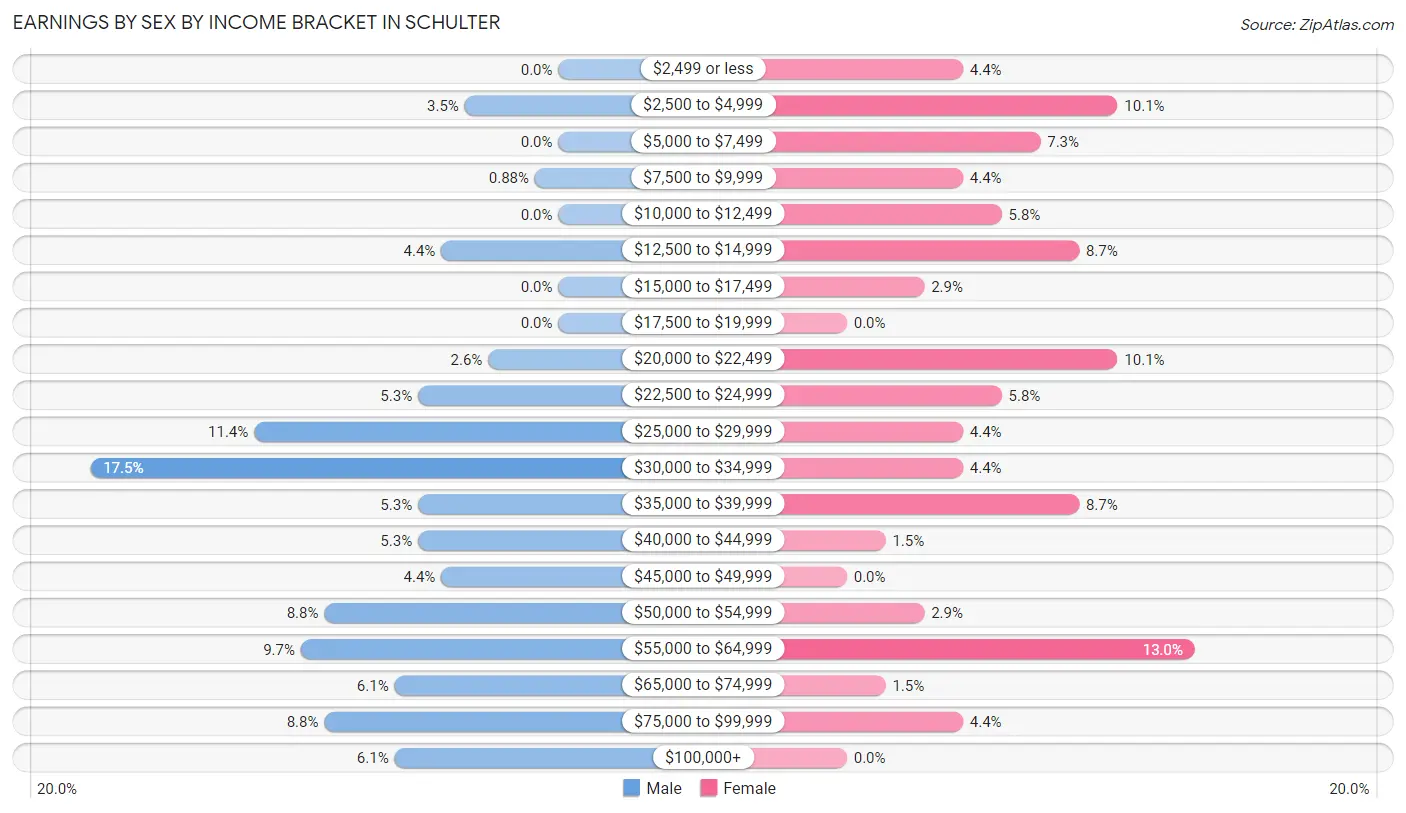
Earnings by Sex by Income Bracket in Schulter
The most common earnings brackets in Schulter are $30,000 to $34,999 for men (20 | 17.5%) and $55,000 to $64,999 for women (9 | 13.0%).
| Income | Male | Female |
| $2,499 or less | 0 (0.0%) | 3 (4.3%) |
| $2,500 to $4,999 | 4 (3.5%) | 7 (10.1%) |
| $5,000 to $7,499 | 0 (0.0%) | 5 (7.2%) |
| $7,500 to $9,999 | 1 (0.9%) | 3 (4.3%) |
| $10,000 to $12,499 | 0 (0.0%) | 4 (5.8%) |
| $12,500 to $14,999 | 5 (4.4%) | 6 (8.7%) |
| $15,000 to $17,499 | 0 (0.0%) | 2 (2.9%) |
| $17,500 to $19,999 | 0 (0.0%) | 0 (0.0%) |
| $20,000 to $22,499 | 3 (2.6%) | 7 (10.1%) |
| $22,500 to $24,999 | 6 (5.3%) | 4 (5.8%) |
| $25,000 to $29,999 | 13 (11.4%) | 3 (4.3%) |
| $30,000 to $34,999 | 20 (17.5%) | 3 (4.3%) |
| $35,000 to $39,999 | 6 (5.3%) | 6 (8.7%) |
| $40,000 to $44,999 | 6 (5.3%) | 1 (1.5%) |
| $45,000 to $49,999 | 5 (4.4%) | 0 (0.0%) |
| $50,000 to $54,999 | 10 (8.8%) | 2 (2.9%) |
| $55,000 to $64,999 | 11 (9.7%) | 9 (13.0%) |
| $65,000 to $74,999 | 7 (6.1%) | 1 (1.5%) |
| $75,000 to $99,999 | 10 (8.8%) | 3 (4.3%) |
| $100,000+ | 7 (6.1%) | 0 (0.0%) |
| Total | 114 (100.0%) | 69 (100.0%) |
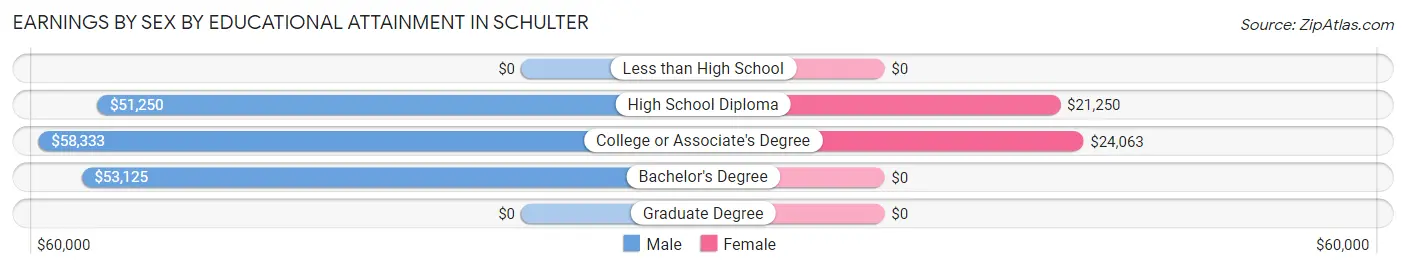
Earnings by Sex by Educational Attainment in Schulter
Average earnings in Schulter are $45,000 for men and $24,688 for women, a difference of 45.1%. Men with an educational attainment of college or associate's degree enjoy the highest average annual earnings of $58,333, while those with high school diploma education earn the least with $51,250. Women with an educational attainment of college or associate's degree earn the most with the average annual earnings of $24,063, while those with high school diploma education have the smallest earnings of $21,250.
| Educational Attainment | Male Income | Female Income |
| Less than High School | - | - |
| High School Diploma | $51,250 | $21,250 |
| College or Associate's Degree | $58,333 | $24,063 |
| Bachelor's Degree | $53,125 | $0 |
| Graduate Degree | - | - |
| Total | $45,000 | $24,688 |
Family Income in Schulter
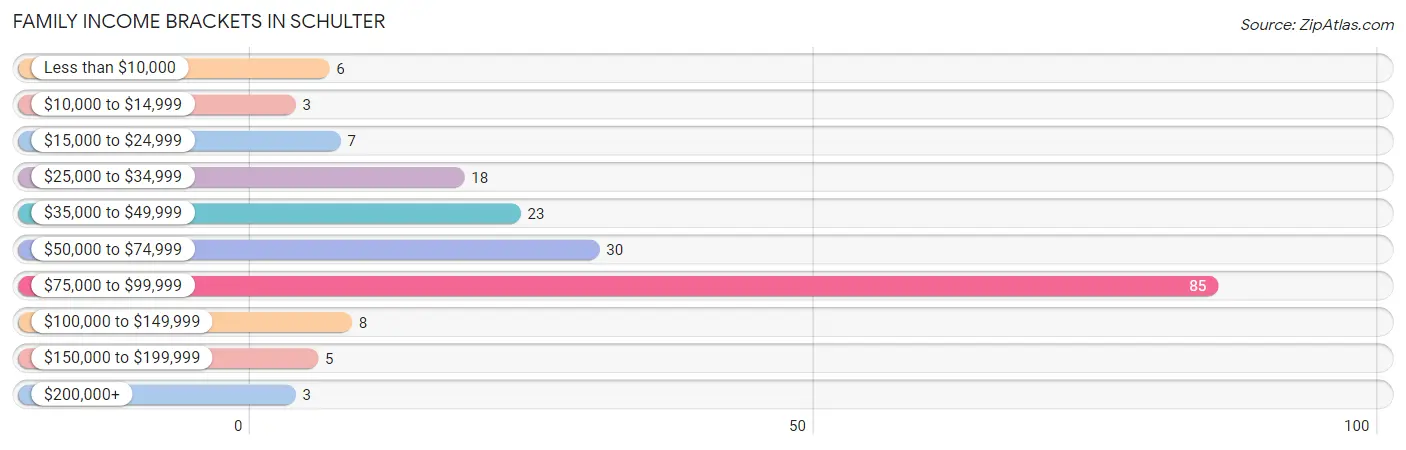
Family Income Brackets in Schulter
According to the Schulter family income data, there are 85 families falling into the $75,000 to $99,999 income range, which is the most common income bracket and makes up 45.2% of all families. Conversely, the $10,000 to $14,999 income bracket is the least frequent group with only 3 families (1.6%) belonging to this category.
| Income Bracket | # Families | % Families |
| Less than $10,000 | 6 | 3.2% |
| $10,000 to $14,999 | 3 | 1.6% |
| $15,000 to $24,999 | 7 | 3.7% |
| $25,000 to $34,999 | 18 | 9.6% |
| $35,000 to $49,999 | 23 | 12.2% |
| $50,000 to $74,999 | 30 | 16.0% |
| $75,000 to $99,999 | 85 | 45.2% |
| $100,000 to $149,999 | 8 | 4.3% |
| $150,000 to $199,999 | 5 | 2.7% |
| $200,000+ | 3 | 1.6% |
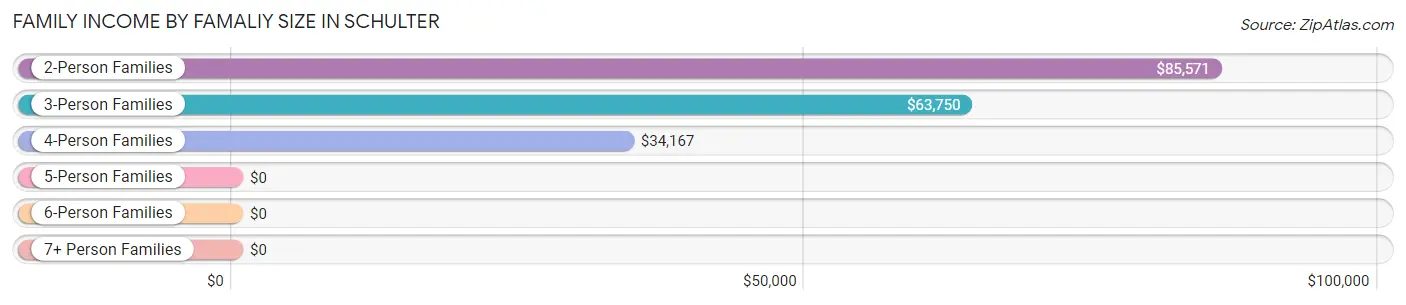
Family Income by Famaliy Size in Schulter
2-person families (118 | 62.8%) account for the highest median family income in Schulter with $85,571 per family, while 2-person families (118 | 62.8%) have the highest median income of $42,786 per family member.
| Income Bracket | # Families | Median Income |
| 2-Person Families | 118 (62.8%) | $85,571 |
| 3-Person Families | 29 (15.4%) | $63,750 |
| 4-Person Families | 24 (12.8%) | $34,167 |
| 5-Person Families | 11 (5.9%) | $0 |
| 6-Person Families | 6 (3.2%) | $0 |
| 7+ Person Families | 0 (0.0%) | $0 |
| Total | 188 (100.0%) | $85,107 |
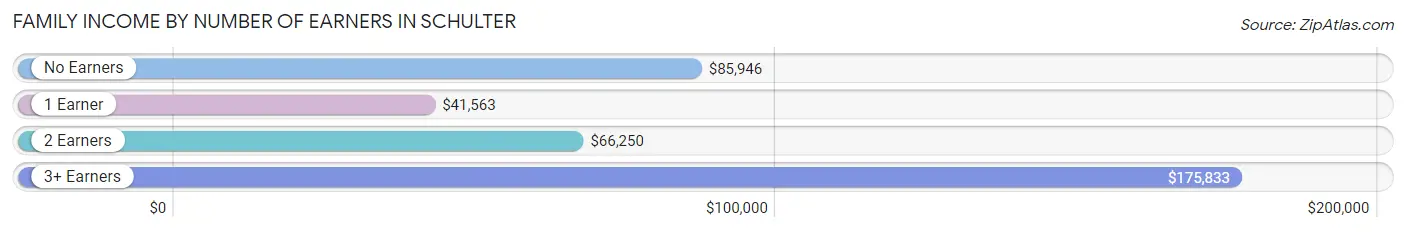
Family Income by Number of Earners in Schulter
The median family income in Schulter is $85,107, with families comprising 3+ earners (10) having the highest median family income of $175,833, while families with 1 earner (65) have the lowest median family income of $41,563, accounting for 5.3% and 34.6% of families, respectively.
| Number of Earners | # Families | Median Income |
| No Earners | 89 (47.3%) | $85,946 |
| 1 Earner | 65 (34.6%) | $41,563 |
| 2 Earners | 24 (12.8%) | $66,250 |
| 3+ Earners | 10 (5.3%) | $175,833 |
| Total | 188 (100.0%) | $85,107 |
Household Income in Schulter
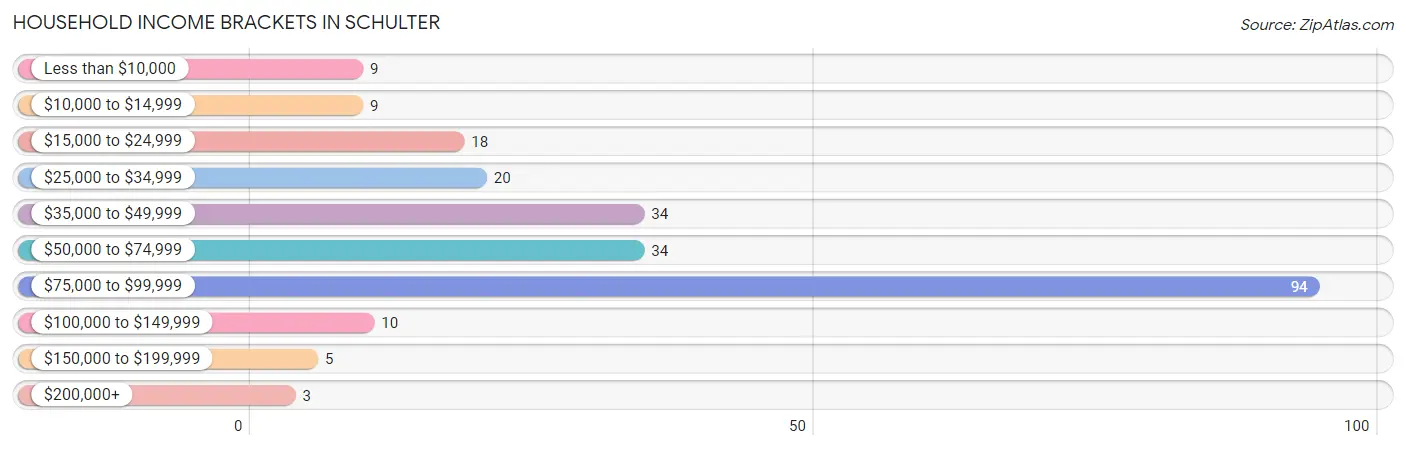
Household Income Brackets in Schulter
With 94 households falling in the category, the $75,000 to $99,999 income range is the most frequent in Schulter, accounting for 39.8% of all households. In contrast, only 3 households (1.3%) fall into the $200,000+ income bracket, making it the least populous group.
| Income Bracket | # Households | % Households |
| Less than $10,000 | 9 | 3.8% |
| $10,000 to $14,999 | 9 | 3.8% |
| $15,000 to $24,999 | 18 | 7.6% |
| $25,000 to $34,999 | 20 | 8.5% |
| $35,000 to $49,999 | 34 | 14.4% |
| $50,000 to $74,999 | 34 | 14.4% |
| $75,000 to $99,999 | 94 | 39.8% |
| $100,000 to $149,999 | 10 | 4.2% |
| $150,000 to $199,999 | 5 | 2.1% |
| $200,000+ | 3 | 1.3% |
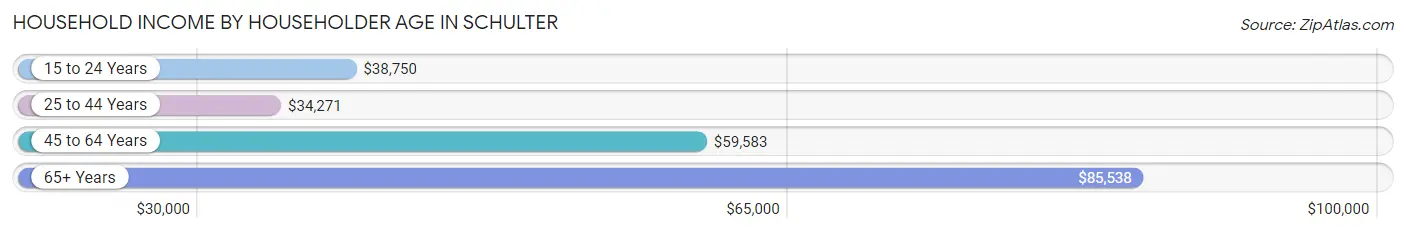
Household Income by Householder Age in Schulter
The median household income in Schulter is $71,429, with the highest median household income of $85,538 found in the 65+ years age bracket for the primary householder. A total of 127 households (53.8%) fall into this category. Meanwhile, the 25 to 44 years age bracket for the primary householder has the lowest median household income of $34,271, with 43 households (18.2%) in this group.
| Income Bracket | # Households | Median Income |
| 15 to 24 Years | 8 (3.4%) | $38,750 |
| 25 to 44 Years | 43 (18.2%) | $34,271 |
| 45 to 64 Years | 58 (24.6%) | $59,583 |
| 65+ Years | 127 (53.8%) | $85,538 |
| Total | 236 (100.0%) | $71,429 |
Poverty in Schulter
Income Below Poverty by Sex and Age in Schulter
With 13.6% poverty level for males and 11.8% for females among the residents of Schulter, 5 year old males and 15 year old females are the most vulnerable to poverty, with 3 males (100.0%) and 1 females (100.0%) in their respective age groups living below the poverty level.
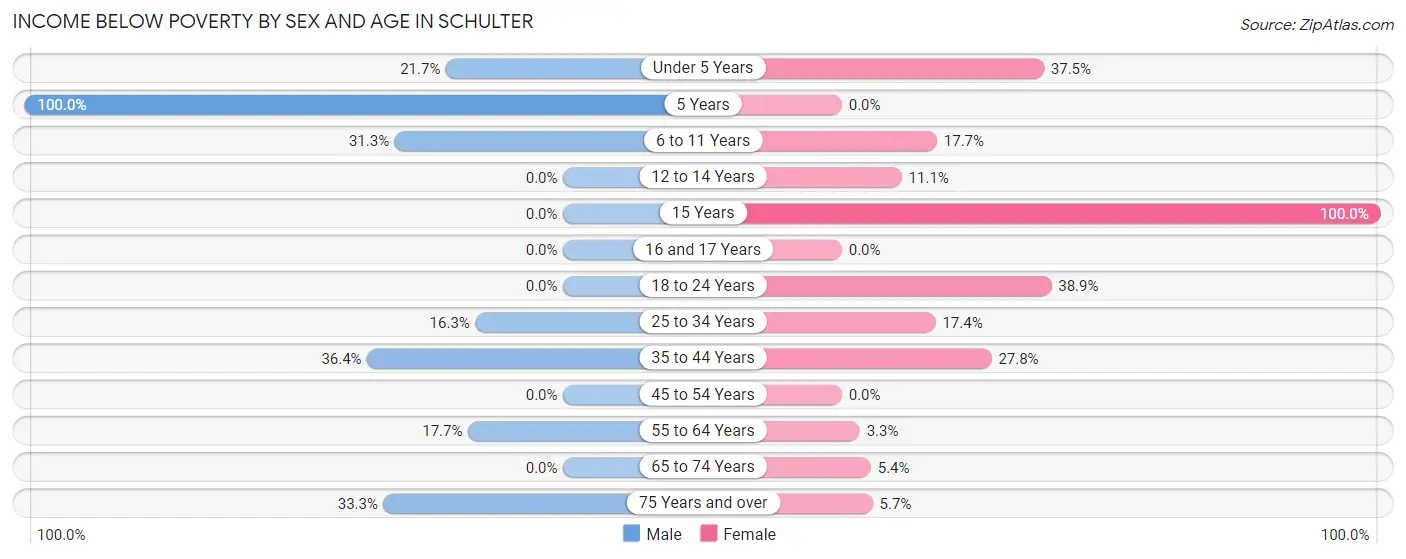
| Age Bracket | Male | Female |
| Under 5 Years | 5 (21.7%) | 6 (37.5%) |
| 5 Years | 3 (100.0%) | 0 (0.0%) |
| 6 to 11 Years | 5 (31.2%) | 3 (17.6%) |
| 12 to 14 Years | 0 (0.0%) | 1 (11.1%) |
| 15 Years | 0 (0.0%) | 1 (100.0%) |
| 16 and 17 Years | 0 (0.0%) | 0 (0.0%) |
| 18 to 24 Years | 0 (0.0%) | 7 (38.9%) |
| 25 to 34 Years | 7 (16.3%) | 4 (17.4%) |
| 35 to 44 Years | 4 (36.4%) | 5 (27.8%) |
| 45 to 54 Years | 0 (0.0%) | 0 (0.0%) |
| 55 to 64 Years | 3 (17.6%) | 1 (3.3%) |
| 65 to 74 Years | 0 (0.0%) | 5 (5.4%) |
| 75 Years and over | 2 (33.3%) | 2 (5.7%) |
| Total | 29 (13.6%) | 35 (11.8%) |
Income Above Poverty by Sex and Age in Schulter
According to the poverty statistics in Schulter, males aged 12 to 14 years and females aged 5 years are the age groups that are most secure financially, with 100.0% of males and 100.0% of females in these age groups living above the poverty line.
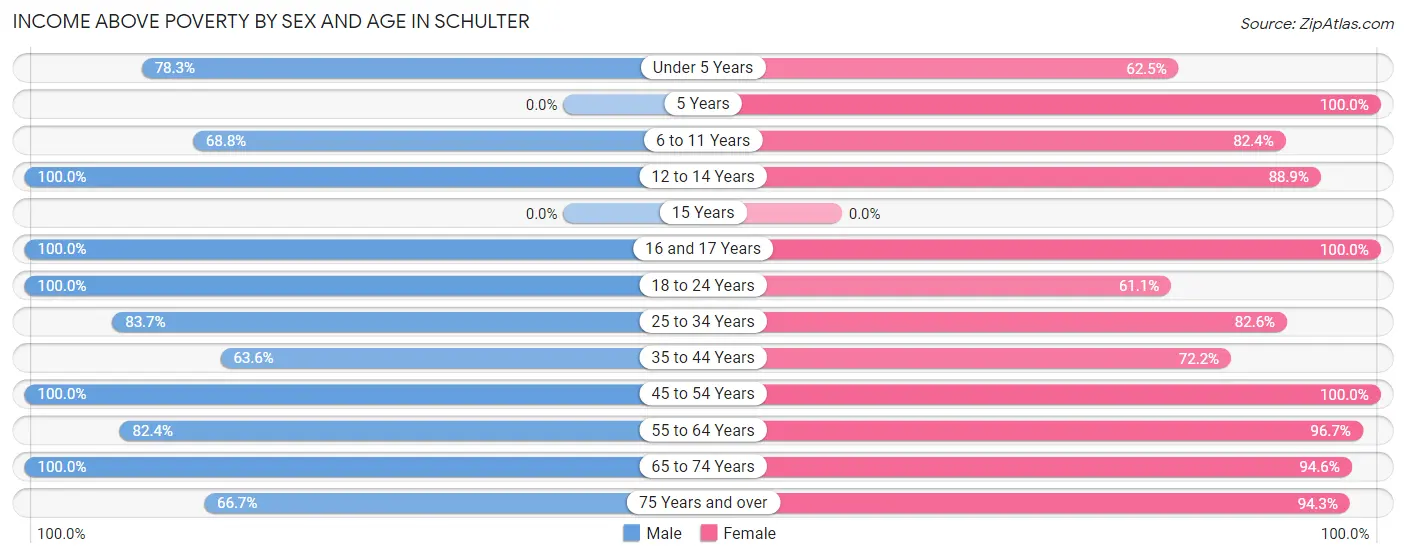
| Age Bracket | Male | Female |
| Under 5 Years | 18 (78.3%) | 10 (62.5%) |
| 5 Years | 0 (0.0%) | 3 (100.0%) |
| 6 to 11 Years | 11 (68.8%) | 14 (82.4%) |
| 12 to 14 Years | 5 (100.0%) | 8 (88.9%) |
| 15 Years | 0 (0.0%) | 0 (0.0%) |
| 16 and 17 Years | 8 (100.0%) | 9 (100.0%) |
| 18 to 24 Years | 13 (100.0%) | 11 (61.1%) |
| 25 to 34 Years | 36 (83.7%) | 19 (82.6%) |
| 35 to 44 Years | 7 (63.6%) | 13 (72.2%) |
| 45 to 54 Years | 40 (100.0%) | 25 (100.0%) |
| 55 to 64 Years | 14 (82.4%) | 29 (96.7%) |
| 65 to 74 Years | 28 (100.0%) | 88 (94.6%) |
| 75 Years and over | 4 (66.7%) | 33 (94.3%) |
| Total | 184 (86.4%) | 262 (88.2%) |
Income Below Poverty Among Married-Couple Families in Schulter
The poverty statistics for married-couple families in Schulter show that 2.9% or 4 of the total 138 families live below the poverty line. Families with 3 or 4 children have the highest poverty rate of 37.5%, comprising of 3 families. On the other hand, families with 1 or 2 children have the lowest poverty rate of 0.0%, which includes 0 families.
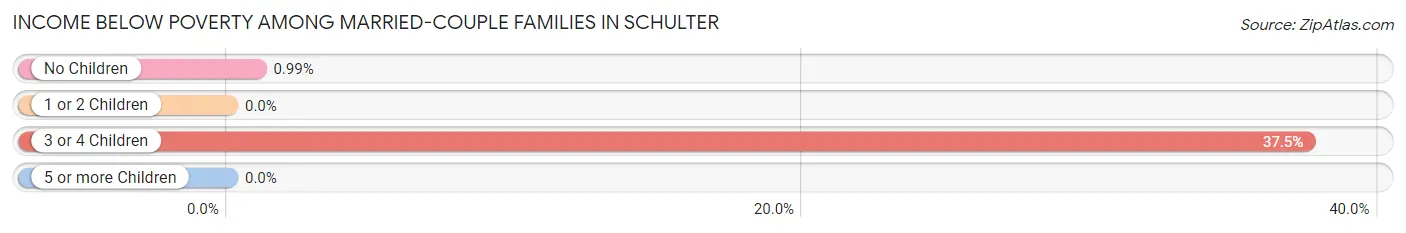
| Children | Above Poverty | Below Poverty |
| No Children | 100 (99.0%) | 1 (1.0%) |
| 1 or 2 Children | 29 (100.0%) | 0 (0.0%) |
| 3 or 4 Children | 5 (62.5%) | 3 (37.5%) |
| 5 or more Children | 0 (0.0%) | 0 (0.0%) |
| Total | 134 (97.1%) | 4 (2.9%) |
Income Below Poverty Among Single-Parent Households in Schulter
According to the poverty data in Schulter, 25.0% or 4 single-father households and 17.6% or 6 single-mother households are living below the poverty line. Among single-father households, those with 3 or 4 children have the highest poverty rate, with 4 households (100.0%) experiencing poverty. Likewise, among single-mother households, those with 1 or 2 children have the highest poverty rate, with 4 households (30.8%) falling below the poverty line.
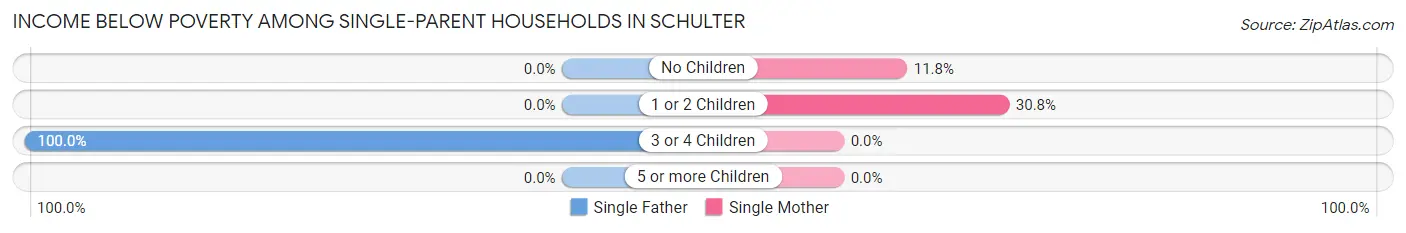
| Children | Single Father | Single Mother |
| No Children | 0 (0.0%) | 2 (11.8%) |
| 1 or 2 Children | 0 (0.0%) | 4 (30.8%) |
| 3 or 4 Children | 4 (100.0%) | 0 (0.0%) |
| 5 or more Children | 0 (0.0%) | 0 (0.0%) |
| Total | 4 (25.0%) | 6 (17.6%) |
Income Below Poverty Among Married-Couple vs Single-Parent Households in Schulter
The poverty data for Schulter shows that 4 of the married-couple family households (2.9%) and 10 of the single-parent households (20.0%) are living below the poverty level. Within the married-couple family households, those with 3 or 4 children have the highest poverty rate, with 3 households (37.5%) falling below the poverty line. Among the single-parent households, those with 3 or 4 children have the highest poverty rate, with 4 household (50.0%) living below poverty.
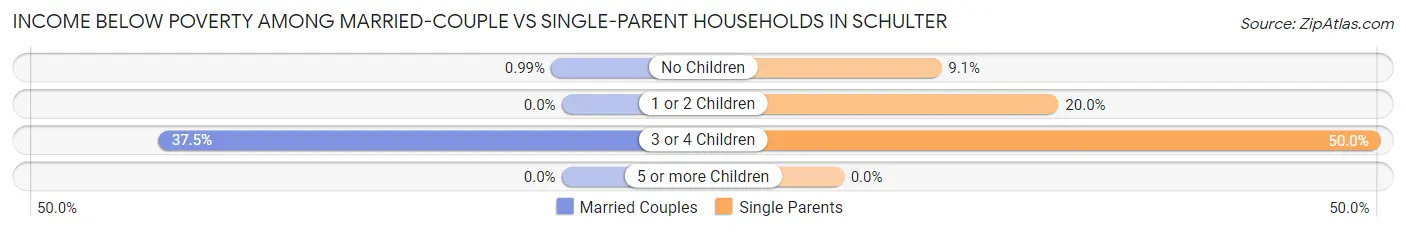
| Children | Married-Couple Families | Single-Parent Households |
| No Children | 1 (1.0%) | 2 (9.1%) |
| 1 or 2 Children | 0 (0.0%) | 4 (20.0%) |
| 3 or 4 Children | 3 (37.5%) | 4 (50.0%) |
| 5 or more Children | 0 (0.0%) | 0 (0.0%) |
| Total | 4 (2.9%) | 10 (20.0%) |
Race in Schulter
The most populous races in Schulter are White / Caucasian (427 | 83.7%), Native / Alaskan (45 | 8.8%), and Two or more Races (38 | 7.4%).
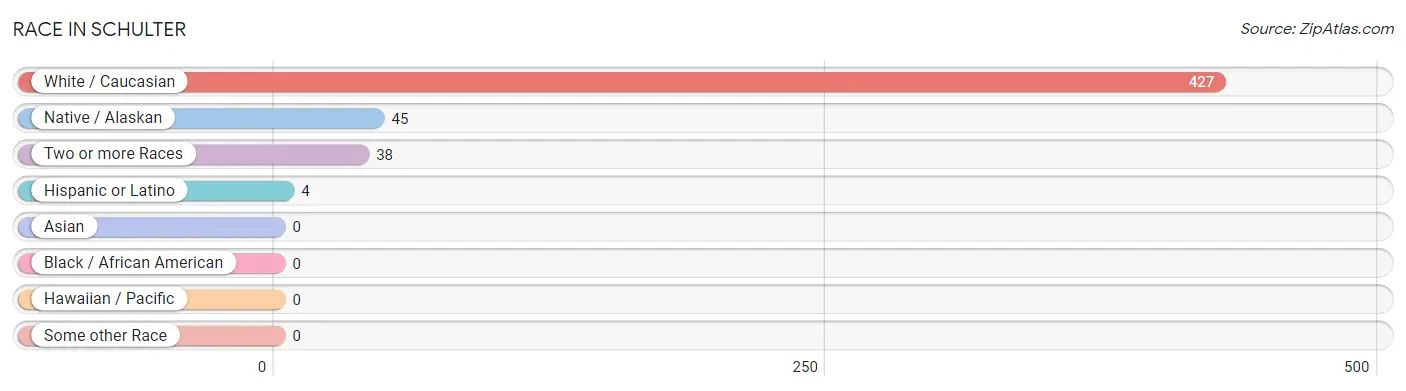
| Race | # Population | % Population |
| Asian | 0 | 0.0% |
| Black / African American | 0 | 0.0% |
| Hawaiian / Pacific | 0 | 0.0% |
| Hispanic or Latino | 4 | 0.8% |
| Native / Alaskan | 45 | 8.8% |
| White / Caucasian | 427 | 83.7% |
| Two or more Races | 38 | 7.4% |
| Some other Race | 0 | 0.0% |
| Total | 510 | 100.0% |
Ancestry in Schulter
The most populous ancestries reported in Schulter are Irish (132 | 25.9%), German (76 | 14.9%), English (66 | 12.9%), Creek (42 | 8.2%), and French (30 | 5.9%), together accounting for 67.8% of all Schulter residents.
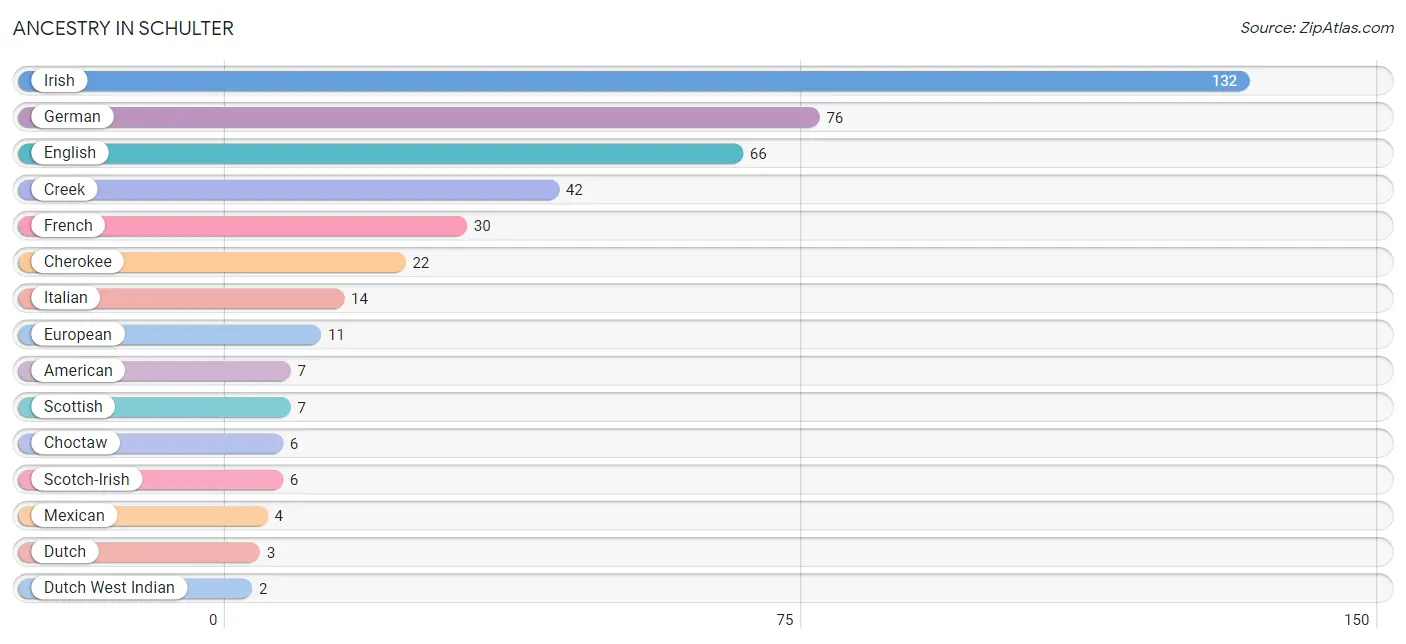
| Ancestry | # Population | % Population |
| American | 7 | 1.4% |
| Cherokee | 22 | 4.3% |
| Choctaw | 6 | 1.2% |
| Creek | 42 | 8.2% |
| Dutch | 3 | 0.6% |
| Dutch West Indian | 2 | 0.4% |
| English | 66 | 12.9% |
| European | 11 | 2.2% |
| French | 30 | 5.9% |
| German | 76 | 14.9% |
| Irish | 132 | 25.9% |
| Italian | 14 | 2.8% |
| Kiowa | 1 | 0.2% |
| Mexican | 4 | 0.8% |
| Polish | 1 | 0.2% |
| Scotch-Irish | 6 | 1.2% |
| Scottish | 7 | 1.4% | View All 17 Rows |
Immigrants in Schulter

| Immigration Origin | # Population | % Population | View All 0 Rows |
Sex and Age in Schulter
Sex and Age in Schulter
The most populous age groups in Schulter are 25 to 29 Years (26 | 12.2%) for men and 65 to 69 Years (80 | 26.9%) for women.
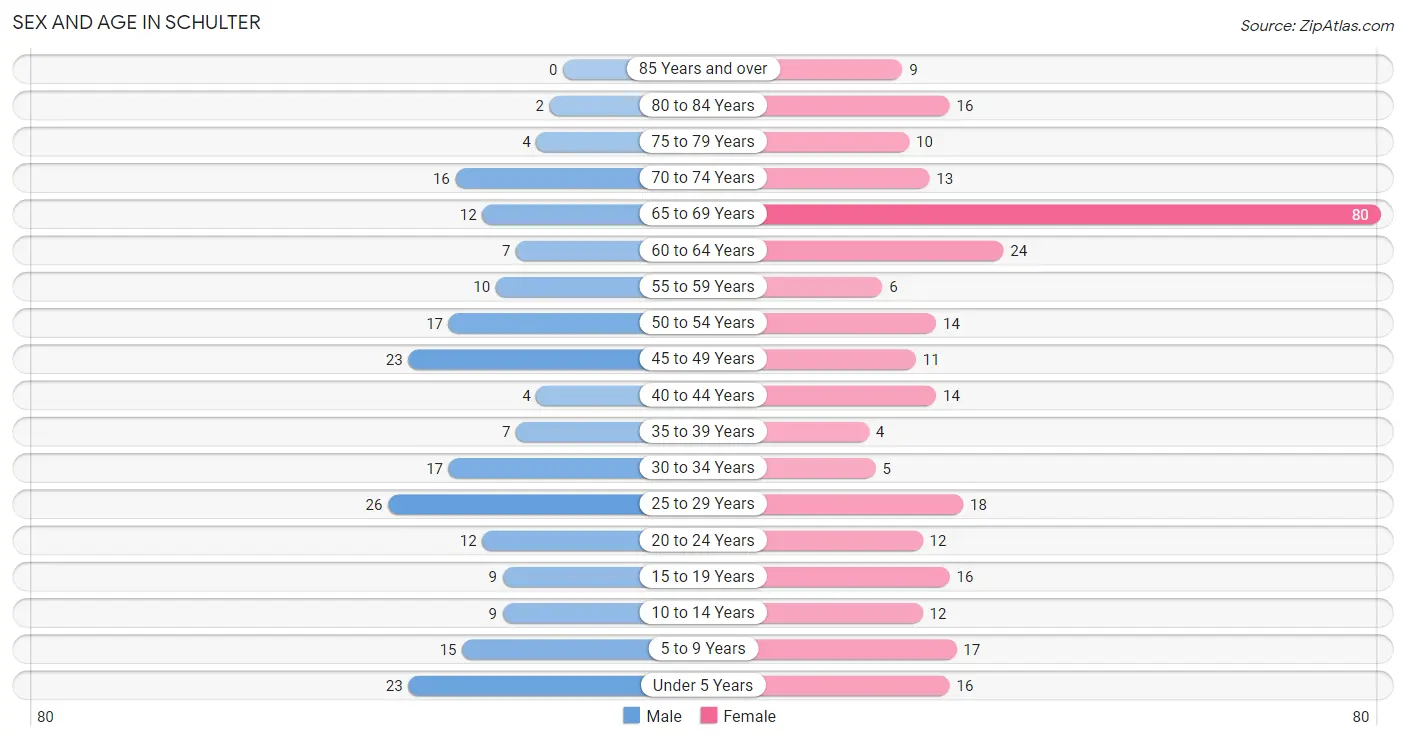
| Age Bracket | Male | Female |
| Under 5 Years | 23 (10.8%) | 16 (5.4%) |
| 5 to 9 Years | 15 (7.0%) | 17 (5.7%) |
| 10 to 14 Years | 9 (4.2%) | 12 (4.0%) |
| 15 to 19 Years | 9 (4.2%) | 16 (5.4%) |
| 20 to 24 Years | 12 (5.6%) | 12 (4.0%) |
| 25 to 29 Years | 26 (12.2%) | 18 (6.1%) |
| 30 to 34 Years | 17 (8.0%) | 5 (1.7%) |
| 35 to 39 Years | 7 (3.3%) | 4 (1.3%) |
| 40 to 44 Years | 4 (1.9%) | 14 (4.7%) |
| 45 to 49 Years | 23 (10.8%) | 11 (3.7%) |
| 50 to 54 Years | 17 (8.0%) | 14 (4.7%) |
| 55 to 59 Years | 10 (4.7%) | 6 (2.0%) |
| 60 to 64 Years | 7 (3.3%) | 24 (8.1%) |
| 65 to 69 Years | 12 (5.6%) | 80 (26.9%) |
| 70 to 74 Years | 16 (7.5%) | 13 (4.4%) |
| 75 to 79 Years | 4 (1.9%) | 10 (3.4%) |
| 80 to 84 Years | 2 (0.9%) | 16 (5.4%) |
| 85 Years and over | 0 (0.0%) | 9 (3.0%) |
| Total | 213 (100.0%) | 297 (100.0%) |
Families and Households in Schulter
Median Family Size in Schulter
The median family size in Schulter is 2.35 persons per family, with single female/mother families (34 | 18.1%) accounting for the largest median family size of 3 persons per family. On the other hand, married-couple families (138 | 73.4%) represent the smallest median family size with 2.17 persons per family.
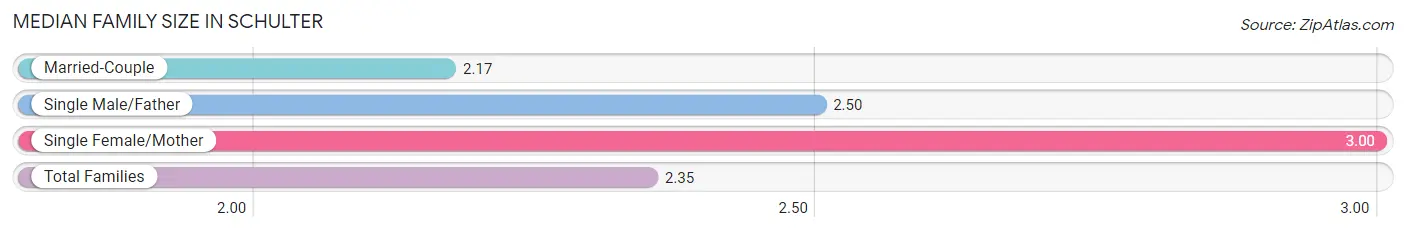
| Family Type | # Families | Family Size |
| Married-Couple | 138 (73.4%) | 2.17 |
| Single Male/Father | 16 (8.5%) | 2.50 |
| Single Female/Mother | 34 (18.1%) | 3.00 |
| Total Families | 188 (100.0%) | 2.35 |
Median Household Size in Schulter
The median household size in Schulter is 2.16 persons per household, with single female/mother households (34 | 14.4%) accounting for the largest median household size of 3.09 persons per household. non-family households (48 | 20.3%) represent the smallest median household size with 1.17 persons per household.
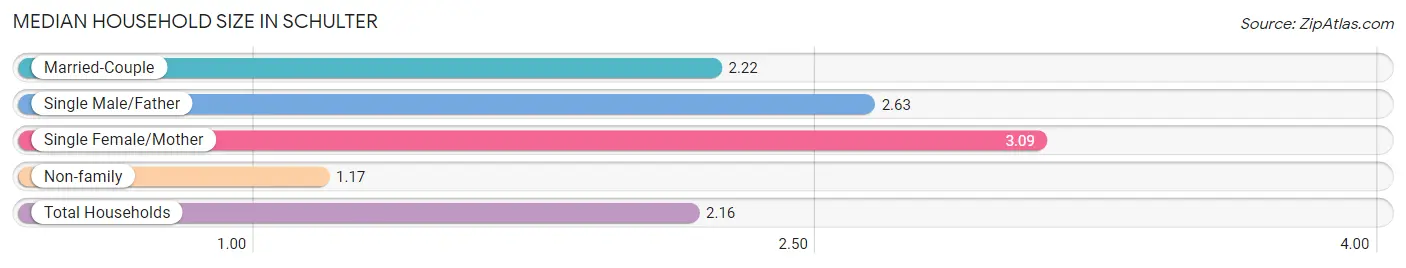
| Household Type | # Households | Household Size |
| Married-Couple | 138 (58.5%) | 2.22 |
| Single Male/Father | 16 (6.8%) | 2.63 |
| Single Female/Mother | 34 (14.4%) | 3.09 |
| Non-family | 48 (20.3%) | 1.17 |
| Total Households | 236 (100.0%) | 2.16 |
Household Size by Marriage Status in Schulter
Out of a total of 236 households in Schulter, 188 (79.7%) are family households, while 48 (20.3%) are nonfamily households. The most numerous type of family households are 2-person households, comprising 114, and the most common type of nonfamily households are 1-person households, comprising 42.
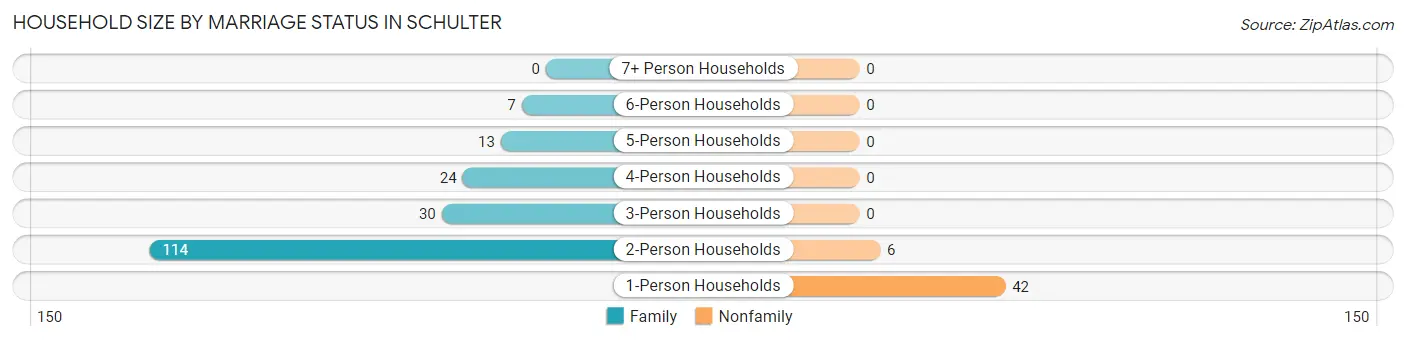
| Household Size | Family Households | Nonfamily Households |
| 1-Person Households | - | 42 (17.8%) |
| 2-Person Households | 114 (48.3%) | 6 (2.5%) |
| 3-Person Households | 30 (12.7%) | 0 (0.0%) |
| 4-Person Households | 24 (10.2%) | 0 (0.0%) |
| 5-Person Households | 13 (5.5%) | 0 (0.0%) |
| 6-Person Households | 7 (3.0%) | 0 (0.0%) |
| 7+ Person Households | 0 (0.0%) | 0 (0.0%) |
| Total | 188 (79.7%) | 48 (20.3%) |
Female Fertility in Schulter
Fertility by Age in Schulter
Average fertility rate in Schulter is 232.0 births per 1,000 women. Women in the age bracket of 20 to 34 years have the highest fertility rate with 543.0 births per 1,000 women. Women in the age bracket of 20 to 34 years acount for 100.0% of all women with births.
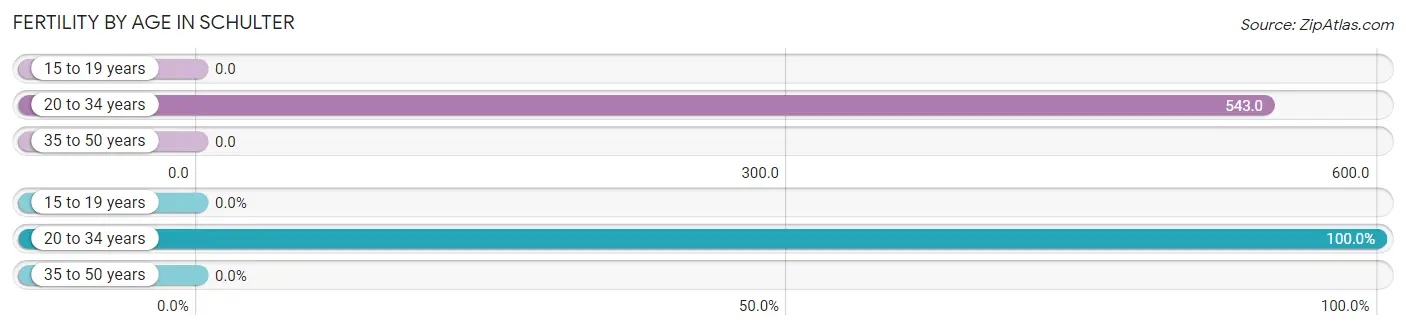
| Age Bracket | Women with Births | Births / 1,000 Women |
| 15 to 19 years | 0 (0.0%) | 0.0 |
| 20 to 34 years | 19 (100.0%) | 543.0 |
| 35 to 50 years | 0 (0.0%) | 0.0 |
| Total | 19 (100.0%) | 232.0 |
Fertility by Age by Marriage Status in Schulter
73.7% of women with births (19) in Schulter are married. The highest percentage of unmarried women with births falls into 20 to 34 years age bracket with 26.3% of them unmarried at the time of birth, while the lowest percentage of unmarried women with births belong to 20 to 34 years age bracket with 26.3% of them unmarried.
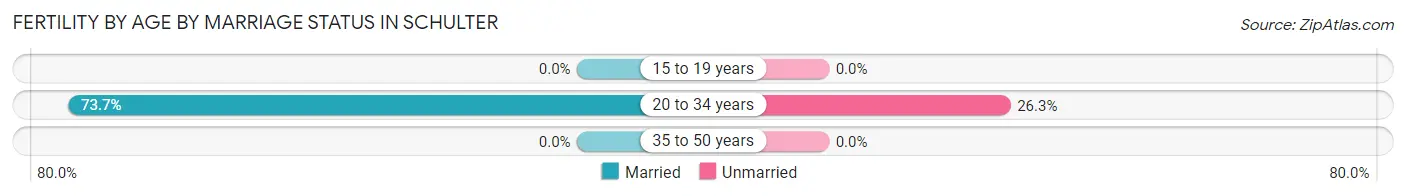
| Age Bracket | Married | Unmarried |
| 15 to 19 years | 0 (0.0%) | 0 (0.0%) |
| 20 to 34 years | 14 (73.7%) | 5 (26.3%) |
| 35 to 50 years | 0 (0.0%) | 0 (0.0%) |
| Total | 14 (73.7%) | 5 (26.3%) |
Fertility by Education in Schulter
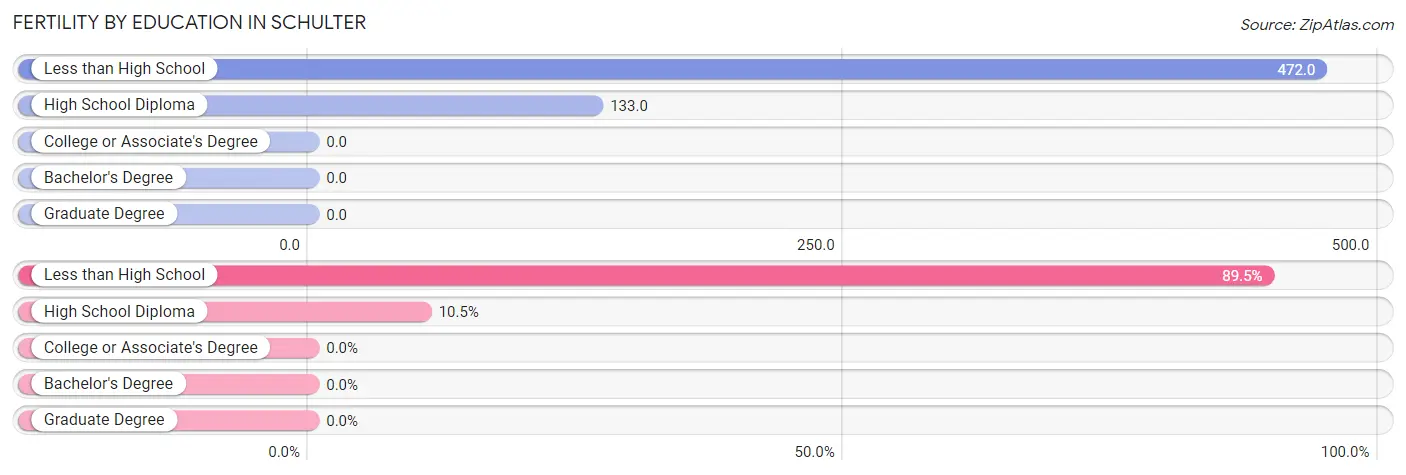
| Educational Attainment | Women with Births | Births / 1,000 Women |
| Less than High School | 17 (89.5%) | 472.0 |
| High School Diploma | 2 (10.5%) | 133.0 |
| College or Associate's Degree | 0 (0.0%) | 0.0 |
| Bachelor's Degree | 0 (0.0%) | 0.0 |
| Graduate Degree | 0 (0.0%) | 0.0 |
| Total | 19 (100.0%) | 232.0 |
Fertility by Education by Marriage Status in Schulter
26.3% of women with births in Schulter are unmarried. Women with the educational attainment of high school diploma are most likely to be married with 100.0% of them married at childbirth, while women with the educational attainment of less than high school are least likely to be married with 29.4% of them unmarried at childbirth.
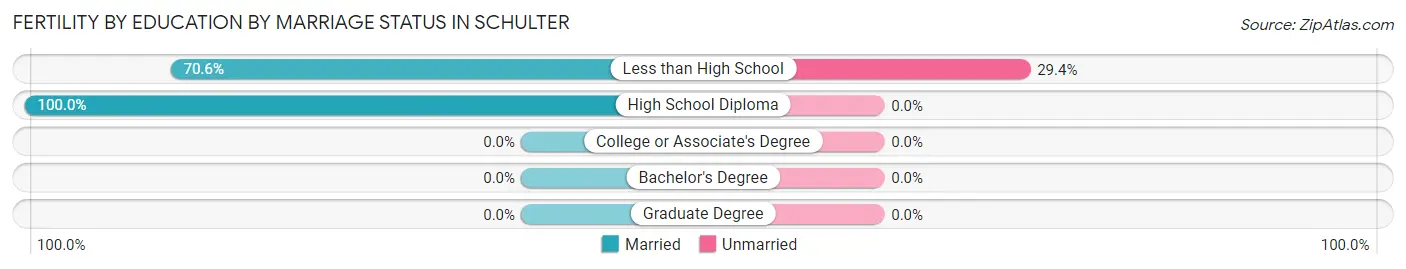
| Educational Attainment | Married | Unmarried |
| Less than High School | 12 (70.6%) | 5 (29.4%) |
| High School Diploma | 2 (100.0%) | 0 (0.0%) |
| College or Associate's Degree | 0 (0.0%) | 0 (0.0%) |
| Bachelor's Degree | 0 (0.0%) | 0 (0.0%) |
| Graduate Degree | 0 (0.0%) | 0 (0.0%) |
| Total | 14 (73.7%) | 5 (26.3%) |
Employment Characteristics in Schulter
Employment by Class of Employer in Schulter
Among the 175 employed individuals in Schulter, private company employees (124 | 70.9%), state government employees (20 | 11.4%), and not-for-profit organizations (10 | 5.7%) make up the most common classes of employment.
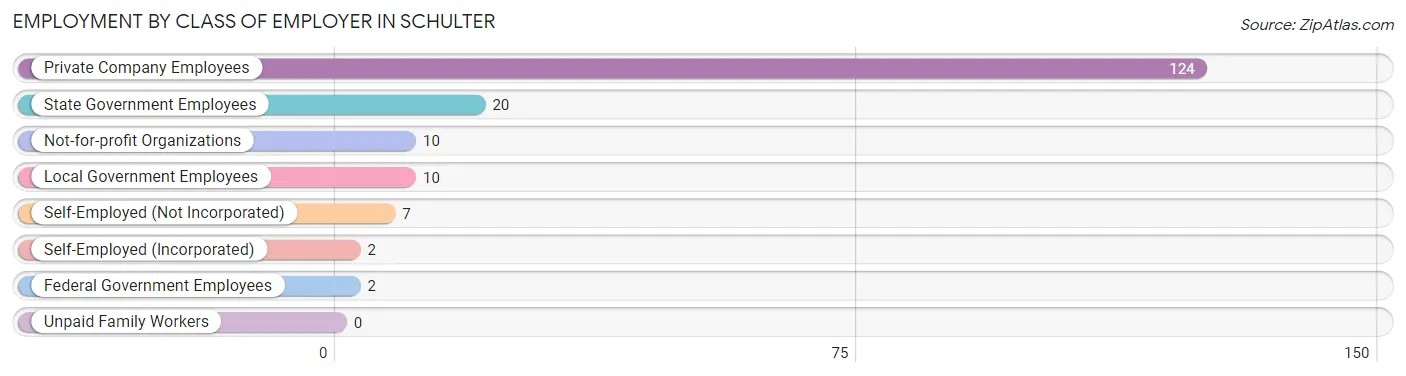
| Employer Class | # Employees | % Employees |
| Private Company Employees | 124 | 70.9% |
| Self-Employed (Incorporated) | 2 | 1.1% |
| Self-Employed (Not Incorporated) | 7 | 4.0% |
| Not-for-profit Organizations | 10 | 5.7% |
| Local Government Employees | 10 | 5.7% |
| State Government Employees | 20 | 11.4% |
| Federal Government Employees | 2 | 1.1% |
| Unpaid Family Workers | 0 | 0.0% |
| Total | 175 | 100.0% |
Employment Status by Age in Schulter
According to the labor force statistics for Schulter, out of the total population over 16 years of age (417), 44.1% or 184 individuals are in the labor force, with 2.7% or 5 of them unemployed. The age group with the highest labor force participation rate is 20 to 24 years, with 91.7% or 22 individuals in the labor force. Within the labor force, the 16 to 19 years age range has the highest percentage of unemployed individuals, with 33.3% or 5 of them being unemployed.
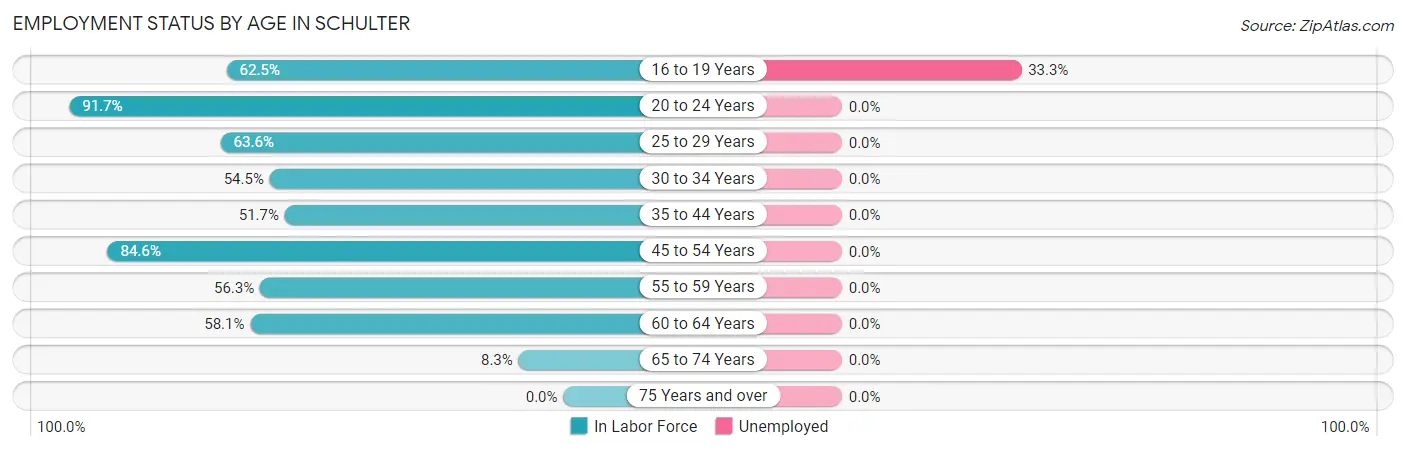
| Age Bracket | In Labor Force | Unemployed |
| 16 to 19 Years | 15 (62.5%) | 5 (33.3%) |
| 20 to 24 Years | 22 (91.7%) | 0 (0.0%) |
| 25 to 29 Years | 28 (63.6%) | 0 (0.0%) |
| 30 to 34 Years | 12 (54.5%) | 0 (0.0%) |
| 35 to 44 Years | 15 (51.7%) | 0 (0.0%) |
| 45 to 54 Years | 55 (84.6%) | 0 (0.0%) |
| 55 to 59 Years | 9 (56.3%) | 0 (0.0%) |
| 60 to 64 Years | 18 (58.1%) | 0 (0.0%) |
| 65 to 74 Years | 10 (8.3%) | 0 (0.0%) |
| 75 Years and over | 0 (0.0%) | 0 (0.0%) |
| Total | 184 (44.1%) | 5 (2.7%) |
Employment Status by Educational Attainment in Schulter
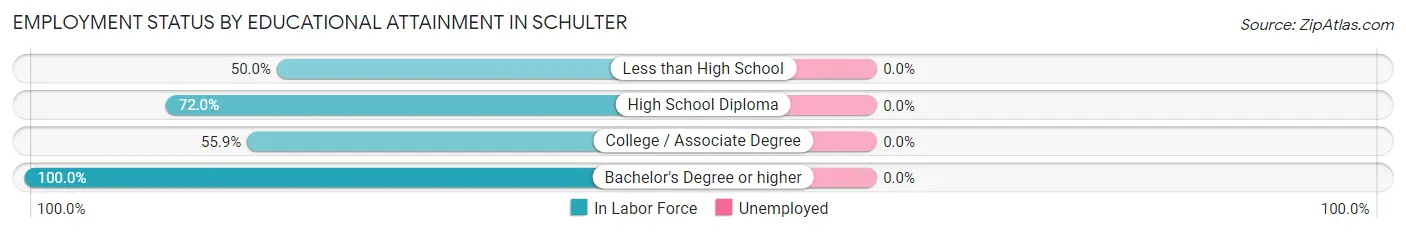
| Educational Attainment | In Labor Force | Unemployed |
| Less than High School | 18 (50.0%) | 0 (0.0%) |
| High School Diploma | 67 (72.0%) | 0 (0.0%) |
| College / Associate Degree | 33 (55.9%) | 0 (0.0%) |
| Bachelor's Degree or higher | 19 (100.0%) | 0 (0.0%) |
| Total | 137 (66.2%) | 0 (0.0%) |
Employment Occupations by Sex in Schulter
Management, Business, Science and Arts Occupations
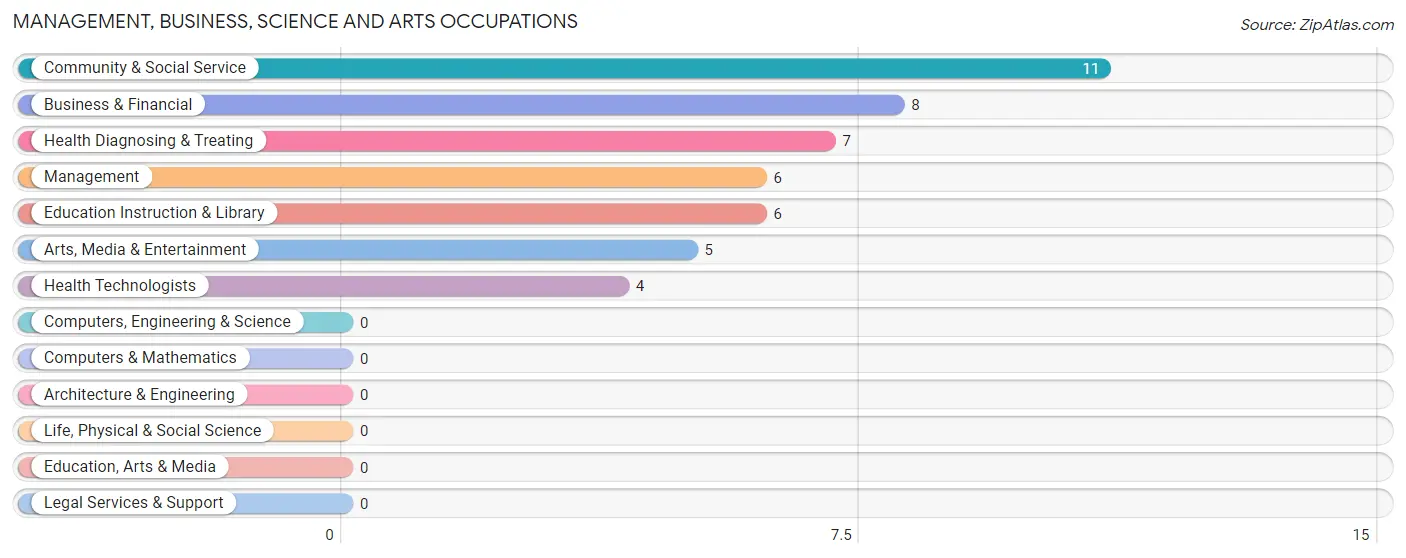
The most common Management, Business, Science and Arts occupations in Schulter are Community & Social Service (11 | 6.1%), Business & Financial (8 | 4.5%), Health Diagnosing & Treating (7 | 3.9%), Management (6 | 3.4%), and Education Instruction & Library (6 | 3.4%).
Management, Business, Science and Arts Occupations by Sex
Within the Management, Business, Science and Arts occupations in Schulter, the most male-oriented occupations are Arts, Media & Entertainment (100.0%), Business & Financial (75.0%), and Community & Social Service (72.7%), while the most female-oriented occupations are Management (100.0%), Health Diagnosing & Treating (100.0%), and Health Technologists (100.0%).
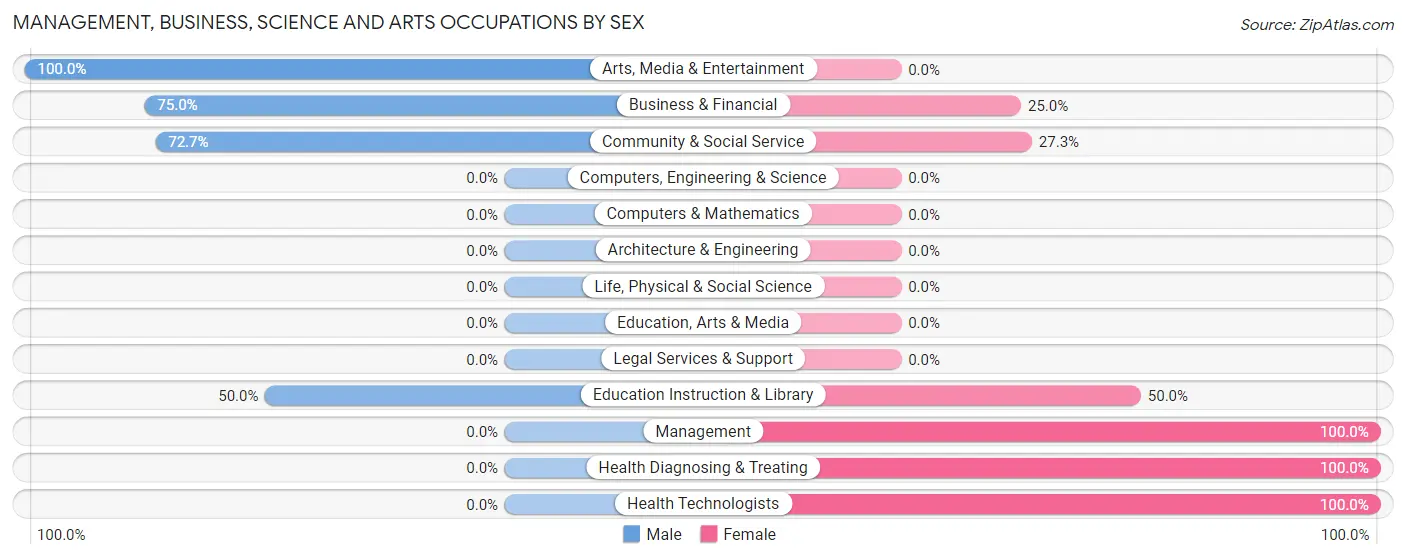
| Occupation | Male | Female |
| Management | 0 (0.0%) | 6 (100.0%) |
| Business & Financial | 6 (75.0%) | 2 (25.0%) |
| Computers, Engineering & Science | 0 (0.0%) | 0 (0.0%) |
| Computers & Mathematics | 0 (0.0%) | 0 (0.0%) |
| Architecture & Engineering | 0 (0.0%) | 0 (0.0%) |
| Life, Physical & Social Science | 0 (0.0%) | 0 (0.0%) |
| Community & Social Service | 8 (72.7%) | 3 (27.3%) |
| Education, Arts & Media | 0 (0.0%) | 0 (0.0%) |
| Legal Services & Support | 0 (0.0%) | 0 (0.0%) |
| Education Instruction & Library | 3 (50.0%) | 3 (50.0%) |
| Arts, Media & Entertainment | 5 (100.0%) | 0 (0.0%) |
| Health Diagnosing & Treating | 0 (0.0%) | 7 (100.0%) |
| Health Technologists | 0 (0.0%) | 4 (100.0%) |
| Total (Category) | 14 (43.8%) | 18 (56.2%) |
| Total (Overall) | 112 (62.6%) | 67 (37.4%) |
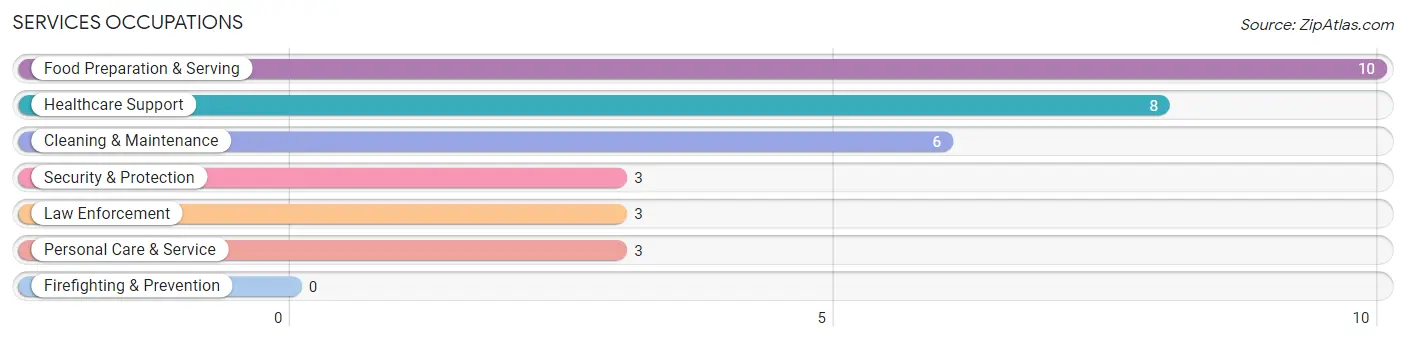
Services Occupations
The most common Services occupations in Schulter are Food Preparation & Serving (10 | 5.6%), Healthcare Support (8 | 4.5%), Cleaning & Maintenance (6 | 3.4%), Security & Protection (3 | 1.7%), and Law Enforcement (3 | 1.7%).
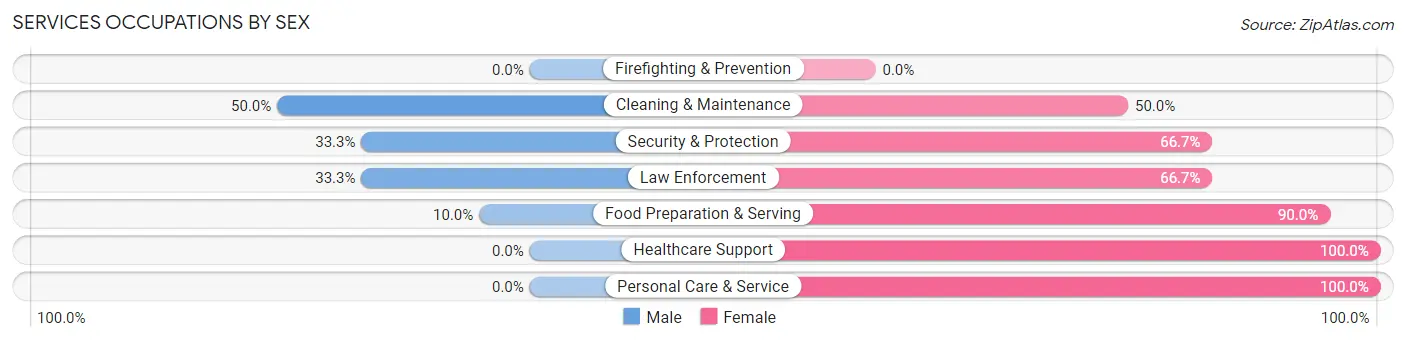
Services Occupations by Sex
Within the Services occupations in Schulter, the most male-oriented occupations are Cleaning & Maintenance (50.0%), Security & Protection (33.3%), and Law Enforcement (33.3%), while the most female-oriented occupations are Healthcare Support (100.0%), Personal Care & Service (100.0%), and Food Preparation & Serving (90.0%).
| Occupation | Male | Female |
| Healthcare Support | 0 (0.0%) | 8 (100.0%) |
| Security & Protection | 1 (33.3%) | 2 (66.7%) |
| Firefighting & Prevention | 0 (0.0%) | 0 (0.0%) |
| Law Enforcement | 1 (33.3%) | 2 (66.7%) |
| Food Preparation & Serving | 1 (10.0%) | 9 (90.0%) |
| Cleaning & Maintenance | 3 (50.0%) | 3 (50.0%) |
| Personal Care & Service | 0 (0.0%) | 3 (100.0%) |
| Total (Category) | 5 (16.7%) | 25 (83.3%) |
| Total (Overall) | 112 (62.6%) | 67 (37.4%) |
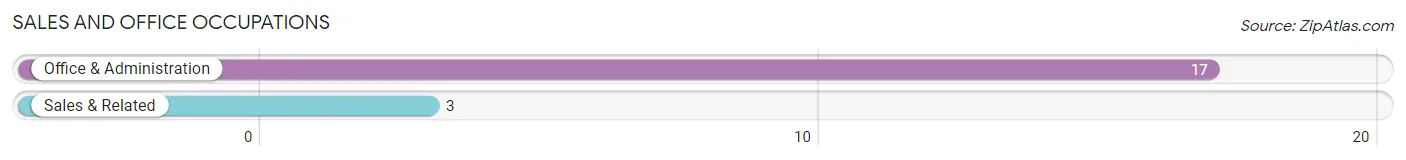
Sales and Office Occupations
The most common Sales and Office occupations in Schulter are Office & Administration (17 | 9.5%), and Sales & Related (3 | 1.7%).
Sales and Office Occupations by Sex
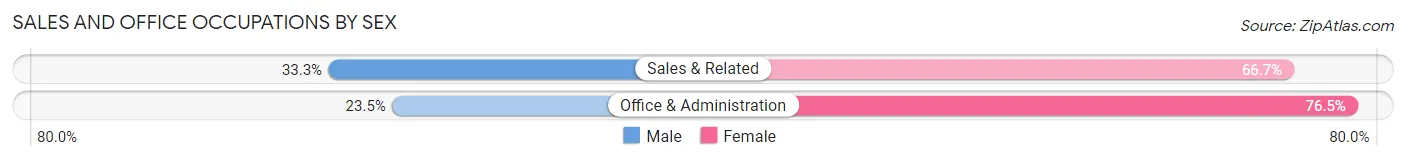
| Occupation | Male | Female |
| Sales & Related | 1 (33.3%) | 2 (66.7%) |
| Office & Administration | 4 (23.5%) | 13 (76.5%) |
| Total (Category) | 5 (25.0%) | 15 (75.0%) |
| Total (Overall) | 112 (62.6%) | 67 (37.4%) |
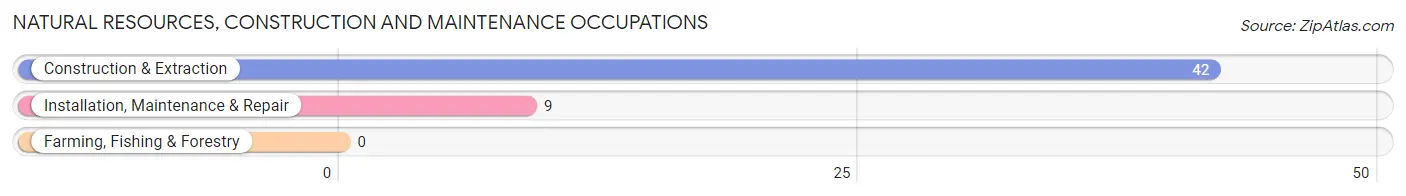
Natural Resources, Construction and Maintenance Occupations
The most common Natural Resources, Construction and Maintenance occupations in Schulter are Construction & Extraction (42 | 23.5%), and Installation, Maintenance & Repair (9 | 5.0%).
Natural Resources, Construction and Maintenance Occupations by Sex
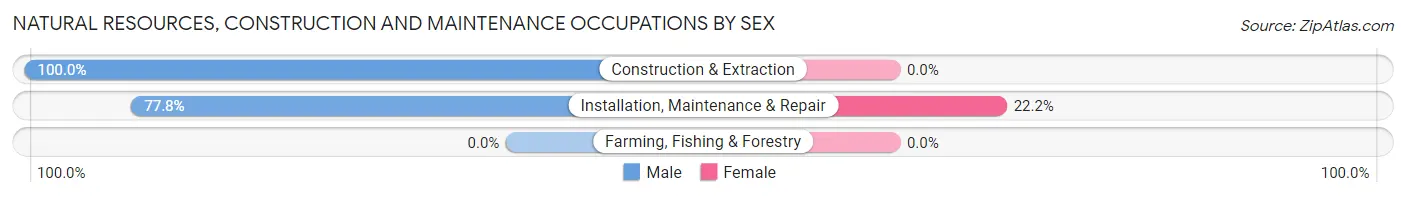
| Occupation | Male | Female |
| Farming, Fishing & Forestry | 0 (0.0%) | 0 (0.0%) |
| Construction & Extraction | 42 (100.0%) | 0 (0.0%) |
| Installation, Maintenance & Repair | 7 (77.8%) | 2 (22.2%) |
| Total (Category) | 49 (96.1%) | 2 (3.9%) |
| Total (Overall) | 112 (62.6%) | 67 (37.4%) |
Production, Transportation and Moving Occupations
The most common Production, Transportation and Moving occupations in Schulter are Production (19 | 10.6%), Material Moving (17 | 9.5%), and Transportation (10 | 5.6%).
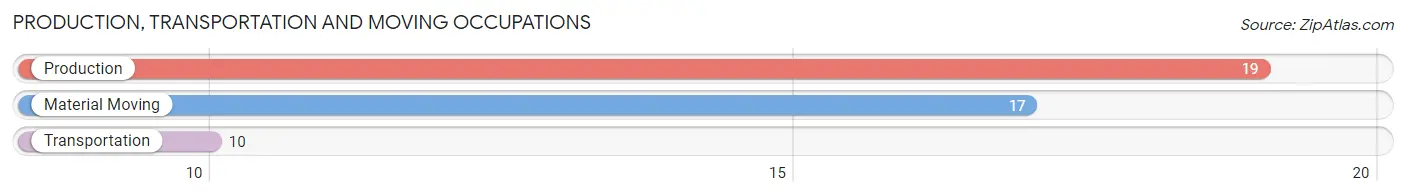
Production, Transportation and Moving Occupations by Sex
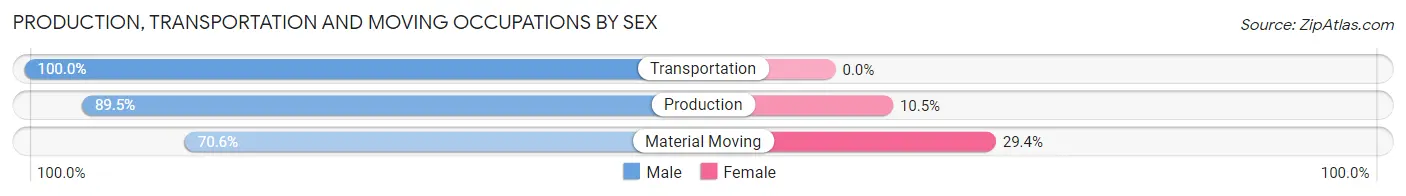
| Occupation | Male | Female |
| Production | 17 (89.5%) | 2 (10.5%) |
| Transportation | 10 (100.0%) | 0 (0.0%) |
| Material Moving | 12 (70.6%) | 5 (29.4%) |
| Total (Category) | 39 (84.8%) | 7 (15.2%) |
| Total (Overall) | 112 (62.6%) | 67 (37.4%) |
Employment Industries by Sex in Schulter
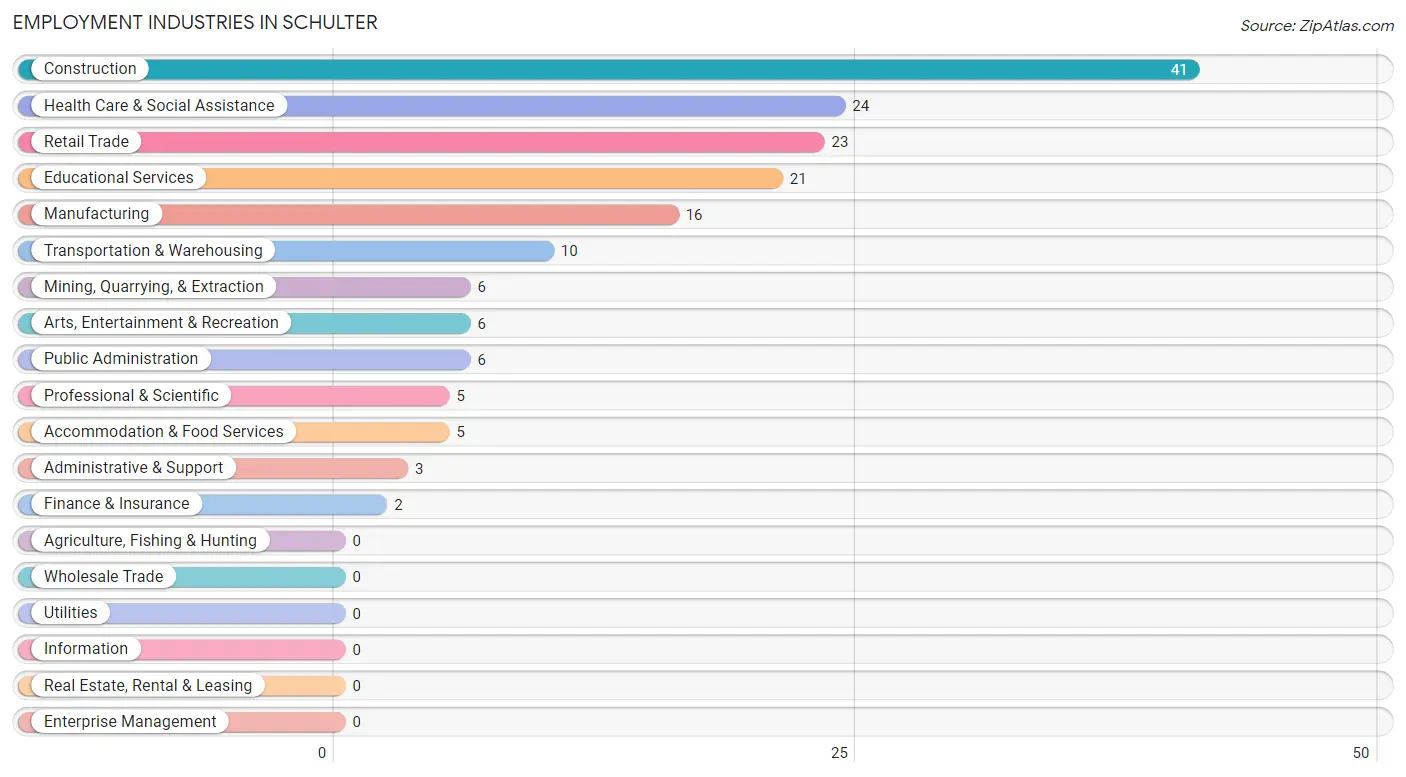
Employment Industries in Schulter
The major employment industries in Schulter include Construction (41 | 22.9%), Health Care & Social Assistance (24 | 13.4%), Retail Trade (23 | 12.9%), Educational Services (21 | 11.7%), and Manufacturing (16 | 8.9%).
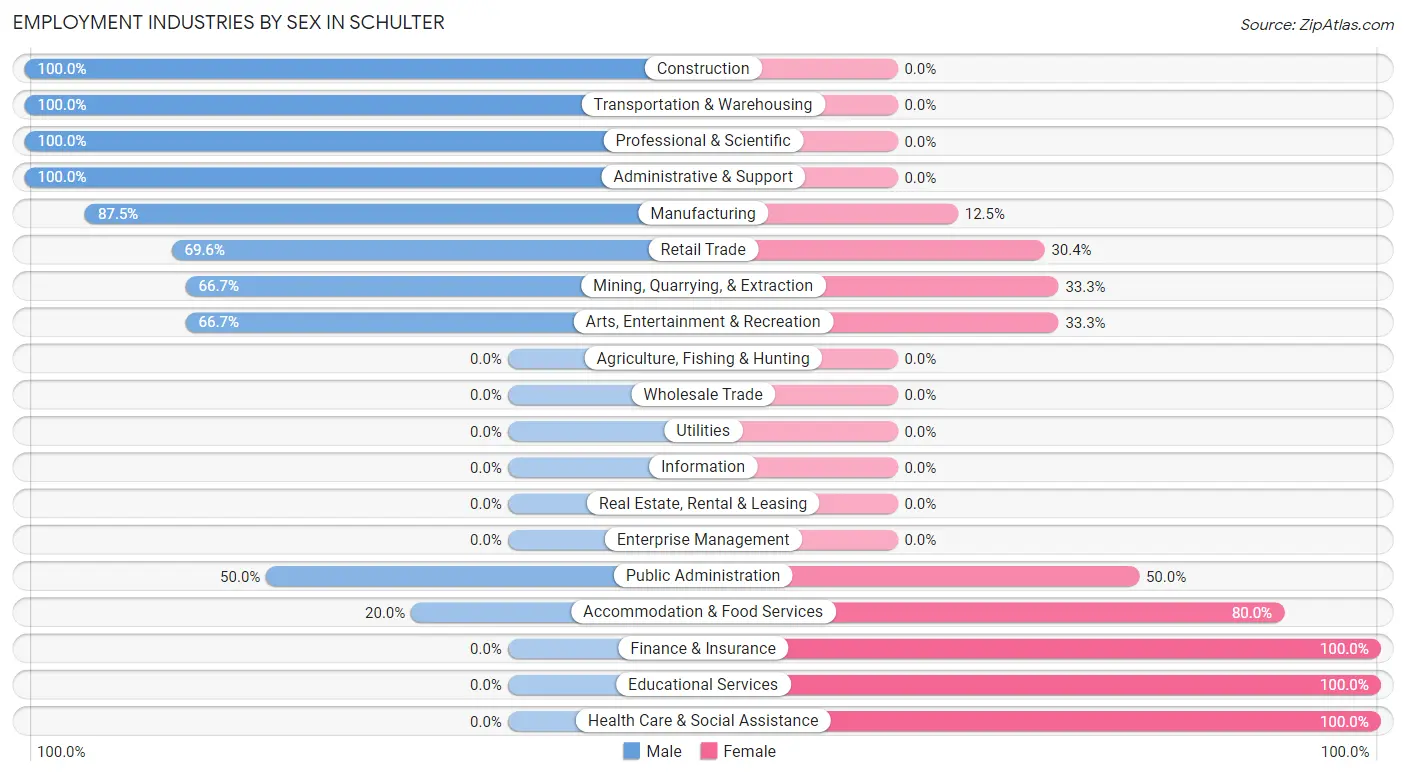
Employment Industries by Sex in Schulter
The Schulter industries that see more men than women are Construction (100.0%), Transportation & Warehousing (100.0%), and Professional & Scientific (100.0%), whereas the industries that tend to have a higher number of women are Finance & Insurance (100.0%), Educational Services (100.0%), and Health Care & Social Assistance (100.0%).
| Industry | Male | Female |
| Agriculture, Fishing & Hunting | 0 (0.0%) | 0 (0.0%) |
| Mining, Quarrying, & Extraction | 4 (66.7%) | 2 (33.3%) |
| Construction | 41 (100.0%) | 0 (0.0%) |
| Manufacturing | 14 (87.5%) | 2 (12.5%) |
| Wholesale Trade | 0 (0.0%) | 0 (0.0%) |
| Retail Trade | 16 (69.6%) | 7 (30.4%) |
| Transportation & Warehousing | 10 (100.0%) | 0 (0.0%) |
| Utilities | 0 (0.0%) | 0 (0.0%) |
| Information | 0 (0.0%) | 0 (0.0%) |
| Finance & Insurance | 0 (0.0%) | 2 (100.0%) |
| Real Estate, Rental & Leasing | 0 (0.0%) | 0 (0.0%) |
| Professional & Scientific | 5 (100.0%) | 0 (0.0%) |
| Enterprise Management | 0 (0.0%) | 0 (0.0%) |
| Administrative & Support | 3 (100.0%) | 0 (0.0%) |
| Educational Services | 0 (0.0%) | 21 (100.0%) |
| Health Care & Social Assistance | 0 (0.0%) | 24 (100.0%) |
| Arts, Entertainment & Recreation | 4 (66.7%) | 2 (33.3%) |
| Accommodation & Food Services | 1 (20.0%) | 4 (80.0%) |
| Public Administration | 3 (50.0%) | 3 (50.0%) |
| Total | 112 (62.6%) | 67 (37.4%) |
Education in Schulter
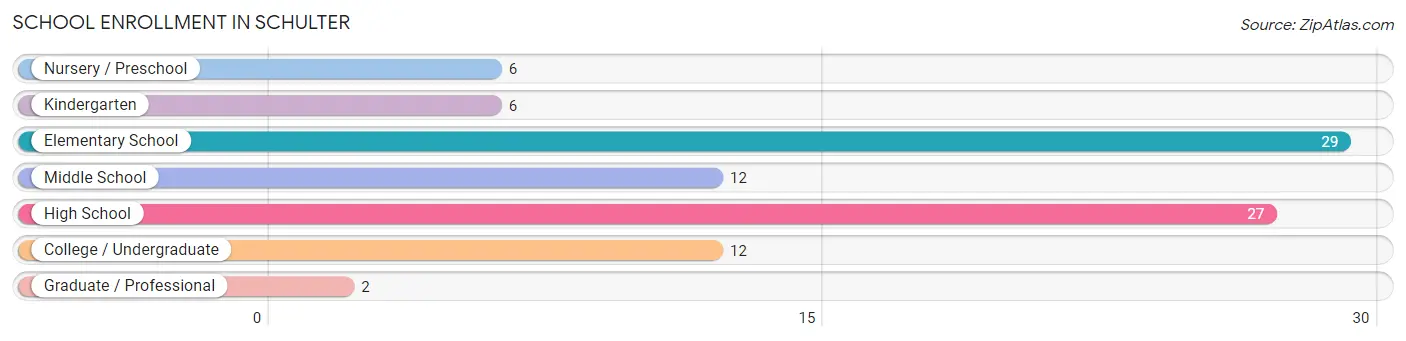
School Enrollment in Schulter
The most common levels of schooling among the 94 students in Schulter are elementary school (29 | 30.8%), high school (27 | 28.7%), and middle school (12 | 12.8%).
| School Level | # Students | % Students |
| Nursery / Preschool | 6 | 6.4% |
| Kindergarten | 6 | 6.4% |
| Elementary School | 29 | 30.8% |
| Middle School | 12 | 12.8% |
| High School | 27 | 28.7% |
| College / Undergraduate | 12 | 12.8% |
| Graduate / Professional | 2 | 2.1% |
| Total | 94 | 100.0% |
School Enrollment by Age by Funding Source in Schulter
Out of a total of 94 students who are enrolled in schools in Schulter, 2 (2.1%) attend a private institution, while the remaining 92 (97.9%) are enrolled in public schools. The age group of 25 to 34 year olds has the highest likelihood of being enrolled in private schools, with 2 (33.3% in the age bracket) enrolled. Conversely, the age group of 3 to 4 year olds has the lowest likelihood of being enrolled in a private school, with 3 (100.0% in the age bracket) attending a public institution.
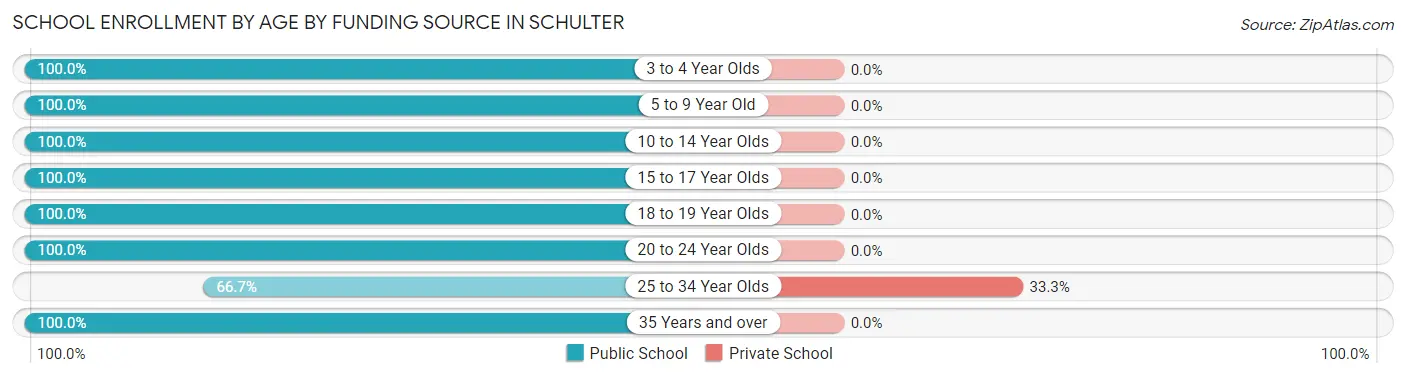
| Age Bracket | Public School | Private School |
| 3 to 4 Year Olds | 3 (100.0%) | 0 (0.0%) |
| 5 to 9 Year Old | 32 (100.0%) | 0 (0.0%) |
| 10 to 14 Year Olds | 21 (100.0%) | 0 (0.0%) |
| 15 to 17 Year Olds | 18 (100.0%) | 0 (0.0%) |
| 18 to 19 Year Olds | 6 (100.0%) | 0 (0.0%) |
| 20 to 24 Year Olds | 5 (100.0%) | 0 (0.0%) |
| 25 to 34 Year Olds | 4 (66.7%) | 2 (33.3%) |
| 35 Years and over | 3 (100.0%) | 0 (0.0%) |
| Total | 92 (97.9%) | 2 (2.1%) |
Educational Attainment by Field of Study in Schulter
Science & technology (10 | 43.5%), education (10 | 43.5%), and bio, nature & agricultural (3 | 13.0%) are the most common fields of study among 23 individuals in Schulter who have obtained a bachelor's degree or higher.
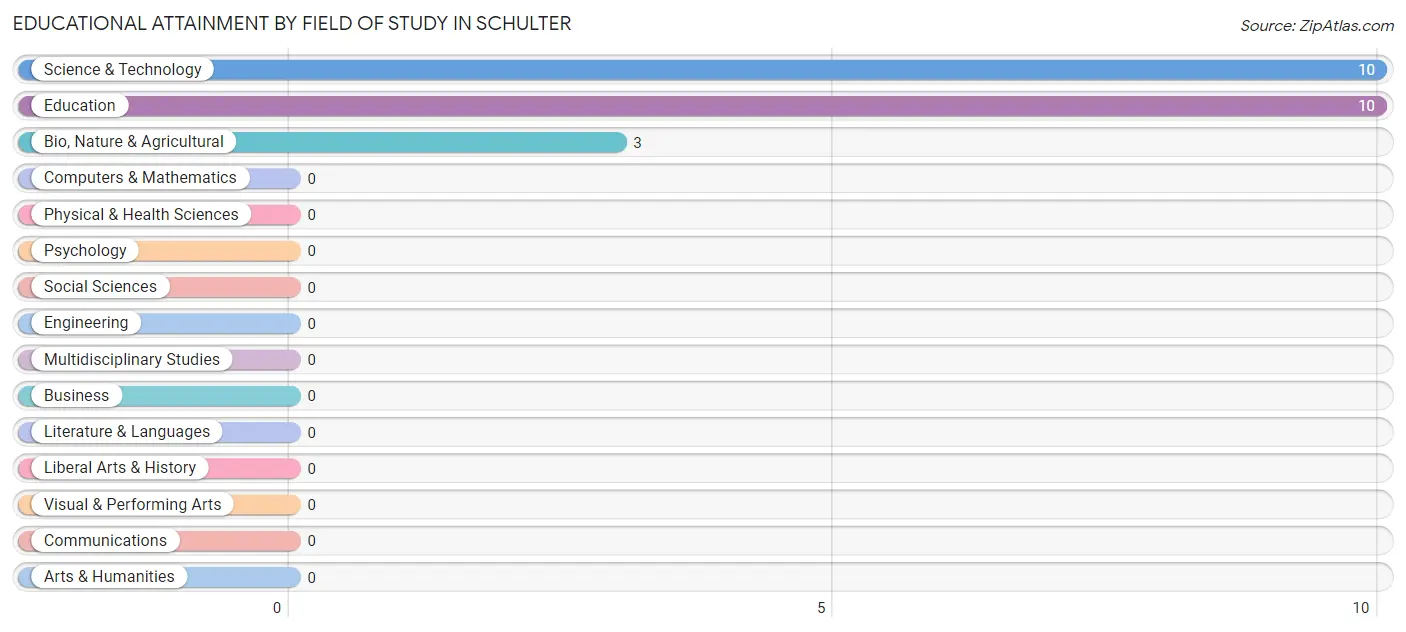
| Field of Study | # Graduates | % Graduates |
| Computers & Mathematics | 0 | 0.0% |
| Bio, Nature & Agricultural | 3 | 13.0% |
| Physical & Health Sciences | 0 | 0.0% |
| Psychology | 0 | 0.0% |
| Social Sciences | 0 | 0.0% |
| Engineering | 0 | 0.0% |
| Multidisciplinary Studies | 0 | 0.0% |
| Science & Technology | 10 | 43.5% |
| Business | 0 | 0.0% |
| Education | 10 | 43.5% |
| Literature & Languages | 0 | 0.0% |
| Liberal Arts & History | 0 | 0.0% |
| Visual & Performing Arts | 0 | 0.0% |
| Communications | 0 | 0.0% |
| Arts & Humanities | 0 | 0.0% |
| Total | 23 | 100.0% |
Transportation & Commute in Schulter
Vehicle Availability by Sex in Schulter
The most prevalent vehicle ownership categories in Schulter are males with 2 vehicles (57, accounting for 52.8%) and females with 2 vehicles (23, making up 85.1%).
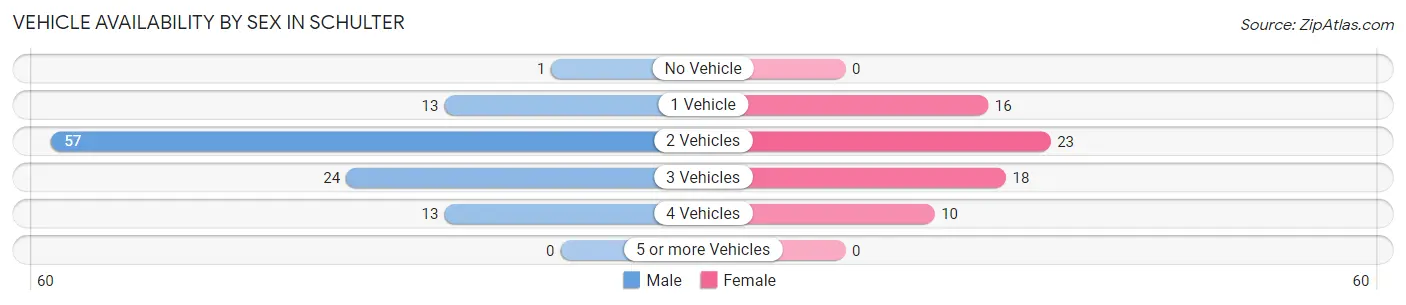
| Vehicles Available | Male | Female |
| No Vehicle | 1 (0.9%) | 0 (0.0%) |
| 1 Vehicle | 13 (12.0%) | 16 (23.9%) |
| 2 Vehicles | 57 (52.8%) | 23 (34.3%) |
| 3 Vehicles | 24 (22.2%) | 18 (26.9%) |
| 4 Vehicles | 13 (12.0%) | 10 (14.9%) |
| 5 or more Vehicles | 0 (0.0%) | 0 (0.0%) |
| Total | 108 (100.0%) | 67 (100.0%) |
Commute Time in Schulter
The most frequently occuring commute durations in Schulter are 15 to 19 minutes (49 commuters, 29.0%), 5 to 9 minutes (33 commuters, 19.5%), and 10 to 14 minutes (32 commuters, 18.9%).
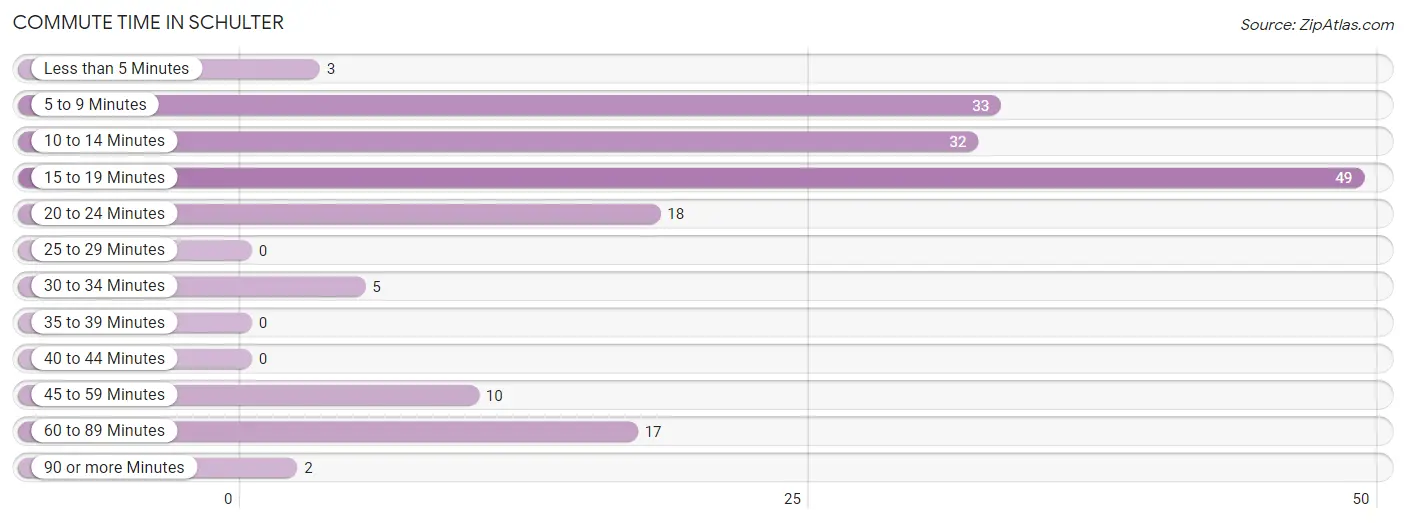
| Commute Time | # Commuters | % Commuters |
| Less than 5 Minutes | 3 | 1.8% |
| 5 to 9 Minutes | 33 | 19.5% |
| 10 to 14 Minutes | 32 | 18.9% |
| 15 to 19 Minutes | 49 | 29.0% |
| 20 to 24 Minutes | 18 | 10.6% |
| 25 to 29 Minutes | 0 | 0.0% |
| 30 to 34 Minutes | 5 | 3.0% |
| 35 to 39 Minutes | 0 | 0.0% |
| 40 to 44 Minutes | 0 | 0.0% |
| 45 to 59 Minutes | 10 | 5.9% |
| 60 to 89 Minutes | 17 | 10.1% |
| 90 or more Minutes | 2 | 1.2% |
Commute Time by Sex in Schulter
The most common commute times in Schulter are 15 to 19 minutes (32 commuters, 31.1%) for males and 5 to 9 minutes (17 commuters, 25.8%) for females.
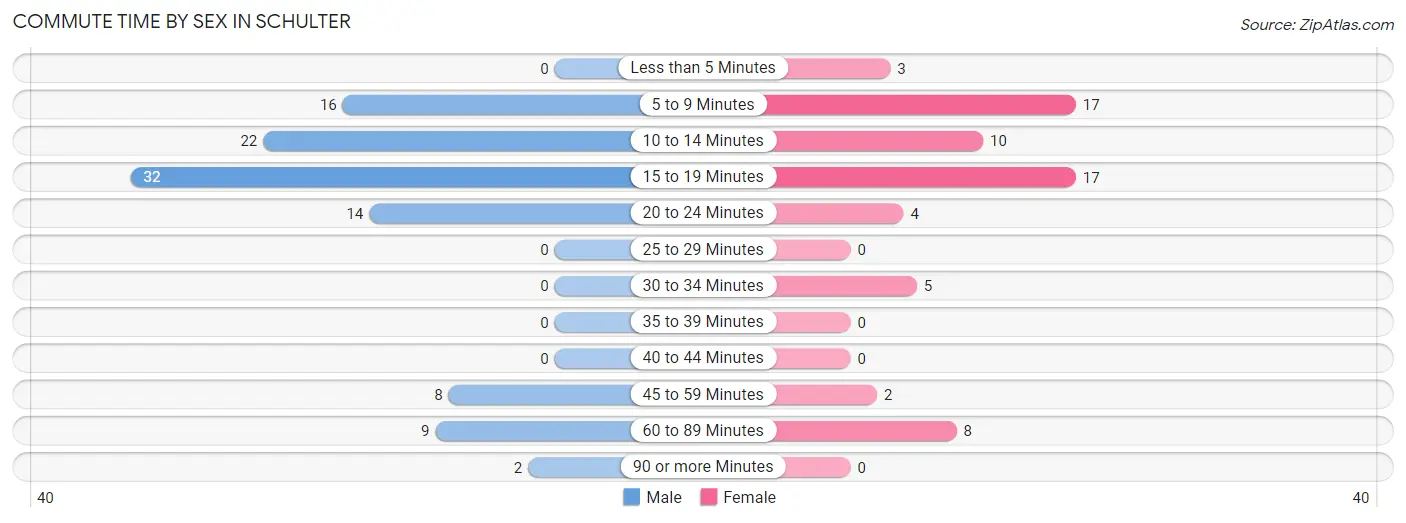
| Commute Time | Male | Female |
| Less than 5 Minutes | 0 (0.0%) | 3 (4.5%) |
| 5 to 9 Minutes | 16 (15.5%) | 17 (25.8%) |
| 10 to 14 Minutes | 22 (21.4%) | 10 (15.1%) |
| 15 to 19 Minutes | 32 (31.1%) | 17 (25.8%) |
| 20 to 24 Minutes | 14 (13.6%) | 4 (6.1%) |
| 25 to 29 Minutes | 0 (0.0%) | 0 (0.0%) |
| 30 to 34 Minutes | 0 (0.0%) | 5 (7.6%) |
| 35 to 39 Minutes | 0 (0.0%) | 0 (0.0%) |
| 40 to 44 Minutes | 0 (0.0%) | 0 (0.0%) |
| 45 to 59 Minutes | 8 (7.8%) | 2 (3.0%) |
| 60 to 89 Minutes | 9 (8.7%) | 8 (12.1%) |
| 90 or more Minutes | 2 (1.9%) | 0 (0.0%) |
Time of Departure to Work by Sex in Schulter
The most frequent times of departure to work in Schulter are 6:30 AM to 6:59 AM (23, 22.3%) for males and 7:30 AM to 7:59 AM (13, 19.7%) for females.
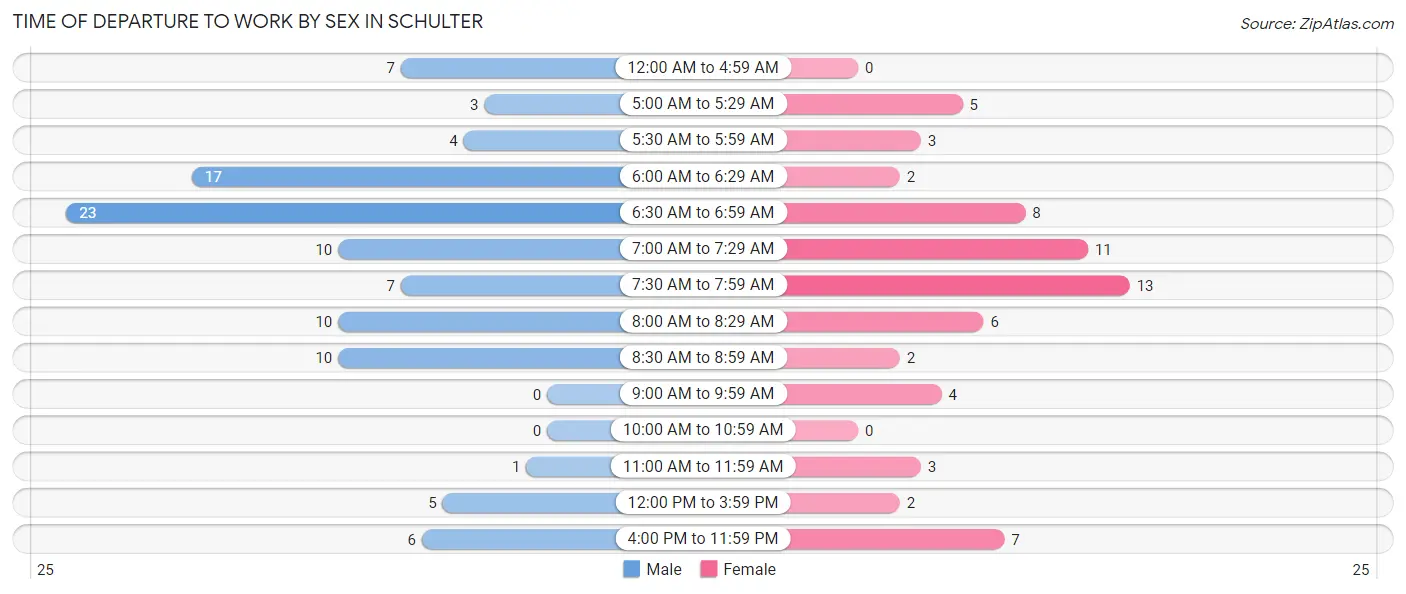
| Time of Departure | Male | Female |
| 12:00 AM to 4:59 AM | 7 (6.8%) | 0 (0.0%) |
| 5:00 AM to 5:29 AM | 3 (2.9%) | 5 (7.6%) |
| 5:30 AM to 5:59 AM | 4 (3.9%) | 3 (4.5%) |
| 6:00 AM to 6:29 AM | 17 (16.5%) | 2 (3.0%) |
| 6:30 AM to 6:59 AM | 23 (22.3%) | 8 (12.1%) |
| 7:00 AM to 7:29 AM | 10 (9.7%) | 11 (16.7%) |
| 7:30 AM to 7:59 AM | 7 (6.8%) | 13 (19.7%) |
| 8:00 AM to 8:29 AM | 10 (9.7%) | 6 (9.1%) |
| 8:30 AM to 8:59 AM | 10 (9.7%) | 2 (3.0%) |
| 9:00 AM to 9:59 AM | 0 (0.0%) | 4 (6.1%) |
| 10:00 AM to 10:59 AM | 0 (0.0%) | 0 (0.0%) |
| 11:00 AM to 11:59 AM | 1 (1.0%) | 3 (4.5%) |
| 12:00 PM to 3:59 PM | 5 (4.9%) | 2 (3.0%) |
| 4:00 PM to 11:59 PM | 6 (5.8%) | 7 (10.6%) |
| Total | 103 (100.0%) | 66 (100.0%) |
Housing Occupancy in Schulter
Occupancy by Ownership in Schulter
Of the total 236 dwellings in Schulter, owner-occupied units account for 207 (87.7%), while renter-occupied units make up 29 (12.3%).
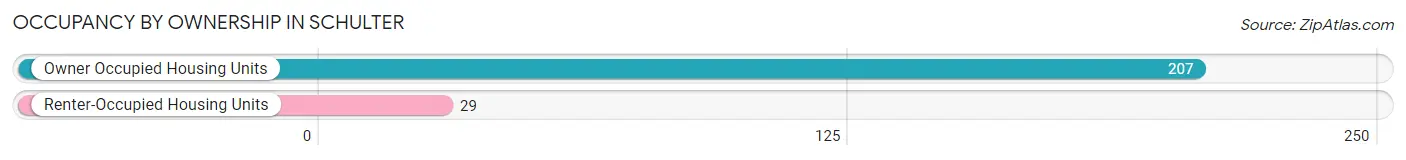
| Occupancy | # Housing Units | % Housing Units |
| Owner Occupied Housing Units | 207 | 87.7% |
| Renter-Occupied Housing Units | 29 | 12.3% |
| Total Occupied Housing Units | 236 | 100.0% |
Occupancy by Household Size in Schulter
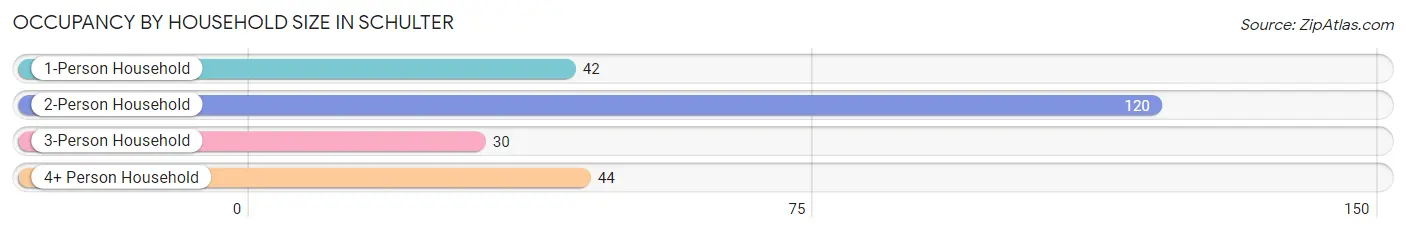
| Household Size | # Housing Units | % Housing Units |
| 1-Person Household | 42 | 17.8% |
| 2-Person Household | 120 | 50.8% |
| 3-Person Household | 30 | 12.7% |
| 4+ Person Household | 44 | 18.6% |
| Total Housing Units | 236 | 100.0% |
Occupancy by Ownership by Household Size in Schulter
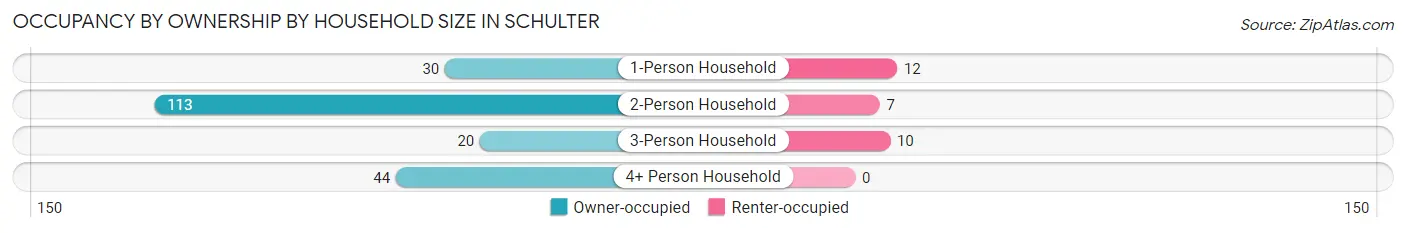
| Household Size | Owner-occupied | Renter-occupied |
| 1-Person Household | 30 (71.4%) | 12 (28.6%) |
| 2-Person Household | 113 (94.2%) | 7 (5.8%) |
| 3-Person Household | 20 (66.7%) | 10 (33.3%) |
| 4+ Person Household | 44 (100.0%) | 0 (0.0%) |
| Total Housing Units | 207 (87.7%) | 29 (12.3%) |
Occupancy by Educational Attainment in Schulter
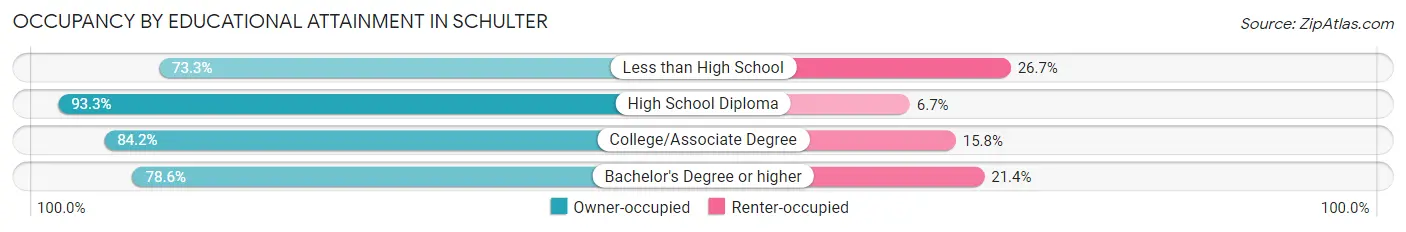
| Household Size | Owner-occupied | Renter-occupied |
| Less than High School | 22 (73.3%) | 8 (26.7%) |
| High School Diploma | 126 (93.3%) | 9 (6.7%) |
| College/Associate Degree | 48 (84.2%) | 9 (15.8%) |
| Bachelor's Degree or higher | 11 (78.6%) | 3 (21.4%) |
Occupancy by Age of Householder in Schulter
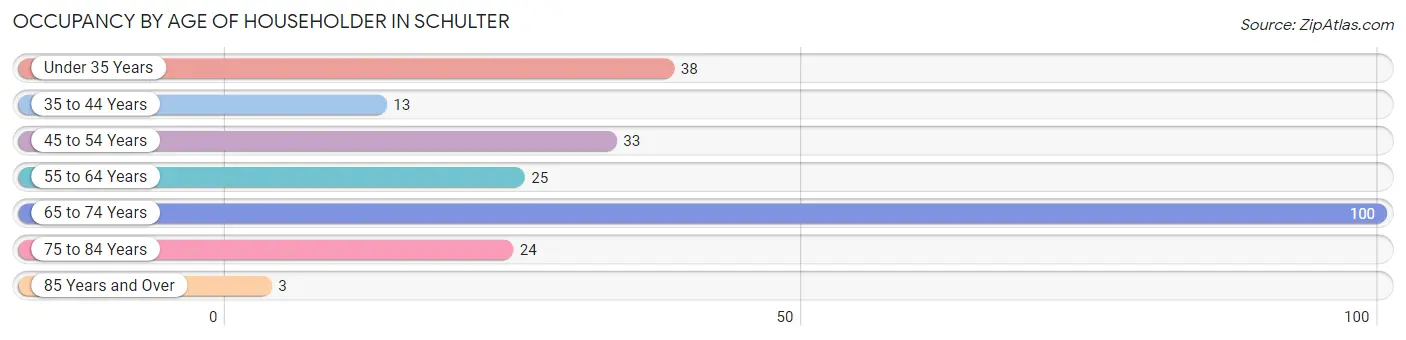
| Age Bracket | # Households | % Households |
| Under 35 Years | 38 | 16.1% |
| 35 to 44 Years | 13 | 5.5% |
| 45 to 54 Years | 33 | 14.0% |
| 55 to 64 Years | 25 | 10.6% |
| 65 to 74 Years | 100 | 42.4% |
| 75 to 84 Years | 24 | 10.2% |
| 85 Years and Over | 3 | 1.3% |
| Total | 236 | 100.0% |
Housing Finances in Schulter
Median Income by Occupancy in Schulter
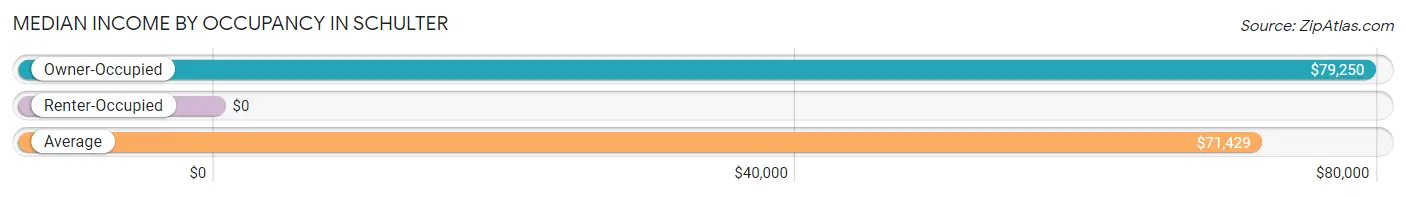
| Occupancy Type | # Households | Median Income |
| Owner-Occupied | 207 (87.7%) | $79,250 |
| Renter-Occupied | 29 (12.3%) | $0 |
| Average | 236 (100.0%) | $71,429 |
Occupancy by Householder Income Bracket in Schulter
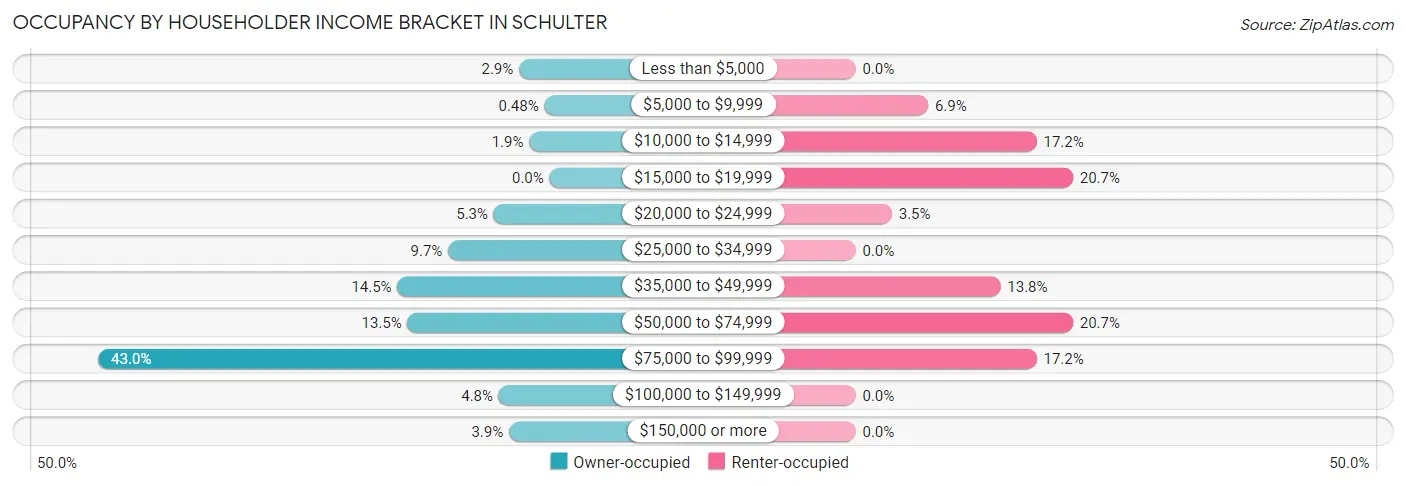
| Income Bracket | Owner-occupied | Renter-occupied |
| Less than $5,000 | 6 (2.9%) | 0 (0.0%) |
| $5,000 to $9,999 | 1 (0.5%) | 2 (6.9%) |
| $10,000 to $14,999 | 4 (1.9%) | 5 (17.2%) |
| $15,000 to $19,999 | 0 (0.0%) | 6 (20.7%) |
| $20,000 to $24,999 | 11 (5.3%) | 1 (3.5%) |
| $25,000 to $34,999 | 20 (9.7%) | 0 (0.0%) |
| $35,000 to $49,999 | 30 (14.5%) | 4 (13.8%) |
| $50,000 to $74,999 | 28 (13.5%) | 6 (20.7%) |
| $75,000 to $99,999 | 89 (43.0%) | 5 (17.2%) |
| $100,000 to $149,999 | 10 (4.8%) | 0 (0.0%) |
| $150,000 or more | 8 (3.9%) | 0 (0.0%) |
| Total | 207 (100.0%) | 29 (100.0%) |
Monthly Housing Cost Tiers in Schulter
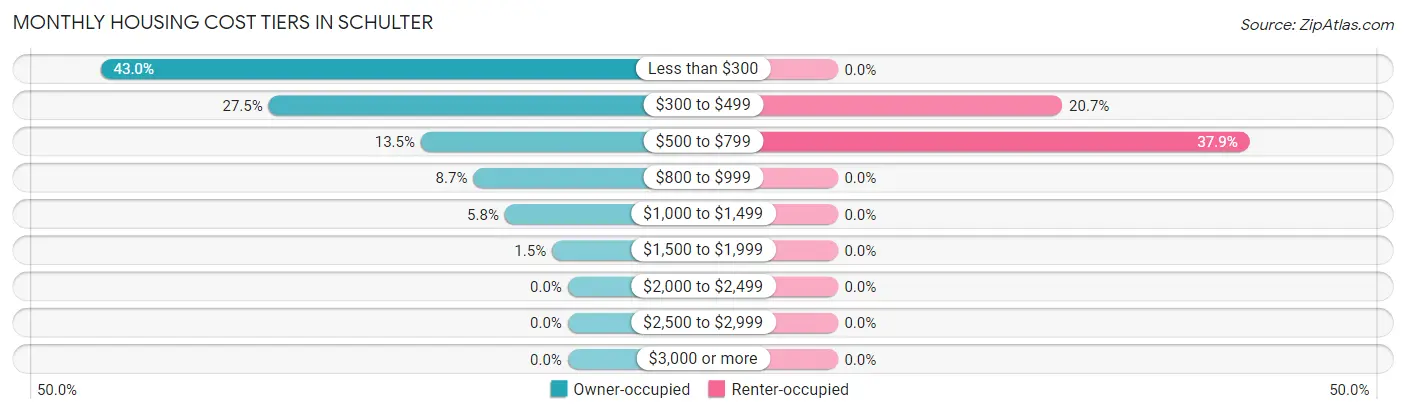
| Monthly Cost | Owner-occupied | Renter-occupied |
| Less than $300 | 89 (43.0%) | 0 (0.0%) |
| $300 to $499 | 57 (27.5%) | 6 (20.7%) |
| $500 to $799 | 28 (13.5%) | 11 (37.9%) |
| $800 to $999 | 18 (8.7%) | 0 (0.0%) |
| $1,000 to $1,499 | 12 (5.8%) | 0 (0.0%) |
| $1,500 to $1,999 | 3 (1.5%) | 0 (0.0%) |
| $2,000 to $2,499 | 0 (0.0%) | 0 (0.0%) |
| $2,500 to $2,999 | 0 (0.0%) | 0 (0.0%) |
| $3,000 or more | 0 (0.0%) | 0 (0.0%) |
| Total | 207 (100.0%) | 29 (100.0%) |
Physical Housing Characteristics in Schulter
Housing Structures in Schulter
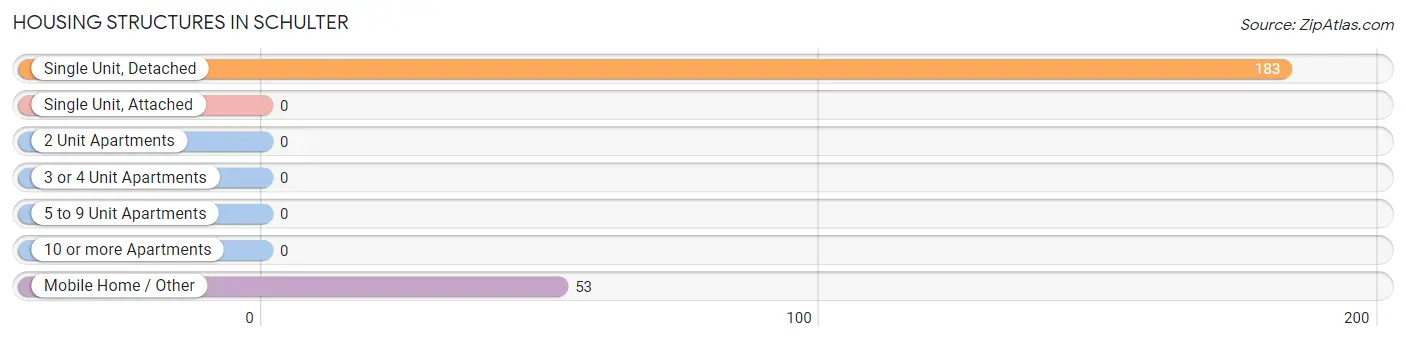
| Structure Type | # Housing Units | % Housing Units |
| Single Unit, Detached | 183 | 77.5% |
| Single Unit, Attached | 0 | 0.0% |
| 2 Unit Apartments | 0 | 0.0% |
| 3 or 4 Unit Apartments | 0 | 0.0% |
| 5 to 9 Unit Apartments | 0 | 0.0% |
| 10 or more Apartments | 0 | 0.0% |
| Mobile Home / Other | 53 | 22.5% |
| Total | 236 | 100.0% |
Housing Structures by Occupancy in Schulter
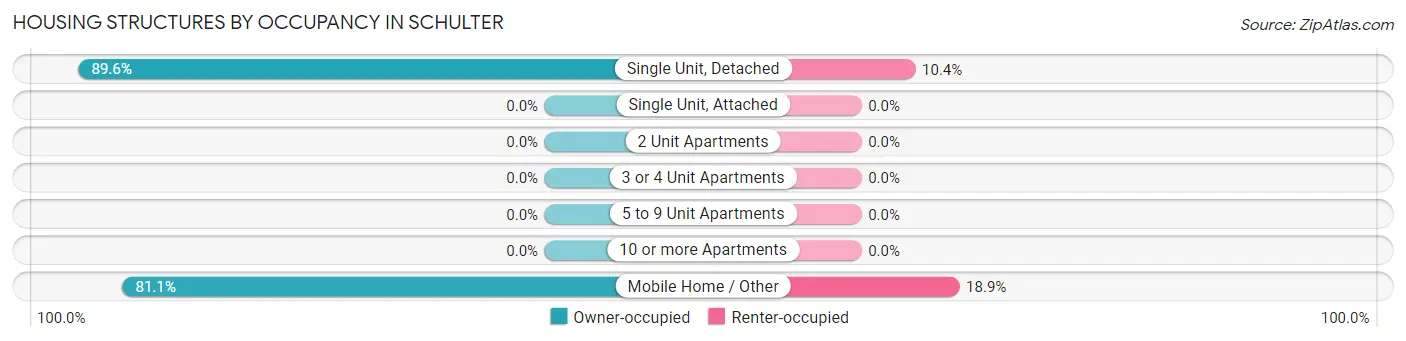
| Structure Type | Owner-occupied | Renter-occupied |
| Single Unit, Detached | 164 (89.6%) | 19 (10.4%) |
| Single Unit, Attached | 0 (0.0%) | 0 (0.0%) |
| 2 Unit Apartments | 0 (0.0%) | 0 (0.0%) |
| 3 or 4 Unit Apartments | 0 (0.0%) | 0 (0.0%) |
| 5 to 9 Unit Apartments | 0 (0.0%) | 0 (0.0%) |
| 10 or more Apartments | 0 (0.0%) | 0 (0.0%) |
| Mobile Home / Other | 43 (81.1%) | 10 (18.9%) |
| Total | 207 (87.7%) | 29 (12.3%) |
Housing Structures by Number of Rooms in Schulter
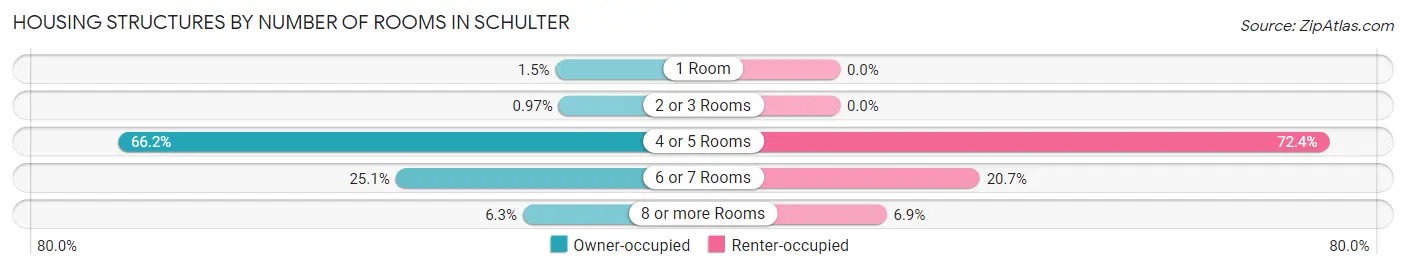
| Number of Rooms | Owner-occupied | Renter-occupied |
| 1 Room | 3 (1.5%) | 0 (0.0%) |
| 2 or 3 Rooms | 2 (1.0%) | 0 (0.0%) |
| 4 or 5 Rooms | 137 (66.2%) | 21 (72.4%) |
| 6 or 7 Rooms | 52 (25.1%) | 6 (20.7%) |
| 8 or more Rooms | 13 (6.3%) | 2 (6.9%) |
| Total | 207 (100.0%) | 29 (100.0%) |
Housing Structure by Heating Type in Schulter
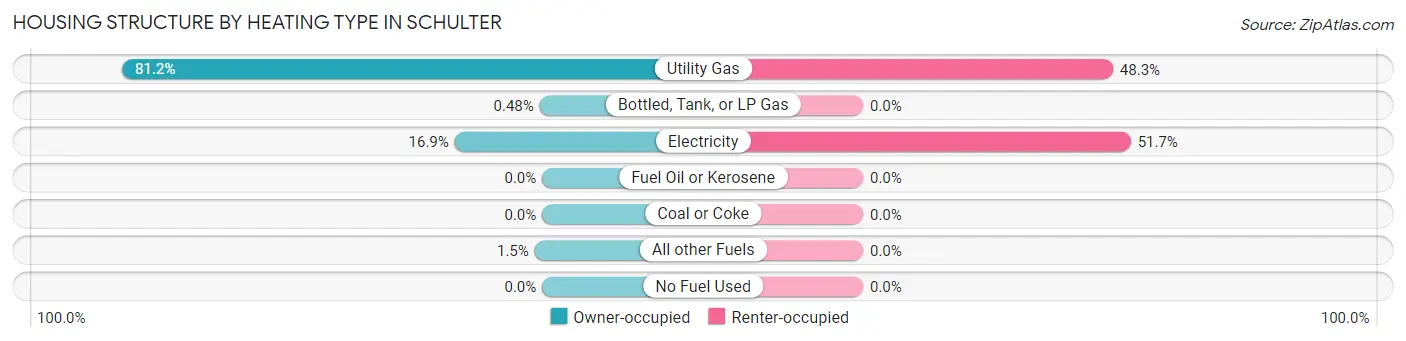
| Heating Type | Owner-occupied | Renter-occupied |
| Utility Gas | 168 (81.2%) | 14 (48.3%) |
| Bottled, Tank, or LP Gas | 1 (0.5%) | 0 (0.0%) |
| Electricity | 35 (16.9%) | 15 (51.7%) |
| Fuel Oil or Kerosene | 0 (0.0%) | 0 (0.0%) |
| Coal or Coke | 0 (0.0%) | 0 (0.0%) |
| All other Fuels | 3 (1.5%) | 0 (0.0%) |
| No Fuel Used | 0 (0.0%) | 0 (0.0%) |
| Total | 207 (100.0%) | 29 (100.0%) |
Household Vehicle Usage in Schulter
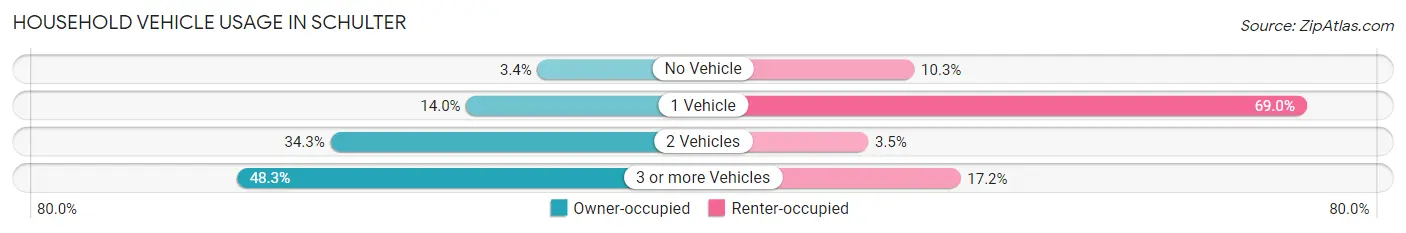
| Vehicles per Household | Owner-occupied | Renter-occupied |
| No Vehicle | 7 (3.4%) | 3 (10.3%) |
| 1 Vehicle | 29 (14.0%) | 20 (69.0%) |
| 2 Vehicles | 71 (34.3%) | 1 (3.5%) |
| 3 or more Vehicles | 100 (48.3%) | 5 (17.2%) |
| Total | 207 (100.0%) | 29 (100.0%) |
Real Estate & Mortgages in Schulter
Real Estate and Mortgage Overview in Schulter
| Characteristic | Without Mortgage | With Mortgage |
| Housing Units | 166 | 41 |
| Median Property Value | $25,000 | $81,300 |
| Median Household Income | $85,233 | $7 |
| Monthly Housing Costs | $267 | $0 |
| Real Estate Taxes | $459 | $0 |
Property Value by Mortgage Status in Schulter
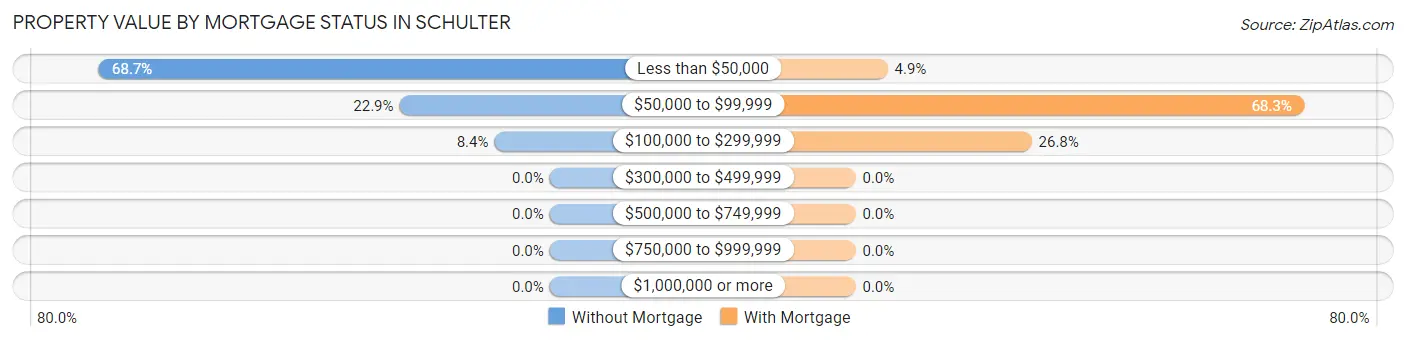
| Property Value | Without Mortgage | With Mortgage |
| Less than $50,000 | 114 (68.7%) | 2 (4.9%) |
| $50,000 to $99,999 | 38 (22.9%) | 28 (68.3%) |
| $100,000 to $299,999 | 14 (8.4%) | 11 (26.8%) |
| $300,000 to $499,999 | 0 (0.0%) | 0 (0.0%) |
| $500,000 to $749,999 | 0 (0.0%) | 0 (0.0%) |
| $750,000 to $999,999 | 0 (0.0%) | 0 (0.0%) |
| $1,000,000 or more | 0 (0.0%) | 0 (0.0%) |
| Total | 166 (100.0%) | 41 (100.0%) |
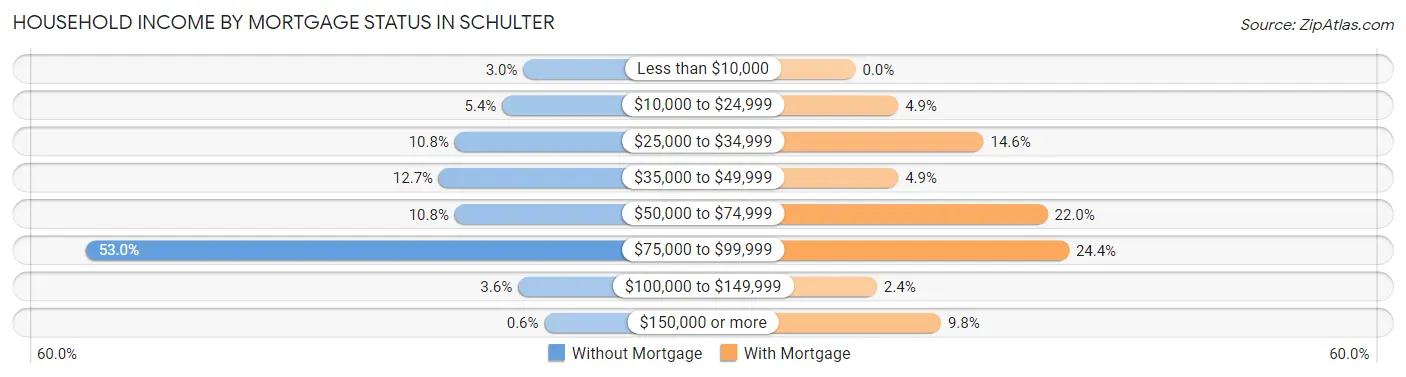
Household Income by Mortgage Status in Schulter
| Household Income | Without Mortgage | With Mortgage |
| Less than $10,000 | 5 (3.0%) | 0 (0.0%) |
| $10,000 to $24,999 | 9 (5.4%) | 2 (4.9%) |
| $25,000 to $34,999 | 18 (10.8%) | 6 (14.6%) |
| $35,000 to $49,999 | 21 (12.7%) | 2 (4.9%) |
| $50,000 to $74,999 | 18 (10.8%) | 9 (22.0%) |
| $75,000 to $99,999 | 88 (53.0%) | 10 (24.4%) |
| $100,000 to $149,999 | 6 (3.6%) | 1 (2.4%) |
| $150,000 or more | 1 (0.6%) | 4 (9.8%) |
| Total | 166 (100.0%) | 41 (100.0%) |
Property Value to Household Income Ratio in Schulter
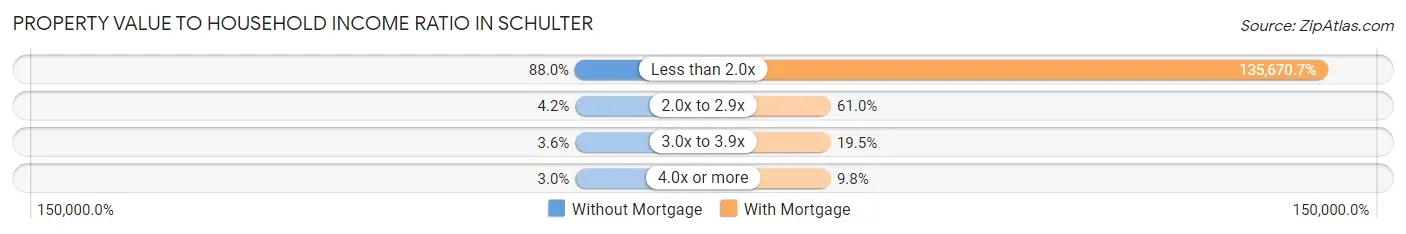
| Value-to-Income Ratio | Without Mortgage | With Mortgage |
| Less than 2.0x | 146 (87.9%) | 55,625 (135,670.7%) |
| 2.0x to 2.9x | 7 (4.2%) | 25 (61.0%) |
| 3.0x to 3.9x | 6 (3.6%) | 8 (19.5%) |
| 4.0x or more | 5 (3.0%) | 4 (9.8%) |
| Total | 166 (100.0%) | 41 (100.0%) |
Real Estate Taxes by Mortgage Status in Schulter
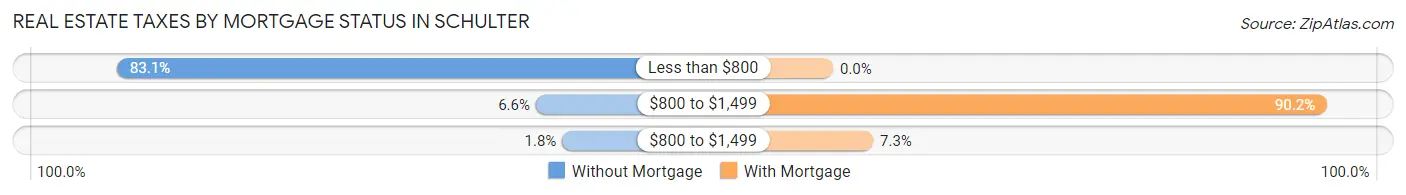
| Property Taxes | Without Mortgage | With Mortgage |
| Less than $800 | 138 (83.1%) | 0 (0.0%) |
| $800 to $1,499 | 11 (6.6%) | 37 (90.2%) |
| $800 to $1,499 | 3 (1.8%) | 3 (7.3%) |
| Total | 166 (100.0%) | 41 (100.0%) |
Health & Disability in Schulter
Health Insurance Coverage by Age in Schulter
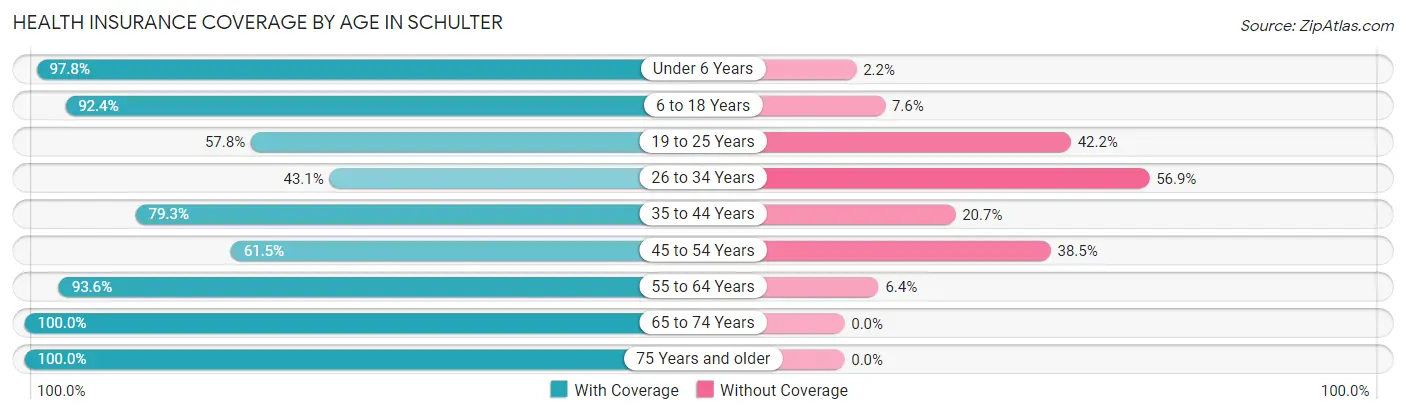
| Age Bracket | With Coverage | Without Coverage |
| Under 6 Years | 44 (97.8%) | 1 (2.2%) |
| 6 to 18 Years | 61 (92.4%) | 5 (7.6%) |
| 19 to 25 Years | 26 (57.8%) | 19 (42.2%) |
| 26 to 34 Years | 22 (43.1%) | 29 (56.9%) |
| 35 to 44 Years | 23 (79.3%) | 6 (20.7%) |
| 45 to 54 Years | 40 (61.5%) | 25 (38.5%) |
| 55 to 64 Years | 44 (93.6%) | 3 (6.4%) |
| 65 to 74 Years | 121 (100.0%) | 0 (0.0%) |
| 75 Years and older | 41 (100.0%) | 0 (0.0%) |
| Total | 422 (82.8%) | 88 (17.2%) |
Health Insurance Coverage by Citizenship Status in Schulter
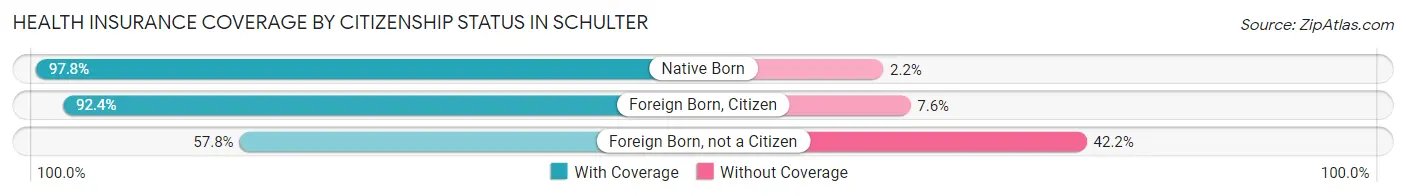
| Citizenship Status | With Coverage | Without Coverage |
| Native Born | 44 (97.8%) | 1 (2.2%) |
| Foreign Born, Citizen | 61 (92.4%) | 5 (7.6%) |
| Foreign Born, not a Citizen | 26 (57.8%) | 19 (42.2%) |
Health Insurance Coverage by Household Income in Schulter
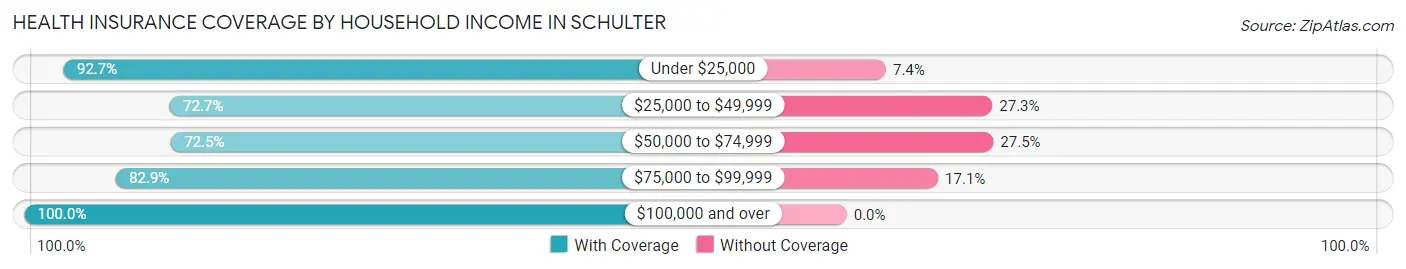
| Household Income | With Coverage | Without Coverage |
| Under $25,000 | 63 (92.6%) | 5 (7.3%) |
| $25,000 to $49,999 | 88 (72.7%) | 33 (27.3%) |
| $50,000 to $74,999 | 66 (72.5%) | 25 (27.5%) |
| $75,000 to $99,999 | 121 (82.9%) | 25 (17.1%) |
| $100,000 and over | 84 (100.0%) | 0 (0.0%) |
Public vs Private Health Insurance Coverage by Age in Schulter
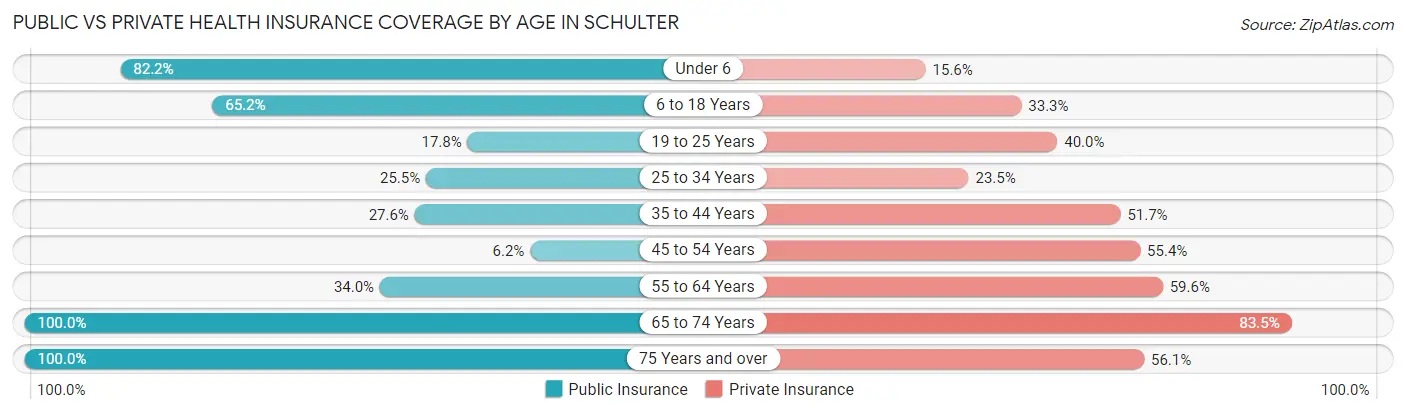
| Age Bracket | Public Insurance | Private Insurance |
| Under 6 | 37 (82.2%) | 7 (15.6%) |
| 6 to 18 Years | 43 (65.1%) | 22 (33.3%) |
| 19 to 25 Years | 8 (17.8%) | 18 (40.0%) |
| 25 to 34 Years | 13 (25.5%) | 12 (23.5%) |
| 35 to 44 Years | 8 (27.6%) | 15 (51.7%) |
| 45 to 54 Years | 4 (6.1%) | 36 (55.4%) |
| 55 to 64 Years | 16 (34.0%) | 28 (59.6%) |
| 65 to 74 Years | 121 (100.0%) | 101 (83.5%) |
| 75 Years and over | 41 (100.0%) | 23 (56.1%) |
| Total | 291 (57.1%) | 262 (51.4%) |
Disability Status by Sex by Age in Schulter
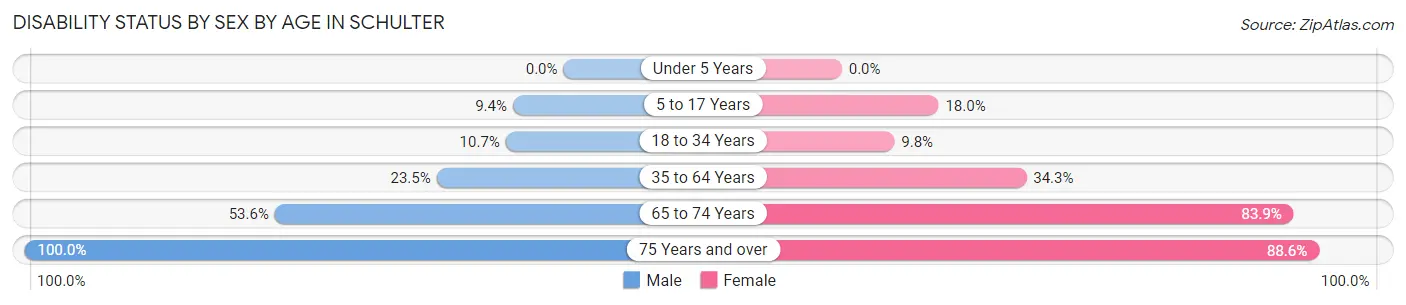
| Age Bracket | Male | Female |
| Under 5 Years | 0 (0.0%) | 0 (0.0%) |
| 5 to 17 Years | 3 (9.4%) | 7 (17.9%) |
| 18 to 34 Years | 6 (10.7%) | 4 (9.8%) |
| 35 to 64 Years | 16 (23.5%) | 25 (34.3%) |
| 65 to 74 Years | 15 (53.6%) | 78 (83.9%) |
| 75 Years and over | 6 (100.0%) | 31 (88.6%) |
Disability Class by Sex by Age in Schulter
Disability Class: Hearing Difficulty
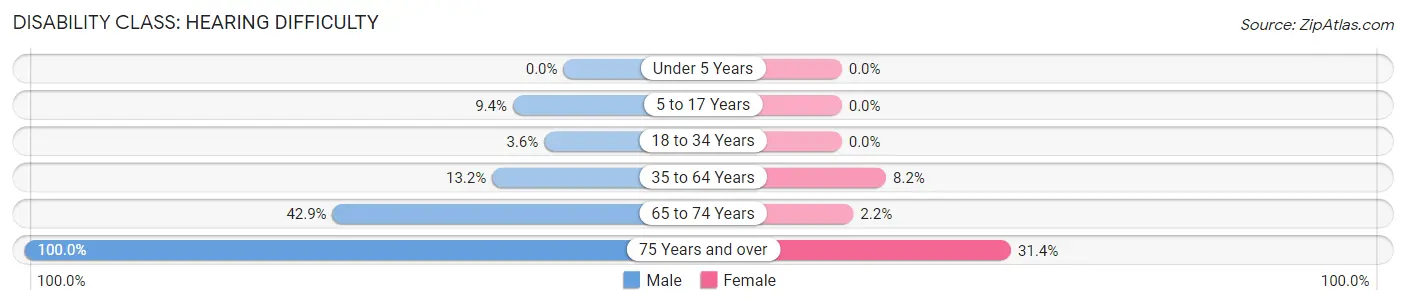
| Age Bracket | Male | Female |
| Under 5 Years | 0 (0.0%) | 0 (0.0%) |
| 5 to 17 Years | 3 (9.4%) | 0 (0.0%) |
| 18 to 34 Years | 2 (3.6%) | 0 (0.0%) |
| 35 to 64 Years | 9 (13.2%) | 6 (8.2%) |
| 65 to 74 Years | 12 (42.9%) | 2 (2.1%) |
| 75 Years and over | 6 (100.0%) | 11 (31.4%) |
Disability Class: Vision Difficulty
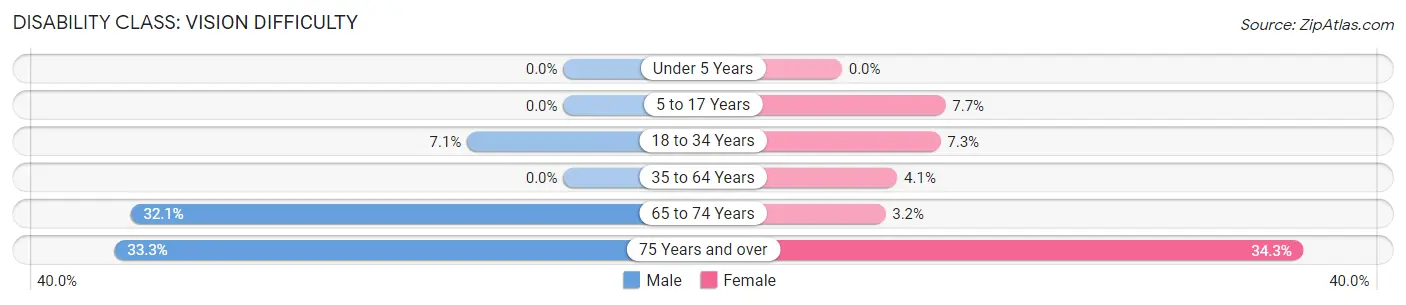
| Age Bracket | Male | Female |
| Under 5 Years | 0 (0.0%) | 0 (0.0%) |
| 5 to 17 Years | 0 (0.0%) | 3 (7.7%) |
| 18 to 34 Years | 4 (7.1%) | 3 (7.3%) |
| 35 to 64 Years | 0 (0.0%) | 3 (4.1%) |
| 65 to 74 Years | 9 (32.1%) | 3 (3.2%) |
| 75 Years and over | 2 (33.3%) | 12 (34.3%) |
Disability Class: Cognitive Difficulty
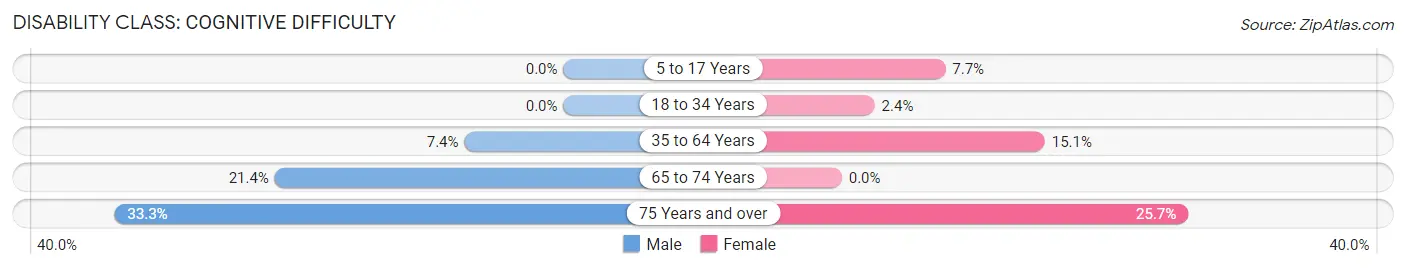
| Age Bracket | Male | Female |
| 5 to 17 Years | 0 (0.0%) | 3 (7.7%) |
| 18 to 34 Years | 0 (0.0%) | 1 (2.4%) |
| 35 to 64 Years | 5 (7.3%) | 11 (15.1%) |
| 65 to 74 Years | 6 (21.4%) | 0 (0.0%) |
| 75 Years and over | 2 (33.3%) | 9 (25.7%) |
Disability Class: Ambulatory Difficulty
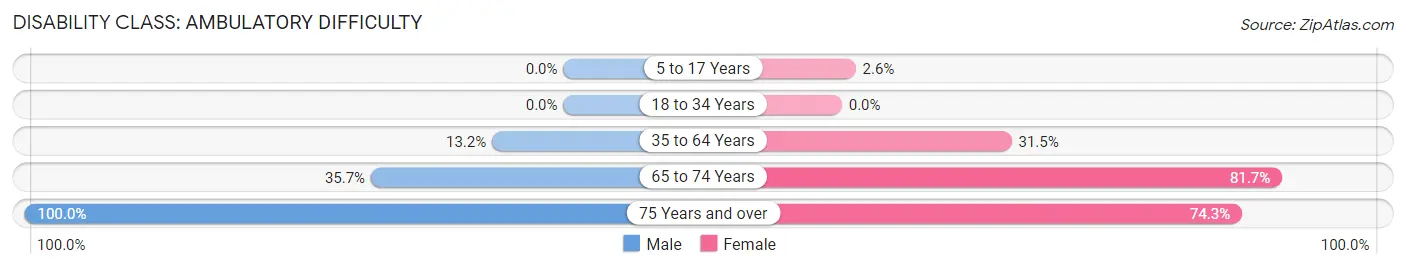
| Age Bracket | Male | Female |
| 5 to 17 Years | 0 (0.0%) | 1 (2.6%) |
| 18 to 34 Years | 0 (0.0%) | 0 (0.0%) |
| 35 to 64 Years | 9 (13.2%) | 23 (31.5%) |
| 65 to 74 Years | 10 (35.7%) | 76 (81.7%) |
| 75 Years and over | 6 (100.0%) | 26 (74.3%) |
Disability Class: Self-Care Difficulty
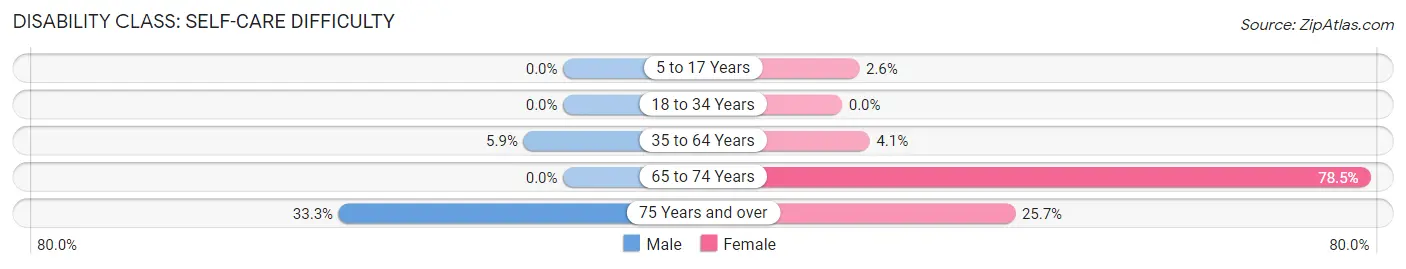
| Age Bracket | Male | Female |
| 5 to 17 Years | 0 (0.0%) | 1 (2.6%) |
| 18 to 34 Years | 0 (0.0%) | 0 (0.0%) |
| 35 to 64 Years | 4 (5.9%) | 3 (4.1%) |
| 65 to 74 Years | 0 (0.0%) | 73 (78.5%) |
| 75 Years and over | 2 (33.3%) | 9 (25.7%) |
Technology Access in Schulter
Computing Device Access in Schulter
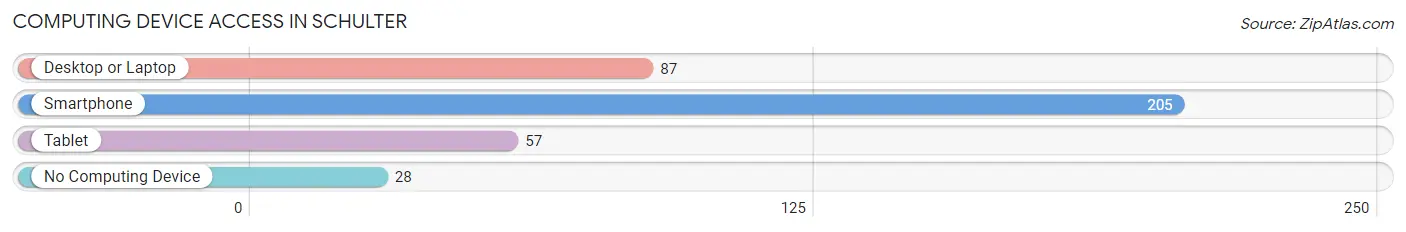
| Device Type | # Households | % Households |
| Desktop or Laptop | 87 | 36.9% |
| Smartphone | 205 | 86.9% |
| Tablet | 57 | 24.1% |
| No Computing Device | 28 | 11.9% |
| Total | 236 | 100.0% |
Internet Access in Schulter
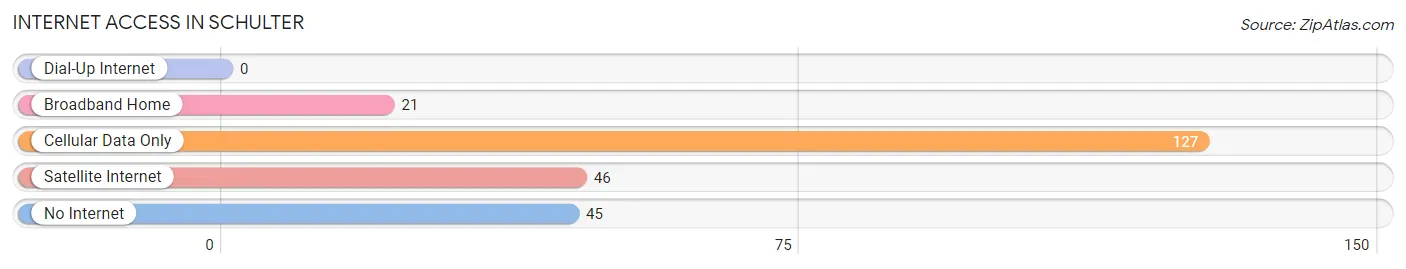
| Internet Type | # Households | % Households |
| Dial-Up Internet | 0 | 0.0% |
| Broadband Home | 21 | 8.9% |
| Cellular Data Only | 127 | 53.8% |
| Satellite Internet | 46 | 19.5% |
| No Internet | 45 | 19.1% |
| Total | 236 | 100.0% |
Schulter Summary
Schulter is a small town located in Oklahoma, United States. It is situated in the northeastern part of the state, in Okmulgee County. The town has a population of approximately 1,000 people, and is part of the Tulsa Metropolitan Statistical Area.
History
Schulter was founded in 1891 by German immigrants who had settled in the area. The town was named after the Schulter family, who were among the first settlers. The town was originally a farming community, and the Schulter family owned a large farm in the area.
In the early 1900s, the town began to grow and develop. The first school was built in 1906, and the first post office was established in 1907. The town also had a general store, a blacksmith shop, and a few other businesses.
In the 1920s, the town experienced a period of growth and prosperity. The population increased, and new businesses opened. The town also had a movie theater, a bank, and a hotel.
In the 1950s, the town began to decline. Many of the businesses closed, and the population decreased. The town was also affected by the Great Depression and World War II.
Geography
Schulter is located in northeastern Oklahoma, in Okmulgee County. The town is situated on the banks of the Arkansas River, and is surrounded by rolling hills and wooded areas. The town is located about 30 miles south of Tulsa, and about 50 miles east of Oklahoma City.
The climate in Schulter is generally mild, with hot summers and cold winters. The average annual temperature is around 60 degrees Fahrenheit. The town receives an average of 40 inches of precipitation per year.
Economy
The economy of Schulter is largely based on agriculture. The town is home to several farms, and the surrounding area is used for growing crops such as corn, wheat, and soybeans. The town also has a few small businesses, including a grocery store, a hardware store, and a few restaurants.
Demographics
As of the 2010 census, the population of Schulter was 1,000 people. The racial makeup of the town was 95.2% White, 0.7% African American, 0.3% Native American, 0.3% Asian, and 3.5% from other races. The median household income was $35,000, and the median age was 38 years.
Schulter is a small town with a rich history and a strong sense of community. The town is home to a diverse population, and offers a variety of activities and amenities. The town is a great place to live, work, and raise a family.
Common Questions
What is Per Capita Income in Schulter?
Per Capita income in Schulter is $27,594.
What is the Median Family Income in Schulter?
Median Family Income in Schulter is $85,107.
What is the Median Household income in Schulter?
Median Household Income in Schulter is $71,429.
What is Income or Wage Gap in Schulter?
Income or Wage Gap in Schulter is 41.7%.
Women in Schulter earn 58.3 cents for every dollar earned by a man.
What is Inequality or Gini Index in Schulter?
Inequality or Gini Index in Schulter is 0.30.
What is the Total Population of Schulter?
Total Population of Schulter is 510.
What is the Total Male Population of Schulter?
Total Male Population of Schulter is 213.
What is the Total Female Population of Schulter?
Total Female Population of Schulter is 297.
What is the Ratio of Males per 100 Females in Schulter?
There are 71.72 Males per 100 Females in Schulter.
What is the Ratio of Females per 100 Males in Schulter?
There are 139.44 Females per 100 Males in Schulter.
What is the Median Population Age in Schulter?
Median Population Age in Schulter is 47.8 Years.
What is the Average Family Size in Schulter
Average Family Size in Schulter is 2.4 People.
What is the Average Household Size in Schulter
Average Household Size in Schulter is 2.2 People.
How Large is the Labor Force in Schulter?
There are 184 People in the Labor Forcein in Schulter.
What is the Percentage of People in the Labor Force in Schulter?
44.1% of People are in the Labor Force in Schulter.
What is the Unemployment Rate in Schulter?
Unemployment Rate in Schulter is 2.7%.