Sayre, OK Map & Demographics
Sayre Map
Sayre Overview
$9,783
PER CAPITA INCOME
$59,028
AVG FAMILY INCOME
$45,859
AVG HOUSEHOLD INCOME
9.9%
WAGE / INCOME GAP [ % ]
90.1¢/ $1
WAGE / INCOME GAP [ $ ]
0.41
INEQUALITY / GINI INDEX
5,459
TOTAL POPULATION
4,230
MALE POPULATION
1,229
FEMALE POPULATION
344.18
MALES / 100 FEMALES
29.05
FEMALES / 100 MALES
37.4
MEDIAN AGE
3.2
AVG FAMILY SIZE
2.4
AVG HOUSEHOLD SIZE
974
LABOR FORCE [ PEOPLE ]
19.7%
PERCENT IN LABOR FORCE
12.3%
UNEMPLOYMENT RATE
Sayre Zip Codes
Sayre Area Codes
Income in Sayre
Income Overview in Sayre
Per Capita Income in Sayre is $9,783, while median incomes of families and households are $59,028 and $45,859 respectively.
| Characteristic | Number | Measure |
| Per Capita Income | 5,459 | $9,783 |
| Median Family Income | 535 | $59,028 |
| Mean Family Income | 535 | $62,933 |
| Median Household Income | 948 | $45,859 |
| Mean Household Income | 948 | $50,540 |
| Income Deficit | 535 | $0 |
| Wage / Income Gap (%) | 5,459 | 9.92% |
| Wage / Income Gap ($) | 5,459 | 90.08¢ per $1 |
| Gini / Inequality Index | 5,459 | 0.41 |
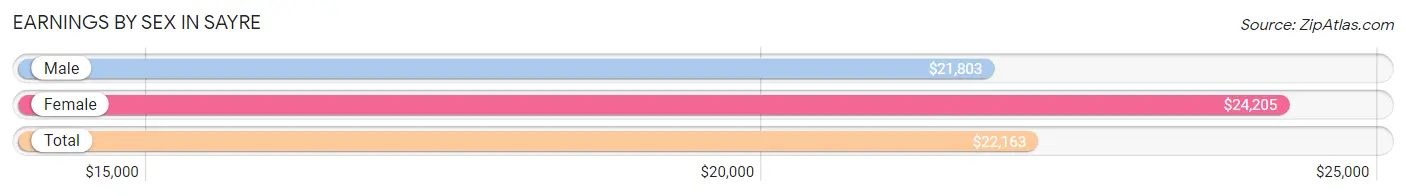
Earnings by Sex in Sayre
Average Earnings in Sayre are $22,163, $21,803 for men and $24,205 for women, a difference of 9.9%.
| Sex | Number | Average Earnings |
| Male | 705 (57.2%) | $21,803 |
| Female | 527 (42.8%) | $24,205 |
| Total | 1,232 (100.0%) | $22,163 |
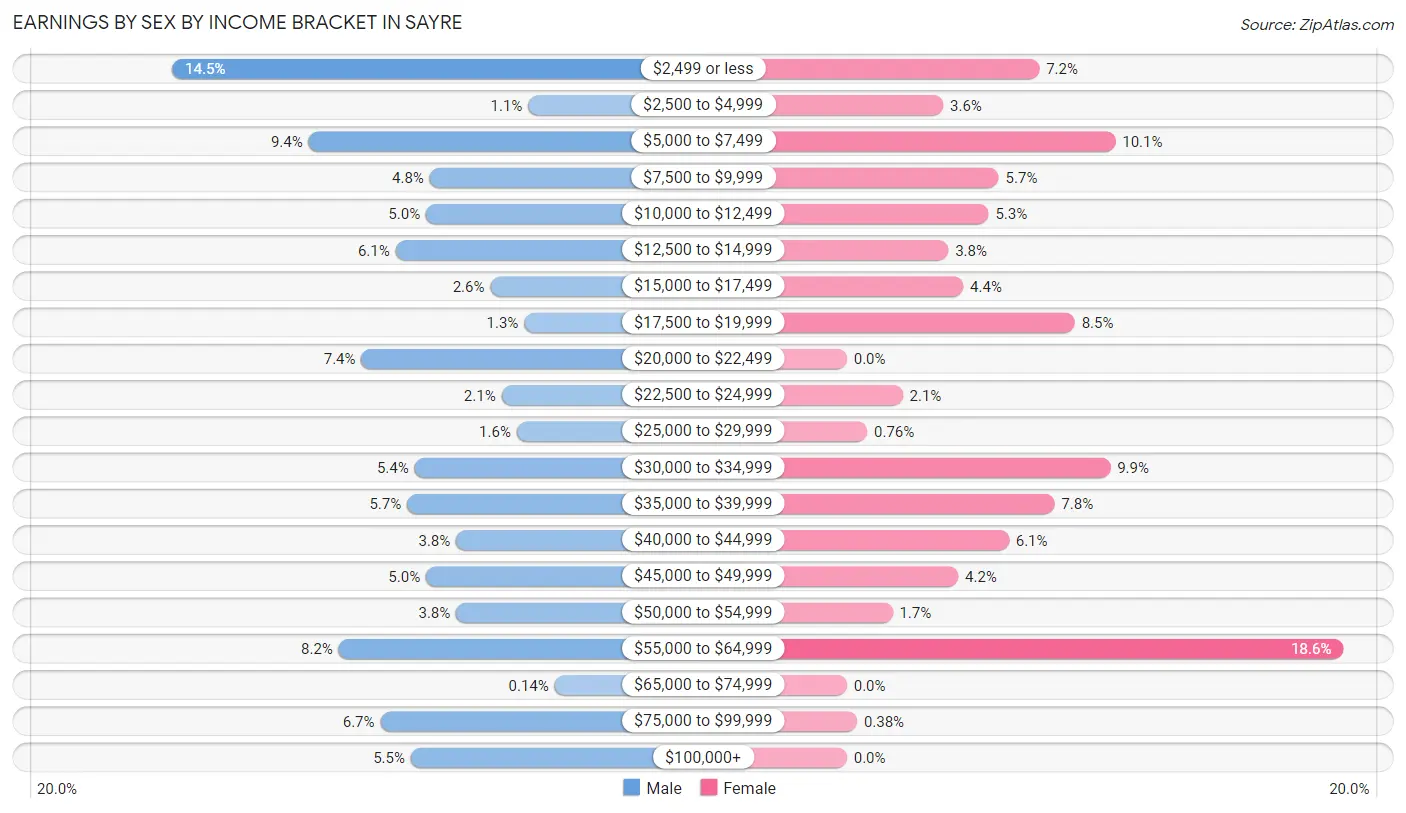
Earnings by Sex by Income Bracket in Sayre
The most common earnings brackets in Sayre are $2,499 or less for men (102 | 14.5%) and $55,000 to $64,999 for women (98 | 18.6%).
| Income | Male | Female |
| $2,499 or less | 102 (14.5%) | 38 (7.2%) |
| $2,500 to $4,999 | 8 (1.1%) | 19 (3.6%) |
| $5,000 to $7,499 | 66 (9.4%) | 53 (10.1%) |
| $7,500 to $9,999 | 34 (4.8%) | 30 (5.7%) |
| $10,000 to $12,499 | 35 (5.0%) | 28 (5.3%) |
| $12,500 to $14,999 | 43 (6.1%) | 20 (3.8%) |
| $15,000 to $17,499 | 18 (2.5%) | 23 (4.4%) |
| $17,500 to $19,999 | 9 (1.3%) | 45 (8.5%) |
| $20,000 to $22,499 | 52 (7.4%) | 0 (0.0%) |
| $22,500 to $24,999 | 15 (2.1%) | 11 (2.1%) |
| $25,000 to $29,999 | 11 (1.6%) | 4 (0.8%) |
| $30,000 to $34,999 | 38 (5.4%) | 52 (9.9%) |
| $35,000 to $39,999 | 40 (5.7%) | 41 (7.8%) |
| $40,000 to $44,999 | 27 (3.8%) | 32 (6.1%) |
| $45,000 to $49,999 | 35 (5.0%) | 22 (4.2%) |
| $50,000 to $54,999 | 27 (3.8%) | 9 (1.7%) |
| $55,000 to $64,999 | 58 (8.2%) | 98 (18.6%) |
| $65,000 to $74,999 | 1 (0.1%) | 0 (0.0%) |
| $75,000 to $99,999 | 47 (6.7%) | 2 (0.4%) |
| $100,000+ | 39 (5.5%) | 0 (0.0%) |
| Total | 705 (100.0%) | 527 (100.0%) |
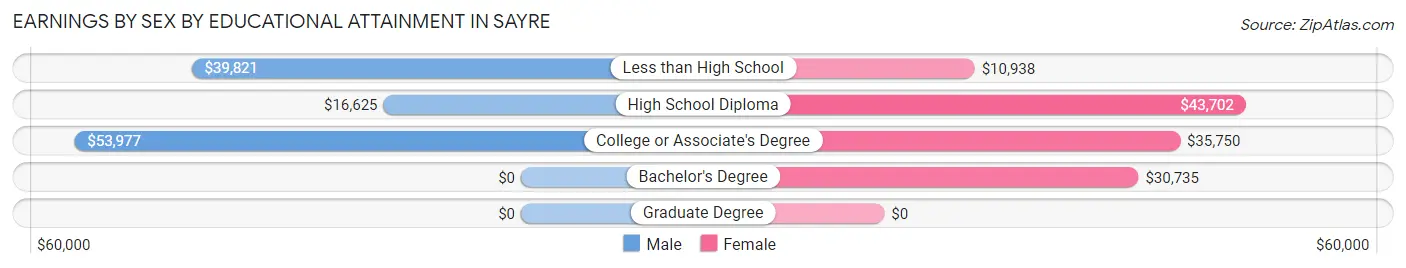
Earnings by Sex by Educational Attainment in Sayre
Average earnings in Sayre are $30,990 for men and $32,436 for women, a difference of 4.5%. Men with an educational attainment of college or associate's degree enjoy the highest average annual earnings of $53,977, while those with high school diploma education earn the least with $16,625. Women with an educational attainment of high school diploma earn the most with the average annual earnings of $43,702, while those with less than high school education have the smallest earnings of $10,938.
| Educational Attainment | Male Income | Female Income |
| Less than High School | $39,821 | $10,938 |
| High School Diploma | $16,625 | $43,702 |
| College or Associate's Degree | $53,977 | $35,750 |
| Bachelor's Degree | - | - |
| Graduate Degree | - | - |
| Total | $30,990 | $32,436 |
Family Income in Sayre
Family Income Brackets in Sayre
According to the Sayre family income data, there are 141 families falling into the $75,000 to $99,999 income range, which is the most common income bracket and makes up 26.4% of all families. Conversely, the $200,000+ income bracket is the least frequent group with only 7 families (1.3%) belonging to this category.
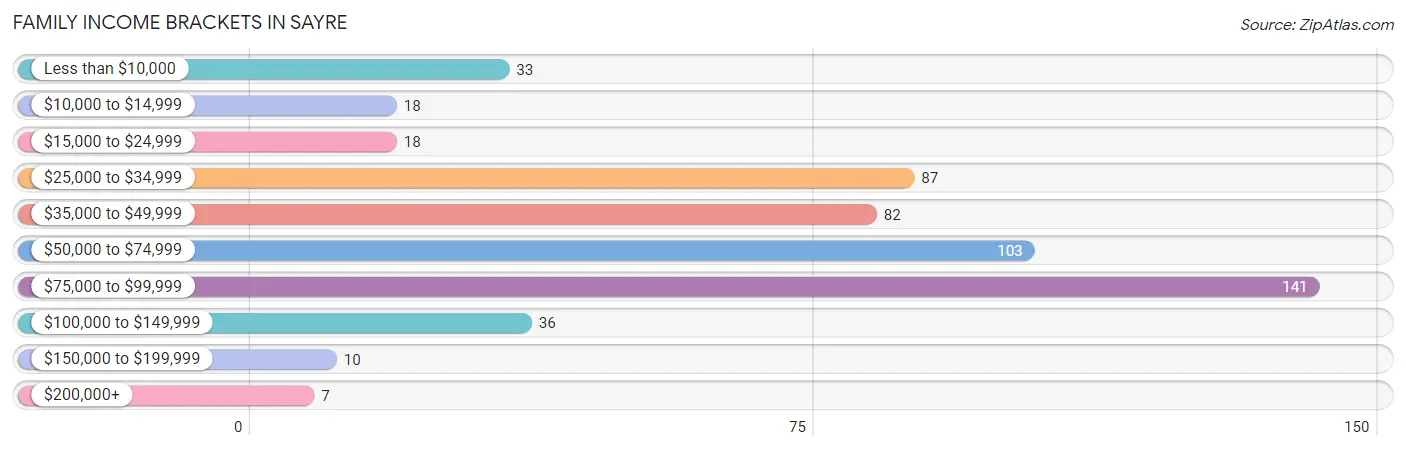
| Income Bracket | # Families | % Families |
| Less than $10,000 | 33 | 6.2% |
| $10,000 to $14,999 | 18 | 3.4% |
| $15,000 to $24,999 | 18 | 3.4% |
| $25,000 to $34,999 | 87 | 16.3% |
| $35,000 to $49,999 | 82 | 15.3% |
| $50,000 to $74,999 | 103 | 19.3% |
| $75,000 to $99,999 | 141 | 26.4% |
| $100,000 to $149,999 | 36 | 6.7% |
| $150,000 to $199,999 | 10 | 1.9% |
| $200,000+ | 7 | 1.3% |
Family Income by Famaliy Size in Sayre
4-person families (89 | 16.6%) account for the highest median family income in Sayre with $85,703 per family, while 2-person families (258 | 48.2%) have the highest median income of $24,432 per family member.
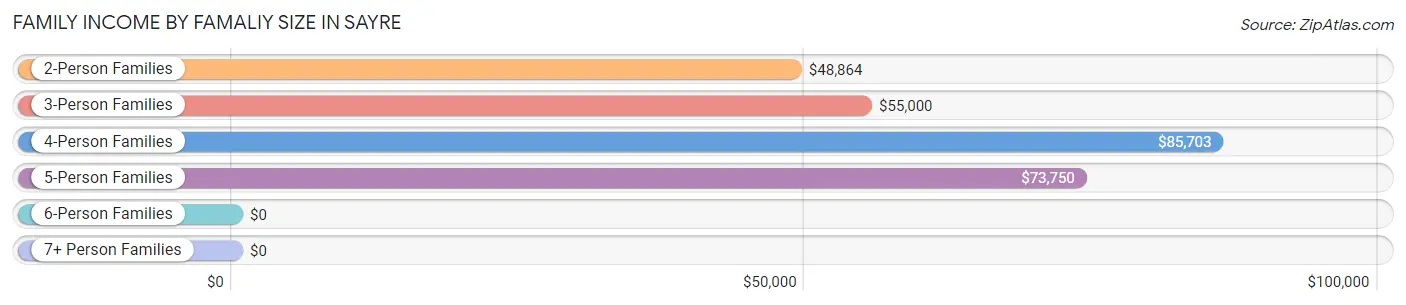
| Income Bracket | # Families | Median Income |
| 2-Person Families | 258 (48.2%) | $48,864 |
| 3-Person Families | 132 (24.7%) | $55,000 |
| 4-Person Families | 89 (16.6%) | $85,703 |
| 5-Person Families | 22 (4.1%) | $73,750 |
| 6-Person Families | 16 (3.0%) | $0 |
| 7+ Person Families | 18 (3.4%) | $0 |
| Total | 535 (100.0%) | $59,028 |
Family Income by Number of Earners in Sayre
The median family income in Sayre is $59,028, with families comprising 2 earners (195) having the highest median family income of $89,228, while families with no earners (89) have the lowest median family income of $28,850, accounting for 36.4% and 16.6% of families, respectively.
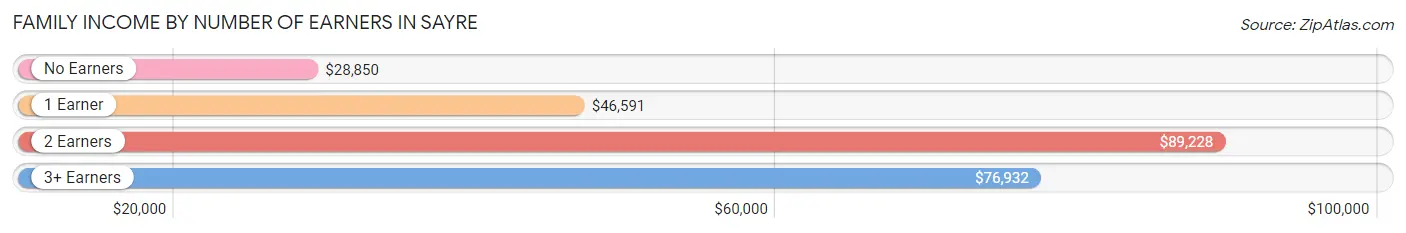
| Number of Earners | # Families | Median Income |
| No Earners | 89 (16.6%) | $28,850 |
| 1 Earner | 214 (40.0%) | $46,591 |
| 2 Earners | 195 (36.4%) | $89,228 |
| 3+ Earners | 37 (6.9%) | $76,932 |
| Total | 535 (100.0%) | $59,028 |
Household Income in Sayre
Household Income Brackets in Sayre
With 220 households falling in the category, the $50,000 to $74,999 income range is the most frequent in Sayre, accounting for 23.2% of all households. In contrast, only 7 households (0.7%) fall into the $200,000+ income bracket, making it the least populous group.
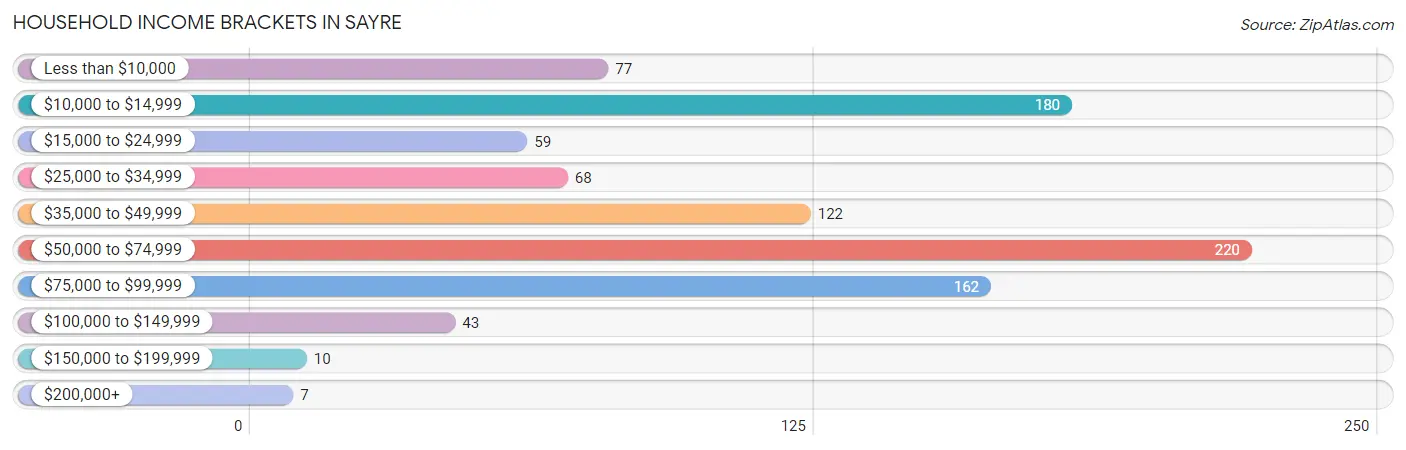
| Income Bracket | # Households | % Households |
| Less than $10,000 | 77 | 8.1% |
| $10,000 to $14,999 | 180 | 19.0% |
| $15,000 to $24,999 | 59 | 6.2% |
| $25,000 to $34,999 | 68 | 7.2% |
| $35,000 to $49,999 | 122 | 12.9% |
| $50,000 to $74,999 | 220 | 23.2% |
| $75,000 to $99,999 | 162 | 17.1% |
| $100,000 to $149,999 | 43 | 4.5% |
| $150,000 to $199,999 | 10 | 1.1% |
| $200,000+ | 7 | 0.7% |
Household Income by Householder Age in Sayre
The median household income in Sayre is $45,859, with the highest median household income of $61,424 found in the 25 to 44 years age bracket for the primary householder. A total of 274 households (28.9%) fall into this category. Meanwhile, the 15 to 24 years age bracket for the primary householder has the lowest median household income of $0, with 89 households (9.4%) in this group.
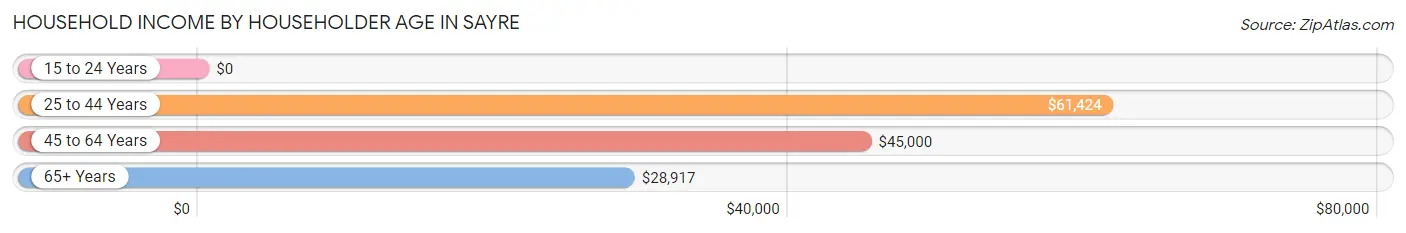
| Income Bracket | # Households | Median Income |
| 15 to 24 Years | 89 (9.4%) | $0 |
| 25 to 44 Years | 274 (28.9%) | $61,424 |
| 45 to 64 Years | 364 (38.4%) | $45,000 |
| 65+ Years | 221 (23.3%) | $28,917 |
| Total | 948 (100.0%) | $45,859 |
Poverty in Sayre
Income Below Poverty by Sex and Age in Sayre
With 31.1% poverty level for males and 27.8% for females among the residents of Sayre, 16 and 17 year old males and 12 to 14 year old females are the most vulnerable to poverty, with 21 males (63.6%) and 18 females (64.3%) in their respective age groups living below the poverty level.
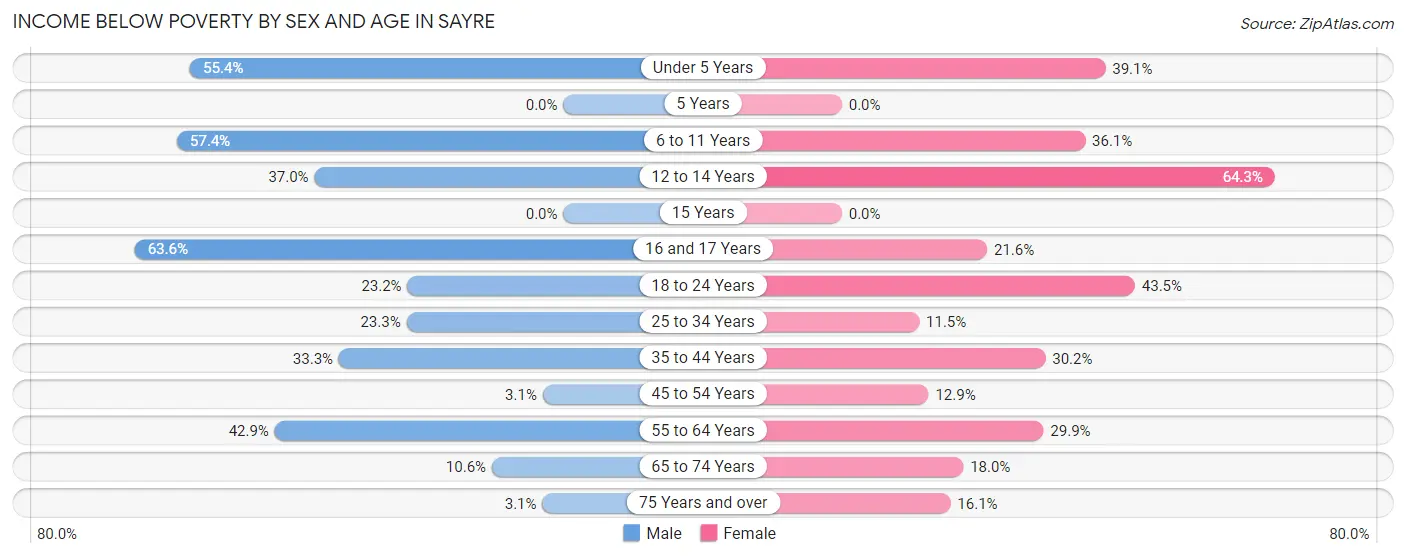
| Age Bracket | Male | Female |
| Under 5 Years | 41 (55.4%) | 36 (39.1%) |
| 5 Years | 0 (0.0%) | 0 (0.0%) |
| 6 to 11 Years | 35 (57.4%) | 43 (36.1%) |
| 12 to 14 Years | 34 (37.0%) | 18 (64.3%) |
| 15 Years | 0 (0.0%) | 0 (0.0%) |
| 16 and 17 Years | 21 (63.6%) | 11 (21.6%) |
| 18 to 24 Years | 47 (23.2%) | 47 (43.5%) |
| 25 to 34 Years | 17 (23.3%) | 7 (11.5%) |
| 35 to 44 Years | 47 (33.3%) | 68 (30.2%) |
| 45 to 54 Years | 3 (3.1%) | 13 (12.9%) |
| 55 to 64 Years | 75 (42.9%) | 53 (29.9%) |
| 65 to 74 Years | 7 (10.6%) | 22 (18.0%) |
| 75 Years and over | 1 (3.1%) | 10 (16.1%) |
| Total | 328 (31.1%) | 328 (27.8%) |
Income Above Poverty by Sex and Age in Sayre
According to the poverty statistics in Sayre, males aged 15 years and females aged 5 years are the age groups that are most secure financially, with 100.0% of males and 100.0% of females in these age groups living above the poverty line.
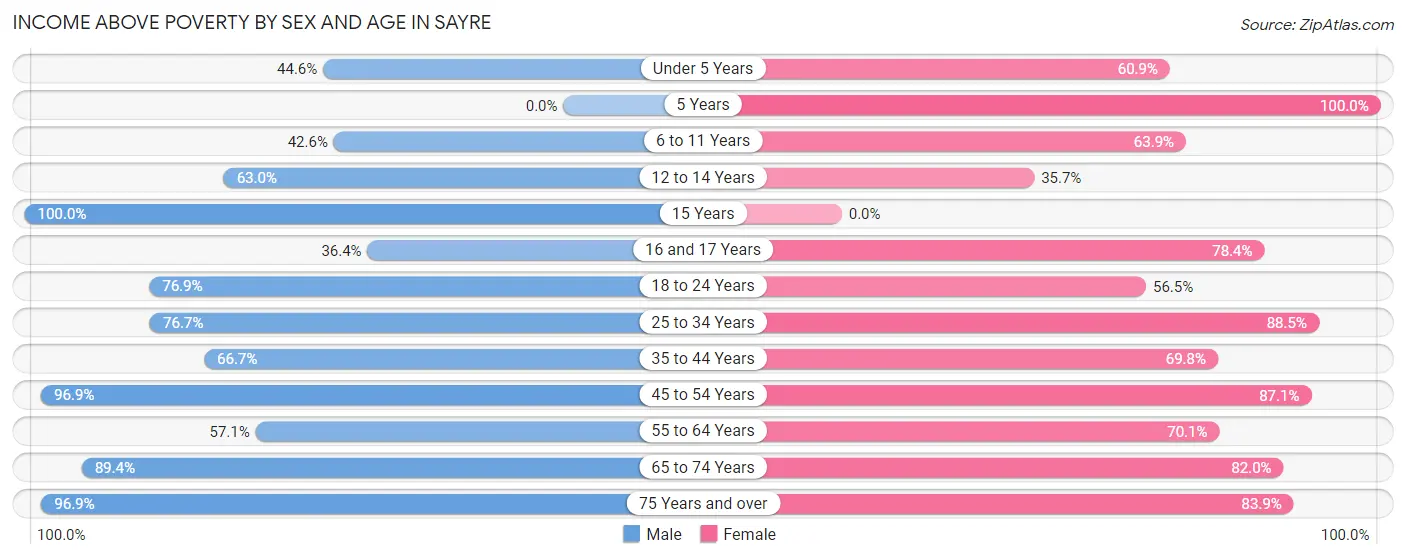
| Age Bracket | Male | Female |
| Under 5 Years | 33 (44.6%) | 56 (60.9%) |
| 5 Years | 0 (0.0%) | 35 (100.0%) |
| 6 to 11 Years | 26 (42.6%) | 76 (63.9%) |
| 12 to 14 Years | 58 (63.0%) | 10 (35.7%) |
| 15 Years | 7 (100.0%) | 0 (0.0%) |
| 16 and 17 Years | 12 (36.4%) | 40 (78.4%) |
| 18 to 24 Years | 156 (76.8%) | 61 (56.5%) |
| 25 to 34 Years | 56 (76.7%) | 54 (88.5%) |
| 35 to 44 Years | 94 (66.7%) | 157 (69.8%) |
| 45 to 54 Years | 95 (96.9%) | 88 (87.1%) |
| 55 to 64 Years | 100 (57.1%) | 124 (70.1%) |
| 65 to 74 Years | 59 (89.4%) | 100 (82.0%) |
| 75 Years and over | 31 (96.9%) | 52 (83.9%) |
| Total | 727 (68.9%) | 853 (72.2%) |
Income Below Poverty Among Married-Couple Families in Sayre
The poverty statistics for married-couple families in Sayre show that 5.1% or 18 of the total 355 families live below the poverty line. Families with 3 or 4 children have the highest poverty rate of 11.8%, comprising of 4 families. On the other hand, families with no children have the lowest poverty rate of 3.3%, which includes 7 families.
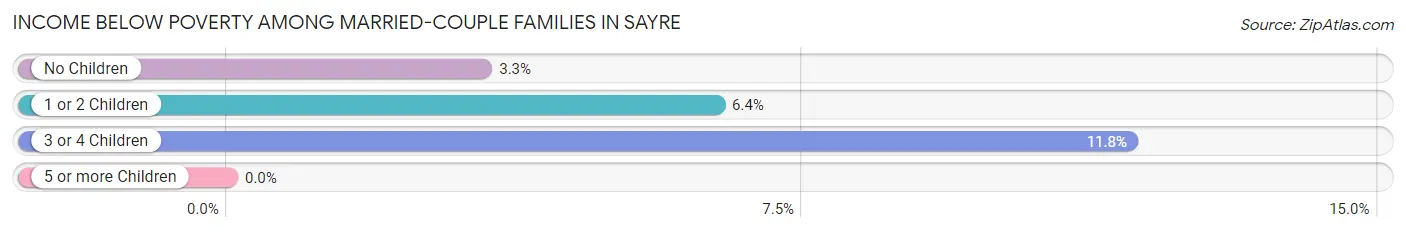
| Children | Above Poverty | Below Poverty |
| No Children | 204 (96.7%) | 7 (3.3%) |
| 1 or 2 Children | 103 (93.6%) | 7 (6.4%) |
| 3 or 4 Children | 30 (88.2%) | 4 (11.8%) |
| 5 or more Children | 0 (0.0%) | 0 (0.0%) |
| Total | 337 (94.9%) | 18 (5.1%) |
Income Below Poverty Among Single-Parent Households in Sayre
According to the poverty data in Sayre, 5.1% or 4 single-father households and 55.4% or 56 single-mother households are living below the poverty line. Among single-father households, those with 1 or 2 children have the highest poverty rate, with 4 households (26.7%) experiencing poverty. Likewise, among single-mother households, those with 3 or 4 children have the highest poverty rate, with 9 households (100.0%) falling below the poverty line.
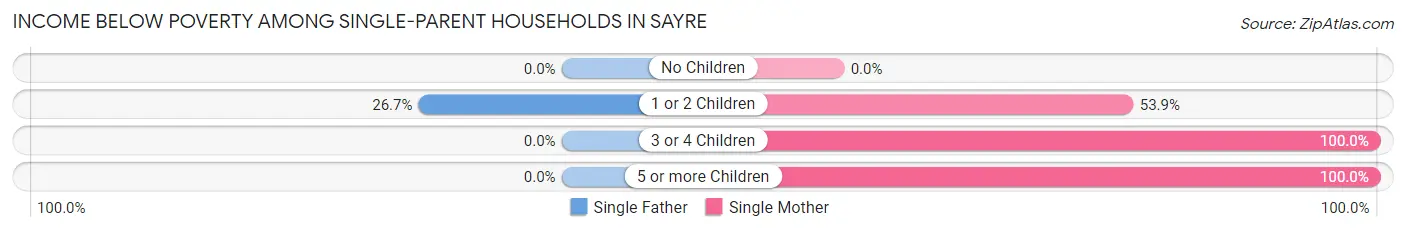
| Children | Single Father | Single Mother |
| No Children | 0 (0.0%) | 0 (0.0%) |
| 1 or 2 Children | 4 (26.7%) | 35 (53.8%) |
| 3 or 4 Children | 0 (0.0%) | 9 (100.0%) |
| 5 or more Children | 0 (0.0%) | 12 (100.0%) |
| Total | 4 (5.1%) | 56 (55.4%) |
Income Below Poverty Among Married-Couple vs Single-Parent Households in Sayre
The poverty data for Sayre shows that 18 of the married-couple family households (5.1%) and 60 of the single-parent households (33.3%) are living below the poverty level. Within the married-couple family households, those with 3 or 4 children have the highest poverty rate, with 4 households (11.8%) falling below the poverty line. Among the single-parent households, those with 3 or 4 children have the highest poverty rate, with 9 household (100.0%) living below poverty.
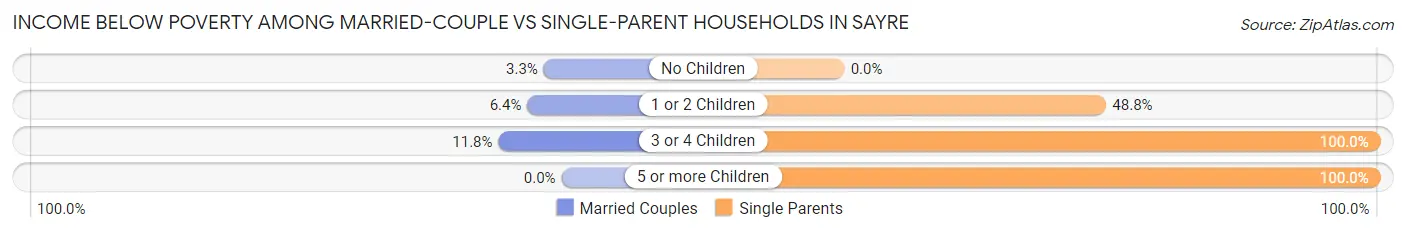
| Children | Married-Couple Families | Single-Parent Households |
| No Children | 7 (3.3%) | 0 (0.0%) |
| 1 or 2 Children | 7 (6.4%) | 39 (48.7%) |
| 3 or 4 Children | 4 (11.8%) | 9 (100.0%) |
| 5 or more Children | 0 (0.0%) | 12 (100.0%) |
| Total | 18 (5.1%) | 60 (33.3%) |
Race in Sayre
The most populous races in Sayre are White / Caucasian (3,282 | 60.1%), Black / African American (1,069 | 19.6%), and Hispanic or Latino (840 | 15.4%).
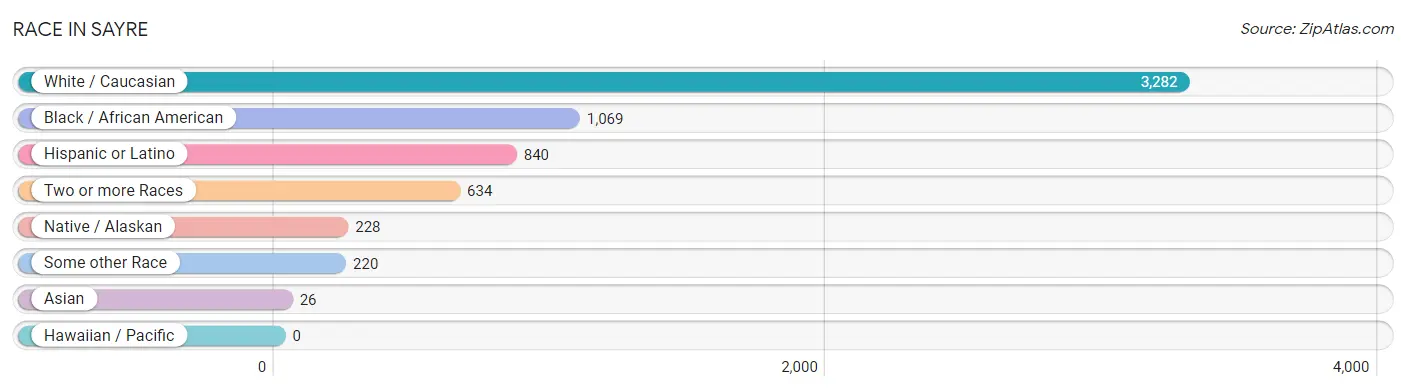
| Race | # Population | % Population |
| Asian | 26 | 0.5% |
| Black / African American | 1,069 | 19.6% |
| Hawaiian / Pacific | 0 | 0.0% |
| Hispanic or Latino | 840 | 15.4% |
| Native / Alaskan | 228 | 4.2% |
| White / Caucasian | 3,282 | 60.1% |
| Two or more Races | 634 | 11.6% |
| Some other Race | 220 | 4.0% |
| Total | 5,459 | 100.0% |
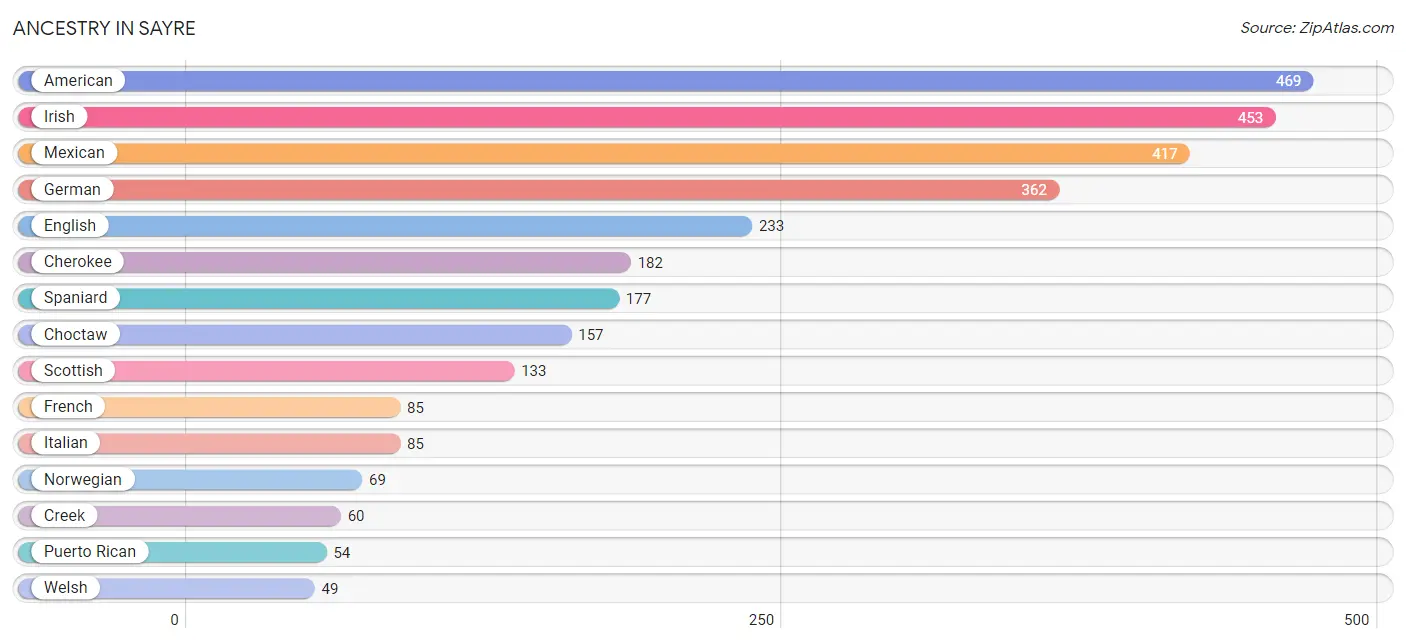
Ancestry in Sayre
The most populous ancestries reported in Sayre are American (469 | 8.6%), Irish (453 | 8.3%), Mexican (417 | 7.6%), German (362 | 6.6%), and English (233 | 4.3%), together accounting for 35.4% of all Sayre residents.
| Ancestry | # Population | % Population |
| African | 8 | 0.2% |
| American | 469 | 8.6% |
| Apache | 7 | 0.1% |
| Arab | 7 | 0.1% |
| Arapaho | 9 | 0.2% |
| Blackfeet | 17 | 0.3% |
| Burmese | 11 | 0.2% |
| Central American | 11 | 0.2% |
| Cherokee | 182 | 3.3% |
| Cheyenne | 4 | 0.1% |
| Chickasaw | 14 | 0.3% |
| Choctaw | 157 | 2.9% |
| Comanche | 7 | 0.1% |
| Cree | 8 | 0.2% |
| Creek | 60 | 1.1% |
| Croatian | 11 | 0.2% |
| Cuban | 15 | 0.3% |
| Danish | 3 | 0.1% |
| Dutch | 42 | 0.8% |
| Dutch West Indian | 36 | 0.7% |
| English | 233 | 4.3% |
| European | 23 | 0.4% |
| Finnish | 6 | 0.1% |
| French | 85 | 1.6% |
| French Canadian | 17 | 0.3% |
| German | 362 | 6.6% |
| Haitian | 19 | 0.4% |
| Indian (Asian) | 15 | 0.3% |
| Irish | 453 | 8.3% |
| Italian | 85 | 1.6% |
| Jamaican | 15 | 0.3% |
| Kiowa | 48 | 0.9% |
| Laotian | 20 | 0.4% |
| Lebanese | 7 | 0.1% |
| Mexican | 417 | 7.6% |
| Nigerian | 9 | 0.2% |
| Norwegian | 69 | 1.3% |
| Osage | 1 | 0.0% |
| Panamanian | 11 | 0.2% |
| Potawatomi | 18 | 0.3% |
| Puerto Rican | 54 | 1.0% |
| Romanian | 12 | 0.2% |
| Scandinavian | 8 | 0.2% |
| Scotch-Irish | 35 | 0.6% |
| Scottish | 133 | 2.4% |
| Seminole | 46 | 0.8% |
| South American | 17 | 0.3% |
| Spaniard | 177 | 3.2% |
| Spanish | 11 | 0.2% |
| Subsaharan African | 26 | 0.5% |
| Swedish | 14 | 0.3% |
| Venezuelan | 17 | 0.3% |
| Welsh | 49 | 0.9% | View All 53 Rows |
Immigrants in Sayre
The most numerous immigrant groups reported in Sayre came from Latin America (77 | 1.4%), Central America (62 | 1.1%), Mexico (62 | 1.1%), Caribbean (15 | 0.3%), and Jamaica (15 | 0.3%), together accounting for 4.2% of all Sayre residents.
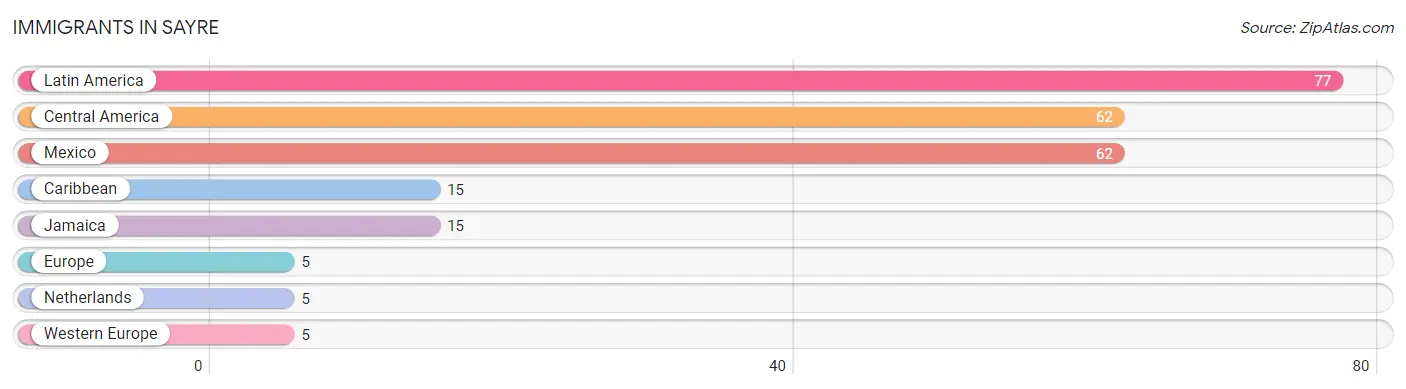
| Immigration Origin | # Population | % Population |
| Caribbean | 15 | 0.3% |
| Central America | 62 | 1.1% |
| Europe | 5 | 0.1% |
| Jamaica | 15 | 0.3% |
| Latin America | 77 | 1.4% |
| Mexico | 62 | 1.1% |
| Netherlands | 5 | 0.1% |
| Western Europe | 5 | 0.1% | View All 8 Rows |
Sex and Age in Sayre
Sex and Age in Sayre
The most populous age groups in Sayre are 25 to 29 Years (588 | 13.9%) for men and 35 to 39 Years (158 | 12.9%) for women.
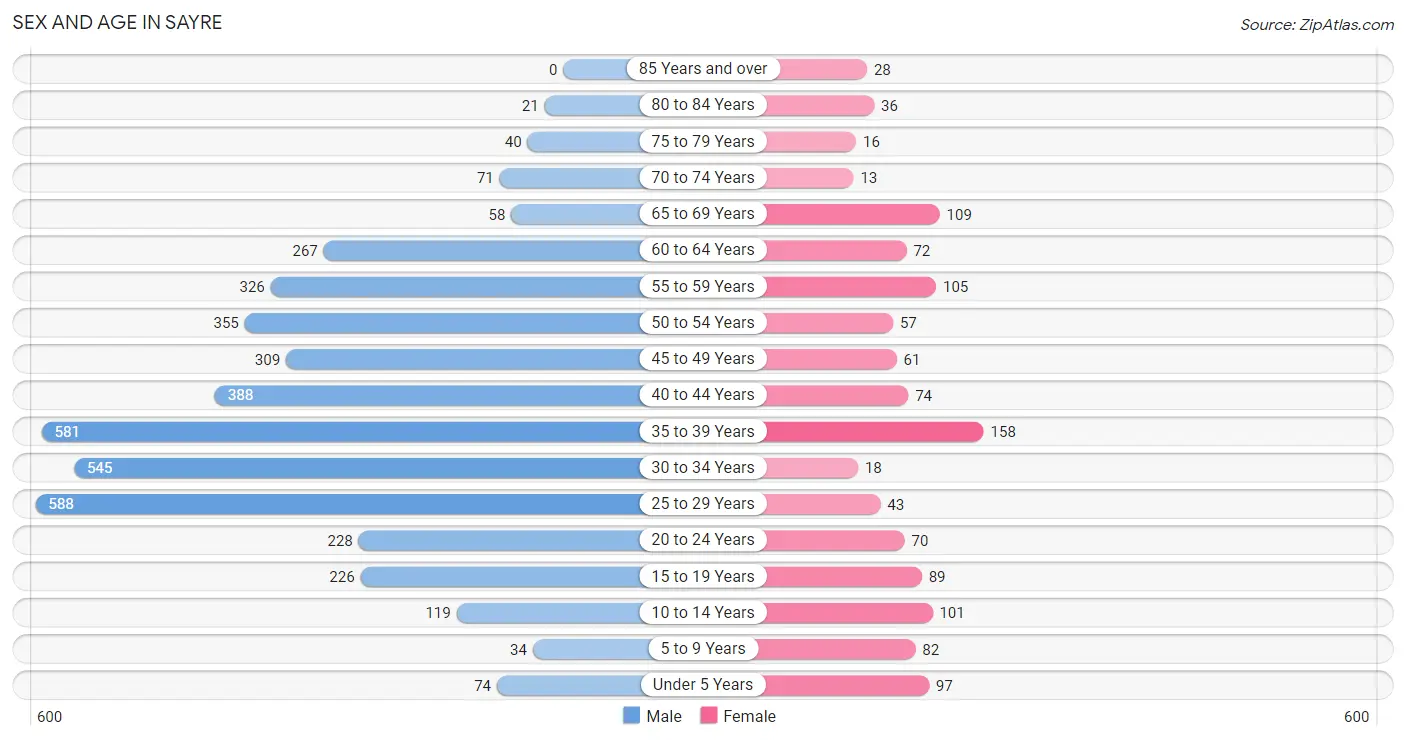
| Age Bracket | Male | Female |
| Under 5 Years | 74 (1.8%) | 97 (7.9%) |
| 5 to 9 Years | 34 (0.8%) | 82 (6.7%) |
| 10 to 14 Years | 119 (2.8%) | 101 (8.2%) |
| 15 to 19 Years | 226 (5.3%) | 89 (7.2%) |
| 20 to 24 Years | 228 (5.4%) | 70 (5.7%) |
| 25 to 29 Years | 588 (13.9%) | 43 (3.5%) |
| 30 to 34 Years | 545 (12.9%) | 18 (1.5%) |
| 35 to 39 Years | 581 (13.7%) | 158 (12.9%) |
| 40 to 44 Years | 388 (9.2%) | 74 (6.0%) |
| 45 to 49 Years | 309 (7.3%) | 61 (5.0%) |
| 50 to 54 Years | 355 (8.4%) | 57 (4.6%) |
| 55 to 59 Years | 326 (7.7%) | 105 (8.5%) |
| 60 to 64 Years | 267 (6.3%) | 72 (5.9%) |
| 65 to 69 Years | 58 (1.4%) | 109 (8.9%) |
| 70 to 74 Years | 71 (1.7%) | 13 (1.1%) |
| 75 to 79 Years | 40 (0.9%) | 16 (1.3%) |
| 80 to 84 Years | 21 (0.5%) | 36 (2.9%) |
| 85 Years and over | 0 (0.0%) | 28 (2.3%) |
| Total | 4,230 (100.0%) | 1,229 (100.0%) |
Families and Households in Sayre
Median Family Size in Sayre
The median family size in Sayre is 3.19 persons per family, with single female/mother families (101 | 18.9%) accounting for the largest median family size of 3.81 persons per family. On the other hand, single male/father families (79 | 14.8%) represent the smallest median family size with 2.63 persons per family.
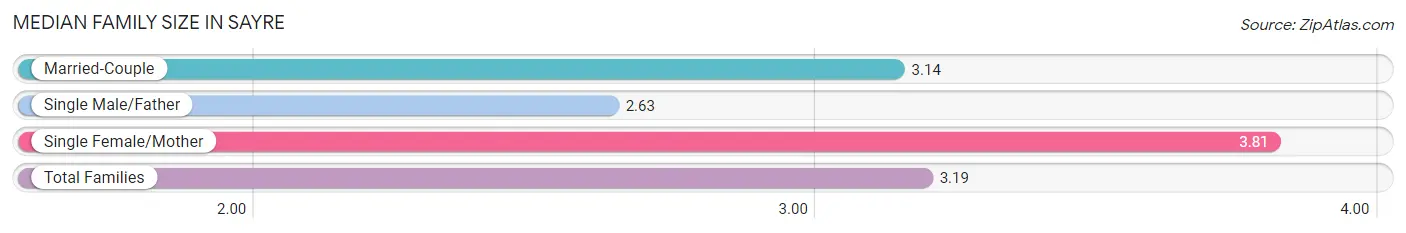
| Family Type | # Families | Family Size |
| Married-Couple | 355 (66.4%) | 3.14 |
| Single Male/Father | 79 (14.8%) | 2.63 |
| Single Female/Mother | 101 (18.9%) | 3.81 |
| Total Families | 535 (100.0%) | 3.19 |
Median Household Size in Sayre
The median household size in Sayre is 2.36 persons per household, with single female/mother households (101 | 10.6%) accounting for the largest median household size of 3.96 persons per household. non-family households (413 | 43.6%) represent the smallest median household size with 1.18 persons per household.
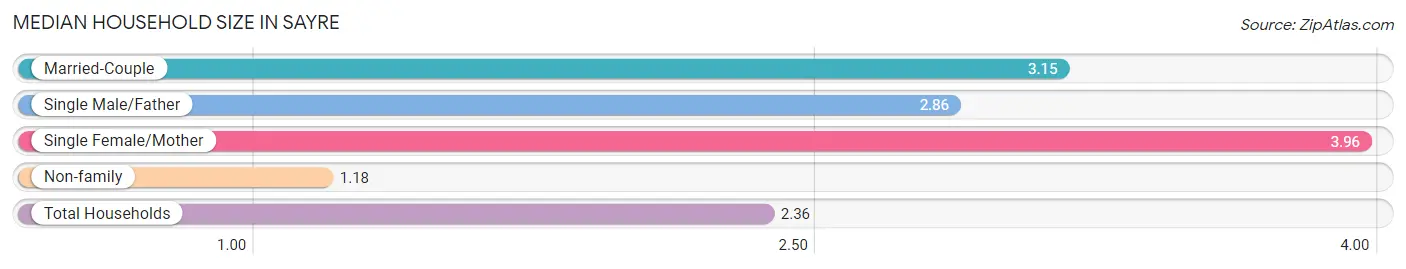
| Household Type | # Households | Household Size |
| Married-Couple | 355 (37.4%) | 3.15 |
| Single Male/Father | 79 (8.3%) | 2.86 |
| Single Female/Mother | 101 (10.6%) | 3.96 |
| Non-family | 413 (43.6%) | 1.18 |
| Total Households | 948 (100.0%) | 2.36 |
Household Size by Marriage Status in Sayre
Out of a total of 948 households in Sayre, 535 (56.4%) are family households, while 413 (43.6%) are nonfamily households. The most numerous type of family households are 2-person households, comprising 227, and the most common type of nonfamily households are 1-person households, comprising 391.
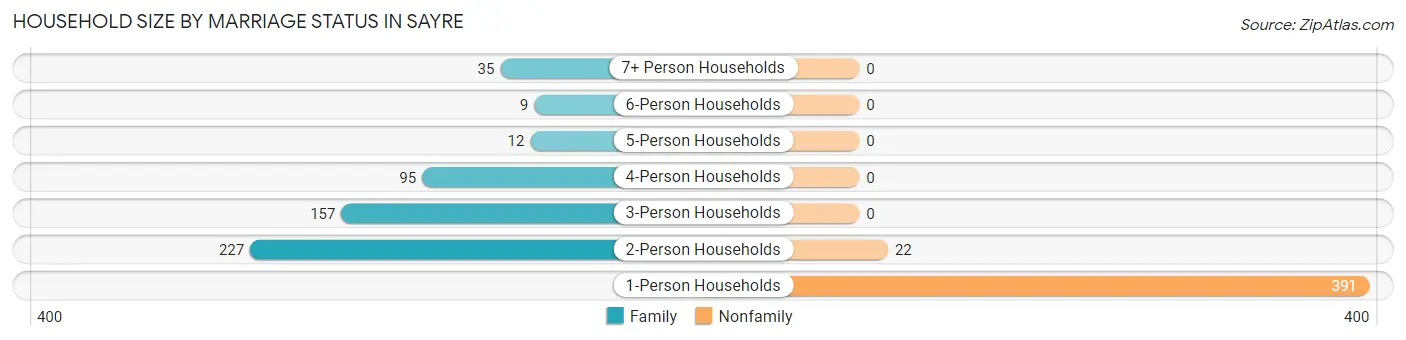
| Household Size | Family Households | Nonfamily Households |
| 1-Person Households | - | 391 (41.2%) |
| 2-Person Households | 227 (23.9%) | 22 (2.3%) |
| 3-Person Households | 157 (16.6%) | 0 (0.0%) |
| 4-Person Households | 95 (10.0%) | 0 (0.0%) |
| 5-Person Households | 12 (1.3%) | 0 (0.0%) |
| 6-Person Households | 9 (0.9%) | 0 (0.0%) |
| 7+ Person Households | 35 (3.7%) | 0 (0.0%) |
| Total | 535 (56.4%) | 413 (43.6%) |
Female Fertility in Sayre
Fertility by Age in Sayre
Average fertility rate in Sayre is 90.0 births per 1,000 women. Women in the age bracket of 20 to 34 years have the highest fertility rate with 198.0 births per 1,000 women. Women in the age bracket of 20 to 34 years acount for 55.3% of all women with births.
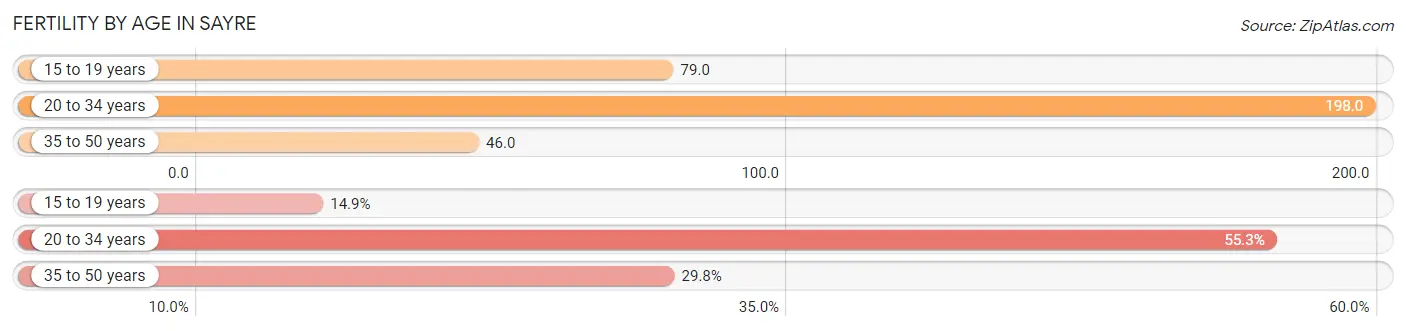
| Age Bracket | Women with Births | Births / 1,000 Women |
| 15 to 19 years | 7 (14.9%) | 79.0 |
| 20 to 34 years | 26 (55.3%) | 198.0 |
| 35 to 50 years | 14 (29.8%) | 46.0 |
| Total | 47 (100.0%) | 90.0 |
Fertility by Age by Marriage Status in Sayre
51.1% of women with births (47) in Sayre are married. The highest percentage of unmarried women with births falls into 35 to 50 years age bracket with 100.0% of them unmarried at the time of birth, while the lowest percentage of unmarried women with births belong to 15 to 19 years age bracket with 0.0% of them unmarried.
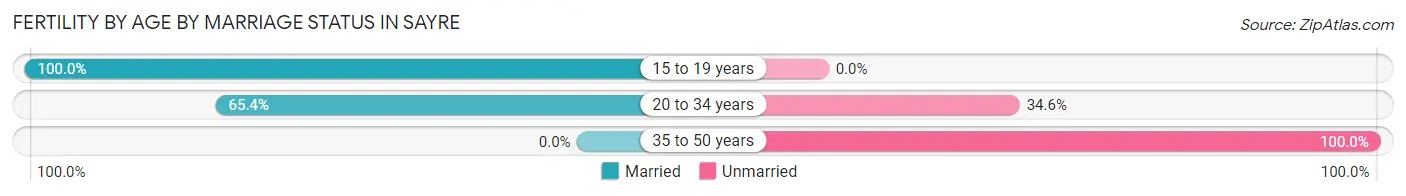
| Age Bracket | Married | Unmarried |
| 15 to 19 years | 7 (100.0%) | 0 (0.0%) |
| 20 to 34 years | 17 (65.4%) | 9 (34.6%) |
| 35 to 50 years | 0 (0.0%) | 14 (100.0%) |
| Total | 24 (51.1%) | 23 (48.9%) |
Fertility by Education in Sayre
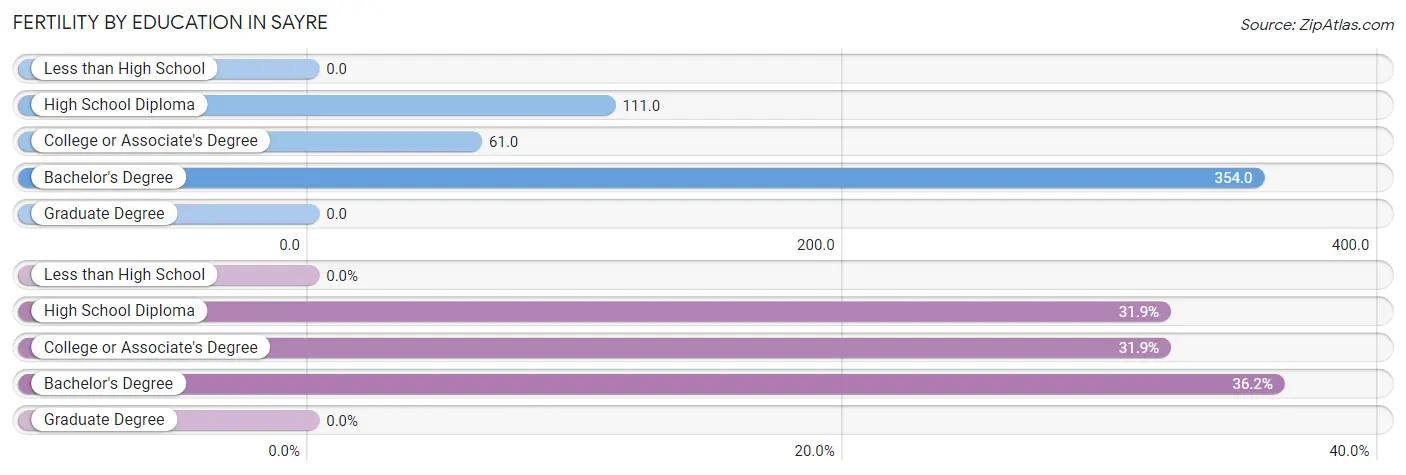
| Educational Attainment | Women with Births | Births / 1,000 Women |
| Less than High School | 0 (0.0%) | 0.0 |
| High School Diploma | 15 (31.9%) | 111.0 |
| College or Associate's Degree | 15 (31.9%) | 61.0 |
| Bachelor's Degree | 17 (36.2%) | 354.0 |
| Graduate Degree | 0 (0.0%) | 0.0 |
| Total | 47 (100.0%) | 90.0 |
Fertility by Education by Marriage Status in Sayre
48.9% of women with births in Sayre are unmarried. Women with the educational attainment of bachelor's degree are most likely to be married with 100.0% of them married at childbirth, while women with the educational attainment of college or associate's degree are least likely to be married with 100.0% of them unmarried at childbirth.
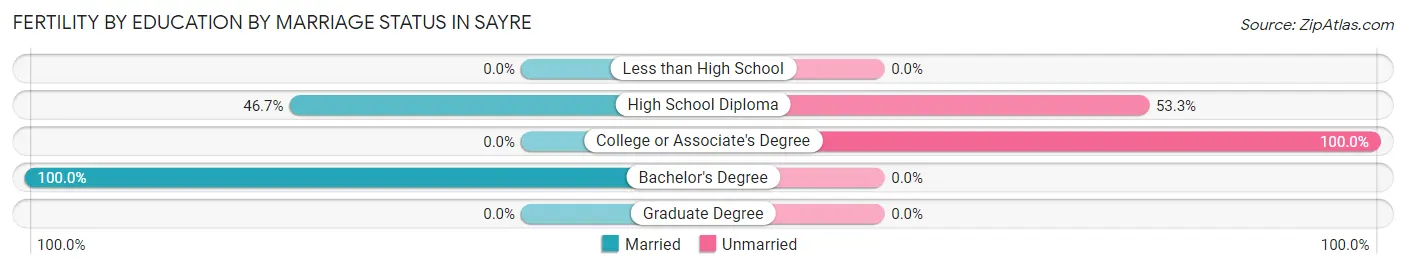
| Educational Attainment | Married | Unmarried |
| Less than High School | 0 (0.0%) | 0 (0.0%) |
| High School Diploma | 7 (46.7%) | 8 (53.3%) |
| College or Associate's Degree | 0 (0.0%) | 15 (100.0%) |
| Bachelor's Degree | 17 (100.0%) | 0 (0.0%) |
| Graduate Degree | 0 (0.0%) | 0 (0.0%) |
| Total | 24 (51.1%) | 23 (48.9%) |
Employment Characteristics in Sayre
Employment by Class of Employer in Sayre
Among the 789 employed individuals in Sayre, private company employees (541 | 68.6%), local government employees (97 | 12.3%), and self-employed (not incorporated) (41 | 5.2%) make up the most common classes of employment.
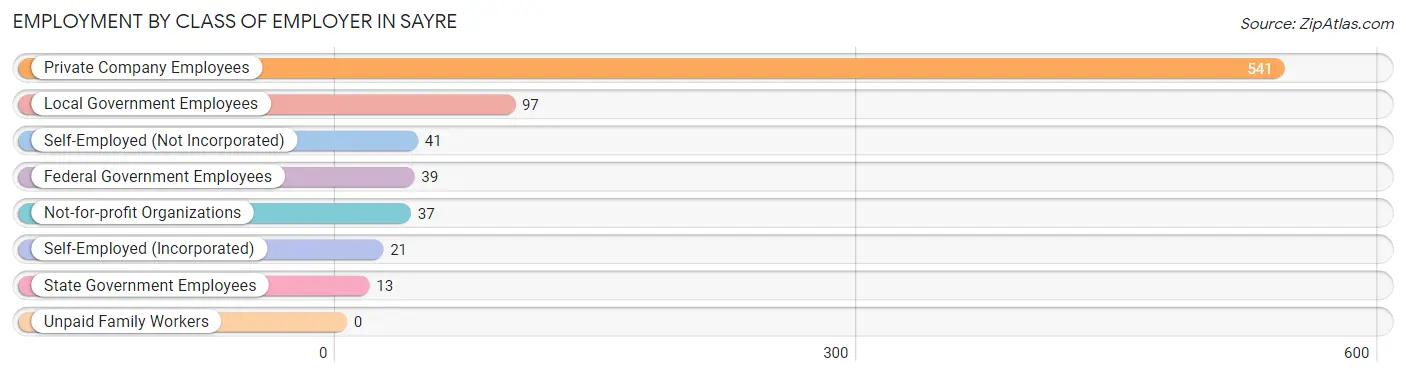
| Employer Class | # Employees | % Employees |
| Private Company Employees | 541 | 68.6% |
| Self-Employed (Incorporated) | 21 | 2.7% |
| Self-Employed (Not Incorporated) | 41 | 5.2% |
| Not-for-profit Organizations | 37 | 4.7% |
| Local Government Employees | 97 | 12.3% |
| State Government Employees | 13 | 1.7% |
| Federal Government Employees | 39 | 4.9% |
| Unpaid Family Workers | 0 | 0.0% |
| Total | 789 | 100.0% |
Employment Status by Age in Sayre
According to the labor force statistics for Sayre, out of the total population over 16 years of age (4,945), 19.7% or 974 individuals are in the labor force, with 12.3% or 120 of them unemployed. The age group with the highest labor force participation rate is 16 to 19 years, with 52.9% or 163 individuals in the labor force. Within the labor force, the 25 to 29 years age range has the highest percentage of unemployed individuals, with 37.3% or 28 of them being unemployed.
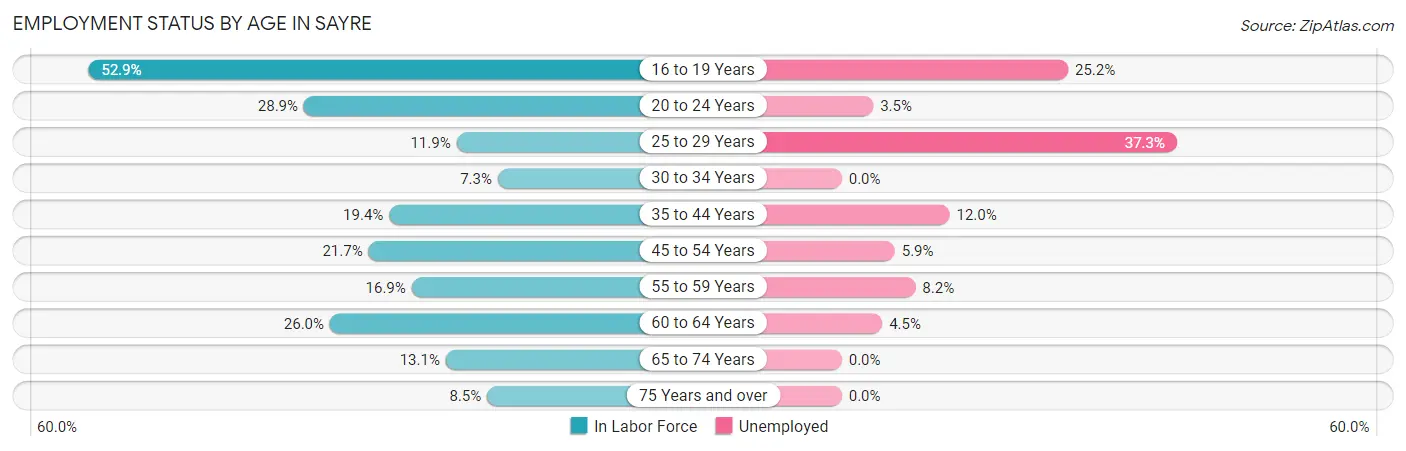
| Age Bracket | In Labor Force | Unemployed |
| 16 to 19 Years | 163 (52.9%) | 41 (25.2%) |
| 20 to 24 Years | 86 (28.9%) | 3 (3.5%) |
| 25 to 29 Years | 75 (11.9%) | 28 (37.3%) |
| 30 to 34 Years | 41 (7.3%) | 0 (0.0%) |
| 35 to 44 Years | 233 (19.4%) | 28 (12.0%) |
| 45 to 54 Years | 170 (21.7%) | 10 (5.9%) |
| 55 to 59 Years | 73 (16.9%) | 6 (8.2%) |
| 60 to 64 Years | 88 (26.0%) | 4 (4.5%) |
| 65 to 74 Years | 33 (13.1%) | 0 (0.0%) |
| 75 Years and over | 12 (8.5%) | 0 (0.0%) |
| Total | 974 (19.7%) | 120 (12.3%) |
Employment Status by Educational Attainment in Sayre
According to labor force statistics for Sayre, 17.2% of individuals (679) out of the total population between 25 and 64 years of age (3,947) are in the labor force, with 11.2% or 76 of them being unemployed. The group with the highest labor force participation rate are those with the educational attainment of bachelor's degree or higher, with 51.0% or 80 individuals in the labor force. Within the labor force, individuals with less than high school education have the highest percentage of unemployment, with 26.3% or 21 of them being unemployed.
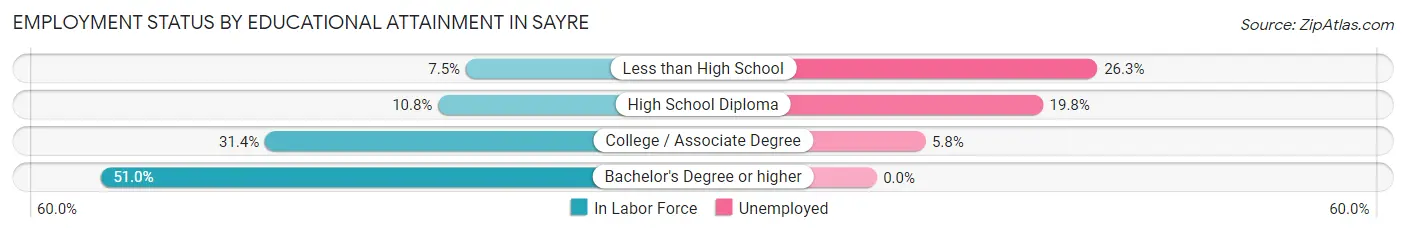
| Educational Attainment | In Labor Force | Unemployed |
| Less than High School | 80 (7.5%) | 279 (26.3%) |
| High School Diploma | 176 (10.8%) | 324 (19.8%) |
| College / Associate Degree | 344 (31.4%) | 63 (5.8%) |
| Bachelor's Degree or higher | 80 (51.0%) | 0 (0.0%) |
| Total | 679 (17.2%) | 442 (11.2%) |
Employment Occupations by Sex in Sayre
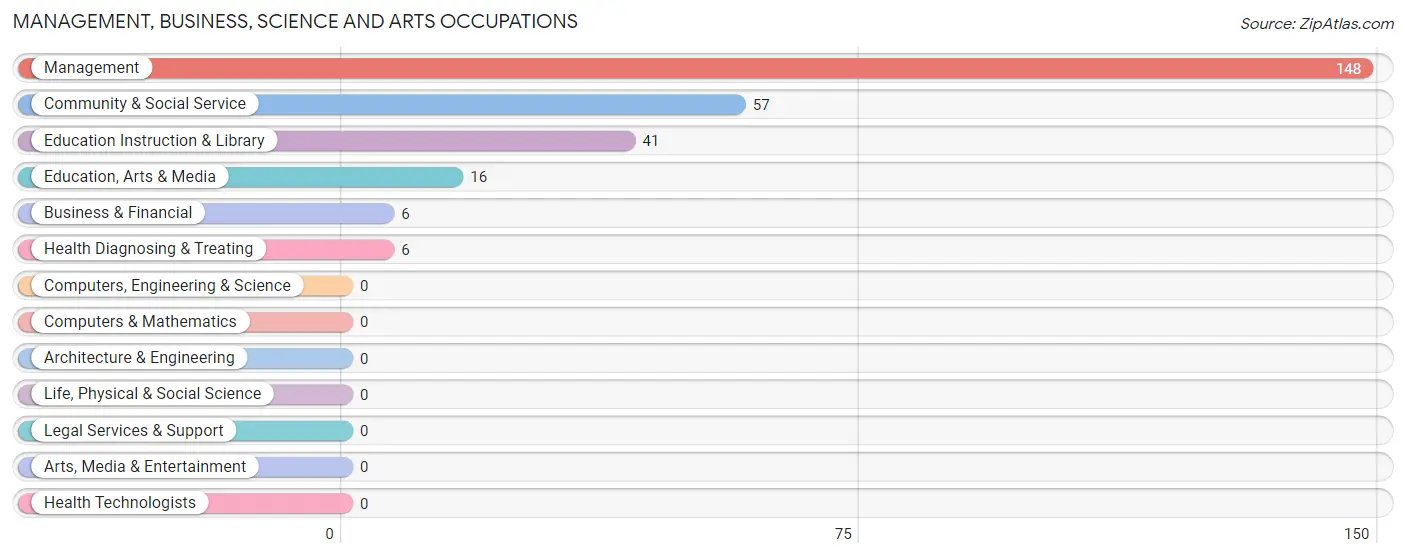
Management, Business, Science and Arts Occupations
The most common Management, Business, Science and Arts occupations in Sayre are Management (148 | 17.3%), Community & Social Service (57 | 6.7%), Education Instruction & Library (41 | 4.8%), Education, Arts & Media (16 | 1.9%), and Business & Financial (6 | 0.7%).
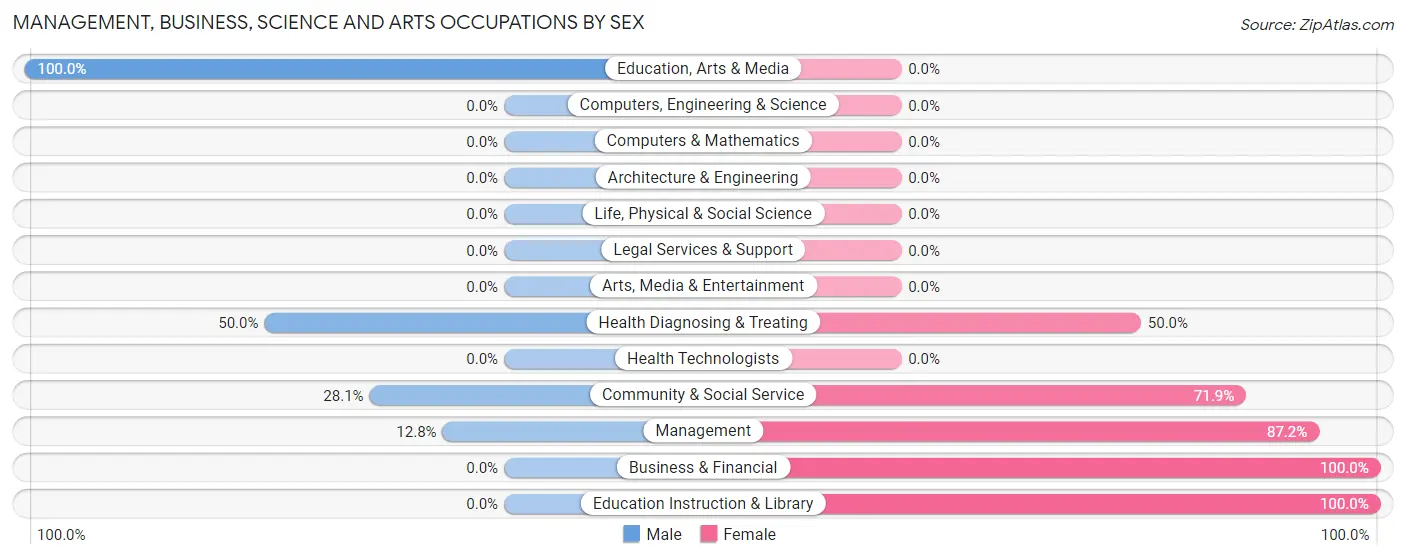
Management, Business, Science and Arts Occupations by Sex
Within the Management, Business, Science and Arts occupations in Sayre, the most male-oriented occupations are Education, Arts & Media (100.0%), Health Diagnosing & Treating (50.0%), and Community & Social Service (28.1%), while the most female-oriented occupations are Business & Financial (100.0%), Education Instruction & Library (100.0%), and Management (87.2%).
| Occupation | Male | Female |
| Management | 19 (12.8%) | 129 (87.2%) |
| Business & Financial | 0 (0.0%) | 6 (100.0%) |
| Computers, Engineering & Science | 0 (0.0%) | 0 (0.0%) |
| Computers & Mathematics | 0 (0.0%) | 0 (0.0%) |
| Architecture & Engineering | 0 (0.0%) | 0 (0.0%) |
| Life, Physical & Social Science | 0 (0.0%) | 0 (0.0%) |
| Community & Social Service | 16 (28.1%) | 41 (71.9%) |
| Education, Arts & Media | 16 (100.0%) | 0 (0.0%) |
| Legal Services & Support | 0 (0.0%) | 0 (0.0%) |
| Education Instruction & Library | 0 (0.0%) | 41 (100.0%) |
| Arts, Media & Entertainment | 0 (0.0%) | 0 (0.0%) |
| Health Diagnosing & Treating | 3 (50.0%) | 3 (50.0%) |
| Health Technologists | 0 (0.0%) | 0 (0.0%) |
| Total (Category) | 38 (17.5%) | 179 (82.5%) |
| Total (Overall) | 382 (44.7%) | 472 (55.3%) |
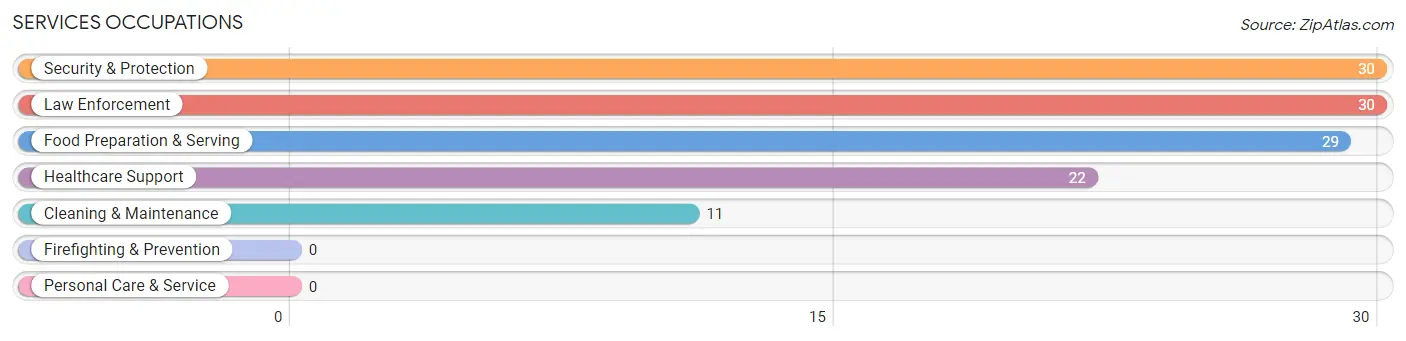
Services Occupations
The most common Services occupations in Sayre are Security & Protection (30 | 3.5%), Law Enforcement (30 | 3.5%), Food Preparation & Serving (29 | 3.4%), Healthcare Support (22 | 2.6%), and Cleaning & Maintenance (11 | 1.3%).
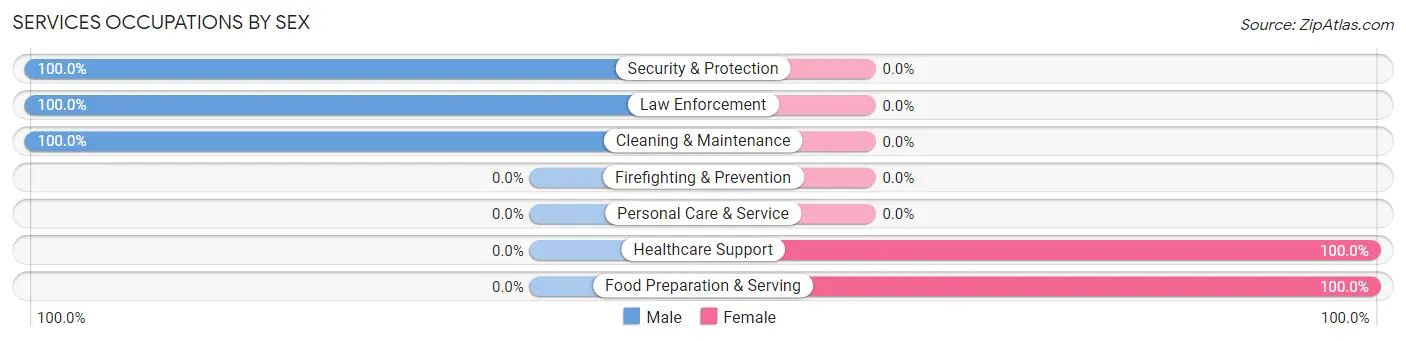
Services Occupations by Sex
Within the Services occupations in Sayre, the most male-oriented occupations are Security & Protection (100.0%), Law Enforcement (100.0%), and Cleaning & Maintenance (100.0%), while the most female-oriented occupations are Healthcare Support (100.0%), and Food Preparation & Serving (100.0%).
| Occupation | Male | Female |
| Healthcare Support | 0 (0.0%) | 22 (100.0%) |
| Security & Protection | 30 (100.0%) | 0 (0.0%) |
| Firefighting & Prevention | 0 (0.0%) | 0 (0.0%) |
| Law Enforcement | 30 (100.0%) | 0 (0.0%) |
| Food Preparation & Serving | 0 (0.0%) | 29 (100.0%) |
| Cleaning & Maintenance | 11 (100.0%) | 0 (0.0%) |
| Personal Care & Service | 0 (0.0%) | 0 (0.0%) |
| Total (Category) | 41 (44.6%) | 51 (55.4%) |
| Total (Overall) | 382 (44.7%) | 472 (55.3%) |
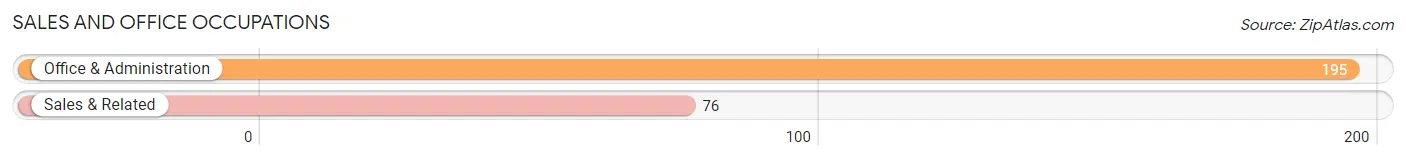
Sales and Office Occupations
The most common Sales and Office occupations in Sayre are Office & Administration (195 | 22.8%), and Sales & Related (76 | 8.9%).
Sales and Office Occupations by Sex
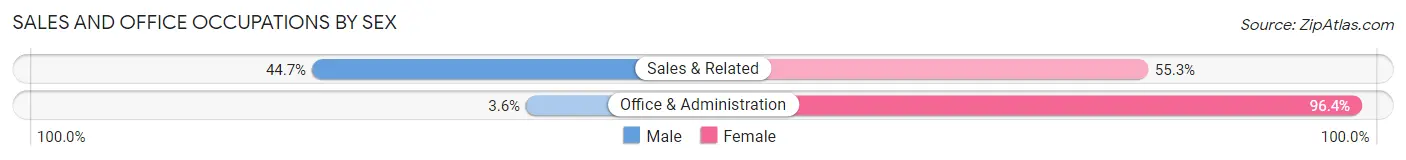
| Occupation | Male | Female |
| Sales & Related | 34 (44.7%) | 42 (55.3%) |
| Office & Administration | 7 (3.6%) | 188 (96.4%) |
| Total (Category) | 41 (15.1%) | 230 (84.9%) |
| Total (Overall) | 382 (44.7%) | 472 (55.3%) |
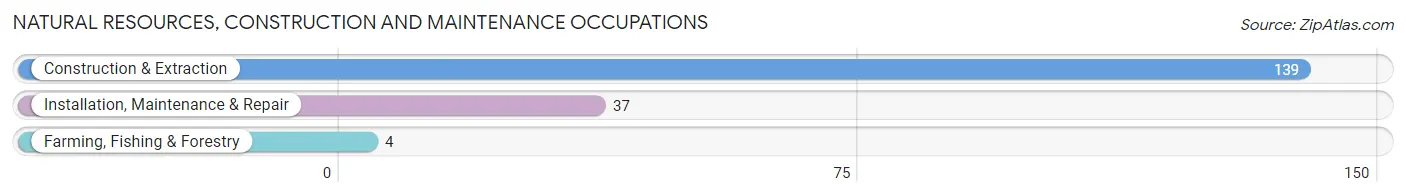
Natural Resources, Construction and Maintenance Occupations
The most common Natural Resources, Construction and Maintenance occupations in Sayre are Construction & Extraction (139 | 16.3%), Installation, Maintenance & Repair (37 | 4.3%), and Farming, Fishing & Forestry (4 | 0.5%).
Natural Resources, Construction and Maintenance Occupations by Sex
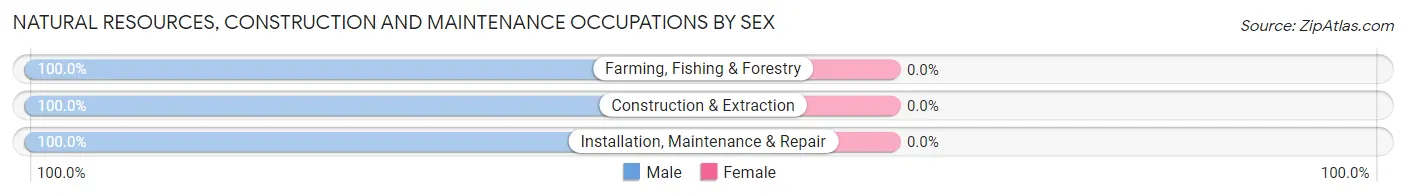
| Occupation | Male | Female |
| Farming, Fishing & Forestry | 4 (100.0%) | 0 (0.0%) |
| Construction & Extraction | 139 (100.0%) | 0 (0.0%) |
| Installation, Maintenance & Repair | 37 (100.0%) | 0 (0.0%) |
| Total (Category) | 180 (100.0%) | 0 (0.0%) |
| Total (Overall) | 382 (44.7%) | 472 (55.3%) |
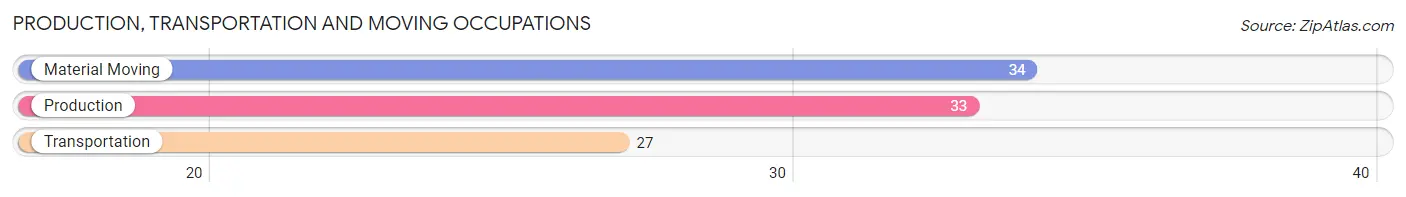
Production, Transportation and Moving Occupations
The most common Production, Transportation and Moving occupations in Sayre are Material Moving (34 | 4.0%), Production (33 | 3.9%), and Transportation (27 | 3.2%).
Production, Transportation and Moving Occupations by Sex
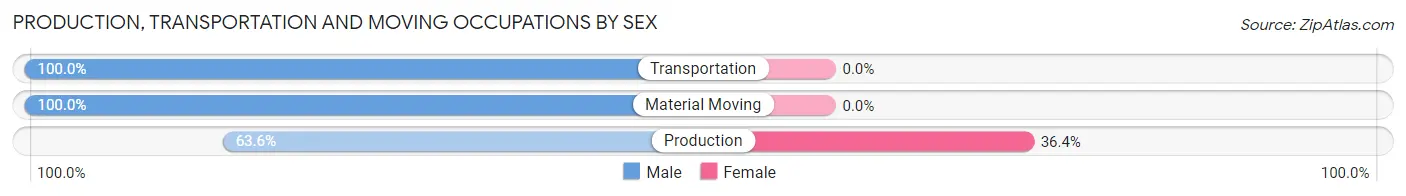
| Occupation | Male | Female |
| Production | 21 (63.6%) | 12 (36.4%) |
| Transportation | 27 (100.0%) | 0 (0.0%) |
| Material Moving | 34 (100.0%) | 0 (0.0%) |
| Total (Category) | 82 (87.2%) | 12 (12.8%) |
| Total (Overall) | 382 (44.7%) | 472 (55.3%) |
Employment Industries by Sex in Sayre
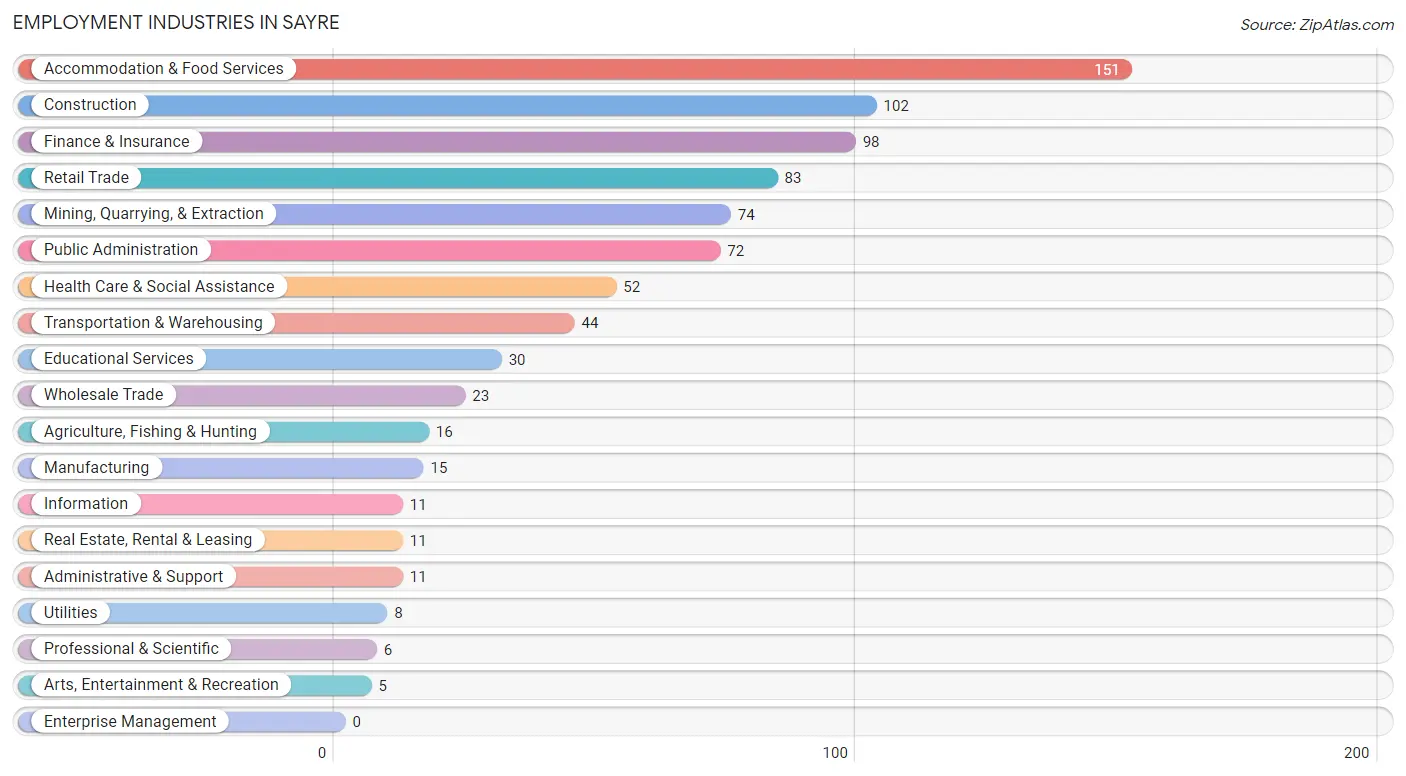
Employment Industries in Sayre
The major employment industries in Sayre include Accommodation & Food Services (151 | 17.7%), Construction (102 | 11.9%), Finance & Insurance (98 | 11.5%), Retail Trade (83 | 9.7%), and Mining, Quarrying, & Extraction (74 | 8.7%).
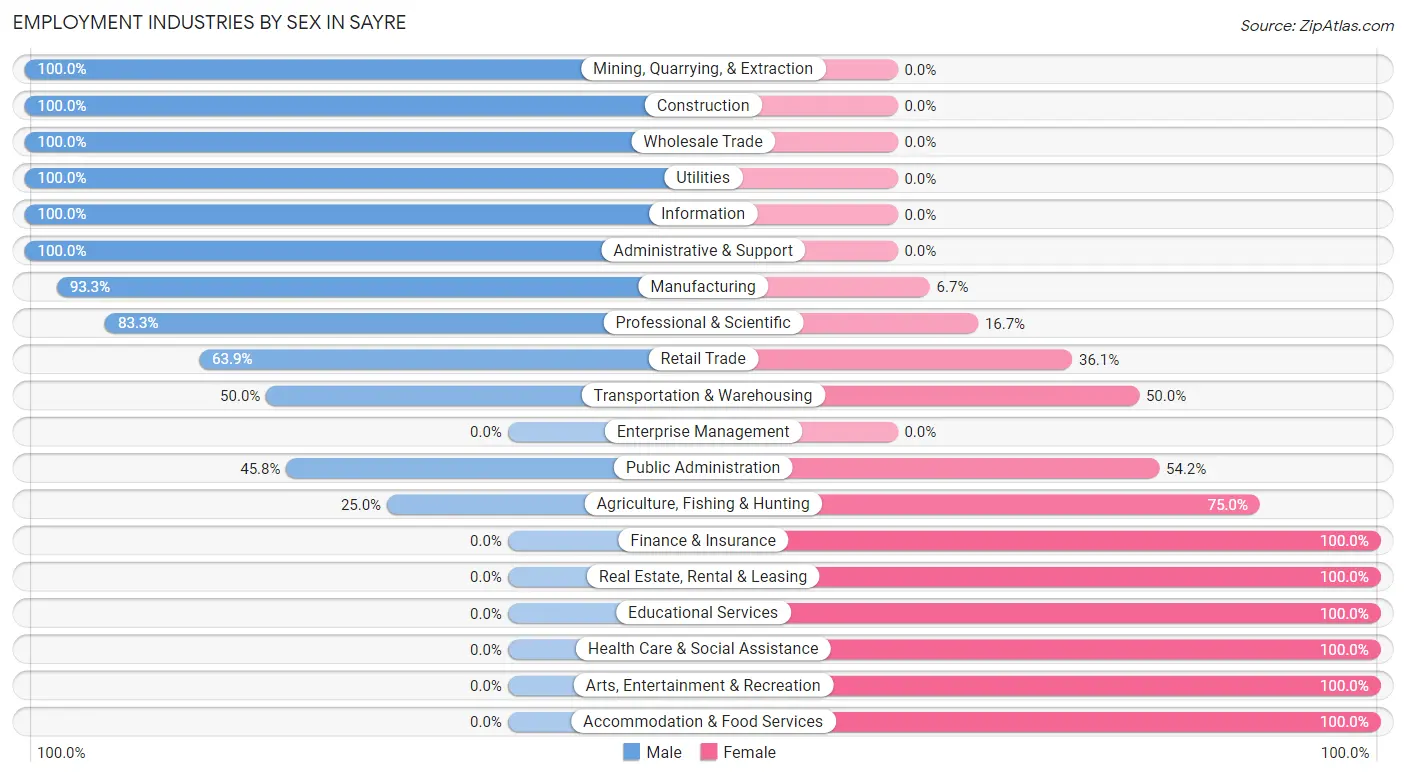
Employment Industries by Sex in Sayre
The Sayre industries that see more men than women are Mining, Quarrying, & Extraction (100.0%), Construction (100.0%), and Wholesale Trade (100.0%), whereas the industries that tend to have a higher number of women are Finance & Insurance (100.0%), Real Estate, Rental & Leasing (100.0%), and Educational Services (100.0%).
| Industry | Male | Female |
| Agriculture, Fishing & Hunting | 4 (25.0%) | 12 (75.0%) |
| Mining, Quarrying, & Extraction | 74 (100.0%) | 0 (0.0%) |
| Construction | 102 (100.0%) | 0 (0.0%) |
| Manufacturing | 14 (93.3%) | 1 (6.7%) |
| Wholesale Trade | 23 (100.0%) | 0 (0.0%) |
| Retail Trade | 53 (63.9%) | 30 (36.1%) |
| Transportation & Warehousing | 22 (50.0%) | 22 (50.0%) |
| Utilities | 8 (100.0%) | 0 (0.0%) |
| Information | 11 (100.0%) | 0 (0.0%) |
| Finance & Insurance | 0 (0.0%) | 98 (100.0%) |
| Real Estate, Rental & Leasing | 0 (0.0%) | 11 (100.0%) |
| Professional & Scientific | 5 (83.3%) | 1 (16.7%) |
| Enterprise Management | 0 (0.0%) | 0 (0.0%) |
| Administrative & Support | 11 (100.0%) | 0 (0.0%) |
| Educational Services | 0 (0.0%) | 30 (100.0%) |
| Health Care & Social Assistance | 0 (0.0%) | 52 (100.0%) |
| Arts, Entertainment & Recreation | 0 (0.0%) | 5 (100.0%) |
| Accommodation & Food Services | 0 (0.0%) | 151 (100.0%) |
| Public Administration | 33 (45.8%) | 39 (54.2%) |
| Total | 382 (44.7%) | 472 (55.3%) |
Education in Sayre
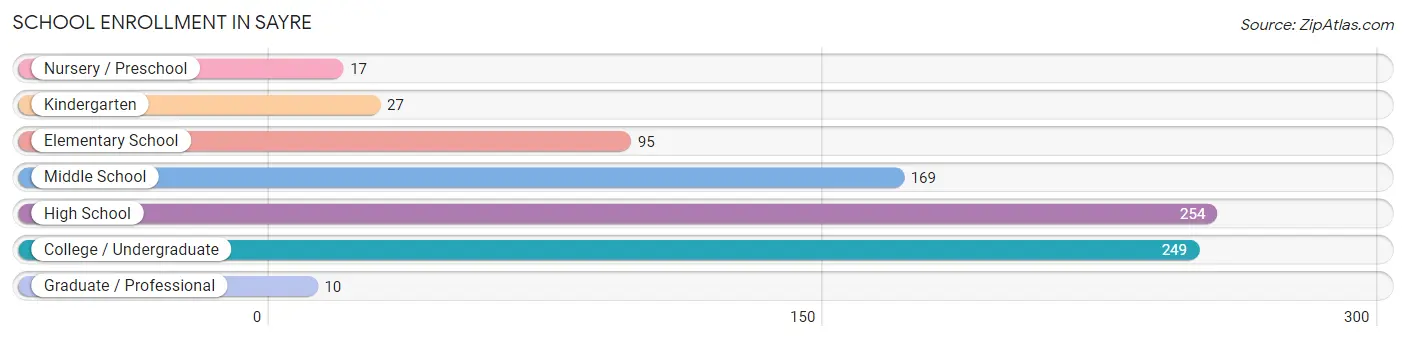
School Enrollment in Sayre
The most common levels of schooling among the 821 students in Sayre are high school (254 | 30.9%), college / undergraduate (249 | 30.3%), and middle school (169 | 20.6%).
| School Level | # Students | % Students |
| Nursery / Preschool | 17 | 2.1% |
| Kindergarten | 27 | 3.3% |
| Elementary School | 95 | 11.6% |
| Middle School | 169 | 20.6% |
| High School | 254 | 30.9% |
| College / Undergraduate | 249 | 30.3% |
| Graduate / Professional | 10 | 1.2% |
| Total | 821 | 100.0% |
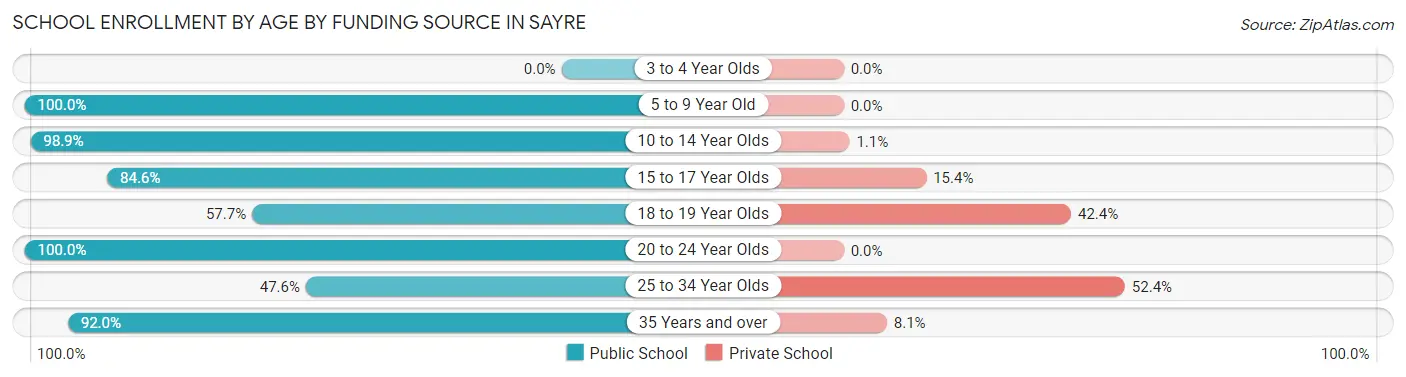
School Enrollment by Age by Funding Source in Sayre
Out of a total of 821 students who are enrolled in schools in Sayre, 150 (18.3%) attend a private institution, while the remaining 671 (81.7%) are enrolled in public schools. The age group of 25 to 34 year olds has the highest likelihood of being enrolled in private schools, with 44 (52.4% in the age bracket) enrolled. Conversely, the age group of 5 to 9 year old has the lowest likelihood of being enrolled in a private school, with 116 (100.0% in the age bracket) attending a public institution.
| Age Bracket | Public School | Private School |
| 3 to 4 Year Olds | 0 (0.0%) | 0 (0.0%) |
| 5 to 9 Year Old | 116 (100.0%) | 0 (0.0%) |
| 10 to 14 Year Olds | 183 (98.9%) | 2 (1.1%) |
| 15 to 17 Year Olds | 77 (84.6%) | 14 (15.4%) |
| 18 to 19 Year Olds | 113 (57.7%) | 83 (42.3%) |
| 20 to 24 Year Olds | 62 (100.0%) | 0 (0.0%) |
| 25 to 34 Year Olds | 40 (47.6%) | 44 (52.4%) |
| 35 Years and over | 80 (91.9%) | 7 (8.1%) |
| Total | 671 (81.7%) | 150 (18.3%) |
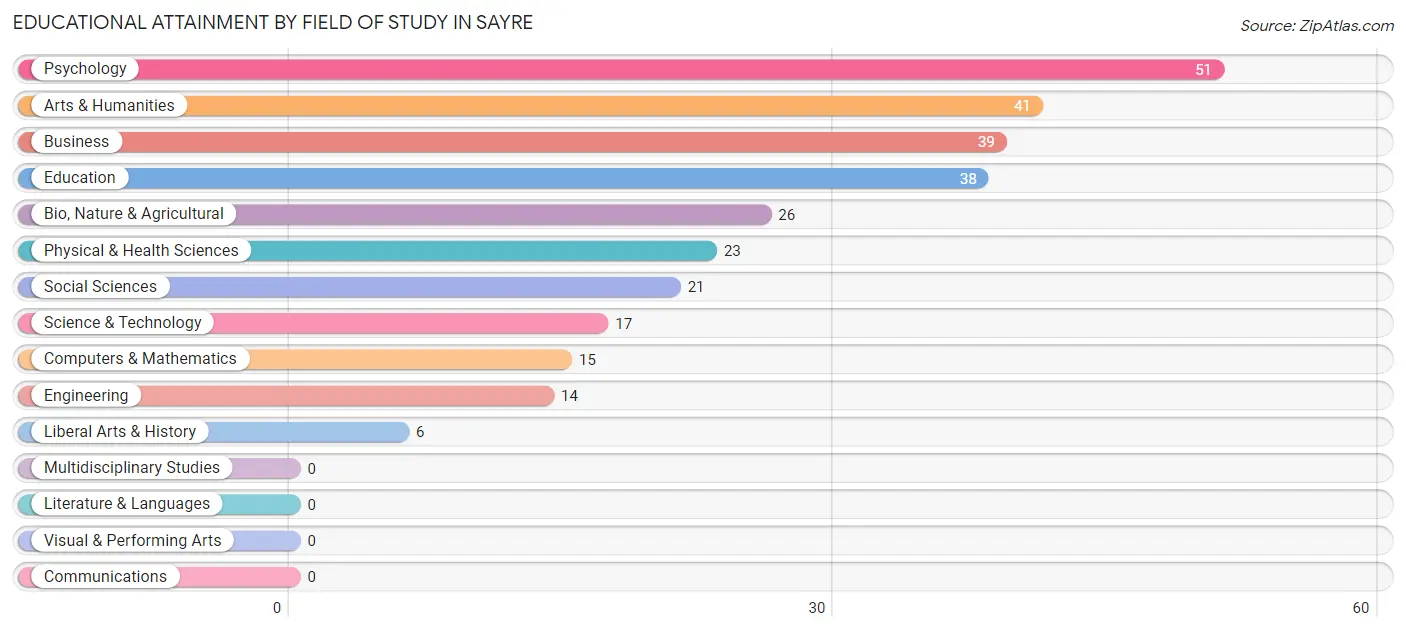
Educational Attainment by Field of Study in Sayre
Psychology (51 | 17.5%), arts & humanities (41 | 14.1%), business (39 | 13.4%), education (38 | 13.1%), and bio, nature & agricultural (26 | 8.9%) are the most common fields of study among 291 individuals in Sayre who have obtained a bachelor's degree or higher.
| Field of Study | # Graduates | % Graduates |
| Computers & Mathematics | 15 | 5.1% |
| Bio, Nature & Agricultural | 26 | 8.9% |
| Physical & Health Sciences | 23 | 7.9% |
| Psychology | 51 | 17.5% |
| Social Sciences | 21 | 7.2% |
| Engineering | 14 | 4.8% |
| Multidisciplinary Studies | 0 | 0.0% |
| Science & Technology | 17 | 5.8% |
| Business | 39 | 13.4% |
| Education | 38 | 13.1% |
| Literature & Languages | 0 | 0.0% |
| Liberal Arts & History | 6 | 2.1% |
| Visual & Performing Arts | 0 | 0.0% |
| Communications | 0 | 0.0% |
| Arts & Humanities | 41 | 14.1% |
| Total | 291 | 100.0% |
Transportation & Commute in Sayre
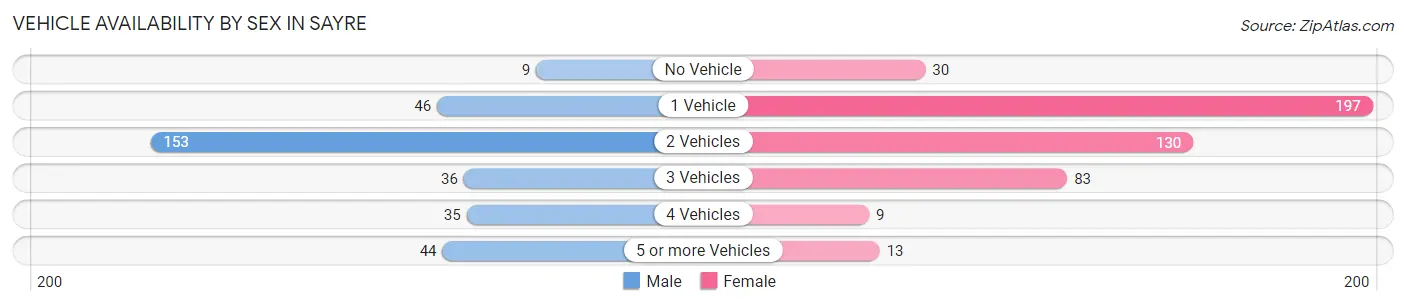
Vehicle Availability by Sex in Sayre
The most prevalent vehicle ownership categories in Sayre are males with 2 vehicles (153, accounting for 47.4%) and females with 2 vehicles (130, making up 33.1%).
| Vehicles Available | Male | Female |
| No Vehicle | 9 (2.8%) | 30 (6.5%) |
| 1 Vehicle | 46 (14.2%) | 197 (42.6%) |
| 2 Vehicles | 153 (47.4%) | 130 (28.1%) |
| 3 Vehicles | 36 (11.2%) | 83 (18.0%) |
| 4 Vehicles | 35 (10.8%) | 9 (1.9%) |
| 5 or more Vehicles | 44 (13.6%) | 13 (2.8%) |
| Total | 323 (100.0%) | 462 (100.0%) |
Commute Time in Sayre
The most frequently occuring commute durations in Sayre are 5 to 9 minutes (179 commuters, 23.0%), 15 to 19 minutes (147 commuters, 18.9%), and less than 5 minutes (114 commuters, 14.6%).
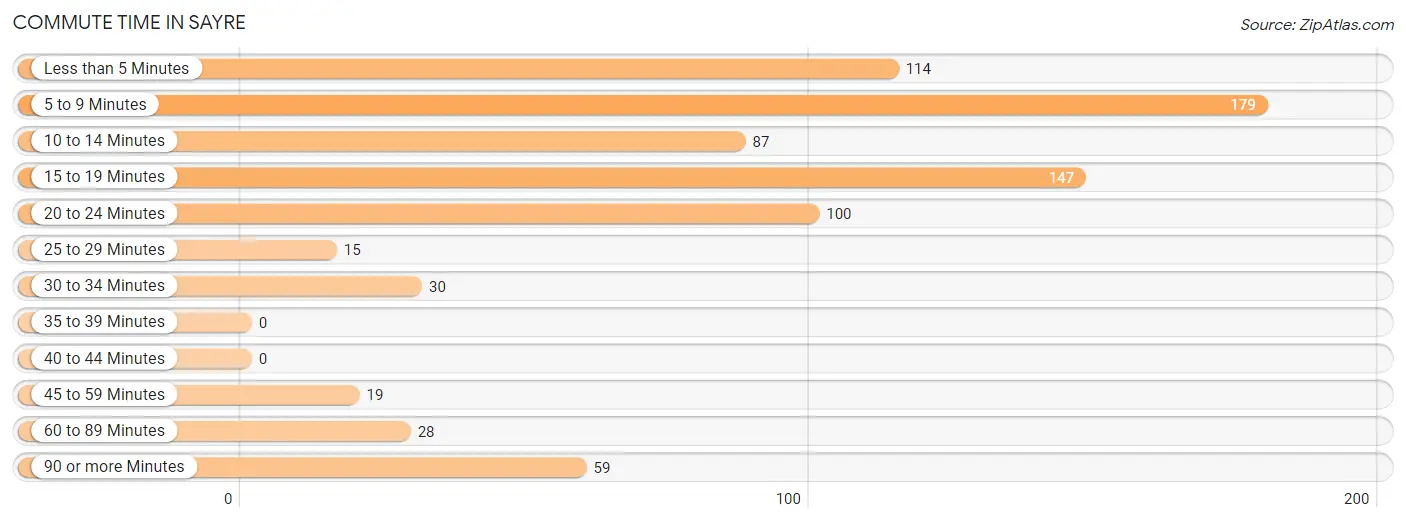
| Commute Time | # Commuters | % Commuters |
| Less than 5 Minutes | 114 | 14.6% |
| 5 to 9 Minutes | 179 | 23.0% |
| 10 to 14 Minutes | 87 | 11.2% |
| 15 to 19 Minutes | 147 | 18.9% |
| 20 to 24 Minutes | 100 | 12.9% |
| 25 to 29 Minutes | 15 | 1.9% |
| 30 to 34 Minutes | 30 | 3.9% |
| 35 to 39 Minutes | 0 | 0.0% |
| 40 to 44 Minutes | 0 | 0.0% |
| 45 to 59 Minutes | 19 | 2.4% |
| 60 to 89 Minutes | 28 | 3.6% |
| 90 or more Minutes | 59 | 7.6% |
Commute Time by Sex in Sayre
The most common commute times in Sayre are 5 to 9 minutes (56 commuters, 17.3%) for males and 5 to 9 minutes (123 commuters, 27.0%) for females.
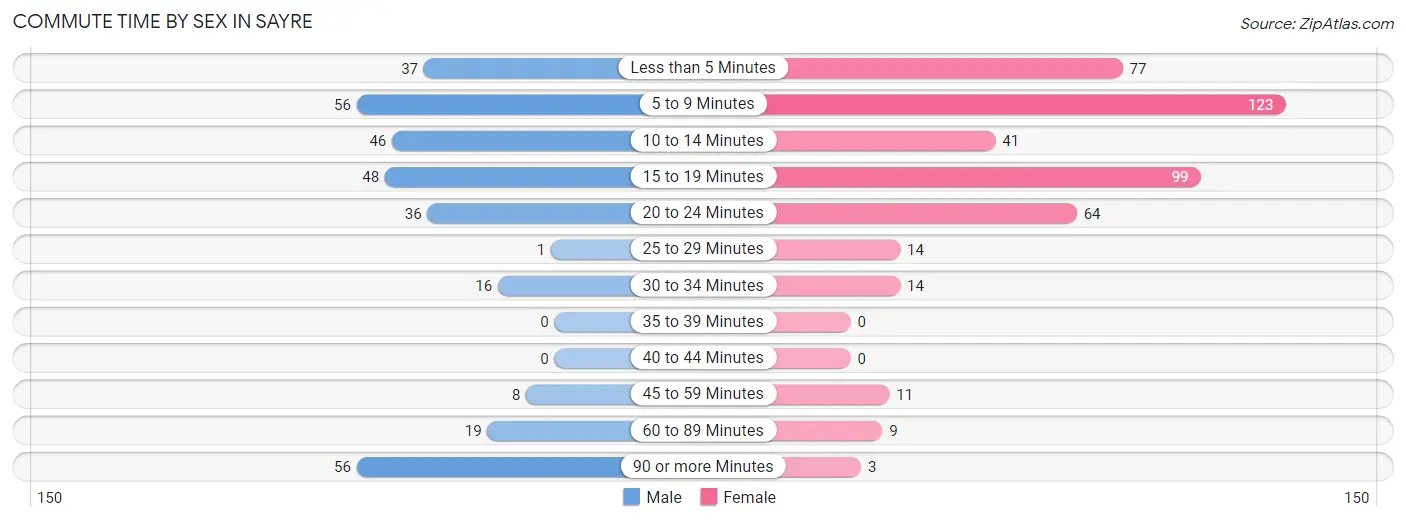
| Commute Time | Male | Female |
| Less than 5 Minutes | 37 (11.5%) | 77 (16.9%) |
| 5 to 9 Minutes | 56 (17.3%) | 123 (27.0%) |
| 10 to 14 Minutes | 46 (14.2%) | 41 (9.0%) |
| 15 to 19 Minutes | 48 (14.9%) | 99 (21.8%) |
| 20 to 24 Minutes | 36 (11.2%) | 64 (14.1%) |
| 25 to 29 Minutes | 1 (0.3%) | 14 (3.1%) |
| 30 to 34 Minutes | 16 (5.0%) | 14 (3.1%) |
| 35 to 39 Minutes | 0 (0.0%) | 0 (0.0%) |
| 40 to 44 Minutes | 0 (0.0%) | 0 (0.0%) |
| 45 to 59 Minutes | 8 (2.5%) | 11 (2.4%) |
| 60 to 89 Minutes | 19 (5.9%) | 9 (2.0%) |
| 90 or more Minutes | 56 (17.3%) | 3 (0.7%) |
Time of Departure to Work by Sex in Sayre
The most frequent times of departure to work in Sayre are 6:30 AM to 6:59 AM (71, 22.0%) for males and 12:00 PM to 3:59 PM (104, 22.9%) for females.
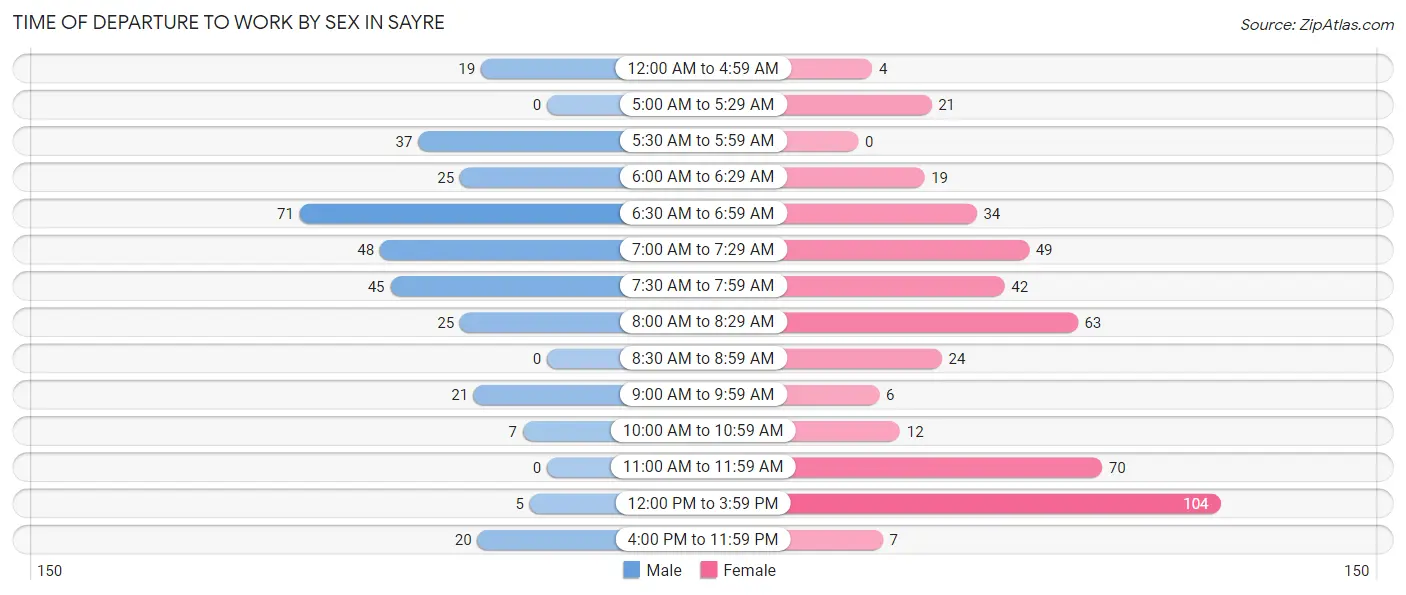
| Time of Departure | Male | Female |
| 12:00 AM to 4:59 AM | 19 (5.9%) | 4 (0.9%) |
| 5:00 AM to 5:29 AM | 0 (0.0%) | 21 (4.6%) |
| 5:30 AM to 5:59 AM | 37 (11.5%) | 0 (0.0%) |
| 6:00 AM to 6:29 AM | 25 (7.7%) | 19 (4.2%) |
| 6:30 AM to 6:59 AM | 71 (22.0%) | 34 (7.5%) |
| 7:00 AM to 7:29 AM | 48 (14.9%) | 49 (10.8%) |
| 7:30 AM to 7:59 AM | 45 (13.9%) | 42 (9.2%) |
| 8:00 AM to 8:29 AM | 25 (7.7%) | 63 (13.9%) |
| 8:30 AM to 8:59 AM | 0 (0.0%) | 24 (5.3%) |
| 9:00 AM to 9:59 AM | 21 (6.5%) | 6 (1.3%) |
| 10:00 AM to 10:59 AM | 7 (2.2%) | 12 (2.6%) |
| 11:00 AM to 11:59 AM | 0 (0.0%) | 70 (15.4%) |
| 12:00 PM to 3:59 PM | 5 (1.5%) | 104 (22.9%) |
| 4:00 PM to 11:59 PM | 20 (6.2%) | 7 (1.5%) |
| Total | 323 (100.0%) | 455 (100.0%) |
Housing Occupancy in Sayre
Occupancy by Ownership in Sayre
Of the total 948 dwellings in Sayre, owner-occupied units account for 485 (51.2%), while renter-occupied units make up 463 (48.8%).
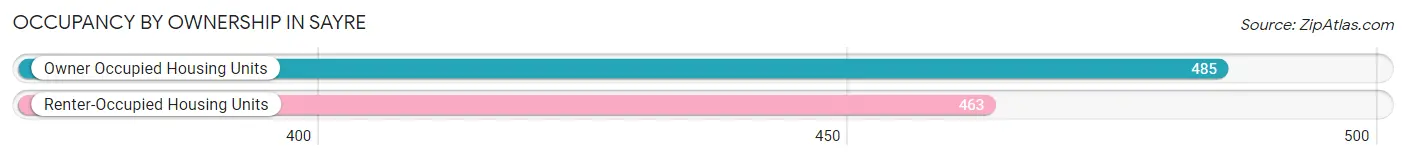
| Occupancy | # Housing Units | % Housing Units |
| Owner Occupied Housing Units | 485 | 51.2% |
| Renter-Occupied Housing Units | 463 | 48.8% |
| Total Occupied Housing Units | 948 | 100.0% |
Occupancy by Household Size in Sayre
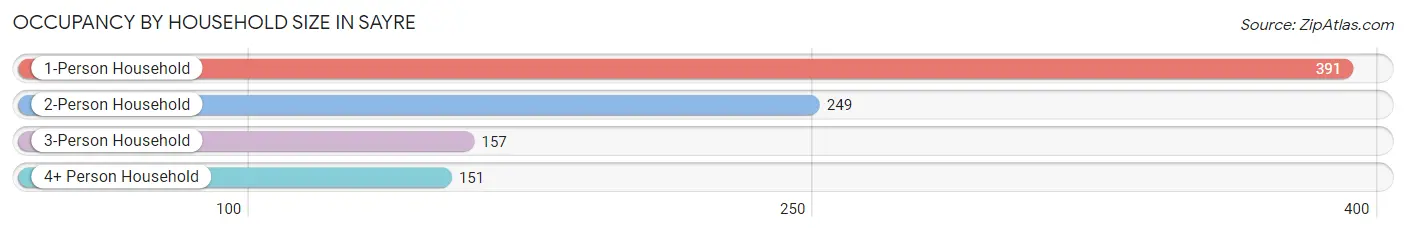
| Household Size | # Housing Units | % Housing Units |
| 1-Person Household | 391 | 41.2% |
| 2-Person Household | 249 | 26.3% |
| 3-Person Household | 157 | 16.6% |
| 4+ Person Household | 151 | 15.9% |
| Total Housing Units | 948 | 100.0% |
Occupancy by Ownership by Household Size in Sayre
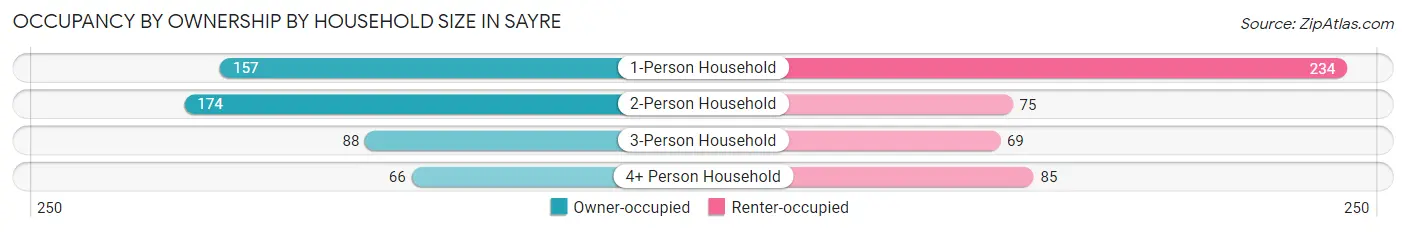
| Household Size | Owner-occupied | Renter-occupied |
| 1-Person Household | 157 (40.2%) | 234 (59.9%) |
| 2-Person Household | 174 (69.9%) | 75 (30.1%) |
| 3-Person Household | 88 (56.0%) | 69 (44.0%) |
| 4+ Person Household | 66 (43.7%) | 85 (56.3%) |
| Total Housing Units | 485 (51.2%) | 463 (48.8%) |
Occupancy by Educational Attainment in Sayre
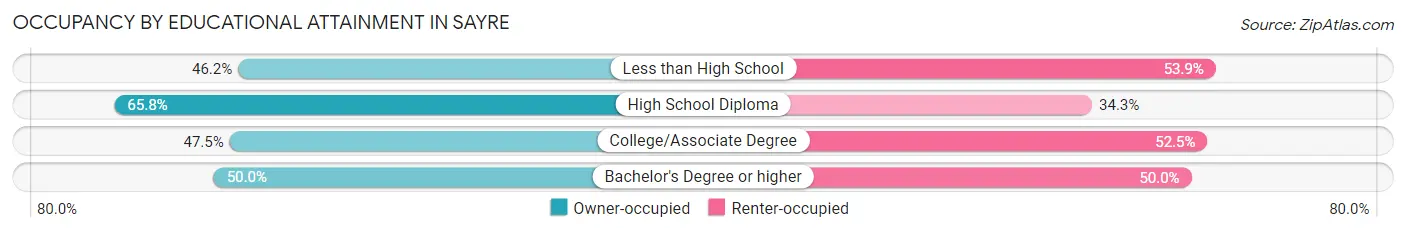
| Household Size | Owner-occupied | Renter-occupied |
| Less than High School | 60 (46.2%) | 70 (53.8%) |
| High School Diploma | 119 (65.7%) | 62 (34.3%) |
| College/Associate Degree | 237 (47.5%) | 262 (52.5%) |
| Bachelor's Degree or higher | 69 (50.0%) | 69 (50.0%) |
Occupancy by Age of Householder in Sayre
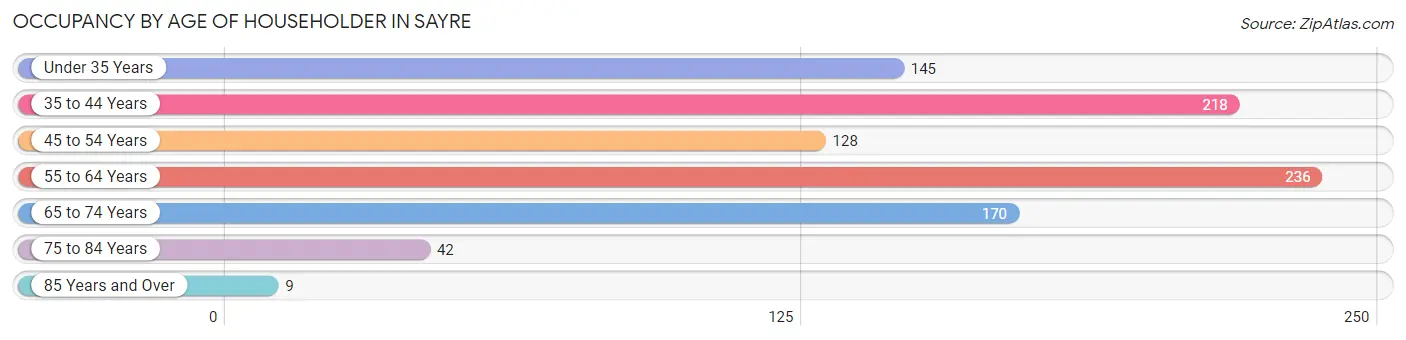
| Age Bracket | # Households | % Households |
| Under 35 Years | 145 | 15.3% |
| 35 to 44 Years | 218 | 23.0% |
| 45 to 54 Years | 128 | 13.5% |
| 55 to 64 Years | 236 | 24.9% |
| 65 to 74 Years | 170 | 17.9% |
| 75 to 84 Years | 42 | 4.4% |
| 85 Years and Over | 9 | 0.9% |
| Total | 948 | 100.0% |
Housing Finances in Sayre
Median Income by Occupancy in Sayre
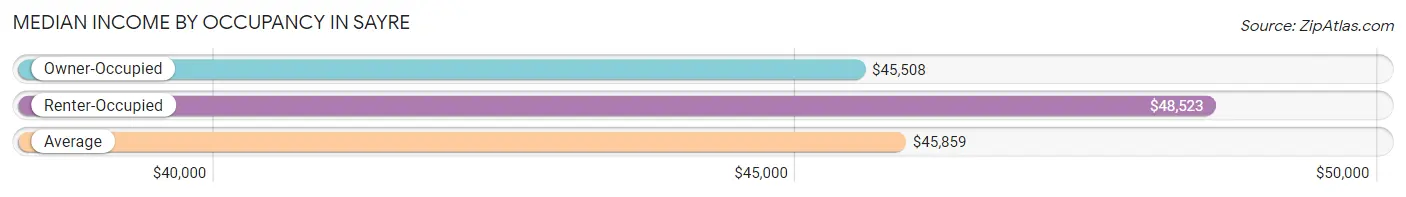
| Occupancy Type | # Households | Median Income |
| Owner-Occupied | 485 (51.2%) | $45,508 |
| Renter-Occupied | 463 (48.8%) | $48,523 |
| Average | 948 (100.0%) | $45,859 |
Occupancy by Householder Income Bracket in Sayre
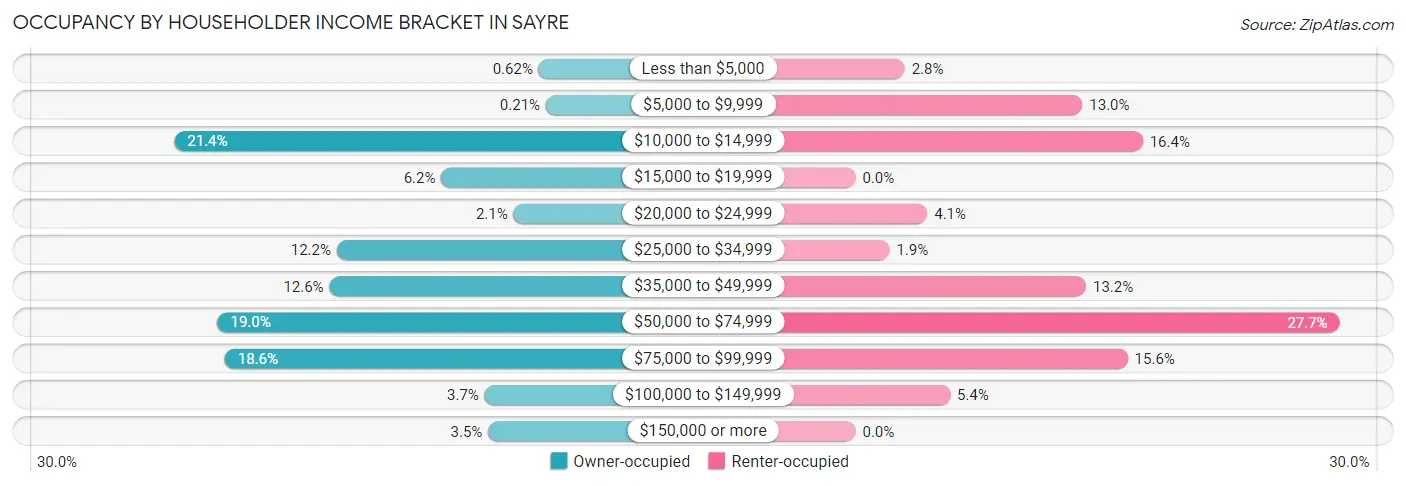
| Income Bracket | Owner-occupied | Renter-occupied |
| Less than $5,000 | 3 (0.6%) | 13 (2.8%) |
| $5,000 to $9,999 | 1 (0.2%) | 60 (13.0%) |
| $10,000 to $14,999 | 104 (21.4%) | 76 (16.4%) |
| $15,000 to $19,999 | 30 (6.2%) | 0 (0.0%) |
| $20,000 to $24,999 | 10 (2.1%) | 19 (4.1%) |
| $25,000 to $34,999 | 59 (12.2%) | 9 (1.9%) |
| $35,000 to $49,999 | 61 (12.6%) | 61 (13.2%) |
| $50,000 to $74,999 | 92 (19.0%) | 128 (27.7%) |
| $75,000 to $99,999 | 90 (18.6%) | 72 (15.5%) |
| $100,000 to $149,999 | 18 (3.7%) | 25 (5.4%) |
| $150,000 or more | 17 (3.5%) | 0 (0.0%) |
| Total | 485 (100.0%) | 463 (100.0%) |
Monthly Housing Cost Tiers in Sayre
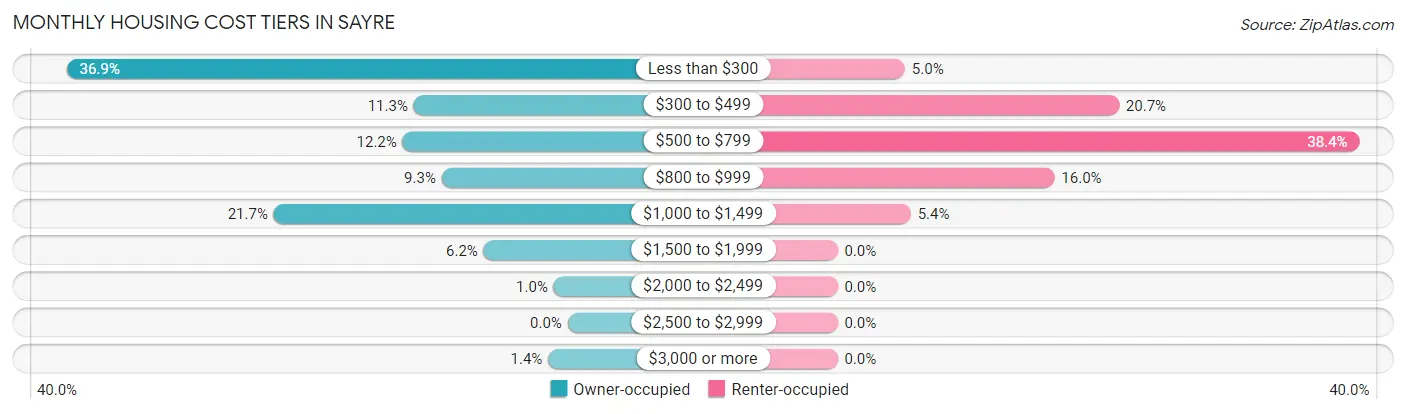
| Monthly Cost | Owner-occupied | Renter-occupied |
| Less than $300 | 179 (36.9%) | 23 (5.0%) |
| $300 to $499 | 55 (11.3%) | 96 (20.7%) |
| $500 to $799 | 59 (12.2%) | 178 (38.4%) |
| $800 to $999 | 45 (9.3%) | 74 (16.0%) |
| $1,000 to $1,499 | 105 (21.6%) | 25 (5.4%) |
| $1,500 to $1,999 | 30 (6.2%) | 0 (0.0%) |
| $2,000 to $2,499 | 5 (1.0%) | 0 (0.0%) |
| $2,500 to $2,999 | 0 (0.0%) | 0 (0.0%) |
| $3,000 or more | 7 (1.4%) | 0 (0.0%) |
| Total | 485 (100.0%) | 463 (100.0%) |
Physical Housing Characteristics in Sayre
Housing Structures in Sayre
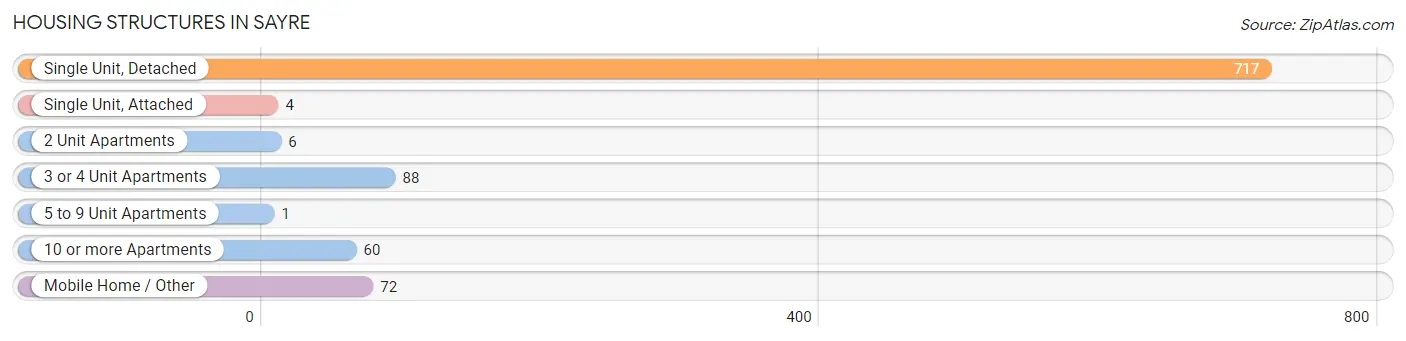
| Structure Type | # Housing Units | % Housing Units |
| Single Unit, Detached | 717 | 75.6% |
| Single Unit, Attached | 4 | 0.4% |
| 2 Unit Apartments | 6 | 0.6% |
| 3 or 4 Unit Apartments | 88 | 9.3% |
| 5 to 9 Unit Apartments | 1 | 0.1% |
| 10 or more Apartments | 60 | 6.3% |
| Mobile Home / Other | 72 | 7.6% |
| Total | 948 | 100.0% |
Housing Structures by Occupancy in Sayre
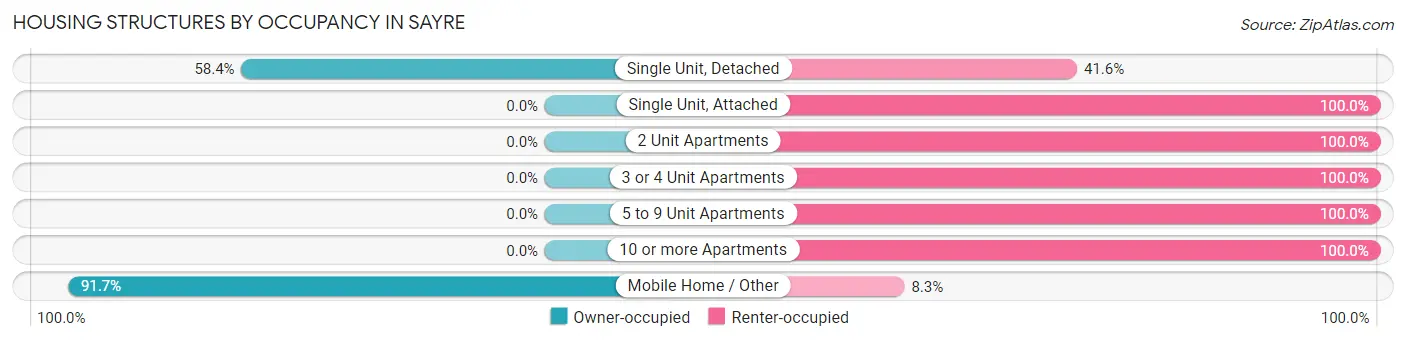
| Structure Type | Owner-occupied | Renter-occupied |
| Single Unit, Detached | 419 (58.4%) | 298 (41.6%) |
| Single Unit, Attached | 0 (0.0%) | 4 (100.0%) |
| 2 Unit Apartments | 0 (0.0%) | 6 (100.0%) |
| 3 or 4 Unit Apartments | 0 (0.0%) | 88 (100.0%) |
| 5 to 9 Unit Apartments | 0 (0.0%) | 1 (100.0%) |
| 10 or more Apartments | 0 (0.0%) | 60 (100.0%) |
| Mobile Home / Other | 66 (91.7%) | 6 (8.3%) |
| Total | 485 (51.2%) | 463 (48.8%) |
Housing Structures by Number of Rooms in Sayre
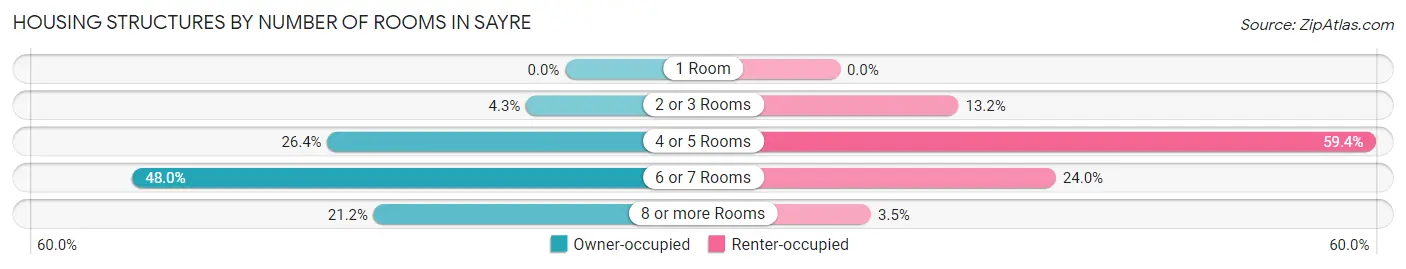
| Number of Rooms | Owner-occupied | Renter-occupied |
| 1 Room | 0 (0.0%) | 0 (0.0%) |
| 2 or 3 Rooms | 21 (4.3%) | 61 (13.2%) |
| 4 or 5 Rooms | 128 (26.4%) | 275 (59.4%) |
| 6 or 7 Rooms | 233 (48.0%) | 111 (24.0%) |
| 8 or more Rooms | 103 (21.2%) | 16 (3.5%) |
| Total | 485 (100.0%) | 463 (100.0%) |
Housing Structure by Heating Type in Sayre
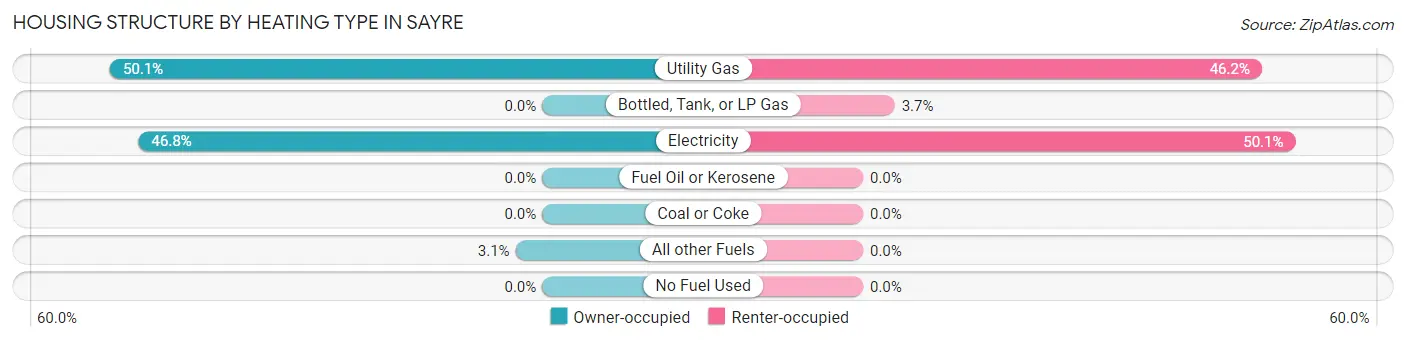
| Heating Type | Owner-occupied | Renter-occupied |
| Utility Gas | 243 (50.1%) | 214 (46.2%) |
| Bottled, Tank, or LP Gas | 0 (0.0%) | 17 (3.7%) |
| Electricity | 227 (46.8%) | 232 (50.1%) |
| Fuel Oil or Kerosene | 0 (0.0%) | 0 (0.0%) |
| Coal or Coke | 0 (0.0%) | 0 (0.0%) |
| All other Fuels | 15 (3.1%) | 0 (0.0%) |
| No Fuel Used | 0 (0.0%) | 0 (0.0%) |
| Total | 485 (100.0%) | 463 (100.0%) |
Household Vehicle Usage in Sayre
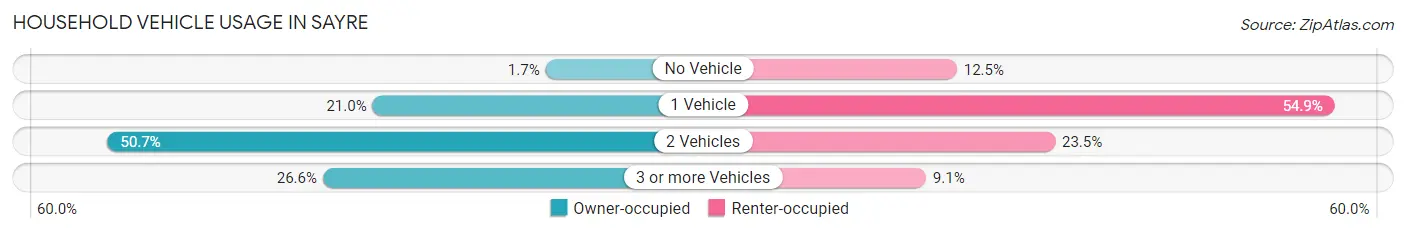
| Vehicles per Household | Owner-occupied | Renter-occupied |
| No Vehicle | 8 (1.7%) | 58 (12.5%) |
| 1 Vehicle | 102 (21.0%) | 254 (54.9%) |
| 2 Vehicles | 246 (50.7%) | 109 (23.5%) |
| 3 or more Vehicles | 129 (26.6%) | 42 (9.1%) |
| Total | 485 (100.0%) | 463 (100.0%) |
Real Estate & Mortgages in Sayre
Real Estate and Mortgage Overview in Sayre
| Characteristic | Without Mortgage | With Mortgage |
| Housing Units | 242 | 243 |
| Median Property Value | - | - |
| Median Household Income | - | - |
| Monthly Housing Costs | $229 | $7 |
| Real Estate Taxes | $227 | $14 |
Property Value by Mortgage Status in Sayre
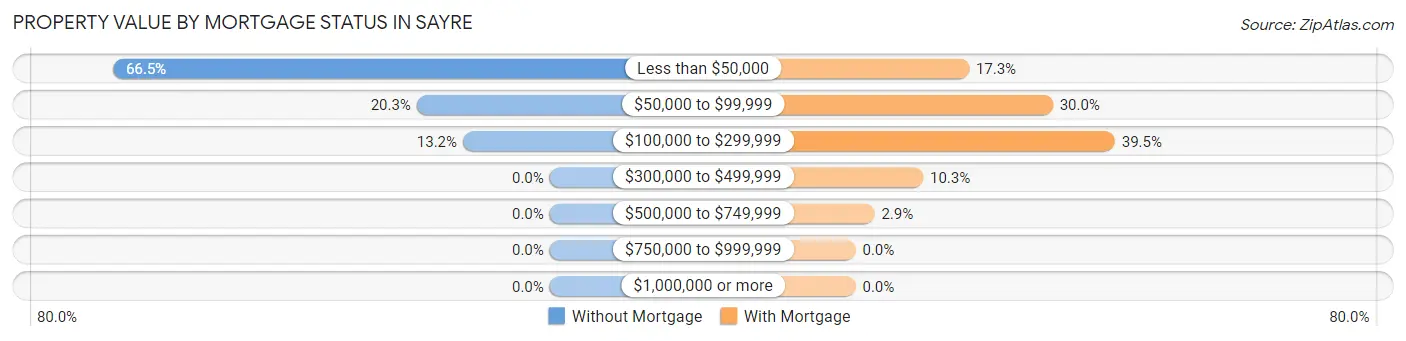
| Property Value | Without Mortgage | With Mortgage |
| Less than $50,000 | 161 (66.5%) | 42 (17.3%) |
| $50,000 to $99,999 | 49 (20.3%) | 73 (30.0%) |
| $100,000 to $299,999 | 32 (13.2%) | 96 (39.5%) |
| $300,000 to $499,999 | 0 (0.0%) | 25 (10.3%) |
| $500,000 to $749,999 | 0 (0.0%) | 7 (2.9%) |
| $750,000 to $999,999 | 0 (0.0%) | 0 (0.0%) |
| $1,000,000 or more | 0 (0.0%) | 0 (0.0%) |
| Total | 242 (100.0%) | 243 (100.0%) |
Household Income by Mortgage Status in Sayre
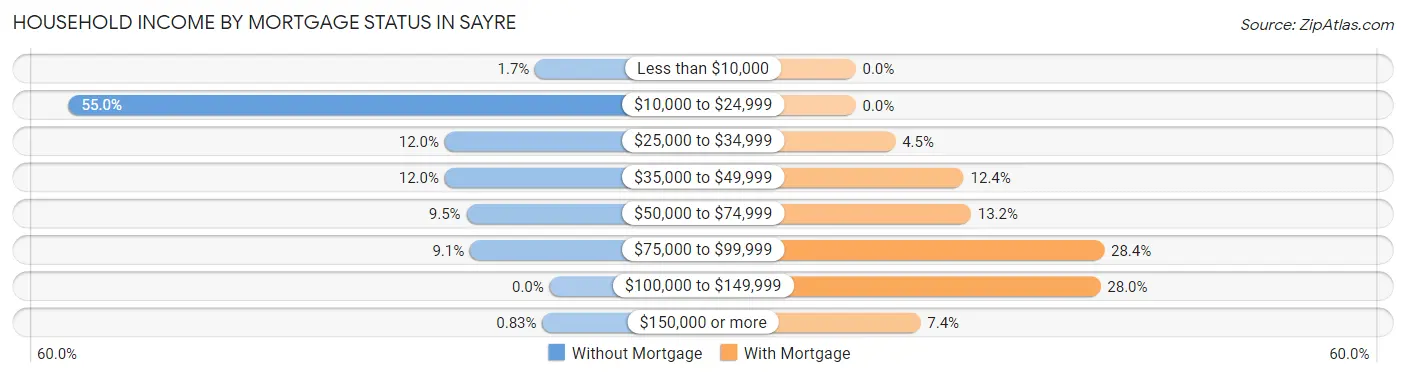
| Household Income | Without Mortgage | With Mortgage |
| Less than $10,000 | 4 (1.7%) | 0 (0.0%) |
| $10,000 to $24,999 | 133 (55.0%) | 0 (0.0%) |
| $25,000 to $34,999 | 29 (12.0%) | 11 (4.5%) |
| $35,000 to $49,999 | 29 (12.0%) | 30 (12.3%) |
| $50,000 to $74,999 | 23 (9.5%) | 32 (13.2%) |
| $75,000 to $99,999 | 22 (9.1%) | 69 (28.4%) |
| $100,000 to $149,999 | 0 (0.0%) | 68 (28.0%) |
| $150,000 or more | 2 (0.8%) | 18 (7.4%) |
| Total | 242 (100.0%) | 243 (100.0%) |
Property Value to Household Income Ratio in Sayre
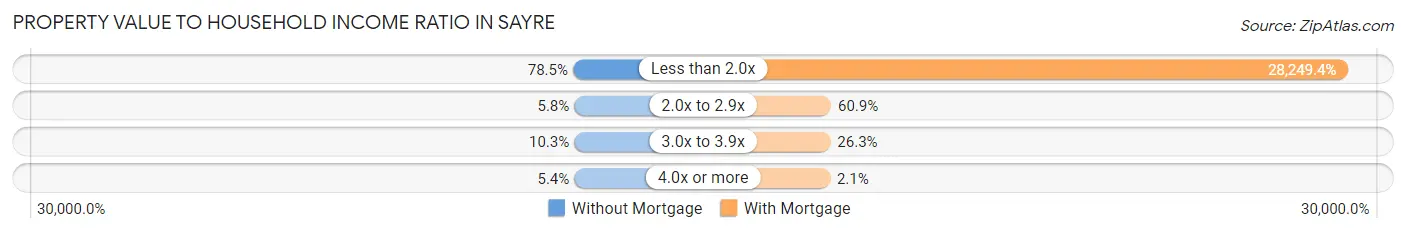
| Value-to-Income Ratio | Without Mortgage | With Mortgage |
| Less than 2.0x | 190 (78.5%) | 68,646 (28,249.4%) |
| 2.0x to 2.9x | 14 (5.8%) | 148 (60.9%) |
| 3.0x to 3.9x | 25 (10.3%) | 64 (26.3%) |
| 4.0x or more | 13 (5.4%) | 5 (2.1%) |
| Total | 242 (100.0%) | 243 (100.0%) |
Real Estate Taxes by Mortgage Status in Sayre
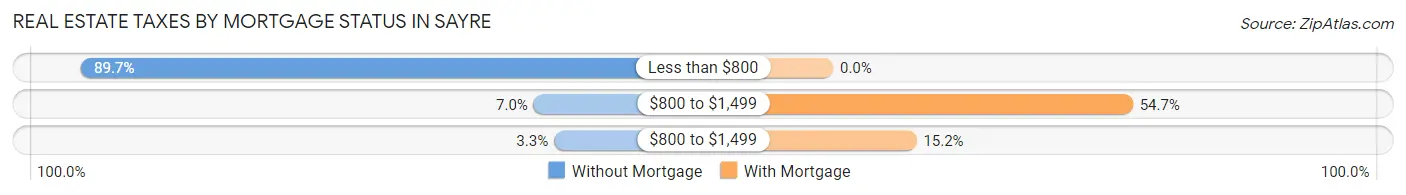
| Property Taxes | Without Mortgage | With Mortgage |
| Less than $800 | 217 (89.7%) | 0 (0.0%) |
| $800 to $1,499 | 17 (7.0%) | 133 (54.7%) |
| $800 to $1,499 | 8 (3.3%) | 37 (15.2%) |
| Total | 242 (100.0%) | 243 (100.0%) |
Health & Disability in Sayre
Health Insurance Coverage by Age in Sayre
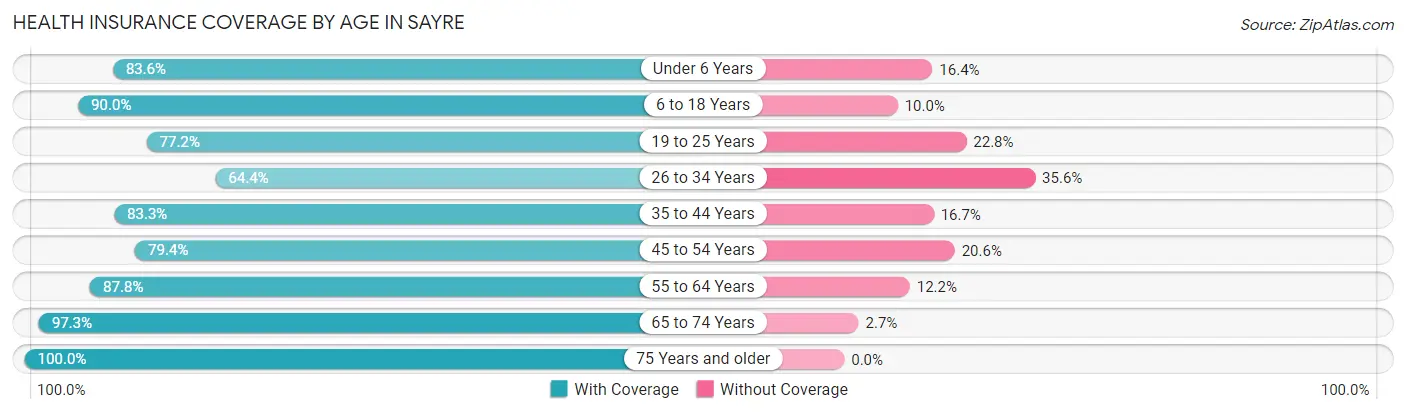
| Age Bracket | With Coverage | Without Coverage |
| Under 6 Years | 173 (83.6%) | 34 (16.4%) |
| 6 to 18 Years | 425 (90.0%) | 47 (10.0%) |
| 19 to 25 Years | 190 (77.2%) | 56 (22.8%) |
| 26 to 34 Years | 76 (64.4%) | 42 (35.6%) |
| 35 to 44 Years | 305 (83.3%) | 61 (16.7%) |
| 45 to 54 Years | 158 (79.4%) | 41 (20.6%) |
| 55 to 64 Years | 309 (87.8%) | 43 (12.2%) |
| 65 to 74 Years | 183 (97.3%) | 5 (2.7%) |
| 75 Years and older | 94 (100.0%) | 0 (0.0%) |
| Total | 1,913 (85.3%) | 329 (14.7%) |
Health Insurance Coverage by Citizenship Status in Sayre
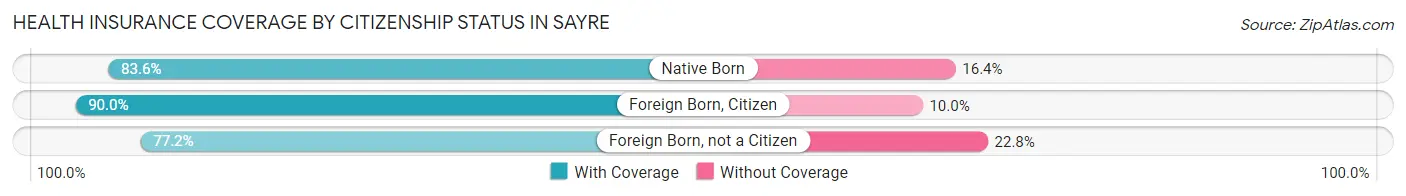
| Citizenship Status | With Coverage | Without Coverage |
| Native Born | 173 (83.6%) | 34 (16.4%) |
| Foreign Born, Citizen | 425 (90.0%) | 47 (10.0%) |
| Foreign Born, not a Citizen | 190 (77.2%) | 56 (22.8%) |
Health Insurance Coverage by Household Income in Sayre
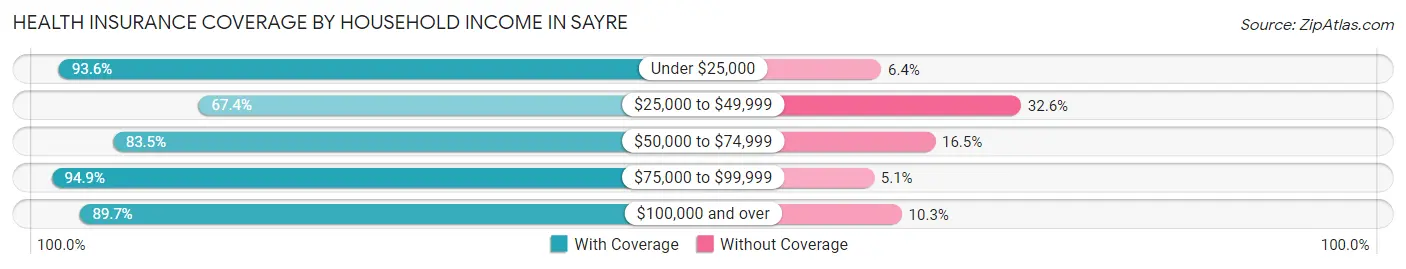
| Household Income | With Coverage | Without Coverage |
| Under $25,000 | 509 (93.6%) | 35 (6.4%) |
| $25,000 to $49,999 | 345 (67.4%) | 167 (32.6%) |
| $50,000 to $74,999 | 394 (83.5%) | 78 (16.5%) |
| $75,000 to $99,999 | 431 (94.9%) | 23 (5.1%) |
| $100,000 and over | 227 (89.7%) | 26 (10.3%) |
Public vs Private Health Insurance Coverage by Age in Sayre
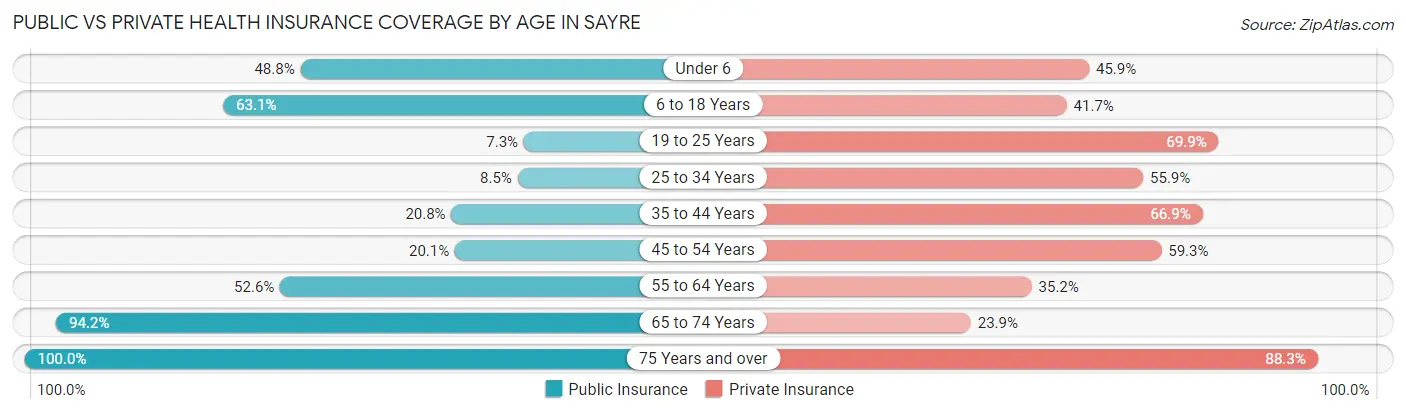
| Age Bracket | Public Insurance | Private Insurance |
| Under 6 | 101 (48.8%) | 95 (45.9%) |
| 6 to 18 Years | 298 (63.1%) | 197 (41.7%) |
| 19 to 25 Years | 18 (7.3%) | 172 (69.9%) |
| 25 to 34 Years | 10 (8.5%) | 66 (55.9%) |
| 35 to 44 Years | 76 (20.8%) | 245 (66.9%) |
| 45 to 54 Years | 40 (20.1%) | 118 (59.3%) |
| 55 to 64 Years | 185 (52.6%) | 124 (35.2%) |
| 65 to 74 Years | 177 (94.2%) | 45 (23.9%) |
| 75 Years and over | 94 (100.0%) | 83 (88.3%) |
| Total | 999 (44.6%) | 1,145 (51.1%) |
Disability Status by Sex by Age in Sayre
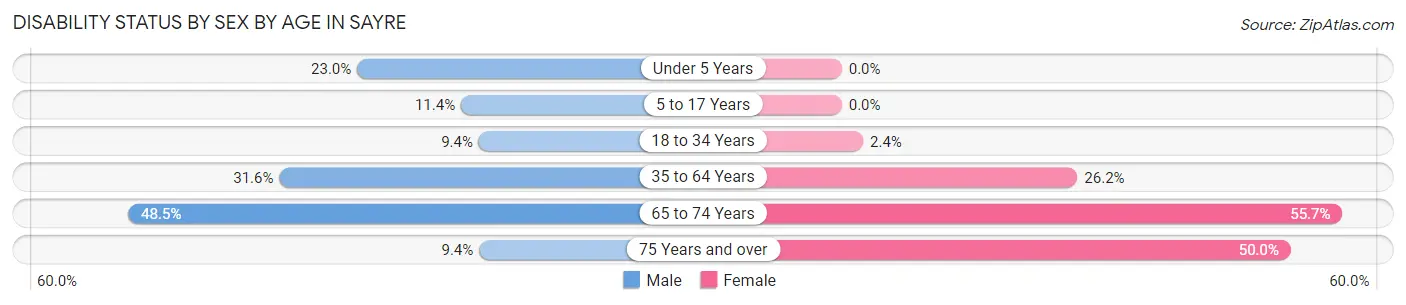
| Age Bracket | Male | Female |
| Under 5 Years | 17 (23.0%) | 0 (0.0%) |
| 5 to 17 Years | 22 (11.4%) | 0 (0.0%) |
| 18 to 34 Years | 26 (9.4%) | 4 (2.4%) |
| 35 to 64 Years | 131 (31.6%) | 132 (26.2%) |
| 65 to 74 Years | 32 (48.5%) | 68 (55.7%) |
| 75 Years and over | 3 (9.4%) | 31 (50.0%) |
Disability Class by Sex by Age in Sayre
Disability Class: Hearing Difficulty
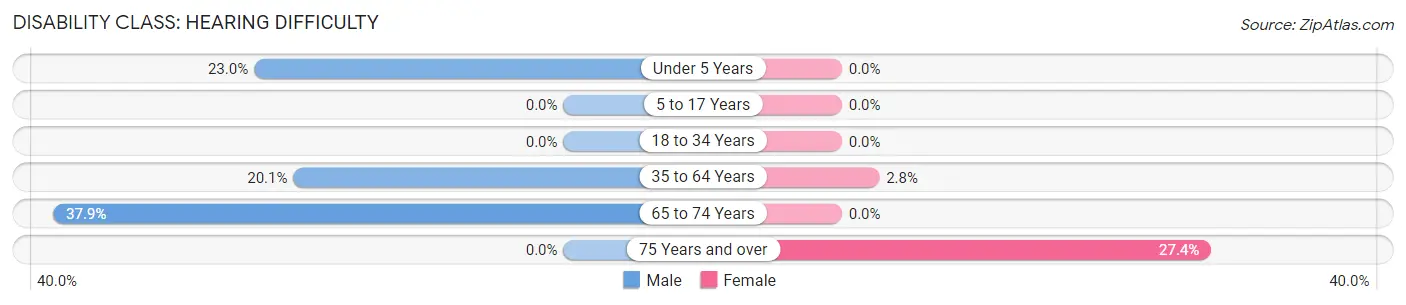
| Age Bracket | Male | Female |
| Under 5 Years | 17 (23.0%) | 0 (0.0%) |
| 5 to 17 Years | 0 (0.0%) | 0 (0.0%) |
| 18 to 34 Years | 0 (0.0%) | 0 (0.0%) |
| 35 to 64 Years | 83 (20.1%) | 14 (2.8%) |
| 65 to 74 Years | 25 (37.9%) | 0 (0.0%) |
| 75 Years and over | 0 (0.0%) | 17 (27.4%) |
Disability Class: Vision Difficulty
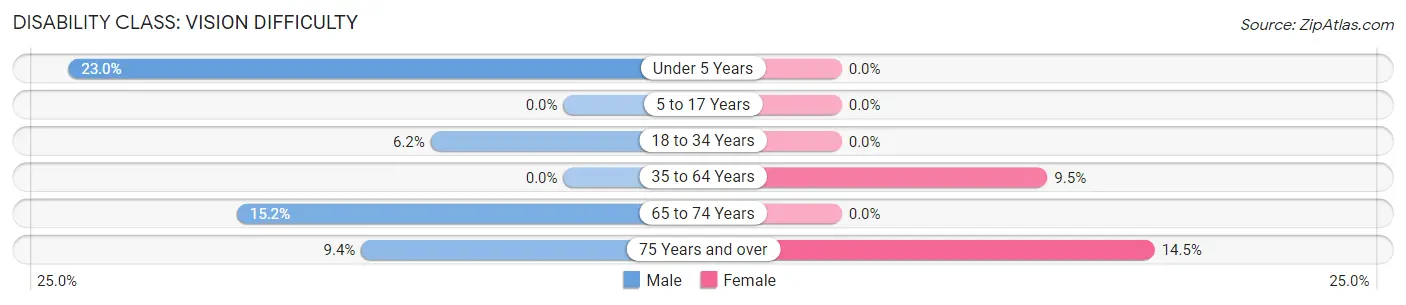
| Age Bracket | Male | Female |
| Under 5 Years | 17 (23.0%) | 0 (0.0%) |
| 5 to 17 Years | 0 (0.0%) | 0 (0.0%) |
| 18 to 34 Years | 17 (6.2%) | 0 (0.0%) |
| 35 to 64 Years | 0 (0.0%) | 48 (9.5%) |
| 65 to 74 Years | 10 (15.1%) | 0 (0.0%) |
| 75 Years and over | 3 (9.4%) | 9 (14.5%) |
Disability Class: Cognitive Difficulty
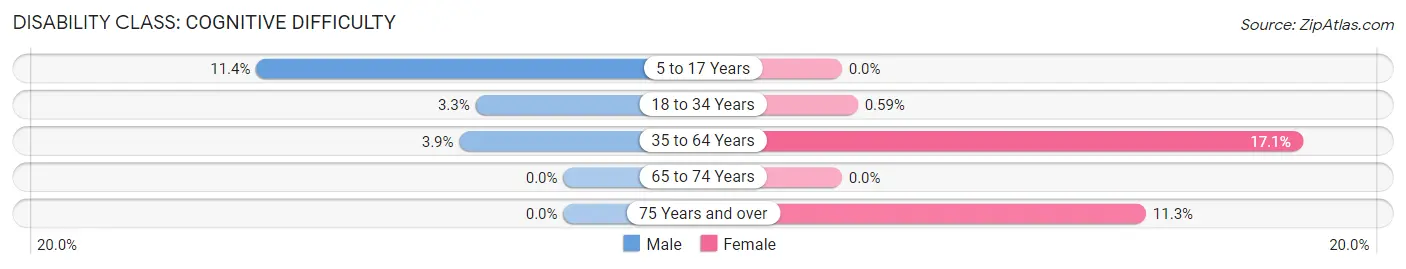
| Age Bracket | Male | Female |
| 5 to 17 Years | 22 (11.4%) | 0 (0.0%) |
| 18 to 34 Years | 9 (3.3%) | 1 (0.6%) |
| 35 to 64 Years | 16 (3.9%) | 86 (17.1%) |
| 65 to 74 Years | 0 (0.0%) | 0 (0.0%) |
| 75 Years and over | 0 (0.0%) | 7 (11.3%) |
Disability Class: Ambulatory Difficulty
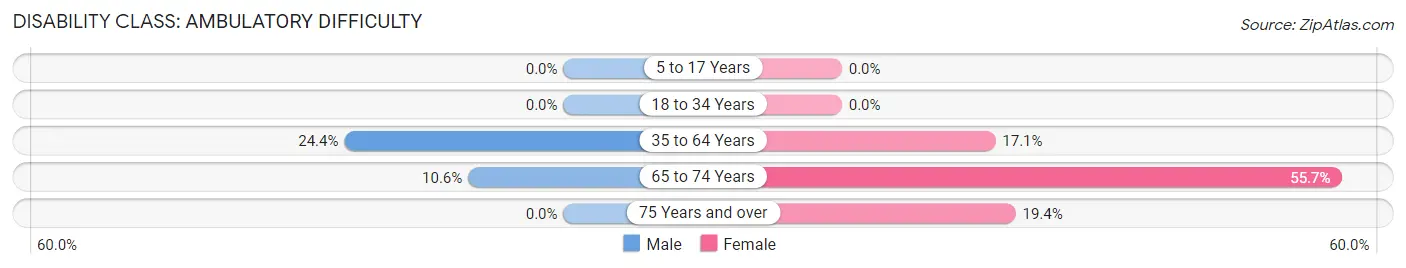
| Age Bracket | Male | Female |
| 5 to 17 Years | 0 (0.0%) | 0 (0.0%) |
| 18 to 34 Years | 0 (0.0%) | 0 (0.0%) |
| 35 to 64 Years | 101 (24.4%) | 86 (17.1%) |
| 65 to 74 Years | 7 (10.6%) | 68 (55.7%) |
| 75 Years and over | 0 (0.0%) | 12 (19.4%) |
Disability Class: Self-Care Difficulty
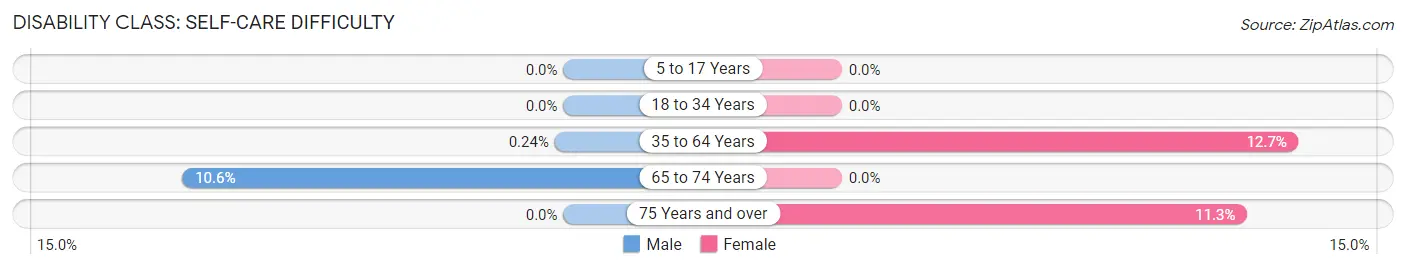
| Age Bracket | Male | Female |
| 5 to 17 Years | 0 (0.0%) | 0 (0.0%) |
| 18 to 34 Years | 0 (0.0%) | 0 (0.0%) |
| 35 to 64 Years | 1 (0.2%) | 64 (12.7%) |
| 65 to 74 Years | 7 (10.6%) | 0 (0.0%) |
| 75 Years and over | 0 (0.0%) | 7 (11.3%) |
Technology Access in Sayre
Computing Device Access in Sayre
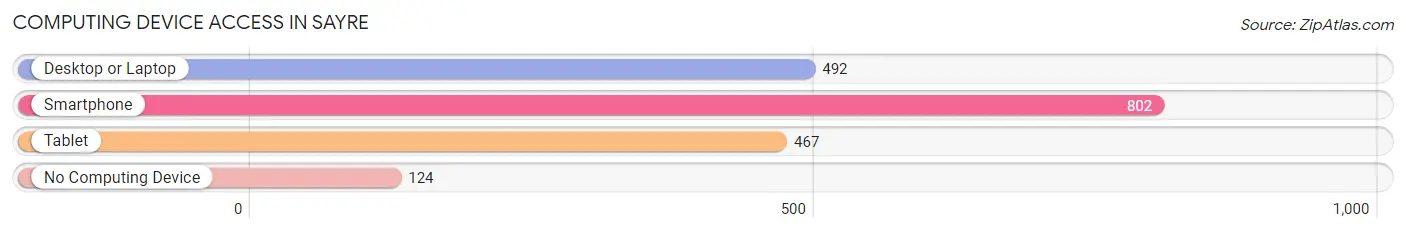
| Device Type | # Households | % Households |
| Desktop or Laptop | 492 | 51.9% |
| Smartphone | 802 | 84.6% |
| Tablet | 467 | 49.3% |
| No Computing Device | 124 | 13.1% |
| Total | 948 | 100.0% |
Internet Access in Sayre
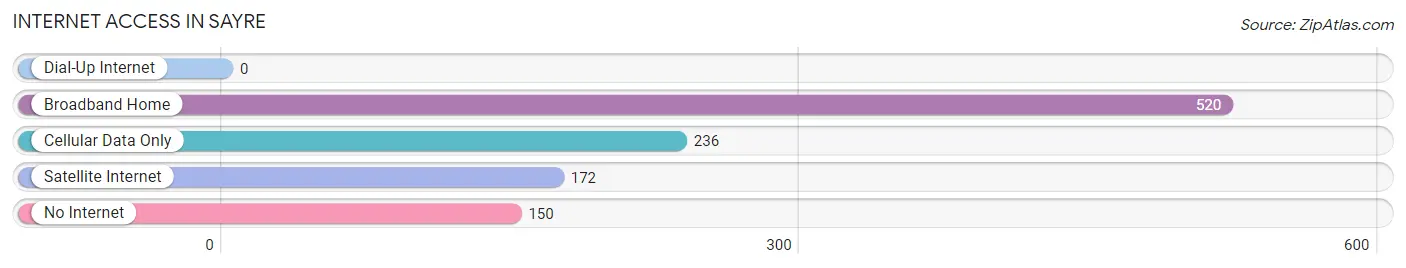
| Internet Type | # Households | % Households |
| Dial-Up Internet | 0 | 0.0% |
| Broadband Home | 520 | 54.8% |
| Cellular Data Only | 236 | 24.9% |
| Satellite Internet | 172 | 18.1% |
| No Internet | 150 | 15.8% |
| Total | 948 | 100.0% |
Sayre Summary
Sayre is a city located in Beckham County, Oklahoma. It is the county seat of Beckham County and is situated along the western border of the state. The population of Sayre was 3,845 at the 2010 census, an increase of 8.3% from the 2000 census.
History
Sayre was founded in 1901 by the Sayre Land and Townsite Company. The town was named after the company's president, William H. Sayre. The town was originally located in Greer County, Oklahoma, but was moved to Beckham County in 1907. The town was incorporated in 1909.
Geography
Sayre is located at the intersection of U.S. Route 283 and State Highway 152. It is situated in the western part of Oklahoma, approximately 100 miles west of Oklahoma City. The city has a total area of 4.2 square miles, all of which is land.
Economy
The economy of Sayre is largely based on agriculture and oil production. The city is home to several oil and gas companies, including Apache Corporation, Devon Energy, and Chesapeake Energy. The city also has a strong agricultural sector, with wheat, cotton, and sorghum being the main crops.
Demographics
As of the 2010 census, there were 3,845 people, 1,541 households, and 990 families residing in the city. The population density was 917.2 people per square mile. The racial makeup of the city was 81.2% White, 0.7% African American, 1.3% Native American, 0.3% Asian, 0.1% Pacific Islander, 14.2% from other races, and 2.3% from two or more races. Hispanic or Latino of any race were 22.3% of the population.
The median income for a household in the city was $30,938, and the median income for a family was $37,813. The per capita income for the city was $16,845. About 17.2% of families and 21.2% of the population were below the poverty line, including 28.3% of those under age 18 and 11.2% of those age 65 or over.
Conclusion
Sayre is a small city located in western Oklahoma. It is the county seat of Beckham County and has a population of 3,845 as of the 2010 census. The economy of Sayre is largely based on agriculture and oil production, and the city is home to several oil and gas companies. The racial makeup of the city is predominantly white, with a significant Hispanic or Latino population. The median income for a household in the city is $30,938, and the per capita income is $16,845.
Common Questions
What is Per Capita Income in Sayre?
Per Capita income in Sayre is $9,783.
What is the Median Family Income in Sayre?
Median Family Income in Sayre is $59,028.
What is the Median Household income in Sayre?
Median Household Income in Sayre is $45,859.
What is Income or Wage Gap in Sayre?
Income or Wage Gap in Sayre is 9.9%.
Women in Sayre earn 90.1 cents for every dollar earned by a man.
What is Inequality or Gini Index in Sayre?
Inequality or Gini Index in Sayre is 0.41.
What is the Total Population of Sayre?
Total Population of Sayre is 5,459.
What is the Total Male Population of Sayre?
Total Male Population of Sayre is 4,230.
What is the Total Female Population of Sayre?
Total Female Population of Sayre is 1,229.
What is the Ratio of Males per 100 Females in Sayre?
There are 344.18 Males per 100 Females in Sayre.
What is the Ratio of Females per 100 Males in Sayre?
There are 29.05 Females per 100 Males in Sayre.
What is the Median Population Age in Sayre?
Median Population Age in Sayre is 37.4 Years.
What is the Average Family Size in Sayre
Average Family Size in Sayre is 3.2 People.
What is the Average Household Size in Sayre
Average Household Size in Sayre is 2.4 People.
How Large is the Labor Force in Sayre?
There are 974 People in the Labor Forcein in Sayre.
What is the Percentage of People in the Labor Force in Sayre?
19.7% of People are in the Labor Force in Sayre.
What is the Unemployment Rate in Sayre?
Unemployment Rate in Sayre is 12.3%.