Sand Springs, OK Map & Demographics
Sand Springs Map
Sand Springs Overview
$32,237
PER CAPITA INCOME
$83,727
AVG FAMILY INCOME
$70,431
AVG HOUSEHOLD INCOME
26.0%
WAGE / INCOME GAP [ % ]
74.0¢/ $1
WAGE / INCOME GAP [ $ ]
0.40
INEQUALITY / GINI INDEX
19,925
TOTAL POPULATION
9,836
MALE POPULATION
10,089
FEMALE POPULATION
97.49
MALES / 100 FEMALES
102.57
FEMALES / 100 MALES
36.6
MEDIAN AGE
3.2
AVG FAMILY SIZE
2.7
AVG HOUSEHOLD SIZE
9,622
LABOR FORCE [ PEOPLE ]
62.6%
PERCENT IN LABOR FORCE
4.5%
UNEMPLOYMENT RATE
Sand Springs Zip Codes
Sand Springs Area Codes
Income in Sand Springs
Income Overview in Sand Springs
Per Capita Income in Sand Springs is $32,237, while median incomes of families and households are $83,727 and $70,431 respectively.
| Characteristic | Number | Measure |
| Per Capita Income | 19,925 | $32,237 |
| Median Family Income | 5,223 | $83,727 |
| Mean Family Income | 5,223 | $97,030 |
| Median Household Income | 7,427 | $70,431 |
| Mean Household Income | 7,427 | $85,372 |
| Income Deficit | 5,223 | $0 |
| Wage / Income Gap (%) | 19,925 | 25.97% |
| Wage / Income Gap ($) | 19,925 | 74.03¢ per $1 |
| Gini / Inequality Index | 19,925 | 0.40 |
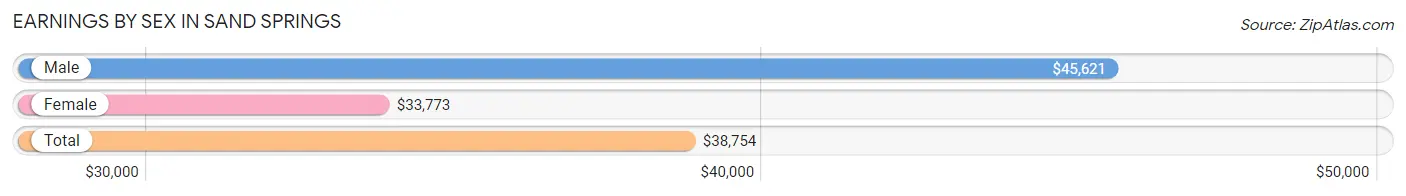
Earnings by Sex in Sand Springs
Average Earnings in Sand Springs are $38,754, $45,621 for men and $33,773 for women, a difference of 26.0%.
| Sex | Number | Average Earnings |
| Male | 5,257 (52.2%) | $45,621 |
| Female | 4,812 (47.8%) | $33,773 |
| Total | 10,069 (100.0%) | $38,754 |
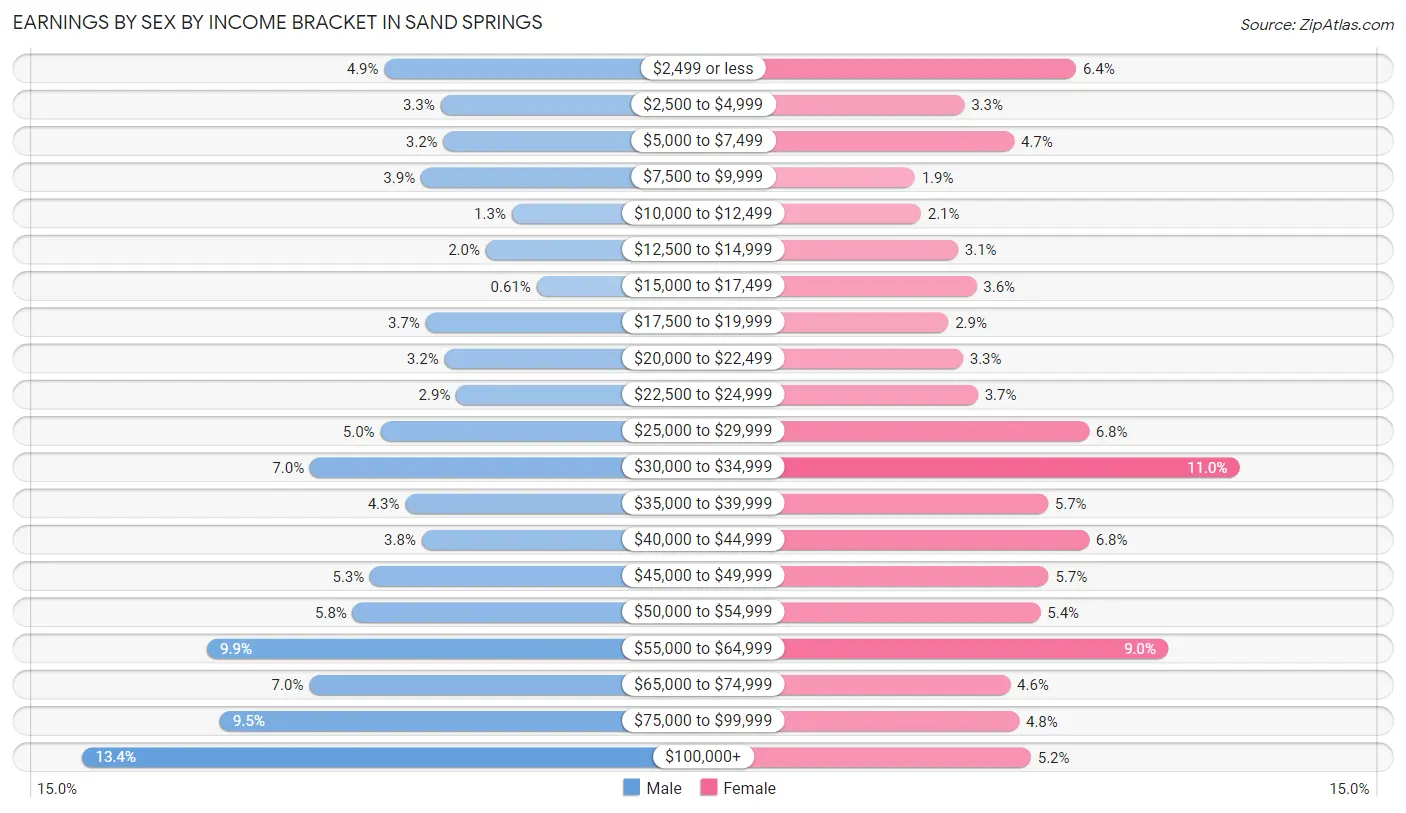
Earnings by Sex by Income Bracket in Sand Springs
The most common earnings brackets in Sand Springs are $100,000+ for men (703 | 13.4%) and $30,000 to $34,999 for women (531 | 11.0%).
| Income | Male | Female |
| $2,499 or less | 257 (4.9%) | 310 (6.4%) |
| $2,500 to $4,999 | 174 (3.3%) | 159 (3.3%) |
| $5,000 to $7,499 | 170 (3.2%) | 226 (4.7%) |
| $7,500 to $9,999 | 203 (3.9%) | 92 (1.9%) |
| $10,000 to $12,499 | 69 (1.3%) | 100 (2.1%) |
| $12,500 to $14,999 | 107 (2.0%) | 150 (3.1%) |
| $15,000 to $17,499 | 32 (0.6%) | 175 (3.6%) |
| $17,500 to $19,999 | 196 (3.7%) | 137 (2.9%) |
| $20,000 to $22,499 | 168 (3.2%) | 157 (3.3%) |
| $22,500 to $24,999 | 151 (2.9%) | 177 (3.7%) |
| $25,000 to $29,999 | 263 (5.0%) | 327 (6.8%) |
| $30,000 to $34,999 | 367 (7.0%) | 531 (11.0%) |
| $35,000 to $39,999 | 226 (4.3%) | 272 (5.7%) |
| $40,000 to $44,999 | 202 (3.8%) | 327 (6.8%) |
| $45,000 to $49,999 | 278 (5.3%) | 273 (5.7%) |
| $50,000 to $54,999 | 304 (5.8%) | 262 (5.4%) |
| $55,000 to $64,999 | 519 (9.9%) | 434 (9.0%) |
| $65,000 to $74,999 | 368 (7.0%) | 221 (4.6%) |
| $75,000 to $99,999 | 500 (9.5%) | 233 (4.8%) |
| $100,000+ | 703 (13.4%) | 249 (5.2%) |
| Total | 5,257 (100.0%) | 4,812 (100.0%) |
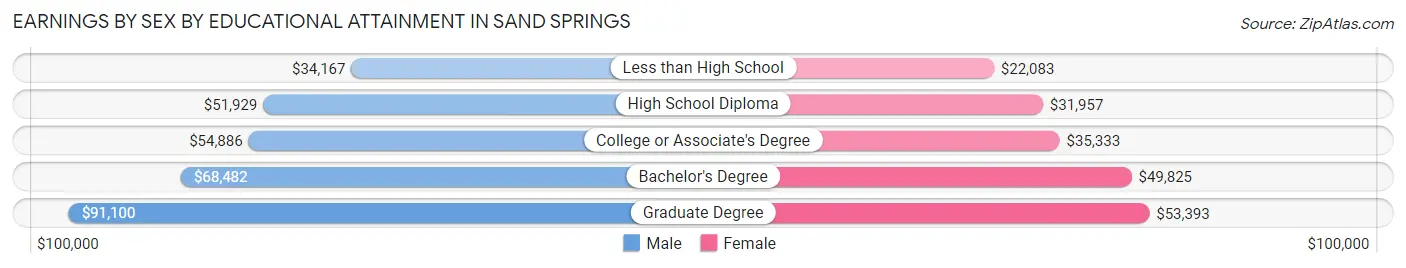
Earnings by Sex by Educational Attainment in Sand Springs
Average earnings in Sand Springs are $54,982 for men and $38,491 for women, a difference of 30.0%. Men with an educational attainment of graduate degree enjoy the highest average annual earnings of $91,100, while those with less than high school education earn the least with $34,167. Women with an educational attainment of graduate degree earn the most with the average annual earnings of $53,393, while those with less than high school education have the smallest earnings of $22,083.
| Educational Attainment | Male Income | Female Income |
| Less than High School | $34,167 | $22,083 |
| High School Diploma | $51,929 | $31,957 |
| College or Associate's Degree | $54,886 | $35,333 |
| Bachelor's Degree | $68,482 | $49,825 |
| Graduate Degree | $91,100 | $53,393 |
| Total | $54,982 | $38,491 |
Family Income in Sand Springs
Family Income Brackets in Sand Springs
According to the Sand Springs family income data, there are 1,306 families falling into the $100,000 to $149,999 income range, which is the most common income bracket and makes up 25.0% of all families. Conversely, the less than $10,000 income bracket is the least frequent group with only 52 families (1.0%) belonging to this category.
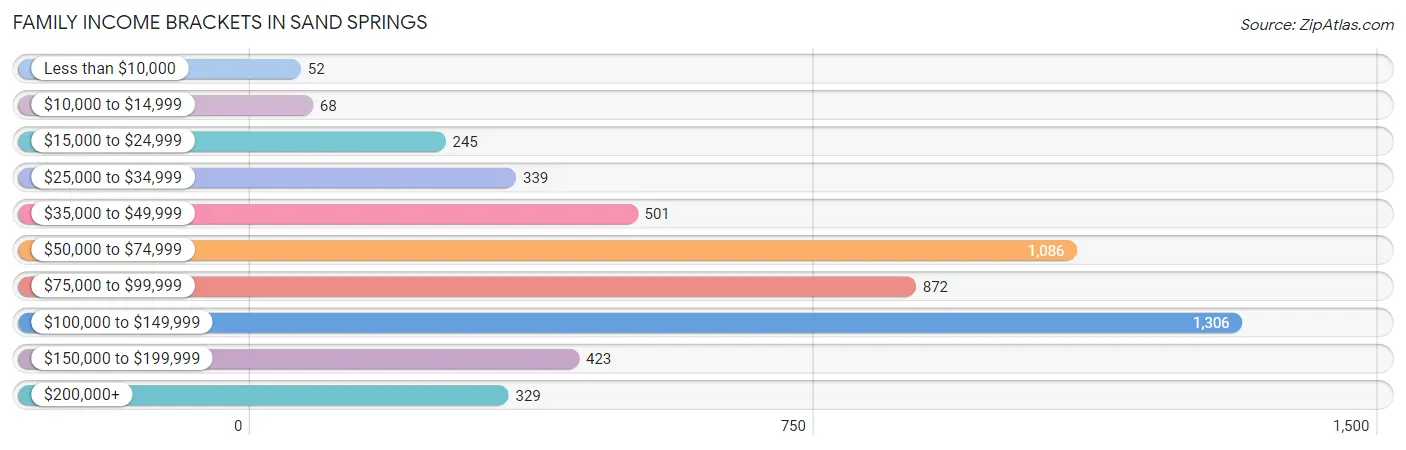
| Income Bracket | # Families | % Families |
| Less than $10,000 | 52 | 1.0% |
| $10,000 to $14,999 | 68 | 1.3% |
| $15,000 to $24,999 | 245 | 4.7% |
| $25,000 to $34,999 | 339 | 6.5% |
| $35,000 to $49,999 | 501 | 9.6% |
| $50,000 to $74,999 | 1,086 | 20.8% |
| $75,000 to $99,999 | 872 | 16.7% |
| $100,000 to $149,999 | 1,306 | 25.0% |
| $150,000 to $199,999 | 423 | 8.1% |
| $200,000+ | 329 | 6.3% |
Family Income by Famaliy Size in Sand Springs
6-person families (158 | 3.0%) account for the highest median family income in Sand Springs with $109,318 per family, while 2-person families (2,421 | 46.4%) have the highest median income of $34,606 per family member.
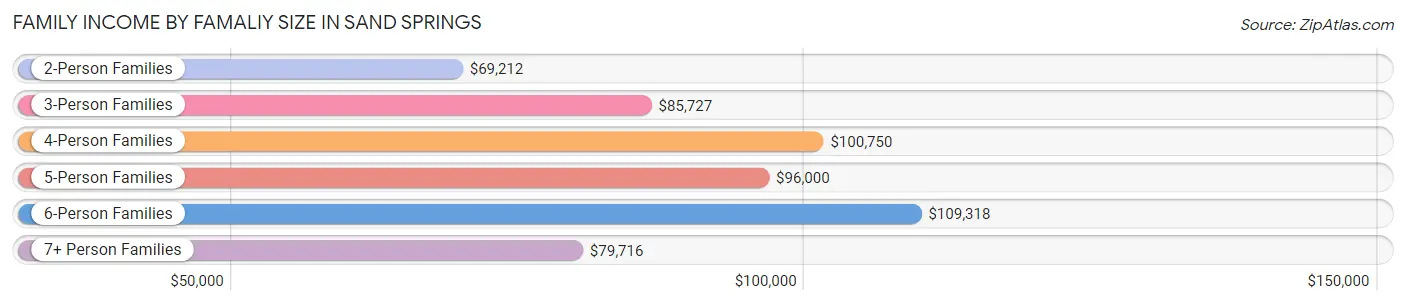
| Income Bracket | # Families | Median Income |
| 2-Person Families | 2,421 (46.4%) | $69,212 |
| 3-Person Families | 1,037 (19.9%) | $85,727 |
| 4-Person Families | 1,026 (19.6%) | $100,750 |
| 5-Person Families | 482 (9.2%) | $96,000 |
| 6-Person Families | 158 (3.0%) | $109,318 |
| 7+ Person Families | 99 (1.9%) | $79,716 |
| Total | 5,223 (100.0%) | $83,727 |
Family Income by Number of Earners in Sand Springs
The median family income in Sand Springs is $83,727, with families comprising 3+ earners (788) having the highest median family income of $132,969, while families with 1 earner (1,577) have the lowest median family income of $53,558, accounting for 15.1% and 30.2% of families, respectively.
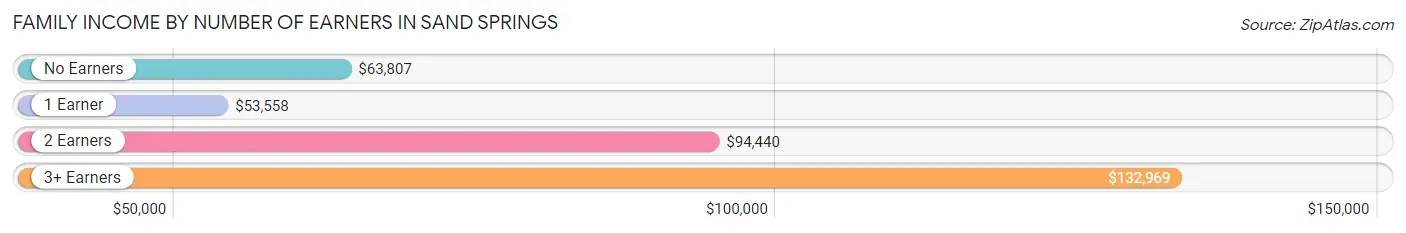
| Number of Earners | # Families | Median Income |
| No Earners | 857 (16.4%) | $63,807 |
| 1 Earner | 1,577 (30.2%) | $53,558 |
| 2 Earners | 2,001 (38.3%) | $94,440 |
| 3+ Earners | 788 (15.1%) | $132,969 |
| Total | 5,223 (100.0%) | $83,727 |
Household Income in Sand Springs
Household Income Brackets in Sand Springs
With 1,552 households falling in the category, the $100,000 to $149,999 income range is the most frequent in Sand Springs, accounting for 20.9% of all households. In contrast, only 238 households (3.2%) fall into the $10,000 to $14,999 income bracket, making it the least populous group.
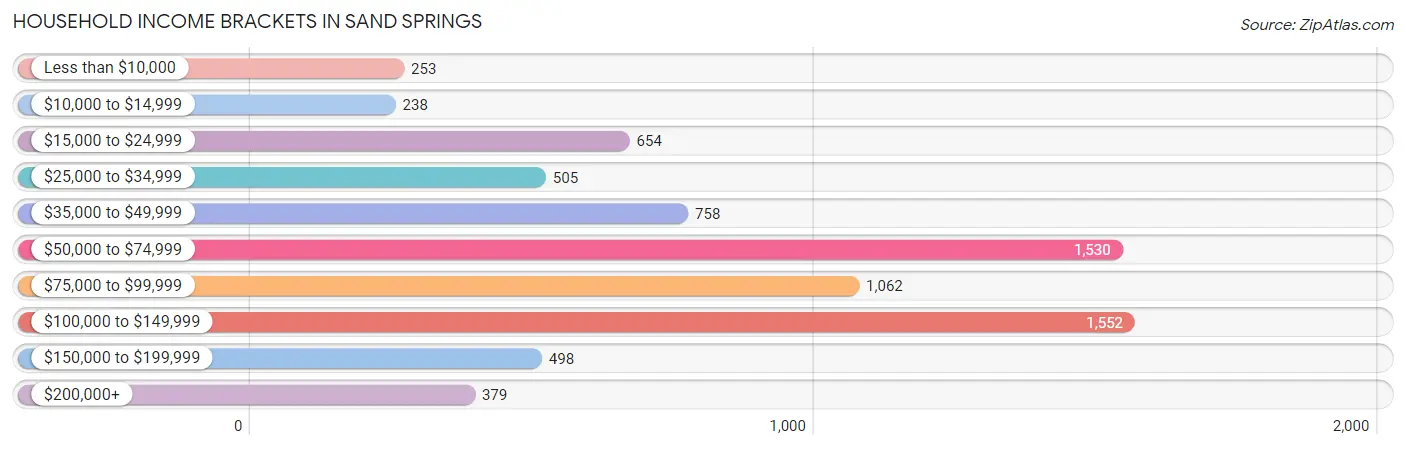
| Income Bracket | # Households | % Households |
| Less than $10,000 | 253 | 3.4% |
| $10,000 to $14,999 | 238 | 3.2% |
| $15,000 to $24,999 | 654 | 8.8% |
| $25,000 to $34,999 | 505 | 6.8% |
| $35,000 to $49,999 | 758 | 10.2% |
| $50,000 to $74,999 | 1,530 | 20.6% |
| $75,000 to $99,999 | 1,062 | 14.3% |
| $100,000 to $149,999 | 1,552 | 20.9% |
| $150,000 to $199,999 | 498 | 6.7% |
| $200,000+ | 379 | 5.1% |
Household Income by Householder Age in Sand Springs
The median household income in Sand Springs is $70,431, with the highest median household income of $84,321 found in the 45 to 64 years age bracket for the primary householder. A total of 2,422 households (32.6%) fall into this category. Meanwhile, the 65+ years age bracket for the primary householder has the lowest median household income of $57,627, with 2,460 households (33.1%) in this group.
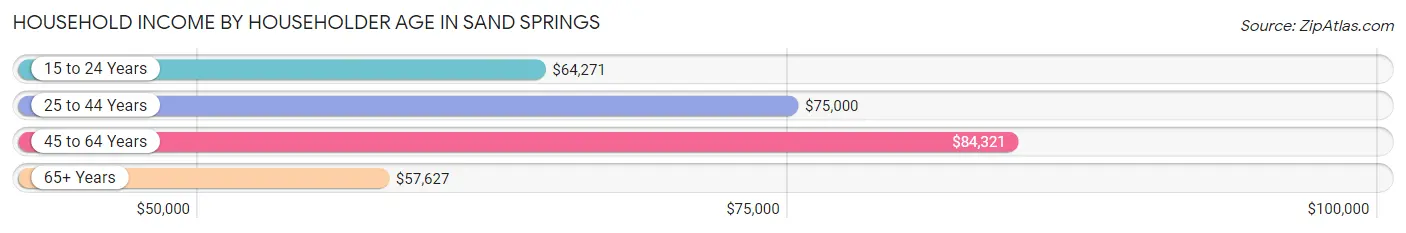
| Income Bracket | # Households | Median Income |
| 15 to 24 Years | 243 (3.3%) | $64,271 |
| 25 to 44 Years | 2,302 (31.0%) | $75,000 |
| 45 to 64 Years | 2,422 (32.6%) | $84,321 |
| 65+ Years | 2,460 (33.1%) | $57,627 |
| Total | 7,427 (100.0%) | $70,431 |
Poverty in Sand Springs
Income Below Poverty by Sex and Age in Sand Springs
With 7.9% poverty level for males and 13.6% for females among the residents of Sand Springs, 12 to 14 year old males and under 5 year old females are the most vulnerable to poverty, with 76 males (12.3%) and 223 females (34.4%) in their respective age groups living below the poverty level.
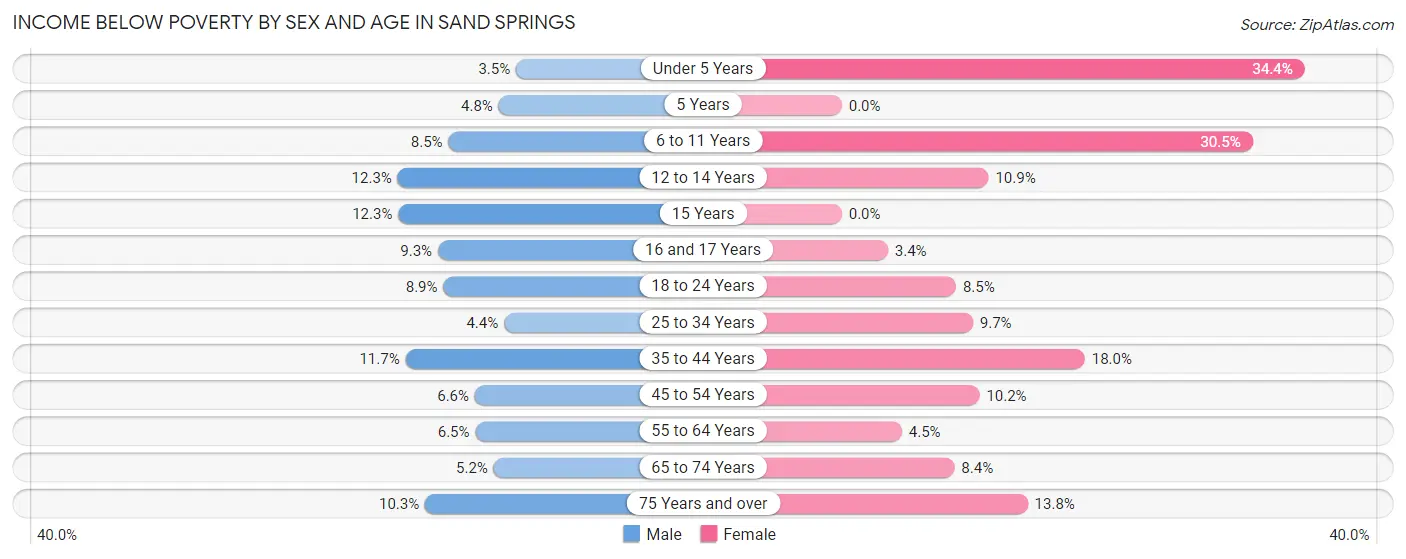
| Age Bracket | Male | Female |
| Under 5 Years | 20 (3.5%) | 223 (34.4%) |
| 5 Years | 6 (4.8%) | 0 (0.0%) |
| 6 to 11 Years | 72 (8.5%) | 289 (30.5%) |
| 12 to 14 Years | 76 (12.3%) | 50 (10.9%) |
| 15 Years | 19 (12.3%) | 0 (0.0%) |
| 16 and 17 Years | 31 (9.3%) | 9 (3.4%) |
| 18 to 24 Years | 100 (8.9%) | 71 (8.5%) |
| 25 to 34 Years | 47 (4.4%) | 108 (9.7%) |
| 35 to 44 Years | 151 (11.7%) | 254 (18.0%) |
| 45 to 54 Years | 71 (6.6%) | 110 (10.2%) |
| 55 to 64 Years | 66 (6.5%) | 55 (4.5%) |
| 65 to 74 Years | 44 (5.2%) | 94 (8.4%) |
| 75 Years and over | 75 (10.3%) | 98 (13.8%) |
| Total | 778 (7.9%) | 1,361 (13.6%) |
Income Above Poverty by Sex and Age in Sand Springs
According to the poverty statistics in Sand Springs, males aged under 5 years and females aged 5 years are the age groups that are most secure financially, with 96.5% of males and 100.0% of females in these age groups living above the poverty line.
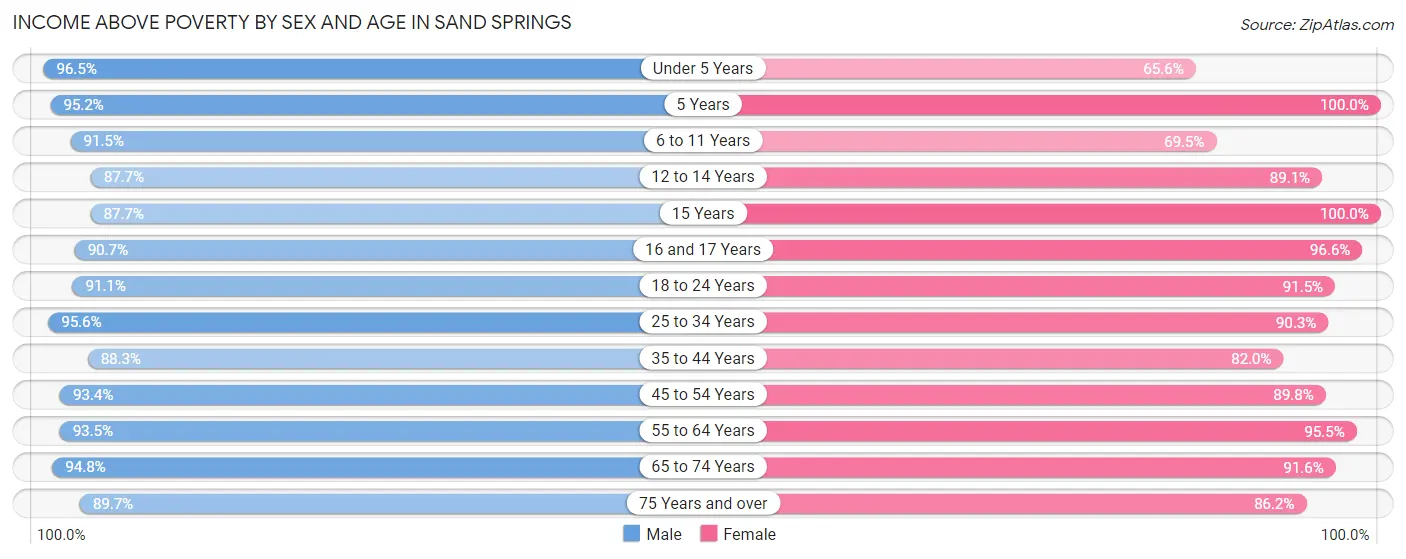
| Age Bracket | Male | Female |
| Under 5 Years | 550 (96.5%) | 426 (65.6%) |
| 5 Years | 119 (95.2%) | 35 (100.0%) |
| 6 to 11 Years | 772 (91.5%) | 659 (69.5%) |
| 12 to 14 Years | 542 (87.7%) | 409 (89.1%) |
| 15 Years | 136 (87.7%) | 128 (100.0%) |
| 16 and 17 Years | 302 (90.7%) | 254 (96.6%) |
| 18 to 24 Years | 1,022 (91.1%) | 766 (91.5%) |
| 25 to 34 Years | 1,022 (95.6%) | 1,002 (90.3%) |
| 35 to 44 Years | 1,137 (88.3%) | 1,154 (82.0%) |
| 45 to 54 Years | 1,009 (93.4%) | 966 (89.8%) |
| 55 to 64 Years | 945 (93.5%) | 1,178 (95.5%) |
| 65 to 74 Years | 807 (94.8%) | 1,031 (91.6%) |
| 75 Years and over | 655 (89.7%) | 612 (86.2%) |
| Total | 9,018 (92.1%) | 8,620 (86.4%) |
Income Below Poverty Among Married-Couple Families in Sand Springs
The poverty statistics for married-couple families in Sand Springs show that 4.2% or 160 of the total 3,856 families live below the poverty line. Families with 3 or 4 children have the highest poverty rate of 17.7%, comprising of 51 families. On the other hand, families with 5 or more children have the lowest poverty rate of 0.0%, which includes 0 families.
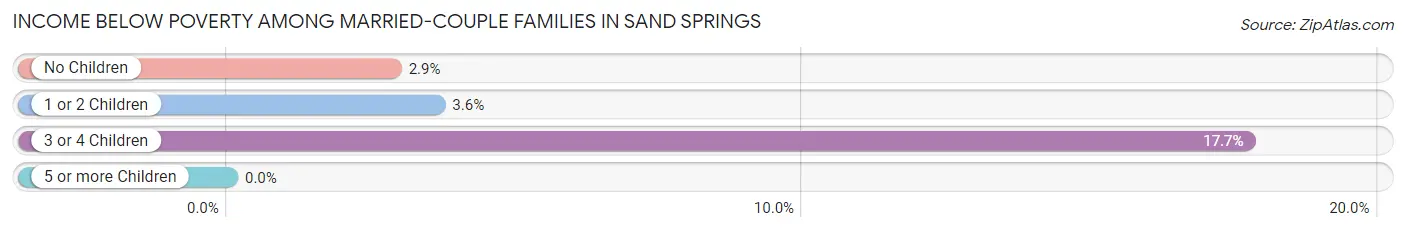
| Children | Above Poverty | Below Poverty |
| No Children | 2,217 (97.2%) | 65 (2.9%) |
| 1 or 2 Children | 1,176 (96.4%) | 44 (3.6%) |
| 3 or 4 Children | 237 (82.3%) | 51 (17.7%) |
| 5 or more Children | 66 (100.0%) | 0 (0.0%) |
| Total | 3,696 (95.9%) | 160 (4.2%) |
Income Below Poverty Among Single-Parent Households in Sand Springs
According to the poverty data in Sand Springs, 5.5% or 23 single-father households and 12.2% or 115 single-mother households are living below the poverty line. Among single-father households, those with no children have the highest poverty rate, with 11 households (7.7%) experiencing poverty. Likewise, among single-mother households, those with 3 or 4 children have the highest poverty rate, with 32 households (19.9%) falling below the poverty line.
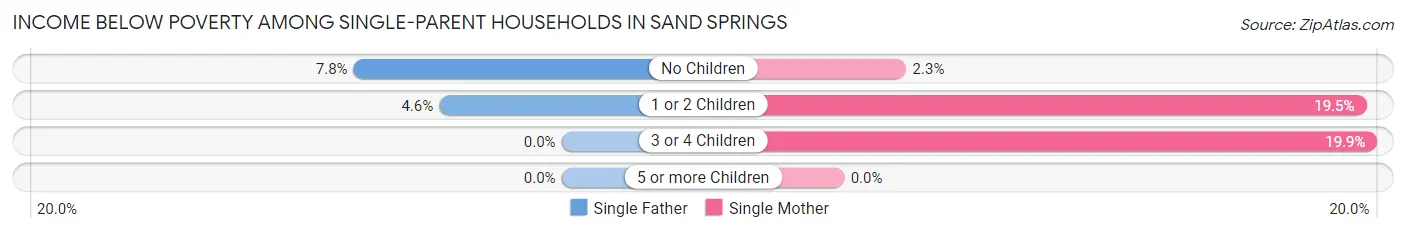
| Children | Single Father | Single Mother |
| No Children | 11 (7.7%) | 9 (2.3%) |
| 1 or 2 Children | 12 (4.6%) | 74 (19.5%) |
| 3 or 4 Children | 0 (0.0%) | 32 (19.9%) |
| 5 or more Children | 0 (0.0%) | 0 (0.0%) |
| Total | 23 (5.5%) | 115 (12.2%) |
Income Below Poverty Among Married-Couple vs Single-Parent Households in Sand Springs
The poverty data for Sand Springs shows that 160 of the married-couple family households (4.2%) and 138 of the single-parent households (10.1%) are living below the poverty level. Within the married-couple family households, those with 3 or 4 children have the highest poverty rate, with 51 households (17.7%) falling below the poverty line. Among the single-parent households, those with 3 or 4 children have the highest poverty rate, with 32 household (18.1%) living below poverty.
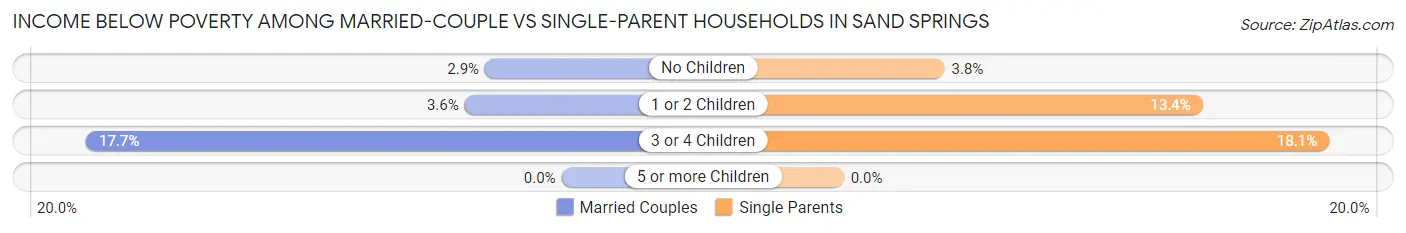
| Children | Married-Couple Families | Single-Parent Households |
| No Children | 65 (2.9%) | 20 (3.8%) |
| 1 or 2 Children | 44 (3.6%) | 86 (13.4%) |
| 3 or 4 Children | 51 (17.7%) | 32 (18.1%) |
| 5 or more Children | 0 (0.0%) | 0 (0.0%) |
| Total | 160 (4.2%) | 138 (10.1%) |
Race in Sand Springs
The most populous races in Sand Springs are White / Caucasian (15,937 | 80.0%), Two or more Races (1,741 | 8.7%), and Native / Alaskan (1,462 | 7.3%).
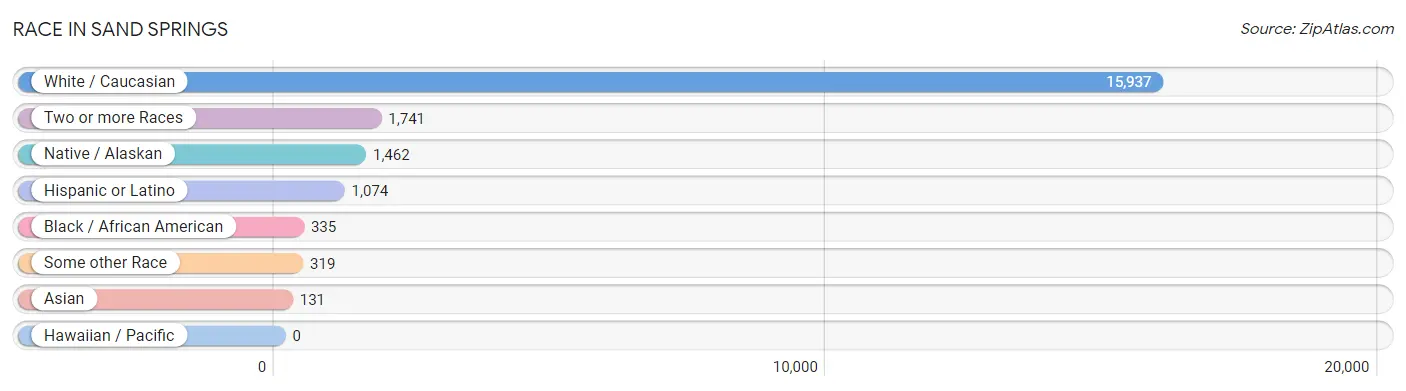
| Race | # Population | % Population |
| Asian | 131 | 0.7% |
| Black / African American | 335 | 1.7% |
| Hawaiian / Pacific | 0 | 0.0% |
| Hispanic or Latino | 1,074 | 5.4% |
| Native / Alaskan | 1,462 | 7.3% |
| White / Caucasian | 15,937 | 80.0% |
| Two or more Races | 1,741 | 8.7% |
| Some other Race | 319 | 1.6% |
| Total | 19,925 | 100.0% |
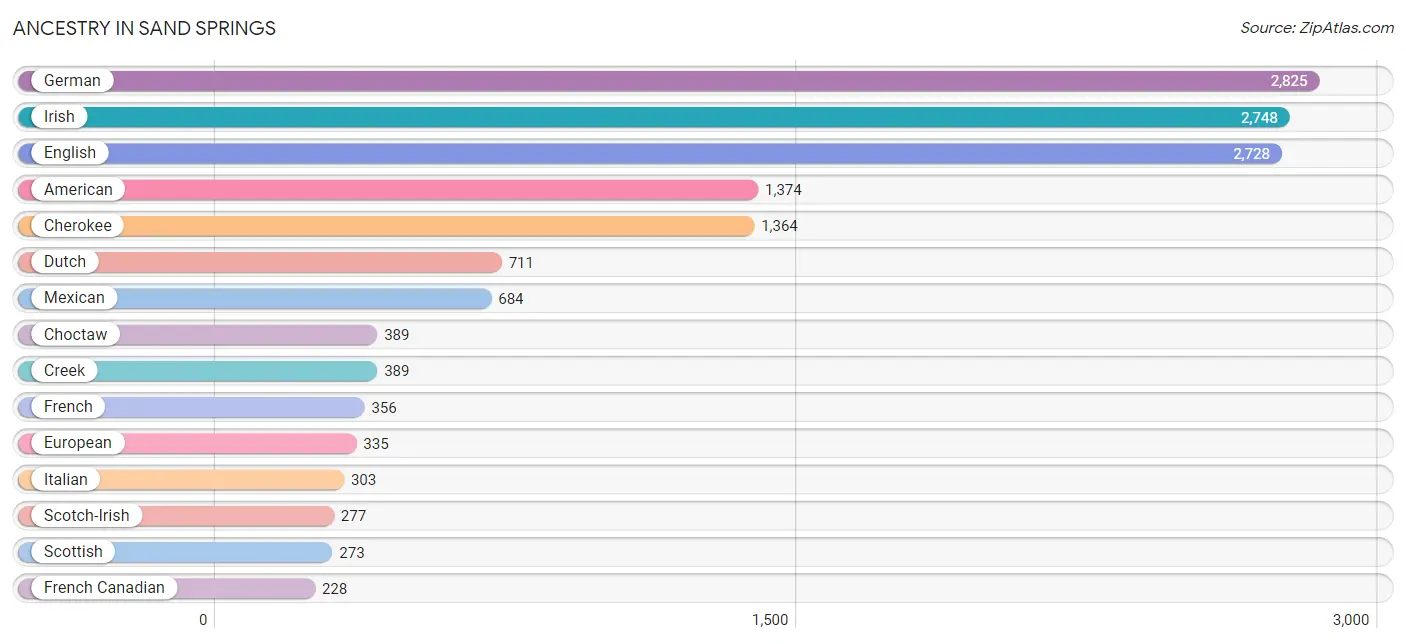
Ancestry in Sand Springs
The most populous ancestries reported in Sand Springs are German (2,825 | 14.2%), Irish (2,748 | 13.8%), English (2,728 | 13.7%), American (1,374 | 6.9%), and Cherokee (1,364 | 6.9%), together accounting for 55.4% of all Sand Springs residents.
| Ancestry | # Population | % Population |
| African | 56 | 0.3% |
| American | 1,374 | 6.9% |
| Apache | 13 | 0.1% |
| Arab | 55 | 0.3% |
| Arapaho | 3 | 0.0% |
| Bangladeshi | 20 | 0.1% |
| Bhutanese | 39 | 0.2% |
| Blackfeet | 11 | 0.1% |
| Brazilian | 17 | 0.1% |
| British | 102 | 0.5% |
| Burmese | 13 | 0.1% |
| Cajun | 14 | 0.1% |
| Canadian | 26 | 0.1% |
| Central American | 116 | 0.6% |
| Central American Indian | 56 | 0.3% |
| Cherokee | 1,364 | 6.9% |
| Cheyenne | 10 | 0.1% |
| Chickasaw | 89 | 0.4% |
| Choctaw | 389 | 1.9% |
| Colombian | 3 | 0.0% |
| Comanche | 37 | 0.2% |
| Creek | 389 | 1.9% |
| Cuban | 113 | 0.6% |
| Czech | 33 | 0.2% |
| Danish | 112 | 0.6% |
| Dutch | 711 | 3.6% |
| Dutch West Indian | 135 | 0.7% |
| Eastern European | 62 | 0.3% |
| English | 2,728 | 13.7% |
| European | 335 | 1.7% |
| French | 356 | 1.8% |
| French Canadian | 228 | 1.1% |
| German | 2,825 | 14.2% |
| German Russian | 19 | 0.1% |
| Guatemalan | 26 | 0.1% |
| Hungarian | 5 | 0.0% |
| Indian (Asian) | 49 | 0.3% |
| Irish | 2,748 | 13.8% |
| Iroquois | 10 | 0.1% |
| Israeli | 40 | 0.2% |
| Italian | 303 | 1.5% |
| Kiowa | 10 | 0.1% |
| Korean | 31 | 0.2% |
| Lebanese | 34 | 0.2% |
| Mexican | 684 | 3.4% |
| Mexican American Indian | 30 | 0.2% |
| Nicaraguan | 16 | 0.1% |
| Norwegian | 156 | 0.8% |
| Osage | 23 | 0.1% |
| Pakistani | 28 | 0.1% |
| Panamanian | 21 | 0.1% |
| Peruvian | 15 | 0.1% |
| Polish | 105 | 0.5% |
| Potawatomi | 70 | 0.4% |
| Puerto Rican | 95 | 0.5% |
| Russian | 16 | 0.1% |
| Salvadoran | 53 | 0.3% |
| Scandinavian | 118 | 0.6% |
| Scotch-Irish | 277 | 1.4% |
| Scottish | 273 | 1.4% |
| Seminole | 40 | 0.2% |
| Sioux | 23 | 0.1% |
| Slavic | 37 | 0.2% |
| South American | 18 | 0.1% |
| Spaniard | 10 | 0.1% |
| Spanish | 5 | 0.0% |
| Subsaharan African | 81 | 0.4% |
| Swedish | 93 | 0.5% |
| Swiss | 224 | 1.1% |
| Syrian | 12 | 0.1% |
| Thai | 15 | 0.1% |
| Turkish | 13 | 0.1% |
| Welsh | 78 | 0.4% | View All 73 Rows |
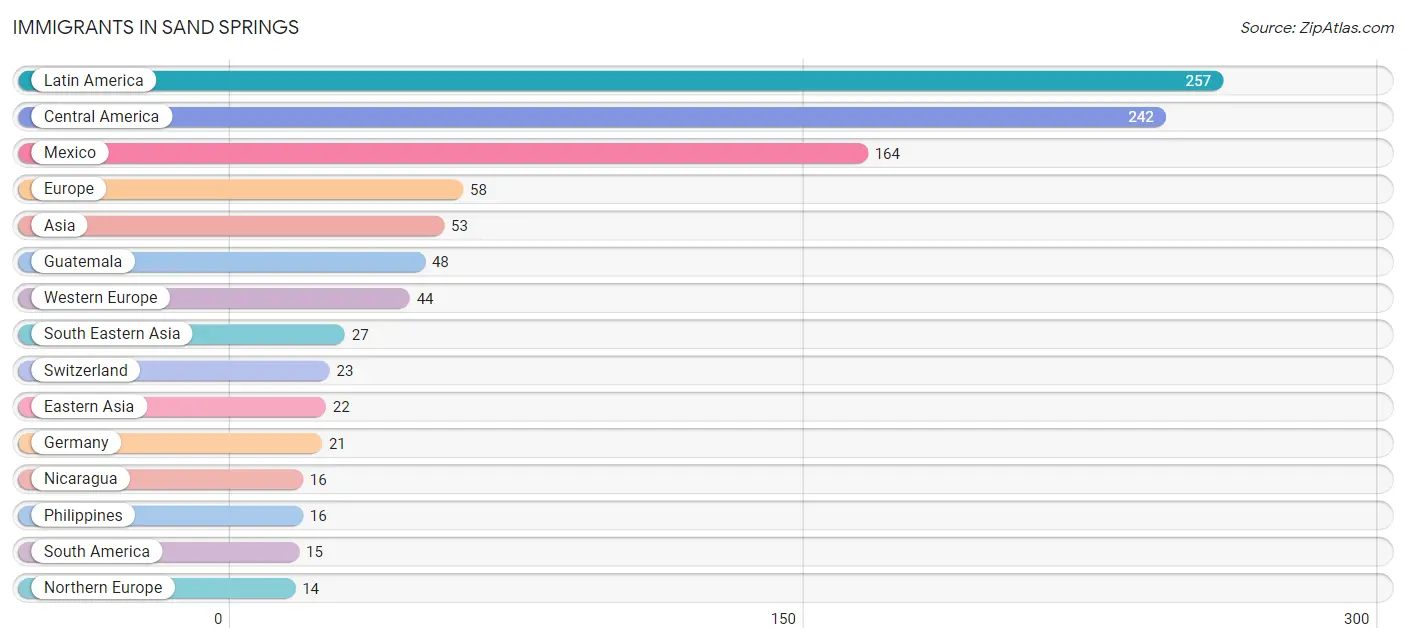
Immigrants in Sand Springs
The most numerous immigrant groups reported in Sand Springs came from Latin America (257 | 1.3%), Central America (242 | 1.2%), Mexico (164 | 0.8%), Europe (58 | 0.3%), and Asia (53 | 0.3%), together accounting for 3.9% of all Sand Springs residents.
| Immigration Origin | # Population | % Population |
| Asia | 53 | 0.3% |
| Bolivia | 12 | 0.1% |
| Canada | 13 | 0.1% |
| Central America | 242 | 1.2% |
| China | 9 | 0.1% |
| Colombia | 3 | 0.0% |
| Eastern Asia | 22 | 0.1% |
| El Salvador | 11 | 0.1% |
| England | 7 | 0.0% |
| Europe | 58 | 0.3% |
| Germany | 21 | 0.1% |
| Guatemala | 48 | 0.2% |
| Hong Kong | 9 | 0.1% |
| Ireland | 7 | 0.0% |
| Korea | 13 | 0.1% |
| Latin America | 257 | 1.3% |
| Mexico | 164 | 0.8% |
| Nicaragua | 16 | 0.1% |
| Northern Europe | 14 | 0.1% |
| Pakistan | 4 | 0.0% |
| Panama | 3 | 0.0% |
| Philippines | 16 | 0.1% |
| South America | 15 | 0.1% |
| South Central Asia | 4 | 0.0% |
| South Eastern Asia | 27 | 0.1% |
| Switzerland | 23 | 0.1% |
| Thailand | 11 | 0.1% |
| Western Europe | 44 | 0.2% | View All 28 Rows |
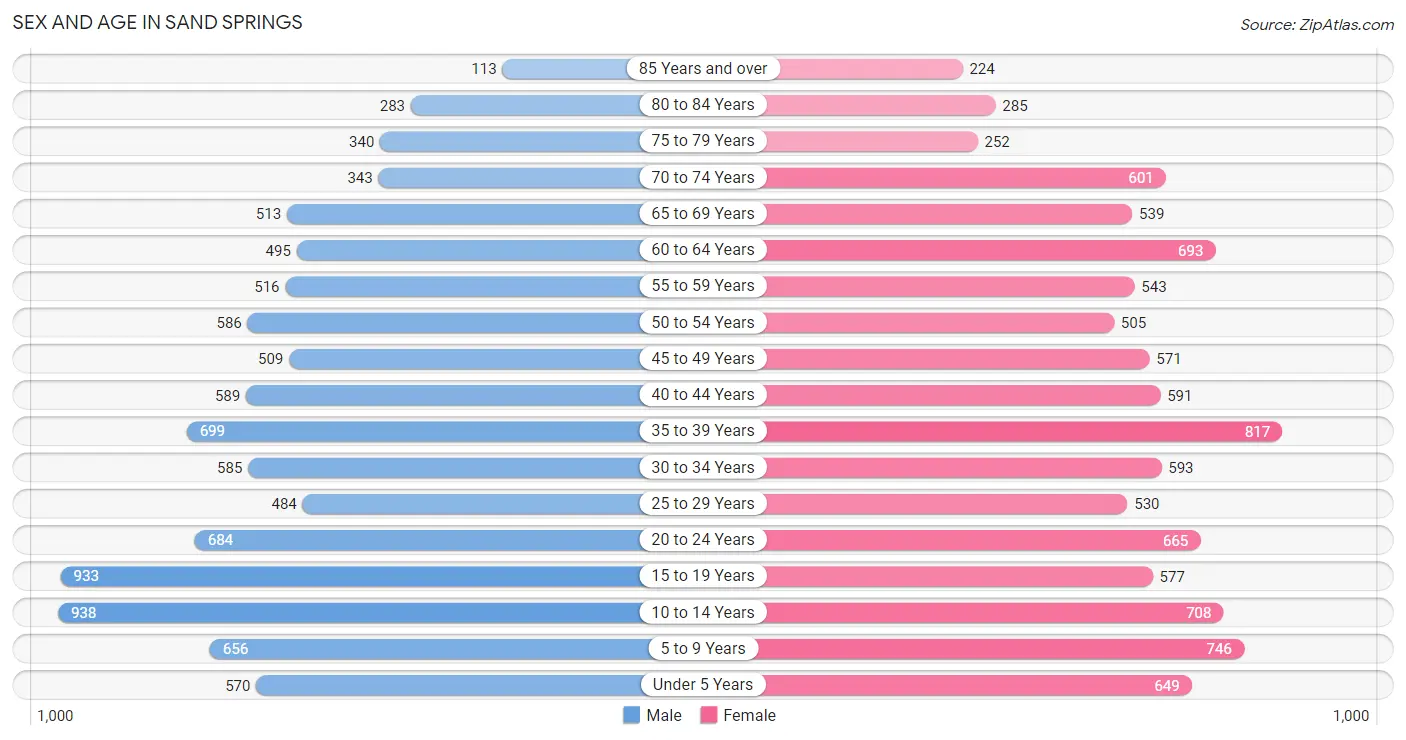
Sex and Age in Sand Springs
Sex and Age in Sand Springs
The most populous age groups in Sand Springs are 10 to 14 Years (938 | 9.5%) for men and 35 to 39 Years (817 | 8.1%) for women.
| Age Bracket | Male | Female |
| Under 5 Years | 570 (5.8%) | 649 (6.4%) |
| 5 to 9 Years | 656 (6.7%) | 746 (7.4%) |
| 10 to 14 Years | 938 (9.5%) | 708 (7.0%) |
| 15 to 19 Years | 933 (9.5%) | 577 (5.7%) |
| 20 to 24 Years | 684 (7.0%) | 665 (6.6%) |
| 25 to 29 Years | 484 (4.9%) | 530 (5.2%) |
| 30 to 34 Years | 585 (5.9%) | 593 (5.9%) |
| 35 to 39 Years | 699 (7.1%) | 817 (8.1%) |
| 40 to 44 Years | 589 (6.0%) | 591 (5.9%) |
| 45 to 49 Years | 509 (5.2%) | 571 (5.7%) |
| 50 to 54 Years | 586 (6.0%) | 505 (5.0%) |
| 55 to 59 Years | 516 (5.2%) | 543 (5.4%) |
| 60 to 64 Years | 495 (5.0%) | 693 (6.9%) |
| 65 to 69 Years | 513 (5.2%) | 539 (5.3%) |
| 70 to 74 Years | 343 (3.5%) | 601 (6.0%) |
| 75 to 79 Years | 340 (3.5%) | 252 (2.5%) |
| 80 to 84 Years | 283 (2.9%) | 285 (2.8%) |
| 85 Years and over | 113 (1.1%) | 224 (2.2%) |
| Total | 9,836 (100.0%) | 10,089 (100.0%) |
Families and Households in Sand Springs
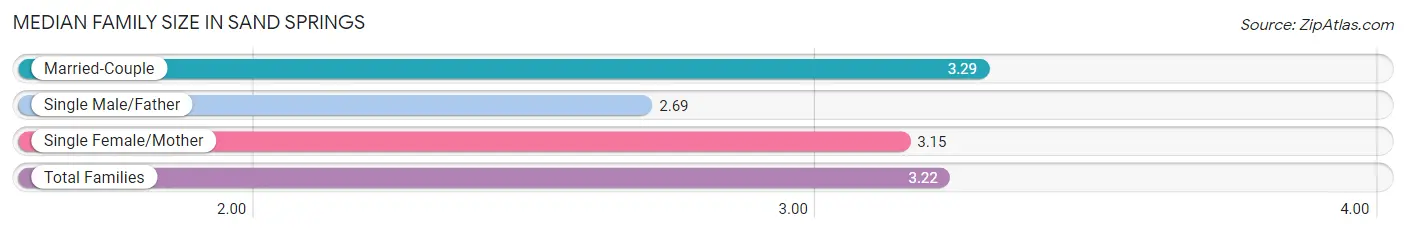
Median Family Size in Sand Springs
The median family size in Sand Springs is 3.22 persons per family, with married-couple families (3,856 | 73.8%) accounting for the largest median family size of 3.29 persons per family. On the other hand, single male/father families (421 | 8.1%) represent the smallest median family size with 2.69 persons per family.
| Family Type | # Families | Family Size |
| Married-Couple | 3,856 (73.8%) | 3.29 |
| Single Male/Father | 421 (8.1%) | 2.69 |
| Single Female/Mother | 946 (18.1%) | 3.15 |
| Total Families | 5,223 (100.0%) | 3.22 |
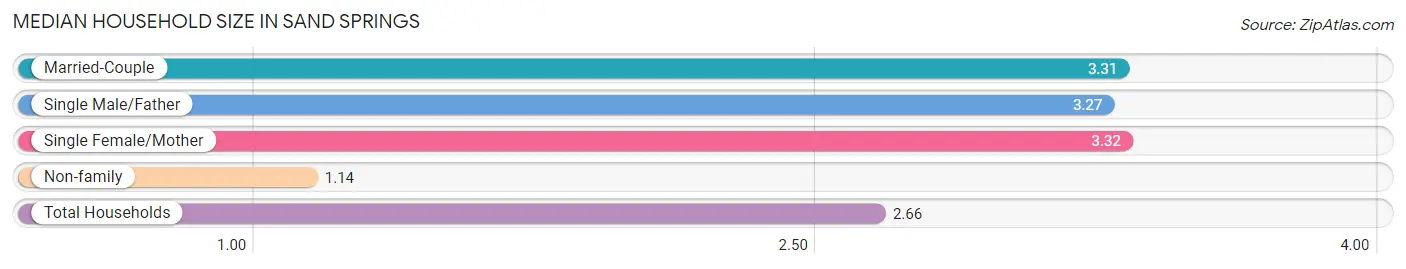
Median Household Size in Sand Springs
The median household size in Sand Springs is 2.66 persons per household, with single female/mother households (946 | 12.7%) accounting for the largest median household size of 3.32 persons per household. non-family households (2,204 | 29.7%) represent the smallest median household size with 1.14 persons per household.
| Household Type | # Households | Household Size |
| Married-Couple | 3,856 (51.9%) | 3.31 |
| Single Male/Father | 421 (5.7%) | 3.27 |
| Single Female/Mother | 946 (12.7%) | 3.32 |
| Non-family | 2,204 (29.7%) | 1.14 |
| Total Households | 7,427 (100.0%) | 2.66 |
Household Size by Marriage Status in Sand Springs
Out of a total of 7,427 households in Sand Springs, 5,223 (70.3%) are family households, while 2,204 (29.7%) are nonfamily households. The most numerous type of family households are 2-person households, comprising 2,231, and the most common type of nonfamily households are 1-person households, comprising 1,977.
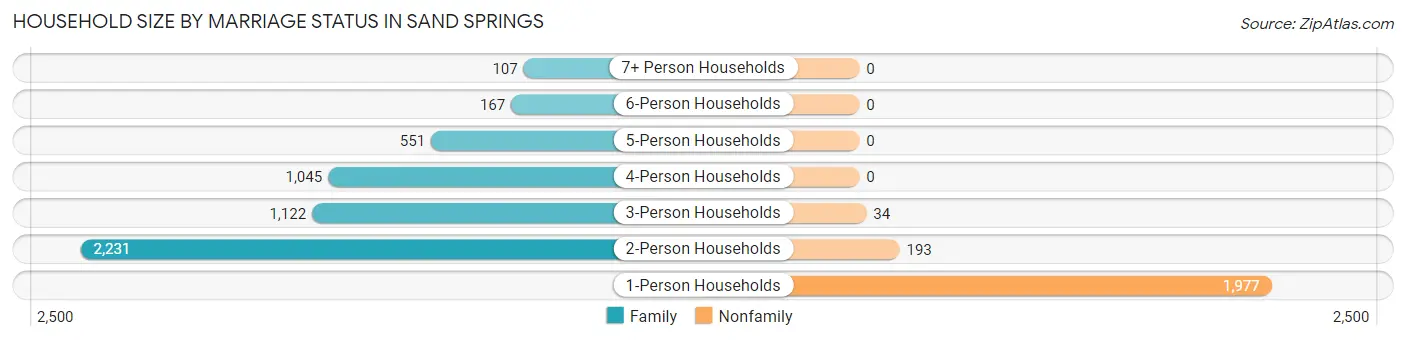
| Household Size | Family Households | Nonfamily Households |
| 1-Person Households | - | 1,977 (26.6%) |
| 2-Person Households | 2,231 (30.0%) | 193 (2.6%) |
| 3-Person Households | 1,122 (15.1%) | 34 (0.5%) |
| 4-Person Households | 1,045 (14.1%) | 0 (0.0%) |
| 5-Person Households | 551 (7.4%) | 0 (0.0%) |
| 6-Person Households | 167 (2.2%) | 0 (0.0%) |
| 7+ Person Households | 107 (1.4%) | 0 (0.0%) |
| Total | 5,223 (70.3%) | 2,204 (29.7%) |
Female Fertility in Sand Springs
Fertility by Age in Sand Springs
Average fertility rate in Sand Springs is 67.0 births per 1,000 women. Women in the age bracket of 35 to 50 years have the highest fertility rate with 80.0 births per 1,000 women. Women in the age bracket of 35 to 50 years acount for 56.0% of all women with births.
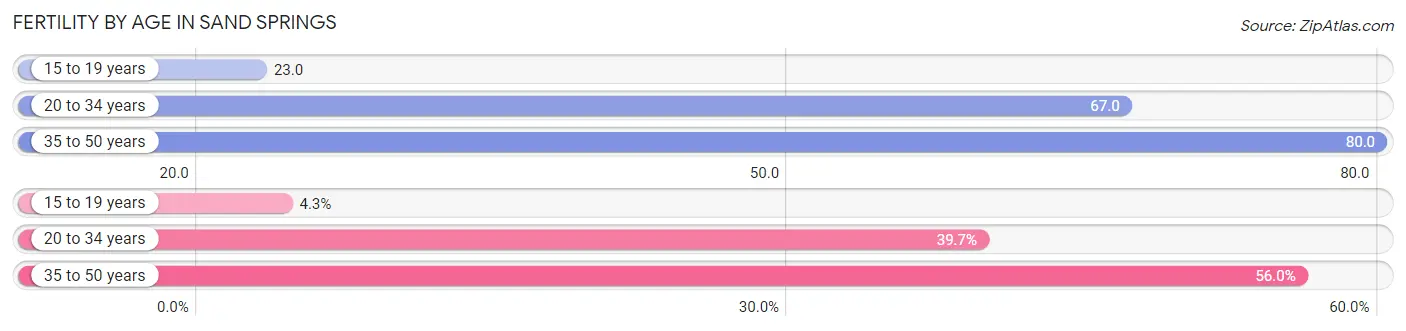
| Age Bracket | Women with Births | Births / 1,000 Women |
| 15 to 19 years | 13 (4.3%) | 23.0 |
| 20 to 34 years | 120 (39.7%) | 67.0 |
| 35 to 50 years | 169 (56.0%) | 80.0 |
| Total | 302 (100.0%) | 67.0 |
Fertility by Age by Marriage Status in Sand Springs
81.1% of women with births (302) in Sand Springs are married. The highest percentage of unmarried women with births falls into 15 to 19 years age bracket with 100.0% of them unmarried at the time of birth, while the lowest percentage of unmarried women with births belong to 35 to 50 years age bracket with 0.0% of them unmarried.
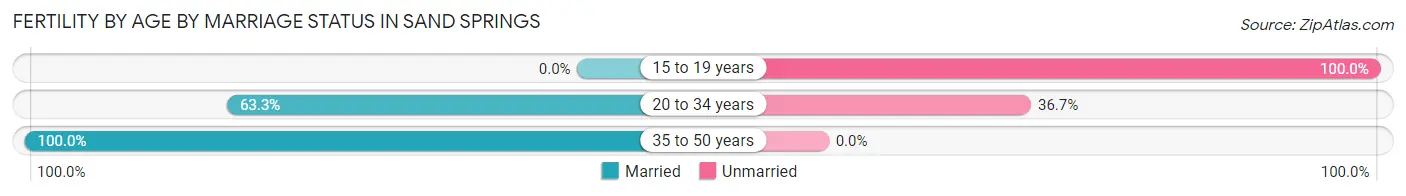
| Age Bracket | Married | Unmarried |
| 15 to 19 years | 0 (0.0%) | 13 (100.0%) |
| 20 to 34 years | 76 (63.3%) | 44 (36.7%) |
| 35 to 50 years | 169 (100.0%) | 0 (0.0%) |
| Total | 245 (81.1%) | 57 (18.9%) |
Fertility by Education in Sand Springs
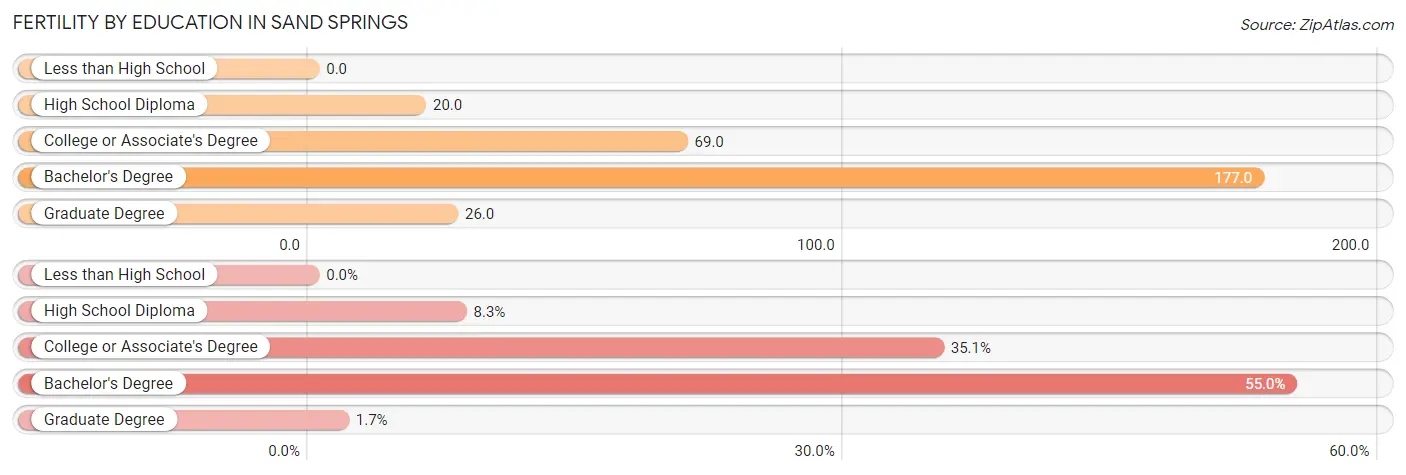
| Educational Attainment | Women with Births | Births / 1,000 Women |
| Less than High School | 0 (0.0%) | 0.0 |
| High School Diploma | 25 (8.3%) | 20.0 |
| College or Associate's Degree | 106 (35.1%) | 69.0 |
| Bachelor's Degree | 166 (55.0%) | 177.0 |
| Graduate Degree | 5 (1.7%) | 26.0 |
| Total | 302 (100.0%) | 67.0 |
Fertility by Education by Marriage Status in Sand Springs
18.9% of women with births in Sand Springs are unmarried. Women with the educational attainment of high school diploma are most likely to be married with 100.0% of them married at childbirth, while women with the educational attainment of college or associate's degree are least likely to be married with 53.8% of them unmarried at childbirth.
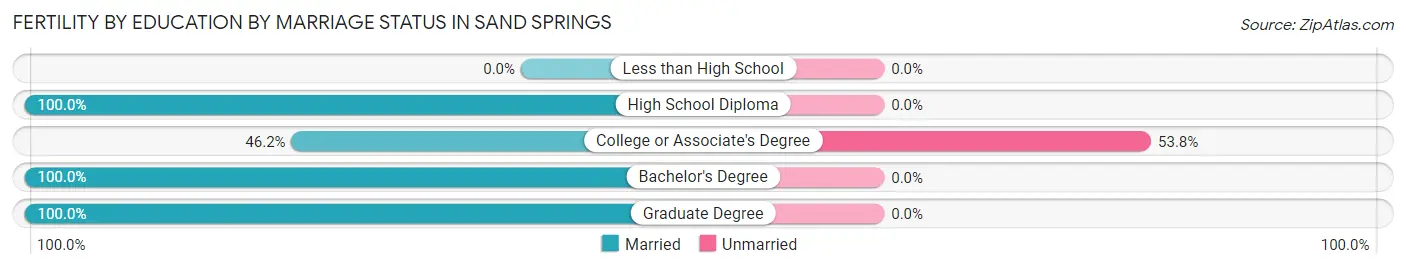
| Educational Attainment | Married | Unmarried |
| Less than High School | 0 (0.0%) | 0 (0.0%) |
| High School Diploma | 25 (100.0%) | 0 (0.0%) |
| College or Associate's Degree | 49 (46.2%) | 57 (53.8%) |
| Bachelor's Degree | 166 (100.0%) | 0 (0.0%) |
| Graduate Degree | 5 (100.0%) | 0 (0.0%) |
| Total | 245 (81.1%) | 57 (18.9%) |
Employment Characteristics in Sand Springs
Employment by Class of Employer in Sand Springs
Among the 9,073 employed individuals in Sand Springs, private company employees (6,689 | 73.7%), not-for-profit organizations (714 | 7.9%), and local government employees (506 | 5.6%) make up the most common classes of employment.
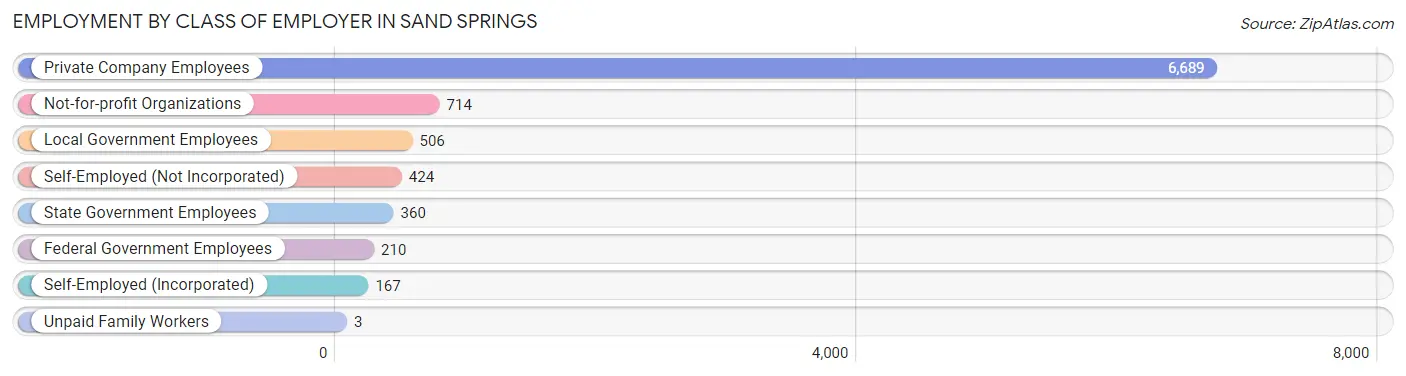
| Employer Class | # Employees | % Employees |
| Private Company Employees | 6,689 | 73.7% |
| Self-Employed (Incorporated) | 167 | 1.8% |
| Self-Employed (Not Incorporated) | 424 | 4.7% |
| Not-for-profit Organizations | 714 | 7.9% |
| Local Government Employees | 506 | 5.6% |
| State Government Employees | 360 | 4.0% |
| Federal Government Employees | 210 | 2.3% |
| Unpaid Family Workers | 3 | 0.0% |
| Total | 9,073 | 100.0% |
Employment Status by Age in Sand Springs
According to the labor force statistics for Sand Springs, out of the total population over 16 years of age (15,371), 62.6% or 9,622 individuals are in the labor force, with 4.5% or 433 of them unemployed. The age group with the highest labor force participation rate is 25 to 29 years, with 86.3% or 875 individuals in the labor force. Within the labor force, the 20 to 24 years age range has the highest percentage of unemployed individuals, with 7.2% or 80 of them being unemployed.
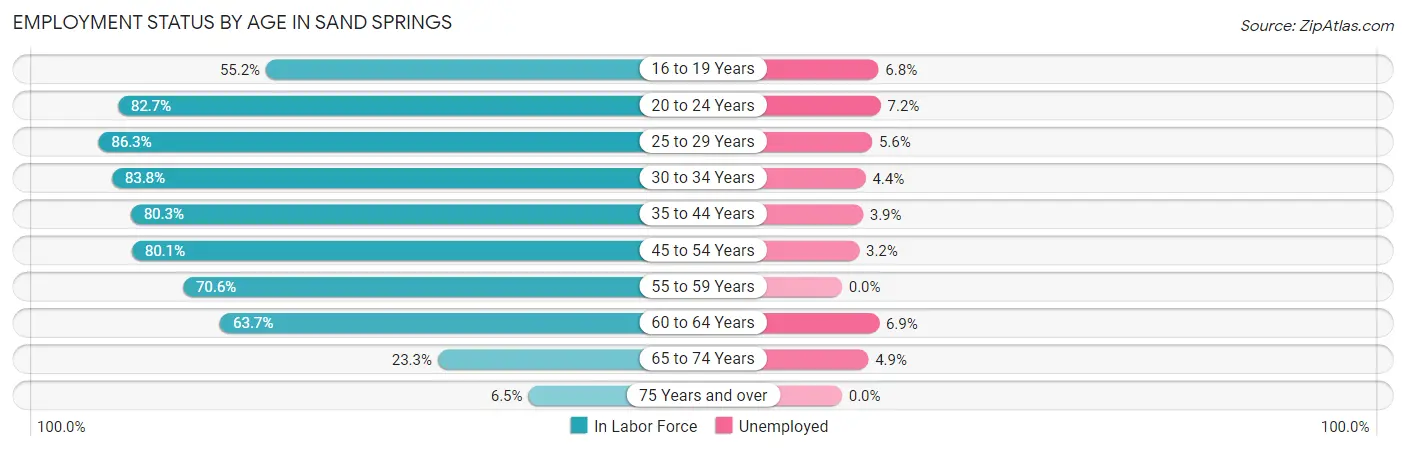
| Age Bracket | In Labor Force | Unemployed |
| 16 to 19 Years | 675 (55.2%) | 46 (6.8%) |
| 20 to 24 Years | 1,116 (82.7%) | 80 (7.2%) |
| 25 to 29 Years | 875 (86.3%) | 49 (5.6%) |
| 30 to 34 Years | 987 (83.8%) | 43 (4.4%) |
| 35 to 44 Years | 2,165 (80.3%) | 84 (3.9%) |
| 45 to 54 Years | 1,739 (80.1%) | 56 (3.2%) |
| 55 to 59 Years | 748 (70.6%) | 0 (0.0%) |
| 60 to 64 Years | 757 (63.7%) | 52 (6.9%) |
| 65 to 74 Years | 465 (23.3%) | 23 (4.9%) |
| 75 Years and over | 97 (6.5%) | 0 (0.0%) |
| Total | 9,622 (62.6%) | 433 (4.5%) |
Employment Status by Educational Attainment in Sand Springs
According to labor force statistics for Sand Springs, 78.1% of individuals (7,268) out of the total population between 25 and 64 years of age (9,306) are in the labor force, with 3.9% or 283 of them being unemployed. The group with the highest labor force participation rate are those with the educational attainment of bachelor's degree or higher, with 86.9% or 1,973 individuals in the labor force. Within the labor force, individuals with less than high school education have the highest percentage of unemployment, with 18.0% or 104 of them being unemployed.
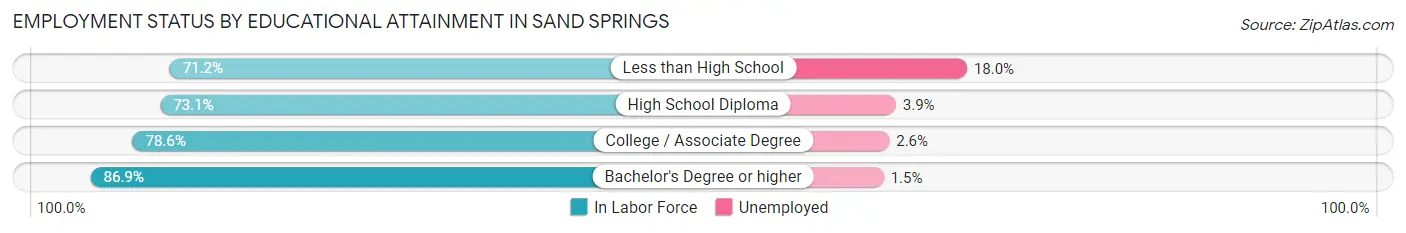
| Educational Attainment | In Labor Force | Unemployed |
| Less than High School | 577 (71.2%) | 146 (18.0%) |
| High School Diploma | 2,273 (73.1%) | 121 (3.9%) |
| College / Associate Degree | 2,450 (78.6%) | 81 (2.6%) |
| Bachelor's Degree or higher | 1,973 (86.9%) | 34 (1.5%) |
| Total | 7,268 (78.1%) | 363 (3.9%) |
Employment Occupations by Sex in Sand Springs
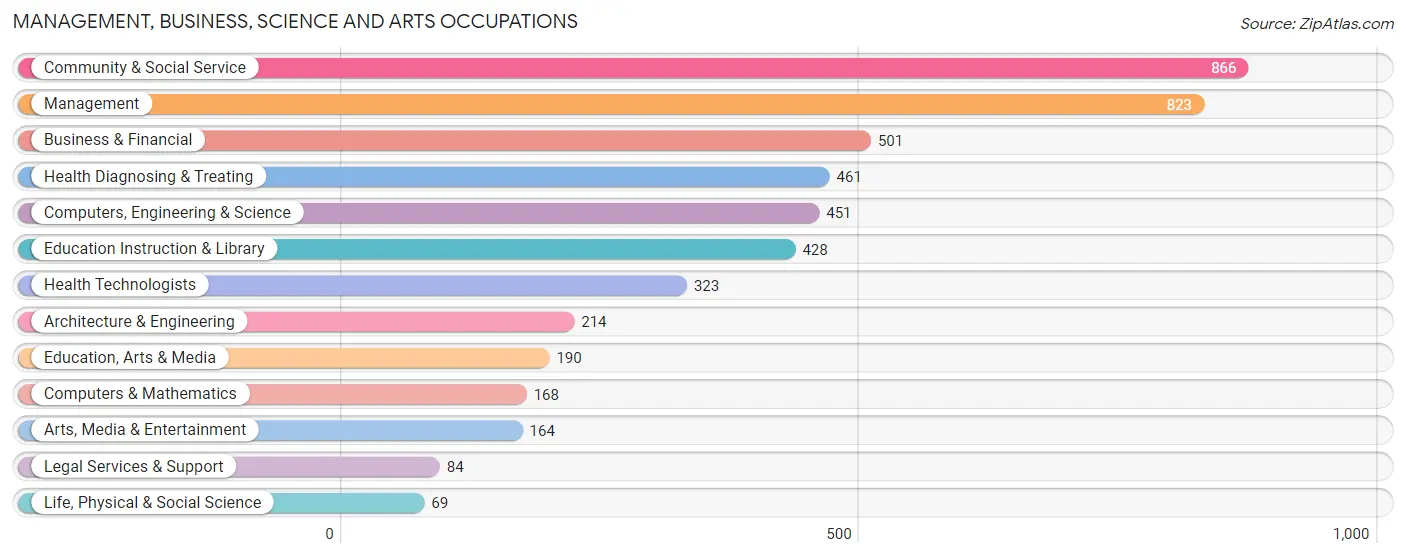
Management, Business, Science and Arts Occupations
The most common Management, Business, Science and Arts occupations in Sand Springs are Community & Social Service (866 | 9.5%), Management (823 | 9.0%), Business & Financial (501 | 5.5%), Health Diagnosing & Treating (461 | 5.1%), and Computers, Engineering & Science (451 | 4.9%).
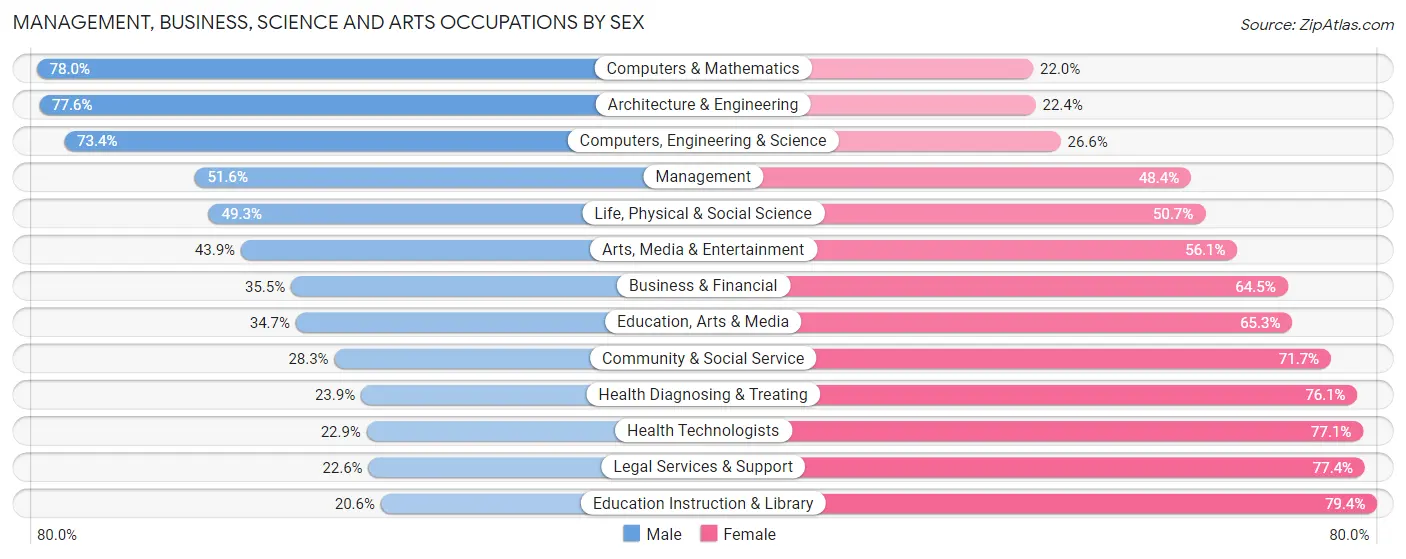
Management, Business, Science and Arts Occupations by Sex
Within the Management, Business, Science and Arts occupations in Sand Springs, the most male-oriented occupations are Computers & Mathematics (78.0%), Architecture & Engineering (77.6%), and Computers, Engineering & Science (73.4%), while the most female-oriented occupations are Education Instruction & Library (79.4%), Legal Services & Support (77.4%), and Health Technologists (77.1%).
| Occupation | Male | Female |
| Management | 425 (51.6%) | 398 (48.4%) |
| Business & Financial | 178 (35.5%) | 323 (64.5%) |
| Computers, Engineering & Science | 331 (73.4%) | 120 (26.6%) |
| Computers & Mathematics | 131 (78.0%) | 37 (22.0%) |
| Architecture & Engineering | 166 (77.6%) | 48 (22.4%) |
| Life, Physical & Social Science | 34 (49.3%) | 35 (50.7%) |
| Community & Social Service | 245 (28.3%) | 621 (71.7%) |
| Education, Arts & Media | 66 (34.7%) | 124 (65.3%) |
| Legal Services & Support | 19 (22.6%) | 65 (77.4%) |
| Education Instruction & Library | 88 (20.6%) | 340 (79.4%) |
| Arts, Media & Entertainment | 72 (43.9%) | 92 (56.1%) |
| Health Diagnosing & Treating | 110 (23.9%) | 351 (76.1%) |
| Health Technologists | 74 (22.9%) | 249 (77.1%) |
| Total (Category) | 1,289 (41.5%) | 1,813 (58.5%) |
| Total (Overall) | 4,716 (51.6%) | 4,418 (48.4%) |
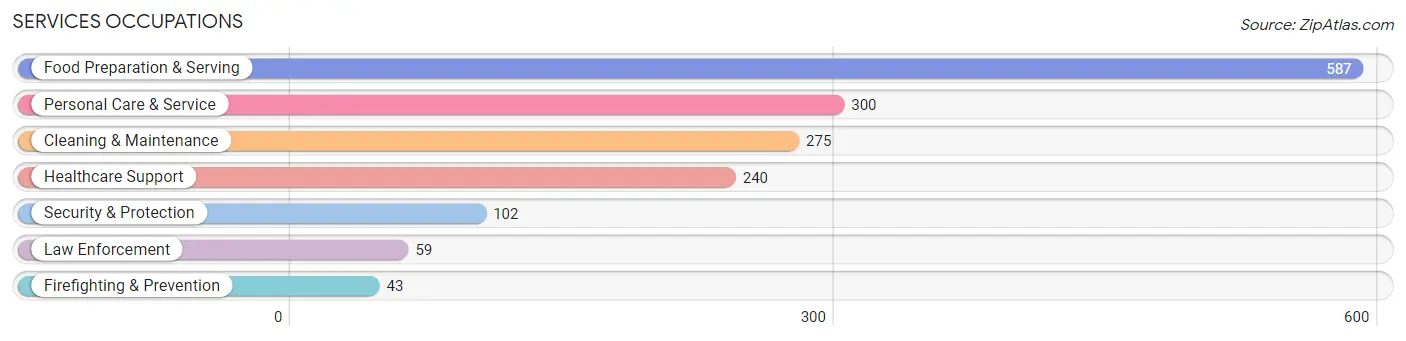
Services Occupations
The most common Services occupations in Sand Springs are Food Preparation & Serving (587 | 6.4%), Personal Care & Service (300 | 3.3%), Cleaning & Maintenance (275 | 3.0%), Healthcare Support (240 | 2.6%), and Security & Protection (102 | 1.1%).
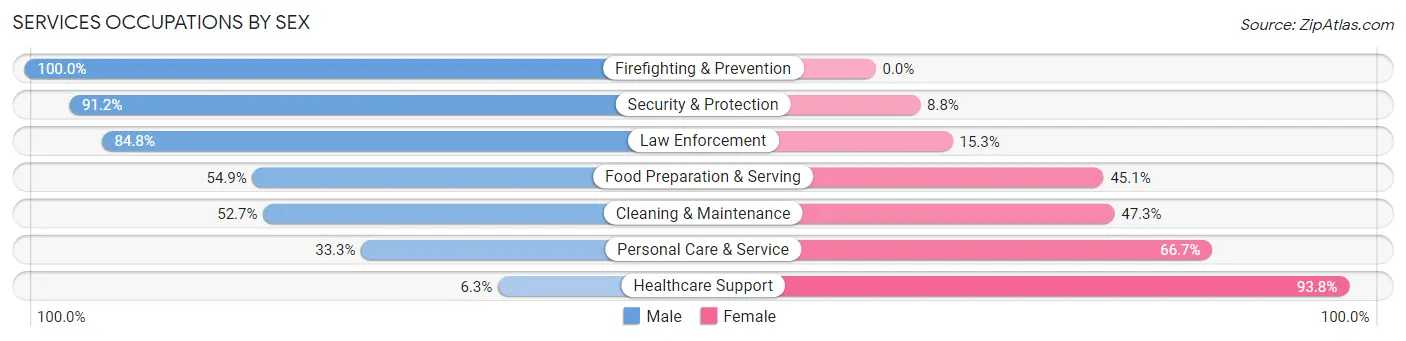
Services Occupations by Sex
Within the Services occupations in Sand Springs, the most male-oriented occupations are Firefighting & Prevention (100.0%), Security & Protection (91.2%), and Law Enforcement (84.8%), while the most female-oriented occupations are Healthcare Support (93.8%), Personal Care & Service (66.7%), and Cleaning & Maintenance (47.3%).
| Occupation | Male | Female |
| Healthcare Support | 15 (6.2%) | 225 (93.8%) |
| Security & Protection | 93 (91.2%) | 9 (8.8%) |
| Firefighting & Prevention | 43 (100.0%) | 0 (0.0%) |
| Law Enforcement | 50 (84.8%) | 9 (15.2%) |
| Food Preparation & Serving | 322 (54.9%) | 265 (45.1%) |
| Cleaning & Maintenance | 145 (52.7%) | 130 (47.3%) |
| Personal Care & Service | 100 (33.3%) | 200 (66.7%) |
| Total (Category) | 675 (44.9%) | 829 (55.1%) |
| Total (Overall) | 4,716 (51.6%) | 4,418 (48.4%) |
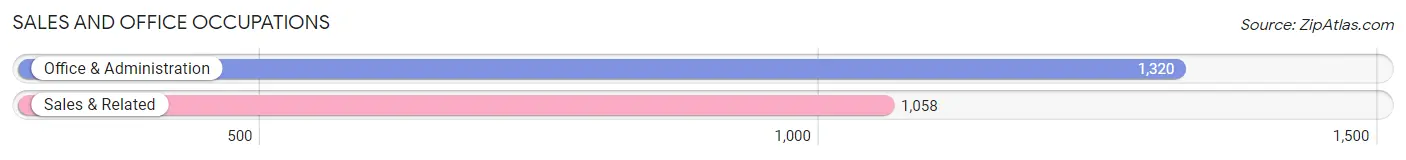
Sales and Office Occupations
The most common Sales and Office occupations in Sand Springs are Office & Administration (1,320 | 14.4%), and Sales & Related (1,058 | 11.6%).
Sales and Office Occupations by Sex
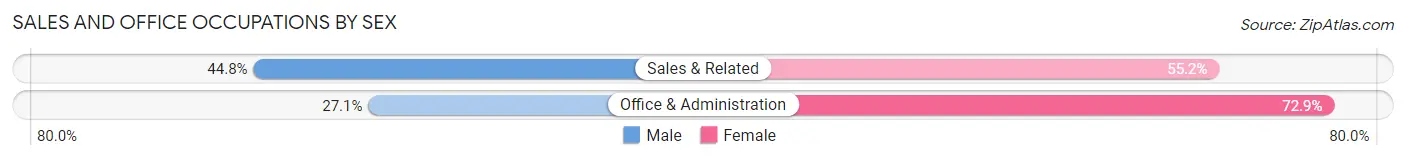
| Occupation | Male | Female |
| Sales & Related | 474 (44.8%) | 584 (55.2%) |
| Office & Administration | 358 (27.1%) | 962 (72.9%) |
| Total (Category) | 832 (35.0%) | 1,546 (65.0%) |
| Total (Overall) | 4,716 (51.6%) | 4,418 (48.4%) |
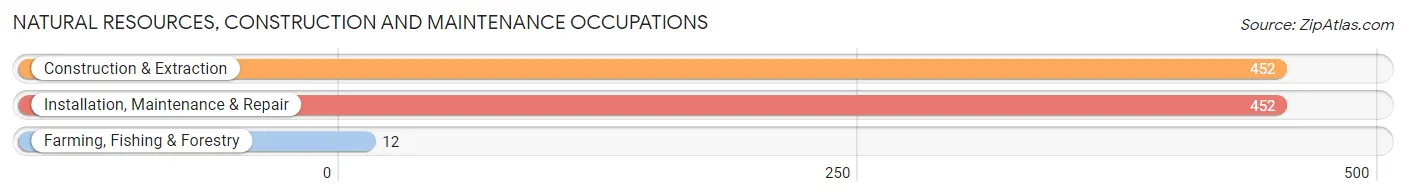
Natural Resources, Construction and Maintenance Occupations
The most common Natural Resources, Construction and Maintenance occupations in Sand Springs are Construction & Extraction (452 | 5.0%), Installation, Maintenance & Repair (452 | 5.0%), and Farming, Fishing & Forestry (12 | 0.1%).
Natural Resources, Construction and Maintenance Occupations by Sex
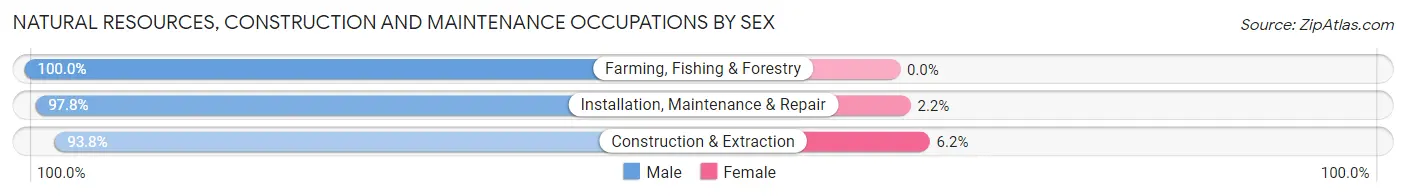
| Occupation | Male | Female |
| Farming, Fishing & Forestry | 12 (100.0%) | 0 (0.0%) |
| Construction & Extraction | 424 (93.8%) | 28 (6.2%) |
| Installation, Maintenance & Repair | 442 (97.8%) | 10 (2.2%) |
| Total (Category) | 878 (95.9%) | 38 (4.2%) |
| Total (Overall) | 4,716 (51.6%) | 4,418 (48.4%) |
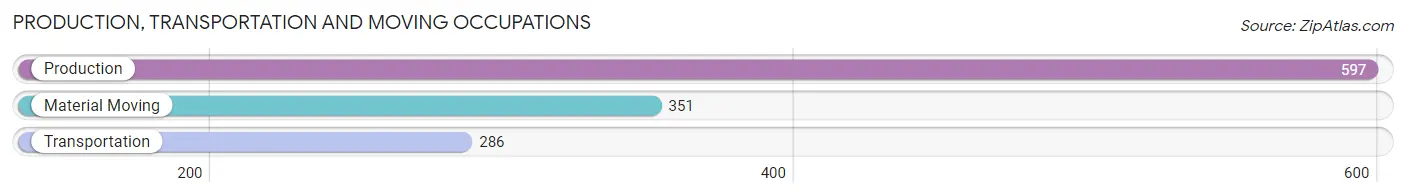
Production, Transportation and Moving Occupations
The most common Production, Transportation and Moving occupations in Sand Springs are Production (597 | 6.5%), Material Moving (351 | 3.8%), and Transportation (286 | 3.1%).
Production, Transportation and Moving Occupations by Sex
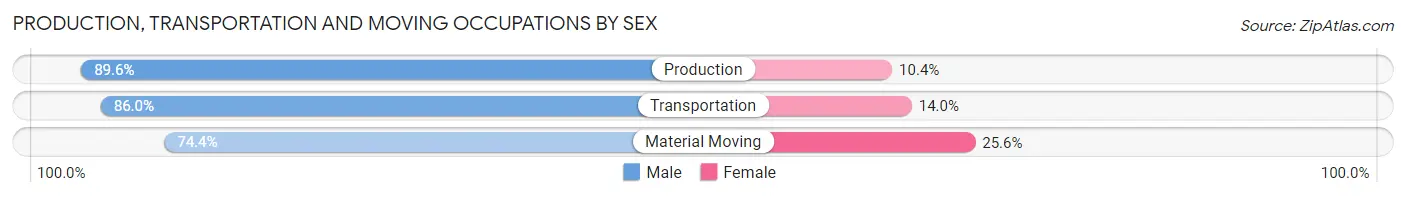
| Occupation | Male | Female |
| Production | 535 (89.6%) | 62 (10.4%) |
| Transportation | 246 (86.0%) | 40 (14.0%) |
| Material Moving | 261 (74.4%) | 90 (25.6%) |
| Total (Category) | 1,042 (84.4%) | 192 (15.6%) |
| Total (Overall) | 4,716 (51.6%) | 4,418 (48.4%) |
Employment Industries by Sex in Sand Springs
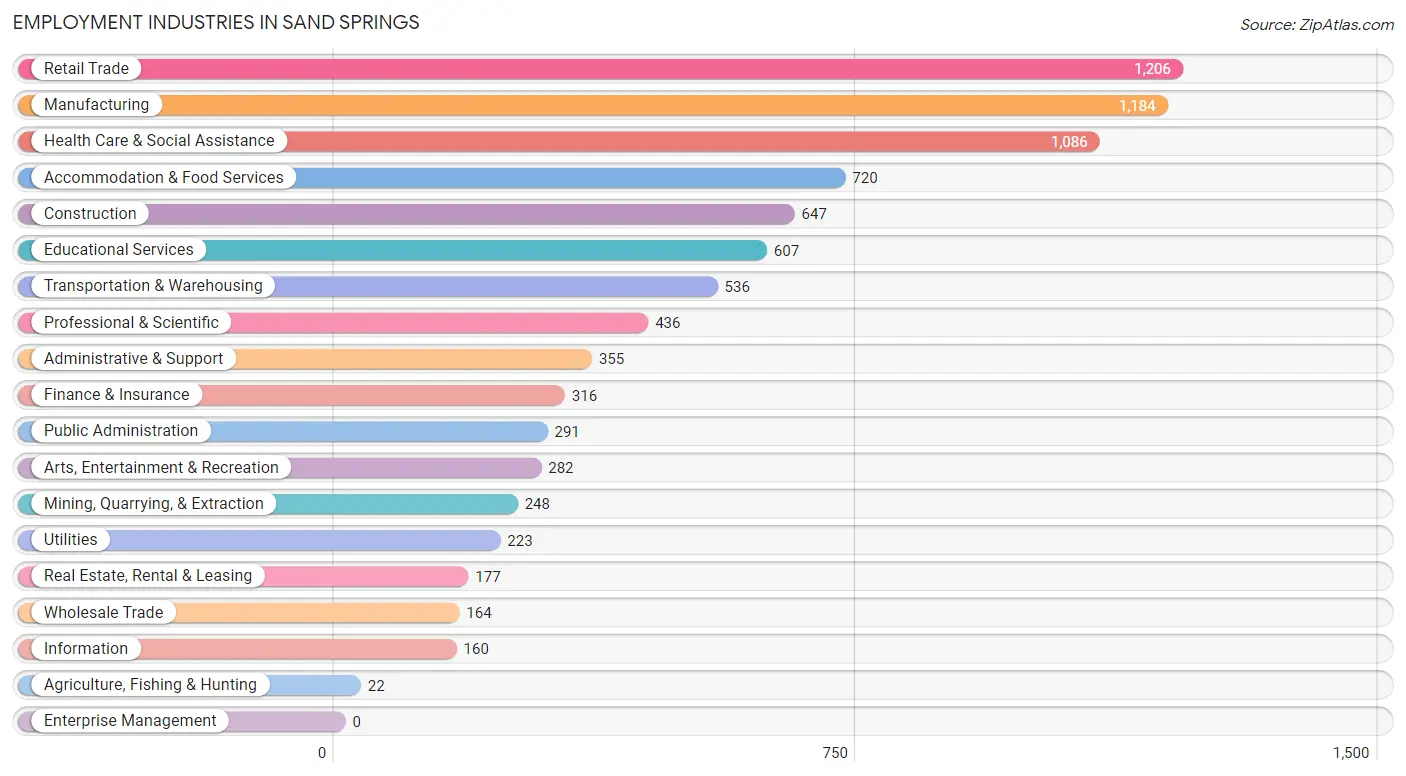
Employment Industries in Sand Springs
The major employment industries in Sand Springs include Retail Trade (1,206 | 13.2%), Manufacturing (1,184 | 13.0%), Health Care & Social Assistance (1,086 | 11.9%), Accommodation & Food Services (720 | 7.9%), and Construction (647 | 7.1%).
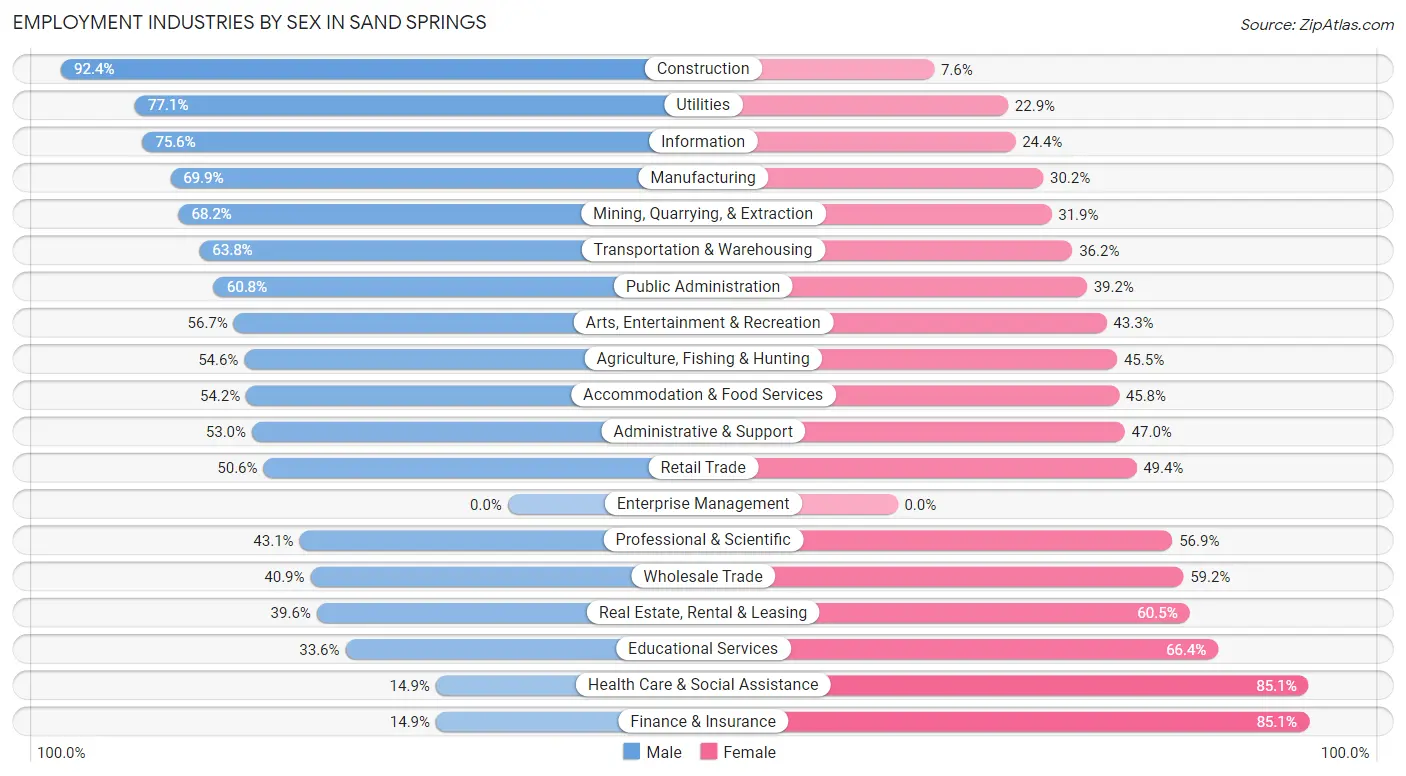
Employment Industries by Sex in Sand Springs
The Sand Springs industries that see more men than women are Construction (92.4%), Utilities (77.1%), and Information (75.6%), whereas the industries that tend to have a higher number of women are Finance & Insurance (85.1%), Health Care & Social Assistance (85.1%), and Educational Services (66.4%).
| Industry | Male | Female |
| Agriculture, Fishing & Hunting | 12 (54.5%) | 10 (45.5%) |
| Mining, Quarrying, & Extraction | 169 (68.1%) | 79 (31.9%) |
| Construction | 598 (92.4%) | 49 (7.6%) |
| Manufacturing | 827 (69.9%) | 357 (30.1%) |
| Wholesale Trade | 67 (40.8%) | 97 (59.2%) |
| Retail Trade | 610 (50.6%) | 596 (49.4%) |
| Transportation & Warehousing | 342 (63.8%) | 194 (36.2%) |
| Utilities | 172 (77.1%) | 51 (22.9%) |
| Information | 121 (75.6%) | 39 (24.4%) |
| Finance & Insurance | 47 (14.9%) | 269 (85.1%) |
| Real Estate, Rental & Leasing | 70 (39.6%) | 107 (60.5%) |
| Professional & Scientific | 188 (43.1%) | 248 (56.9%) |
| Enterprise Management | 0 (0.0%) | 0 (0.0%) |
| Administrative & Support | 188 (53.0%) | 167 (47.0%) |
| Educational Services | 204 (33.6%) | 403 (66.4%) |
| Health Care & Social Assistance | 162 (14.9%) | 924 (85.1%) |
| Arts, Entertainment & Recreation | 160 (56.7%) | 122 (43.3%) |
| Accommodation & Food Services | 390 (54.2%) | 330 (45.8%) |
| Public Administration | 177 (60.8%) | 114 (39.2%) |
| Total | 4,716 (51.6%) | 4,418 (48.4%) |
Education in Sand Springs
School Enrollment in Sand Springs
The most common levels of schooling among the 5,227 students in Sand Springs are middle school (1,337 | 25.6%), high school (1,272 | 24.3%), and elementary school (1,249 | 23.9%).
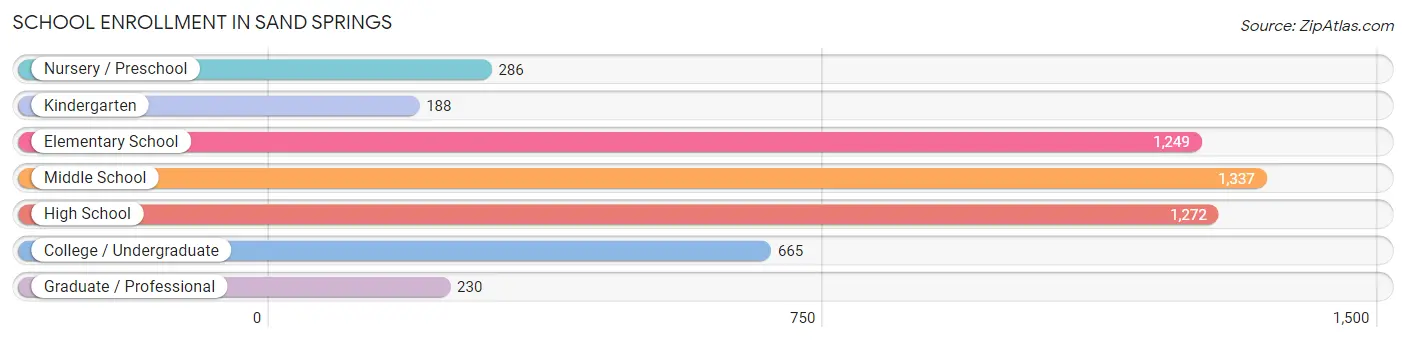
| School Level | # Students | % Students |
| Nursery / Preschool | 286 | 5.5% |
| Kindergarten | 188 | 3.6% |
| Elementary School | 1,249 | 23.9% |
| Middle School | 1,337 | 25.6% |
| High School | 1,272 | 24.3% |
| College / Undergraduate | 665 | 12.7% |
| Graduate / Professional | 230 | 4.4% |
| Total | 5,227 | 100.0% |
School Enrollment by Age by Funding Source in Sand Springs
Out of a total of 5,227 students who are enrolled in schools in Sand Springs, 873 (16.7%) attend a private institution, while the remaining 4,354 (83.3%) are enrolled in public schools. The age group of 3 to 4 year olds has the highest likelihood of being enrolled in private schools, with 122 (55.2% in the age bracket) enrolled. Conversely, the age group of 35 years and over has the lowest likelihood of being enrolled in a private school, with 282 (90.4% in the age bracket) attending a public institution.
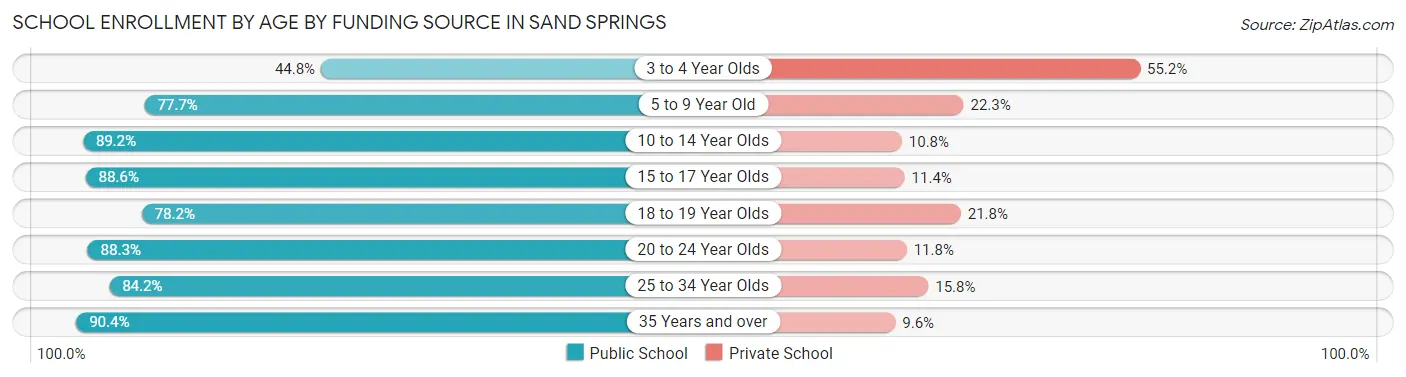
| Age Bracket | Public School | Private School |
| 3 to 4 Year Olds | 99 (44.8%) | 122 (55.2%) |
| 5 to 9 Year Old | 1,047 (77.7%) | 301 (22.3%) |
| 10 to 14 Year Olds | 1,414 (89.2%) | 172 (10.8%) |
| 15 to 17 Year Olds | 788 (88.6%) | 101 (11.4%) |
| 18 to 19 Year Olds | 276 (78.2%) | 77 (21.8%) |
| 20 to 24 Year Olds | 278 (88.2%) | 37 (11.7%) |
| 25 to 34 Year Olds | 171 (84.2%) | 32 (15.8%) |
| 35 Years and over | 282 (90.4%) | 30 (9.6%) |
| Total | 4,354 (83.3%) | 873 (16.7%) |
Educational Attainment by Field of Study in Sand Springs
Business (729 | 22.4%), education (577 | 17.7%), engineering (312 | 9.6%), arts & humanities (304 | 9.3%), and science & technology (295 | 9.1%) are the most common fields of study among 3,250 individuals in Sand Springs who have obtained a bachelor's degree or higher.
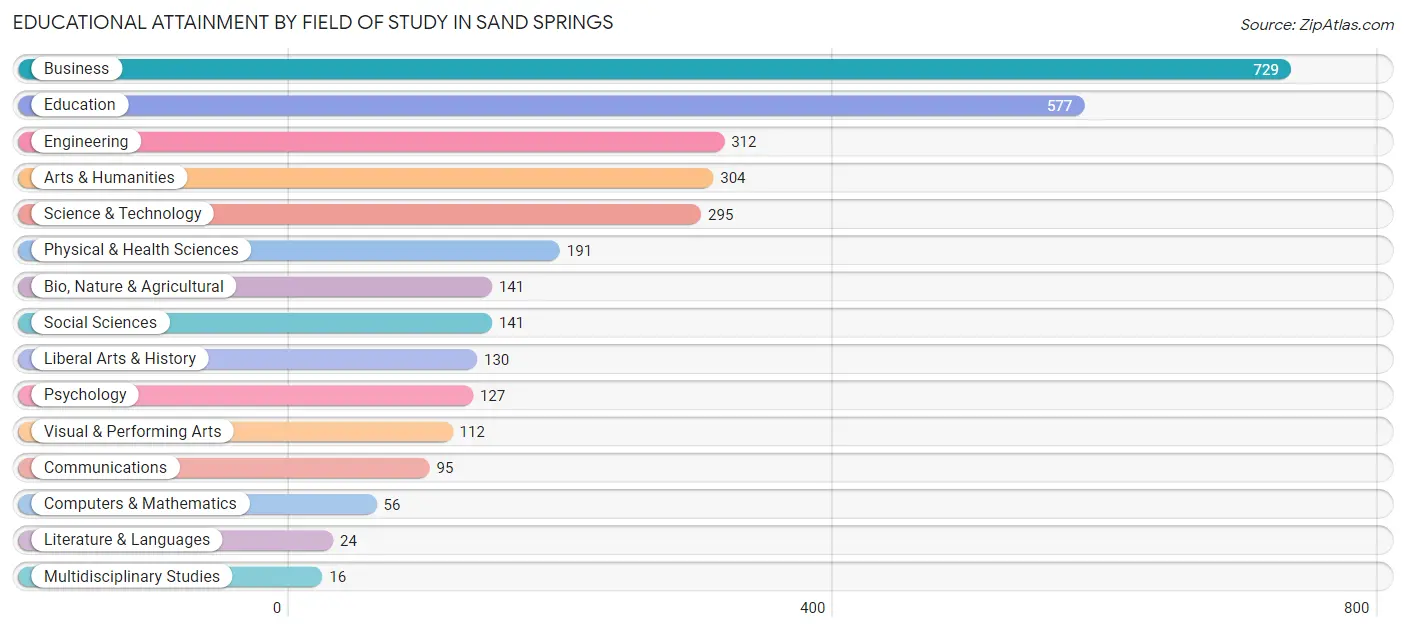
| Field of Study | # Graduates | % Graduates |
| Computers & Mathematics | 56 | 1.7% |
| Bio, Nature & Agricultural | 141 | 4.3% |
| Physical & Health Sciences | 191 | 5.9% |
| Psychology | 127 | 3.9% |
| Social Sciences | 141 | 4.3% |
| Engineering | 312 | 9.6% |
| Multidisciplinary Studies | 16 | 0.5% |
| Science & Technology | 295 | 9.1% |
| Business | 729 | 22.4% |
| Education | 577 | 17.7% |
| Literature & Languages | 24 | 0.7% |
| Liberal Arts & History | 130 | 4.0% |
| Visual & Performing Arts | 112 | 3.5% |
| Communications | 95 | 2.9% |
| Arts & Humanities | 304 | 9.3% |
| Total | 3,250 | 100.0% |
Transportation & Commute in Sand Springs
Vehicle Availability by Sex in Sand Springs
The most prevalent vehicle ownership categories in Sand Springs are males with 2 vehicles (2,168, accounting for 46.1%) and females with 2 vehicles (1,668, making up 49.7%).
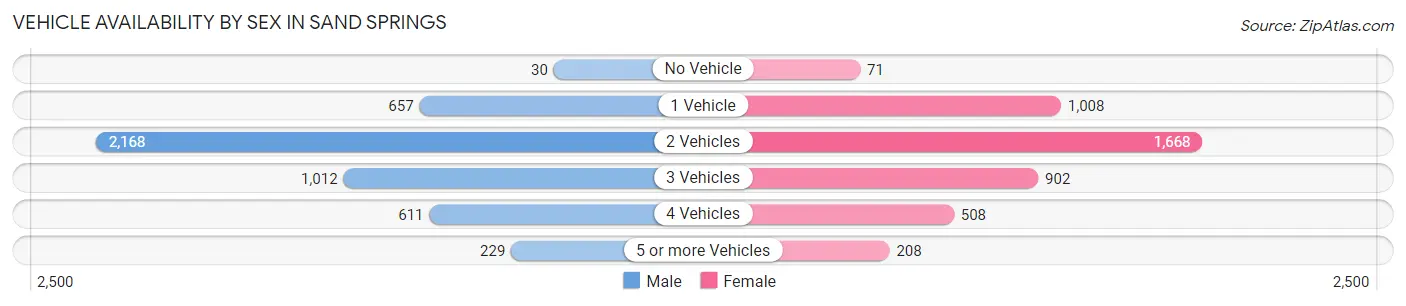
| Vehicles Available | Male | Female |
| No Vehicle | 30 (0.6%) | 71 (1.6%) |
| 1 Vehicle | 657 (14.0%) | 1,008 (23.1%) |
| 2 Vehicles | 2,168 (46.1%) | 1,668 (38.2%) |
| 3 Vehicles | 1,012 (21.5%) | 902 (20.7%) |
| 4 Vehicles | 611 (13.0%) | 508 (11.6%) |
| 5 or more Vehicles | 229 (4.9%) | 208 (4.8%) |
| Total | 4,707 (100.0%) | 4,365 (100.0%) |
Commute Time in Sand Springs
The most frequently occuring commute durations in Sand Springs are 20 to 24 minutes (2,082 commuters, 24.2%), 15 to 19 minutes (1,460 commuters, 16.9%), and 30 to 34 minutes (1,374 commuters, 15.9%).
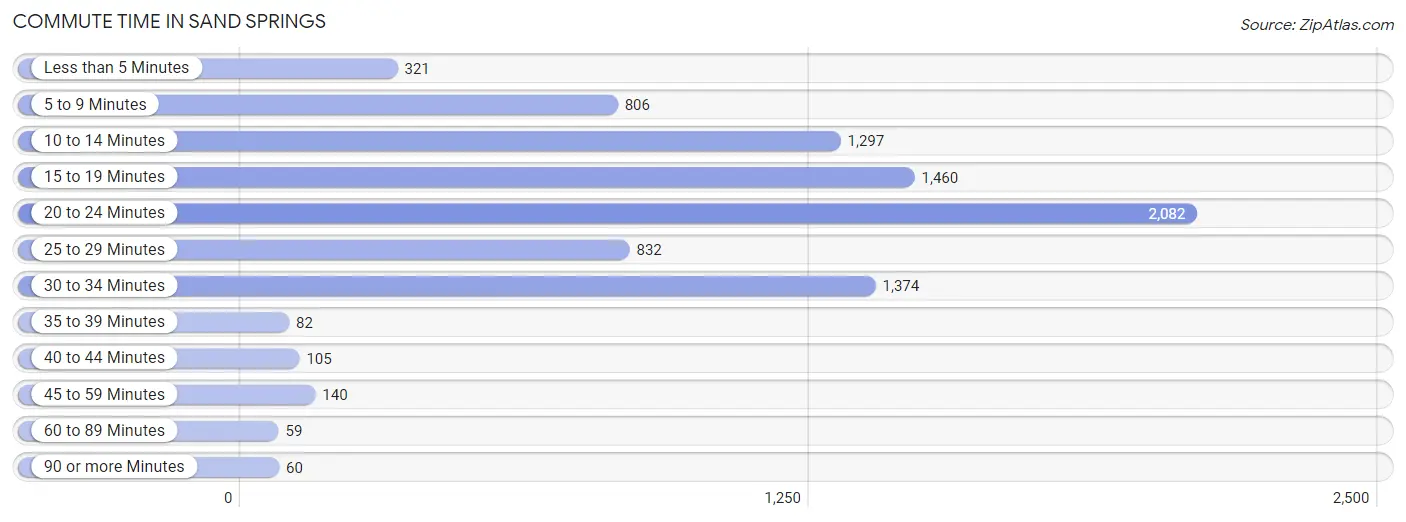
| Commute Time | # Commuters | % Commuters |
| Less than 5 Minutes | 321 | 3.7% |
| 5 to 9 Minutes | 806 | 9.3% |
| 10 to 14 Minutes | 1,297 | 15.0% |
| 15 to 19 Minutes | 1,460 | 16.9% |
| 20 to 24 Minutes | 2,082 | 24.2% |
| 25 to 29 Minutes | 832 | 9.7% |
| 30 to 34 Minutes | 1,374 | 15.9% |
| 35 to 39 Minutes | 82 | 0.9% |
| 40 to 44 Minutes | 105 | 1.2% |
| 45 to 59 Minutes | 140 | 1.6% |
| 60 to 89 Minutes | 59 | 0.7% |
| 90 or more Minutes | 60 | 0.7% |
Commute Time by Sex in Sand Springs
The most common commute times in Sand Springs are 20 to 24 minutes (1,094 commuters, 24.4%) for males and 20 to 24 minutes (988 commuters, 23.9%) for females.
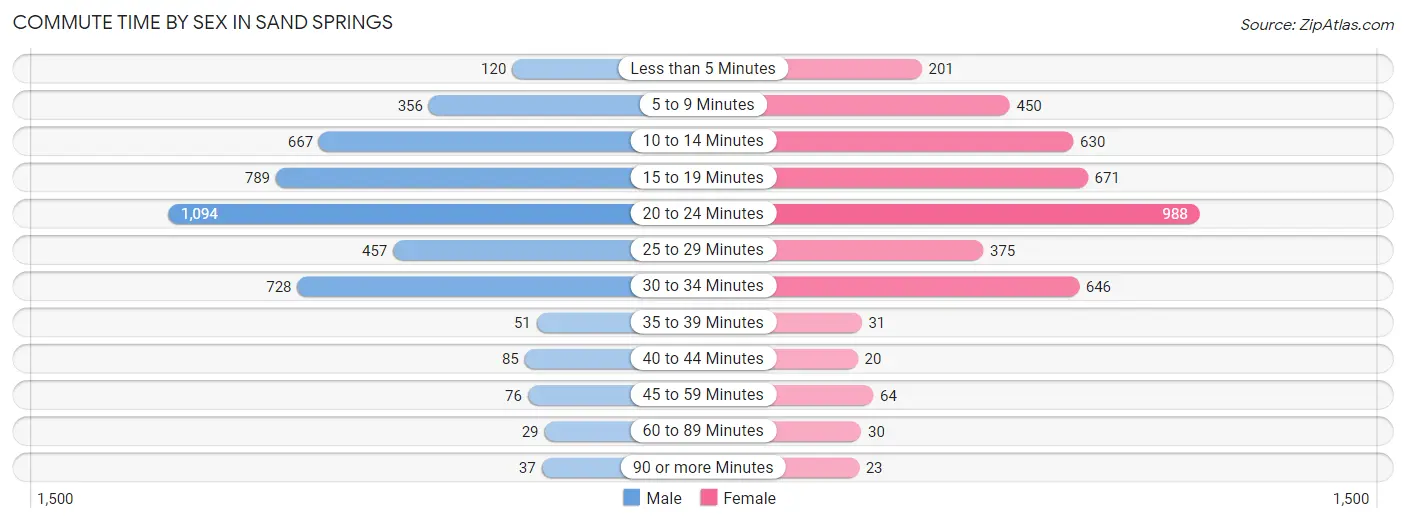
| Commute Time | Male | Female |
| Less than 5 Minutes | 120 (2.7%) | 201 (4.9%) |
| 5 to 9 Minutes | 356 (7.9%) | 450 (10.9%) |
| 10 to 14 Minutes | 667 (14.9%) | 630 (15.3%) |
| 15 to 19 Minutes | 789 (17.6%) | 671 (16.3%) |
| 20 to 24 Minutes | 1,094 (24.4%) | 988 (23.9%) |
| 25 to 29 Minutes | 457 (10.2%) | 375 (9.1%) |
| 30 to 34 Minutes | 728 (16.2%) | 646 (15.7%) |
| 35 to 39 Minutes | 51 (1.1%) | 31 (0.7%) |
| 40 to 44 Minutes | 85 (1.9%) | 20 (0.5%) |
| 45 to 59 Minutes | 76 (1.7%) | 64 (1.5%) |
| 60 to 89 Minutes | 29 (0.6%) | 30 (0.7%) |
| 90 or more Minutes | 37 (0.8%) | 23 (0.6%) |
Time of Departure to Work by Sex in Sand Springs
The most frequent times of departure to work in Sand Springs are 6:30 AM to 6:59 AM (669, 14.9%) for males and 7:00 AM to 7:29 AM (678, 16.4%) for females.
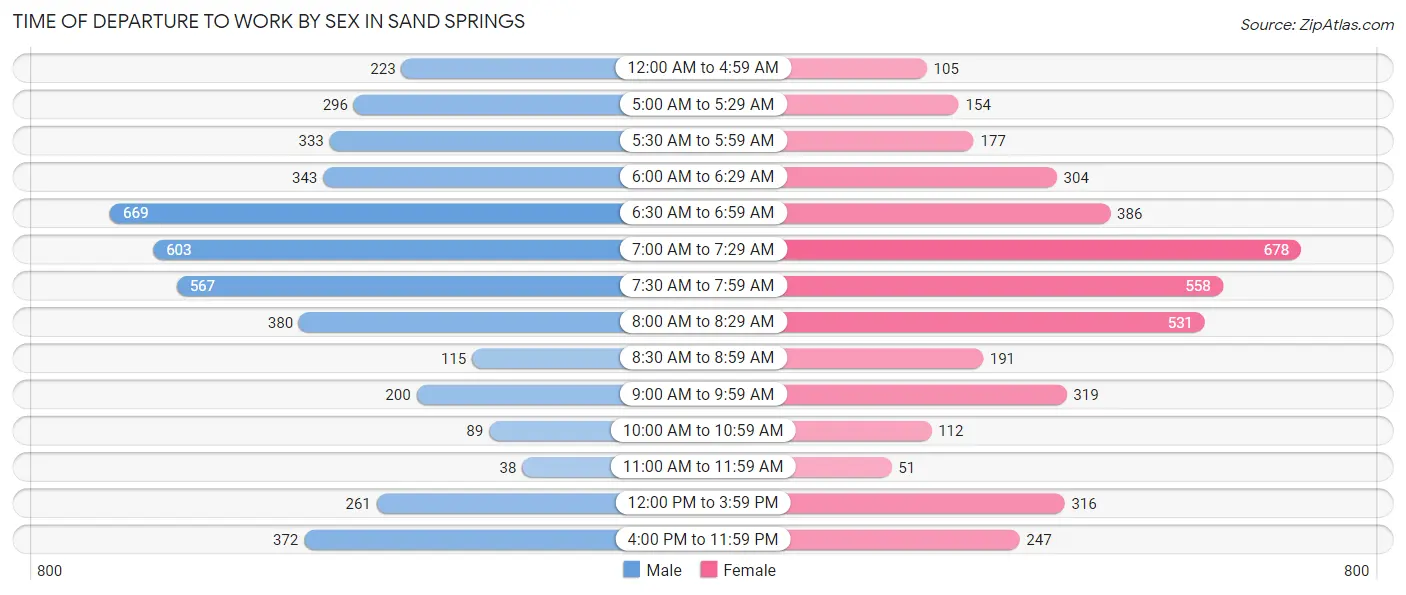
| Time of Departure | Male | Female |
| 12:00 AM to 4:59 AM | 223 (5.0%) | 105 (2.5%) |
| 5:00 AM to 5:29 AM | 296 (6.6%) | 154 (3.7%) |
| 5:30 AM to 5:59 AM | 333 (7.4%) | 177 (4.3%) |
| 6:00 AM to 6:29 AM | 343 (7.6%) | 304 (7.4%) |
| 6:30 AM to 6:59 AM | 669 (14.9%) | 386 (9.3%) |
| 7:00 AM to 7:29 AM | 603 (13.4%) | 678 (16.4%) |
| 7:30 AM to 7:59 AM | 567 (12.6%) | 558 (13.5%) |
| 8:00 AM to 8:29 AM | 380 (8.5%) | 531 (12.9%) |
| 8:30 AM to 8:59 AM | 115 (2.6%) | 191 (4.6%) |
| 9:00 AM to 9:59 AM | 200 (4.5%) | 319 (7.7%) |
| 10:00 AM to 10:59 AM | 89 (2.0%) | 112 (2.7%) |
| 11:00 AM to 11:59 AM | 38 (0.9%) | 51 (1.2%) |
| 12:00 PM to 3:59 PM | 261 (5.8%) | 316 (7.6%) |
| 4:00 PM to 11:59 PM | 372 (8.3%) | 247 (6.0%) |
| Total | 4,489 (100.0%) | 4,129 (100.0%) |
Housing Occupancy in Sand Springs
Occupancy by Ownership in Sand Springs
Of the total 7,427 dwellings in Sand Springs, owner-occupied units account for 5,232 (70.5%), while renter-occupied units make up 2,195 (29.5%).
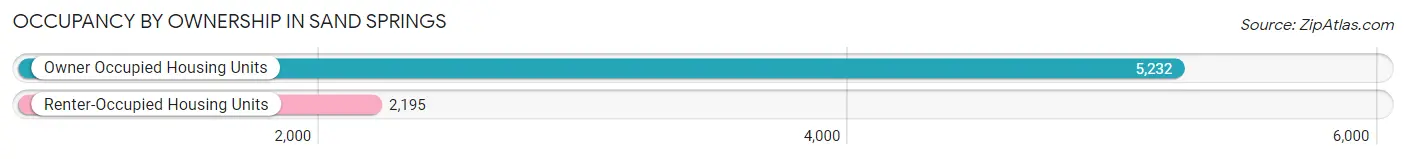
| Occupancy | # Housing Units | % Housing Units |
| Owner Occupied Housing Units | 5,232 | 70.5% |
| Renter-Occupied Housing Units | 2,195 | 29.5% |
| Total Occupied Housing Units | 7,427 | 100.0% |
Occupancy by Household Size in Sand Springs
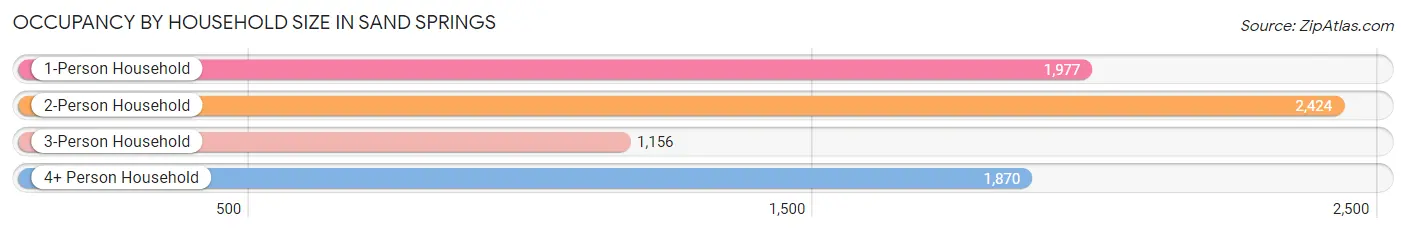
| Household Size | # Housing Units | % Housing Units |
| 1-Person Household | 1,977 | 26.6% |
| 2-Person Household | 2,424 | 32.6% |
| 3-Person Household | 1,156 | 15.6% |
| 4+ Person Household | 1,870 | 25.2% |
| Total Housing Units | 7,427 | 100.0% |
Occupancy by Ownership by Household Size in Sand Springs
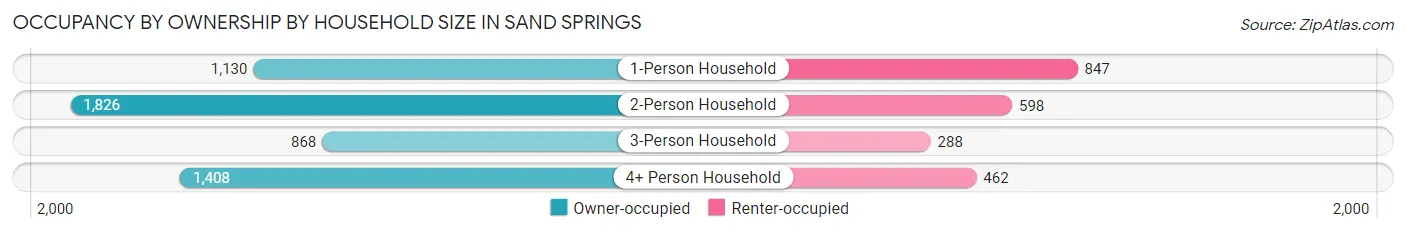
| Household Size | Owner-occupied | Renter-occupied |
| 1-Person Household | 1,130 (57.2%) | 847 (42.8%) |
| 2-Person Household | 1,826 (75.3%) | 598 (24.7%) |
| 3-Person Household | 868 (75.1%) | 288 (24.9%) |
| 4+ Person Household | 1,408 (75.3%) | 462 (24.7%) |
| Total Housing Units | 5,232 (70.5%) | 2,195 (29.5%) |
Occupancy by Educational Attainment in Sand Springs
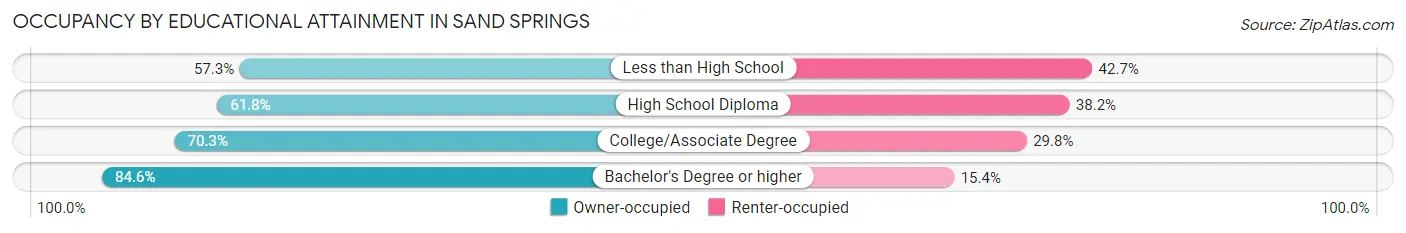
| Household Size | Owner-occupied | Renter-occupied |
| Less than High School | 350 (57.3%) | 261 (42.7%) |
| High School Diploma | 1,363 (61.8%) | 843 (38.2%) |
| College/Associate Degree | 1,868 (70.3%) | 791 (29.7%) |
| Bachelor's Degree or higher | 1,651 (84.6%) | 300 (15.4%) |
Occupancy by Age of Householder in Sand Springs
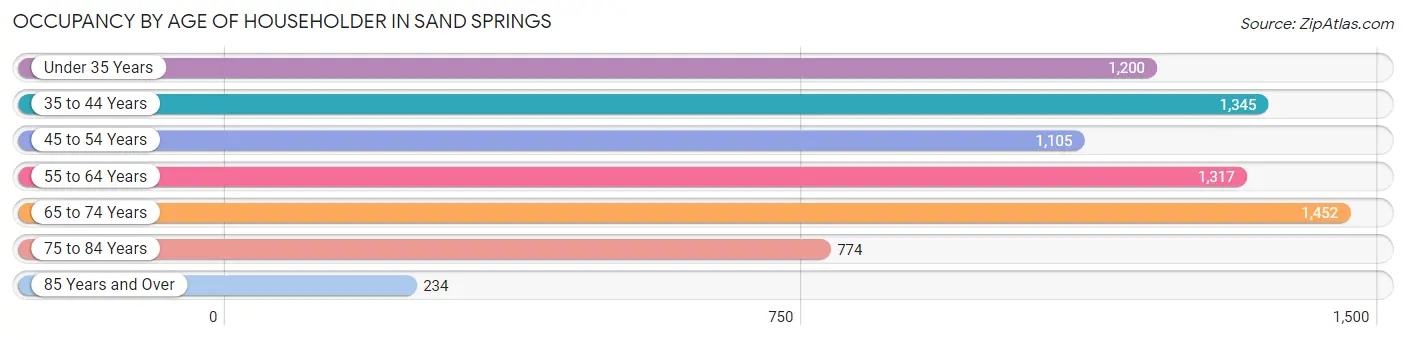
| Age Bracket | # Households | % Households |
| Under 35 Years | 1,200 | 16.2% |
| 35 to 44 Years | 1,345 | 18.1% |
| 45 to 54 Years | 1,105 | 14.9% |
| 55 to 64 Years | 1,317 | 17.7% |
| 65 to 74 Years | 1,452 | 19.6% |
| 75 to 84 Years | 774 | 10.4% |
| 85 Years and Over | 234 | 3.2% |
| Total | 7,427 | 100.0% |
Housing Finances in Sand Springs
Median Income by Occupancy in Sand Springs
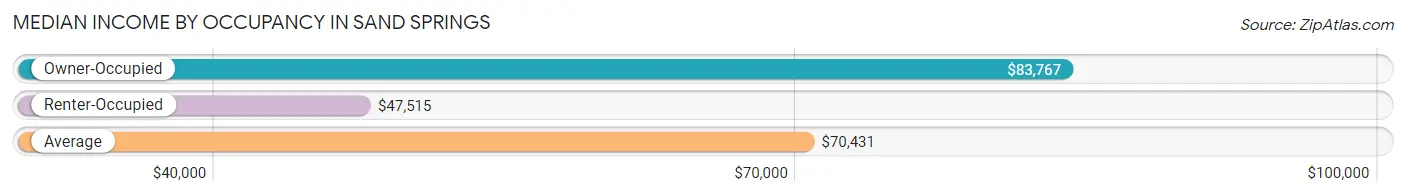
| Occupancy Type | # Households | Median Income |
| Owner-Occupied | 5,232 (70.5%) | $83,767 |
| Renter-Occupied | 2,195 (29.5%) | $47,515 |
| Average | 7,427 (100.0%) | $70,431 |
Occupancy by Householder Income Bracket in Sand Springs
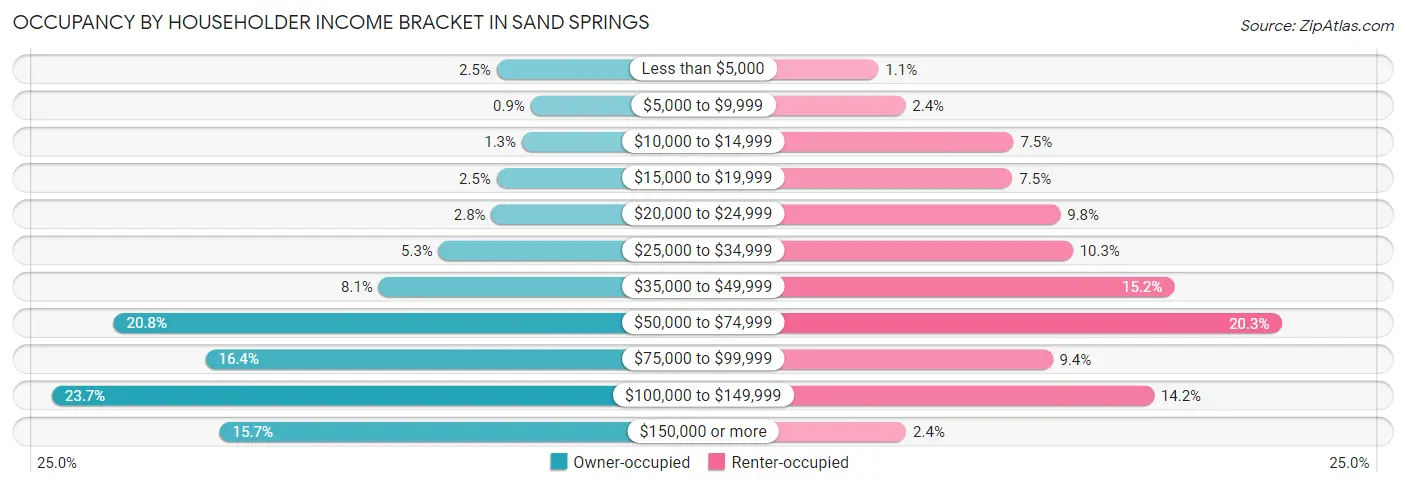
| Income Bracket | Owner-occupied | Renter-occupied |
| Less than $5,000 | 132 (2.5%) | 24 (1.1%) |
| $5,000 to $9,999 | 47 (0.9%) | 52 (2.4%) |
| $10,000 to $14,999 | 69 (1.3%) | 165 (7.5%) |
| $15,000 to $19,999 | 132 (2.5%) | 164 (7.5%) |
| $20,000 to $24,999 | 145 (2.8%) | 214 (9.8%) |
| $25,000 to $34,999 | 276 (5.3%) | 227 (10.3%) |
| $35,000 to $49,999 | 426 (8.1%) | 333 (15.2%) |
| $50,000 to $74,999 | 1,086 (20.8%) | 445 (20.3%) |
| $75,000 to $99,999 | 857 (16.4%) | 206 (9.4%) |
| $100,000 to $149,999 | 1,240 (23.7%) | 312 (14.2%) |
| $150,000 or more | 822 (15.7%) | 53 (2.4%) |
| Total | 5,232 (100.0%) | 2,195 (100.0%) |
Monthly Housing Cost Tiers in Sand Springs
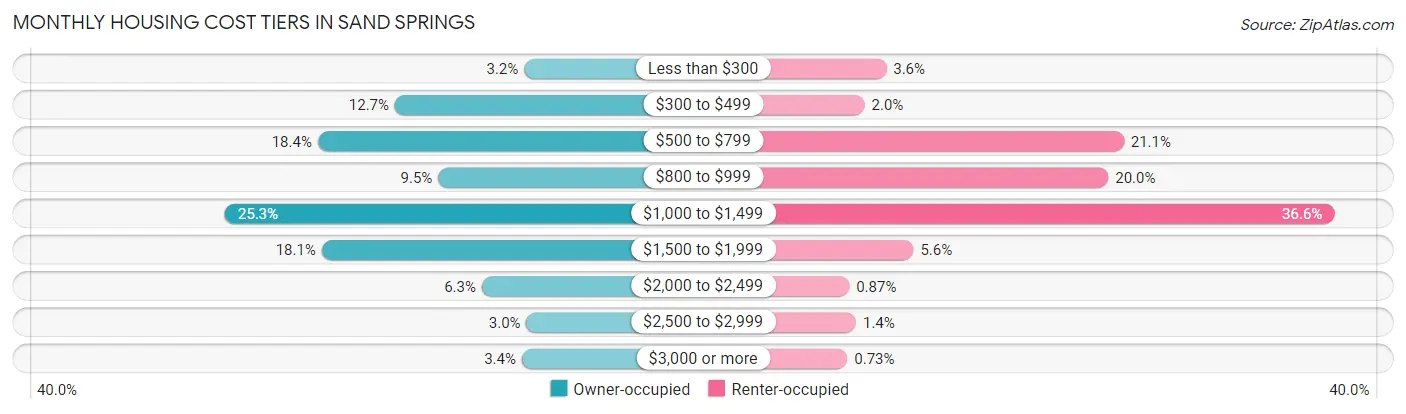
| Monthly Cost | Owner-occupied | Renter-occupied |
| Less than $300 | 168 (3.2%) | 79 (3.6%) |
| $300 to $499 | 666 (12.7%) | 44 (2.0%) |
| $500 to $799 | 963 (18.4%) | 463 (21.1%) |
| $800 to $999 | 499 (9.5%) | 438 (20.0%) |
| $1,000 to $1,499 | 1,321 (25.3%) | 803 (36.6%) |
| $1,500 to $1,999 | 948 (18.1%) | 123 (5.6%) |
| $2,000 to $2,499 | 331 (6.3%) | 19 (0.9%) |
| $2,500 to $2,999 | 159 (3.0%) | 30 (1.4%) |
| $3,000 or more | 177 (3.4%) | 16 (0.7%) |
| Total | 5,232 (100.0%) | 2,195 (100.0%) |
Physical Housing Characteristics in Sand Springs
Housing Structures in Sand Springs
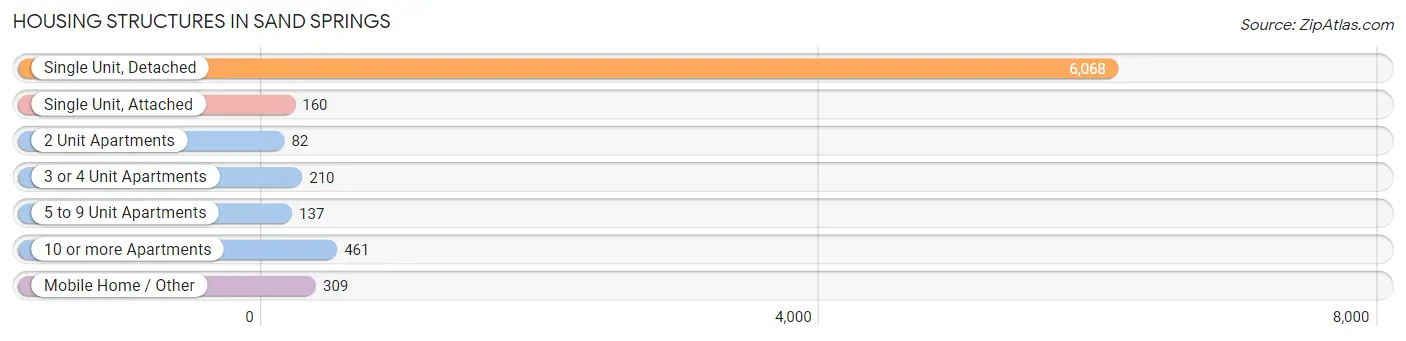
| Structure Type | # Housing Units | % Housing Units |
| Single Unit, Detached | 6,068 | 81.7% |
| Single Unit, Attached | 160 | 2.1% |
| 2 Unit Apartments | 82 | 1.1% |
| 3 or 4 Unit Apartments | 210 | 2.8% |
| 5 to 9 Unit Apartments | 137 | 1.8% |
| 10 or more Apartments | 461 | 6.2% |
| Mobile Home / Other | 309 | 4.2% |
| Total | 7,427 | 100.0% |
Housing Structures by Occupancy in Sand Springs
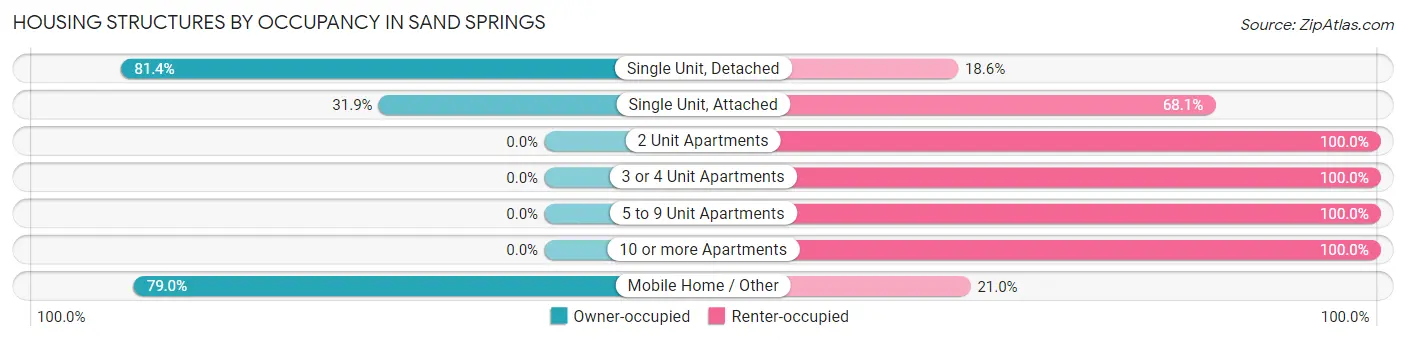
| Structure Type | Owner-occupied | Renter-occupied |
| Single Unit, Detached | 4,937 (81.4%) | 1,131 (18.6%) |
| Single Unit, Attached | 51 (31.9%) | 109 (68.1%) |
| 2 Unit Apartments | 0 (0.0%) | 82 (100.0%) |
| 3 or 4 Unit Apartments | 0 (0.0%) | 210 (100.0%) |
| 5 to 9 Unit Apartments | 0 (0.0%) | 137 (100.0%) |
| 10 or more Apartments | 0 (0.0%) | 461 (100.0%) |
| Mobile Home / Other | 244 (79.0%) | 65 (21.0%) |
| Total | 5,232 (70.5%) | 2,195 (29.5%) |
Housing Structures by Number of Rooms in Sand Springs
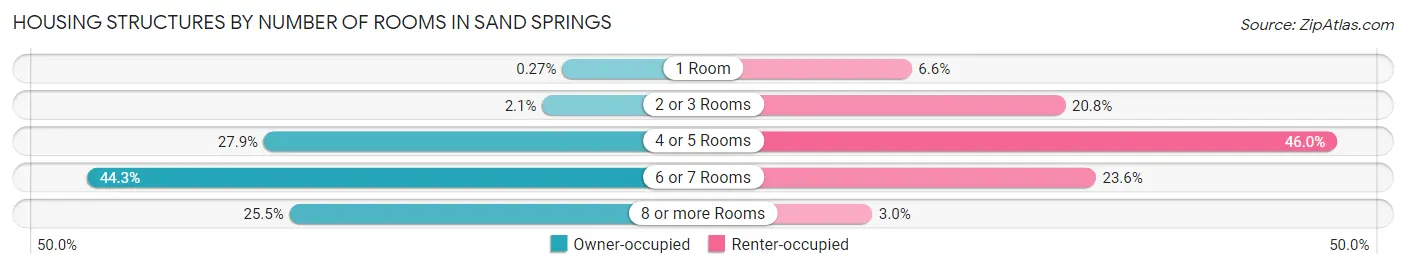
| Number of Rooms | Owner-occupied | Renter-occupied |
| 1 Room | 14 (0.3%) | 145 (6.6%) |
| 2 or 3 Rooms | 111 (2.1%) | 457 (20.8%) |
| 4 or 5 Rooms | 1,458 (27.9%) | 1,009 (46.0%) |
| 6 or 7 Rooms | 2,315 (44.3%) | 519 (23.6%) |
| 8 or more Rooms | 1,334 (25.5%) | 65 (3.0%) |
| Total | 5,232 (100.0%) | 2,195 (100.0%) |
Housing Structure by Heating Type in Sand Springs
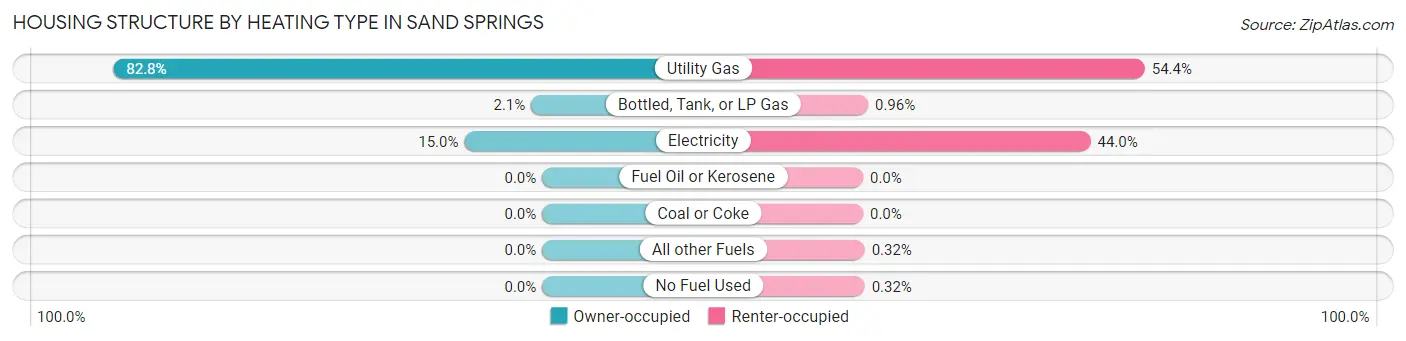
| Heating Type | Owner-occupied | Renter-occupied |
| Utility Gas | 4,334 (82.8%) | 1,195 (54.4%) |
| Bottled, Tank, or LP Gas | 111 (2.1%) | 21 (1.0%) |
| Electricity | 787 (15.0%) | 965 (44.0%) |
| Fuel Oil or Kerosene | 0 (0.0%) | 0 (0.0%) |
| Coal or Coke | 0 (0.0%) | 0 (0.0%) |
| All other Fuels | 0 (0.0%) | 7 (0.3%) |
| No Fuel Used | 0 (0.0%) | 7 (0.3%) |
| Total | 5,232 (100.0%) | 2,195 (100.0%) |
Household Vehicle Usage in Sand Springs
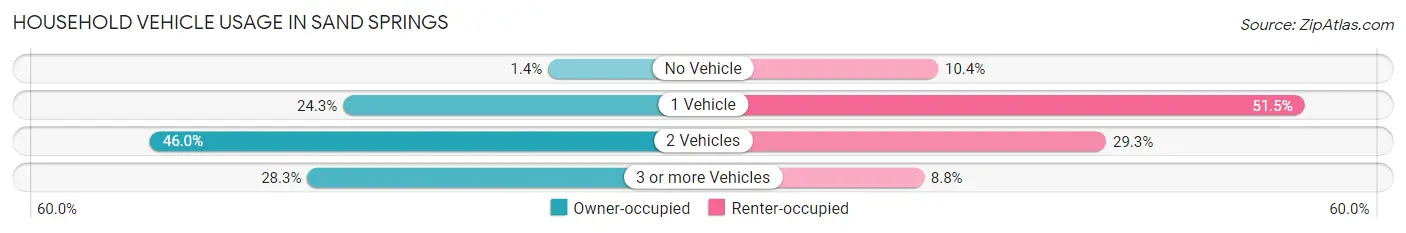
| Vehicles per Household | Owner-occupied | Renter-occupied |
| No Vehicle | 71 (1.4%) | 229 (10.4%) |
| 1 Vehicle | 1,273 (24.3%) | 1,130 (51.5%) |
| 2 Vehicles | 2,405 (46.0%) | 642 (29.2%) |
| 3 or more Vehicles | 1,483 (28.3%) | 194 (8.8%) |
| Total | 5,232 (100.0%) | 2,195 (100.0%) |
Real Estate & Mortgages in Sand Springs
Real Estate and Mortgage Overview in Sand Springs
| Characteristic | Without Mortgage | With Mortgage |
| Housing Units | 1,745 | 3,487 |
| Median Property Value | $156,000 | $185,100 |
| Median Household Income | $63,024 | $521 |
| Monthly Housing Costs | $525 | $177 |
| Real Estate Taxes | $1,495 | $118 |
Property Value by Mortgage Status in Sand Springs
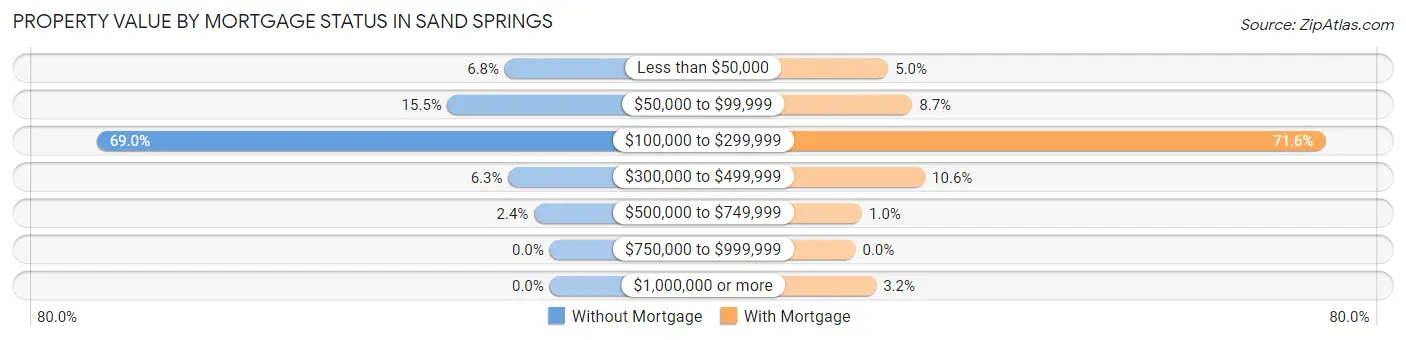
| Property Value | Without Mortgage | With Mortgage |
| Less than $50,000 | 119 (6.8%) | 174 (5.0%) |
| $50,000 to $99,999 | 271 (15.5%) | 302 (8.7%) |
| $100,000 to $299,999 | 1,204 (69.0%) | 2,496 (71.6%) |
| $300,000 to $499,999 | 110 (6.3%) | 370 (10.6%) |
| $500,000 to $749,999 | 41 (2.4%) | 35 (1.0%) |
| $750,000 to $999,999 | 0 (0.0%) | 0 (0.0%) |
| $1,000,000 or more | 0 (0.0%) | 110 (3.2%) |
| Total | 1,745 (100.0%) | 3,487 (100.0%) |
Household Income by Mortgage Status in Sand Springs
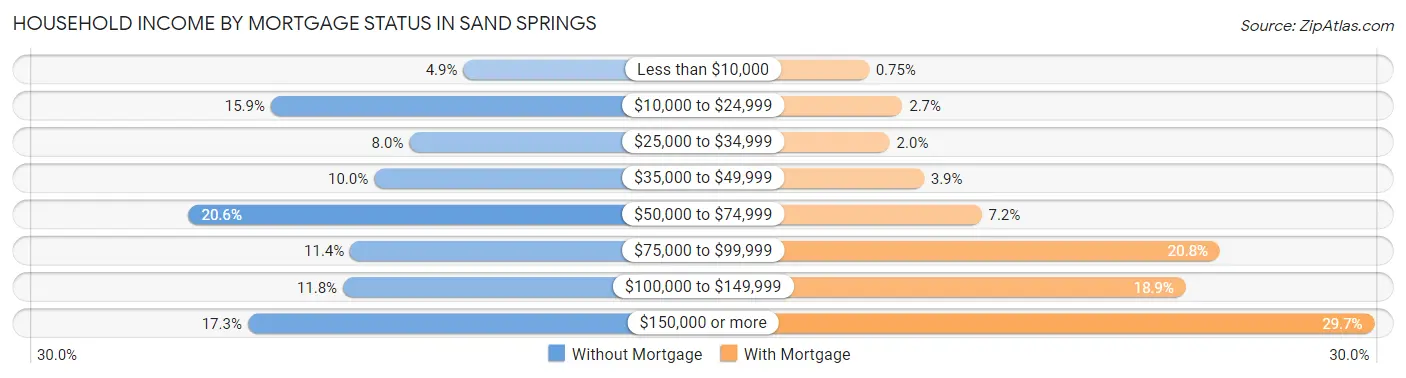
| Household Income | Without Mortgage | With Mortgage |
| Less than $10,000 | 86 (4.9%) | 26 (0.7%) |
| $10,000 to $24,999 | 278 (15.9%) | 93 (2.7%) |
| $25,000 to $34,999 | 140 (8.0%) | 68 (1.9%) |
| $35,000 to $49,999 | 175 (10.0%) | 136 (3.9%) |
| $50,000 to $74,999 | 360 (20.6%) | 251 (7.2%) |
| $75,000 to $99,999 | 199 (11.4%) | 726 (20.8%) |
| $100,000 to $149,999 | 206 (11.8%) | 658 (18.9%) |
| $150,000 or more | 301 (17.2%) | 1,034 (29.6%) |
| Total | 1,745 (100.0%) | 3,487 (100.0%) |
Property Value to Household Income Ratio in Sand Springs
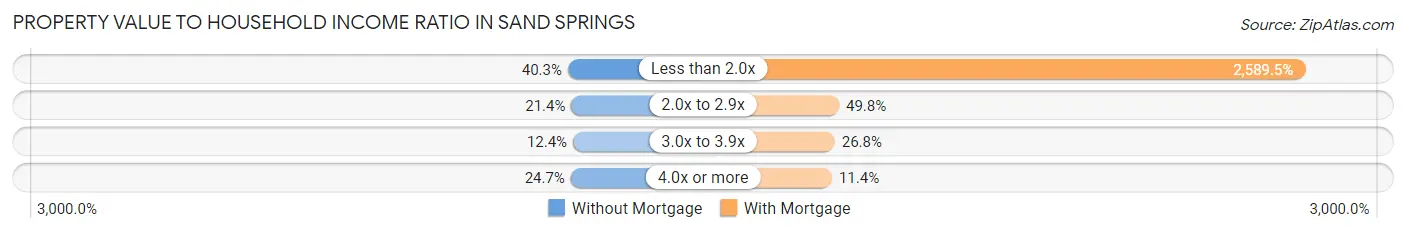
| Value-to-Income Ratio | Without Mortgage | With Mortgage |
| Less than 2.0x | 703 (40.3%) | 90,295 (2,589.5%) |
| 2.0x to 2.9x | 373 (21.4%) | 1,736 (49.8%) |
| 3.0x to 3.9x | 217 (12.4%) | 934 (26.8%) |
| 4.0x or more | 431 (24.7%) | 396 (11.4%) |
| Total | 1,745 (100.0%) | 3,487 (100.0%) |
Real Estate Taxes by Mortgage Status in Sand Springs
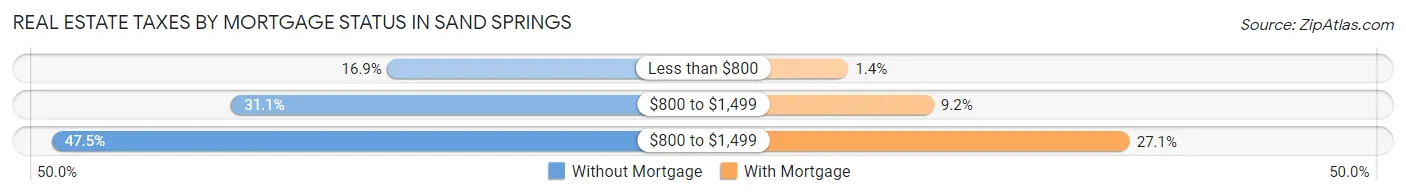
| Property Taxes | Without Mortgage | With Mortgage |
| Less than $800 | 294 (16.9%) | 49 (1.4%) |
| $800 to $1,499 | 543 (31.1%) | 321 (9.2%) |
| $800 to $1,499 | 829 (47.5%) | 945 (27.1%) |
| Total | 1,745 (100.0%) | 3,487 (100.0%) |
Health & Disability in Sand Springs
Health Insurance Coverage by Age in Sand Springs
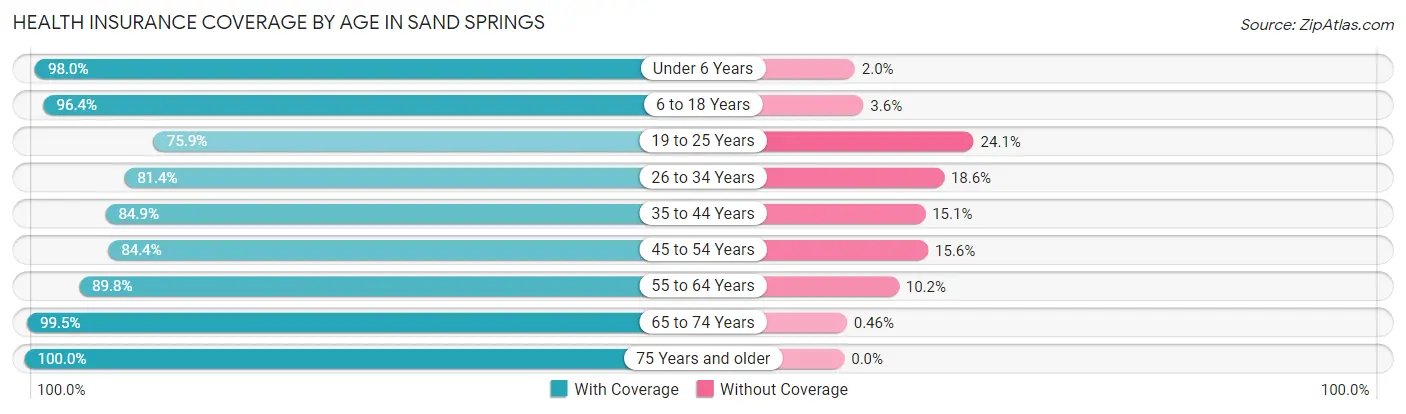
| Age Bracket | With Coverage | Without Coverage |
| Under 6 Years | 1,352 (98.0%) | 27 (2.0%) |
| 6 to 18 Years | 3,876 (96.4%) | 143 (3.6%) |
| 19 to 25 Years | 1,416 (75.9%) | 450 (24.1%) |
| 26 to 34 Years | 1,600 (81.4%) | 365 (18.6%) |
| 35 to 44 Years | 2,285 (84.9%) | 406 (15.1%) |
| 45 to 54 Years | 1,819 (84.4%) | 337 (15.6%) |
| 55 to 64 Years | 2,016 (89.8%) | 228 (10.2%) |
| 65 to 74 Years | 1,967 (99.5%) | 9 (0.5%) |
| 75 Years and older | 1,440 (100.0%) | 0 (0.0%) |
| Total | 17,771 (90.0%) | 1,965 (10.0%) |
Health Insurance Coverage by Citizenship Status in Sand Springs
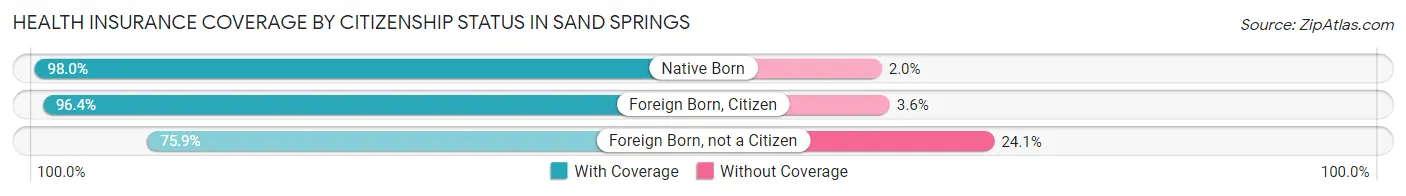
| Citizenship Status | With Coverage | Without Coverage |
| Native Born | 1,352 (98.0%) | 27 (2.0%) |
| Foreign Born, Citizen | 3,876 (96.4%) | 143 (3.6%) |
| Foreign Born, not a Citizen | 1,416 (75.9%) | 450 (24.1%) |
Health Insurance Coverage by Household Income in Sand Springs
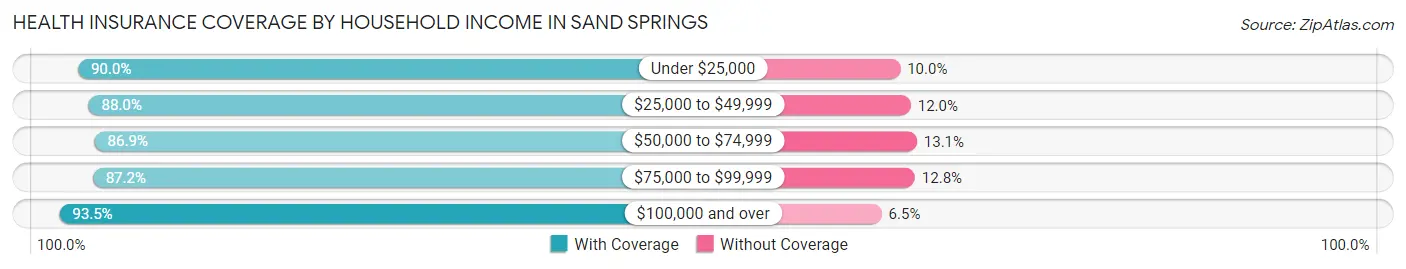
| Household Income | With Coverage | Without Coverage |
| Under $25,000 | 2,013 (90.0%) | 224 (10.0%) |
| $25,000 to $49,999 | 2,547 (88.0%) | 347 (12.0%) |
| $50,000 to $74,999 | 3,096 (86.9%) | 468 (13.1%) |
| $75,000 to $99,999 | 2,858 (87.2%) | 418 (12.8%) |
| $100,000 and over | 7,243 (93.5%) | 506 (6.5%) |
Public vs Private Health Insurance Coverage by Age in Sand Springs
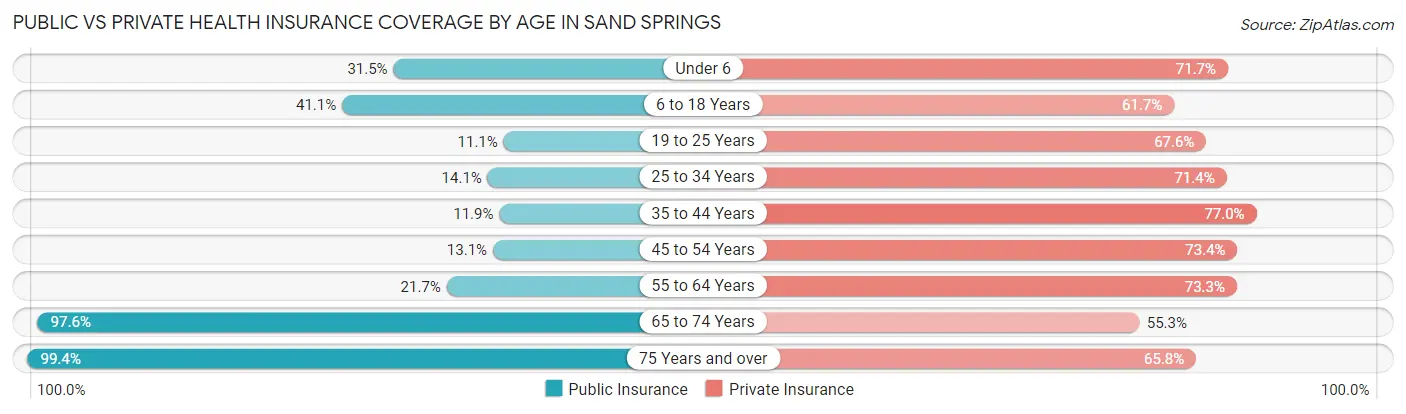
| Age Bracket | Public Insurance | Private Insurance |
| Under 6 | 435 (31.5%) | 988 (71.7%) |
| 6 to 18 Years | 1,651 (41.1%) | 2,479 (61.7%) |
| 19 to 25 Years | 207 (11.1%) | 1,262 (67.6%) |
| 25 to 34 Years | 276 (14.1%) | 1,403 (71.4%) |
| 35 to 44 Years | 320 (11.9%) | 2,071 (77.0%) |
| 45 to 54 Years | 282 (13.1%) | 1,583 (73.4%) |
| 55 to 64 Years | 486 (21.7%) | 1,645 (73.3%) |
| 65 to 74 Years | 1,928 (97.6%) | 1,093 (55.3%) |
| 75 Years and over | 1,432 (99.4%) | 947 (65.8%) |
| Total | 7,017 (35.5%) | 13,471 (68.3%) |
Disability Status by Sex by Age in Sand Springs
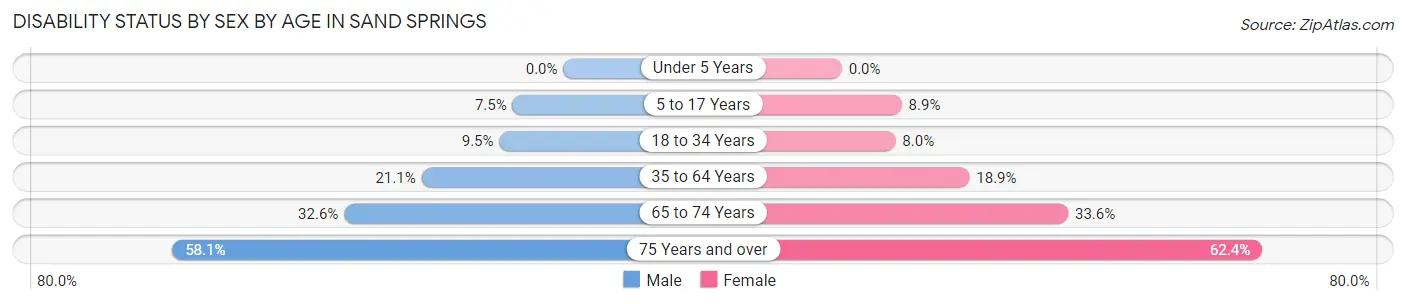
| Age Bracket | Male | Female |
| Under 5 Years | 0 (0.0%) | 0 (0.0%) |
| 5 to 17 Years | 157 (7.5%) | 164 (8.9%) |
| 18 to 34 Years | 203 (9.5%) | 155 (8.0%) |
| 35 to 64 Years | 712 (21.1%) | 703 (18.9%) |
| 65 to 74 Years | 277 (32.6%) | 378 (33.6%) |
| 75 Years and over | 424 (58.1%) | 443 (62.4%) |
Disability Class by Sex by Age in Sand Springs
Disability Class: Hearing Difficulty
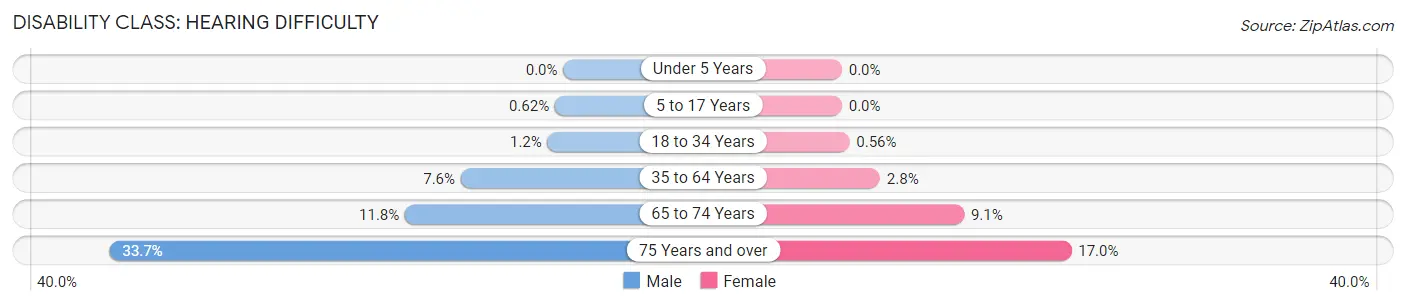
| Age Bracket | Male | Female |
| Under 5 Years | 0 (0.0%) | 0 (0.0%) |
| 5 to 17 Years | 13 (0.6%) | 0 (0.0%) |
| 18 to 34 Years | 25 (1.2%) | 11 (0.6%) |
| 35 to 64 Years | 257 (7.6%) | 105 (2.8%) |
| 65 to 74 Years | 100 (11.7%) | 102 (9.1%) |
| 75 Years and over | 246 (33.7%) | 121 (17.0%) |
Disability Class: Vision Difficulty
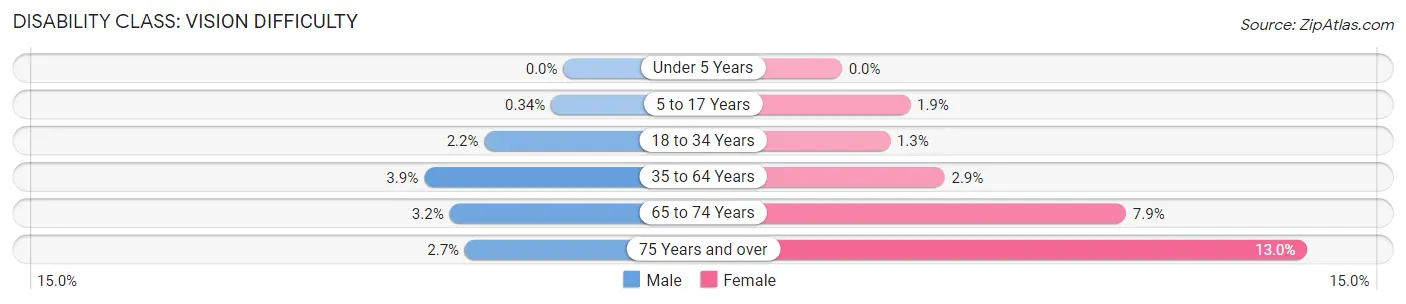
| Age Bracket | Male | Female |
| Under 5 Years | 0 (0.0%) | 0 (0.0%) |
| 5 to 17 Years | 7 (0.3%) | 35 (1.9%) |
| 18 to 34 Years | 47 (2.2%) | 26 (1.3%) |
| 35 to 64 Years | 131 (3.9%) | 106 (2.9%) |
| 65 to 74 Years | 27 (3.2%) | 89 (7.9%) |
| 75 Years and over | 20 (2.7%) | 92 (13.0%) |
Disability Class: Cognitive Difficulty
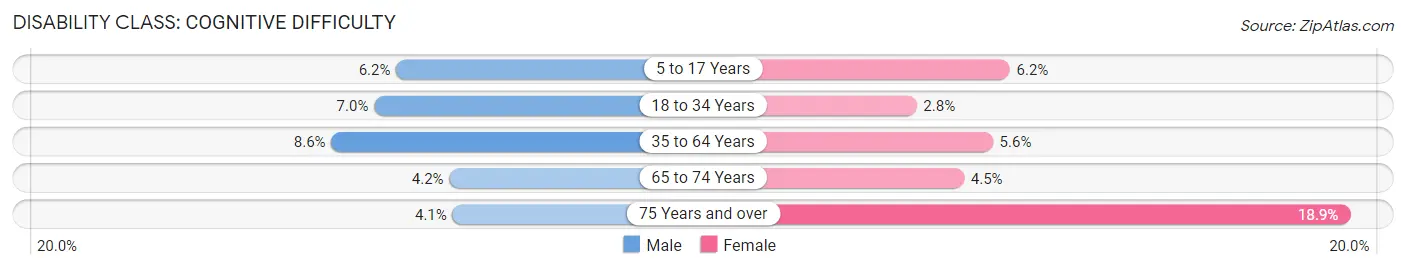
| Age Bracket | Male | Female |
| 5 to 17 Years | 129 (6.2%) | 115 (6.2%) |
| 18 to 34 Years | 150 (7.0%) | 54 (2.8%) |
| 35 to 64 Years | 291 (8.6%) | 208 (5.6%) |
| 65 to 74 Years | 36 (4.2%) | 51 (4.5%) |
| 75 Years and over | 30 (4.1%) | 134 (18.9%) |
Disability Class: Ambulatory Difficulty
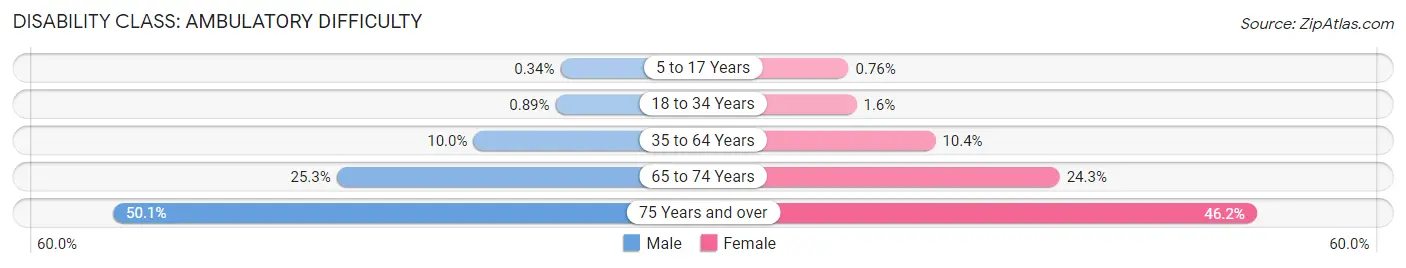
| Age Bracket | Male | Female |
| 5 to 17 Years | 7 (0.3%) | 14 (0.8%) |
| 18 to 34 Years | 19 (0.9%) | 32 (1.6%) |
| 35 to 64 Years | 339 (10.0%) | 387 (10.4%) |
| 65 to 74 Years | 215 (25.3%) | 273 (24.3%) |
| 75 Years and over | 366 (50.1%) | 328 (46.2%) |
Disability Class: Self-Care Difficulty
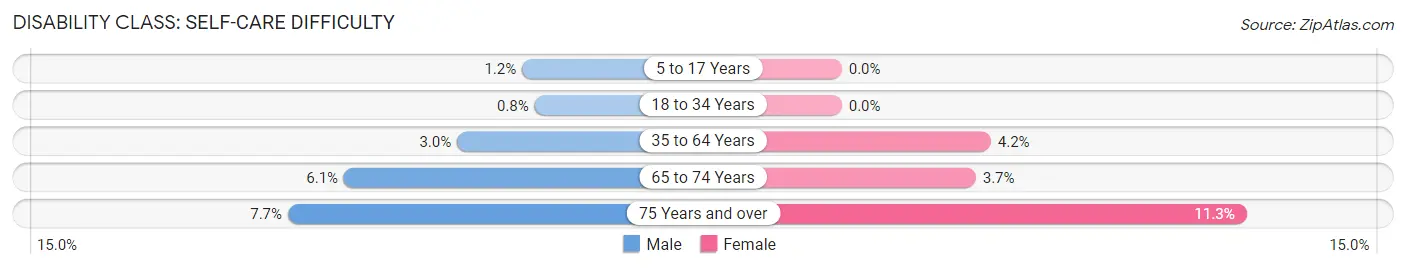
| Age Bracket | Male | Female |
| 5 to 17 Years | 24 (1.1%) | 0 (0.0%) |
| 18 to 34 Years | 17 (0.8%) | 0 (0.0%) |
| 35 to 64 Years | 100 (3.0%) | 154 (4.2%) |
| 65 to 74 Years | 52 (6.1%) | 42 (3.7%) |
| 75 Years and over | 56 (7.7%) | 80 (11.3%) |
Technology Access in Sand Springs
Computing Device Access in Sand Springs
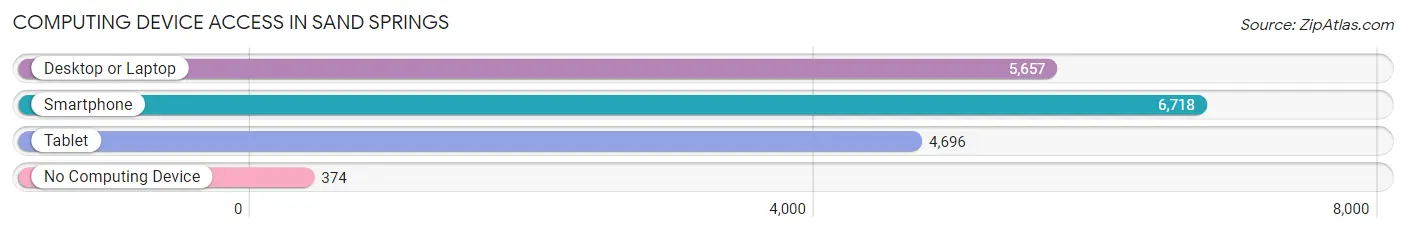
| Device Type | # Households | % Households |
| Desktop or Laptop | 5,657 | 76.2% |
| Smartphone | 6,718 | 90.4% |
| Tablet | 4,696 | 63.2% |
| No Computing Device | 374 | 5.0% |
| Total | 7,427 | 100.0% |
Internet Access in Sand Springs
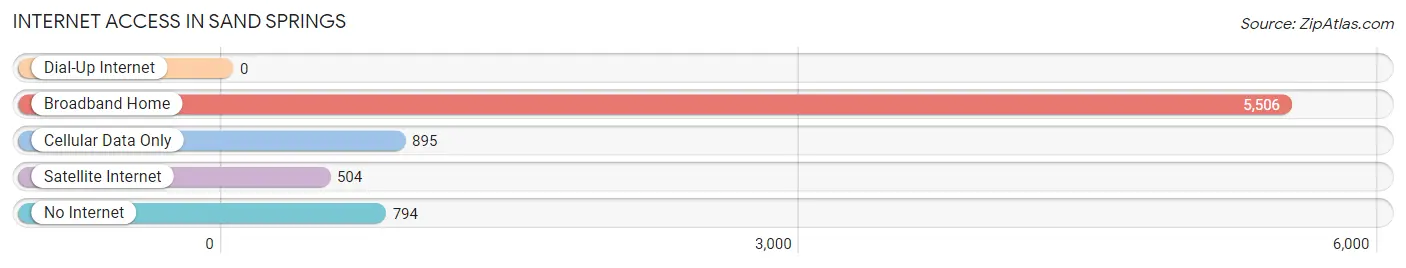
| Internet Type | # Households | % Households |
| Dial-Up Internet | 0 | 0.0% |
| Broadband Home | 5,506 | 74.1% |
| Cellular Data Only | 895 | 12.0% |
| Satellite Internet | 504 | 6.8% |
| No Internet | 794 | 10.7% |
| Total | 7,427 | 100.0% |
Sand Springs Summary
History
Sand Springs, Oklahoma is a city located in Tulsa County, Oklahoma. It is a suburb of Tulsa, located just west of the Arkansas River. The city was founded in 1911 by oilman Charles Page, who was looking for a place to build a model community for his workers. He purchased the land from the Creek Nation and named it Sand Springs after the sand dunes that were located in the area.
The city was incorporated in 1912 and quickly grew due to the oil boom in the area. The population grew from 1,000 in 1912 to over 10,000 by 1920. The city was home to many oil companies, including the Page Oil Company, which was founded by Charles Page. The city also had a thriving business district, with many stores, restaurants, and other businesses.
The city was also home to a number of churches, schools, and other institutions. The Sand Springs School District was established in 1913 and is still in operation today. The city also had a number of parks, including the Charles Page Memorial Park, which was established in 1921.
The city experienced a period of decline in the 1950s and 1960s due to the decline of the oil industry. However, the city has since experienced a resurgence, with new businesses and housing developments being built. The population of the city has grown to over 20,000 as of 2020.
Geography
Sand Springs is located in Tulsa County, Oklahoma, just west of the Arkansas River. The city is located in the Osage Plains region of Oklahoma, which is characterized by rolling hills and flat plains. The city is located at an elevation of 745 feet above sea level.
The city covers an area of 16.3 square miles, with a population density of 1,250 people per square mile. The city is located in the Central Standard Time Zone and observes Daylight Saving Time.
The climate in Sand Springs is classified as humid subtropical, with hot summers and mild winters. The average temperature in the summer is around 90 degrees Fahrenheit, while the average temperature in the winter is around 40 degrees Fahrenheit. The city receives an average of 40 inches of precipitation per year.
Economy
Sand Springs has a diverse economy, with a variety of industries represented. The city is home to a number of manufacturing companies, including the Sand Springs Manufacturing Company, which produces industrial equipment. The city is also home to a number of oil and gas companies, including the Page Oil Company, which was founded by Charles Page.
The city is also home to a number of retail stores, restaurants, and other businesses. The city is home to a number of medical facilities, including the Sand Springs Medical Center. The city is also home to a number of educational institutions, including the Sand Springs School District.
Demographics
As of the 2020 census, the population of Sand Springs was 20,717. The population is made up of a diverse mix of races and ethnicities, with the largest group being White (77.3%), followed by Hispanic or Latino (10.2%), African American (7.2%), and Asian (2.3%).
The median household income in Sand Springs is $50,945, which is slightly higher than the national median of $50,221. The median home value in the city is $133,400, which is slightly lower than the national median of $184,700. The city has a poverty rate of 11.3%, which is slightly higher than the national average of 10.5%.
Conclusion
Sand Springs, Oklahoma is a city located in Tulsa County, Oklahoma. It is a suburb of Tulsa, located just west of the Arkansas River. The city was founded in 1911 by oilman Charles Page, who was looking for a place to build a model community for his workers. The city has a diverse economy, with a variety of industries represented. The population of the city is 20,717, with a median household income of $50,945 and a median home value of $133,400. The city has a poverty rate of 11.3%, which is slightly higher than the national average. Sand Springs is a thriving city with a rich history and a bright future.
Common Questions
What is Per Capita Income in Sand Springs?
Per Capita income in Sand Springs is $32,237.
What is the Median Family Income in Sand Springs?
Median Family Income in Sand Springs is $83,727.
What is the Median Household income in Sand Springs?
Median Household Income in Sand Springs is $70,431.
What is Income or Wage Gap in Sand Springs?
Income or Wage Gap in Sand Springs is 26.0%.
Women in Sand Springs earn 74.0 cents for every dollar earned by a man.
What is Inequality or Gini Index in Sand Springs?
Inequality or Gini Index in Sand Springs is 0.40.
What is the Total Population of Sand Springs?
Total Population of Sand Springs is 19,925.
What is the Total Male Population of Sand Springs?
Total Male Population of Sand Springs is 9,836.
What is the Total Female Population of Sand Springs?
Total Female Population of Sand Springs is 10,089.
What is the Ratio of Males per 100 Females in Sand Springs?
There are 97.49 Males per 100 Females in Sand Springs.
What is the Ratio of Females per 100 Males in Sand Springs?
There are 102.57 Females per 100 Males in Sand Springs.
What is the Median Population Age in Sand Springs?
Median Population Age in Sand Springs is 36.6 Years.
What is the Average Family Size in Sand Springs
Average Family Size in Sand Springs is 3.2 People.
What is the Average Household Size in Sand Springs
Average Household Size in Sand Springs is 2.7 People.
How Large is the Labor Force in Sand Springs?
There are 9,622 People in the Labor Forcein in Sand Springs.
What is the Percentage of People in the Labor Force in Sand Springs?
62.6% of People are in the Labor Force in Sand Springs.
What is the Unemployment Rate in Sand Springs?
Unemployment Rate in Sand Springs is 4.5%.