Rush Springs, OK Map & Demographics
Rush Springs Map
Rush Springs Overview
$20,855
PER CAPITA INCOME
$43,654
AVG FAMILY INCOME
$37,344
AVG HOUSEHOLD INCOME
43.1%
WAGE / INCOME GAP [ % ]
56.9¢/ $1
WAGE / INCOME GAP [ $ ]
$12,434
FAMILY INCOME DEFICIT
0.41
INEQUALITY / GINI INDEX
1,265
TOTAL POPULATION
652
MALE POPULATION
613
FEMALE POPULATION
106.36
MALES / 100 FEMALES
94.02
FEMALES / 100 MALES
38.7
MEDIAN AGE
3.2
AVG FAMILY SIZE
2.5
AVG HOUSEHOLD SIZE
504
LABOR FORCE [ PEOPLE ]
49.8%
PERCENT IN LABOR FORCE
6.7%
UNEMPLOYMENT RATE
Rush Springs Zip Codes
Rush Springs Area Codes
Income in Rush Springs
Income Overview in Rush Springs
Per Capita Income in Rush Springs is $20,855, while median incomes of families and households are $43,654 and $37,344 respectively.
| Characteristic | Number | Measure |
| Per Capita Income | 1,265 | $20,855 |
| Median Family Income | 308 | $43,654 |
| Mean Family Income | 308 | $55,655 |
| Median Household Income | 502 | $37,344 |
| Mean Household Income | 502 | $47,175 |
| Income Deficit | 308 | $12,434 |
| Wage / Income Gap (%) | 1,265 | 43.11% |
| Wage / Income Gap ($) | 1,265 | 56.89¢ per $1 |
| Gini / Inequality Index | 1,265 | 0.41 |
Earnings by Sex in Rush Springs
Average Earnings in Rush Springs are $29,750, $34,861 for men and $19,833 for women, a difference of 43.1%.
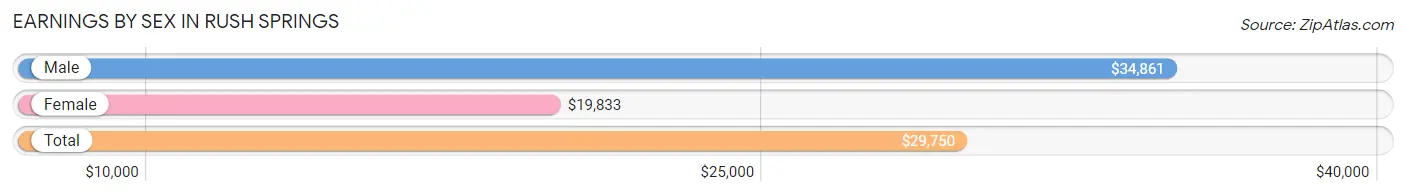
| Sex | Number | Average Earnings |
| Male | 298 (58.7%) | $34,861 |
| Female | 210 (41.3%) | $19,833 |
| Total | 508 (100.0%) | $29,750 |
Earnings by Sex by Income Bracket in Rush Springs
The most common earnings brackets in Rush Springs are $30,000 to $34,999 for men (42 | 14.1%) and $2,499 or less for women (28 | 13.3%).
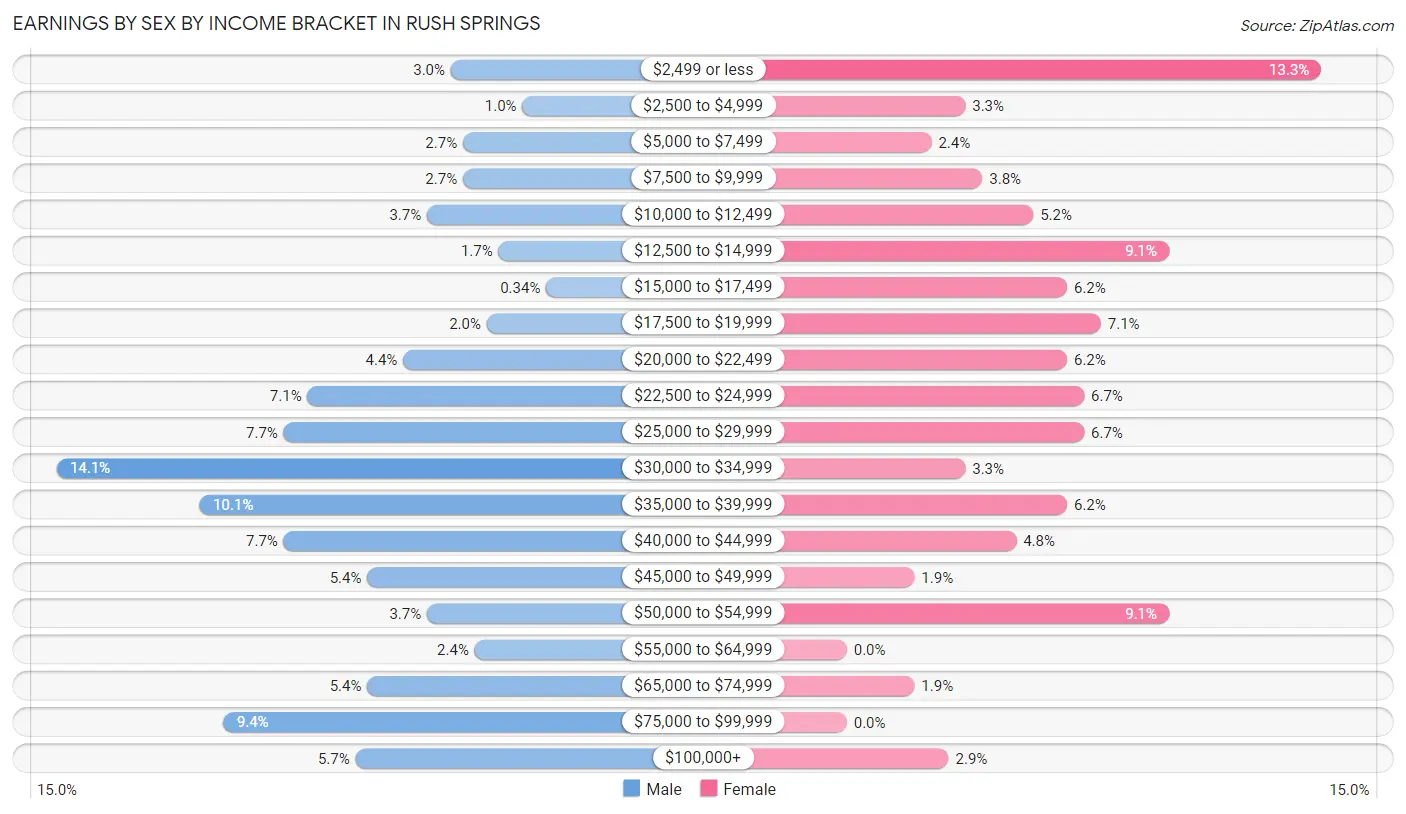
| Income | Male | Female |
| $2,499 or less | 9 (3.0%) | 28 (13.3%) |
| $2,500 to $4,999 | 3 (1.0%) | 7 (3.3%) |
| $5,000 to $7,499 | 8 (2.7%) | 5 (2.4%) |
| $7,500 to $9,999 | 8 (2.7%) | 8 (3.8%) |
| $10,000 to $12,499 | 11 (3.7%) | 11 (5.2%) |
| $12,500 to $14,999 | 5 (1.7%) | 19 (9.0%) |
| $15,000 to $17,499 | 1 (0.3%) | 13 (6.2%) |
| $17,500 to $19,999 | 6 (2.0%) | 15 (7.1%) |
| $20,000 to $22,499 | 13 (4.4%) | 13 (6.2%) |
| $22,500 to $24,999 | 21 (7.0%) | 14 (6.7%) |
| $25,000 to $29,999 | 23 (7.7%) | 14 (6.7%) |
| $30,000 to $34,999 | 42 (14.1%) | 7 (3.3%) |
| $35,000 to $39,999 | 30 (10.1%) | 13 (6.2%) |
| $40,000 to $44,999 | 23 (7.7%) | 10 (4.8%) |
| $45,000 to $49,999 | 16 (5.4%) | 4 (1.9%) |
| $50,000 to $54,999 | 11 (3.7%) | 19 (9.0%) |
| $55,000 to $64,999 | 7 (2.4%) | 0 (0.0%) |
| $65,000 to $74,999 | 16 (5.4%) | 4 (1.9%) |
| $75,000 to $99,999 | 28 (9.4%) | 0 (0.0%) |
| $100,000+ | 17 (5.7%) | 6 (2.9%) |
| Total | 298 (100.0%) | 210 (100.0%) |
Earnings by Sex by Educational Attainment in Rush Springs
Average earnings in Rush Springs are $39,327 for men and $20,769 for women, a difference of 47.2%. Men with an educational attainment of graduate degree enjoy the highest average annual earnings of $111,250, while those with high school diploma education earn the least with $35,278. Women with an educational attainment of bachelor's degree earn the most with the average annual earnings of $28,750, while those with less than high school education have the smallest earnings of $14,531.
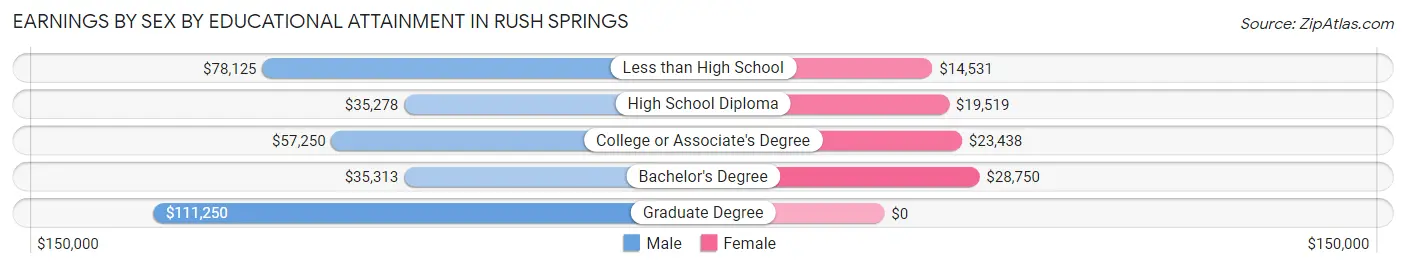
| Educational Attainment | Male Income | Female Income |
| Less than High School | $78,125 | $14,531 |
| High School Diploma | $35,278 | $19,519 |
| College or Associate's Degree | $57,250 | $23,438 |
| Bachelor's Degree | $35,313 | $28,750 |
| Graduate Degree | $111,250 | $0 |
| Total | $39,327 | $20,769 |
Family Income in Rush Springs
Family Income Brackets in Rush Springs
According to the Rush Springs family income data, there are 71 families falling into the $35,000 to $49,999 income range, which is the most common income bracket and makes up 23.1% of all families. Conversely, the $200,000+ income bracket is the least frequent group with only 2 families (0.6%) belonging to this category.
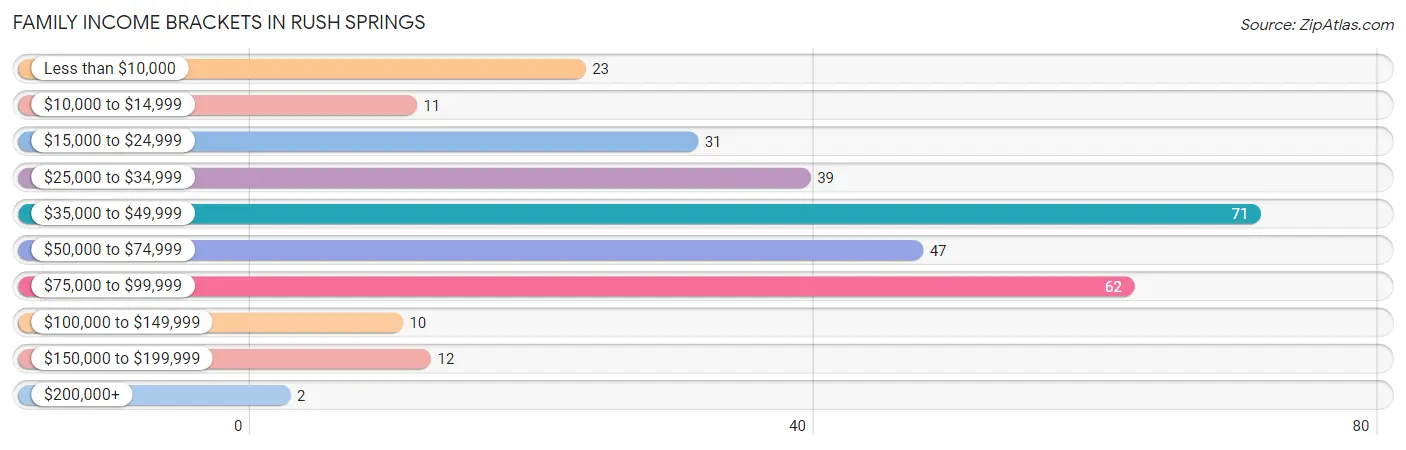
| Income Bracket | # Families | % Families |
| Less than $10,000 | 23 | 7.5% |
| $10,000 to $14,999 | 11 | 3.6% |
| $15,000 to $24,999 | 31 | 10.1% |
| $25,000 to $34,999 | 39 | 12.7% |
| $35,000 to $49,999 | 71 | 23.1% |
| $50,000 to $74,999 | 47 | 15.3% |
| $75,000 to $99,999 | 62 | 20.1% |
| $100,000 to $149,999 | 10 | 3.2% |
| $150,000 to $199,999 | 12 | 3.9% |
| $200,000+ | 2 | 0.6% |
Family Income by Famaliy Size in Rush Springs
3-person families (55 | 17.9%) account for the highest median family income in Rush Springs with $82,625 per family, while 3-person families (55 | 17.9%) have the highest median income of $27,542 per family member.
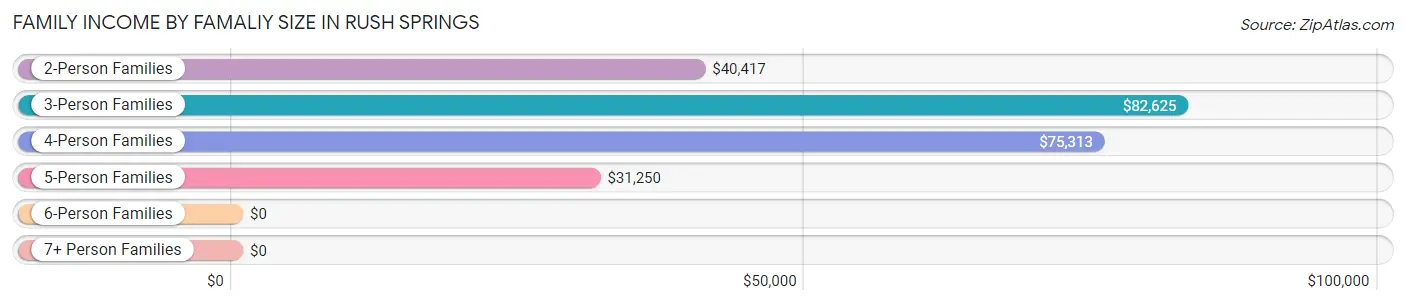
| Income Bracket | # Families | Median Income |
| 2-Person Families | 163 (52.9%) | $40,417 |
| 3-Person Families | 55 (17.9%) | $82,625 |
| 4-Person Families | 53 (17.2%) | $75,313 |
| 5-Person Families | 17 (5.5%) | $31,250 |
| 6-Person Families | 11 (3.6%) | $0 |
| 7+ Person Families | 9 (2.9%) | $0 |
| Total | 308 (100.0%) | $43,654 |
Family Income by Number of Earners in Rush Springs
The median family income in Rush Springs is $43,654, with families comprising 3+ earners (12) having the highest median family income of $149,167, while families with no earners (66) have the lowest median family income of $30,625, accounting for 3.9% and 21.4% of families, respectively.
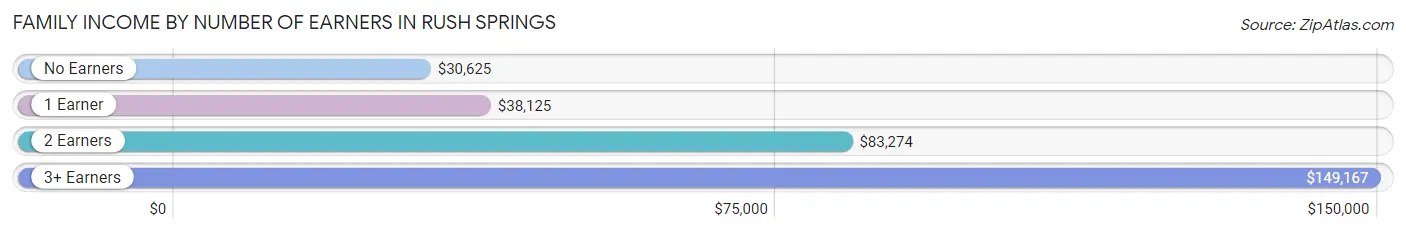
| Number of Earners | # Families | Median Income |
| No Earners | 66 (21.4%) | $30,625 |
| 1 Earner | 137 (44.5%) | $38,125 |
| 2 Earners | 93 (30.2%) | $83,274 |
| 3+ Earners | 12 (3.9%) | $149,167 |
| Total | 308 (100.0%) | $43,654 |
Household Income in Rush Springs
Household Income Brackets in Rush Springs
With 96 households falling in the category, the $35,000 to $49,999 income range is the most frequent in Rush Springs, accounting for 19.1% of all households. In contrast, only 2 households (0.4%) fall into the $200,000+ income bracket, making it the least populous group.
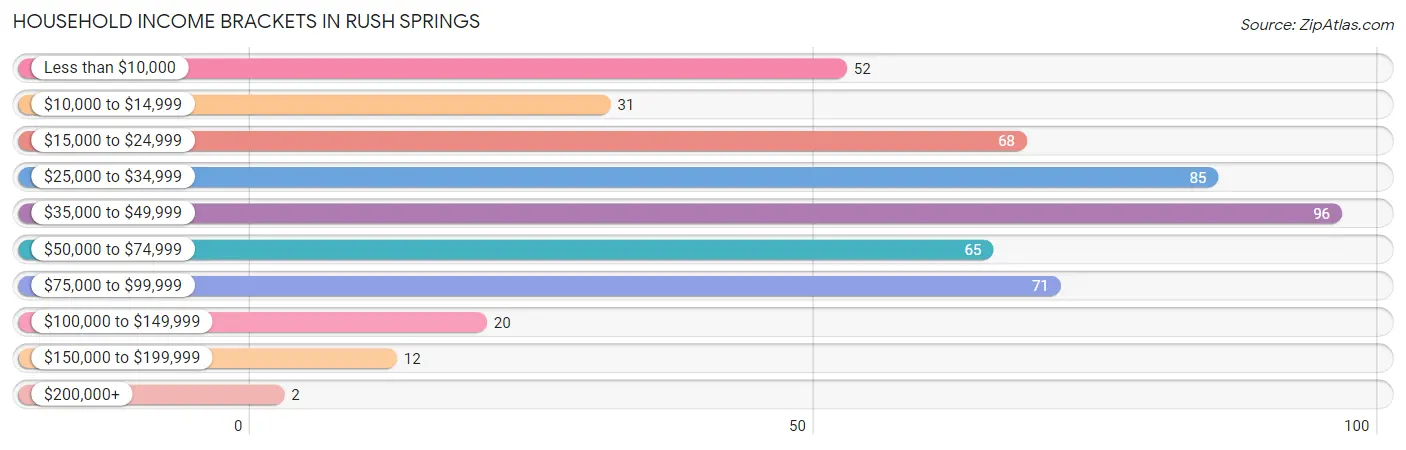
| Income Bracket | # Households | % Households |
| Less than $10,000 | 52 | 10.4% |
| $10,000 to $14,999 | 31 | 6.2% |
| $15,000 to $24,999 | 68 | 13.5% |
| $25,000 to $34,999 | 85 | 16.9% |
| $35,000 to $49,999 | 96 | 19.1% |
| $50,000 to $74,999 | 65 | 12.9% |
| $75,000 to $99,999 | 71 | 14.1% |
| $100,000 to $149,999 | 20 | 4.0% |
| $150,000 to $199,999 | 12 | 2.4% |
| $200,000+ | 2 | 0.4% |
Household Income by Householder Age in Rush Springs
The median household income in Rush Springs is $37,344, with the highest median household income of $60,313 found in the 45 to 64 years age bracket for the primary householder. A total of 134 households (26.7%) fall into this category. Meanwhile, the 65+ years age bracket for the primary householder has the lowest median household income of $26,964, with 212 households (42.2%) in this group.
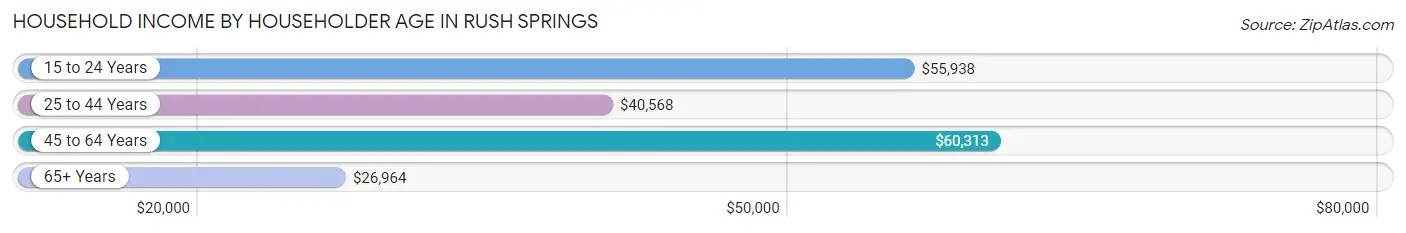
| Income Bracket | # Households | Median Income |
| 15 to 24 Years | 15 (3.0%) | $55,938 |
| 25 to 44 Years | 141 (28.1%) | $40,568 |
| 45 to 64 Years | 134 (26.7%) | $60,313 |
| 65+ Years | 212 (42.2%) | $26,964 |
| Total | 502 (100.0%) | $37,344 |
Poverty in Rush Springs
Income Below Poverty by Sex and Age in Rush Springs
With 25.2% poverty level for males and 26.9% for females among the residents of Rush Springs, 15 year old males and 12 to 14 year old females are the most vulnerable to poverty, with 18 males (75.0%) and 20 females (74.1%) in their respective age groups living below the poverty level.
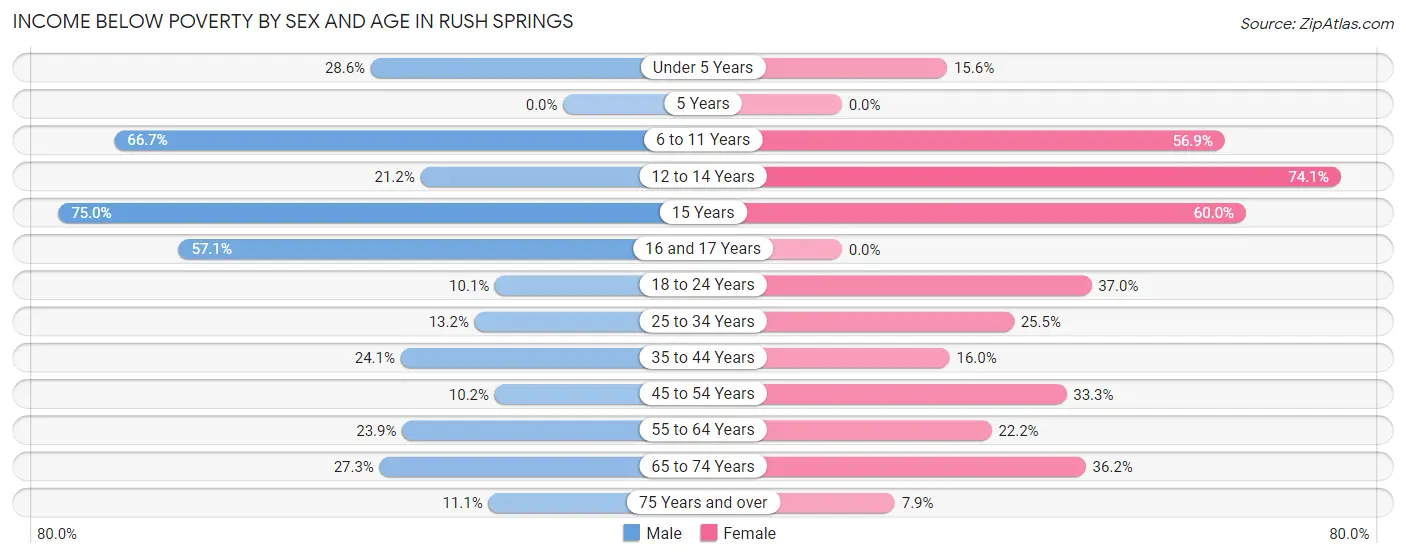
| Age Bracket | Male | Female |
| Under 5 Years | 6 (28.6%) | 5 (15.6%) |
| 5 Years | 0 (0.0%) | 0 (0.0%) |
| 6 to 11 Years | 28 (66.7%) | 29 (56.9%) |
| 12 to 14 Years | 7 (21.2%) | 20 (74.1%) |
| 15 Years | 18 (75.0%) | 3 (60.0%) |
| 16 and 17 Years | 20 (57.1%) | 0 (0.0%) |
| 18 to 24 Years | 8 (10.1%) | 10 (37.0%) |
| 25 to 34 Years | 10 (13.2%) | 24 (25.5%) |
| 35 to 44 Years | 21 (24.1%) | 12 (16.0%) |
| 45 to 54 Years | 6 (10.2%) | 20 (33.3%) |
| 55 to 64 Years | 11 (23.9%) | 14 (22.2%) |
| 65 to 74 Years | 21 (27.3%) | 21 (36.2%) |
| 75 Years and over | 7 (11.1%) | 7 (7.9%) |
| Total | 163 (25.2%) | 165 (26.9%) |
Income Above Poverty by Sex and Age in Rush Springs
According to the poverty statistics in Rush Springs, males aged 5 years and females aged 5 years are the age groups that are most secure financially, with 100.0% of males and 100.0% of females in these age groups living above the poverty line.
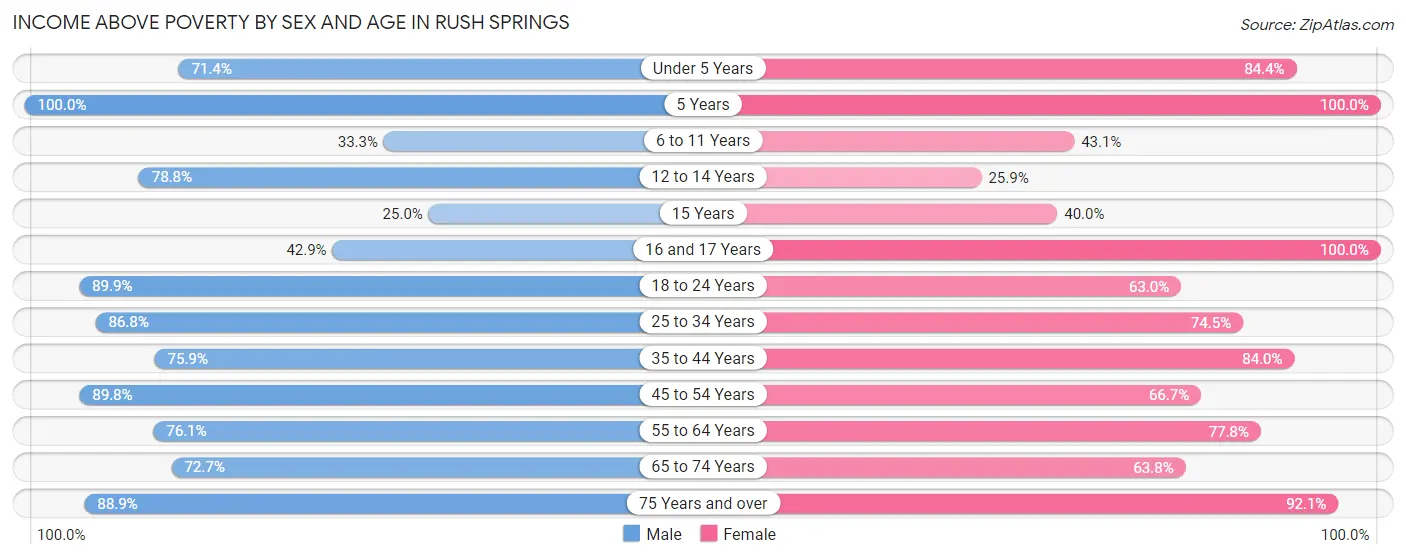
| Age Bracket | Male | Female |
| Under 5 Years | 15 (71.4%) | 27 (84.4%) |
| 5 Years | 6 (100.0%) | 7 (100.0%) |
| 6 to 11 Years | 14 (33.3%) | 22 (43.1%) |
| 12 to 14 Years | 26 (78.8%) | 7 (25.9%) |
| 15 Years | 6 (25.0%) | 2 (40.0%) |
| 16 and 17 Years | 15 (42.9%) | 25 (100.0%) |
| 18 to 24 Years | 71 (89.9%) | 17 (63.0%) |
| 25 to 34 Years | 66 (86.8%) | 70 (74.5%) |
| 35 to 44 Years | 66 (75.9%) | 63 (84.0%) |
| 45 to 54 Years | 53 (89.8%) | 40 (66.7%) |
| 55 to 64 Years | 35 (76.1%) | 49 (77.8%) |
| 65 to 74 Years | 56 (72.7%) | 37 (63.8%) |
| 75 Years and over | 56 (88.9%) | 82 (92.1%) |
| Total | 485 (74.9%) | 448 (73.1%) |
Income Below Poverty Among Married-Couple Families in Rush Springs
The poverty statistics for married-couple families in Rush Springs show that 15.1% or 30 of the total 199 families live below the poverty line. Families with 3 or 4 children have the highest poverty rate of 41.2%, comprising of 7 families. On the other hand, families with 5 or more children have the lowest poverty rate of 0.0%, which includes 0 families.
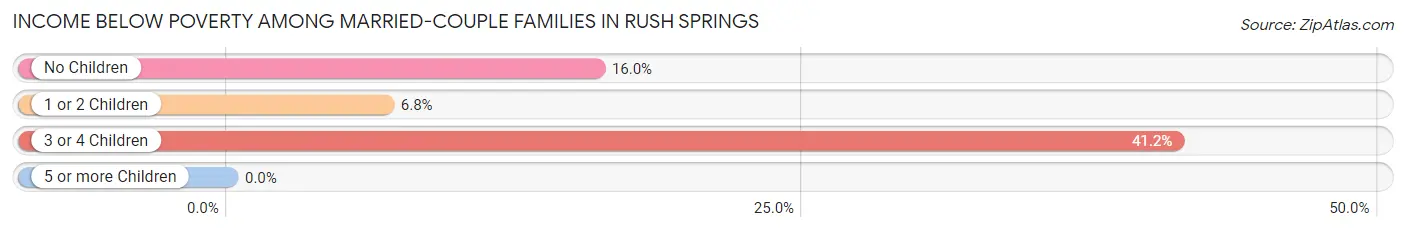
| Children | Above Poverty | Below Poverty |
| No Children | 100 (84.0%) | 19 (16.0%) |
| 1 or 2 Children | 55 (93.2%) | 4 (6.8%) |
| 3 or 4 Children | 10 (58.8%) | 7 (41.2%) |
| 5 or more Children | 4 (100.0%) | 0 (0.0%) |
| Total | 169 (84.9%) | 30 (15.1%) |
Income Below Poverty Among Single-Parent Households in Rush Springs
According to the poverty data in Rush Springs, 24.3% or 9 single-father households and 36.1% or 26 single-mother households are living below the poverty line. Among single-father households, those with 5 or more children have the highest poverty rate, with 2 households (100.0%) experiencing poverty. Likewise, among single-mother households, those with 5 or more children have the highest poverty rate, with 3 households (100.0%) falling below the poverty line.
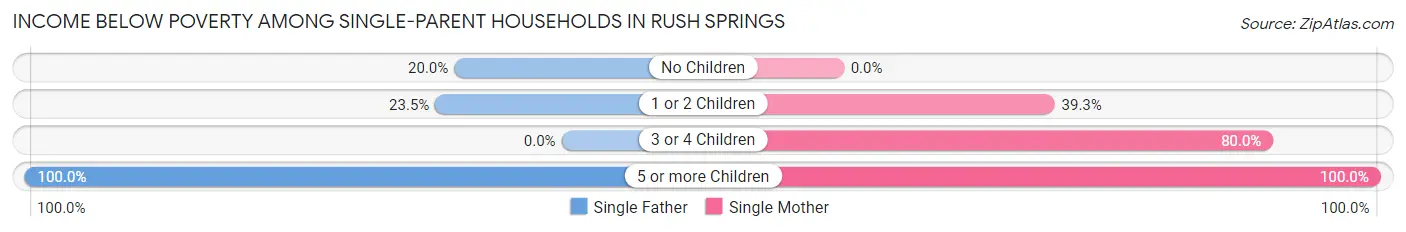
| Children | Single Father | Single Mother |
| No Children | 3 (20.0%) | 0 (0.0%) |
| 1 or 2 Children | 4 (23.5%) | 11 (39.3%) |
| 3 or 4 Children | 0 (0.0%) | 12 (80.0%) |
| 5 or more Children | 2 (100.0%) | 3 (100.0%) |
| Total | 9 (24.3%) | 26 (36.1%) |
Income Below Poverty Among Married-Couple vs Single-Parent Households in Rush Springs
The poverty data for Rush Springs shows that 30 of the married-couple family households (15.1%) and 35 of the single-parent households (32.1%) are living below the poverty level. Within the married-couple family households, those with 3 or 4 children have the highest poverty rate, with 7 households (41.2%) falling below the poverty line. Among the single-parent households, those with 5 or more children have the highest poverty rate, with 5 household (100.0%) living below poverty.
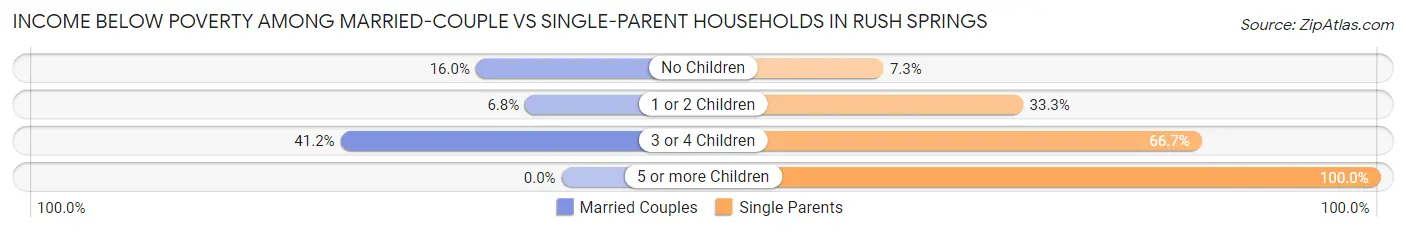
| Children | Married-Couple Families | Single-Parent Households |
| No Children | 19 (16.0%) | 3 (7.3%) |
| 1 or 2 Children | 4 (6.8%) | 15 (33.3%) |
| 3 or 4 Children | 7 (41.2%) | 12 (66.7%) |
| 5 or more Children | 0 (0.0%) | 5 (100.0%) |
| Total | 30 (15.1%) | 35 (32.1%) |
Race in Rush Springs
The most populous races in Rush Springs are White / Caucasian (1,018 | 80.5%), Two or more Races (191 | 15.1%), and Native / Alaskan (54 | 4.3%).
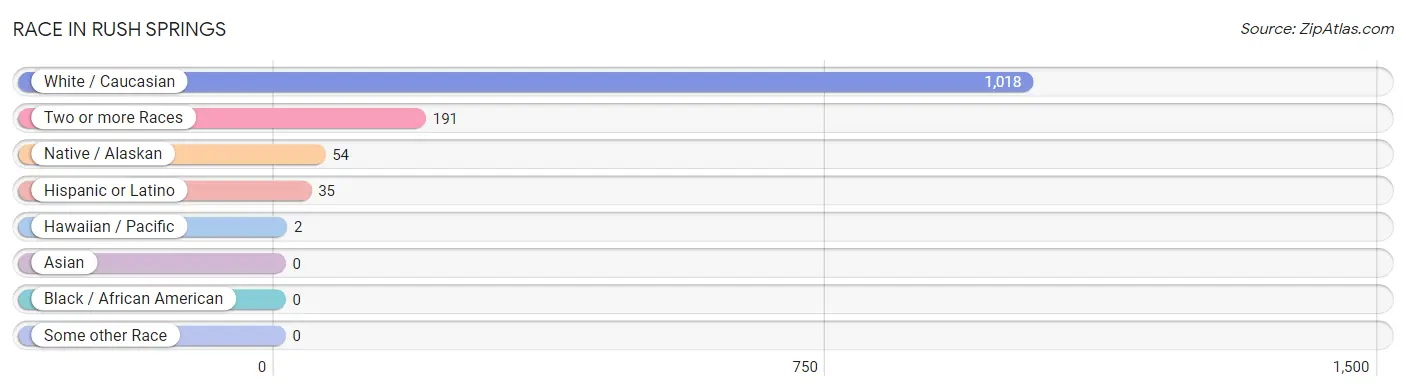
| Race | # Population | % Population |
| Asian | 0 | 0.0% |
| Black / African American | 0 | 0.0% |
| Hawaiian / Pacific | 2 | 0.2% |
| Hispanic or Latino | 35 | 2.8% |
| Native / Alaskan | 54 | 4.3% |
| White / Caucasian | 1,018 | 80.5% |
| Two or more Races | 191 | 15.1% |
| Some other Race | 0 | 0.0% |
| Total | 1,265 | 100.0% |
Ancestry in Rush Springs
The most populous ancestries reported in Rush Springs are English (200 | 15.8%), Irish (160 | 12.7%), German (153 | 12.1%), Cherokee (62 | 4.9%), and American (51 | 4.0%), together accounting for 49.5% of all Rush Springs residents.
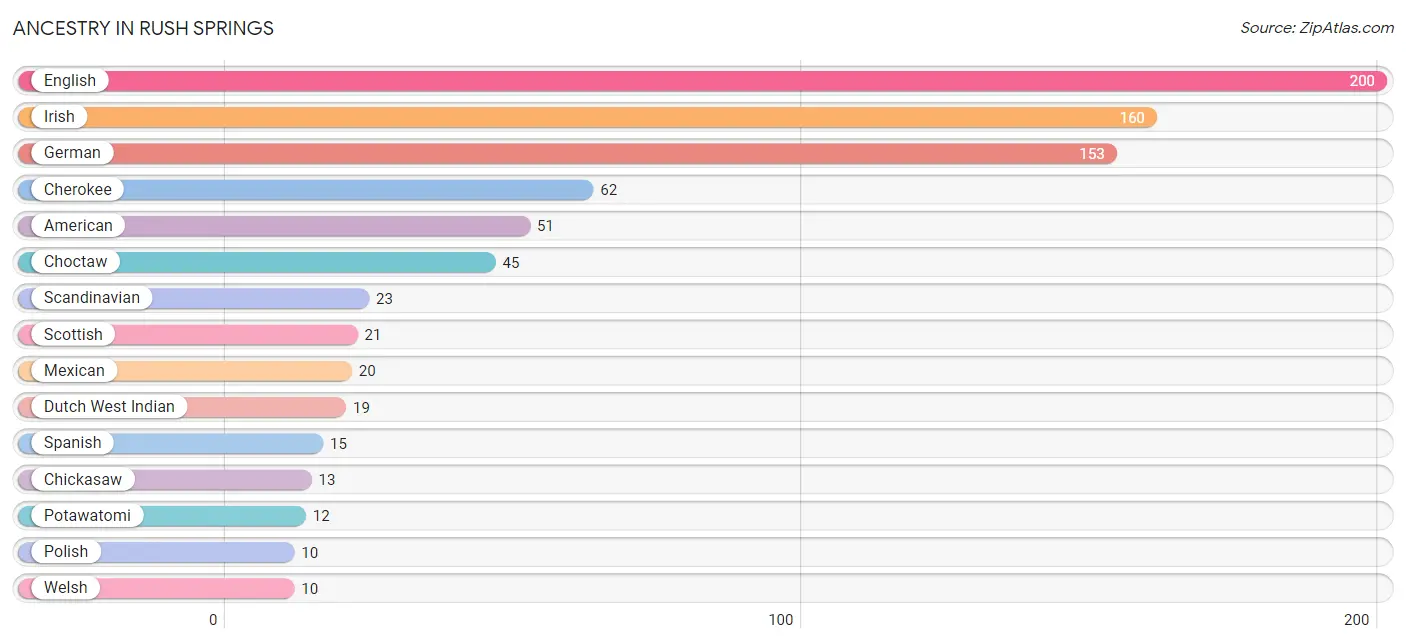
| Ancestry | # Population | % Population |
| American | 51 | 4.0% |
| British | 4 | 0.3% |
| Celtic | 4 | 0.3% |
| Cherokee | 62 | 4.9% |
| Chickasaw | 13 | 1.0% |
| Choctaw | 45 | 3.6% |
| Comanche | 5 | 0.4% |
| Danish | 9 | 0.7% |
| Dutch | 5 | 0.4% |
| Dutch West Indian | 19 | 1.5% |
| English | 200 | 15.8% |
| French | 6 | 0.5% |
| German | 153 | 12.1% |
| Greek | 4 | 0.3% |
| Irish | 160 | 12.7% |
| Italian | 4 | 0.3% |
| Mexican | 20 | 1.6% |
| Norwegian | 5 | 0.4% |
| Polish | 10 | 0.8% |
| Potawatomi | 12 | 0.9% |
| Russian | 2 | 0.2% |
| Samoan | 2 | 0.2% |
| Scandinavian | 23 | 1.8% |
| Scotch-Irish | 8 | 0.6% |
| Scottish | 21 | 1.7% |
| Spanish | 15 | 1.2% |
| Swiss | 8 | 0.6% |
| Welsh | 10 | 0.8% | View All 28 Rows |
Immigrants in Rush Springs
The most numerous immigrant groups reported in Rush Springs came from Central America (2 | 0.2%), Latin America (2 | 0.2%), and Mexico (2 | 0.2%), together accounting for 0.5% of all Rush Springs residents.
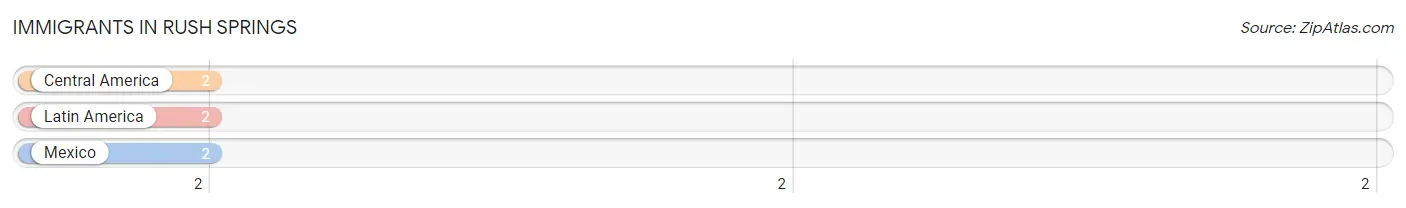
| Immigration Origin | # Population | % Population |
| Central America | 2 | 0.2% |
| Latin America | 2 | 0.2% |
| Mexico | 2 | 0.2% | View All 3 Rows |
Sex and Age in Rush Springs
Sex and Age in Rush Springs
The most populous age groups in Rush Springs are 15 to 19 Years (77 | 11.8%) for men and 25 to 29 Years (66 | 10.8%) for women.
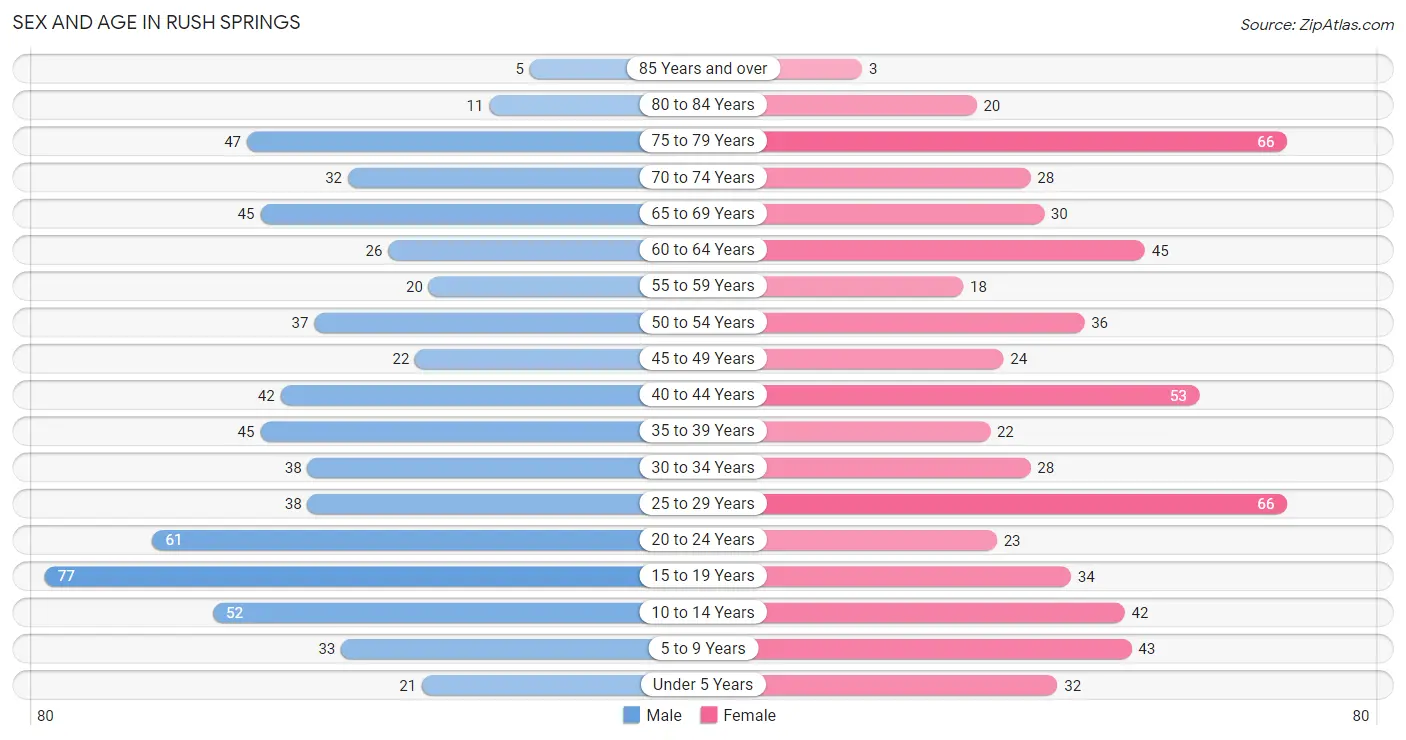
| Age Bracket | Male | Female |
| Under 5 Years | 21 (3.2%) | 32 (5.2%) |
| 5 to 9 Years | 33 (5.1%) | 43 (7.0%) |
| 10 to 14 Years | 52 (8.0%) | 42 (6.9%) |
| 15 to 19 Years | 77 (11.8%) | 34 (5.6%) |
| 20 to 24 Years | 61 (9.4%) | 23 (3.7%) |
| 25 to 29 Years | 38 (5.8%) | 66 (10.8%) |
| 30 to 34 Years | 38 (5.8%) | 28 (4.6%) |
| 35 to 39 Years | 45 (6.9%) | 22 (3.6%) |
| 40 to 44 Years | 42 (6.4%) | 53 (8.6%) |
| 45 to 49 Years | 22 (3.4%) | 24 (3.9%) |
| 50 to 54 Years | 37 (5.7%) | 36 (5.9%) |
| 55 to 59 Years | 20 (3.1%) | 18 (2.9%) |
| 60 to 64 Years | 26 (4.0%) | 45 (7.3%) |
| 65 to 69 Years | 45 (6.9%) | 30 (4.9%) |
| 70 to 74 Years | 32 (4.9%) | 28 (4.6%) |
| 75 to 79 Years | 47 (7.2%) | 66 (10.8%) |
| 80 to 84 Years | 11 (1.7%) | 20 (3.3%) |
| 85 Years and over | 5 (0.8%) | 3 (0.5%) |
| Total | 652 (100.0%) | 613 (100.0%) |
Families and Households in Rush Springs
Median Family Size in Rush Springs
The median family size in Rush Springs is 3.24 persons per family, with single female/mother families (72 | 23.4%) accounting for the largest median family size of 3.57 persons per family. On the other hand, single male/father families (37 | 12.0%) represent the smallest median family size with 3.11 persons per family.
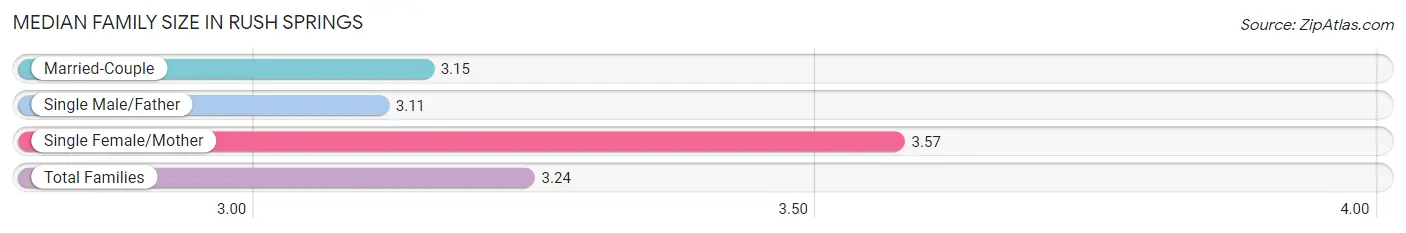
| Family Type | # Families | Family Size |
| Married-Couple | 199 (64.6%) | 3.15 |
| Single Male/Father | 37 (12.0%) | 3.11 |
| Single Female/Mother | 72 (23.4%) | 3.57 |
| Total Families | 308 (100.0%) | 3.24 |
Median Household Size in Rush Springs
The median household size in Rush Springs is 2.52 persons per household, with single male/father households (37 | 7.4%) accounting for the largest median household size of 3.97 persons per household. non-family households (194 | 38.7%) represent the smallest median household size with 1.13 persons per household.
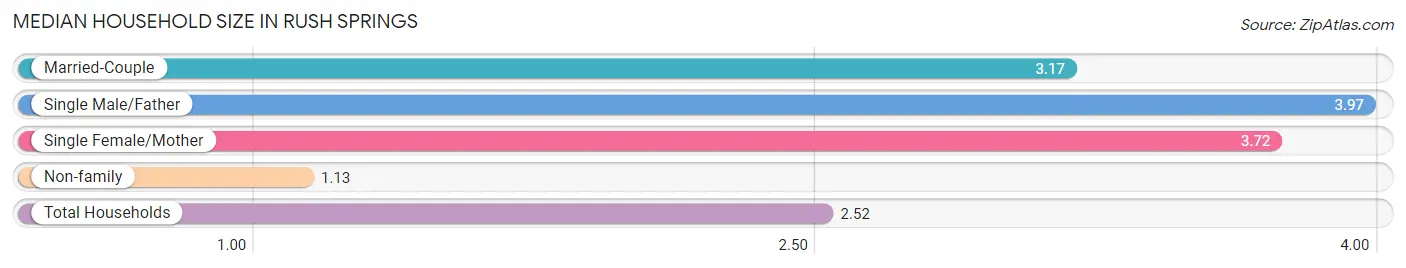
| Household Type | # Households | Household Size |
| Married-Couple | 199 (39.6%) | 3.17 |
| Single Male/Father | 37 (7.4%) | 3.97 |
| Single Female/Mother | 72 (14.3%) | 3.72 |
| Non-family | 194 (38.7%) | 1.13 |
| Total Households | 502 (100.0%) | 2.52 |
Household Size by Marriage Status in Rush Springs
Out of a total of 502 households in Rush Springs, 308 (61.4%) are family households, while 194 (38.7%) are nonfamily households. The most numerous type of family households are 2-person households, comprising 153, and the most common type of nonfamily households are 1-person households, comprising 177.
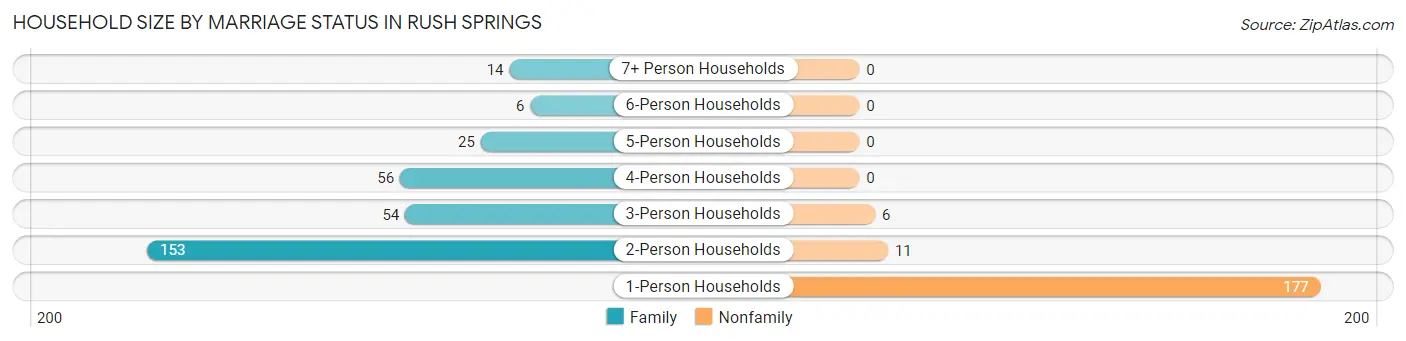
| Household Size | Family Households | Nonfamily Households |
| 1-Person Households | - | 177 (35.3%) |
| 2-Person Households | 153 (30.5%) | 11 (2.2%) |
| 3-Person Households | 54 (10.8%) | 6 (1.2%) |
| 4-Person Households | 56 (11.2%) | 0 (0.0%) |
| 5-Person Households | 25 (5.0%) | 0 (0.0%) |
| 6-Person Households | 6 (1.2%) | 0 (0.0%) |
| 7+ Person Households | 14 (2.8%) | 0 (0.0%) |
| Total | 308 (61.4%) | 194 (38.7%) |
Female Fertility in Rush Springs
Fertility by Age in Rush Springs
Average fertility rate in Rush Springs is 70.0 births per 1,000 women. Women in the age bracket of 20 to 34 years have the highest fertility rate with 162.0 births per 1,000 women. Women in the age bracket of 20 to 34 years acount for 100.0% of all women with births.
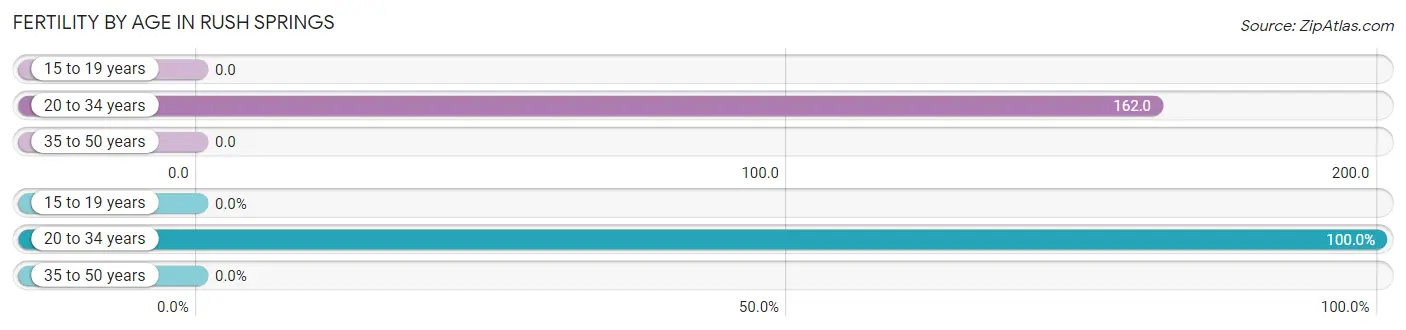
| Age Bracket | Women with Births | Births / 1,000 Women |
| 15 to 19 years | 0 (0.0%) | 0.0 |
| 20 to 34 years | 19 (100.0%) | 162.0 |
| 35 to 50 years | 0 (0.0%) | 0.0 |
| Total | 19 (100.0%) | 70.0 |
Fertility by Age by Marriage Status in Rush Springs
52.6% of women with births (19) in Rush Springs are married. The highest percentage of unmarried women with births falls into 20 to 34 years age bracket with 47.4% of them unmarried at the time of birth, while the lowest percentage of unmarried women with births belong to 20 to 34 years age bracket with 47.4% of them unmarried.
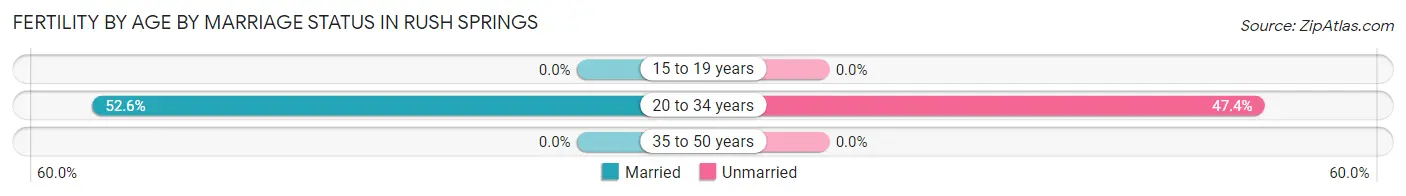
| Age Bracket | Married | Unmarried |
| 15 to 19 years | 0 (0.0%) | 0 (0.0%) |
| 20 to 34 years | 10 (52.6%) | 9 (47.4%) |
| 35 to 50 years | 0 (0.0%) | 0 (0.0%) |
| Total | 10 (52.6%) | 9 (47.4%) |
Fertility by Education in Rush Springs
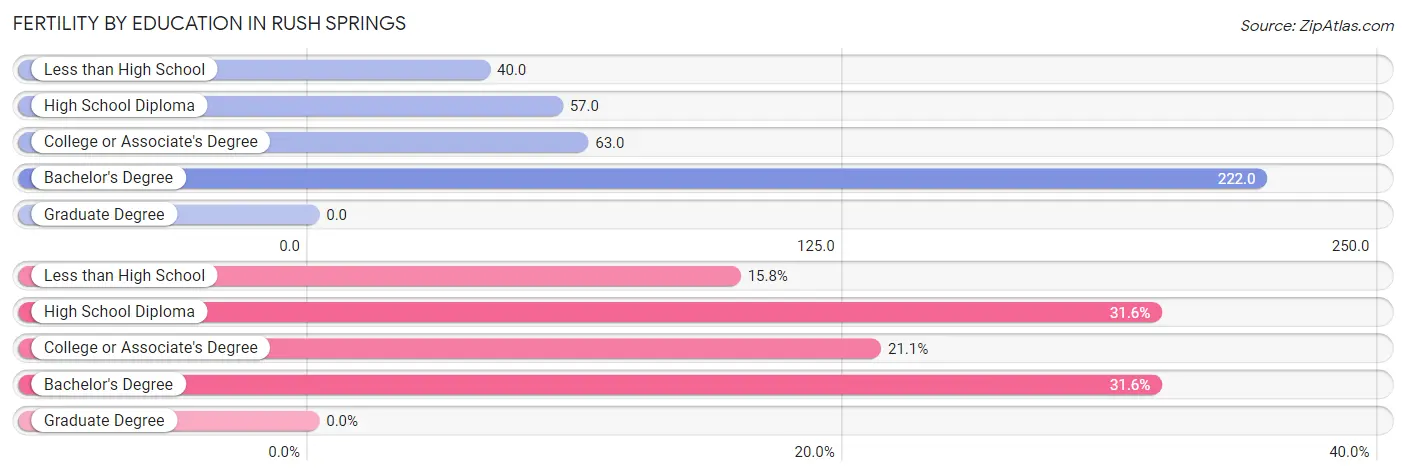
| Educational Attainment | Women with Births | Births / 1,000 Women |
| Less than High School | 3 (15.8%) | 40.0 |
| High School Diploma | 6 (31.6%) | 57.0 |
| College or Associate's Degree | 4 (21.0%) | 63.0 |
| Bachelor's Degree | 6 (31.6%) | 222.0 |
| Graduate Degree | 0 (0.0%) | 0.0 |
| Total | 19 (100.0%) | 70.0 |
Fertility by Education by Marriage Status in Rush Springs
47.4% of women with births in Rush Springs are unmarried. Women with the educational attainment of college or associate's degree are most likely to be married with 100.0% of them married at childbirth, while women with the educational attainment of less than high school are least likely to be married with 100.0% of them unmarried at childbirth.
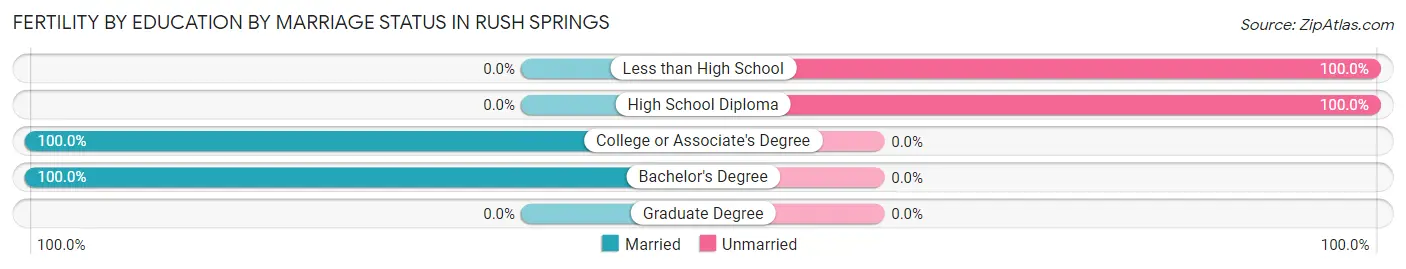
| Educational Attainment | Married | Unmarried |
| Less than High School | 0 (0.0%) | 3 (100.0%) |
| High School Diploma | 0 (0.0%) | 6 (100.0%) |
| College or Associate's Degree | 4 (100.0%) | 0 (0.0%) |
| Bachelor's Degree | 6 (100.0%) | 0 (0.0%) |
| Graduate Degree | 0 (0.0%) | 0 (0.0%) |
| Total | 10 (52.6%) | 9 (47.4%) |
Employment Characteristics in Rush Springs
Employment by Class of Employer in Rush Springs
Among the 459 employed individuals in Rush Springs, private company employees (313 | 68.2%), local government employees (42 | 9.1%), and self-employed (not incorporated) (38 | 8.3%) make up the most common classes of employment.
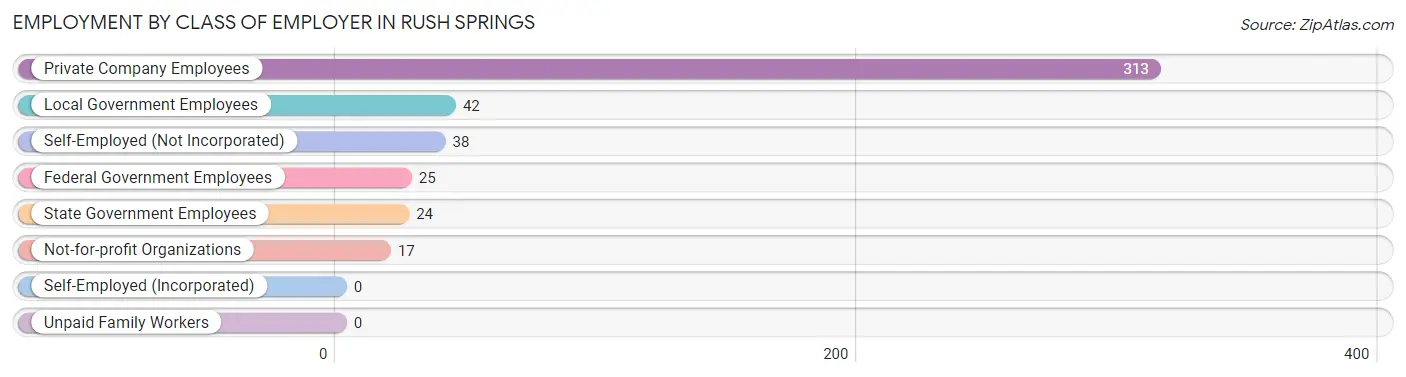
| Employer Class | # Employees | % Employees |
| Private Company Employees | 313 | 68.2% |
| Self-Employed (Incorporated) | 0 | 0.0% |
| Self-Employed (Not Incorporated) | 38 | 8.3% |
| Not-for-profit Organizations | 17 | 3.7% |
| Local Government Employees | 42 | 9.1% |
| State Government Employees | 24 | 5.2% |
| Federal Government Employees | 25 | 5.4% |
| Unpaid Family Workers | 0 | 0.0% |
| Total | 459 | 100.0% |
Employment Status by Age in Rush Springs
According to the labor force statistics for Rush Springs, out of the total population over 16 years of age (1,013), 49.8% or 504 individuals are in the labor force, with 6.7% or 34 of them unemployed. The age group with the highest labor force participation rate is 25 to 29 years, with 94.2% or 98 individuals in the labor force. Within the labor force, the 16 to 19 years age range has the highest percentage of unemployed individuals, with 75.0% or 6 of them being unemployed.
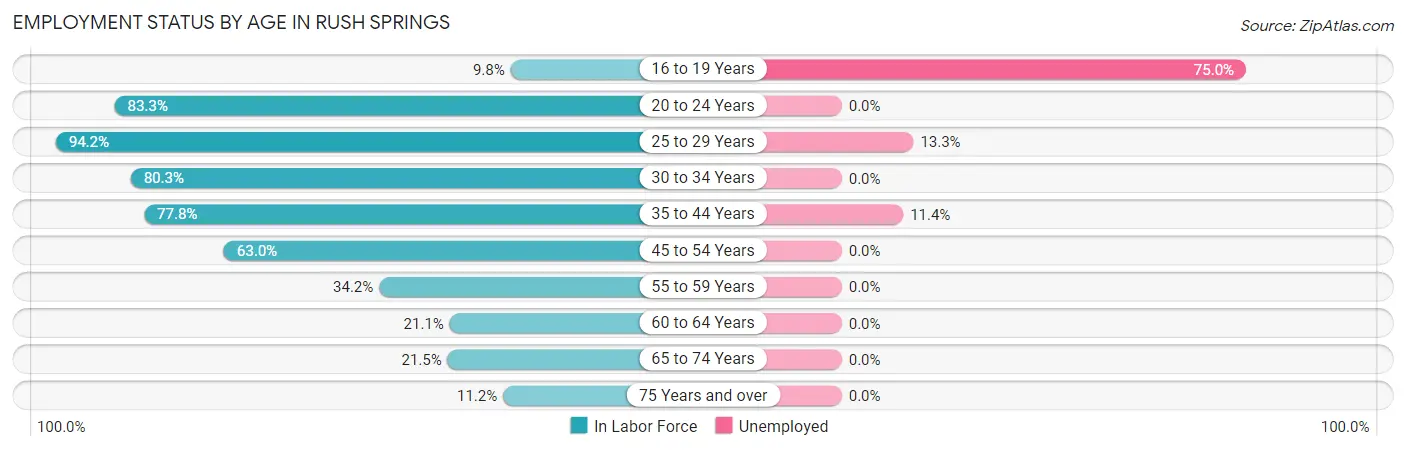
| Age Bracket | In Labor Force | Unemployed |
| 16 to 19 Years | 8 (9.8%) | 6 (75.0%) |
| 20 to 24 Years | 70 (83.3%) | 0 (0.0%) |
| 25 to 29 Years | 98 (94.2%) | 13 (13.3%) |
| 30 to 34 Years | 53 (80.3%) | 0 (0.0%) |
| 35 to 44 Years | 126 (77.8%) | 14 (11.4%) |
| 45 to 54 Years | 75 (63.0%) | 0 (0.0%) |
| 55 to 59 Years | 13 (34.2%) | 0 (0.0%) |
| 60 to 64 Years | 15 (21.1%) | 0 (0.0%) |
| 65 to 74 Years | 29 (21.5%) | 0 (0.0%) |
| 75 Years and over | 17 (11.2%) | 0 (0.0%) |
| Total | 504 (49.8%) | 34 (6.7%) |
Employment Status by Educational Attainment in Rush Springs
According to labor force statistics for Rush Springs, 67.9% of individuals (380) out of the total population between 25 and 64 years of age (560) are in the labor force, with 7.2% or 27 of them being unemployed. The group with the highest labor force participation rate are those with the educational attainment of bachelor's degree or higher, with 92.6% or 50 individuals in the labor force. Within the labor force, individuals with less than high school education have the highest percentage of unemployment, with 11.9% or 5 of them being unemployed.
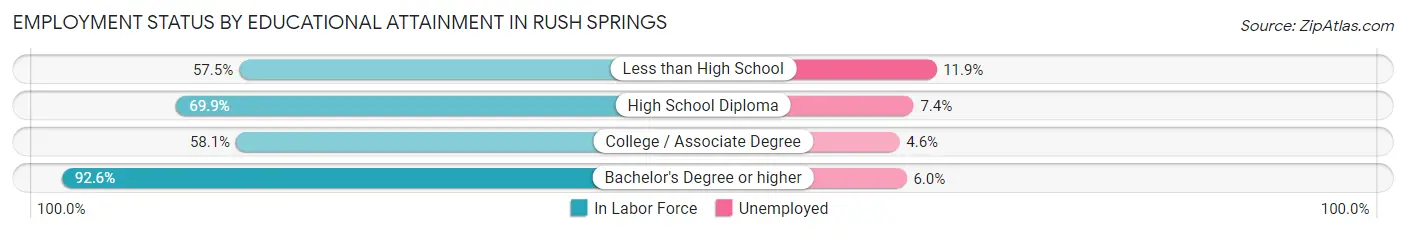
| Educational Attainment | In Labor Force | Unemployed |
| Less than High School | 42 (57.5%) | 9 (11.9%) |
| High School Diploma | 216 (69.9%) | 23 (7.4%) |
| College / Associate Degree | 72 (58.1%) | 6 (4.6%) |
| Bachelor's Degree or higher | 50 (92.6%) | 3 (6.0%) |
| Total | 380 (67.9%) | 40 (7.2%) |
Employment Occupations by Sex in Rush Springs
Management, Business, Science and Arts Occupations
The most common Management, Business, Science and Arts occupations in Rush Springs are Management (67 | 14.6%), Community & Social Service (46 | 10.0%), Education Instruction & Library (40 | 8.7%), Health Diagnosing & Treating (6 | 1.3%), and Health Technologists (6 | 1.3%).
Management, Business, Science and Arts Occupations by Sex
Within the Management, Business, Science and Arts occupations in Rush Springs, the most male-oriented occupations are Education, Arts & Media (100.0%), Management (79.1%), and Community & Social Service (23.9%), while the most female-oriented occupations are Legal Services & Support (100.0%), Health Diagnosing & Treating (100.0%), and Health Technologists (100.0%).
| Occupation | Male | Female |
| Management | 53 (79.1%) | 14 (20.9%) |
| Business & Financial | 0 (0.0%) | 0 (0.0%) |
| Computers, Engineering & Science | 0 (0.0%) | 0 (0.0%) |
| Computers & Mathematics | 0 (0.0%) | 0 (0.0%) |
| Architecture & Engineering | 0 (0.0%) | 0 (0.0%) |
| Life, Physical & Social Science | 0 (0.0%) | 0 (0.0%) |
| Community & Social Service | 11 (23.9%) | 35 (76.1%) |
| Education, Arts & Media | 3 (100.0%) | 0 (0.0%) |
| Legal Services & Support | 0 (0.0%) | 3 (100.0%) |
| Education Instruction & Library | 8 (20.0%) | 32 (80.0%) |
| Arts, Media & Entertainment | 0 (0.0%) | 0 (0.0%) |
| Health Diagnosing & Treating | 0 (0.0%) | 6 (100.0%) |
| Health Technologists | 0 (0.0%) | 6 (100.0%) |
| Total (Category) | 64 (53.8%) | 55 (46.2%) |
| Total (Overall) | 270 (59.0%) | 188 (41.0%) |
Services Occupations
The most common Services occupations in Rush Springs are Food Preparation & Serving (29 | 6.3%), Cleaning & Maintenance (21 | 4.6%), Healthcare Support (16 | 3.5%), and Personal Care & Service (4 | 0.9%).
Services Occupations by Sex
Within the Services occupations in Rush Springs, the most male-oriented occupations are Cleaning & Maintenance (71.4%), Food Preparation & Serving (34.5%), and Healthcare Support (31.2%), while the most female-oriented occupations are Personal Care & Service (100.0%), Healthcare Support (68.8%), and Food Preparation & Serving (65.5%).
| Occupation | Male | Female |
| Healthcare Support | 5 (31.2%) | 11 (68.8%) |
| Security & Protection | 0 (0.0%) | 0 (0.0%) |
| Firefighting & Prevention | 0 (0.0%) | 0 (0.0%) |
| Law Enforcement | 0 (0.0%) | 0 (0.0%) |
| Food Preparation & Serving | 10 (34.5%) | 19 (65.5%) |
| Cleaning & Maintenance | 15 (71.4%) | 6 (28.6%) |
| Personal Care & Service | 0 (0.0%) | 4 (100.0%) |
| Total (Category) | 30 (42.9%) | 40 (57.1%) |
| Total (Overall) | 270 (59.0%) | 188 (41.0%) |
Sales and Office Occupations
The most common Sales and Office occupations in Rush Springs are Sales & Related (60 | 13.1%), and Office & Administration (36 | 7.9%).
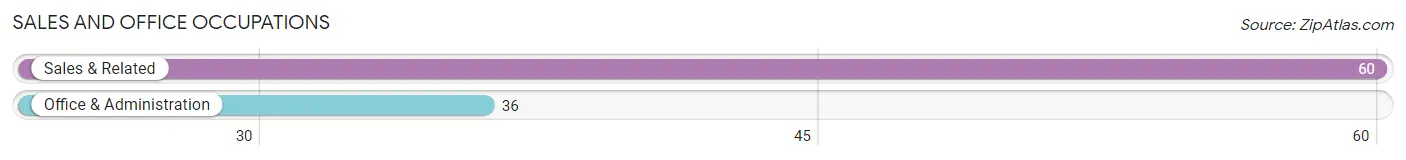
Sales and Office Occupations by Sex
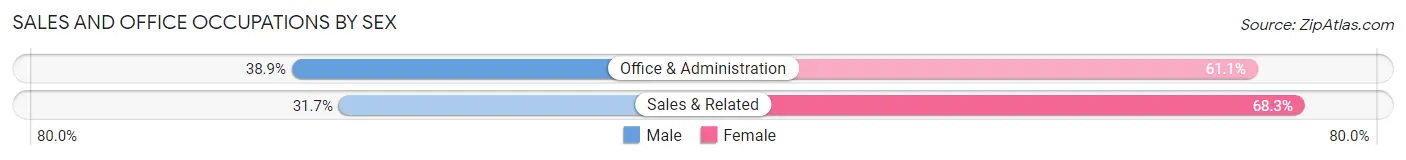
| Occupation | Male | Female |
| Sales & Related | 19 (31.7%) | 41 (68.3%) |
| Office & Administration | 14 (38.9%) | 22 (61.1%) |
| Total (Category) | 33 (34.4%) | 63 (65.6%) |
| Total (Overall) | 270 (59.0%) | 188 (41.0%) |
Natural Resources, Construction and Maintenance Occupations
The most common Natural Resources, Construction and Maintenance occupations in Rush Springs are Construction & Extraction (34 | 7.4%), Installation, Maintenance & Repair (20 | 4.4%), and Farming, Fishing & Forestry (4 | 0.9%).
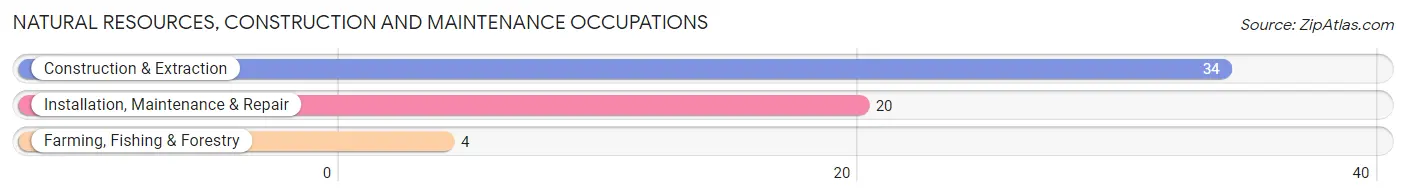
Natural Resources, Construction and Maintenance Occupations by Sex
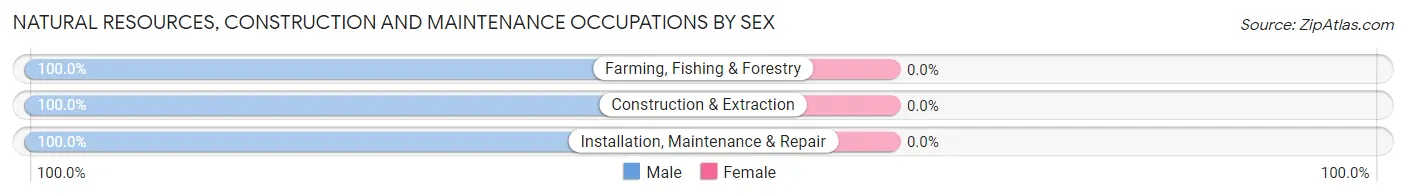
| Occupation | Male | Female |
| Farming, Fishing & Forestry | 4 (100.0%) | 0 (0.0%) |
| Construction & Extraction | 34 (100.0%) | 0 (0.0%) |
| Installation, Maintenance & Repair | 20 (100.0%) | 0 (0.0%) |
| Total (Category) | 58 (100.0%) | 0 (0.0%) |
| Total (Overall) | 270 (59.0%) | 188 (41.0%) |
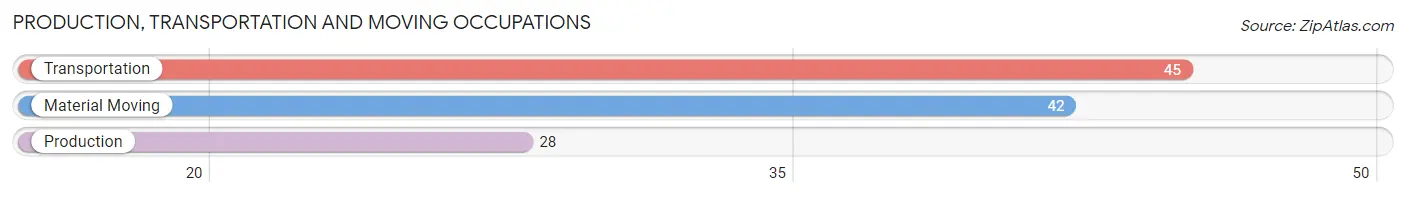
Production, Transportation and Moving Occupations
The most common Production, Transportation and Moving occupations in Rush Springs are Transportation (45 | 9.8%), Material Moving (42 | 9.2%), and Production (28 | 6.1%).
Production, Transportation and Moving Occupations by Sex
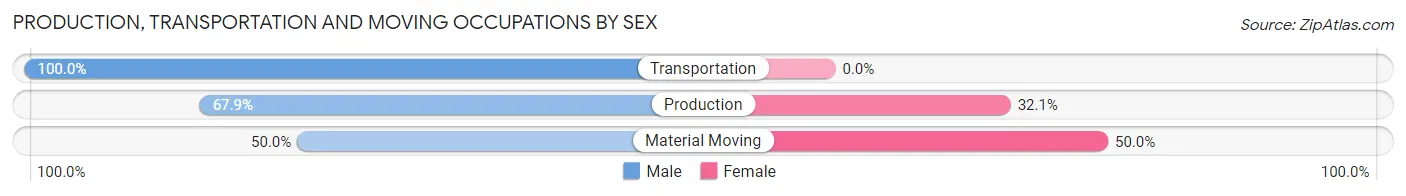
| Occupation | Male | Female |
| Production | 19 (67.9%) | 9 (32.1%) |
| Transportation | 45 (100.0%) | 0 (0.0%) |
| Material Moving | 21 (50.0%) | 21 (50.0%) |
| Total (Category) | 85 (73.9%) | 30 (26.1%) |
| Total (Overall) | 270 (59.0%) | 188 (41.0%) |
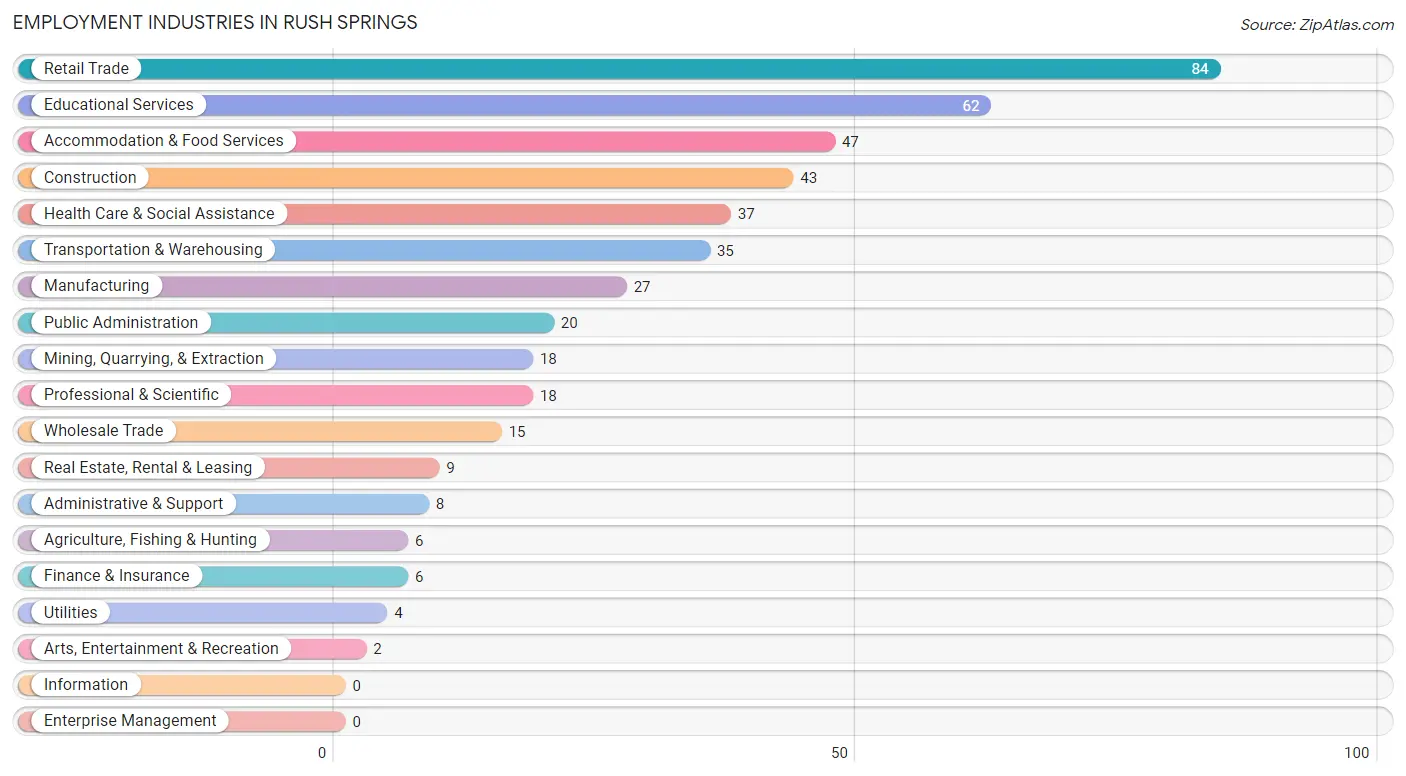
Employment Industries by Sex in Rush Springs
Employment Industries in Rush Springs
The major employment industries in Rush Springs include Retail Trade (84 | 18.3%), Educational Services (62 | 13.5%), Accommodation & Food Services (47 | 10.3%), Construction (43 | 9.4%), and Health Care & Social Assistance (37 | 8.1%).
Employment Industries by Sex in Rush Springs
The Rush Springs industries that see more men than women are Mining, Quarrying, & Extraction (100.0%), Construction (100.0%), and Utilities (100.0%), whereas the industries that tend to have a higher number of women are Arts, Entertainment & Recreation (100.0%), Health Care & Social Assistance (86.5%), and Professional & Scientific (72.2%).
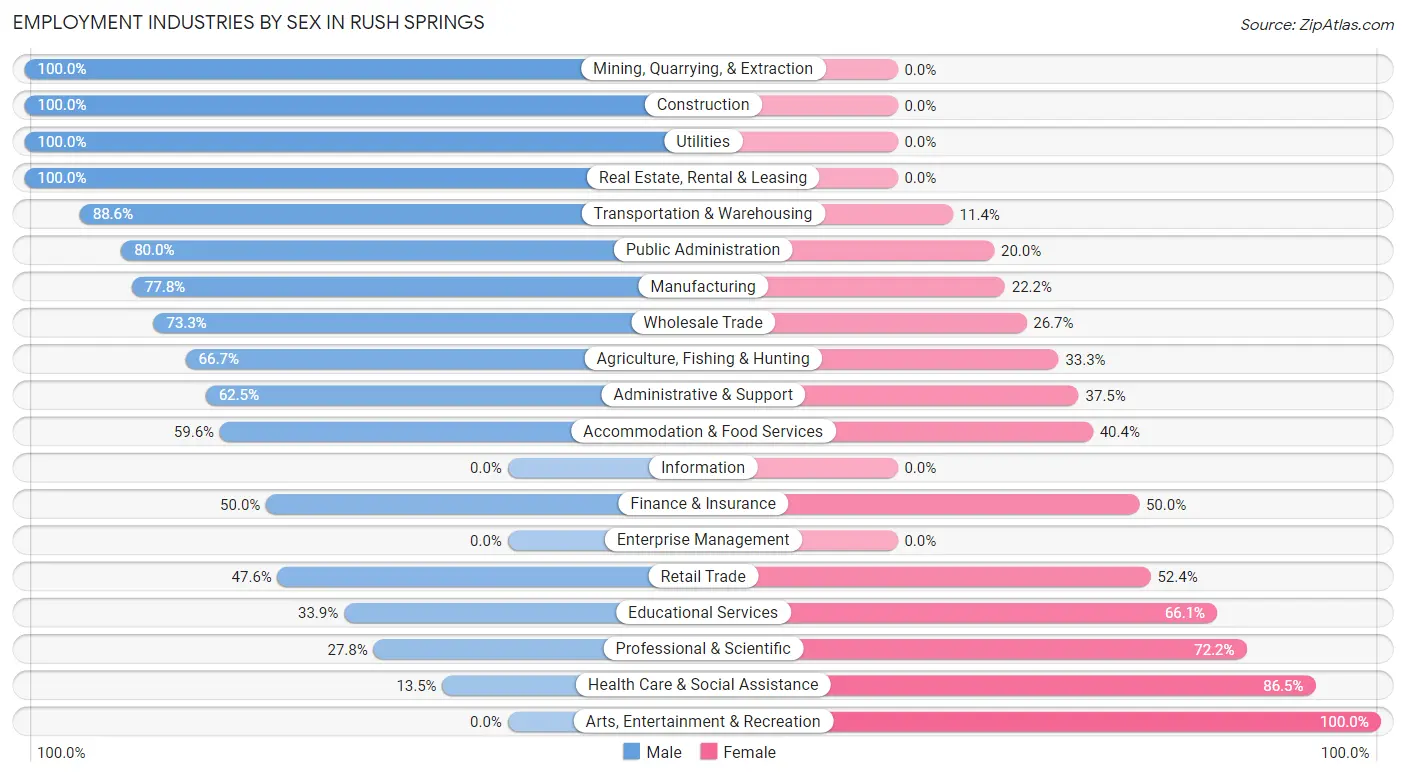
| Industry | Male | Female |
| Agriculture, Fishing & Hunting | 4 (66.7%) | 2 (33.3%) |
| Mining, Quarrying, & Extraction | 18 (100.0%) | 0 (0.0%) |
| Construction | 43 (100.0%) | 0 (0.0%) |
| Manufacturing | 21 (77.8%) | 6 (22.2%) |
| Wholesale Trade | 11 (73.3%) | 4 (26.7%) |
| Retail Trade | 40 (47.6%) | 44 (52.4%) |
| Transportation & Warehousing | 31 (88.6%) | 4 (11.4%) |
| Utilities | 4 (100.0%) | 0 (0.0%) |
| Information | 0 (0.0%) | 0 (0.0%) |
| Finance & Insurance | 3 (50.0%) | 3 (50.0%) |
| Real Estate, Rental & Leasing | 9 (100.0%) | 0 (0.0%) |
| Professional & Scientific | 5 (27.8%) | 13 (72.2%) |
| Enterprise Management | 0 (0.0%) | 0 (0.0%) |
| Administrative & Support | 5 (62.5%) | 3 (37.5%) |
| Educational Services | 21 (33.9%) | 41 (66.1%) |
| Health Care & Social Assistance | 5 (13.5%) | 32 (86.5%) |
| Arts, Entertainment & Recreation | 0 (0.0%) | 2 (100.0%) |
| Accommodation & Food Services | 28 (59.6%) | 19 (40.4%) |
| Public Administration | 16 (80.0%) | 4 (20.0%) |
| Total | 270 (59.0%) | 188 (41.0%) |
Education in Rush Springs
School Enrollment in Rush Springs
The most common levels of schooling among the 328 students in Rush Springs are middle school (105 | 32.0%), high school (81 | 24.7%), and elementary school (61 | 18.6%).
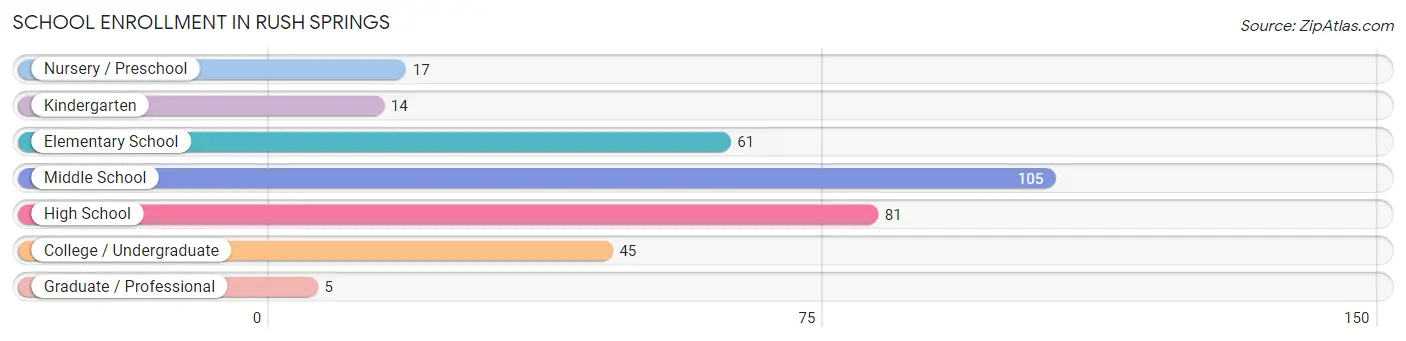
| School Level | # Students | % Students |
| Nursery / Preschool | 17 | 5.2% |
| Kindergarten | 14 | 4.3% |
| Elementary School | 61 | 18.6% |
| Middle School | 105 | 32.0% |
| High School | 81 | 24.7% |
| College / Undergraduate | 45 | 13.7% |
| Graduate / Professional | 5 | 1.5% |
| Total | 328 | 100.0% |
School Enrollment by Age by Funding Source in Rush Springs
Out of a total of 328 students who are enrolled in schools in Rush Springs, 15 (4.6%) attend a private institution, while the remaining 313 (95.4%) are enrolled in public schools. The age group of 15 to 17 year olds has the highest likelihood of being enrolled in private schools, with 12 (13.6% in the age bracket) enrolled. Conversely, the age group of 3 to 4 year olds has the lowest likelihood of being enrolled in a private school, with 13 (100.0% in the age bracket) attending a public institution.
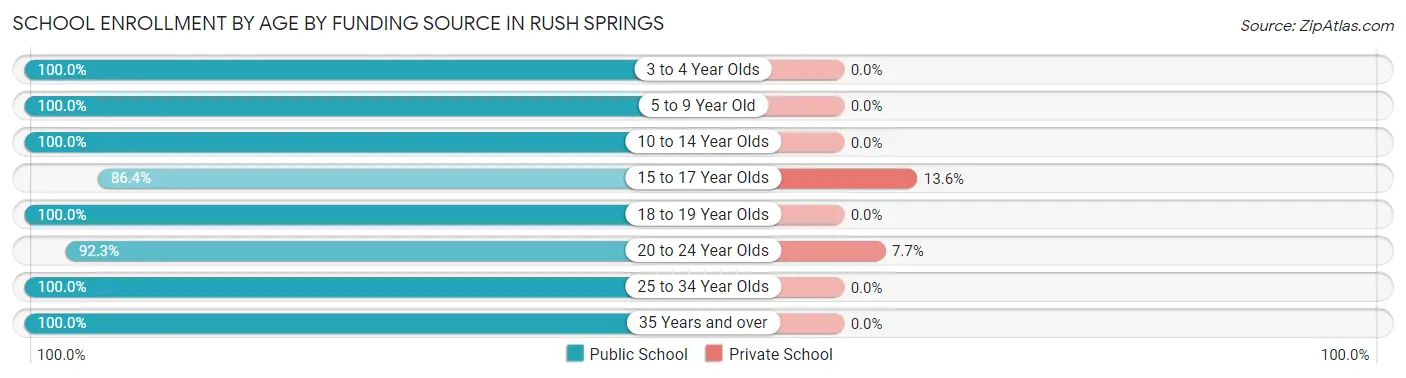
| Age Bracket | Public School | Private School |
| 3 to 4 Year Olds | 13 (100.0%) | 0 (0.0%) |
| 5 to 9 Year Old | 74 (100.0%) | 0 (0.0%) |
| 10 to 14 Year Olds | 94 (100.0%) | 0 (0.0%) |
| 15 to 17 Year Olds | 76 (86.4%) | 12 (13.6%) |
| 18 to 19 Year Olds | 6 (100.0%) | 0 (0.0%) |
| 20 to 24 Year Olds | 36 (92.3%) | 3 (7.7%) |
| 25 to 34 Year Olds | 3 (100.0%) | 0 (0.0%) |
| 35 Years and over | 11 (100.0%) | 0 (0.0%) |
| Total | 313 (95.4%) | 15 (4.6%) |
Educational Attainment by Field of Study in Rush Springs
Business (45 | 38.1%), education (21 | 17.8%), liberal arts & history (9 | 7.6%), social sciences (8 | 6.8%), and communications (7 | 5.9%) are the most common fields of study among 118 individuals in Rush Springs who have obtained a bachelor's degree or higher.
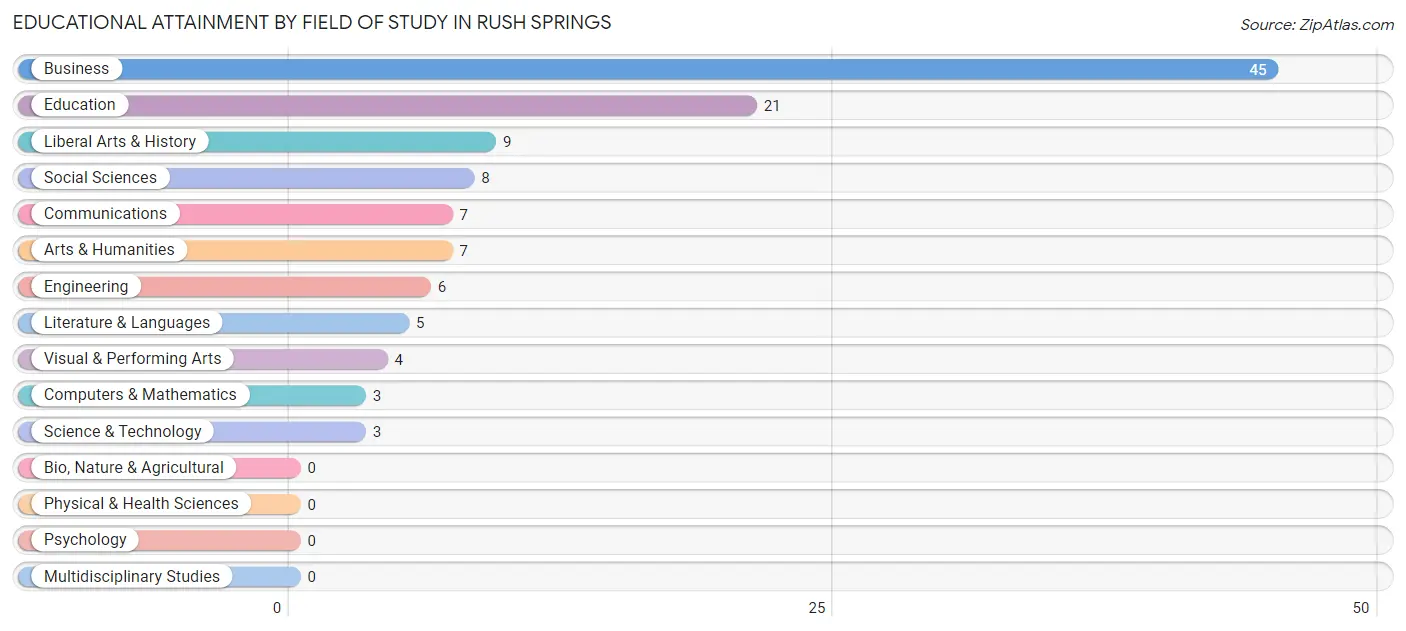
| Field of Study | # Graduates | % Graduates |
| Computers & Mathematics | 3 | 2.5% |
| Bio, Nature & Agricultural | 0 | 0.0% |
| Physical & Health Sciences | 0 | 0.0% |
| Psychology | 0 | 0.0% |
| Social Sciences | 8 | 6.8% |
| Engineering | 6 | 5.1% |
| Multidisciplinary Studies | 0 | 0.0% |
| Science & Technology | 3 | 2.5% |
| Business | 45 | 38.1% |
| Education | 21 | 17.8% |
| Literature & Languages | 5 | 4.2% |
| Liberal Arts & History | 9 | 7.6% |
| Visual & Performing Arts | 4 | 3.4% |
| Communications | 7 | 5.9% |
| Arts & Humanities | 7 | 5.9% |
| Total | 118 | 100.0% |
Transportation & Commute in Rush Springs
Vehicle Availability by Sex in Rush Springs
The most prevalent vehicle ownership categories in Rush Springs are males with 2 vehicles (107, accounting for 38.5%) and females with 2 vehicles (74, making up 59.1%).
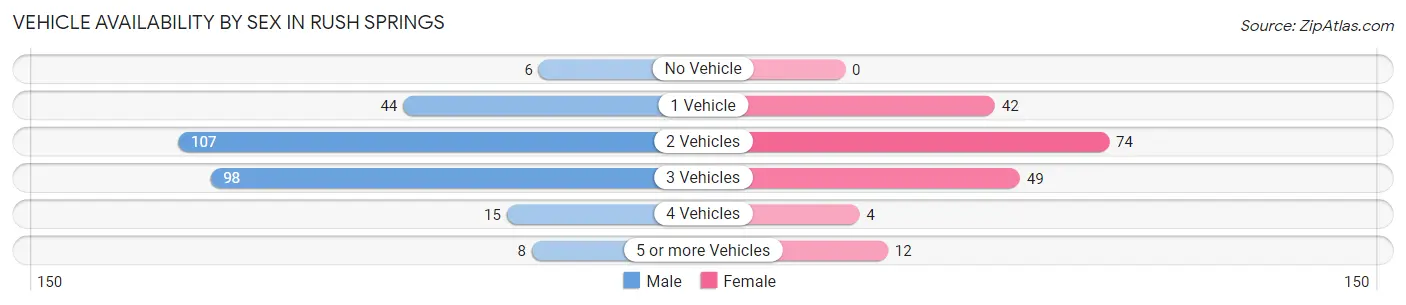
| Vehicles Available | Male | Female |
| No Vehicle | 6 (2.2%) | 0 (0.0%) |
| 1 Vehicle | 44 (15.8%) | 42 (23.2%) |
| 2 Vehicles | 107 (38.5%) | 74 (40.9%) |
| 3 Vehicles | 98 (35.2%) | 49 (27.1%) |
| 4 Vehicles | 15 (5.4%) | 4 (2.2%) |
| 5 or more Vehicles | 8 (2.9%) | 12 (6.6%) |
| Total | 278 (100.0%) | 181 (100.0%) |
Commute Time in Rush Springs
The most frequently occuring commute durations in Rush Springs are 30 to 34 minutes (103 commuters, 23.3%), 5 to 9 minutes (102 commuters, 23.0%), and 20 to 24 minutes (78 commuters, 17.6%).
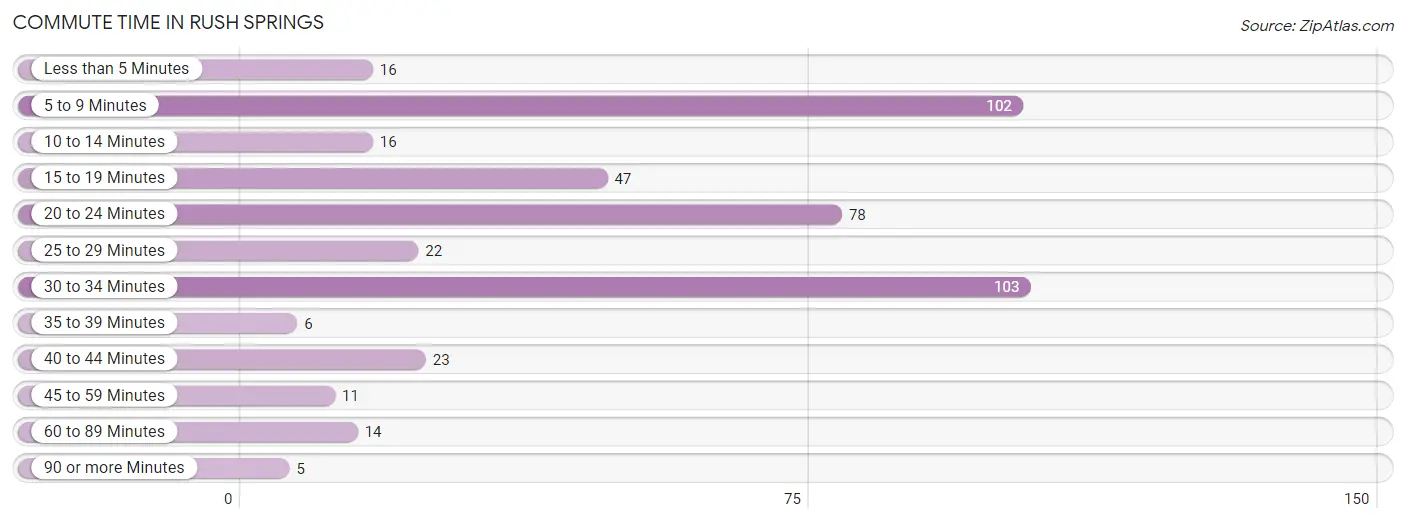
| Commute Time | # Commuters | % Commuters |
| Less than 5 Minutes | 16 | 3.6% |
| 5 to 9 Minutes | 102 | 23.0% |
| 10 to 14 Minutes | 16 | 3.6% |
| 15 to 19 Minutes | 47 | 10.6% |
| 20 to 24 Minutes | 78 | 17.6% |
| 25 to 29 Minutes | 22 | 5.0% |
| 30 to 34 Minutes | 103 | 23.3% |
| 35 to 39 Minutes | 6 | 1.3% |
| 40 to 44 Minutes | 23 | 5.2% |
| 45 to 59 Minutes | 11 | 2.5% |
| 60 to 89 Minutes | 14 | 3.2% |
| 90 or more Minutes | 5 | 1.1% |
Commute Time by Sex in Rush Springs
The most common commute times in Rush Springs are 30 to 34 minutes (60 commuters, 21.8%) for males and 5 to 9 minutes (47 commuters, 28.0%) for females.
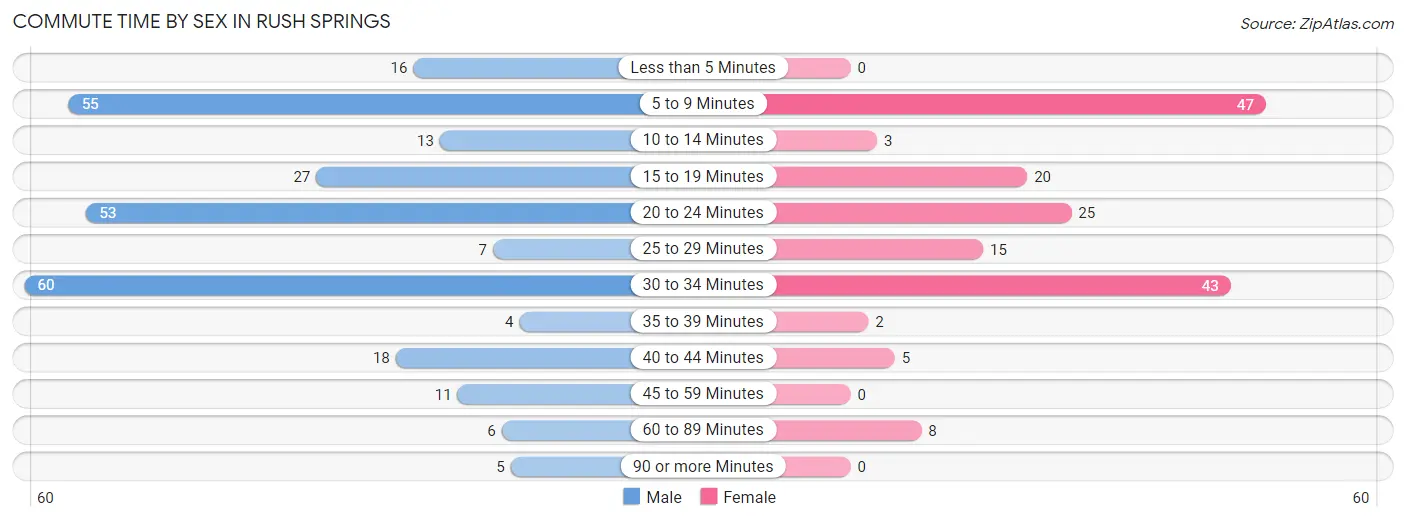
| Commute Time | Male | Female |
| Less than 5 Minutes | 16 (5.8%) | 0 (0.0%) |
| 5 to 9 Minutes | 55 (20.0%) | 47 (28.0%) |
| 10 to 14 Minutes | 13 (4.7%) | 3 (1.8%) |
| 15 to 19 Minutes | 27 (9.8%) | 20 (11.9%) |
| 20 to 24 Minutes | 53 (19.3%) | 25 (14.9%) |
| 25 to 29 Minutes | 7 (2.5%) | 15 (8.9%) |
| 30 to 34 Minutes | 60 (21.8%) | 43 (25.6%) |
| 35 to 39 Minutes | 4 (1.5%) | 2 (1.2%) |
| 40 to 44 Minutes | 18 (6.6%) | 5 (3.0%) |
| 45 to 59 Minutes | 11 (4.0%) | 0 (0.0%) |
| 60 to 89 Minutes | 6 (2.2%) | 8 (4.8%) |
| 90 or more Minutes | 5 (1.8%) | 0 (0.0%) |
Time of Departure to Work by Sex in Rush Springs
The most frequent times of departure to work in Rush Springs are 7:00 AM to 7:29 AM (112, 40.7%) for males and 7:00 AM to 7:29 AM (39, 23.2%) for females.
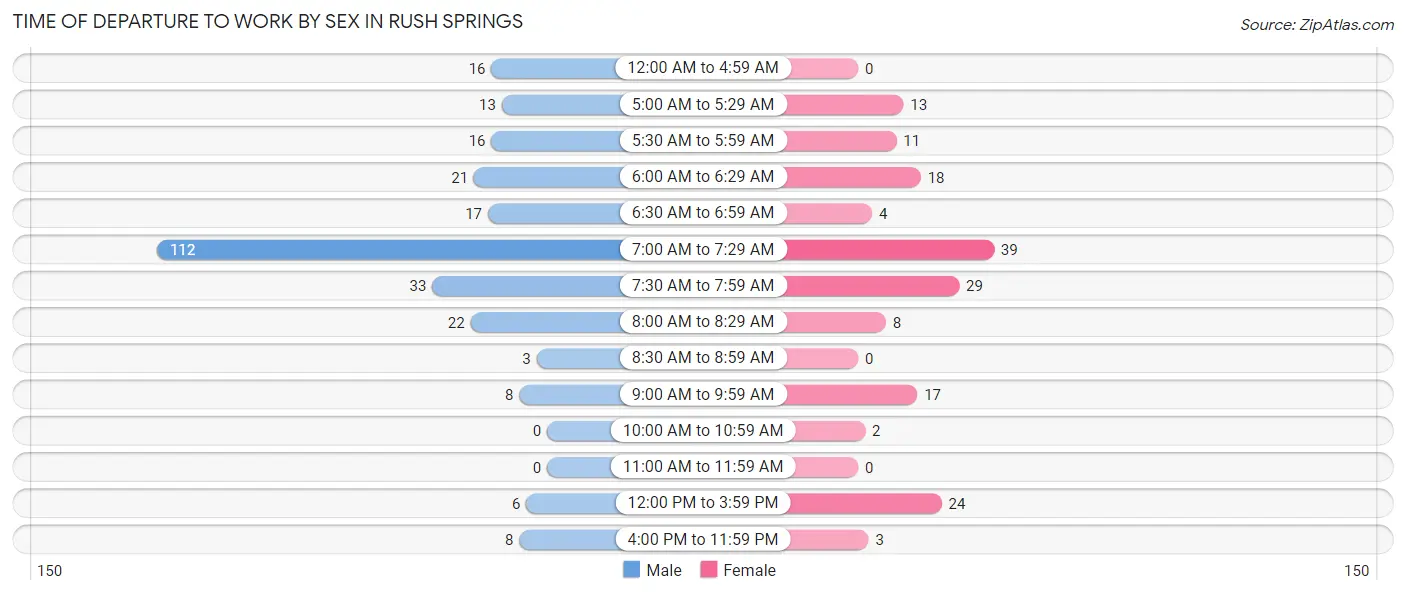
| Time of Departure | Male | Female |
| 12:00 AM to 4:59 AM | 16 (5.8%) | 0 (0.0%) |
| 5:00 AM to 5:29 AM | 13 (4.7%) | 13 (7.7%) |
| 5:30 AM to 5:59 AM | 16 (5.8%) | 11 (6.6%) |
| 6:00 AM to 6:29 AM | 21 (7.6%) | 18 (10.7%) |
| 6:30 AM to 6:59 AM | 17 (6.2%) | 4 (2.4%) |
| 7:00 AM to 7:29 AM | 112 (40.7%) | 39 (23.2%) |
| 7:30 AM to 7:59 AM | 33 (12.0%) | 29 (17.3%) |
| 8:00 AM to 8:29 AM | 22 (8.0%) | 8 (4.8%) |
| 8:30 AM to 8:59 AM | 3 (1.1%) | 0 (0.0%) |
| 9:00 AM to 9:59 AM | 8 (2.9%) | 17 (10.1%) |
| 10:00 AM to 10:59 AM | 0 (0.0%) | 2 (1.2%) |
| 11:00 AM to 11:59 AM | 0 (0.0%) | 0 (0.0%) |
| 12:00 PM to 3:59 PM | 6 (2.2%) | 24 (14.3%) |
| 4:00 PM to 11:59 PM | 8 (2.9%) | 3 (1.8%) |
| Total | 275 (100.0%) | 168 (100.0%) |
Housing Occupancy in Rush Springs
Occupancy by Ownership in Rush Springs
Of the total 502 dwellings in Rush Springs, owner-occupied units account for 317 (63.1%), while renter-occupied units make up 185 (36.8%).
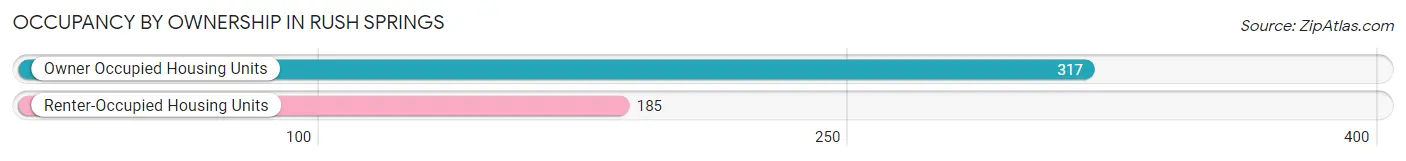
| Occupancy | # Housing Units | % Housing Units |
| Owner Occupied Housing Units | 317 | 63.1% |
| Renter-Occupied Housing Units | 185 | 36.8% |
| Total Occupied Housing Units | 502 | 100.0% |
Occupancy by Household Size in Rush Springs
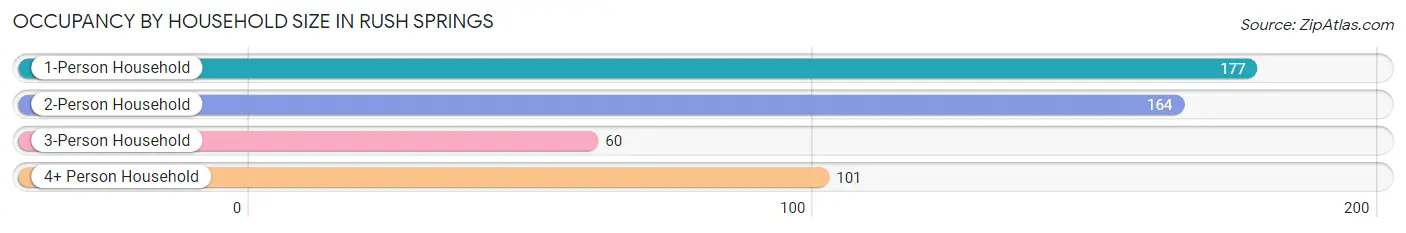
| Household Size | # Housing Units | % Housing Units |
| 1-Person Household | 177 | 35.3% |
| 2-Person Household | 164 | 32.7% |
| 3-Person Household | 60 | 11.9% |
| 4+ Person Household | 101 | 20.1% |
| Total Housing Units | 502 | 100.0% |
Occupancy by Ownership by Household Size in Rush Springs
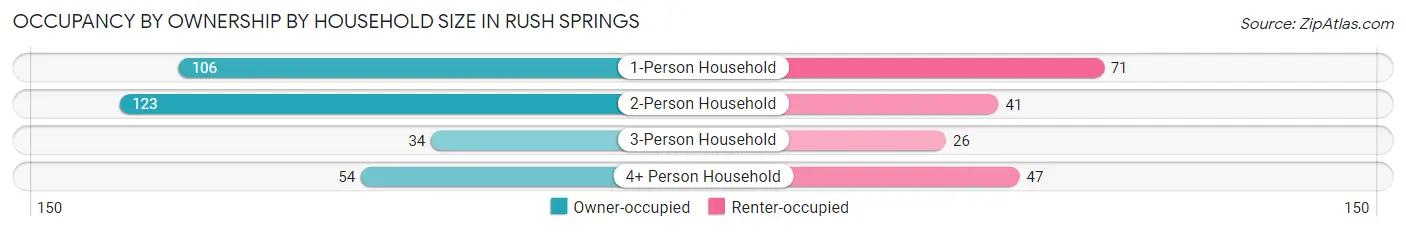
| Household Size | Owner-occupied | Renter-occupied |
| 1-Person Household | 106 (59.9%) | 71 (40.1%) |
| 2-Person Household | 123 (75.0%) | 41 (25.0%) |
| 3-Person Household | 34 (56.7%) | 26 (43.3%) |
| 4+ Person Household | 54 (53.5%) | 47 (46.5%) |
| Total Housing Units | 317 (63.1%) | 185 (36.8%) |
Occupancy by Educational Attainment in Rush Springs
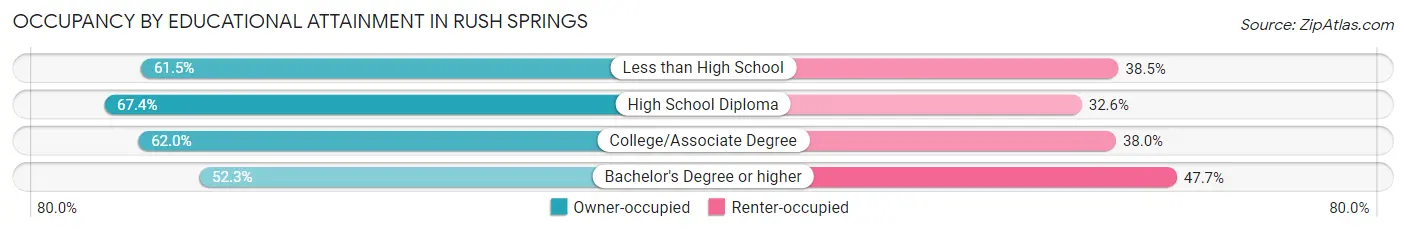
| Household Size | Owner-occupied | Renter-occupied |
| Less than High School | 40 (61.5%) | 25 (38.5%) |
| High School Diploma | 155 (67.4%) | 75 (32.6%) |
| College/Associate Degree | 88 (62.0%) | 54 (38.0%) |
| Bachelor's Degree or higher | 34 (52.3%) | 31 (47.7%) |
Occupancy by Age of Householder in Rush Springs
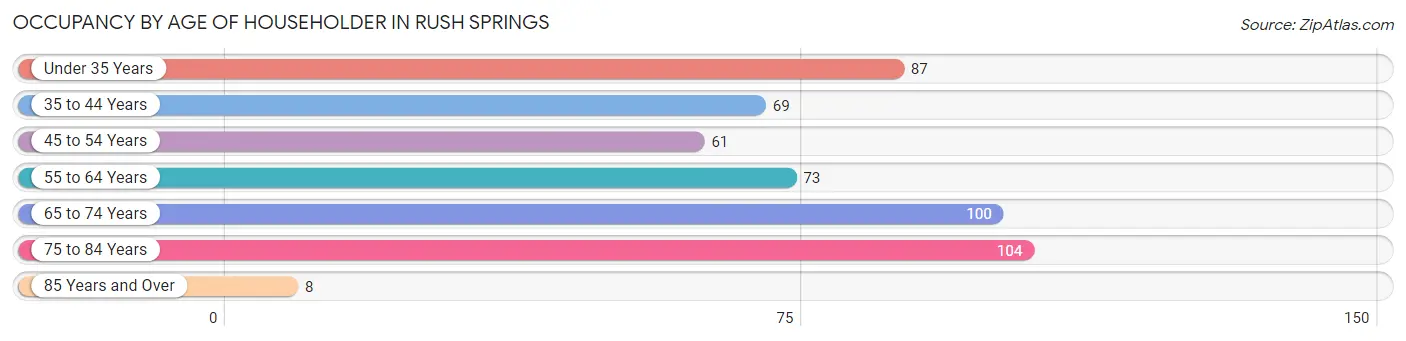
| Age Bracket | # Households | % Households |
| Under 35 Years | 87 | 17.3% |
| 35 to 44 Years | 69 | 13.8% |
| 45 to 54 Years | 61 | 12.1% |
| 55 to 64 Years | 73 | 14.5% |
| 65 to 74 Years | 100 | 19.9% |
| 75 to 84 Years | 104 | 20.7% |
| 85 Years and Over | 8 | 1.6% |
| Total | 502 | 100.0% |
Housing Finances in Rush Springs
Median Income by Occupancy in Rush Springs
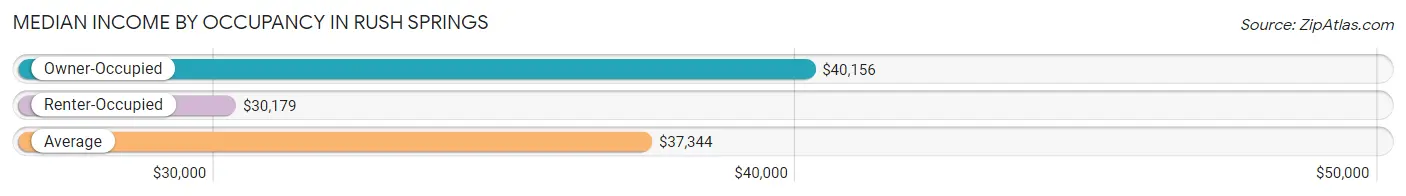
| Occupancy Type | # Households | Median Income |
| Owner-Occupied | 317 (63.1%) | $40,156 |
| Renter-Occupied | 185 (36.8%) | $30,179 |
| Average | 502 (100.0%) | $37,344 |
Occupancy by Householder Income Bracket in Rush Springs
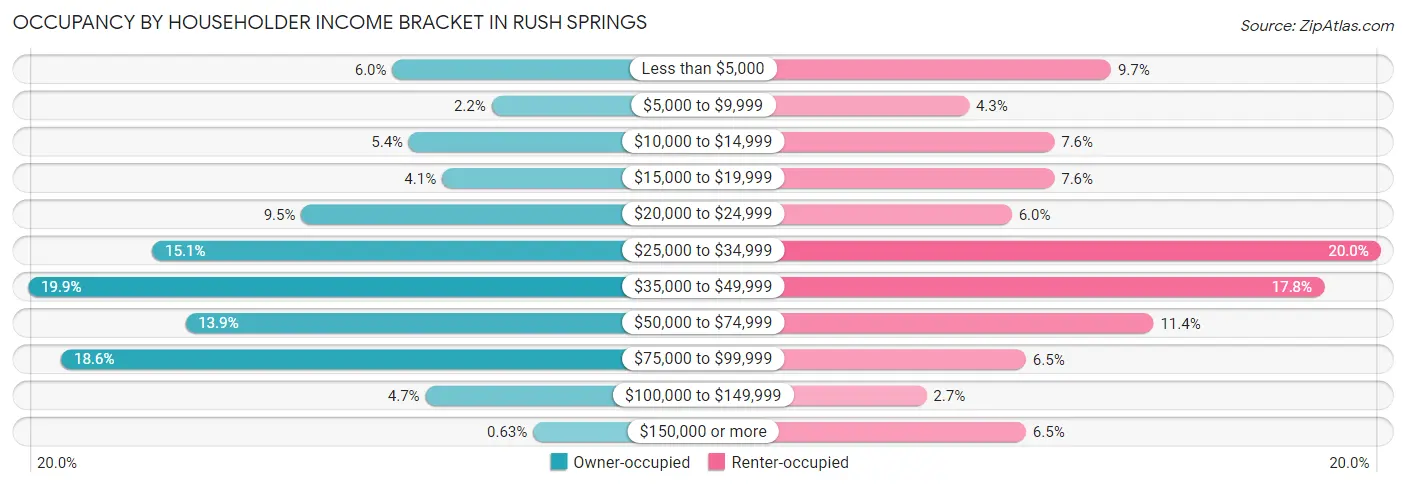
| Income Bracket | Owner-occupied | Renter-occupied |
| Less than $5,000 | 19 (6.0%) | 18 (9.7%) |
| $5,000 to $9,999 | 7 (2.2%) | 8 (4.3%) |
| $10,000 to $14,999 | 17 (5.4%) | 14 (7.6%) |
| $15,000 to $19,999 | 13 (4.1%) | 14 (7.6%) |
| $20,000 to $24,999 | 30 (9.5%) | 11 (5.9%) |
| $25,000 to $34,999 | 48 (15.1%) | 37 (20.0%) |
| $35,000 to $49,999 | 63 (19.9%) | 33 (17.8%) |
| $50,000 to $74,999 | 44 (13.9%) | 21 (11.4%) |
| $75,000 to $99,999 | 59 (18.6%) | 12 (6.5%) |
| $100,000 to $149,999 | 15 (4.7%) | 5 (2.7%) |
| $150,000 or more | 2 (0.6%) | 12 (6.5%) |
| Total | 317 (100.0%) | 185 (100.0%) |
Monthly Housing Cost Tiers in Rush Springs
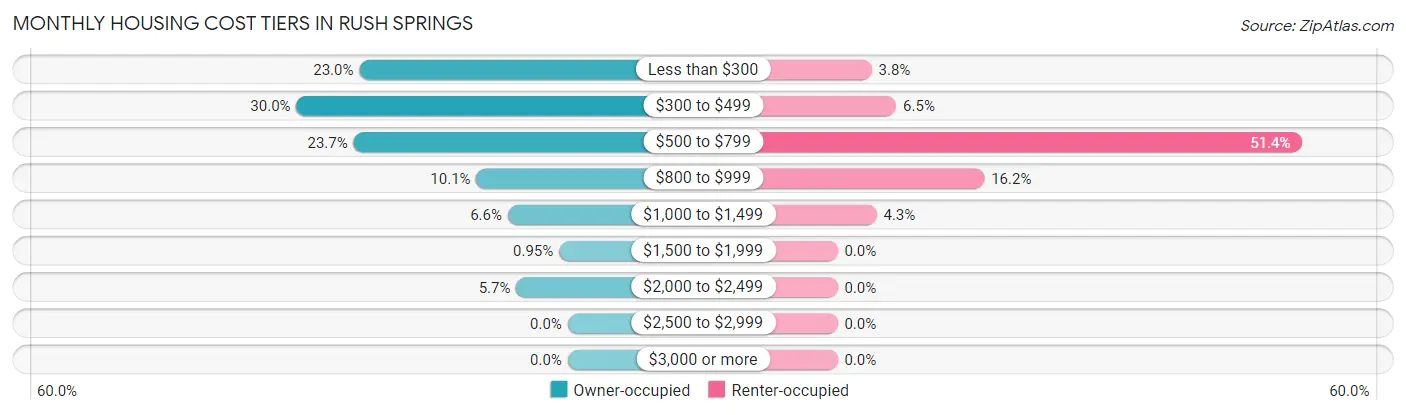
| Monthly Cost | Owner-occupied | Renter-occupied |
| Less than $300 | 73 (23.0%) | 7 (3.8%) |
| $300 to $499 | 95 (30.0%) | 12 (6.5%) |
| $500 to $799 | 75 (23.7%) | 95 (51.3%) |
| $800 to $999 | 32 (10.1%) | 30 (16.2%) |
| $1,000 to $1,499 | 21 (6.6%) | 8 (4.3%) |
| $1,500 to $1,999 | 3 (0.9%) | 0 (0.0%) |
| $2,000 to $2,499 | 18 (5.7%) | 0 (0.0%) |
| $2,500 to $2,999 | 0 (0.0%) | 0 (0.0%) |
| $3,000 or more | 0 (0.0%) | 0 (0.0%) |
| Total | 317 (100.0%) | 185 (100.0%) |
Physical Housing Characteristics in Rush Springs
Housing Structures in Rush Springs
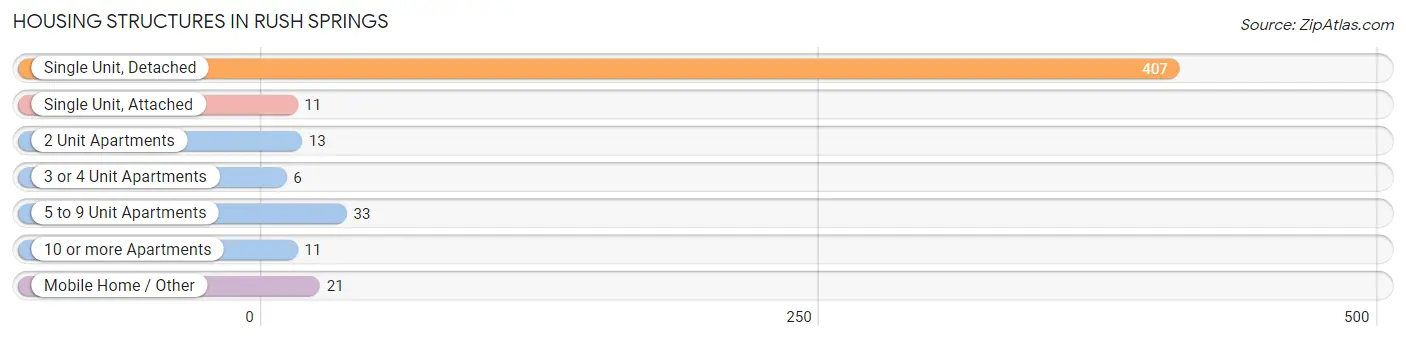
| Structure Type | # Housing Units | % Housing Units |
| Single Unit, Detached | 407 | 81.1% |
| Single Unit, Attached | 11 | 2.2% |
| 2 Unit Apartments | 13 | 2.6% |
| 3 or 4 Unit Apartments | 6 | 1.2% |
| 5 to 9 Unit Apartments | 33 | 6.6% |
| 10 or more Apartments | 11 | 2.2% |
| Mobile Home / Other | 21 | 4.2% |
| Total | 502 | 100.0% |
Housing Structures by Occupancy in Rush Springs
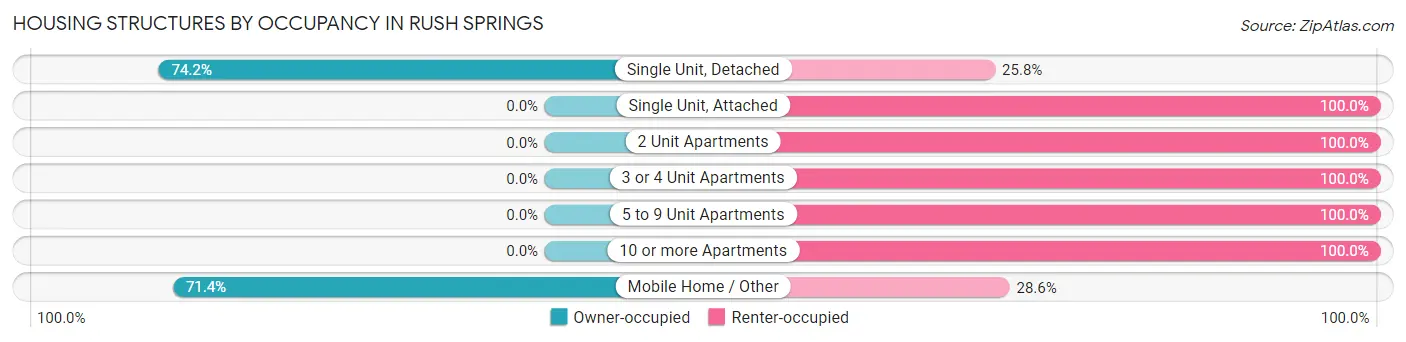
| Structure Type | Owner-occupied | Renter-occupied |
| Single Unit, Detached | 302 (74.2%) | 105 (25.8%) |
| Single Unit, Attached | 0 (0.0%) | 11 (100.0%) |
| 2 Unit Apartments | 0 (0.0%) | 13 (100.0%) |
| 3 or 4 Unit Apartments | 0 (0.0%) | 6 (100.0%) |
| 5 to 9 Unit Apartments | 0 (0.0%) | 33 (100.0%) |
| 10 or more Apartments | 0 (0.0%) | 11 (100.0%) |
| Mobile Home / Other | 15 (71.4%) | 6 (28.6%) |
| Total | 317 (63.1%) | 185 (36.8%) |
Housing Structures by Number of Rooms in Rush Springs
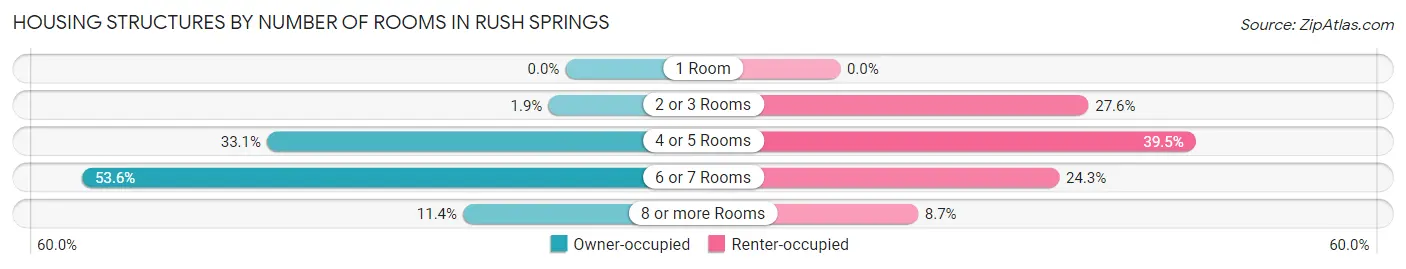
| Number of Rooms | Owner-occupied | Renter-occupied |
| 1 Room | 0 (0.0%) | 0 (0.0%) |
| 2 or 3 Rooms | 6 (1.9%) | 51 (27.6%) |
| 4 or 5 Rooms | 105 (33.1%) | 73 (39.5%) |
| 6 or 7 Rooms | 170 (53.6%) | 45 (24.3%) |
| 8 or more Rooms | 36 (11.4%) | 16 (8.6%) |
| Total | 317 (100.0%) | 185 (100.0%) |
Housing Structure by Heating Type in Rush Springs
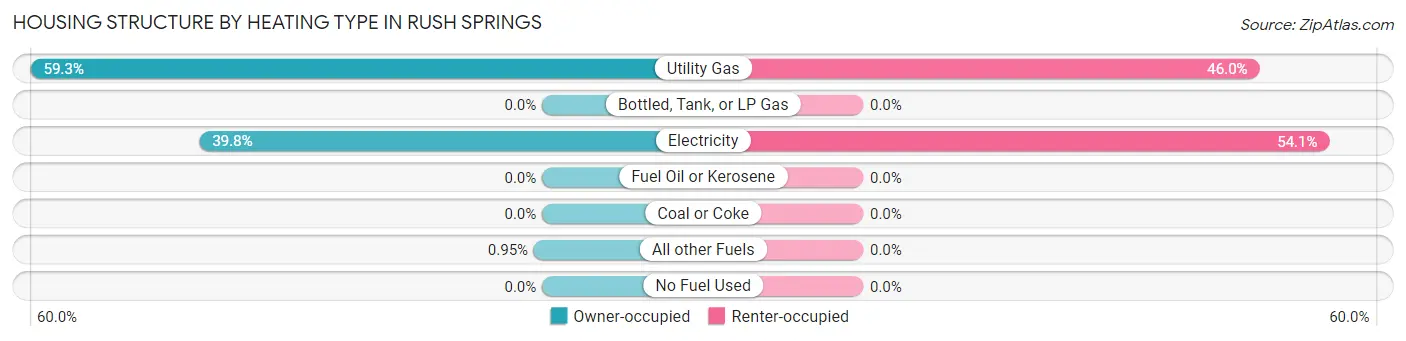
| Heating Type | Owner-occupied | Renter-occupied |
| Utility Gas | 188 (59.3%) | 85 (46.0%) |
| Bottled, Tank, or LP Gas | 0 (0.0%) | 0 (0.0%) |
| Electricity | 126 (39.8%) | 100 (54.0%) |
| Fuel Oil or Kerosene | 0 (0.0%) | 0 (0.0%) |
| Coal or Coke | 0 (0.0%) | 0 (0.0%) |
| All other Fuels | 3 (0.9%) | 0 (0.0%) |
| No Fuel Used | 0 (0.0%) | 0 (0.0%) |
| Total | 317 (100.0%) | 185 (100.0%) |
Household Vehicle Usage in Rush Springs
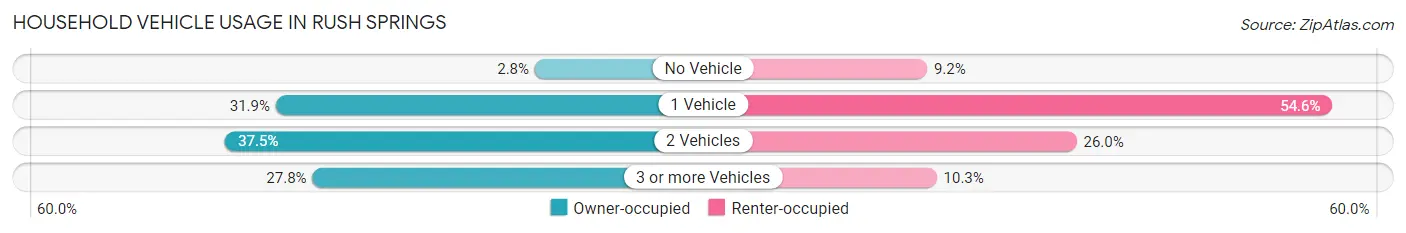
| Vehicles per Household | Owner-occupied | Renter-occupied |
| No Vehicle | 9 (2.8%) | 17 (9.2%) |
| 1 Vehicle | 101 (31.9%) | 101 (54.6%) |
| 2 Vehicles | 119 (37.5%) | 48 (26.0%) |
| 3 or more Vehicles | 88 (27.8%) | 19 (10.3%) |
| Total | 317 (100.0%) | 185 (100.0%) |
Real Estate & Mortgages in Rush Springs
Real Estate and Mortgage Overview in Rush Springs
| Characteristic | Without Mortgage | With Mortgage |
| Housing Units | 178 | 139 |
| Median Property Value | $63,300 | $82,300 |
| Median Household Income | $28,750 | $2 |
| Monthly Housing Costs | $326 | $0 |
| Real Estate Taxes | $292 | $17 |
Property Value by Mortgage Status in Rush Springs
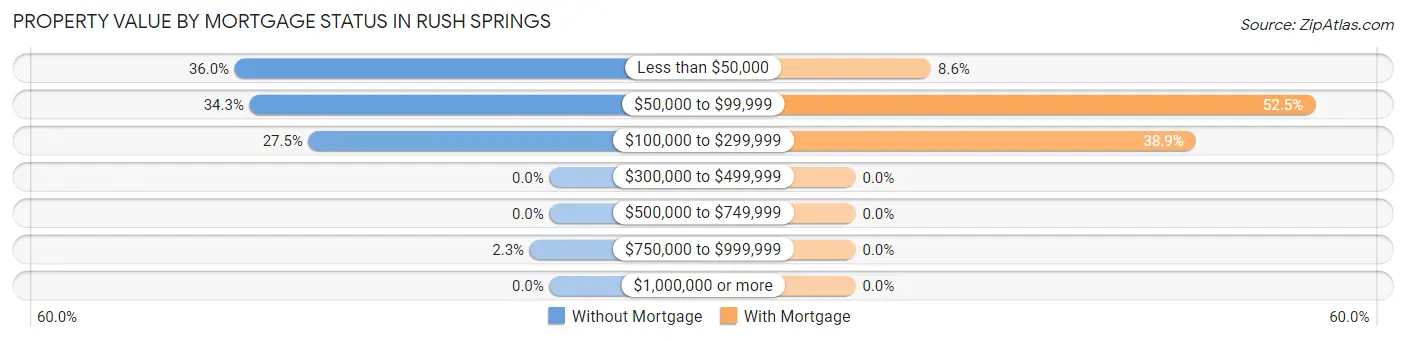
| Property Value | Without Mortgage | With Mortgage |
| Less than $50,000 | 64 (36.0%) | 12 (8.6%) |
| $50,000 to $99,999 | 61 (34.3%) | 73 (52.5%) |
| $100,000 to $299,999 | 49 (27.5%) | 54 (38.9%) |
| $300,000 to $499,999 | 0 (0.0%) | 0 (0.0%) |
| $500,000 to $749,999 | 0 (0.0%) | 0 (0.0%) |
| $750,000 to $999,999 | 4 (2.2%) | 0 (0.0%) |
| $1,000,000 or more | 0 (0.0%) | 0 (0.0%) |
| Total | 178 (100.0%) | 139 (100.0%) |
Household Income by Mortgage Status in Rush Springs
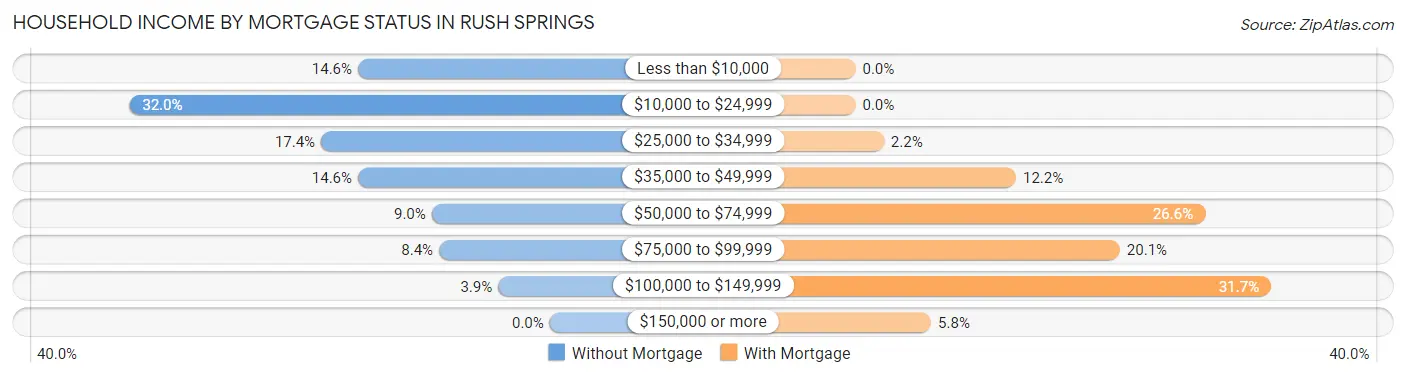
| Household Income | Without Mortgage | With Mortgage |
| Less than $10,000 | 26 (14.6%) | 0 (0.0%) |
| $10,000 to $24,999 | 57 (32.0%) | 0 (0.0%) |
| $25,000 to $34,999 | 31 (17.4%) | 3 (2.2%) |
| $35,000 to $49,999 | 26 (14.6%) | 17 (12.2%) |
| $50,000 to $74,999 | 16 (9.0%) | 37 (26.6%) |
| $75,000 to $99,999 | 15 (8.4%) | 28 (20.1%) |
| $100,000 to $149,999 | 7 (3.9%) | 44 (31.7%) |
| $150,000 or more | 0 (0.0%) | 8 (5.8%) |
| Total | 178 (100.0%) | 139 (100.0%) |
Property Value to Household Income Ratio in Rush Springs
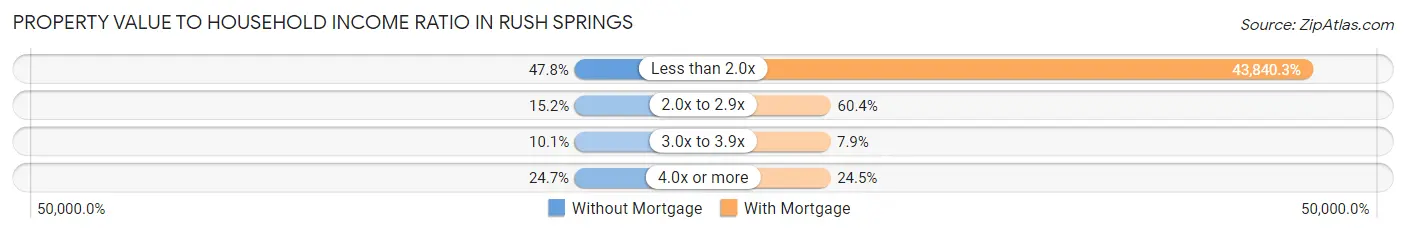
| Value-to-Income Ratio | Without Mortgage | With Mortgage |
| Less than 2.0x | 85 (47.7%) | 60,938 (43,840.3%) |
| 2.0x to 2.9x | 27 (15.2%) | 84 (60.4%) |
| 3.0x to 3.9x | 18 (10.1%) | 11 (7.9%) |
| 4.0x or more | 44 (24.7%) | 34 (24.5%) |
| Total | 178 (100.0%) | 139 (100.0%) |
Real Estate Taxes by Mortgage Status in Rush Springs
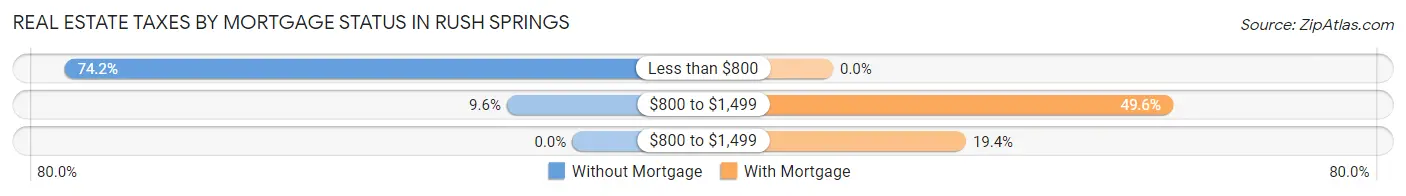
| Property Taxes | Without Mortgage | With Mortgage |
| Less than $800 | 132 (74.2%) | 0 (0.0%) |
| $800 to $1,499 | 17 (9.6%) | 69 (49.6%) |
| $800 to $1,499 | 0 (0.0%) | 27 (19.4%) |
| Total | 178 (100.0%) | 139 (100.0%) |
Health & Disability in Rush Springs
Health Insurance Coverage by Age in Rush Springs
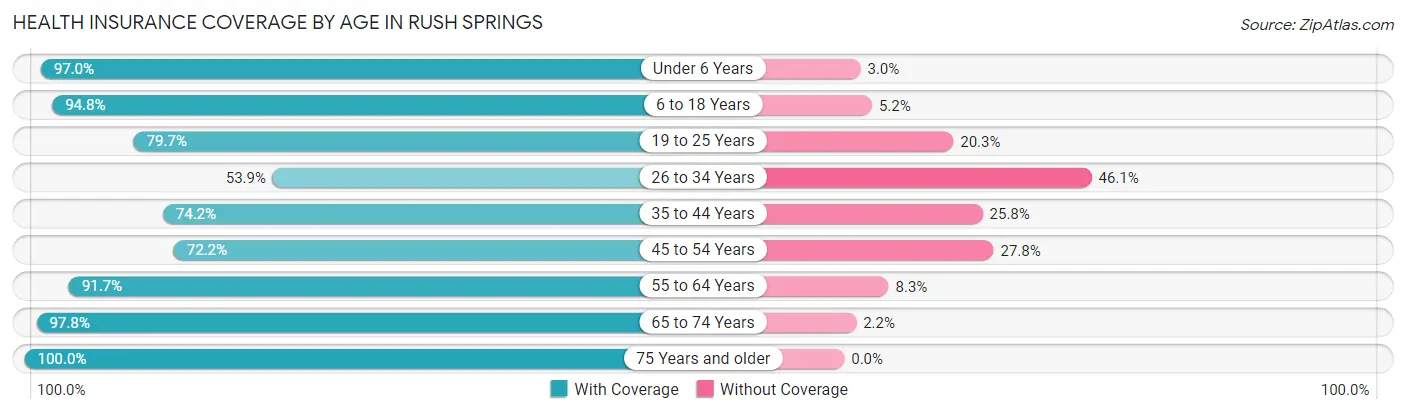
| Age Bracket | With Coverage | Without Coverage |
| Under 6 Years | 64 (97.0%) | 2 (3.0%) |
| 6 to 18 Years | 239 (94.8%) | 13 (5.2%) |
| 19 to 25 Years | 98 (79.7%) | 25 (20.3%) |
| 26 to 34 Years | 76 (53.9%) | 65 (46.1%) |
| 35 to 44 Years | 118 (74.2%) | 41 (25.8%) |
| 45 to 54 Years | 83 (72.2%) | 32 (27.8%) |
| 55 to 64 Years | 100 (91.7%) | 9 (8.3%) |
| 65 to 74 Years | 132 (97.8%) | 3 (2.2%) |
| 75 Years and older | 152 (100.0%) | 0 (0.0%) |
| Total | 1,062 (84.8%) | 190 (15.2%) |
Health Insurance Coverage by Citizenship Status in Rush Springs
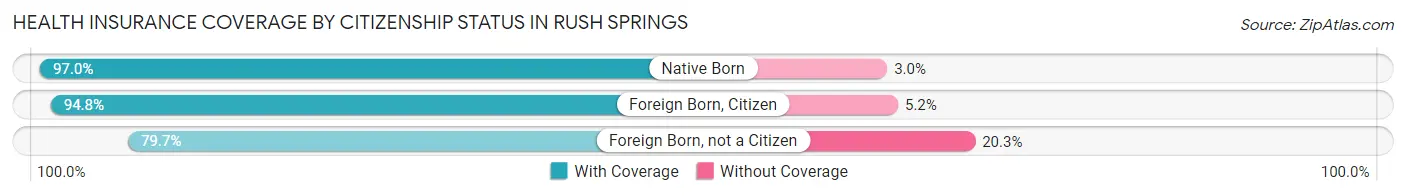
| Citizenship Status | With Coverage | Without Coverage |
| Native Born | 64 (97.0%) | 2 (3.0%) |
| Foreign Born, Citizen | 239 (94.8%) | 13 (5.2%) |
| Foreign Born, not a Citizen | 98 (79.7%) | 25 (20.3%) |
Health Insurance Coverage by Household Income in Rush Springs
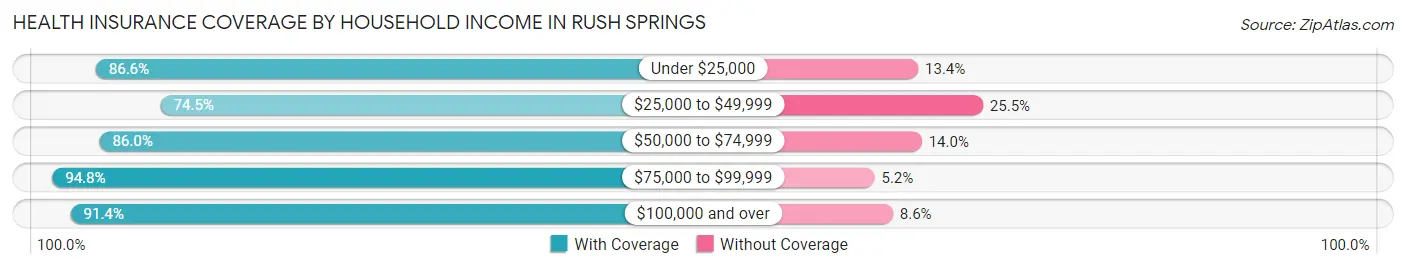
| Household Income | With Coverage | Without Coverage |
| Under $25,000 | 253 (86.6%) | 39 (13.4%) |
| $25,000 to $49,999 | 298 (74.5%) | 102 (25.5%) |
| $50,000 to $74,999 | 147 (86.0%) | 24 (14.0%) |
| $75,000 to $99,999 | 237 (94.8%) | 13 (5.2%) |
| $100,000 and over | 127 (91.4%) | 12 (8.6%) |
Public vs Private Health Insurance Coverage by Age in Rush Springs
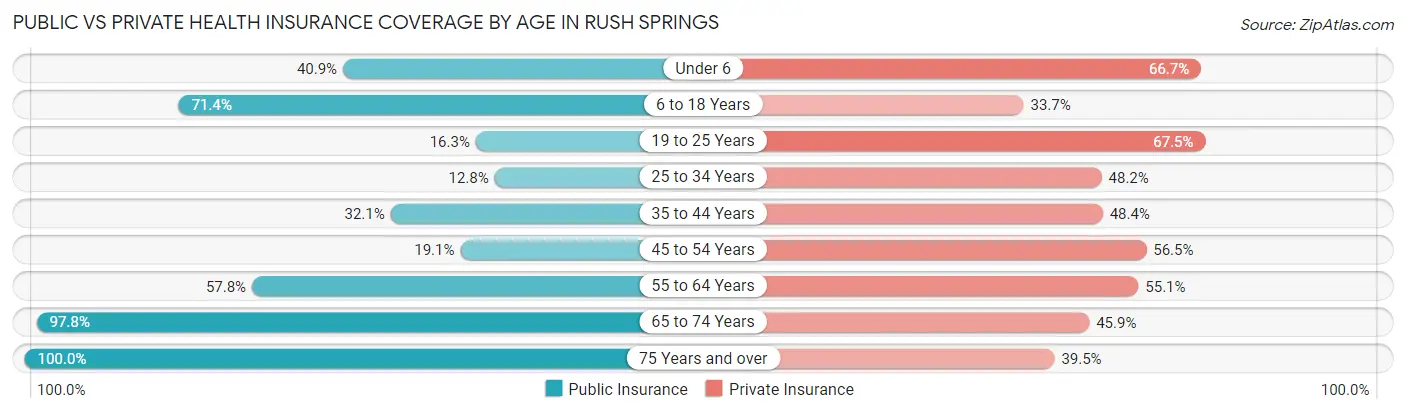
| Age Bracket | Public Insurance | Private Insurance |
| Under 6 | 27 (40.9%) | 44 (66.7%) |
| 6 to 18 Years | 180 (71.4%) | 85 (33.7%) |
| 19 to 25 Years | 20 (16.3%) | 83 (67.5%) |
| 25 to 34 Years | 18 (12.8%) | 68 (48.2%) |
| 35 to 44 Years | 51 (32.1%) | 77 (48.4%) |
| 45 to 54 Years | 22 (19.1%) | 65 (56.5%) |
| 55 to 64 Years | 63 (57.8%) | 60 (55.0%) |
| 65 to 74 Years | 132 (97.8%) | 62 (45.9%) |
| 75 Years and over | 152 (100.0%) | 60 (39.5%) |
| Total | 665 (53.1%) | 604 (48.2%) |
Disability Status by Sex by Age in Rush Springs
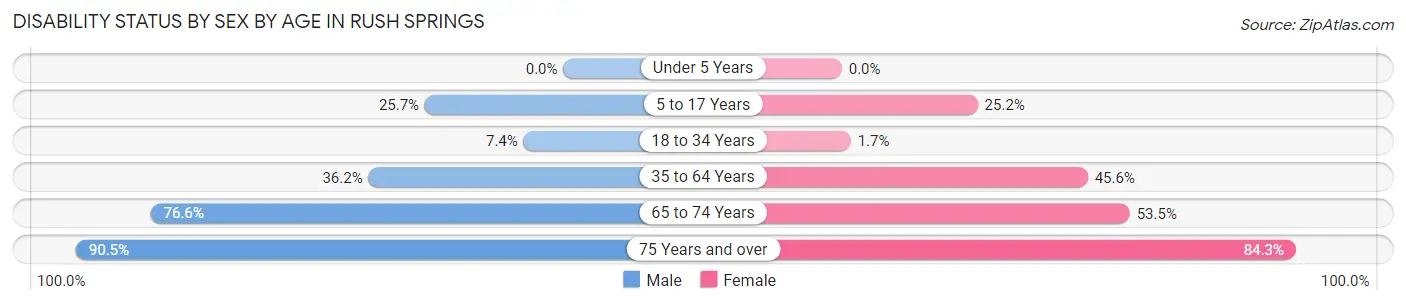
| Age Bracket | Male | Female |
| Under 5 Years | 0 (0.0%) | 0 (0.0%) |
| 5 to 17 Years | 37 (25.7%) | 29 (25.2%) |
| 18 to 34 Years | 11 (7.4%) | 2 (1.7%) |
| 35 to 64 Years | 68 (36.2%) | 89 (45.6%) |
| 65 to 74 Years | 59 (76.6%) | 31 (53.4%) |
| 75 Years and over | 57 (90.5%) | 75 (84.3%) |
Disability Class by Sex by Age in Rush Springs
Disability Class: Hearing Difficulty
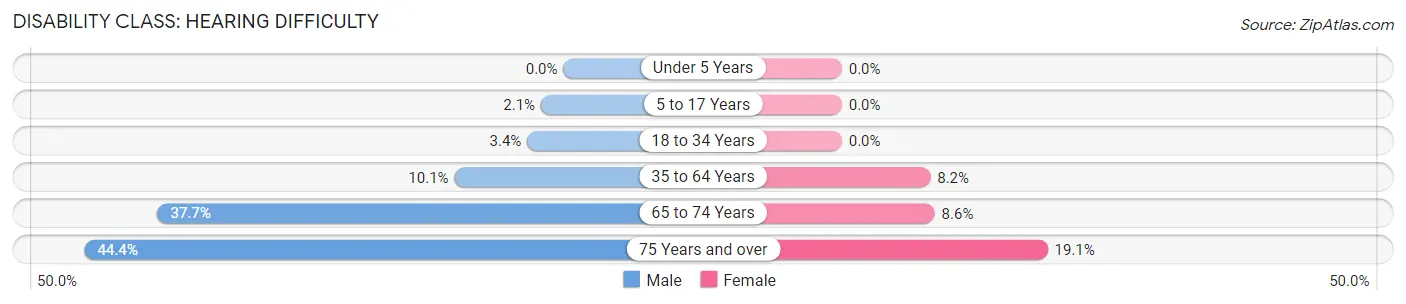
| Age Bracket | Male | Female |
| Under 5 Years | 0 (0.0%) | 0 (0.0%) |
| 5 to 17 Years | 3 (2.1%) | 0 (0.0%) |
| 18 to 34 Years | 5 (3.4%) | 0 (0.0%) |
| 35 to 64 Years | 19 (10.1%) | 16 (8.2%) |
| 65 to 74 Years | 29 (37.7%) | 5 (8.6%) |
| 75 Years and over | 28 (44.4%) | 17 (19.1%) |
Disability Class: Vision Difficulty
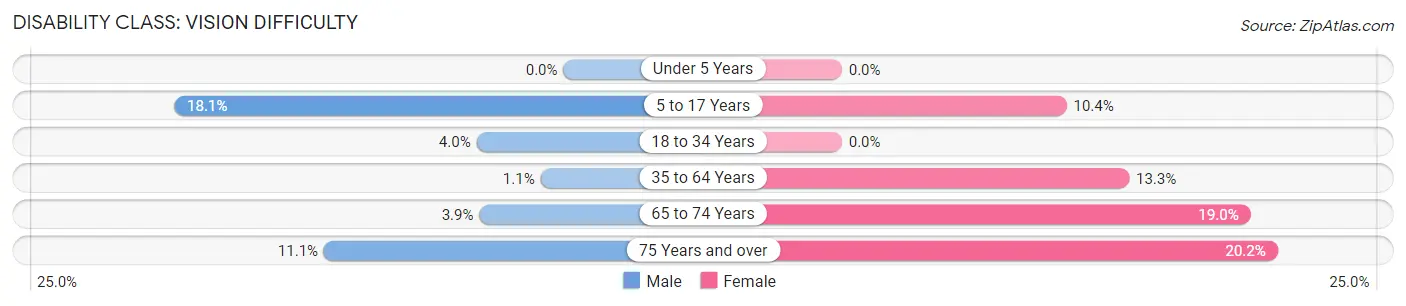
| Age Bracket | Male | Female |
| Under 5 Years | 0 (0.0%) | 0 (0.0%) |
| 5 to 17 Years | 26 (18.1%) | 12 (10.4%) |
| 18 to 34 Years | 6 (4.0%) | 0 (0.0%) |
| 35 to 64 Years | 2 (1.1%) | 26 (13.3%) |
| 65 to 74 Years | 3 (3.9%) | 11 (19.0%) |
| 75 Years and over | 7 (11.1%) | 18 (20.2%) |
Disability Class: Cognitive Difficulty
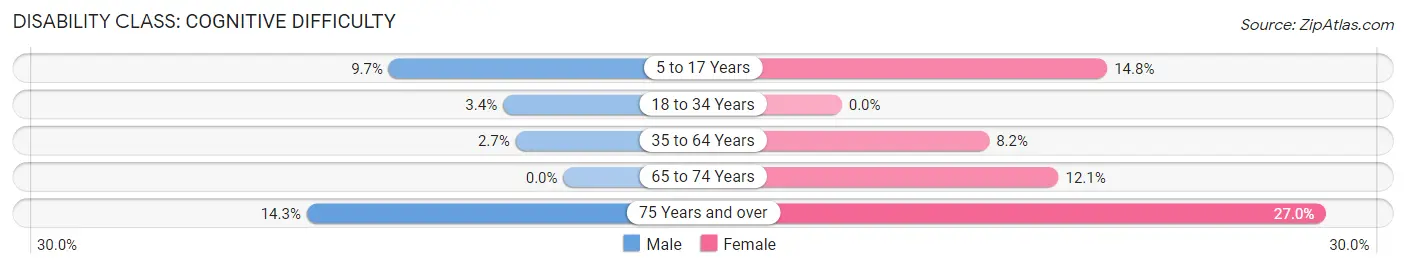
| Age Bracket | Male | Female |
| 5 to 17 Years | 14 (9.7%) | 17 (14.8%) |
| 18 to 34 Years | 5 (3.4%) | 0 (0.0%) |
| 35 to 64 Years | 5 (2.7%) | 16 (8.2%) |
| 65 to 74 Years | 0 (0.0%) | 7 (12.1%) |
| 75 Years and over | 9 (14.3%) | 24 (27.0%) |
Disability Class: Ambulatory Difficulty
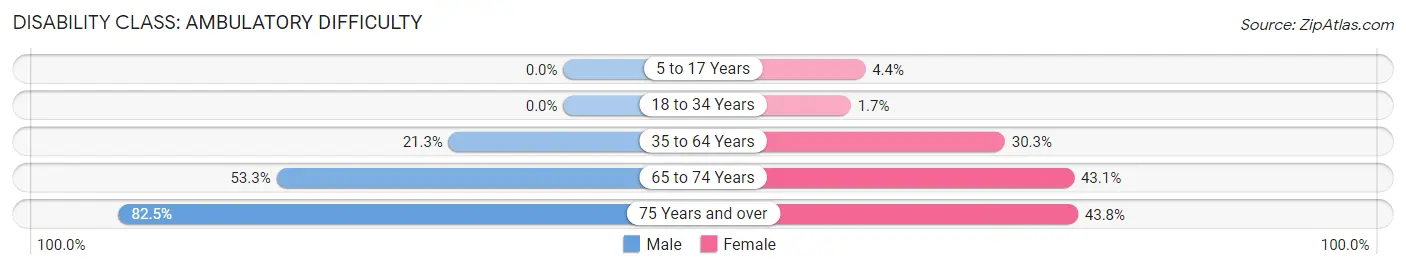
| Age Bracket | Male | Female |
| 5 to 17 Years | 0 (0.0%) | 5 (4.3%) |
| 18 to 34 Years | 0 (0.0%) | 2 (1.7%) |
| 35 to 64 Years | 40 (21.3%) | 59 (30.3%) |
| 65 to 74 Years | 41 (53.2%) | 25 (43.1%) |
| 75 Years and over | 52 (82.5%) | 39 (43.8%) |
Disability Class: Self-Care Difficulty
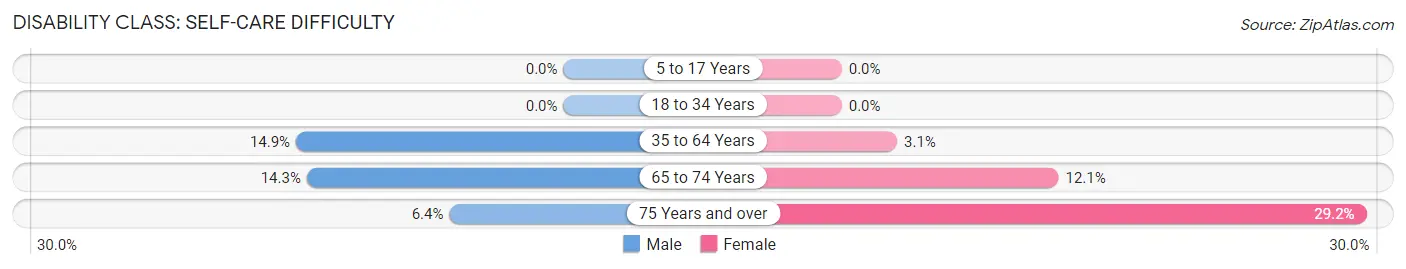
| Age Bracket | Male | Female |
| 5 to 17 Years | 0 (0.0%) | 0 (0.0%) |
| 18 to 34 Years | 0 (0.0%) | 0 (0.0%) |
| 35 to 64 Years | 28 (14.9%) | 6 (3.1%) |
| 65 to 74 Years | 11 (14.3%) | 7 (12.1%) |
| 75 Years and over | 4 (6.4%) | 26 (29.2%) |
Technology Access in Rush Springs
Computing Device Access in Rush Springs
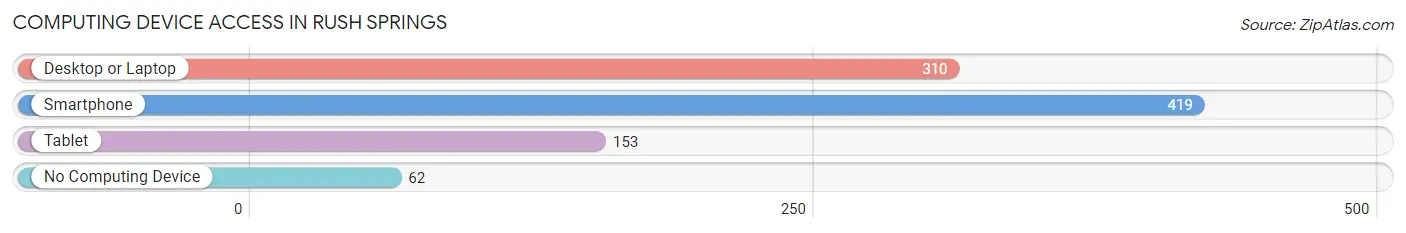
| Device Type | # Households | % Households |
| Desktop or Laptop | 310 | 61.8% |
| Smartphone | 419 | 83.5% |
| Tablet | 153 | 30.5% |
| No Computing Device | 62 | 12.3% |
| Total | 502 | 100.0% |
Internet Access in Rush Springs
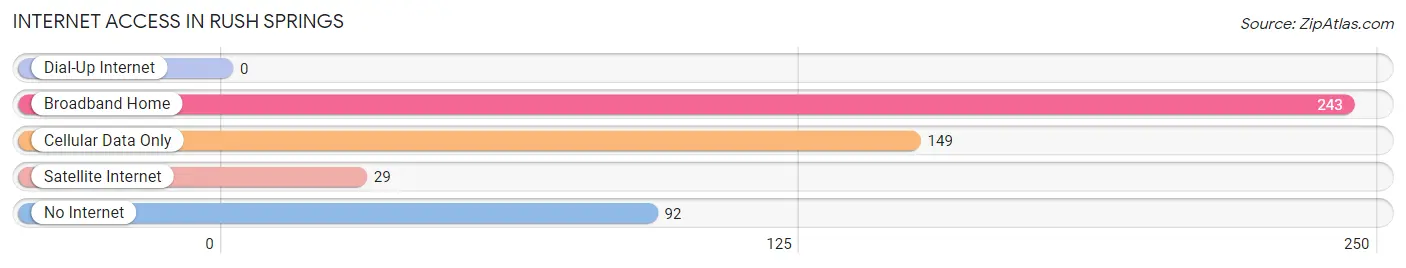
| Internet Type | # Households | % Households |
| Dial-Up Internet | 0 | 0.0% |
| Broadband Home | 243 | 48.4% |
| Cellular Data Only | 149 | 29.7% |
| Satellite Internet | 29 | 5.8% |
| No Internet | 92 | 18.3% |
| Total | 502 | 100.0% |
Rush Springs Summary
History
The town of Rush Springs, Oklahoma is located in Grady County, approximately 70 miles southwest of Oklahoma City. The town was founded in 1891 by the Rush Springs Townsite Company, which was formed by a group of investors from Rush Springs, Texas. The town was named after the nearby Rush Springs, which were a popular destination for travelers and settlers.
The town was originally a farming community, with cotton being the main crop. In the early 1900s, the town began to grow and develop, with the construction of a school, a bank, a hotel, and a post office. The town also had a newspaper, the Rush Springs News, which was published from 1902 to 1910.
In the 1920s, the town experienced a boom in oil production, which led to an influx of new residents and businesses. The town also became a popular tourist destination, with the opening of the Rush Springs Hotel in 1925.
The town continued to grow and develop throughout the 20th century, with the construction of a new school in the 1950s and the opening of a new hospital in the 1970s. The town also experienced a population boom in the 1990s, with the opening of a new Walmart store in 1995.
Geography
Rush Springs is located in the southwestern part of Grady County, approximately 70 miles southwest of Oklahoma City. The town is situated on the banks of the Washita River, which flows through the town. The town is surrounded by rolling hills and farmland, with the nearest major city being Lawton, which is located approximately 30 miles to the east.
The climate in Rush Springs is generally mild, with temperatures ranging from the low 30s in the winter to the mid-90s in the summer. The town receives an average of 36 inches of precipitation per year, with most of it falling in the spring and summer months.
Economy
The economy of Rush Springs is largely based on agriculture, with cotton being the main crop. Other crops grown in the area include corn, wheat, and soybeans. The town also has a number of businesses, including a Walmart store, a bank, a hotel, and a post office.
The town is also home to a number of manufacturing companies, including a plastics factory and a metal fabrication plant. The town also has a number of restaurants and bars, as well as a movie theater.
Demographics
As of the 2010 census, the population of Rush Springs was 2,072. The racial makeup of the town was 94.3% White, 0.7% African American, 0.3% Native American, 0.2% Asian, 0.1% Pacific Islander, and 4.4% from other races. The median household income in the town was $35,938, and the median family income was $41,250.
Conclusion
Rush Springs, Oklahoma is a small town located in Grady County, approximately 70 miles southwest of Oklahoma City. The town was founded in 1891 and has a long history of farming and oil production. The town has experienced a population boom in recent years, with the opening of a Walmart store in 1995. The town has a largely agricultural economy, with cotton being the main crop. The town also has a number of businesses, including a bank, a hotel, and a post office. The population of Rush Springs was 2,072 as of the 2010 census, with the median household income being $35,938.
Common Questions
What is Per Capita Income in Rush Springs?
Per Capita income in Rush Springs is $20,855.
What is the Median Family Income in Rush Springs?
Median Family Income in Rush Springs is $43,654.
What is the Median Household income in Rush Springs?
Median Household Income in Rush Springs is $37,344.
What is Income or Wage Gap in Rush Springs?
Income or Wage Gap in Rush Springs is 43.1%.
Women in Rush Springs earn 56.9 cents for every dollar earned by a man.
What is Family Income Deficit in Rush Springs?
Family Income Deficit in Rush Springs is $12,434.
Families that are below poverty line in Rush Springs earn $12,434 less on average than the poverty threshold level.
What is Inequality or Gini Index in Rush Springs?
Inequality or Gini Index in Rush Springs is 0.41.
What is the Total Population of Rush Springs?
Total Population of Rush Springs is 1,265.
What is the Total Male Population of Rush Springs?
Total Male Population of Rush Springs is 652.
What is the Total Female Population of Rush Springs?
Total Female Population of Rush Springs is 613.
What is the Ratio of Males per 100 Females in Rush Springs?
There are 106.36 Males per 100 Females in Rush Springs.
What is the Ratio of Females per 100 Males in Rush Springs?
There are 94.02 Females per 100 Males in Rush Springs.
What is the Median Population Age in Rush Springs?
Median Population Age in Rush Springs is 38.7 Years.
What is the Average Family Size in Rush Springs
Average Family Size in Rush Springs is 3.2 People.
What is the Average Household Size in Rush Springs
Average Household Size in Rush Springs is 2.5 People.
How Large is the Labor Force in Rush Springs?
There are 504 People in the Labor Forcein in Rush Springs.
What is the Percentage of People in the Labor Force in Rush Springs?
49.8% of People are in the Labor Force in Rush Springs.
What is the Unemployment Rate in Rush Springs?
Unemployment Rate in Rush Springs is 6.7%.