Rock Island, OK Map & Demographics
Rock Island Map
Rock Island Overview
$22,169
PER CAPITA INCOME
$51,771
AVG FAMILY INCOME
$38,281
AVG HOUSEHOLD INCOME
27.1%
WAGE / INCOME GAP [ % ]
72.9¢/ $1
WAGE / INCOME GAP [ $ ]
$9,780
FAMILY INCOME DEFICIT
0.52
INEQUALITY / GINI INDEX
772
TOTAL POPULATION
383
MALE POPULATION
389
FEMALE POPULATION
98.46
MALES / 100 FEMALES
101.57
FEMALES / 100 MALES
39.2
MEDIAN AGE
3.5
AVG FAMILY SIZE
2.7
AVG HOUSEHOLD SIZE
280
LABOR FORCE [ PEOPLE ]
46.4%
PERCENT IN LABOR FORCE
6.4%
UNEMPLOYMENT RATE
Income in Rock Island
Income Overview in Rock Island
Per Capita Income in Rock Island is $22,169, while median incomes of families and households are $51,771 and $38,281 respectively.
| Characteristic | Number | Measure |
| Per Capita Income | 772 | $22,169 |
| Median Family Income | 185 | $51,771 |
| Mean Family Income | 185 | $71,131 |
| Median Household Income | 289 | $38,281 |
| Mean Household Income | 289 | $54,246 |
| Income Deficit | 185 | $9,780 |
| Wage / Income Gap (%) | 772 | 27.12% |
| Wage / Income Gap ($) | 772 | 72.88¢ per $1 |
| Gini / Inequality Index | 772 | 0.52 |
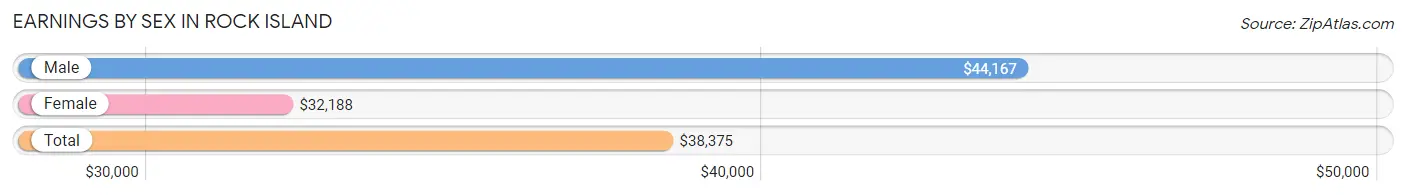
Earnings by Sex in Rock Island
Average Earnings in Rock Island are $38,375, $44,167 for men and $32,188 for women, a difference of 27.1%.
| Sex | Number | Average Earnings |
| Male | 178 (62.0%) | $44,167 |
| Female | 109 (38.0%) | $32,188 |
| Total | 287 (100.0%) | $38,375 |
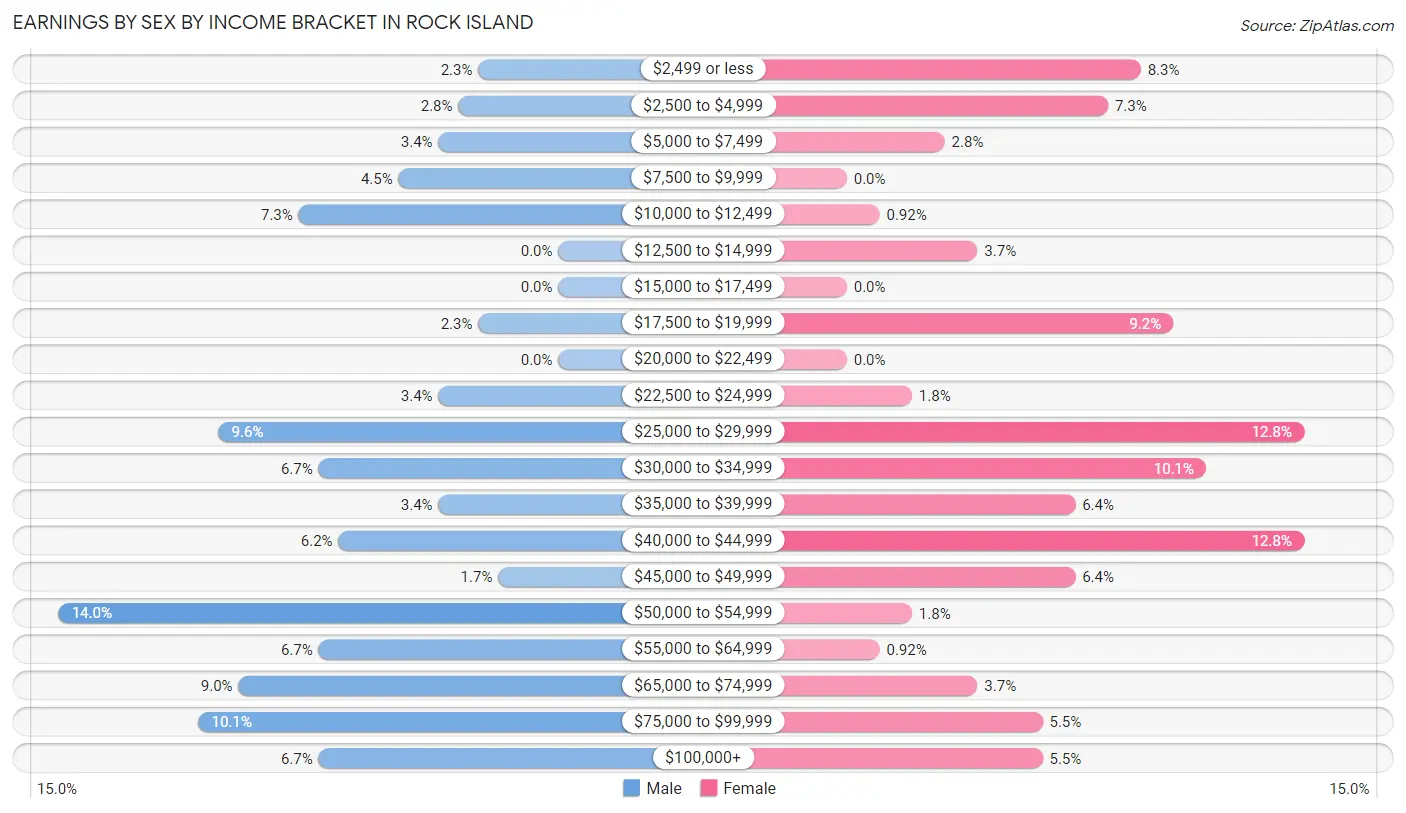
Earnings by Sex by Income Bracket in Rock Island
The most common earnings brackets in Rock Island are $50,000 to $54,999 for men (25 | 14.0%) and $25,000 to $29,999 for women (14 | 12.8%).
| Income | Male | Female |
| $2,499 or less | 4 (2.2%) | 9 (8.3%) |
| $2,500 to $4,999 | 5 (2.8%) | 8 (7.3%) |
| $5,000 to $7,499 | 6 (3.4%) | 3 (2.8%) |
| $7,500 to $9,999 | 8 (4.5%) | 0 (0.0%) |
| $10,000 to $12,499 | 13 (7.3%) | 1 (0.9%) |
| $12,500 to $14,999 | 0 (0.0%) | 4 (3.7%) |
| $15,000 to $17,499 | 0 (0.0%) | 0 (0.0%) |
| $17,500 to $19,999 | 4 (2.2%) | 10 (9.2%) |
| $20,000 to $22,499 | 0 (0.0%) | 0 (0.0%) |
| $22,500 to $24,999 | 6 (3.4%) | 2 (1.8%) |
| $25,000 to $29,999 | 17 (9.6%) | 14 (12.8%) |
| $30,000 to $34,999 | 12 (6.7%) | 11 (10.1%) |
| $35,000 to $39,999 | 6 (3.4%) | 7 (6.4%) |
| $40,000 to $44,999 | 11 (6.2%) | 14 (12.8%) |
| $45,000 to $49,999 | 3 (1.7%) | 7 (6.4%) |
| $50,000 to $54,999 | 25 (14.0%) | 2 (1.8%) |
| $55,000 to $64,999 | 12 (6.7%) | 1 (0.9%) |
| $65,000 to $74,999 | 16 (9.0%) | 4 (3.7%) |
| $75,000 to $99,999 | 18 (10.1%) | 6 (5.5%) |
| $100,000+ | 12 (6.7%) | 6 (5.5%) |
| Total | 178 (100.0%) | 109 (100.0%) |
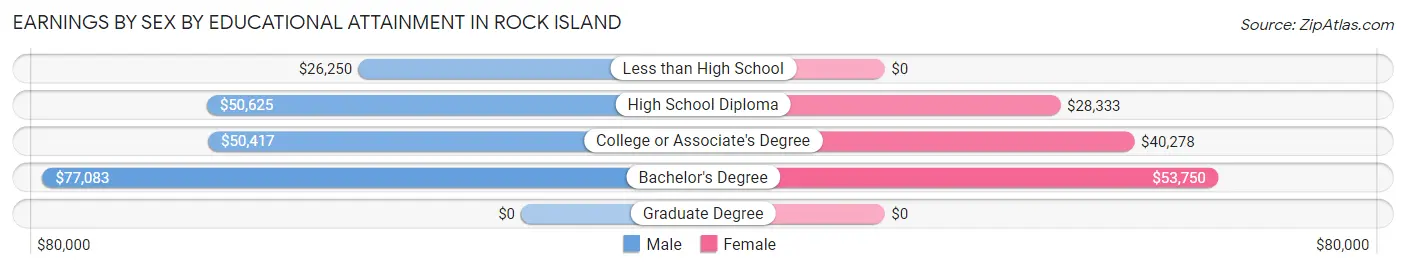
Earnings by Sex by Educational Attainment in Rock Island
Average earnings in Rock Island are $50,987 for men and $36,667 for women, a difference of 28.1%. Men with an educational attainment of bachelor's degree enjoy the highest average annual earnings of $77,083, while those with less than high school education earn the least with $26,250. Women with an educational attainment of bachelor's degree earn the most with the average annual earnings of $53,750, while those with high school diploma education have the smallest earnings of $28,333.
| Educational Attainment | Male Income | Female Income |
| Less than High School | $26,250 | $0 |
| High School Diploma | $50,625 | $28,333 |
| College or Associate's Degree | $50,417 | $40,278 |
| Bachelor's Degree | $77,083 | $53,750 |
| Graduate Degree | - | - |
| Total | $50,987 | $36,667 |
Family Income in Rock Island
Family Income Brackets in Rock Island
According to the Rock Island family income data, there are 50 families falling into the $50,000 to $74,999 income range, which is the most common income bracket and makes up 27.0% of all families. Conversely, the $150,000 to $199,999 income bracket is the least frequent group with only 8 families (4.3%) belonging to this category.
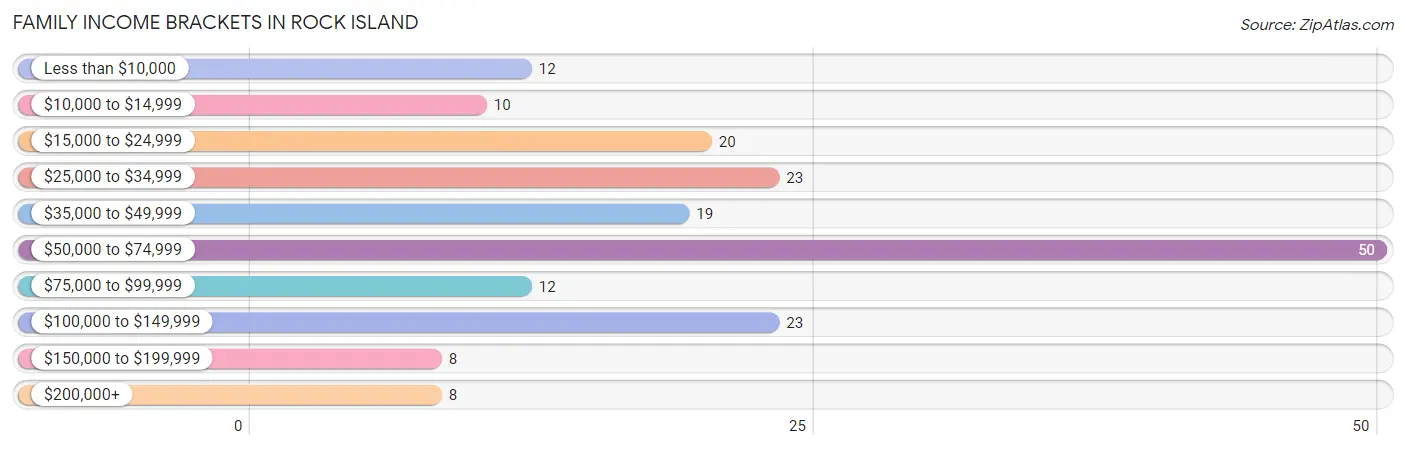
| Income Bracket | # Families | % Families |
| Less than $10,000 | 12 | 6.5% |
| $10,000 to $14,999 | 10 | 5.4% |
| $15,000 to $24,999 | 20 | 10.8% |
| $25,000 to $34,999 | 23 | 12.4% |
| $35,000 to $49,999 | 19 | 10.3% |
| $50,000 to $74,999 | 50 | 27.0% |
| $75,000 to $99,999 | 12 | 6.5% |
| $100,000 to $149,999 | 23 | 12.4% |
| $150,000 to $199,999 | 8 | 4.3% |
| $200,000+ | 8 | 4.3% |
Family Income by Famaliy Size in Rock Island
4-person families (25 | 13.5%) account for the highest median family income in Rock Island with $102,917 per family, while 4-person families (25 | 13.5%) have the highest median income of $25,729 per family member.
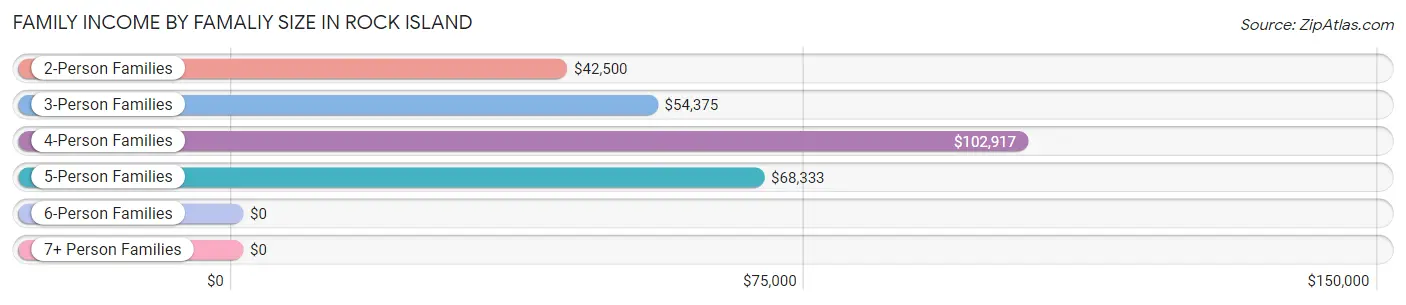
| Income Bracket | # Families | Median Income |
| 2-Person Families | 96 (51.9%) | $42,500 |
| 3-Person Families | 35 (18.9%) | $54,375 |
| 4-Person Families | 25 (13.5%) | $102,917 |
| 5-Person Families | 12 (6.5%) | $68,333 |
| 6-Person Families | 11 (5.9%) | $0 |
| 7+ Person Families | 6 (3.2%) | $0 |
| Total | 185 (100.0%) | $51,771 |
Family Income by Number of Earners in Rock Island
The median family income in Rock Island is $51,771, with families comprising 3+ earners (11) having the highest median family income of $140,625, while families with no earners (42) have the lowest median family income of $28,750, accounting for 5.9% and 22.7% of families, respectively.
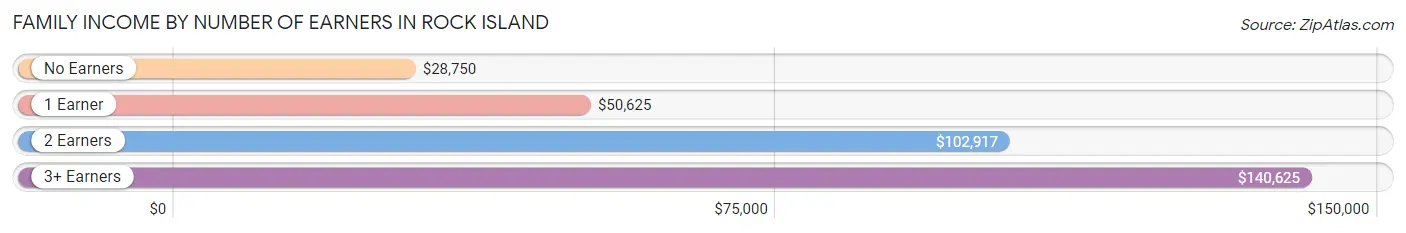
| Number of Earners | # Families | Median Income |
| No Earners | 42 (22.7%) | $28,750 |
| 1 Earner | 79 (42.7%) | $50,625 |
| 2 Earners | 53 (28.6%) | $102,917 |
| 3+ Earners | 11 (5.9%) | $140,625 |
| Total | 185 (100.0%) | $51,771 |
Household Income in Rock Island
Household Income Brackets in Rock Island
With 60 households falling in the category, the $50,000 to $74,999 income range is the most frequent in Rock Island, accounting for 20.8% of all households. In contrast, only 8 households (2.8%) fall into the $150,000 to $199,999 income bracket, making it the least populous group.
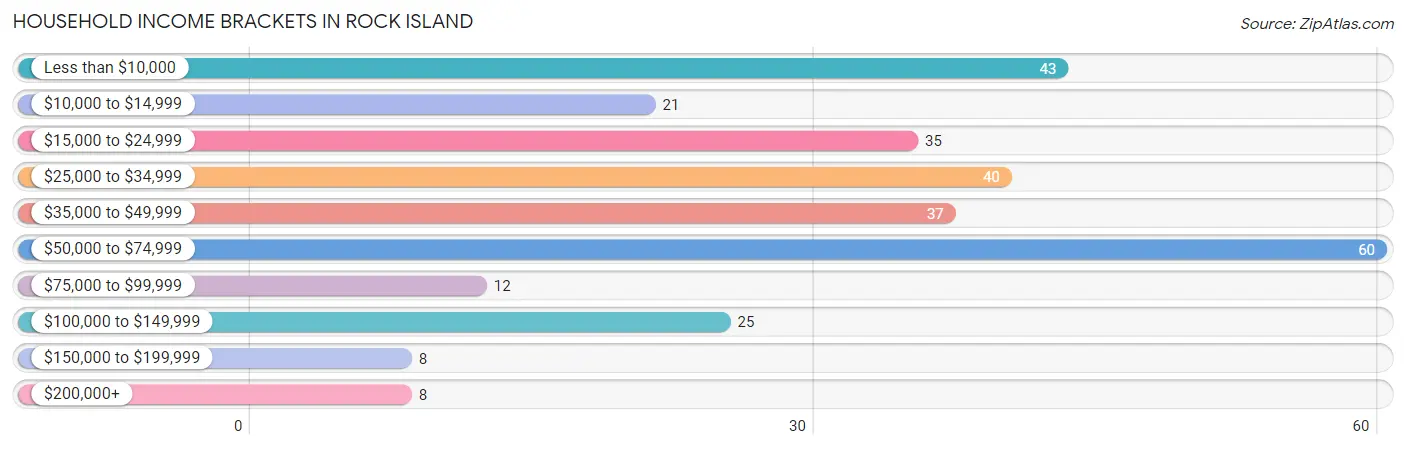
| Income Bracket | # Households | % Households |
| Less than $10,000 | 43 | 14.9% |
| $10,000 to $14,999 | 21 | 7.3% |
| $15,000 to $24,999 | 35 | 12.1% |
| $25,000 to $34,999 | 40 | 13.8% |
| $35,000 to $49,999 | 37 | 12.8% |
| $50,000 to $74,999 | 60 | 20.8% |
| $75,000 to $99,999 | 12 | 4.2% |
| $100,000 to $149,999 | 25 | 8.7% |
| $150,000 to $199,999 | 8 | 2.8% |
| $200,000+ | 8 | 2.8% |
Household Income by Householder Age in Rock Island
The median household income in Rock Island is $38,281, with the highest median household income of $50,729 found in the 45 to 64 years age bracket for the primary householder. A total of 97 households (33.6%) fall into this category. Meanwhile, the 65+ years age bracket for the primary householder has the lowest median household income of $19,792, with 105 households (36.3%) in this group.
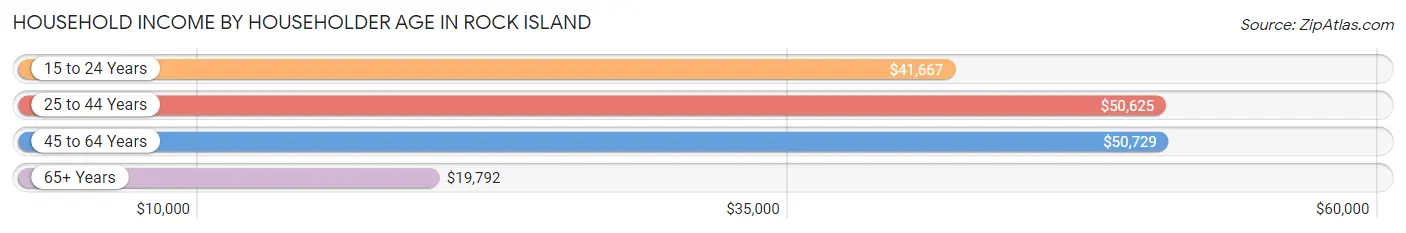
| Income Bracket | # Households | Median Income |
| 15 to 24 Years | 20 (6.9%) | $41,667 |
| 25 to 44 Years | 67 (23.2%) | $50,625 |
| 45 to 64 Years | 97 (33.6%) | $50,729 |
| 65+ Years | 105 (36.3%) | $19,792 |
| Total | 289 (100.0%) | $38,281 |
Poverty in Rock Island
Income Below Poverty by Sex and Age in Rock Island
With 24.0% poverty level for males and 32.9% for females among the residents of Rock Island, 5 year old males and 12 to 14 year old females are the most vulnerable to poverty, with 4 males (50.0%) and 4 females (100.0%) in their respective age groups living below the poverty level.
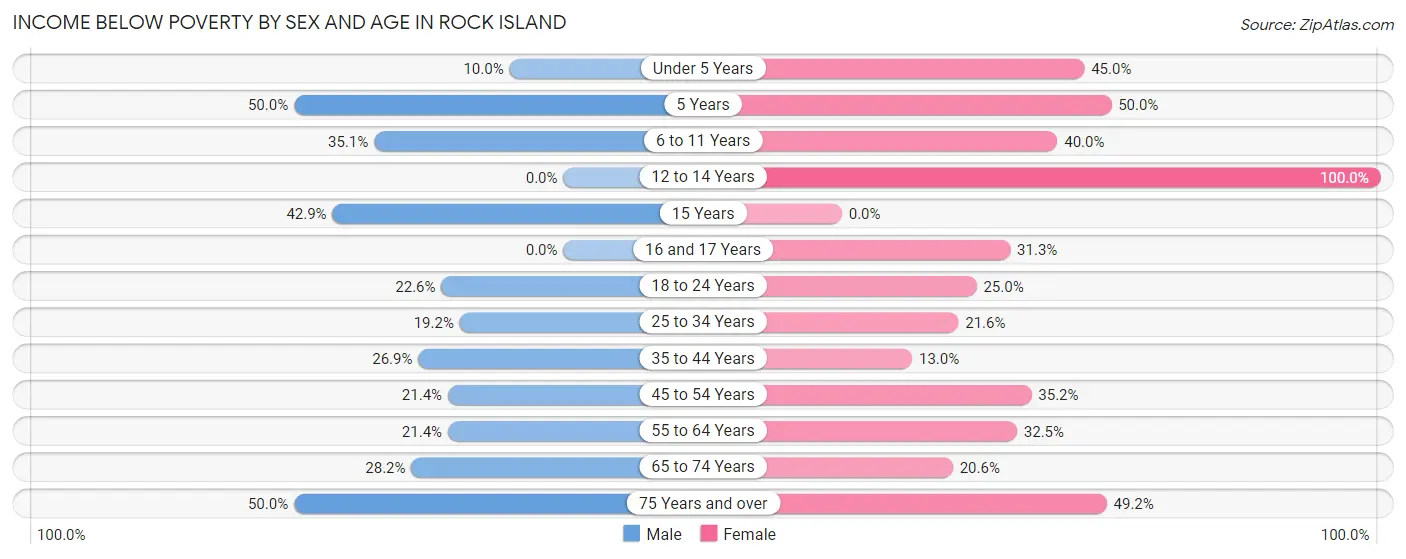
| Age Bracket | Male | Female |
| Under 5 Years | 3 (10.0%) | 9 (45.0%) |
| 5 Years | 4 (50.0%) | 3 (50.0%) |
| 6 to 11 Years | 13 (35.1%) | 18 (40.0%) |
| 12 to 14 Years | 0 (0.0%) | 4 (100.0%) |
| 15 Years | 3 (42.9%) | 0 (0.0%) |
| 16 and 17 Years | 0 (0.0%) | 5 (31.2%) |
| 18 to 24 Years | 12 (22.6%) | 7 (25.0%) |
| 25 to 34 Years | 5 (19.2%) | 8 (21.6%) |
| 35 to 44 Years | 14 (26.9%) | 6 (13.0%) |
| 45 to 54 Years | 15 (21.4%) | 19 (35.2%) |
| 55 to 64 Years | 6 (21.4%) | 13 (32.5%) |
| 65 to 74 Years | 11 (28.2%) | 7 (20.6%) |
| 75 Years and over | 6 (50.0%) | 29 (49.1%) |
| Total | 92 (24.0%) | 128 (32.9%) |
Income Above Poverty by Sex and Age in Rock Island
According to the poverty statistics in Rock Island, males aged 12 to 14 years and females aged 35 to 44 years are the age groups that are most secure financially, with 100.0% of males and 87.0% of females in these age groups living above the poverty line.
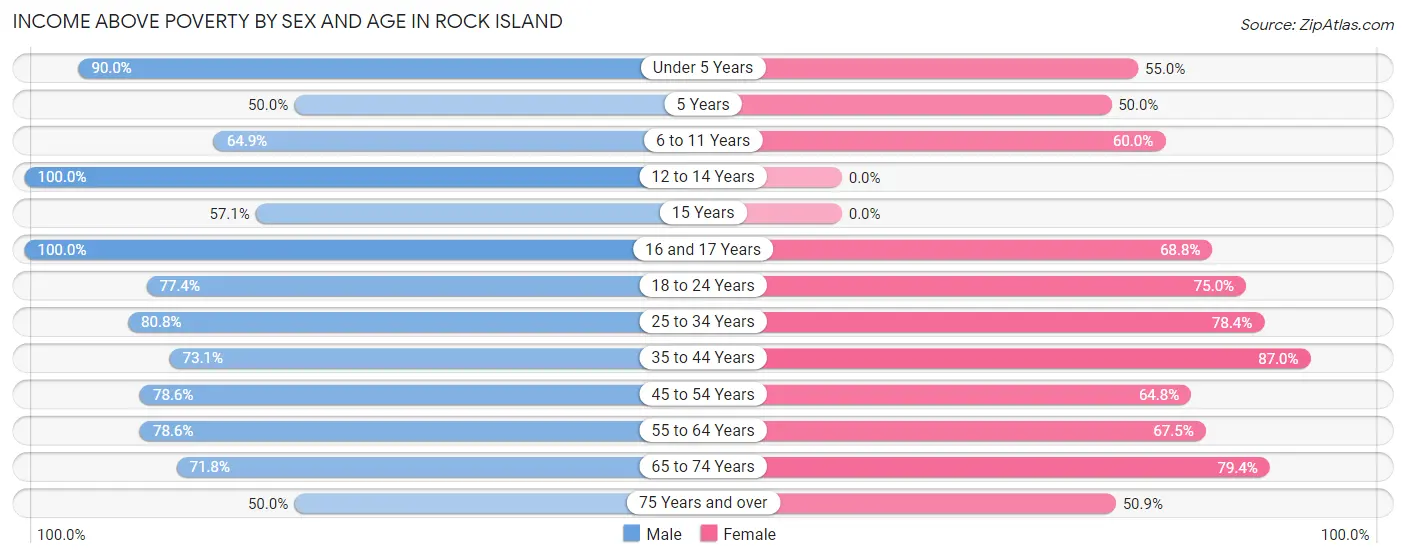
| Age Bracket | Male | Female |
| Under 5 Years | 27 (90.0%) | 11 (55.0%) |
| 5 Years | 4 (50.0%) | 3 (50.0%) |
| 6 to 11 Years | 24 (64.9%) | 27 (60.0%) |
| 12 to 14 Years | 11 (100.0%) | 0 (0.0%) |
| 15 Years | 4 (57.1%) | 0 (0.0%) |
| 16 and 17 Years | 10 (100.0%) | 11 (68.8%) |
| 18 to 24 Years | 41 (77.4%) | 21 (75.0%) |
| 25 to 34 Years | 21 (80.8%) | 29 (78.4%) |
| 35 to 44 Years | 38 (73.1%) | 40 (87.0%) |
| 45 to 54 Years | 55 (78.6%) | 35 (64.8%) |
| 55 to 64 Years | 22 (78.6%) | 27 (67.5%) |
| 65 to 74 Years | 28 (71.8%) | 27 (79.4%) |
| 75 Years and over | 6 (50.0%) | 30 (50.8%) |
| Total | 291 (76.0%) | 261 (67.1%) |
Income Below Poverty Among Married-Couple Families in Rock Island
The poverty statistics for married-couple families in Rock Island show that 19.5% or 29 of the total 149 families live below the poverty line. Families with 5 or more children have the highest poverty rate of 75.0%, comprising of 3 families. On the other hand, families with no children have the lowest poverty rate of 13.2%, which includes 10 families.
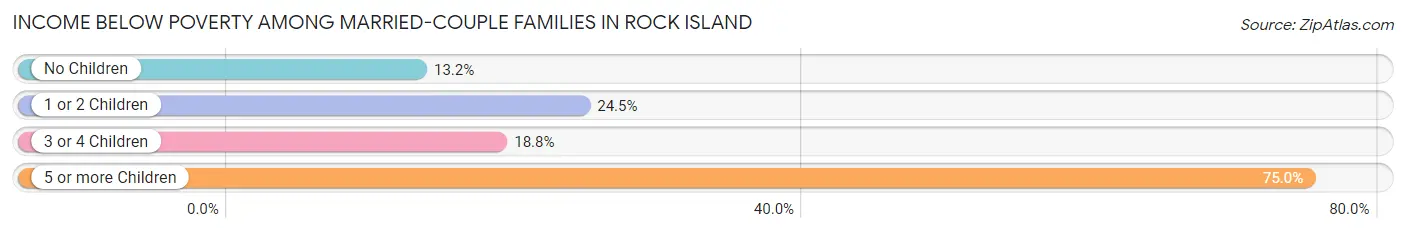
| Children | Above Poverty | Below Poverty |
| No Children | 66 (86.8%) | 10 (13.2%) |
| 1 or 2 Children | 40 (75.5%) | 13 (24.5%) |
| 3 or 4 Children | 13 (81.2%) | 3 (18.8%) |
| 5 or more Children | 1 (25.0%) | 3 (75.0%) |
| Total | 120 (80.5%) | 29 (19.5%) |
Income Below Poverty Among Single-Parent Households in Rock Island
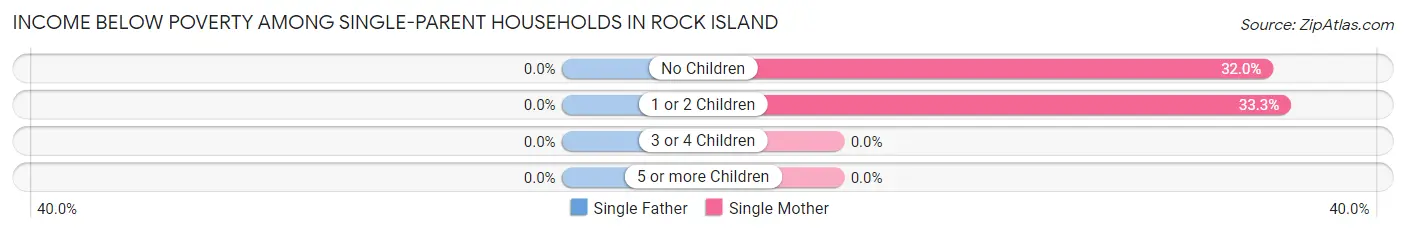
| Children | Single Father | Single Mother |
| No Children | 0 (0.0%) | 8 (32.0%) |
| 1 or 2 Children | 0 (0.0%) | 3 (33.3%) |
| 3 or 4 Children | 0 (0.0%) | 0 (0.0%) |
| 5 or more Children | 0 (0.0%) | 0 (0.0%) |
| Total | 0 (0.0%) | 11 (32.4%) |
Income Below Poverty Among Married-Couple vs Single-Parent Households in Rock Island
The poverty data for Rock Island shows that 29 of the married-couple family households (19.5%) and 11 of the single-parent households (30.6%) are living below the poverty level. Within the married-couple family households, those with 5 or more children have the highest poverty rate, with 3 households (75.0%) falling below the poverty line. Among the single-parent households, those with 1 or 2 children have the highest poverty rate, with 3 household (33.3%) living below poverty.
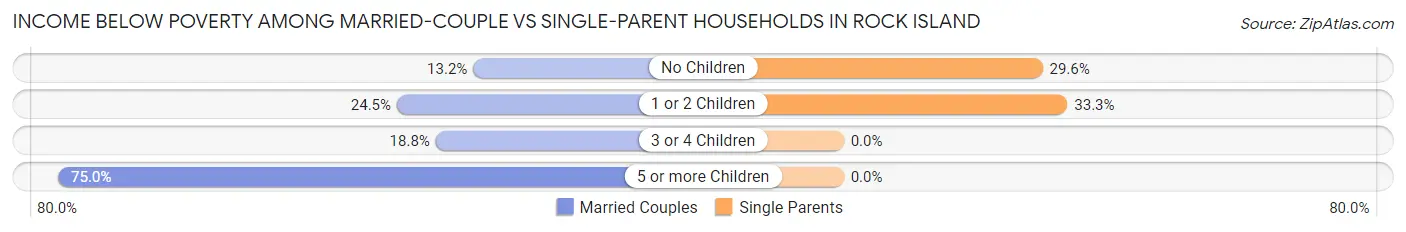
| Children | Married-Couple Families | Single-Parent Households |
| No Children | 10 (13.2%) | 8 (29.6%) |
| 1 or 2 Children | 13 (24.5%) | 3 (33.3%) |
| 3 or 4 Children | 3 (18.8%) | 0 (0.0%) |
| 5 or more Children | 3 (75.0%) | 0 (0.0%) |
| Total | 29 (19.5%) | 11 (30.6%) |
Race in Rock Island
The most populous races in Rock Island are White / Caucasian (663 | 85.9%), Native / Alaskan (81 | 10.5%), and Two or more Races (28 | 3.6%).
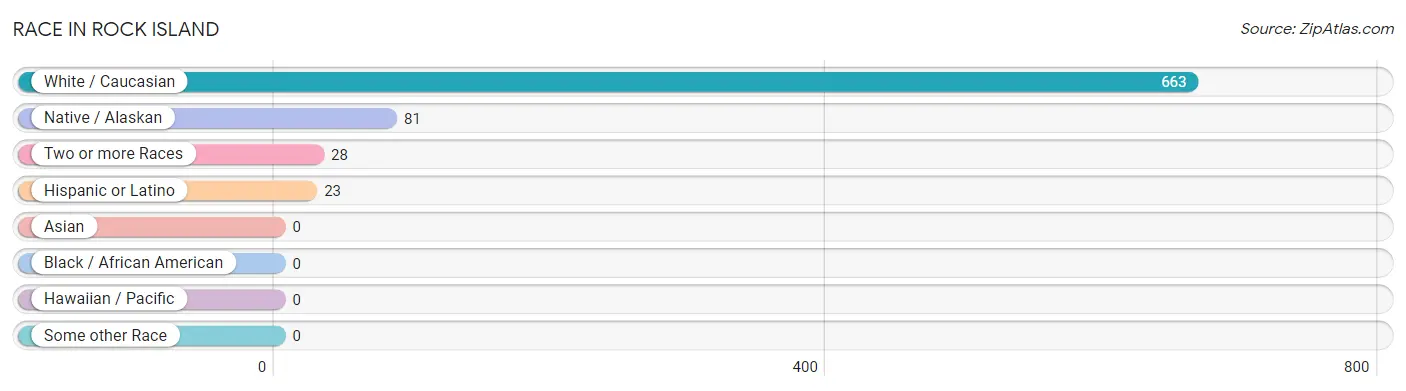
| Race | # Population | % Population |
| Asian | 0 | 0.0% |
| Black / African American | 0 | 0.0% |
| Hawaiian / Pacific | 0 | 0.0% |
| Hispanic or Latino | 23 | 3.0% |
| Native / Alaskan | 81 | 10.5% |
| White / Caucasian | 663 | 85.9% |
| Two or more Races | 28 | 3.6% |
| Some other Race | 0 | 0.0% |
| Total | 772 | 100.0% |
Ancestry in Rock Island
The most populous ancestries reported in Rock Island are Cherokee (70 | 9.1%), American (61 | 7.9%), Irish (51 | 6.6%), Choctaw (39 | 5.1%), and English (39 | 5.1%), together accounting for 33.7% of all Rock Island residents.
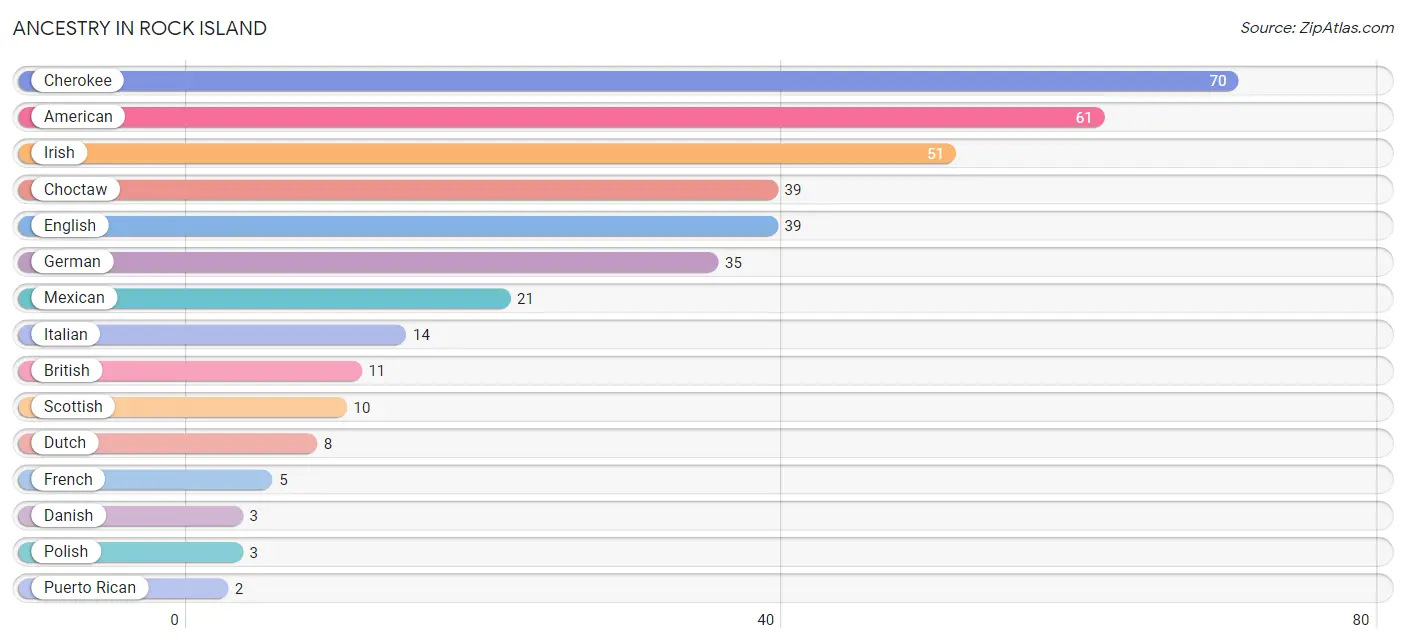
| Ancestry | # Population | % Population |
| American | 61 | 7.9% |
| British | 11 | 1.4% |
| Cherokee | 70 | 9.1% |
| Chickasaw | 1 | 0.1% |
| Choctaw | 39 | 5.1% |
| Danish | 3 | 0.4% |
| Dutch | 8 | 1.0% |
| Dutch West Indian | 1 | 0.1% |
| English | 39 | 5.1% |
| French | 5 | 0.6% |
| German | 35 | 4.5% |
| Irish | 51 | 6.6% |
| Italian | 14 | 1.8% |
| Mexican | 21 | 2.7% |
| Polish | 3 | 0.4% |
| Puerto Rican | 2 | 0.3% |
| Scottish | 10 | 1.3% | View All 17 Rows |
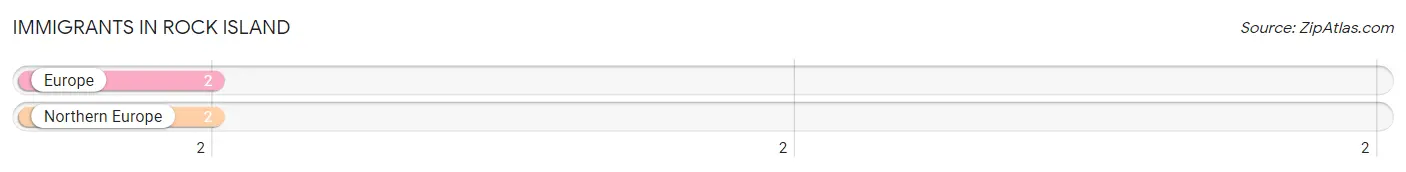
Immigrants in Rock Island
The most numerous immigrant groups reported in Rock Island came from Europe (2 | 0.3%), and Northern Europe (2 | 0.3%), together accounting for 0.5% of all Rock Island residents.
| Immigration Origin | # Population | % Population |
| Europe | 2 | 0.3% |
| Northern Europe | 2 | 0.3% | View All 2 Rows |
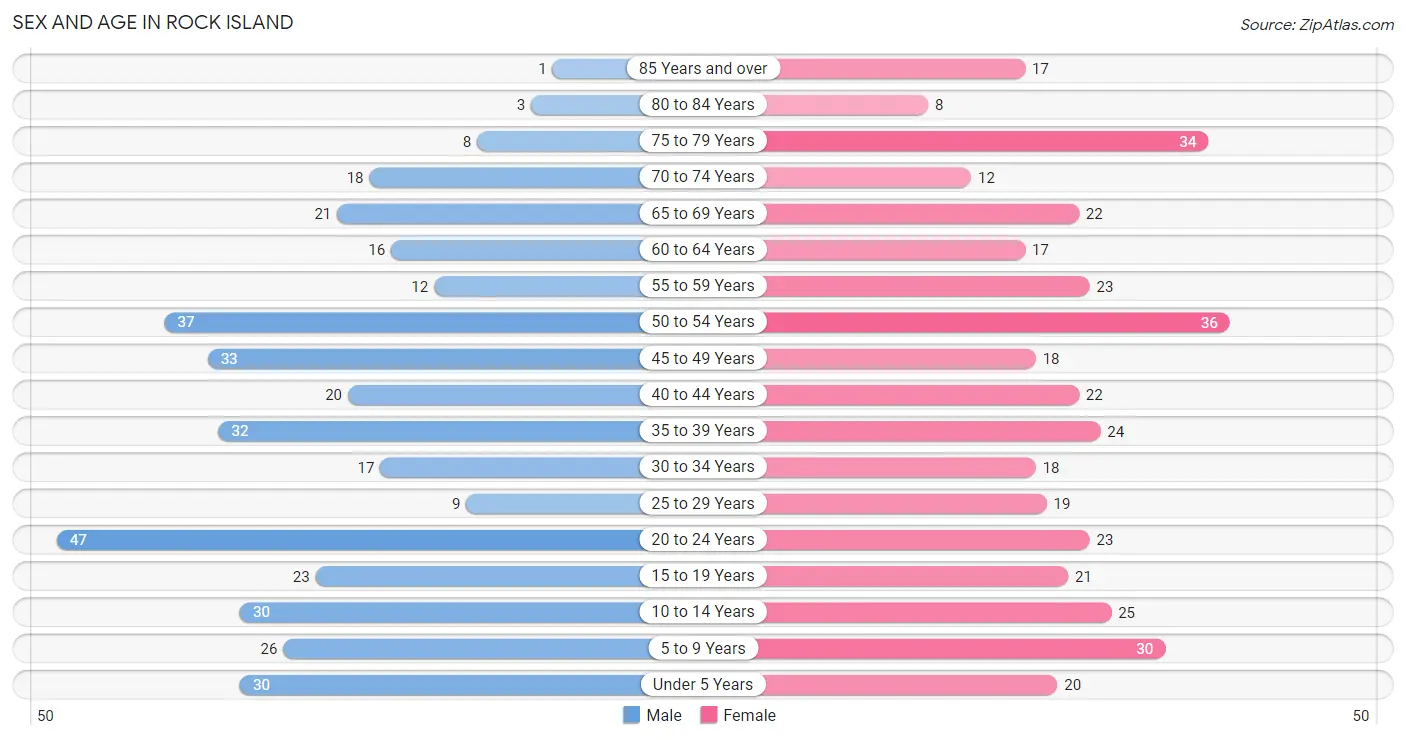
Sex and Age in Rock Island
Sex and Age in Rock Island
The most populous age groups in Rock Island are 20 to 24 Years (47 | 12.3%) for men and 50 to 54 Years (36 | 9.2%) for women.
| Age Bracket | Male | Female |
| Under 5 Years | 30 (7.8%) | 20 (5.1%) |
| 5 to 9 Years | 26 (6.8%) | 30 (7.7%) |
| 10 to 14 Years | 30 (7.8%) | 25 (6.4%) |
| 15 to 19 Years | 23 (6.0%) | 21 (5.4%) |
| 20 to 24 Years | 47 (12.3%) | 23 (5.9%) |
| 25 to 29 Years | 9 (2.4%) | 19 (4.9%) |
| 30 to 34 Years | 17 (4.4%) | 18 (4.6%) |
| 35 to 39 Years | 32 (8.4%) | 24 (6.2%) |
| 40 to 44 Years | 20 (5.2%) | 22 (5.7%) |
| 45 to 49 Years | 33 (8.6%) | 18 (4.6%) |
| 50 to 54 Years | 37 (9.7%) | 36 (9.2%) |
| 55 to 59 Years | 12 (3.1%) | 23 (5.9%) |
| 60 to 64 Years | 16 (4.2%) | 17 (4.4%) |
| 65 to 69 Years | 21 (5.5%) | 22 (5.7%) |
| 70 to 74 Years | 18 (4.7%) | 12 (3.1%) |
| 75 to 79 Years | 8 (2.1%) | 34 (8.7%) |
| 80 to 84 Years | 3 (0.8%) | 8 (2.1%) |
| 85 Years and over | 1 (0.3%) | 17 (4.4%) |
| Total | 383 (100.0%) | 389 (100.0%) |
Families and Households in Rock Island
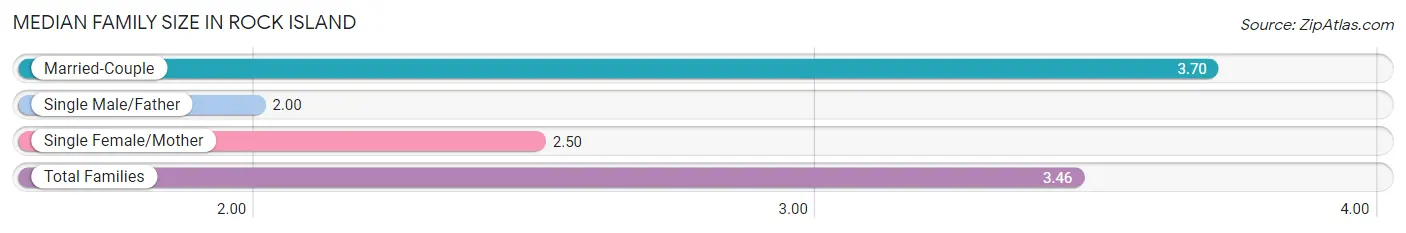
Median Family Size in Rock Island
The median family size in Rock Island is 3.46 persons per family, with married-couple families (149 | 80.5%) accounting for the largest median family size of 3.7 persons per family. On the other hand, single male/father families (2 | 1.1%) represent the smallest median family size with 2.00 persons per family.
| Family Type | # Families | Family Size |
| Married-Couple | 149 (80.5%) | 3.70 |
| Single Male/Father | 2 (1.1%) | 2.00 |
| Single Female/Mother | 34 (18.4%) | 2.50 |
| Total Families | 185 (100.0%) | 3.46 |
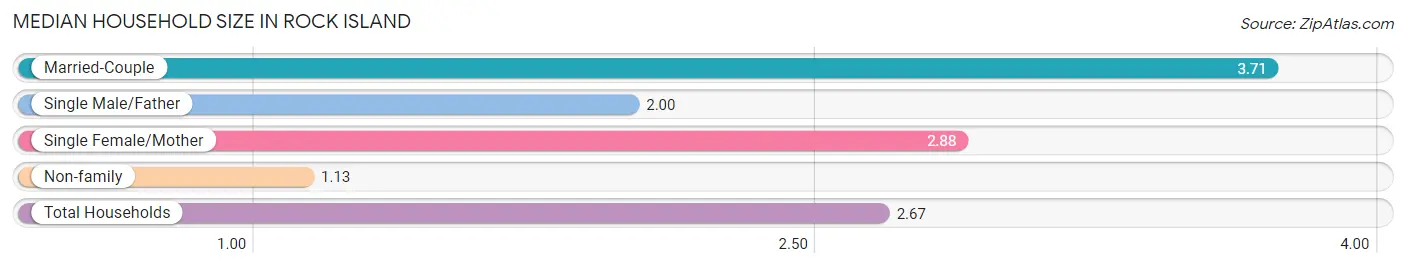
Median Household Size in Rock Island
The median household size in Rock Island is 2.67 persons per household, with married-couple households (149 | 51.6%) accounting for the largest median household size of 3.71 persons per household. non-family households (104 | 36.0%) represent the smallest median household size with 1.13 persons per household.
| Household Type | # Households | Household Size |
| Married-Couple | 149 (51.6%) | 3.71 |
| Single Male/Father | 2 (0.7%) | 2.00 |
| Single Female/Mother | 34 (11.8%) | 2.88 |
| Non-family | 104 (36.0%) | 1.13 |
| Total Households | 289 (100.0%) | 2.67 |
Household Size by Marriage Status in Rock Island
Out of a total of 289 households in Rock Island, 185 (64.0%) are family households, while 104 (36.0%) are nonfamily households. The most numerous type of family households are 2-person households, comprising 91, and the most common type of nonfamily households are 1-person households, comprising 93.
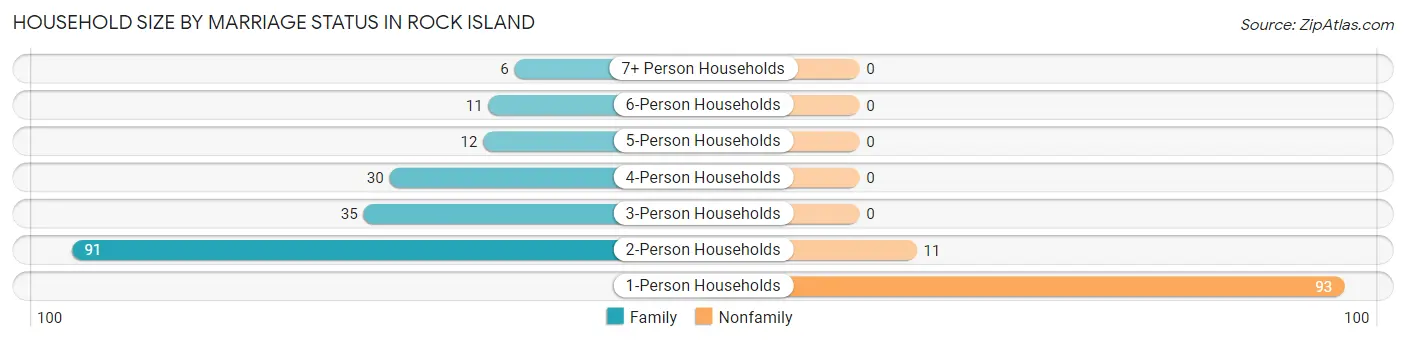
| Household Size | Family Households | Nonfamily Households |
| 1-Person Households | - | 93 (32.2%) |
| 2-Person Households | 91 (31.5%) | 11 (3.8%) |
| 3-Person Households | 35 (12.1%) | 0 (0.0%) |
| 4-Person Households | 30 (10.4%) | 0 (0.0%) |
| 5-Person Households | 12 (4.2%) | 0 (0.0%) |
| 6-Person Households | 11 (3.8%) | 0 (0.0%) |
| 7+ Person Households | 6 (2.1%) | 0 (0.0%) |
| Total | 185 (64.0%) | 104 (36.0%) |
Female Fertility in Rock Island
Fertility by Age in Rock Island
Average fertility rate in Rock Island is 38.0 births per 1,000 women. Women in the age bracket of 20 to 34 years have the highest fertility rate with 100.0 births per 1,000 women. Women in the age bracket of 20 to 34 years acount for 100.0% of all women with births.
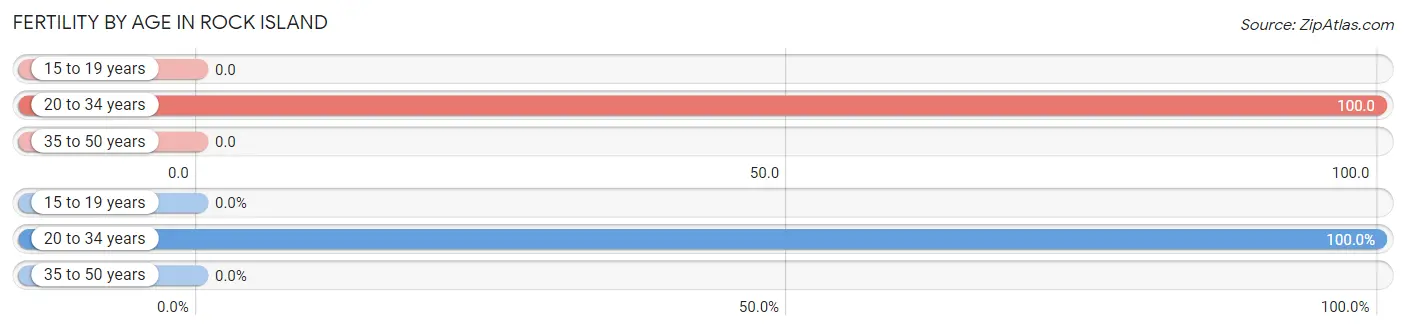
| Age Bracket | Women with Births | Births / 1,000 Women |
| 15 to 19 years | 0 (0.0%) | 0.0 |
| 20 to 34 years | 6 (100.0%) | 100.0 |
| 35 to 50 years | 0 (0.0%) | 0.0 |
| Total | 6 (100.0%) | 38.0 |
Fertility by Age by Marriage Status in Rock Island
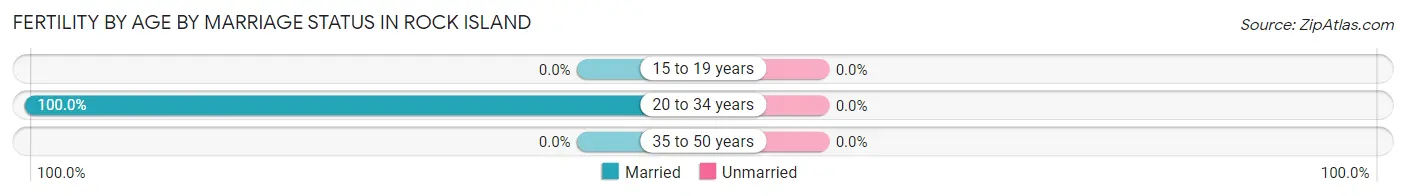
| Age Bracket | Married | Unmarried |
| 15 to 19 years | 0 (0.0%) | 0 (0.0%) |
| 20 to 34 years | 6 (100.0%) | 0 (0.0%) |
| 35 to 50 years | 0 (0.0%) | 0 (0.0%) |
| Total | 6 (100.0%) | 0 (0.0%) |
Fertility by Education in Rock Island
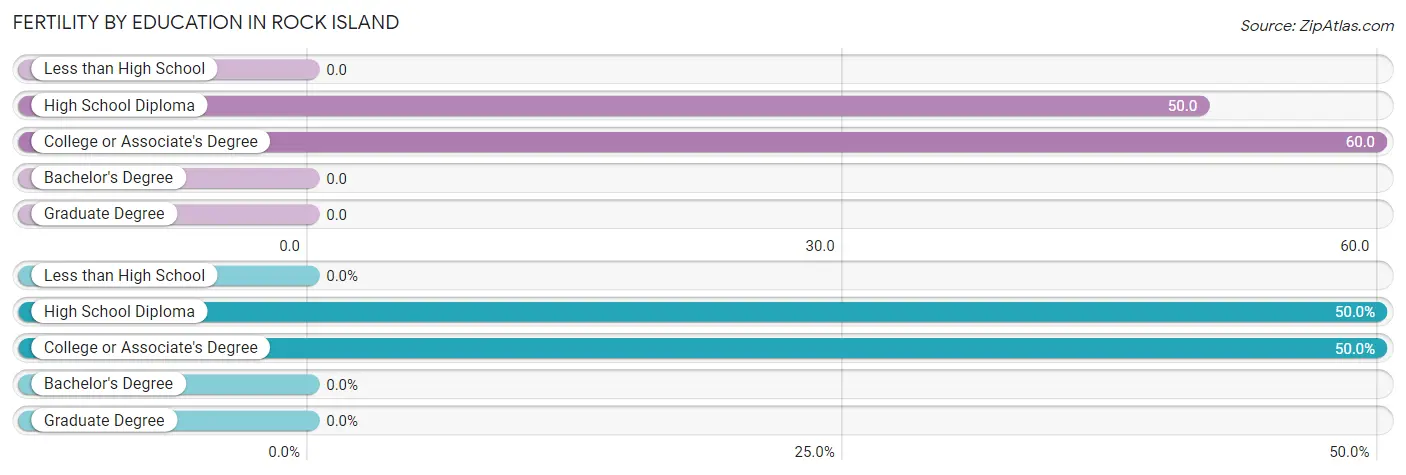
| Educational Attainment | Women with Births | Births / 1,000 Women |
| Less than High School | 0 (0.0%) | 0.0 |
| High School Diploma | 3 (50.0%) | 50.0 |
| College or Associate's Degree | 3 (50.0%) | 60.0 |
| Bachelor's Degree | 0 (0.0%) | 0.0 |
| Graduate Degree | 0 (0.0%) | 0.0 |
| Total | 6 (100.0%) | 38.0 |
Fertility by Education by Marriage Status in Rock Island
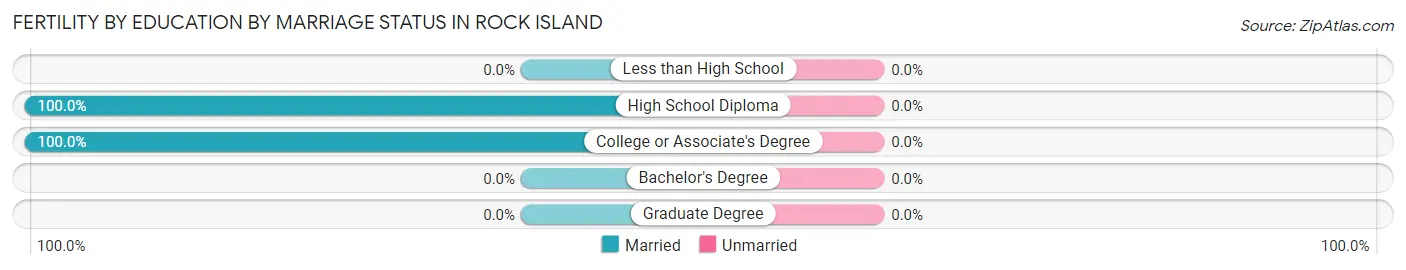
| Educational Attainment | Married | Unmarried |
| Less than High School | 0 (0.0%) | 0 (0.0%) |
| High School Diploma | 3 (100.0%) | 0 (0.0%) |
| College or Associate's Degree | 3 (100.0%) | 0 (0.0%) |
| Bachelor's Degree | 0 (0.0%) | 0 (0.0%) |
| Graduate Degree | 0 (0.0%) | 0 (0.0%) |
| Total | 6 (100.0%) | 0 (0.0%) |
Employment Characteristics in Rock Island
Employment by Class of Employer in Rock Island
Among the 262 employed individuals in Rock Island, private company employees (197 | 75.2%), self-employed (not incorporated) (24 | 9.2%), and local government employees (13 | 5.0%) make up the most common classes of employment.
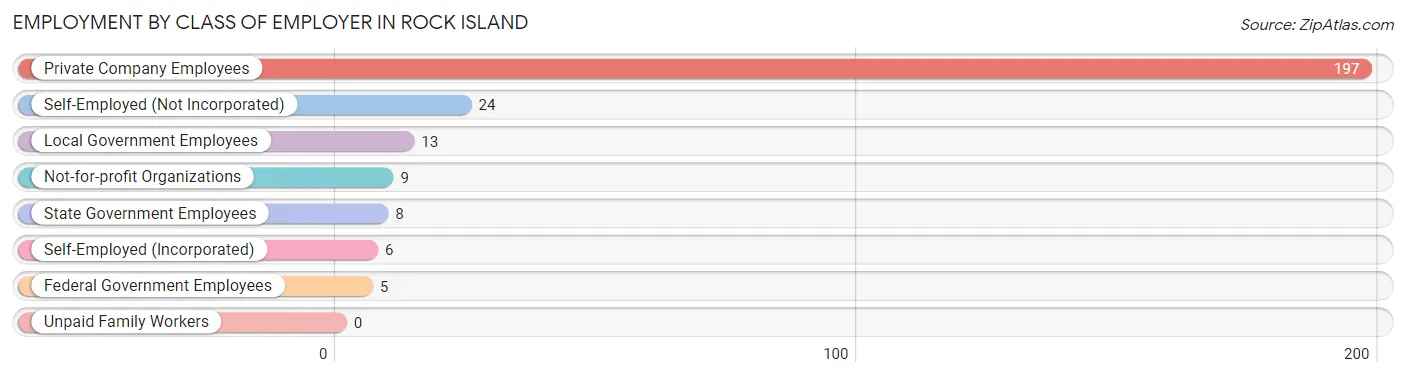
| Employer Class | # Employees | % Employees |
| Private Company Employees | 197 | 75.2% |
| Self-Employed (Incorporated) | 6 | 2.3% |
| Self-Employed (Not Incorporated) | 24 | 9.2% |
| Not-for-profit Organizations | 9 | 3.4% |
| Local Government Employees | 13 | 5.0% |
| State Government Employees | 8 | 3.0% |
| Federal Government Employees | 5 | 1.9% |
| Unpaid Family Workers | 0 | 0.0% |
| Total | 262 | 100.0% |
Employment Status by Age in Rock Island
According to the labor force statistics for Rock Island, out of the total population over 16 years of age (604), 46.4% or 280 individuals are in the labor force, with 6.4% or 18 of them unemployed. The age group with the highest labor force participation rate is 30 to 34 years, with 97.1% or 34 individuals in the labor force. Within the labor force, the 20 to 24 years age range has the highest percentage of unemployed individuals, with 25.6% or 11 of them being unemployed.
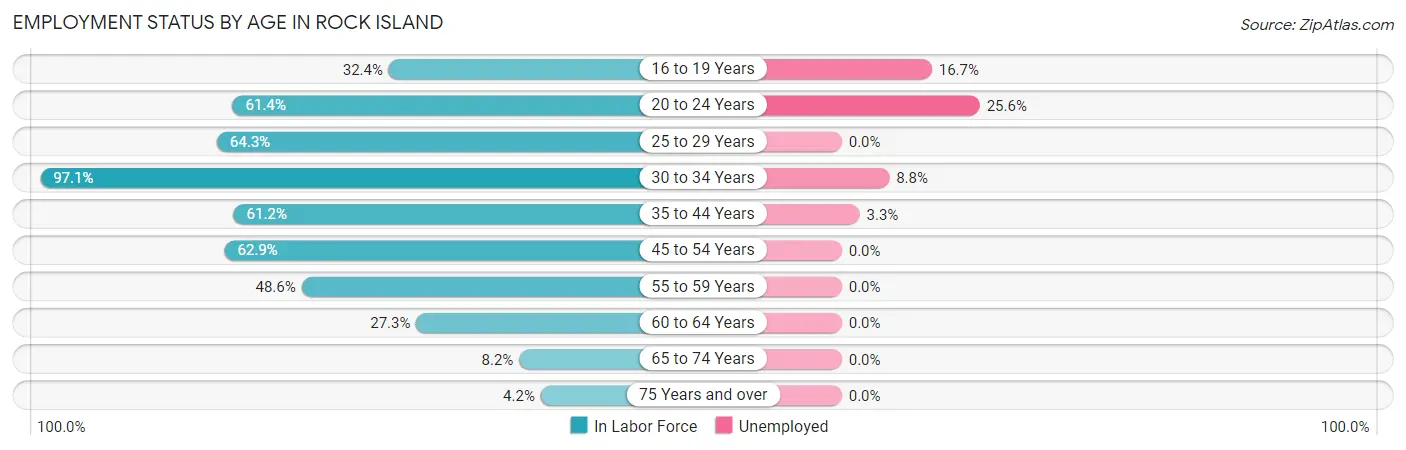
| Age Bracket | In Labor Force | Unemployed |
| 16 to 19 Years | 12 (32.4%) | 2 (16.7%) |
| 20 to 24 Years | 43 (61.4%) | 11 (25.6%) |
| 25 to 29 Years | 18 (64.3%) | 0 (0.0%) |
| 30 to 34 Years | 34 (97.1%) | 3 (8.8%) |
| 35 to 44 Years | 60 (61.2%) | 2 (3.3%) |
| 45 to 54 Years | 78 (62.9%) | 0 (0.0%) |
| 55 to 59 Years | 17 (48.6%) | 0 (0.0%) |
| 60 to 64 Years | 9 (27.3%) | 0 (0.0%) |
| 65 to 74 Years | 6 (8.2%) | 0 (0.0%) |
| 75 Years and over | 3 (4.2%) | 0 (0.0%) |
| Total | 280 (46.4%) | 18 (6.4%) |
Employment Status by Educational Attainment in Rock Island
According to labor force statistics for Rock Island, 61.2% of individuals (216) out of the total population between 25 and 64 years of age (353) are in the labor force, with 2.3% or 5 of them being unemployed. The group with the highest labor force participation rate are those with the educational attainment of bachelor's degree or higher, with 85.1% or 40 individuals in the labor force. Within the labor force, individuals with high school diploma education have the highest percentage of unemployment, with 5.4% or 5 of them being unemployed.
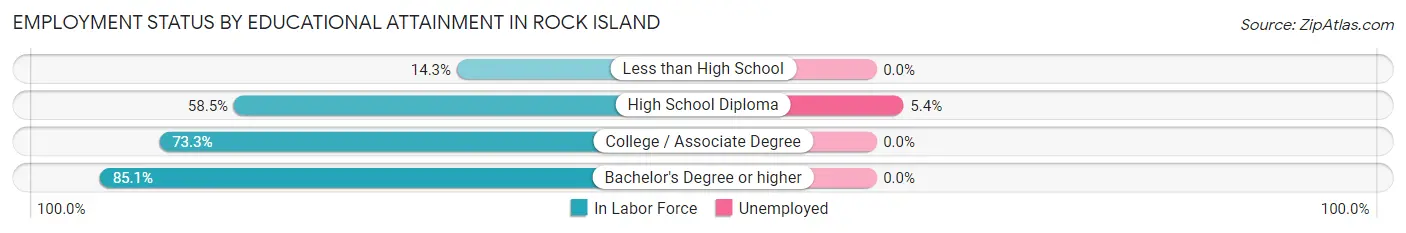
| Educational Attainment | In Labor Force | Unemployed |
| Less than High School | 6 (14.3%) | 0 (0.0%) |
| High School Diploma | 93 (58.5%) | 9 (5.4%) |
| College / Associate Degree | 77 (73.3%) | 0 (0.0%) |
| Bachelor's Degree or higher | 40 (85.1%) | 0 (0.0%) |
| Total | 216 (61.2%) | 8 (2.3%) |
Employment Occupations by Sex in Rock Island
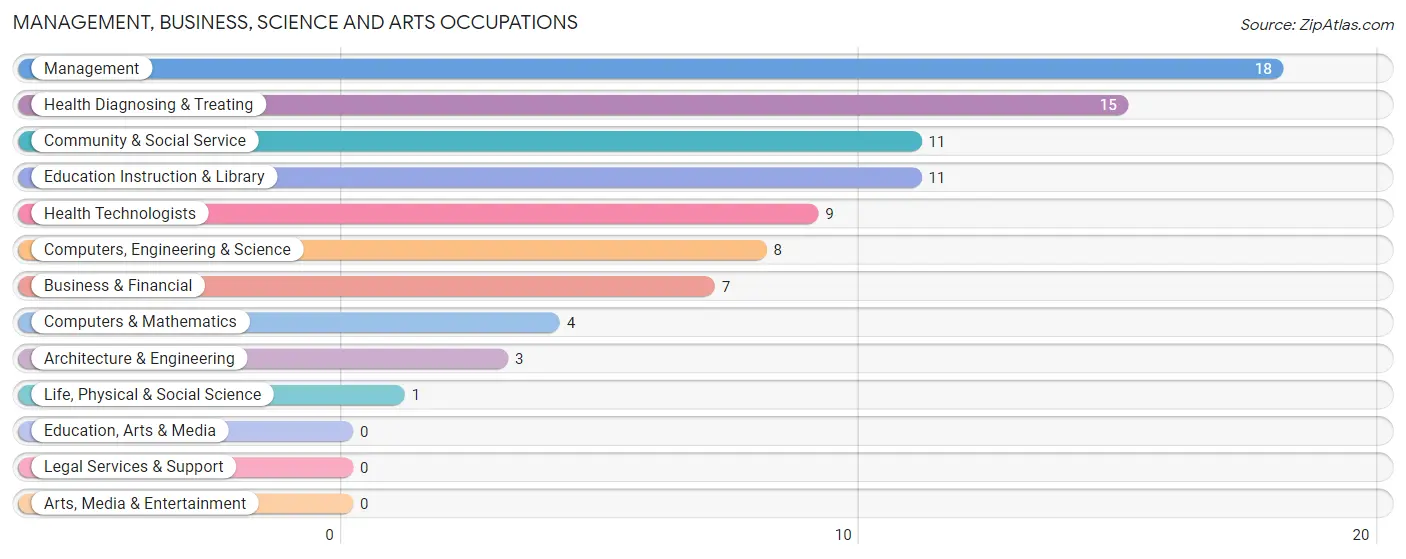
Management, Business, Science and Arts Occupations
The most common Management, Business, Science and Arts occupations in Rock Island are Management (18 | 6.9%), Health Diagnosing & Treating (15 | 5.7%), Community & Social Service (11 | 4.2%), Education Instruction & Library (11 | 4.2%), and Health Technologists (9 | 3.4%).
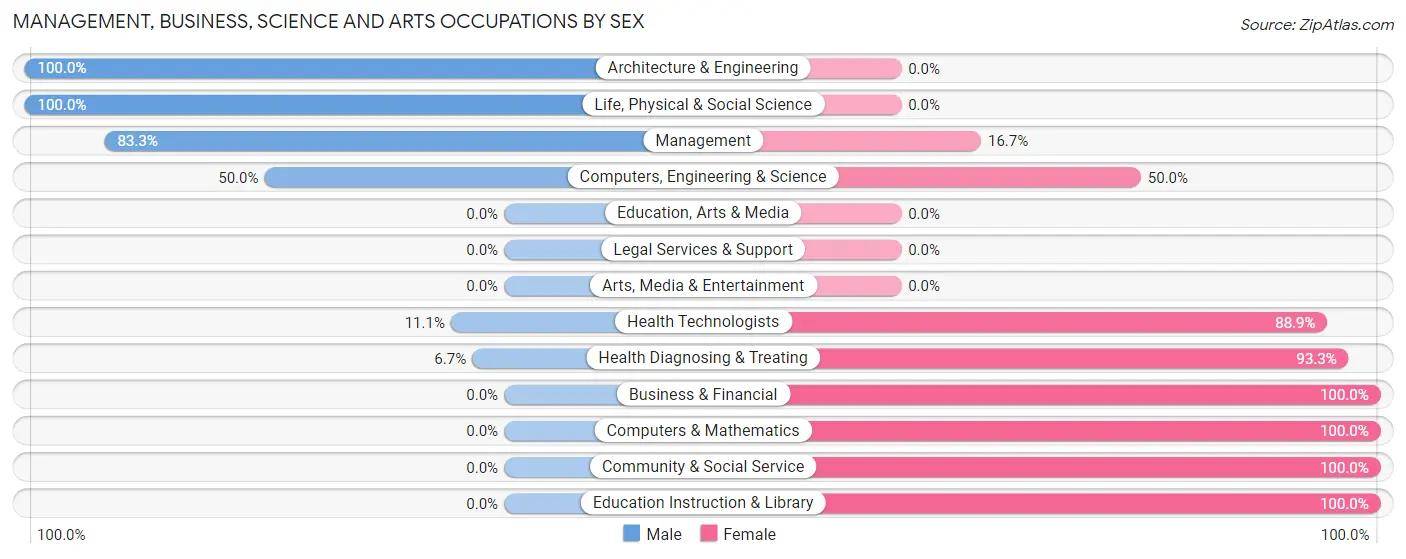
Management, Business, Science and Arts Occupations by Sex
Within the Management, Business, Science and Arts occupations in Rock Island, the most male-oriented occupations are Architecture & Engineering (100.0%), Life, Physical & Social Science (100.0%), and Management (83.3%), while the most female-oriented occupations are Business & Financial (100.0%), Computers & Mathematics (100.0%), and Community & Social Service (100.0%).
| Occupation | Male | Female |
| Management | 15 (83.3%) | 3 (16.7%) |
| Business & Financial | 0 (0.0%) | 7 (100.0%) |
| Computers, Engineering & Science | 4 (50.0%) | 4 (50.0%) |
| Computers & Mathematics | 0 (0.0%) | 4 (100.0%) |
| Architecture & Engineering | 3 (100.0%) | 0 (0.0%) |
| Life, Physical & Social Science | 1 (100.0%) | 0 (0.0%) |
| Community & Social Service | 0 (0.0%) | 11 (100.0%) |
| Education, Arts & Media | 0 (0.0%) | 0 (0.0%) |
| Legal Services & Support | 0 (0.0%) | 0 (0.0%) |
| Education Instruction & Library | 0 (0.0%) | 11 (100.0%) |
| Arts, Media & Entertainment | 0 (0.0%) | 0 (0.0%) |
| Health Diagnosing & Treating | 1 (6.7%) | 14 (93.3%) |
| Health Technologists | 1 (11.1%) | 8 (88.9%) |
| Total (Category) | 20 (33.9%) | 39 (66.1%) |
| Total (Overall) | 165 (63.0%) | 97 (37.0%) |
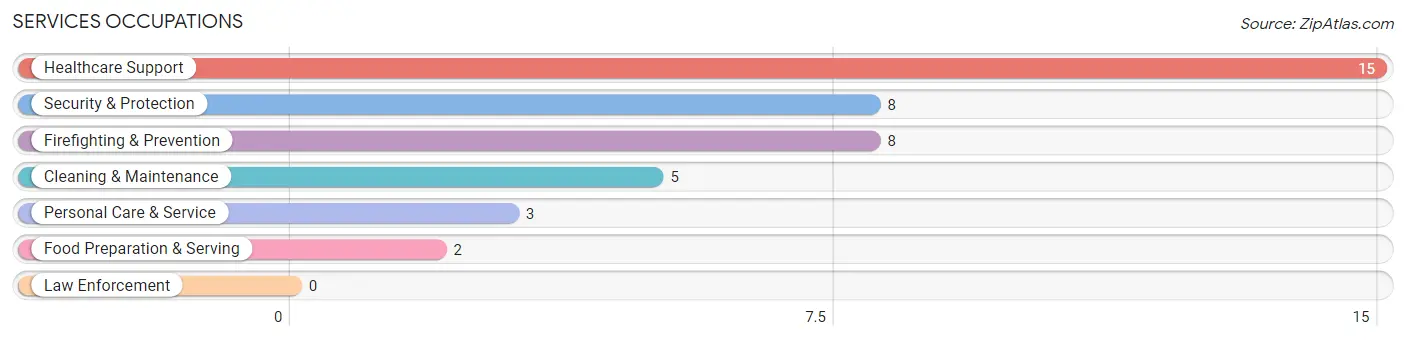
Services Occupations
The most common Services occupations in Rock Island are Healthcare Support (15 | 5.7%), Security & Protection (8 | 3.0%), Firefighting & Prevention (8 | 3.0%), Cleaning & Maintenance (5 | 1.9%), and Personal Care & Service (3 | 1.1%).
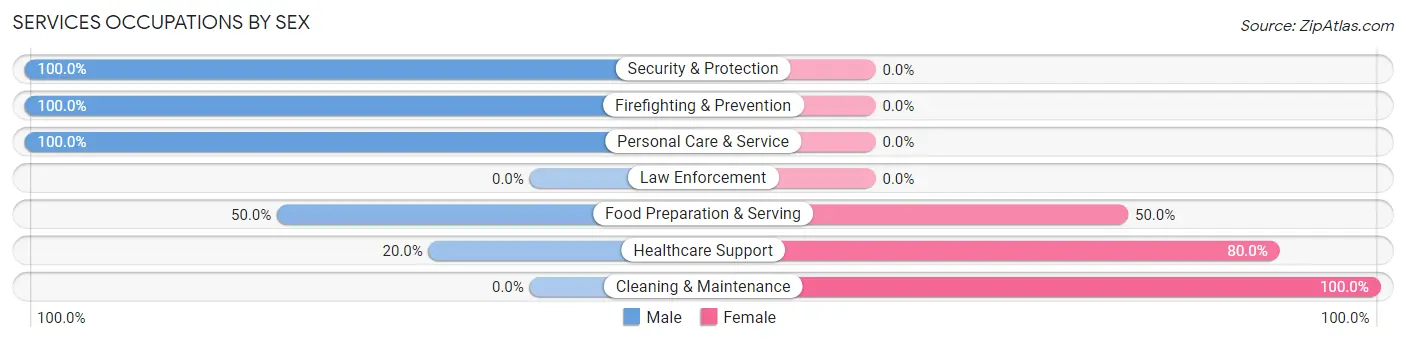
Services Occupations by Sex
Within the Services occupations in Rock Island, the most male-oriented occupations are Security & Protection (100.0%), Firefighting & Prevention (100.0%), and Personal Care & Service (100.0%), while the most female-oriented occupations are Cleaning & Maintenance (100.0%), Healthcare Support (80.0%), and Food Preparation & Serving (50.0%).
| Occupation | Male | Female |
| Healthcare Support | 3 (20.0%) | 12 (80.0%) |
| Security & Protection | 8 (100.0%) | 0 (0.0%) |
| Firefighting & Prevention | 8 (100.0%) | 0 (0.0%) |
| Law Enforcement | 0 (0.0%) | 0 (0.0%) |
| Food Preparation & Serving | 1 (50.0%) | 1 (50.0%) |
| Cleaning & Maintenance | 0 (0.0%) | 5 (100.0%) |
| Personal Care & Service | 3 (100.0%) | 0 (0.0%) |
| Total (Category) | 15 (45.5%) | 18 (54.5%) |
| Total (Overall) | 165 (63.0%) | 97 (37.0%) |
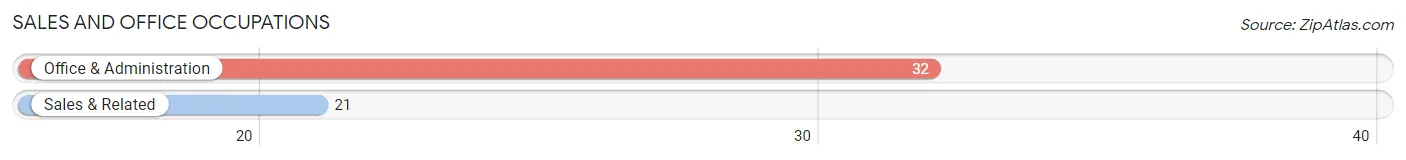
Sales and Office Occupations
The most common Sales and Office occupations in Rock Island are Office & Administration (32 | 12.2%), and Sales & Related (21 | 8.0%).
Sales and Office Occupations by Sex
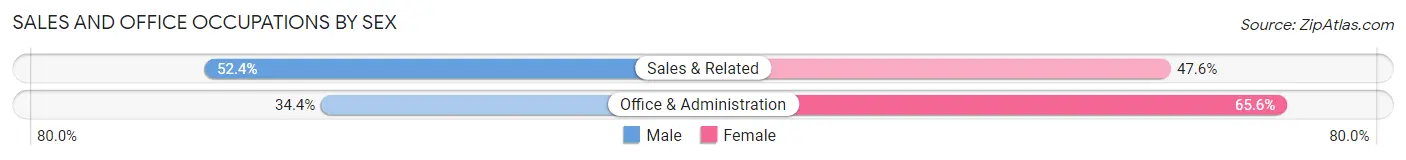
| Occupation | Male | Female |
| Sales & Related | 11 (52.4%) | 10 (47.6%) |
| Office & Administration | 11 (34.4%) | 21 (65.6%) |
| Total (Category) | 22 (41.5%) | 31 (58.5%) |
| Total (Overall) | 165 (63.0%) | 97 (37.0%) |
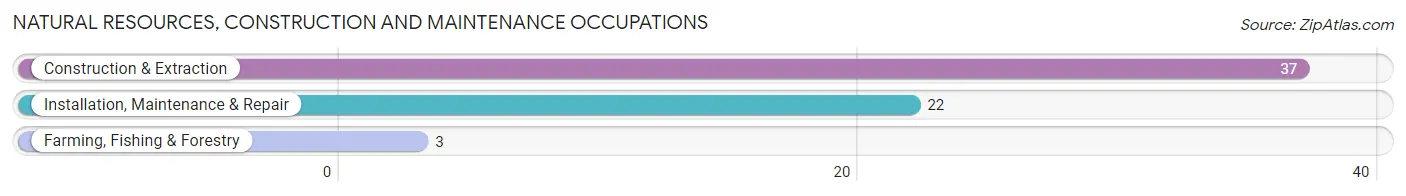
Natural Resources, Construction and Maintenance Occupations
The most common Natural Resources, Construction and Maintenance occupations in Rock Island are Construction & Extraction (37 | 14.1%), Installation, Maintenance & Repair (22 | 8.4%), and Farming, Fishing & Forestry (3 | 1.1%).
Natural Resources, Construction and Maintenance Occupations by Sex
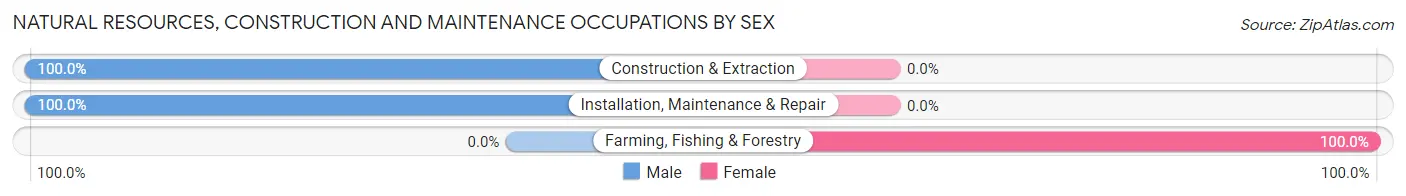
| Occupation | Male | Female |
| Farming, Fishing & Forestry | 0 (0.0%) | 3 (100.0%) |
| Construction & Extraction | 37 (100.0%) | 0 (0.0%) |
| Installation, Maintenance & Repair | 22 (100.0%) | 0 (0.0%) |
| Total (Category) | 59 (95.2%) | 3 (4.8%) |
| Total (Overall) | 165 (63.0%) | 97 (37.0%) |
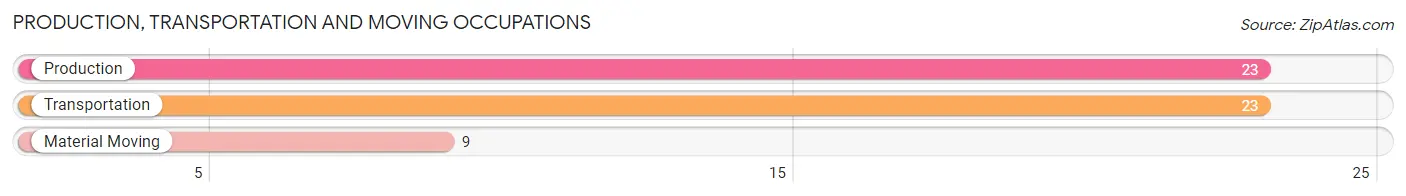
Production, Transportation and Moving Occupations
The most common Production, Transportation and Moving occupations in Rock Island are Production (23 | 8.8%), Transportation (23 | 8.8%), and Material Moving (9 | 3.4%).
Production, Transportation and Moving Occupations by Sex
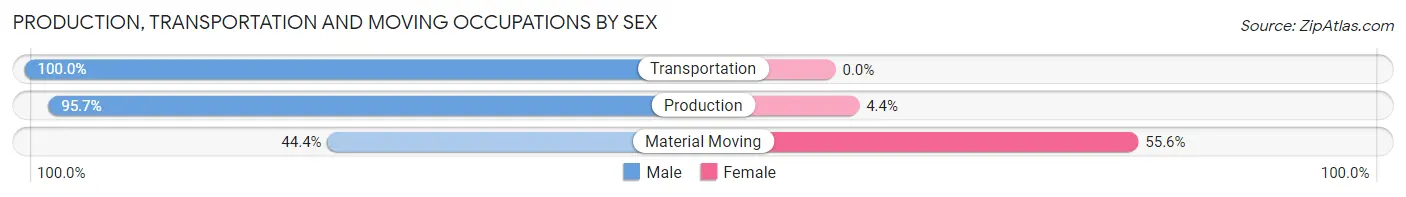
| Occupation | Male | Female |
| Production | 22 (95.7%) | 1 (4.3%) |
| Transportation | 23 (100.0%) | 0 (0.0%) |
| Material Moving | 4 (44.4%) | 5 (55.6%) |
| Total (Category) | 49 (89.1%) | 6 (10.9%) |
| Total (Overall) | 165 (63.0%) | 97 (37.0%) |
Employment Industries by Sex in Rock Island
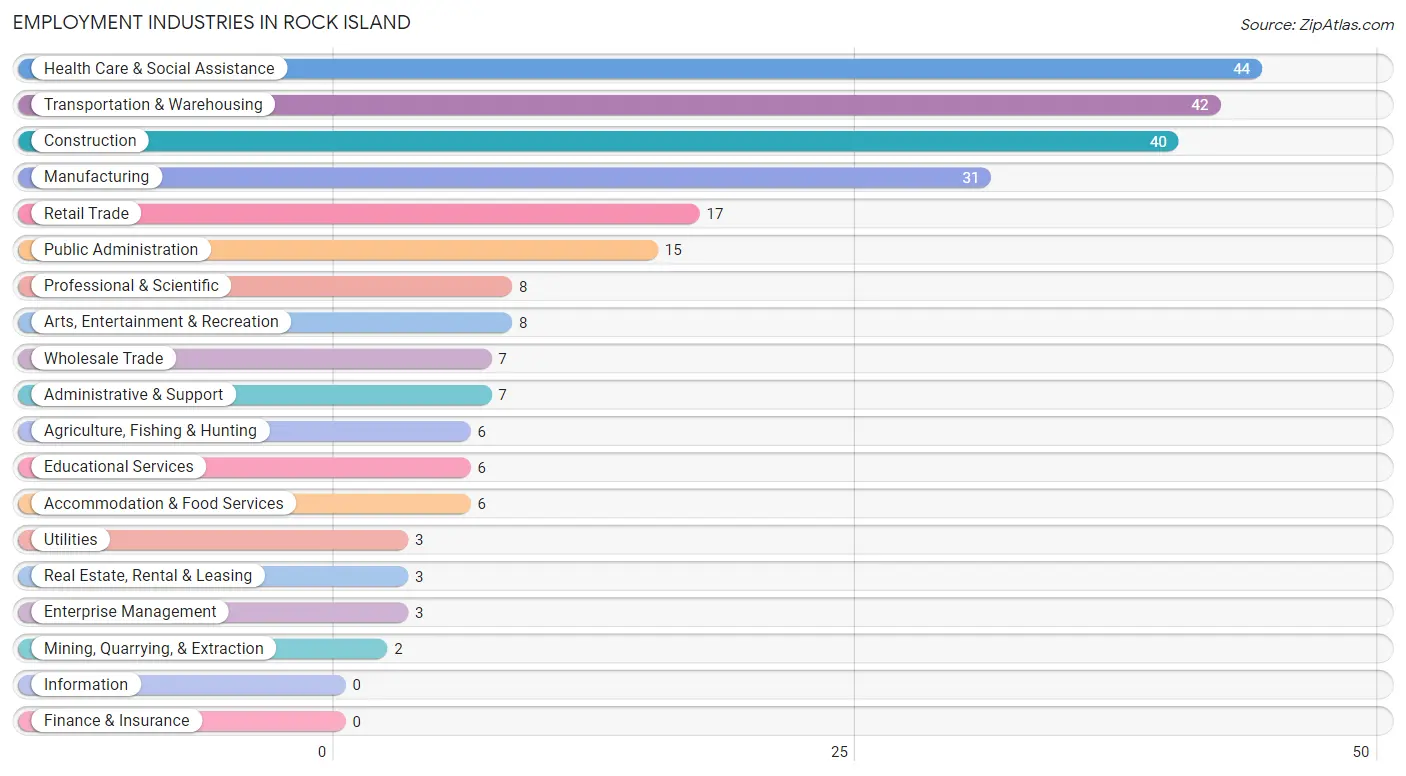
Employment Industries in Rock Island
The major employment industries in Rock Island include Health Care & Social Assistance (44 | 16.8%), Transportation & Warehousing (42 | 16.0%), Construction (40 | 15.3%), Manufacturing (31 | 11.8%), and Retail Trade (17 | 6.5%).
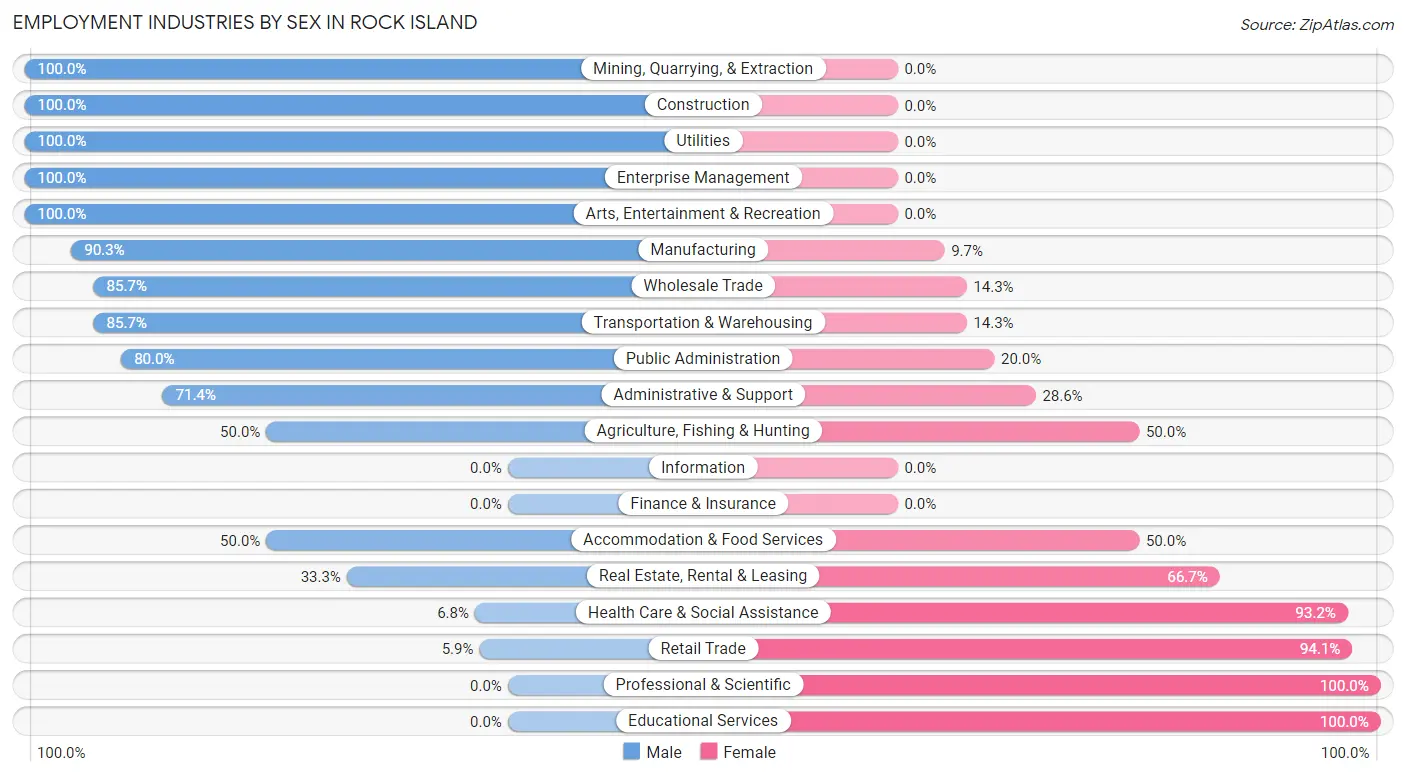
Employment Industries by Sex in Rock Island
The Rock Island industries that see more men than women are Mining, Quarrying, & Extraction (100.0%), Construction (100.0%), and Utilities (100.0%), whereas the industries that tend to have a higher number of women are Professional & Scientific (100.0%), Educational Services (100.0%), and Retail Trade (94.1%).
| Industry | Male | Female |
| Agriculture, Fishing & Hunting | 3 (50.0%) | 3 (50.0%) |
| Mining, Quarrying, & Extraction | 2 (100.0%) | 0 (0.0%) |
| Construction | 40 (100.0%) | 0 (0.0%) |
| Manufacturing | 28 (90.3%) | 3 (9.7%) |
| Wholesale Trade | 6 (85.7%) | 1 (14.3%) |
| Retail Trade | 1 (5.9%) | 16 (94.1%) |
| Transportation & Warehousing | 36 (85.7%) | 6 (14.3%) |
| Utilities | 3 (100.0%) | 0 (0.0%) |
| Information | 0 (0.0%) | 0 (0.0%) |
| Finance & Insurance | 0 (0.0%) | 0 (0.0%) |
| Real Estate, Rental & Leasing | 1 (33.3%) | 2 (66.7%) |
| Professional & Scientific | 0 (0.0%) | 8 (100.0%) |
| Enterprise Management | 3 (100.0%) | 0 (0.0%) |
| Administrative & Support | 5 (71.4%) | 2 (28.6%) |
| Educational Services | 0 (0.0%) | 6 (100.0%) |
| Health Care & Social Assistance | 3 (6.8%) | 41 (93.2%) |
| Arts, Entertainment & Recreation | 8 (100.0%) | 0 (0.0%) |
| Accommodation & Food Services | 3 (50.0%) | 3 (50.0%) |
| Public Administration | 12 (80.0%) | 3 (20.0%) |
| Total | 165 (63.0%) | 97 (37.0%) |
Education in Rock Island
School Enrollment in Rock Island
The most common levels of schooling among the 174 students in Rock Island are middle school (45 | 25.9%), elementary school (41 | 23.6%), and high school (40 | 23.0%).
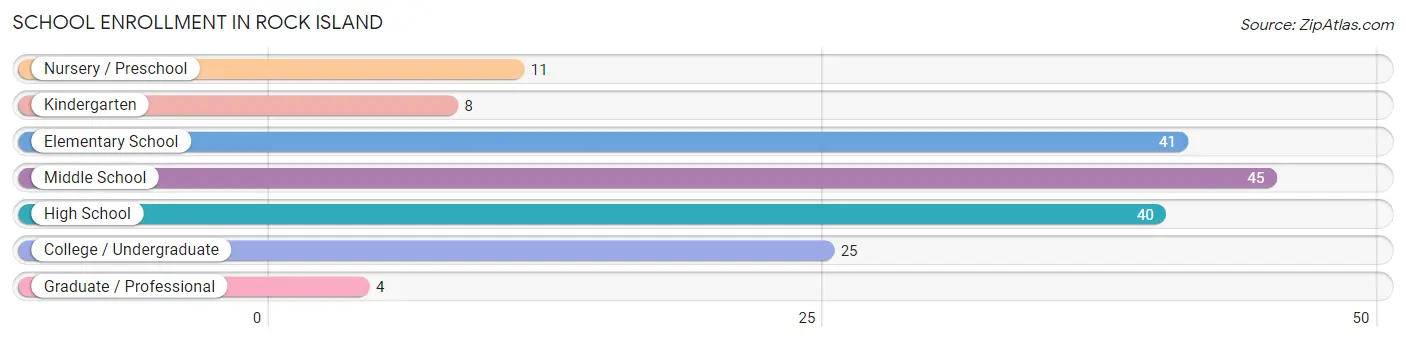
| School Level | # Students | % Students |
| Nursery / Preschool | 11 | 6.3% |
| Kindergarten | 8 | 4.6% |
| Elementary School | 41 | 23.6% |
| Middle School | 45 | 25.9% |
| High School | 40 | 23.0% |
| College / Undergraduate | 25 | 14.4% |
| Graduate / Professional | 4 | 2.3% |
| Total | 174 | 100.0% |
School Enrollment by Age by Funding Source in Rock Island
Out of a total of 174 students who are enrolled in schools in Rock Island, 27 (15.5%) attend a private institution, while the remaining 147 (84.5%) are enrolled in public schools. The age group of 3 to 4 year olds has the highest likelihood of being enrolled in private schools, with 2 (50.0% in the age bracket) enrolled. Conversely, the age group of 15 to 17 year olds has the lowest likelihood of being enrolled in a private school, with 33 (100.0% in the age bracket) attending a public institution.
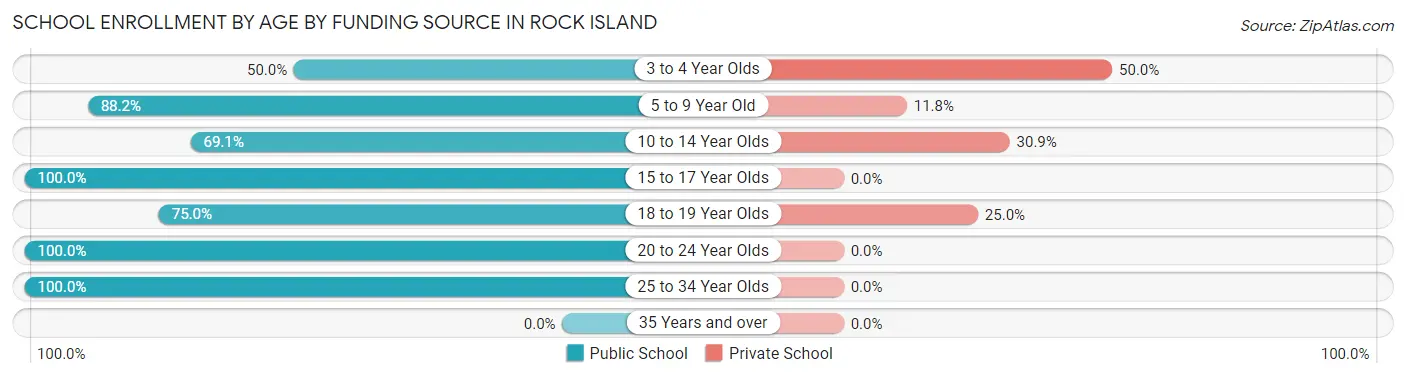
| Age Bracket | Public School | Private School |
| 3 to 4 Year Olds | 2 (50.0%) | 2 (50.0%) |
| 5 to 9 Year Old | 45 (88.2%) | 6 (11.8%) |
| 10 to 14 Year Olds | 38 (69.1%) | 17 (30.9%) |
| 15 to 17 Year Olds | 33 (100.0%) | 0 (0.0%) |
| 18 to 19 Year Olds | 6 (75.0%) | 2 (25.0%) |
| 20 to 24 Year Olds | 16 (100.0%) | 0 (0.0%) |
| 25 to 34 Year Olds | 7 (100.0%) | 0 (0.0%) |
| 35 Years and over | 0 (0.0%) | 0 (0.0%) |
| Total | 147 (84.5%) | 27 (15.5%) |
Educational Attainment by Field of Study in Rock Island
Education (17 | 28.3%), business (14 | 23.3%), science & technology (8 | 13.3%), bio, nature & agricultural (4 | 6.7%), and communications (4 | 6.7%) are the most common fields of study among 60 individuals in Rock Island who have obtained a bachelor's degree or higher.
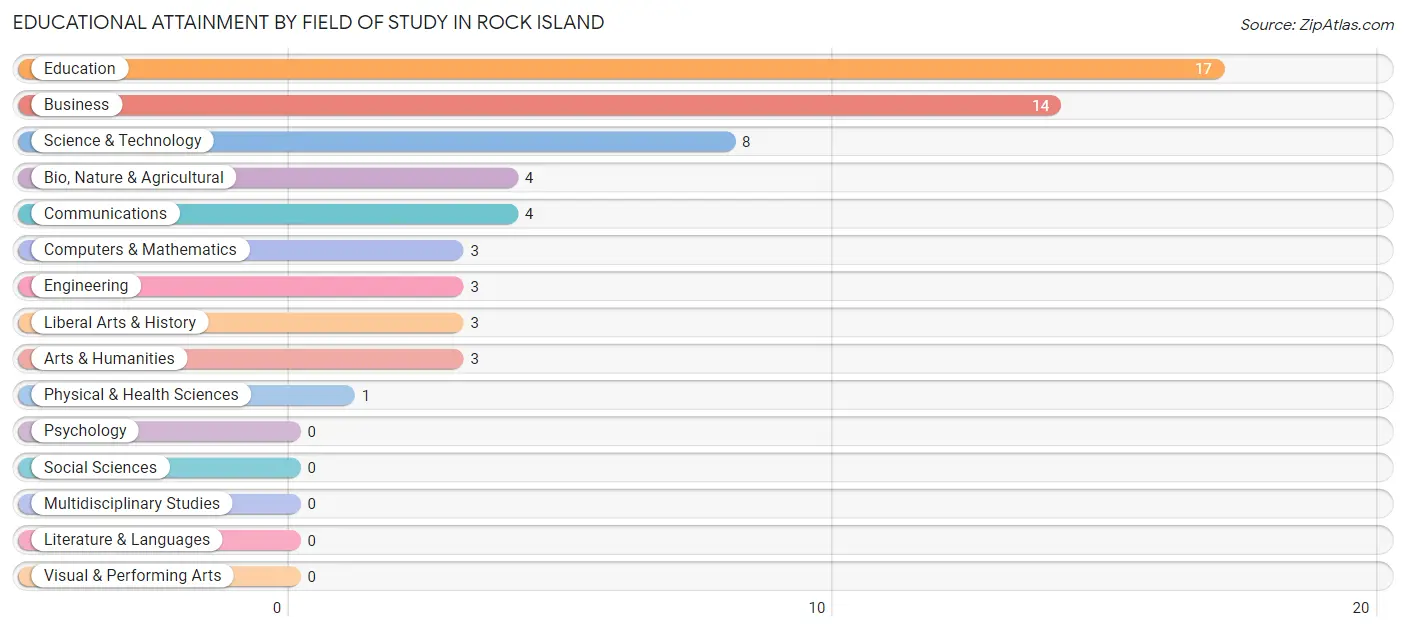
| Field of Study | # Graduates | % Graduates |
| Computers & Mathematics | 3 | 5.0% |
| Bio, Nature & Agricultural | 4 | 6.7% |
| Physical & Health Sciences | 1 | 1.7% |
| Psychology | 0 | 0.0% |
| Social Sciences | 0 | 0.0% |
| Engineering | 3 | 5.0% |
| Multidisciplinary Studies | 0 | 0.0% |
| Science & Technology | 8 | 13.3% |
| Business | 14 | 23.3% |
| Education | 17 | 28.3% |
| Literature & Languages | 0 | 0.0% |
| Liberal Arts & History | 3 | 5.0% |
| Visual & Performing Arts | 0 | 0.0% |
| Communications | 4 | 6.7% |
| Arts & Humanities | 3 | 5.0% |
| Total | 60 | 100.0% |
Transportation & Commute in Rock Island
Vehicle Availability by Sex in Rock Island
The most prevalent vehicle ownership categories in Rock Island are males with 2 vehicles (80, accounting for 48.5%) and females with 2 vehicles (34, making up 82.5%).
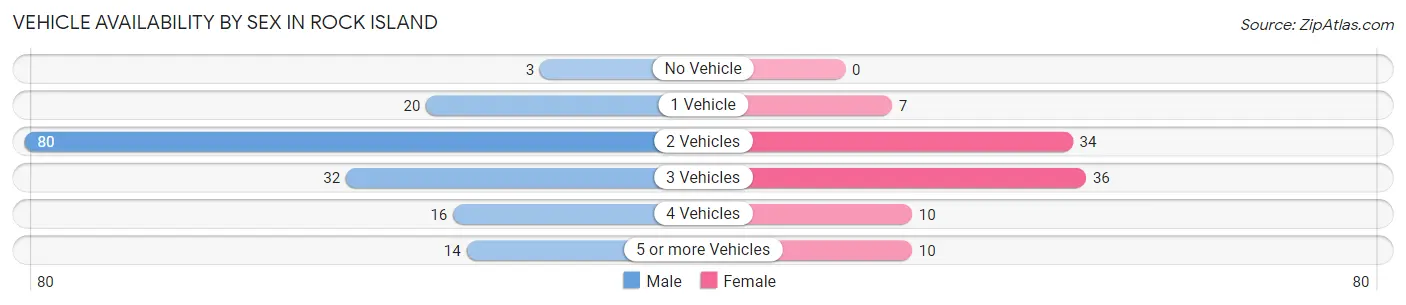
| Vehicles Available | Male | Female |
| No Vehicle | 3 (1.8%) | 0 (0.0%) |
| 1 Vehicle | 20 (12.1%) | 7 (7.2%) |
| 2 Vehicles | 80 (48.5%) | 34 (35.0%) |
| 3 Vehicles | 32 (19.4%) | 36 (37.1%) |
| 4 Vehicles | 16 (9.7%) | 10 (10.3%) |
| 5 or more Vehicles | 14 (8.5%) | 10 (10.3%) |
| Total | 165 (100.0%) | 97 (100.0%) |
Commute Time in Rock Island
The most frequently occuring commute durations in Rock Island are 20 to 24 minutes (68 commuters, 27.5%), 30 to 34 minutes (45 commuters, 18.2%), and 15 to 19 minutes (38 commuters, 15.4%).
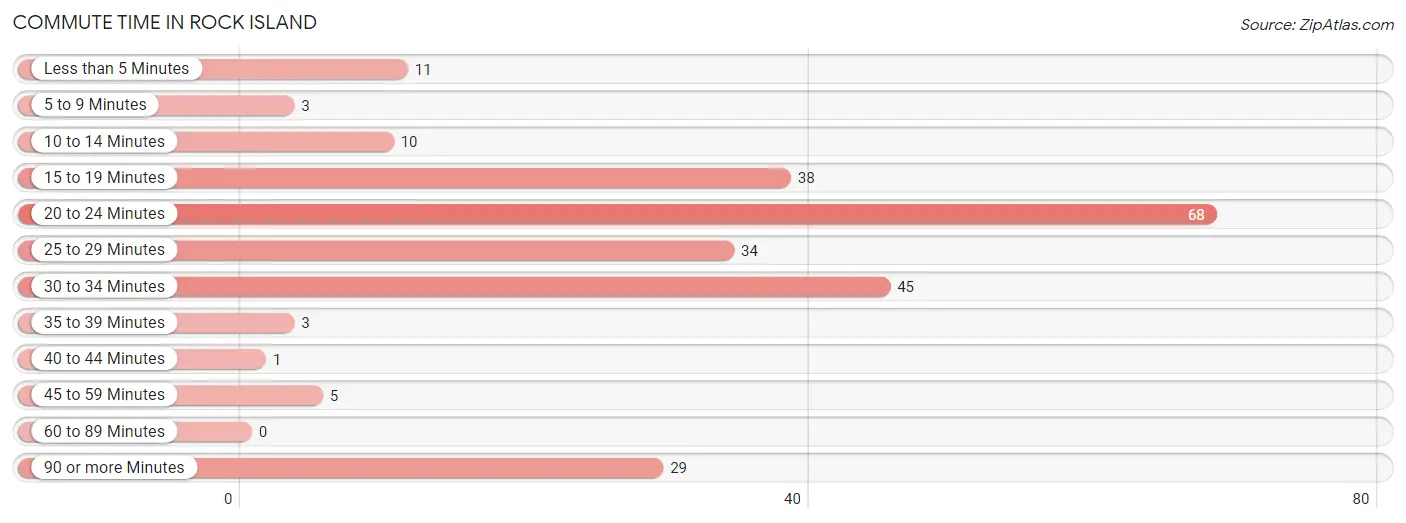
| Commute Time | # Commuters | % Commuters |
| Less than 5 Minutes | 11 | 4.4% |
| 5 to 9 Minutes | 3 | 1.2% |
| 10 to 14 Minutes | 10 | 4.1% |
| 15 to 19 Minutes | 38 | 15.4% |
| 20 to 24 Minutes | 68 | 27.5% |
| 25 to 29 Minutes | 34 | 13.8% |
| 30 to 34 Minutes | 45 | 18.2% |
| 35 to 39 Minutes | 3 | 1.2% |
| 40 to 44 Minutes | 1 | 0.4% |
| 45 to 59 Minutes | 5 | 2.0% |
| 60 to 89 Minutes | 0 | 0.0% |
| 90 or more Minutes | 29 | 11.7% |
Commute Time by Sex in Rock Island
The most common commute times in Rock Island are 20 to 24 minutes (42 commuters, 27.1%) for males and 20 to 24 minutes (26 commuters, 28.3%) for females.
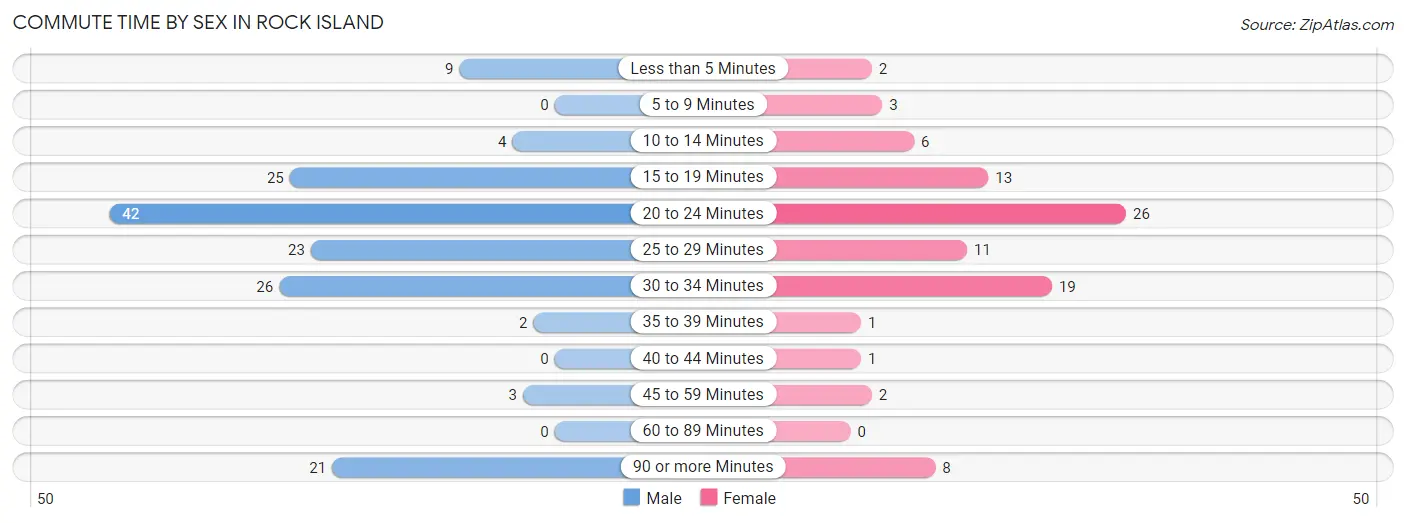
| Commute Time | Male | Female |
| Less than 5 Minutes | 9 (5.8%) | 2 (2.2%) |
| 5 to 9 Minutes | 0 (0.0%) | 3 (3.3%) |
| 10 to 14 Minutes | 4 (2.6%) | 6 (6.5%) |
| 15 to 19 Minutes | 25 (16.1%) | 13 (14.1%) |
| 20 to 24 Minutes | 42 (27.1%) | 26 (28.3%) |
| 25 to 29 Minutes | 23 (14.8%) | 11 (12.0%) |
| 30 to 34 Minutes | 26 (16.8%) | 19 (20.6%) |
| 35 to 39 Minutes | 2 (1.3%) | 1 (1.1%) |
| 40 to 44 Minutes | 0 (0.0%) | 1 (1.1%) |
| 45 to 59 Minutes | 3 (1.9%) | 2 (2.2%) |
| 60 to 89 Minutes | 0 (0.0%) | 0 (0.0%) |
| 90 or more Minutes | 21 (13.6%) | 8 (8.7%) |
Time of Departure to Work by Sex in Rock Island
The most frequent times of departure to work in Rock Island are 7:00 AM to 7:29 AM (35, 22.6%) for males and 7:00 AM to 7:29 AM (28, 30.4%) for females.
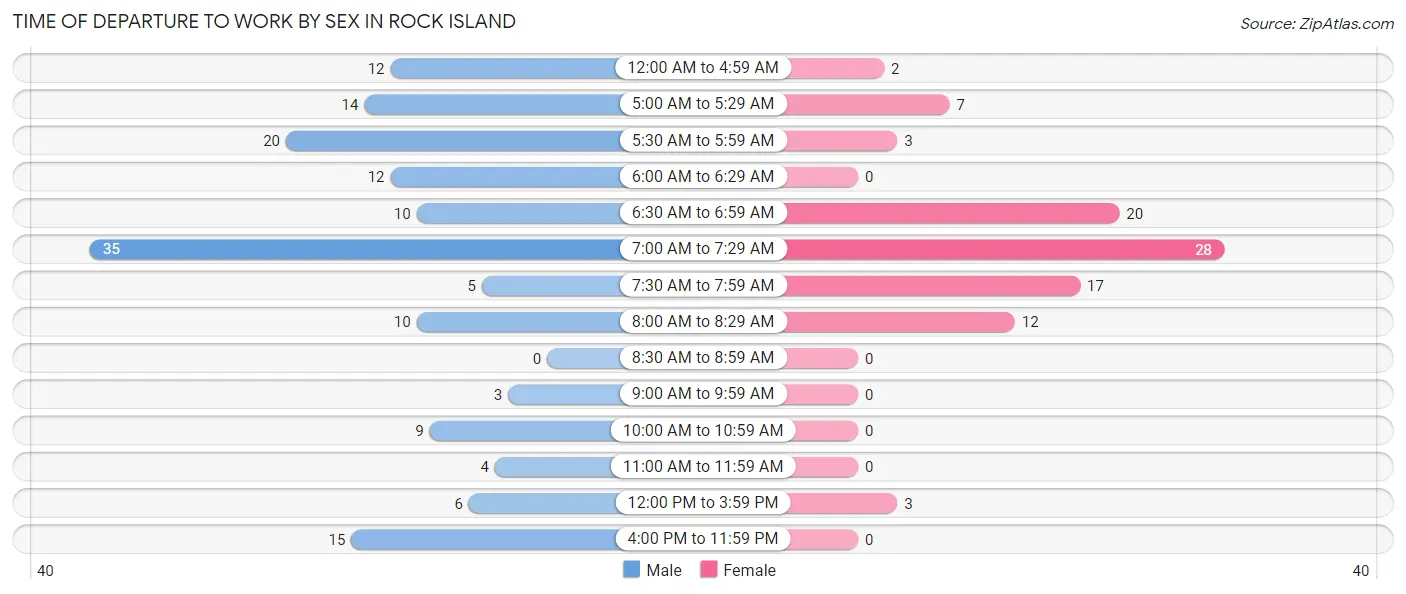
| Time of Departure | Male | Female |
| 12:00 AM to 4:59 AM | 12 (7.7%) | 2 (2.2%) |
| 5:00 AM to 5:29 AM | 14 (9.0%) | 7 (7.6%) |
| 5:30 AM to 5:59 AM | 20 (12.9%) | 3 (3.3%) |
| 6:00 AM to 6:29 AM | 12 (7.7%) | 0 (0.0%) |
| 6:30 AM to 6:59 AM | 10 (6.5%) | 20 (21.7%) |
| 7:00 AM to 7:29 AM | 35 (22.6%) | 28 (30.4%) |
| 7:30 AM to 7:59 AM | 5 (3.2%) | 17 (18.5%) |
| 8:00 AM to 8:29 AM | 10 (6.5%) | 12 (13.0%) |
| 8:30 AM to 8:59 AM | 0 (0.0%) | 0 (0.0%) |
| 9:00 AM to 9:59 AM | 3 (1.9%) | 0 (0.0%) |
| 10:00 AM to 10:59 AM | 9 (5.8%) | 0 (0.0%) |
| 11:00 AM to 11:59 AM | 4 (2.6%) | 0 (0.0%) |
| 12:00 PM to 3:59 PM | 6 (3.9%) | 3 (3.3%) |
| 4:00 PM to 11:59 PM | 15 (9.7%) | 0 (0.0%) |
| Total | 155 (100.0%) | 92 (100.0%) |
Housing Occupancy in Rock Island
Occupancy by Ownership in Rock Island
Of the total 289 dwellings in Rock Island, owner-occupied units account for 215 (74.4%), while renter-occupied units make up 74 (25.6%).
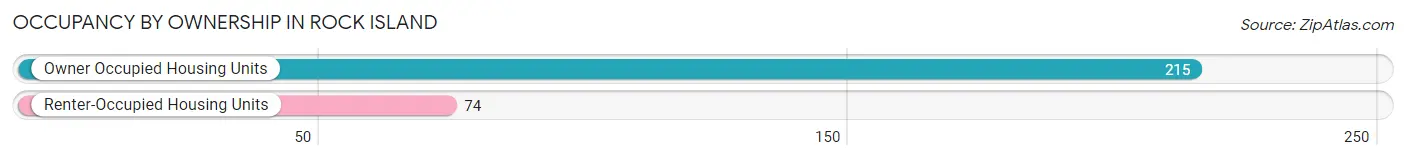
| Occupancy | # Housing Units | % Housing Units |
| Owner Occupied Housing Units | 215 | 74.4% |
| Renter-Occupied Housing Units | 74 | 25.6% |
| Total Occupied Housing Units | 289 | 100.0% |
Occupancy by Household Size in Rock Island
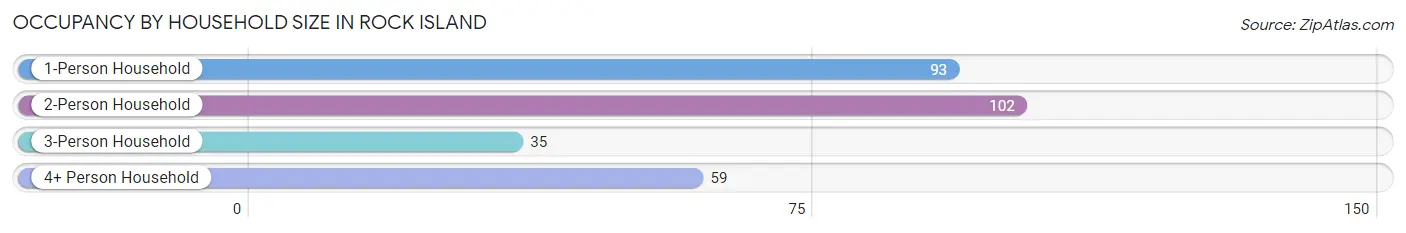
| Household Size | # Housing Units | % Housing Units |
| 1-Person Household | 93 | 32.2% |
| 2-Person Household | 102 | 35.3% |
| 3-Person Household | 35 | 12.1% |
| 4+ Person Household | 59 | 20.4% |
| Total Housing Units | 289 | 100.0% |
Occupancy by Ownership by Household Size in Rock Island
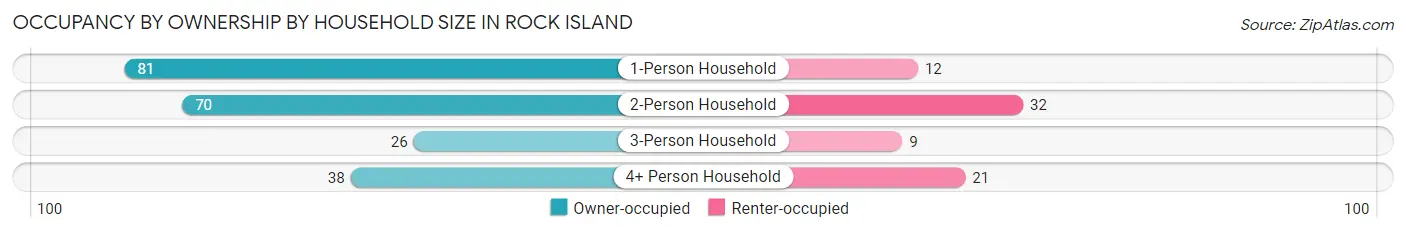
| Household Size | Owner-occupied | Renter-occupied |
| 1-Person Household | 81 (87.1%) | 12 (12.9%) |
| 2-Person Household | 70 (68.6%) | 32 (31.4%) |
| 3-Person Household | 26 (74.3%) | 9 (25.7%) |
| 4+ Person Household | 38 (64.4%) | 21 (35.6%) |
| Total Housing Units | 215 (74.4%) | 74 (25.6%) |
Occupancy by Educational Attainment in Rock Island
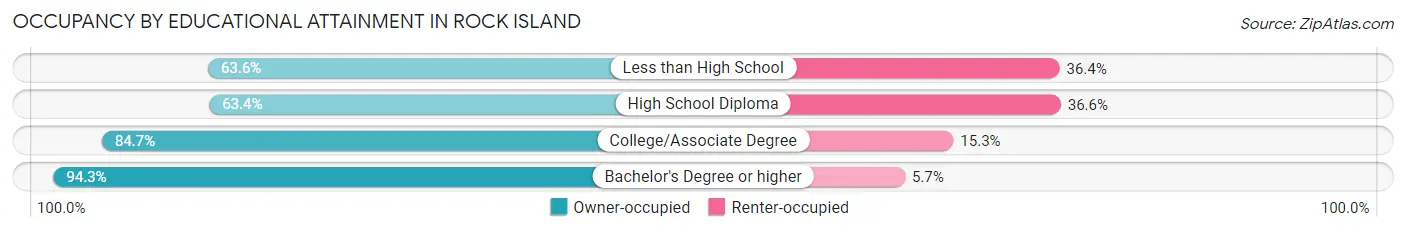
| Household Size | Owner-occupied | Renter-occupied |
| Less than High School | 28 (63.6%) | 16 (36.4%) |
| High School Diploma | 71 (63.4%) | 41 (36.6%) |
| College/Associate Degree | 83 (84.7%) | 15 (15.3%) |
| Bachelor's Degree or higher | 33 (94.3%) | 2 (5.7%) |
Occupancy by Age of Householder in Rock Island
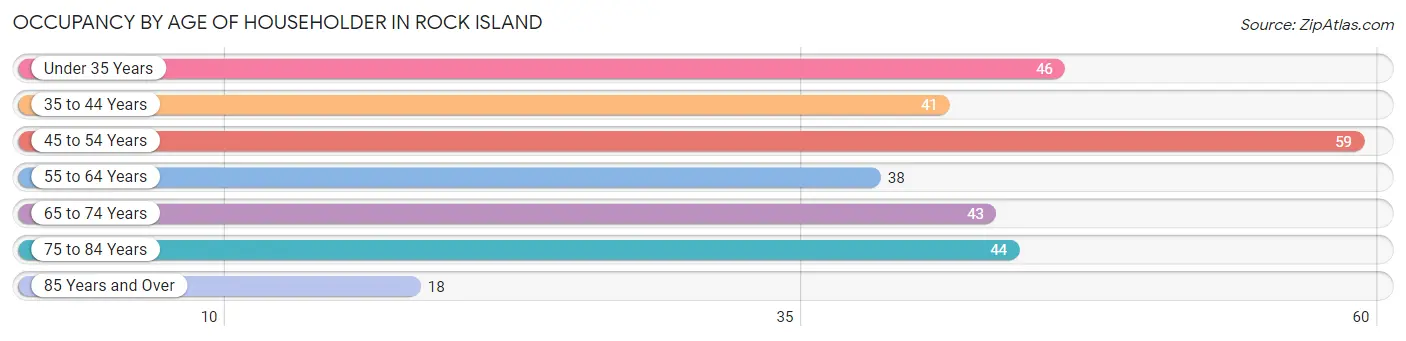
| Age Bracket | # Households | % Households |
| Under 35 Years | 46 | 15.9% |
| 35 to 44 Years | 41 | 14.2% |
| 45 to 54 Years | 59 | 20.4% |
| 55 to 64 Years | 38 | 13.2% |
| 65 to 74 Years | 43 | 14.9% |
| 75 to 84 Years | 44 | 15.2% |
| 85 Years and Over | 18 | 6.2% |
| Total | 289 | 100.0% |
Housing Finances in Rock Island
Median Income by Occupancy in Rock Island
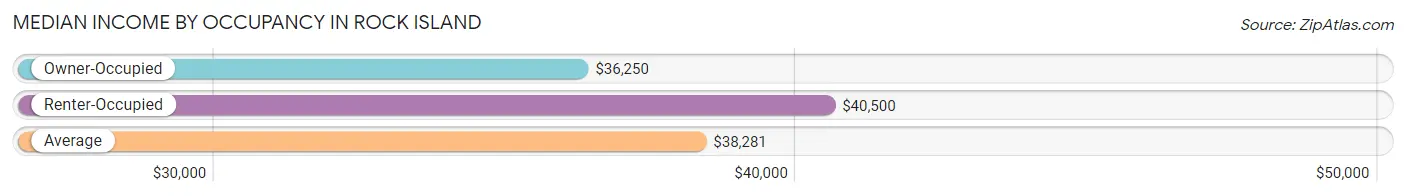
| Occupancy Type | # Households | Median Income |
| Owner-Occupied | 215 (74.4%) | $36,250 |
| Renter-Occupied | 74 (25.6%) | $40,500 |
| Average | 289 (100.0%) | $38,281 |
Occupancy by Householder Income Bracket in Rock Island
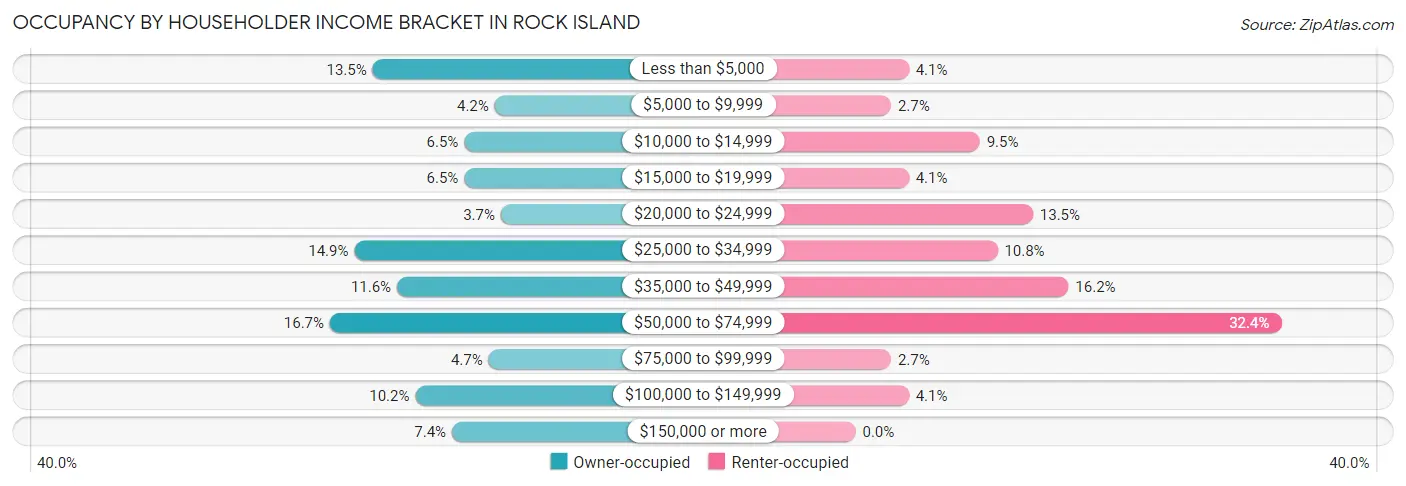
| Income Bracket | Owner-occupied | Renter-occupied |
| Less than $5,000 | 29 (13.5%) | 3 (4.1%) |
| $5,000 to $9,999 | 9 (4.2%) | 2 (2.7%) |
| $10,000 to $14,999 | 14 (6.5%) | 7 (9.5%) |
| $15,000 to $19,999 | 14 (6.5%) | 3 (4.1%) |
| $20,000 to $24,999 | 8 (3.7%) | 10 (13.5%) |
| $25,000 to $34,999 | 32 (14.9%) | 8 (10.8%) |
| $35,000 to $49,999 | 25 (11.6%) | 12 (16.2%) |
| $50,000 to $74,999 | 36 (16.7%) | 24 (32.4%) |
| $75,000 to $99,999 | 10 (4.6%) | 2 (2.7%) |
| $100,000 to $149,999 | 22 (10.2%) | 3 (4.1%) |
| $150,000 or more | 16 (7.4%) | 0 (0.0%) |
| Total | 215 (100.0%) | 74 (100.0%) |
Monthly Housing Cost Tiers in Rock Island
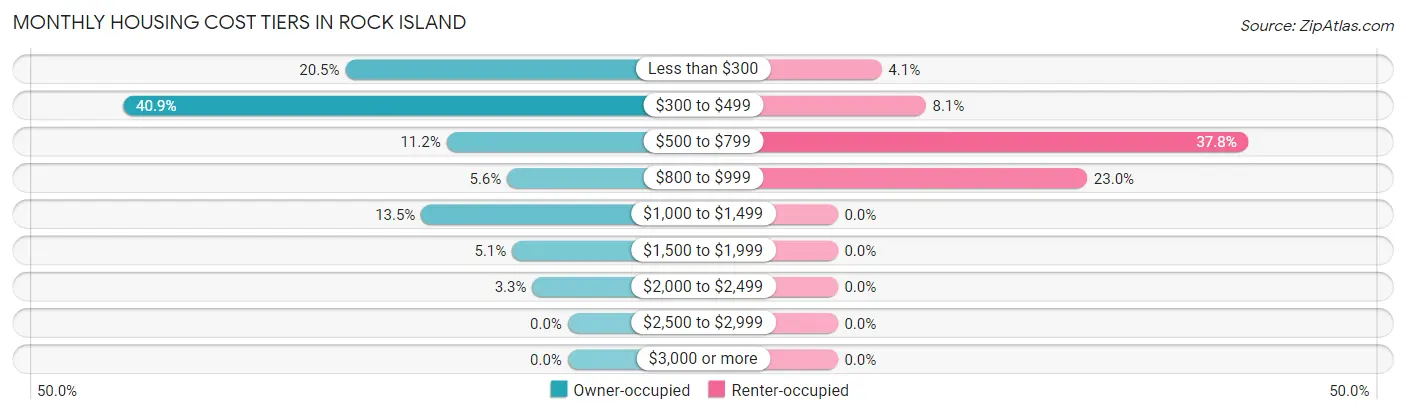
| Monthly Cost | Owner-occupied | Renter-occupied |
| Less than $300 | 44 (20.5%) | 3 (4.1%) |
| $300 to $499 | 88 (40.9%) | 6 (8.1%) |
| $500 to $799 | 24 (11.2%) | 28 (37.8%) |
| $800 to $999 | 12 (5.6%) | 17 (23.0%) |
| $1,000 to $1,499 | 29 (13.5%) | 0 (0.0%) |
| $1,500 to $1,999 | 11 (5.1%) | 0 (0.0%) |
| $2,000 to $2,499 | 7 (3.3%) | 0 (0.0%) |
| $2,500 to $2,999 | 0 (0.0%) | 0 (0.0%) |
| $3,000 or more | 0 (0.0%) | 0 (0.0%) |
| Total | 215 (100.0%) | 74 (100.0%) |
Physical Housing Characteristics in Rock Island
Housing Structures in Rock Island
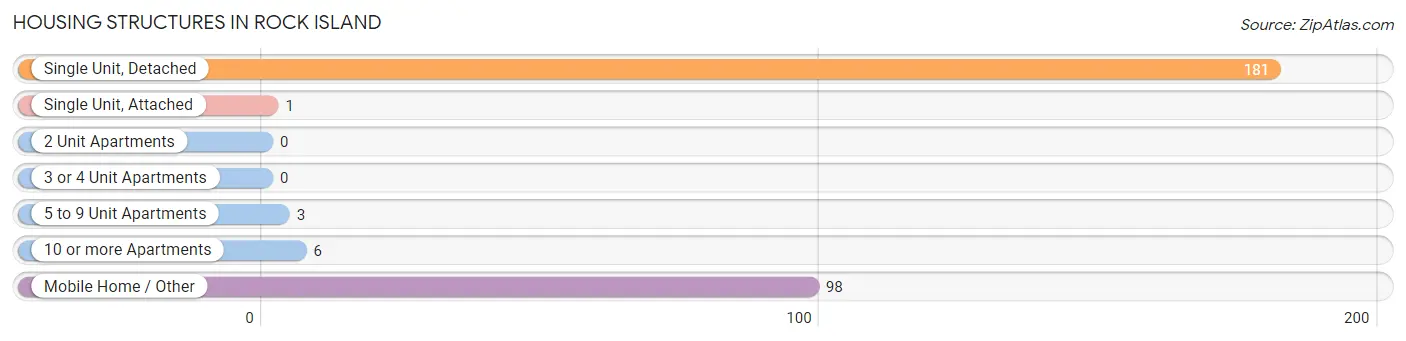
| Structure Type | # Housing Units | % Housing Units |
| Single Unit, Detached | 181 | 62.6% |
| Single Unit, Attached | 1 | 0.4% |
| 2 Unit Apartments | 0 | 0.0% |
| 3 or 4 Unit Apartments | 0 | 0.0% |
| 5 to 9 Unit Apartments | 3 | 1.0% |
| 10 or more Apartments | 6 | 2.1% |
| Mobile Home / Other | 98 | 33.9% |
| Total | 289 | 100.0% |
Housing Structures by Occupancy in Rock Island
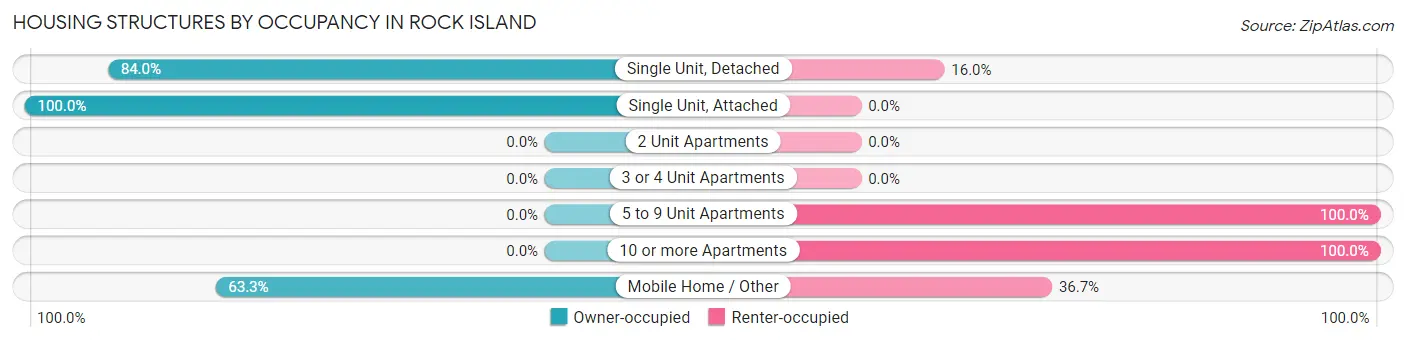
| Structure Type | Owner-occupied | Renter-occupied |
| Single Unit, Detached | 152 (84.0%) | 29 (16.0%) |
| Single Unit, Attached | 1 (100.0%) | 0 (0.0%) |
| 2 Unit Apartments | 0 (0.0%) | 0 (0.0%) |
| 3 or 4 Unit Apartments | 0 (0.0%) | 0 (0.0%) |
| 5 to 9 Unit Apartments | 0 (0.0%) | 3 (100.0%) |
| 10 or more Apartments | 0 (0.0%) | 6 (100.0%) |
| Mobile Home / Other | 62 (63.3%) | 36 (36.7%) |
| Total | 215 (74.4%) | 74 (25.6%) |
Housing Structures by Number of Rooms in Rock Island
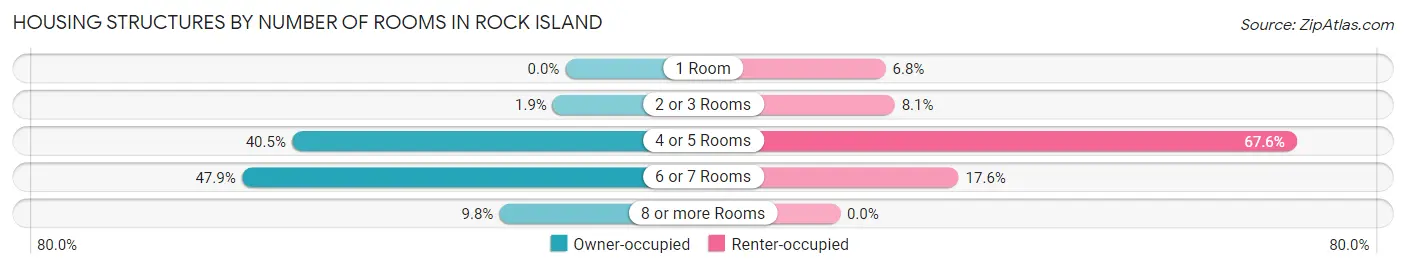
| Number of Rooms | Owner-occupied | Renter-occupied |
| 1 Room | 0 (0.0%) | 5 (6.8%) |
| 2 or 3 Rooms | 4 (1.9%) | 6 (8.1%) |
| 4 or 5 Rooms | 87 (40.5%) | 50 (67.6%) |
| 6 or 7 Rooms | 103 (47.9%) | 13 (17.6%) |
| 8 or more Rooms | 21 (9.8%) | 0 (0.0%) |
| Total | 215 (100.0%) | 74 (100.0%) |
Housing Structure by Heating Type in Rock Island
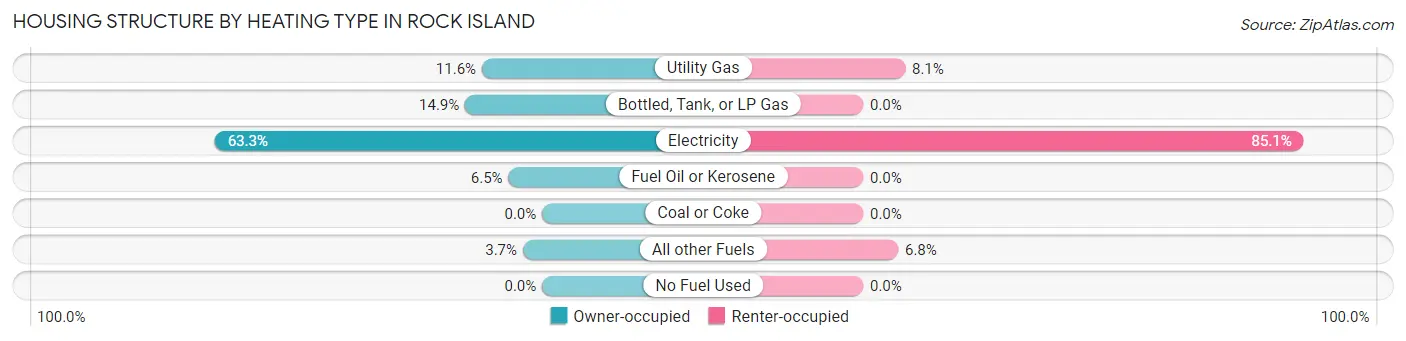
| Heating Type | Owner-occupied | Renter-occupied |
| Utility Gas | 25 (11.6%) | 6 (8.1%) |
| Bottled, Tank, or LP Gas | 32 (14.9%) | 0 (0.0%) |
| Electricity | 136 (63.3%) | 63 (85.1%) |
| Fuel Oil or Kerosene | 14 (6.5%) | 0 (0.0%) |
| Coal or Coke | 0 (0.0%) | 0 (0.0%) |
| All other Fuels | 8 (3.7%) | 5 (6.8%) |
| No Fuel Used | 0 (0.0%) | 0 (0.0%) |
| Total | 215 (100.0%) | 74 (100.0%) |
Household Vehicle Usage in Rock Island
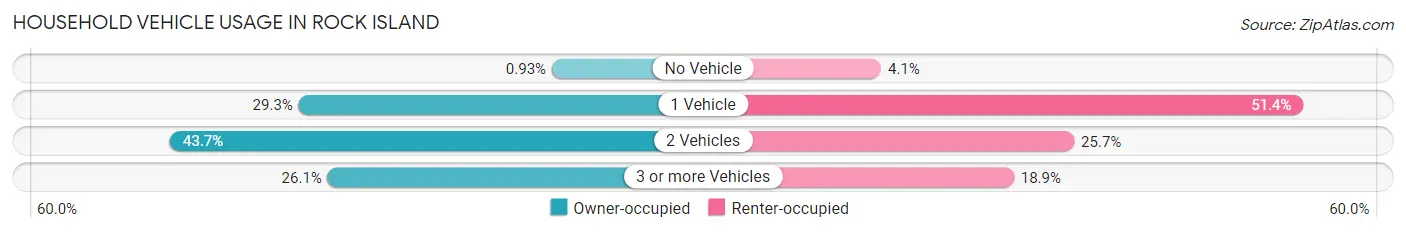
| Vehicles per Household | Owner-occupied | Renter-occupied |
| No Vehicle | 2 (0.9%) | 3 (4.1%) |
| 1 Vehicle | 63 (29.3%) | 38 (51.3%) |
| 2 Vehicles | 94 (43.7%) | 19 (25.7%) |
| 3 or more Vehicles | 56 (26.1%) | 14 (18.9%) |
| Total | 215 (100.0%) | 74 (100.0%) |
Real Estate & Mortgages in Rock Island
Real Estate and Mortgage Overview in Rock Island
| Characteristic | Without Mortgage | With Mortgage |
| Housing Units | 139 | 76 |
| Median Property Value | $95,000 | $162,500 |
| Median Household Income | $26,328 | $10 |
| Monthly Housing Costs | $335 | $0 |
| Real Estate Taxes | $372 | $5 |
Property Value by Mortgage Status in Rock Island
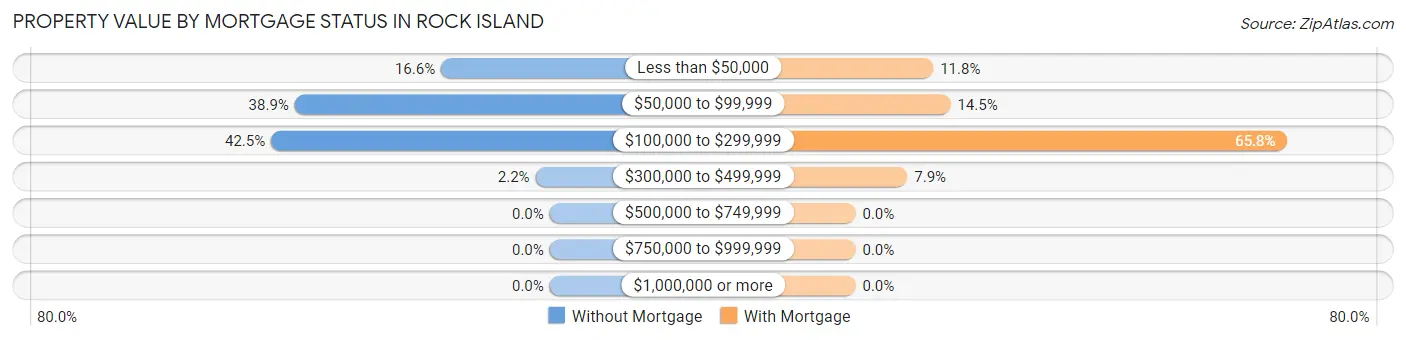
| Property Value | Without Mortgage | With Mortgage |
| Less than $50,000 | 23 (16.6%) | 9 (11.8%) |
| $50,000 to $99,999 | 54 (38.9%) | 11 (14.5%) |
| $100,000 to $299,999 | 59 (42.4%) | 50 (65.8%) |
| $300,000 to $499,999 | 3 (2.2%) | 6 (7.9%) |
| $500,000 to $749,999 | 0 (0.0%) | 0 (0.0%) |
| $750,000 to $999,999 | 0 (0.0%) | 0 (0.0%) |
| $1,000,000 or more | 0 (0.0%) | 0 (0.0%) |
| Total | 139 (100.0%) | 76 (100.0%) |
Household Income by Mortgage Status in Rock Island
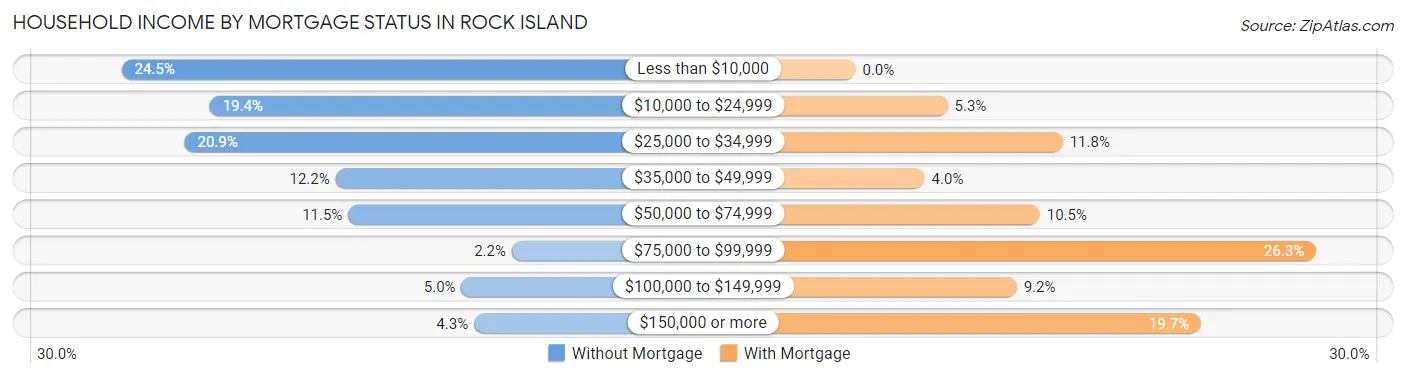
| Household Income | Without Mortgage | With Mortgage |
| Less than $10,000 | 34 (24.5%) | 0 (0.0%) |
| $10,000 to $24,999 | 27 (19.4%) | 4 (5.3%) |
| $25,000 to $34,999 | 29 (20.9%) | 9 (11.8%) |
| $35,000 to $49,999 | 17 (12.2%) | 3 (4.0%) |
| $50,000 to $74,999 | 16 (11.5%) | 8 (10.5%) |
| $75,000 to $99,999 | 3 (2.2%) | 20 (26.3%) |
| $100,000 to $149,999 | 7 (5.0%) | 7 (9.2%) |
| $150,000 or more | 6 (4.3%) | 15 (19.7%) |
| Total | 139 (100.0%) | 76 (100.0%) |
Property Value to Household Income Ratio in Rock Island
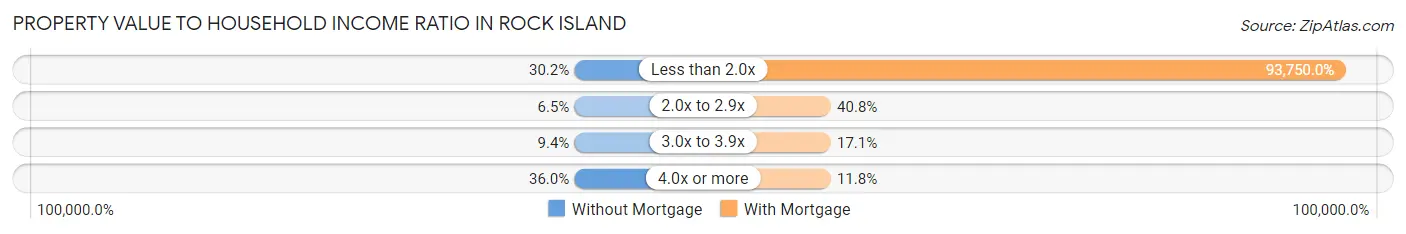
| Value-to-Income Ratio | Without Mortgage | With Mortgage |
| Less than 2.0x | 42 (30.2%) | 71,250 (93,750.0%) |
| 2.0x to 2.9x | 9 (6.5%) | 31 (40.8%) |
| 3.0x to 3.9x | 13 (9.3%) | 13 (17.1%) |
| 4.0x or more | 50 (36.0%) | 9 (11.8%) |
| Total | 139 (100.0%) | 76 (100.0%) |
Real Estate Taxes by Mortgage Status in Rock Island
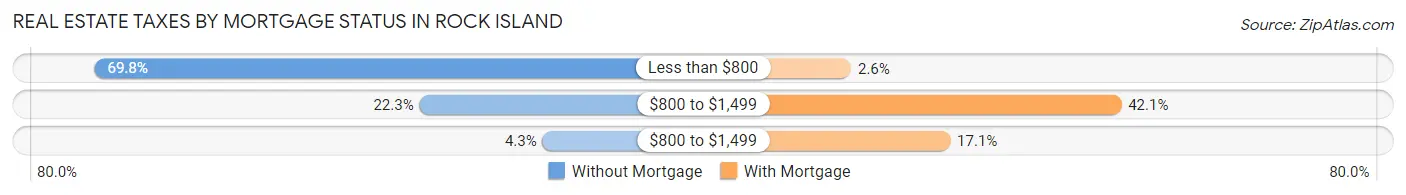
| Property Taxes | Without Mortgage | With Mortgage |
| Less than $800 | 97 (69.8%) | 2 (2.6%) |
| $800 to $1,499 | 31 (22.3%) | 32 (42.1%) |
| $800 to $1,499 | 6 (4.3%) | 13 (17.1%) |
| Total | 139 (100.0%) | 76 (100.0%) |
Health & Disability in Rock Island
Health Insurance Coverage by Age in Rock Island
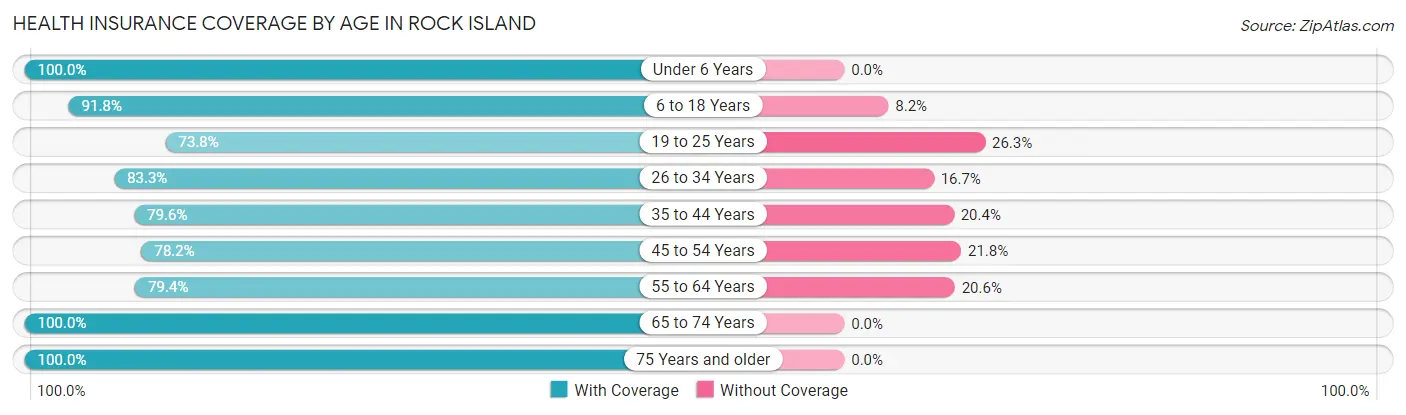
| Age Bracket | With Coverage | Without Coverage |
| Under 6 Years | 64 (100.0%) | 0 (0.0%) |
| 6 to 18 Years | 123 (91.8%) | 11 (8.2%) |
| 19 to 25 Years | 59 (73.8%) | 21 (26.3%) |
| 26 to 34 Years | 50 (83.3%) | 10 (16.7%) |
| 35 to 44 Years | 78 (79.6%) | 20 (20.4%) |
| 45 to 54 Years | 97 (78.2%) | 27 (21.8%) |
| 55 to 64 Years | 54 (79.4%) | 14 (20.6%) |
| 65 to 74 Years | 73 (100.0%) | 0 (0.0%) |
| 75 Years and older | 71 (100.0%) | 0 (0.0%) |
| Total | 669 (86.7%) | 103 (13.3%) |
Health Insurance Coverage by Citizenship Status in Rock Island
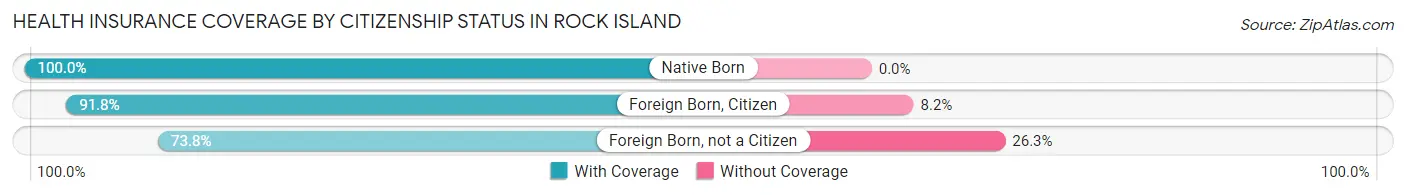
| Citizenship Status | With Coverage | Without Coverage |
| Native Born | 64 (100.0%) | 0 (0.0%) |
| Foreign Born, Citizen | 123 (91.8%) | 11 (8.2%) |
| Foreign Born, not a Citizen | 59 (73.8%) | 21 (26.3%) |
Health Insurance Coverage by Household Income in Rock Island
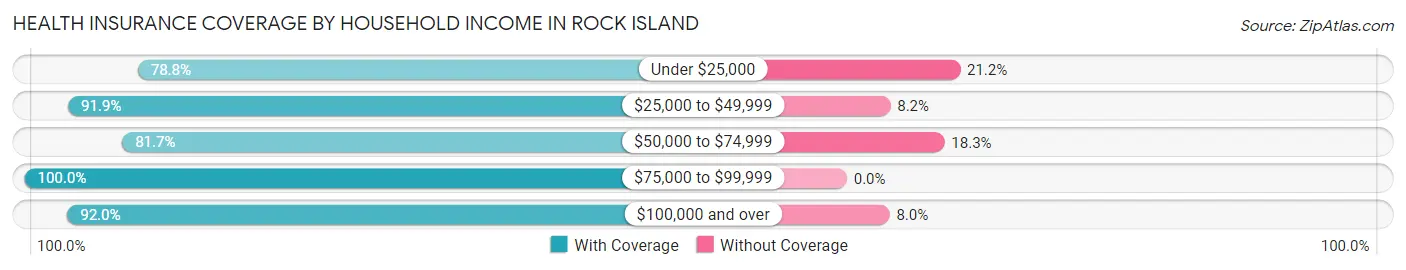
| Household Income | With Coverage | Without Coverage |
| Under $25,000 | 156 (78.8%) | 42 (21.2%) |
| $25,000 to $49,999 | 169 (91.8%) | 15 (8.2%) |
| $50,000 to $74,999 | 143 (81.7%) | 32 (18.3%) |
| $75,000 to $99,999 | 40 (100.0%) | 0 (0.0%) |
| $100,000 and over | 161 (92.0%) | 14 (8.0%) |
Public vs Private Health Insurance Coverage by Age in Rock Island
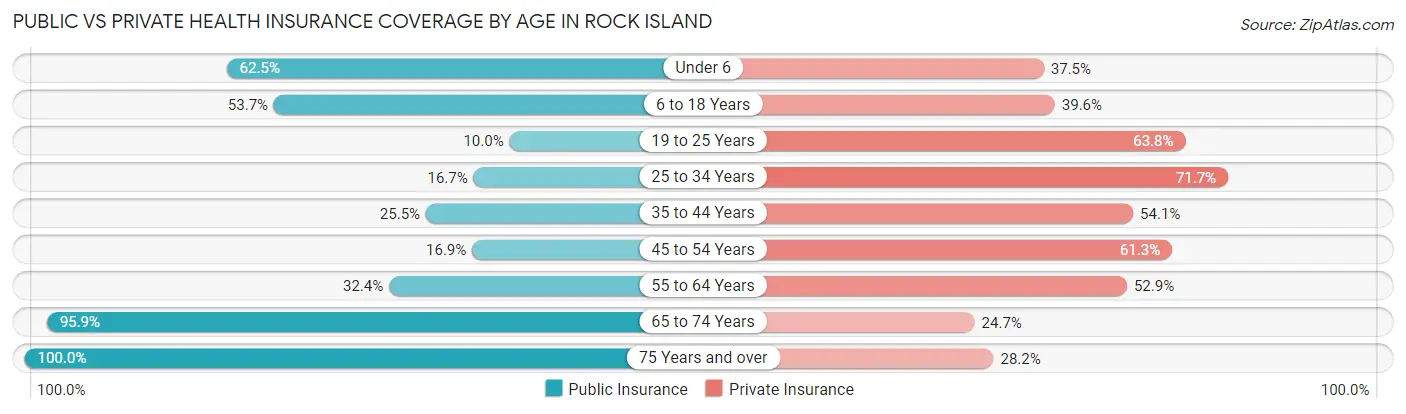
| Age Bracket | Public Insurance | Private Insurance |
| Under 6 | 40 (62.5%) | 24 (37.5%) |
| 6 to 18 Years | 72 (53.7%) | 53 (39.6%) |
| 19 to 25 Years | 8 (10.0%) | 51 (63.7%) |
| 25 to 34 Years | 10 (16.7%) | 43 (71.7%) |
| 35 to 44 Years | 25 (25.5%) | 53 (54.1%) |
| 45 to 54 Years | 21 (16.9%) | 76 (61.3%) |
| 55 to 64 Years | 22 (32.4%) | 36 (52.9%) |
| 65 to 74 Years | 70 (95.9%) | 18 (24.7%) |
| 75 Years and over | 71 (100.0%) | 20 (28.2%) |
| Total | 339 (43.9%) | 374 (48.4%) |
Disability Status by Sex by Age in Rock Island
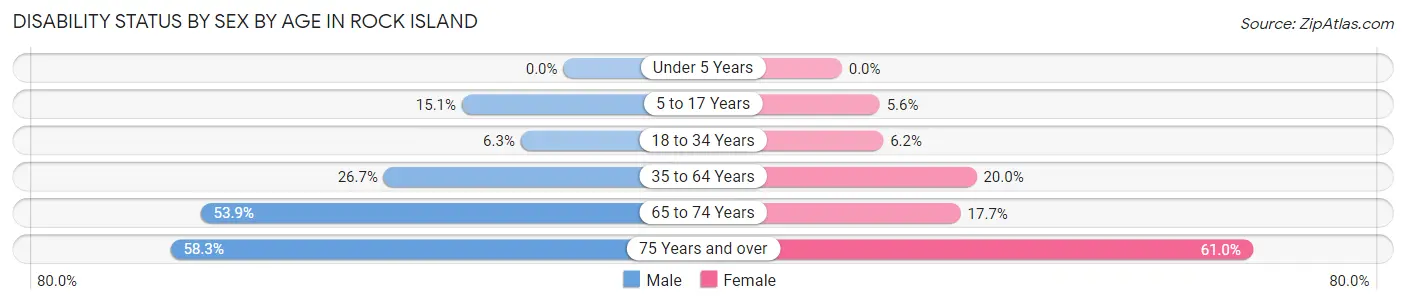
| Age Bracket | Male | Female |
| Under 5 Years | 0 (0.0%) | 0 (0.0%) |
| 5 to 17 Years | 11 (15.1%) | 4 (5.6%) |
| 18 to 34 Years | 5 (6.3%) | 4 (6.1%) |
| 35 to 64 Years | 40 (26.7%) | 28 (20.0%) |
| 65 to 74 Years | 21 (53.8%) | 6 (17.6%) |
| 75 Years and over | 7 (58.3%) | 36 (61.0%) |
Disability Class by Sex by Age in Rock Island
Disability Class: Hearing Difficulty
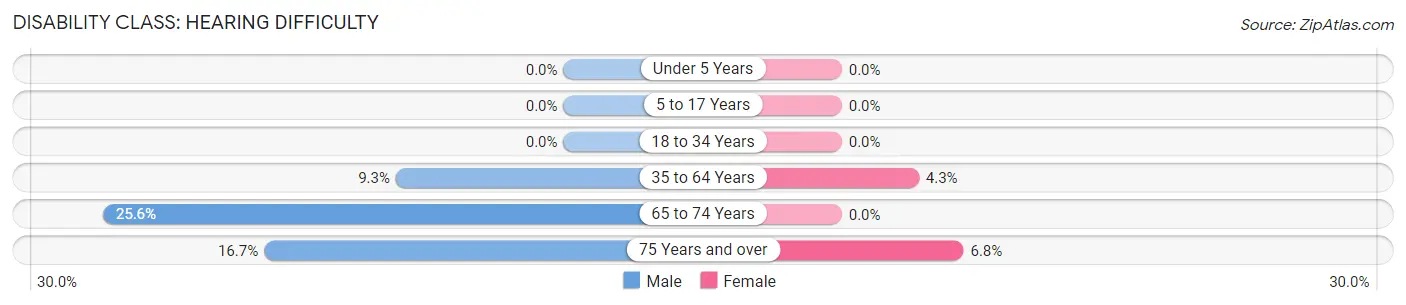
| Age Bracket | Male | Female |
| Under 5 Years | 0 (0.0%) | 0 (0.0%) |
| 5 to 17 Years | 0 (0.0%) | 0 (0.0%) |
| 18 to 34 Years | 0 (0.0%) | 0 (0.0%) |
| 35 to 64 Years | 14 (9.3%) | 6 (4.3%) |
| 65 to 74 Years | 10 (25.6%) | 0 (0.0%) |
| 75 Years and over | 2 (16.7%) | 4 (6.8%) |
Disability Class: Vision Difficulty
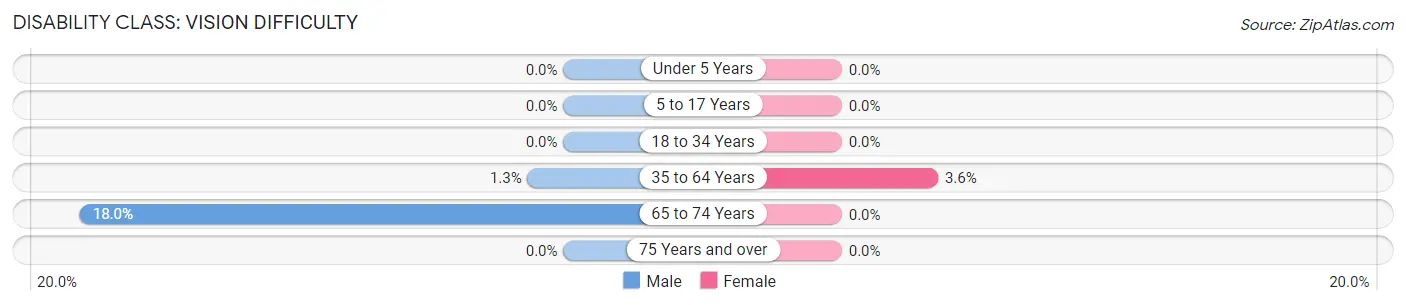
| Age Bracket | Male | Female |
| Under 5 Years | 0 (0.0%) | 0 (0.0%) |
| 5 to 17 Years | 0 (0.0%) | 0 (0.0%) |
| 18 to 34 Years | 0 (0.0%) | 0 (0.0%) |
| 35 to 64 Years | 2 (1.3%) | 5 (3.6%) |
| 65 to 74 Years | 7 (17.9%) | 0 (0.0%) |
| 75 Years and over | 0 (0.0%) | 0 (0.0%) |
Disability Class: Cognitive Difficulty
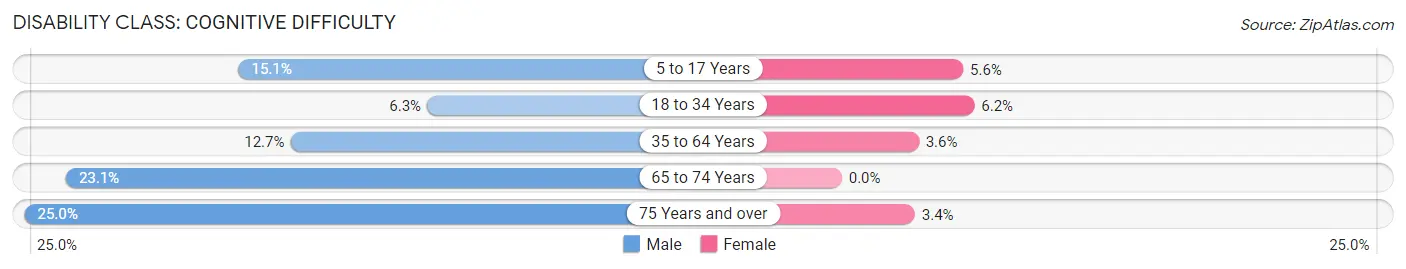
| Age Bracket | Male | Female |
| 5 to 17 Years | 11 (15.1%) | 4 (5.6%) |
| 18 to 34 Years | 5 (6.3%) | 4 (6.1%) |
| 35 to 64 Years | 19 (12.7%) | 5 (3.6%) |
| 65 to 74 Years | 9 (23.1%) | 0 (0.0%) |
| 75 Years and over | 3 (25.0%) | 2 (3.4%) |
Disability Class: Ambulatory Difficulty
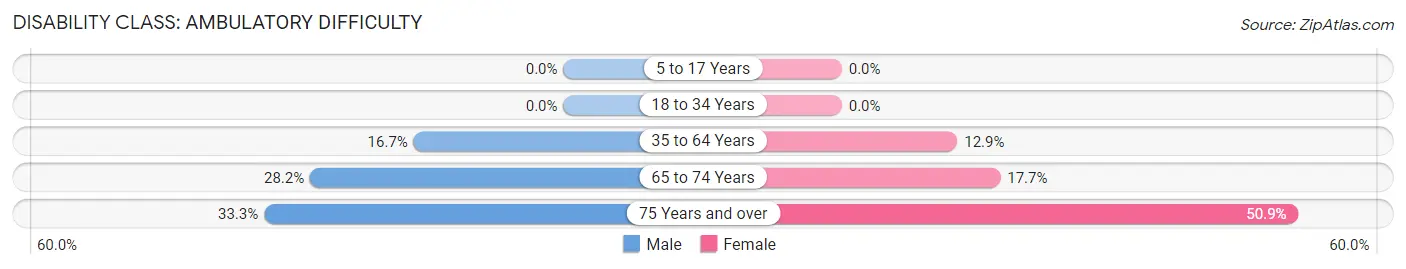
| Age Bracket | Male | Female |
| 5 to 17 Years | 0 (0.0%) | 0 (0.0%) |
| 18 to 34 Years | 0 (0.0%) | 0 (0.0%) |
| 35 to 64 Years | 25 (16.7%) | 18 (12.9%) |
| 65 to 74 Years | 11 (28.2%) | 6 (17.6%) |
| 75 Years and over | 4 (33.3%) | 30 (50.8%) |
Disability Class: Self-Care Difficulty
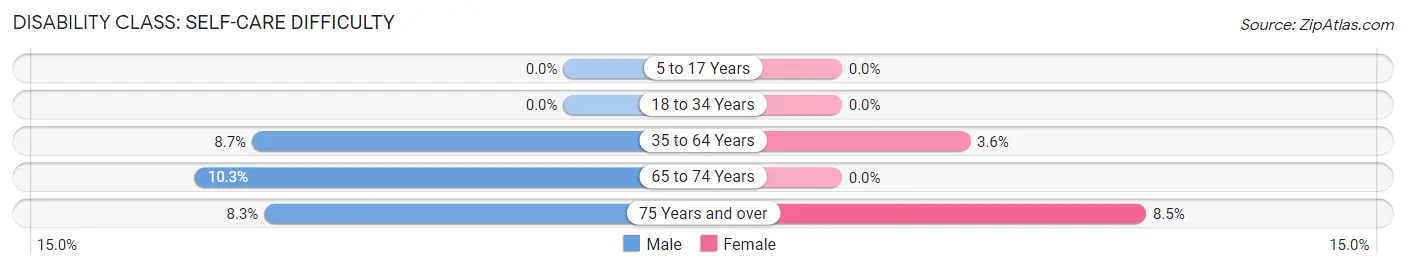
| Age Bracket | Male | Female |
| 5 to 17 Years | 0 (0.0%) | 0 (0.0%) |
| 18 to 34 Years | 0 (0.0%) | 0 (0.0%) |
| 35 to 64 Years | 13 (8.7%) | 5 (3.6%) |
| 65 to 74 Years | 4 (10.3%) | 0 (0.0%) |
| 75 Years and over | 1 (8.3%) | 5 (8.5%) |
Technology Access in Rock Island
Computing Device Access in Rock Island
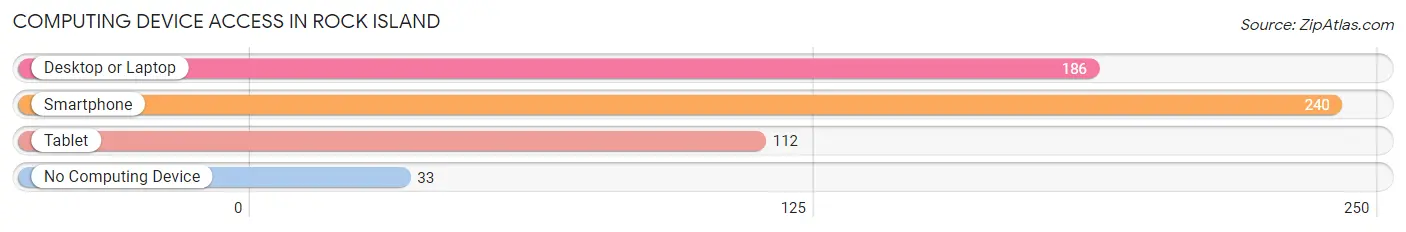
| Device Type | # Households | % Households |
| Desktop or Laptop | 186 | 64.4% |
| Smartphone | 240 | 83.0% |
| Tablet | 112 | 38.8% |
| No Computing Device | 33 | 11.4% |
| Total | 289 | 100.0% |
Internet Access in Rock Island
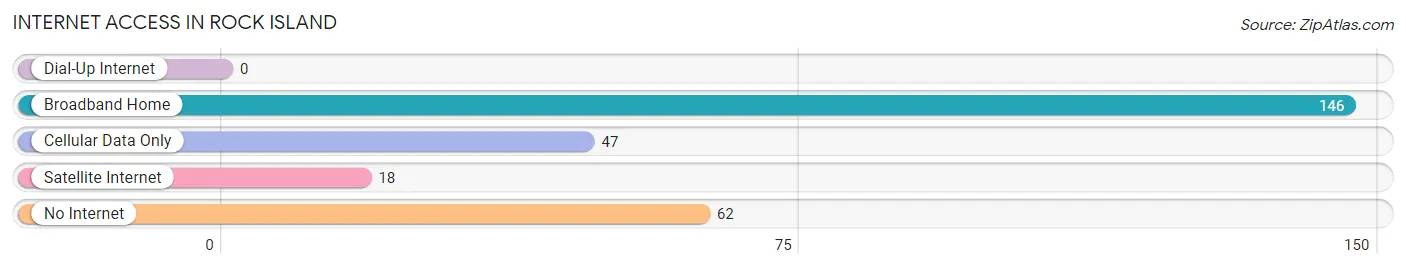
| Internet Type | # Households | % Households |
| Dial-Up Internet | 0 | 0.0% |
| Broadband Home | 146 | 50.5% |
| Cellular Data Only | 47 | 16.3% |
| Satellite Internet | 18 | 6.2% |
| No Internet | 62 | 21.4% |
| Total | 289 | 100.0% |
Rock Island Summary
Rock Island is a small town located in the southeastern corner of Oklahoma, in the Choctaw Nation. It is situated in the foothills of the Ouachita Mountains, and is surrounded by rolling hills and lush forests. The town was founded in 1891 by the Choctaw Nation, and was named after the nearby Rock Island Creek.
Geography
Rock Island is located in southeastern Oklahoma, in the foothills of the Ouachita Mountains. The town is situated on the banks of Rock Island Creek, which flows through the town and into the nearby Kiamichi River. The town is surrounded by rolling hills and lush forests, and is located approximately 30 miles from the nearest major city, McAlester.
Climate
Rock Island has a humid subtropical climate, with hot, humid summers and mild winters. The average annual temperature is around 65°F, with temperatures ranging from an average low of around 40°F in the winter to an average high of around 90°F in the summer. The town receives an average of around 48 inches of precipitation per year, with most of it falling in the spring and summer months.
Demographics
As of the 2010 census, Rock Island had a population of 1,093. The racial makeup of the town was 79.2% White, 17.2% Native American, 0.7% African American, 0.3% Asian, and 2.6% from other races. The median household income was $25,938, and the median family income was $31,250.
Economy
Rock Island’s economy is largely based on agriculture and tourism. The town is home to several farms, which produce a variety of crops, including corn, soybeans, wheat, and hay. The town is also home to several tourist attractions, including the Rock Island State Park, which offers camping, fishing, and hiking opportunities. The town is also home to several small businesses, including restaurants, shops, and a local newspaper.
History
Rock Island was founded in 1891 by the Choctaw Nation. The town was named after the nearby Rock Island Creek, and was originally intended to be a trading post for the Choctaw people. The town quickly grew, and by the early 1900s, it had become a bustling center of commerce and industry. The town was home to several businesses, including a sawmill, a gristmill, and a cotton gin.
In the early 1900s, the town was also home to several churches, including the First Baptist Church, which was founded in 1902. The town also had a school, which was established in 1906. The school was later renamed Rock Island High School, and is still in operation today.
In the late 1900s, the town began to decline, as many of the businesses and industries that had once been the backbone of the town’s economy began to close. The town’s population also began to decline, as many of the town’s residents moved away in search of better opportunities.
Today, Rock Island is a small, rural town with a population of just over 1,000. The town is still home to several businesses, including a few restaurants, shops, and a local newspaper. The town is also home to several tourist attractions, including the Rock Island State Park, which offers camping, fishing, and hiking opportunities.
Common Questions
What is Per Capita Income in Rock Island?
Per Capita income in Rock Island is $22,169.
What is the Median Family Income in Rock Island?
Median Family Income in Rock Island is $51,771.
What is the Median Household income in Rock Island?
Median Household Income in Rock Island is $38,281.
What is Income or Wage Gap in Rock Island?
Income or Wage Gap in Rock Island is 27.1%.
Women in Rock Island earn 72.9 cents for every dollar earned by a man.
What is Family Income Deficit in Rock Island?
Family Income Deficit in Rock Island is $9,780.
Families that are below poverty line in Rock Island earn $9,780 less on average than the poverty threshold level.
What is Inequality or Gini Index in Rock Island?
Inequality or Gini Index in Rock Island is 0.52.
What is the Total Population of Rock Island?
Total Population of Rock Island is 772.
What is the Total Male Population of Rock Island?
Total Male Population of Rock Island is 383.
What is the Total Female Population of Rock Island?
Total Female Population of Rock Island is 389.
What is the Ratio of Males per 100 Females in Rock Island?
There are 98.46 Males per 100 Females in Rock Island.
What is the Ratio of Females per 100 Males in Rock Island?
There are 101.57 Females per 100 Males in Rock Island.
What is the Median Population Age in Rock Island?
Median Population Age in Rock Island is 39.2 Years.
What is the Average Family Size in Rock Island
Average Family Size in Rock Island is 3.5 People.
What is the Average Household Size in Rock Island
Average Household Size in Rock Island is 2.7 People.
How Large is the Labor Force in Rock Island?
There are 280 People in the Labor Forcein in Rock Island.
What is the Percentage of People in the Labor Force in Rock Island?
46.4% of People are in the Labor Force in Rock Island.
What is the Unemployment Rate in Rock Island?
Unemployment Rate in Rock Island is 6.4%.