Quapaw, OK Map & Demographics
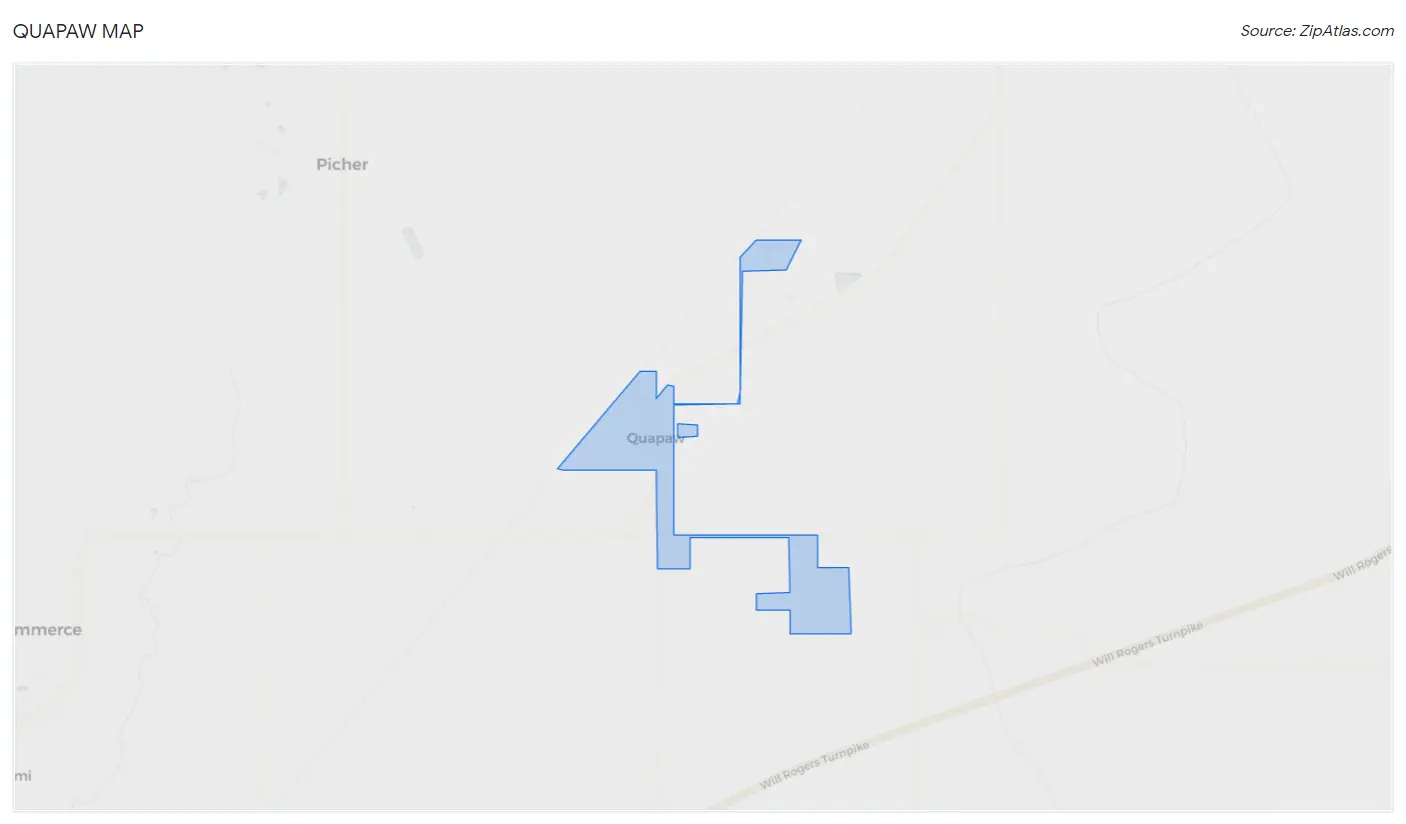
Quapaw Map
Quapaw Overview
$21,527
PER CAPITA INCOME
$56,250
AVG FAMILY INCOME
$47,125
AVG HOUSEHOLD INCOME
3.3%
WAGE / INCOME GAP [ % ]
96.7¢/ $1
WAGE / INCOME GAP [ $ ]
$8,892
FAMILY INCOME DEFICIT
0.41
INEQUALITY / GINI INDEX
851
TOTAL POPULATION
398
MALE POPULATION
453
FEMALE POPULATION
87.86
MALES / 100 FEMALES
113.82
FEMALES / 100 MALES
37.3
MEDIAN AGE
3.2
AVG FAMILY SIZE
2.6
AVG HOUSEHOLD SIZE
360
LABOR FORCE [ PEOPLE ]
56.2%
PERCENT IN LABOR FORCE
5.3%
UNEMPLOYMENT RATE
Quapaw Zip Codes
Quapaw Area Codes
Income in Quapaw
Income Overview in Quapaw
Per Capita Income in Quapaw is $21,527, while median incomes of families and households are $56,250 and $47,125 respectively.
| Characteristic | Number | Measure |
| Per Capita Income | 851 | $21,527 |
| Median Family Income | 203 | $56,250 |
| Mean Family Income | 203 | $63,382 |
| Median Household Income | 311 | $47,125 |
| Mean Household Income | 311 | $56,035 |
| Income Deficit | 203 | $8,892 |
| Wage / Income Gap (%) | 851 | 3.29% |
| Wage / Income Gap ($) | 851 | 96.71¢ per $1 |
| Gini / Inequality Index | 851 | 0.41 |
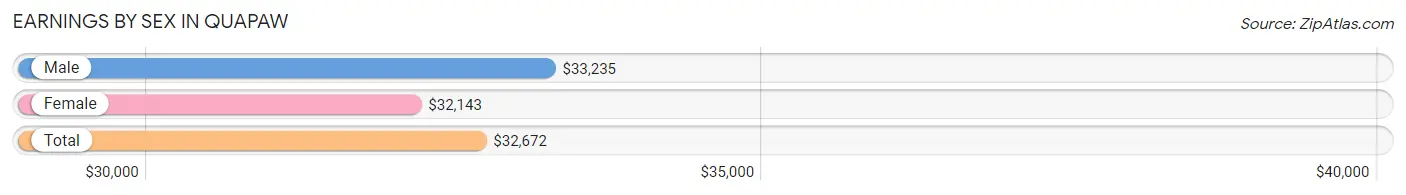
Earnings by Sex in Quapaw
Average Earnings in Quapaw are $32,672, $33,235 for men and $32,143 for women, a difference of 3.3%.
| Sex | Number | Average Earnings |
| Male | 186 (49.7%) | $33,235 |
| Female | 188 (50.3%) | $32,143 |
| Total | 374 (100.0%) | $32,672 |
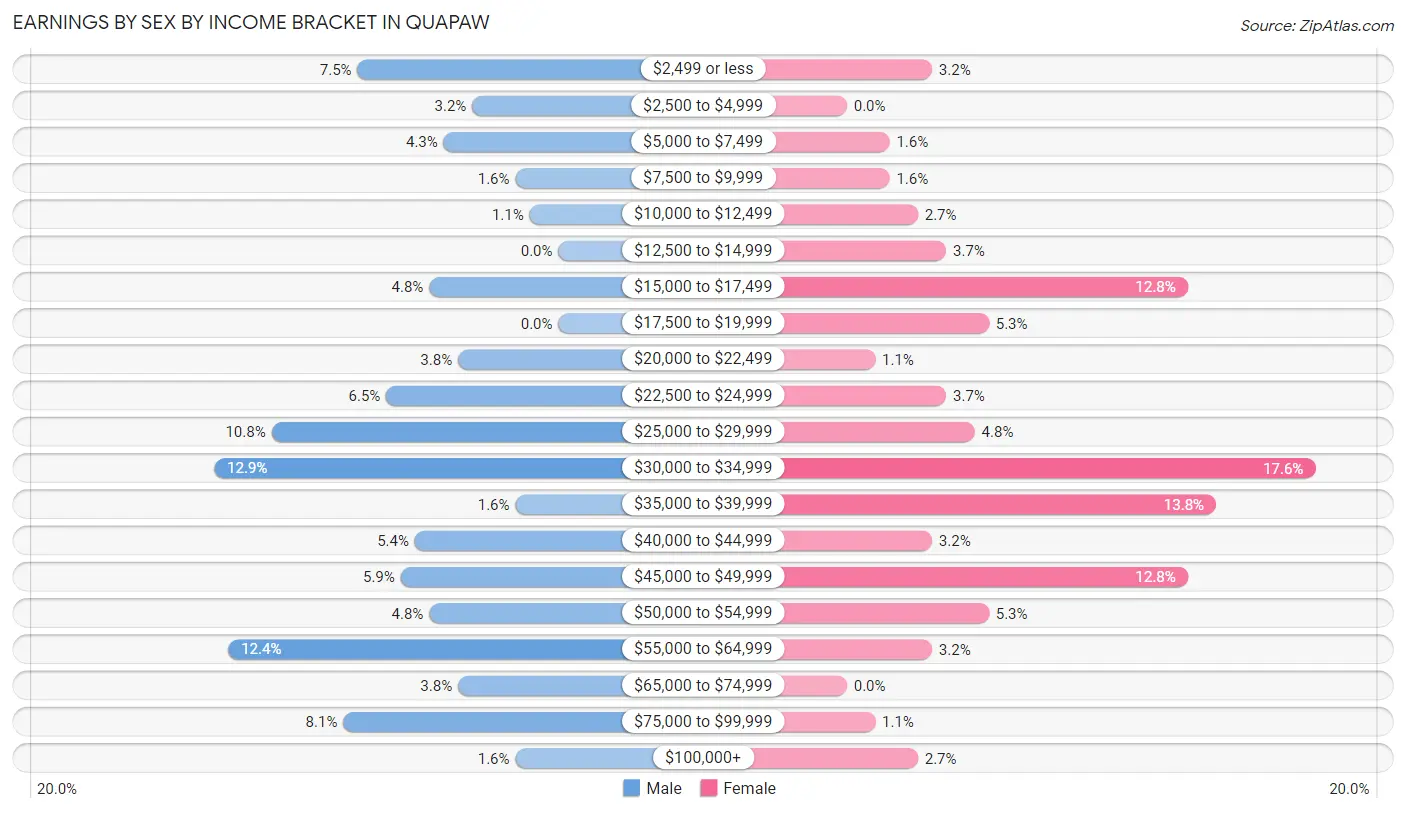
Earnings by Sex by Income Bracket in Quapaw
The most common earnings brackets in Quapaw are $30,000 to $34,999 for men (24 | 12.9%) and $30,000 to $34,999 for women (33 | 17.5%).
| Income | Male | Female |
| $2,499 or less | 14 (7.5%) | 6 (3.2%) |
| $2,500 to $4,999 | 6 (3.2%) | 0 (0.0%) |
| $5,000 to $7,499 | 8 (4.3%) | 3 (1.6%) |
| $7,500 to $9,999 | 3 (1.6%) | 3 (1.6%) |
| $10,000 to $12,499 | 2 (1.1%) | 5 (2.7%) |
| $12,500 to $14,999 | 0 (0.0%) | 7 (3.7%) |
| $15,000 to $17,499 | 9 (4.8%) | 24 (12.8%) |
| $17,500 to $19,999 | 0 (0.0%) | 10 (5.3%) |
| $20,000 to $22,499 | 7 (3.8%) | 2 (1.1%) |
| $22,500 to $24,999 | 12 (6.5%) | 7 (3.7%) |
| $25,000 to $29,999 | 20 (10.7%) | 9 (4.8%) |
| $30,000 to $34,999 | 24 (12.9%) | 33 (17.5%) |
| $35,000 to $39,999 | 3 (1.6%) | 26 (13.8%) |
| $40,000 to $44,999 | 10 (5.4%) | 6 (3.2%) |
| $45,000 to $49,999 | 11 (5.9%) | 24 (12.8%) |
| $50,000 to $54,999 | 9 (4.8%) | 10 (5.3%) |
| $55,000 to $64,999 | 23 (12.4%) | 6 (3.2%) |
| $65,000 to $74,999 | 7 (3.8%) | 0 (0.0%) |
| $75,000 to $99,999 | 15 (8.1%) | 2 (1.1%) |
| $100,000+ | 3 (1.6%) | 5 (2.7%) |
| Total | 186 (100.0%) | 188 (100.0%) |
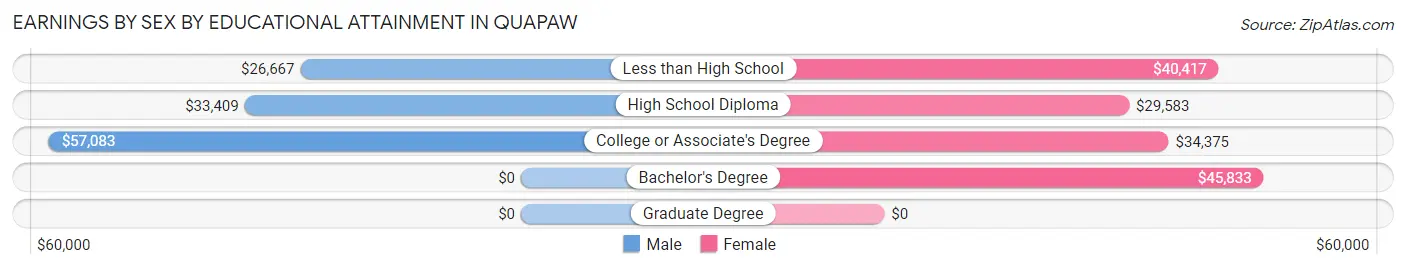
Earnings by Sex by Educational Attainment in Quapaw
Average earnings in Quapaw are $34,643 for men and $32,500 for women, a difference of 6.2%. Men with an educational attainment of college or associate's degree enjoy the highest average annual earnings of $57,083, while those with less than high school education earn the least with $26,667. Women with an educational attainment of bachelor's degree earn the most with the average annual earnings of $45,833, while those with high school diploma education have the smallest earnings of $29,583.
| Educational Attainment | Male Income | Female Income |
| Less than High School | $26,667 | $40,417 |
| High School Diploma | $33,409 | $29,583 |
| College or Associate's Degree | $57,083 | $34,375 |
| Bachelor's Degree | - | - |
| Graduate Degree | - | - |
| Total | $34,643 | $32,500 |
Family Income in Quapaw
Family Income Brackets in Quapaw
According to the Quapaw family income data, there are 54 families falling into the $50,000 to $74,999 income range, which is the most common income bracket and makes up 26.6% of all families. Conversely, the $200,000+ income bracket is the least frequent group with only 3 families (1.5%) belonging to this category.
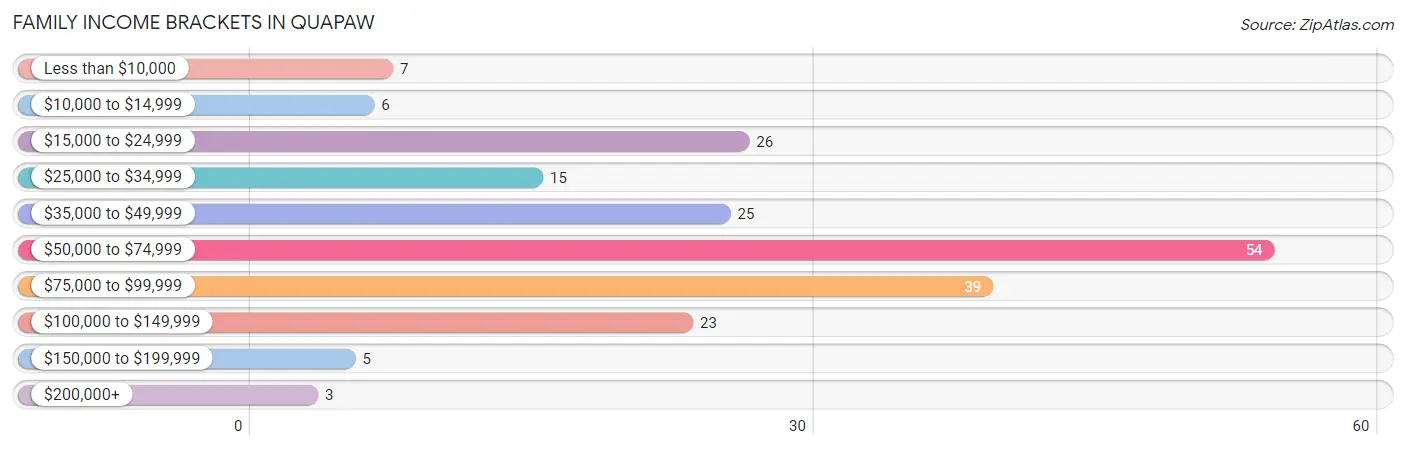
| Income Bracket | # Families | % Families |
| Less than $10,000 | 7 | 3.4% |
| $10,000 to $14,999 | 6 | 3.0% |
| $15,000 to $24,999 | 26 | 12.8% |
| $25,000 to $34,999 | 15 | 7.4% |
| $35,000 to $49,999 | 25 | 12.3% |
| $50,000 to $74,999 | 54 | 26.6% |
| $75,000 to $99,999 | 39 | 19.2% |
| $100,000 to $149,999 | 23 | 11.3% |
| $150,000 to $199,999 | 5 | 2.5% |
| $200,000+ | 3 | 1.5% |
Family Income by Famaliy Size in Quapaw
6-person families (11 | 5.4%) account for the highest median family income in Quapaw with $82,917 per family, while 2-person families (87 | 42.9%) have the highest median income of $27,604 per family member.
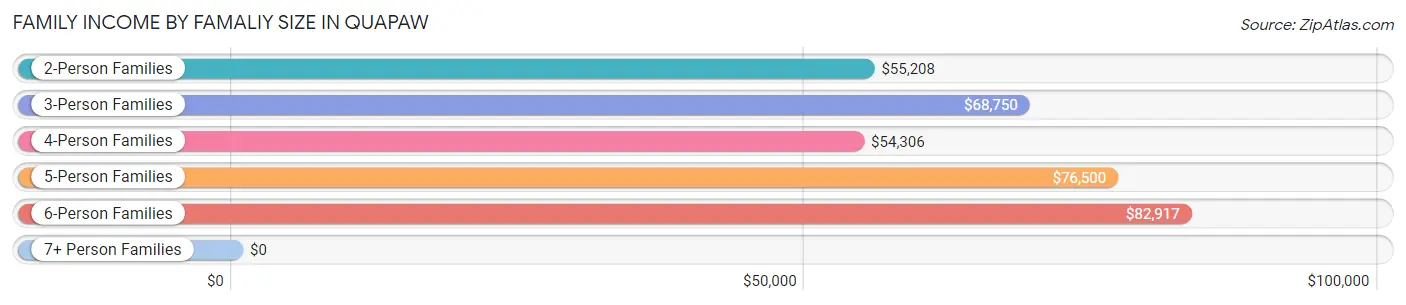
| Income Bracket | # Families | Median Income |
| 2-Person Families | 87 (42.9%) | $55,208 |
| 3-Person Families | 54 (26.6%) | $68,750 |
| 4-Person Families | 35 (17.2%) | $54,306 |
| 5-Person Families | 14 (6.9%) | $76,500 |
| 6-Person Families | 11 (5.4%) | $82,917 |
| 7+ Person Families | 2 (1.0%) | $0 |
| Total | 203 (100.0%) | $56,250 |
Family Income by Number of Earners in Quapaw
The median family income in Quapaw is $56,250, with families comprising 3+ earners (12) having the highest median family income of $103,750, while families with no earners (36) have the lowest median family income of $25,833, accounting for 5.9% and 17.7% of families, respectively.
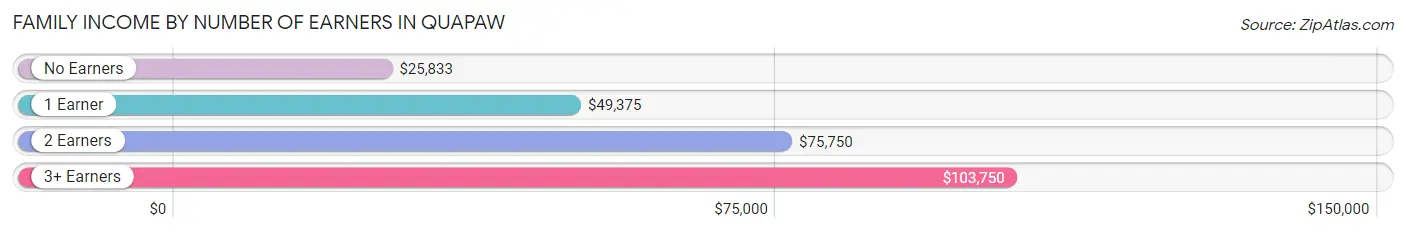
| Number of Earners | # Families | Median Income |
| No Earners | 36 (17.7%) | $25,833 |
| 1 Earner | 78 (38.4%) | $49,375 |
| 2 Earners | 77 (37.9%) | $75,750 |
| 3+ Earners | 12 (5.9%) | $103,750 |
| Total | 203 (100.0%) | $56,250 |
Household Income in Quapaw
Household Income Brackets in Quapaw
With 66 households falling in the category, the $50,000 to $74,999 income range is the most frequent in Quapaw, accounting for 21.2% of all households. In contrast, only 5 households (1.6%) fall into the $150,000 to $199,999 income bracket, making it the least populous group.
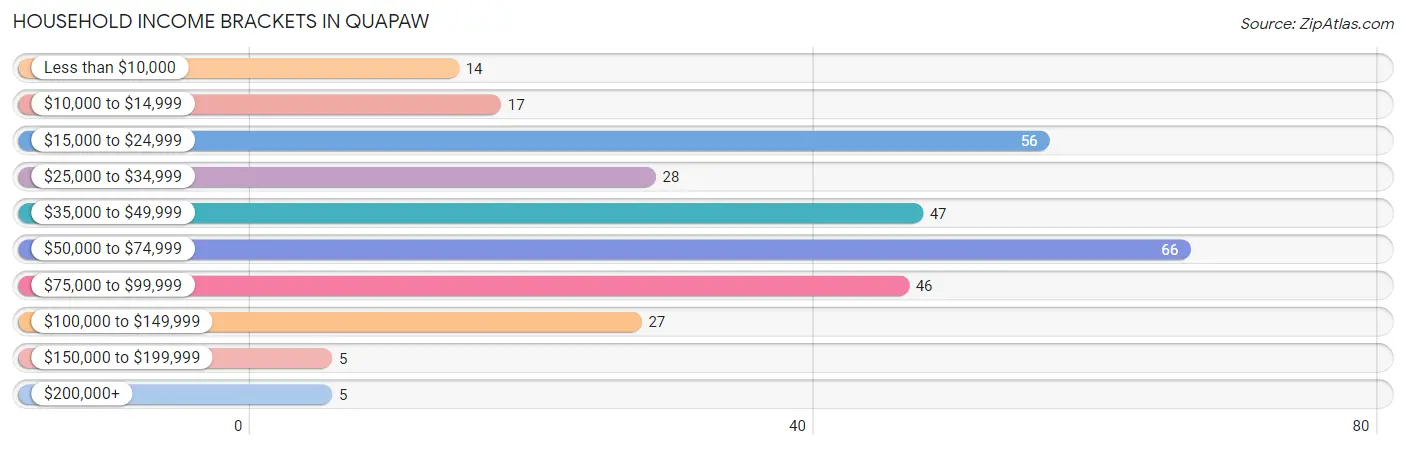
| Income Bracket | # Households | % Households |
| Less than $10,000 | 14 | 4.5% |
| $10,000 to $14,999 | 17 | 5.5% |
| $15,000 to $24,999 | 56 | 18.0% |
| $25,000 to $34,999 | 28 | 9.0% |
| $35,000 to $49,999 | 47 | 15.1% |
| $50,000 to $74,999 | 66 | 21.2% |
| $75,000 to $99,999 | 46 | 14.8% |
| $100,000 to $149,999 | 27 | 8.7% |
| $150,000 to $199,999 | 5 | 1.6% |
| $200,000+ | 5 | 1.6% |
Household Income by Householder Age in Quapaw
The median household income in Quapaw is $47,125, with the highest median household income of $52,750 found in the 45 to 64 years age bracket for the primary householder. A total of 107 households (34.4%) fall into this category. Meanwhile, the 15 to 24 years age bracket for the primary householder has the lowest median household income of $37,000, with 14 households (4.5%) in this group.
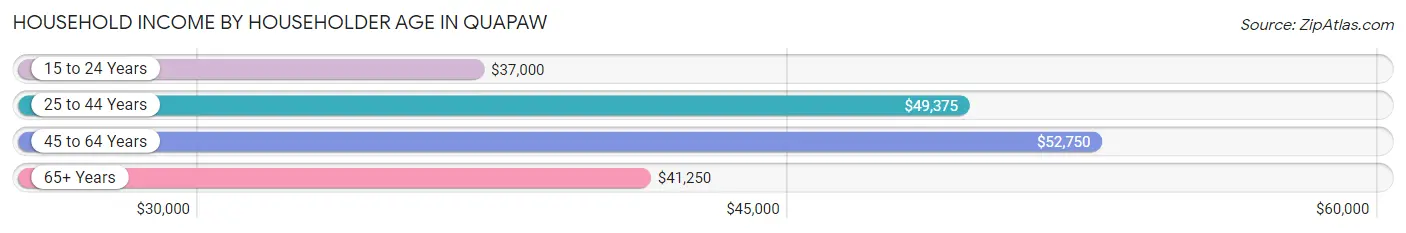
| Income Bracket | # Households | Median Income |
| 15 to 24 Years | 14 (4.5%) | $37,000 |
| 25 to 44 Years | 117 (37.6%) | $49,375 |
| 45 to 64 Years | 107 (34.4%) | $52,750 |
| 65+ Years | 73 (23.5%) | $41,250 |
| Total | 311 (100.0%) | $47,125 |
Poverty in Quapaw
Income Below Poverty by Sex and Age in Quapaw
With 23.2% poverty level for males and 20.4% for females among the residents of Quapaw, 12 to 14 year old males and under 5 year old females are the most vulnerable to poverty, with 13 males (43.3%) and 11 females (57.9%) in their respective age groups living below the poverty level.
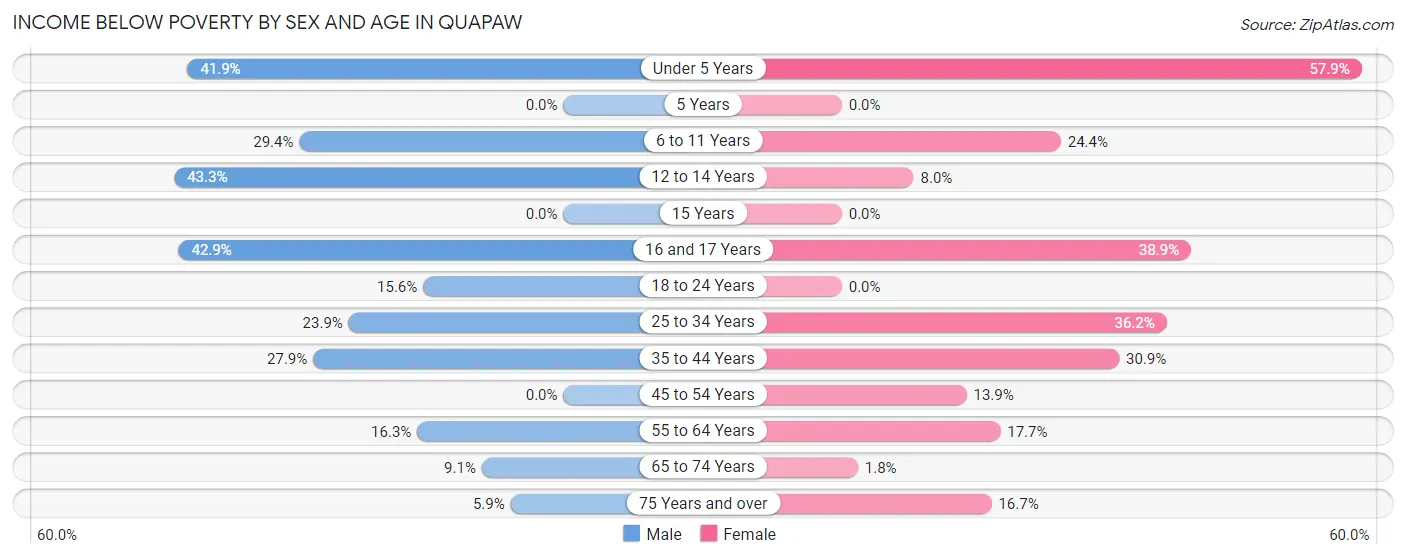
| Age Bracket | Male | Female |
| Under 5 Years | 18 (41.9%) | 11 (57.9%) |
| 5 Years | 0 (0.0%) | 0 (0.0%) |
| 6 to 11 Years | 10 (29.4%) | 10 (24.4%) |
| 12 to 14 Years | 13 (43.3%) | 2 (8.0%) |
| 15 Years | 0 (0.0%) | 0 (0.0%) |
| 16 and 17 Years | 6 (42.9%) | 7 (38.9%) |
| 18 to 24 Years | 5 (15.6%) | 0 (0.0%) |
| 25 to 34 Years | 11 (23.9%) | 17 (36.2%) |
| 35 to 44 Years | 17 (27.9%) | 21 (30.9%) |
| 45 to 54 Years | 0 (0.0%) | 5 (13.9%) |
| 55 to 64 Years | 7 (16.3%) | 9 (17.6%) |
| 65 to 74 Years | 3 (9.1%) | 1 (1.8%) |
| 75 Years and over | 1 (5.9%) | 2 (16.7%) |
| Total | 91 (23.2%) | 85 (20.4%) |
Income Above Poverty by Sex and Age in Quapaw
According to the poverty statistics in Quapaw, males aged 45 to 54 years and females aged 5 years are the age groups that are most secure financially, with 100.0% of males and 100.0% of females in these age groups living above the poverty line.
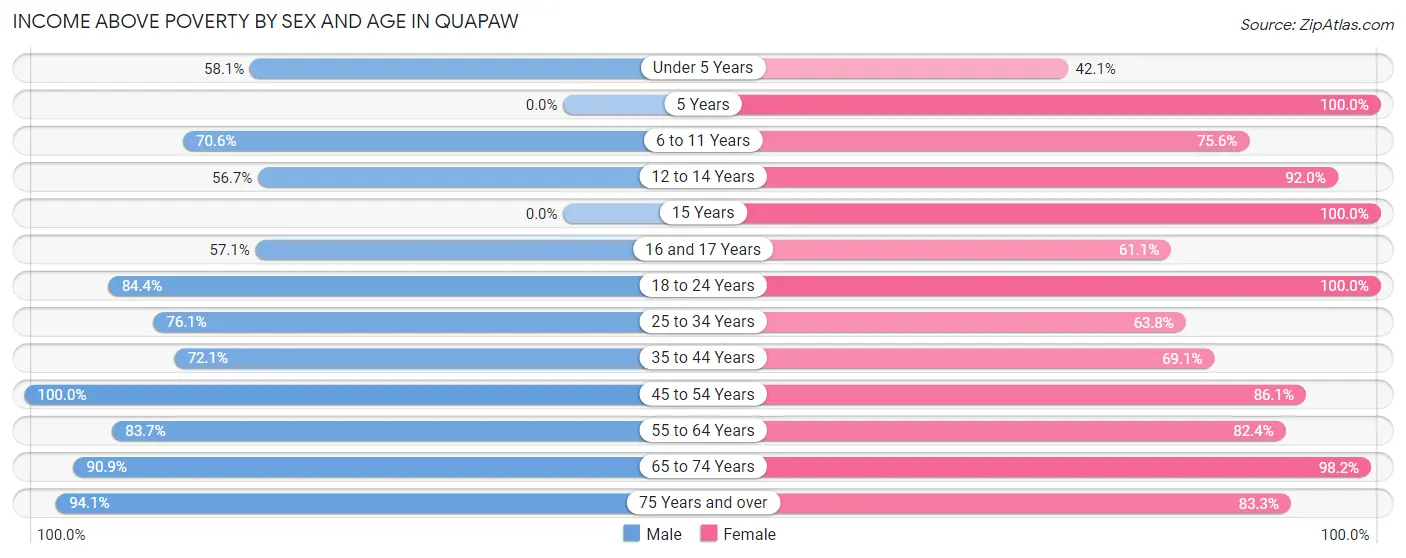
| Age Bracket | Male | Female |
| Under 5 Years | 25 (58.1%) | 8 (42.1%) |
| 5 Years | 0 (0.0%) | 2 (100.0%) |
| 6 to 11 Years | 24 (70.6%) | 31 (75.6%) |
| 12 to 14 Years | 17 (56.7%) | 23 (92.0%) |
| 15 Years | 0 (0.0%) | 16 (100.0%) |
| 16 and 17 Years | 8 (57.1%) | 11 (61.1%) |
| 18 to 24 Years | 27 (84.4%) | 26 (100.0%) |
| 25 to 34 Years | 35 (76.1%) | 30 (63.8%) |
| 35 to 44 Years | 44 (72.1%) | 47 (69.1%) |
| 45 to 54 Years | 39 (100.0%) | 31 (86.1%) |
| 55 to 64 Years | 36 (83.7%) | 42 (82.4%) |
| 65 to 74 Years | 30 (90.9%) | 55 (98.2%) |
| 75 Years and over | 16 (94.1%) | 10 (83.3%) |
| Total | 301 (76.8%) | 332 (79.6%) |
Income Below Poverty Among Married-Couple Families in Quapaw
The poverty statistics for married-couple families in Quapaw show that 6.1% or 8 of the total 132 families live below the poverty line. Families with 5 or more children have the highest poverty rate of 100.0%, comprising of 2 families. On the other hand, families with no children have the lowest poverty rate of 3.0%, which includes 2 families.
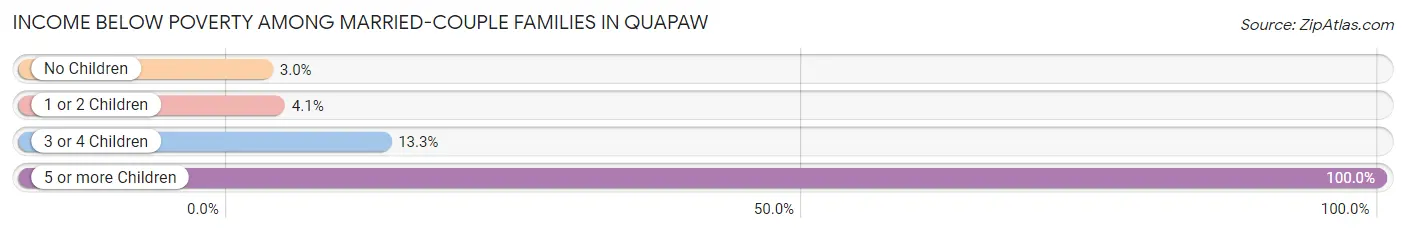
| Children | Above Poverty | Below Poverty |
| No Children | 64 (97.0%) | 2 (3.0%) |
| 1 or 2 Children | 47 (95.9%) | 2 (4.1%) |
| 3 or 4 Children | 13 (86.7%) | 2 (13.3%) |
| 5 or more Children | 0 (0.0%) | 2 (100.0%) |
| Total | 124 (93.9%) | 8 (6.1%) |
Income Below Poverty Among Single-Parent Households in Quapaw
According to the poverty data in Quapaw, 25.0% or 9 single-father households and 57.1% or 20 single-mother households are living below the poverty line. Among single-father households, those with 1 or 2 children have the highest poverty rate, with 7 households (36.8%) experiencing poverty. Likewise, among single-mother households, those with 3 or 4 children have the highest poverty rate, with 5 households (100.0%) falling below the poverty line.
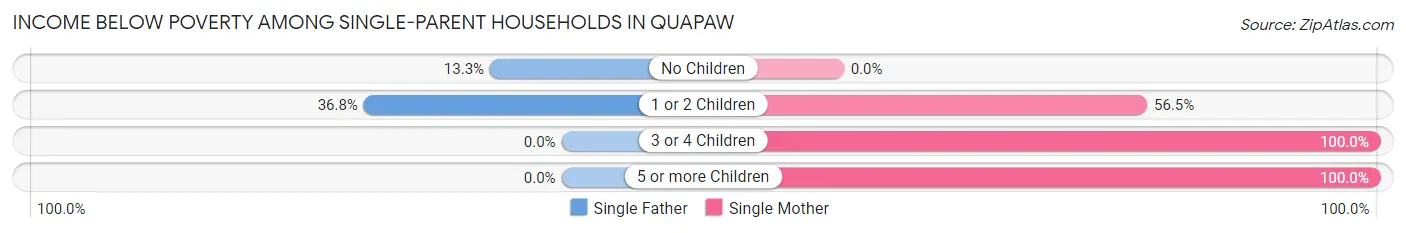
| Children | Single Father | Single Mother |
| No Children | 2 (13.3%) | 0 (0.0%) |
| 1 or 2 Children | 7 (36.8%) | 13 (56.5%) |
| 3 or 4 Children | 0 (0.0%) | 5 (100.0%) |
| 5 or more Children | 0 (0.0%) | 2 (100.0%) |
| Total | 9 (25.0%) | 20 (57.1%) |
Income Below Poverty Among Married-Couple vs Single-Parent Households in Quapaw
The poverty data for Quapaw shows that 8 of the married-couple family households (6.1%) and 29 of the single-parent households (40.8%) are living below the poverty level. Within the married-couple family households, those with 5 or more children have the highest poverty rate, with 2 households (100.0%) falling below the poverty line. Among the single-parent households, those with 5 or more children have the highest poverty rate, with 2 household (100.0%) living below poverty.
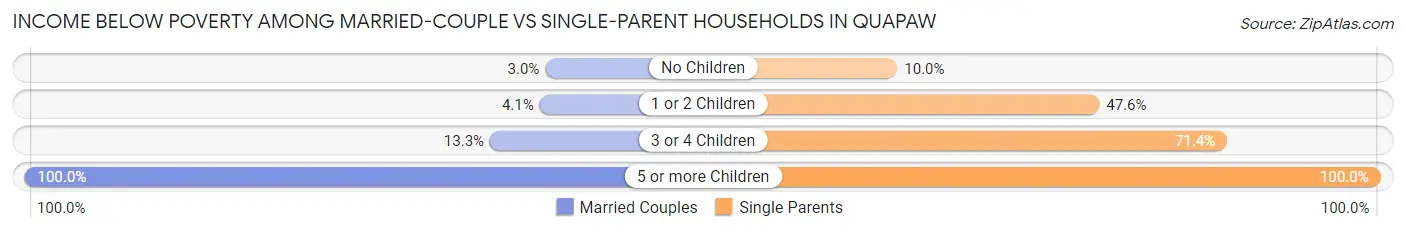
| Children | Married-Couple Families | Single-Parent Households |
| No Children | 2 (3.0%) | 2 (10.0%) |
| 1 or 2 Children | 2 (4.1%) | 20 (47.6%) |
| 3 or 4 Children | 2 (13.3%) | 5 (71.4%) |
| 5 or more Children | 2 (100.0%) | 2 (100.0%) |
| Total | 8 (6.1%) | 29 (40.8%) |
Race in Quapaw
The most populous races in Quapaw are White / Caucasian (473 | 55.6%), Native / Alaskan (310 | 36.4%), and Two or more Races (54 | 6.4%).
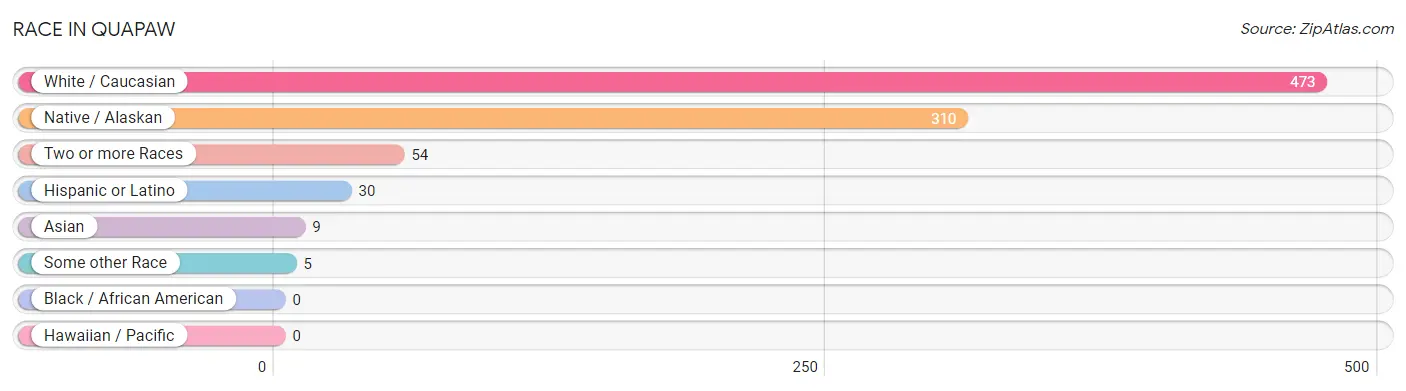
| Race | # Population | % Population |
| Asian | 9 | 1.1% |
| Black / African American | 0 | 0.0% |
| Hawaiian / Pacific | 0 | 0.0% |
| Hispanic or Latino | 30 | 3.5% |
| Native / Alaskan | 310 | 36.4% |
| White / Caucasian | 473 | 55.6% |
| Two or more Races | 54 | 6.4% |
| Some other Race | 5 | 0.6% |
| Total | 851 | 100.0% |
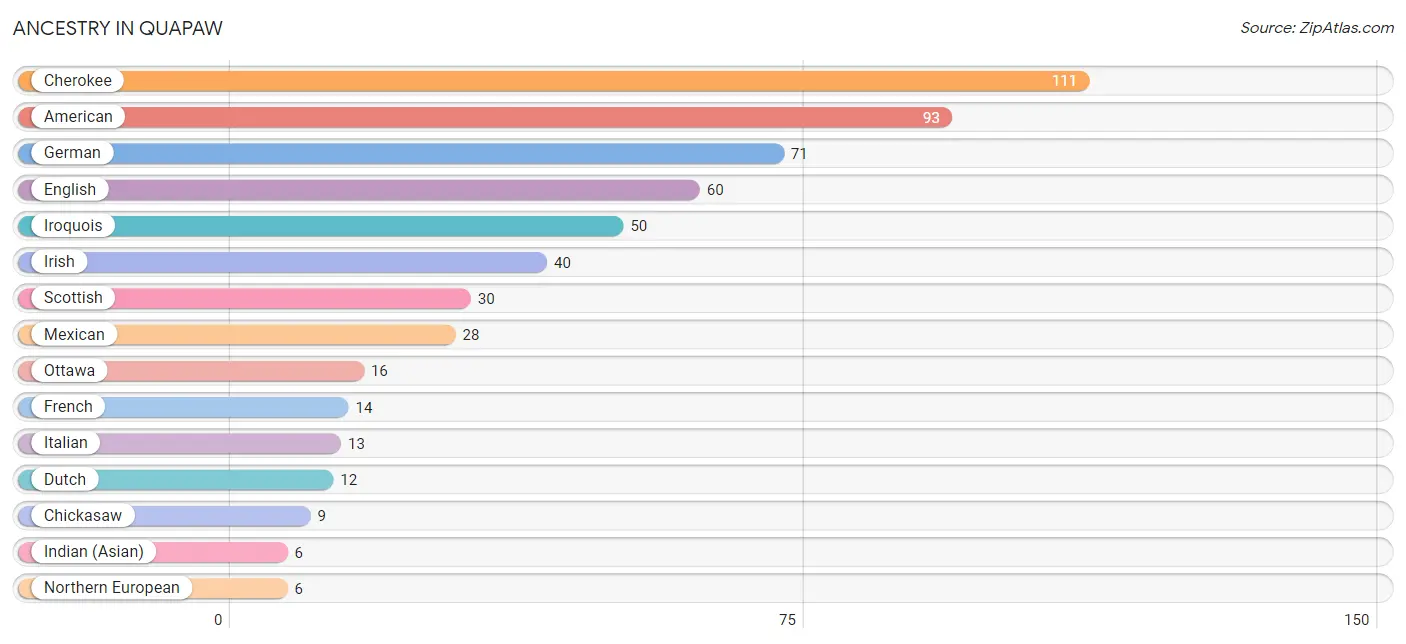
Ancestry in Quapaw
The most populous ancestries reported in Quapaw are Cherokee (111 | 13.0%), American (93 | 10.9%), German (71 | 8.3%), English (60 | 7.0%), and Iroquois (50 | 5.9%), together accounting for 45.2% of all Quapaw residents.
| Ancestry | # Population | % Population |
| American | 93 | 10.9% |
| Bhutanese | 3 | 0.4% |
| British | 3 | 0.4% |
| Celtic | 2 | 0.2% |
| Cherokee | 111 | 13.0% |
| Chickasaw | 9 | 1.1% |
| Choctaw | 5 | 0.6% |
| Czech | 3 | 0.4% |
| Delaware | 1 | 0.1% |
| Dutch | 12 | 1.4% |
| Dutch West Indian | 3 | 0.4% |
| English | 60 | 7.0% |
| French | 14 | 1.7% |
| French Canadian | 1 | 0.1% |
| German | 71 | 8.3% |
| German Russian | 2 | 0.2% |
| Hungarian | 1 | 0.1% |
| Indian (Asian) | 6 | 0.7% |
| Irish | 40 | 4.7% |
| Iroquois | 50 | 5.9% |
| Italian | 13 | 1.5% |
| Mexican | 28 | 3.3% |
| Northern European | 6 | 0.7% |
| Ottawa | 16 | 1.9% |
| Polish | 4 | 0.5% |
| Potawatomi | 6 | 0.7% |
| Puerto Rican | 2 | 0.2% |
| Scandinavian | 2 | 0.2% |
| Scotch-Irish | 1 | 0.1% |
| Scottish | 30 | 3.5% |
| Seminole | 1 | 0.1% |
| Shoshone | 2 | 0.2% |
| Swedish | 3 | 0.4% |
| Swiss | 5 | 0.6% |
| Thai | 3 | 0.4% | View All 35 Rows |
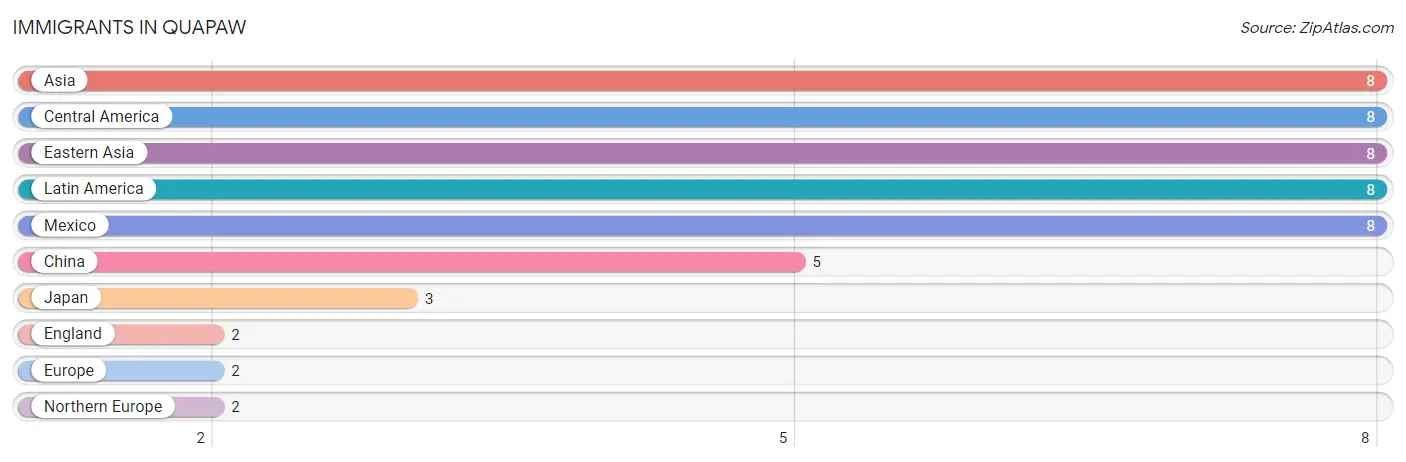
Immigrants in Quapaw
The most numerous immigrant groups reported in Quapaw came from Asia (8 | 0.9%), Central America (8 | 0.9%), Eastern Asia (8 | 0.9%), Latin America (8 | 0.9%), and Mexico (8 | 0.9%), together accounting for 4.7% of all Quapaw residents.
| Immigration Origin | # Population | % Population |
| Asia | 8 | 0.9% |
| Central America | 8 | 0.9% |
| China | 5 | 0.6% |
| Eastern Asia | 8 | 0.9% |
| England | 2 | 0.2% |
| Europe | 2 | 0.2% |
| Japan | 3 | 0.4% |
| Latin America | 8 | 0.9% |
| Mexico | 8 | 0.9% |
| Northern Europe | 2 | 0.2% | View All 10 Rows |
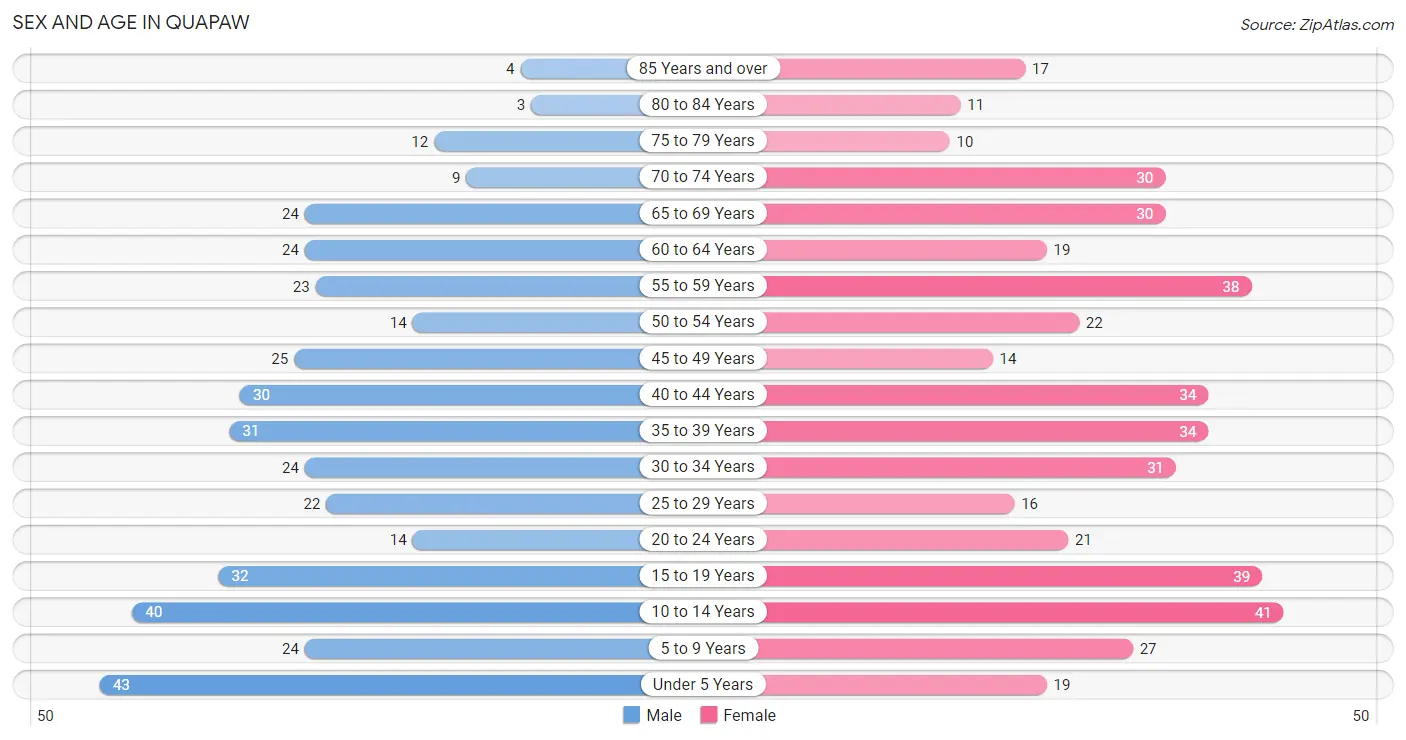
Sex and Age in Quapaw
Sex and Age in Quapaw
The most populous age groups in Quapaw are Under 5 Years (43 | 10.8%) for men and 10 to 14 Years (41 | 9.0%) for women.
| Age Bracket | Male | Female |
| Under 5 Years | 43 (10.8%) | 19 (4.2%) |
| 5 to 9 Years | 24 (6.0%) | 27 (6.0%) |
| 10 to 14 Years | 40 (10.1%) | 41 (9.0%) |
| 15 to 19 Years | 32 (8.0%) | 39 (8.6%) |
| 20 to 24 Years | 14 (3.5%) | 21 (4.6%) |
| 25 to 29 Years | 22 (5.5%) | 16 (3.5%) |
| 30 to 34 Years | 24 (6.0%) | 31 (6.8%) |
| 35 to 39 Years | 31 (7.8%) | 34 (7.5%) |
| 40 to 44 Years | 30 (7.5%) | 34 (7.5%) |
| 45 to 49 Years | 25 (6.3%) | 14 (3.1%) |
| 50 to 54 Years | 14 (3.5%) | 22 (4.9%) |
| 55 to 59 Years | 23 (5.8%) | 38 (8.4%) |
| 60 to 64 Years | 24 (6.0%) | 19 (4.2%) |
| 65 to 69 Years | 24 (6.0%) | 30 (6.6%) |
| 70 to 74 Years | 9 (2.3%) | 30 (6.6%) |
| 75 to 79 Years | 12 (3.0%) | 10 (2.2%) |
| 80 to 84 Years | 3 (0.7%) | 11 (2.4%) |
| 85 Years and over | 4 (1.0%) | 17 (3.7%) |
| Total | 398 (100.0%) | 453 (100.0%) |
Families and Households in Quapaw
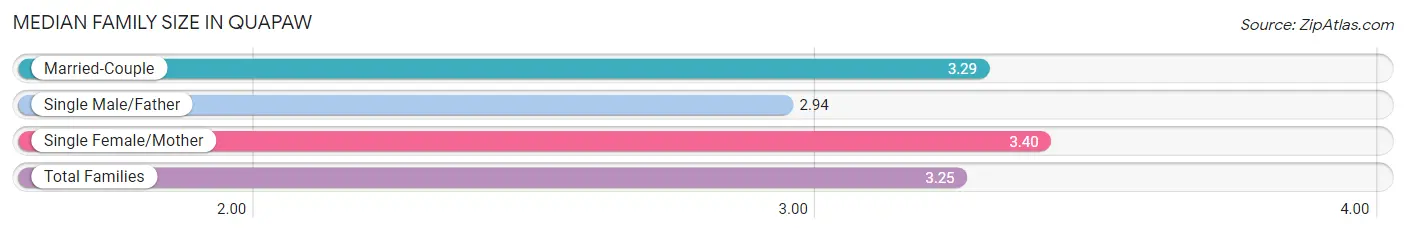
Median Family Size in Quapaw
The median family size in Quapaw is 3.25 persons per family, with single female/mother families (35 | 17.2%) accounting for the largest median family size of 3.4 persons per family. On the other hand, single male/father families (36 | 17.7%) represent the smallest median family size with 2.94 persons per family.
| Family Type | # Families | Family Size |
| Married-Couple | 132 (65.0%) | 3.29 |
| Single Male/Father | 36 (17.7%) | 2.94 |
| Single Female/Mother | 35 (17.2%) | 3.40 |
| Total Families | 203 (100.0%) | 3.25 |
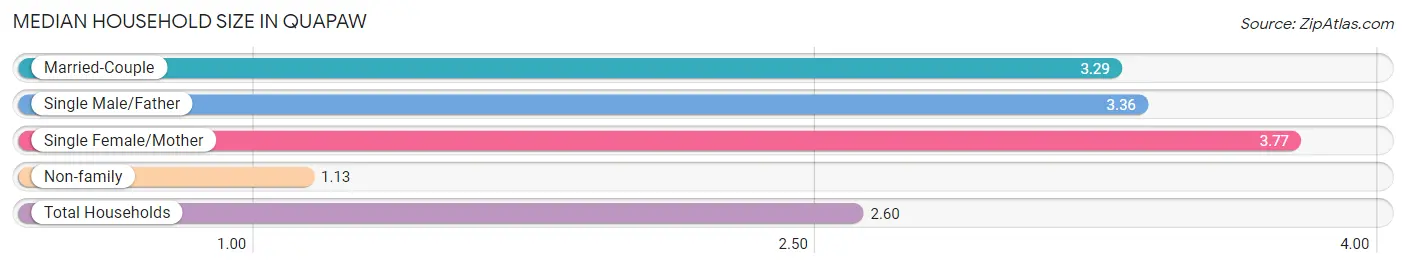
Median Household Size in Quapaw
The median household size in Quapaw is 2.60 persons per household, with single female/mother households (35 | 11.3%) accounting for the largest median household size of 3.77 persons per household. non-family households (108 | 34.7%) represent the smallest median household size with 1.13 persons per household.
| Household Type | # Households | Household Size |
| Married-Couple | 132 (42.4%) | 3.29 |
| Single Male/Father | 36 (11.6%) | 3.36 |
| Single Female/Mother | 35 (11.3%) | 3.77 |
| Non-family | 108 (34.7%) | 1.13 |
| Total Households | 311 (100.0%) | 2.60 |
Household Size by Marriage Status in Quapaw
Out of a total of 311 households in Quapaw, 203 (65.3%) are family households, while 108 (34.7%) are nonfamily households. The most numerous type of family households are 2-person households, comprising 81, and the most common type of nonfamily households are 1-person households, comprising 95.
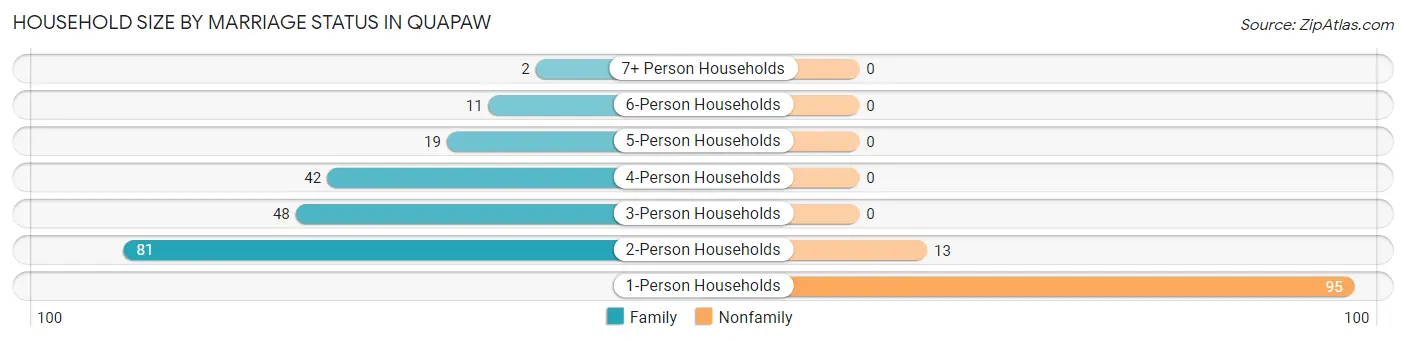
| Household Size | Family Households | Nonfamily Households |
| 1-Person Households | - | 95 (30.5%) |
| 2-Person Households | 81 (26.1%) | 13 (4.2%) |
| 3-Person Households | 48 (15.4%) | 0 (0.0%) |
| 4-Person Households | 42 (13.5%) | 0 (0.0%) |
| 5-Person Households | 19 (6.1%) | 0 (0.0%) |
| 6-Person Households | 11 (3.5%) | 0 (0.0%) |
| 7+ Person Households | 2 (0.6%) | 0 (0.0%) |
| Total | 203 (65.3%) | 108 (34.7%) |
Female Fertility in Quapaw
Fertility by Age in Quapaw
Average fertility rate in Quapaw is 26.0 births per 1,000 women. Women in the age bracket of 20 to 34 years have the highest fertility rate with 74.0 births per 1,000 women. Women in the age bracket of 20 to 34 years acount for 100.0% of all women with births.
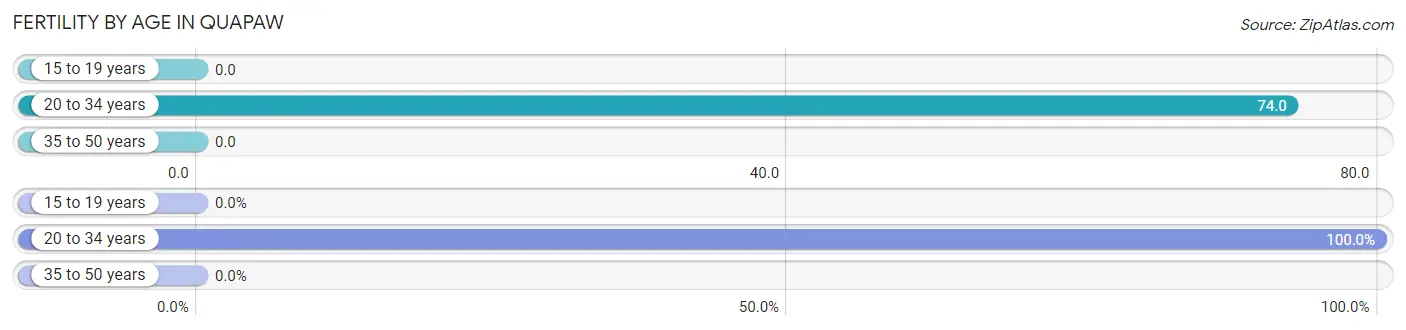
| Age Bracket | Women with Births | Births / 1,000 Women |
| 15 to 19 years | 0 (0.0%) | 0.0 |
| 20 to 34 years | 5 (100.0%) | 74.0 |
| 35 to 50 years | 0 (0.0%) | 0.0 |
| Total | 5 (100.0%) | 26.0 |
Fertility by Age by Marriage Status in Quapaw
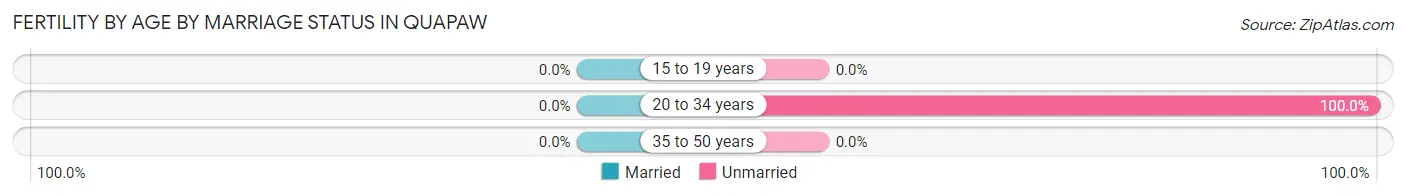
| Age Bracket | Married | Unmarried |
| 15 to 19 years | 0 (0.0%) | 0 (0.0%) |
| 20 to 34 years | 0 (0.0%) | 5 (100.0%) |
| 35 to 50 years | 0 (0.0%) | 0 (0.0%) |
| Total | 0 (0.0%) | 5 (100.0%) |
Fertility by Education in Quapaw
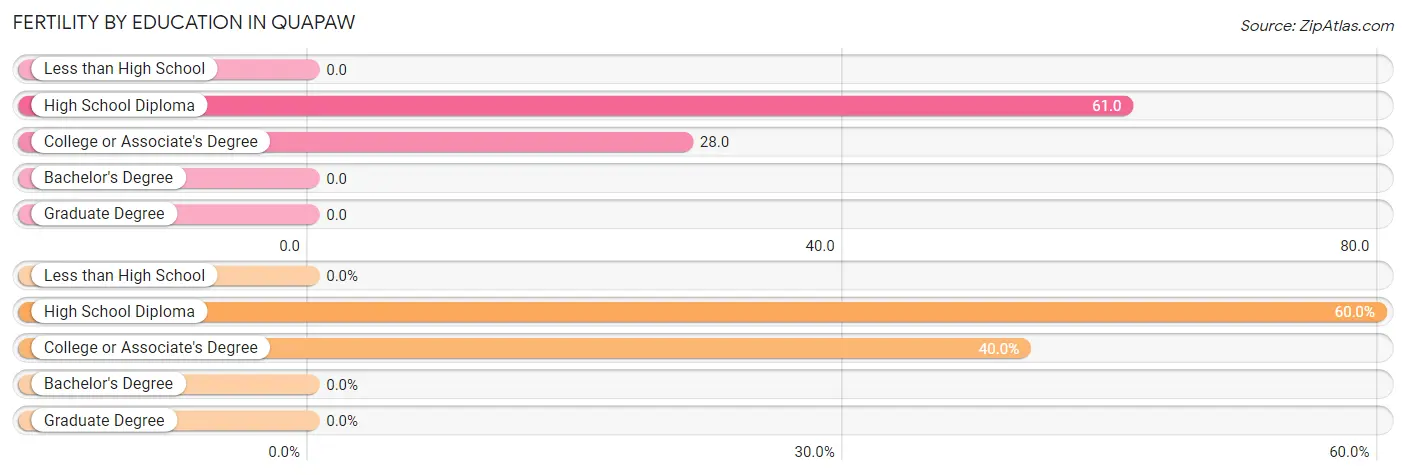
| Educational Attainment | Women with Births | Births / 1,000 Women |
| Less than High School | 0 (0.0%) | 0.0 |
| High School Diploma | 3 (60.0%) | 61.0 |
| College or Associate's Degree | 2 (40.0%) | 28.0 |
| Bachelor's Degree | 0 (0.0%) | 0.0 |
| Graduate Degree | 0 (0.0%) | 0.0 |
| Total | 5 (100.0%) | 26.0 |
Fertility by Education by Marriage Status in Quapaw
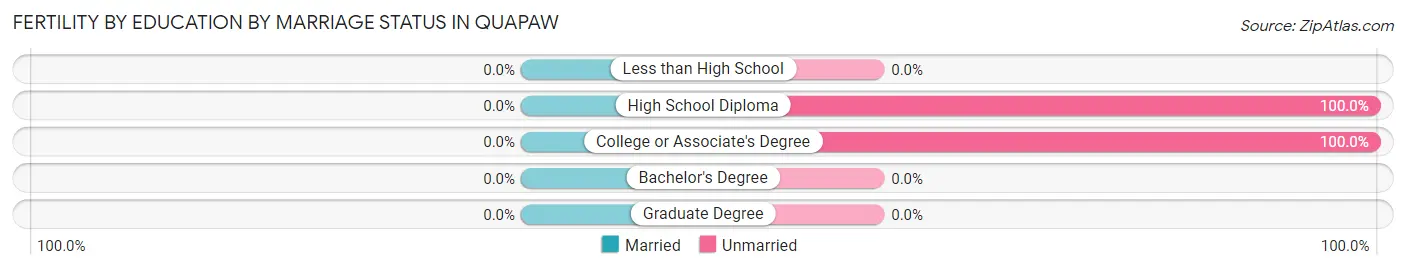
| Educational Attainment | Married | Unmarried |
| Less than High School | 0 (0.0%) | 0 (0.0%) |
| High School Diploma | 0 (0.0%) | 3 (100.0%) |
| College or Associate's Degree | 0 (0.0%) | 2 (100.0%) |
| Bachelor's Degree | 0 (0.0%) | 0 (0.0%) |
| Graduate Degree | 0 (0.0%) | 0 (0.0%) |
| Total | 0 (0.0%) | 5 (100.0%) |
Employment Characteristics in Quapaw
Employment by Class of Employer in Quapaw
Among the 338 employed individuals in Quapaw, private company employees (221 | 65.4%), federal government employees (44 | 13.0%), and local government employees (27 | 8.0%) make up the most common classes of employment.
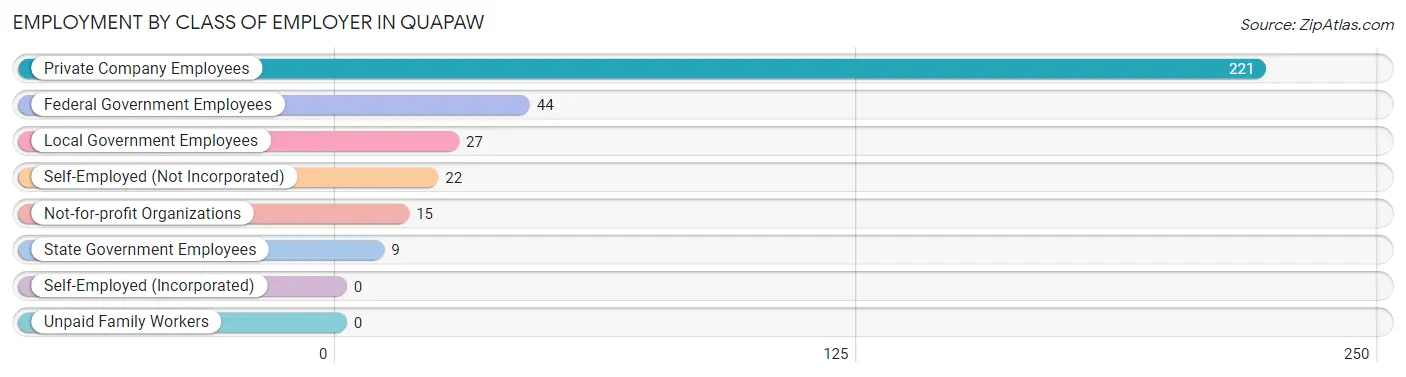
| Employer Class | # Employees | % Employees |
| Private Company Employees | 221 | 65.4% |
| Self-Employed (Incorporated) | 0 | 0.0% |
| Self-Employed (Not Incorporated) | 22 | 6.5% |
| Not-for-profit Organizations | 15 | 4.4% |
| Local Government Employees | 27 | 8.0% |
| State Government Employees | 9 | 2.7% |
| Federal Government Employees | 44 | 13.0% |
| Unpaid Family Workers | 0 | 0.0% |
| Total | 338 | 100.0% |
Employment Status by Age in Quapaw
According to the labor force statistics for Quapaw, out of the total population over 16 years of age (641), 56.2% or 360 individuals are in the labor force, with 5.3% or 19 of them unemployed. The age group with the highest labor force participation rate is 45 to 54 years, with 85.3% or 64 individuals in the labor force. Within the labor force, the 16 to 19 years age range has the highest percentage of unemployed individuals, with 21.1% or 4 of them being unemployed.
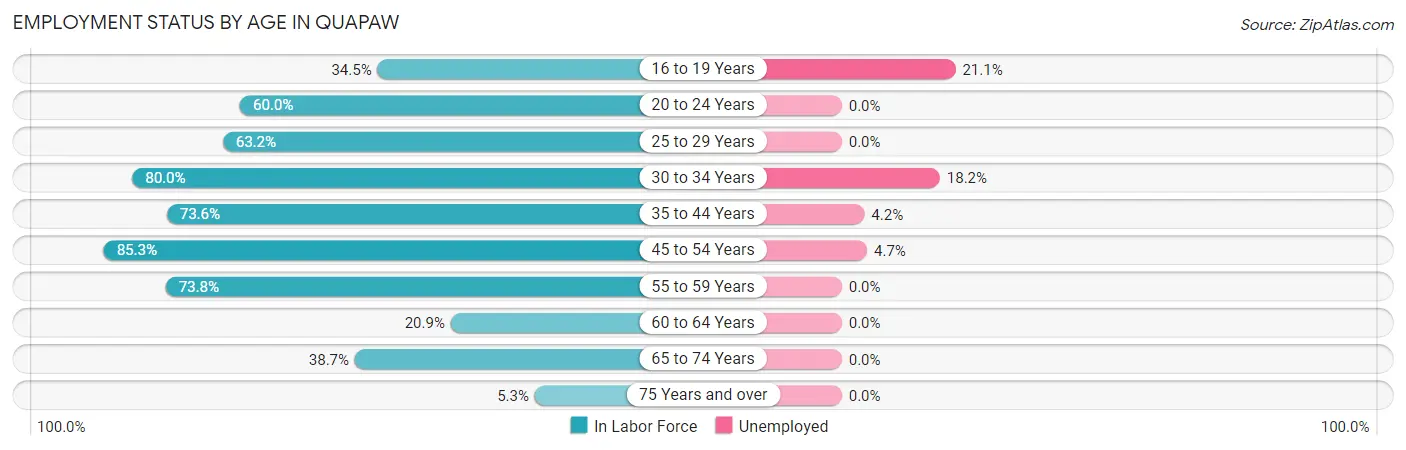
| Age Bracket | In Labor Force | Unemployed |
| 16 to 19 Years | 19 (34.5%) | 4 (21.1%) |
| 20 to 24 Years | 21 (60.0%) | 0 (0.0%) |
| 25 to 29 Years | 24 (63.2%) | 0 (0.0%) |
| 30 to 34 Years | 44 (80.0%) | 8 (18.2%) |
| 35 to 44 Years | 95 (73.6%) | 4 (4.2%) |
| 45 to 54 Years | 64 (85.3%) | 3 (4.7%) |
| 55 to 59 Years | 45 (73.8%) | 0 (0.0%) |
| 60 to 64 Years | 9 (20.9%) | 0 (0.0%) |
| 65 to 74 Years | 36 (38.7%) | 0 (0.0%) |
| 75 Years and over | 3 (5.3%) | 0 (0.0%) |
| Total | 360 (56.2%) | 19 (5.3%) |
Employment Status by Educational Attainment in Quapaw
According to labor force statistics for Quapaw, 70.1% of individuals (281) out of the total population between 25 and 64 years of age (401) are in the labor force, with 5.3% or 15 of them being unemployed. The group with the highest labor force participation rate are those with the educational attainment of college / associate degree, with 81.0% or 124 individuals in the labor force. Within the labor force, individuals with less than high school education have the highest percentage of unemployment, with 21.9% or 7 of them being unemployed.
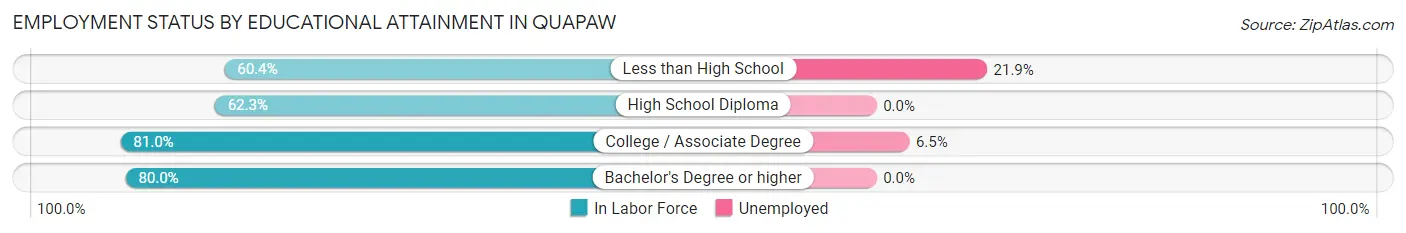
| Educational Attainment | In Labor Force | Unemployed |
| Less than High School | 32 (60.4%) | 12 (21.9%) |
| High School Diploma | 109 (62.3%) | 0 (0.0%) |
| College / Associate Degree | 124 (81.0%) | 10 (6.5%) |
| Bachelor's Degree or higher | 16 (80.0%) | 0 (0.0%) |
| Total | 281 (70.1%) | 21 (5.3%) |
Employment Occupations by Sex in Quapaw
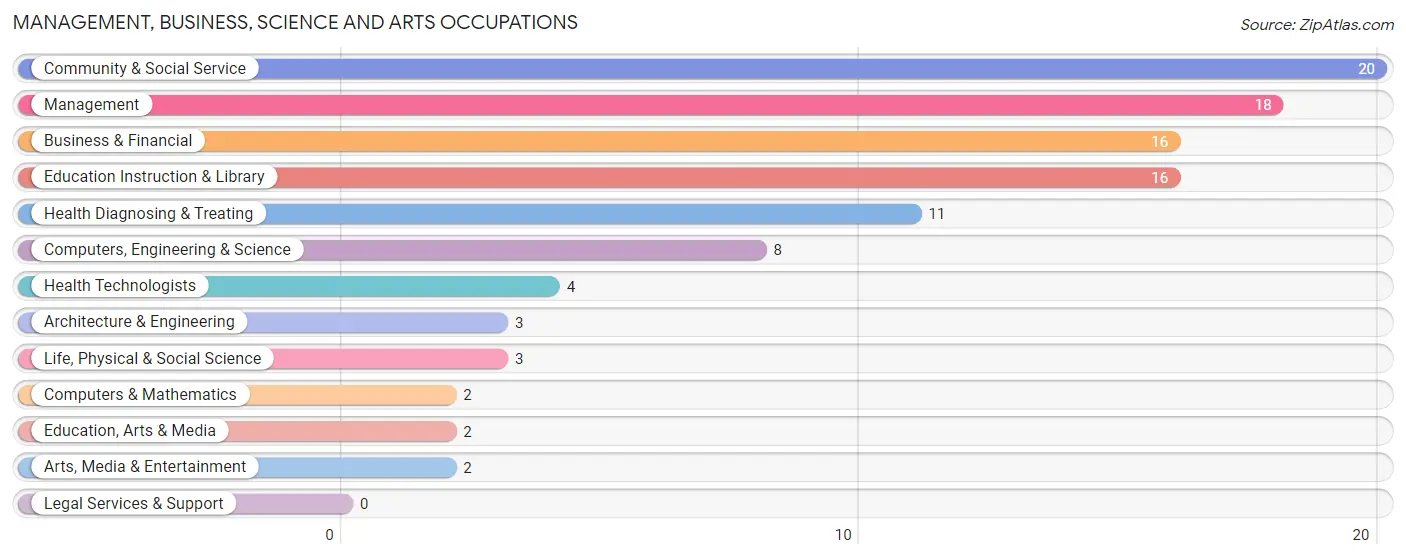
Management, Business, Science and Arts Occupations
The most common Management, Business, Science and Arts occupations in Quapaw are Community & Social Service (20 | 5.9%), Management (18 | 5.3%), Business & Financial (16 | 4.7%), Education Instruction & Library (16 | 4.7%), and Health Diagnosing & Treating (11 | 3.2%).
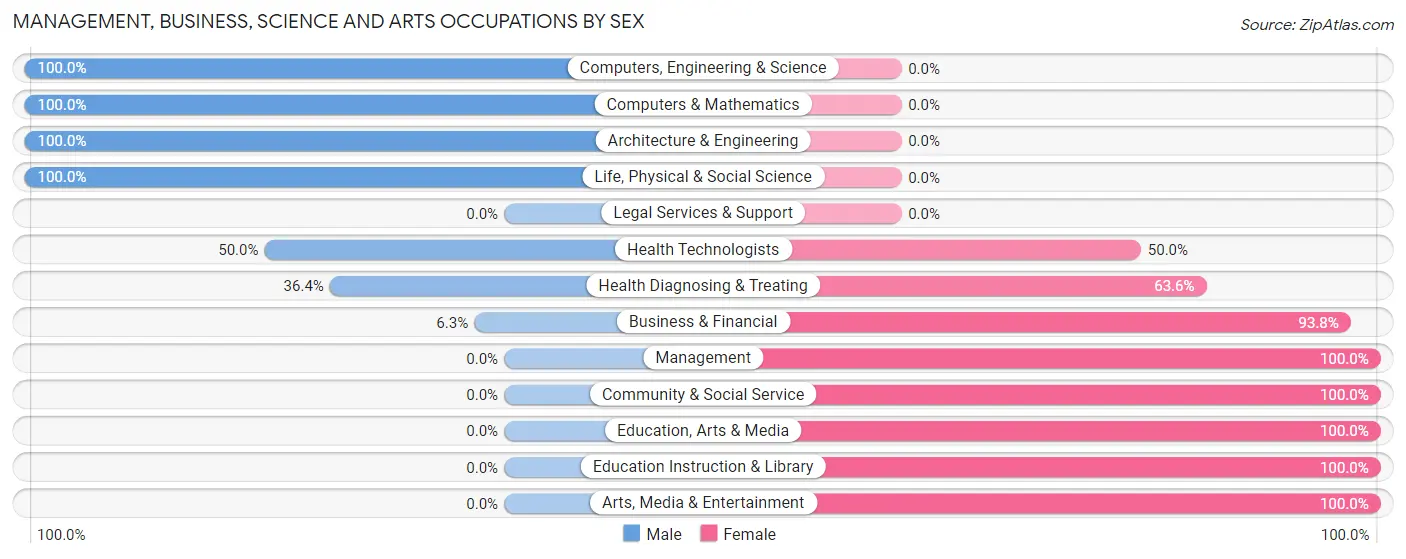
Management, Business, Science and Arts Occupations by Sex
Within the Management, Business, Science and Arts occupations in Quapaw, the most male-oriented occupations are Computers, Engineering & Science (100.0%), Computers & Mathematics (100.0%), and Architecture & Engineering (100.0%), while the most female-oriented occupations are Management (100.0%), Community & Social Service (100.0%), and Education, Arts & Media (100.0%).
| Occupation | Male | Female |
| Management | 0 (0.0%) | 18 (100.0%) |
| Business & Financial | 1 (6.2%) | 15 (93.8%) |
| Computers, Engineering & Science | 8 (100.0%) | 0 (0.0%) |
| Computers & Mathematics | 2 (100.0%) | 0 (0.0%) |
| Architecture & Engineering | 3 (100.0%) | 0 (0.0%) |
| Life, Physical & Social Science | 3 (100.0%) | 0 (0.0%) |
| Community & Social Service | 0 (0.0%) | 20 (100.0%) |
| Education, Arts & Media | 0 (0.0%) | 2 (100.0%) |
| Legal Services & Support | 0 (0.0%) | 0 (0.0%) |
| Education Instruction & Library | 0 (0.0%) | 16 (100.0%) |
| Arts, Media & Entertainment | 0 (0.0%) | 2 (100.0%) |
| Health Diagnosing & Treating | 4 (36.4%) | 7 (63.6%) |
| Health Technologists | 2 (50.0%) | 2 (50.0%) |
| Total (Category) | 13 (17.8%) | 60 (82.2%) |
| Total (Overall) | 164 (48.1%) | 177 (51.9%) |
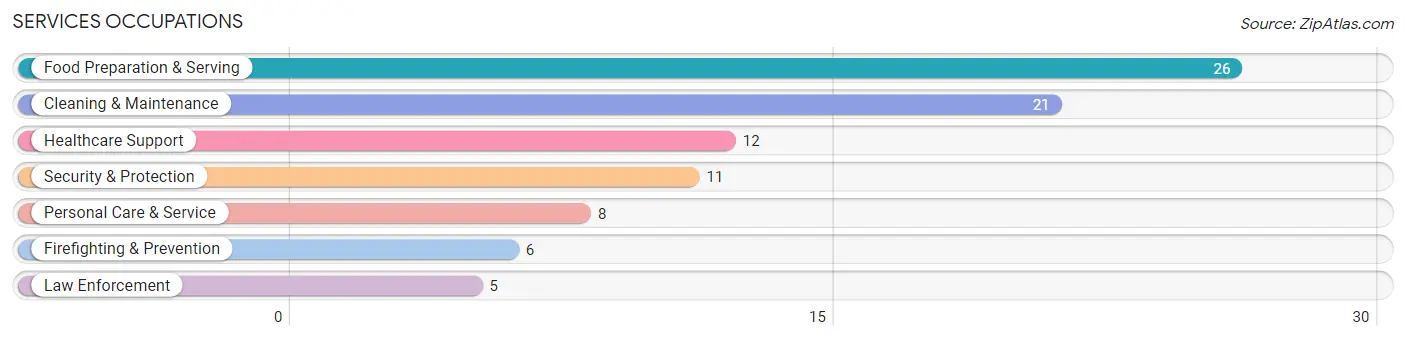
Services Occupations
The most common Services occupations in Quapaw are Food Preparation & Serving (26 | 7.6%), Cleaning & Maintenance (21 | 6.2%), Healthcare Support (12 | 3.5%), Security & Protection (11 | 3.2%), and Personal Care & Service (8 | 2.4%).
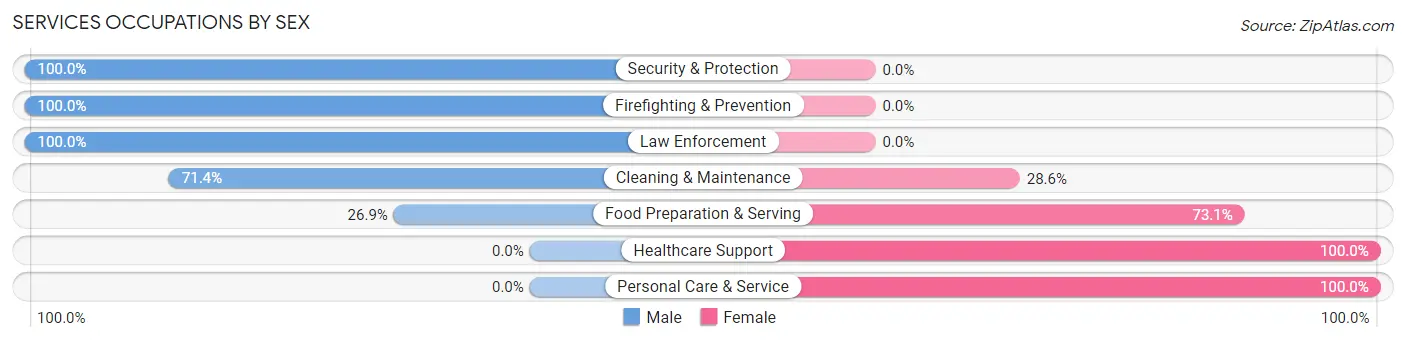
Services Occupations by Sex
Within the Services occupations in Quapaw, the most male-oriented occupations are Security & Protection (100.0%), Firefighting & Prevention (100.0%), and Law Enforcement (100.0%), while the most female-oriented occupations are Healthcare Support (100.0%), Personal Care & Service (100.0%), and Food Preparation & Serving (73.1%).
| Occupation | Male | Female |
| Healthcare Support | 0 (0.0%) | 12 (100.0%) |
| Security & Protection | 11 (100.0%) | 0 (0.0%) |
| Firefighting & Prevention | 6 (100.0%) | 0 (0.0%) |
| Law Enforcement | 5 (100.0%) | 0 (0.0%) |
| Food Preparation & Serving | 7 (26.9%) | 19 (73.1%) |
| Cleaning & Maintenance | 15 (71.4%) | 6 (28.6%) |
| Personal Care & Service | 0 (0.0%) | 8 (100.0%) |
| Total (Category) | 33 (42.3%) | 45 (57.7%) |
| Total (Overall) | 164 (48.1%) | 177 (51.9%) |
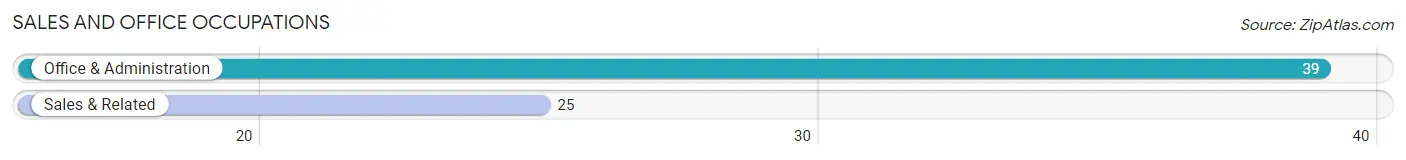
Sales and Office Occupations
The most common Sales and Office occupations in Quapaw are Office & Administration (39 | 11.4%), and Sales & Related (25 | 7.3%).
Sales and Office Occupations by Sex
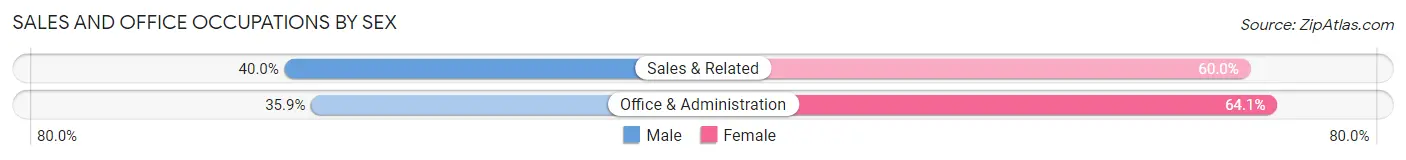
| Occupation | Male | Female |
| Sales & Related | 10 (40.0%) | 15 (60.0%) |
| Office & Administration | 14 (35.9%) | 25 (64.1%) |
| Total (Category) | 24 (37.5%) | 40 (62.5%) |
| Total (Overall) | 164 (48.1%) | 177 (51.9%) |
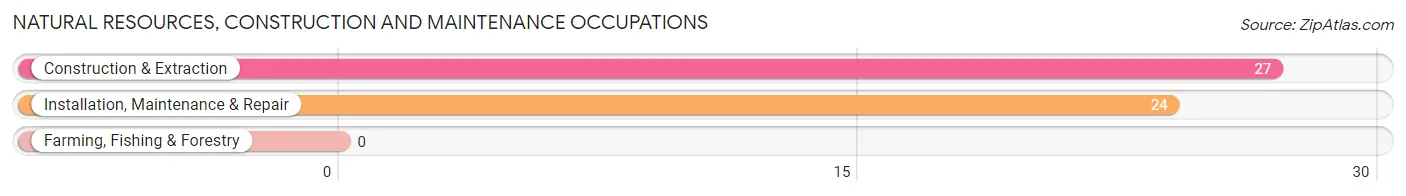
Natural Resources, Construction and Maintenance Occupations
The most common Natural Resources, Construction and Maintenance occupations in Quapaw are Construction & Extraction (27 | 7.9%), and Installation, Maintenance & Repair (24 | 7.0%).
Natural Resources, Construction and Maintenance Occupations by Sex
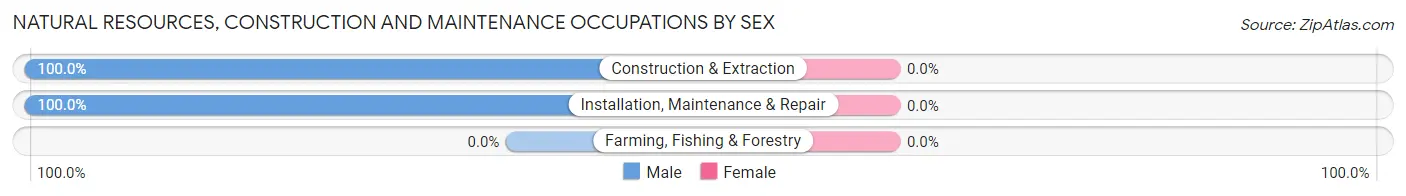
| Occupation | Male | Female |
| Farming, Fishing & Forestry | 0 (0.0%) | 0 (0.0%) |
| Construction & Extraction | 27 (100.0%) | 0 (0.0%) |
| Installation, Maintenance & Repair | 24 (100.0%) | 0 (0.0%) |
| Total (Category) | 51 (100.0%) | 0 (0.0%) |
| Total (Overall) | 164 (48.1%) | 177 (51.9%) |
Production, Transportation and Moving Occupations
The most common Production, Transportation and Moving occupations in Quapaw are Production (52 | 15.2%), Material Moving (18 | 5.3%), and Transportation (5 | 1.5%).
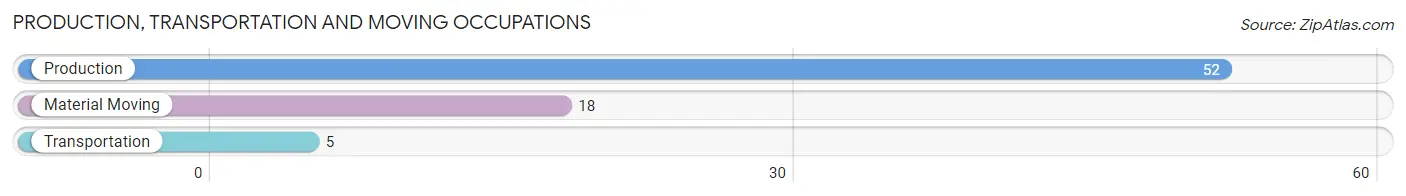
Production, Transportation and Moving Occupations by Sex
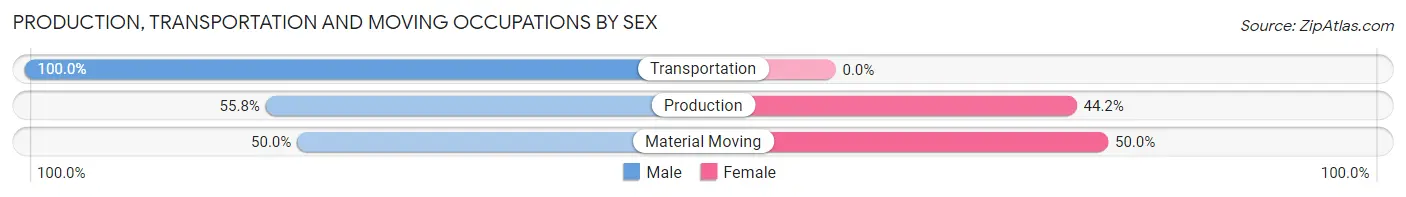
| Occupation | Male | Female |
| Production | 29 (55.8%) | 23 (44.2%) |
| Transportation | 5 (100.0%) | 0 (0.0%) |
| Material Moving | 9 (50.0%) | 9 (50.0%) |
| Total (Category) | 43 (57.3%) | 32 (42.7%) |
| Total (Overall) | 164 (48.1%) | 177 (51.9%) |
Employment Industries by Sex in Quapaw
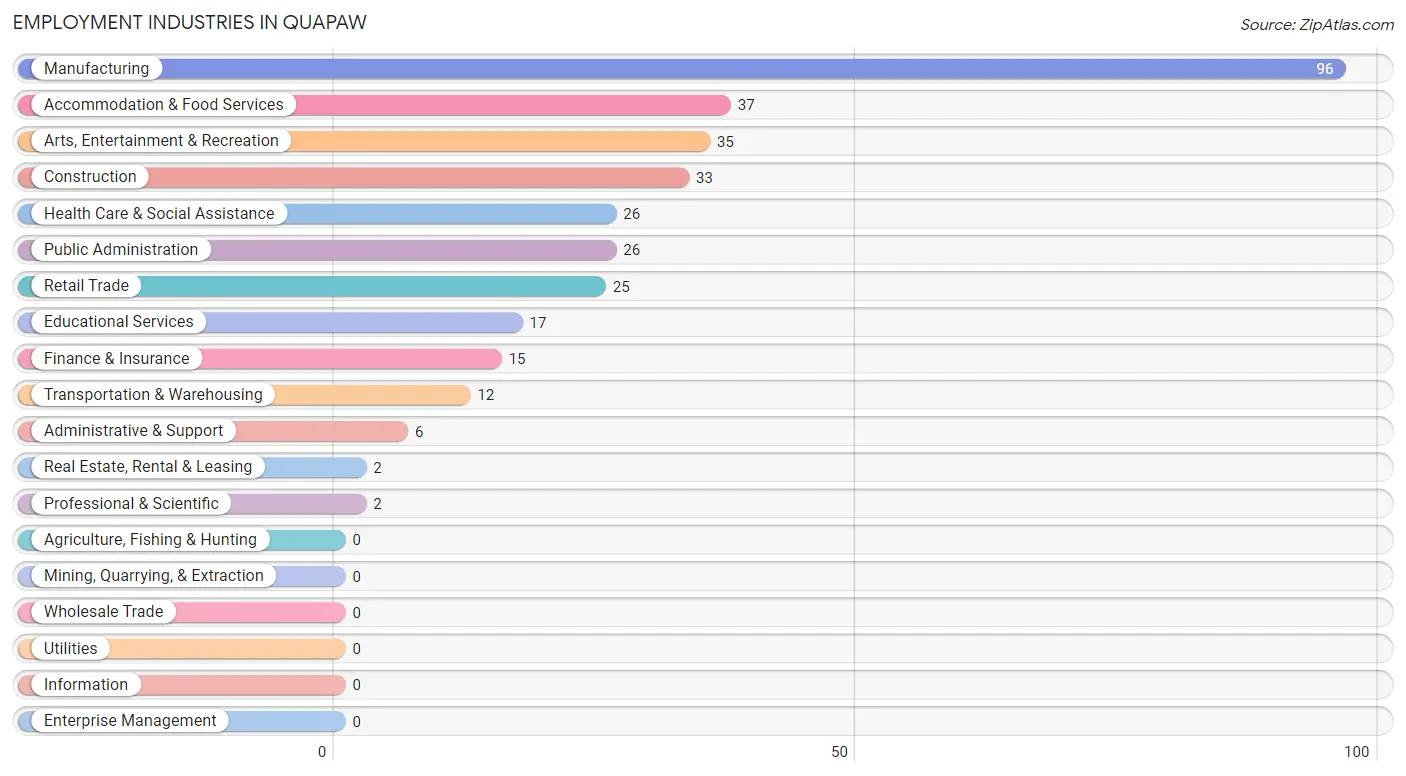
Employment Industries in Quapaw
The major employment industries in Quapaw include Manufacturing (96 | 28.1%), Accommodation & Food Services (37 | 10.8%), Arts, Entertainment & Recreation (35 | 10.3%), Construction (33 | 9.7%), and Health Care & Social Assistance (26 | 7.6%).
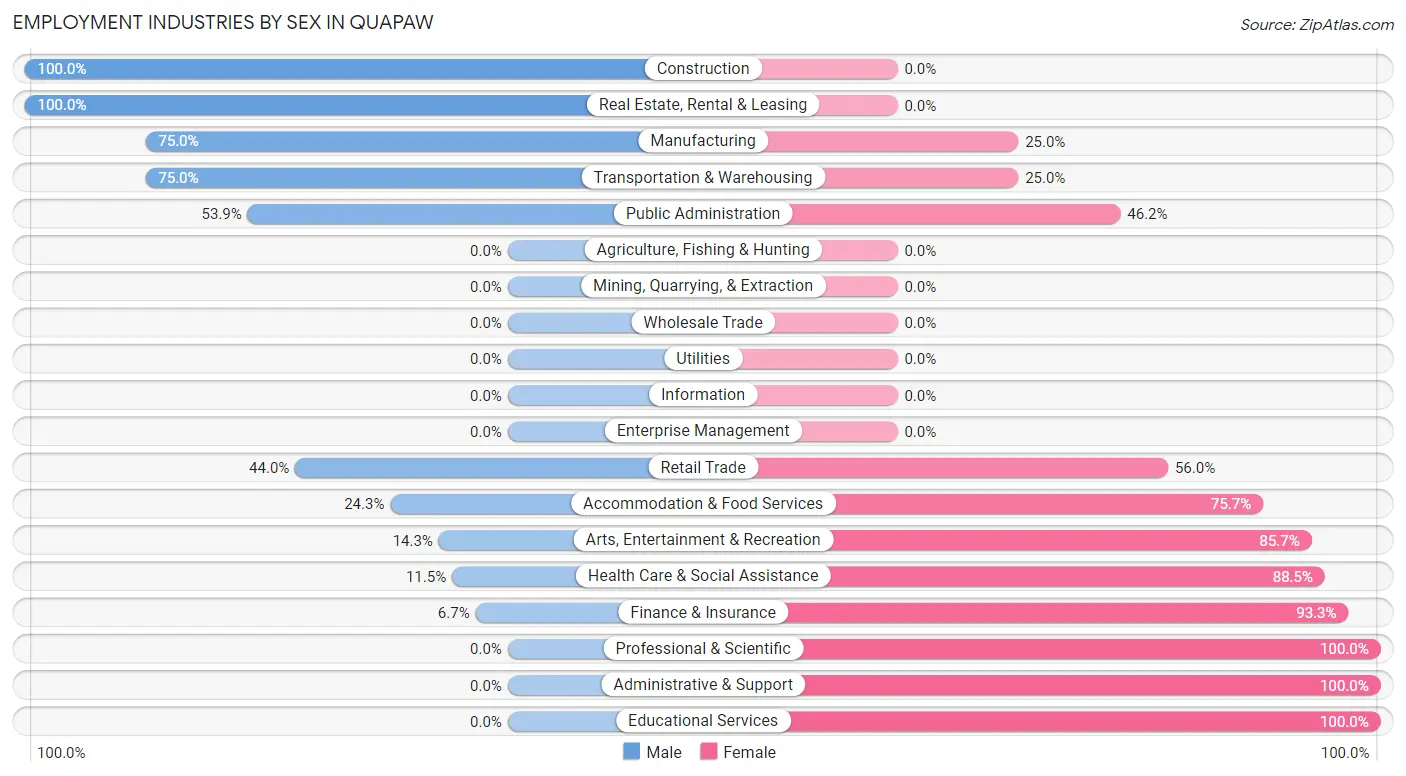
Employment Industries by Sex in Quapaw
The Quapaw industries that see more men than women are Construction (100.0%), Real Estate, Rental & Leasing (100.0%), and Manufacturing (75.0%), whereas the industries that tend to have a higher number of women are Professional & Scientific (100.0%), Administrative & Support (100.0%), and Educational Services (100.0%).
| Industry | Male | Female |
| Agriculture, Fishing & Hunting | 0 (0.0%) | 0 (0.0%) |
| Mining, Quarrying, & Extraction | 0 (0.0%) | 0 (0.0%) |
| Construction | 33 (100.0%) | 0 (0.0%) |
| Manufacturing | 72 (75.0%) | 24 (25.0%) |
| Wholesale Trade | 0 (0.0%) | 0 (0.0%) |
| Retail Trade | 11 (44.0%) | 14 (56.0%) |
| Transportation & Warehousing | 9 (75.0%) | 3 (25.0%) |
| Utilities | 0 (0.0%) | 0 (0.0%) |
| Information | 0 (0.0%) | 0 (0.0%) |
| Finance & Insurance | 1 (6.7%) | 14 (93.3%) |
| Real Estate, Rental & Leasing | 2 (100.0%) | 0 (0.0%) |
| Professional & Scientific | 0 (0.0%) | 2 (100.0%) |
| Enterprise Management | 0 (0.0%) | 0 (0.0%) |
| Administrative & Support | 0 (0.0%) | 6 (100.0%) |
| Educational Services | 0 (0.0%) | 17 (100.0%) |
| Health Care & Social Assistance | 3 (11.5%) | 23 (88.5%) |
| Arts, Entertainment & Recreation | 5 (14.3%) | 30 (85.7%) |
| Accommodation & Food Services | 9 (24.3%) | 28 (75.7%) |
| Public Administration | 14 (53.8%) | 12 (46.2%) |
| Total | 164 (48.1%) | 177 (51.9%) |
Education in Quapaw
School Enrollment in Quapaw
The most common levels of schooling among the 235 students in Quapaw are high school (68 | 28.9%), elementary school (62 | 26.4%), and middle school (54 | 23.0%).
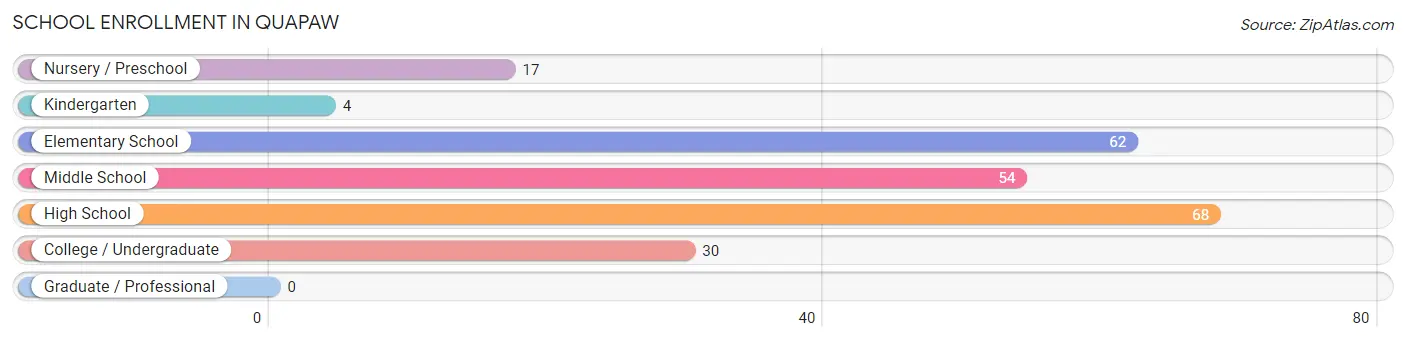
| School Level | # Students | % Students |
| Nursery / Preschool | 17 | 7.2% |
| Kindergarten | 4 | 1.7% |
| Elementary School | 62 | 26.4% |
| Middle School | 54 | 23.0% |
| High School | 68 | 28.9% |
| College / Undergraduate | 30 | 12.8% |
| Graduate / Professional | 0 | 0.0% |
| Total | 235 | 100.0% |
School Enrollment by Age by Funding Source in Quapaw
Out of a total of 235 students who are enrolled in schools in Quapaw, 8 (3.4%) attend a private institution, while the remaining 227 (96.6%) are enrolled in public schools. The age group of 25 to 34 year olds has the highest likelihood of being enrolled in private schools, with 2 (20.0% in the age bracket) enrolled. Conversely, the age group of 3 to 4 year olds has the lowest likelihood of being enrolled in a private school, with 15 (100.0% in the age bracket) attending a public institution.
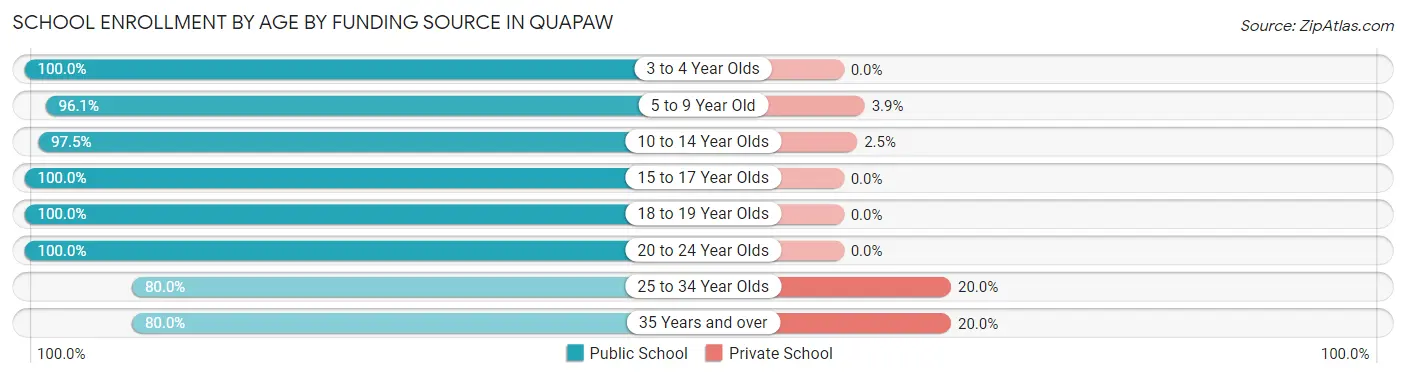
| Age Bracket | Public School | Private School |
| 3 to 4 Year Olds | 15 (100.0%) | 0 (0.0%) |
| 5 to 9 Year Old | 49 (96.1%) | 2 (3.9%) |
| 10 to 14 Year Olds | 77 (97.5%) | 2 (2.5%) |
| 15 to 17 Year Olds | 48 (100.0%) | 0 (0.0%) |
| 18 to 19 Year Olds | 9 (100.0%) | 0 (0.0%) |
| 20 to 24 Year Olds | 13 (100.0%) | 0 (0.0%) |
| 25 to 34 Year Olds | 8 (80.0%) | 2 (20.0%) |
| 35 Years and over | 8 (80.0%) | 2 (20.0%) |
| Total | 227 (96.6%) | 8 (3.4%) |
Educational Attainment by Field of Study in Quapaw
Business (20 | 45.5%), education (8 | 18.2%), psychology (4 | 9.1%), bio, nature & agricultural (3 | 6.8%), and science & technology (3 | 6.8%) are the most common fields of study among 44 individuals in Quapaw who have obtained a bachelor's degree or higher.
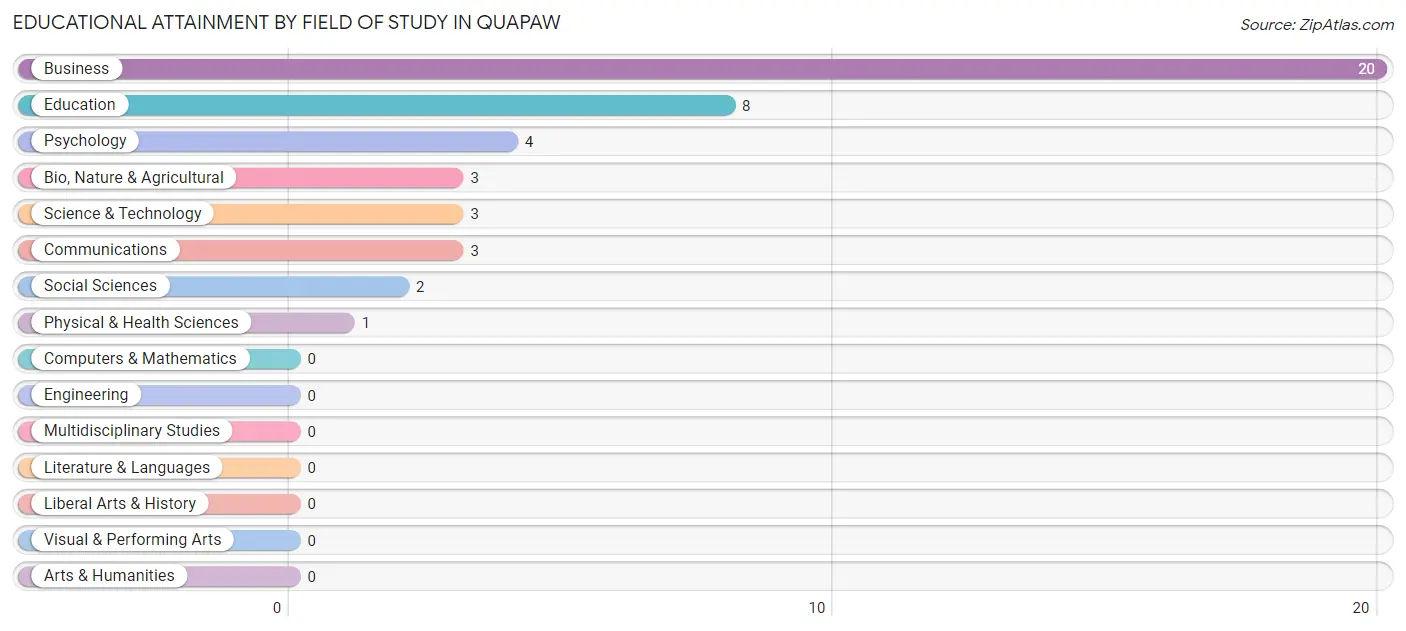
| Field of Study | # Graduates | % Graduates |
| Computers & Mathematics | 0 | 0.0% |
| Bio, Nature & Agricultural | 3 | 6.8% |
| Physical & Health Sciences | 1 | 2.3% |
| Psychology | 4 | 9.1% |
| Social Sciences | 2 | 4.5% |
| Engineering | 0 | 0.0% |
| Multidisciplinary Studies | 0 | 0.0% |
| Science & Technology | 3 | 6.8% |
| Business | 20 | 45.5% |
| Education | 8 | 18.2% |
| Literature & Languages | 0 | 0.0% |
| Liberal Arts & History | 0 | 0.0% |
| Visual & Performing Arts | 0 | 0.0% |
| Communications | 3 | 6.8% |
| Arts & Humanities | 0 | 0.0% |
| Total | 44 | 100.0% |
Transportation & Commute in Quapaw
Vehicle Availability by Sex in Quapaw
The most prevalent vehicle ownership categories in Quapaw are males with 2 vehicles (60, accounting for 36.6%) and females with 2 vehicles (65, making up 34.5%).
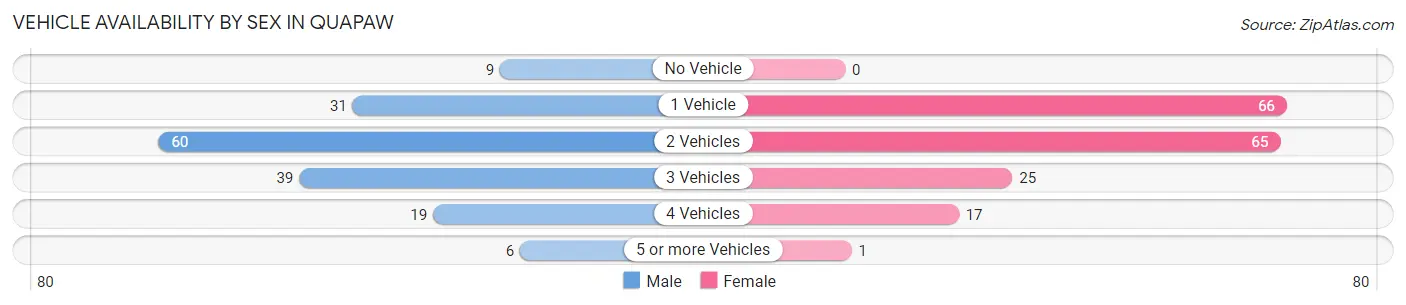
| Vehicles Available | Male | Female |
| No Vehicle | 9 (5.5%) | 0 (0.0%) |
| 1 Vehicle | 31 (18.9%) | 66 (37.9%) |
| 2 Vehicles | 60 (36.6%) | 65 (37.4%) |
| 3 Vehicles | 39 (23.8%) | 25 (14.4%) |
| 4 Vehicles | 19 (11.6%) | 17 (9.8%) |
| 5 or more Vehicles | 6 (3.7%) | 1 (0.6%) |
| Total | 164 (100.0%) | 174 (100.0%) |
Commute Time in Quapaw
The most frequently occuring commute durations in Quapaw are 15 to 19 minutes (78 commuters, 23.2%), 5 to 9 minutes (60 commuters, 17.9%), and 10 to 14 minutes (57 commuters, 17.0%).
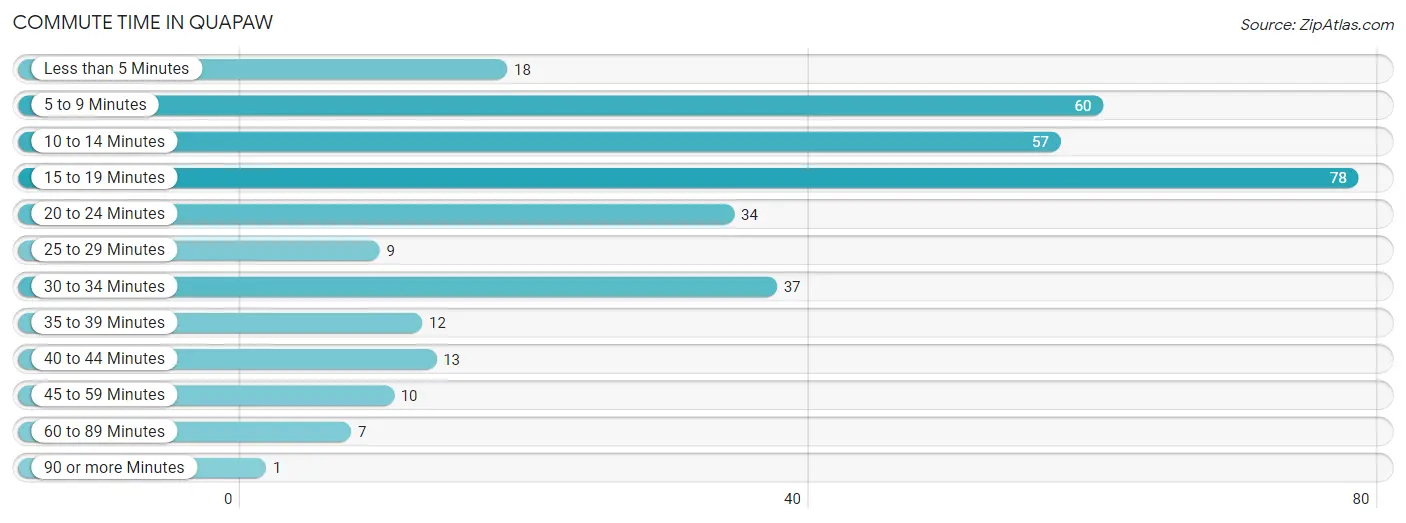
| Commute Time | # Commuters | % Commuters |
| Less than 5 Minutes | 18 | 5.4% |
| 5 to 9 Minutes | 60 | 17.9% |
| 10 to 14 Minutes | 57 | 17.0% |
| 15 to 19 Minutes | 78 | 23.2% |
| 20 to 24 Minutes | 34 | 10.1% |
| 25 to 29 Minutes | 9 | 2.7% |
| 30 to 34 Minutes | 37 | 11.0% |
| 35 to 39 Minutes | 12 | 3.6% |
| 40 to 44 Minutes | 13 | 3.9% |
| 45 to 59 Minutes | 10 | 3.0% |
| 60 to 89 Minutes | 7 | 2.1% |
| 90 or more Minutes | 1 | 0.3% |
Commute Time by Sex in Quapaw
The most common commute times in Quapaw are 5 to 9 minutes (36 commuters, 22.0%) for males and 15 to 19 minutes (43 commuters, 25.0%) for females.
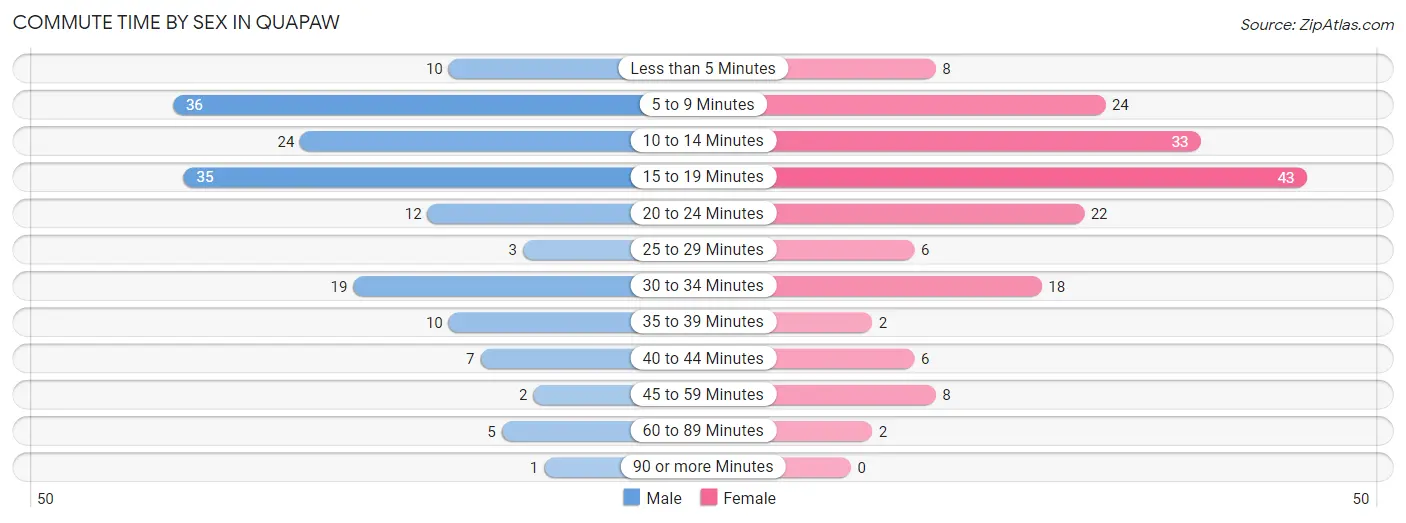
| Commute Time | Male | Female |
| Less than 5 Minutes | 10 (6.1%) | 8 (4.6%) |
| 5 to 9 Minutes | 36 (22.0%) | 24 (14.0%) |
| 10 to 14 Minutes | 24 (14.6%) | 33 (19.2%) |
| 15 to 19 Minutes | 35 (21.3%) | 43 (25.0%) |
| 20 to 24 Minutes | 12 (7.3%) | 22 (12.8%) |
| 25 to 29 Minutes | 3 (1.8%) | 6 (3.5%) |
| 30 to 34 Minutes | 19 (11.6%) | 18 (10.5%) |
| 35 to 39 Minutes | 10 (6.1%) | 2 (1.2%) |
| 40 to 44 Minutes | 7 (4.3%) | 6 (3.5%) |
| 45 to 59 Minutes | 2 (1.2%) | 8 (4.6%) |
| 60 to 89 Minutes | 5 (3.0%) | 2 (1.2%) |
| 90 or more Minutes | 1 (0.6%) | 0 (0.0%) |
Time of Departure to Work by Sex in Quapaw
The most frequent times of departure to work in Quapaw are 7:30 AM to 7:59 AM (32, 19.5%) for males and 7:30 AM to 7:59 AM (44, 25.6%) for females.
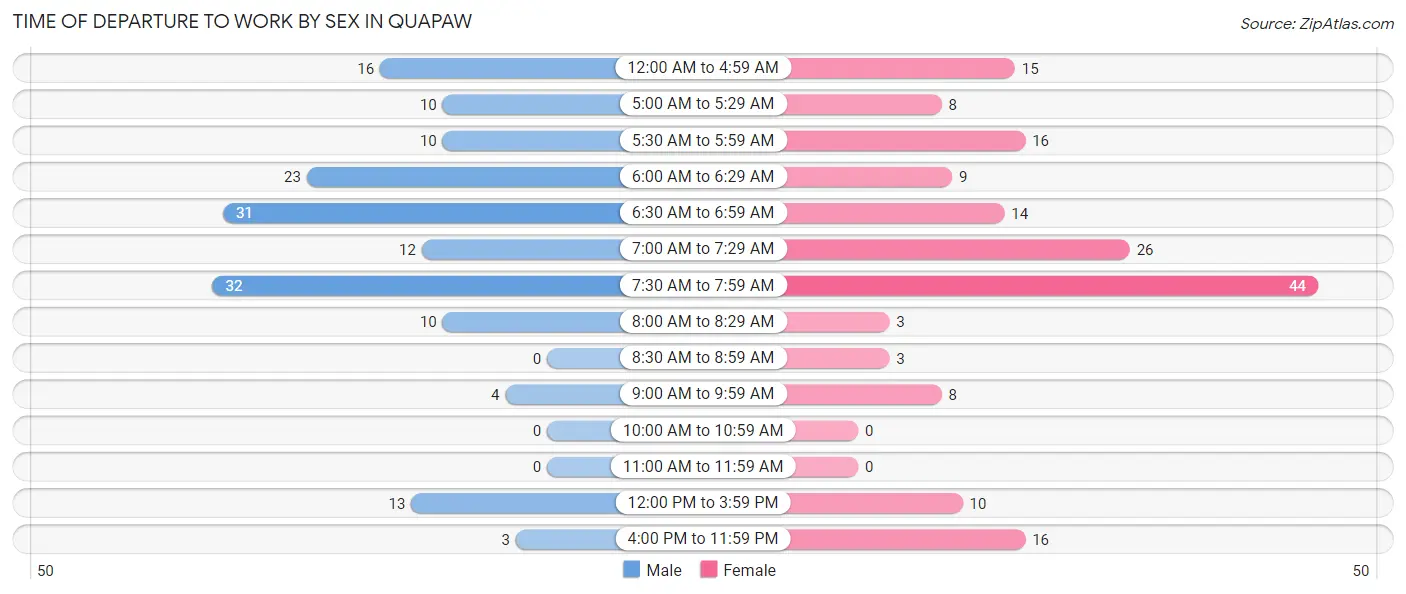
| Time of Departure | Male | Female |
| 12:00 AM to 4:59 AM | 16 (9.8%) | 15 (8.7%) |
| 5:00 AM to 5:29 AM | 10 (6.1%) | 8 (4.6%) |
| 5:30 AM to 5:59 AM | 10 (6.1%) | 16 (9.3%) |
| 6:00 AM to 6:29 AM | 23 (14.0%) | 9 (5.2%) |
| 6:30 AM to 6:59 AM | 31 (18.9%) | 14 (8.1%) |
| 7:00 AM to 7:29 AM | 12 (7.3%) | 26 (15.1%) |
| 7:30 AM to 7:59 AM | 32 (19.5%) | 44 (25.6%) |
| 8:00 AM to 8:29 AM | 10 (6.1%) | 3 (1.7%) |
| 8:30 AM to 8:59 AM | 0 (0.0%) | 3 (1.7%) |
| 9:00 AM to 9:59 AM | 4 (2.4%) | 8 (4.6%) |
| 10:00 AM to 10:59 AM | 0 (0.0%) | 0 (0.0%) |
| 11:00 AM to 11:59 AM | 0 (0.0%) | 0 (0.0%) |
| 12:00 PM to 3:59 PM | 13 (7.9%) | 10 (5.8%) |
| 4:00 PM to 11:59 PM | 3 (1.8%) | 16 (9.3%) |
| Total | 164 (100.0%) | 172 (100.0%) |
Housing Occupancy in Quapaw
Occupancy by Ownership in Quapaw
Of the total 311 dwellings in Quapaw, owner-occupied units account for 173 (55.6%), while renter-occupied units make up 138 (44.4%).
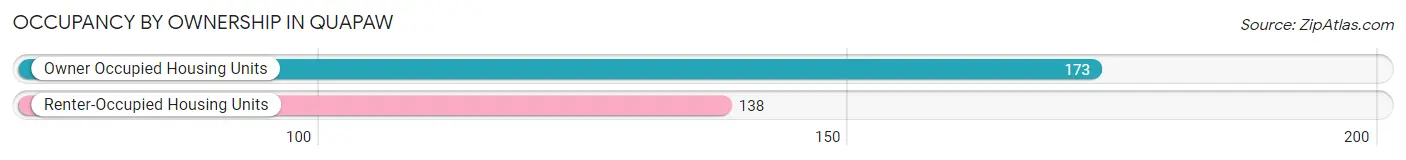
| Occupancy | # Housing Units | % Housing Units |
| Owner Occupied Housing Units | 173 | 55.6% |
| Renter-Occupied Housing Units | 138 | 44.4% |
| Total Occupied Housing Units | 311 | 100.0% |
Occupancy by Household Size in Quapaw
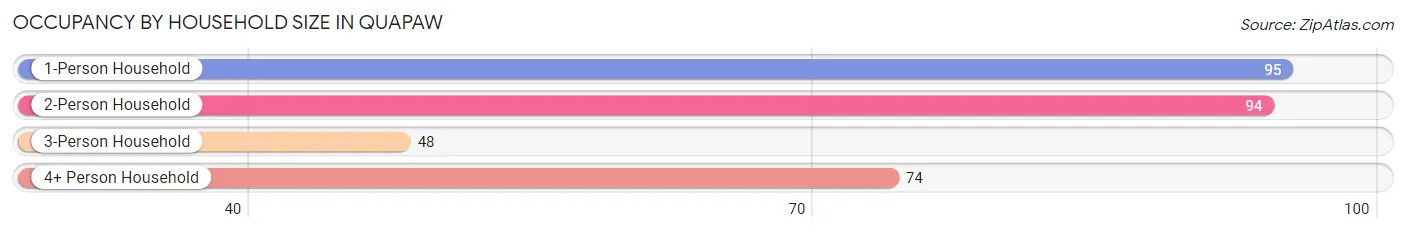
| Household Size | # Housing Units | % Housing Units |
| 1-Person Household | 95 | 30.5% |
| 2-Person Household | 94 | 30.2% |
| 3-Person Household | 48 | 15.4% |
| 4+ Person Household | 74 | 23.8% |
| Total Housing Units | 311 | 100.0% |
Occupancy by Ownership by Household Size in Quapaw
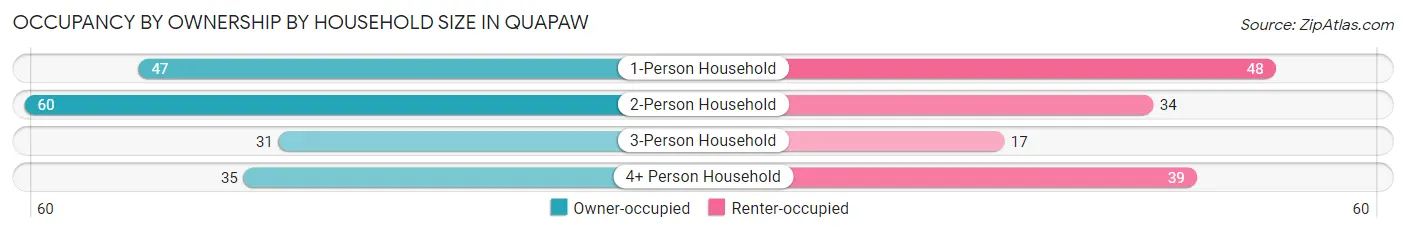
| Household Size | Owner-occupied | Renter-occupied |
| 1-Person Household | 47 (49.5%) | 48 (50.5%) |
| 2-Person Household | 60 (63.8%) | 34 (36.2%) |
| 3-Person Household | 31 (64.6%) | 17 (35.4%) |
| 4+ Person Household | 35 (47.3%) | 39 (52.7%) |
| Total Housing Units | 173 (55.6%) | 138 (44.4%) |
Occupancy by Educational Attainment in Quapaw
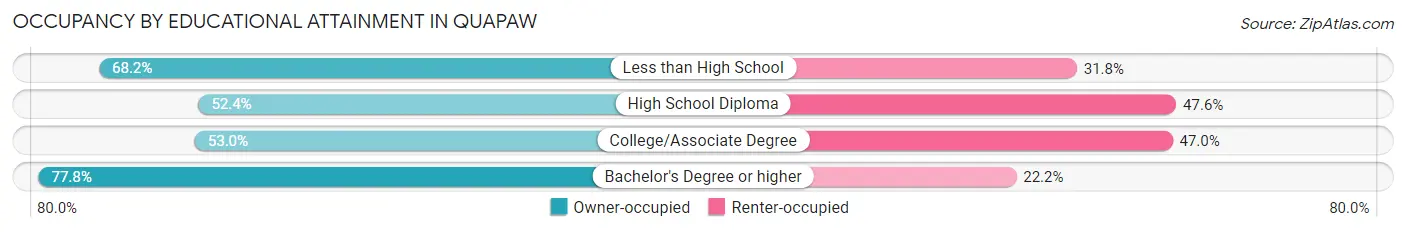
| Household Size | Owner-occupied | Renter-occupied |
| Less than High School | 30 (68.2%) | 14 (31.8%) |
| High School Diploma | 65 (52.4%) | 59 (47.6%) |
| College/Associate Degree | 71 (53.0%) | 63 (47.0%) |
| Bachelor's Degree or higher | 7 (77.8%) | 2 (22.2%) |
Occupancy by Age of Householder in Quapaw
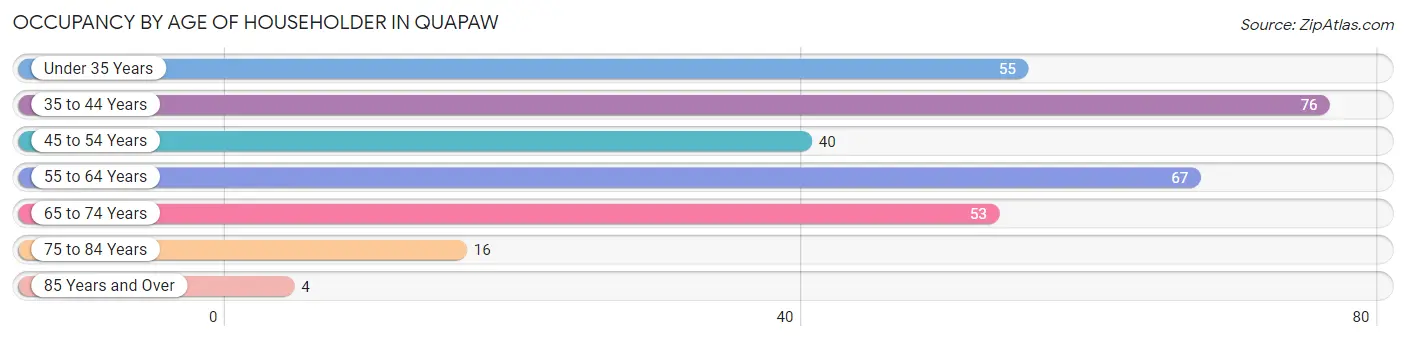
| Age Bracket | # Households | % Households |
| Under 35 Years | 55 | 17.7% |
| 35 to 44 Years | 76 | 24.4% |
| 45 to 54 Years | 40 | 12.9% |
| 55 to 64 Years | 67 | 21.5% |
| 65 to 74 Years | 53 | 17.0% |
| 75 to 84 Years | 16 | 5.1% |
| 85 Years and Over | 4 | 1.3% |
| Total | 311 | 100.0% |
Housing Finances in Quapaw
Median Income by Occupancy in Quapaw
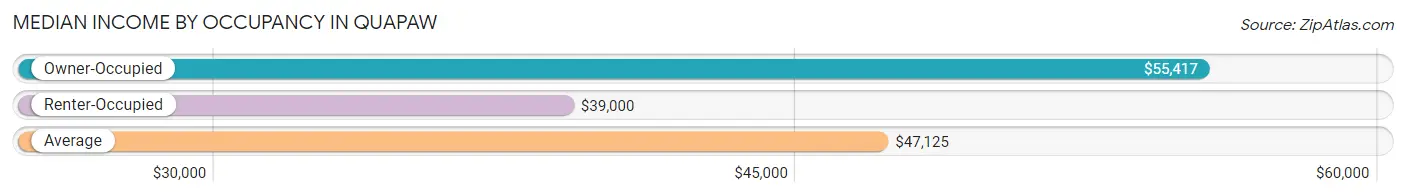
| Occupancy Type | # Households | Median Income |
| Owner-Occupied | 173 (55.6%) | $55,417 |
| Renter-Occupied | 138 (44.4%) | $39,000 |
| Average | 311 (100.0%) | $47,125 |
Occupancy by Householder Income Bracket in Quapaw
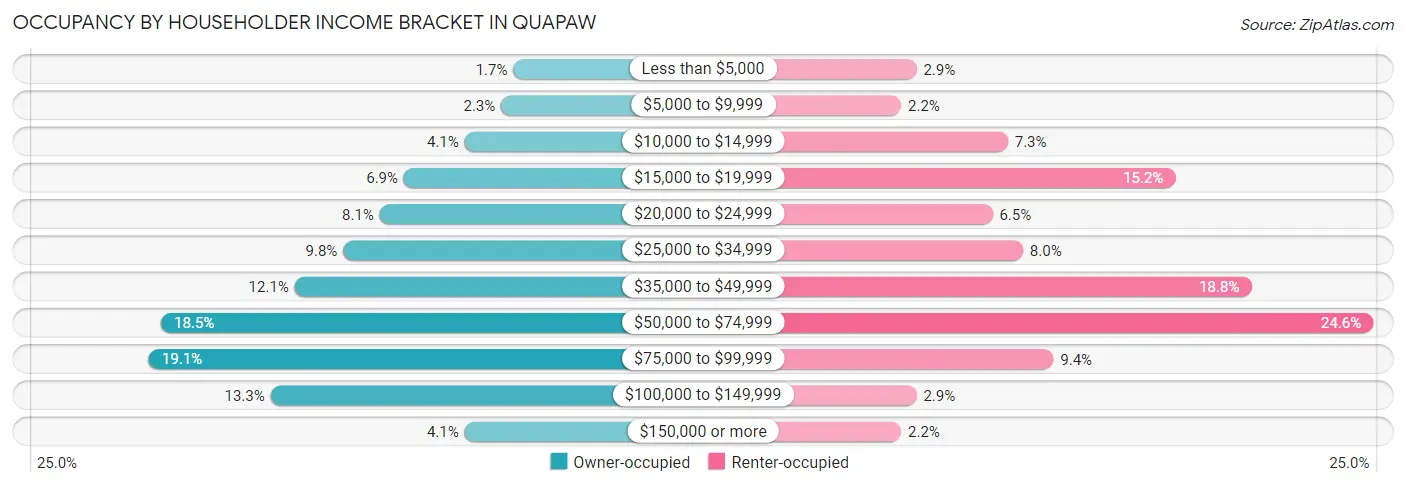
| Income Bracket | Owner-occupied | Renter-occupied |
| Less than $5,000 | 3 (1.7%) | 4 (2.9%) |
| $5,000 to $9,999 | 4 (2.3%) | 3 (2.2%) |
| $10,000 to $14,999 | 7 (4.1%) | 10 (7.2%) |
| $15,000 to $19,999 | 12 (6.9%) | 21 (15.2%) |
| $20,000 to $24,999 | 14 (8.1%) | 9 (6.5%) |
| $25,000 to $34,999 | 17 (9.8%) | 11 (8.0%) |
| $35,000 to $49,999 | 21 (12.1%) | 26 (18.8%) |
| $50,000 to $74,999 | 32 (18.5%) | 34 (24.6%) |
| $75,000 to $99,999 | 33 (19.1%) | 13 (9.4%) |
| $100,000 to $149,999 | 23 (13.3%) | 4 (2.9%) |
| $150,000 or more | 7 (4.1%) | 3 (2.2%) |
| Total | 173 (100.0%) | 138 (100.0%) |
Monthly Housing Cost Tiers in Quapaw
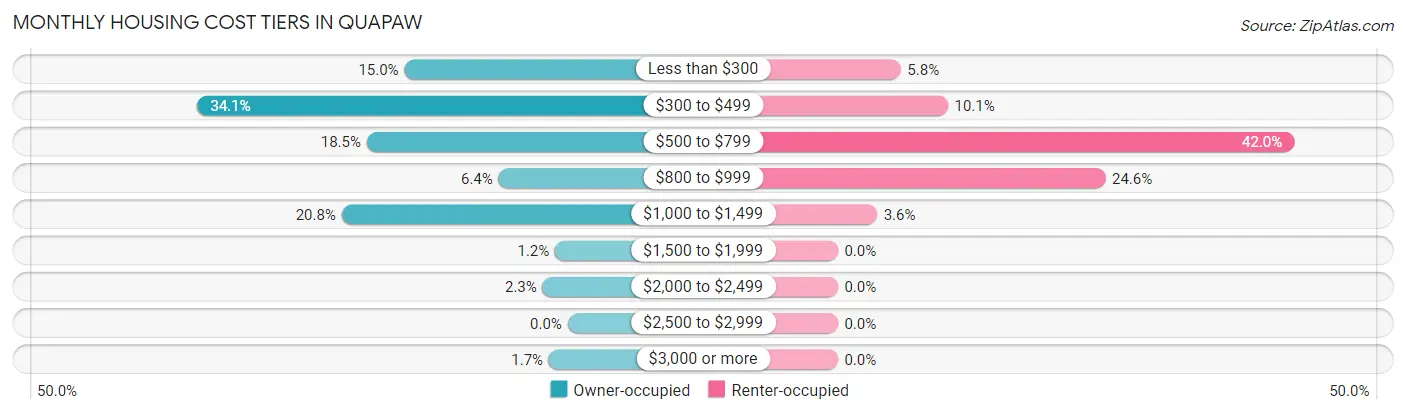
| Monthly Cost | Owner-occupied | Renter-occupied |
| Less than $300 | 26 (15.0%) | 8 (5.8%) |
| $300 to $499 | 59 (34.1%) | 14 (10.1%) |
| $500 to $799 | 32 (18.5%) | 58 (42.0%) |
| $800 to $999 | 11 (6.4%) | 34 (24.6%) |
| $1,000 to $1,499 | 36 (20.8%) | 5 (3.6%) |
| $1,500 to $1,999 | 2 (1.2%) | 0 (0.0%) |
| $2,000 to $2,499 | 4 (2.3%) | 0 (0.0%) |
| $2,500 to $2,999 | 0 (0.0%) | 0 (0.0%) |
| $3,000 or more | 3 (1.7%) | 0 (0.0%) |
| Total | 173 (100.0%) | 138 (100.0%) |
Physical Housing Characteristics in Quapaw
Housing Structures in Quapaw
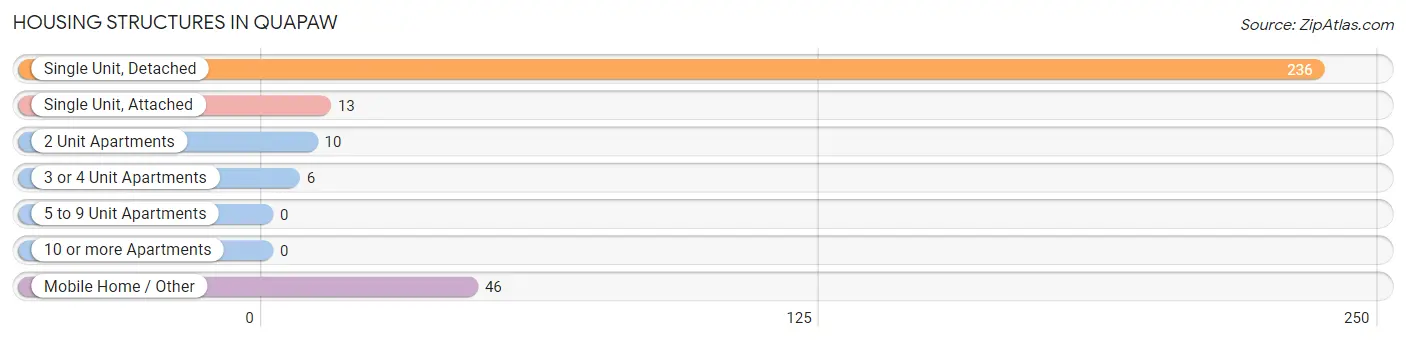
| Structure Type | # Housing Units | % Housing Units |
| Single Unit, Detached | 236 | 75.9% |
| Single Unit, Attached | 13 | 4.2% |
| 2 Unit Apartments | 10 | 3.2% |
| 3 or 4 Unit Apartments | 6 | 1.9% |
| 5 to 9 Unit Apartments | 0 | 0.0% |
| 10 or more Apartments | 0 | 0.0% |
| Mobile Home / Other | 46 | 14.8% |
| Total | 311 | 100.0% |
Housing Structures by Occupancy in Quapaw
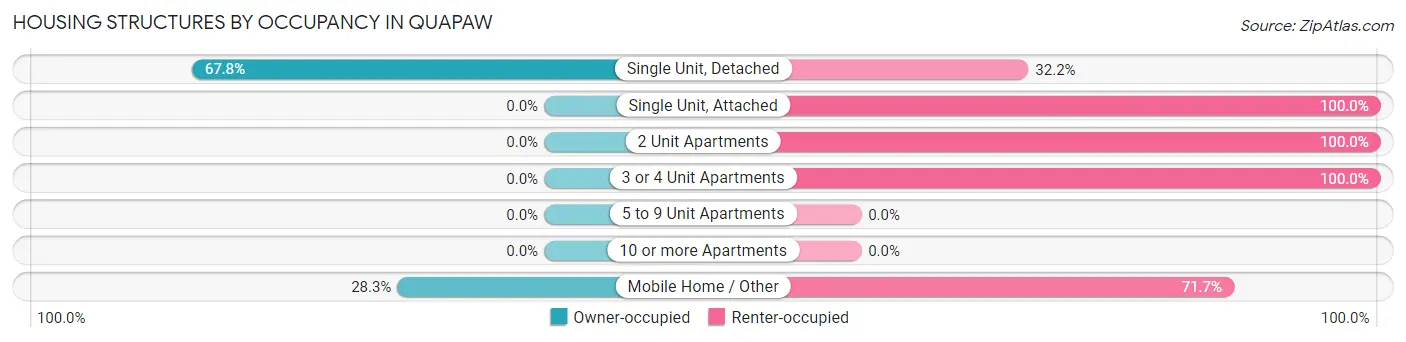
| Structure Type | Owner-occupied | Renter-occupied |
| Single Unit, Detached | 160 (67.8%) | 76 (32.2%) |
| Single Unit, Attached | 0 (0.0%) | 13 (100.0%) |
| 2 Unit Apartments | 0 (0.0%) | 10 (100.0%) |
| 3 or 4 Unit Apartments | 0 (0.0%) | 6 (100.0%) |
| 5 to 9 Unit Apartments | 0 (0.0%) | 0 (0.0%) |
| 10 or more Apartments | 0 (0.0%) | 0 (0.0%) |
| Mobile Home / Other | 13 (28.3%) | 33 (71.7%) |
| Total | 173 (55.6%) | 138 (44.4%) |
Housing Structures by Number of Rooms in Quapaw
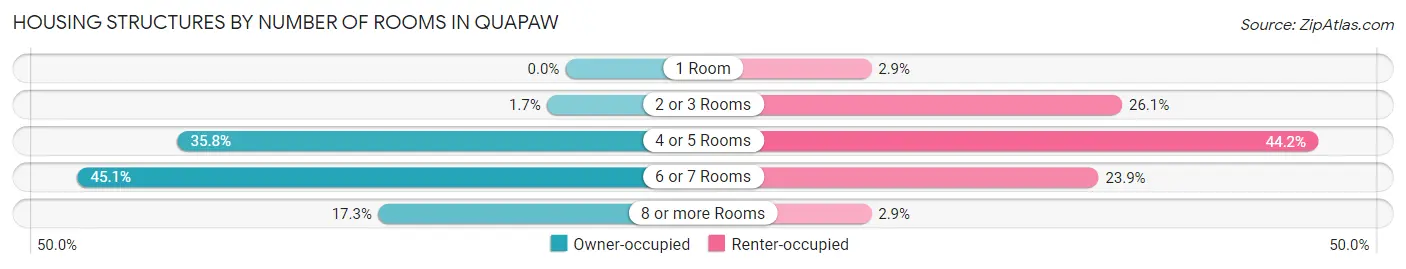
| Number of Rooms | Owner-occupied | Renter-occupied |
| 1 Room | 0 (0.0%) | 4 (2.9%) |
| 2 or 3 Rooms | 3 (1.7%) | 36 (26.1%) |
| 4 or 5 Rooms | 62 (35.8%) | 61 (44.2%) |
| 6 or 7 Rooms | 78 (45.1%) | 33 (23.9%) |
| 8 or more Rooms | 30 (17.3%) | 4 (2.9%) |
| Total | 173 (100.0%) | 138 (100.0%) |
Housing Structure by Heating Type in Quapaw
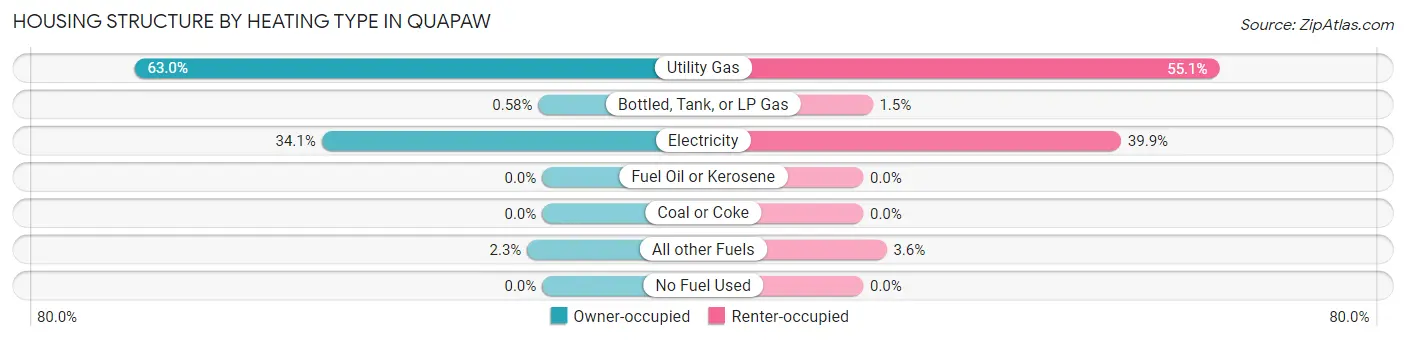
| Heating Type | Owner-occupied | Renter-occupied |
| Utility Gas | 109 (63.0%) | 76 (55.1%) |
| Bottled, Tank, or LP Gas | 1 (0.6%) | 2 (1.5%) |
| Electricity | 59 (34.1%) | 55 (39.9%) |
| Fuel Oil or Kerosene | 0 (0.0%) | 0 (0.0%) |
| Coal or Coke | 0 (0.0%) | 0 (0.0%) |
| All other Fuels | 4 (2.3%) | 5 (3.6%) |
| No Fuel Used | 0 (0.0%) | 0 (0.0%) |
| Total | 173 (100.0%) | 138 (100.0%) |
Household Vehicle Usage in Quapaw
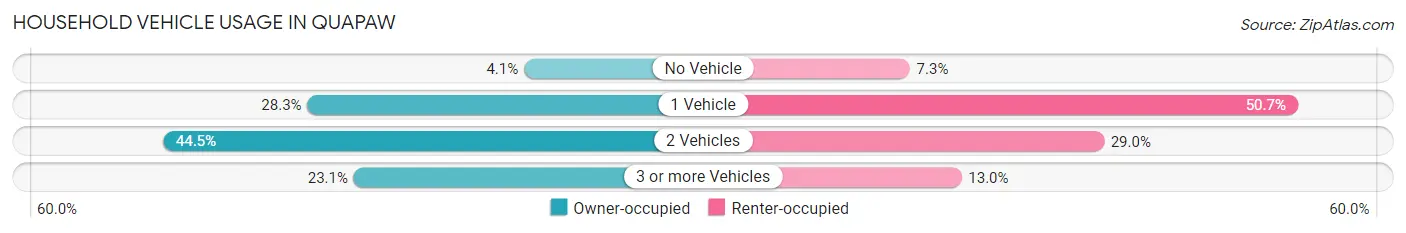
| Vehicles per Household | Owner-occupied | Renter-occupied |
| No Vehicle | 7 (4.1%) | 10 (7.2%) |
| 1 Vehicle | 49 (28.3%) | 70 (50.7%) |
| 2 Vehicles | 77 (44.5%) | 40 (29.0%) |
| 3 or more Vehicles | 40 (23.1%) | 18 (13.0%) |
| Total | 173 (100.0%) | 138 (100.0%) |
Real Estate & Mortgages in Quapaw
Real Estate and Mortgage Overview in Quapaw
| Characteristic | Without Mortgage | With Mortgage |
| Housing Units | 96 | 77 |
| Median Property Value | $60,000 | $111,200 |
| Median Household Income | $47,500 | $2 |
| Monthly Housing Costs | $363 | $3 |
| Real Estate Taxes | $259 | $5 |
Property Value by Mortgage Status in Quapaw
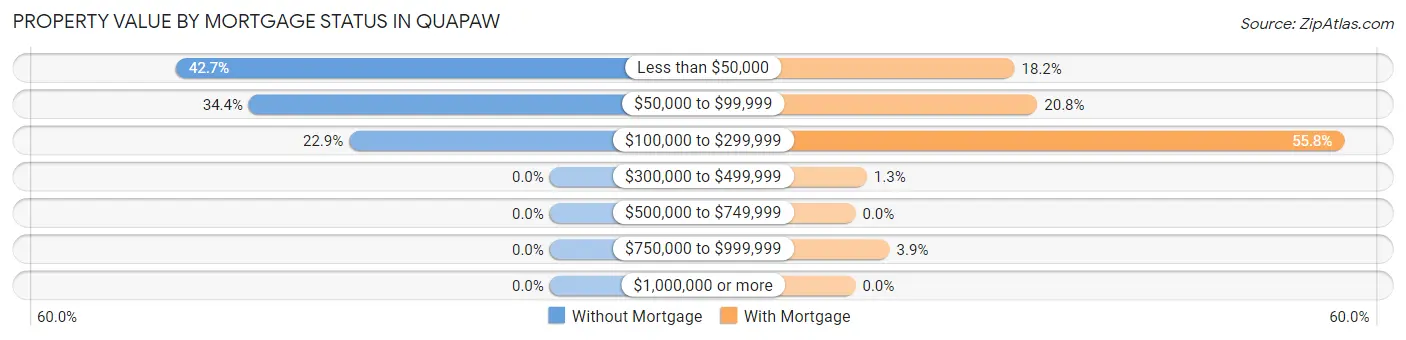
| Property Value | Without Mortgage | With Mortgage |
| Less than $50,000 | 41 (42.7%) | 14 (18.2%) |
| $50,000 to $99,999 | 33 (34.4%) | 16 (20.8%) |
| $100,000 to $299,999 | 22 (22.9%) | 43 (55.8%) |
| $300,000 to $499,999 | 0 (0.0%) | 1 (1.3%) |
| $500,000 to $749,999 | 0 (0.0%) | 0 (0.0%) |
| $750,000 to $999,999 | 0 (0.0%) | 3 (3.9%) |
| $1,000,000 or more | 0 (0.0%) | 0 (0.0%) |
| Total | 96 (100.0%) | 77 (100.0%) |
Household Income by Mortgage Status in Quapaw
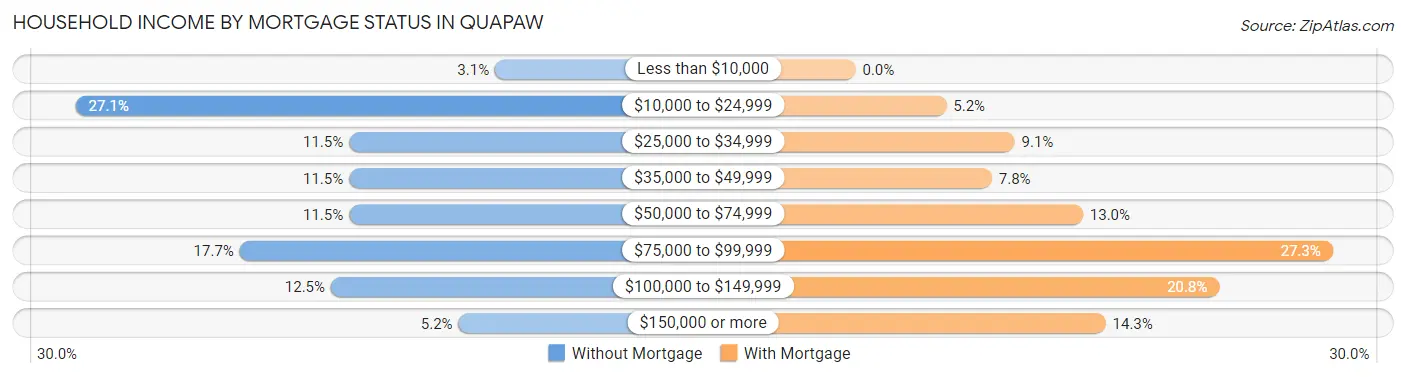
| Household Income | Without Mortgage | With Mortgage |
| Less than $10,000 | 3 (3.1%) | 0 (0.0%) |
| $10,000 to $24,999 | 26 (27.1%) | 4 (5.2%) |
| $25,000 to $34,999 | 11 (11.5%) | 7 (9.1%) |
| $35,000 to $49,999 | 11 (11.5%) | 6 (7.8%) |
| $50,000 to $74,999 | 11 (11.5%) | 10 (13.0%) |
| $75,000 to $99,999 | 17 (17.7%) | 21 (27.3%) |
| $100,000 to $149,999 | 12 (12.5%) | 16 (20.8%) |
| $150,000 or more | 5 (5.2%) | 11 (14.3%) |
| Total | 96 (100.0%) | 77 (100.0%) |
Property Value to Household Income Ratio in Quapaw
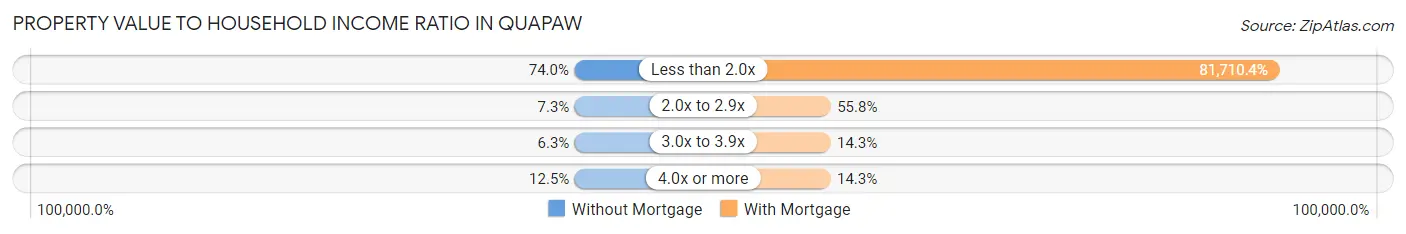
| Value-to-Income Ratio | Without Mortgage | With Mortgage |
| Less than 2.0x | 71 (74.0%) | 62,917 (81,710.4%) |
| 2.0x to 2.9x | 7 (7.3%) | 43 (55.8%) |
| 3.0x to 3.9x | 6 (6.2%) | 11 (14.3%) |
| 4.0x or more | 12 (12.5%) | 11 (14.3%) |
| Total | 96 (100.0%) | 77 (100.0%) |
Real Estate Taxes by Mortgage Status in Quapaw
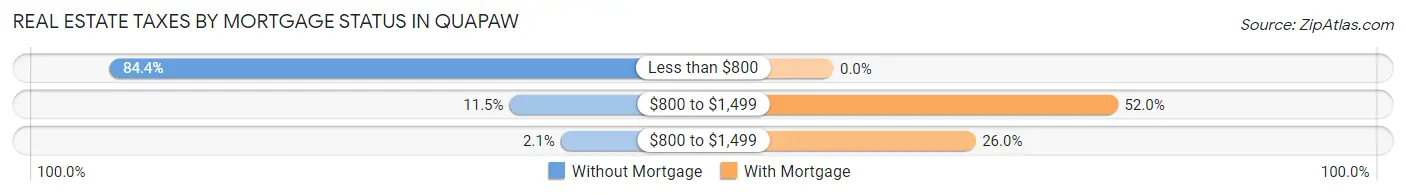
| Property Taxes | Without Mortgage | With Mortgage |
| Less than $800 | 81 (84.4%) | 0 (0.0%) |
| $800 to $1,499 | 11 (11.5%) | 40 (51.9%) |
| $800 to $1,499 | 2 (2.1%) | 20 (26.0%) |
| Total | 96 (100.0%) | 77 (100.0%) |
Health & Disability in Quapaw
Health Insurance Coverage by Age in Quapaw
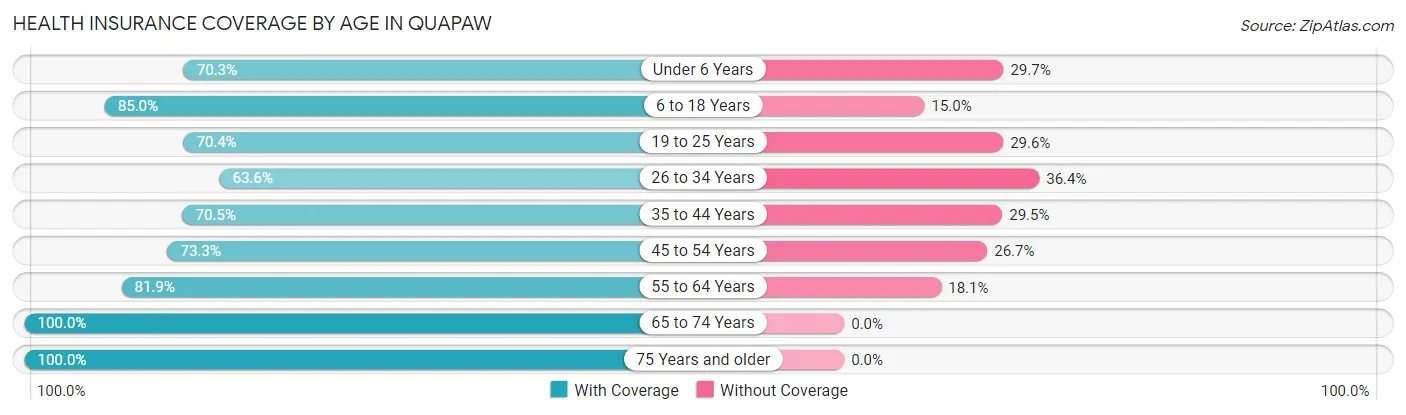
| Age Bracket | With Coverage | Without Coverage |
| Under 6 Years | 45 (70.3%) | 19 (29.7%) |
| 6 to 18 Years | 159 (85.0%) | 28 (15.0%) |
| 19 to 25 Years | 38 (70.4%) | 16 (29.6%) |
| 26 to 34 Years | 56 (63.6%) | 32 (36.4%) |
| 35 to 44 Years | 91 (70.5%) | 38 (29.5%) |
| 45 to 54 Years | 55 (73.3%) | 20 (26.7%) |
| 55 to 64 Years | 77 (81.9%) | 17 (18.1%) |
| 65 to 74 Years | 89 (100.0%) | 0 (0.0%) |
| 75 Years and older | 29 (100.0%) | 0 (0.0%) |
| Total | 639 (79.0%) | 170 (21.0%) |
Health Insurance Coverage by Citizenship Status in Quapaw
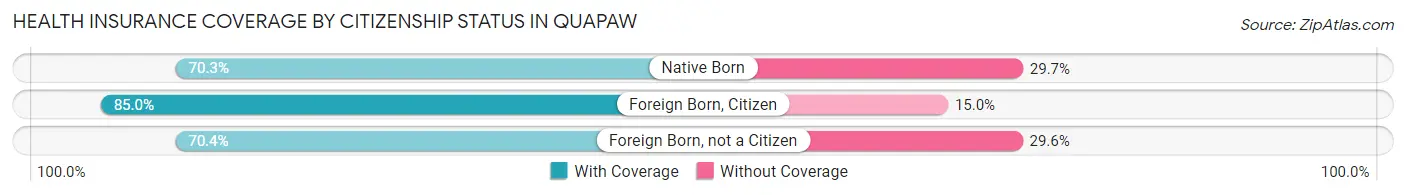
| Citizenship Status | With Coverage | Without Coverage |
| Native Born | 45 (70.3%) | 19 (29.7%) |
| Foreign Born, Citizen | 159 (85.0%) | 28 (15.0%) |
| Foreign Born, not a Citizen | 38 (70.4%) | 16 (29.6%) |
Health Insurance Coverage by Household Income in Quapaw
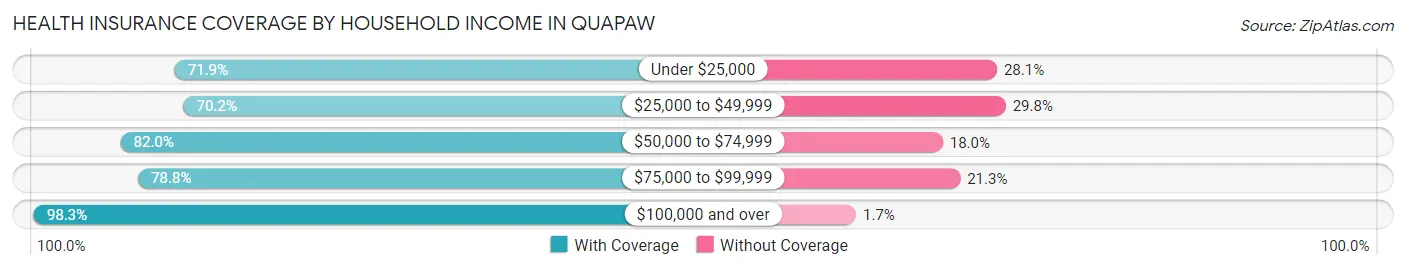
| Household Income | With Coverage | Without Coverage |
| Under $25,000 | 120 (71.9%) | 47 (28.1%) |
| $25,000 to $49,999 | 125 (70.2%) | 53 (29.8%) |
| $50,000 to $74,999 | 155 (82.0%) | 34 (18.0%) |
| $75,000 to $99,999 | 126 (78.7%) | 34 (21.2%) |
| $100,000 and over | 113 (98.3%) | 2 (1.7%) |
Public vs Private Health Insurance Coverage by Age in Quapaw
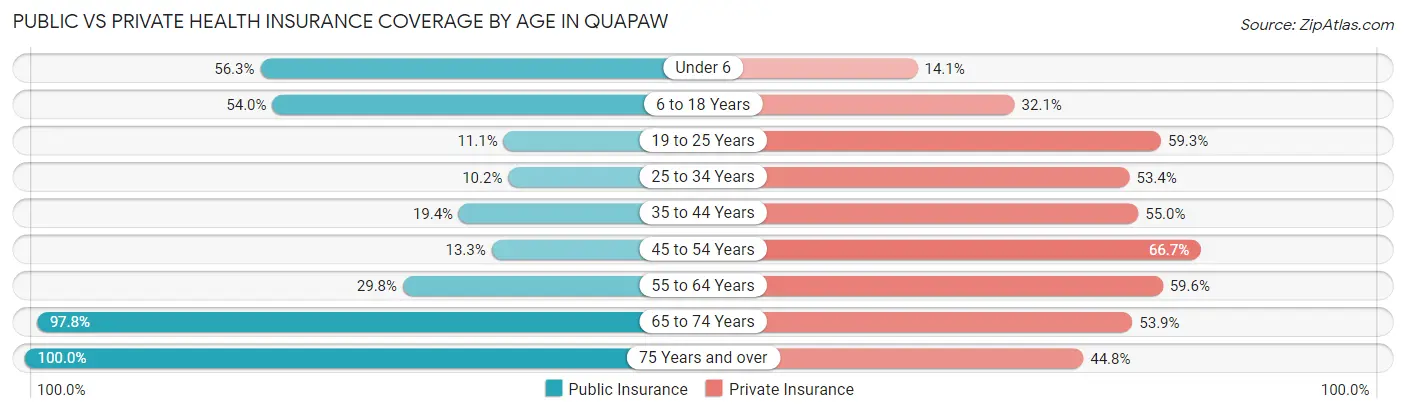
| Age Bracket | Public Insurance | Private Insurance |
| Under 6 | 36 (56.2%) | 9 (14.1%) |
| 6 to 18 Years | 101 (54.0%) | 60 (32.1%) |
| 19 to 25 Years | 6 (11.1%) | 32 (59.3%) |
| 25 to 34 Years | 9 (10.2%) | 47 (53.4%) |
| 35 to 44 Years | 25 (19.4%) | 71 (55.0%) |
| 45 to 54 Years | 10 (13.3%) | 50 (66.7%) |
| 55 to 64 Years | 28 (29.8%) | 56 (59.6%) |
| 65 to 74 Years | 87 (97.8%) | 48 (53.9%) |
| 75 Years and over | 29 (100.0%) | 13 (44.8%) |
| Total | 331 (40.9%) | 386 (47.7%) |
Disability Status by Sex by Age in Quapaw
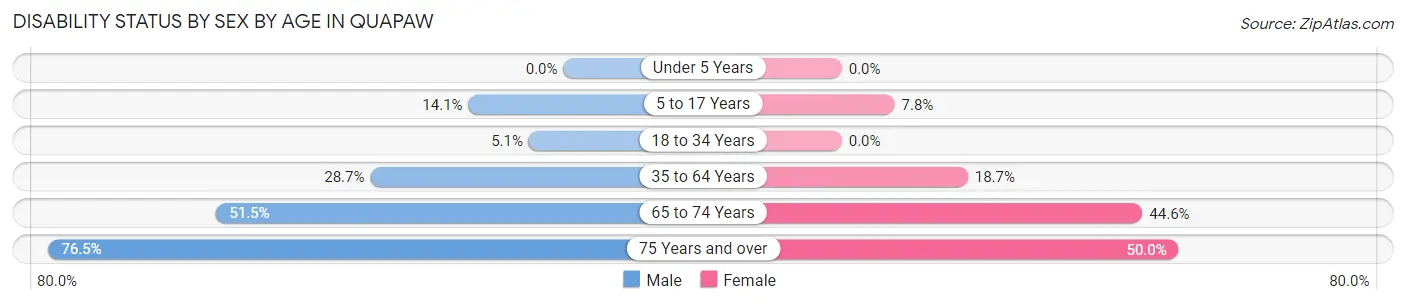
| Age Bracket | Male | Female |
| Under 5 Years | 0 (0.0%) | 0 (0.0%) |
| 5 to 17 Years | 11 (14.1%) | 8 (7.8%) |
| 18 to 34 Years | 4 (5.1%) | 0 (0.0%) |
| 35 to 64 Years | 41 (28.7%) | 29 (18.7%) |
| 65 to 74 Years | 17 (51.5%) | 25 (44.6%) |
| 75 Years and over | 13 (76.5%) | 6 (50.0%) |
Disability Class by Sex by Age in Quapaw
Disability Class: Hearing Difficulty
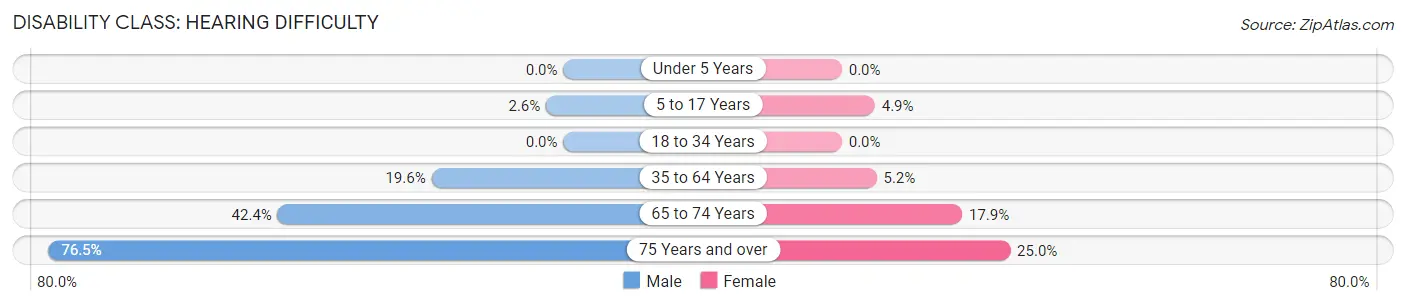
| Age Bracket | Male | Female |
| Under 5 Years | 0 (0.0%) | 0 (0.0%) |
| 5 to 17 Years | 2 (2.6%) | 5 (4.9%) |
| 18 to 34 Years | 0 (0.0%) | 0 (0.0%) |
| 35 to 64 Years | 28 (19.6%) | 8 (5.2%) |
| 65 to 74 Years | 14 (42.4%) | 10 (17.9%) |
| 75 Years and over | 13 (76.5%) | 3 (25.0%) |
Disability Class: Vision Difficulty
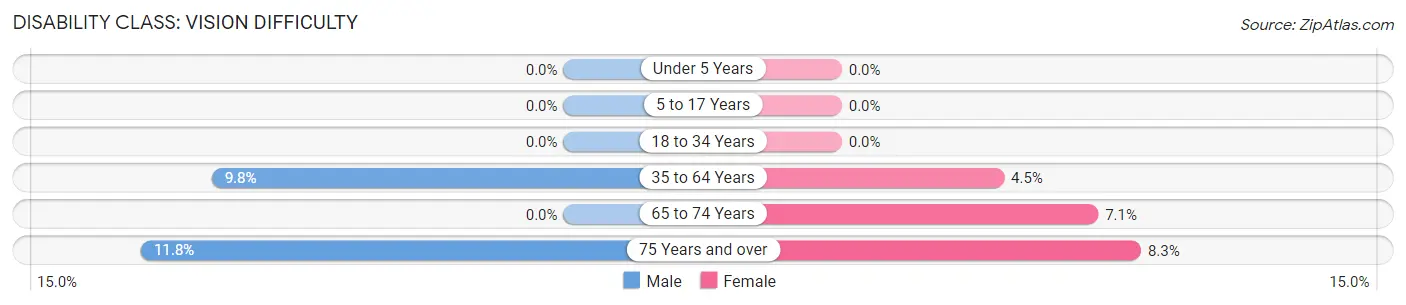
| Age Bracket | Male | Female |
| Under 5 Years | 0 (0.0%) | 0 (0.0%) |
| 5 to 17 Years | 0 (0.0%) | 0 (0.0%) |
| 18 to 34 Years | 0 (0.0%) | 0 (0.0%) |
| 35 to 64 Years | 14 (9.8%) | 7 (4.5%) |
| 65 to 74 Years | 0 (0.0%) | 4 (7.1%) |
| 75 Years and over | 2 (11.8%) | 1 (8.3%) |
Disability Class: Cognitive Difficulty
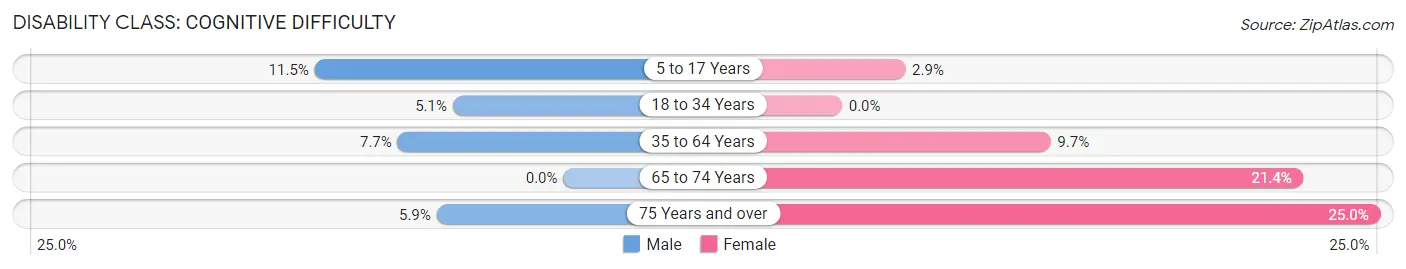
| Age Bracket | Male | Female |
| 5 to 17 Years | 9 (11.5%) | 3 (2.9%) |
| 18 to 34 Years | 4 (5.1%) | 0 (0.0%) |
| 35 to 64 Years | 11 (7.7%) | 15 (9.7%) |
| 65 to 74 Years | 0 (0.0%) | 12 (21.4%) |
| 75 Years and over | 1 (5.9%) | 3 (25.0%) |
Disability Class: Ambulatory Difficulty
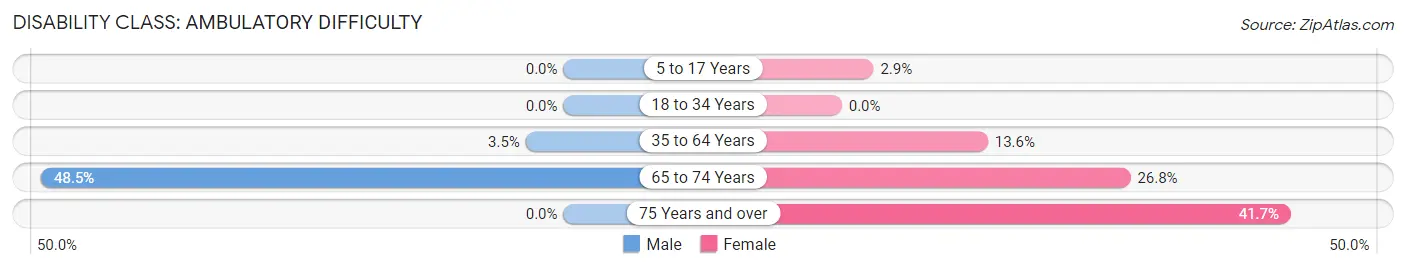
| Age Bracket | Male | Female |
| 5 to 17 Years | 0 (0.0%) | 3 (2.9%) |
| 18 to 34 Years | 0 (0.0%) | 0 (0.0%) |
| 35 to 64 Years | 5 (3.5%) | 21 (13.6%) |
| 65 to 74 Years | 16 (48.5%) | 15 (26.8%) |
| 75 Years and over | 0 (0.0%) | 5 (41.7%) |
Disability Class: Self-Care Difficulty
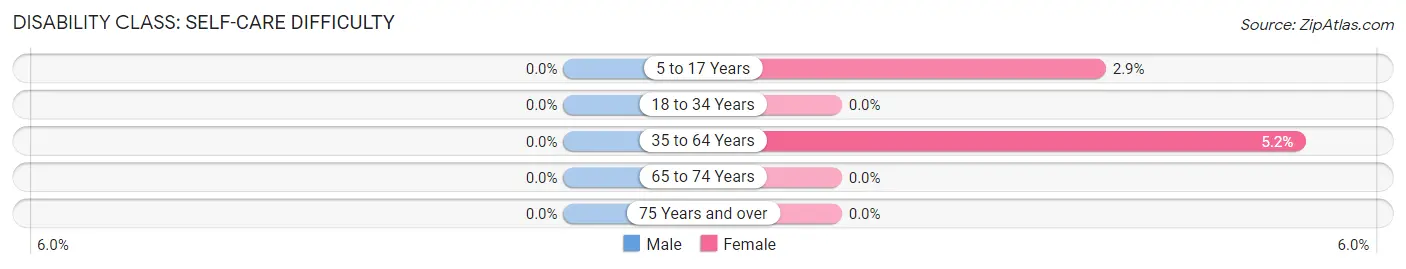
| Age Bracket | Male | Female |
| 5 to 17 Years | 0 (0.0%) | 3 (2.9%) |
| 18 to 34 Years | 0 (0.0%) | 0 (0.0%) |
| 35 to 64 Years | 0 (0.0%) | 8 (5.2%) |
| 65 to 74 Years | 0 (0.0%) | 0 (0.0%) |
| 75 Years and over | 0 (0.0%) | 0 (0.0%) |
Technology Access in Quapaw
Computing Device Access in Quapaw
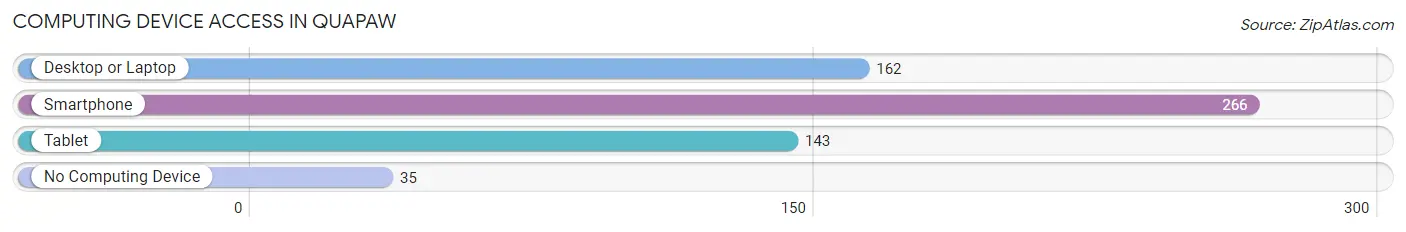
| Device Type | # Households | % Households |
| Desktop or Laptop | 162 | 52.1% |
| Smartphone | 266 | 85.5% |
| Tablet | 143 | 46.0% |
| No Computing Device | 35 | 11.3% |
| Total | 311 | 100.0% |
Internet Access in Quapaw
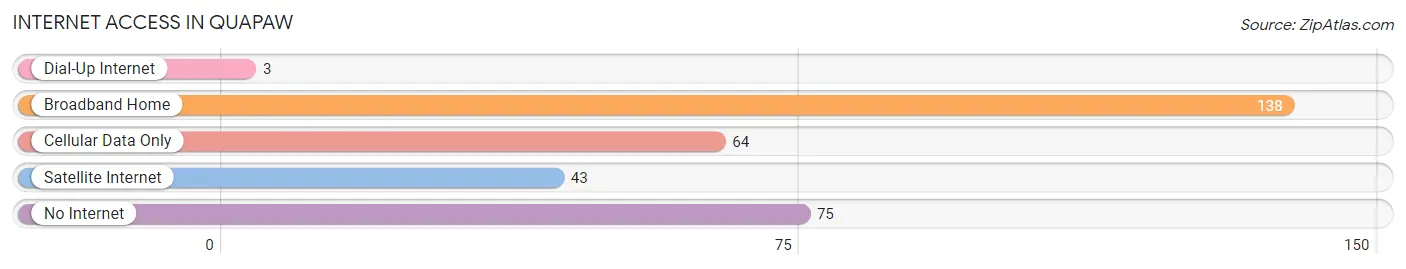
| Internet Type | # Households | % Households |
| Dial-Up Internet | 3 | 1.0% |
| Broadband Home | 138 | 44.4% |
| Cellular Data Only | 64 | 20.6% |
| Satellite Internet | 43 | 13.8% |
| No Internet | 75 | 24.1% |
| Total | 311 | 100.0% |
Quapaw Summary
Quapaw, Oklahoma is a small town located in Ottawa County in the northeastern corner of the state. It is situated on the banks of the Neosho River, just south of the Kansas border. The town was founded in 1872 and was named after the Quapaw Tribe of Native Americans who once inhabited the area. The population of Quapaw was 1,845 in the 2010 census.
Geography
Quapaw is located in the northeastern corner of Oklahoma, just south of the Kansas border. It is situated on the banks of the Neosho River, which flows through the town. The town is located in the Ozark Plateau region of the state, which is characterized by rolling hills and forests. The climate in Quapaw is humid subtropical, with hot summers and mild winters.
Economy
The economy of Quapaw is largely based on agriculture and tourism. The town is home to several farms, which produce a variety of crops, including corn, soybeans, wheat, and hay. Quapaw is also home to several tourist attractions, including the Quapaw Nation Powwow Grounds, the Quapaw Nation Museum, and the Quapaw Nation Casino.
Demographics
As of the 2010 census, the population of Quapaw was 1,845. The racial makeup of the town was 94.3% White, 0.7% African American, 0.7% Native American, 0.2% Asian, 0.1% Pacific Islander, and 3.1% from other races. The median household income was $30,938, and the median family income was $37,813.
History
Quapaw was founded in 1872 by the Quapaw Tribe of Native Americans. The town was originally known as "Quapaw City" and was the first permanent settlement in Ottawa County. The town was named after the Quapaw Tribe, who had inhabited the area for centuries prior to the arrival of European settlers.
In the late 19th century, Quapaw was a thriving agricultural community, with several farms producing a variety of crops. The town was also home to several businesses, including a general store, a blacksmith shop, and a hotel.
In the early 20th century, Quapaw experienced a period of growth and prosperity. The town was home to several churches, a bank, a newspaper, and a movie theater. The town also had a thriving tourism industry, with several tourist attractions, including the Quapaw Nation Powwow Grounds, the Quapaw Nation Museum, and the Quapaw Nation Casino.
In the late 20th century, Quapaw experienced a period of decline. The town's population decreased, and many of the businesses and tourist attractions closed. However, in recent years, the town has experienced a resurgence, with several new businesses opening and the population increasing.
Today, Quapaw is a small but vibrant town. It is home to several businesses, churches, and tourist attractions. The town is also home to the Quapaw Nation Powwow Grounds, the Quapaw Nation Museum, and the Quapaw Nation Casino. Quapaw is a great place to live, work, and visit.
Common Questions
What is Per Capita Income in Quapaw?
Per Capita income in Quapaw is $21,527.
What is the Median Family Income in Quapaw?
Median Family Income in Quapaw is $56,250.
What is the Median Household income in Quapaw?
Median Household Income in Quapaw is $47,125.
What is Income or Wage Gap in Quapaw?
Income or Wage Gap in Quapaw is 3.3%.
Women in Quapaw earn 96.7 cents for every dollar earned by a man.
What is Family Income Deficit in Quapaw?
Family Income Deficit in Quapaw is $8,892.
Families that are below poverty line in Quapaw earn $8,892 less on average than the poverty threshold level.
What is Inequality or Gini Index in Quapaw?
Inequality or Gini Index in Quapaw is 0.41.
What is the Total Population of Quapaw?
Total Population of Quapaw is 851.
What is the Total Male Population of Quapaw?
Total Male Population of Quapaw is 398.
What is the Total Female Population of Quapaw?
Total Female Population of Quapaw is 453.
What is the Ratio of Males per 100 Females in Quapaw?
There are 87.86 Males per 100 Females in Quapaw.
What is the Ratio of Females per 100 Males in Quapaw?
There are 113.82 Females per 100 Males in Quapaw.
What is the Median Population Age in Quapaw?
Median Population Age in Quapaw is 37.3 Years.
What is the Average Family Size in Quapaw
Average Family Size in Quapaw is 3.2 People.
What is the Average Household Size in Quapaw
Average Household Size in Quapaw is 2.6 People.
How Large is the Labor Force in Quapaw?
There are 360 People in the Labor Forcein in Quapaw.
What is the Percentage of People in the Labor Force in Quapaw?
56.2% of People are in the Labor Force in Quapaw.
What is the Unemployment Rate in Quapaw?
Unemployment Rate in Quapaw is 5.3%.