Pink, OK Map & Demographics
Pink Map
Pink Overview
$27,133
PER CAPITA INCOME
$73,328
AVG FAMILY INCOME
$65,417
AVG HOUSEHOLD INCOME
32.4%
WAGE / INCOME GAP [ % ]
67.6¢/ $1
WAGE / INCOME GAP [ $ ]
0.38
INEQUALITY / GINI INDEX
2,119
TOTAL POPULATION
1,126
MALE POPULATION
993
FEMALE POPULATION
113.39
MALES / 100 FEMALES
88.19
FEMALES / 100 MALES
38.3
MEDIAN AGE
3.3
AVG FAMILY SIZE
2.9
AVG HOUSEHOLD SIZE
877
LABOR FORCE [ PEOPLE ]
50.8%
PERCENT IN LABOR FORCE
5.7%
UNEMPLOYMENT RATE
Income in Pink
Income Overview in Pink
Per Capita Income in Pink is $27,133, while median incomes of families and households are $73,328 and $65,417 respectively.
| Characteristic | Number | Measure |
| Per Capita Income | 2,119 | $27,133 |
| Median Family Income | 549 | $73,328 |
| Mean Family Income | 549 | $84,239 |
| Median Household Income | 732 | $65,417 |
| Mean Household Income | 732 | $73,808 |
| Income Deficit | 549 | $0 |
| Wage / Income Gap (%) | 2,119 | 32.36% |
| Wage / Income Gap ($) | 2,119 | 67.64¢ per $1 |
| Gini / Inequality Index | 2,119 | 0.38 |
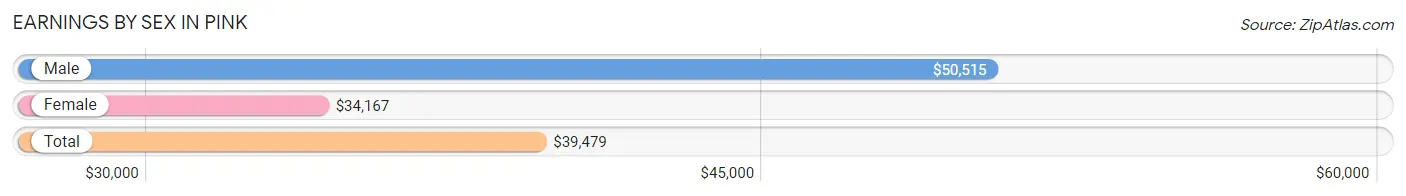
Earnings by Sex in Pink
Average Earnings in Pink are $39,479, $50,515 for men and $34,167 for women, a difference of 32.4%.
| Sex | Number | Average Earnings |
| Male | 605 (65.1%) | $50,515 |
| Female | 324 (34.9%) | $34,167 |
| Total | 929 (100.0%) | $39,479 |
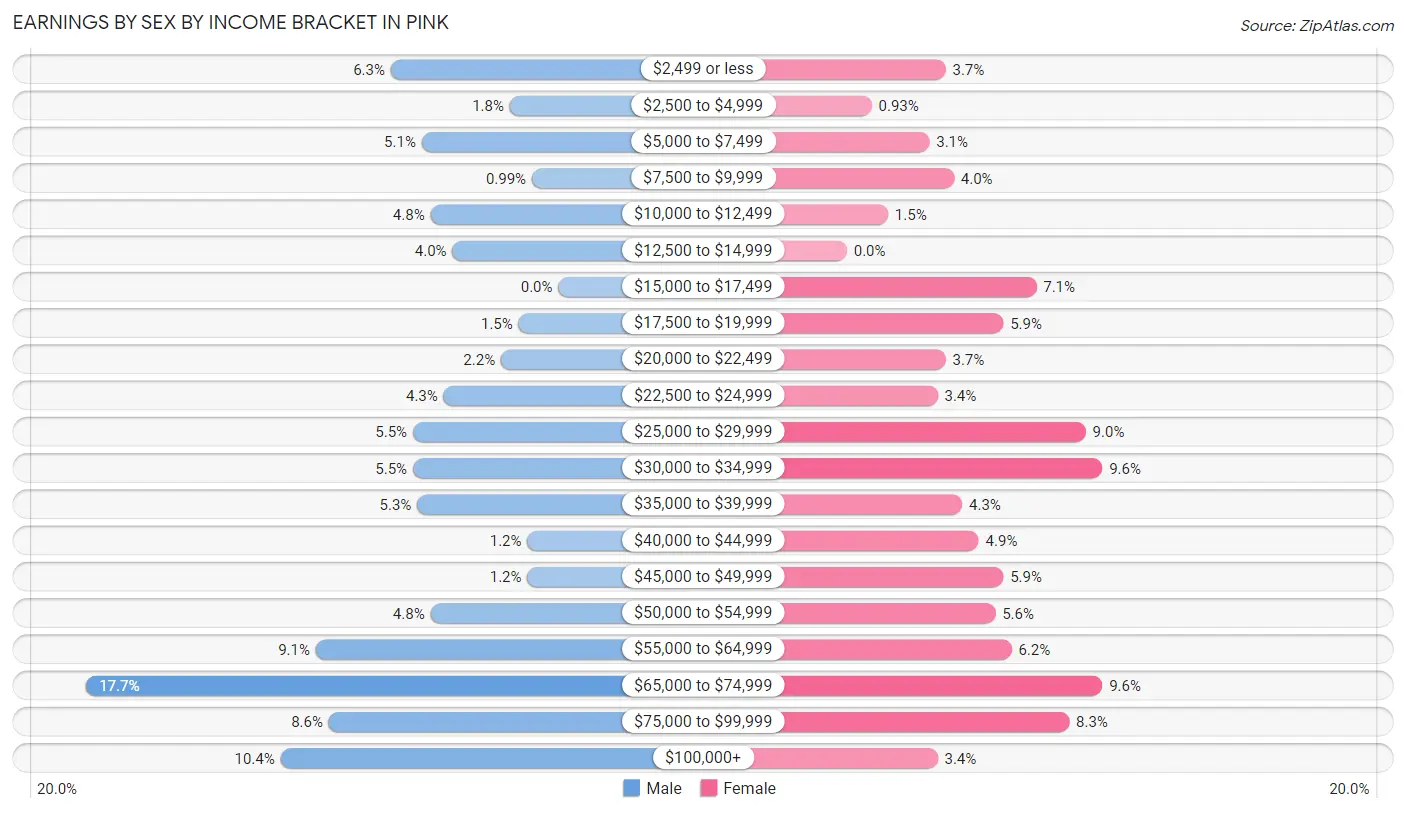
Earnings by Sex by Income Bracket in Pink
The most common earnings brackets in Pink are $65,000 to $74,999 for men (107 | 17.7%) and $30,000 to $34,999 for women (31 | 9.6%).
| Income | Male | Female |
| $2,499 or less | 38 (6.3%) | 12 (3.7%) |
| $2,500 to $4,999 | 11 (1.8%) | 3 (0.9%) |
| $5,000 to $7,499 | 31 (5.1%) | 10 (3.1%) |
| $7,500 to $9,999 | 6 (1.0%) | 13 (4.0%) |
| $10,000 to $12,499 | 29 (4.8%) | 5 (1.5%) |
| $12,500 to $14,999 | 24 (4.0%) | 0 (0.0%) |
| $15,000 to $17,499 | 0 (0.0%) | 23 (7.1%) |
| $17,500 to $19,999 | 9 (1.5%) | 19 (5.9%) |
| $20,000 to $22,499 | 13 (2.1%) | 12 (3.7%) |
| $22,500 to $24,999 | 26 (4.3%) | 11 (3.4%) |
| $25,000 to $29,999 | 33 (5.4%) | 29 (8.9%) |
| $30,000 to $34,999 | 33 (5.4%) | 31 (9.6%) |
| $35,000 to $39,999 | 32 (5.3%) | 14 (4.3%) |
| $40,000 to $44,999 | 7 (1.2%) | 16 (4.9%) |
| $45,000 to $49,999 | 7 (1.2%) | 19 (5.9%) |
| $50,000 to $54,999 | 29 (4.8%) | 18 (5.6%) |
| $55,000 to $64,999 | 55 (9.1%) | 20 (6.2%) |
| $65,000 to $74,999 | 107 (17.7%) | 31 (9.6%) |
| $75,000 to $99,999 | 52 (8.6%) | 27 (8.3%) |
| $100,000+ | 63 (10.4%) | 11 (3.4%) |
| Total | 605 (100.0%) | 324 (100.0%) |
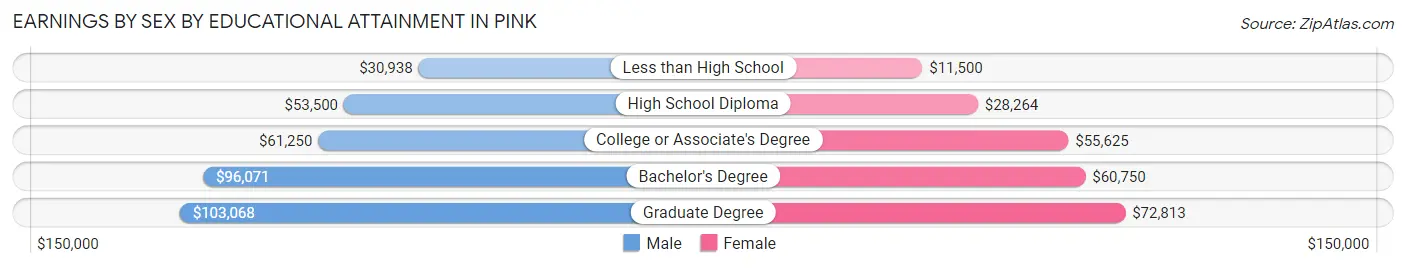
Earnings by Sex by Educational Attainment in Pink
Average earnings in Pink are $58,371 for men and $35,750 for women, a difference of 38.8%. Men with an educational attainment of graduate degree enjoy the highest average annual earnings of $103,068, while those with less than high school education earn the least with $30,938. Women with an educational attainment of graduate degree earn the most with the average annual earnings of $72,813, while those with less than high school education have the smallest earnings of $11,500.
| Educational Attainment | Male Income | Female Income |
| Less than High School | $30,938 | $11,500 |
| High School Diploma | $53,500 | $28,264 |
| College or Associate's Degree | $61,250 | $55,625 |
| Bachelor's Degree | $96,071 | $60,750 |
| Graduate Degree | $103,068 | $72,813 |
| Total | $58,371 | $35,750 |
Family Income in Pink
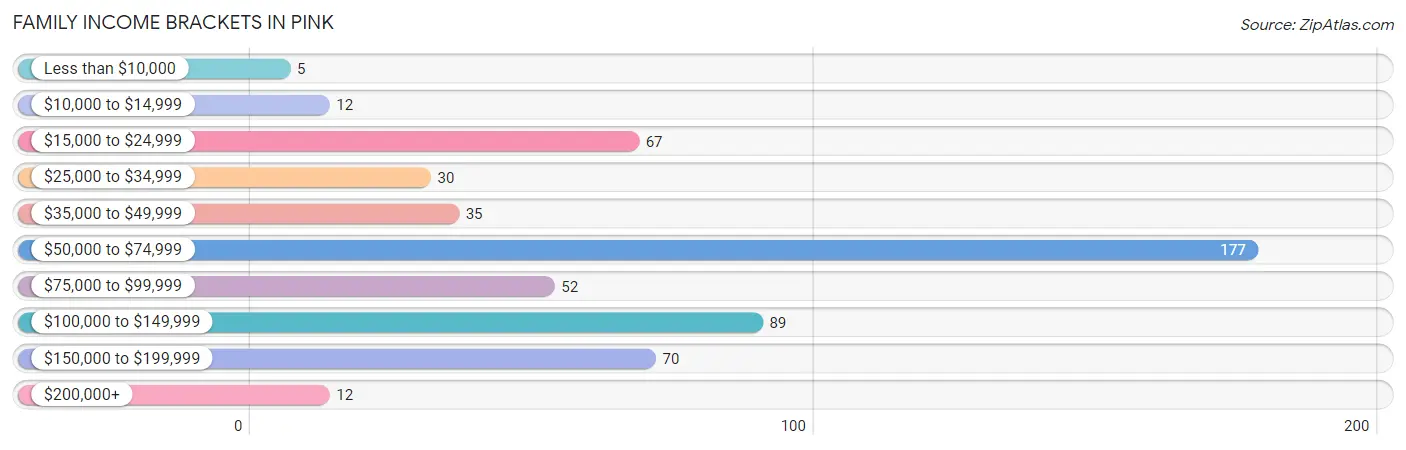
Family Income Brackets in Pink
According to the Pink family income data, there are 177 families falling into the $50,000 to $74,999 income range, which is the most common income bracket and makes up 32.2% of all families. Conversely, the less than $10,000 income bracket is the least frequent group with only 5 families (0.9%) belonging to this category.
| Income Bracket | # Families | % Families |
| Less than $10,000 | 5 | 0.9% |
| $10,000 to $14,999 | 12 | 2.2% |
| $15,000 to $24,999 | 67 | 12.2% |
| $25,000 to $34,999 | 30 | 5.5% |
| $35,000 to $49,999 | 35 | 6.4% |
| $50,000 to $74,999 | 177 | 32.2% |
| $75,000 to $99,999 | 52 | 9.5% |
| $100,000 to $149,999 | 89 | 16.2% |
| $150,000 to $199,999 | 70 | 12.8% |
| $200,000+ | 12 | 2.2% |
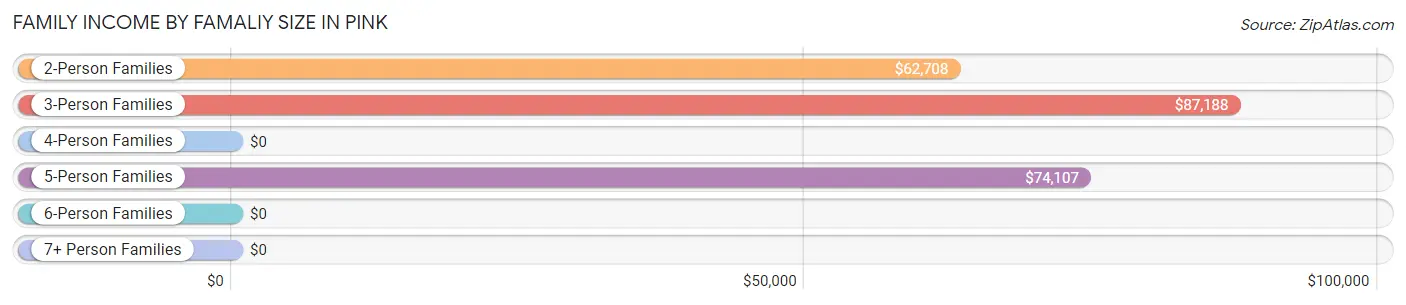
Family Income by Famaliy Size in Pink
3-person families (87 | 15.9%) account for the highest median family income in Pink with $87,188 per family, while 2-person families (268 | 48.8%) have the highest median income of $31,354 per family member.
| Income Bracket | # Families | Median Income |
| 2-Person Families | 268 (48.8%) | $62,708 |
| 3-Person Families | 87 (15.9%) | $87,188 |
| 4-Person Families | 64 (11.7%) | $0 |
| 5-Person Families | 108 (19.7%) | $74,107 |
| 6-Person Families | 10 (1.8%) | $0 |
| 7+ Person Families | 12 (2.2%) | $0 |
| Total | 549 (100.0%) | $73,328 |
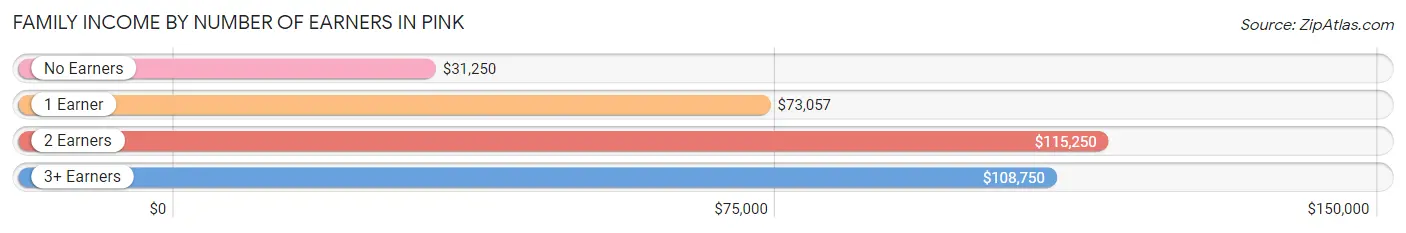
Family Income by Number of Earners in Pink
The median family income in Pink is $73,328, with families comprising 2 earners (165) having the highest median family income of $115,250, while families with no earners (87) have the lowest median family income of $31,250, accounting for 30.0% and 15.9% of families, respectively.
| Number of Earners | # Families | Median Income |
| No Earners | 87 (15.9%) | $31,250 |
| 1 Earner | 257 (46.8%) | $73,057 |
| 2 Earners | 165 (30.0%) | $115,250 |
| 3+ Earners | 40 (7.3%) | $108,750 |
| Total | 549 (100.0%) | $73,328 |
Household Income in Pink
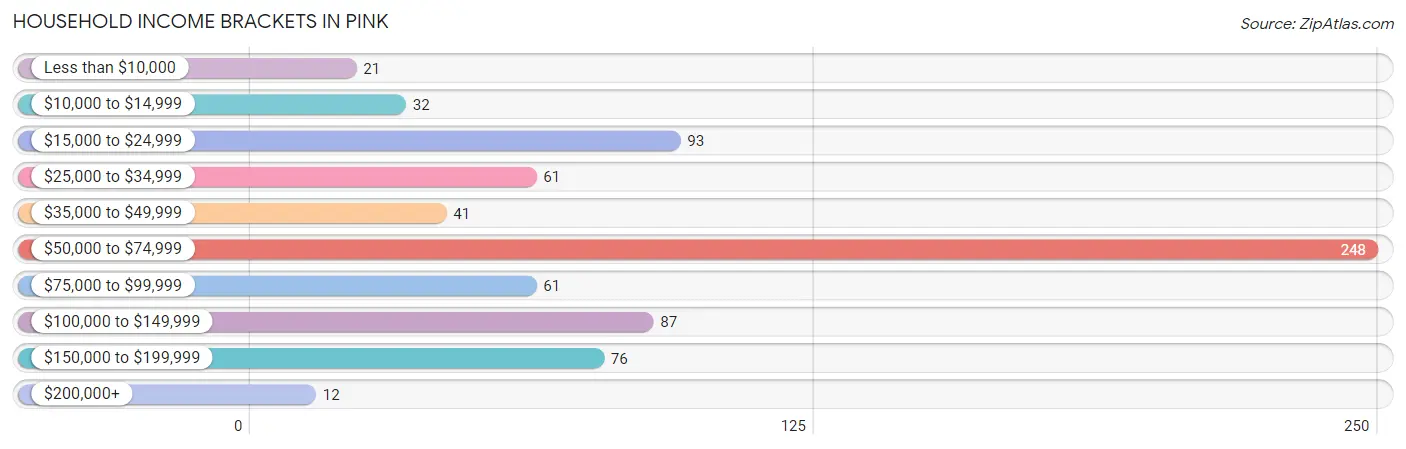
Household Income Brackets in Pink
With 248 households falling in the category, the $50,000 to $74,999 income range is the most frequent in Pink, accounting for 33.9% of all households. In contrast, only 12 households (1.6%) fall into the $200,000+ income bracket, making it the least populous group.
| Income Bracket | # Households | % Households |
| Less than $10,000 | 21 | 2.9% |
| $10,000 to $14,999 | 32 | 4.4% |
| $15,000 to $24,999 | 93 | 12.7% |
| $25,000 to $34,999 | 61 | 8.3% |
| $35,000 to $49,999 | 41 | 5.6% |
| $50,000 to $74,999 | 248 | 33.9% |
| $75,000 to $99,999 | 61 | 8.3% |
| $100,000 to $149,999 | 87 | 11.9% |
| $150,000 to $199,999 | 76 | 10.4% |
| $200,000+ | 12 | 1.6% |
Household Income by Householder Age in Pink
The median household income in Pink is $65,417, with the highest median household income of $74,010 found in the 25 to 44 years age bracket for the primary householder. A total of 251 households (34.3%) fall into this category. Meanwhile, the 15 to 24 years age bracket for the primary householder has the lowest median household income of $0, with 6 households (0.8%) in this group.
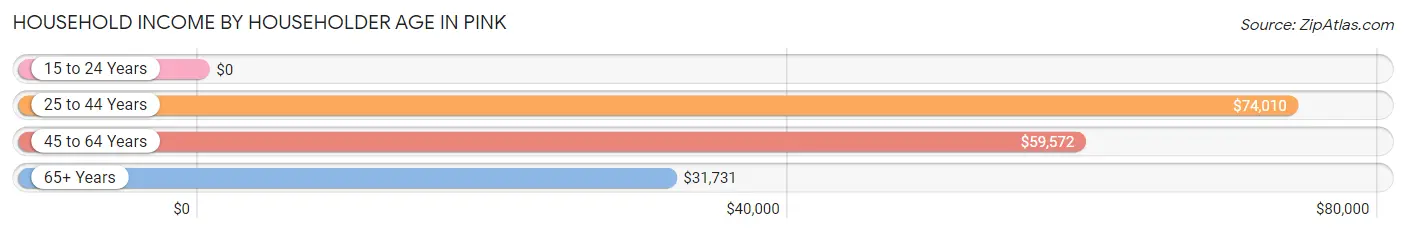
| Income Bracket | # Households | Median Income |
| 15 to 24 Years | 6 (0.8%) | $0 |
| 25 to 44 Years | 251 (34.3%) | $74,010 |
| 45 to 64 Years | 313 (42.8%) | $59,572 |
| 65+ Years | 162 (22.1%) | $31,731 |
| Total | 732 (100.0%) | $65,417 |
Poverty in Pink
Income Below Poverty by Sex and Age in Pink
With 15.0% poverty level for males and 18.1% for females among the residents of Pink, 65 to 74 year old males and 65 to 74 year old females are the most vulnerable to poverty, with 50 males (37.0%) and 43 females (36.7%) in their respective age groups living below the poverty level.
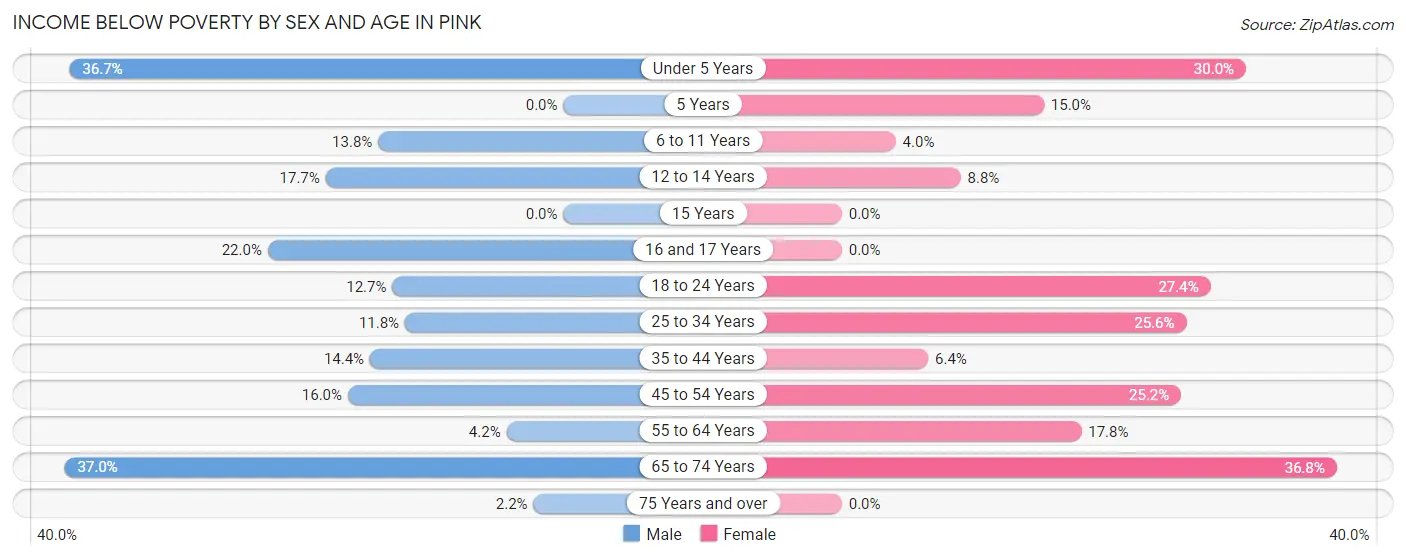
| Age Bracket | Male | Female |
| Under 5 Years | 11 (36.7%) | 12 (30.0%) |
| 5 Years | 0 (0.0%) | 3 (15.0%) |
| 6 to 11 Years | 11 (13.8%) | 4 (4.0%) |
| 12 to 14 Years | 3 (17.6%) | 3 (8.8%) |
| 15 Years | 0 (0.0%) | 0 (0.0%) |
| 16 and 17 Years | 9 (22.0%) | 0 (0.0%) |
| 18 to 24 Years | 16 (12.7%) | 26 (27.4%) |
| 25 to 34 Years | 14 (11.8%) | 22 (25.6%) |
| 35 to 44 Years | 27 (14.4%) | 10 (6.4%) |
| 45 to 54 Years | 20 (16.0%) | 33 (25.2%) |
| 55 to 64 Years | 7 (4.2%) | 24 (17.8%) |
| 65 to 74 Years | 50 (37.0%) | 43 (36.7%) |
| 75 Years and over | 1 (2.2%) | 0 (0.0%) |
| Total | 169 (15.0%) | 180 (18.1%) |
Income Above Poverty by Sex and Age in Pink
According to the poverty statistics in Pink, males aged 5 years and females aged 15 years are the age groups that are most secure financially, with 100.0% of males and 100.0% of females in these age groups living above the poverty line.
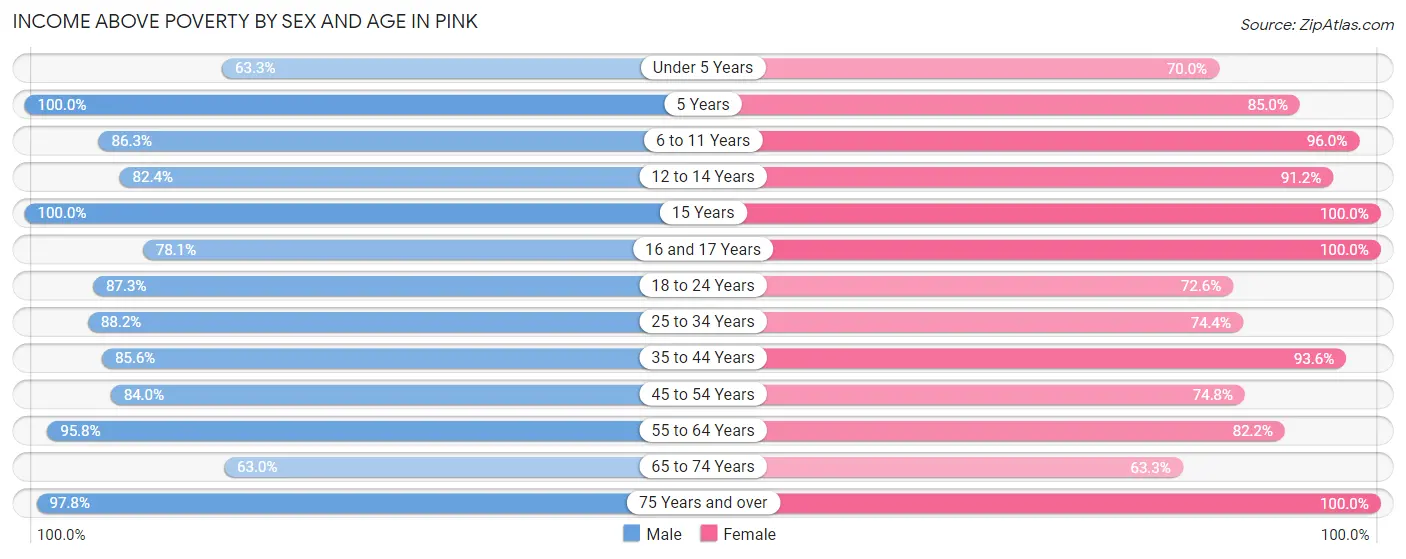
| Age Bracket | Male | Female |
| Under 5 Years | 19 (63.3%) | 28 (70.0%) |
| 5 Years | 7 (100.0%) | 17 (85.0%) |
| 6 to 11 Years | 69 (86.3%) | 96 (96.0%) |
| 12 to 14 Years | 14 (82.4%) | 31 (91.2%) |
| 15 Years | 47 (100.0%) | 18 (100.0%) |
| 16 and 17 Years | 32 (78.0%) | 9 (100.0%) |
| 18 to 24 Years | 110 (87.3%) | 69 (72.6%) |
| 25 to 34 Years | 105 (88.2%) | 64 (74.4%) |
| 35 to 44 Years | 161 (85.6%) | 146 (93.6%) |
| 45 to 54 Years | 105 (84.0%) | 98 (74.8%) |
| 55 to 64 Years | 159 (95.8%) | 111 (82.2%) |
| 65 to 74 Years | 85 (63.0%) | 74 (63.2%) |
| 75 Years and over | 44 (97.8%) | 52 (100.0%) |
| Total | 957 (85.0%) | 813 (81.9%) |
Income Below Poverty Among Married-Couple Families in Pink
The poverty statistics for married-couple families in Pink show that 13.8% or 59 of the total 428 families live below the poverty line. Families with 1 or 2 children have the highest poverty rate of 40.7%, comprising of 22 families. On the other hand, families with 5 or more children have the lowest poverty rate of 0.0%, which includes 0 families.
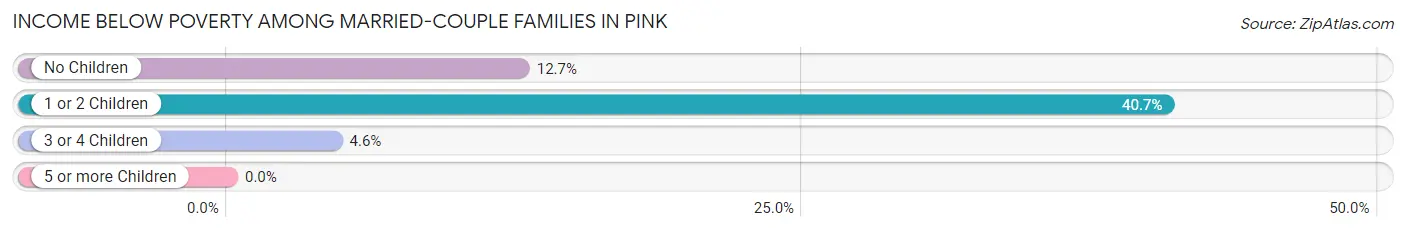
| Children | Above Poverty | Below Poverty |
| No Children | 220 (87.3%) | 32 (12.7%) |
| 1 or 2 Children | 32 (59.3%) | 22 (40.7%) |
| 3 or 4 Children | 105 (95.5%) | 5 (4.5%) |
| 5 or more Children | 12 (100.0%) | 0 (0.0%) |
| Total | 369 (86.2%) | 59 (13.8%) |
Income Below Poverty Among Single-Parent Households in Pink
According to the poverty data in Pink, 11.5% or 7 single-father households and 8.3% or 5 single-mother households are living below the poverty line. Among single-father households, those with no children have the highest poverty rate, with 7 households (15.6%) experiencing poverty. Likewise, among single-mother households, those with 1 or 2 children have the highest poverty rate, with 5 households (26.3%) falling below the poverty line.
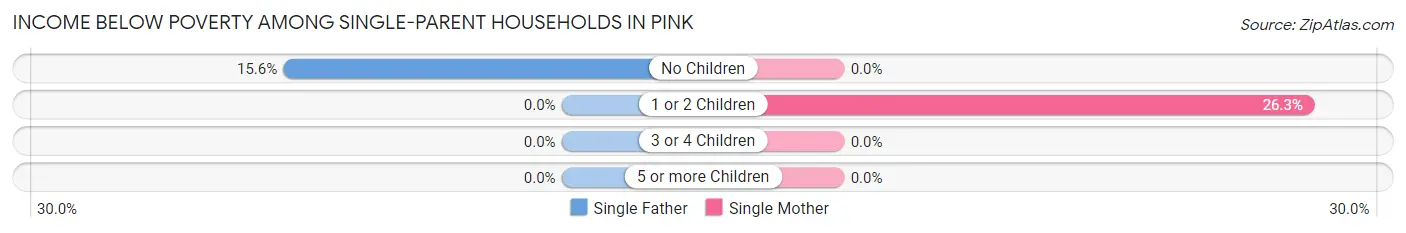
| Children | Single Father | Single Mother |
| No Children | 7 (15.6%) | 0 (0.0%) |
| 1 or 2 Children | 0 (0.0%) | 5 (26.3%) |
| 3 or 4 Children | 0 (0.0%) | 0 (0.0%) |
| 5 or more Children | 0 (0.0%) | 0 (0.0%) |
| Total | 7 (11.5%) | 5 (8.3%) |
Income Below Poverty Among Married-Couple vs Single-Parent Households in Pink
The poverty data for Pink shows that 59 of the married-couple family households (13.8%) and 12 of the single-parent households (9.9%) are living below the poverty level. Within the married-couple family households, those with 1 or 2 children have the highest poverty rate, with 22 households (40.7%) falling below the poverty line. Among the single-parent households, those with 1 or 2 children have the highest poverty rate, with 5 household (14.3%) living below poverty.
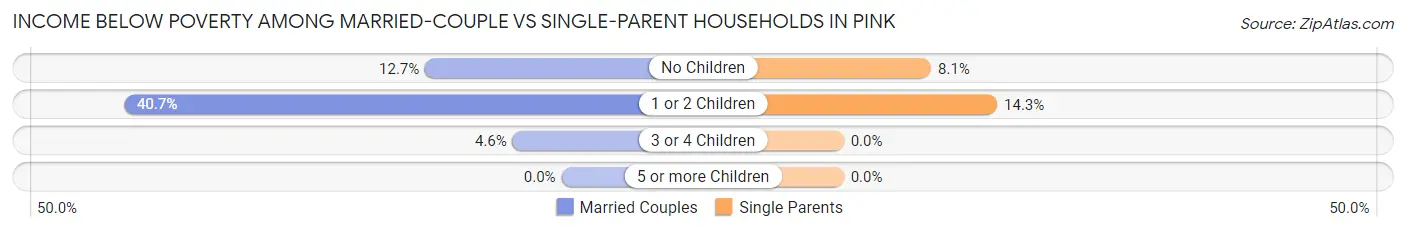
| Children | Married-Couple Families | Single-Parent Households |
| No Children | 32 (12.7%) | 7 (8.1%) |
| 1 or 2 Children | 22 (40.7%) | 5 (14.3%) |
| 3 or 4 Children | 5 (4.5%) | 0 (0.0%) |
| 5 or more Children | 0 (0.0%) | 0 (0.0%) |
| Total | 59 (13.8%) | 12 (9.9%) |
Race in Pink
The most populous races in Pink are White / Caucasian (1,733 | 81.8%), Two or more Races (161 | 7.6%), and Hispanic or Latino (118 | 5.6%).
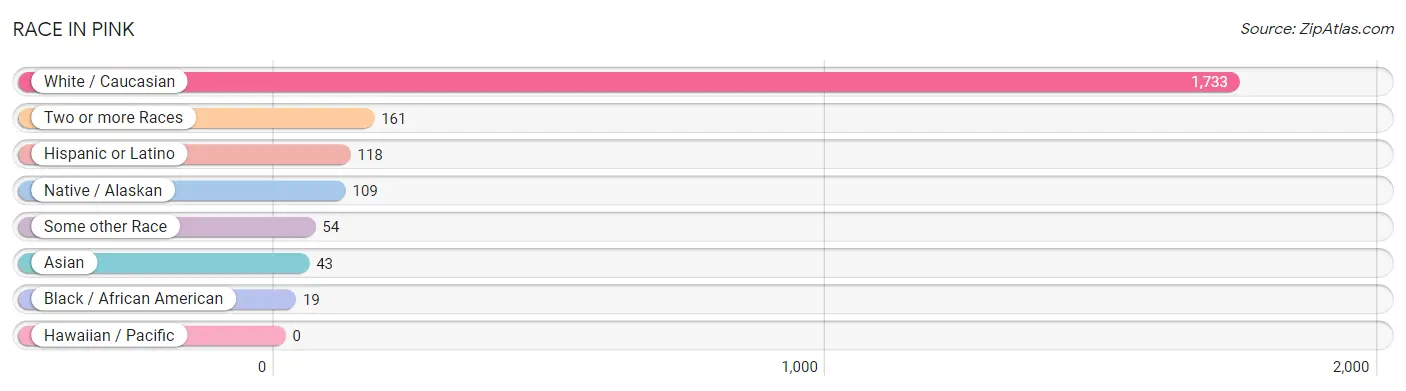
| Race | # Population | % Population |
| Asian | 43 | 2.0% |
| Black / African American | 19 | 0.9% |
| Hawaiian / Pacific | 0 | 0.0% |
| Hispanic or Latino | 118 | 5.6% |
| Native / Alaskan | 109 | 5.1% |
| White / Caucasian | 1,733 | 81.8% |
| Two or more Races | 161 | 7.6% |
| Some other Race | 54 | 2.5% |
| Total | 2,119 | 100.0% |
Ancestry in Pink
The most populous ancestries reported in Pink are Irish (228 | 10.8%), English (212 | 10.0%), German (191 | 9.0%), Mexican (118 | 5.6%), and American (86 | 4.1%), together accounting for 39.4% of all Pink residents.
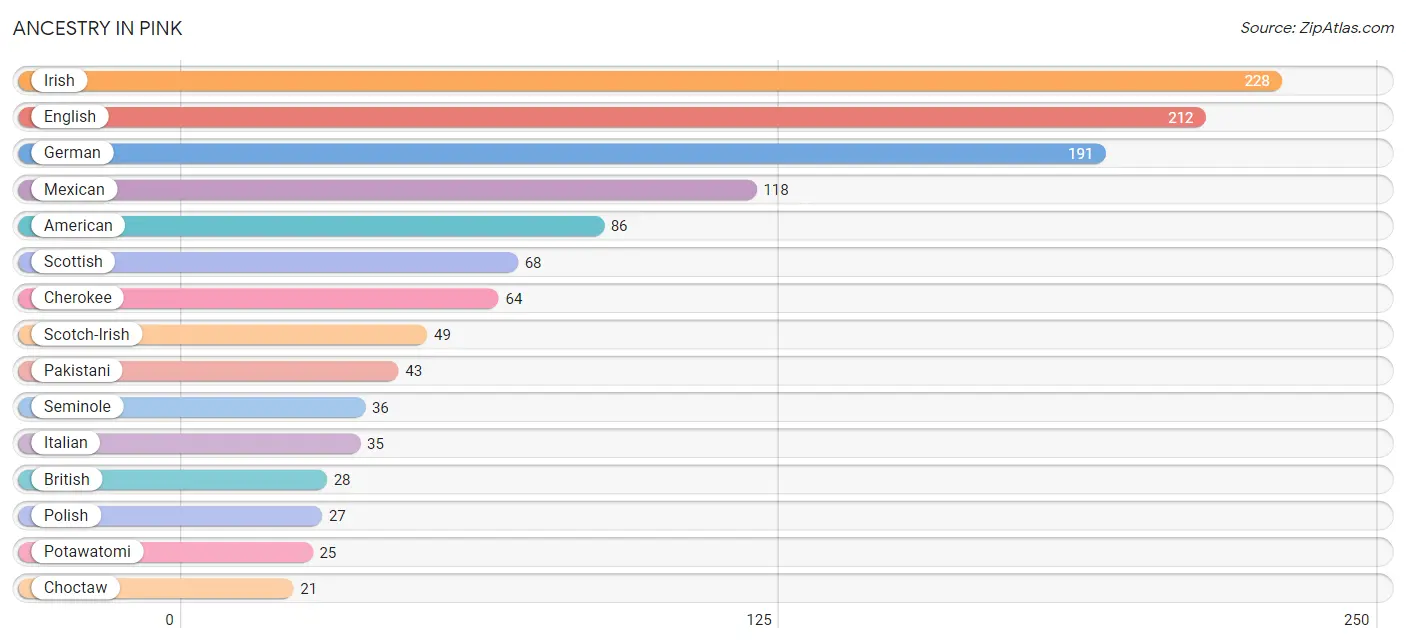
| Ancestry | # Population | % Population |
| American | 86 | 4.1% |
| British | 28 | 1.3% |
| Cherokee | 64 | 3.0% |
| Chickasaw | 11 | 0.5% |
| Choctaw | 21 | 1.0% |
| Creek | 9 | 0.4% |
| Czechoslovakian | 7 | 0.3% |
| Danish | 5 | 0.2% |
| Dutch | 16 | 0.8% |
| English | 212 | 10.0% |
| European | 11 | 0.5% |
| French | 4 | 0.2% |
| German | 191 | 9.0% |
| Hungarian | 8 | 0.4% |
| Icelander | 11 | 0.5% |
| Irish | 228 | 10.8% |
| Italian | 35 | 1.7% |
| Mexican | 118 | 5.6% |
| Norwegian | 3 | 0.1% |
| Pakistani | 43 | 2.0% |
| Polish | 27 | 1.3% |
| Potawatomi | 25 | 1.2% |
| Scandinavian | 5 | 0.2% |
| Scotch-Irish | 49 | 2.3% |
| Scottish | 68 | 3.2% |
| Seminole | 36 | 1.7% |
| Swedish | 8 | 0.4% |
| Swiss | 4 | 0.2% |
| Welsh | 10 | 0.5% |
| Yaqui | 11 | 0.5% | View All 30 Rows |
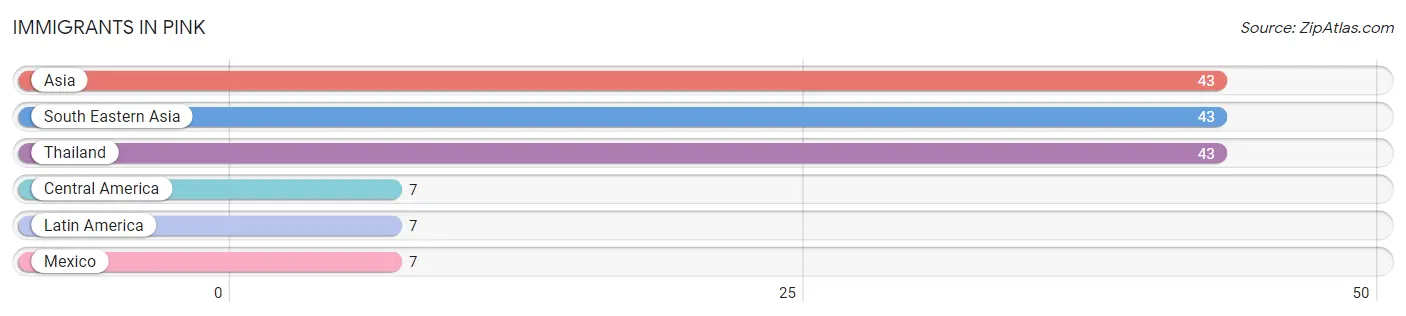
Immigrants in Pink
The most numerous immigrant groups reported in Pink came from Asia (43 | 2.0%), South Eastern Asia (43 | 2.0%), Thailand (43 | 2.0%), Central America (7 | 0.3%), and Latin America (7 | 0.3%), together accounting for 6.7% of all Pink residents.
| Immigration Origin | # Population | % Population |
| Asia | 43 | 2.0% |
| Central America | 7 | 0.3% |
| Latin America | 7 | 0.3% |
| Mexico | 7 | 0.3% |
| South Eastern Asia | 43 | 2.0% |
| Thailand | 43 | 2.0% | View All 6 Rows |
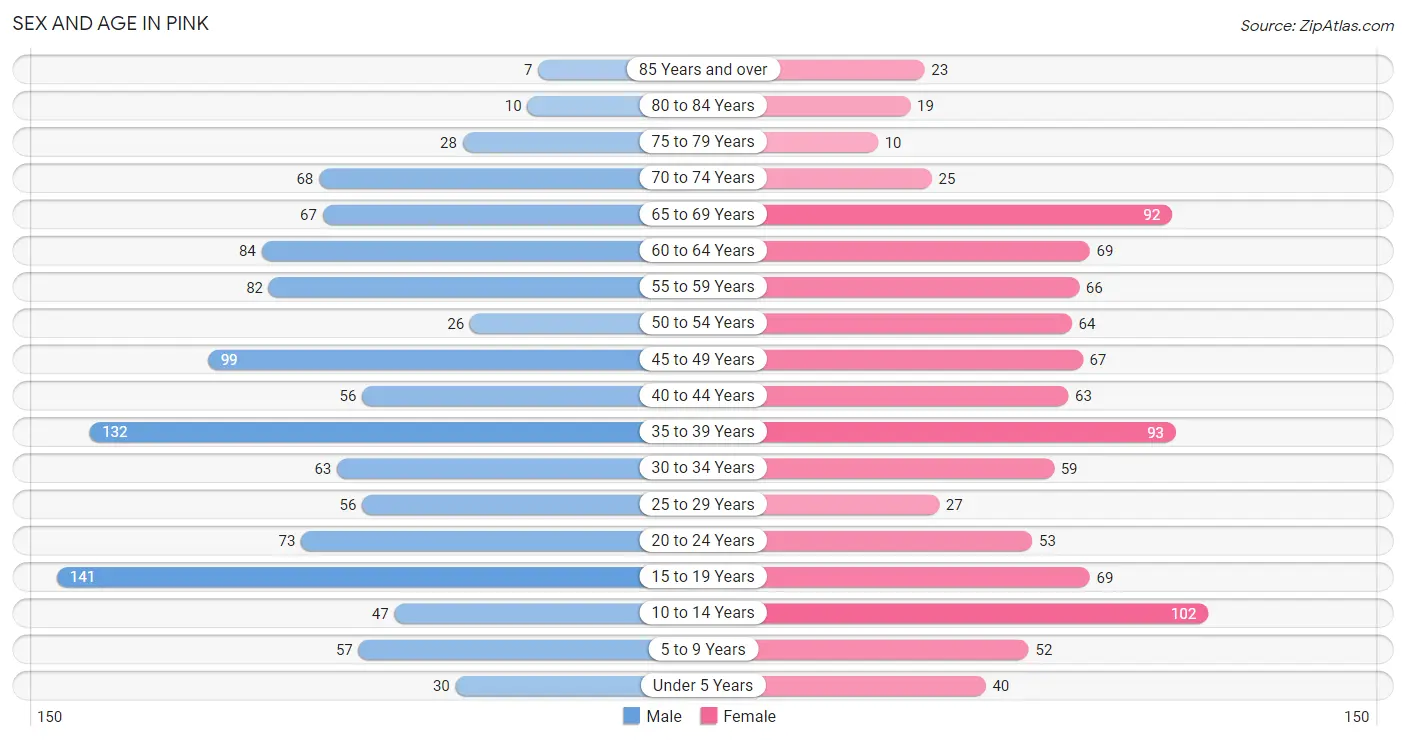
Sex and Age in Pink
Sex and Age in Pink
The most populous age groups in Pink are 15 to 19 Years (141 | 12.5%) for men and 10 to 14 Years (102 | 10.3%) for women.
| Age Bracket | Male | Female |
| Under 5 Years | 30 (2.7%) | 40 (4.0%) |
| 5 to 9 Years | 57 (5.1%) | 52 (5.2%) |
| 10 to 14 Years | 47 (4.2%) | 102 (10.3%) |
| 15 to 19 Years | 141 (12.5%) | 69 (7.0%) |
| 20 to 24 Years | 73 (6.5%) | 53 (5.3%) |
| 25 to 29 Years | 56 (5.0%) | 27 (2.7%) |
| 30 to 34 Years | 63 (5.6%) | 59 (5.9%) |
| 35 to 39 Years | 132 (11.7%) | 93 (9.4%) |
| 40 to 44 Years | 56 (5.0%) | 63 (6.3%) |
| 45 to 49 Years | 99 (8.8%) | 67 (6.8%) |
| 50 to 54 Years | 26 (2.3%) | 64 (6.5%) |
| 55 to 59 Years | 82 (7.3%) | 66 (6.7%) |
| 60 to 64 Years | 84 (7.5%) | 69 (7.0%) |
| 65 to 69 Years | 67 (5.9%) | 92 (9.3%) |
| 70 to 74 Years | 68 (6.0%) | 25 (2.5%) |
| 75 to 79 Years | 28 (2.5%) | 10 (1.0%) |
| 80 to 84 Years | 10 (0.9%) | 19 (1.9%) |
| 85 Years and over | 7 (0.6%) | 23 (2.3%) |
| Total | 1,126 (100.0%) | 993 (100.0%) |
Families and Households in Pink
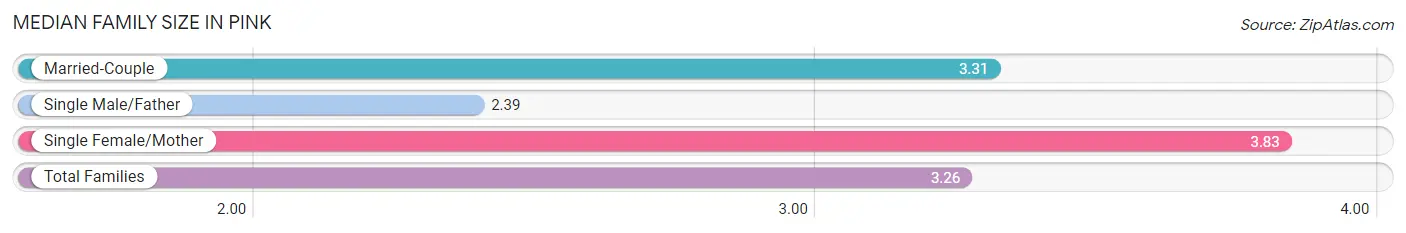
Median Family Size in Pink
The median family size in Pink is 3.26 persons per family, with single female/mother families (60 | 10.9%) accounting for the largest median family size of 3.83 persons per family. On the other hand, single male/father families (61 | 11.1%) represent the smallest median family size with 2.39 persons per family.
| Family Type | # Families | Family Size |
| Married-Couple | 428 (78.0%) | 3.31 |
| Single Male/Father | 61 (11.1%) | 2.39 |
| Single Female/Mother | 60 (10.9%) | 3.83 |
| Total Families | 549 (100.0%) | 3.26 |
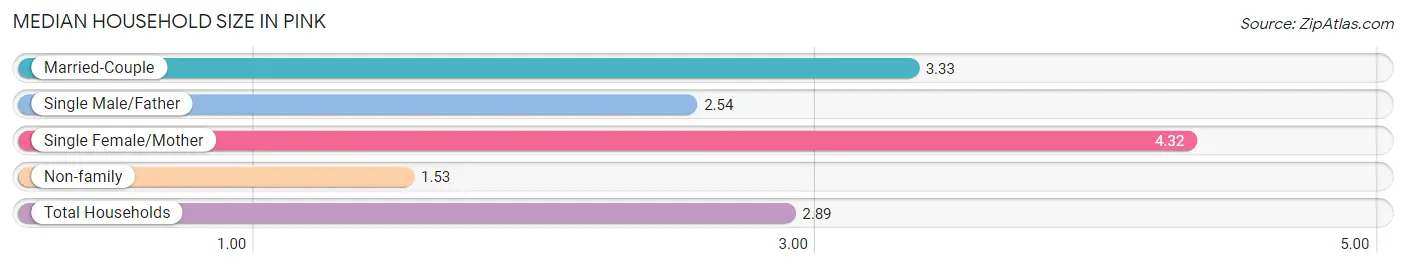
Median Household Size in Pink
The median household size in Pink is 2.89 persons per household, with single female/mother households (60 | 8.2%) accounting for the largest median household size of 4.32 persons per household. non-family households (183 | 25.0%) represent the smallest median household size with 1.53 persons per household.
| Household Type | # Households | Household Size |
| Married-Couple | 428 (58.5%) | 3.33 |
| Single Male/Father | 61 (8.3%) | 2.54 |
| Single Female/Mother | 60 (8.2%) | 4.32 |
| Non-family | 183 (25.0%) | 1.53 |
| Total Households | 732 (100.0%) | 2.89 |
Household Size by Marriage Status in Pink
Out of a total of 732 households in Pink, 549 (75.0%) are family households, while 183 (25.0%) are nonfamily households. The most numerous type of family households are 2-person households, comprising 235, and the most common type of nonfamily households are 1-person households, comprising 136.
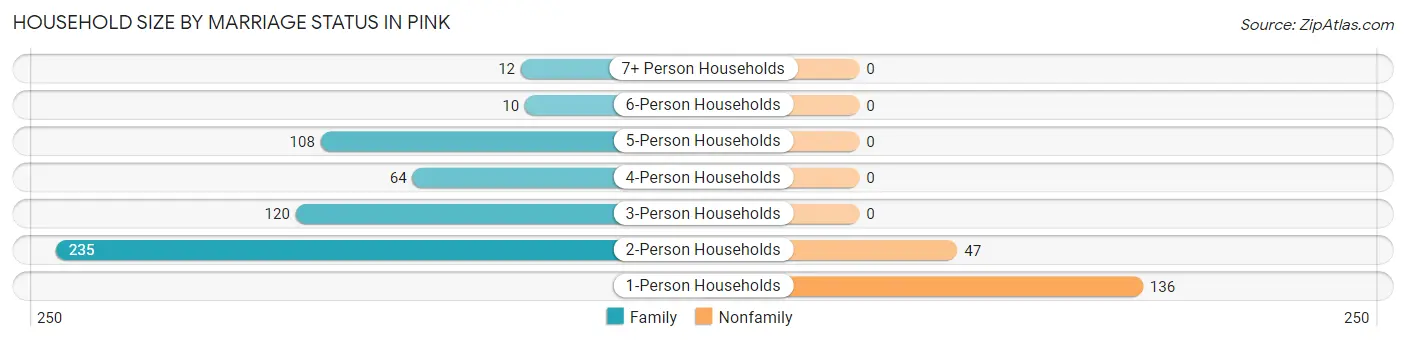
| Household Size | Family Households | Nonfamily Households |
| 1-Person Households | - | 136 (18.6%) |
| 2-Person Households | 235 (32.1%) | 47 (6.4%) |
| 3-Person Households | 120 (16.4%) | 0 (0.0%) |
| 4-Person Households | 64 (8.7%) | 0 (0.0%) |
| 5-Person Households | 108 (14.7%) | 0 (0.0%) |
| 6-Person Households | 10 (1.4%) | 0 (0.0%) |
| 7+ Person Households | 12 (1.6%) | 0 (0.0%) |
| Total | 549 (75.0%) | 183 (25.0%) |
Female Fertility in Pink
Fertility by Age in Pink
Average fertility rate in Pink is 24.0 births per 1,000 women. Women in the age bracket of 20 to 34 years have the highest fertility rate with 36.0 births per 1,000 women. Women in the age bracket of 35 to 50 years acount for 54.5% of all women with births.
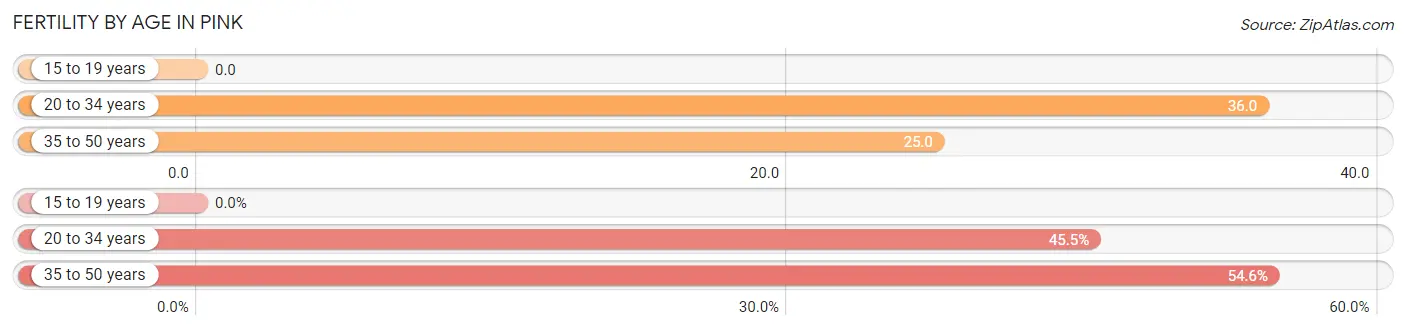
| Age Bracket | Women with Births | Births / 1,000 Women |
| 15 to 19 years | 0 (0.0%) | 0.0 |
| 20 to 34 years | 5 (45.5%) | 36.0 |
| 35 to 50 years | 6 (54.5%) | 25.0 |
| Total | 11 (100.0%) | 24.0 |
Fertility by Age by Marriage Status in Pink
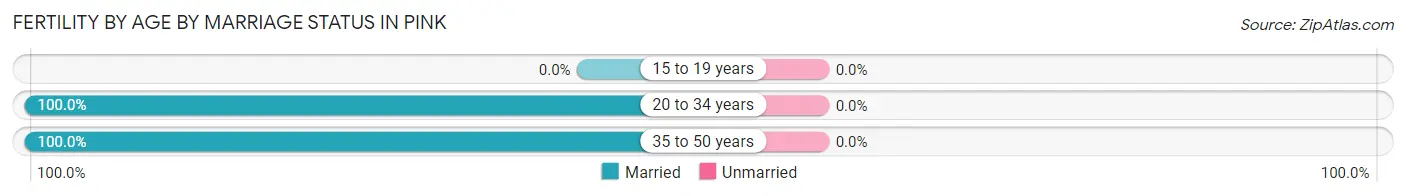
| Age Bracket | Married | Unmarried |
| 15 to 19 years | 0 (0.0%) | 0 (0.0%) |
| 20 to 34 years | 5 (100.0%) | 0 (0.0%) |
| 35 to 50 years | 6 (100.0%) | 0 (0.0%) |
| Total | 11 (100.0%) | 0 (0.0%) |
Fertility by Education in Pink
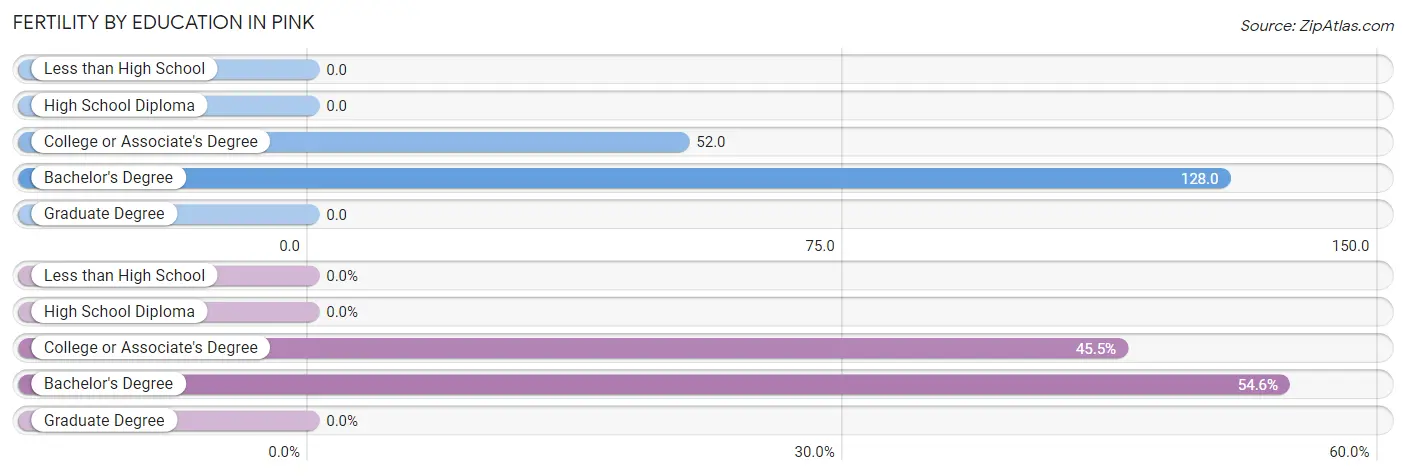
| Educational Attainment | Women with Births | Births / 1,000 Women |
| Less than High School | 0 (0.0%) | 0.0 |
| High School Diploma | 0 (0.0%) | 0.0 |
| College or Associate's Degree | 5 (45.5%) | 52.0 |
| Bachelor's Degree | 6 (54.5%) | 128.0 |
| Graduate Degree | 0 (0.0%) | 0.0 |
| Total | 11 (100.0%) | 24.0 |
Fertility by Education by Marriage Status in Pink
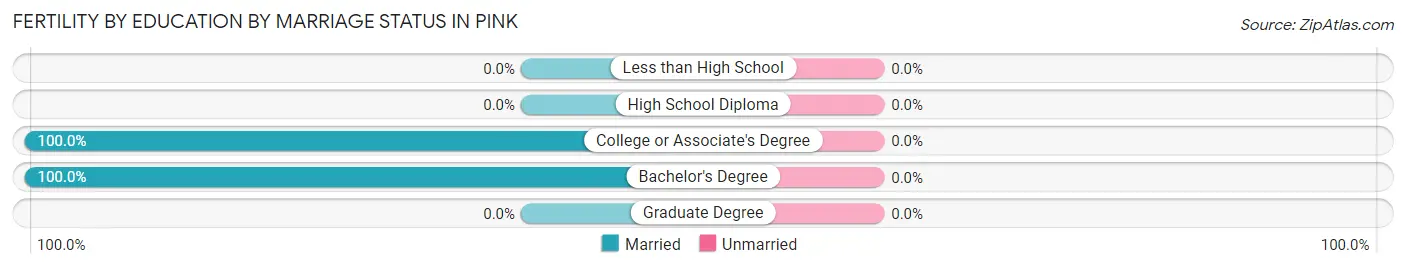
| Educational Attainment | Married | Unmarried |
| Less than High School | 0 (0.0%) | 0 (0.0%) |
| High School Diploma | 0 (0.0%) | 0 (0.0%) |
| College or Associate's Degree | 5 (100.0%) | 0 (0.0%) |
| Bachelor's Degree | 6 (100.0%) | 0 (0.0%) |
| Graduate Degree | 0 (0.0%) | 0 (0.0%) |
| Total | 11 (100.0%) | 0 (0.0%) |
Employment Characteristics in Pink
Employment by Class of Employer in Pink
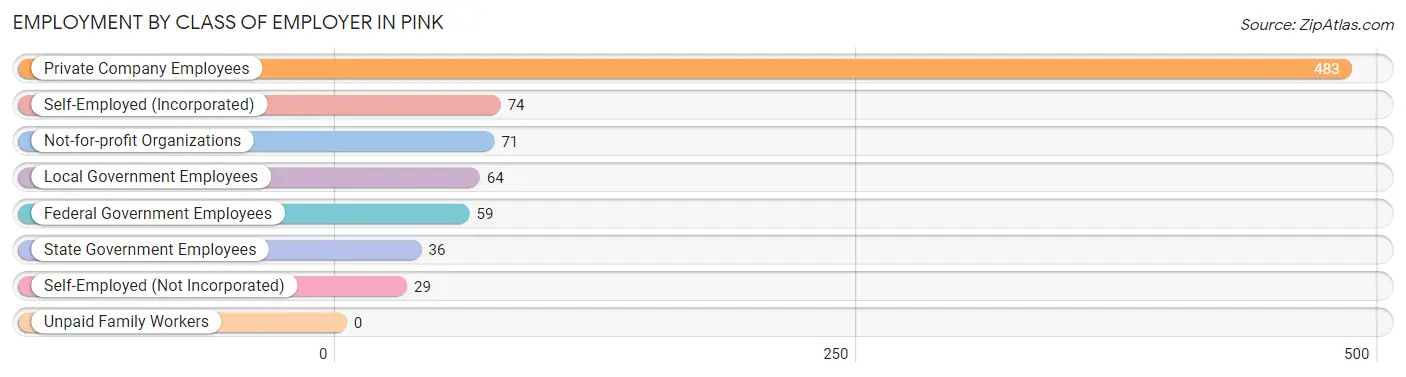
Among the 816 employed individuals in Pink, private company employees (483 | 59.2%), self-employed (incorporated) (74 | 9.1%), and not-for-profit organizations (71 | 8.7%) make up the most common classes of employment.
| Employer Class | # Employees | % Employees |
| Private Company Employees | 483 | 59.2% |
| Self-Employed (Incorporated) | 74 | 9.1% |
| Self-Employed (Not Incorporated) | 29 | 3.5% |
| Not-for-profit Organizations | 71 | 8.7% |
| Local Government Employees | 64 | 7.8% |
| State Government Employees | 36 | 4.4% |
| Federal Government Employees | 59 | 7.2% |
| Unpaid Family Workers | 0 | 0.0% |
| Total | 816 | 100.0% |
Employment Status by Age in Pink
According to the labor force statistics for Pink, out of the total population over 16 years of age (1,726), 50.8% or 877 individuals are in the labor force, with 5.7% or 50 of them unemployed. The age group with the highest labor force participation rate is 20 to 24 years, with 70.6% or 89 individuals in the labor force. Within the labor force, the 65 to 74 years age range has the highest percentage of unemployed individuals, with 34.7% or 17 of them being unemployed.
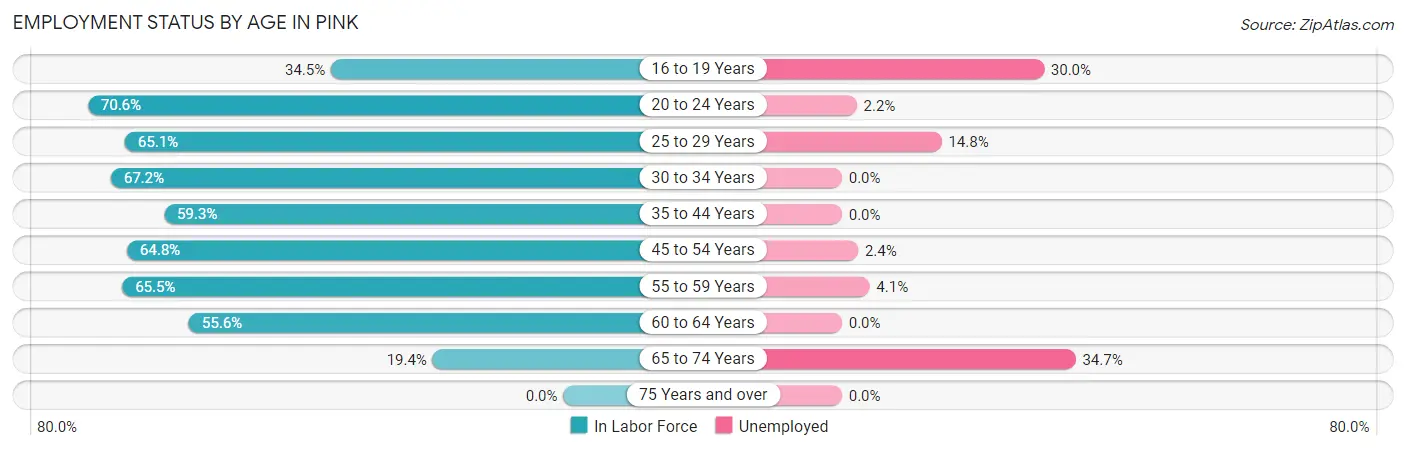
| Age Bracket | In Labor Force | Unemployed |
| 16 to 19 Years | 50 (34.5%) | 15 (30.0%) |
| 20 to 24 Years | 89 (70.6%) | 2 (2.2%) |
| 25 to 29 Years | 54 (65.1%) | 8 (14.8%) |
| 30 to 34 Years | 82 (67.2%) | 0 (0.0%) |
| 35 to 44 Years | 204 (59.3%) | 0 (0.0%) |
| 45 to 54 Years | 166 (64.8%) | 4 (2.4%) |
| 55 to 59 Years | 97 (65.5%) | 4 (4.1%) |
| 60 to 64 Years | 85 (55.6%) | 0 (0.0%) |
| 65 to 74 Years | 49 (19.4%) | 17 (34.7%) |
| 75 Years and over | 0 (0.0%) | 0 (0.0%) |
| Total | 877 (50.8%) | 50 (5.7%) |
Employment Status by Educational Attainment in Pink
According to labor force statistics for Pink, 62.2% of individuals (688) out of the total population between 25 and 64 years of age (1,106) are in the labor force, with 2.3% or 16 of them being unemployed. The group with the highest labor force participation rate are those with the educational attainment of bachelor's degree or higher, with 90.1% or 137 individuals in the labor force. Within the labor force, individuals with college / associate degree education have the highest percentage of unemployment, with 4.0% or 8 of them being unemployed.
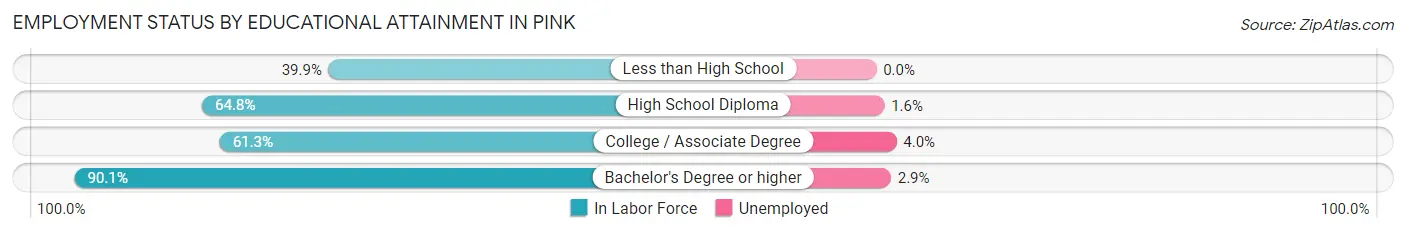
| Educational Attainment | In Labor Force | Unemployed |
| Less than High School | 89 (39.9%) | 0 (0.0%) |
| High School Diploma | 258 (64.8%) | 6 (1.6%) |
| College / Associate Degree | 204 (61.3%) | 13 (4.0%) |
| Bachelor's Degree or higher | 137 (90.1%) | 4 (2.9%) |
| Total | 688 (62.2%) | 25 (2.3%) |
Employment Occupations by Sex in Pink
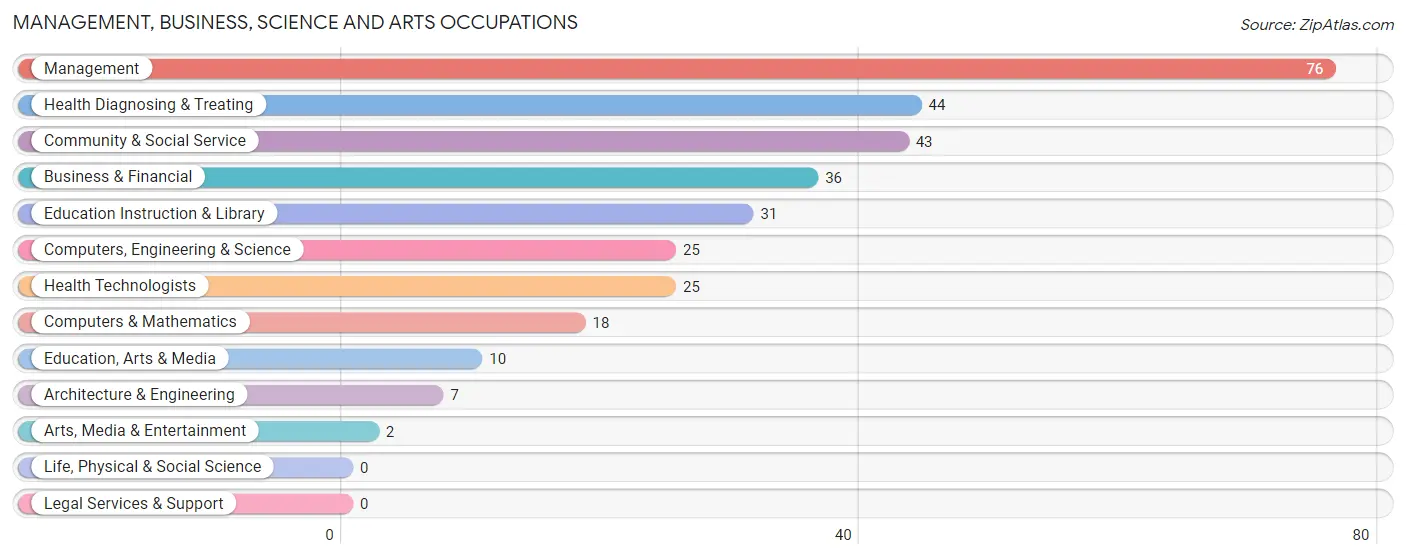
Management, Business, Science and Arts Occupations
The most common Management, Business, Science and Arts occupations in Pink are Management (76 | 9.2%), Health Diagnosing & Treating (44 | 5.3%), Community & Social Service (43 | 5.2%), Business & Financial (36 | 4.4%), and Education Instruction & Library (31 | 3.8%).
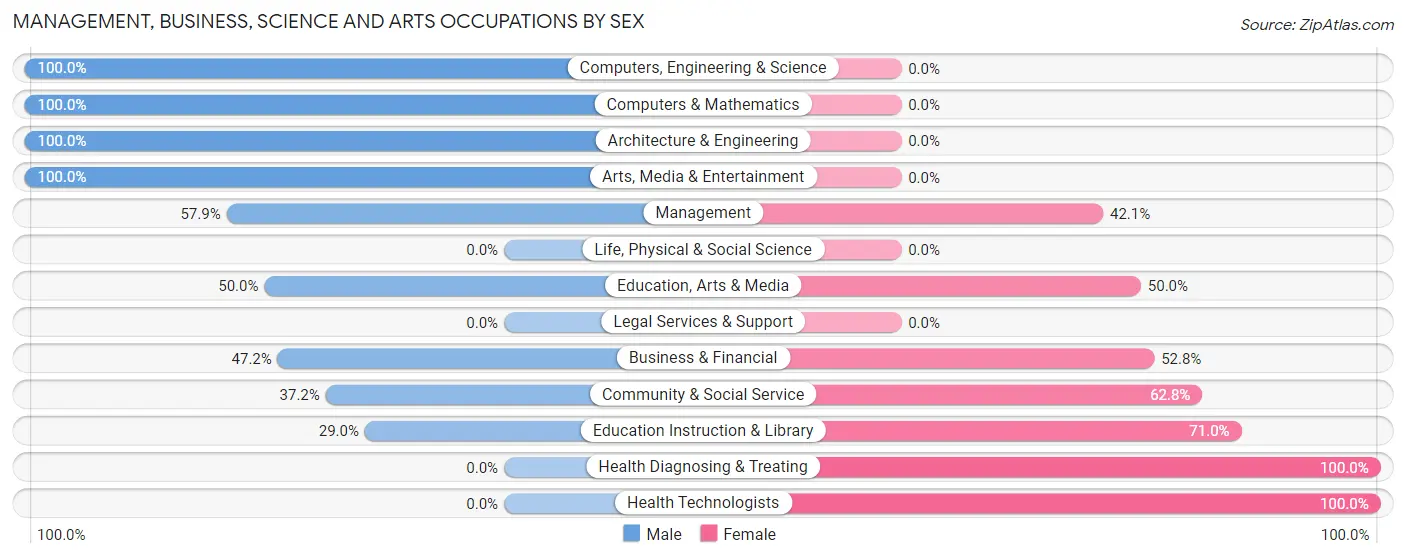
Management, Business, Science and Arts Occupations by Sex
Within the Management, Business, Science and Arts occupations in Pink, the most male-oriented occupations are Computers, Engineering & Science (100.0%), Computers & Mathematics (100.0%), and Architecture & Engineering (100.0%), while the most female-oriented occupations are Health Diagnosing & Treating (100.0%), Health Technologists (100.0%), and Education Instruction & Library (71.0%).
| Occupation | Male | Female |
| Management | 44 (57.9%) | 32 (42.1%) |
| Business & Financial | 17 (47.2%) | 19 (52.8%) |
| Computers, Engineering & Science | 25 (100.0%) | 0 (0.0%) |
| Computers & Mathematics | 18 (100.0%) | 0 (0.0%) |
| Architecture & Engineering | 7 (100.0%) | 0 (0.0%) |
| Life, Physical & Social Science | 0 (0.0%) | 0 (0.0%) |
| Community & Social Service | 16 (37.2%) | 27 (62.8%) |
| Education, Arts & Media | 5 (50.0%) | 5 (50.0%) |
| Legal Services & Support | 0 (0.0%) | 0 (0.0%) |
| Education Instruction & Library | 9 (29.0%) | 22 (71.0%) |
| Arts, Media & Entertainment | 2 (100.0%) | 0 (0.0%) |
| Health Diagnosing & Treating | 0 (0.0%) | 44 (100.0%) |
| Health Technologists | 0 (0.0%) | 25 (100.0%) |
| Total (Category) | 102 (45.5%) | 122 (54.5%) |
| Total (Overall) | 536 (65.2%) | 286 (34.8%) |
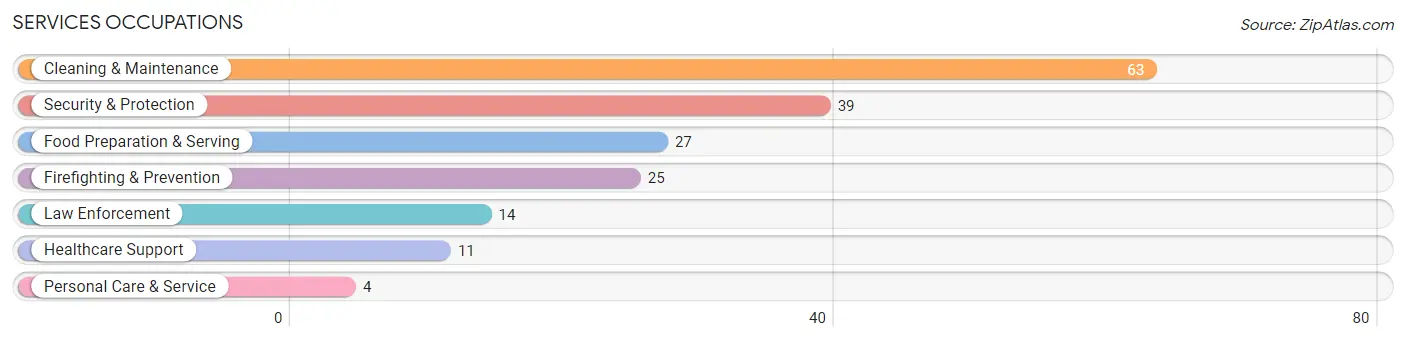
Services Occupations
The most common Services occupations in Pink are Cleaning & Maintenance (63 | 7.7%), Security & Protection (39 | 4.7%), Food Preparation & Serving (27 | 3.3%), Firefighting & Prevention (25 | 3.0%), and Law Enforcement (14 | 1.7%).
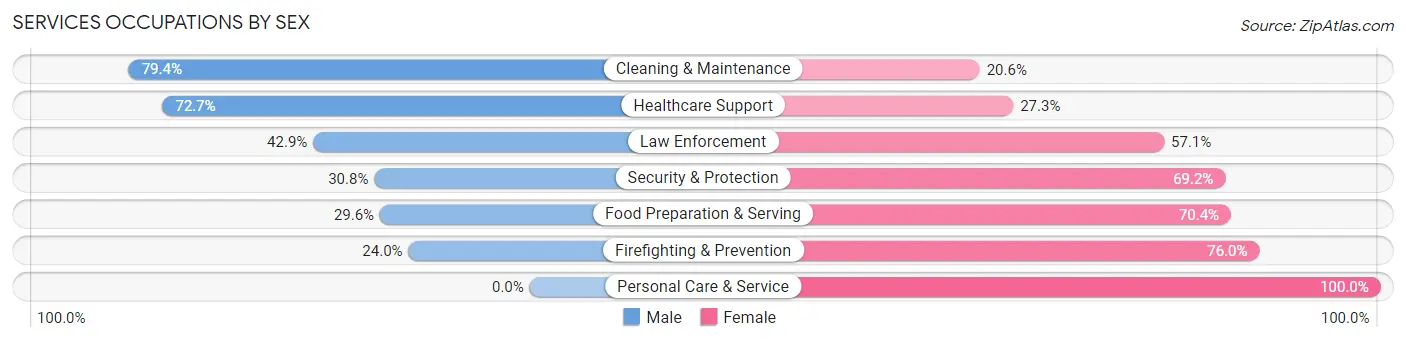
Services Occupations by Sex
Within the Services occupations in Pink, the most male-oriented occupations are Cleaning & Maintenance (79.4%), Healthcare Support (72.7%), and Law Enforcement (42.9%), while the most female-oriented occupations are Personal Care & Service (100.0%), Firefighting & Prevention (76.0%), and Food Preparation & Serving (70.4%).
| Occupation | Male | Female |
| Healthcare Support | 8 (72.7%) | 3 (27.3%) |
| Security & Protection | 12 (30.8%) | 27 (69.2%) |
| Firefighting & Prevention | 6 (24.0%) | 19 (76.0%) |
| Law Enforcement | 6 (42.9%) | 8 (57.1%) |
| Food Preparation & Serving | 8 (29.6%) | 19 (70.4%) |
| Cleaning & Maintenance | 50 (79.4%) | 13 (20.6%) |
| Personal Care & Service | 0 (0.0%) | 4 (100.0%) |
| Total (Category) | 78 (54.2%) | 66 (45.8%) |
| Total (Overall) | 536 (65.2%) | 286 (34.8%) |
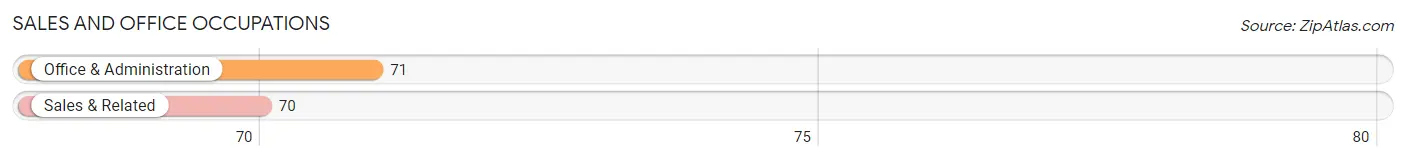
Sales and Office Occupations
The most common Sales and Office occupations in Pink are Office & Administration (71 | 8.6%), and Sales & Related (70 | 8.5%).
Sales and Office Occupations by Sex
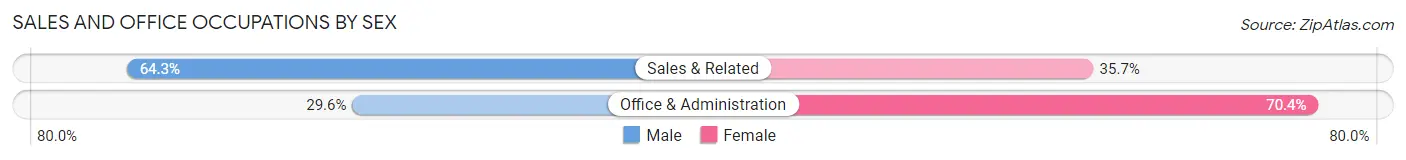
| Occupation | Male | Female |
| Sales & Related | 45 (64.3%) | 25 (35.7%) |
| Office & Administration | 21 (29.6%) | 50 (70.4%) |
| Total (Category) | 66 (46.8%) | 75 (53.2%) |
| Total (Overall) | 536 (65.2%) | 286 (34.8%) |
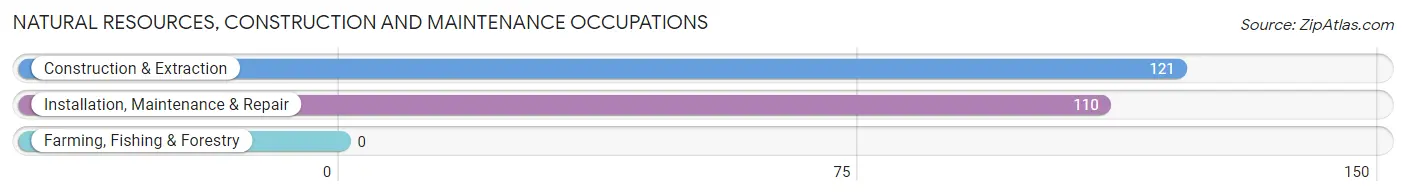
Natural Resources, Construction and Maintenance Occupations
The most common Natural Resources, Construction and Maintenance occupations in Pink are Construction & Extraction (121 | 14.7%), and Installation, Maintenance & Repair (110 | 13.4%).
Natural Resources, Construction and Maintenance Occupations by Sex
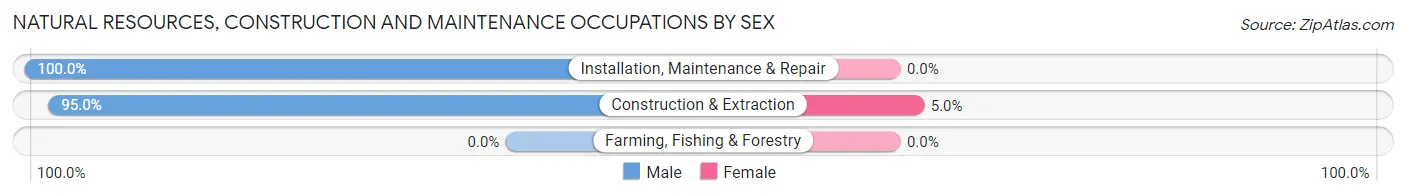
| Occupation | Male | Female |
| Farming, Fishing & Forestry | 0 (0.0%) | 0 (0.0%) |
| Construction & Extraction | 115 (95.0%) | 6 (5.0%) |
| Installation, Maintenance & Repair | 110 (100.0%) | 0 (0.0%) |
| Total (Category) | 225 (97.4%) | 6 (2.6%) |
| Total (Overall) | 536 (65.2%) | 286 (34.8%) |
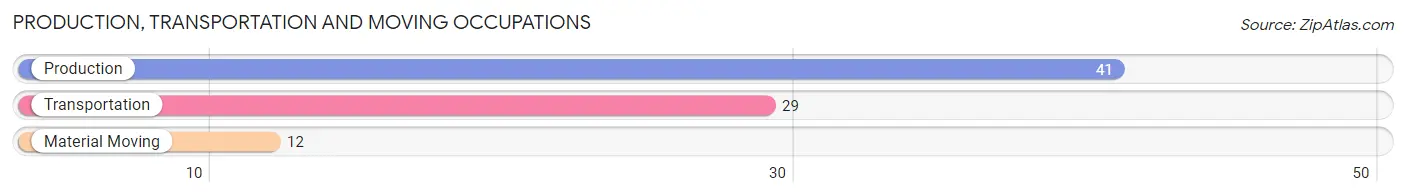
Production, Transportation and Moving Occupations
The most common Production, Transportation and Moving occupations in Pink are Production (41 | 5.0%), Transportation (29 | 3.5%), and Material Moving (12 | 1.5%).
Production, Transportation and Moving Occupations by Sex
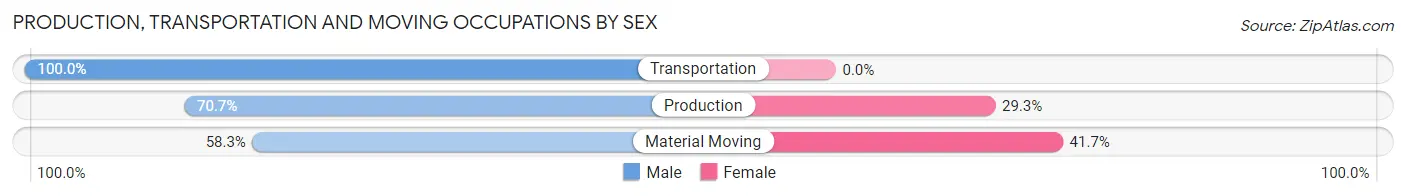
| Occupation | Male | Female |
| Production | 29 (70.7%) | 12 (29.3%) |
| Transportation | 29 (100.0%) | 0 (0.0%) |
| Material Moving | 7 (58.3%) | 5 (41.7%) |
| Total (Category) | 65 (79.3%) | 17 (20.7%) |
| Total (Overall) | 536 (65.2%) | 286 (34.8%) |
Employment Industries by Sex in Pink
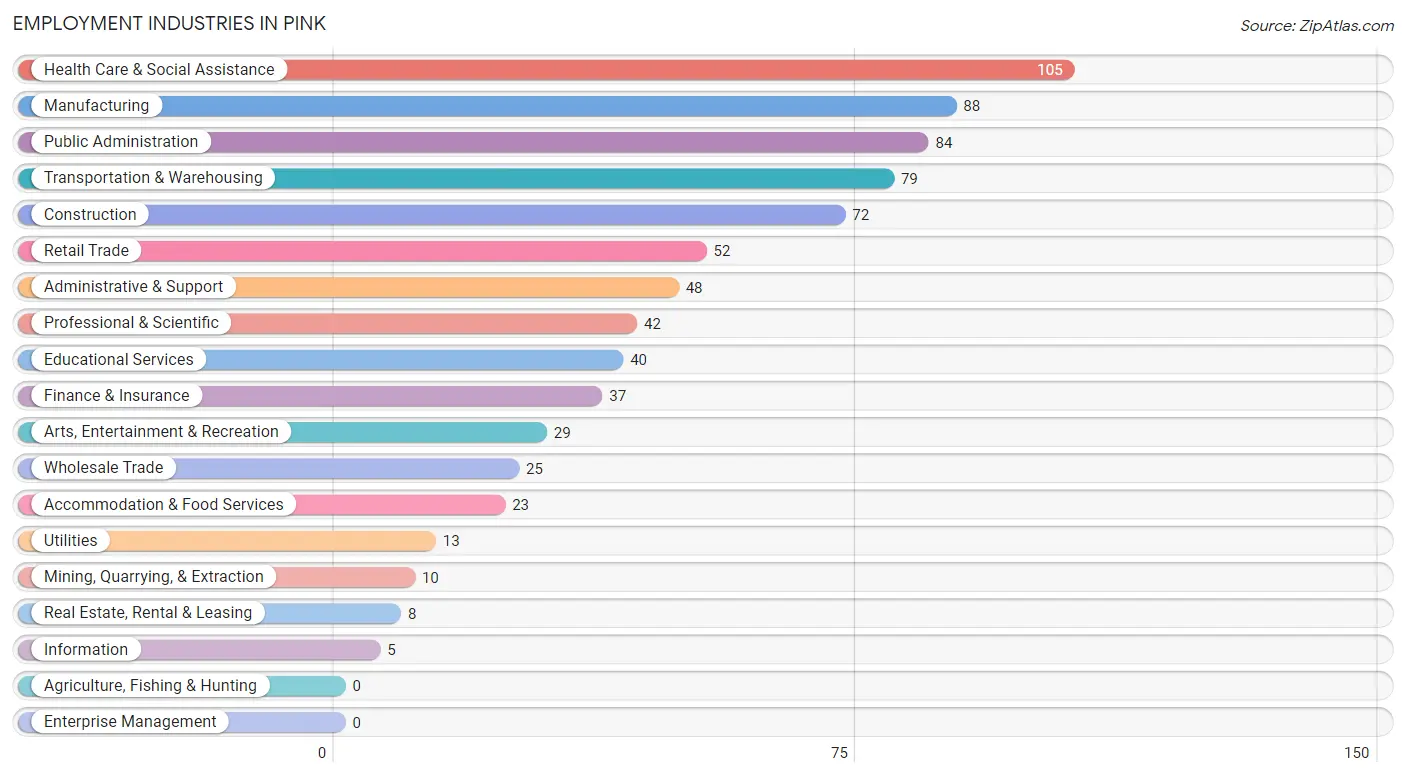
Employment Industries in Pink
The major employment industries in Pink include Health Care & Social Assistance (105 | 12.8%), Manufacturing (88 | 10.7%), Public Administration (84 | 10.2%), Transportation & Warehousing (79 | 9.6%), and Construction (72 | 8.8%).
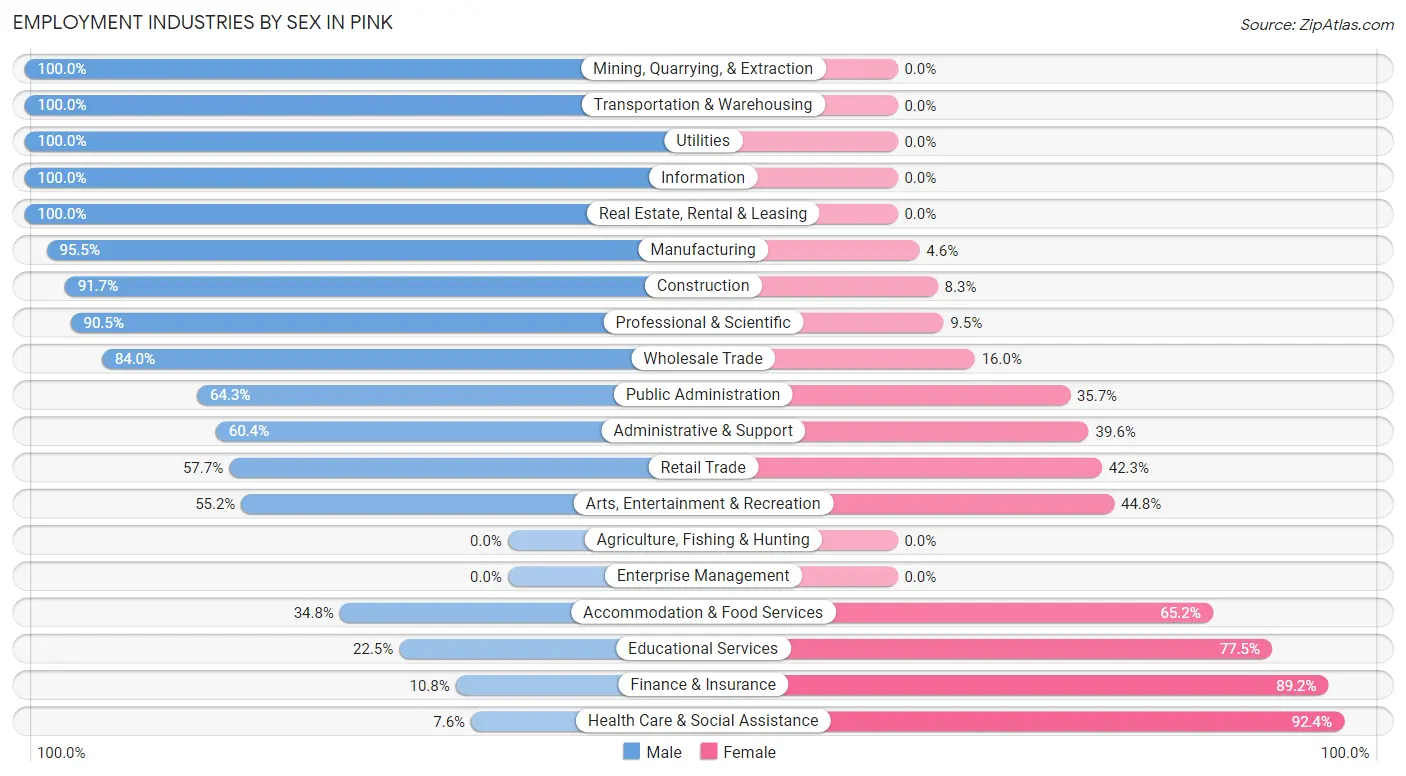
Employment Industries by Sex in Pink
The Pink industries that see more men than women are Mining, Quarrying, & Extraction (100.0%), Transportation & Warehousing (100.0%), and Utilities (100.0%), whereas the industries that tend to have a higher number of women are Health Care & Social Assistance (92.4%), Finance & Insurance (89.2%), and Educational Services (77.5%).
| Industry | Male | Female |
| Agriculture, Fishing & Hunting | 0 (0.0%) | 0 (0.0%) |
| Mining, Quarrying, & Extraction | 10 (100.0%) | 0 (0.0%) |
| Construction | 66 (91.7%) | 6 (8.3%) |
| Manufacturing | 84 (95.5%) | 4 (4.5%) |
| Wholesale Trade | 21 (84.0%) | 4 (16.0%) |
| Retail Trade | 30 (57.7%) | 22 (42.3%) |
| Transportation & Warehousing | 79 (100.0%) | 0 (0.0%) |
| Utilities | 13 (100.0%) | 0 (0.0%) |
| Information | 5 (100.0%) | 0 (0.0%) |
| Finance & Insurance | 4 (10.8%) | 33 (89.2%) |
| Real Estate, Rental & Leasing | 8 (100.0%) | 0 (0.0%) |
| Professional & Scientific | 38 (90.5%) | 4 (9.5%) |
| Enterprise Management | 0 (0.0%) | 0 (0.0%) |
| Administrative & Support | 29 (60.4%) | 19 (39.6%) |
| Educational Services | 9 (22.5%) | 31 (77.5%) |
| Health Care & Social Assistance | 8 (7.6%) | 97 (92.4%) |
| Arts, Entertainment & Recreation | 16 (55.2%) | 13 (44.8%) |
| Accommodation & Food Services | 8 (34.8%) | 15 (65.2%) |
| Public Administration | 54 (64.3%) | 30 (35.7%) |
| Total | 536 (65.2%) | 286 (34.8%) |
Education in Pink
School Enrollment in Pink
The most common levels of schooling among the 475 students in Pink are high school (164 | 34.5%), middle school (136 | 28.6%), and elementary school (81 | 17.1%).
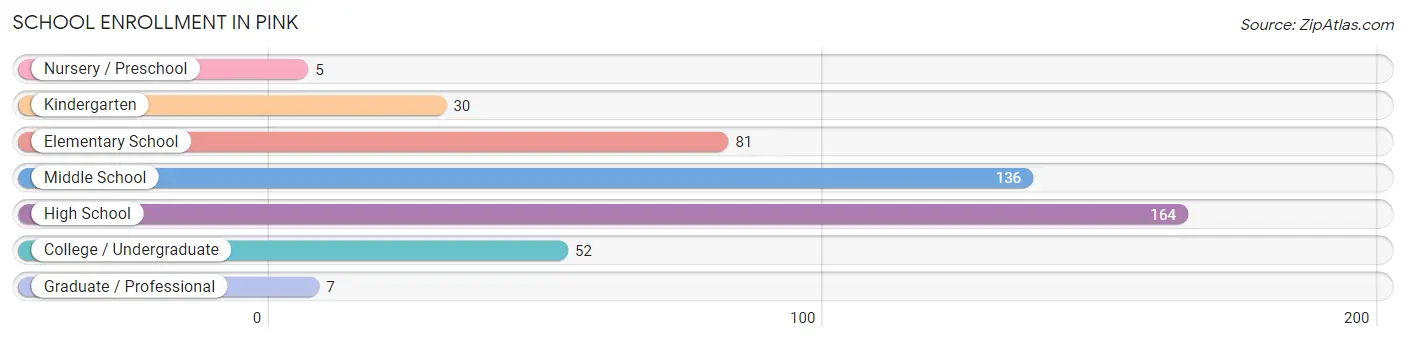
| School Level | # Students | % Students |
| Nursery / Preschool | 5 | 1.1% |
| Kindergarten | 30 | 6.3% |
| Elementary School | 81 | 17.1% |
| Middle School | 136 | 28.6% |
| High School | 164 | 34.5% |
| College / Undergraduate | 52 | 11.0% |
| Graduate / Professional | 7 | 1.5% |
| Total | 475 | 100.0% |
School Enrollment by Age by Funding Source in Pink
Out of a total of 475 students who are enrolled in schools in Pink, 158 (33.3%) attend a private institution, while the remaining 317 (66.7%) are enrolled in public schools. The age group of 20 to 24 year olds has the highest likelihood of being enrolled in private schools, with 18 (69.2% in the age bracket) enrolled. Conversely, the age group of 3 to 4 year olds has the lowest likelihood of being enrolled in a private school, with 10 (100.0% in the age bracket) attending a public institution.
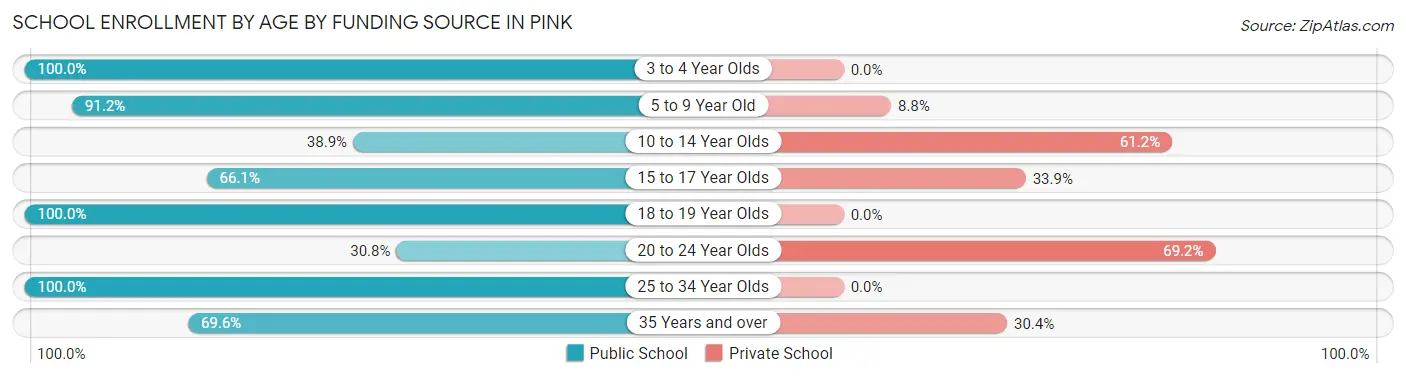
| Age Bracket | Public School | Private School |
| 3 to 4 Year Olds | 10 (100.0%) | 0 (0.0%) |
| 5 to 9 Year Old | 93 (91.2%) | 9 (8.8%) |
| 10 to 14 Year Olds | 54 (38.9%) | 85 (61.2%) |
| 15 to 17 Year Olds | 76 (66.1%) | 39 (33.9%) |
| 18 to 19 Year Olds | 52 (100.0%) | 0 (0.0%) |
| 20 to 24 Year Olds | 8 (30.8%) | 18 (69.2%) |
| 25 to 34 Year Olds | 8 (100.0%) | 0 (0.0%) |
| 35 Years and over | 16 (69.6%) | 7 (30.4%) |
| Total | 317 (66.7%) | 158 (33.3%) |
Educational Attainment by Field of Study in Pink
Science & technology (33 | 15.9%), liberal arts & history (32 | 15.4%), arts & humanities (30 | 14.4%), social sciences (26 | 12.5%), and business (26 | 12.5%) are the most common fields of study among 208 individuals in Pink who have obtained a bachelor's degree or higher.
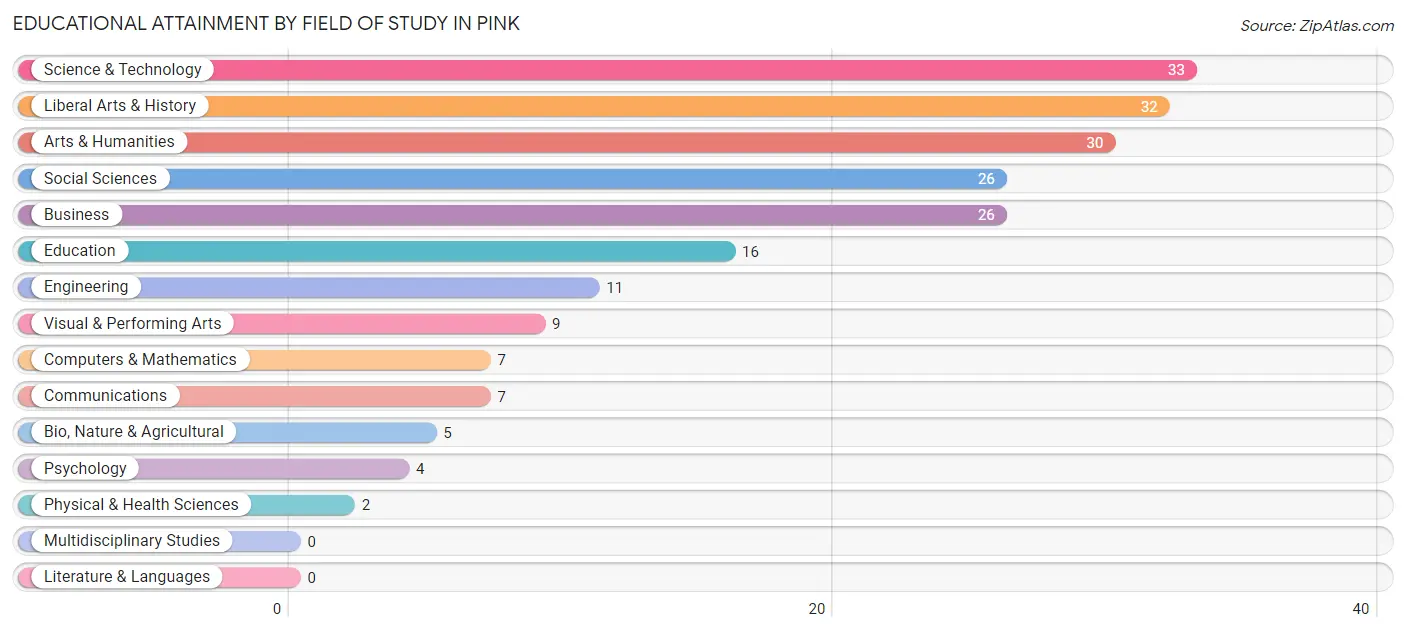
| Field of Study | # Graduates | % Graduates |
| Computers & Mathematics | 7 | 3.4% |
| Bio, Nature & Agricultural | 5 | 2.4% |
| Physical & Health Sciences | 2 | 1.0% |
| Psychology | 4 | 1.9% |
| Social Sciences | 26 | 12.5% |
| Engineering | 11 | 5.3% |
| Multidisciplinary Studies | 0 | 0.0% |
| Science & Technology | 33 | 15.9% |
| Business | 26 | 12.5% |
| Education | 16 | 7.7% |
| Literature & Languages | 0 | 0.0% |
| Liberal Arts & History | 32 | 15.4% |
| Visual & Performing Arts | 9 | 4.3% |
| Communications | 7 | 3.4% |
| Arts & Humanities | 30 | 14.4% |
| Total | 208 | 100.0% |
Transportation & Commute in Pink
Vehicle Availability by Sex in Pink
The most prevalent vehicle ownership categories in Pink are males with 2 vehicles (257, accounting for 48.9%) and females with 2 vehicles (147, making up 88.6%).
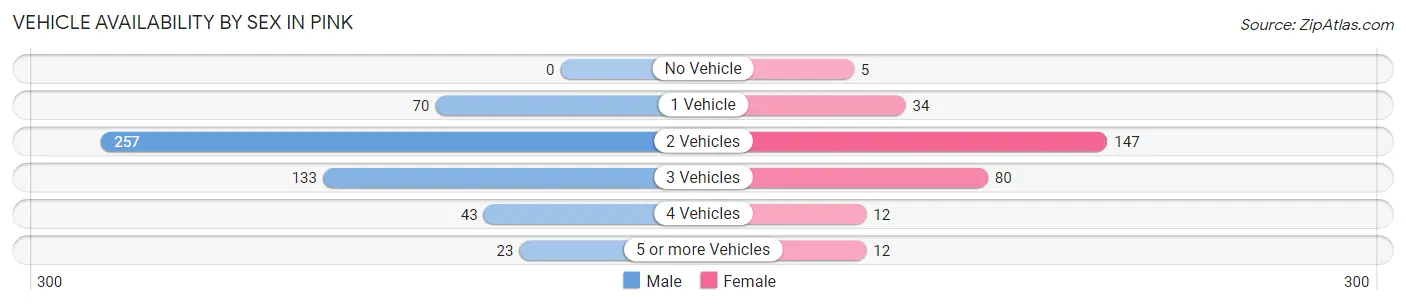
| Vehicles Available | Male | Female |
| No Vehicle | 0 (0.0%) | 5 (1.7%) |
| 1 Vehicle | 70 (13.3%) | 34 (11.7%) |
| 2 Vehicles | 257 (48.9%) | 147 (50.7%) |
| 3 Vehicles | 133 (25.3%) | 80 (27.6%) |
| 4 Vehicles | 43 (8.2%) | 12 (4.1%) |
| 5 or more Vehicles | 23 (4.4%) | 12 (4.1%) |
| Total | 526 (100.0%) | 290 (100.0%) |
Commute Time in Pink
The most frequently occuring commute durations in Pink are 45 to 59 minutes (152 commuters, 19.8%), 30 to 34 minutes (142 commuters, 18.5%), and 15 to 19 minutes (97 commuters, 12.7%).
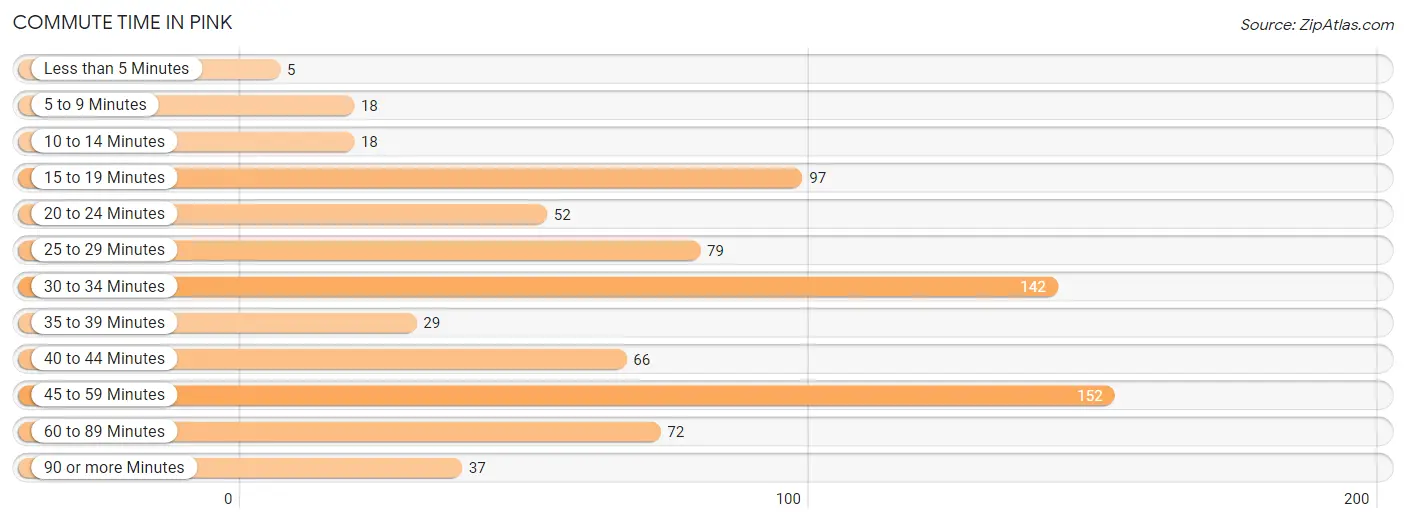
| Commute Time | # Commuters | % Commuters |
| Less than 5 Minutes | 5 | 0.6% |
| 5 to 9 Minutes | 18 | 2.4% |
| 10 to 14 Minutes | 18 | 2.4% |
| 15 to 19 Minutes | 97 | 12.7% |
| 20 to 24 Minutes | 52 | 6.8% |
| 25 to 29 Minutes | 79 | 10.3% |
| 30 to 34 Minutes | 142 | 18.5% |
| 35 to 39 Minutes | 29 | 3.8% |
| 40 to 44 Minutes | 66 | 8.6% |
| 45 to 59 Minutes | 152 | 19.8% |
| 60 to 89 Minutes | 72 | 9.4% |
| 90 or more Minutes | 37 | 4.8% |
Commute Time by Sex in Pink
The most common commute times in Pink are 45 to 59 minutes (107 commuters, 21.7%) for males and 30 to 34 minutes (53 commuters, 19.4%) for females.
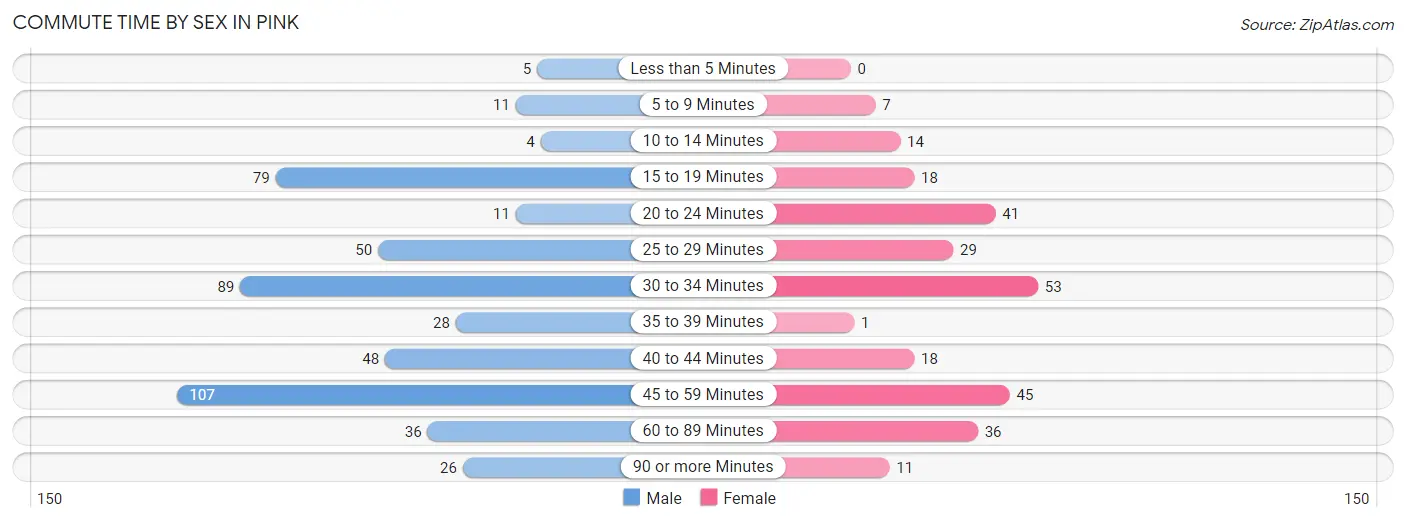
| Commute Time | Male | Female |
| Less than 5 Minutes | 5 (1.0%) | 0 (0.0%) |
| 5 to 9 Minutes | 11 (2.2%) | 7 (2.6%) |
| 10 to 14 Minutes | 4 (0.8%) | 14 (5.1%) |
| 15 to 19 Minutes | 79 (16.0%) | 18 (6.6%) |
| 20 to 24 Minutes | 11 (2.2%) | 41 (15.0%) |
| 25 to 29 Minutes | 50 (10.1%) | 29 (10.6%) |
| 30 to 34 Minutes | 89 (18.0%) | 53 (19.4%) |
| 35 to 39 Minutes | 28 (5.7%) | 1 (0.4%) |
| 40 to 44 Minutes | 48 (9.7%) | 18 (6.6%) |
| 45 to 59 Minutes | 107 (21.7%) | 45 (16.5%) |
| 60 to 89 Minutes | 36 (7.3%) | 36 (13.2%) |
| 90 or more Minutes | 26 (5.3%) | 11 (4.0%) |
Time of Departure to Work by Sex in Pink
The most frequent times of departure to work in Pink are 7:30 AM to 7:59 AM (138, 27.9%) for males and 6:30 AM to 6:59 AM (57, 20.9%) for females.
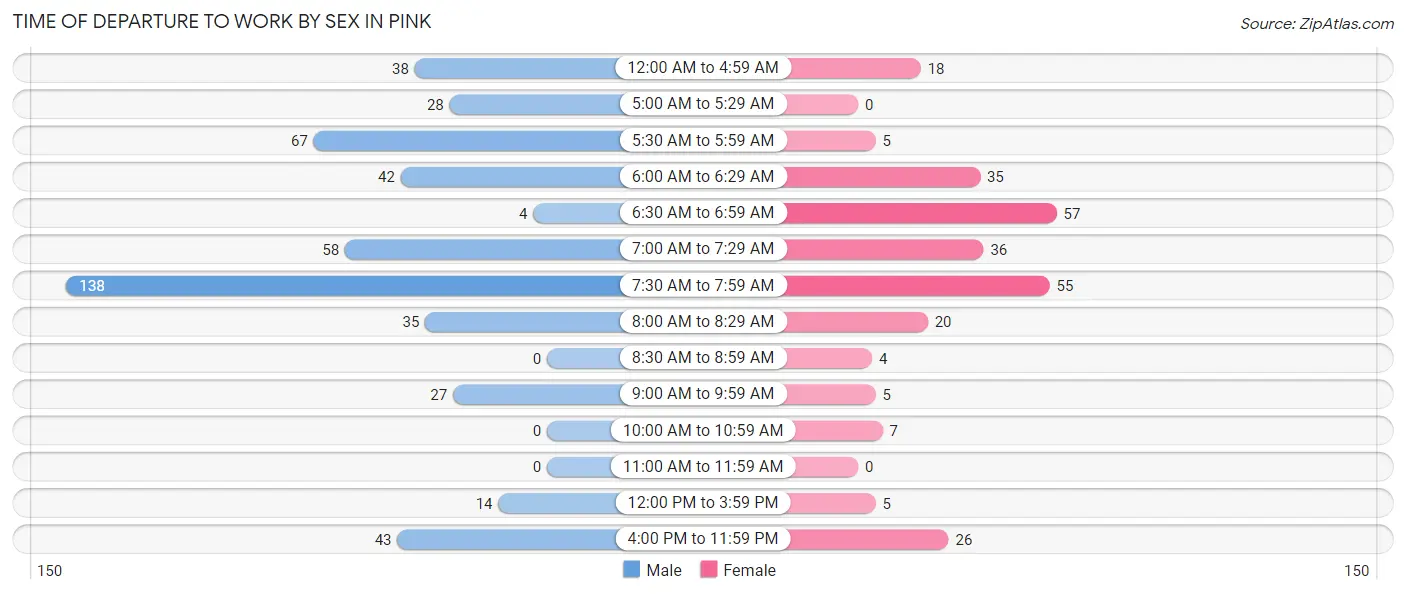
| Time of Departure | Male | Female |
| 12:00 AM to 4:59 AM | 38 (7.7%) | 18 (6.6%) |
| 5:00 AM to 5:29 AM | 28 (5.7%) | 0 (0.0%) |
| 5:30 AM to 5:59 AM | 67 (13.6%) | 5 (1.8%) |
| 6:00 AM to 6:29 AM | 42 (8.5%) | 35 (12.8%) |
| 6:30 AM to 6:59 AM | 4 (0.8%) | 57 (20.9%) |
| 7:00 AM to 7:29 AM | 58 (11.7%) | 36 (13.2%) |
| 7:30 AM to 7:59 AM | 138 (27.9%) | 55 (20.2%) |
| 8:00 AM to 8:29 AM | 35 (7.1%) | 20 (7.3%) |
| 8:30 AM to 8:59 AM | 0 (0.0%) | 4 (1.5%) |
| 9:00 AM to 9:59 AM | 27 (5.5%) | 5 (1.8%) |
| 10:00 AM to 10:59 AM | 0 (0.0%) | 7 (2.6%) |
| 11:00 AM to 11:59 AM | 0 (0.0%) | 0 (0.0%) |
| 12:00 PM to 3:59 PM | 14 (2.8%) | 5 (1.8%) |
| 4:00 PM to 11:59 PM | 43 (8.7%) | 26 (9.5%) |
| Total | 494 (100.0%) | 273 (100.0%) |
Housing Occupancy in Pink
Occupancy by Ownership in Pink
Of the total 732 dwellings in Pink, owner-occupied units account for 676 (92.3%), while renter-occupied units make up 56 (7.6%).
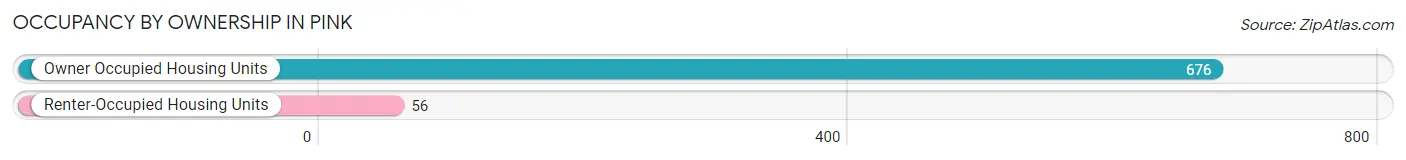
| Occupancy | # Housing Units | % Housing Units |
| Owner Occupied Housing Units | 676 | 92.3% |
| Renter-Occupied Housing Units | 56 | 7.6% |
| Total Occupied Housing Units | 732 | 100.0% |
Occupancy by Household Size in Pink
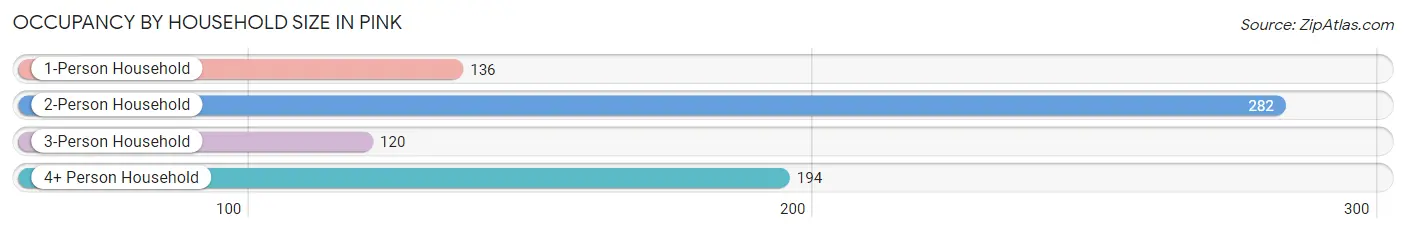
| Household Size | # Housing Units | % Housing Units |
| 1-Person Household | 136 | 18.6% |
| 2-Person Household | 282 | 38.5% |
| 3-Person Household | 120 | 16.4% |
| 4+ Person Household | 194 | 26.5% |
| Total Housing Units | 732 | 100.0% |
Occupancy by Ownership by Household Size in Pink
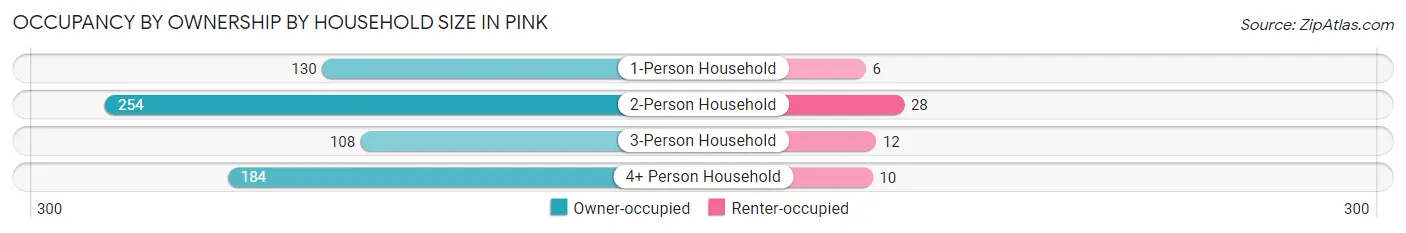
| Household Size | Owner-occupied | Renter-occupied |
| 1-Person Household | 130 (95.6%) | 6 (4.4%) |
| 2-Person Household | 254 (90.1%) | 28 (9.9%) |
| 3-Person Household | 108 (90.0%) | 12 (10.0%) |
| 4+ Person Household | 184 (94.9%) | 10 (5.1%) |
| Total Housing Units | 676 (92.3%) | 56 (7.6%) |
Occupancy by Educational Attainment in Pink
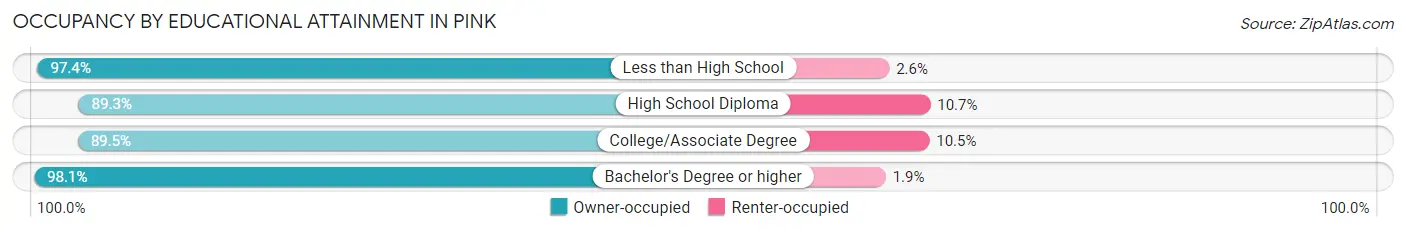
| Household Size | Owner-occupied | Renter-occupied |
| Less than High School | 151 (97.4%) | 4 (2.6%) |
| High School Diploma | 183 (89.3%) | 22 (10.7%) |
| College/Associate Degree | 238 (89.5%) | 28 (10.5%) |
| Bachelor's Degree or higher | 104 (98.1%) | 2 (1.9%) |
Occupancy by Age of Householder in Pink
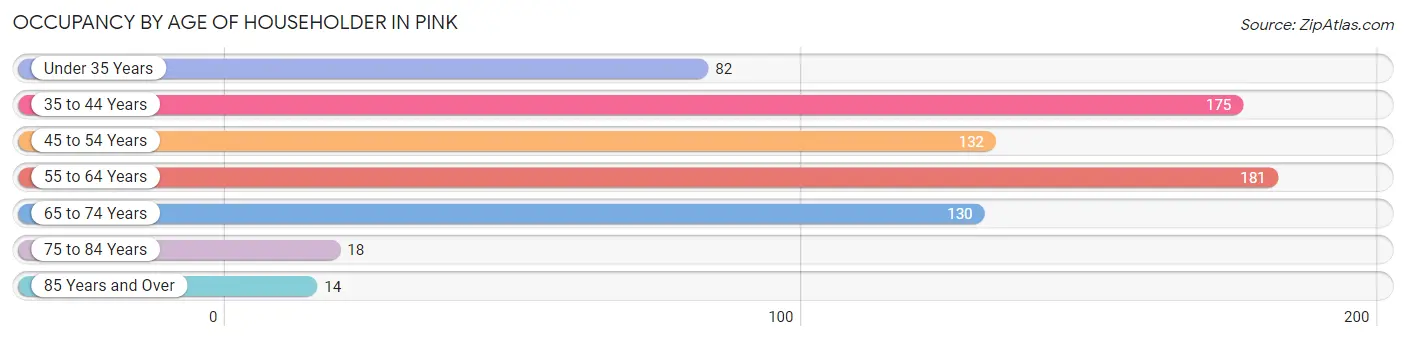
| Age Bracket | # Households | % Households |
| Under 35 Years | 82 | 11.2% |
| 35 to 44 Years | 175 | 23.9% |
| 45 to 54 Years | 132 | 18.0% |
| 55 to 64 Years | 181 | 24.7% |
| 65 to 74 Years | 130 | 17.8% |
| 75 to 84 Years | 18 | 2.5% |
| 85 Years and Over | 14 | 1.9% |
| Total | 732 | 100.0% |
Housing Finances in Pink
Median Income by Occupancy in Pink
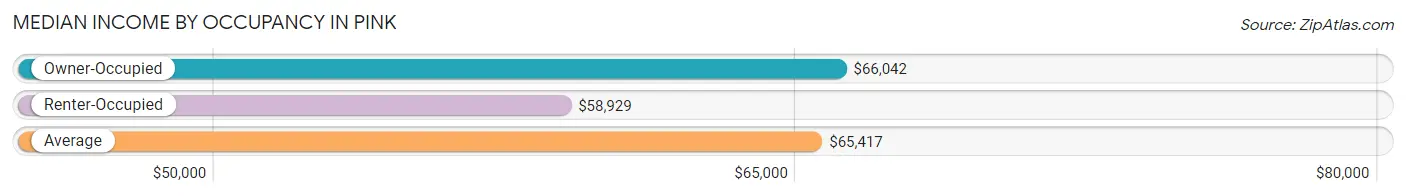
| Occupancy Type | # Households | Median Income |
| Owner-Occupied | 676 (92.3%) | $66,042 |
| Renter-Occupied | 56 (7.6%) | $58,929 |
| Average | 732 (100.0%) | $65,417 |
Occupancy by Householder Income Bracket in Pink
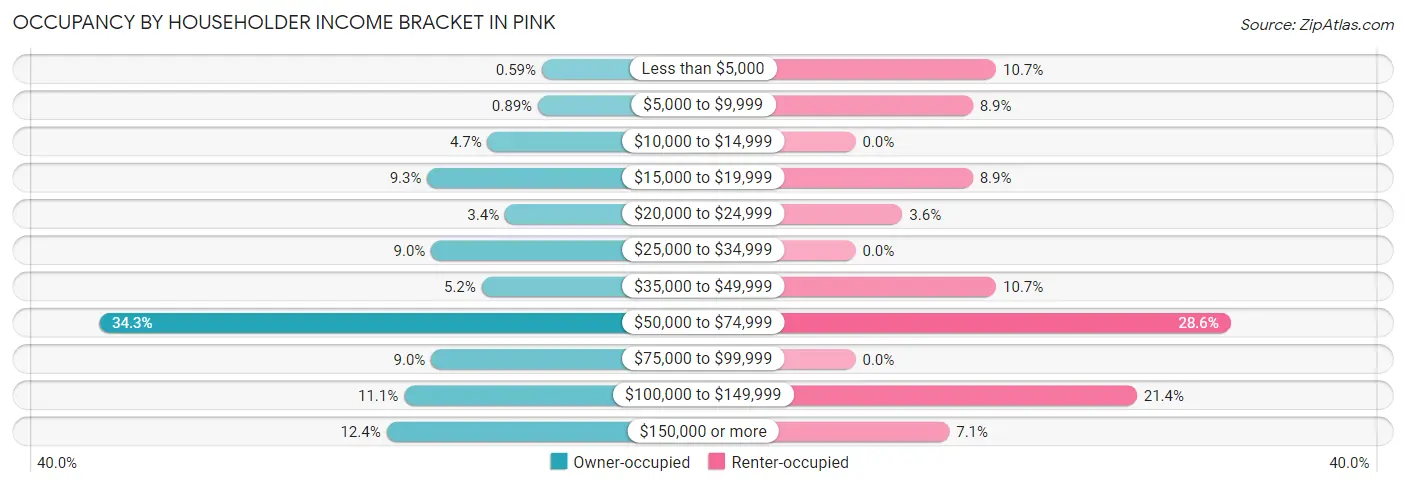
| Income Bracket | Owner-occupied | Renter-occupied |
| Less than $5,000 | 4 (0.6%) | 6 (10.7%) |
| $5,000 to $9,999 | 6 (0.9%) | 5 (8.9%) |
| $10,000 to $14,999 | 32 (4.7%) | 0 (0.0%) |
| $15,000 to $19,999 | 63 (9.3%) | 5 (8.9%) |
| $20,000 to $24,999 | 23 (3.4%) | 2 (3.6%) |
| $25,000 to $34,999 | 61 (9.0%) | 0 (0.0%) |
| $35,000 to $49,999 | 35 (5.2%) | 6 (10.7%) |
| $50,000 to $74,999 | 232 (34.3%) | 16 (28.6%) |
| $75,000 to $99,999 | 61 (9.0%) | 0 (0.0%) |
| $100,000 to $149,999 | 75 (11.1%) | 12 (21.4%) |
| $150,000 or more | 84 (12.4%) | 4 (7.1%) |
| Total | 676 (100.0%) | 56 (100.0%) |
Monthly Housing Cost Tiers in Pink
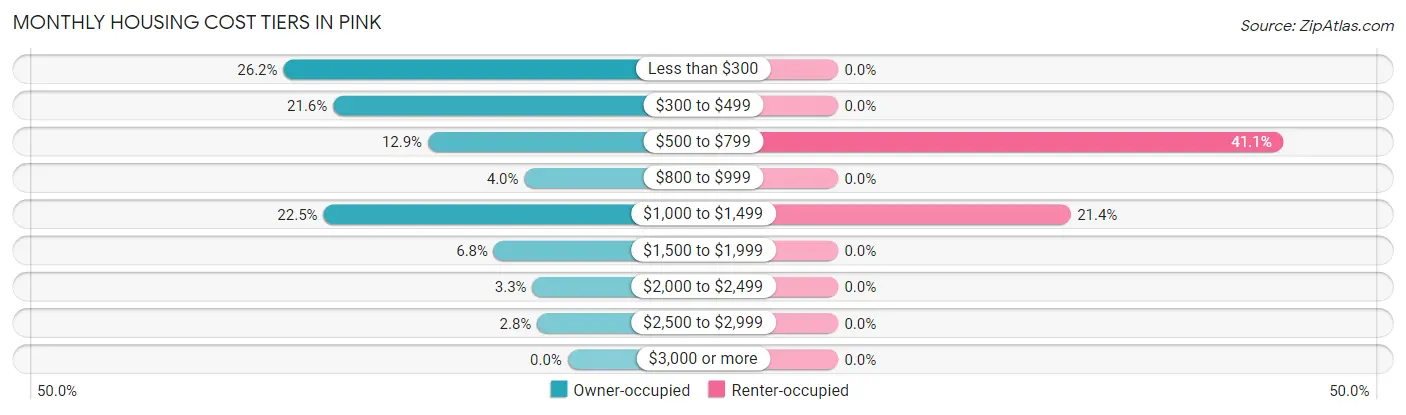
| Monthly Cost | Owner-occupied | Renter-occupied |
| Less than $300 | 177 (26.2%) | 0 (0.0%) |
| $300 to $499 | 146 (21.6%) | 0 (0.0%) |
| $500 to $799 | 87 (12.9%) | 23 (41.1%) |
| $800 to $999 | 27 (4.0%) | 0 (0.0%) |
| $1,000 to $1,499 | 152 (22.5%) | 12 (21.4%) |
| $1,500 to $1,999 | 46 (6.8%) | 0 (0.0%) |
| $2,000 to $2,499 | 22 (3.3%) | 0 (0.0%) |
| $2,500 to $2,999 | 19 (2.8%) | 0 (0.0%) |
| $3,000 or more | 0 (0.0%) | 0 (0.0%) |
| Total | 676 (100.0%) | 56 (100.0%) |
Physical Housing Characteristics in Pink
Housing Structures in Pink
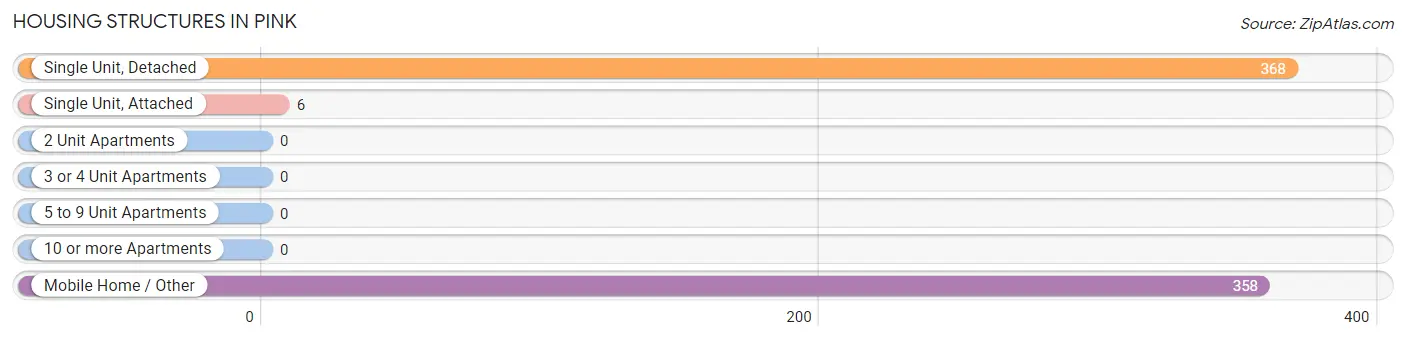
| Structure Type | # Housing Units | % Housing Units |
| Single Unit, Detached | 368 | 50.3% |
| Single Unit, Attached | 6 | 0.8% |
| 2 Unit Apartments | 0 | 0.0% |
| 3 or 4 Unit Apartments | 0 | 0.0% |
| 5 to 9 Unit Apartments | 0 | 0.0% |
| 10 or more Apartments | 0 | 0.0% |
| Mobile Home / Other | 358 | 48.9% |
| Total | 732 | 100.0% |
Housing Structures by Occupancy in Pink
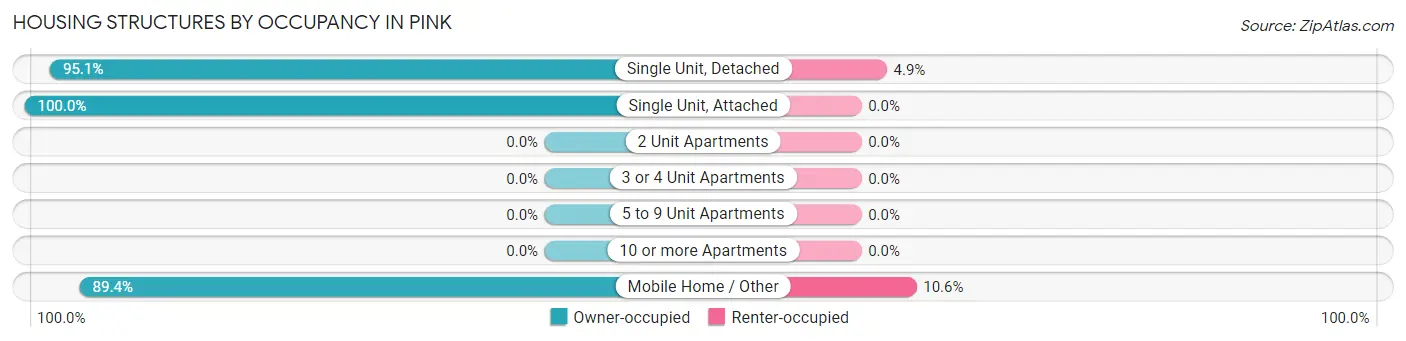
| Structure Type | Owner-occupied | Renter-occupied |
| Single Unit, Detached | 350 (95.1%) | 18 (4.9%) |
| Single Unit, Attached | 6 (100.0%) | 0 (0.0%) |
| 2 Unit Apartments | 0 (0.0%) | 0 (0.0%) |
| 3 or 4 Unit Apartments | 0 (0.0%) | 0 (0.0%) |
| 5 to 9 Unit Apartments | 0 (0.0%) | 0 (0.0%) |
| 10 or more Apartments | 0 (0.0%) | 0 (0.0%) |
| Mobile Home / Other | 320 (89.4%) | 38 (10.6%) |
| Total | 676 (92.3%) | 56 (7.6%) |
Housing Structures by Number of Rooms in Pink
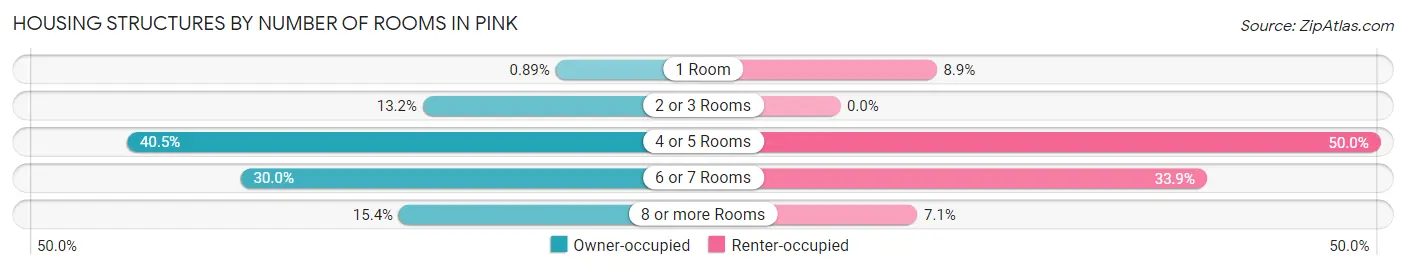
| Number of Rooms | Owner-occupied | Renter-occupied |
| 1 Room | 6 (0.9%) | 5 (8.9%) |
| 2 or 3 Rooms | 89 (13.2%) | 0 (0.0%) |
| 4 or 5 Rooms | 274 (40.5%) | 28 (50.0%) |
| 6 or 7 Rooms | 203 (30.0%) | 19 (33.9%) |
| 8 or more Rooms | 104 (15.4%) | 4 (7.1%) |
| Total | 676 (100.0%) | 56 (100.0%) |
Housing Structure by Heating Type in Pink
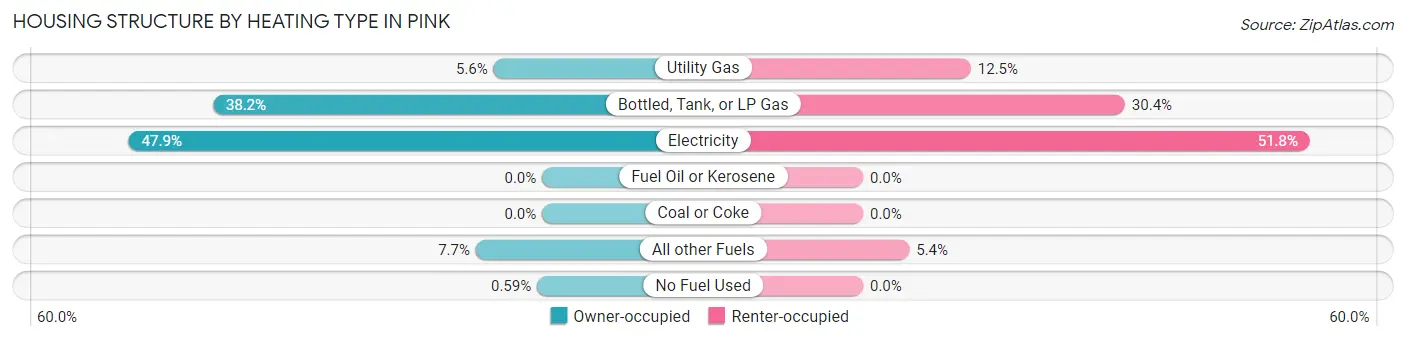
| Heating Type | Owner-occupied | Renter-occupied |
| Utility Gas | 38 (5.6%) | 7 (12.5%) |
| Bottled, Tank, or LP Gas | 258 (38.2%) | 17 (30.4%) |
| Electricity | 324 (47.9%) | 29 (51.8%) |
| Fuel Oil or Kerosene | 0 (0.0%) | 0 (0.0%) |
| Coal or Coke | 0 (0.0%) | 0 (0.0%) |
| All other Fuels | 52 (7.7%) | 3 (5.4%) |
| No Fuel Used | 4 (0.6%) | 0 (0.0%) |
| Total | 676 (100.0%) | 56 (100.0%) |
Household Vehicle Usage in Pink
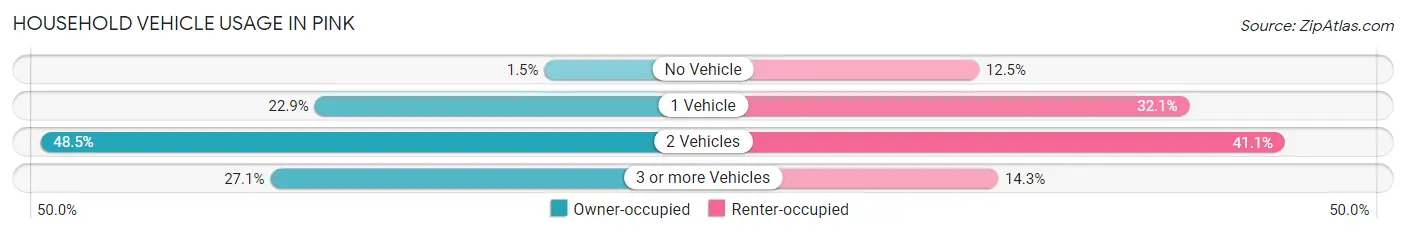
| Vehicles per Household | Owner-occupied | Renter-occupied |
| No Vehicle | 10 (1.5%) | 7 (12.5%) |
| 1 Vehicle | 155 (22.9%) | 18 (32.1%) |
| 2 Vehicles | 328 (48.5%) | 23 (41.1%) |
| 3 or more Vehicles | 183 (27.1%) | 8 (14.3%) |
| Total | 676 (100.0%) | 56 (100.0%) |
Real Estate & Mortgages in Pink
Real Estate and Mortgage Overview in Pink
| Characteristic | Without Mortgage | With Mortgage |
| Housing Units | 343 | 333 |
| Median Property Value | $104,000 | $139,300 |
| Median Household Income | $51,705 | $44 |
| Monthly Housing Costs | $296 | $0 |
| Real Estate Taxes | $483 | $6 |
Property Value by Mortgage Status in Pink
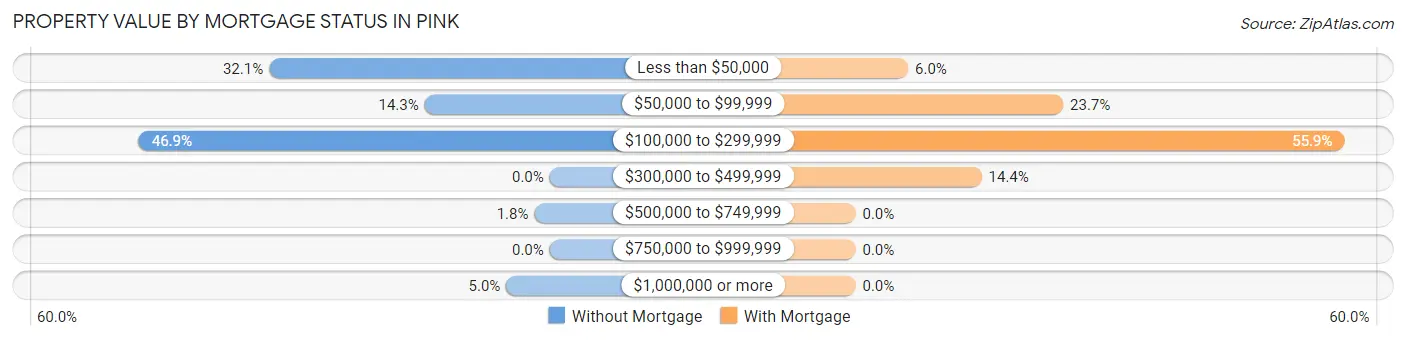
| Property Value | Without Mortgage | With Mortgage |
| Less than $50,000 | 110 (32.1%) | 20 (6.0%) |
| $50,000 to $99,999 | 49 (14.3%) | 79 (23.7%) |
| $100,000 to $299,999 | 161 (46.9%) | 186 (55.9%) |
| $300,000 to $499,999 | 0 (0.0%) | 48 (14.4%) |
| $500,000 to $749,999 | 6 (1.8%) | 0 (0.0%) |
| $750,000 to $999,999 | 0 (0.0%) | 0 (0.0%) |
| $1,000,000 or more | 17 (5.0%) | 0 (0.0%) |
| Total | 343 (100.0%) | 333 (100.0%) |
Household Income by Mortgage Status in Pink
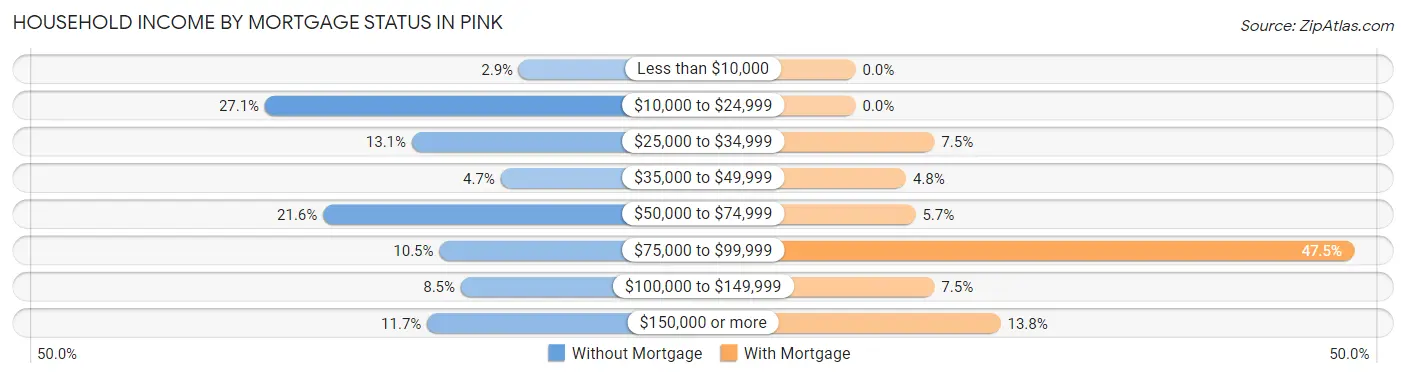
| Household Income | Without Mortgage | With Mortgage |
| Less than $10,000 | 10 (2.9%) | 0 (0.0%) |
| $10,000 to $24,999 | 93 (27.1%) | 0 (0.0%) |
| $25,000 to $34,999 | 45 (13.1%) | 25 (7.5%) |
| $35,000 to $49,999 | 16 (4.7%) | 16 (4.8%) |
| $50,000 to $74,999 | 74 (21.6%) | 19 (5.7%) |
| $75,000 to $99,999 | 36 (10.5%) | 158 (47.4%) |
| $100,000 to $149,999 | 29 (8.5%) | 25 (7.5%) |
| $150,000 or more | 40 (11.7%) | 46 (13.8%) |
| Total | 343 (100.0%) | 333 (100.0%) |
Property Value to Household Income Ratio in Pink
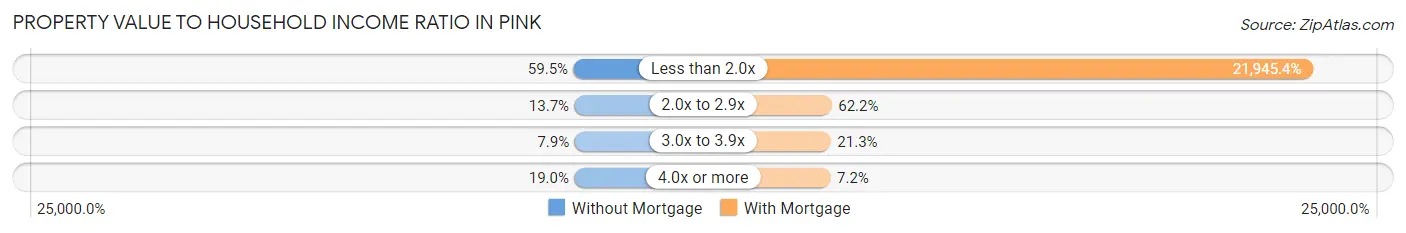
| Value-to-Income Ratio | Without Mortgage | With Mortgage |
| Less than 2.0x | 204 (59.5%) | 73,078 (21,945.3%) |
| 2.0x to 2.9x | 47 (13.7%) | 207 (62.2%) |
| 3.0x to 3.9x | 27 (7.9%) | 71 (21.3%) |
| 4.0x or more | 65 (19.0%) | 24 (7.2%) |
| Total | 343 (100.0%) | 333 (100.0%) |
Real Estate Taxes by Mortgage Status in Pink
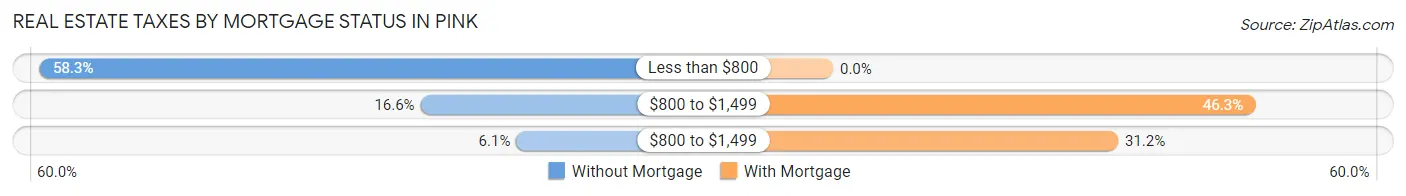
| Property Taxes | Without Mortgage | With Mortgage |
| Less than $800 | 200 (58.3%) | 0 (0.0%) |
| $800 to $1,499 | 57 (16.6%) | 154 (46.3%) |
| $800 to $1,499 | 21 (6.1%) | 104 (31.2%) |
| Total | 343 (100.0%) | 333 (100.0%) |
Health & Disability in Pink
Health Insurance Coverage by Age in Pink
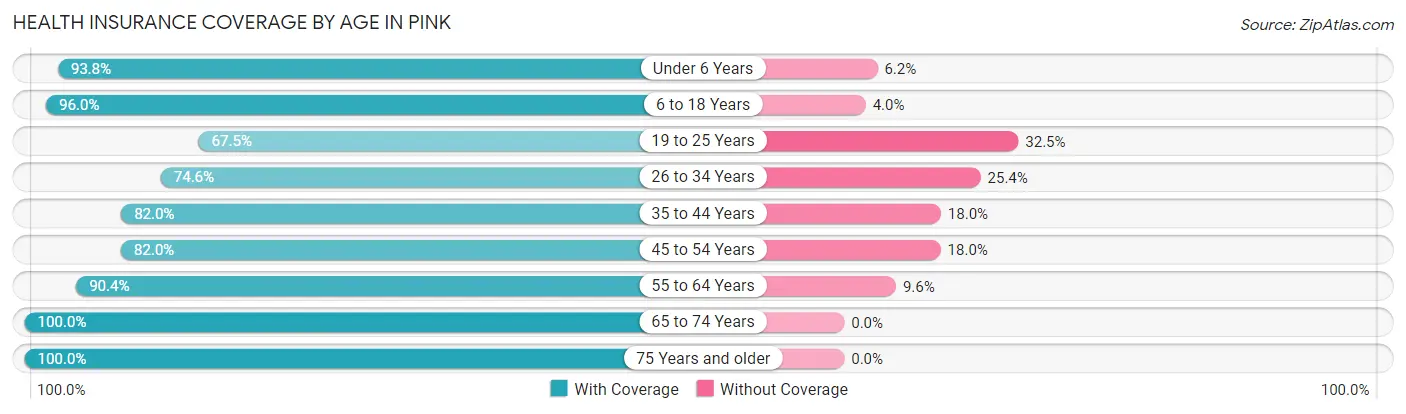
| Age Bracket | With Coverage | Without Coverage |
| Under 6 Years | 91 (93.8%) | 6 (6.2%) |
| 6 to 18 Years | 384 (96.0%) | 16 (4.0%) |
| 19 to 25 Years | 129 (67.5%) | 62 (32.5%) |
| 26 to 34 Years | 132 (74.6%) | 45 (25.4%) |
| 35 to 44 Years | 282 (82.0%) | 62 (18.0%) |
| 45 to 54 Years | 210 (82.0%) | 46 (18.0%) |
| 55 to 64 Years | 272 (90.4%) | 29 (9.6%) |
| 65 to 74 Years | 252 (100.0%) | 0 (0.0%) |
| 75 Years and older | 97 (100.0%) | 0 (0.0%) |
| Total | 1,849 (87.4%) | 266 (12.6%) |
Health Insurance Coverage by Citizenship Status in Pink
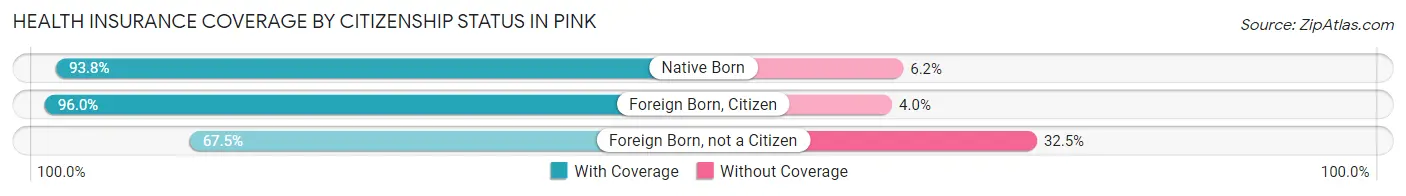
| Citizenship Status | With Coverage | Without Coverage |
| Native Born | 91 (93.8%) | 6 (6.2%) |
| Foreign Born, Citizen | 384 (96.0%) | 16 (4.0%) |
| Foreign Born, not a Citizen | 129 (67.5%) | 62 (32.5%) |
Health Insurance Coverage by Household Income in Pink
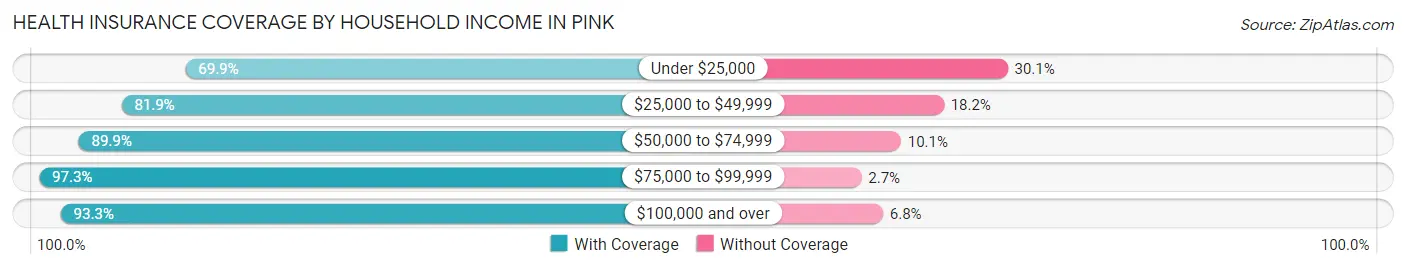
| Household Income | With Coverage | Without Coverage |
| Under $25,000 | 239 (69.9%) | 103 (30.1%) |
| $25,000 to $49,999 | 212 (81.9%) | 47 (18.1%) |
| $50,000 to $74,999 | 604 (89.9%) | 68 (10.1%) |
| $75,000 to $99,999 | 214 (97.3%) | 6 (2.7%) |
| $100,000 and over | 580 (93.2%) | 42 (6.8%) |
Public vs Private Health Insurance Coverage by Age in Pink
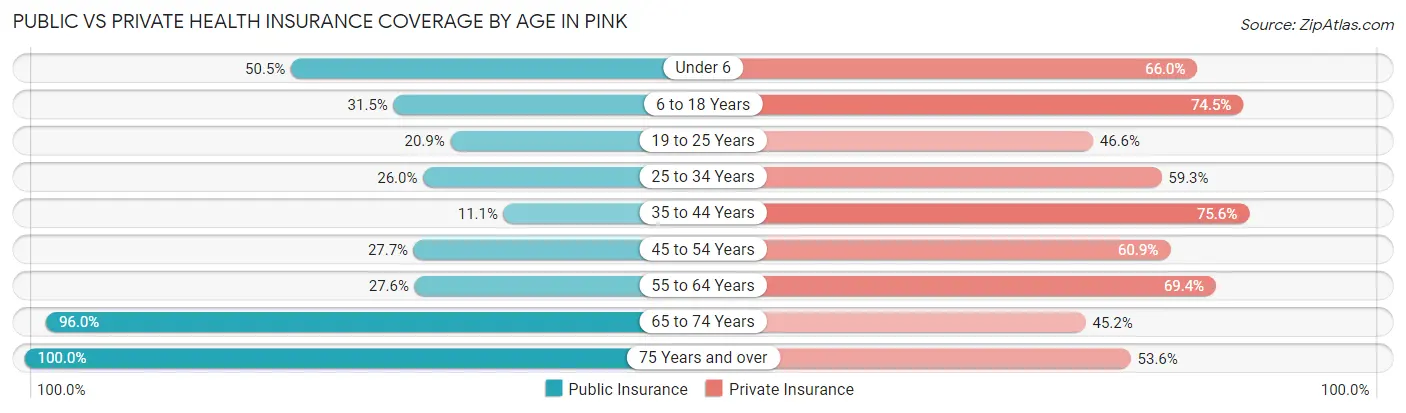
| Age Bracket | Public Insurance | Private Insurance |
| Under 6 | 49 (50.5%) | 64 (66.0%) |
| 6 to 18 Years | 126 (31.5%) | 298 (74.5%) |
| 19 to 25 Years | 40 (20.9%) | 89 (46.6%) |
| 25 to 34 Years | 46 (26.0%) | 105 (59.3%) |
| 35 to 44 Years | 38 (11.1%) | 260 (75.6%) |
| 45 to 54 Years | 71 (27.7%) | 156 (60.9%) |
| 55 to 64 Years | 83 (27.6%) | 209 (69.4%) |
| 65 to 74 Years | 242 (96.0%) | 114 (45.2%) |
| 75 Years and over | 97 (100.0%) | 52 (53.6%) |
| Total | 792 (37.4%) | 1,347 (63.7%) |
Disability Status by Sex by Age in Pink
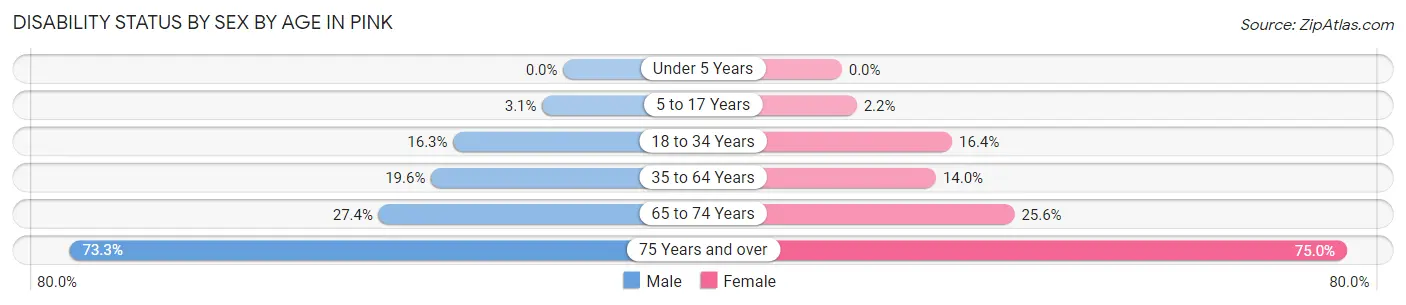
| Age Bracket | Male | Female |
| Under 5 Years | 0 (0.0%) | 0 (0.0%) |
| 5 to 17 Years | 6 (3.1%) | 4 (2.2%) |
| 18 to 34 Years | 40 (16.3%) | 29 (16.4%) |
| 35 to 64 Years | 94 (19.6%) | 59 (14.0%) |
| 65 to 74 Years | 37 (27.4%) | 30 (25.6%) |
| 75 Years and over | 33 (73.3%) | 39 (75.0%) |
Disability Class by Sex by Age in Pink
Disability Class: Hearing Difficulty
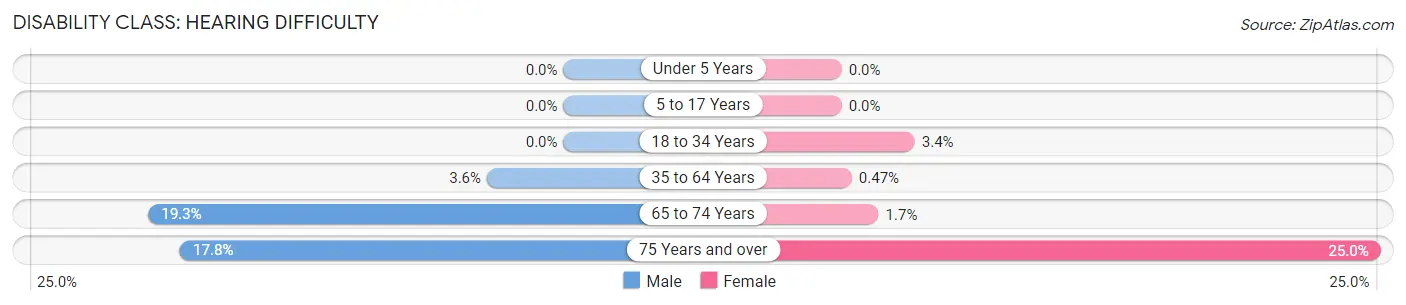
| Age Bracket | Male | Female |
| Under 5 Years | 0 (0.0%) | 0 (0.0%) |
| 5 to 17 Years | 0 (0.0%) | 0 (0.0%) |
| 18 to 34 Years | 0 (0.0%) | 6 (3.4%) |
| 35 to 64 Years | 17 (3.5%) | 2 (0.5%) |
| 65 to 74 Years | 26 (19.3%) | 2 (1.7%) |
| 75 Years and over | 8 (17.8%) | 13 (25.0%) |
Disability Class: Vision Difficulty
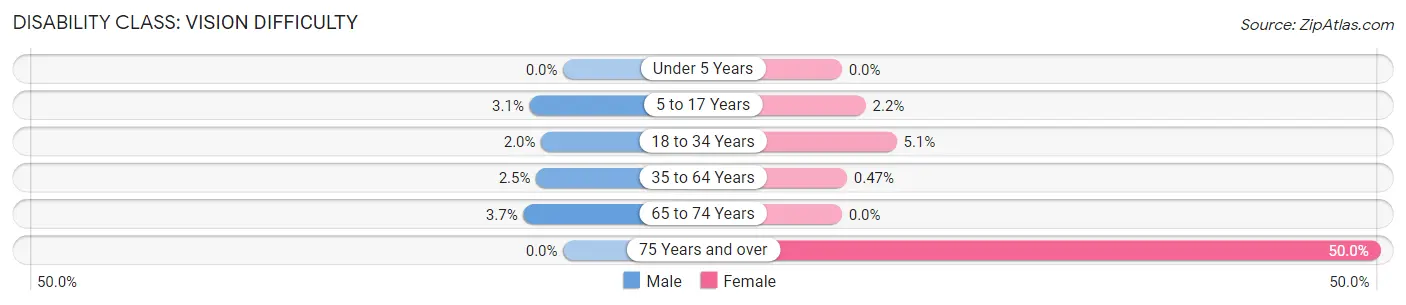
| Age Bracket | Male | Female |
| Under 5 Years | 0 (0.0%) | 0 (0.0%) |
| 5 to 17 Years | 6 (3.1%) | 4 (2.2%) |
| 18 to 34 Years | 5 (2.0%) | 9 (5.1%) |
| 35 to 64 Years | 12 (2.5%) | 2 (0.5%) |
| 65 to 74 Years | 5 (3.7%) | 0 (0.0%) |
| 75 Years and over | 0 (0.0%) | 26 (50.0%) |
Disability Class: Cognitive Difficulty
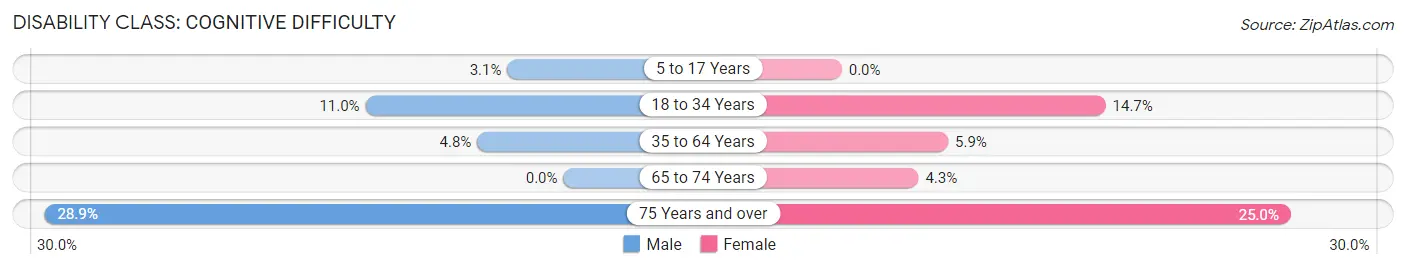
| Age Bracket | Male | Female |
| 5 to 17 Years | 6 (3.1%) | 0 (0.0%) |
| 18 to 34 Years | 27 (11.0%) | 26 (14.7%) |
| 35 to 64 Years | 23 (4.8%) | 25 (5.9%) |
| 65 to 74 Years | 0 (0.0%) | 5 (4.3%) |
| 75 Years and over | 13 (28.9%) | 13 (25.0%) |
Disability Class: Ambulatory Difficulty
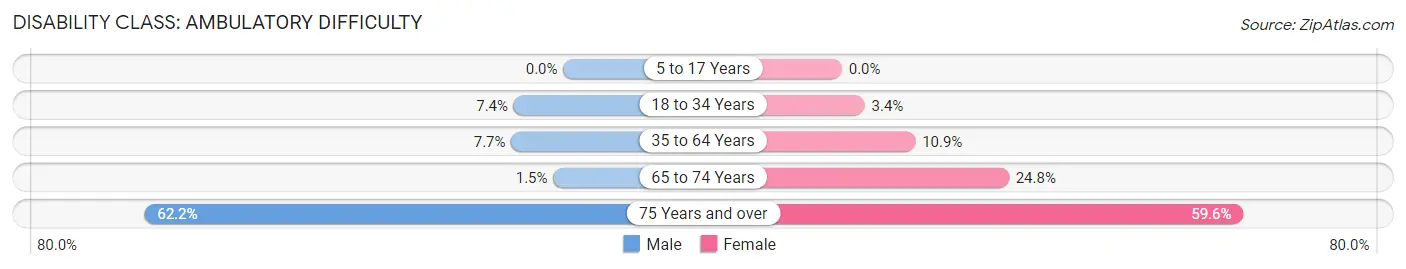
| Age Bracket | Male | Female |
| 5 to 17 Years | 0 (0.0%) | 0 (0.0%) |
| 18 to 34 Years | 18 (7.3%) | 6 (3.4%) |
| 35 to 64 Years | 37 (7.7%) | 46 (10.9%) |
| 65 to 74 Years | 2 (1.5%) | 29 (24.8%) |
| 75 Years and over | 28 (62.2%) | 31 (59.6%) |
Disability Class: Self-Care Difficulty
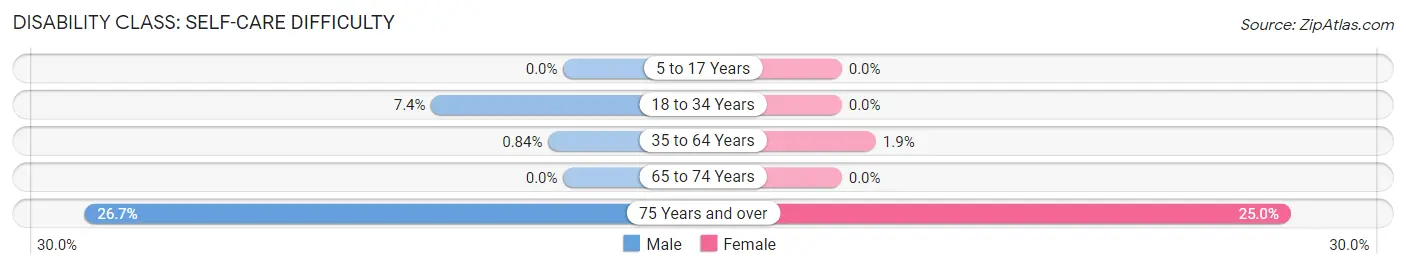
| Age Bracket | Male | Female |
| 5 to 17 Years | 0 (0.0%) | 0 (0.0%) |
| 18 to 34 Years | 18 (7.3%) | 0 (0.0%) |
| 35 to 64 Years | 4 (0.8%) | 8 (1.9%) |
| 65 to 74 Years | 0 (0.0%) | 0 (0.0%) |
| 75 Years and over | 12 (26.7%) | 13 (25.0%) |
Technology Access in Pink
Computing Device Access in Pink
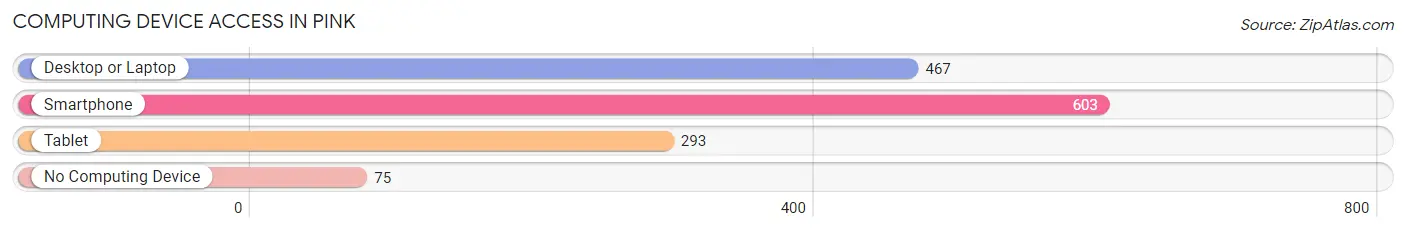
| Device Type | # Households | % Households |
| Desktop or Laptop | 467 | 63.8% |
| Smartphone | 603 | 82.4% |
| Tablet | 293 | 40.0% |
| No Computing Device | 75 | 10.2% |
| Total | 732 | 100.0% |
Internet Access in Pink
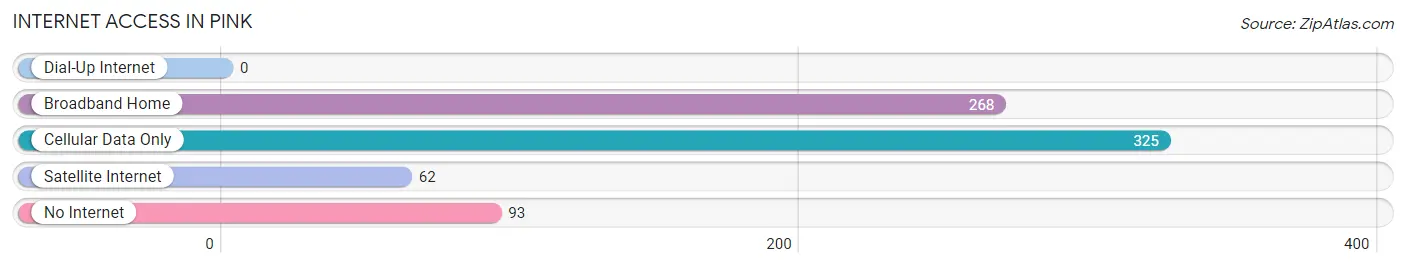
| Internet Type | # Households | % Households |
| Dial-Up Internet | 0 | 0.0% |
| Broadband Home | 268 | 36.6% |
| Cellular Data Only | 325 | 44.4% |
| Satellite Internet | 62 | 8.5% |
| No Internet | 93 | 12.7% |
| Total | 732 | 100.0% |
Pink Summary
Oklahoma is a state located in the South Central region of the United States. It is bordered by Texas to the south, Arkansas to the east, Kansas to the north, and Colorado and New Mexico to the west. Oklahoma is the 20th most populous state in the United States, with an estimated population of 3.9 million in 2019. Oklahoma is known for its diverse geography, ranging from the Great Plains in the west to the Ozark Mountains in the east. It is also home to a variety of natural resources, including oil, natural gas, and coal.
History
The area that is now Oklahoma was originally inhabited by Native American tribes, including the Caddo, Comanche, Osage, and Quapaw. In the early 1800s, the area was part of the Louisiana Purchase, and was later organized as part of the Indian Territory. In 1889, the Oklahoma Territory was created, and in 1907, Oklahoma became the 46th state in the Union.
During the early 20th century, Oklahoma experienced a period of economic growth and development, fueled by the discovery of oil and natural gas. This period of growth was followed by the Great Depression, which had a devastating effect on the state’s economy. In the 1940s, Oklahoma experienced a period of economic recovery, and in the 1950s, the state experienced a period of population growth.
Geography
Oklahoma is located in the South Central region of the United States. It is bordered by Texas to the south, Arkansas to the east, Kansas to the north, and Colorado and New Mexico to the west. Oklahoma is the 20th largest state in the United States, with an area of 69,899 square miles.
Oklahoma is known for its diverse geography, ranging from the Great Plains in the west to the Ozark Mountains in the east. The state is also home to a variety of natural resources, including oil, natural gas, and coal.
Economy
Oklahoma’s economy is largely based on the production of oil and natural gas. The state is the third-largest producer of oil in the United States, and the fourth-largest producer of natural gas. Other major industries in the state include agriculture, manufacturing, and tourism.
In 2019, the gross domestic product (GDP) of Oklahoma was $193.3 billion, and the state’s unemployment rate was 3.7%. The median household income in the state was $50,051, and the poverty rate was 15.2%.
Demographics
As of 2019, the population of Oklahoma was estimated to be 3.9 million. The state is home to a variety of ethnic and racial groups, including White (68.3%), American Indian and Alaska Native (9.2%), Black or African American (7.7%), and Hispanic or Latino (9.2%).
The largest cities in Oklahoma are Oklahoma City (population 643,648), Tulsa (population 399,682), and Norman (population 122,180). The state’s capital is Oklahoma City.
Conclusion
Oklahoma is a state located in the South Central region of the United States. It is bordered by Texas to the south, Arkansas to the east, Kansas to the north, and Colorado and New Mexico to the west. Oklahoma is the 20th most populous state in the United States, with an estimated population of 3.9 million in 2019. The state is known for its diverse geography, ranging from the Great Plains in the west to the Ozark Mountains in the east. The state’s economy is largely based on the production of oil and natural gas, and other major industries include agriculture, manufacturing, and tourism. Oklahoma is home to a variety of ethnic and racial groups, and the largest cities in the state are Oklahoma City, Tulsa, and Norman.
Common Questions
What is Per Capita Income in Pink?
Per Capita income in Pink is $27,133.
What is the Median Family Income in Pink?
Median Family Income in Pink is $73,328.
What is the Median Household income in Pink?
Median Household Income in Pink is $65,417.
What is Income or Wage Gap in Pink?
Income or Wage Gap in Pink is 32.4%.
Women in Pink earn 67.6 cents for every dollar earned by a man.
What is Inequality or Gini Index in Pink?
Inequality or Gini Index in Pink is 0.38.
What is the Total Population of Pink?
Total Population of Pink is 2,119.
What is the Total Male Population of Pink?
Total Male Population of Pink is 1,126.
What is the Total Female Population of Pink?
Total Female Population of Pink is 993.
What is the Ratio of Males per 100 Females in Pink?
There are 113.39 Males per 100 Females in Pink.
What is the Ratio of Females per 100 Males in Pink?
There are 88.19 Females per 100 Males in Pink.
What is the Median Population Age in Pink?
Median Population Age in Pink is 38.3 Years.
What is the Average Family Size in Pink
Average Family Size in Pink is 3.3 People.
What is the Average Household Size in Pink
Average Household Size in Pink is 2.9 People.
How Large is the Labor Force in Pink?
There are 877 People in the Labor Forcein in Pink.
What is the Percentage of People in the Labor Force in Pink?
50.8% of People are in the Labor Force in Pink.
What is the Unemployment Rate in Pink?
Unemployment Rate in Pink is 5.7%.