Panama, OK Map & Demographics
Panama Map
Panama Overview
$20,431
PER CAPITA INCOME
$57,188
AVG FAMILY INCOME
$44,397
AVG HOUSEHOLD INCOME
46.2%
WAGE / INCOME GAP [ % ]
53.8¢/ $1
WAGE / INCOME GAP [ $ ]
0.38
INEQUALITY / GINI INDEX
1,278
TOTAL POPULATION
678
MALE POPULATION
600
FEMALE POPULATION
113.00
MALES / 100 FEMALES
88.50
FEMALES / 100 MALES
32.4
MEDIAN AGE
2.7
AVG FAMILY SIZE
2.4
AVG HOUSEHOLD SIZE
523
LABOR FORCE [ PEOPLE ]
56.5%
PERCENT IN LABOR FORCE
3.5%
UNEMPLOYMENT RATE
Panama Zip Codes
Panama Area Codes
Income in Panama
Income Overview in Panama
Per Capita Income in Panama is $20,431, while median incomes of families and households are $57,188 and $44,397 respectively.
| Characteristic | Number | Measure |
| Per Capita Income | 1,278 | $20,431 |
| Median Family Income | 387 | $57,188 |
| Mean Family Income | 387 | $56,875 |
| Median Household Income | 526 | $44,397 |
| Mean Household Income | 526 | $52,816 |
| Income Deficit | 387 | $0 |
| Wage / Income Gap (%) | 1,278 | 46.16% |
| Wage / Income Gap ($) | 1,278 | 53.84¢ per $1 |
| Gini / Inequality Index | 1,278 | 0.38 |
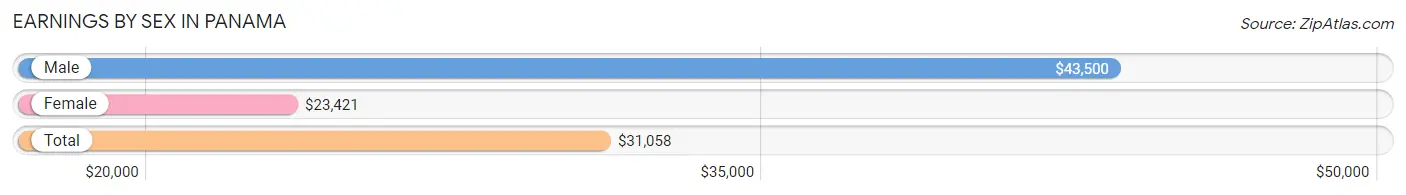
Earnings by Sex in Panama
Average Earnings in Panama are $31,058, $43,500 for men and $23,421 for women, a difference of 46.2%.
| Sex | Number | Average Earnings |
| Male | 320 (59.9%) | $43,500 |
| Female | 214 (40.1%) | $23,421 |
| Total | 534 (100.0%) | $31,058 |
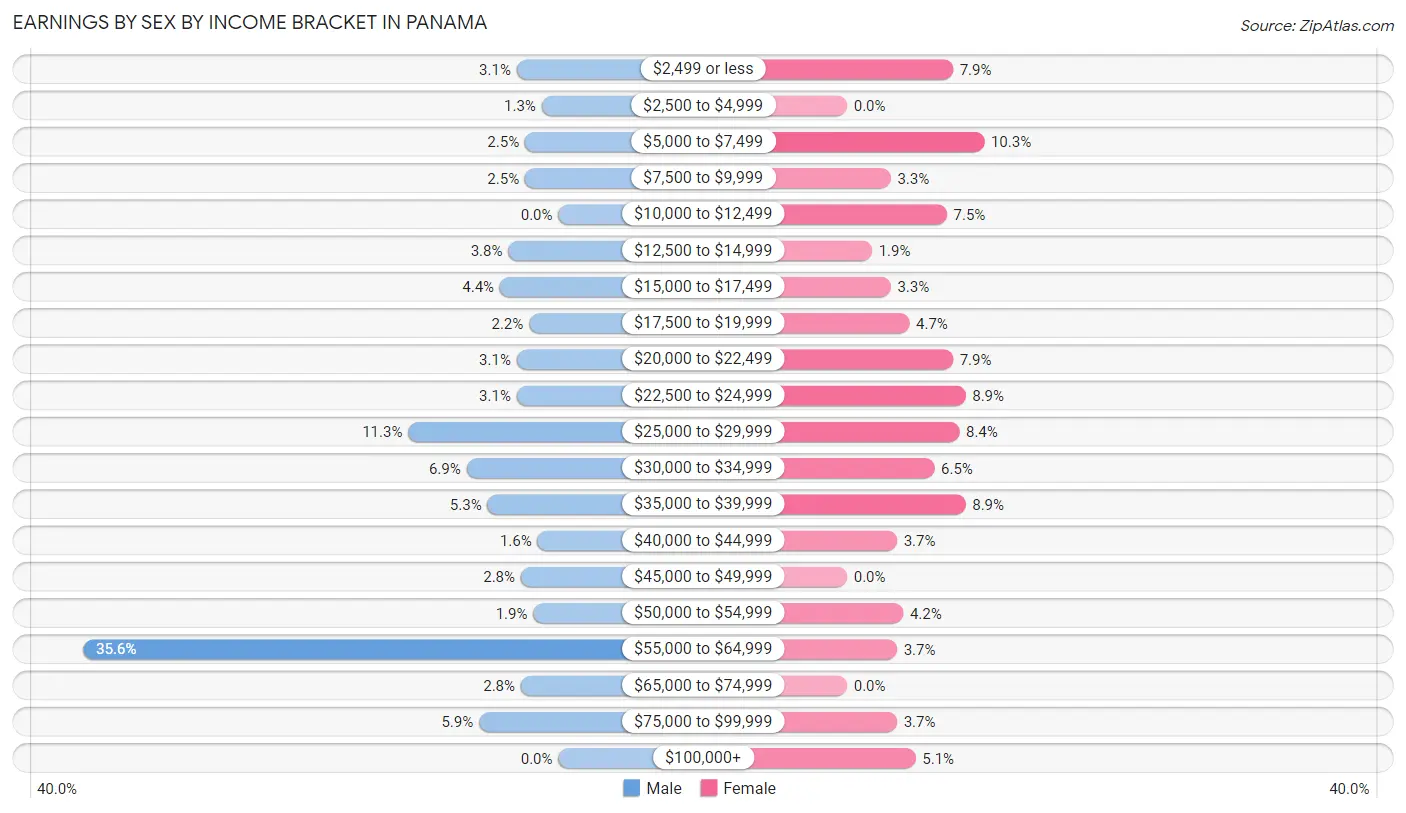
Earnings by Sex by Income Bracket in Panama
The most common earnings brackets in Panama are $55,000 to $64,999 for men (114 | 35.6%) and $5,000 to $7,499 for women (22 | 10.3%).
| Income | Male | Female |
| $2,499 or less | 10 (3.1%) | 17 (7.9%) |
| $2,500 to $4,999 | 4 (1.3%) | 0 (0.0%) |
| $5,000 to $7,499 | 8 (2.5%) | 22 (10.3%) |
| $7,500 to $9,999 | 8 (2.5%) | 7 (3.3%) |
| $10,000 to $12,499 | 0 (0.0%) | 16 (7.5%) |
| $12,500 to $14,999 | 12 (3.7%) | 4 (1.9%) |
| $15,000 to $17,499 | 14 (4.4%) | 7 (3.3%) |
| $17,500 to $19,999 | 7 (2.2%) | 10 (4.7%) |
| $20,000 to $22,499 | 10 (3.1%) | 17 (7.9%) |
| $22,500 to $24,999 | 10 (3.1%) | 19 (8.9%) |
| $25,000 to $29,999 | 36 (11.3%) | 18 (8.4%) |
| $30,000 to $34,999 | 22 (6.9%) | 14 (6.5%) |
| $35,000 to $39,999 | 17 (5.3%) | 19 (8.9%) |
| $40,000 to $44,999 | 5 (1.6%) | 8 (3.7%) |
| $45,000 to $49,999 | 9 (2.8%) | 0 (0.0%) |
| $50,000 to $54,999 | 6 (1.9%) | 9 (4.2%) |
| $55,000 to $64,999 | 114 (35.6%) | 8 (3.7%) |
| $65,000 to $74,999 | 9 (2.8%) | 0 (0.0%) |
| $75,000 to $99,999 | 19 (5.9%) | 8 (3.7%) |
| $100,000+ | 0 (0.0%) | 11 (5.1%) |
| Total | 320 (100.0%) | 214 (100.0%) |
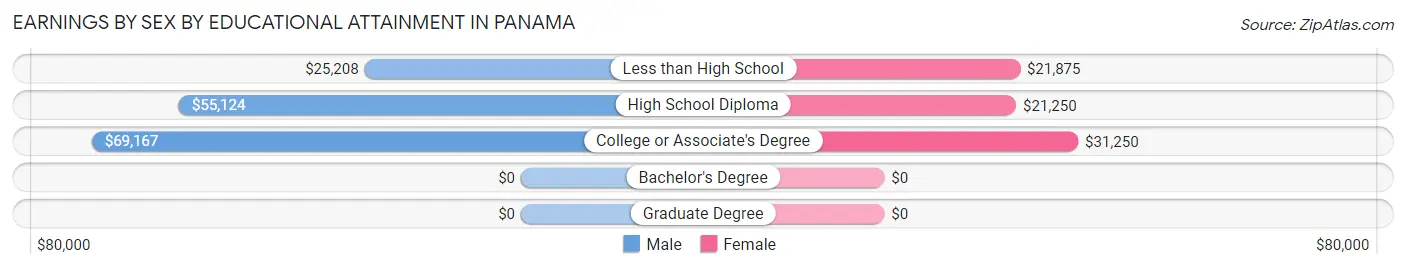
Earnings by Sex by Educational Attainment in Panama
Average earnings in Panama are $50,833 for men and $26,250 for women, a difference of 48.4%. Men with an educational attainment of college or associate's degree enjoy the highest average annual earnings of $69,167, while those with less than high school education earn the least with $25,208. Women with an educational attainment of college or associate's degree earn the most with the average annual earnings of $31,250, while those with high school diploma education have the smallest earnings of $21,250.
| Educational Attainment | Male Income | Female Income |
| Less than High School | $25,208 | $21,875 |
| High School Diploma | $55,124 | $21,250 |
| College or Associate's Degree | $69,167 | $31,250 |
| Bachelor's Degree | - | - |
| Graduate Degree | - | - |
| Total | $50,833 | $26,250 |
Family Income in Panama
Family Income Brackets in Panama
According to the Panama family income data, there are 123 families falling into the $75,000 to $99,999 income range, which is the most common income bracket and makes up 31.8% of all families.
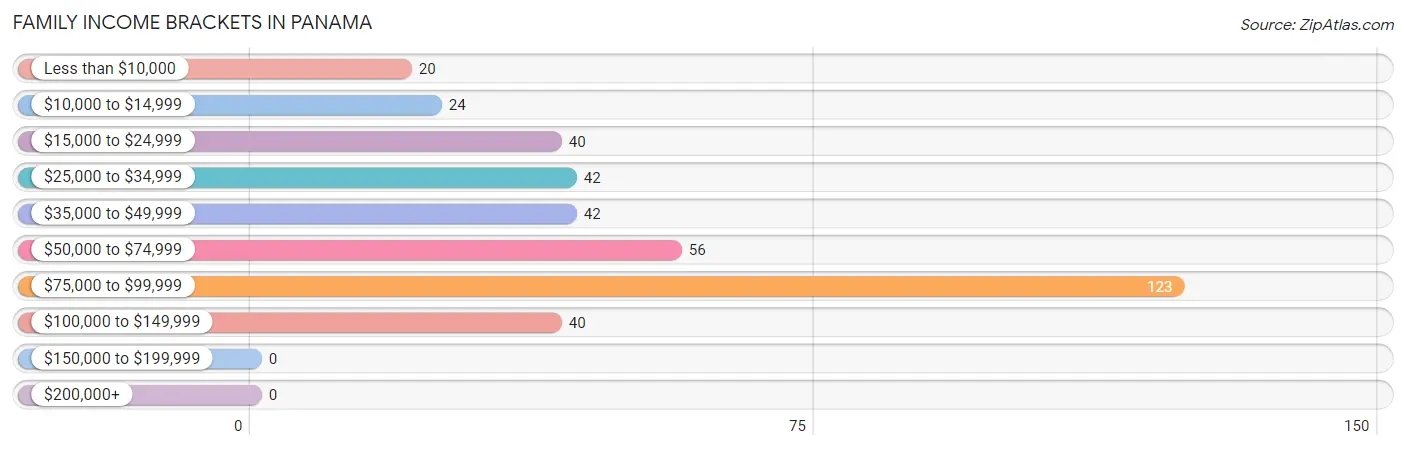
| Income Bracket | # Families | % Families |
| Less than $10,000 | 20 | 5.2% |
| $10,000 to $14,999 | 24 | 6.2% |
| $15,000 to $24,999 | 40 | 10.3% |
| $25,000 to $34,999 | 42 | 10.9% |
| $35,000 to $49,999 | 42 | 10.9% |
| $50,000 to $74,999 | 56 | 14.5% |
| $75,000 to $99,999 | 123 | 31.8% |
| $100,000 to $149,999 | 40 | 10.3% |
| $150,000 to $199,999 | 0 | 0.0% |
| $200,000+ | 0 | 0.0% |
Family Income by Famaliy Size in Panama
4-person families (38 | 9.8%) account for the highest median family income in Panama with $91,250 per family, while 2-person families (233 | 60.2%) have the highest median income of $38,768 per family member.
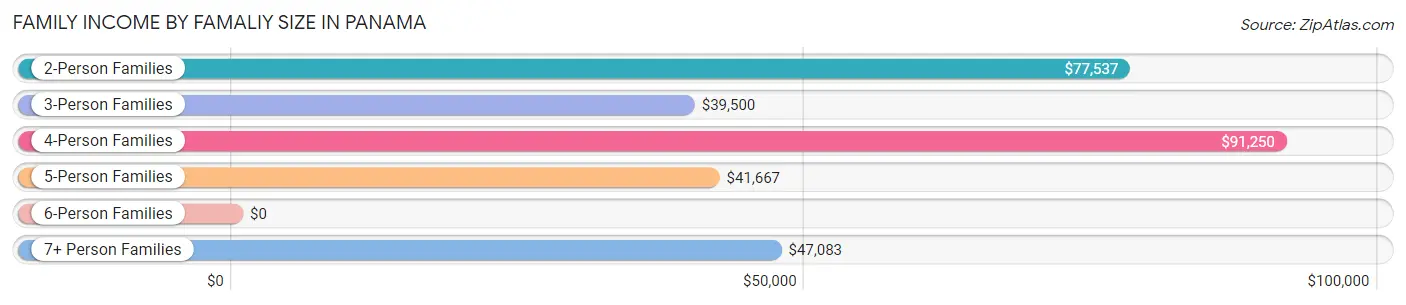
| Income Bracket | # Families | Median Income |
| 2-Person Families | 233 (60.2%) | $77,537 |
| 3-Person Families | 68 (17.6%) | $39,500 |
| 4-Person Families | 38 (9.8%) | $91,250 |
| 5-Person Families | 32 (8.3%) | $41,667 |
| 6-Person Families | 3 (0.8%) | $0 |
| 7+ Person Families | 13 (3.4%) | $47,083 |
| Total | 387 (100.0%) | $57,188 |
Family Income by Number of Earners in Panama
The median family income in Panama is $57,188, with families comprising 3+ earners (14) having the highest median family income of $91,250, while families with no earners (87) have the lowest median family income of $20,625, accounting for 3.6% and 22.5% of families, respectively.
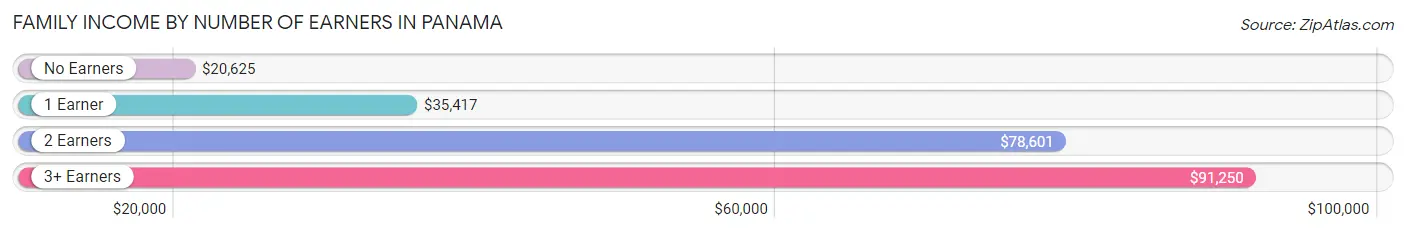
| Number of Earners | # Families | Median Income |
| No Earners | 87 (22.5%) | $20,625 |
| 1 Earner | 105 (27.1%) | $35,417 |
| 2 Earners | 181 (46.8%) | $78,601 |
| 3+ Earners | 14 (3.6%) | $91,250 |
| Total | 387 (100.0%) | $57,188 |
Household Income in Panama
Household Income Brackets in Panama
With 132 households falling in the category, the $75,000 to $99,999 income range is the most frequent in Panama, accounting for 25.1% of all households.
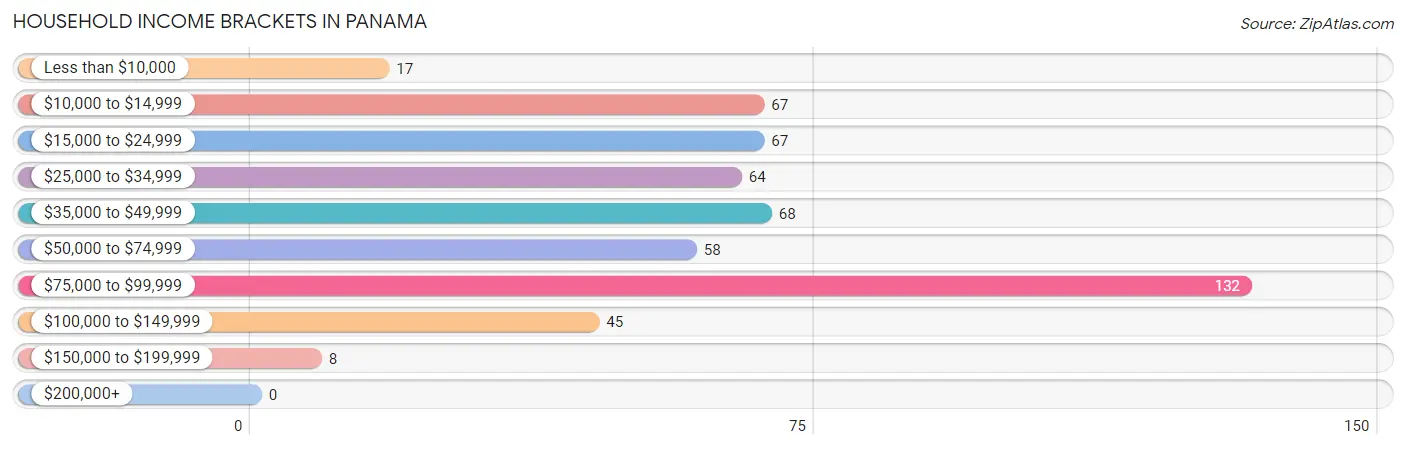
| Income Bracket | # Households | % Households |
| Less than $10,000 | 17 | 3.2% |
| $10,000 to $14,999 | 67 | 12.7% |
| $15,000 to $24,999 | 67 | 12.7% |
| $25,000 to $34,999 | 64 | 12.2% |
| $35,000 to $49,999 | 68 | 12.9% |
| $50,000 to $74,999 | 58 | 11.0% |
| $75,000 to $99,999 | 132 | 25.1% |
| $100,000 to $149,999 | 45 | 8.6% |
| $150,000 to $199,999 | 8 | 1.5% |
| $200,000+ | 0 | 0.0% |
Household Income by Householder Age in Panama
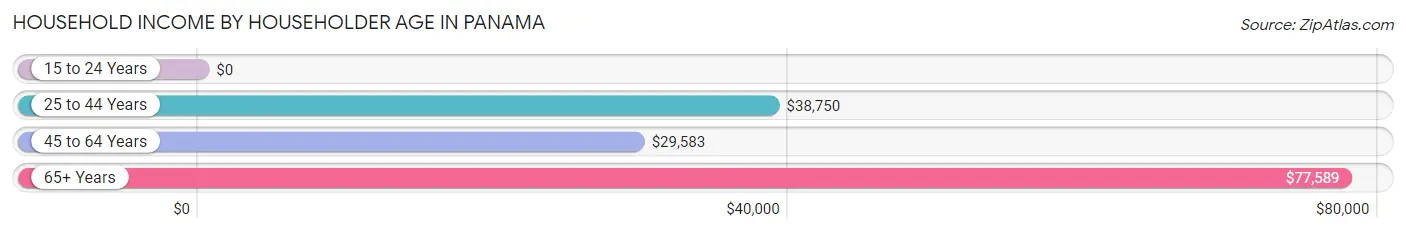
The median household income in Panama is $44,397, with the highest median household income of $77,589 found in the 65+ years age bracket for the primary householder. A total of 203 households (38.6%) fall into this category. Meanwhile, the 15 to 24 years age bracket for the primary householder has the lowest median household income of $0, with 45 households (8.6%) in this group.
| Income Bracket | # Households | Median Income |
| 15 to 24 Years | 45 (8.6%) | $0 |
| 25 to 44 Years | 152 (28.9%) | $38,750 |
| 45 to 64 Years | 126 (23.9%) | $29,583 |
| 65+ Years | 203 (38.6%) | $77,589 |
| Total | 526 (100.0%) | $44,397 |
Poverty in Panama
Income Below Poverty by Sex and Age in Panama
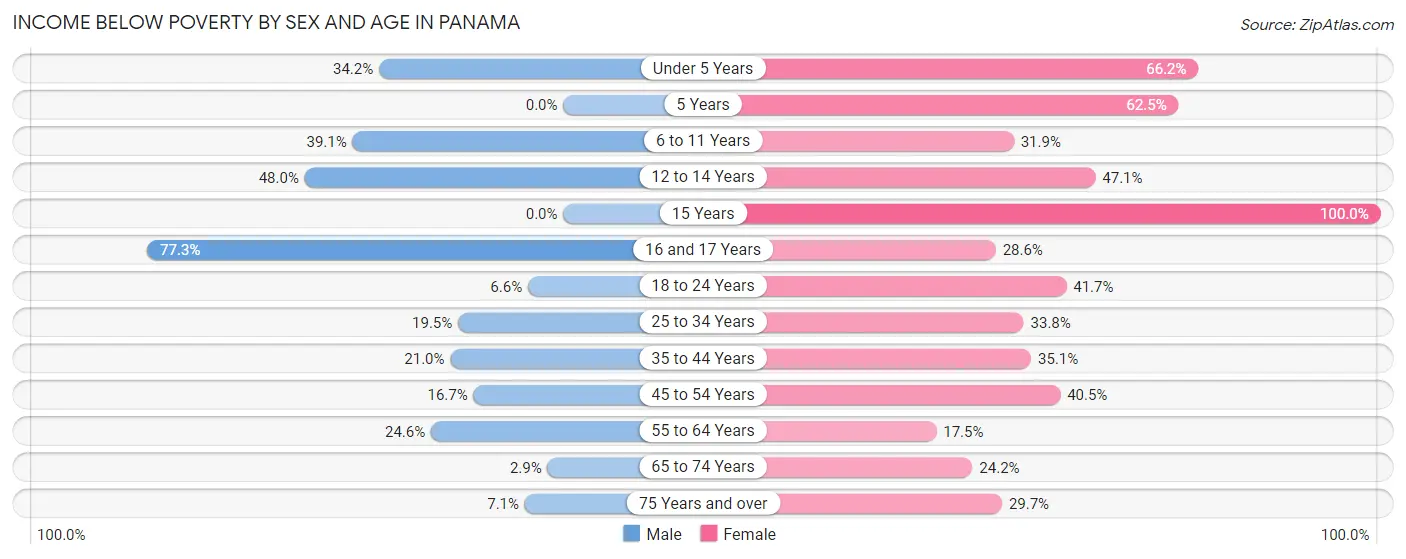
With 20.9% poverty level for males and 37.8% for females among the residents of Panama, 16 and 17 year old males and 15 year old females are the most vulnerable to poverty, with 17 males (77.3%) and 7 females (100.0%) in their respective age groups living below the poverty level.
| Age Bracket | Male | Female |
| Under 5 Years | 26 (34.2%) | 45 (66.2%) |
| 5 Years | 0 (0.0%) | 10 (62.5%) |
| 6 to 11 Years | 27 (39.1%) | 15 (31.9%) |
| 12 to 14 Years | 12 (48.0%) | 8 (47.1%) |
| 15 Years | 0 (0.0%) | 7 (100.0%) |
| 16 and 17 Years | 17 (77.3%) | 4 (28.6%) |
| 18 to 24 Years | 4 (6.6%) | 30 (41.7%) |
| 25 to 34 Years | 17 (19.5%) | 27 (33.8%) |
| 35 to 44 Years | 13 (21.0%) | 26 (35.1%) |
| 45 to 54 Years | 6 (16.7%) | 15 (40.5%) |
| 55 to 64 Years | 14 (24.6%) | 10 (17.5%) |
| 65 to 74 Years | 4 (2.9%) | 16 (24.2%) |
| 75 Years and over | 2 (7.1%) | 11 (29.7%) |
| Total | 142 (20.9%) | 224 (37.8%) |
Income Above Poverty by Sex and Age in Panama
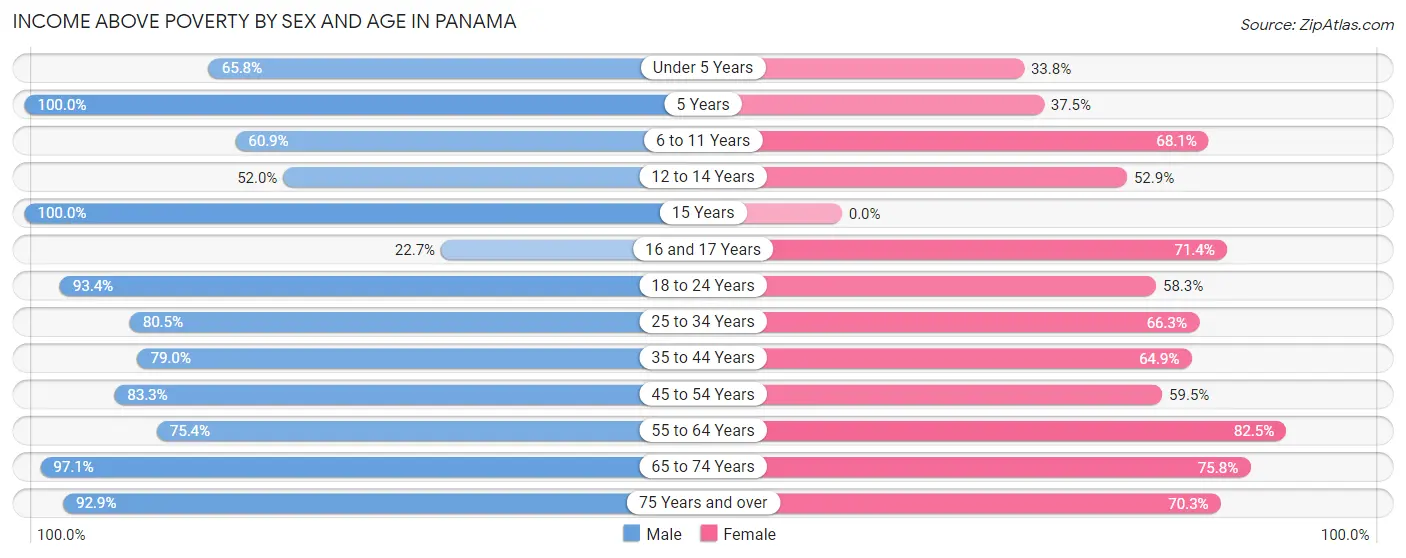
According to the poverty statistics in Panama, males aged 5 years and females aged 55 to 64 years are the age groups that are most secure financially, with 100.0% of males and 82.5% of females in these age groups living above the poverty line.
| Age Bracket | Male | Female |
| Under 5 Years | 50 (65.8%) | 23 (33.8%) |
| 5 Years | 9 (100.0%) | 6 (37.5%) |
| 6 to 11 Years | 42 (60.9%) | 32 (68.1%) |
| 12 to 14 Years | 13 (52.0%) | 9 (52.9%) |
| 15 Years | 10 (100.0%) | 0 (0.0%) |
| 16 and 17 Years | 5 (22.7%) | 10 (71.4%) |
| 18 to 24 Years | 57 (93.4%) | 42 (58.3%) |
| 25 to 34 Years | 70 (80.5%) | 53 (66.2%) |
| 35 to 44 Years | 49 (79.0%) | 48 (64.9%) |
| 45 to 54 Years | 30 (83.3%) | 22 (59.5%) |
| 55 to 64 Years | 43 (75.4%) | 47 (82.5%) |
| 65 to 74 Years | 132 (97.1%) | 50 (75.8%) |
| 75 Years and over | 26 (92.9%) | 26 (70.3%) |
| Total | 536 (79.1%) | 368 (62.2%) |
Income Below Poverty Among Married-Couple Families in Panama
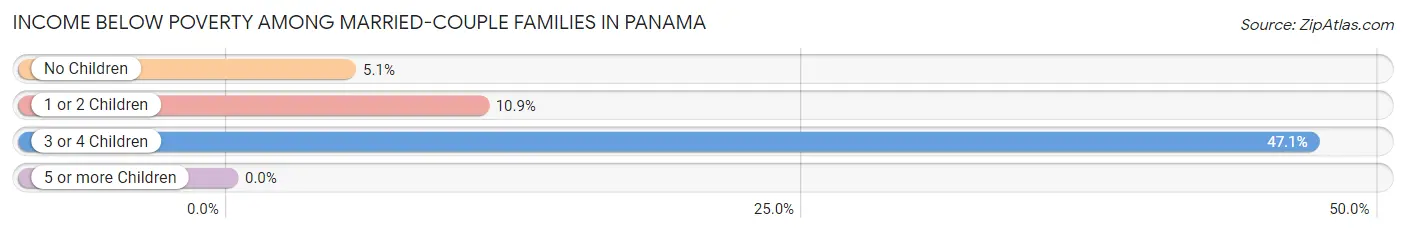
The poverty statistics for married-couple families in Panama show that 9.2% or 23 of the total 250 families live below the poverty line. Families with 3 or 4 children have the highest poverty rate of 47.1%, comprising of 8 families. On the other hand, families with 5 or more children have the lowest poverty rate of 0.0%, which includes 0 families.
| Children | Above Poverty | Below Poverty |
| No Children | 166 (94.9%) | 9 (5.1%) |
| 1 or 2 Children | 49 (89.1%) | 6 (10.9%) |
| 3 or 4 Children | 9 (52.9%) | 8 (47.1%) |
| 5 or more Children | 3 (100.0%) | 0 (0.0%) |
| Total | 227 (90.8%) | 23 (9.2%) |
Income Below Poverty Among Single-Parent Households in Panama
According to the poverty data in Panama, 8.2% or 4 single-father households and 55.7% or 49 single-mother households are living below the poverty line. Among single-father households, those with no children have the highest poverty rate, with 4 households (28.6%) experiencing poverty. Likewise, among single-mother households, those with 5 or more children have the highest poverty rate, with 4 households (100.0%) falling below the poverty line.
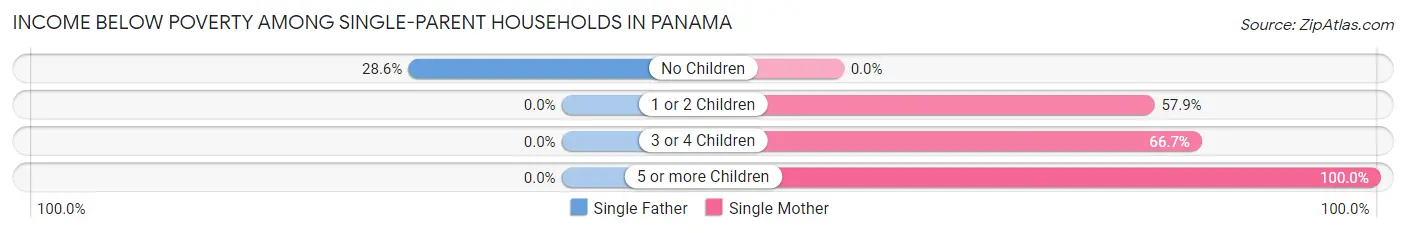
| Children | Single Father | Single Mother |
| No Children | 4 (28.6%) | 0 (0.0%) |
| 1 or 2 Children | 0 (0.0%) | 33 (57.9%) |
| 3 or 4 Children | 0 (0.0%) | 12 (66.7%) |
| 5 or more Children | 0 (0.0%) | 4 (100.0%) |
| Total | 4 (8.2%) | 49 (55.7%) |
Income Below Poverty Among Married-Couple vs Single-Parent Households in Panama
The poverty data for Panama shows that 23 of the married-couple family households (9.2%) and 53 of the single-parent households (38.7%) are living below the poverty level. Within the married-couple family households, those with 3 or 4 children have the highest poverty rate, with 8 households (47.1%) falling below the poverty line. Among the single-parent households, those with 5 or more children have the highest poverty rate, with 4 household (100.0%) living below poverty.
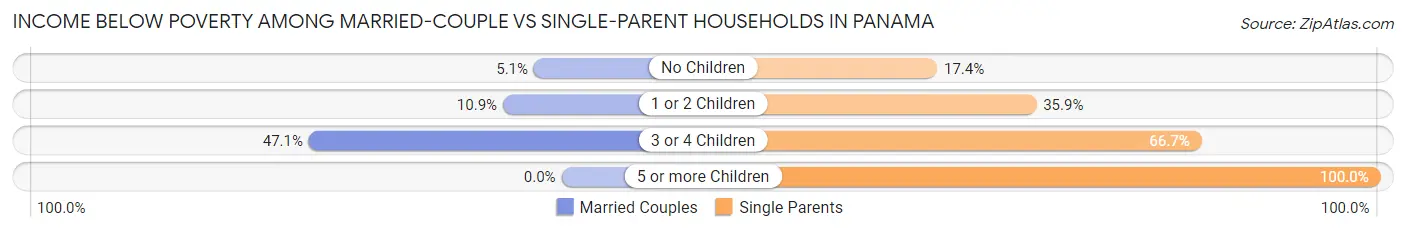
| Children | Married-Couple Families | Single-Parent Households |
| No Children | 9 (5.1%) | 4 (17.4%) |
| 1 or 2 Children | 6 (10.9%) | 33 (35.9%) |
| 3 or 4 Children | 8 (47.1%) | 12 (66.7%) |
| 5 or more Children | 0 (0.0%) | 4 (100.0%) |
| Total | 23 (9.2%) | 53 (38.7%) |
Race in Panama
The most populous races in Panama are White / Caucasian (895 | 70.0%), Two or more Races (242 | 18.9%), and Native / Alaskan (107 | 8.4%).
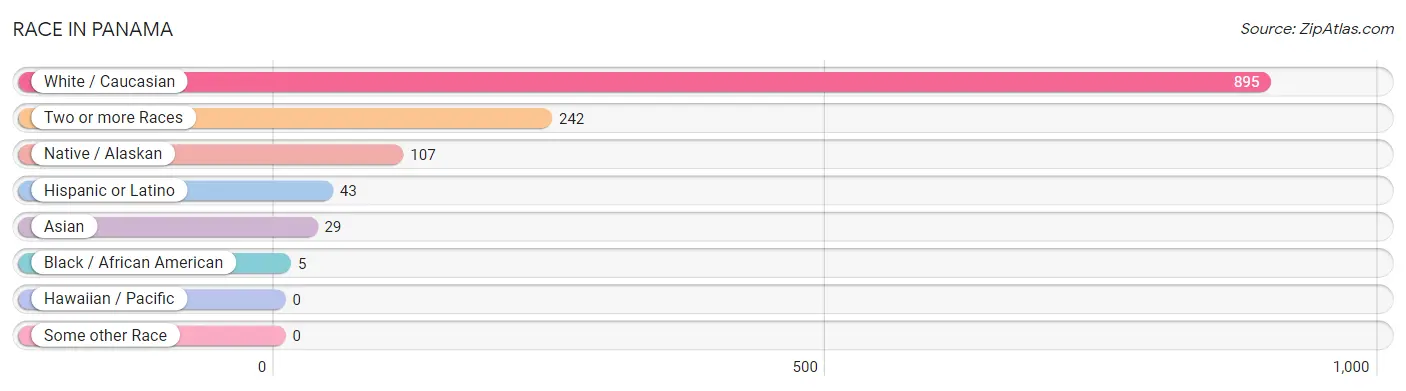
| Race | # Population | % Population |
| Asian | 29 | 2.3% |
| Black / African American | 5 | 0.4% |
| Hawaiian / Pacific | 0 | 0.0% |
| Hispanic or Latino | 43 | 3.4% |
| Native / Alaskan | 107 | 8.4% |
| White / Caucasian | 895 | 70.0% |
| Two or more Races | 242 | 18.9% |
| Some other Race | 0 | 0.0% |
| Total | 1,278 | 100.0% |
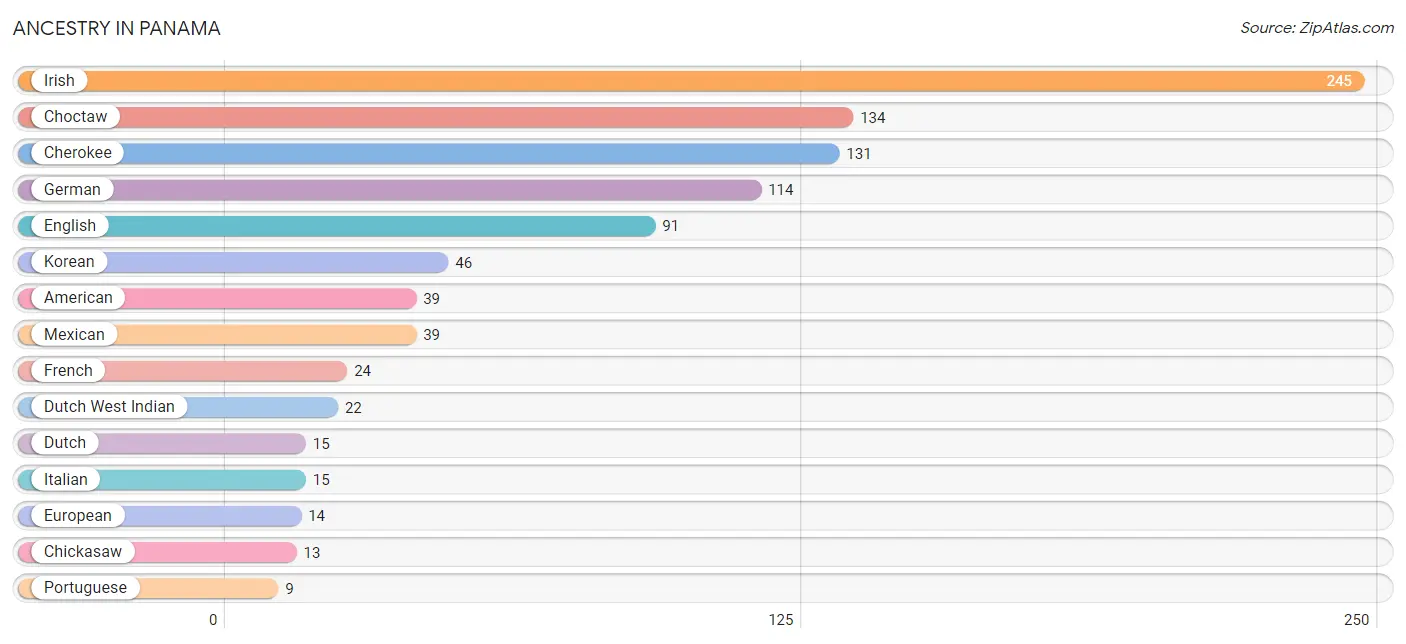
Ancestry in Panama
The most populous ancestries reported in Panama are Irish (245 | 19.2%), Choctaw (134 | 10.5%), Cherokee (131 | 10.2%), German (114 | 8.9%), and English (91 | 7.1%), together accounting for 55.9% of all Panama residents.
| Ancestry | # Population | % Population |
| American | 39 | 3.0% |
| Australian | 8 | 0.6% |
| Blackfeet | 2 | 0.2% |
| Central American | 3 | 0.2% |
| Cherokee | 131 | 10.2% |
| Chickasaw | 13 | 1.0% |
| Choctaw | 134 | 10.5% |
| Czechoslovakian | 3 | 0.2% |
| Dutch | 15 | 1.2% |
| Dutch West Indian | 22 | 1.7% |
| English | 91 | 7.1% |
| European | 14 | 1.1% |
| Finnish | 2 | 0.2% |
| French | 24 | 1.9% |
| French Canadian | 3 | 0.2% |
| German | 114 | 8.9% |
| Irish | 245 | 19.2% |
| Italian | 15 | 1.2% |
| Korean | 46 | 3.6% |
| Mexican | 39 | 3.0% |
| Nicaraguan | 3 | 0.2% |
| Norwegian | 8 | 0.6% |
| Portuguese | 9 | 0.7% |
| Russian | 8 | 0.6% |
| Scandinavian | 6 | 0.5% |
| Scottish | 3 | 0.2% |
| Spanish | 1 | 0.1% |
| Welsh | 4 | 0.3% |
| Yugoslavian | 3 | 0.2% | View All 29 Rows |
Immigrants in Panama
The most numerous immigrant groups reported in Panama came from Asia (20 | 1.6%), Philippines (20 | 1.6%), South Eastern Asia (20 | 1.6%), Central America (6 | 0.5%), and Europe (6 | 0.5%), together accounting for 5.6% of all Panama residents.
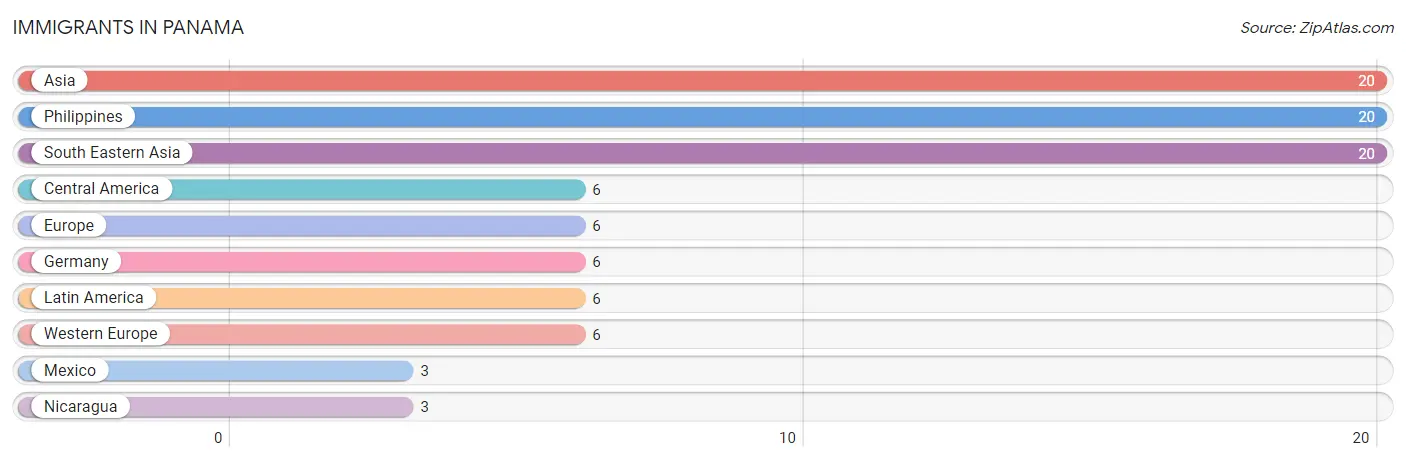
| Immigration Origin | # Population | % Population |
| Asia | 20 | 1.6% |
| Central America | 6 | 0.5% |
| Europe | 6 | 0.5% |
| Germany | 6 | 0.5% |
| Latin America | 6 | 0.5% |
| Mexico | 3 | 0.2% |
| Nicaragua | 3 | 0.2% |
| Philippines | 20 | 1.6% |
| South Eastern Asia | 20 | 1.6% |
| Western Europe | 6 | 0.5% | View All 10 Rows |
Sex and Age in Panama
Sex and Age in Panama
The most populous age groups in Panama are 65 to 69 Years (123 | 18.1%) for men and Under 5 Years (76 | 12.7%) for women.
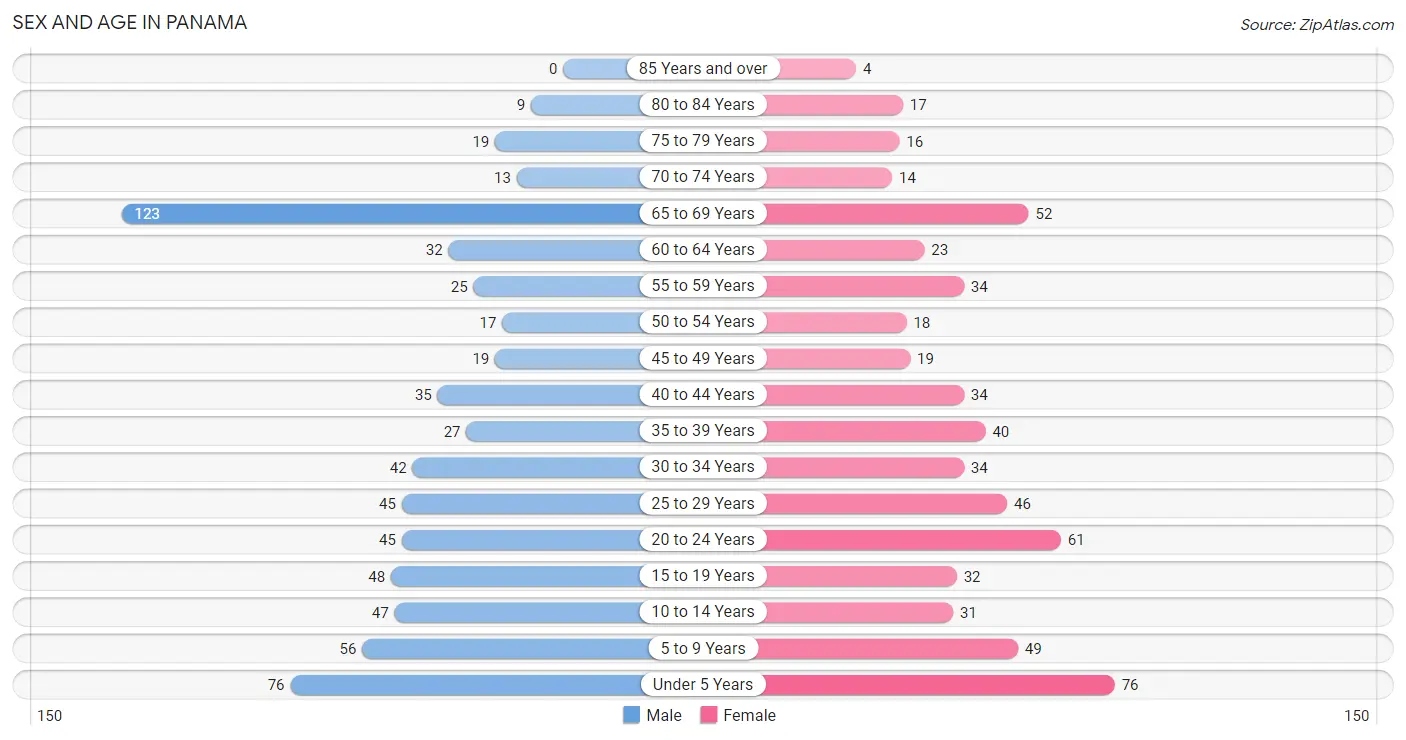
| Age Bracket | Male | Female |
| Under 5 Years | 76 (11.2%) | 76 (12.7%) |
| 5 to 9 Years | 56 (8.3%) | 49 (8.2%) |
| 10 to 14 Years | 47 (6.9%) | 31 (5.2%) |
| 15 to 19 Years | 48 (7.1%) | 32 (5.3%) |
| 20 to 24 Years | 45 (6.6%) | 61 (10.2%) |
| 25 to 29 Years | 45 (6.6%) | 46 (7.7%) |
| 30 to 34 Years | 42 (6.2%) | 34 (5.7%) |
| 35 to 39 Years | 27 (4.0%) | 40 (6.7%) |
| 40 to 44 Years | 35 (5.2%) | 34 (5.7%) |
| 45 to 49 Years | 19 (2.8%) | 19 (3.2%) |
| 50 to 54 Years | 17 (2.5%) | 18 (3.0%) |
| 55 to 59 Years | 25 (3.7%) | 34 (5.7%) |
| 60 to 64 Years | 32 (4.7%) | 23 (3.8%) |
| 65 to 69 Years | 123 (18.1%) | 52 (8.7%) |
| 70 to 74 Years | 13 (1.9%) | 14 (2.3%) |
| 75 to 79 Years | 19 (2.8%) | 16 (2.7%) |
| 80 to 84 Years | 9 (1.3%) | 17 (2.8%) |
| 85 Years and over | 0 (0.0%) | 4 (0.7%) |
| Total | 678 (100.0%) | 600 (100.0%) |
Families and Households in Panama
Median Family Size in Panama
The median family size in Panama is 2.72 persons per family, with single female/mother families (88 | 22.7%) accounting for the largest median family size of 3.22 persons per family. On the other hand, single male/father families (49 | 12.7%) represent the smallest median family size with 2.12 persons per family.
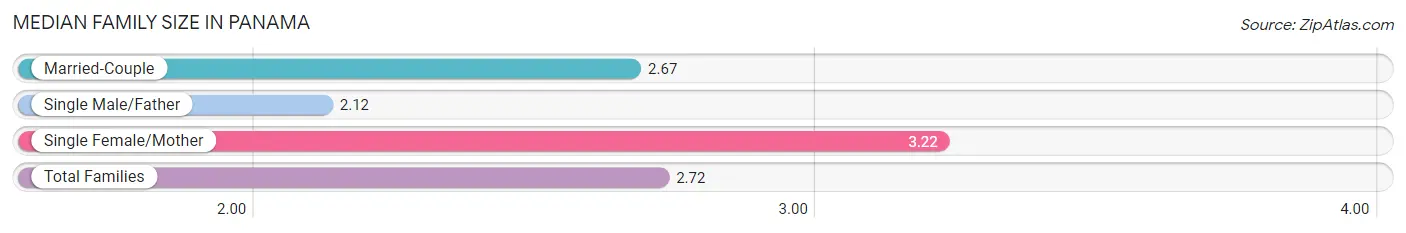
| Family Type | # Families | Family Size |
| Married-Couple | 250 (64.6%) | 2.67 |
| Single Male/Father | 49 (12.7%) | 2.12 |
| Single Female/Mother | 88 (22.7%) | 3.22 |
| Total Families | 387 (100.0%) | 2.72 |
Median Household Size in Panama
The median household size in Panama is 2.43 persons per household, with single female/mother households (88 | 16.7%) accounting for the largest median household size of 3.67 persons per household. non-family households (139 | 26.4%) represent the smallest median household size with 1.07 persons per household.
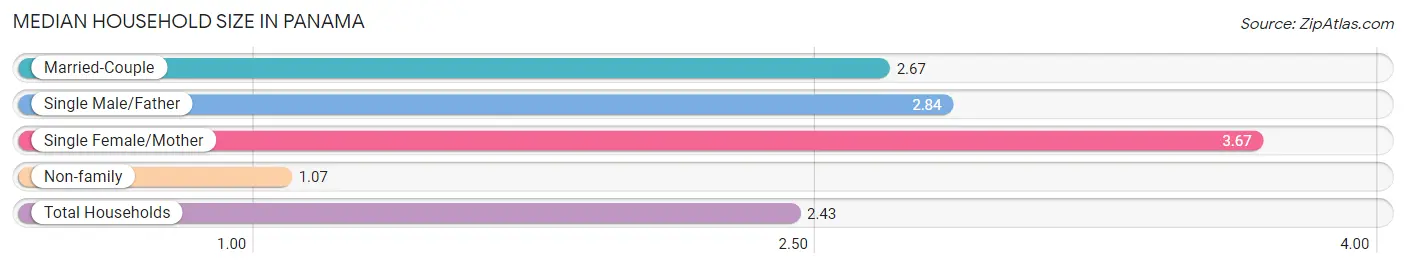
| Household Type | # Households | Household Size |
| Married-Couple | 250 (47.5%) | 2.67 |
| Single Male/Father | 49 (9.3%) | 2.84 |
| Single Female/Mother | 88 (16.7%) | 3.67 |
| Non-family | 139 (26.4%) | 1.07 |
| Total Households | 526 (100.0%) | 2.43 |
Household Size by Marriage Status in Panama
Out of a total of 526 households in Panama, 387 (73.6%) are family households, while 139 (26.4%) are nonfamily households. The most numerous type of family households are 2-person households, comprising 198, and the most common type of nonfamily households are 1-person households, comprising 124.
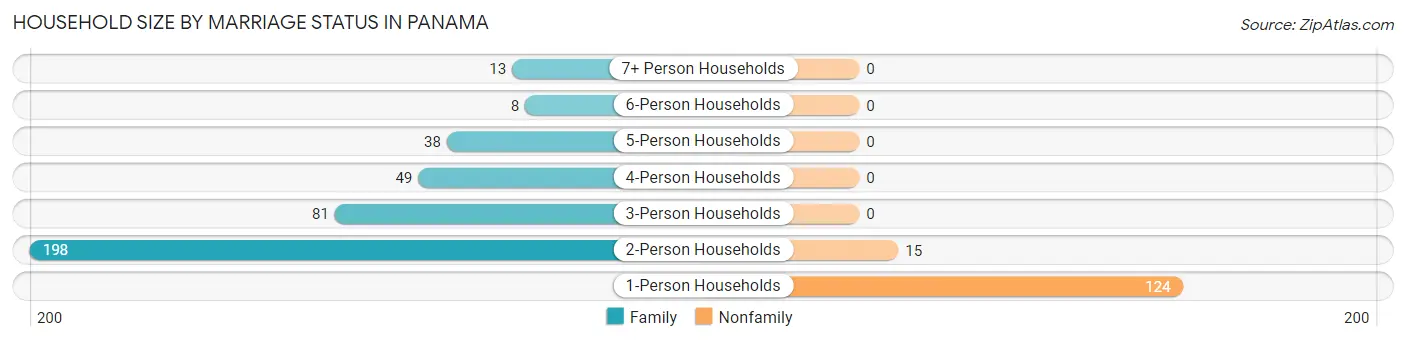
| Household Size | Family Households | Nonfamily Households |
| 1-Person Households | - | 124 (23.6%) |
| 2-Person Households | 198 (37.6%) | 15 (2.9%) |
| 3-Person Households | 81 (15.4%) | 0 (0.0%) |
| 4-Person Households | 49 (9.3%) | 0 (0.0%) |
| 5-Person Households | 38 (7.2%) | 0 (0.0%) |
| 6-Person Households | 8 (1.5%) | 0 (0.0%) |
| 7+ Person Households | 13 (2.5%) | 0 (0.0%) |
| Total | 387 (73.6%) | 139 (26.4%) |
Female Fertility in Panama
Fertility by Age in Panama
Average fertility rate in Panama is 111.0 births per 1,000 women. Women in the age bracket of 20 to 34 years have the highest fertility rate with 170.0 births per 1,000 women. Women in the age bracket of 20 to 34 years acount for 80.0% of all women with births.
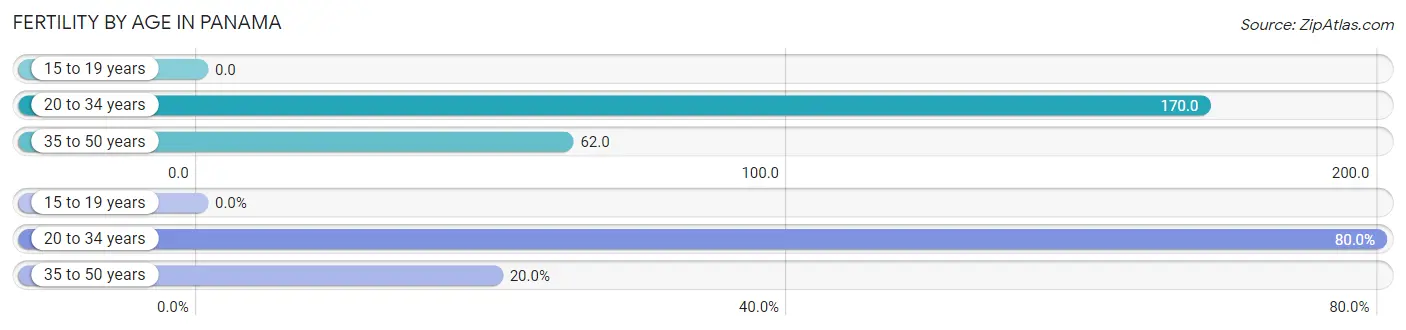
| Age Bracket | Women with Births | Births / 1,000 Women |
| 15 to 19 years | 0 (0.0%) | 0.0 |
| 20 to 34 years | 24 (80.0%) | 170.0 |
| 35 to 50 years | 6 (20.0%) | 62.0 |
| Total | 30 (100.0%) | 111.0 |
Fertility by Age by Marriage Status in Panama
53.3% of women with births (30) in Panama are married. The highest percentage of unmarried women with births falls into 35 to 50 years age bracket with 100.0% of them unmarried at the time of birth, while the lowest percentage of unmarried women with births belong to 20 to 34 years age bracket with 33.3% of them unmarried.
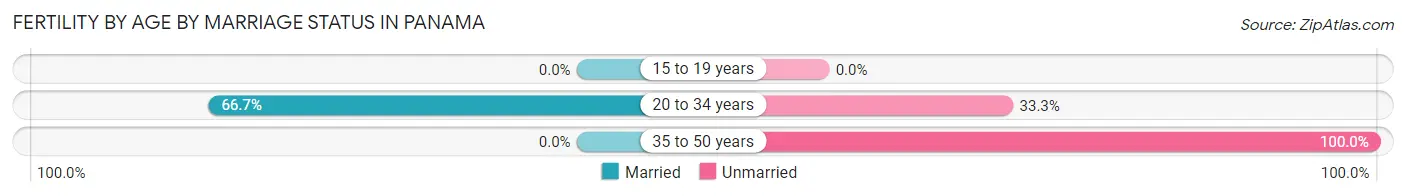
| Age Bracket | Married | Unmarried |
| 15 to 19 years | 0 (0.0%) | 0 (0.0%) |
| 20 to 34 years | 16 (66.7%) | 8 (33.3%) |
| 35 to 50 years | 0 (0.0%) | 6 (100.0%) |
| Total | 16 (53.3%) | 14 (46.7%) |
Fertility by Education in Panama
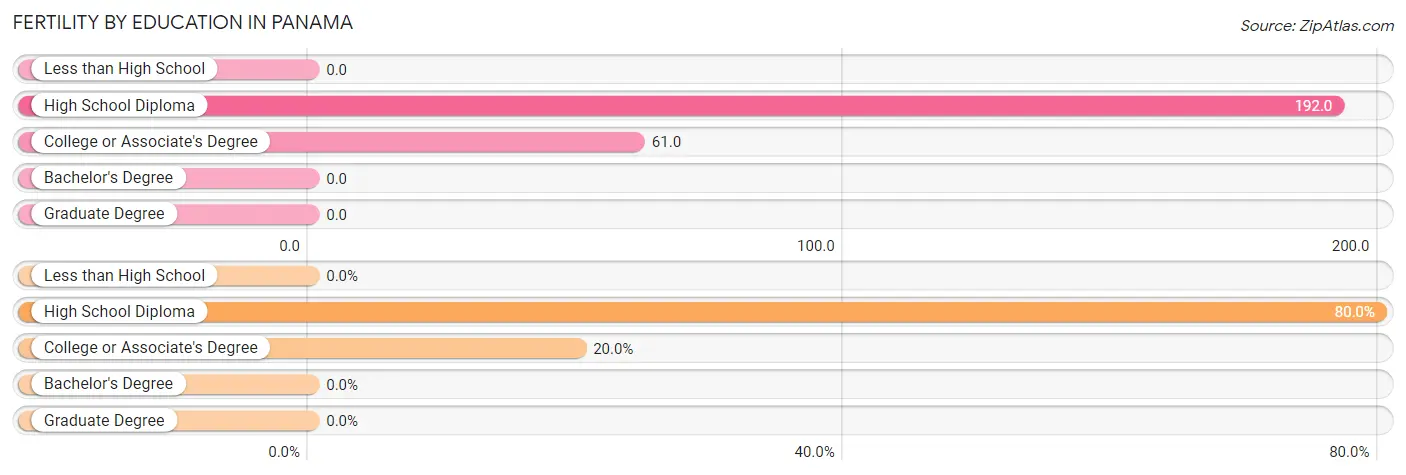
| Educational Attainment | Women with Births | Births / 1,000 Women |
| Less than High School | 0 (0.0%) | 0.0 |
| High School Diploma | 24 (80.0%) | 192.0 |
| College or Associate's Degree | 6 (20.0%) | 61.0 |
| Bachelor's Degree | 0 (0.0%) | 0.0 |
| Graduate Degree | 0 (0.0%) | 0.0 |
| Total | 30 (100.0%) | 111.0 |
Fertility by Education by Marriage Status in Panama
46.7% of women with births in Panama are unmarried. Women with the educational attainment of high school diploma are most likely to be married with 66.7% of them married at childbirth, while women with the educational attainment of college or associate's degree are least likely to be married with 100.0% of them unmarried at childbirth.
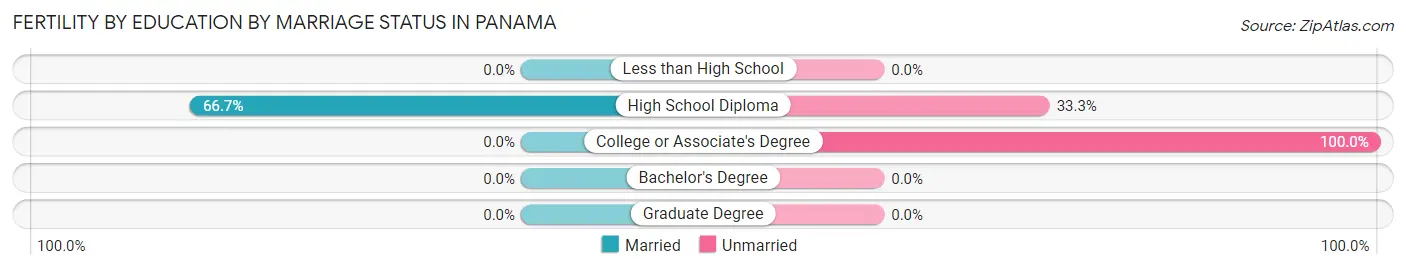
| Educational Attainment | Married | Unmarried |
| Less than High School | 0 (0.0%) | 0 (0.0%) |
| High School Diploma | 16 (66.7%) | 8 (33.3%) |
| College or Associate's Degree | 0 (0.0%) | 6 (100.0%) |
| Bachelor's Degree | 0 (0.0%) | 0 (0.0%) |
| Graduate Degree | 0 (0.0%) | 0 (0.0%) |
| Total | 16 (53.3%) | 14 (46.7%) |
Employment Characteristics in Panama
Employment by Class of Employer in Panama
Among the 502 employed individuals in Panama, private company employees (394 | 78.5%), federal government employees (29 | 5.8%), and self-employed (not incorporated) (20 | 4.0%) make up the most common classes of employment.
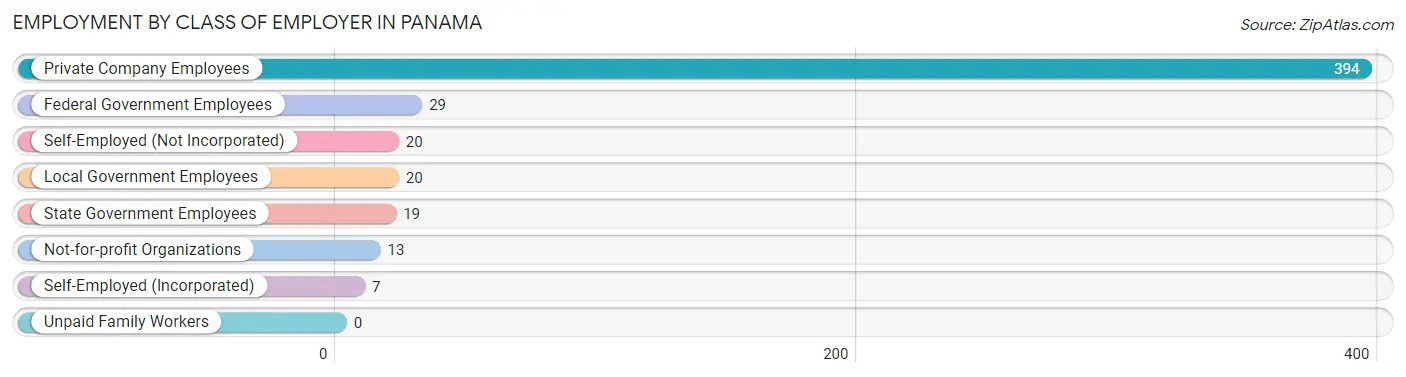
| Employer Class | # Employees | % Employees |
| Private Company Employees | 394 | 78.5% |
| Self-Employed (Incorporated) | 7 | 1.4% |
| Self-Employed (Not Incorporated) | 20 | 4.0% |
| Not-for-profit Organizations | 13 | 2.6% |
| Local Government Employees | 20 | 4.0% |
| State Government Employees | 19 | 3.8% |
| Federal Government Employees | 29 | 5.8% |
| Unpaid Family Workers | 0 | 0.0% |
| Total | 502 | 100.0% |
Employment Status by Age in Panama
According to the labor force statistics for Panama, out of the total population over 16 years of age (926), 56.5% or 523 individuals are in the labor force, with 3.5% or 18 of them unemployed. The age group with the highest labor force participation rate is 30 to 34 years, with 78.9% or 60 individuals in the labor force. Within the labor force, the 25 to 29 years age range has the highest percentage of unemployed individuals, with 13.1% or 8 of them being unemployed.
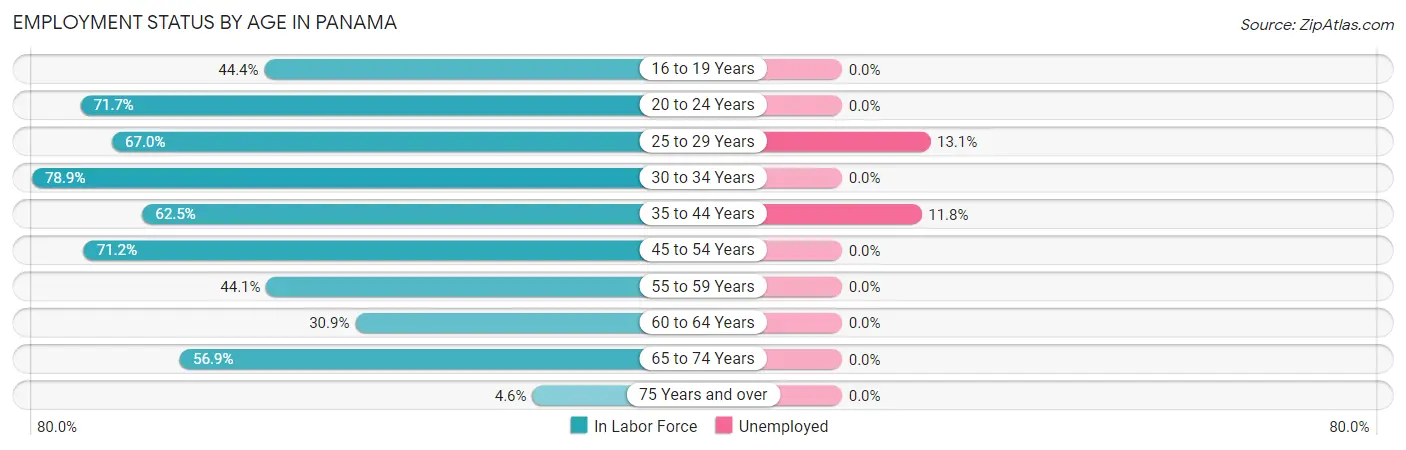
| Age Bracket | In Labor Force | Unemployed |
| 16 to 19 Years | 28 (44.4%) | 0 (0.0%) |
| 20 to 24 Years | 76 (71.7%) | 0 (0.0%) |
| 25 to 29 Years | 61 (67.0%) | 8 (13.1%) |
| 30 to 34 Years | 60 (78.9%) | 0 (0.0%) |
| 35 to 44 Years | 85 (62.5%) | 10 (11.8%) |
| 45 to 54 Years | 52 (71.2%) | 0 (0.0%) |
| 55 to 59 Years | 26 (44.1%) | 0 (0.0%) |
| 60 to 64 Years | 17 (30.9%) | 0 (0.0%) |
| 65 to 74 Years | 115 (56.9%) | 0 (0.0%) |
| 75 Years and over | 3 (4.6%) | 0 (0.0%) |
| Total | 523 (56.5%) | 18 (3.5%) |
Employment Status by Educational Attainment in Panama
According to labor force statistics for Panama, 61.4% of individuals (301) out of the total population between 25 and 64 years of age (490) are in the labor force, with 6.1% or 18 of them being unemployed. The group with the highest labor force participation rate are those with the educational attainment of bachelor's degree or higher, with 73.5% or 25 individuals in the labor force. Within the labor force, individuals with less than high school education have the highest percentage of unemployment, with 14.3% or 4 of them being unemployed.
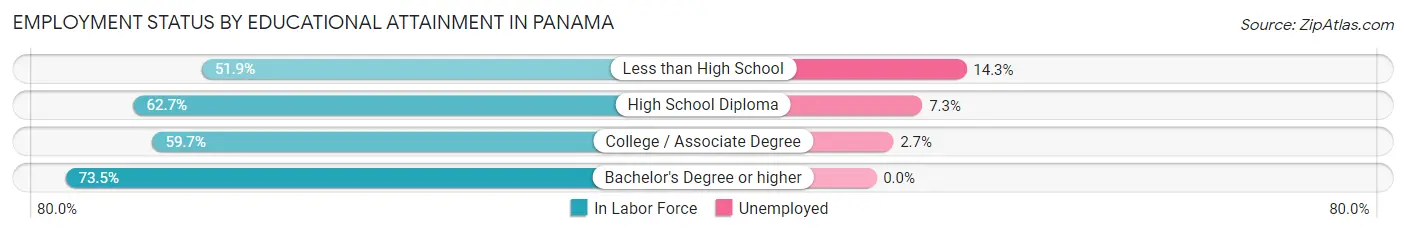
| Educational Attainment | In Labor Force | Unemployed |
| Less than High School | 28 (51.9%) | 8 (14.3%) |
| High School Diploma | 165 (62.7%) | 19 (7.3%) |
| College / Associate Degree | 83 (59.7%) | 4 (2.7%) |
| Bachelor's Degree or higher | 25 (73.5%) | 0 (0.0%) |
| Total | 301 (61.4%) | 30 (6.1%) |
Employment Occupations by Sex in Panama
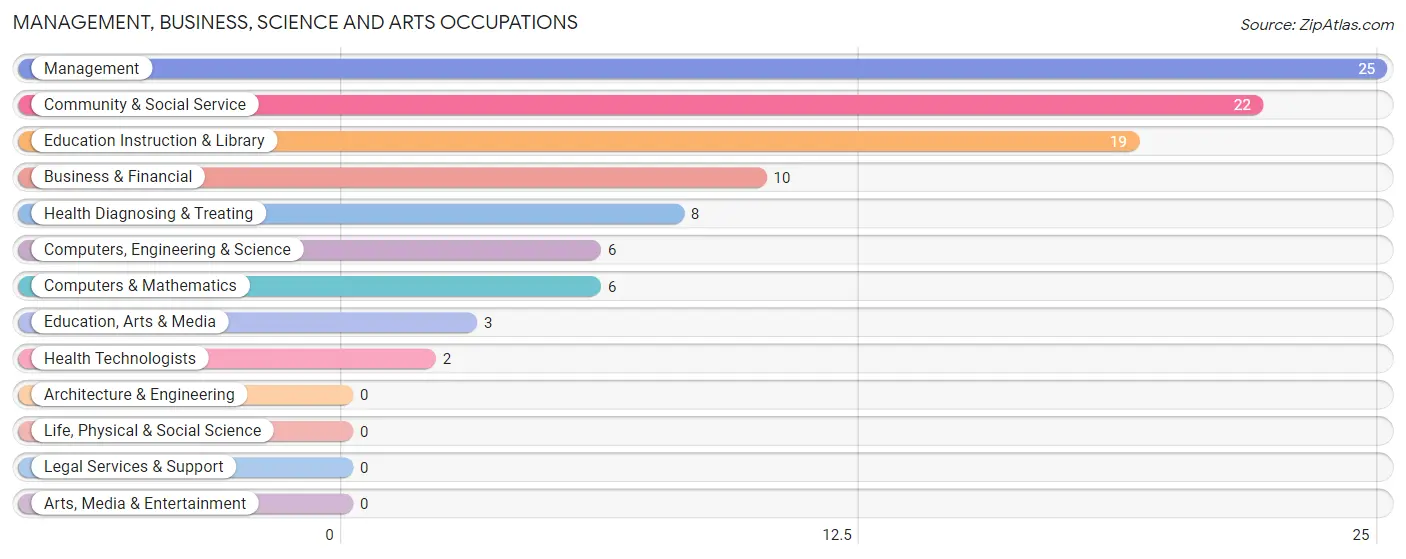
Management, Business, Science and Arts Occupations
The most common Management, Business, Science and Arts occupations in Panama are Management (25 | 5.0%), Community & Social Service (22 | 4.4%), Education Instruction & Library (19 | 3.8%), Business & Financial (10 | 2.0%), and Health Diagnosing & Treating (8 | 1.6%).
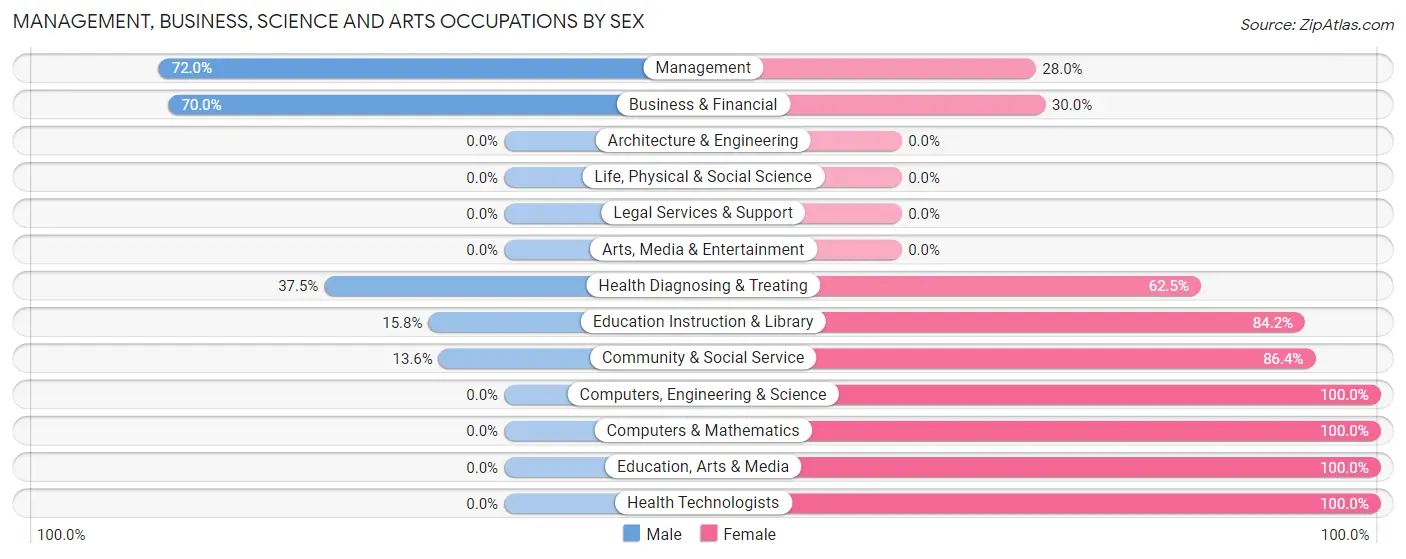
Management, Business, Science and Arts Occupations by Sex
Within the Management, Business, Science and Arts occupations in Panama, the most male-oriented occupations are Management (72.0%), Business & Financial (70.0%), and Health Diagnosing & Treating (37.5%), while the most female-oriented occupations are Computers, Engineering & Science (100.0%), Computers & Mathematics (100.0%), and Education, Arts & Media (100.0%).
| Occupation | Male | Female |
| Management | 18 (72.0%) | 7 (28.0%) |
| Business & Financial | 7 (70.0%) | 3 (30.0%) |
| Computers, Engineering & Science | 0 (0.0%) | 6 (100.0%) |
| Computers & Mathematics | 0 (0.0%) | 6 (100.0%) |
| Architecture & Engineering | 0 (0.0%) | 0 (0.0%) |
| Life, Physical & Social Science | 0 (0.0%) | 0 (0.0%) |
| Community & Social Service | 3 (13.6%) | 19 (86.4%) |
| Education, Arts & Media | 0 (0.0%) | 3 (100.0%) |
| Legal Services & Support | 0 (0.0%) | 0 (0.0%) |
| Education Instruction & Library | 3 (15.8%) | 16 (84.2%) |
| Arts, Media & Entertainment | 0 (0.0%) | 0 (0.0%) |
| Health Diagnosing & Treating | 3 (37.5%) | 5 (62.5%) |
| Health Technologists | 0 (0.0%) | 2 (100.0%) |
| Total (Category) | 31 (43.7%) | 40 (56.3%) |
| Total (Overall) | 312 (62.8%) | 185 (37.2%) |
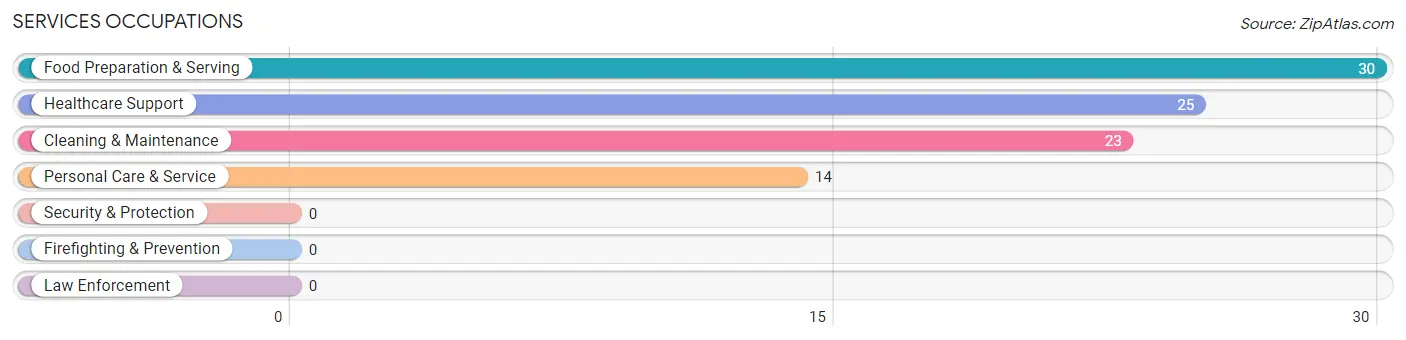
Services Occupations
The most common Services occupations in Panama are Food Preparation & Serving (30 | 6.0%), Healthcare Support (25 | 5.0%), Cleaning & Maintenance (23 | 4.6%), and Personal Care & Service (14 | 2.8%).
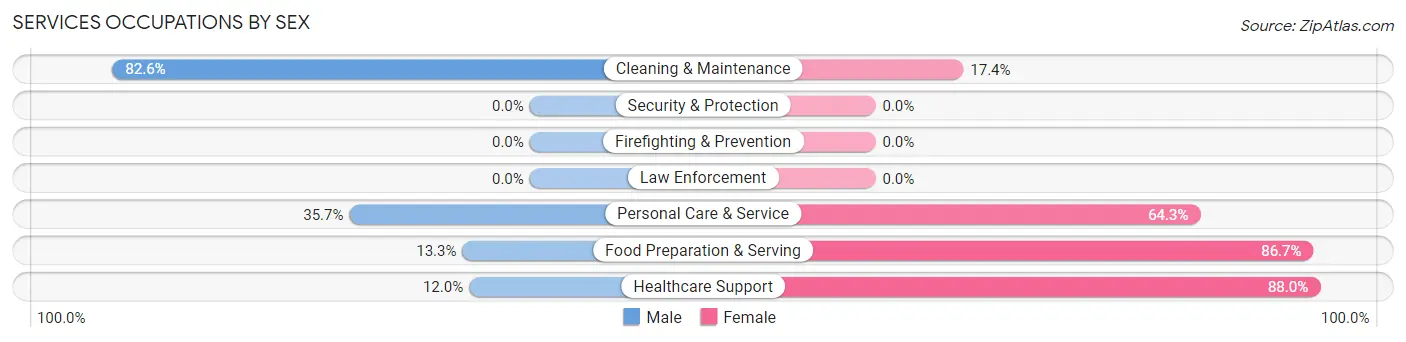
Services Occupations by Sex
Within the Services occupations in Panama, the most male-oriented occupations are Cleaning & Maintenance (82.6%), Personal Care & Service (35.7%), and Food Preparation & Serving (13.3%), while the most female-oriented occupations are Healthcare Support (88.0%), Food Preparation & Serving (86.7%), and Personal Care & Service (64.3%).
| Occupation | Male | Female |
| Healthcare Support | 3 (12.0%) | 22 (88.0%) |
| Security & Protection | 0 (0.0%) | 0 (0.0%) |
| Firefighting & Prevention | 0 (0.0%) | 0 (0.0%) |
| Law Enforcement | 0 (0.0%) | 0 (0.0%) |
| Food Preparation & Serving | 4 (13.3%) | 26 (86.7%) |
| Cleaning & Maintenance | 19 (82.6%) | 4 (17.4%) |
| Personal Care & Service | 5 (35.7%) | 9 (64.3%) |
| Total (Category) | 31 (33.7%) | 61 (66.3%) |
| Total (Overall) | 312 (62.8%) | 185 (37.2%) |
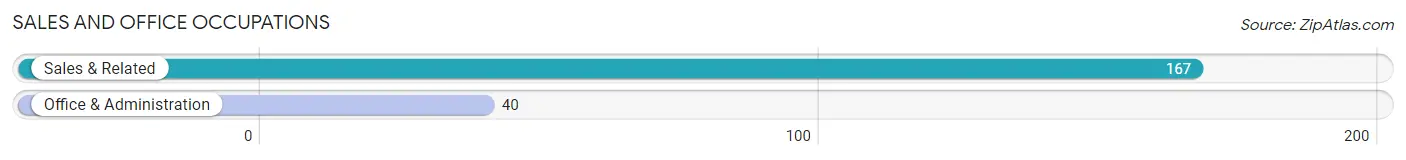
Sales and Office Occupations
The most common Sales and Office occupations in Panama are Sales & Related (167 | 33.6%), and Office & Administration (40 | 8.1%).
Sales and Office Occupations by Sex
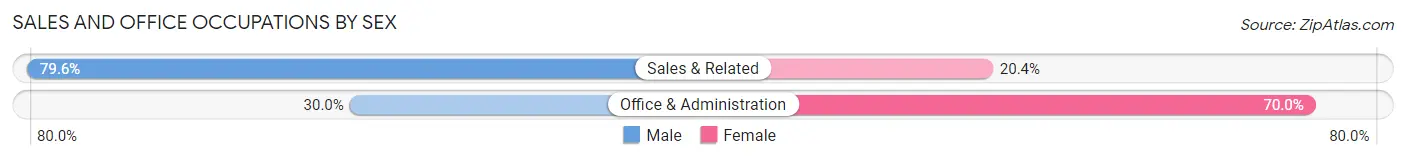
| Occupation | Male | Female |
| Sales & Related | 133 (79.6%) | 34 (20.4%) |
| Office & Administration | 12 (30.0%) | 28 (70.0%) |
| Total (Category) | 145 (70.1%) | 62 (29.9%) |
| Total (Overall) | 312 (62.8%) | 185 (37.2%) |
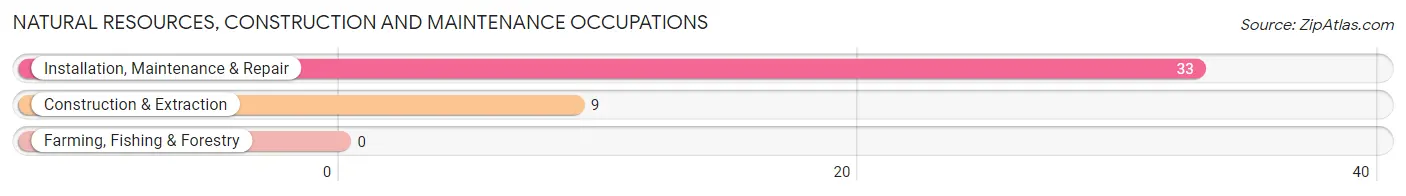
Natural Resources, Construction and Maintenance Occupations
The most common Natural Resources, Construction and Maintenance occupations in Panama are Installation, Maintenance & Repair (33 | 6.6%), and Construction & Extraction (9 | 1.8%).
Natural Resources, Construction and Maintenance Occupations by Sex
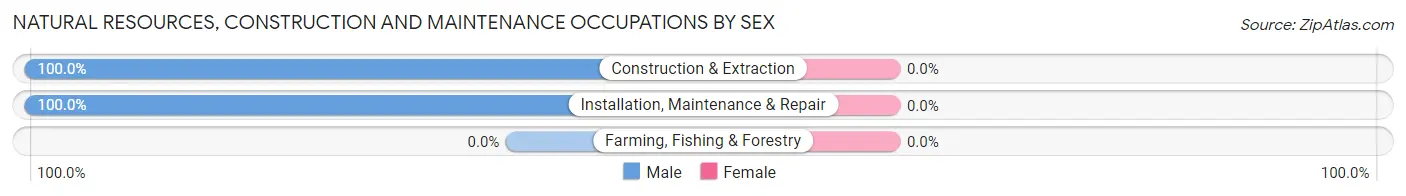
| Occupation | Male | Female |
| Farming, Fishing & Forestry | 0 (0.0%) | 0 (0.0%) |
| Construction & Extraction | 9 (100.0%) | 0 (0.0%) |
| Installation, Maintenance & Repair | 33 (100.0%) | 0 (0.0%) |
| Total (Category) | 42 (100.0%) | 0 (0.0%) |
| Total (Overall) | 312 (62.8%) | 185 (37.2%) |
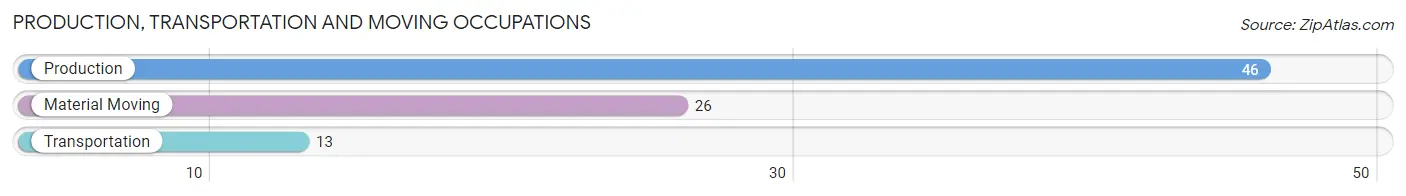
Production, Transportation and Moving Occupations
The most common Production, Transportation and Moving occupations in Panama are Production (46 | 9.3%), Material Moving (26 | 5.2%), and Transportation (13 | 2.6%).
Production, Transportation and Moving Occupations by Sex
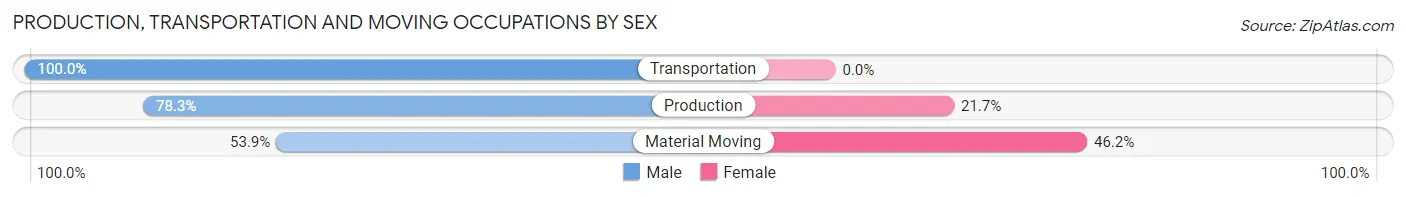
| Occupation | Male | Female |
| Production | 36 (78.3%) | 10 (21.7%) |
| Transportation | 13 (100.0%) | 0 (0.0%) |
| Material Moving | 14 (53.8%) | 12 (46.2%) |
| Total (Category) | 63 (74.1%) | 22 (25.9%) |
| Total (Overall) | 312 (62.8%) | 185 (37.2%) |
Employment Industries by Sex in Panama
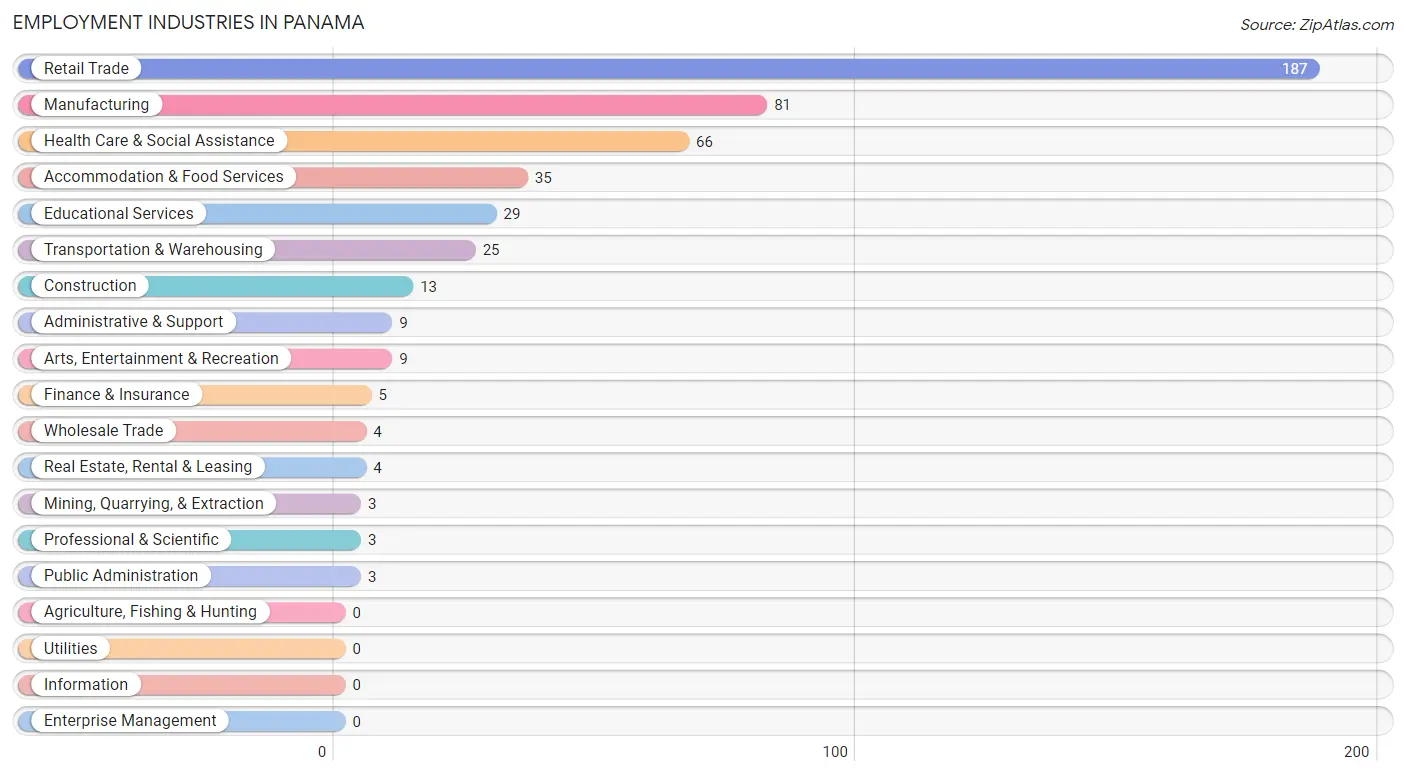
Employment Industries in Panama
The major employment industries in Panama include Retail Trade (187 | 37.6%), Manufacturing (81 | 16.3%), Health Care & Social Assistance (66 | 13.3%), Accommodation & Food Services (35 | 7.0%), and Educational Services (29 | 5.8%).
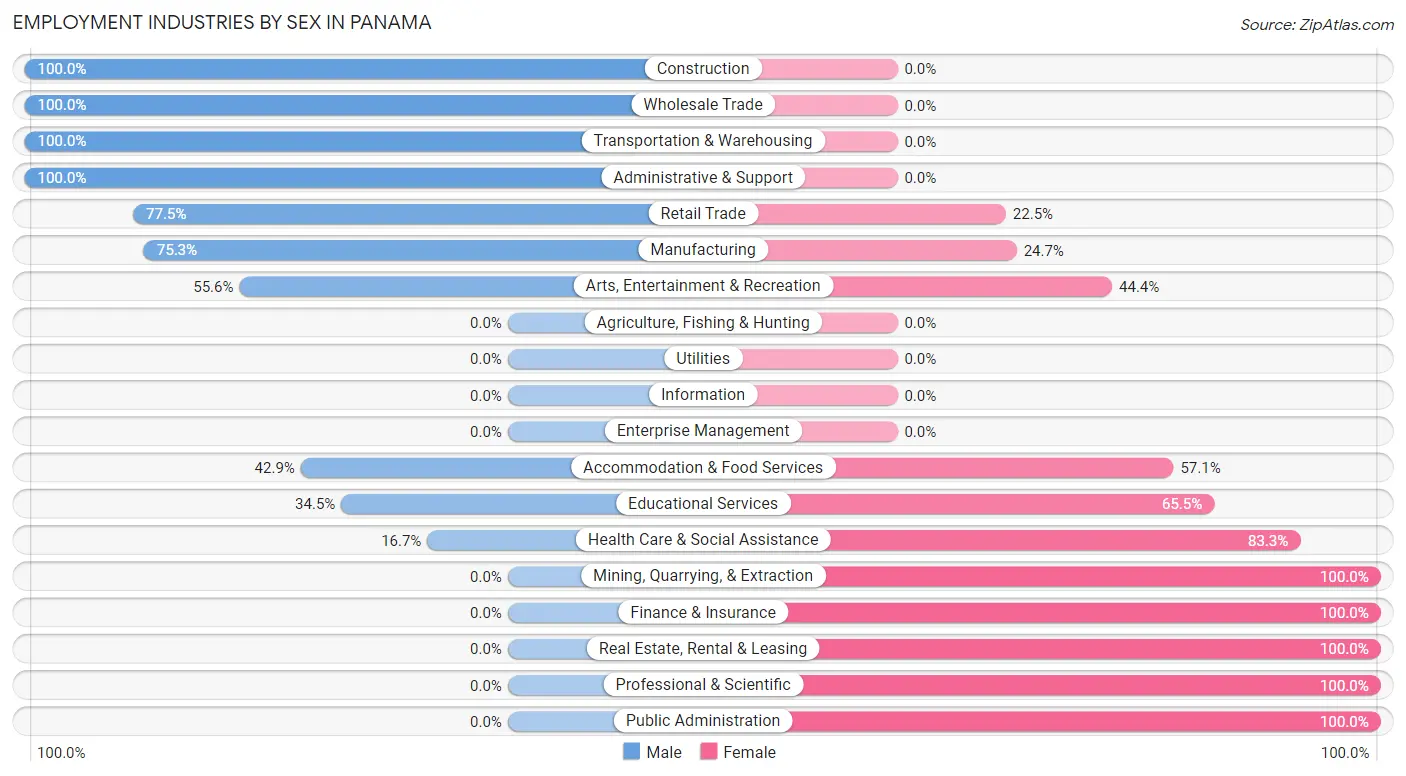
Employment Industries by Sex in Panama
The Panama industries that see more men than women are Construction (100.0%), Wholesale Trade (100.0%), and Transportation & Warehousing (100.0%), whereas the industries that tend to have a higher number of women are Mining, Quarrying, & Extraction (100.0%), Finance & Insurance (100.0%), and Real Estate, Rental & Leasing (100.0%).
| Industry | Male | Female |
| Agriculture, Fishing & Hunting | 0 (0.0%) | 0 (0.0%) |
| Mining, Quarrying, & Extraction | 0 (0.0%) | 3 (100.0%) |
| Construction | 13 (100.0%) | 0 (0.0%) |
| Manufacturing | 61 (75.3%) | 20 (24.7%) |
| Wholesale Trade | 4 (100.0%) | 0 (0.0%) |
| Retail Trade | 145 (77.5%) | 42 (22.5%) |
| Transportation & Warehousing | 25 (100.0%) | 0 (0.0%) |
| Utilities | 0 (0.0%) | 0 (0.0%) |
| Information | 0 (0.0%) | 0 (0.0%) |
| Finance & Insurance | 0 (0.0%) | 5 (100.0%) |
| Real Estate, Rental & Leasing | 0 (0.0%) | 4 (100.0%) |
| Professional & Scientific | 0 (0.0%) | 3 (100.0%) |
| Enterprise Management | 0 (0.0%) | 0 (0.0%) |
| Administrative & Support | 9 (100.0%) | 0 (0.0%) |
| Educational Services | 10 (34.5%) | 19 (65.5%) |
| Health Care & Social Assistance | 11 (16.7%) | 55 (83.3%) |
| Arts, Entertainment & Recreation | 5 (55.6%) | 4 (44.4%) |
| Accommodation & Food Services | 15 (42.9%) | 20 (57.1%) |
| Public Administration | 0 (0.0%) | 3 (100.0%) |
| Total | 312 (62.8%) | 185 (37.2%) |
Education in Panama
School Enrollment in Panama
The most common levels of schooling among the 301 students in Panama are elementary school (75 | 24.9%), high school (64 | 21.3%), and college / undergraduate (61 | 20.3%).
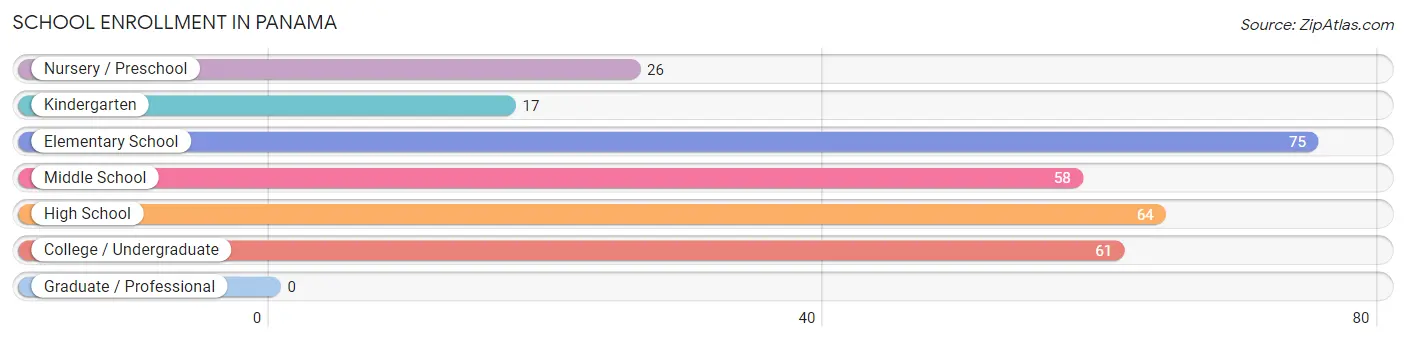
| School Level | # Students | % Students |
| Nursery / Preschool | 26 | 8.6% |
| Kindergarten | 17 | 5.7% |
| Elementary School | 75 | 24.9% |
| Middle School | 58 | 19.3% |
| High School | 64 | 21.3% |
| College / Undergraduate | 61 | 20.3% |
| Graduate / Professional | 0 | 0.0% |
| Total | 301 | 100.0% |
School Enrollment by Age by Funding Source in Panama
Out of a total of 301 students who are enrolled in schools in Panama, 5 (1.7%) attend a private institution, while the remaining 296 (98.3%) are enrolled in public schools. The age group of 15 to 17 year olds has the highest likelihood of being enrolled in private schools, with 5 (11.1% in the age bracket) enrolled. Conversely, the age group of 3 to 4 year olds has the lowest likelihood of being enrolled in a private school, with 7 (100.0% in the age bracket) attending a public institution.
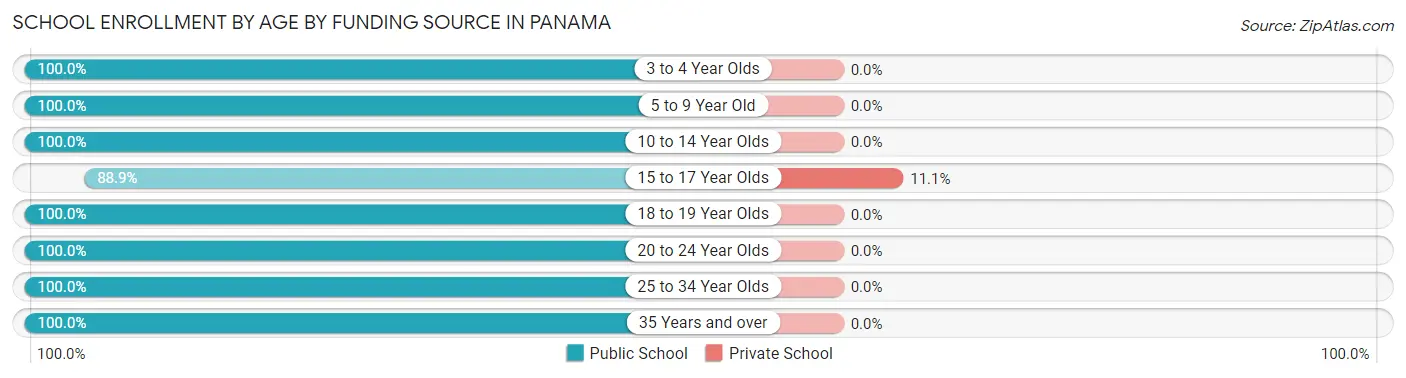
| Age Bracket | Public School | Private School |
| 3 to 4 Year Olds | 7 (100.0%) | 0 (0.0%) |
| 5 to 9 Year Old | 98 (100.0%) | 0 (0.0%) |
| 10 to 14 Year Olds | 78 (100.0%) | 0 (0.0%) |
| 15 to 17 Year Olds | 40 (88.9%) | 5 (11.1%) |
| 18 to 19 Year Olds | 16 (100.0%) | 0 (0.0%) |
| 20 to 24 Year Olds | 39 (100.0%) | 0 (0.0%) |
| 25 to 34 Year Olds | 12 (100.0%) | 0 (0.0%) |
| 35 Years and over | 6 (100.0%) | 0 (0.0%) |
| Total | 296 (98.3%) | 5 (1.7%) |
Educational Attainment by Field of Study in Panama
Education (24 | 40.0%), business (14 | 23.3%), physical & health sciences (5 | 8.3%), arts & humanities (5 | 8.3%), and computers & mathematics (3 | 5.0%) are the most common fields of study among 60 individuals in Panama who have obtained a bachelor's degree or higher.
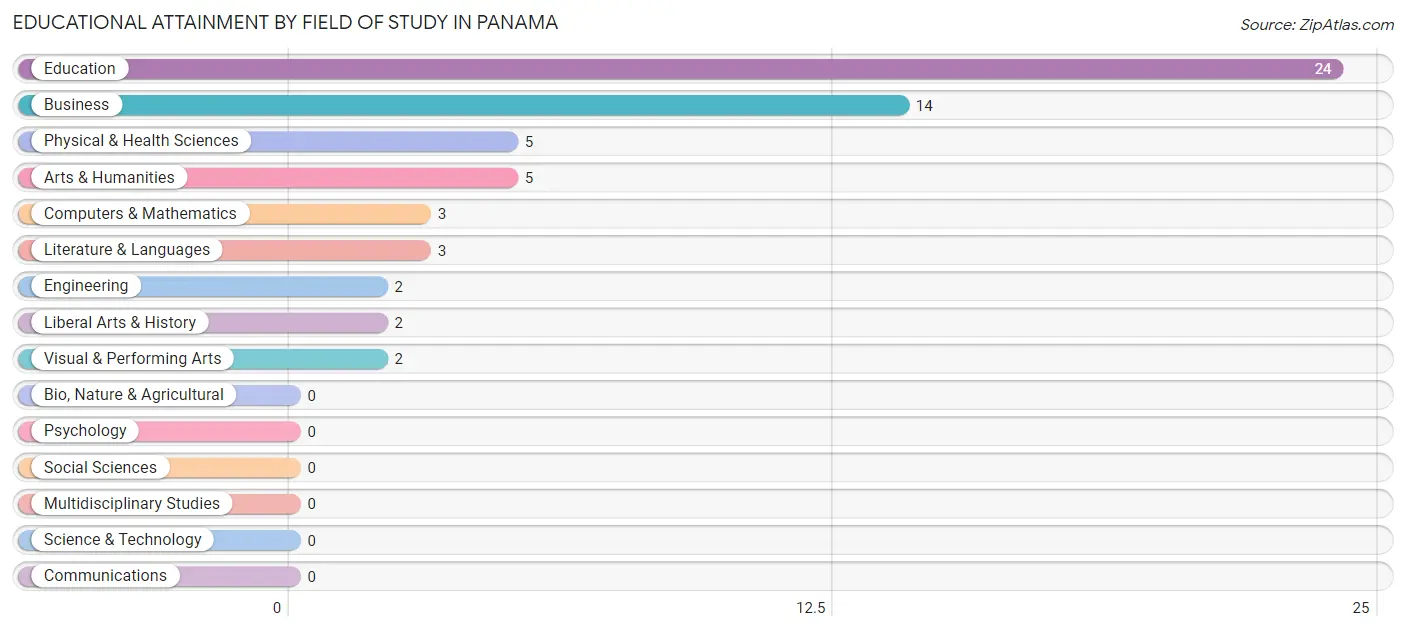
| Field of Study | # Graduates | % Graduates |
| Computers & Mathematics | 3 | 5.0% |
| Bio, Nature & Agricultural | 0 | 0.0% |
| Physical & Health Sciences | 5 | 8.3% |
| Psychology | 0 | 0.0% |
| Social Sciences | 0 | 0.0% |
| Engineering | 2 | 3.3% |
| Multidisciplinary Studies | 0 | 0.0% |
| Science & Technology | 0 | 0.0% |
| Business | 14 | 23.3% |
| Education | 24 | 40.0% |
| Literature & Languages | 3 | 5.0% |
| Liberal Arts & History | 2 | 3.3% |
| Visual & Performing Arts | 2 | 3.3% |
| Communications | 0 | 0.0% |
| Arts & Humanities | 5 | 8.3% |
| Total | 60 | 100.0% |
Transportation & Commute in Panama
Vehicle Availability by Sex in Panama
The most prevalent vehicle ownership categories in Panama are males with 2 vehicles (193, accounting for 61.9%) and females with 2 vehicles (86, making up 101.6%).
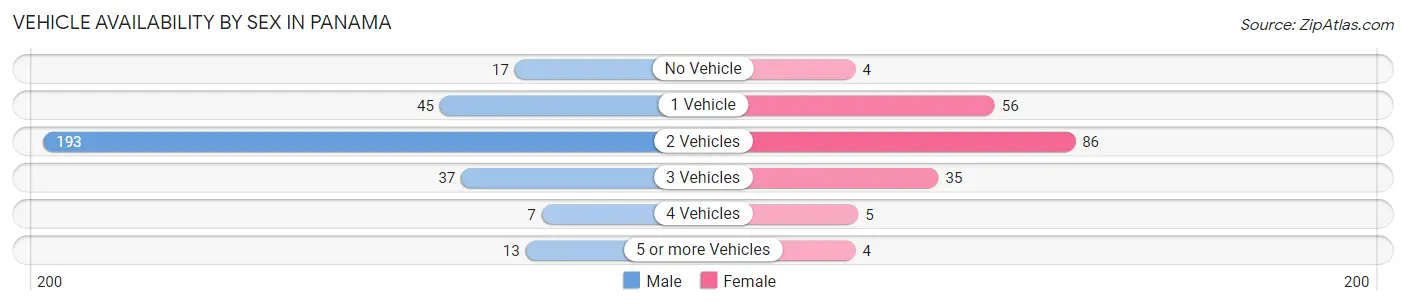
| Vehicles Available | Male | Female |
| No Vehicle | 17 (5.4%) | 4 (2.1%) |
| 1 Vehicle | 45 (14.4%) | 56 (29.5%) |
| 2 Vehicles | 193 (61.9%) | 86 (45.3%) |
| 3 Vehicles | 37 (11.9%) | 35 (18.4%) |
| 4 Vehicles | 7 (2.2%) | 5 (2.6%) |
| 5 or more Vehicles | 13 (4.2%) | 4 (2.1%) |
| Total | 312 (100.0%) | 190 (100.0%) |
Commute Time in Panama
The most frequently occuring commute durations in Panama are 15 to 19 minutes (155 commuters, 32.1%), 30 to 34 minutes (94 commuters, 19.5%), and 10 to 14 minutes (56 commuters, 11.6%).
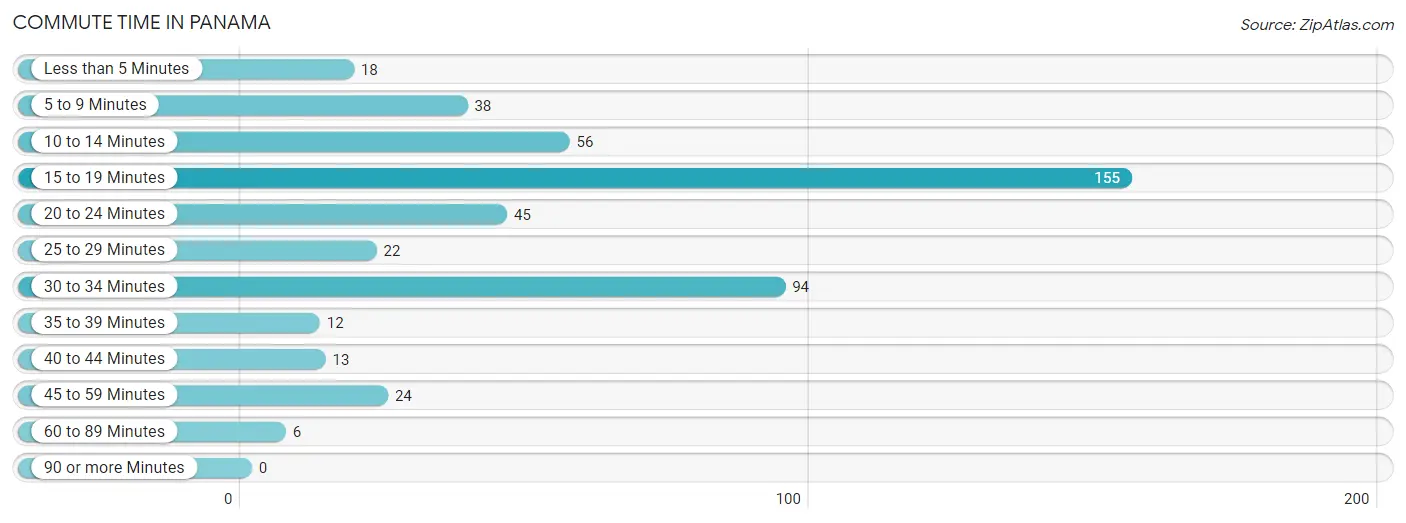
| Commute Time | # Commuters | % Commuters |
| Less than 5 Minutes | 18 | 3.7% |
| 5 to 9 Minutes | 38 | 7.9% |
| 10 to 14 Minutes | 56 | 11.6% |
| 15 to 19 Minutes | 155 | 32.1% |
| 20 to 24 Minutes | 45 | 9.3% |
| 25 to 29 Minutes | 22 | 4.5% |
| 30 to 34 Minutes | 94 | 19.5% |
| 35 to 39 Minutes | 12 | 2.5% |
| 40 to 44 Minutes | 13 | 2.7% |
| 45 to 59 Minutes | 24 | 5.0% |
| 60 to 89 Minutes | 6 | 1.2% |
| 90 or more Minutes | 0 | 0.0% |
Commute Time by Sex in Panama
The most common commute times in Panama are 15 to 19 minutes (131 commuters, 43.1%) for males and 30 to 34 minutes (37 commuters, 20.7%) for females.
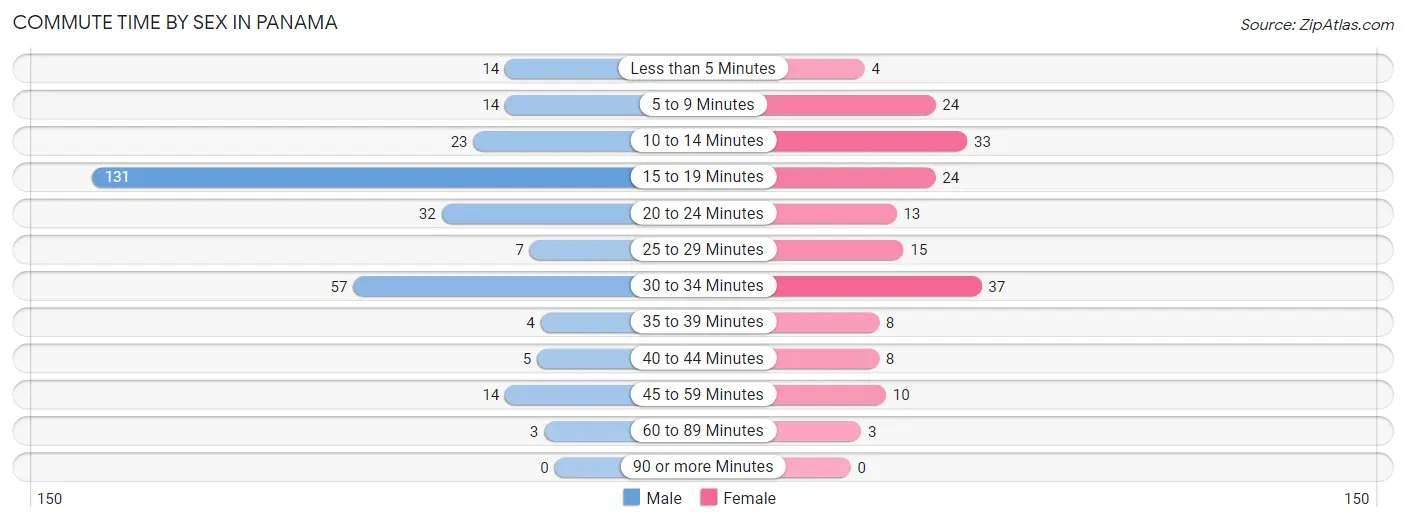
| Commute Time | Male | Female |
| Less than 5 Minutes | 14 (4.6%) | 4 (2.2%) |
| 5 to 9 Minutes | 14 (4.6%) | 24 (13.4%) |
| 10 to 14 Minutes | 23 (7.6%) | 33 (18.4%) |
| 15 to 19 Minutes | 131 (43.1%) | 24 (13.4%) |
| 20 to 24 Minutes | 32 (10.5%) | 13 (7.3%) |
| 25 to 29 Minutes | 7 (2.3%) | 15 (8.4%) |
| 30 to 34 Minutes | 57 (18.8%) | 37 (20.7%) |
| 35 to 39 Minutes | 4 (1.3%) | 8 (4.5%) |
| 40 to 44 Minutes | 5 (1.6%) | 8 (4.5%) |
| 45 to 59 Minutes | 14 (4.6%) | 10 (5.6%) |
| 60 to 89 Minutes | 3 (1.0%) | 3 (1.7%) |
| 90 or more Minutes | 0 (0.0%) | 0 (0.0%) |
Time of Departure to Work by Sex in Panama
The most frequent times of departure to work in Panama are 7:30 AM to 7:59 AM (124, 40.8%) for males and 7:00 AM to 7:29 AM (46, 25.7%) for females.
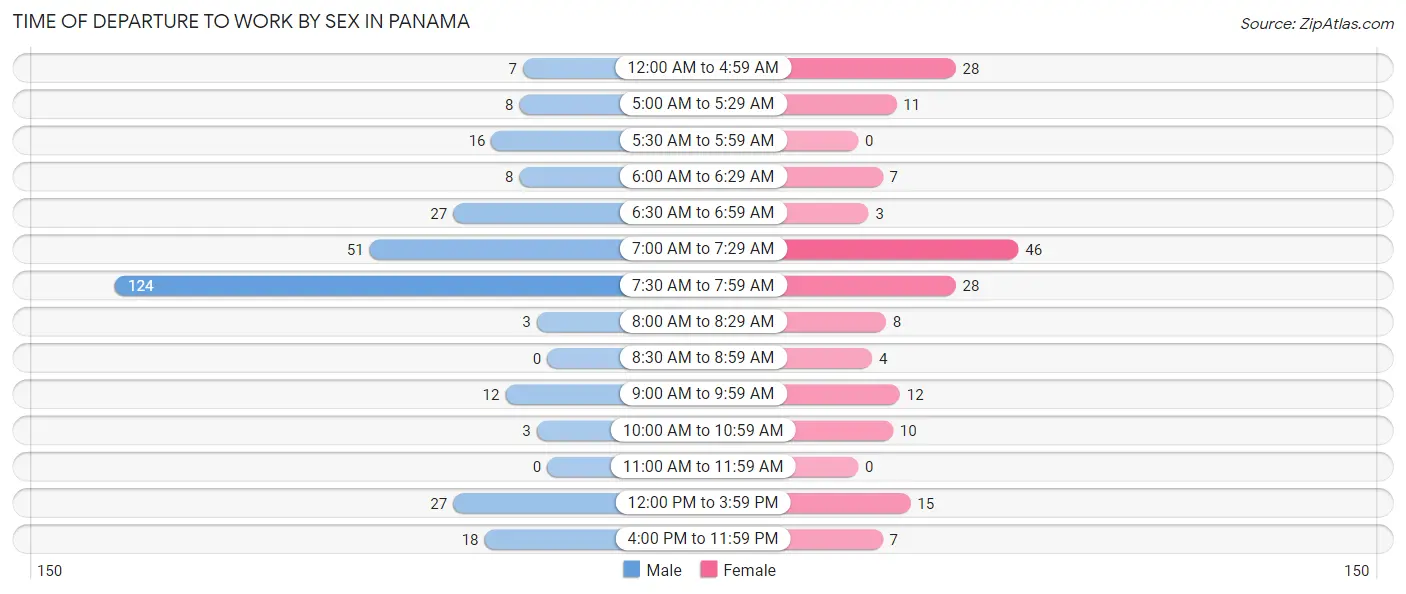
| Time of Departure | Male | Female |
| 12:00 AM to 4:59 AM | 7 (2.3%) | 28 (15.6%) |
| 5:00 AM to 5:29 AM | 8 (2.6%) | 11 (6.1%) |
| 5:30 AM to 5:59 AM | 16 (5.3%) | 0 (0.0%) |
| 6:00 AM to 6:29 AM | 8 (2.6%) | 7 (3.9%) |
| 6:30 AM to 6:59 AM | 27 (8.9%) | 3 (1.7%) |
| 7:00 AM to 7:29 AM | 51 (16.8%) | 46 (25.7%) |
| 7:30 AM to 7:59 AM | 124 (40.8%) | 28 (15.6%) |
| 8:00 AM to 8:29 AM | 3 (1.0%) | 8 (4.5%) |
| 8:30 AM to 8:59 AM | 0 (0.0%) | 4 (2.2%) |
| 9:00 AM to 9:59 AM | 12 (4.0%) | 12 (6.7%) |
| 10:00 AM to 10:59 AM | 3 (1.0%) | 10 (5.6%) |
| 11:00 AM to 11:59 AM | 0 (0.0%) | 0 (0.0%) |
| 12:00 PM to 3:59 PM | 27 (8.9%) | 15 (8.4%) |
| 4:00 PM to 11:59 PM | 18 (5.9%) | 7 (3.9%) |
| Total | 304 (100.0%) | 179 (100.0%) |
Housing Occupancy in Panama
Occupancy by Ownership in Panama
Of the total 526 dwellings in Panama, owner-occupied units account for 319 (60.7%), while renter-occupied units make up 207 (39.4%).
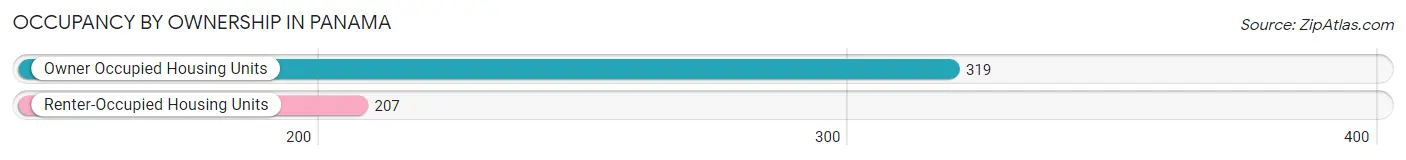
| Occupancy | # Housing Units | % Housing Units |
| Owner Occupied Housing Units | 319 | 60.7% |
| Renter-Occupied Housing Units | 207 | 39.4% |
| Total Occupied Housing Units | 526 | 100.0% |
Occupancy by Household Size in Panama
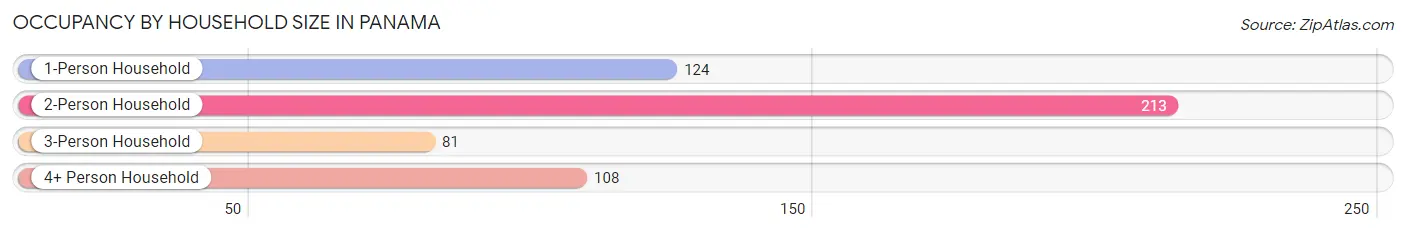
| Household Size | # Housing Units | % Housing Units |
| 1-Person Household | 124 | 23.6% |
| 2-Person Household | 213 | 40.5% |
| 3-Person Household | 81 | 15.4% |
| 4+ Person Household | 108 | 20.5% |
| Total Housing Units | 526 | 100.0% |
Occupancy by Ownership by Household Size in Panama
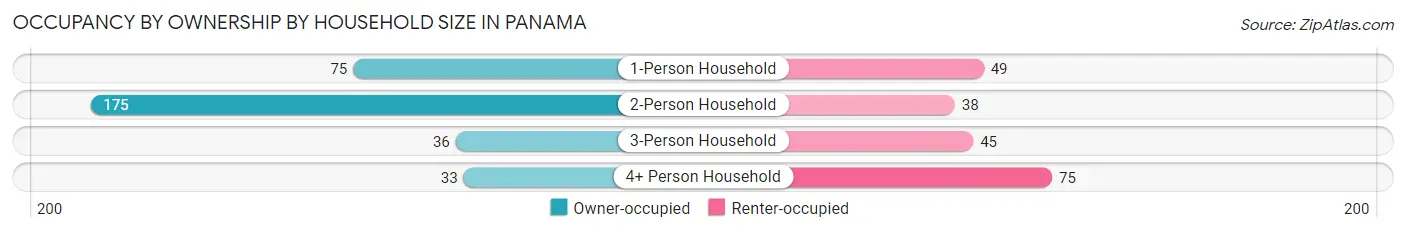
| Household Size | Owner-occupied | Renter-occupied |
| 1-Person Household | 75 (60.5%) | 49 (39.5%) |
| 2-Person Household | 175 (82.2%) | 38 (17.8%) |
| 3-Person Household | 36 (44.4%) | 45 (55.6%) |
| 4+ Person Household | 33 (30.6%) | 75 (69.4%) |
| Total Housing Units | 319 (60.7%) | 207 (39.4%) |
Occupancy by Educational Attainment in Panama
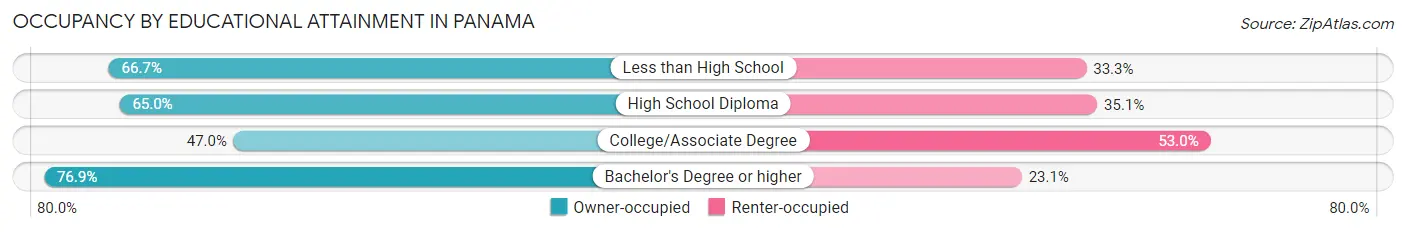
| Household Size | Owner-occupied | Renter-occupied |
| Less than High School | 40 (66.7%) | 20 (33.3%) |
| High School Diploma | 189 (64.9%) | 102 (35.0%) |
| College/Associate Degree | 70 (47.0%) | 79 (53.0%) |
| Bachelor's Degree or higher | 20 (76.9%) | 6 (23.1%) |
Occupancy by Age of Householder in Panama
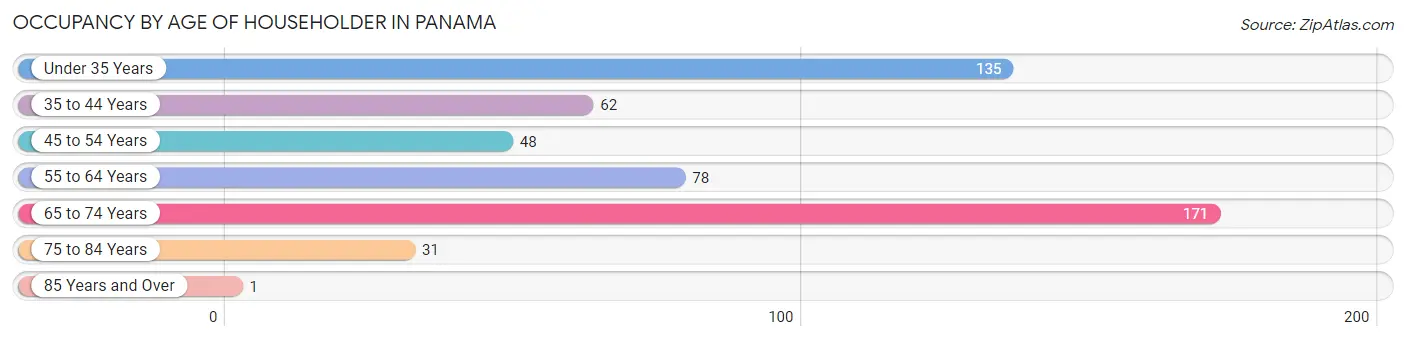
| Age Bracket | # Households | % Households |
| Under 35 Years | 135 | 25.7% |
| 35 to 44 Years | 62 | 11.8% |
| 45 to 54 Years | 48 | 9.1% |
| 55 to 64 Years | 78 | 14.8% |
| 65 to 74 Years | 171 | 32.5% |
| 75 to 84 Years | 31 | 5.9% |
| 85 Years and Over | 1 | 0.2% |
| Total | 526 | 100.0% |
Housing Finances in Panama
Median Income by Occupancy in Panama
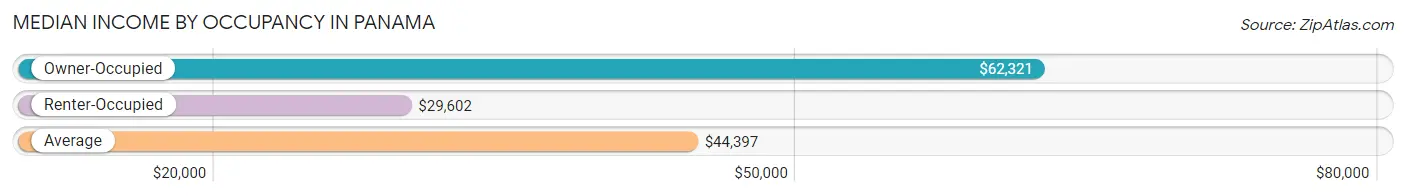
| Occupancy Type | # Households | Median Income |
| Owner-Occupied | 319 (60.7%) | $62,321 |
| Renter-Occupied | 207 (39.4%) | $29,602 |
| Average | 526 (100.0%) | $44,397 |
Occupancy by Householder Income Bracket in Panama
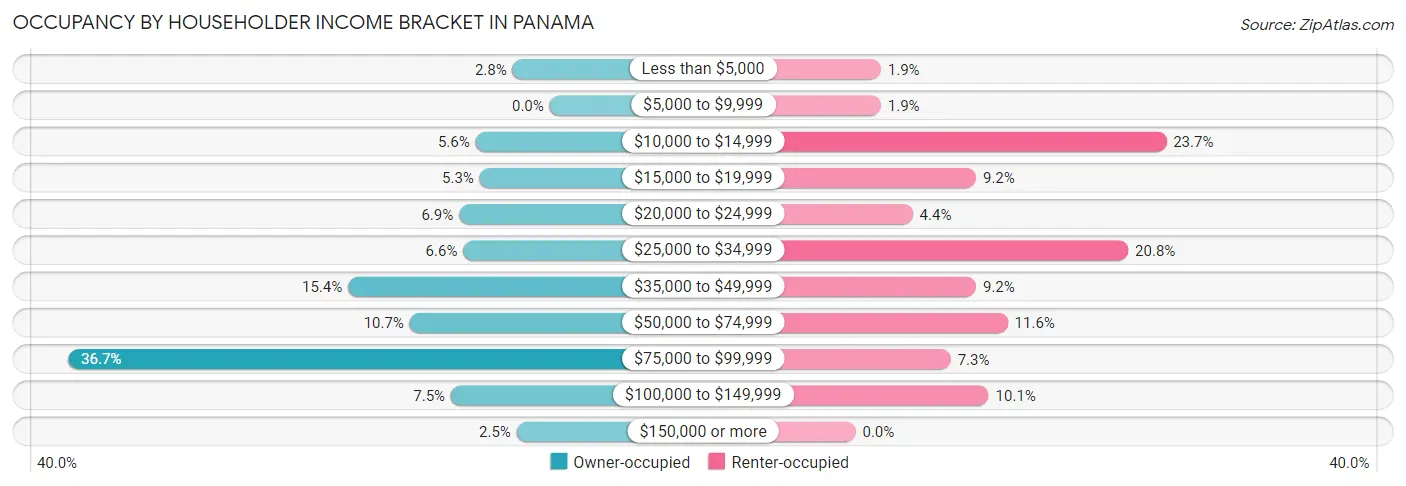
| Income Bracket | Owner-occupied | Renter-occupied |
| Less than $5,000 | 9 (2.8%) | 4 (1.9%) |
| $5,000 to $9,999 | 0 (0.0%) | 4 (1.9%) |
| $10,000 to $14,999 | 18 (5.6%) | 49 (23.7%) |
| $15,000 to $19,999 | 17 (5.3%) | 19 (9.2%) |
| $20,000 to $24,999 | 22 (6.9%) | 9 (4.3%) |
| $25,000 to $34,999 | 21 (6.6%) | 43 (20.8%) |
| $35,000 to $49,999 | 49 (15.4%) | 19 (9.2%) |
| $50,000 to $74,999 | 34 (10.7%) | 24 (11.6%) |
| $75,000 to $99,999 | 117 (36.7%) | 15 (7.2%) |
| $100,000 to $149,999 | 24 (7.5%) | 21 (10.1%) |
| $150,000 or more | 8 (2.5%) | 0 (0.0%) |
| Total | 319 (100.0%) | 207 (100.0%) |
Monthly Housing Cost Tiers in Panama
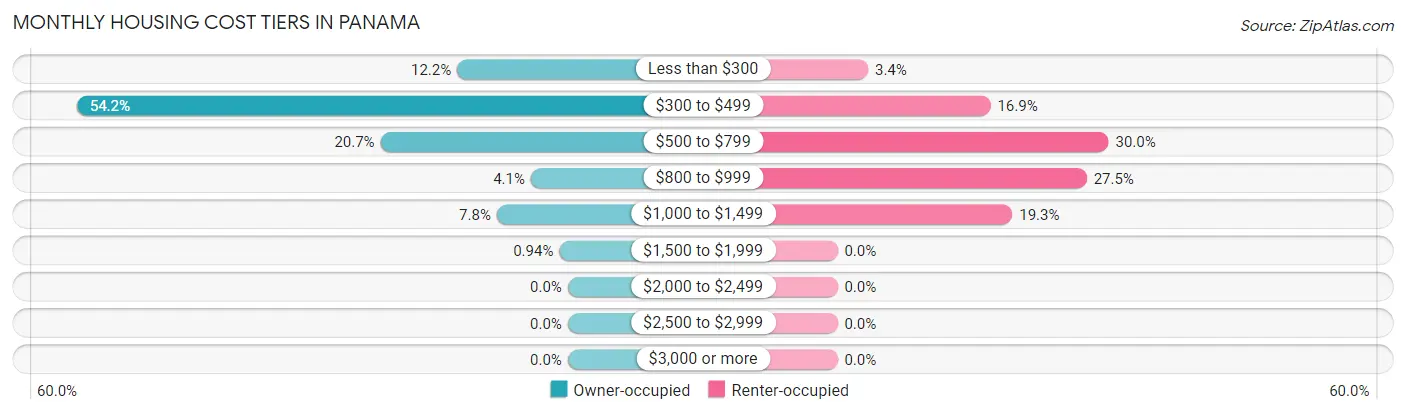
| Monthly Cost | Owner-occupied | Renter-occupied |
| Less than $300 | 39 (12.2%) | 7 (3.4%) |
| $300 to $499 | 173 (54.2%) | 35 (16.9%) |
| $500 to $799 | 66 (20.7%) | 62 (29.9%) |
| $800 to $999 | 13 (4.1%) | 57 (27.5%) |
| $1,000 to $1,499 | 25 (7.8%) | 40 (19.3%) |
| $1,500 to $1,999 | 3 (0.9%) | 0 (0.0%) |
| $2,000 to $2,499 | 0 (0.0%) | 0 (0.0%) |
| $2,500 to $2,999 | 0 (0.0%) | 0 (0.0%) |
| $3,000 or more | 0 (0.0%) | 0 (0.0%) |
| Total | 319 (100.0%) | 207 (100.0%) |
Physical Housing Characteristics in Panama
Housing Structures in Panama
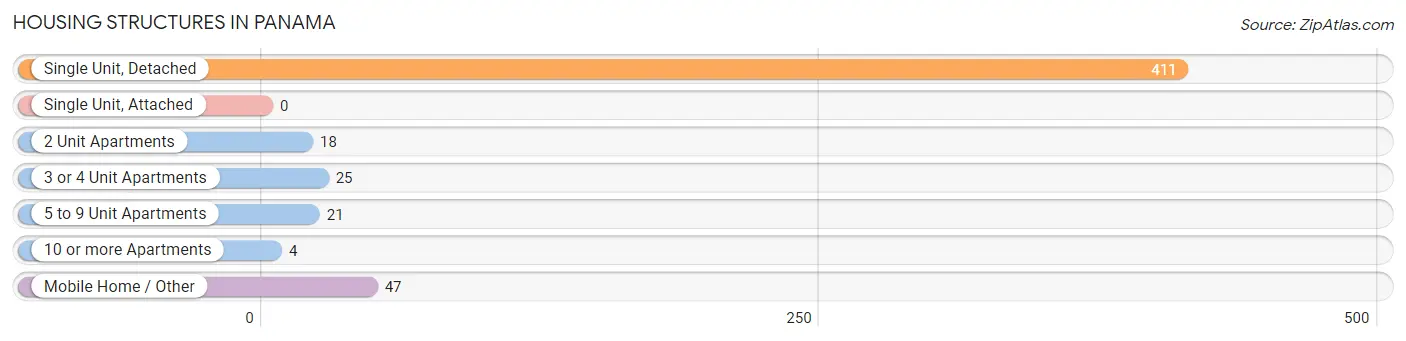
| Structure Type | # Housing Units | % Housing Units |
| Single Unit, Detached | 411 | 78.1% |
| Single Unit, Attached | 0 | 0.0% |
| 2 Unit Apartments | 18 | 3.4% |
| 3 or 4 Unit Apartments | 25 | 4.8% |
| 5 to 9 Unit Apartments | 21 | 4.0% |
| 10 or more Apartments | 4 | 0.8% |
| Mobile Home / Other | 47 | 8.9% |
| Total | 526 | 100.0% |
Housing Structures by Occupancy in Panama
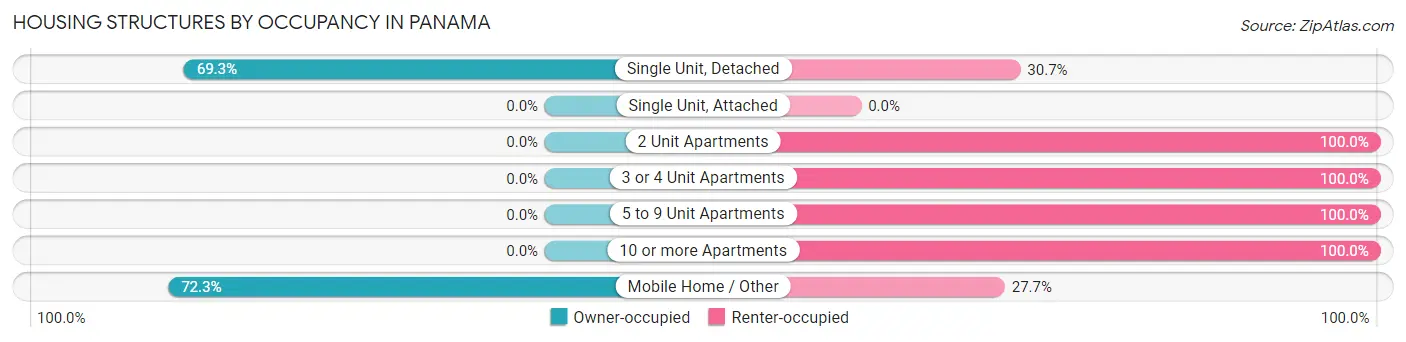
| Structure Type | Owner-occupied | Renter-occupied |
| Single Unit, Detached | 285 (69.3%) | 126 (30.7%) |
| Single Unit, Attached | 0 (0.0%) | 0 (0.0%) |
| 2 Unit Apartments | 0 (0.0%) | 18 (100.0%) |
| 3 or 4 Unit Apartments | 0 (0.0%) | 25 (100.0%) |
| 5 to 9 Unit Apartments | 0 (0.0%) | 21 (100.0%) |
| 10 or more Apartments | 0 (0.0%) | 4 (100.0%) |
| Mobile Home / Other | 34 (72.3%) | 13 (27.7%) |
| Total | 319 (60.7%) | 207 (39.4%) |
Housing Structures by Number of Rooms in Panama
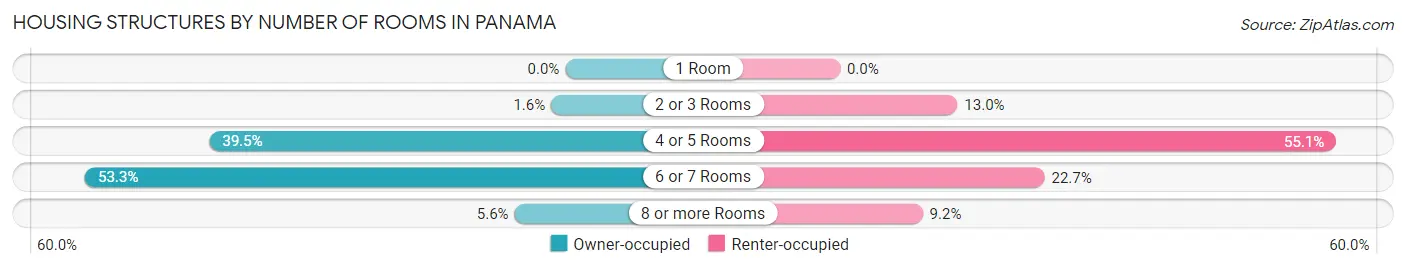
| Number of Rooms | Owner-occupied | Renter-occupied |
| 1 Room | 0 (0.0%) | 0 (0.0%) |
| 2 or 3 Rooms | 5 (1.6%) | 27 (13.0%) |
| 4 or 5 Rooms | 126 (39.5%) | 114 (55.1%) |
| 6 or 7 Rooms | 170 (53.3%) | 47 (22.7%) |
| 8 or more Rooms | 18 (5.6%) | 19 (9.2%) |
| Total | 319 (100.0%) | 207 (100.0%) |
Housing Structure by Heating Type in Panama
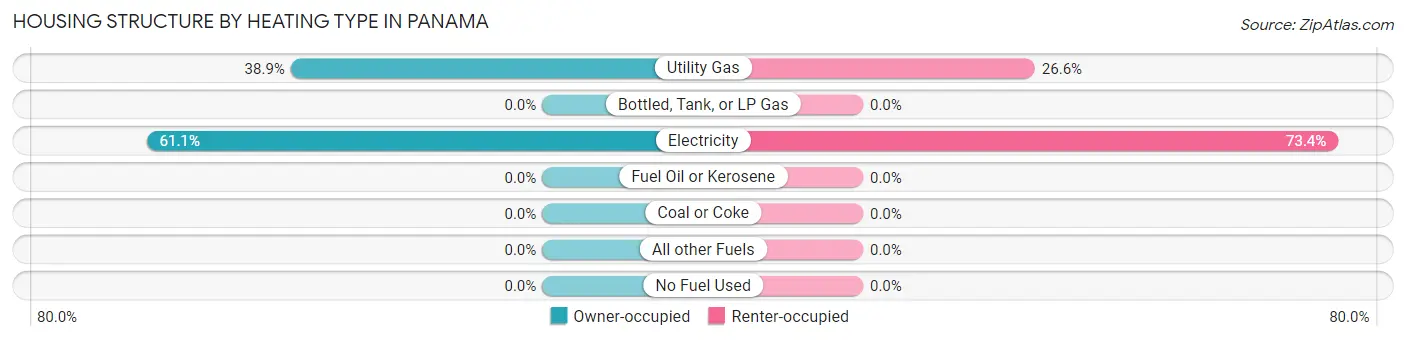
| Heating Type | Owner-occupied | Renter-occupied |
| Utility Gas | 124 (38.9%) | 55 (26.6%) |
| Bottled, Tank, or LP Gas | 0 (0.0%) | 0 (0.0%) |
| Electricity | 195 (61.1%) | 152 (73.4%) |
| Fuel Oil or Kerosene | 0 (0.0%) | 0 (0.0%) |
| Coal or Coke | 0 (0.0%) | 0 (0.0%) |
| All other Fuels | 0 (0.0%) | 0 (0.0%) |
| No Fuel Used | 0 (0.0%) | 0 (0.0%) |
| Total | 319 (100.0%) | 207 (100.0%) |
Household Vehicle Usage in Panama
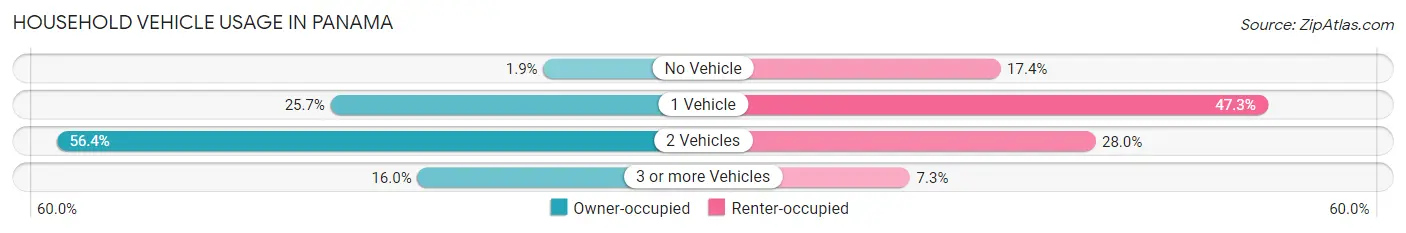
| Vehicles per Household | Owner-occupied | Renter-occupied |
| No Vehicle | 6 (1.9%) | 36 (17.4%) |
| 1 Vehicle | 82 (25.7%) | 98 (47.3%) |
| 2 Vehicles | 180 (56.4%) | 58 (28.0%) |
| 3 or more Vehicles | 51 (16.0%) | 15 (7.2%) |
| Total | 319 (100.0%) | 207 (100.0%) |
Real Estate & Mortgages in Panama
Real Estate and Mortgage Overview in Panama
| Characteristic | Without Mortgage | With Mortgage |
| Housing Units | 236 | 83 |
| Median Property Value | $120,500 | $92,100 |
| Median Household Income | $75,000 | $0 |
| Monthly Housing Costs | $424 | $0 |
| Real Estate Taxes | $963 | $0 |
Property Value by Mortgage Status in Panama
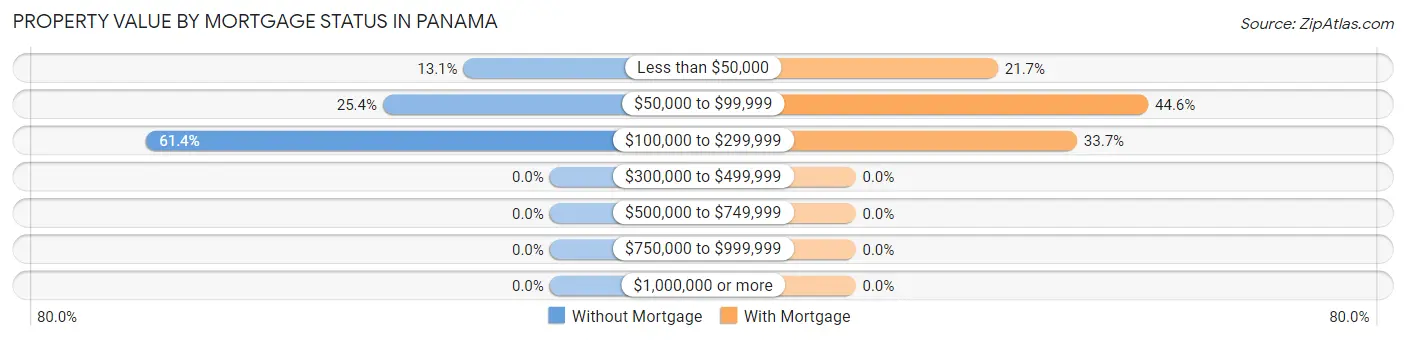
| Property Value | Without Mortgage | With Mortgage |
| Less than $50,000 | 31 (13.1%) | 18 (21.7%) |
| $50,000 to $99,999 | 60 (25.4%) | 37 (44.6%) |
| $100,000 to $299,999 | 145 (61.4%) | 28 (33.7%) |
| $300,000 to $499,999 | 0 (0.0%) | 0 (0.0%) |
| $500,000 to $749,999 | 0 (0.0%) | 0 (0.0%) |
| $750,000 to $999,999 | 0 (0.0%) | 0 (0.0%) |
| $1,000,000 or more | 0 (0.0%) | 0 (0.0%) |
| Total | 236 (100.0%) | 83 (100.0%) |
Household Income by Mortgage Status in Panama
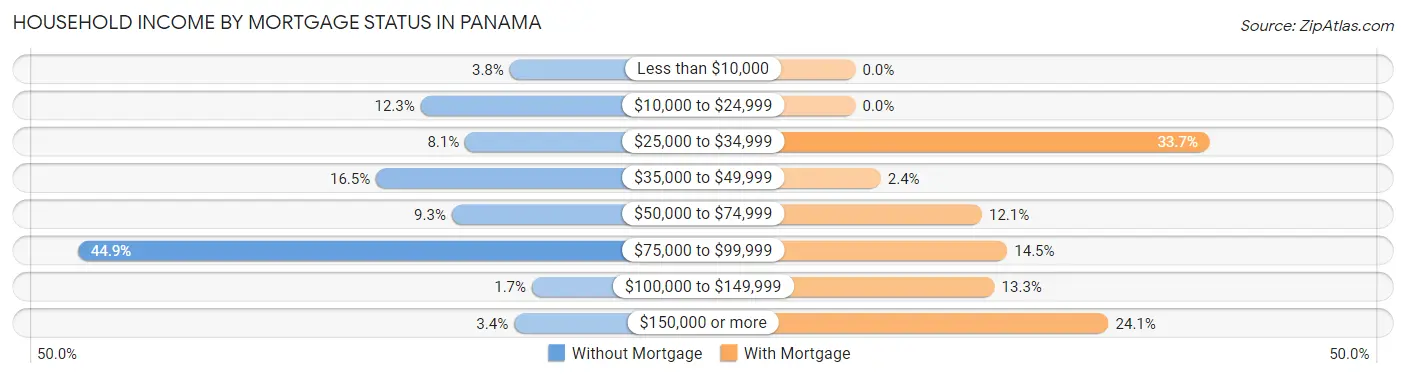
| Household Income | Without Mortgage | With Mortgage |
| Less than $10,000 | 9 (3.8%) | 0 (0.0%) |
| $10,000 to $24,999 | 29 (12.3%) | 0 (0.0%) |
| $25,000 to $34,999 | 19 (8.1%) | 28 (33.7%) |
| $35,000 to $49,999 | 39 (16.5%) | 2 (2.4%) |
| $50,000 to $74,999 | 22 (9.3%) | 10 (12.0%) |
| $75,000 to $99,999 | 106 (44.9%) | 12 (14.5%) |
| $100,000 to $149,999 | 4 (1.7%) | 11 (13.3%) |
| $150,000 or more | 8 (3.4%) | 20 (24.1%) |
| Total | 236 (100.0%) | 83 (100.0%) |
Property Value to Household Income Ratio in Panama
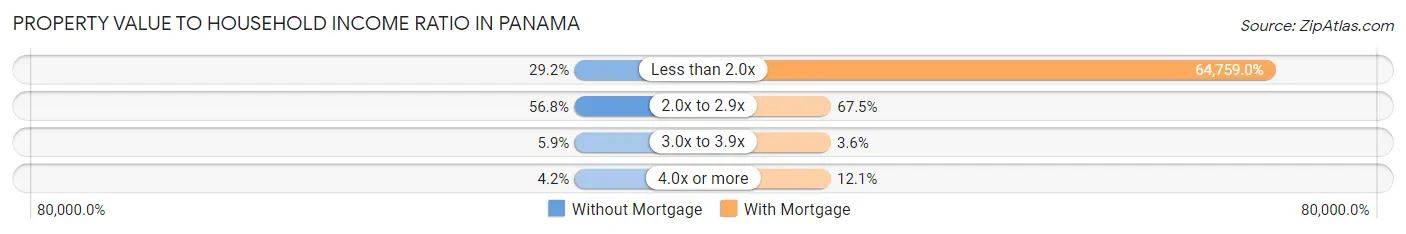
| Value-to-Income Ratio | Without Mortgage | With Mortgage |
| Less than 2.0x | 69 (29.2%) | 53,750 (64,759.0%) |
| 2.0x to 2.9x | 134 (56.8%) | 56 (67.5%) |
| 3.0x to 3.9x | 14 (5.9%) | 3 (3.6%) |
| 4.0x or more | 10 (4.2%) | 10 (12.0%) |
| Total | 236 (100.0%) | 83 (100.0%) |
Real Estate Taxes by Mortgage Status in Panama
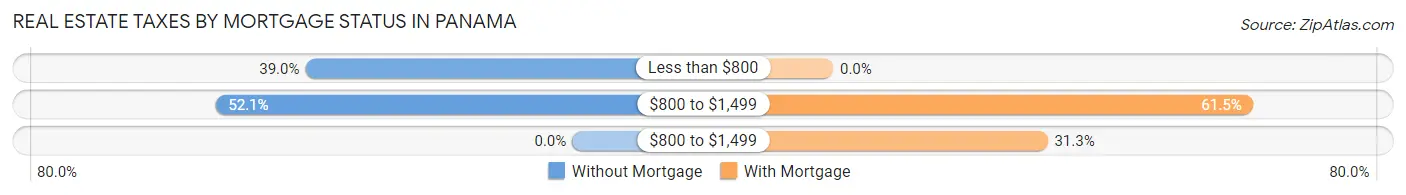
| Property Taxes | Without Mortgage | With Mortgage |
| Less than $800 | 92 (39.0%) | 0 (0.0%) |
| $800 to $1,499 | 123 (52.1%) | 51 (61.5%) |
| $800 to $1,499 | 0 (0.0%) | 26 (31.3%) |
| Total | 236 (100.0%) | 83 (100.0%) |
Health & Disability in Panama
Health Insurance Coverage by Age in Panama
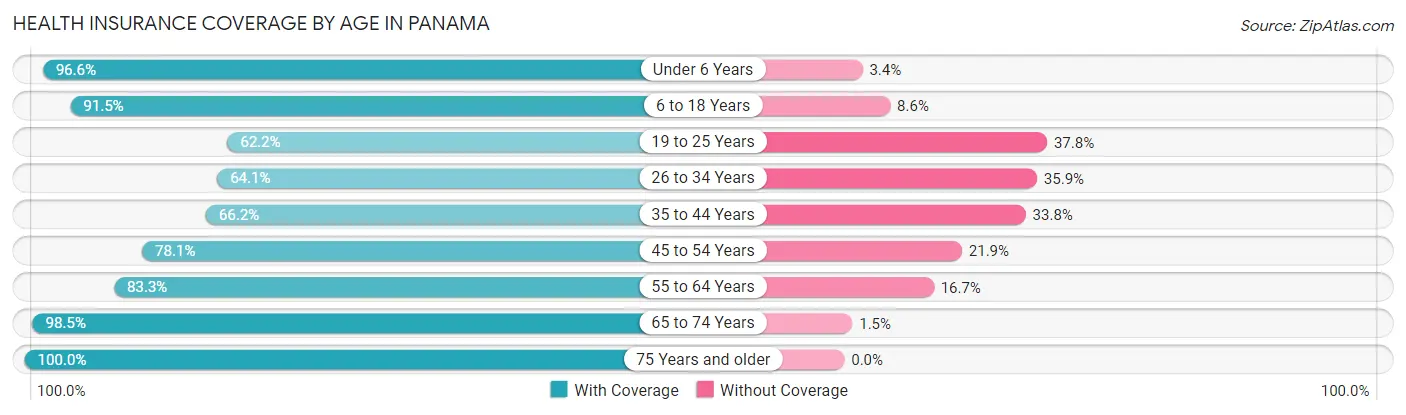
| Age Bracket | With Coverage | Without Coverage |
| Under 6 Years | 171 (96.6%) | 6 (3.4%) |
| 6 to 18 Years | 214 (91.4%) | 20 (8.6%) |
| 19 to 25 Years | 79 (62.2%) | 48 (37.8%) |
| 26 to 34 Years | 91 (64.1%) | 51 (35.9%) |
| 35 to 44 Years | 90 (66.2%) | 46 (33.8%) |
| 45 to 54 Years | 57 (78.1%) | 16 (21.9%) |
| 55 to 64 Years | 95 (83.3%) | 19 (16.7%) |
| 65 to 74 Years | 199 (98.5%) | 3 (1.5%) |
| 75 Years and older | 65 (100.0%) | 0 (0.0%) |
| Total | 1,061 (83.5%) | 209 (16.5%) |
Health Insurance Coverage by Citizenship Status in Panama
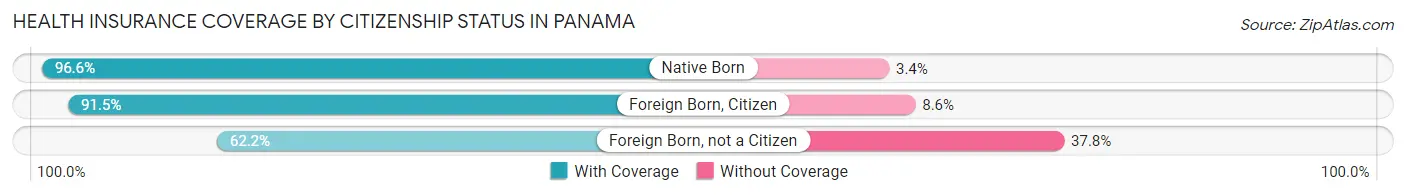
| Citizenship Status | With Coverage | Without Coverage |
| Native Born | 171 (96.6%) | 6 (3.4%) |
| Foreign Born, Citizen | 214 (91.4%) | 20 (8.6%) |
| Foreign Born, not a Citizen | 79 (62.2%) | 48 (37.8%) |
Health Insurance Coverage by Household Income in Panama
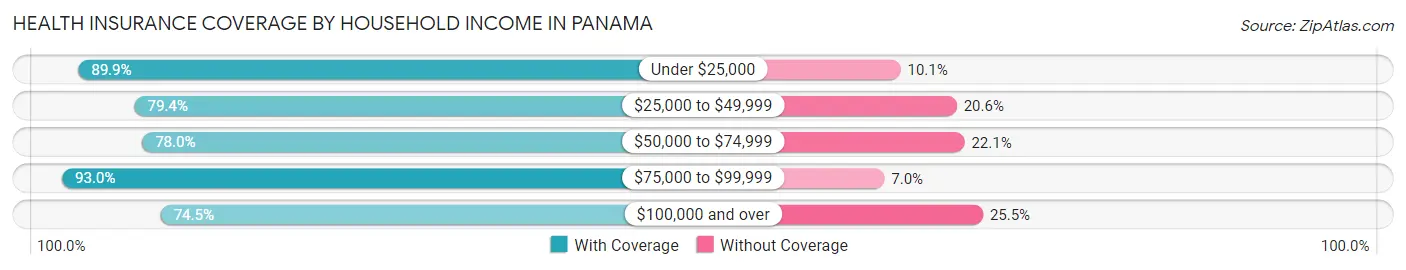
| Household Income | With Coverage | Without Coverage |
| Under $25,000 | 259 (89.9%) | 29 (10.1%) |
| $25,000 to $49,999 | 266 (79.4%) | 69 (20.6%) |
| $50,000 to $74,999 | 152 (77.9%) | 43 (22.1%) |
| $75,000 to $99,999 | 238 (93.0%) | 18 (7.0%) |
| $100,000 and over | 146 (74.5%) | 50 (25.5%) |
Public vs Private Health Insurance Coverage by Age in Panama
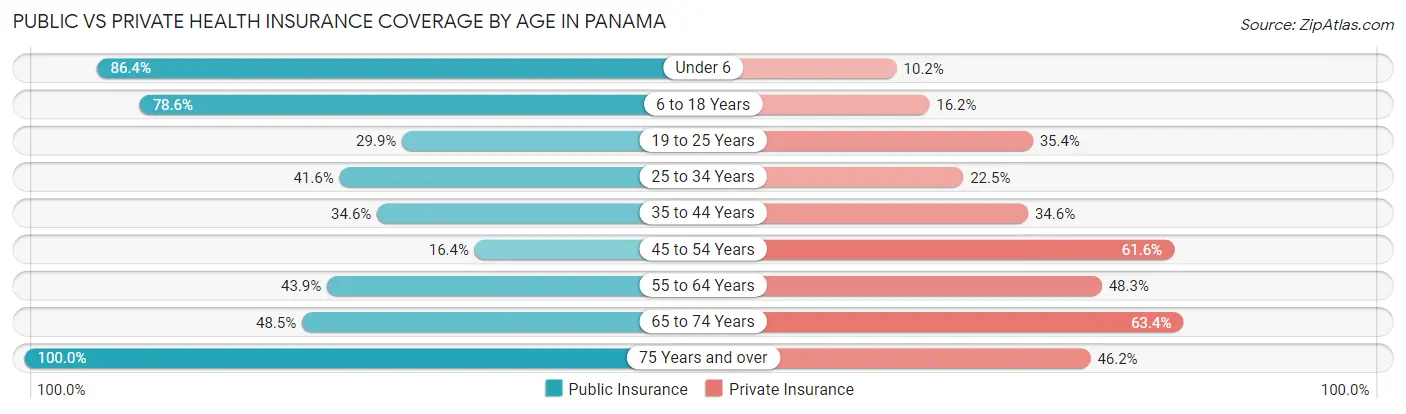
| Age Bracket | Public Insurance | Private Insurance |
| Under 6 | 153 (86.4%) | 18 (10.2%) |
| 6 to 18 Years | 184 (78.6%) | 38 (16.2%) |
| 19 to 25 Years | 38 (29.9%) | 45 (35.4%) |
| 25 to 34 Years | 59 (41.5%) | 32 (22.5%) |
| 35 to 44 Years | 47 (34.6%) | 47 (34.6%) |
| 45 to 54 Years | 12 (16.4%) | 45 (61.6%) |
| 55 to 64 Years | 50 (43.9%) | 55 (48.2%) |
| 65 to 74 Years | 98 (48.5%) | 128 (63.4%) |
| 75 Years and over | 65 (100.0%) | 30 (46.2%) |
| Total | 706 (55.6%) | 438 (34.5%) |
Disability Status by Sex by Age in Panama
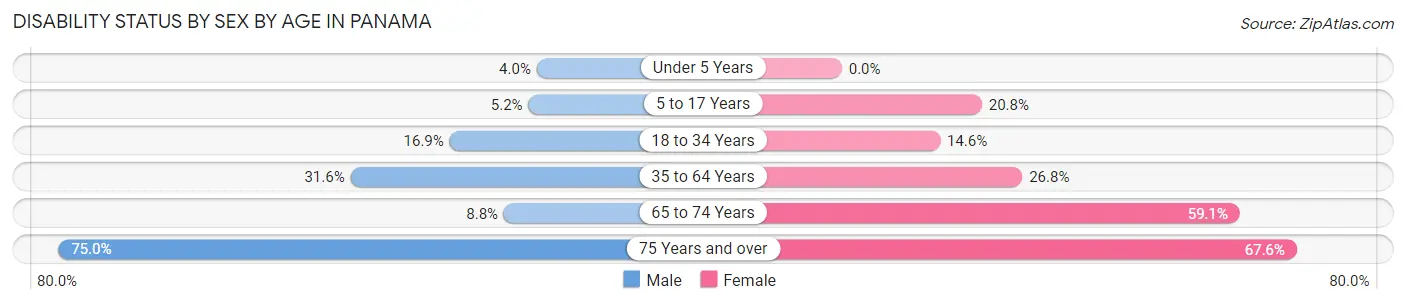
| Age Bracket | Male | Female |
| Under 5 Years | 3 (4.0%) | 0 (0.0%) |
| 5 to 17 Years | 7 (5.2%) | 21 (20.8%) |
| 18 to 34 Years | 25 (16.9%) | 21 (14.6%) |
| 35 to 64 Years | 49 (31.6%) | 45 (26.8%) |
| 65 to 74 Years | 12 (8.8%) | 39 (59.1%) |
| 75 Years and over | 21 (75.0%) | 25 (67.6%) |
Disability Class by Sex by Age in Panama
Disability Class: Hearing Difficulty
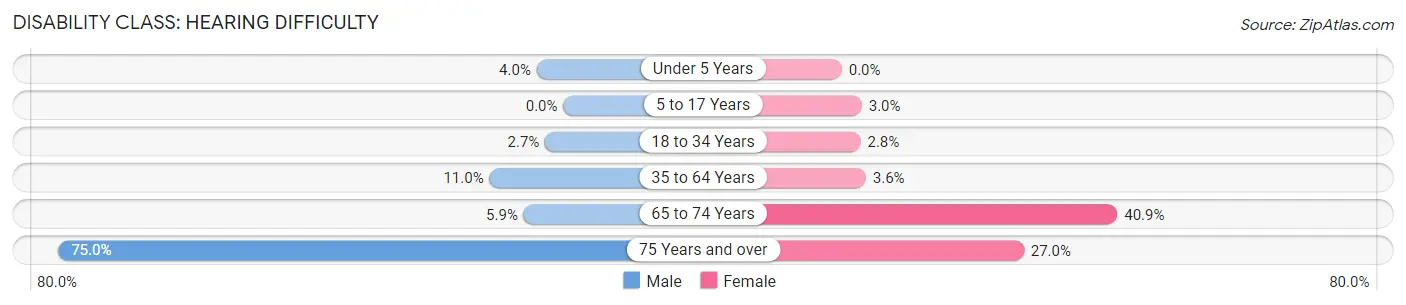
| Age Bracket | Male | Female |
| Under 5 Years | 3 (4.0%) | 0 (0.0%) |
| 5 to 17 Years | 0 (0.0%) | 3 (3.0%) |
| 18 to 34 Years | 4 (2.7%) | 4 (2.8%) |
| 35 to 64 Years | 17 (11.0%) | 6 (3.6%) |
| 65 to 74 Years | 8 (5.9%) | 27 (40.9%) |
| 75 Years and over | 21 (75.0%) | 10 (27.0%) |
Disability Class: Vision Difficulty
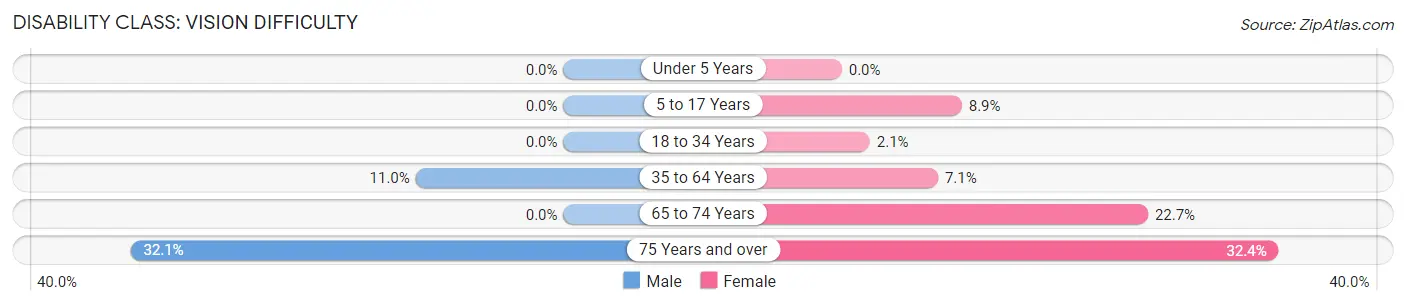
| Age Bracket | Male | Female |
| Under 5 Years | 0 (0.0%) | 0 (0.0%) |
| 5 to 17 Years | 0 (0.0%) | 9 (8.9%) |
| 18 to 34 Years | 0 (0.0%) | 3 (2.1%) |
| 35 to 64 Years | 17 (11.0%) | 12 (7.1%) |
| 65 to 74 Years | 0 (0.0%) | 15 (22.7%) |
| 75 Years and over | 9 (32.1%) | 12 (32.4%) |
Disability Class: Cognitive Difficulty
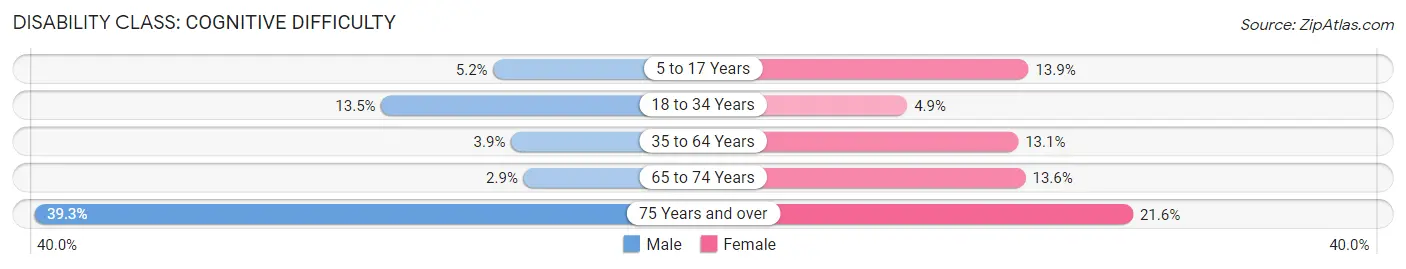
| Age Bracket | Male | Female |
| 5 to 17 Years | 7 (5.2%) | 14 (13.9%) |
| 18 to 34 Years | 20 (13.5%) | 7 (4.9%) |
| 35 to 64 Years | 6 (3.9%) | 22 (13.1%) |
| 65 to 74 Years | 4 (2.9%) | 9 (13.6%) |
| 75 Years and over | 11 (39.3%) | 8 (21.6%) |
Disability Class: Ambulatory Difficulty
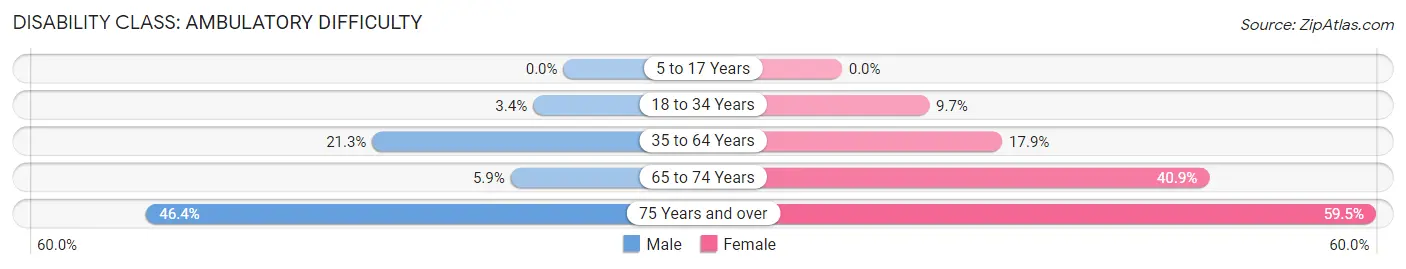
| Age Bracket | Male | Female |
| 5 to 17 Years | 0 (0.0%) | 0 (0.0%) |
| 18 to 34 Years | 5 (3.4%) | 14 (9.7%) |
| 35 to 64 Years | 33 (21.3%) | 30 (17.9%) |
| 65 to 74 Years | 8 (5.9%) | 27 (40.9%) |
| 75 Years and over | 13 (46.4%) | 22 (59.5%) |
Disability Class: Self-Care Difficulty
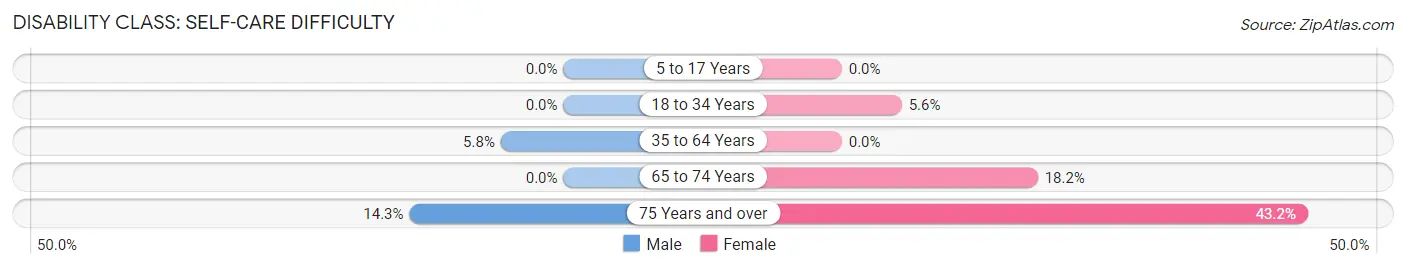
| Age Bracket | Male | Female |
| 5 to 17 Years | 0 (0.0%) | 0 (0.0%) |
| 18 to 34 Years | 0 (0.0%) | 8 (5.6%) |
| 35 to 64 Years | 9 (5.8%) | 0 (0.0%) |
| 65 to 74 Years | 0 (0.0%) | 12 (18.2%) |
| 75 Years and over | 4 (14.3%) | 16 (43.2%) |
Technology Access in Panama
Computing Device Access in Panama
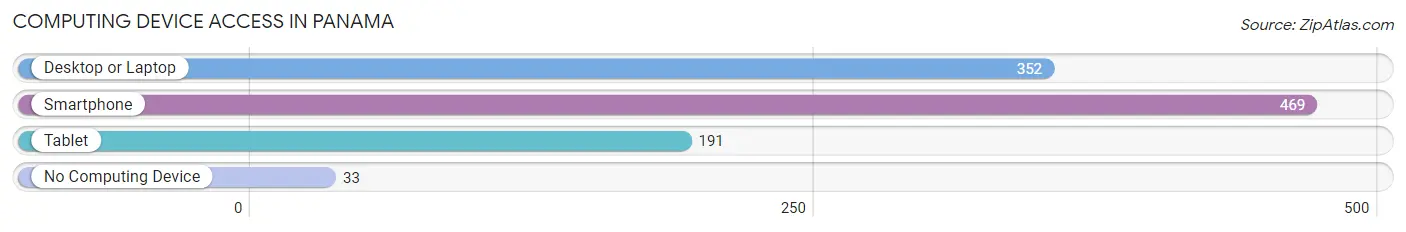
| Device Type | # Households | % Households |
| Desktop or Laptop | 352 | 66.9% |
| Smartphone | 469 | 89.2% |
| Tablet | 191 | 36.3% |
| No Computing Device | 33 | 6.3% |
| Total | 526 | 100.0% |
Internet Access in Panama
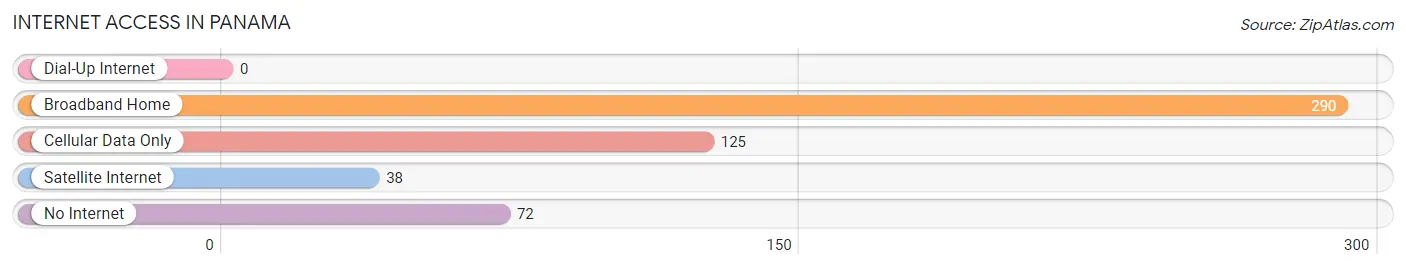
| Internet Type | # Households | % Households |
| Dial-Up Internet | 0 | 0.0% |
| Broadband Home | 290 | 55.1% |
| Cellular Data Only | 125 | 23.8% |
| Satellite Internet | 38 | 7.2% |
| No Internet | 72 | 13.7% |
| Total | 526 | 100.0% |
Panama Summary
Panama, Oklahoma is a small town located in LeFlore County in the southeastern corner of the state. It is situated on the Arkansas-Oklahoma border, approximately 20 miles south of Fort Smith, Arkansas and 40 miles north of Poteau, Oklahoma. The town was founded in 1891 and named after the Panama Canal, which was being built at the time. The population of Panama, Oklahoma was 1,093 as of the 2010 census.
Geography
Panama, Oklahoma is located in the southeastern corner of the state, near the Arkansas-Oklahoma border. It is situated on the Arkansas River, approximately 20 miles south of Fort Smith, Arkansas and 40 miles north of Poteau, Oklahoma. The town is located in the foothills of the Ouachita Mountains and is surrounded by rolling hills and forests. The climate in Panama is mild, with hot summers and cool winters.
Economy
The economy of Panama, Oklahoma is largely based on agriculture and timber. The town is home to several farms and ranches, as well as a sawmill and a lumber yard. The town also has a few small businesses, including a grocery store, a hardware store, and a few restaurants.
Demographics
As of the 2010 census, the population of Panama, Oklahoma was 1,093. The racial makeup of the town was 94.3% White, 0.7% African American, 0.7% Native American, 0.3% Asian, 0.1% Pacific Islander, and 3.0% from other races. The median household income was $30,938, and the median family income was $37,500. The per capita income was $15,945.
Education
Panama, Oklahoma is served by the Panama-Buena Vista School District. The district operates one elementary school, one middle school, and one high school. The town also has a public library.
Conclusion
Panama, Oklahoma is a small town located in the southeastern corner of the state, near the Arkansas-Oklahoma border. The town was founded in 1891 and is home to a population of 1,093 as of the 2010 census. The economy of Panama is largely based on agriculture and timber, and the town is served by the Panama-Buena Vista School District. Panama is a quiet, rural town with a mild climate and a friendly atmosphere.
Common Questions
What is Per Capita Income in Panama?
Per Capita income in Panama is $20,431.
What is the Median Family Income in Panama?
Median Family Income in Panama is $57,188.
What is the Median Household income in Panama?
Median Household Income in Panama is $44,397.
What is Income or Wage Gap in Panama?
Income or Wage Gap in Panama is 46.2%.
Women in Panama earn 53.8 cents for every dollar earned by a man.
What is Inequality or Gini Index in Panama?
Inequality or Gini Index in Panama is 0.38.
What is the Total Population of Panama?
Total Population of Panama is 1,278.
What is the Total Male Population of Panama?
Total Male Population of Panama is 678.
What is the Total Female Population of Panama?
Total Female Population of Panama is 600.
What is the Ratio of Males per 100 Females in Panama?
There are 113.00 Males per 100 Females in Panama.
What is the Ratio of Females per 100 Males in Panama?
There are 88.50 Females per 100 Males in Panama.
What is the Median Population Age in Panama?
Median Population Age in Panama is 32.4 Years.
What is the Average Family Size in Panama
Average Family Size in Panama is 2.7 People.
What is the Average Household Size in Panama
Average Household Size in Panama is 2.4 People.
How Large is the Labor Force in Panama?
There are 523 People in the Labor Forcein in Panama.
What is the Percentage of People in the Labor Force in Panama?
56.5% of People are in the Labor Force in Panama.
What is the Unemployment Rate in Panama?
Unemployment Rate in Panama is 3.5%.