Oologah, OK Map & Demographics
Oologah Map
Oologah Overview
$33,451
PER CAPITA INCOME
$78,250
AVG FAMILY INCOME
$82,531
AVG HOUSEHOLD INCOME
27.8%
WAGE / INCOME GAP [ % ]
72.2¢/ $1
WAGE / INCOME GAP [ $ ]
0.33
INEQUALITY / GINI INDEX
1,783
TOTAL POPULATION
848
MALE POPULATION
935
FEMALE POPULATION
90.70
MALES / 100 FEMALES
110.26
FEMALES / 100 MALES
33.1
MEDIAN AGE
3.2
AVG FAMILY SIZE
2.6
AVG HOUSEHOLD SIZE
928
LABOR FORCE [ PEOPLE ]
65.9%
PERCENT IN LABOR FORCE
7.5%
UNEMPLOYMENT RATE
Oologah Zip Codes
Oologah Area Codes
Income in Oologah
Income Overview in Oologah
Per Capita Income in Oologah is $33,451, while median incomes of families and households are $78,250 and $82,531 respectively.
| Characteristic | Number | Measure |
| Per Capita Income | 1,783 | $33,451 |
| Median Family Income | 464 | $78,250 |
| Mean Family Income | 464 | $87,104 |
| Median Household Income | 683 | $82,531 |
| Mean Household Income | 683 | $87,413 |
| Income Deficit | 464 | $0 |
| Wage / Income Gap (%) | 1,783 | 27.85% |
| Wage / Income Gap ($) | 1,783 | 72.15¢ per $1 |
| Gini / Inequality Index | 1,783 | 0.33 |
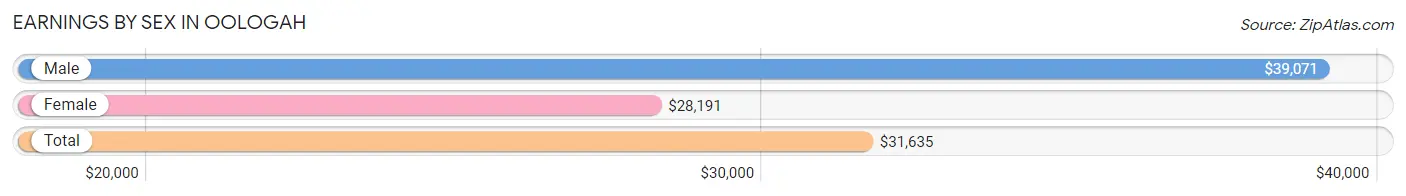
Earnings by Sex in Oologah
Average Earnings in Oologah are $31,635, $39,071 for men and $28,191 for women, a difference of 27.9%.
| Sex | Number | Average Earnings |
| Male | 551 (57.4%) | $39,071 |
| Female | 409 (42.6%) | $28,191 |
| Total | 960 (100.0%) | $31,635 |
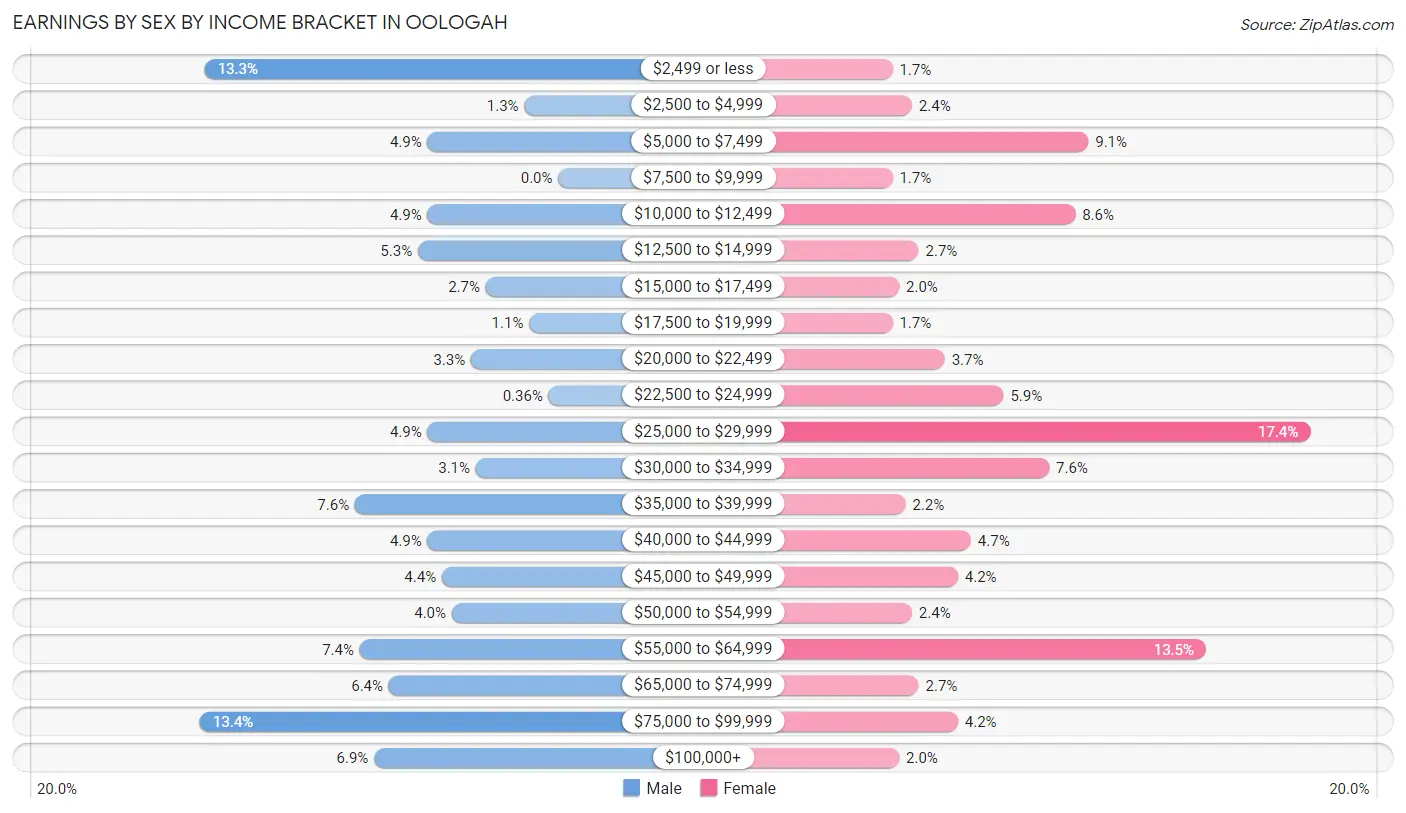
Earnings by Sex by Income Bracket in Oologah
The most common earnings brackets in Oologah are $75,000 to $99,999 for men (74 | 13.4%) and $25,000 to $29,999 for women (71 | 17.4%).
| Income | Male | Female |
| $2,499 or less | 73 (13.3%) | 7 (1.7%) |
| $2,500 to $4,999 | 7 (1.3%) | 10 (2.4%) |
| $5,000 to $7,499 | 27 (4.9%) | 37 (9.0%) |
| $7,500 to $9,999 | 0 (0.0%) | 7 (1.7%) |
| $10,000 to $12,499 | 27 (4.9%) | 35 (8.6%) |
| $12,500 to $14,999 | 29 (5.3%) | 11 (2.7%) |
| $15,000 to $17,499 | 15 (2.7%) | 8 (2.0%) |
| $17,500 to $19,999 | 6 (1.1%) | 7 (1.7%) |
| $20,000 to $22,499 | 18 (3.3%) | 15 (3.7%) |
| $22,500 to $24,999 | 2 (0.4%) | 24 (5.9%) |
| $25,000 to $29,999 | 27 (4.9%) | 71 (17.4%) |
| $30,000 to $34,999 | 17 (3.1%) | 31 (7.6%) |
| $35,000 to $39,999 | 42 (7.6%) | 9 (2.2%) |
| $40,000 to $44,999 | 27 (4.9%) | 19 (4.6%) |
| $45,000 to $49,999 | 24 (4.4%) | 17 (4.2%) |
| $50,000 to $54,999 | 22 (4.0%) | 10 (2.4%) |
| $55,000 to $64,999 | 41 (7.4%) | 55 (13.5%) |
| $65,000 to $74,999 | 35 (6.4%) | 11 (2.7%) |
| $75,000 to $99,999 | 74 (13.4%) | 17 (4.2%) |
| $100,000+ | 38 (6.9%) | 8 (2.0%) |
| Total | 551 (100.0%) | 409 (100.0%) |
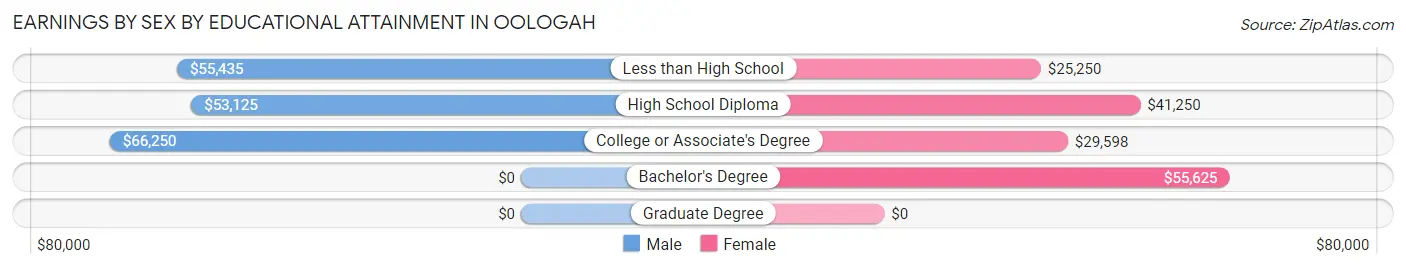
Earnings by Sex by Educational Attainment in Oologah
Average earnings in Oologah are $55,240 for men and $33,750 for women, a difference of 38.9%. Men with an educational attainment of college or associate's degree enjoy the highest average annual earnings of $66,250, while those with high school diploma education earn the least with $53,125. Women with an educational attainment of bachelor's degree earn the most with the average annual earnings of $55,625, while those with less than high school education have the smallest earnings of $25,250.
| Educational Attainment | Male Income | Female Income |
| Less than High School | $55,435 | $25,250 |
| High School Diploma | $53,125 | $41,250 |
| College or Associate's Degree | $66,250 | $29,598 |
| Bachelor's Degree | - | - |
| Graduate Degree | - | - |
| Total | $55,240 | $33,750 |
Family Income in Oologah
Family Income Brackets in Oologah
According to the Oologah family income data, there are 142 families falling into the $100,000 to $149,999 income range, which is the most common income bracket and makes up 30.6% of all families. Conversely, the less than $10,000 income bracket is the least frequent group with only 3 families (0.6%) belonging to this category.
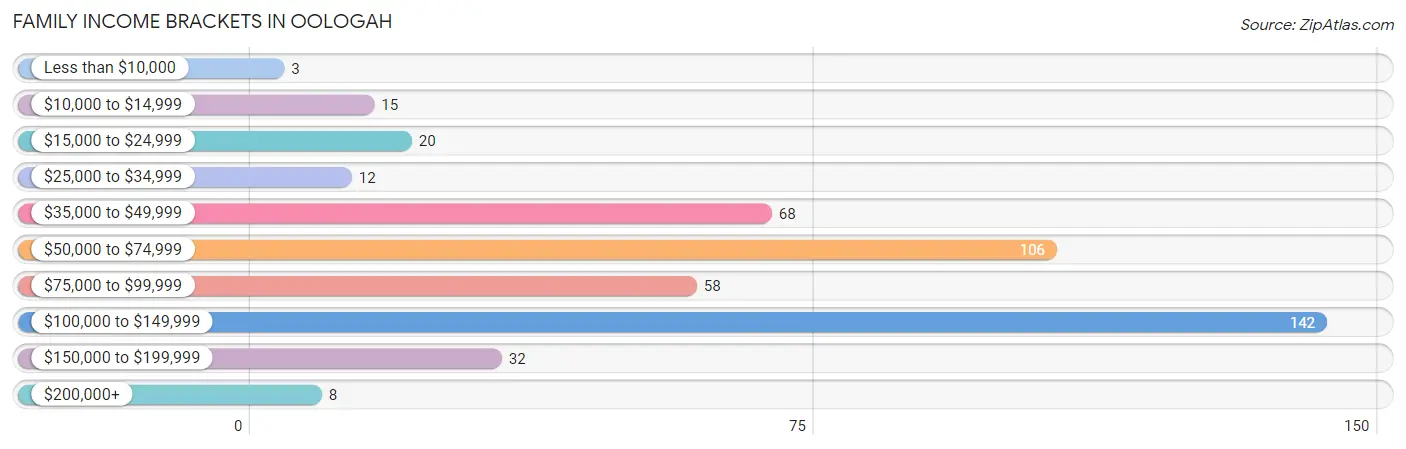
| Income Bracket | # Families | % Families |
| Less than $10,000 | 3 | 0.6% |
| $10,000 to $14,999 | 15 | 3.2% |
| $15,000 to $24,999 | 20 | 4.3% |
| $25,000 to $34,999 | 12 | 2.6% |
| $35,000 to $49,999 | 68 | 14.7% |
| $50,000 to $74,999 | 106 | 22.8% |
| $75,000 to $99,999 | 58 | 12.5% |
| $100,000 to $149,999 | 142 | 30.6% |
| $150,000 to $199,999 | 32 | 6.9% |
| $200,000+ | 8 | 1.7% |
Family Income by Famaliy Size in Oologah
7+ person families (13 | 2.8%) account for the highest median family income in Oologah with $157,813 per family, while 2-person families (217 | 46.8%) have the highest median income of $47,188 per family member.
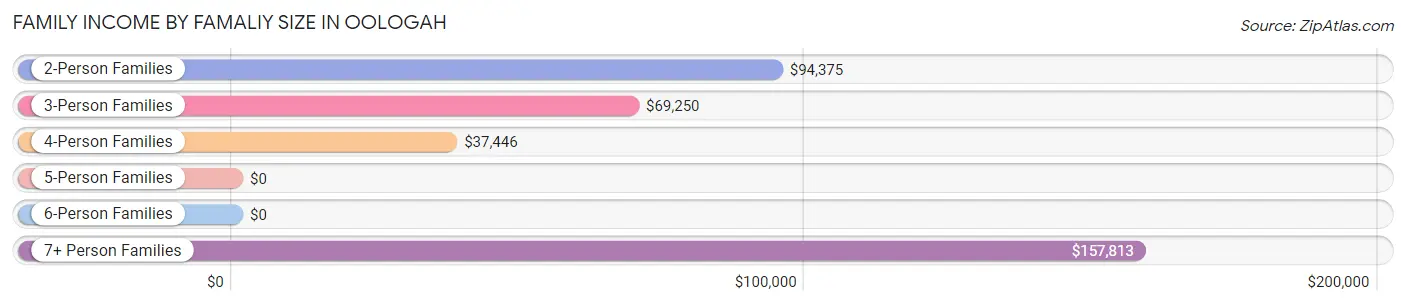
| Income Bracket | # Families | Median Income |
| 2-Person Families | 217 (46.8%) | $94,375 |
| 3-Person Families | 109 (23.5%) | $69,250 |
| 4-Person Families | 71 (15.3%) | $37,446 |
| 5-Person Families | 47 (10.1%) | $0 |
| 6-Person Families | 7 (1.5%) | $0 |
| 7+ Person Families | 13 (2.8%) | $157,813 |
| Total | 464 (100.0%) | $78,250 |
Family Income by Number of Earners in Oologah
The median family income in Oologah is $78,250, with families comprising 3+ earners (70) having the highest median family income of $108,036, while families with no earners (58) have the lowest median family income of $39,583, accounting for 15.1% and 12.5% of families, respectively.
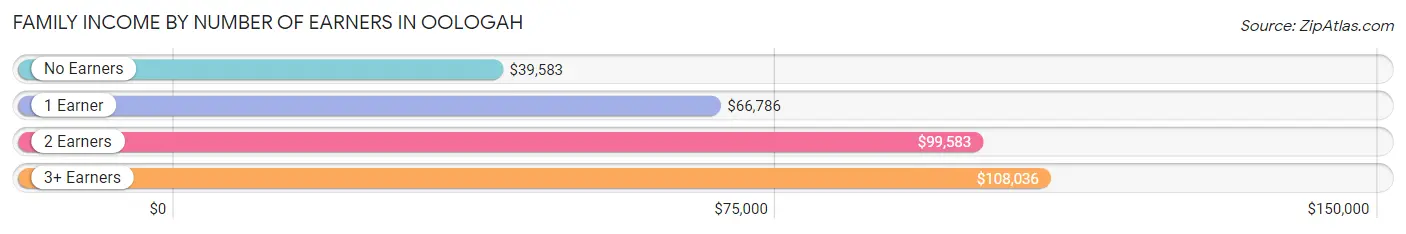
| Number of Earners | # Families | Median Income |
| No Earners | 58 (12.5%) | $39,583 |
| 1 Earner | 160 (34.5%) | $66,786 |
| 2 Earners | 176 (37.9%) | $99,583 |
| 3+ Earners | 70 (15.1%) | $108,036 |
| Total | 464 (100.0%) | $78,250 |
Household Income in Oologah
Household Income Brackets in Oologah
With 154 households falling in the category, the $100,000 to $149,999 income range is the most frequent in Oologah, accounting for 22.6% of all households. In contrast, only 8 households (1.2%) fall into the $200,000+ income bracket, making it the least populous group.
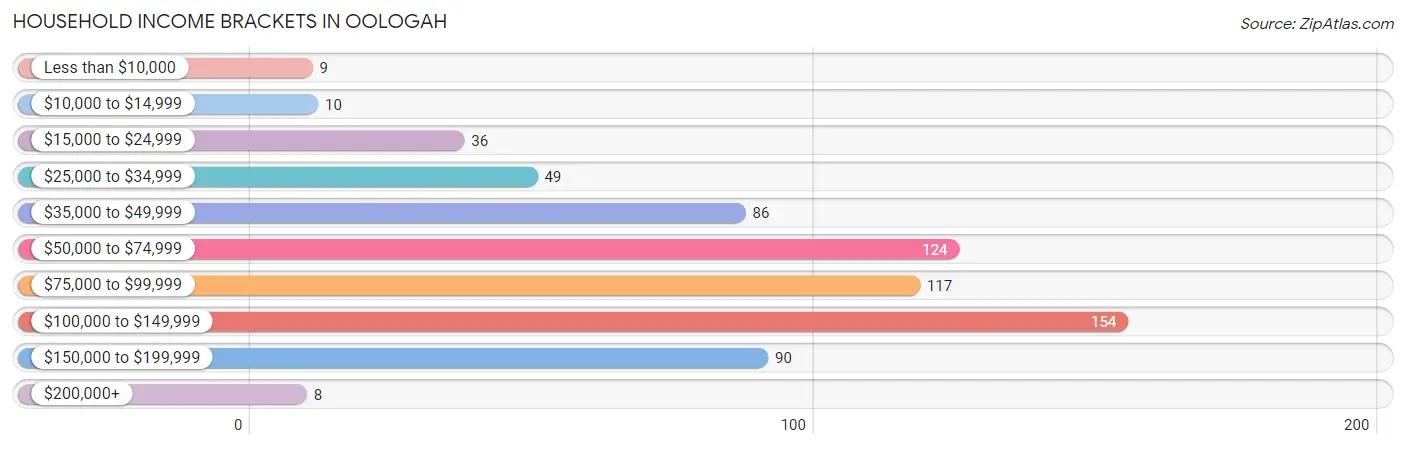
| Income Bracket | # Households | % Households |
| Less than $10,000 | 9 | 1.3% |
| $10,000 to $14,999 | 10 | 1.5% |
| $15,000 to $24,999 | 36 | 5.3% |
| $25,000 to $34,999 | 49 | 7.2% |
| $35,000 to $49,999 | 86 | 12.6% |
| $50,000 to $74,999 | 124 | 18.2% |
| $75,000 to $99,999 | 117 | 17.1% |
| $100,000 to $149,999 | 154 | 22.5% |
| $150,000 to $199,999 | 90 | 13.2% |
| $200,000+ | 8 | 1.2% |
Household Income by Householder Age in Oologah
The median household income in Oologah is $82,531, with the highest median household income of $95,625 found in the 65+ years age bracket for the primary householder. A total of 241 households (35.3%) fall into this category. Meanwhile, the 15 to 24 years age bracket for the primary householder has the lowest median household income of $56,389, with 30 households (4.4%) in this group.
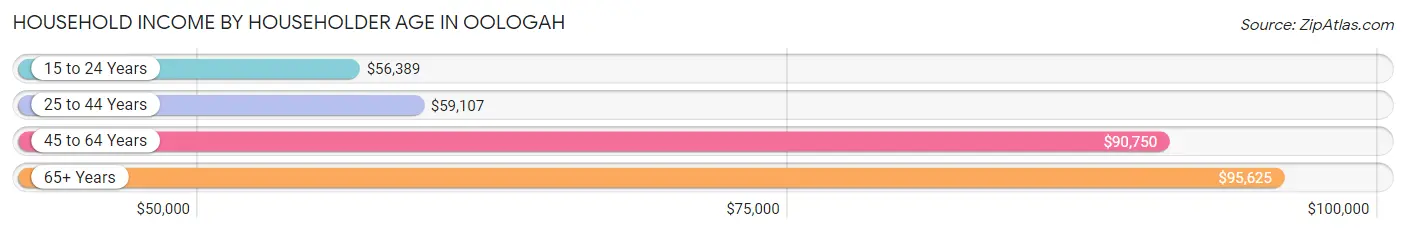
| Income Bracket | # Households | Median Income |
| 15 to 24 Years | 30 (4.4%) | $56,389 |
| 25 to 44 Years | 199 (29.1%) | $59,107 |
| 45 to 64 Years | 213 (31.2%) | $90,750 |
| 65+ Years | 241 (35.3%) | $95,625 |
| Total | 683 (100.0%) | $82,531 |
Poverty in Oologah
Income Below Poverty by Sex and Age in Oologah
With 8.4% poverty level for males and 12.0% for females among the residents of Oologah, 5 year old males and 15 year old females are the most vulnerable to poverty, with 6 males (66.7%) and 20 females (50.0%) in their respective age groups living below the poverty level.
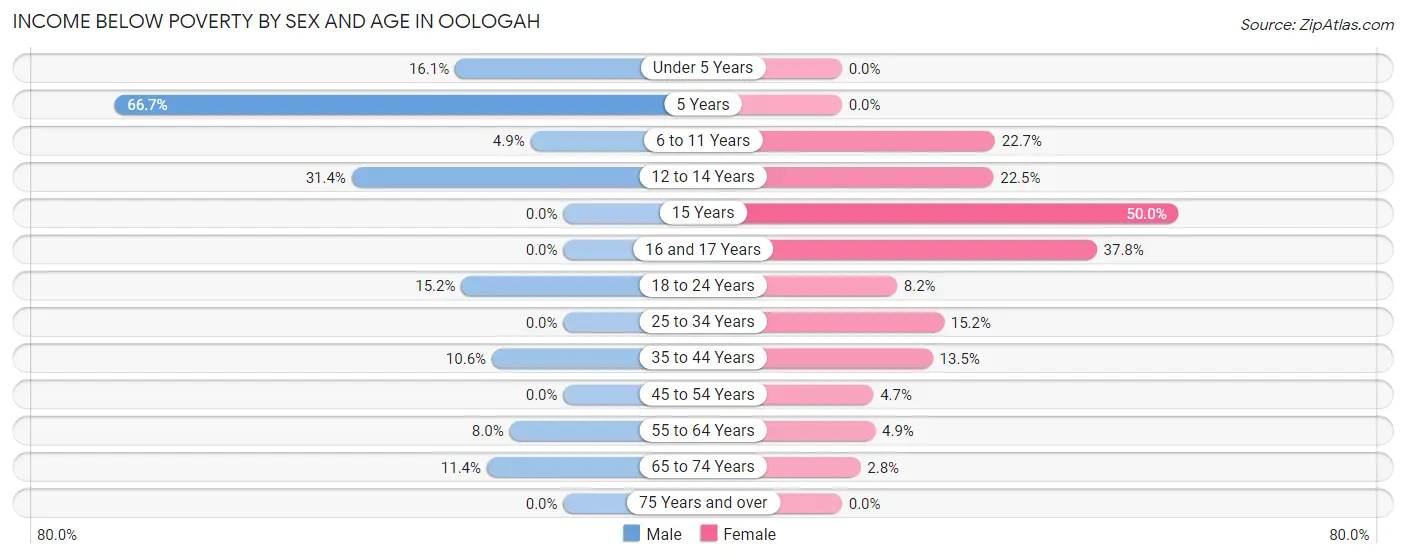
| Age Bracket | Male | Female |
| Under 5 Years | 14 (16.1%) | 0 (0.0%) |
| 5 Years | 6 (66.7%) | 0 (0.0%) |
| 6 to 11 Years | 2 (4.9%) | 15 (22.7%) |
| 12 to 14 Years | 11 (31.4%) | 9 (22.5%) |
| 15 Years | 0 (0.0%) | 20 (50.0%) |
| 16 and 17 Years | 0 (0.0%) | 14 (37.8%) |
| 18 to 24 Years | 20 (15.1%) | 9 (8.2%) |
| 25 to 34 Years | 0 (0.0%) | 15 (15.1%) |
| 35 to 44 Years | 7 (10.6%) | 17 (13.5%) |
| 45 to 54 Years | 0 (0.0%) | 5 (4.7%) |
| 55 to 64 Years | 6 (8.0%) | 4 (4.9%) |
| 65 to 74 Years | 5 (11.4%) | 4 (2.8%) |
| 75 Years and over | 0 (0.0%) | 0 (0.0%) |
| Total | 71 (8.4%) | 112 (12.0%) |
Income Above Poverty by Sex and Age in Oologah
According to the poverty statistics in Oologah, males aged 15 years and females aged under 5 years are the age groups that are most secure financially, with 100.0% of males and 100.0% of females in these age groups living above the poverty line.
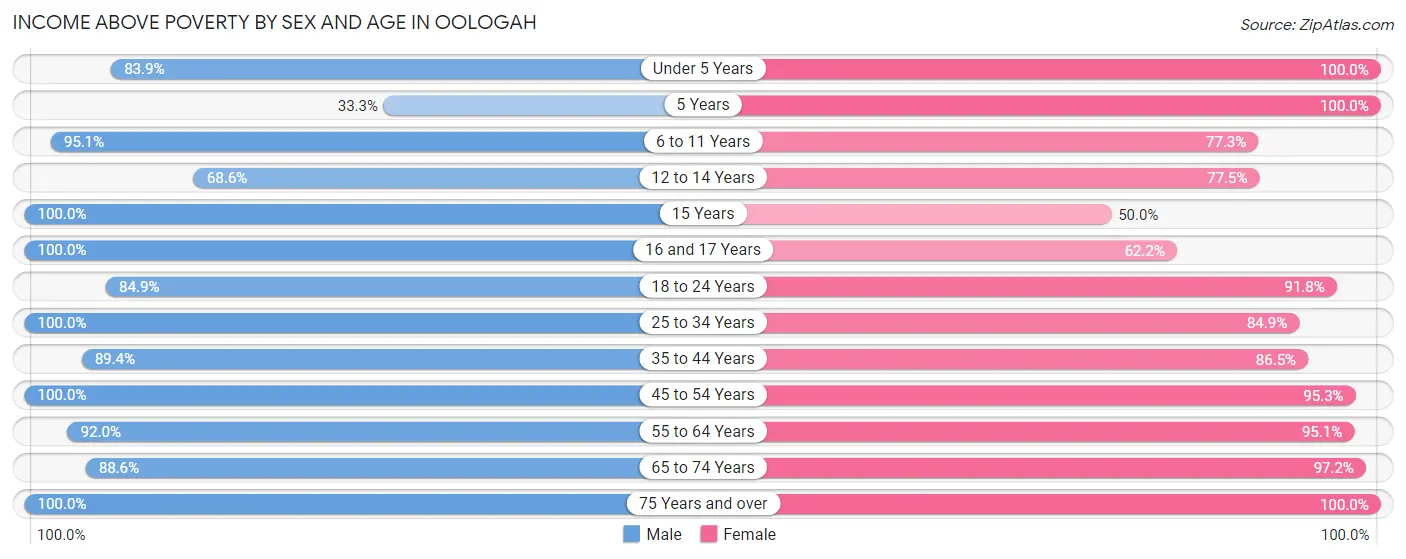
| Age Bracket | Male | Female |
| Under 5 Years | 73 (83.9%) | 52 (100.0%) |
| 5 Years | 3 (33.3%) | 2 (100.0%) |
| 6 to 11 Years | 39 (95.1%) | 51 (77.3%) |
| 12 to 14 Years | 24 (68.6%) | 31 (77.5%) |
| 15 Years | 3 (100.0%) | 20 (50.0%) |
| 16 and 17 Years | 77 (100.0%) | 23 (62.2%) |
| 18 to 24 Years | 112 (84.9%) | 101 (91.8%) |
| 25 to 34 Years | 84 (100.0%) | 84 (84.9%) |
| 35 to 44 Years | 59 (89.4%) | 109 (86.5%) |
| 45 to 54 Years | 125 (100.0%) | 102 (95.3%) |
| 55 to 64 Years | 69 (92.0%) | 77 (95.1%) |
| 65 to 74 Years | 39 (88.6%) | 141 (97.2%) |
| 75 Years and over | 70 (100.0%) | 30 (100.0%) |
| Total | 777 (91.6%) | 823 (88.0%) |
Income Below Poverty Among Married-Couple Families in Oologah
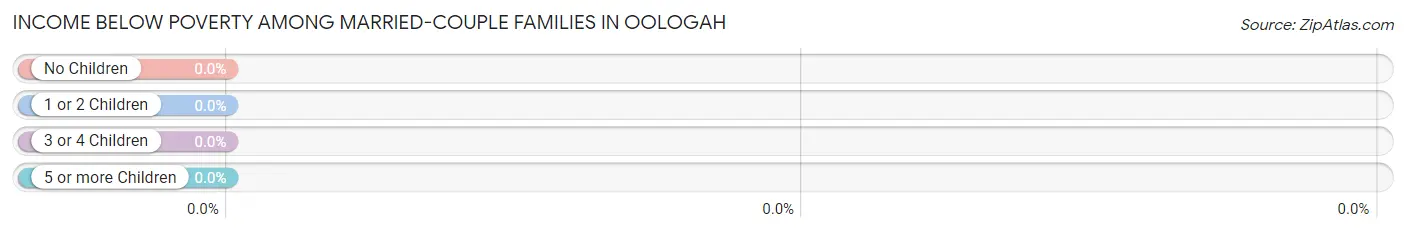
| Children | Above Poverty | Below Poverty |
| No Children | 197 (100.0%) | 0 (0.0%) |
| 1 or 2 Children | 59 (100.0%) | 0 (0.0%) |
| 3 or 4 Children | 33 (100.0%) | 0 (0.0%) |
| 5 or more Children | 5 (100.0%) | 0 (0.0%) |
| Total | 294 (100.0%) | 0 (0.0%) |
Income Below Poverty Among Single-Parent Households in Oologah
According to the poverty data in Oologah, 7.0% or 3 single-father households and 27.6% or 35 single-mother households are living below the poverty line. Among single-father households, those with 1 or 2 children have the highest poverty rate, with 3 households (20.0%) experiencing poverty. Likewise, among single-mother households, those with 3 or 4 children have the highest poverty rate, with 25 households (55.6%) falling below the poverty line.
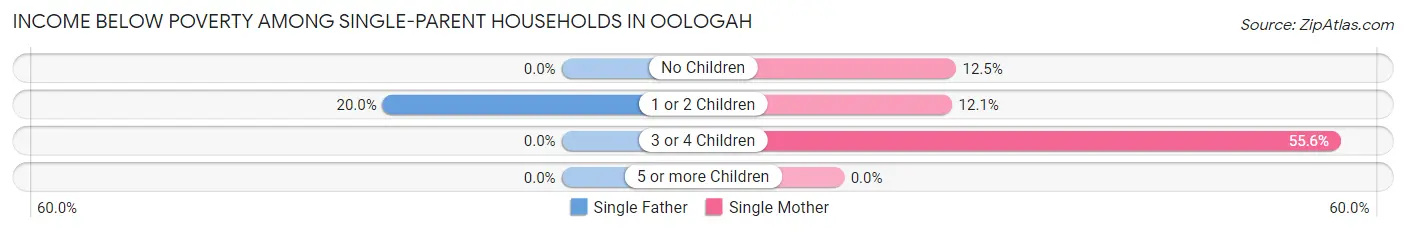
| Children | Single Father | Single Mother |
| No Children | 0 (0.0%) | 3 (12.5%) |
| 1 or 2 Children | 3 (20.0%) | 7 (12.1%) |
| 3 or 4 Children | 0 (0.0%) | 25 (55.6%) |
| 5 or more Children | 0 (0.0%) | 0 (0.0%) |
| Total | 3 (7.0%) | 35 (27.6%) |
Income Below Poverty Among Married-Couple vs Single-Parent Households in Oologah
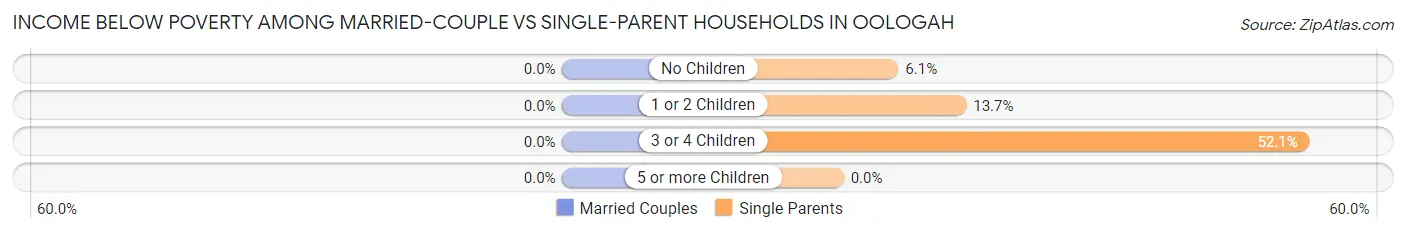
| Children | Married-Couple Families | Single-Parent Households |
| No Children | 0 (0.0%) | 3 (6.1%) |
| 1 or 2 Children | 0 (0.0%) | 10 (13.7%) |
| 3 or 4 Children | 0 (0.0%) | 25 (52.1%) |
| 5 or more Children | 0 (0.0%) | 0 (0.0%) |
| Total | 0 (0.0%) | 38 (22.4%) |
Race in Oologah
The most populous races in Oologah are White / Caucasian (1,233 | 69.2%), Native / Alaskan (317 | 17.8%), and Two or more Races (217 | 12.2%).
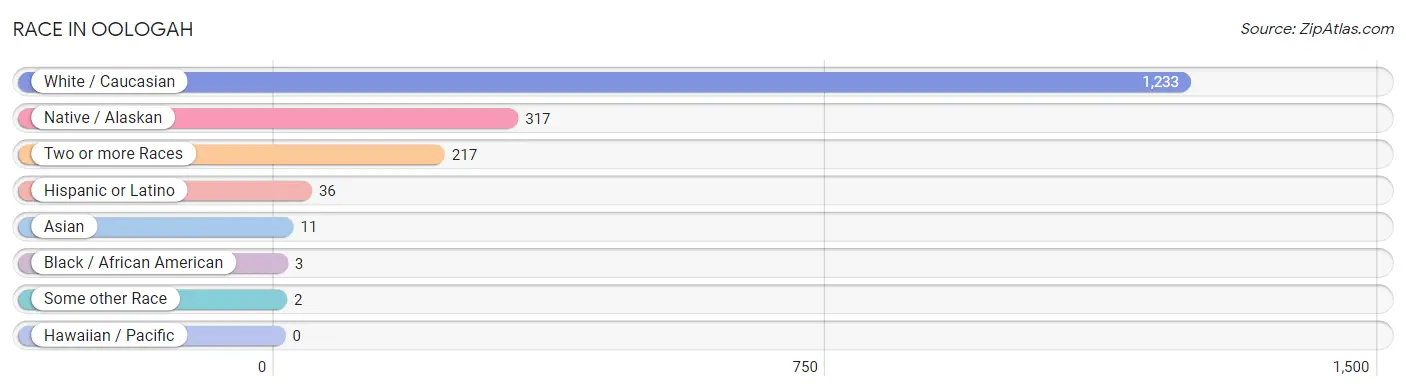
| Race | # Population | % Population |
| Asian | 11 | 0.6% |
| Black / African American | 3 | 0.2% |
| Hawaiian / Pacific | 0 | 0.0% |
| Hispanic or Latino | 36 | 2.0% |
| Native / Alaskan | 317 | 17.8% |
| White / Caucasian | 1,233 | 69.2% |
| Two or more Races | 217 | 12.2% |
| Some other Race | 2 | 0.1% |
| Total | 1,783 | 100.0% |
Ancestry in Oologah
The most populous ancestries reported in Oologah are Cherokee (422 | 23.7%), German (277 | 15.5%), Irish (170 | 9.5%), English (122 | 6.8%), and Scottish (103 | 5.8%), together accounting for 61.4% of all Oologah residents.
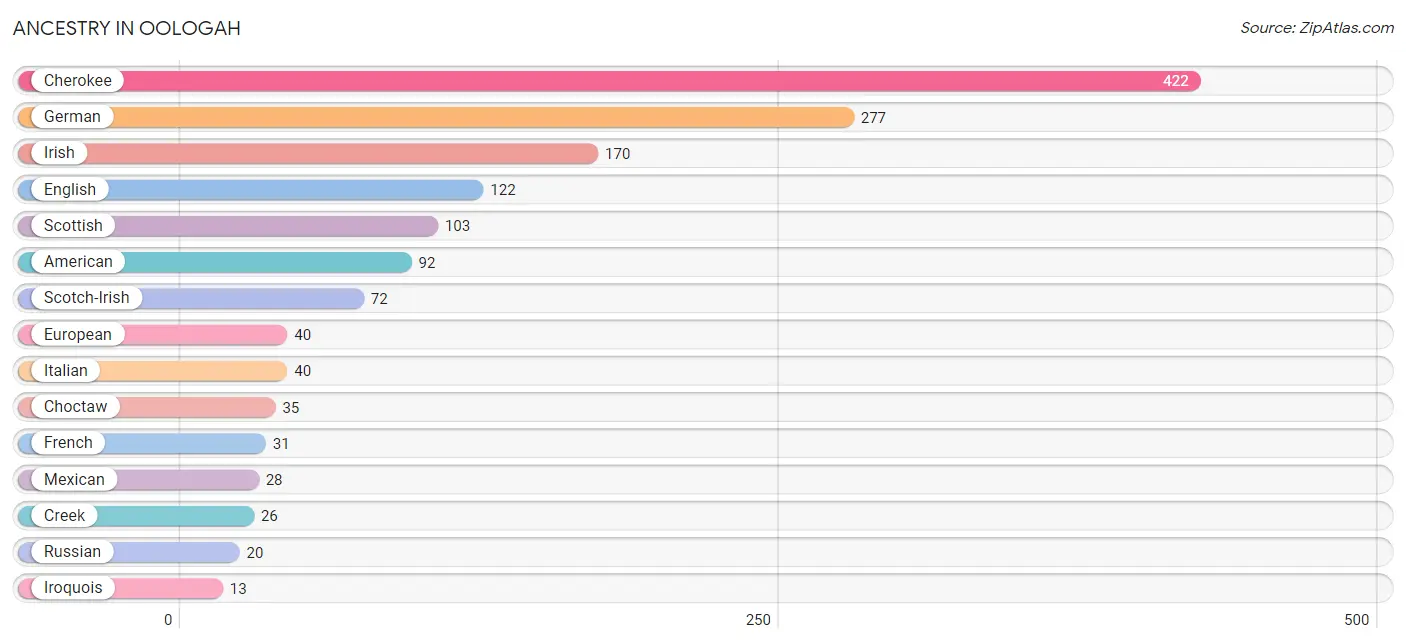
| Ancestry | # Population | % Population |
| American | 92 | 5.2% |
| Arab | 6 | 0.3% |
| Bangladeshi | 11 | 0.6% |
| Bhutanese | 8 | 0.4% |
| Cherokee | 422 | 23.7% |
| Choctaw | 35 | 2.0% |
| Comanche | 9 | 0.5% |
| Creek | 26 | 1.5% |
| Danish | 4 | 0.2% |
| Dutch | 2 | 0.1% |
| Eastern European | 3 | 0.2% |
| English | 122 | 6.8% |
| European | 40 | 2.2% |
| French | 31 | 1.7% |
| French Canadian | 8 | 0.4% |
| German | 277 | 15.5% |
| Irish | 170 | 9.5% |
| Iroquois | 13 | 0.7% |
| Italian | 40 | 2.2% |
| Lebanese | 6 | 0.3% |
| Mexican | 28 | 1.6% |
| Mexican American Indian | 1 | 0.1% |
| Norwegian | 4 | 0.2% |
| Osage | 6 | 0.3% |
| Puerto Rican | 8 | 0.4% |
| Romanian | 4 | 0.2% |
| Russian | 20 | 1.1% |
| Scotch-Irish | 72 | 4.0% |
| Scottish | 103 | 5.8% |
| Slovak | 4 | 0.2% |
| South African | 1 | 0.1% |
| Subsaharan African | 1 | 0.1% |
| Swedish | 12 | 0.7% |
| Swiss | 3 | 0.2% |
| Ukrainian | 8 | 0.4% |
| Welsh | 3 | 0.2% | View All 36 Rows |
Immigrants in Oologah
The most numerous immigrant groups reported in Oologah came from Asia (7 | 0.4%), Laos (4 | 0.2%), South Eastern Asia (4 | 0.2%), Lebanon (3 | 0.2%), and Western Asia (3 | 0.2%), together accounting for 1.2% of all Oologah residents.
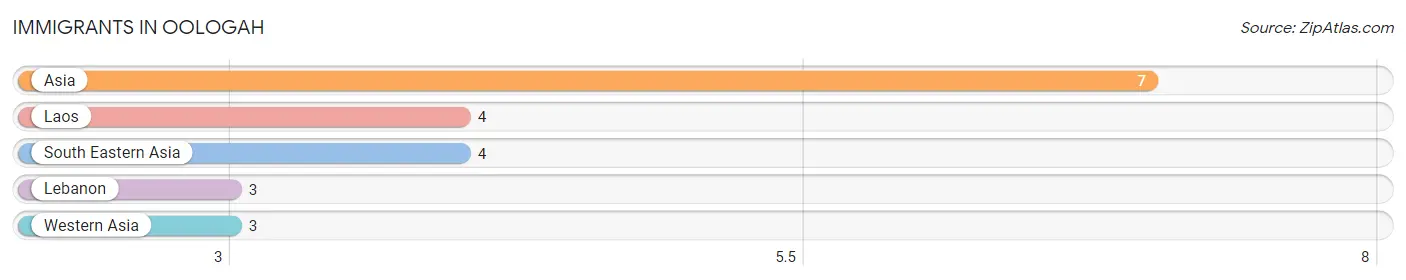
| Immigration Origin | # Population | % Population |
| Asia | 7 | 0.4% |
| Laos | 4 | 0.2% |
| Lebanon | 3 | 0.2% |
| South Eastern Asia | 4 | 0.2% |
| Western Asia | 3 | 0.2% | View All 5 Rows |
Sex and Age in Oologah
Sex and Age in Oologah
The most populous age groups in Oologah are 15 to 19 Years (113 | 13.3%) for men and 15 to 19 Years (114 | 12.2%) for women.
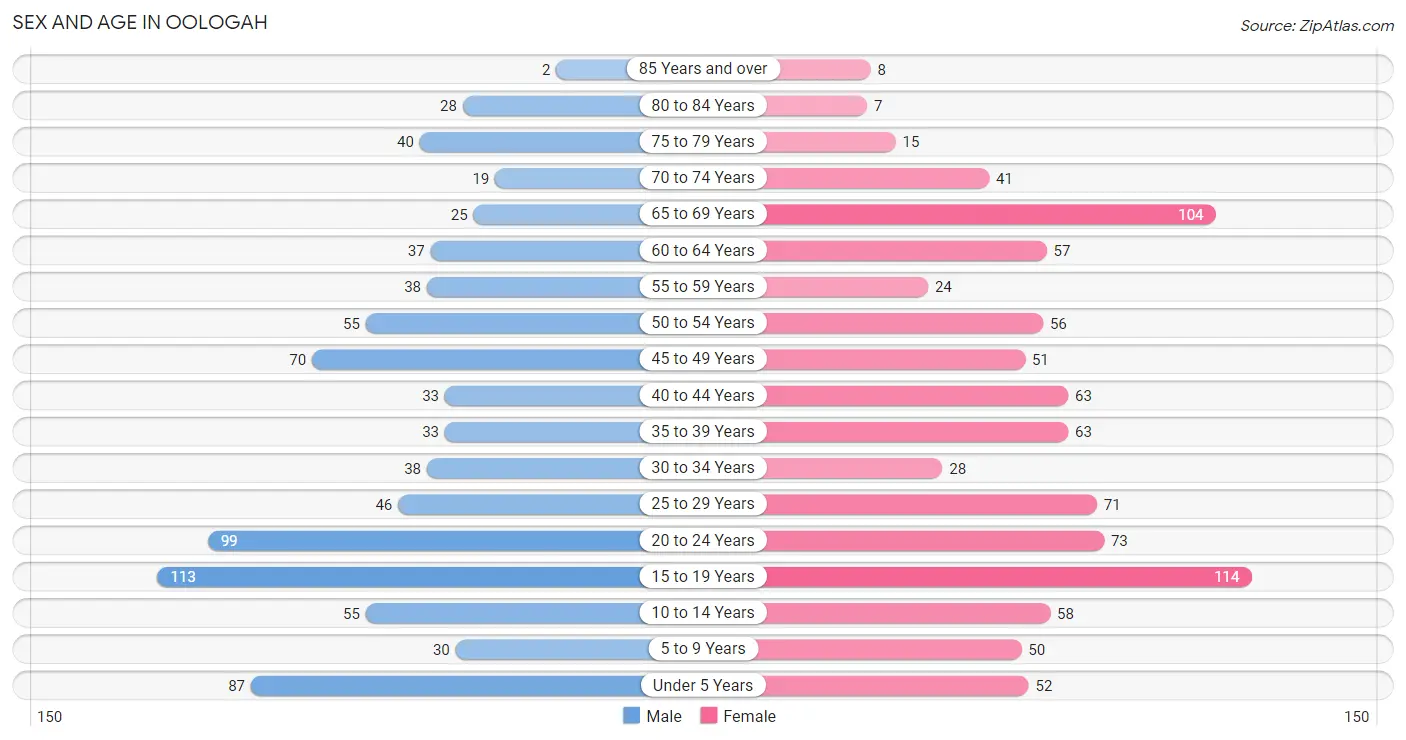
| Age Bracket | Male | Female |
| Under 5 Years | 87 (10.3%) | 52 (5.6%) |
| 5 to 9 Years | 30 (3.5%) | 50 (5.3%) |
| 10 to 14 Years | 55 (6.5%) | 58 (6.2%) |
| 15 to 19 Years | 113 (13.3%) | 114 (12.2%) |
| 20 to 24 Years | 99 (11.7%) | 73 (7.8%) |
| 25 to 29 Years | 46 (5.4%) | 71 (7.6%) |
| 30 to 34 Years | 38 (4.5%) | 28 (3.0%) |
| 35 to 39 Years | 33 (3.9%) | 63 (6.7%) |
| 40 to 44 Years | 33 (3.9%) | 63 (6.7%) |
| 45 to 49 Years | 70 (8.3%) | 51 (5.4%) |
| 50 to 54 Years | 55 (6.5%) | 56 (6.0%) |
| 55 to 59 Years | 38 (4.5%) | 24 (2.6%) |
| 60 to 64 Years | 37 (4.4%) | 57 (6.1%) |
| 65 to 69 Years | 25 (2.9%) | 104 (11.1%) |
| 70 to 74 Years | 19 (2.2%) | 41 (4.4%) |
| 75 to 79 Years | 40 (4.7%) | 15 (1.6%) |
| 80 to 84 Years | 28 (3.3%) | 7 (0.7%) |
| 85 Years and over | 2 (0.2%) | 8 (0.9%) |
| Total | 848 (100.0%) | 935 (100.0%) |
Families and Households in Oologah
Median Family Size in Oologah
The median family size in Oologah is 3.18 persons per family, with single female/mother families (127 | 27.4%) accounting for the largest median family size of 3.5 persons per family. On the other hand, married-couple families (294 | 63.4%) represent the smallest median family size with 3.00 persons per family.
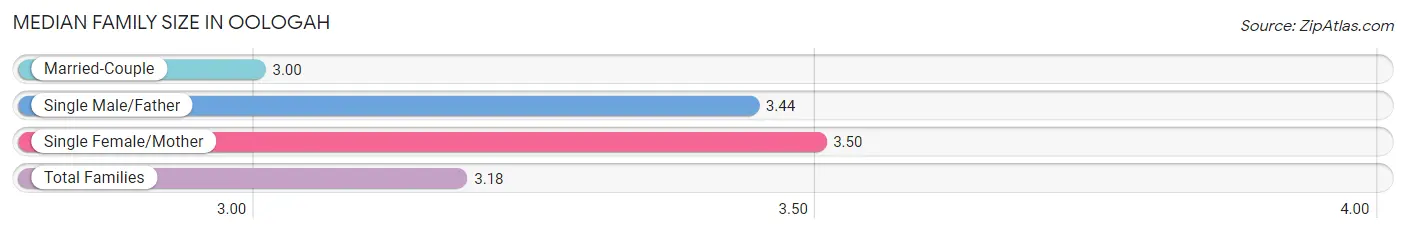
| Family Type | # Families | Family Size |
| Married-Couple | 294 (63.4%) | 3.00 |
| Single Male/Father | 43 (9.3%) | 3.44 |
| Single Female/Mother | 127 (27.4%) | 3.50 |
| Total Families | 464 (100.0%) | 3.18 |
Median Household Size in Oologah
The median household size in Oologah is 2.61 persons per household, with single male/father households (43 | 6.3%) accounting for the largest median household size of 4.23 persons per household. non-family households (219 | 32.1%) represent the smallest median household size with 1.11 persons per household.
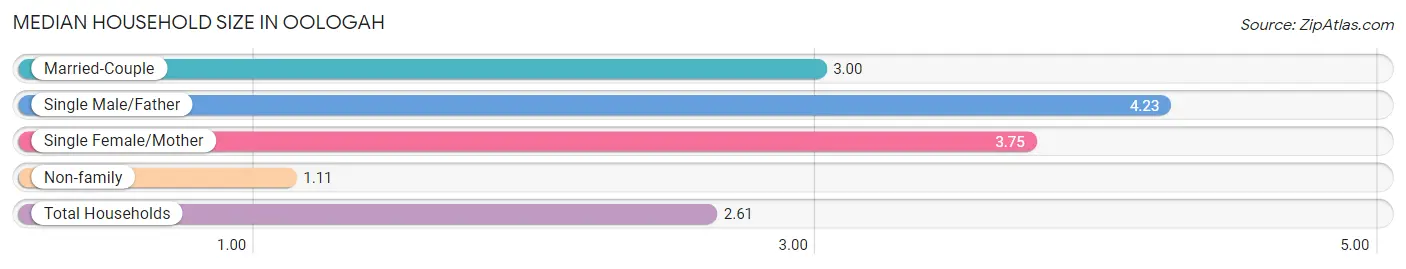
| Household Type | # Households | Household Size |
| Married-Couple | 294 (43.0%) | 3.00 |
| Single Male/Father | 43 (6.3%) | 4.23 |
| Single Female/Mother | 127 (18.6%) | 3.75 |
| Non-family | 219 (32.1%) | 1.11 |
| Total Households | 683 (100.0%) | 2.61 |
Household Size by Marriage Status in Oologah
Out of a total of 683 households in Oologah, 464 (67.9%) are family households, while 219 (32.1%) are nonfamily households. The most numerous type of family households are 2-person households, comprising 197, and the most common type of nonfamily households are 1-person households, comprising 194.
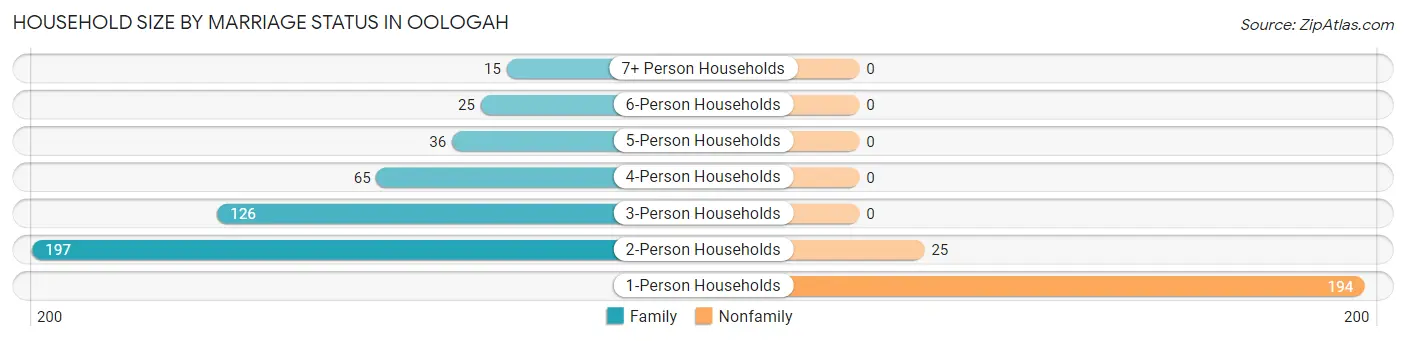
| Household Size | Family Households | Nonfamily Households |
| 1-Person Households | - | 194 (28.4%) |
| 2-Person Households | 197 (28.8%) | 25 (3.7%) |
| 3-Person Households | 126 (18.4%) | 0 (0.0%) |
| 4-Person Households | 65 (9.5%) | 0 (0.0%) |
| 5-Person Households | 36 (5.3%) | 0 (0.0%) |
| 6-Person Households | 25 (3.7%) | 0 (0.0%) |
| 7+ Person Households | 15 (2.2%) | 0 (0.0%) |
| Total | 464 (67.9%) | 219 (32.1%) |
Female Fertility in Oologah
Fertility by Age in Oologah
Average fertility rate in Oologah is 26.0 births per 1,000 women. Women in the age bracket of 20 to 34 years have the highest fertility rate with 52.0 births per 1,000 women. Women in the age bracket of 20 to 34 years acount for 75.0% of all women with births.
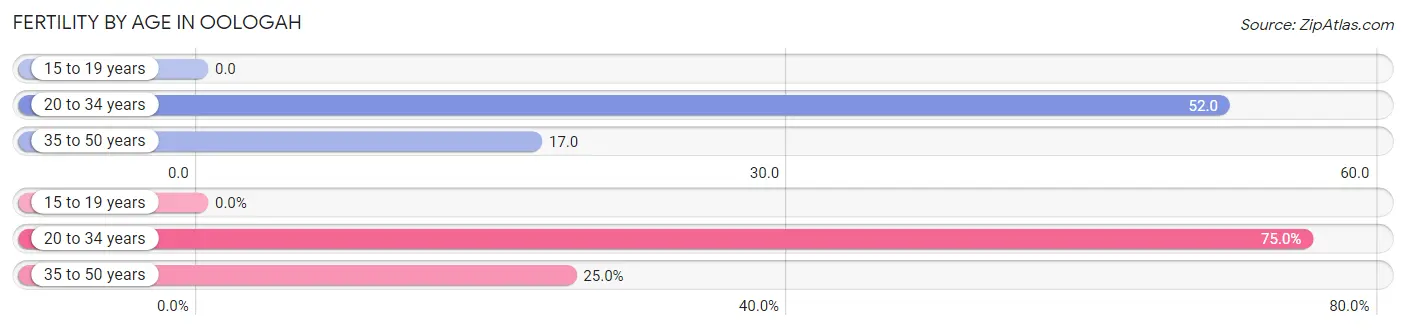
| Age Bracket | Women with Births | Births / 1,000 Women |
| 15 to 19 years | 0 (0.0%) | 0.0 |
| 20 to 34 years | 9 (75.0%) | 52.0 |
| 35 to 50 years | 3 (25.0%) | 17.0 |
| Total | 12 (100.0%) | 26.0 |
Fertility by Age by Marriage Status in Oologah
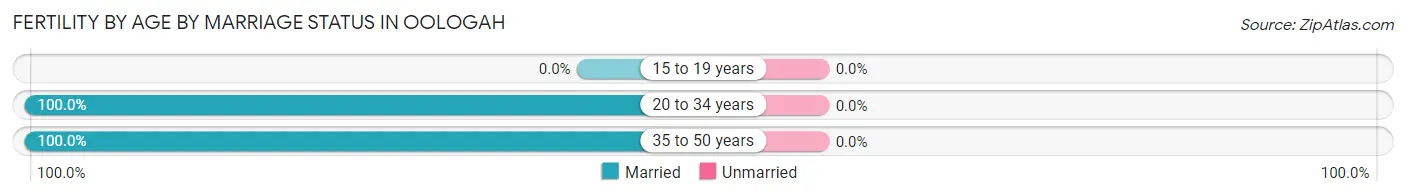
| Age Bracket | Married | Unmarried |
| 15 to 19 years | 0 (0.0%) | 0 (0.0%) |
| 20 to 34 years | 9 (100.0%) | 0 (0.0%) |
| 35 to 50 years | 3 (100.0%) | 0 (0.0%) |
| Total | 12 (100.0%) | 0 (0.0%) |
Fertility by Education in Oologah
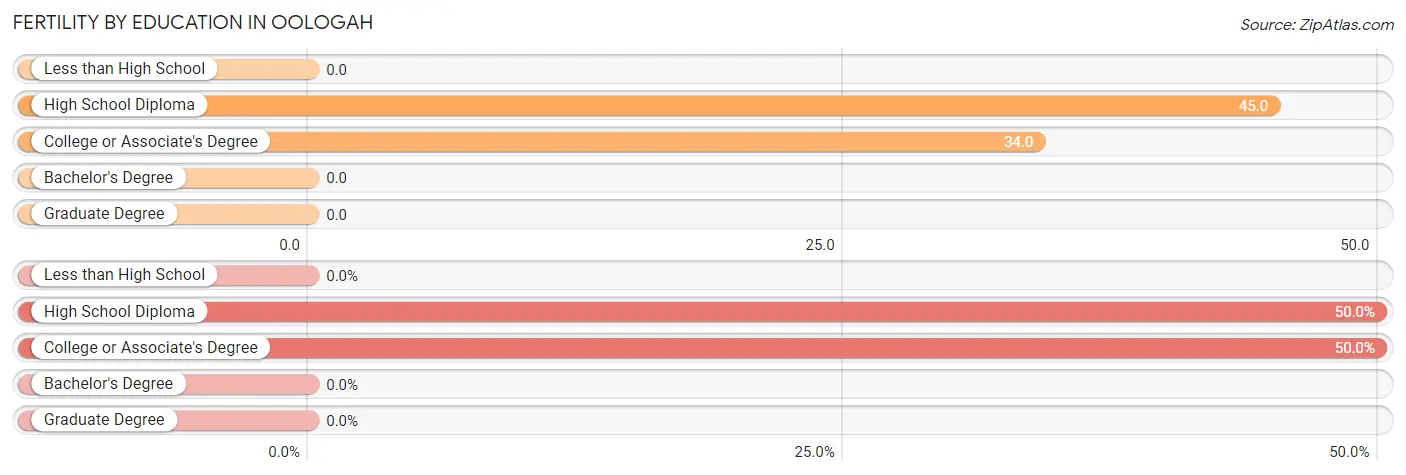
| Educational Attainment | Women with Births | Births / 1,000 Women |
| Less than High School | 0 (0.0%) | 0.0 |
| High School Diploma | 6 (50.0%) | 45.0 |
| College or Associate's Degree | 6 (50.0%) | 34.0 |
| Bachelor's Degree | 0 (0.0%) | 0.0 |
| Graduate Degree | 0 (0.0%) | 0.0 |
| Total | 12 (100.0%) | 26.0 |
Fertility by Education by Marriage Status in Oologah
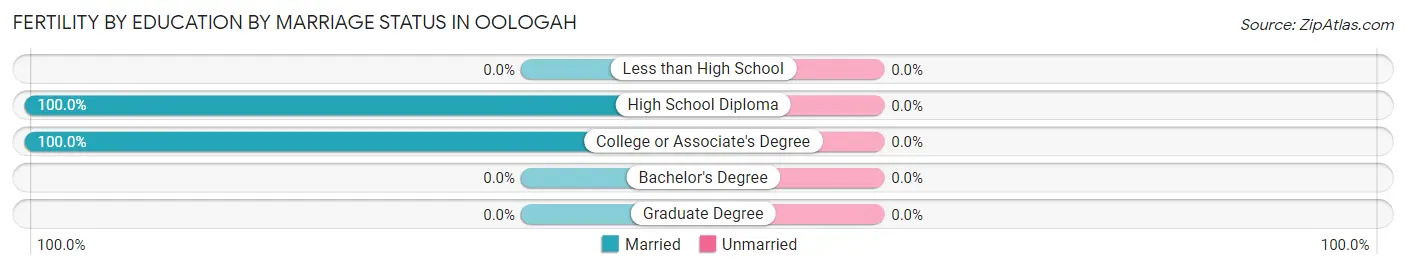
| Educational Attainment | Married | Unmarried |
| Less than High School | 0 (0.0%) | 0 (0.0%) |
| High School Diploma | 6 (100.0%) | 0 (0.0%) |
| College or Associate's Degree | 6 (100.0%) | 0 (0.0%) |
| Bachelor's Degree | 0 (0.0%) | 0 (0.0%) |
| Graduate Degree | 0 (0.0%) | 0 (0.0%) |
| Total | 12 (100.0%) | 0 (0.0%) |
Employment Characteristics in Oologah
Employment by Class of Employer in Oologah
Among the 782 employed individuals in Oologah, private company employees (564 | 72.1%), local government employees (72 | 9.2%), and self-employed (not incorporated) (53 | 6.8%) make up the most common classes of employment.
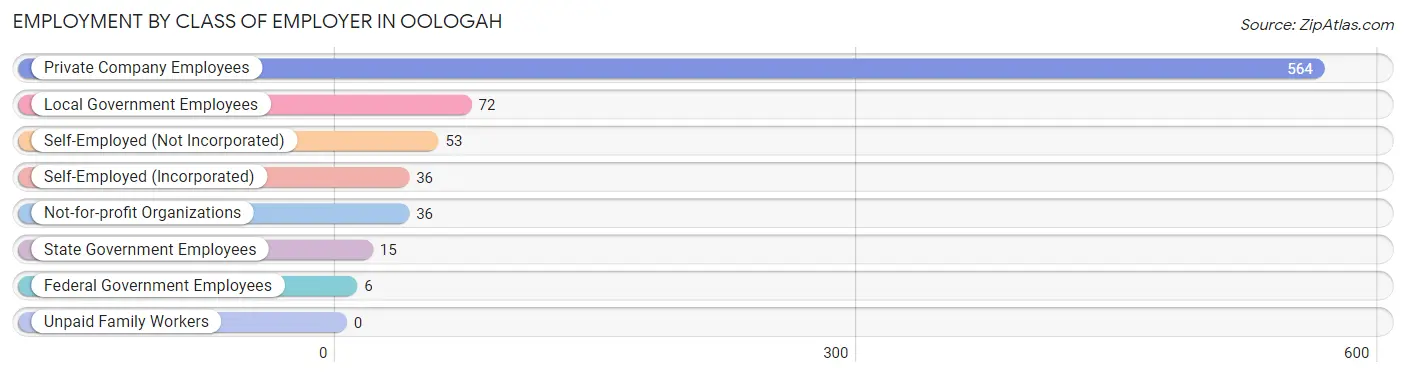
| Employer Class | # Employees | % Employees |
| Private Company Employees | 564 | 72.1% |
| Self-Employed (Incorporated) | 36 | 4.6% |
| Self-Employed (Not Incorporated) | 53 | 6.8% |
| Not-for-profit Organizations | 36 | 4.6% |
| Local Government Employees | 72 | 9.2% |
| State Government Employees | 15 | 1.9% |
| Federal Government Employees | 6 | 0.8% |
| Unpaid Family Workers | 0 | 0.0% |
| Total | 782 | 100.0% |
Employment Status by Age in Oologah
According to the labor force statistics for Oologah, out of the total population over 16 years of age (1,408), 65.9% or 928 individuals are in the labor force, with 7.5% or 70 of them unemployed. The age group with the highest labor force participation rate is 20 to 24 years, with 91.3% or 157 individuals in the labor force. Within the labor force, the 20 to 24 years age range has the highest percentage of unemployed individuals, with 20.4% or 32 of them being unemployed.
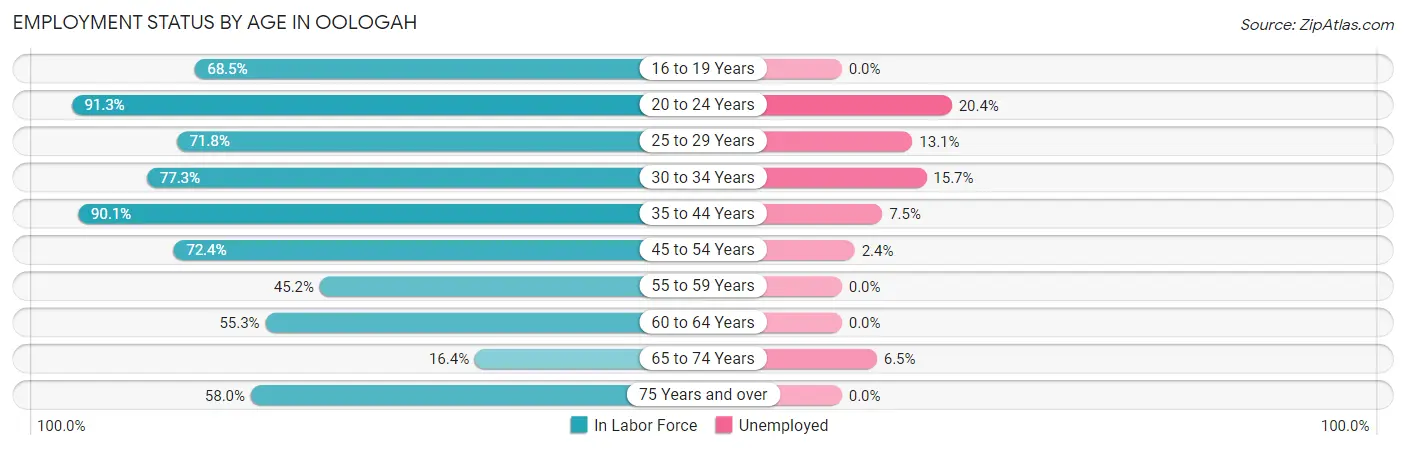
| Age Bracket | In Labor Force | Unemployed |
| 16 to 19 Years | 126 (68.5%) | 0 (0.0%) |
| 20 to 24 Years | 157 (91.3%) | 32 (20.4%) |
| 25 to 29 Years | 84 (71.8%) | 11 (13.1%) |
| 30 to 34 Years | 51 (77.3%) | 8 (15.7%) |
| 35 to 44 Years | 173 (90.1%) | 13 (7.5%) |
| 45 to 54 Years | 168 (72.4%) | 4 (2.4%) |
| 55 to 59 Years | 28 (45.2%) | 0 (0.0%) |
| 60 to 64 Years | 52 (55.3%) | 0 (0.0%) |
| 65 to 74 Years | 31 (16.4%) | 2 (6.5%) |
| 75 Years and over | 58 (58.0%) | 0 (0.0%) |
| Total | 928 (65.9%) | 70 (7.5%) |
Employment Status by Educational Attainment in Oologah
According to labor force statistics for Oologah, 72.9% of individuals (556) out of the total population between 25 and 64 years of age (763) are in the labor force, with 6.5% or 36 of them being unemployed. The group with the highest labor force participation rate are those with the educational attainment of bachelor's degree or higher, with 81.9% or 95 individuals in the labor force. Within the labor force, individuals with high school diploma education have the highest percentage of unemployment, with 8.2% or 18 of them being unemployed.
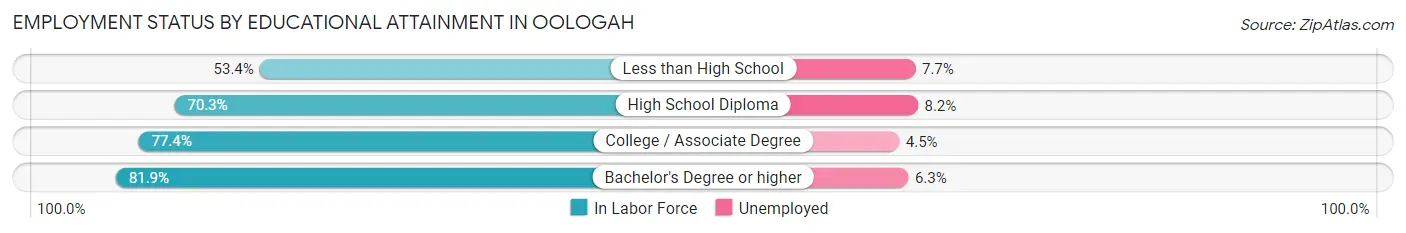
| Educational Attainment | In Labor Force | Unemployed |
| Less than High School | 39 (53.4%) | 6 (7.7%) |
| High School Diploma | 220 (70.3%) | 26 (8.2%) |
| College / Associate Degree | 202 (77.4%) | 12 (4.5%) |
| Bachelor's Degree or higher | 95 (81.9%) | 7 (6.3%) |
| Total | 556 (72.9%) | 50 (6.5%) |
Employment Occupations by Sex in Oologah
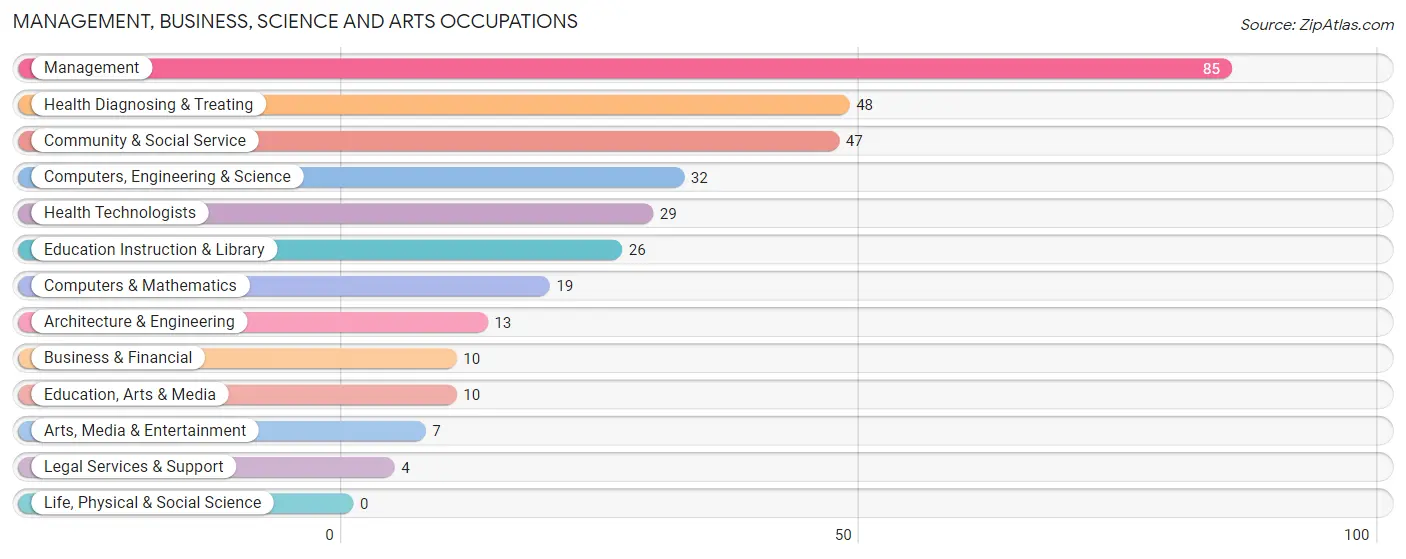
Management, Business, Science and Arts Occupations
The most common Management, Business, Science and Arts occupations in Oologah are Management (85 | 9.9%), Health Diagnosing & Treating (48 | 5.6%), Community & Social Service (47 | 5.5%), Computers, Engineering & Science (32 | 3.7%), and Health Technologists (29 | 3.4%).
Management, Business, Science and Arts Occupations by Sex
Within the Management, Business, Science and Arts occupations in Oologah, the most male-oriented occupations are Computers & Mathematics (100.0%), Legal Services & Support (100.0%), and Computers, Engineering & Science (87.5%), while the most female-oriented occupations are Business & Financial (100.0%), Arts, Media & Entertainment (100.0%), and Education Instruction & Library (88.5%).
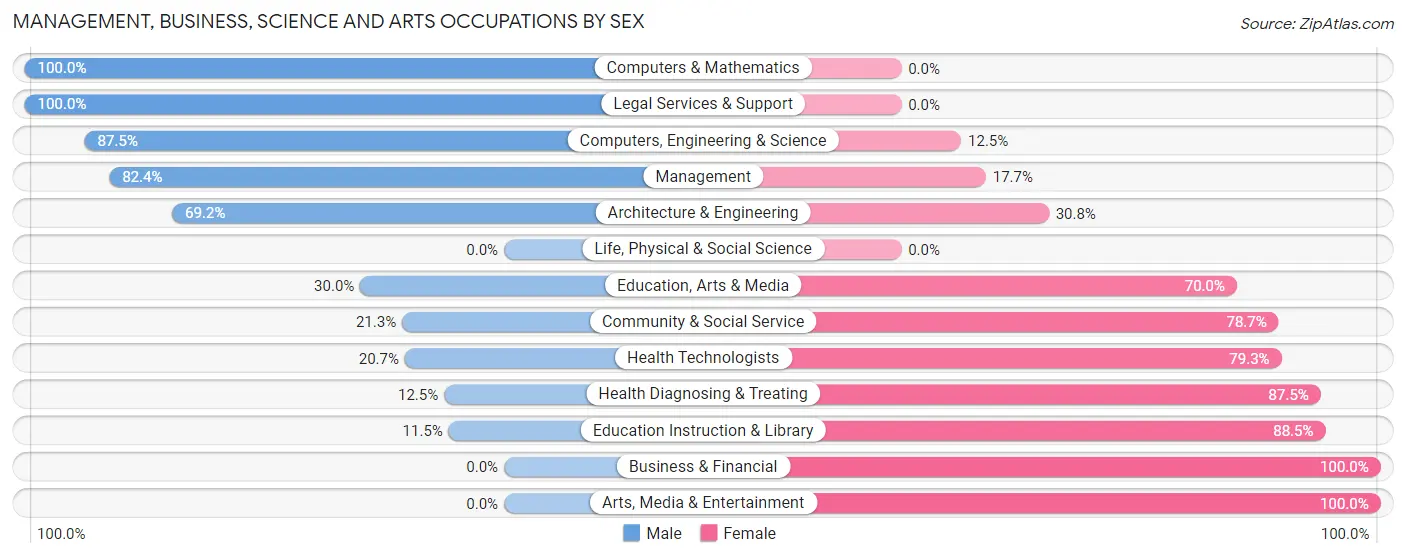
| Occupation | Male | Female |
| Management | 70 (82.4%) | 15 (17.6%) |
| Business & Financial | 0 (0.0%) | 10 (100.0%) |
| Computers, Engineering & Science | 28 (87.5%) | 4 (12.5%) |
| Computers & Mathematics | 19 (100.0%) | 0 (0.0%) |
| Architecture & Engineering | 9 (69.2%) | 4 (30.8%) |
| Life, Physical & Social Science | 0 (0.0%) | 0 (0.0%) |
| Community & Social Service | 10 (21.3%) | 37 (78.7%) |
| Education, Arts & Media | 3 (30.0%) | 7 (70.0%) |
| Legal Services & Support | 4 (100.0%) | 0 (0.0%) |
| Education Instruction & Library | 3 (11.5%) | 23 (88.5%) |
| Arts, Media & Entertainment | 0 (0.0%) | 7 (100.0%) |
| Health Diagnosing & Treating | 6 (12.5%) | 42 (87.5%) |
| Health Technologists | 6 (20.7%) | 23 (79.3%) |
| Total (Category) | 114 (51.3%) | 108 (48.6%) |
| Total (Overall) | 495 (57.7%) | 363 (42.3%) |
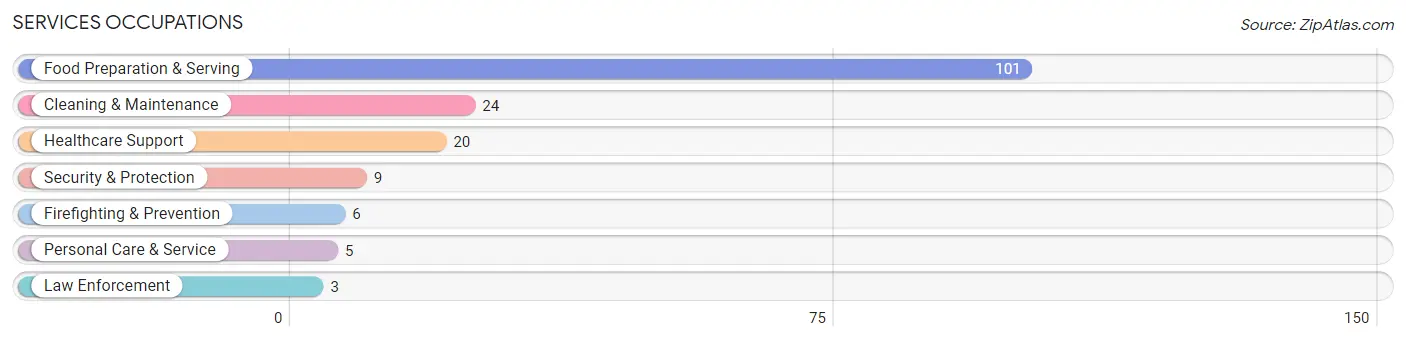
Services Occupations
The most common Services occupations in Oologah are Food Preparation & Serving (101 | 11.8%), Cleaning & Maintenance (24 | 2.8%), Healthcare Support (20 | 2.3%), Security & Protection (9 | 1.1%), and Firefighting & Prevention (6 | 0.7%).
Services Occupations by Sex
Within the Services occupations in Oologah, the most male-oriented occupations are Security & Protection (100.0%), Firefighting & Prevention (100.0%), and Law Enforcement (100.0%), while the most female-oriented occupations are Healthcare Support (100.0%), Personal Care & Service (100.0%), and Cleaning & Maintenance (29.2%).
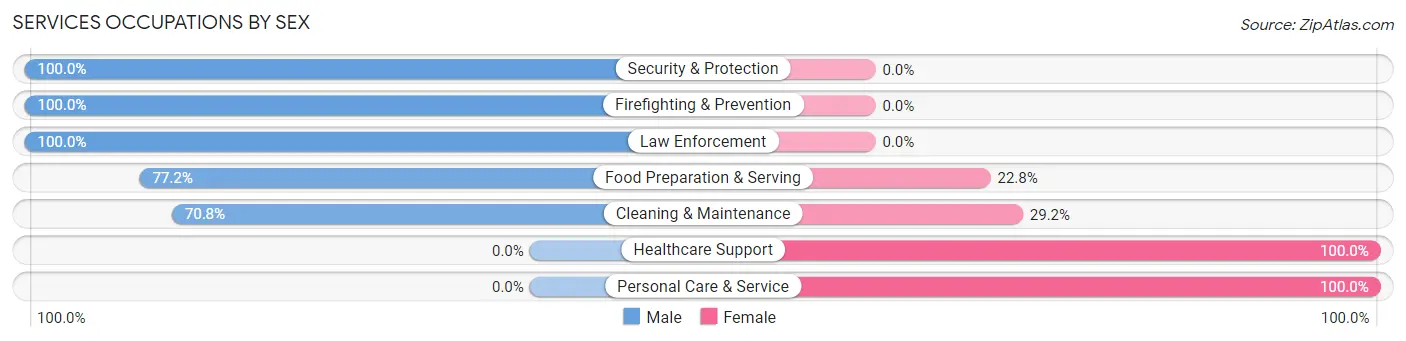
| Occupation | Male | Female |
| Healthcare Support | 0 (0.0%) | 20 (100.0%) |
| Security & Protection | 9 (100.0%) | 0 (0.0%) |
| Firefighting & Prevention | 6 (100.0%) | 0 (0.0%) |
| Law Enforcement | 3 (100.0%) | 0 (0.0%) |
| Food Preparation & Serving | 78 (77.2%) | 23 (22.8%) |
| Cleaning & Maintenance | 17 (70.8%) | 7 (29.2%) |
| Personal Care & Service | 0 (0.0%) | 5 (100.0%) |
| Total (Category) | 104 (65.4%) | 55 (34.6%) |
| Total (Overall) | 495 (57.7%) | 363 (42.3%) |
Sales and Office Occupations
The most common Sales and Office occupations in Oologah are Office & Administration (137 | 16.0%), and Sales & Related (93 | 10.8%).
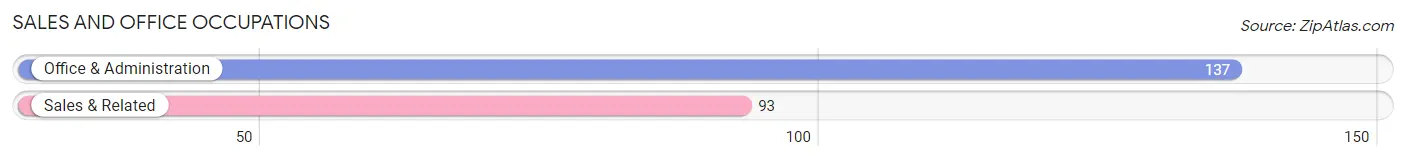
Sales and Office Occupations by Sex
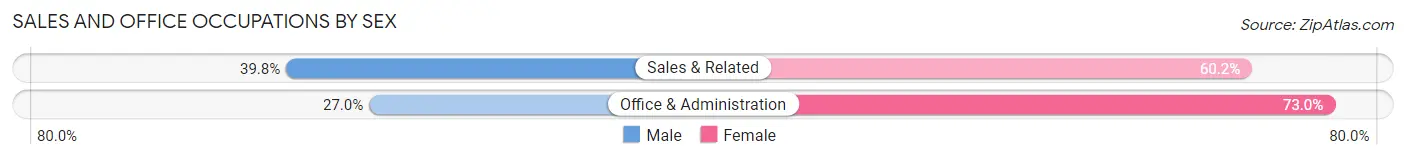
| Occupation | Male | Female |
| Sales & Related | 37 (39.8%) | 56 (60.2%) |
| Office & Administration | 37 (27.0%) | 100 (73.0%) |
| Total (Category) | 74 (32.2%) | 156 (67.8%) |
| Total (Overall) | 495 (57.7%) | 363 (42.3%) |
Natural Resources, Construction and Maintenance Occupations
The most common Natural Resources, Construction and Maintenance occupations in Oologah are Installation, Maintenance & Repair (75 | 8.7%), Construction & Extraction (50 | 5.8%), and Farming, Fishing & Forestry (4 | 0.5%).
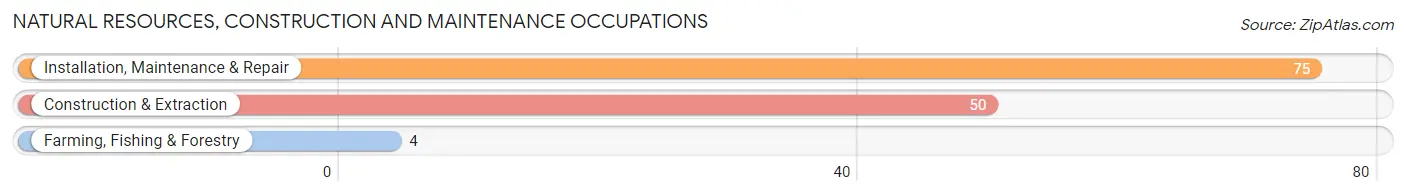
Natural Resources, Construction and Maintenance Occupations by Sex
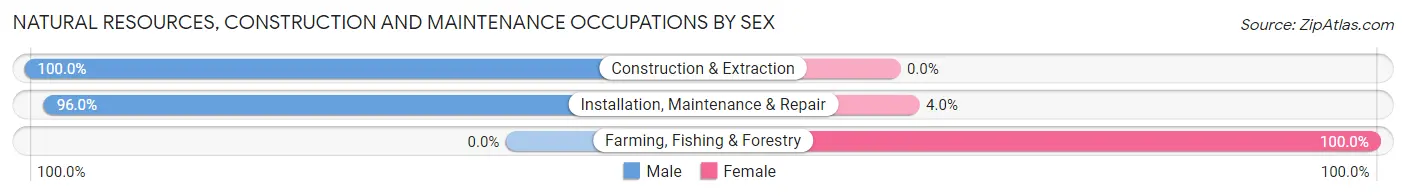
| Occupation | Male | Female |
| Farming, Fishing & Forestry | 0 (0.0%) | 4 (100.0%) |
| Construction & Extraction | 50 (100.0%) | 0 (0.0%) |
| Installation, Maintenance & Repair | 72 (96.0%) | 3 (4.0%) |
| Total (Category) | 122 (94.6%) | 7 (5.4%) |
| Total (Overall) | 495 (57.7%) | 363 (42.3%) |
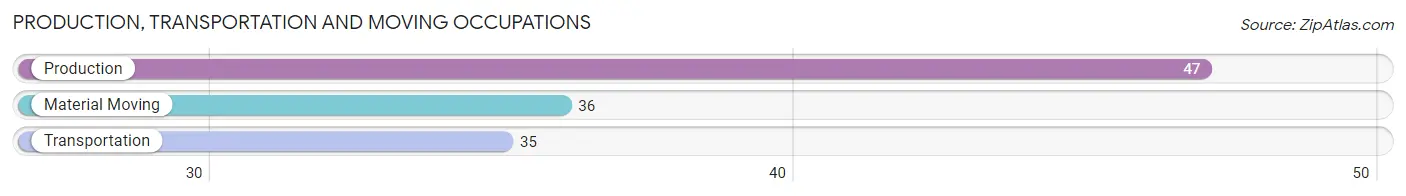
Production, Transportation and Moving Occupations
The most common Production, Transportation and Moving occupations in Oologah are Production (47 | 5.5%), Material Moving (36 | 4.2%), and Transportation (35 | 4.1%).
Production, Transportation and Moving Occupations by Sex
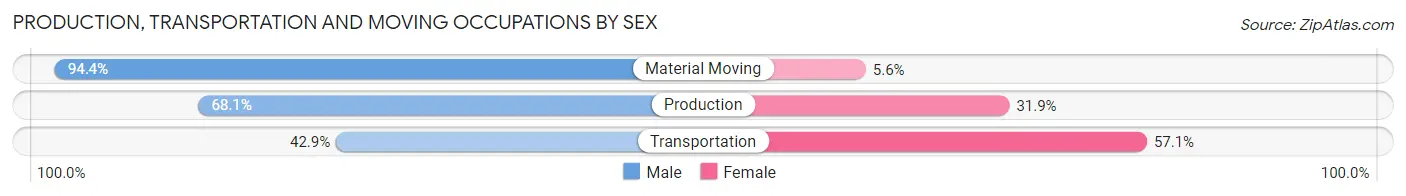
| Occupation | Male | Female |
| Production | 32 (68.1%) | 15 (31.9%) |
| Transportation | 15 (42.9%) | 20 (57.1%) |
| Material Moving | 34 (94.4%) | 2 (5.6%) |
| Total (Category) | 81 (68.6%) | 37 (31.4%) |
| Total (Overall) | 495 (57.7%) | 363 (42.3%) |
Employment Industries by Sex in Oologah
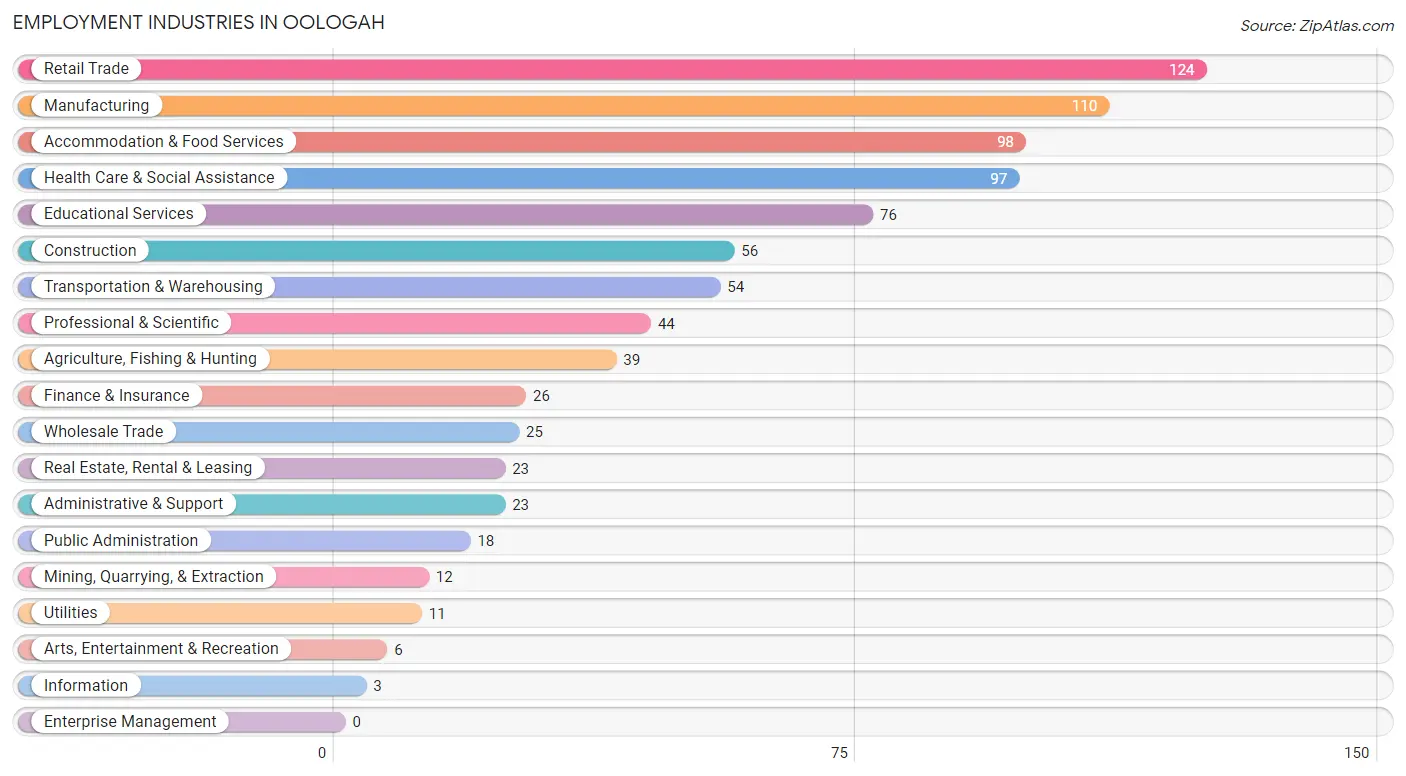
Employment Industries in Oologah
The major employment industries in Oologah include Retail Trade (124 | 14.4%), Manufacturing (110 | 12.8%), Accommodation & Food Services (98 | 11.4%), Health Care & Social Assistance (97 | 11.3%), and Educational Services (76 | 8.9%).
Employment Industries by Sex in Oologah
The Oologah industries that see more men than women are Utilities (100.0%), Real Estate, Rental & Leasing (100.0%), and Agriculture, Fishing & Hunting (89.7%), whereas the industries that tend to have a higher number of women are Information (100.0%), Health Care & Social Assistance (90.7%), and Professional & Scientific (75.0%).
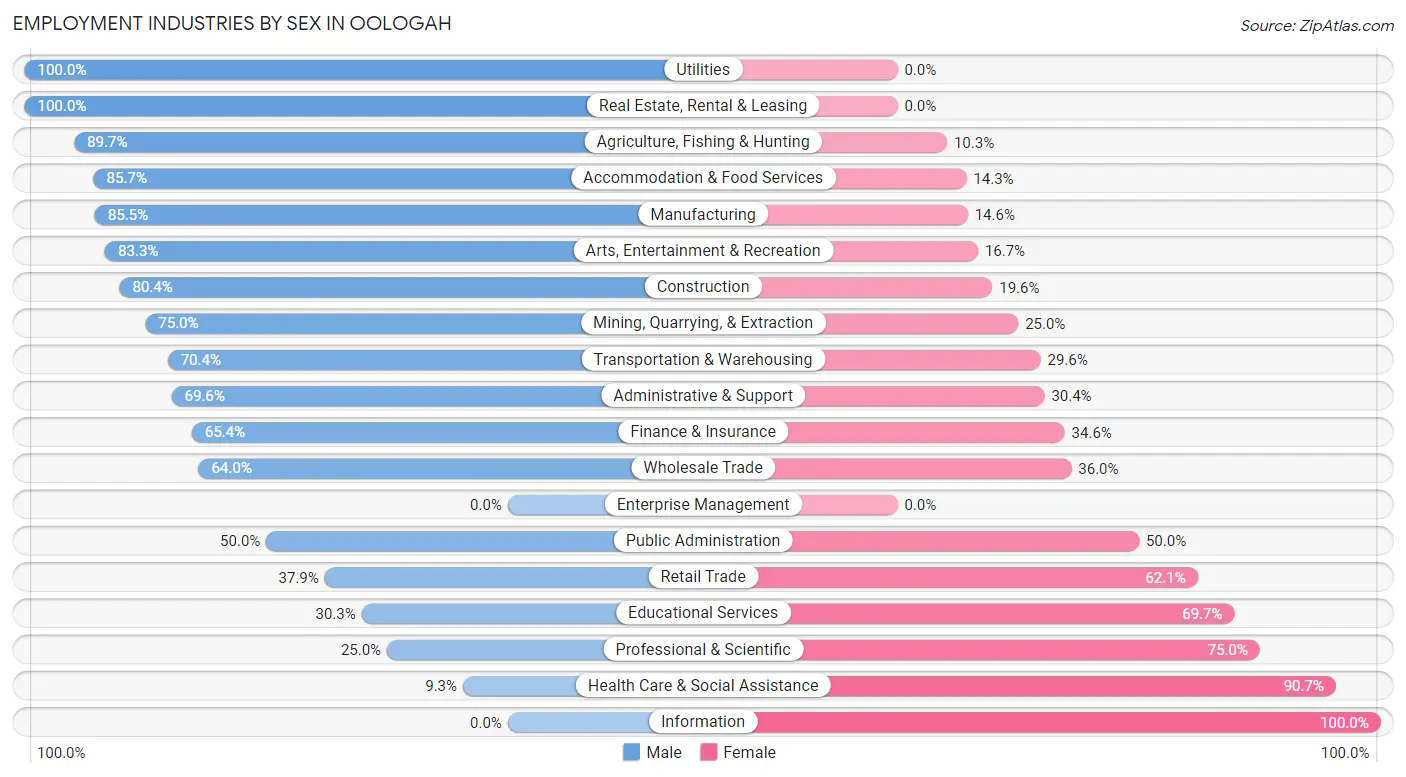
| Industry | Male | Female |
| Agriculture, Fishing & Hunting | 35 (89.7%) | 4 (10.3%) |
| Mining, Quarrying, & Extraction | 9 (75.0%) | 3 (25.0%) |
| Construction | 45 (80.4%) | 11 (19.6%) |
| Manufacturing | 94 (85.5%) | 16 (14.5%) |
| Wholesale Trade | 16 (64.0%) | 9 (36.0%) |
| Retail Trade | 47 (37.9%) | 77 (62.1%) |
| Transportation & Warehousing | 38 (70.4%) | 16 (29.6%) |
| Utilities | 11 (100.0%) | 0 (0.0%) |
| Information | 0 (0.0%) | 3 (100.0%) |
| Finance & Insurance | 17 (65.4%) | 9 (34.6%) |
| Real Estate, Rental & Leasing | 23 (100.0%) | 0 (0.0%) |
| Professional & Scientific | 11 (25.0%) | 33 (75.0%) |
| Enterprise Management | 0 (0.0%) | 0 (0.0%) |
| Administrative & Support | 16 (69.6%) | 7 (30.4%) |
| Educational Services | 23 (30.3%) | 53 (69.7%) |
| Health Care & Social Assistance | 9 (9.3%) | 88 (90.7%) |
| Arts, Entertainment & Recreation | 5 (83.3%) | 1 (16.7%) |
| Accommodation & Food Services | 84 (85.7%) | 14 (14.3%) |
| Public Administration | 9 (50.0%) | 9 (50.0%) |
| Total | 495 (57.7%) | 363 (42.3%) |
Education in Oologah
School Enrollment in Oologah
The most common levels of schooling among the 496 students in Oologah are high school (183 | 36.9%), middle school (94 | 19.0%), and college / undergraduate (94 | 19.0%).
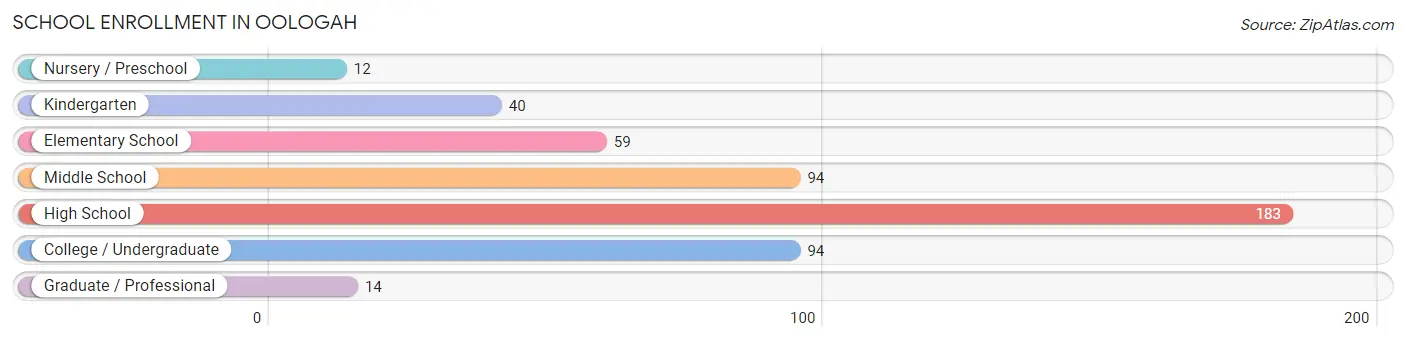
| School Level | # Students | % Students |
| Nursery / Preschool | 12 | 2.4% |
| Kindergarten | 40 | 8.1% |
| Elementary School | 59 | 11.9% |
| Middle School | 94 | 19.0% |
| High School | 183 | 36.9% |
| College / Undergraduate | 94 | 19.0% |
| Graduate / Professional | 14 | 2.8% |
| Total | 496 | 100.0% |
School Enrollment by Age by Funding Source in Oologah
Out of a total of 496 students who are enrolled in schools in Oologah, 77 (15.5%) attend a private institution, while the remaining 419 (84.5%) are enrolled in public schools. The age group of 20 to 24 year olds has the highest likelihood of being enrolled in private schools, with 17 (51.5% in the age bracket) enrolled. Conversely, the age group of 35 years and over has the lowest likelihood of being enrolled in a private school, with 22 (100.0% in the age bracket) attending a public institution.
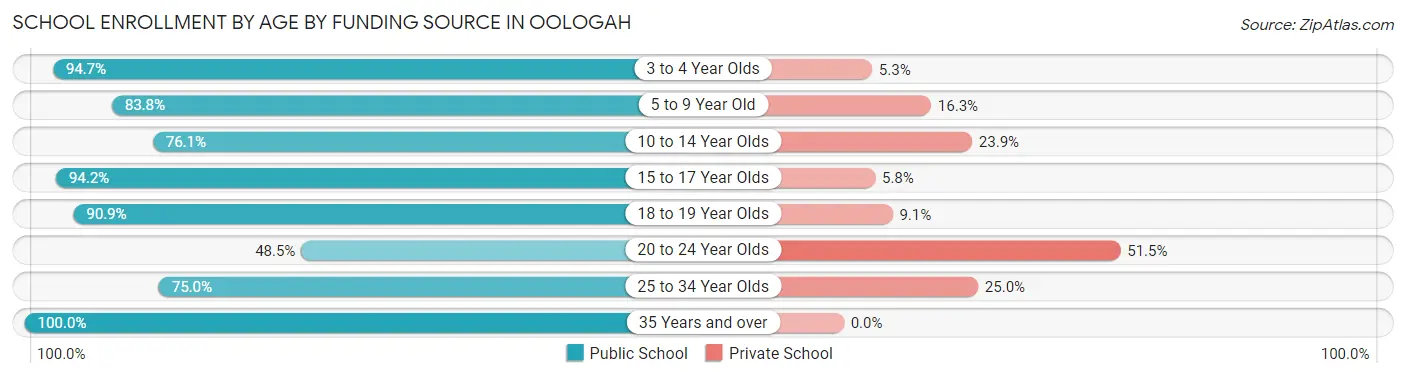
| Age Bracket | Public School | Private School |
| 3 to 4 Year Olds | 18 (94.7%) | 1 (5.3%) |
| 5 to 9 Year Old | 67 (83.8%) | 13 (16.3%) |
| 10 to 14 Year Olds | 86 (76.1%) | 27 (23.9%) |
| 15 to 17 Year Olds | 145 (94.2%) | 9 (5.8%) |
| 18 to 19 Year Olds | 50 (90.9%) | 5 (9.1%) |
| 20 to 24 Year Olds | 16 (48.5%) | 17 (51.5%) |
| 25 to 34 Year Olds | 15 (75.0%) | 5 (25.0%) |
| 35 Years and over | 22 (100.0%) | 0 (0.0%) |
| Total | 419 (84.5%) | 77 (15.5%) |
Educational Attainment by Field of Study in Oologah
Education (69 | 35.9%), business (43 | 22.4%), psychology (13 | 6.8%), liberal arts & history (12 | 6.2%), and bio, nature & agricultural (10 | 5.2%) are the most common fields of study among 192 individuals in Oologah who have obtained a bachelor's degree or higher.
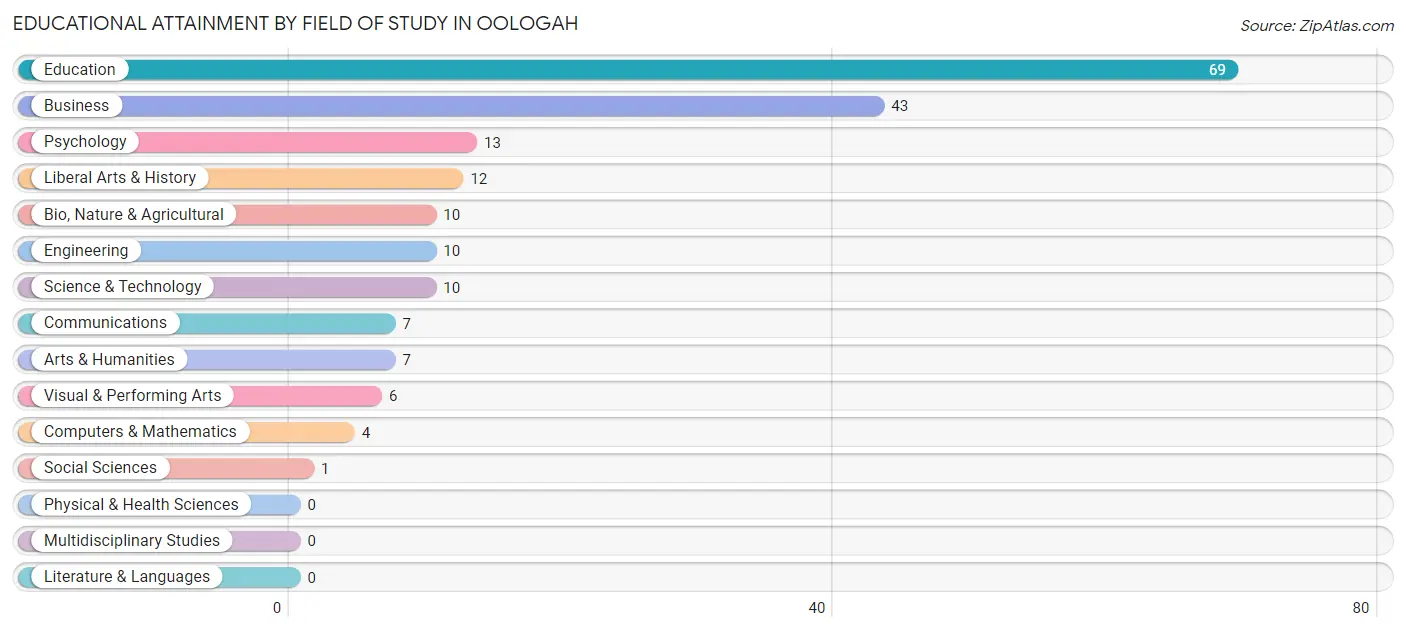
| Field of Study | # Graduates | % Graduates |
| Computers & Mathematics | 4 | 2.1% |
| Bio, Nature & Agricultural | 10 | 5.2% |
| Physical & Health Sciences | 0 | 0.0% |
| Psychology | 13 | 6.8% |
| Social Sciences | 1 | 0.5% |
| Engineering | 10 | 5.2% |
| Multidisciplinary Studies | 0 | 0.0% |
| Science & Technology | 10 | 5.2% |
| Business | 43 | 22.4% |
| Education | 69 | 35.9% |
| Literature & Languages | 0 | 0.0% |
| Liberal Arts & History | 12 | 6.2% |
| Visual & Performing Arts | 6 | 3.1% |
| Communications | 7 | 3.6% |
| Arts & Humanities | 7 | 3.6% |
| Total | 192 | 100.0% |
Transportation & Commute in Oologah
Vehicle Availability by Sex in Oologah
The most prevalent vehicle ownership categories in Oologah are males with 2 vehicles (129, accounting for 30.6%) and females with 2 vehicles (151, making up 35.8%).
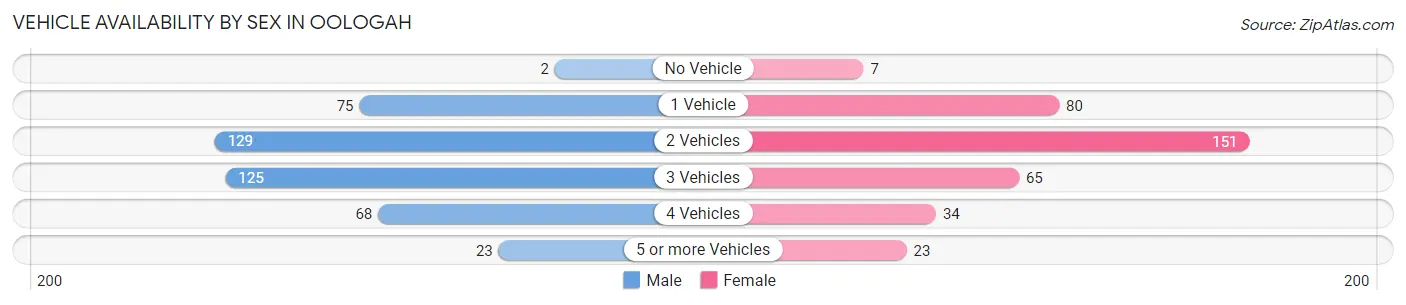
| Vehicles Available | Male | Female |
| No Vehicle | 2 (0.5%) | 7 (1.9%) |
| 1 Vehicle | 75 (17.8%) | 80 (22.2%) |
| 2 Vehicles | 129 (30.6%) | 151 (41.9%) |
| 3 Vehicles | 125 (29.6%) | 65 (18.1%) |
| 4 Vehicles | 68 (16.1%) | 34 (9.4%) |
| 5 or more Vehicles | 23 (5.4%) | 23 (6.4%) |
| Total | 422 (100.0%) | 360 (100.0%) |
Commute Time in Oologah
The most frequently occuring commute durations in Oologah are 20 to 24 minutes (112 commuters, 16.0%), 30 to 34 minutes (105 commuters, 15.0%), and 15 to 19 minutes (81 commuters, 11.6%).
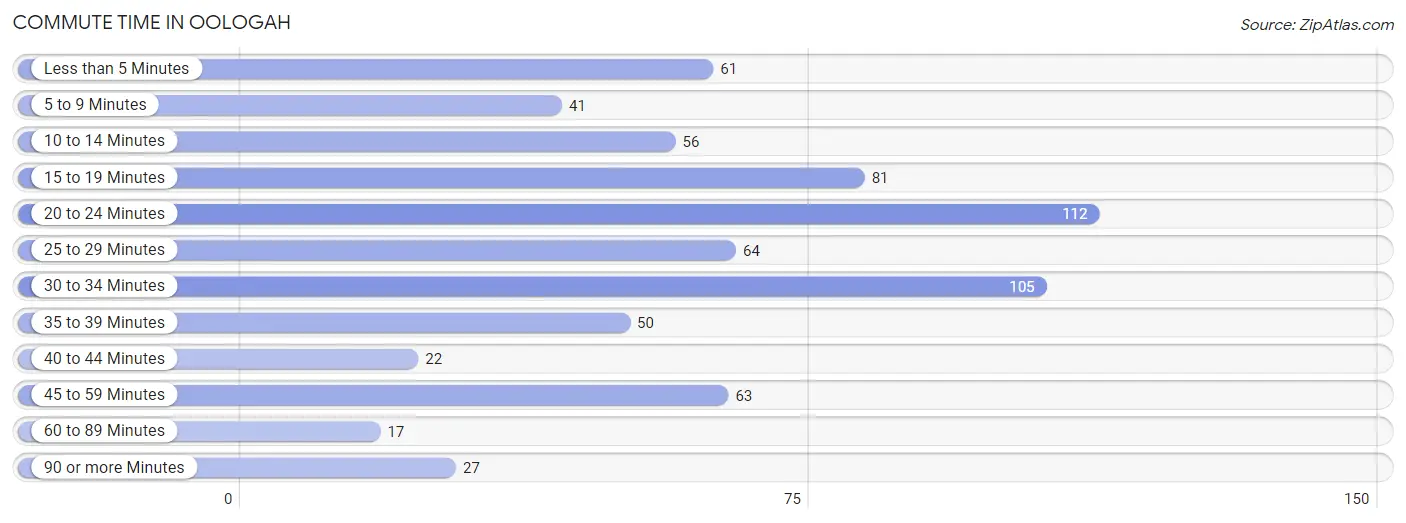
| Commute Time | # Commuters | % Commuters |
| Less than 5 Minutes | 61 | 8.7% |
| 5 to 9 Minutes | 41 | 5.9% |
| 10 to 14 Minutes | 56 | 8.0% |
| 15 to 19 Minutes | 81 | 11.6% |
| 20 to 24 Minutes | 112 | 16.0% |
| 25 to 29 Minutes | 64 | 9.2% |
| 30 to 34 Minutes | 105 | 15.0% |
| 35 to 39 Minutes | 50 | 7.1% |
| 40 to 44 Minutes | 22 | 3.2% |
| 45 to 59 Minutes | 63 | 9.0% |
| 60 to 89 Minutes | 17 | 2.4% |
| 90 or more Minutes | 27 | 3.9% |
Commute Time by Sex in Oologah
The most common commute times in Oologah are 30 to 34 minutes (58 commuters, 15.6%) for males and 20 to 24 minutes (64 commuters, 19.6%) for females.
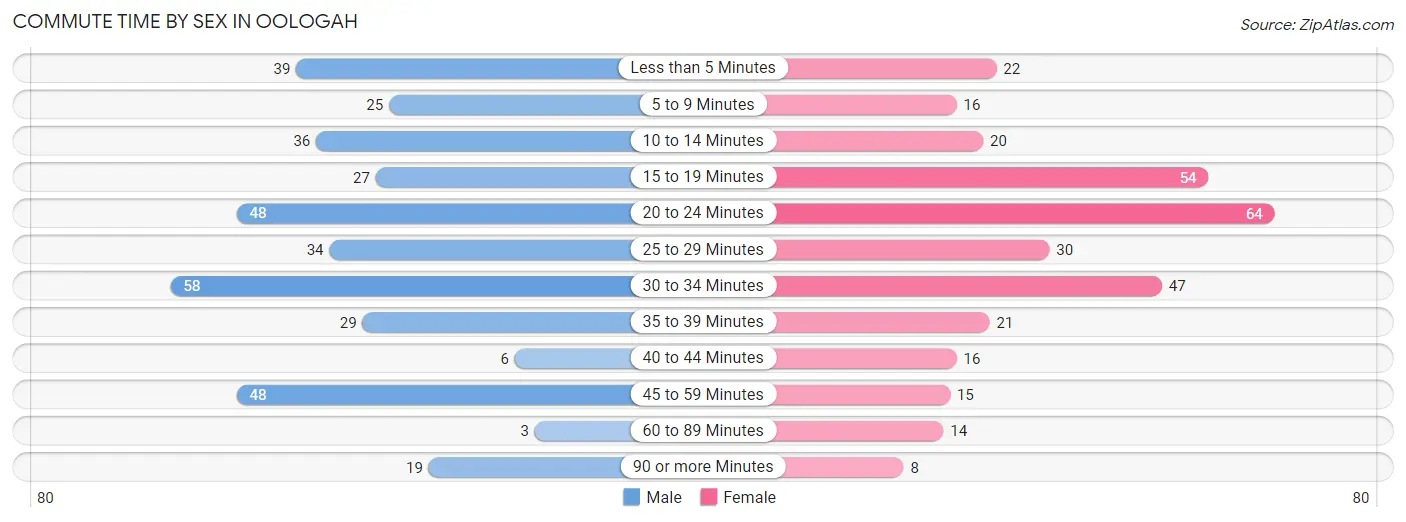
| Commute Time | Male | Female |
| Less than 5 Minutes | 39 (10.5%) | 22 (6.7%) |
| 5 to 9 Minutes | 25 (6.7%) | 16 (4.9%) |
| 10 to 14 Minutes | 36 (9.7%) | 20 (6.1%) |
| 15 to 19 Minutes | 27 (7.3%) | 54 (16.5%) |
| 20 to 24 Minutes | 48 (12.9%) | 64 (19.6%) |
| 25 to 29 Minutes | 34 (9.1%) | 30 (9.2%) |
| 30 to 34 Minutes | 58 (15.6%) | 47 (14.4%) |
| 35 to 39 Minutes | 29 (7.8%) | 21 (6.4%) |
| 40 to 44 Minutes | 6 (1.6%) | 16 (4.9%) |
| 45 to 59 Minutes | 48 (12.9%) | 15 (4.6%) |
| 60 to 89 Minutes | 3 (0.8%) | 14 (4.3%) |
| 90 or more Minutes | 19 (5.1%) | 8 (2.5%) |
Time of Departure to Work by Sex in Oologah
The most frequent times of departure to work in Oologah are 12:00 AM to 4:59 AM (107, 28.8%) for males and 6:30 AM to 6:59 AM (48, 14.7%) for females.
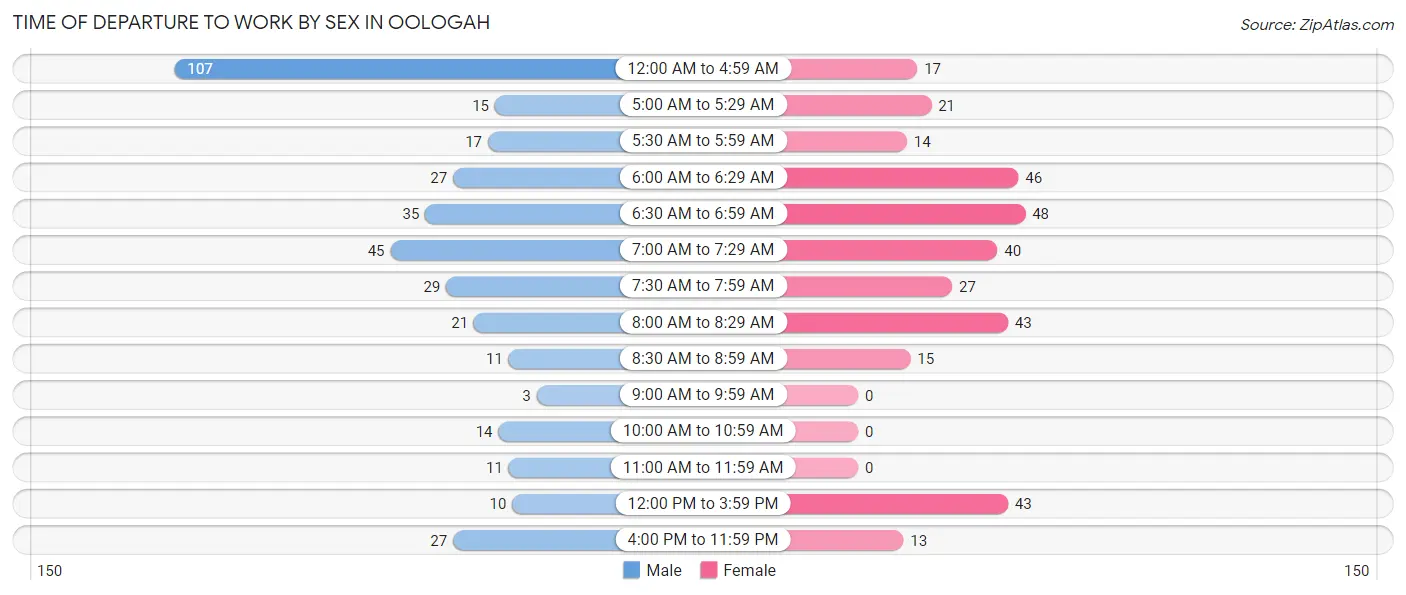
| Time of Departure | Male | Female |
| 12:00 AM to 4:59 AM | 107 (28.8%) | 17 (5.2%) |
| 5:00 AM to 5:29 AM | 15 (4.0%) | 21 (6.4%) |
| 5:30 AM to 5:59 AM | 17 (4.6%) | 14 (4.3%) |
| 6:00 AM to 6:29 AM | 27 (7.3%) | 46 (14.1%) |
| 6:30 AM to 6:59 AM | 35 (9.4%) | 48 (14.7%) |
| 7:00 AM to 7:29 AM | 45 (12.1%) | 40 (12.2%) |
| 7:30 AM to 7:59 AM | 29 (7.8%) | 27 (8.3%) |
| 8:00 AM to 8:29 AM | 21 (5.7%) | 43 (13.2%) |
| 8:30 AM to 8:59 AM | 11 (3.0%) | 15 (4.6%) |
| 9:00 AM to 9:59 AM | 3 (0.8%) | 0 (0.0%) |
| 10:00 AM to 10:59 AM | 14 (3.8%) | 0 (0.0%) |
| 11:00 AM to 11:59 AM | 11 (3.0%) | 0 (0.0%) |
| 12:00 PM to 3:59 PM | 10 (2.7%) | 43 (13.2%) |
| 4:00 PM to 11:59 PM | 27 (7.3%) | 13 (4.0%) |
| Total | 372 (100.0%) | 327 (100.0%) |
Housing Occupancy in Oologah
Occupancy by Ownership in Oologah
Of the total 683 dwellings in Oologah, owner-occupied units account for 455 (66.6%), while renter-occupied units make up 228 (33.4%).
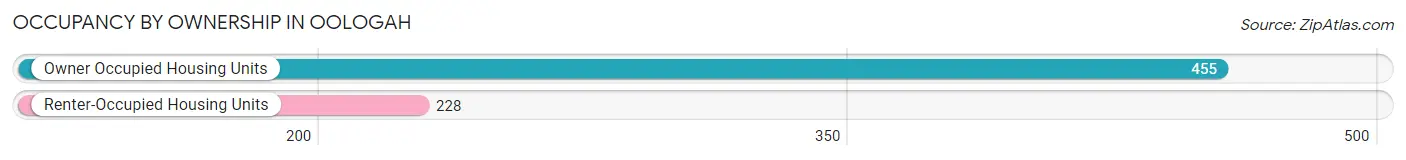
| Occupancy | # Housing Units | % Housing Units |
| Owner Occupied Housing Units | 455 | 66.6% |
| Renter-Occupied Housing Units | 228 | 33.4% |
| Total Occupied Housing Units | 683 | 100.0% |
Occupancy by Household Size in Oologah
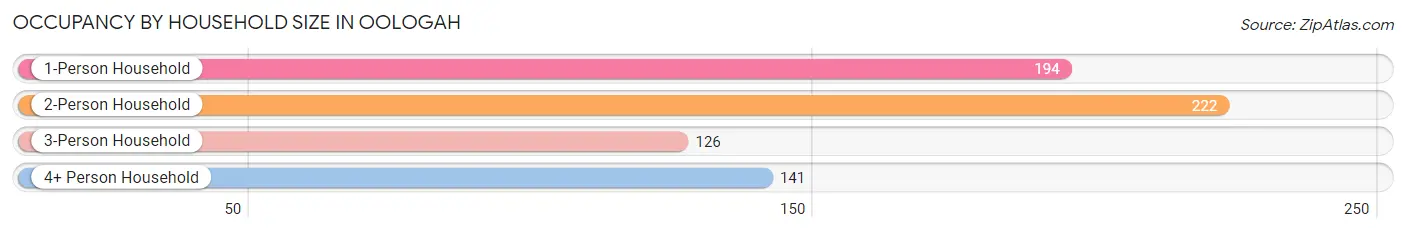
| Household Size | # Housing Units | % Housing Units |
| 1-Person Household | 194 | 28.4% |
| 2-Person Household | 222 | 32.5% |
| 3-Person Household | 126 | 18.4% |
| 4+ Person Household | 141 | 20.6% |
| Total Housing Units | 683 | 100.0% |
Occupancy by Ownership by Household Size in Oologah
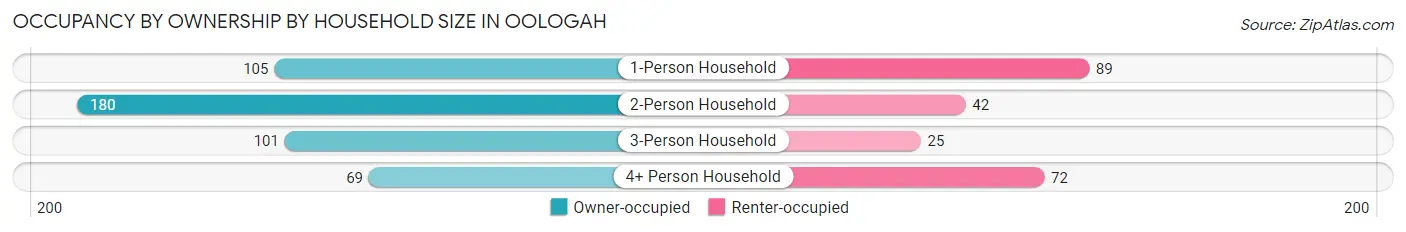
| Household Size | Owner-occupied | Renter-occupied |
| 1-Person Household | 105 (54.1%) | 89 (45.9%) |
| 2-Person Household | 180 (81.1%) | 42 (18.9%) |
| 3-Person Household | 101 (80.2%) | 25 (19.8%) |
| 4+ Person Household | 69 (48.9%) | 72 (51.1%) |
| Total Housing Units | 455 (66.6%) | 228 (33.4%) |
Occupancy by Educational Attainment in Oologah
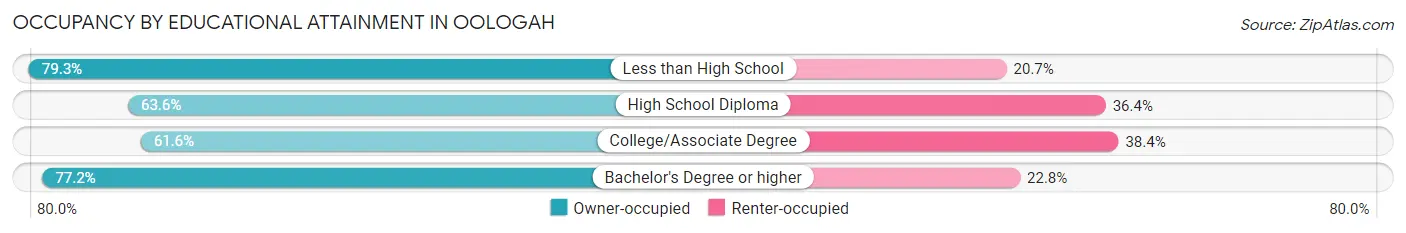
| Household Size | Owner-occupied | Renter-occupied |
| Less than High School | 46 (79.3%) | 12 (20.7%) |
| High School Diploma | 138 (63.6%) | 79 (36.4%) |
| College/Associate Degree | 173 (61.6%) | 108 (38.4%) |
| Bachelor's Degree or higher | 98 (77.2%) | 29 (22.8%) |
Occupancy by Age of Householder in Oologah
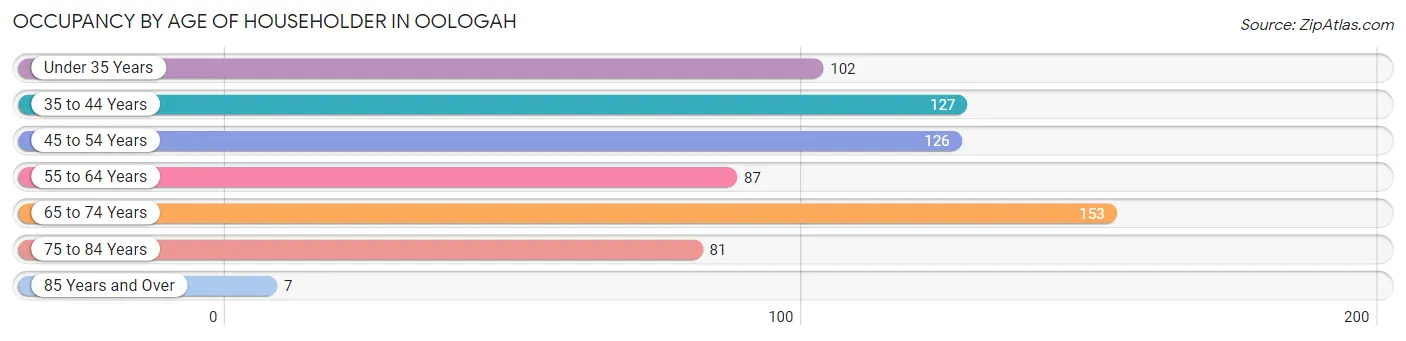
| Age Bracket | # Households | % Households |
| Under 35 Years | 102 | 14.9% |
| 35 to 44 Years | 127 | 18.6% |
| 45 to 54 Years | 126 | 18.4% |
| 55 to 64 Years | 87 | 12.7% |
| 65 to 74 Years | 153 | 22.4% |
| 75 to 84 Years | 81 | 11.9% |
| 85 Years and Over | 7 | 1.0% |
| Total | 683 | 100.0% |
Housing Finances in Oologah
Median Income by Occupancy in Oologah
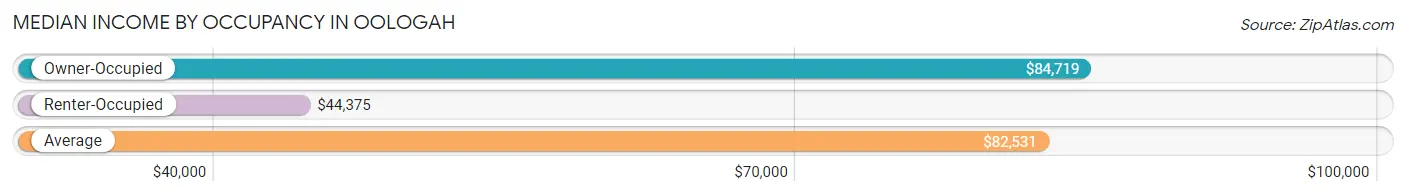
| Occupancy Type | # Households | Median Income |
| Owner-Occupied | 455 (66.6%) | $84,719 |
| Renter-Occupied | 228 (33.4%) | $44,375 |
| Average | 683 (100.0%) | $82,531 |
Occupancy by Householder Income Bracket in Oologah
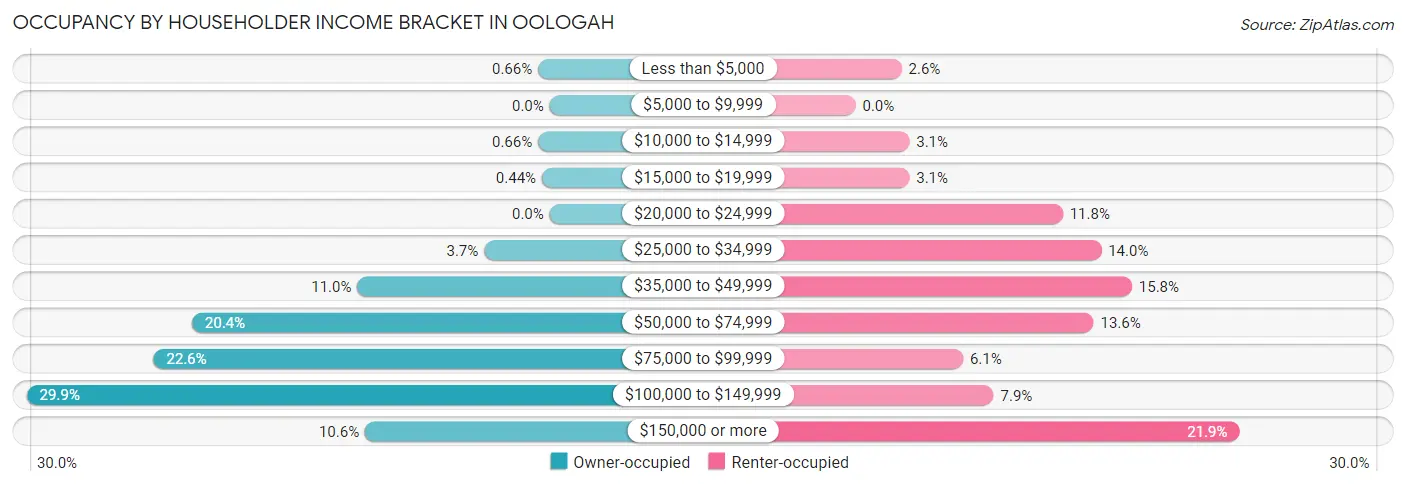
| Income Bracket | Owner-occupied | Renter-occupied |
| Less than $5,000 | 3 (0.7%) | 6 (2.6%) |
| $5,000 to $9,999 | 0 (0.0%) | 0 (0.0%) |
| $10,000 to $14,999 | 3 (0.7%) | 7 (3.1%) |
| $15,000 to $19,999 | 2 (0.4%) | 7 (3.1%) |
| $20,000 to $24,999 | 0 (0.0%) | 27 (11.8%) |
| $25,000 to $34,999 | 17 (3.7%) | 32 (14.0%) |
| $35,000 to $49,999 | 50 (11.0%) | 36 (15.8%) |
| $50,000 to $74,999 | 93 (20.4%) | 31 (13.6%) |
| $75,000 to $99,999 | 103 (22.6%) | 14 (6.1%) |
| $100,000 to $149,999 | 136 (29.9%) | 18 (7.9%) |
| $150,000 or more | 48 (10.5%) | 50 (21.9%) |
| Total | 455 (100.0%) | 228 (100.0%) |
Monthly Housing Cost Tiers in Oologah
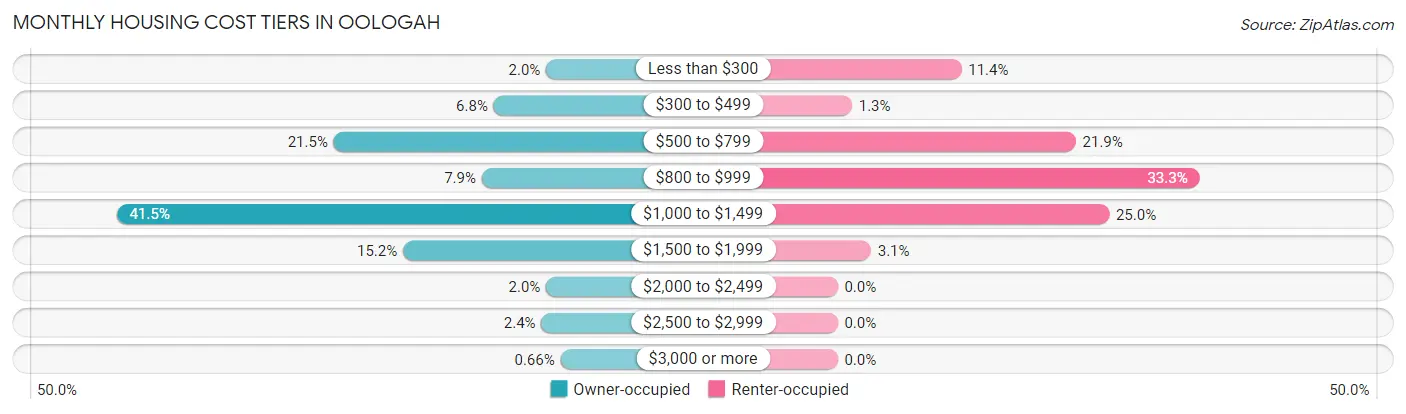
| Monthly Cost | Owner-occupied | Renter-occupied |
| Less than $300 | 9 (2.0%) | 26 (11.4%) |
| $300 to $499 | 31 (6.8%) | 3 (1.3%) |
| $500 to $799 | 98 (21.5%) | 50 (21.9%) |
| $800 to $999 | 36 (7.9%) | 76 (33.3%) |
| $1,000 to $1,499 | 189 (41.5%) | 57 (25.0%) |
| $1,500 to $1,999 | 69 (15.2%) | 7 (3.1%) |
| $2,000 to $2,499 | 9 (2.0%) | 0 (0.0%) |
| $2,500 to $2,999 | 11 (2.4%) | 0 (0.0%) |
| $3,000 or more | 3 (0.7%) | 0 (0.0%) |
| Total | 455 (100.0%) | 228 (100.0%) |
Physical Housing Characteristics in Oologah
Housing Structures in Oologah
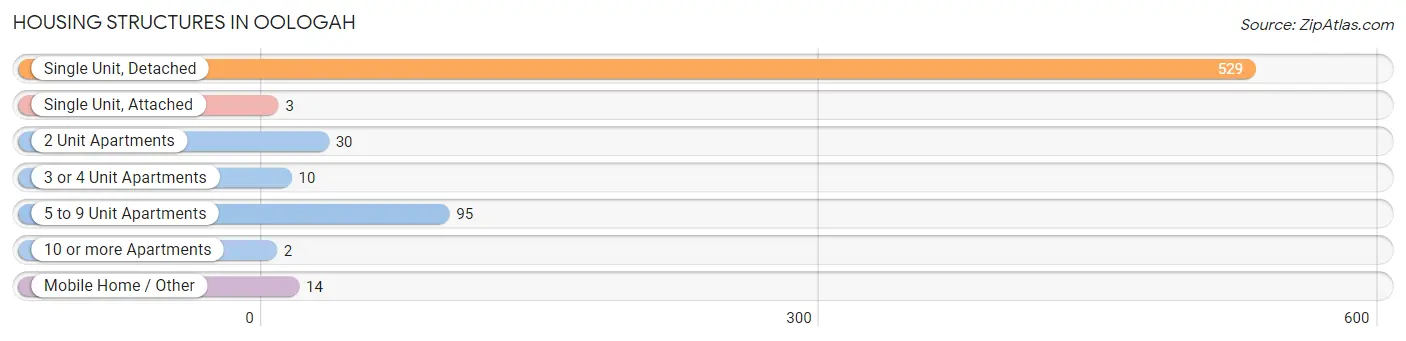
| Structure Type | # Housing Units | % Housing Units |
| Single Unit, Detached | 529 | 77.4% |
| Single Unit, Attached | 3 | 0.4% |
| 2 Unit Apartments | 30 | 4.4% |
| 3 or 4 Unit Apartments | 10 | 1.5% |
| 5 to 9 Unit Apartments | 95 | 13.9% |
| 10 or more Apartments | 2 | 0.3% |
| Mobile Home / Other | 14 | 2.1% |
| Total | 683 | 100.0% |
Housing Structures by Occupancy in Oologah
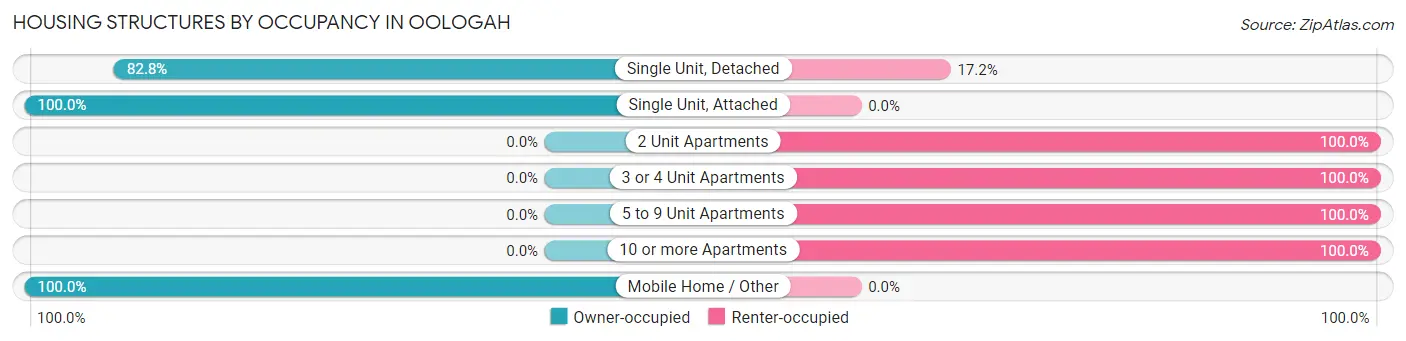
| Structure Type | Owner-occupied | Renter-occupied |
| Single Unit, Detached | 438 (82.8%) | 91 (17.2%) |
| Single Unit, Attached | 3 (100.0%) | 0 (0.0%) |
| 2 Unit Apartments | 0 (0.0%) | 30 (100.0%) |
| 3 or 4 Unit Apartments | 0 (0.0%) | 10 (100.0%) |
| 5 to 9 Unit Apartments | 0 (0.0%) | 95 (100.0%) |
| 10 or more Apartments | 0 (0.0%) | 2 (100.0%) |
| Mobile Home / Other | 14 (100.0%) | 0 (0.0%) |
| Total | 455 (66.6%) | 228 (33.4%) |
Housing Structures by Number of Rooms in Oologah
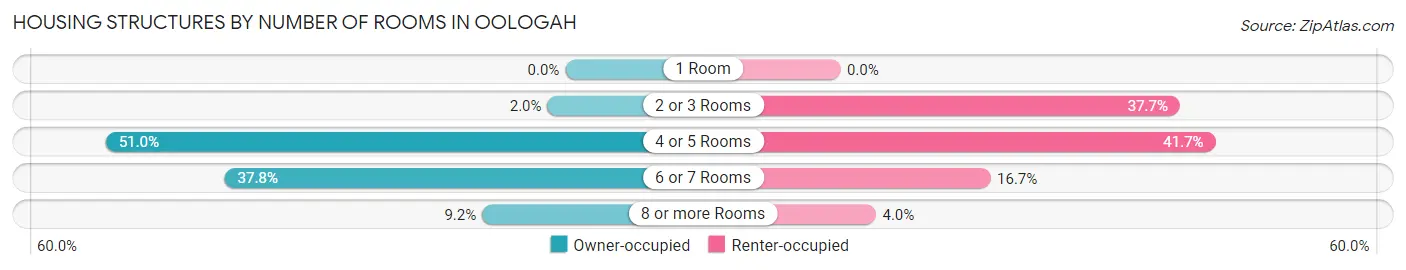
| Number of Rooms | Owner-occupied | Renter-occupied |
| 1 Room | 0 (0.0%) | 0 (0.0%) |
| 2 or 3 Rooms | 9 (2.0%) | 86 (37.7%) |
| 4 or 5 Rooms | 232 (51.0%) | 95 (41.7%) |
| 6 or 7 Rooms | 172 (37.8%) | 38 (16.7%) |
| 8 or more Rooms | 42 (9.2%) | 9 (4.0%) |
| Total | 455 (100.0%) | 228 (100.0%) |
Housing Structure by Heating Type in Oologah
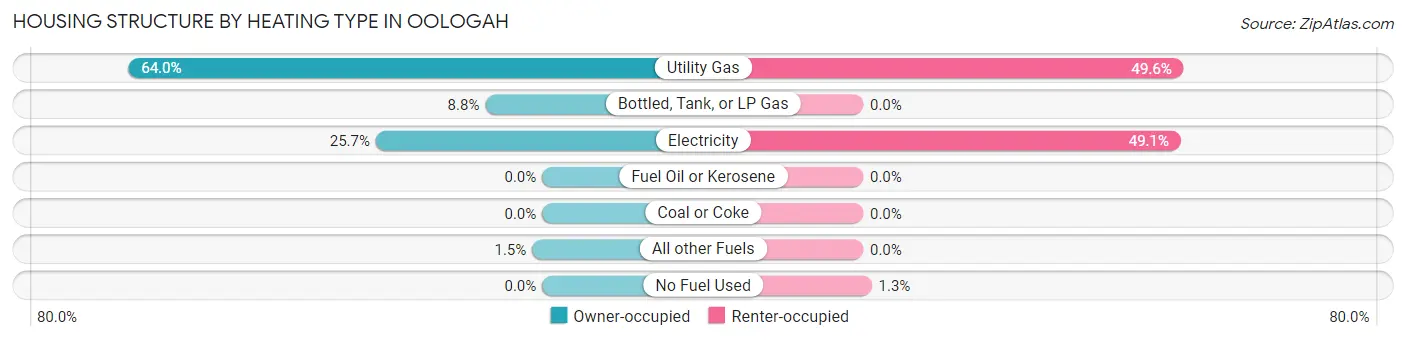
| Heating Type | Owner-occupied | Renter-occupied |
| Utility Gas | 291 (64.0%) | 113 (49.6%) |
| Bottled, Tank, or LP Gas | 40 (8.8%) | 0 (0.0%) |
| Electricity | 117 (25.7%) | 112 (49.1%) |
| Fuel Oil or Kerosene | 0 (0.0%) | 0 (0.0%) |
| Coal or Coke | 0 (0.0%) | 0 (0.0%) |
| All other Fuels | 7 (1.5%) | 0 (0.0%) |
| No Fuel Used | 0 (0.0%) | 3 (1.3%) |
| Total | 455 (100.0%) | 228 (100.0%) |
Household Vehicle Usage in Oologah
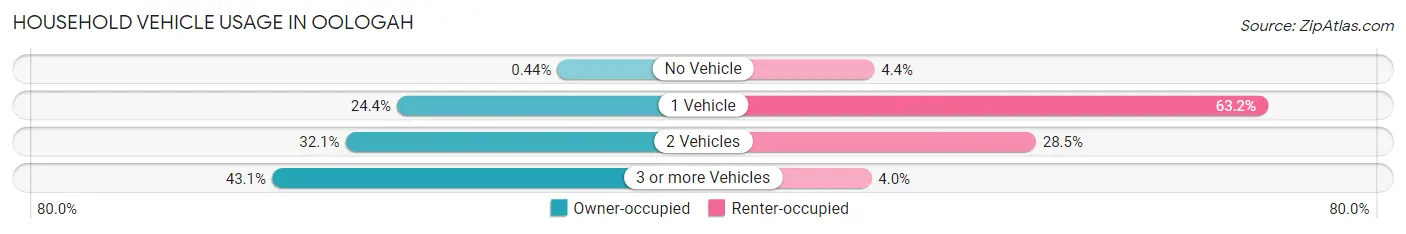
| Vehicles per Household | Owner-occupied | Renter-occupied |
| No Vehicle | 2 (0.4%) | 10 (4.4%) |
| 1 Vehicle | 111 (24.4%) | 144 (63.2%) |
| 2 Vehicles | 146 (32.1%) | 65 (28.5%) |
| 3 or more Vehicles | 196 (43.1%) | 9 (4.0%) |
| Total | 455 (100.0%) | 228 (100.0%) |
Real Estate & Mortgages in Oologah
Real Estate and Mortgage Overview in Oologah
| Characteristic | Without Mortgage | With Mortgage |
| Housing Units | 133 | 322 |
| Median Property Value | $227,100 | $173,800 |
| Median Household Income | $120,938 | $38 |
| Monthly Housing Costs | $545 | $3 |
| Real Estate Taxes | $1,262 | $32 |
Property Value by Mortgage Status in Oologah
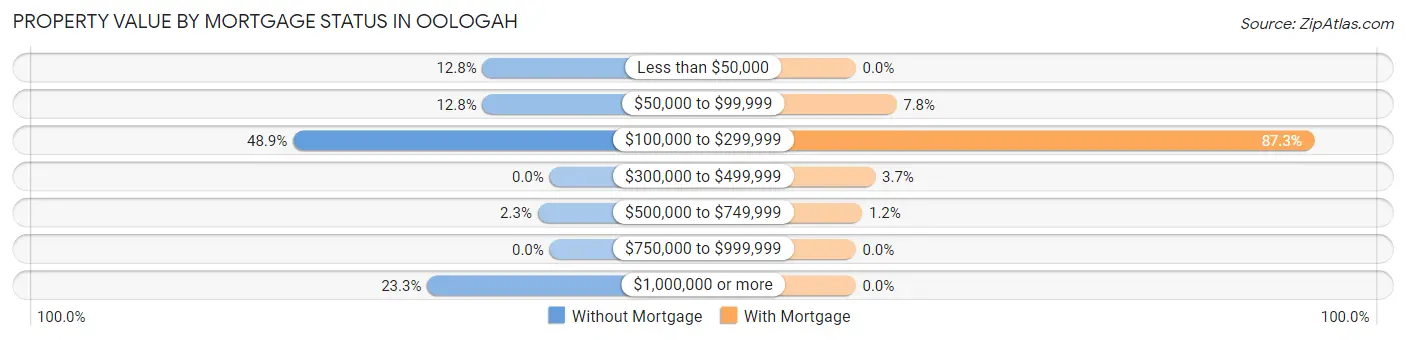
| Property Value | Without Mortgage | With Mortgage |
| Less than $50,000 | 17 (12.8%) | 0 (0.0%) |
| $50,000 to $99,999 | 17 (12.8%) | 25 (7.8%) |
| $100,000 to $299,999 | 65 (48.9%) | 281 (87.3%) |
| $300,000 to $499,999 | 0 (0.0%) | 12 (3.7%) |
| $500,000 to $749,999 | 3 (2.3%) | 4 (1.2%) |
| $750,000 to $999,999 | 0 (0.0%) | 0 (0.0%) |
| $1,000,000 or more | 31 (23.3%) | 0 (0.0%) |
| Total | 133 (100.0%) | 322 (100.0%) |
Household Income by Mortgage Status in Oologah
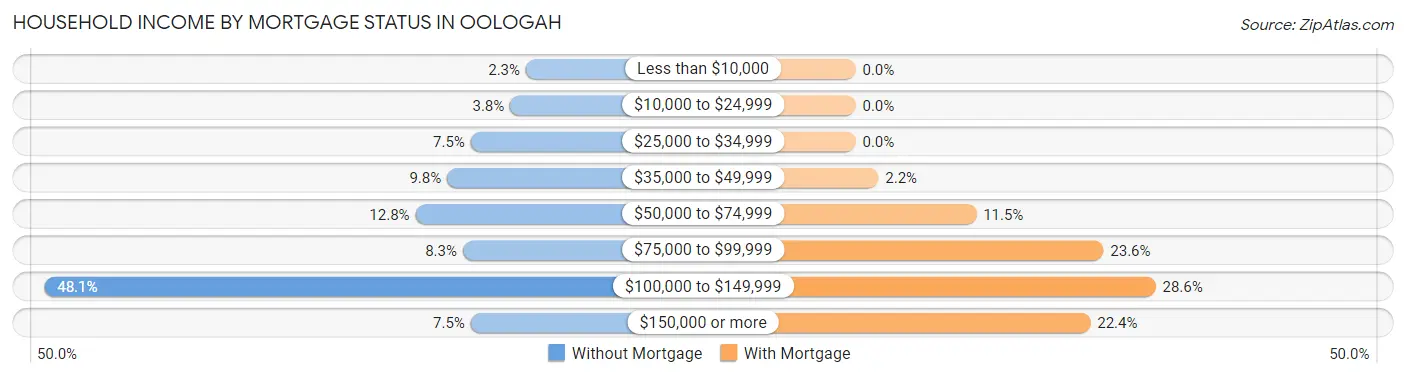
| Household Income | Without Mortgage | With Mortgage |
| Less than $10,000 | 3 (2.3%) | 0 (0.0%) |
| $10,000 to $24,999 | 5 (3.8%) | 0 (0.0%) |
| $25,000 to $34,999 | 10 (7.5%) | 0 (0.0%) |
| $35,000 to $49,999 | 13 (9.8%) | 7 (2.2%) |
| $50,000 to $74,999 | 17 (12.8%) | 37 (11.5%) |
| $75,000 to $99,999 | 11 (8.3%) | 76 (23.6%) |
| $100,000 to $149,999 | 64 (48.1%) | 92 (28.6%) |
| $150,000 or more | 10 (7.5%) | 72 (22.4%) |
| Total | 133 (100.0%) | 322 (100.0%) |
Property Value to Household Income Ratio in Oologah
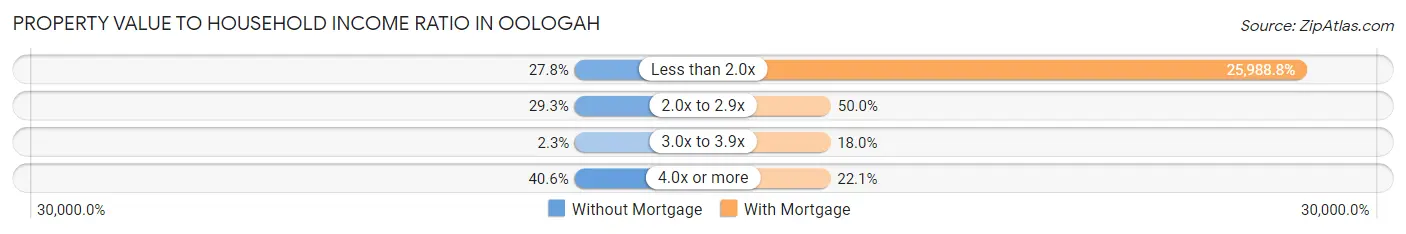
| Value-to-Income Ratio | Without Mortgage | With Mortgage |
| Less than 2.0x | 37 (27.8%) | 83,684 (25,988.8%) |
| 2.0x to 2.9x | 39 (29.3%) | 161 (50.0%) |
| 3.0x to 3.9x | 3 (2.3%) | 58 (18.0%) |
| 4.0x or more | 54 (40.6%) | 71 (22.1%) |
| Total | 133 (100.0%) | 322 (100.0%) |
Real Estate Taxes by Mortgage Status in Oologah
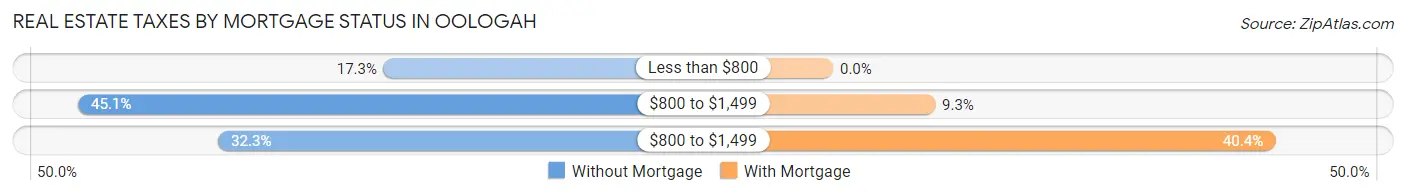
| Property Taxes | Without Mortgage | With Mortgage |
| Less than $800 | 23 (17.3%) | 0 (0.0%) |
| $800 to $1,499 | 60 (45.1%) | 30 (9.3%) |
| $800 to $1,499 | 43 (32.3%) | 130 (40.4%) |
| Total | 133 (100.0%) | 322 (100.0%) |
Health & Disability in Oologah
Health Insurance Coverage by Age in Oologah
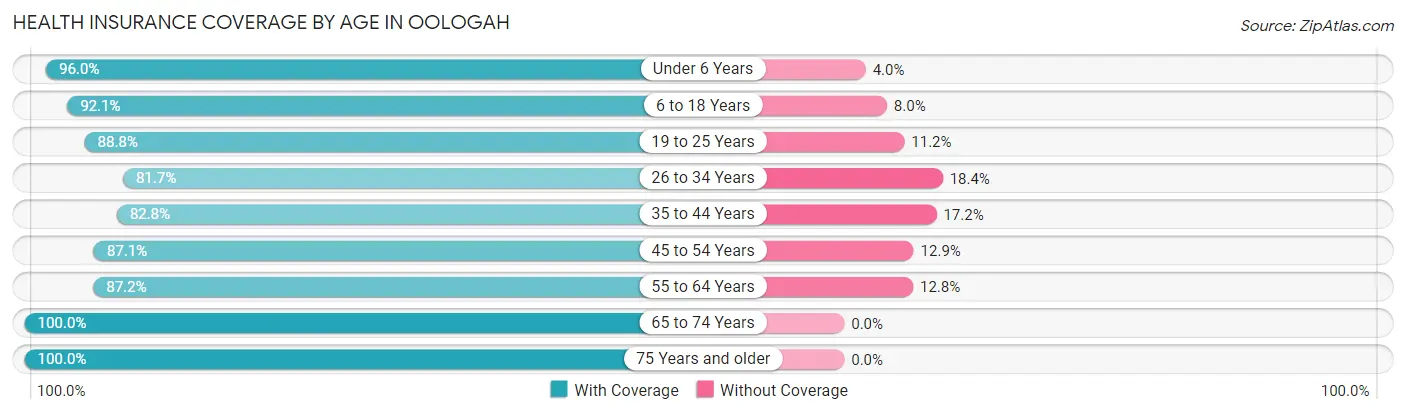
| Age Bracket | With Coverage | Without Coverage |
| Under 6 Years | 144 (96.0%) | 6 (4.0%) |
| 6 to 18 Years | 336 (92.0%) | 29 (8.0%) |
| 19 to 25 Years | 214 (88.8%) | 27 (11.2%) |
| 26 to 34 Years | 129 (81.7%) | 29 (18.3%) |
| 35 to 44 Years | 159 (82.8%) | 33 (17.2%) |
| 45 to 54 Years | 202 (87.1%) | 30 (12.9%) |
| 55 to 64 Years | 136 (87.2%) | 20 (12.8%) |
| 65 to 74 Years | 189 (100.0%) | 0 (0.0%) |
| 75 Years and older | 100 (100.0%) | 0 (0.0%) |
| Total | 1,609 (90.2%) | 174 (9.8%) |
Health Insurance Coverage by Citizenship Status in Oologah
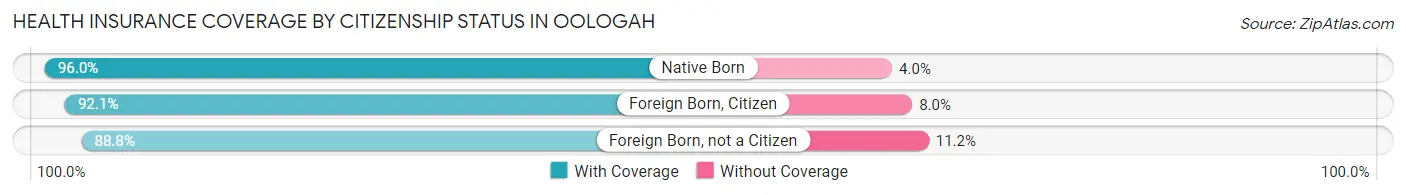
| Citizenship Status | With Coverage | Without Coverage |
| Native Born | 144 (96.0%) | 6 (4.0%) |
| Foreign Born, Citizen | 336 (92.0%) | 29 (8.0%) |
| Foreign Born, not a Citizen | 214 (88.8%) | 27 (11.2%) |
Health Insurance Coverage by Household Income in Oologah
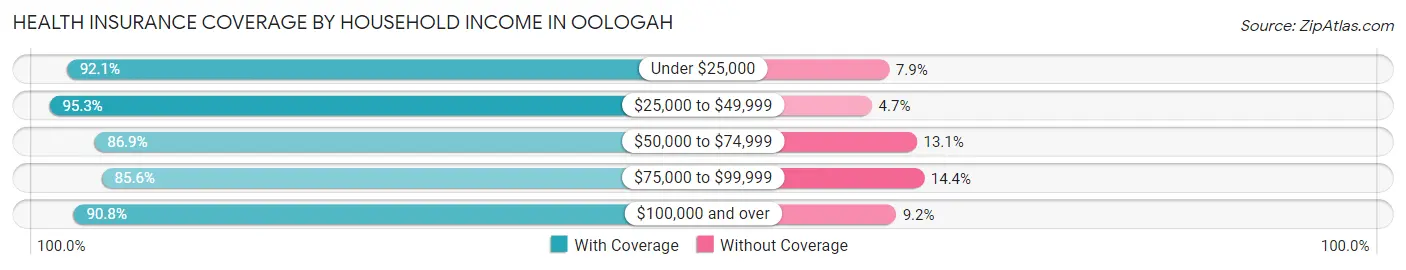
| Household Income | With Coverage | Without Coverage |
| Under $25,000 | 105 (92.1%) | 9 (7.9%) |
| $25,000 to $49,999 | 327 (95.3%) | 16 (4.7%) |
| $50,000 to $74,999 | 286 (86.9%) | 43 (13.1%) |
| $75,000 to $99,999 | 237 (85.6%) | 40 (14.4%) |
| $100,000 and over | 654 (90.8%) | 66 (9.2%) |
Public vs Private Health Insurance Coverage by Age in Oologah
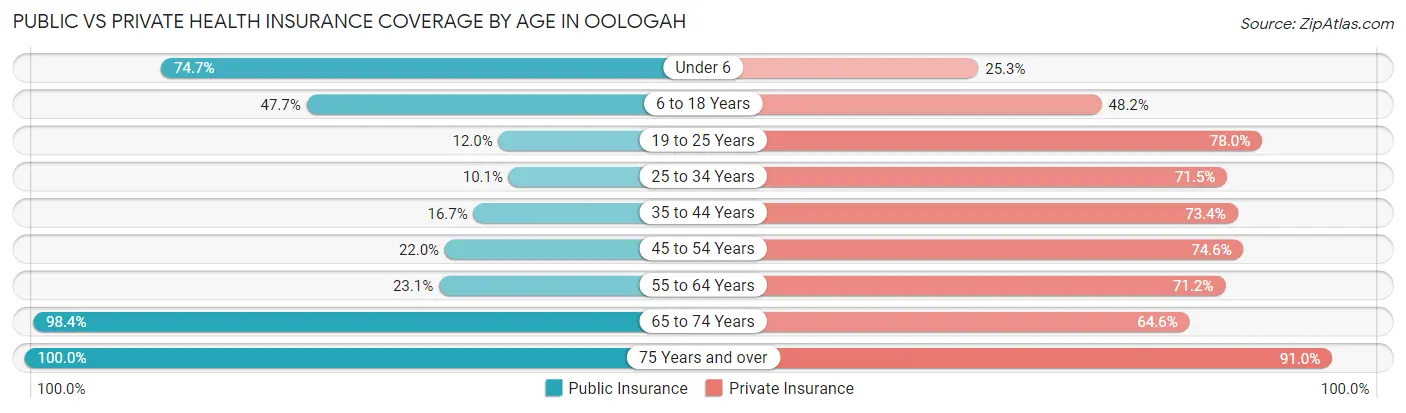
| Age Bracket | Public Insurance | Private Insurance |
| Under 6 | 112 (74.7%) | 38 (25.3%) |
| 6 to 18 Years | 174 (47.7%) | 176 (48.2%) |
| 19 to 25 Years | 29 (12.0%) | 188 (78.0%) |
| 25 to 34 Years | 16 (10.1%) | 113 (71.5%) |
| 35 to 44 Years | 32 (16.7%) | 141 (73.4%) |
| 45 to 54 Years | 51 (22.0%) | 173 (74.6%) |
| 55 to 64 Years | 36 (23.1%) | 111 (71.2%) |
| 65 to 74 Years | 186 (98.4%) | 122 (64.5%) |
| 75 Years and over | 100 (100.0%) | 91 (91.0%) |
| Total | 736 (41.3%) | 1,153 (64.7%) |
Disability Status by Sex by Age in Oologah
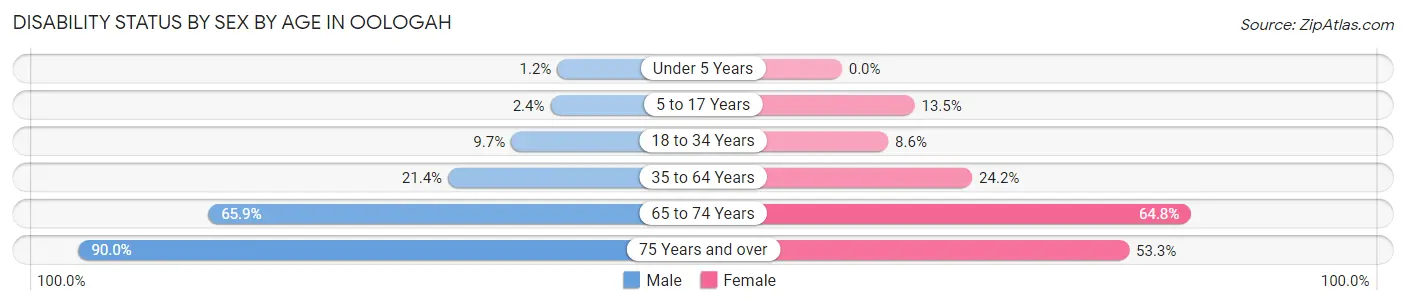
| Age Bracket | Male | Female |
| Under 5 Years | 1 (1.1%) | 0 (0.0%) |
| 5 to 17 Years | 4 (2.4%) | 25 (13.5%) |
| 18 to 34 Years | 21 (9.7%) | 18 (8.6%) |
| 35 to 64 Years | 57 (21.4%) | 76 (24.2%) |
| 65 to 74 Years | 29 (65.9%) | 94 (64.8%) |
| 75 Years and over | 63 (90.0%) | 16 (53.3%) |
Disability Class by Sex by Age in Oologah
Disability Class: Hearing Difficulty
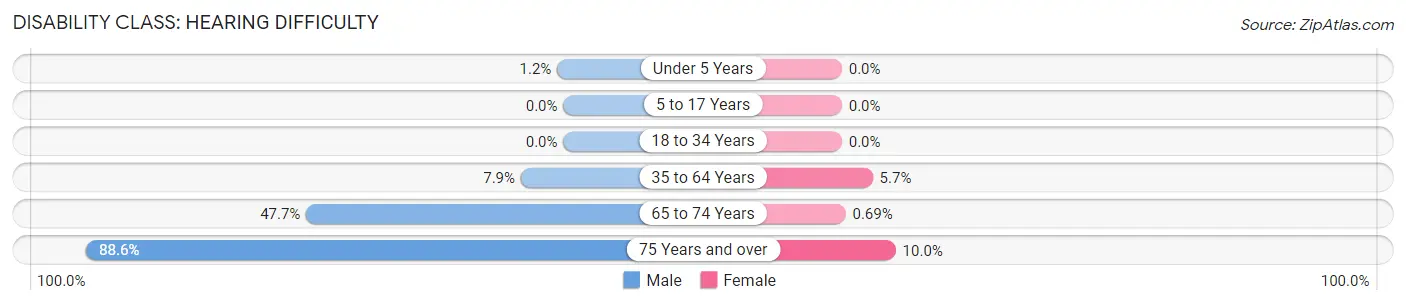
| Age Bracket | Male | Female |
| Under 5 Years | 1 (1.1%) | 0 (0.0%) |
| 5 to 17 Years | 0 (0.0%) | 0 (0.0%) |
| 18 to 34 Years | 0 (0.0%) | 0 (0.0%) |
| 35 to 64 Years | 21 (7.9%) | 18 (5.7%) |
| 65 to 74 Years | 21 (47.7%) | 1 (0.7%) |
| 75 Years and over | 62 (88.6%) | 3 (10.0%) |
Disability Class: Vision Difficulty
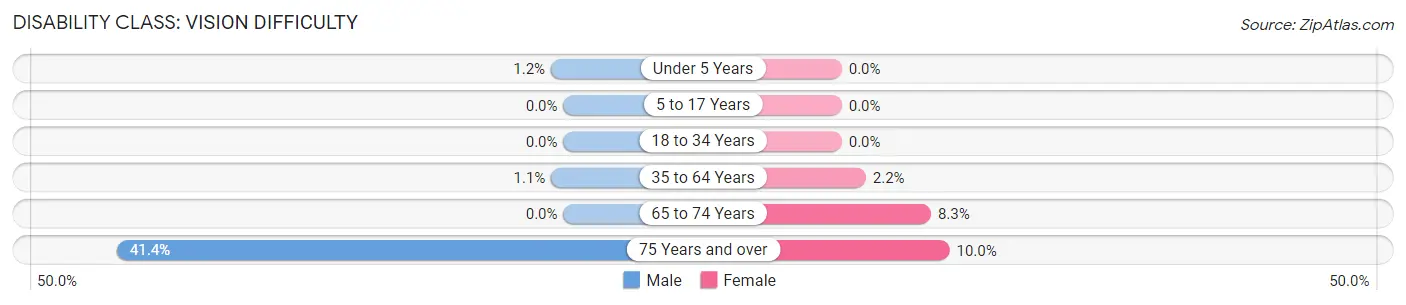
| Age Bracket | Male | Female |
| Under 5 Years | 1 (1.1%) | 0 (0.0%) |
| 5 to 17 Years | 0 (0.0%) | 0 (0.0%) |
| 18 to 34 Years | 0 (0.0%) | 0 (0.0%) |
| 35 to 64 Years | 3 (1.1%) | 7 (2.2%) |
| 65 to 74 Years | 0 (0.0%) | 12 (8.3%) |
| 75 Years and over | 29 (41.4%) | 3 (10.0%) |
Disability Class: Cognitive Difficulty
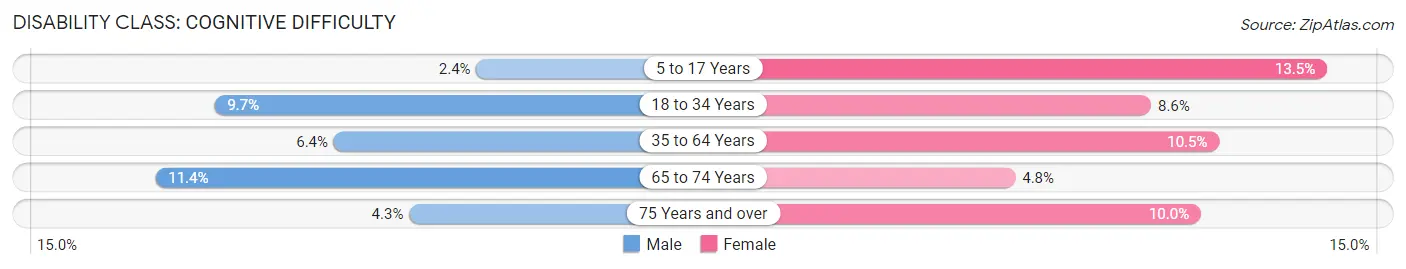
| Age Bracket | Male | Female |
| 5 to 17 Years | 4 (2.4%) | 25 (13.5%) |
| 18 to 34 Years | 21 (9.7%) | 18 (8.6%) |
| 35 to 64 Years | 17 (6.4%) | 33 (10.5%) |
| 65 to 74 Years | 5 (11.4%) | 7 (4.8%) |
| 75 Years and over | 3 (4.3%) | 3 (10.0%) |
Disability Class: Ambulatory Difficulty
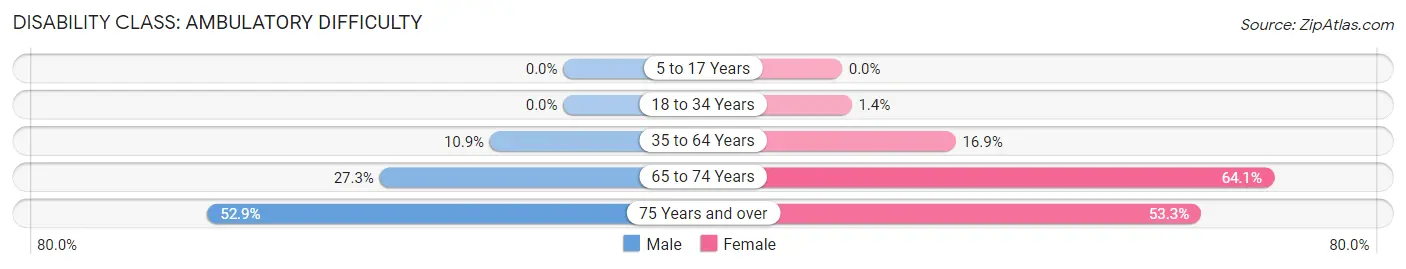
| Age Bracket | Male | Female |
| 5 to 17 Years | 0 (0.0%) | 0 (0.0%) |
| 18 to 34 Years | 0 (0.0%) | 3 (1.4%) |
| 35 to 64 Years | 29 (10.9%) | 53 (16.9%) |
| 65 to 74 Years | 12 (27.3%) | 93 (64.1%) |
| 75 Years and over | 37 (52.9%) | 16 (53.3%) |
Disability Class: Self-Care Difficulty
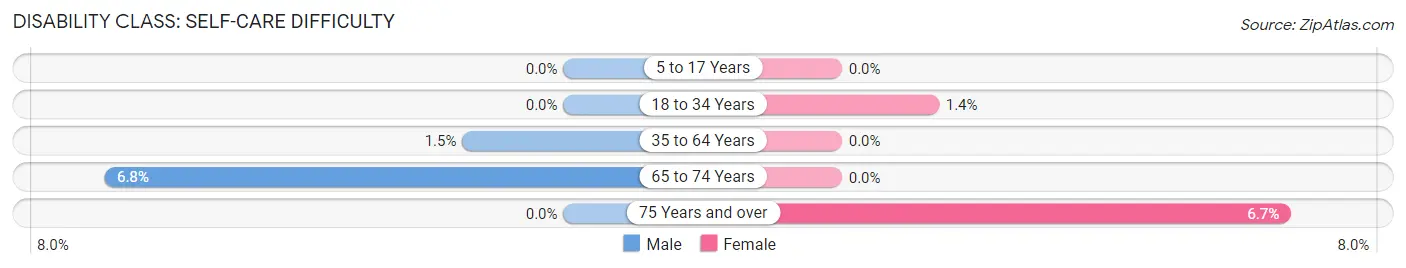
| Age Bracket | Male | Female |
| 5 to 17 Years | 0 (0.0%) | 0 (0.0%) |
| 18 to 34 Years | 0 (0.0%) | 3 (1.4%) |
| 35 to 64 Years | 4 (1.5%) | 0 (0.0%) |
| 65 to 74 Years | 3 (6.8%) | 0 (0.0%) |
| 75 Years and over | 0 (0.0%) | 2 (6.7%) |
Technology Access in Oologah
Computing Device Access in Oologah
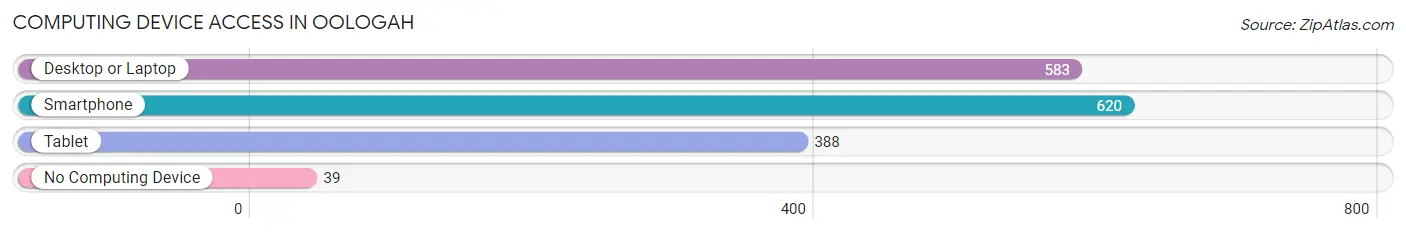
| Device Type | # Households | % Households |
| Desktop or Laptop | 583 | 85.4% |
| Smartphone | 620 | 90.8% |
| Tablet | 388 | 56.8% |
| No Computing Device | 39 | 5.7% |
| Total | 683 | 100.0% |
Internet Access in Oologah
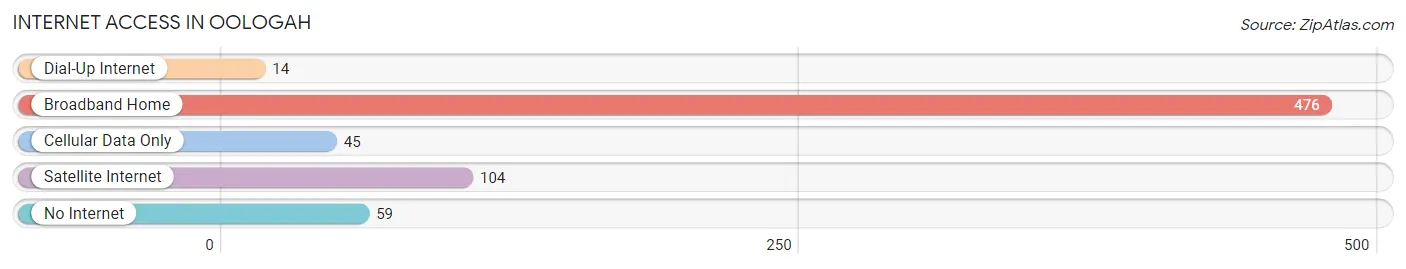
| Internet Type | # Households | % Households |
| Dial-Up Internet | 14 | 2.1% |
| Broadband Home | 476 | 69.7% |
| Cellular Data Only | 45 | 6.6% |
| Satellite Internet | 104 | 15.2% |
| No Internet | 59 | 8.6% |
| Total | 683 | 100.0% |
Oologah Summary
Oologah is a town located in Rogers County, Oklahoma, United States. It is situated in the northeastern part of the state, about 20 miles northeast of Tulsa. The population was 1,890 at the 2010 census.
History
Oologah was founded in 1881 by the Cherokee Nation. The town was named after Chief Oolootsa, a prominent Cherokee leader. The town was originally located in the Cooweescoowee District of the Cherokee Nation.
In 1882, the St. Louis and San Francisco Railway (Frisco) built a line through the area, connecting Oologah to Tulsa and other towns in the region. This allowed the town to become a major shipping point for agricultural products.
In 1889, the Cherokee Nation was dissolved and the area was opened up to white settlers. The town was incorporated in 1895.
In the early 1900s, Oologah was a thriving community with a population of over 1,000. The town had several stores, a bank, a hotel, a newspaper, and a school.
In the 1920s, the town began to decline as the Frisco line was abandoned and the population began to move away. The population dropped to just over 500 by the 1950s.
In the 1960s, the town began to experience a resurgence as the population began to grow again. The population has continued to grow since then, reaching 1,890 in 2010.
Geography
Oologah is located at 36°25'25" North, 95°45'45" West (36.423, -95.7625). The town is situated in the northeastern part of the state, about 20 miles northeast of Tulsa.
The town is located in the Ozark Plateau region of Oklahoma. The terrain is mostly rolling hills and wooded areas. The town is located near Oologah Lake, a reservoir created by the damming of the Verdigris River.
Economy
The economy of Oologah is largely based on agriculture. The town is home to several farms and ranches, as well as a number of businesses related to agriculture.
The town is also home to several manufacturing companies, including a plastics plant and a metal fabrication plant.
Demographics
As of the 2010 census, there were 1,890 people, 745 households, and 517 families residing in the town. The population density was 545.3 people per square mile (210.9/km2). There were 845 housing units at an average density of 242.3 per square mile (93.4/km2).
The racial makeup of the town was 87.2% White, 0.6% African American, 8.2% Native American, 0.3% Asian, 0.1% Pacific Islander, 0.7% from other races, and 2.9% from two or more races. Hispanic or Latino of any race were 2.7% of the population.
There were 745 households, out of which 28.7% had children under the age of 18 living with them, 51.2% were married couples living together, 11.7% had a female householder with no husband present, and 32.2% were non-families. 28.2% of all households were made up of individuals, and 14.2% had someone living alone who was 65 years of age or older. The average household size was 2.45 and the average family size was 2.97.
In the town, the population was spread out, with 24.7% under the age of 18, 8.2% from 18 to 24, 25.2% from 25 to 44, 24.2% from 45 to 64, and 17.7% who were 65 years of age or older. The median age was 39 years. For every 100 females, there were 91.2 males. For every 100 females age 18 and over, there were 87.2 males.
The median income for a household in the town was $30,938, and the median income for a family was $37,500. Males had a median income of $30,000 versus $20,000 for females. The per capita income for the town was $15,945. About 11.2% of families and 14.2% of the population were below the poverty line, including 19.2% of those under age 18 and 11.2% of those age 65 or over.
Common Questions
What is Per Capita Income in Oologah?
Per Capita income in Oologah is $33,451.
What is the Median Family Income in Oologah?
Median Family Income in Oologah is $78,250.
What is the Median Household income in Oologah?
Median Household Income in Oologah is $82,531.
What is Income or Wage Gap in Oologah?
Income or Wage Gap in Oologah is 27.8%.
Women in Oologah earn 72.2 cents for every dollar earned by a man.
What is Inequality or Gini Index in Oologah?
Inequality or Gini Index in Oologah is 0.33.
What is the Total Population of Oologah?
Total Population of Oologah is 1,783.
What is the Total Male Population of Oologah?
Total Male Population of Oologah is 848.
What is the Total Female Population of Oologah?
Total Female Population of Oologah is 935.
What is the Ratio of Males per 100 Females in Oologah?
There are 90.70 Males per 100 Females in Oologah.
What is the Ratio of Females per 100 Males in Oologah?
There are 110.26 Females per 100 Males in Oologah.
What is the Median Population Age in Oologah?
Median Population Age in Oologah is 33.1 Years.
What is the Average Family Size in Oologah
Average Family Size in Oologah is 3.2 People.
What is the Average Household Size in Oologah
Average Household Size in Oologah is 2.6 People.
How Large is the Labor Force in Oologah?
There are 928 People in the Labor Forcein in Oologah.
What is the Percentage of People in the Labor Force in Oologah?
65.9% of People are in the Labor Force in Oologah.
What is the Unemployment Rate in Oologah?
Unemployment Rate in Oologah is 7.5%.