Olustee, OK Map & Demographics
Olustee Map
Olustee Overview
$22,923
PER CAPITA INCOME
$57,679
AVG FAMILY INCOME
$58,074
AVG HOUSEHOLD INCOME
25.7%
WAGE / INCOME GAP [ % ]
74.3¢/ $1
WAGE / INCOME GAP [ $ ]
0.29
INEQUALITY / GINI INDEX
659
TOTAL POPULATION
273
MALE POPULATION
386
FEMALE POPULATION
70.73
MALES / 100 FEMALES
141.39
FEMALES / 100 MALES
39.0
MEDIAN AGE
2.3
AVG FAMILY SIZE
2.4
AVG HOUSEHOLD SIZE
221
LABOR FORCE [ PEOPLE ]
42.7%
PERCENT IN LABOR FORCE
2.3%
UNEMPLOYMENT RATE
Olustee Zip Codes
Olustee Area Codes
Income in Olustee
Income Overview in Olustee
Per Capita Income in Olustee is $22,923, while median incomes of families and households are $57,679 and $58,074 respectively.
| Characteristic | Number | Measure |
| Per Capita Income | 659 | $22,923 |
| Median Family Income | 248 | $57,679 |
| Mean Family Income | 248 | $55,591 |
| Median Household Income | 273 | $58,074 |
| Mean Household Income | 273 | $56,956 |
| Income Deficit | 248 | $0 |
| Wage / Income Gap (%) | 659 | 25.68% |
| Wage / Income Gap ($) | 659 | 74.32¢ per $1 |
| Gini / Inequality Index | 659 | 0.29 |
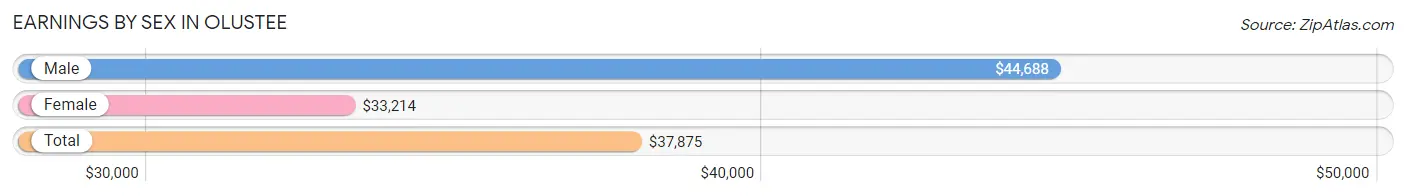
Earnings by Sex in Olustee
Average Earnings in Olustee are $37,875, $44,688 for men and $33,214 for women, a difference of 25.7%.
| Sex | Number | Average Earnings |
| Male | 141 (62.7%) | $44,688 |
| Female | 84 (37.3%) | $33,214 |
| Total | 225 (100.0%) | $37,875 |
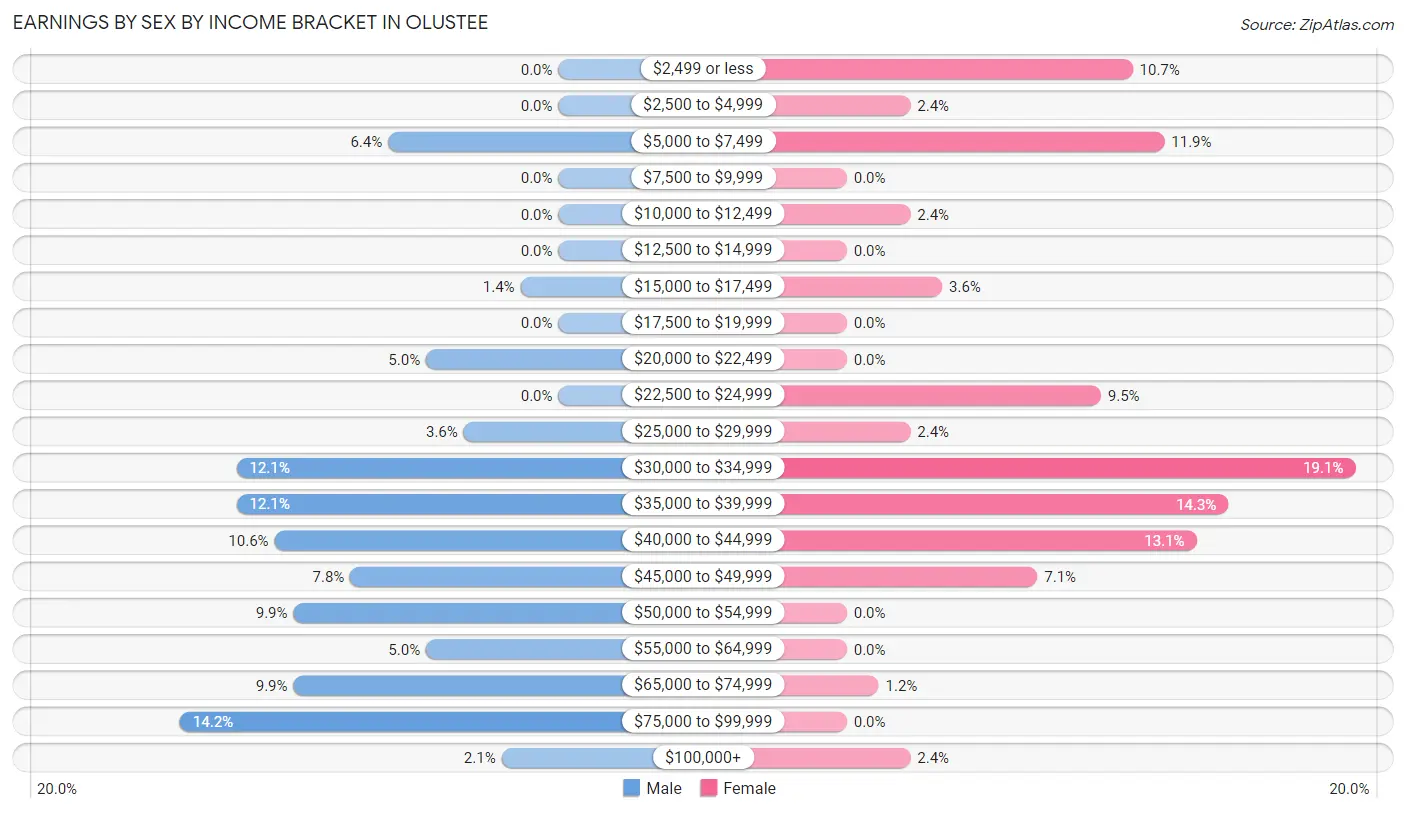
Earnings by Sex by Income Bracket in Olustee
The most common earnings brackets in Olustee are $75,000 to $99,999 for men (20 | 14.2%) and $30,000 to $34,999 for women (16 | 19.1%).
| Income | Male | Female |
| $2,499 or less | 0 (0.0%) | 9 (10.7%) |
| $2,500 to $4,999 | 0 (0.0%) | 2 (2.4%) |
| $5,000 to $7,499 | 9 (6.4%) | 10 (11.9%) |
| $7,500 to $9,999 | 0 (0.0%) | 0 (0.0%) |
| $10,000 to $12,499 | 0 (0.0%) | 2 (2.4%) |
| $12,500 to $14,999 | 0 (0.0%) | 0 (0.0%) |
| $15,000 to $17,499 | 2 (1.4%) | 3 (3.6%) |
| $17,500 to $19,999 | 0 (0.0%) | 0 (0.0%) |
| $20,000 to $22,499 | 7 (5.0%) | 0 (0.0%) |
| $22,500 to $24,999 | 0 (0.0%) | 8 (9.5%) |
| $25,000 to $29,999 | 5 (3.5%) | 2 (2.4%) |
| $30,000 to $34,999 | 17 (12.1%) | 16 (19.1%) |
| $35,000 to $39,999 | 17 (12.1%) | 12 (14.3%) |
| $40,000 to $44,999 | 15 (10.6%) | 11 (13.1%) |
| $45,000 to $49,999 | 11 (7.8%) | 6 (7.1%) |
| $50,000 to $54,999 | 14 (9.9%) | 0 (0.0%) |
| $55,000 to $64,999 | 7 (5.0%) | 0 (0.0%) |
| $65,000 to $74,999 | 14 (9.9%) | 1 (1.2%) |
| $75,000 to $99,999 | 20 (14.2%) | 0 (0.0%) |
| $100,000+ | 3 (2.1%) | 2 (2.4%) |
| Total | 141 (100.0%) | 84 (100.0%) |
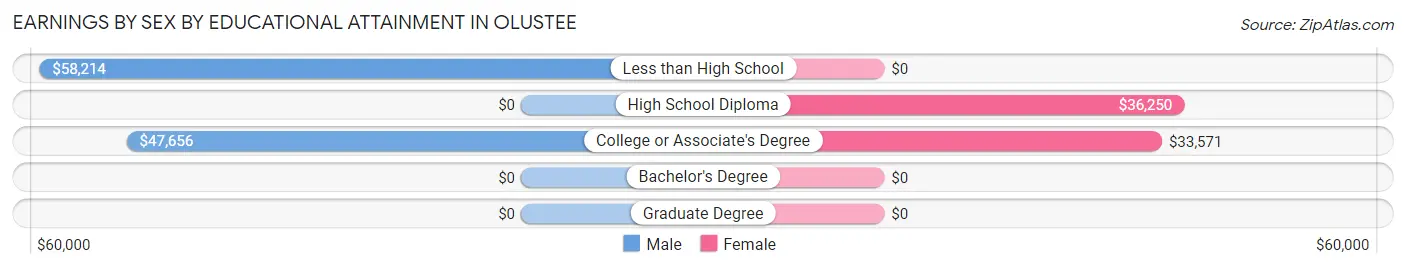
Earnings by Sex by Educational Attainment in Olustee
Average earnings in Olustee are $48,125 for men and $33,393 for women, a difference of 30.6%. Men with an educational attainment of less than high school enjoy the highest average annual earnings of $58,214, while those with college or associate's degree education earn the least with $47,656. Women with an educational attainment of high school diploma earn the most with the average annual earnings of $36,250, while those with college or associate's degree education have the smallest earnings of $33,571.
| Educational Attainment | Male Income | Female Income |
| Less than High School | $58,214 | $0 |
| High School Diploma | - | - |
| College or Associate's Degree | $47,656 | $33,571 |
| Bachelor's Degree | - | - |
| Graduate Degree | - | - |
| Total | $48,125 | $33,393 |
Family Income in Olustee
Family Income Brackets in Olustee
According to the Olustee family income data, there are 109 families falling into the $50,000 to $74,999 income range, which is the most common income bracket and makes up 44.0% of all families. Conversely, the $100,000 to $149,999 income bracket is the least frequent group with only 3 families (1.2%) belonging to this category.
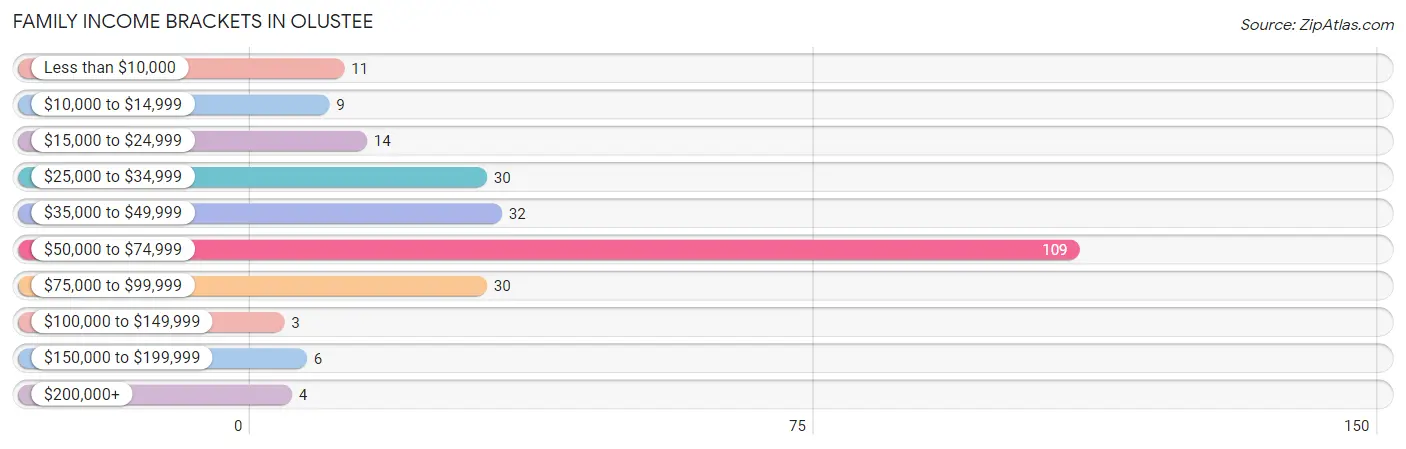
| Income Bracket | # Families | % Families |
| Less than $10,000 | 11 | 4.4% |
| $10,000 to $14,999 | 9 | 3.6% |
| $15,000 to $24,999 | 14 | 5.6% |
| $25,000 to $34,999 | 30 | 12.1% |
| $35,000 to $49,999 | 32 | 12.9% |
| $50,000 to $74,999 | 109 | 44.0% |
| $75,000 to $99,999 | 30 | 12.1% |
| $100,000 to $149,999 | 3 | 1.2% |
| $150,000 to $199,999 | 6 | 2.4% |
| $200,000+ | 4 | 1.6% |
Family Income by Famaliy Size in Olustee
4-person families (13 | 5.2%) account for the highest median family income in Olustee with $76,964 per family, while 2-person families (202 | 81.5%) have the highest median income of $28,794 per family member.
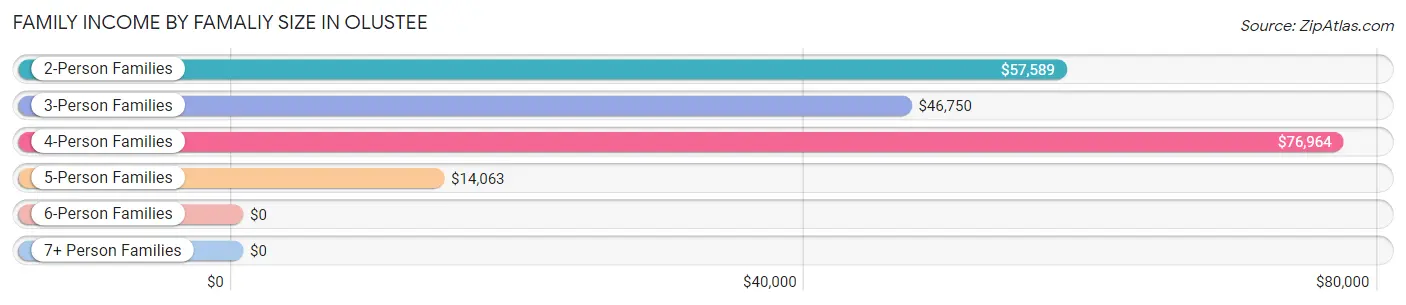
| Income Bracket | # Families | Median Income |
| 2-Person Families | 202 (81.5%) | $57,589 |
| 3-Person Families | 11 (4.4%) | $46,750 |
| 4-Person Families | 13 (5.2%) | $76,964 |
| 5-Person Families | 14 (5.7%) | $14,063 |
| 6-Person Families | 8 (3.2%) | $0 |
| 7+ Person Families | 0 (0.0%) | $0 |
| Total | 248 (100.0%) | $57,679 |
Family Income by Number of Earners in Olustee
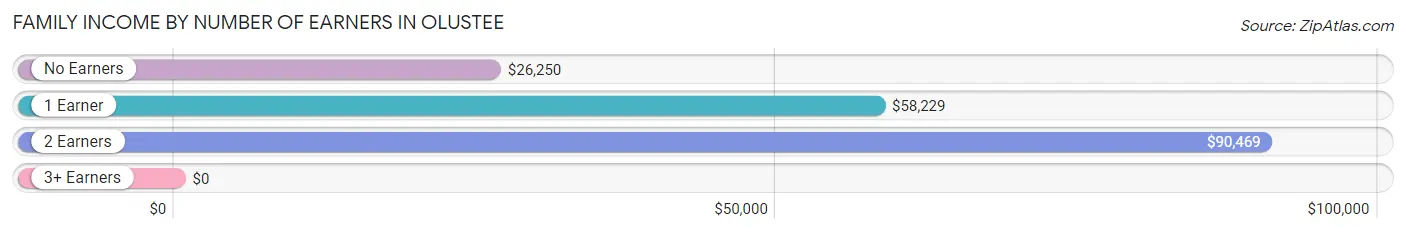
| Number of Earners | # Families | Median Income |
| No Earners | 46 (18.5%) | $26,250 |
| 1 Earner | 159 (64.1%) | $58,229 |
| 2 Earners | 41 (16.5%) | $90,469 |
| 3+ Earners | 2 (0.8%) | $0 |
| Total | 248 (100.0%) | $57,679 |
Household Income in Olustee
Household Income Brackets in Olustee
With 125 households falling in the category, the $50,000 to $74,999 income range is the most frequent in Olustee, accounting for 45.8% of all households. In contrast, only 3 households (1.1%) fall into the $100,000 to $149,999 income bracket, making it the least populous group.
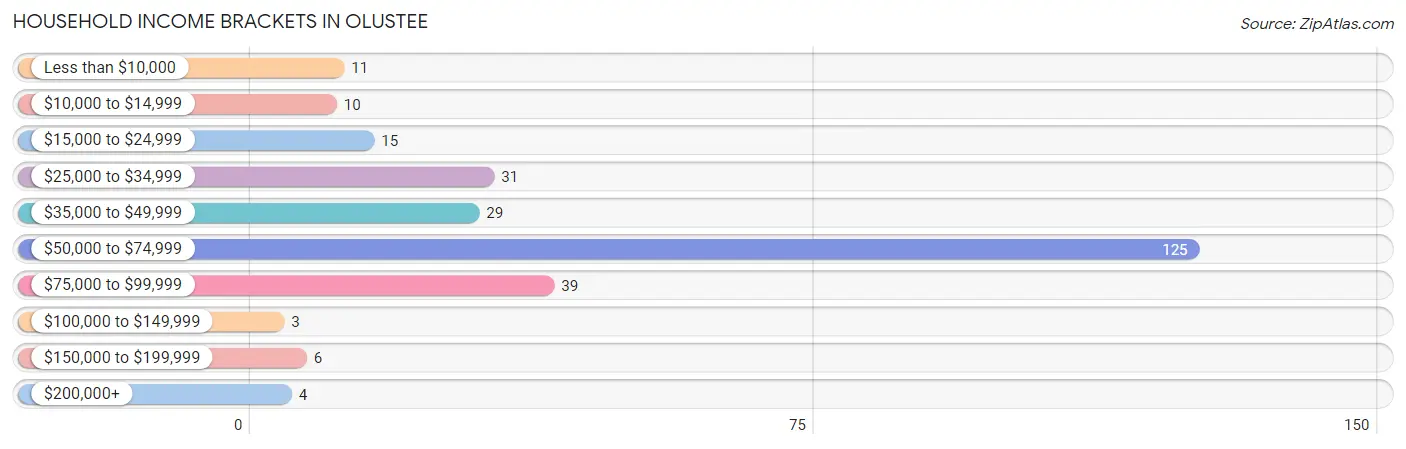
| Income Bracket | # Households | % Households |
| Less than $10,000 | 11 | 4.0% |
| $10,000 to $14,999 | 10 | 3.7% |
| $15,000 to $24,999 | 15 | 5.5% |
| $25,000 to $34,999 | 31 | 11.4% |
| $35,000 to $49,999 | 29 | 10.6% |
| $50,000 to $74,999 | 125 | 45.8% |
| $75,000 to $99,999 | 39 | 14.3% |
| $100,000 to $149,999 | 3 | 1.1% |
| $150,000 to $199,999 | 6 | 2.2% |
| $200,000+ | 4 | 1.5% |
Household Income by Householder Age in Olustee
The median household income in Olustee is $58,074, with the highest median household income of $61,354 found in the 25 to 44 years age bracket for the primary householder. A total of 69 households (25.3%) fall into this category. Meanwhile, the 15 to 24 years age bracket for the primary householder has the lowest median household income of $0, with 12 households (4.4%) in this group.
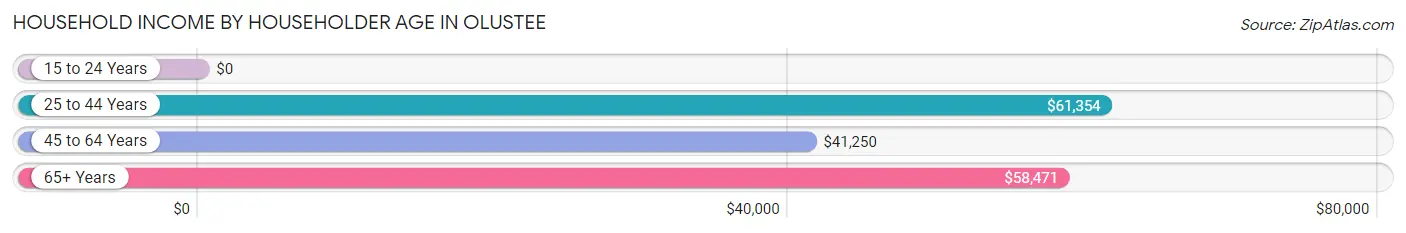
| Income Bracket | # Households | Median Income |
| 15 to 24 Years | 12 (4.4%) | $0 |
| 25 to 44 Years | 69 (25.3%) | $61,354 |
| 45 to 64 Years | 36 (13.2%) | $41,250 |
| 65+ Years | 156 (57.1%) | $58,471 |
| Total | 273 (100.0%) | $58,074 |
Poverty in Olustee
Income Below Poverty by Sex and Age in Olustee
With 12.8% poverty level for males and 23.9% for females among the residents of Olustee, under 5 year old males and 15 year old females are the most vulnerable to poverty, with 2 males (100.0%) and 12 females (100.0%) in their respective age groups living below the poverty level.
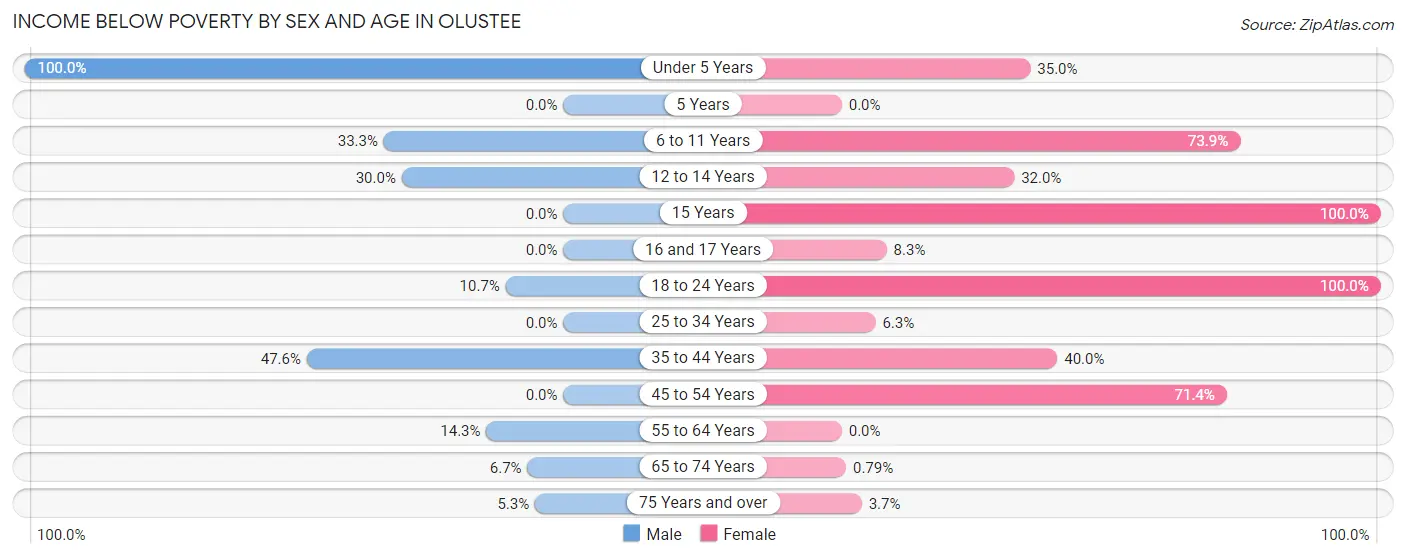
| Age Bracket | Male | Female |
| Under 5 Years | 2 (100.0%) | 7 (35.0%) |
| 5 Years | 0 (0.0%) | 0 (0.0%) |
| 6 to 11 Years | 7 (33.3%) | 17 (73.9%) |
| 12 to 14 Years | 3 (30.0%) | 8 (32.0%) |
| 15 Years | 0 (0.0%) | 12 (100.0%) |
| 16 and 17 Years | 0 (0.0%) | 1 (8.3%) |
| 18 to 24 Years | 3 (10.7%) | 14 (100.0%) |
| 25 to 34 Years | 0 (0.0%) | 2 (6.2%) |
| 35 to 44 Years | 10 (47.6%) | 16 (40.0%) |
| 45 to 54 Years | 0 (0.0%) | 10 (71.4%) |
| 55 to 64 Years | 7 (14.3%) | 0 (0.0%) |
| 65 to 74 Years | 2 (6.7%) | 1 (0.8%) |
| 75 Years and over | 1 (5.3%) | 1 (3.7%) |
| Total | 35 (12.8%) | 89 (23.9%) |
Income Above Poverty by Sex and Age in Olustee
According to the poverty statistics in Olustee, males aged 15 years and females aged 5 years are the age groups that are most secure financially, with 100.0% of males and 100.0% of females in these age groups living above the poverty line.
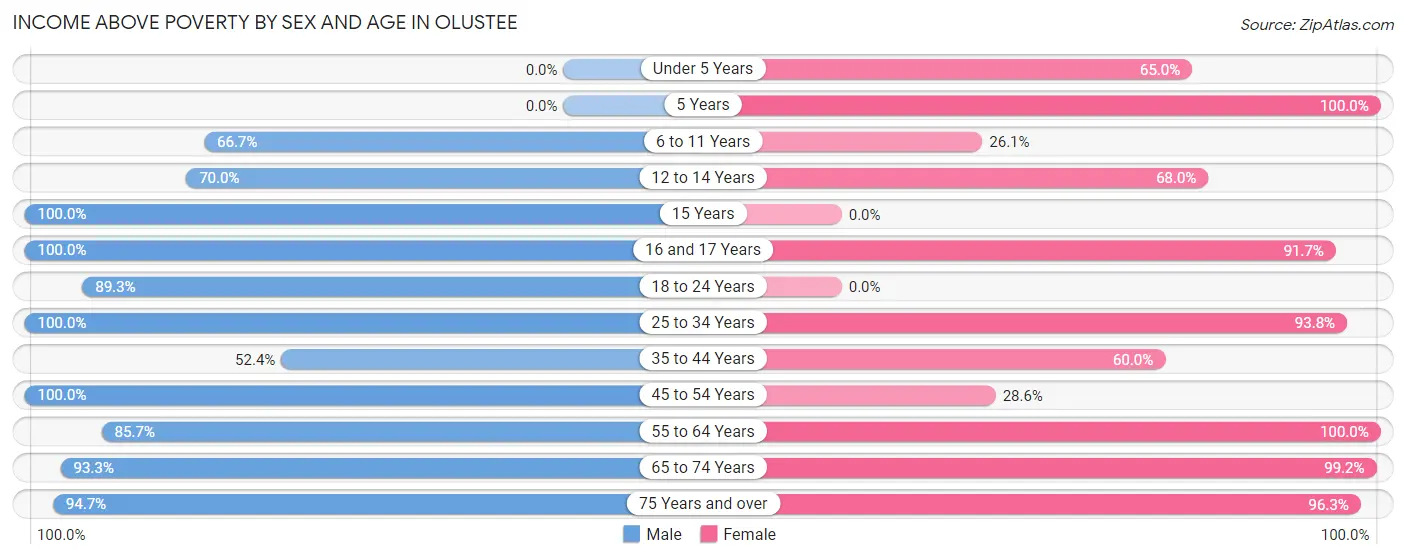
| Age Bracket | Male | Female |
| Under 5 Years | 0 (0.0%) | 13 (65.0%) |
| 5 Years | 0 (0.0%) | 14 (100.0%) |
| 6 to 11 Years | 14 (66.7%) | 6 (26.1%) |
| 12 to 14 Years | 7 (70.0%) | 17 (68.0%) |
| 15 Years | 2 (100.0%) | 0 (0.0%) |
| 16 and 17 Years | 30 (100.0%) | 11 (91.7%) |
| 18 to 24 Years | 25 (89.3%) | 0 (0.0%) |
| 25 to 34 Years | 47 (100.0%) | 30 (93.8%) |
| 35 to 44 Years | 11 (52.4%) | 24 (60.0%) |
| 45 to 54 Years | 14 (100.0%) | 4 (28.6%) |
| 55 to 64 Years | 42 (85.7%) | 14 (100.0%) |
| 65 to 74 Years | 28 (93.3%) | 125 (99.2%) |
| 75 Years and over | 18 (94.7%) | 26 (96.3%) |
| Total | 238 (87.2%) | 284 (76.1%) |
Income Below Poverty Among Married-Couple Families in Olustee
The poverty statistics for married-couple families in Olustee show that 9.5% or 18 of the total 190 families live below the poverty line. Families with 3 or 4 children have the highest poverty rate of 55.6%, comprising of 10 families. On the other hand, families with 1 or 2 children have the lowest poverty rate of 0.0%, which includes 0 families.
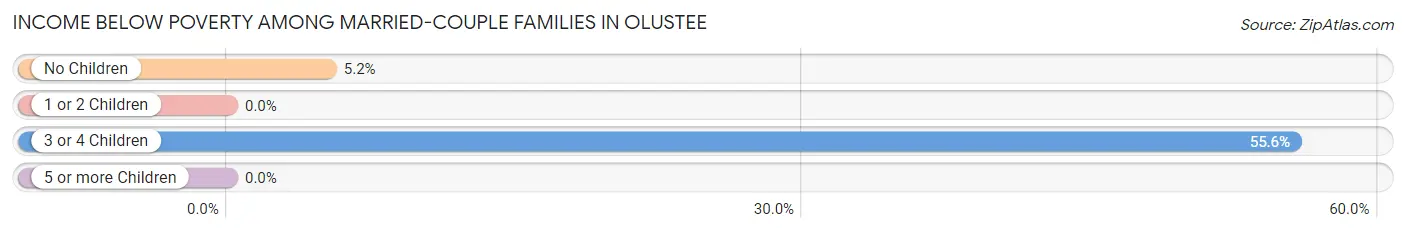
| Children | Above Poverty | Below Poverty |
| No Children | 147 (94.8%) | 8 (5.2%) |
| 1 or 2 Children | 17 (100.0%) | 0 (0.0%) |
| 3 or 4 Children | 8 (44.4%) | 10 (55.6%) |
| 5 or more Children | 0 (0.0%) | 0 (0.0%) |
| Total | 172 (90.5%) | 18 (9.5%) |
Income Below Poverty Among Single-Parent Households in Olustee
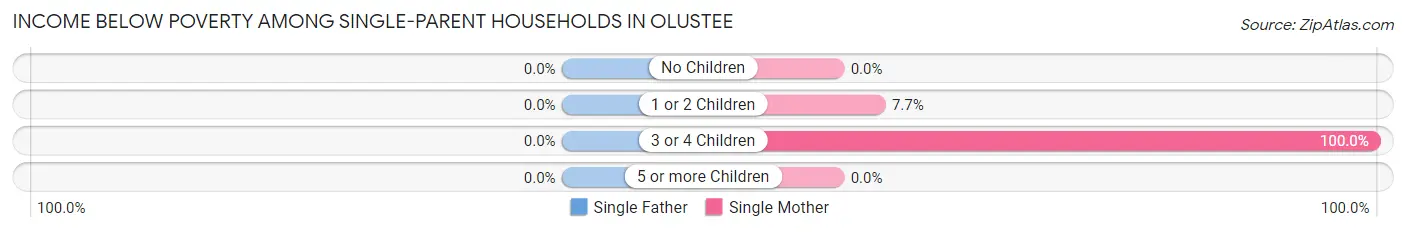
| Children | Single Father | Single Mother |
| No Children | 0 (0.0%) | 0 (0.0%) |
| 1 or 2 Children | 0 (0.0%) | 2 (7.7%) |
| 3 or 4 Children | 0 (0.0%) | 2 (100.0%) |
| 5 or more Children | 0 (0.0%) | 0 (0.0%) |
| Total | 0 (0.0%) | 4 (14.3%) |
Income Below Poverty Among Married-Couple vs Single-Parent Households in Olustee
The poverty data for Olustee shows that 18 of the married-couple family households (9.5%) and 4 of the single-parent households (6.9%) are living below the poverty level. Within the married-couple family households, those with 3 or 4 children have the highest poverty rate, with 10 households (55.6%) falling below the poverty line. Among the single-parent households, those with 3 or 4 children have the highest poverty rate, with 2 household (100.0%) living below poverty.
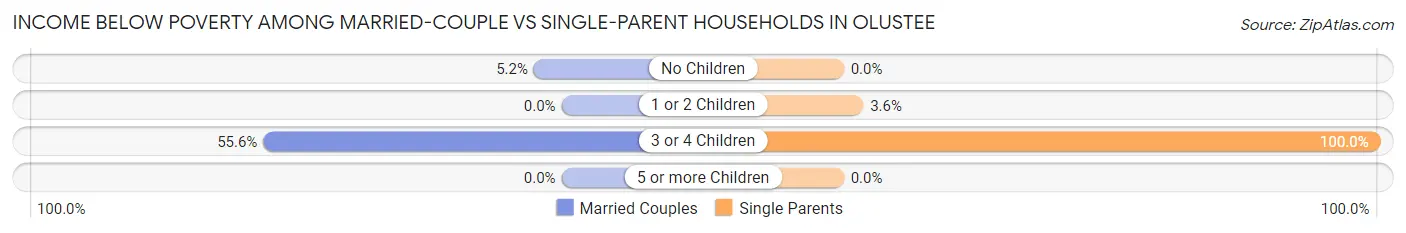
| Children | Married-Couple Families | Single-Parent Households |
| No Children | 8 (5.2%) | 0 (0.0%) |
| 1 or 2 Children | 0 (0.0%) | 2 (3.6%) |
| 3 or 4 Children | 10 (55.6%) | 2 (100.0%) |
| 5 or more Children | 0 (0.0%) | 0 (0.0%) |
| Total | 18 (9.5%) | 4 (6.9%) |
Race in Olustee
The most populous races in Olustee are White / Caucasian (536 | 81.3%), Hispanic or Latino (333 | 50.5%), and Two or more Races (83 | 12.6%).
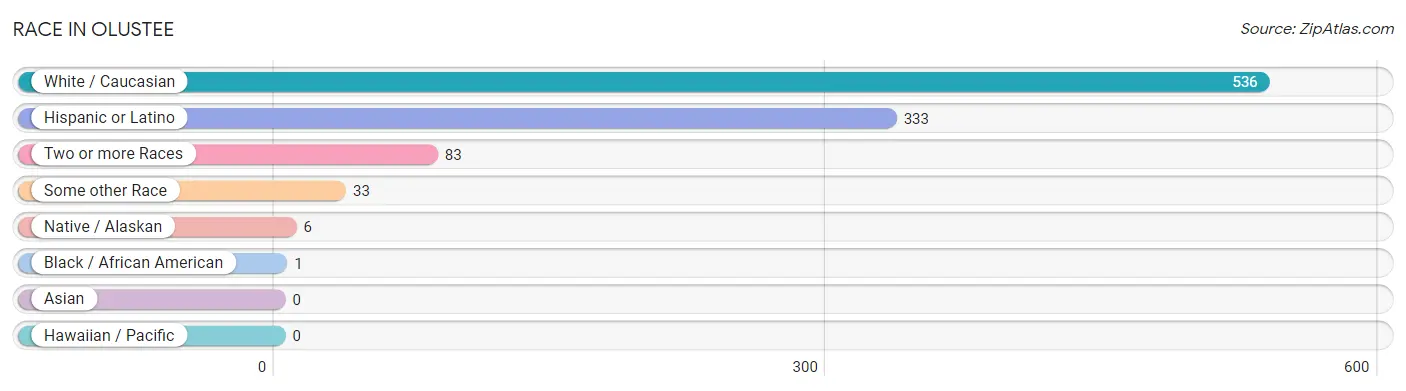
| Race | # Population | % Population |
| Asian | 0 | 0.0% |
| Black / African American | 1 | 0.2% |
| Hawaiian / Pacific | 0 | 0.0% |
| Hispanic or Latino | 333 | 50.5% |
| Native / Alaskan | 6 | 0.9% |
| White / Caucasian | 536 | 81.3% |
| Two or more Races | 83 | 12.6% |
| Some other Race | 33 | 5.0% |
| Total | 659 | 100.0% |
Ancestry in Olustee
The most populous ancestries reported in Olustee are Mexican (227 | 34.4%), Central American (55 | 8.4%), American (51 | 7.7%), Irish (50 | 7.6%), and Salvadoran (45 | 6.8%), together accounting for 65.0% of all Olustee residents.
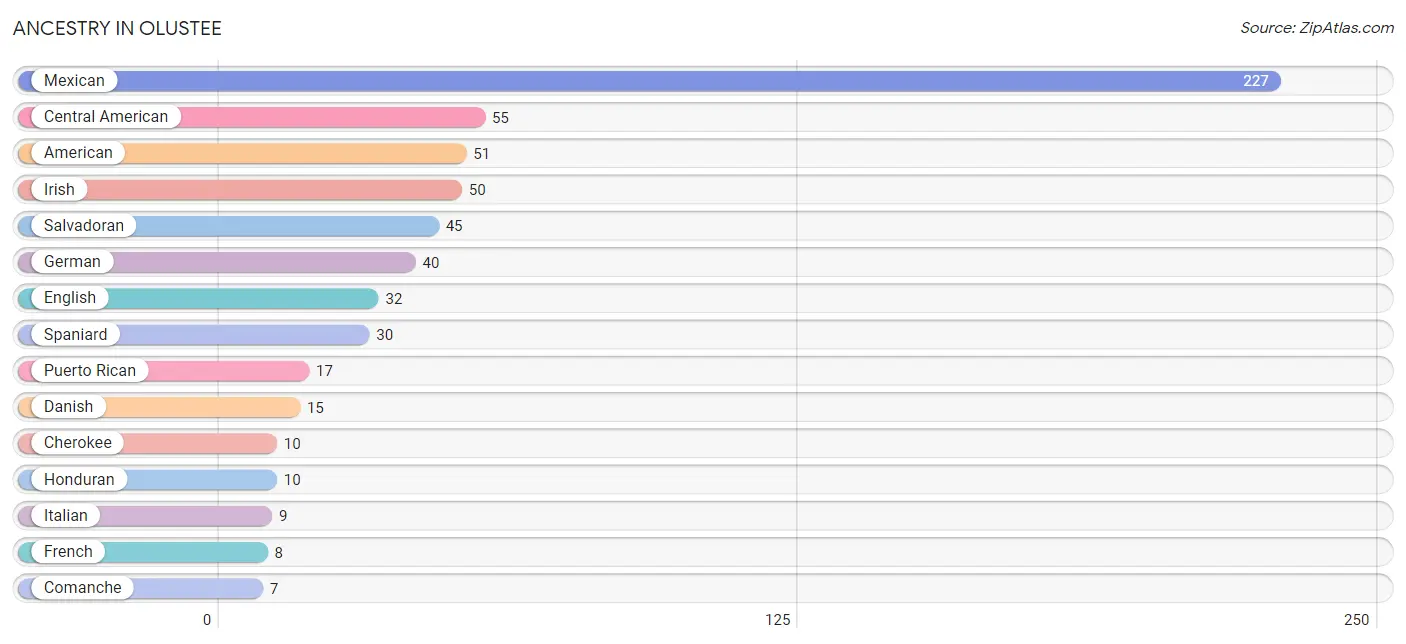
| Ancestry | # Population | % Population |
| American | 51 | 7.7% |
| Apache | 3 | 0.5% |
| Central American | 55 | 8.4% |
| Cherokee | 10 | 1.5% |
| Chickasaw | 6 | 0.9% |
| Choctaw | 1 | 0.2% |
| Comanche | 7 | 1.1% |
| Danish | 15 | 2.3% |
| Dutch | 3 | 0.5% |
| English | 32 | 4.9% |
| French | 8 | 1.2% |
| German | 40 | 6.1% |
| Honduran | 10 | 1.5% |
| Irish | 50 | 7.6% |
| Italian | 9 | 1.4% |
| Mexican | 227 | 34.4% |
| Puerto Rican | 17 | 2.6% |
| Russian | 3 | 0.5% |
| Salvadoran | 45 | 6.8% |
| Scottish | 5 | 0.8% |
| Spaniard | 30 | 4.5% | View All 21 Rows |
Immigrants in Olustee
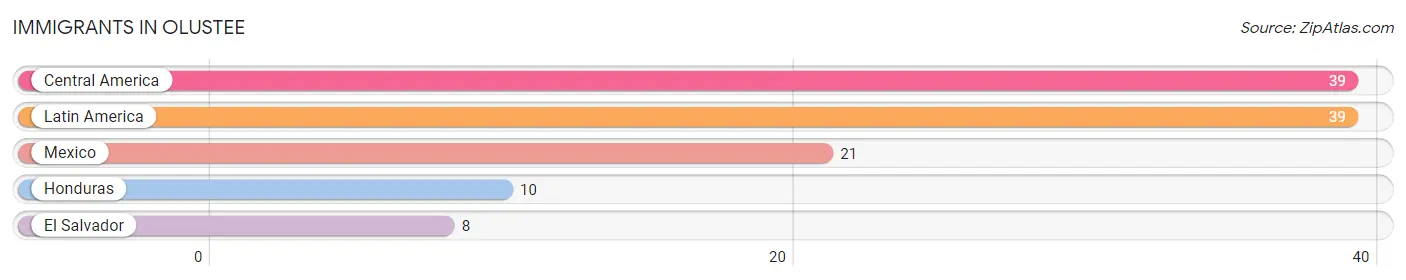
The most numerous immigrant groups reported in Olustee came from Central America (39 | 5.9%), Latin America (39 | 5.9%), Mexico (21 | 3.2%), Honduras (10 | 1.5%), and El Salvador (8 | 1.2%), together accounting for 17.8% of all Olustee residents.
| Immigration Origin | # Population | % Population |
| Central America | 39 | 5.9% |
| El Salvador | 8 | 1.2% |
| Honduras | 10 | 1.5% |
| Latin America | 39 | 5.9% |
| Mexico | 21 | 3.2% | View All 5 Rows |
Sex and Age in Olustee
Sex and Age in Olustee
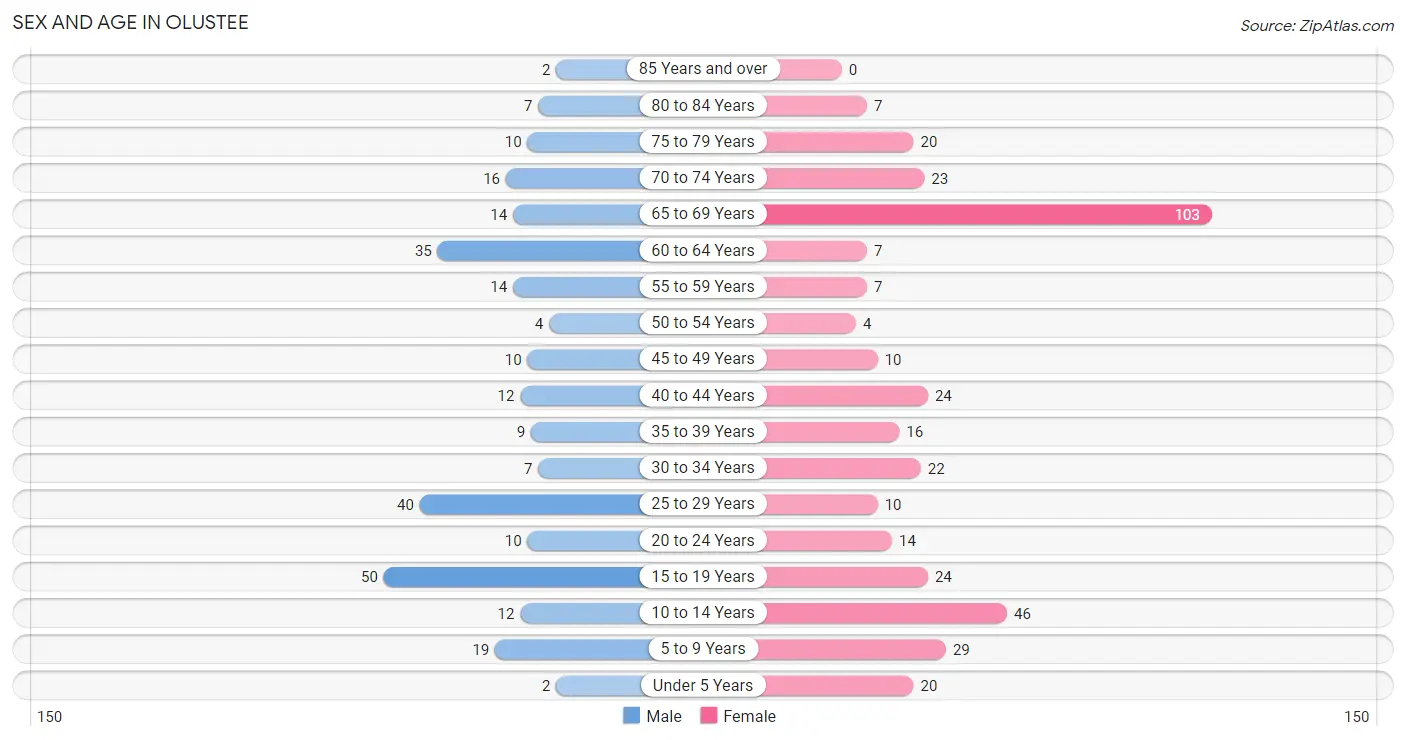
The most populous age groups in Olustee are 15 to 19 Years (50 | 18.3%) for men and 65 to 69 Years (103 | 26.7%) for women.
| Age Bracket | Male | Female |
| Under 5 Years | 2 (0.7%) | 20 (5.2%) |
| 5 to 9 Years | 19 (7.0%) | 29 (7.5%) |
| 10 to 14 Years | 12 (4.4%) | 46 (11.9%) |
| 15 to 19 Years | 50 (18.3%) | 24 (6.2%) |
| 20 to 24 Years | 10 (3.7%) | 14 (3.6%) |
| 25 to 29 Years | 40 (14.6%) | 10 (2.6%) |
| 30 to 34 Years | 7 (2.6%) | 22 (5.7%) |
| 35 to 39 Years | 9 (3.3%) | 16 (4.2%) |
| 40 to 44 Years | 12 (4.4%) | 24 (6.2%) |
| 45 to 49 Years | 10 (3.7%) | 10 (2.6%) |
| 50 to 54 Years | 4 (1.5%) | 4 (1.0%) |
| 55 to 59 Years | 14 (5.1%) | 7 (1.8%) |
| 60 to 64 Years | 35 (12.8%) | 7 (1.8%) |
| 65 to 69 Years | 14 (5.1%) | 103 (26.7%) |
| 70 to 74 Years | 16 (5.9%) | 23 (6.0%) |
| 75 to 79 Years | 10 (3.7%) | 20 (5.2%) |
| 80 to 84 Years | 7 (2.6%) | 7 (1.8%) |
| 85 Years and over | 2 (0.7%) | 0 (0.0%) |
| Total | 273 (100.0%) | 386 (100.0%) |
Families and Households in Olustee
Median Family Size in Olustee
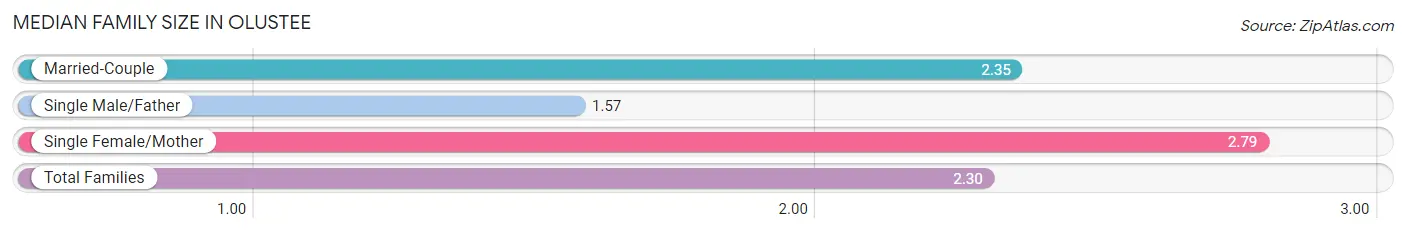
The median family size in Olustee is 2.30 persons per family, with single female/mother families (28 | 11.3%) accounting for the largest median family size of 2.79 persons per family. On the other hand, single male/father families (30 | 12.1%) represent the smallest median family size with 1.57 persons per family.
| Family Type | # Families | Family Size |
| Married-Couple | 190 (76.6%) | 2.35 |
| Single Male/Father | 30 (12.1%) | 1.57 |
| Single Female/Mother | 28 (11.3%) | 2.79 |
| Total Families | 248 (100.0%) | 2.30 |
Median Household Size in Olustee
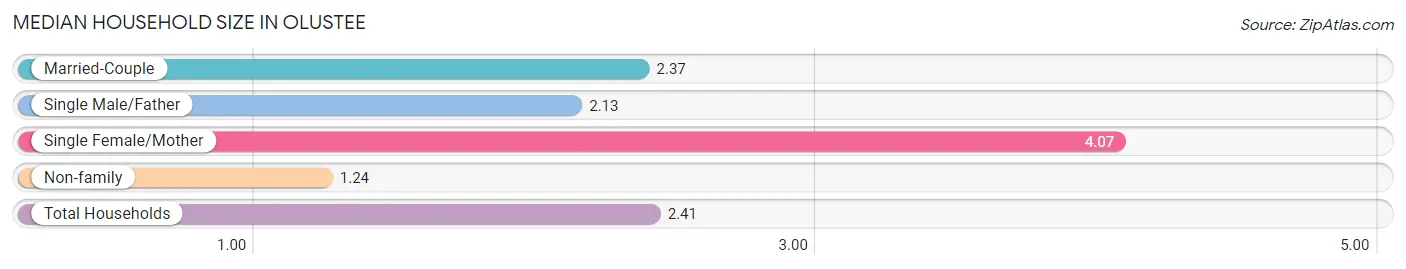
The median household size in Olustee is 2.41 persons per household, with single female/mother households (28 | 10.3%) accounting for the largest median household size of 4.07 persons per household. non-family households (25 | 9.2%) represent the smallest median household size with 1.24 persons per household.
| Household Type | # Households | Household Size |
| Married-Couple | 190 (69.6%) | 2.37 |
| Single Male/Father | 30 (11.0%) | 2.13 |
| Single Female/Mother | 28 (10.3%) | 4.07 |
| Non-family | 25 (9.2%) | 1.24 |
| Total Households | 273 (100.0%) | 2.41 |
Household Size by Marriage Status in Olustee
Out of a total of 273 households in Olustee, 248 (90.8%) are family households, while 25 (9.2%) are nonfamily households. The most numerous type of family households are 2-person households, comprising 170, and the most common type of nonfamily households are 1-person households, comprising 23.
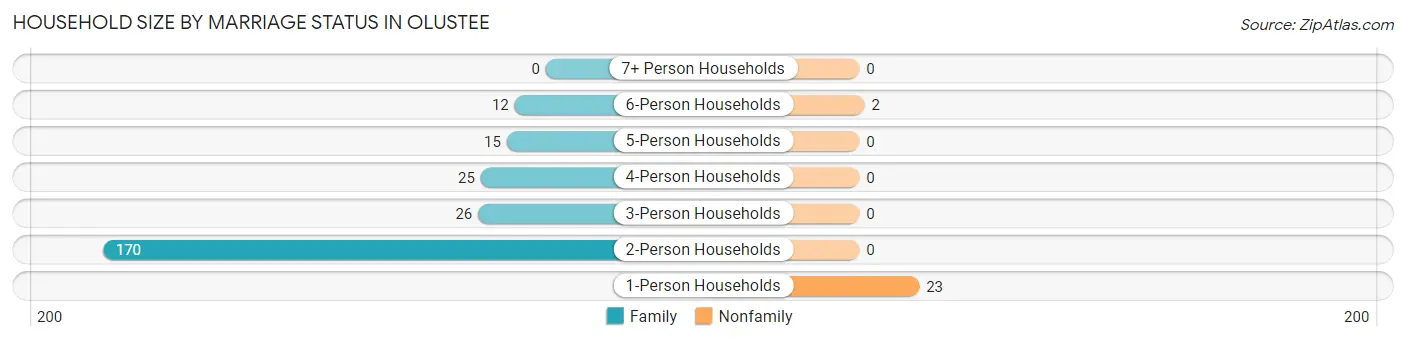
| Household Size | Family Households | Nonfamily Households |
| 1-Person Households | - | 23 (8.4%) |
| 2-Person Households | 170 (62.3%) | 0 (0.0%) |
| 3-Person Households | 26 (9.5%) | 0 (0.0%) |
| 4-Person Households | 25 (9.2%) | 0 (0.0%) |
| 5-Person Households | 15 (5.5%) | 0 (0.0%) |
| 6-Person Households | 12 (4.4%) | 2 (0.7%) |
| 7+ Person Households | 0 (0.0%) | 0 (0.0%) |
| Total | 248 (90.8%) | 25 (9.2%) |
Female Fertility in Olustee
Fertility by Age in Olustee
Average fertility rate in Olustee is 92.0 births per 1,000 women. Women in the age bracket of 20 to 34 years have the highest fertility rate with 152.0 births per 1,000 women. Women in the age bracket of 20 to 34 years acount for 63.6% of all women with births.
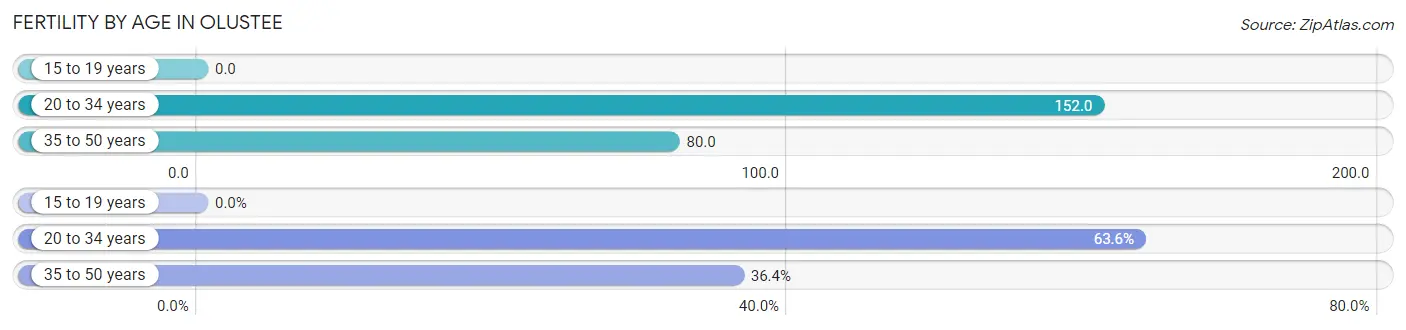
| Age Bracket | Women with Births | Births / 1,000 Women |
| 15 to 19 years | 0 (0.0%) | 0.0 |
| 20 to 34 years | 7 (63.6%) | 152.0 |
| 35 to 50 years | 4 (36.4%) | 80.0 |
| Total | 11 (100.0%) | 92.0 |
Fertility by Age by Marriage Status in Olustee
36.4% of women with births (11) in Olustee are married. The highest percentage of unmarried women with births falls into 20 to 34 years age bracket with 100.0% of them unmarried at the time of birth, while the lowest percentage of unmarried women with births belong to 35 to 50 years age bracket with 0.0% of them unmarried.
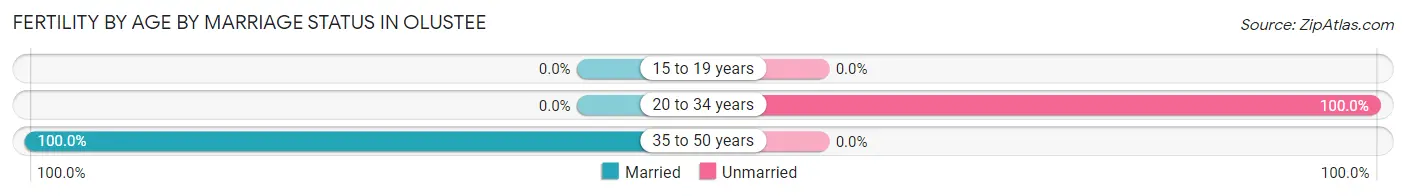
| Age Bracket | Married | Unmarried |
| 15 to 19 years | 0 (0.0%) | 0 (0.0%) |
| 20 to 34 years | 0 (0.0%) | 7 (100.0%) |
| 35 to 50 years | 4 (100.0%) | 0 (0.0%) |
| Total | 4 (36.4%) | 7 (63.6%) |
Fertility by Education in Olustee
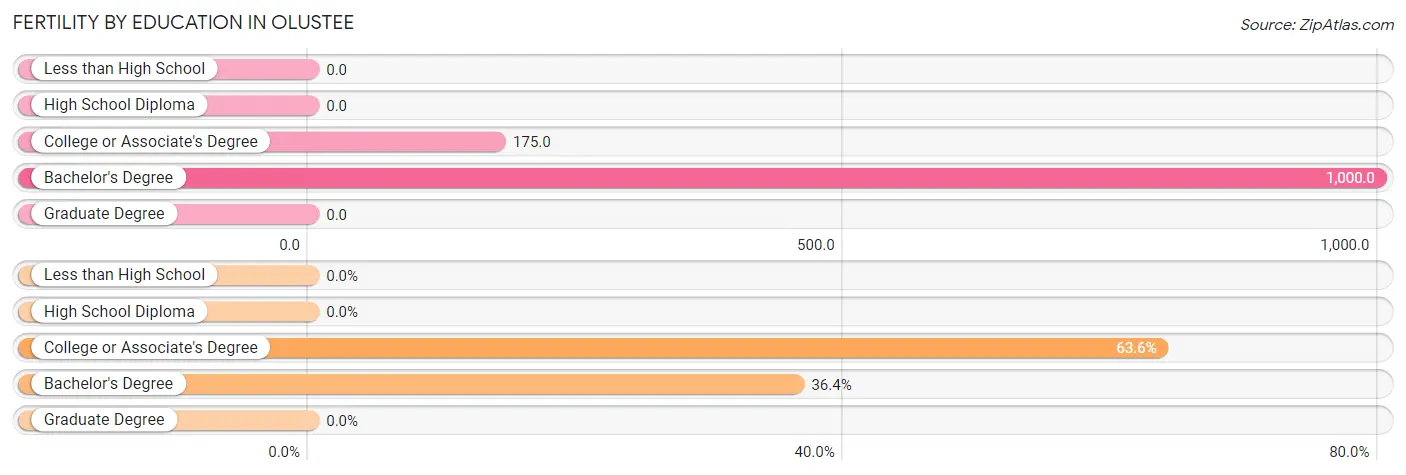
| Educational Attainment | Women with Births | Births / 1,000 Women |
| Less than High School | 0 (0.0%) | 0.0 |
| High School Diploma | 0 (0.0%) | 0.0 |
| College or Associate's Degree | 7 (63.6%) | 175.0 |
| Bachelor's Degree | 4 (36.4%) | 1,000.0 |
| Graduate Degree | 0 (0.0%) | 0.0 |
| Total | 11 (100.0%) | 92.0 |
Fertility by Education by Marriage Status in Olustee
63.6% of women with births in Olustee are unmarried. Women with the educational attainment of bachelor's degree are most likely to be married with 100.0% of them married at childbirth, while women with the educational attainment of college or associate's degree are least likely to be married with 100.0% of them unmarried at childbirth.
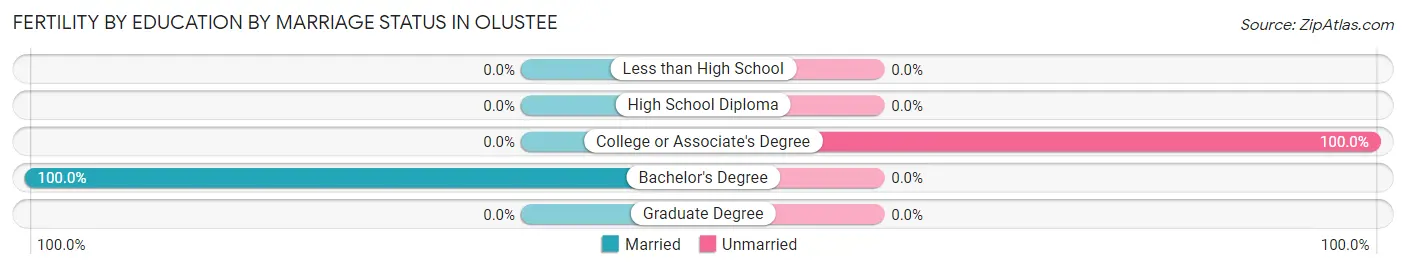
| Educational Attainment | Married | Unmarried |
| Less than High School | 0 (0.0%) | 0 (0.0%) |
| High School Diploma | 0 (0.0%) | 0 (0.0%) |
| College or Associate's Degree | 0 (0.0%) | 7 (100.0%) |
| Bachelor's Degree | 4 (100.0%) | 0 (0.0%) |
| Graduate Degree | 0 (0.0%) | 0 (0.0%) |
| Total | 4 (36.4%) | 7 (63.6%) |
Employment Characteristics in Olustee
Employment by Class of Employer in Olustee
Among the 216 employed individuals in Olustee, private company employees (136 | 63.0%), self-employed (not incorporated) (27 | 12.5%), and federal government employees (25 | 11.6%) make up the most common classes of employment.
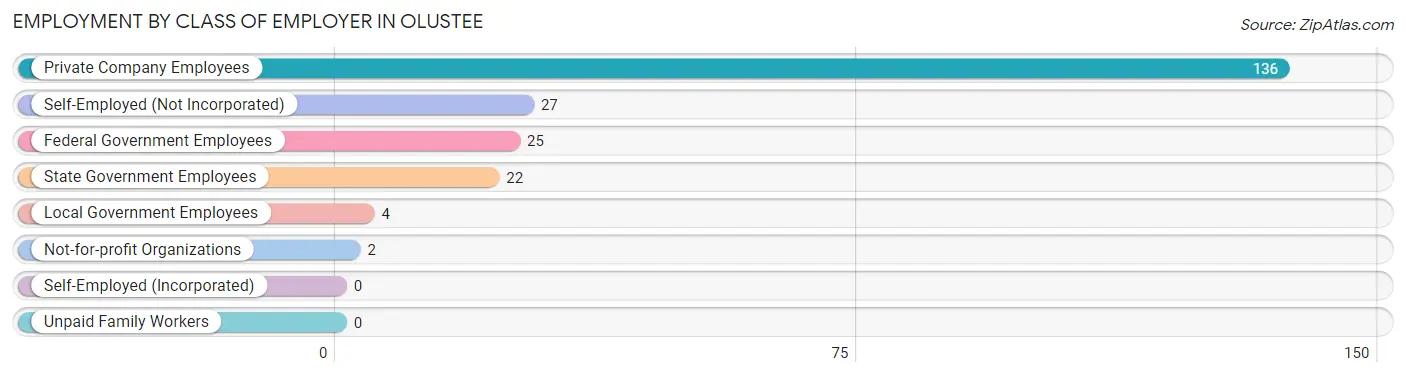
| Employer Class | # Employees | % Employees |
| Private Company Employees | 136 | 63.0% |
| Self-Employed (Incorporated) | 0 | 0.0% |
| Self-Employed (Not Incorporated) | 27 | 12.5% |
| Not-for-profit Organizations | 2 | 0.9% |
| Local Government Employees | 4 | 1.8% |
| State Government Employees | 22 | 10.2% |
| Federal Government Employees | 25 | 11.6% |
| Unpaid Family Workers | 0 | 0.0% |
| Total | 216 | 100.0% |
Employment Status by Age in Olustee
According to the labor force statistics for Olustee, out of the total population over 16 years of age (517), 42.7% or 221 individuals are in the labor force, with 2.3% or 5 of them unemployed. The age group with the highest labor force participation rate is 30 to 34 years, with 100.0% or 29 individuals in the labor force. Within the labor force, the 75 years and over age range has the highest percentage of unemployed individuals, with 45.5% or 5 of them being unemployed.
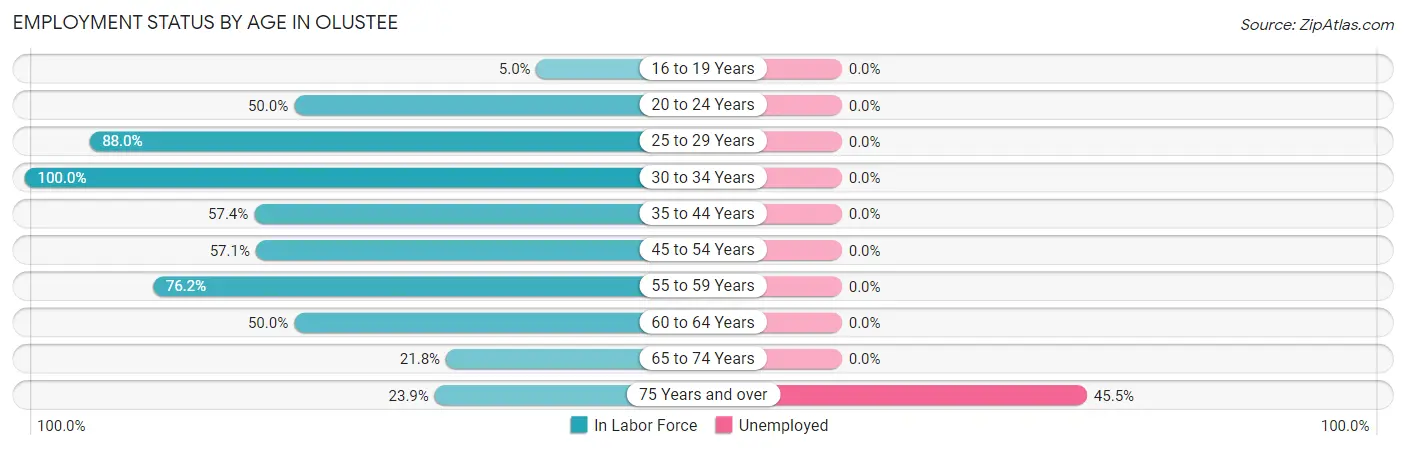
| Age Bracket | In Labor Force | Unemployed |
| 16 to 19 Years | 3 (5.0%) | 0 (0.0%) |
| 20 to 24 Years | 12 (50.0%) | 0 (0.0%) |
| 25 to 29 Years | 44 (88.0%) | 0 (0.0%) |
| 30 to 34 Years | 29 (100.0%) | 0 (0.0%) |
| 35 to 44 Years | 35 (57.4%) | 0 (0.0%) |
| 45 to 54 Years | 16 (57.1%) | 0 (0.0%) |
| 55 to 59 Years | 16 (76.2%) | 0 (0.0%) |
| 60 to 64 Years | 21 (50.0%) | 0 (0.0%) |
| 65 to 74 Years | 34 (21.8%) | 0 (0.0%) |
| 75 Years and over | 11 (23.9%) | 5 (45.5%) |
| Total | 221 (42.7%) | 5 (2.3%) |
Employment Status by Educational Attainment in Olustee
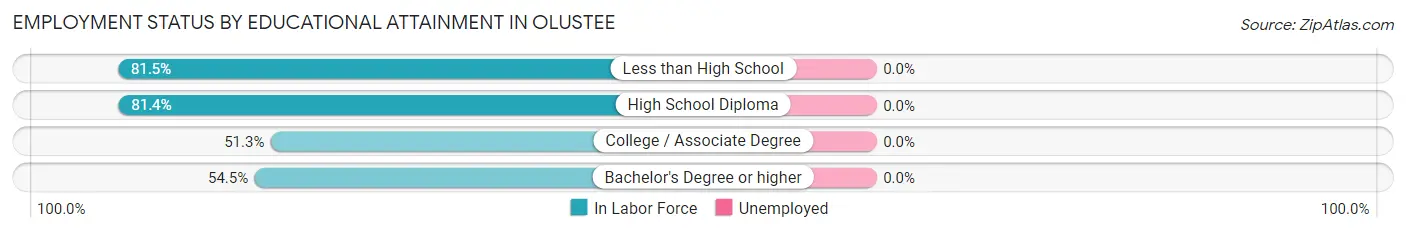
| Educational Attainment | In Labor Force | Unemployed |
| Less than High School | 44 (81.5%) | 0 (0.0%) |
| High School Diploma | 70 (81.4%) | 0 (0.0%) |
| College / Associate Degree | 41 (51.3%) | 0 (0.0%) |
| Bachelor's Degree or higher | 6 (54.5%) | 0 (0.0%) |
| Total | 161 (69.7%) | 0 (0.0%) |
Employment Occupations by Sex in Olustee
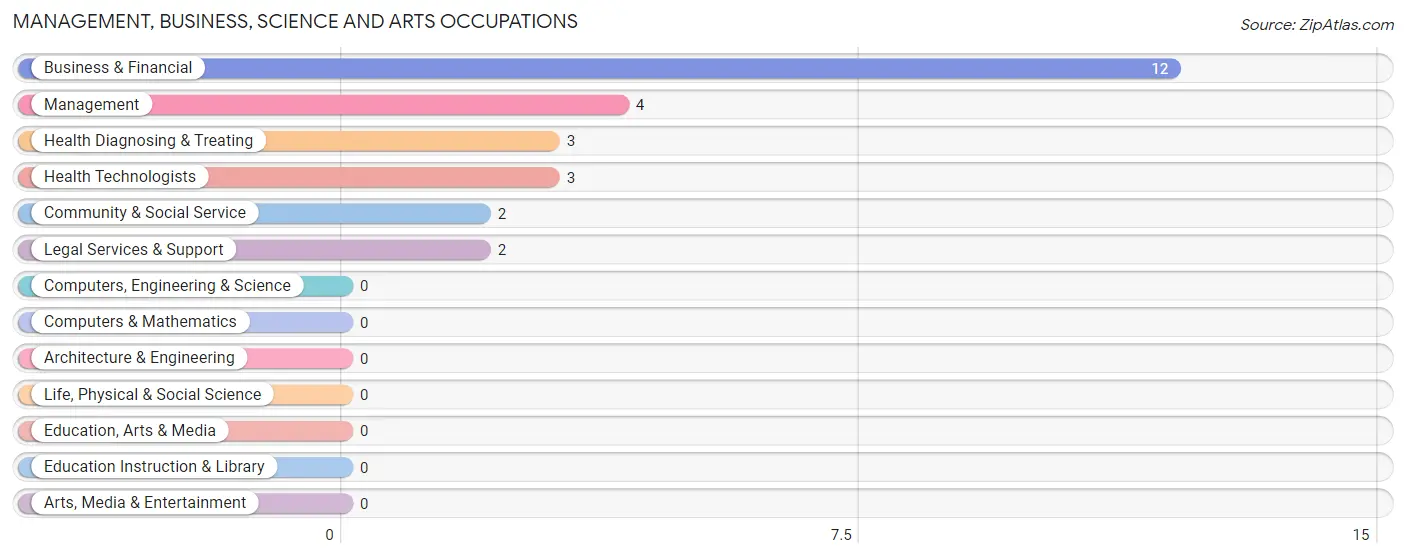
Management, Business, Science and Arts Occupations
The most common Management, Business, Science and Arts occupations in Olustee are Business & Financial (12 | 5.6%), Management (4 | 1.9%), Health Diagnosing & Treating (3 | 1.4%), Health Technologists (3 | 1.4%), and Community & Social Service (2 | 0.9%).
Management, Business, Science and Arts Occupations by Sex
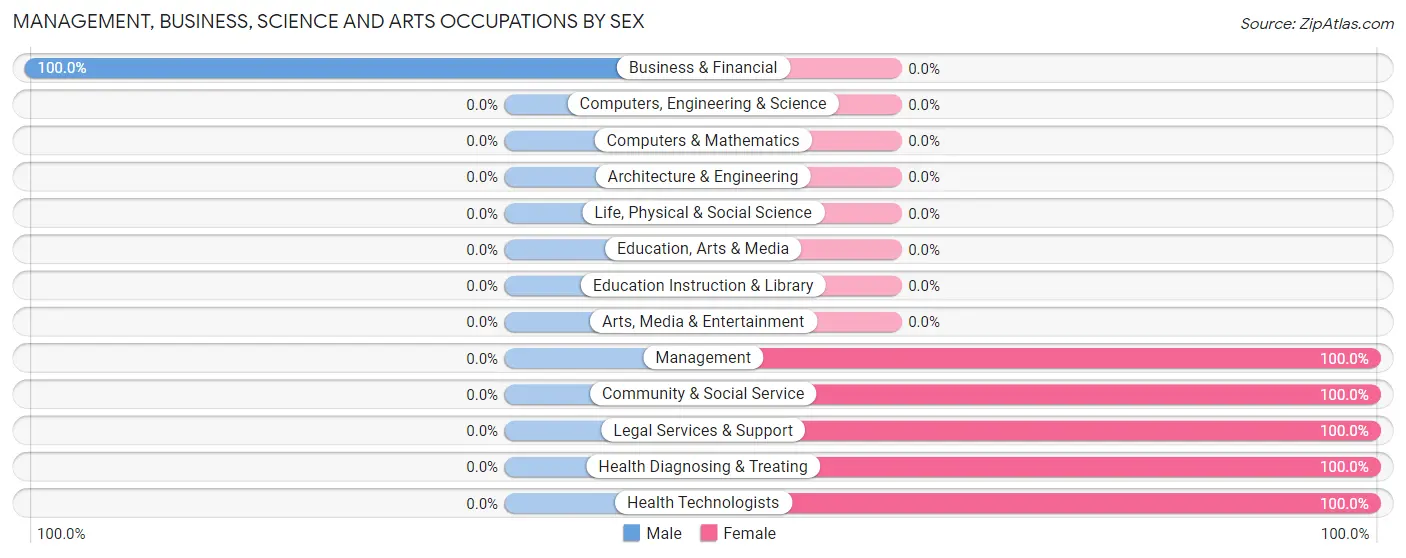
| Occupation | Male | Female |
| Management | 0 (0.0%) | 4 (100.0%) |
| Business & Financial | 12 (100.0%) | 0 (0.0%) |
| Computers, Engineering & Science | 0 (0.0%) | 0 (0.0%) |
| Computers & Mathematics | 0 (0.0%) | 0 (0.0%) |
| Architecture & Engineering | 0 (0.0%) | 0 (0.0%) |
| Life, Physical & Social Science | 0 (0.0%) | 0 (0.0%) |
| Community & Social Service | 0 (0.0%) | 2 (100.0%) |
| Education, Arts & Media | 0 (0.0%) | 0 (0.0%) |
| Legal Services & Support | 0 (0.0%) | 2 (100.0%) |
| Education Instruction & Library | 0 (0.0%) | 0 (0.0%) |
| Arts, Media & Entertainment | 0 (0.0%) | 0 (0.0%) |
| Health Diagnosing & Treating | 0 (0.0%) | 3 (100.0%) |
| Health Technologists | 0 (0.0%) | 3 (100.0%) |
| Total (Category) | 12 (57.1%) | 9 (42.9%) |
| Total (Overall) | 139 (64.9%) | 75 (35.0%) |
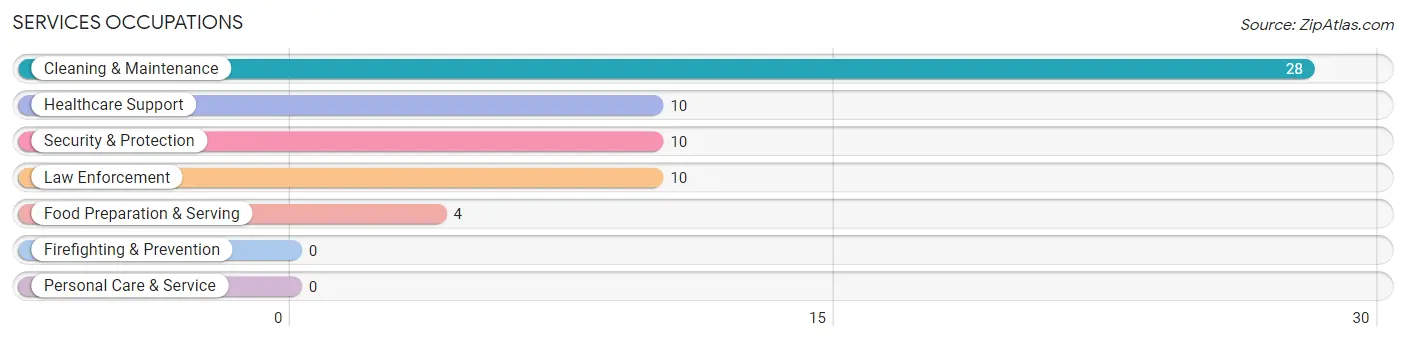
Services Occupations
The most common Services occupations in Olustee are Cleaning & Maintenance (28 | 13.1%), Healthcare Support (10 | 4.7%), Security & Protection (10 | 4.7%), Law Enforcement (10 | 4.7%), and Food Preparation & Serving (4 | 1.9%).
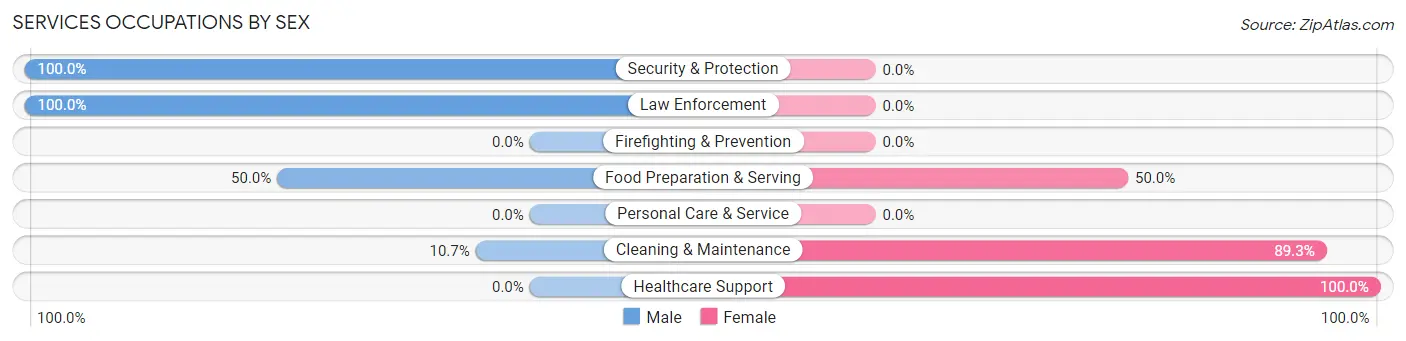
Services Occupations by Sex
Within the Services occupations in Olustee, the most male-oriented occupations are Security & Protection (100.0%), Law Enforcement (100.0%), and Food Preparation & Serving (50.0%), while the most female-oriented occupations are Healthcare Support (100.0%), Cleaning & Maintenance (89.3%), and Food Preparation & Serving (50.0%).
| Occupation | Male | Female |
| Healthcare Support | 0 (0.0%) | 10 (100.0%) |
| Security & Protection | 10 (100.0%) | 0 (0.0%) |
| Firefighting & Prevention | 0 (0.0%) | 0 (0.0%) |
| Law Enforcement | 10 (100.0%) | 0 (0.0%) |
| Food Preparation & Serving | 2 (50.0%) | 2 (50.0%) |
| Cleaning & Maintenance | 3 (10.7%) | 25 (89.3%) |
| Personal Care & Service | 0 (0.0%) | 0 (0.0%) |
| Total (Category) | 15 (28.8%) | 37 (71.2%) |
| Total (Overall) | 139 (64.9%) | 75 (35.0%) |
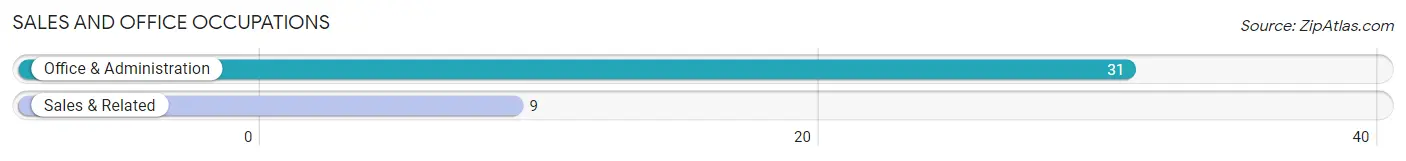
Sales and Office Occupations
The most common Sales and Office occupations in Olustee are Office & Administration (31 | 14.5%), and Sales & Related (9 | 4.2%).
Sales and Office Occupations by Sex

| Occupation | Male | Female |
| Sales & Related | 9 (100.0%) | 0 (0.0%) |
| Office & Administration | 4 (12.9%) | 27 (87.1%) |
| Total (Category) | 13 (32.5%) | 27 (67.5%) |
| Total (Overall) | 139 (64.9%) | 75 (35.0%) |
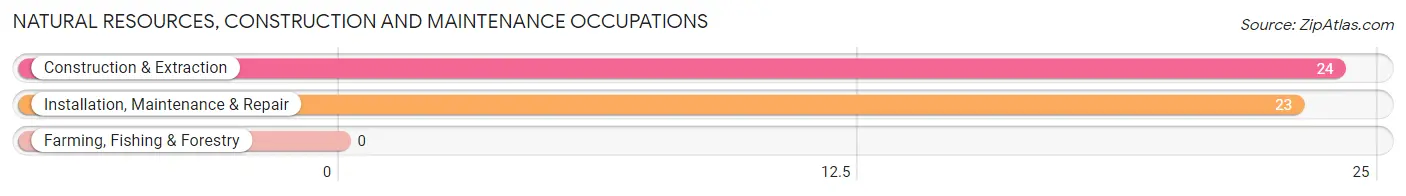
Natural Resources, Construction and Maintenance Occupations
The most common Natural Resources, Construction and Maintenance occupations in Olustee are Construction & Extraction (24 | 11.2%), and Installation, Maintenance & Repair (23 | 10.7%).
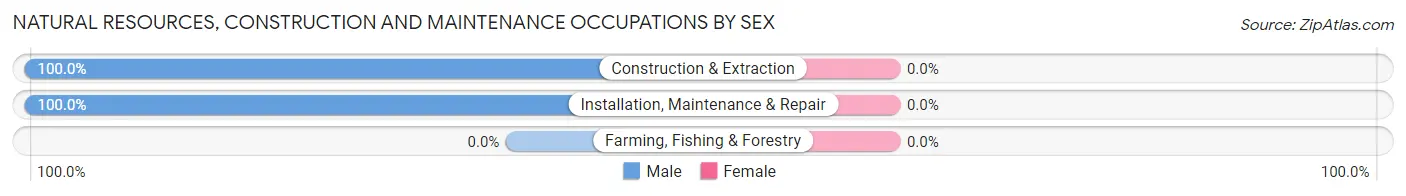
Natural Resources, Construction and Maintenance Occupations by Sex
| Occupation | Male | Female |
| Farming, Fishing & Forestry | 0 (0.0%) | 0 (0.0%) |
| Construction & Extraction | 24 (100.0%) | 0 (0.0%) |
| Installation, Maintenance & Repair | 23 (100.0%) | 0 (0.0%) |
| Total (Category) | 47 (100.0%) | 0 (0.0%) |
| Total (Overall) | 139 (64.9%) | 75 (35.0%) |
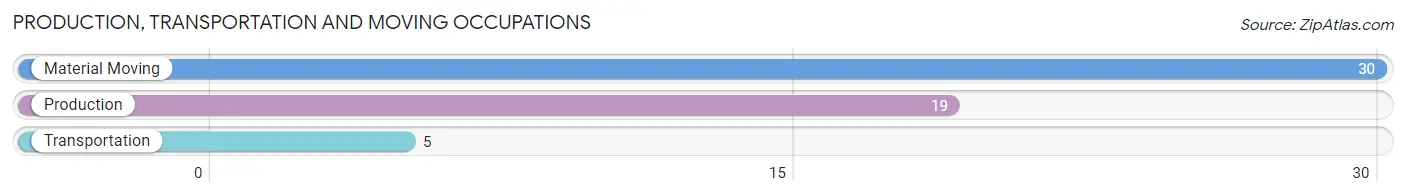
Production, Transportation and Moving Occupations
The most common Production, Transportation and Moving occupations in Olustee are Material Moving (30 | 14.0%), Production (19 | 8.9%), and Transportation (5 | 2.3%).
Production, Transportation and Moving Occupations by Sex
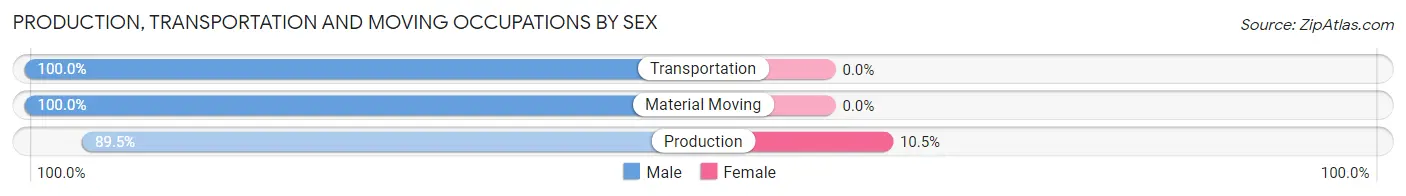
| Occupation | Male | Female |
| Production | 17 (89.5%) | 2 (10.5%) |
| Transportation | 5 (100.0%) | 0 (0.0%) |
| Material Moving | 30 (100.0%) | 0 (0.0%) |
| Total (Category) | 52 (96.3%) | 2 (3.7%) |
| Total (Overall) | 139 (64.9%) | 75 (35.0%) |
Employment Industries by Sex in Olustee
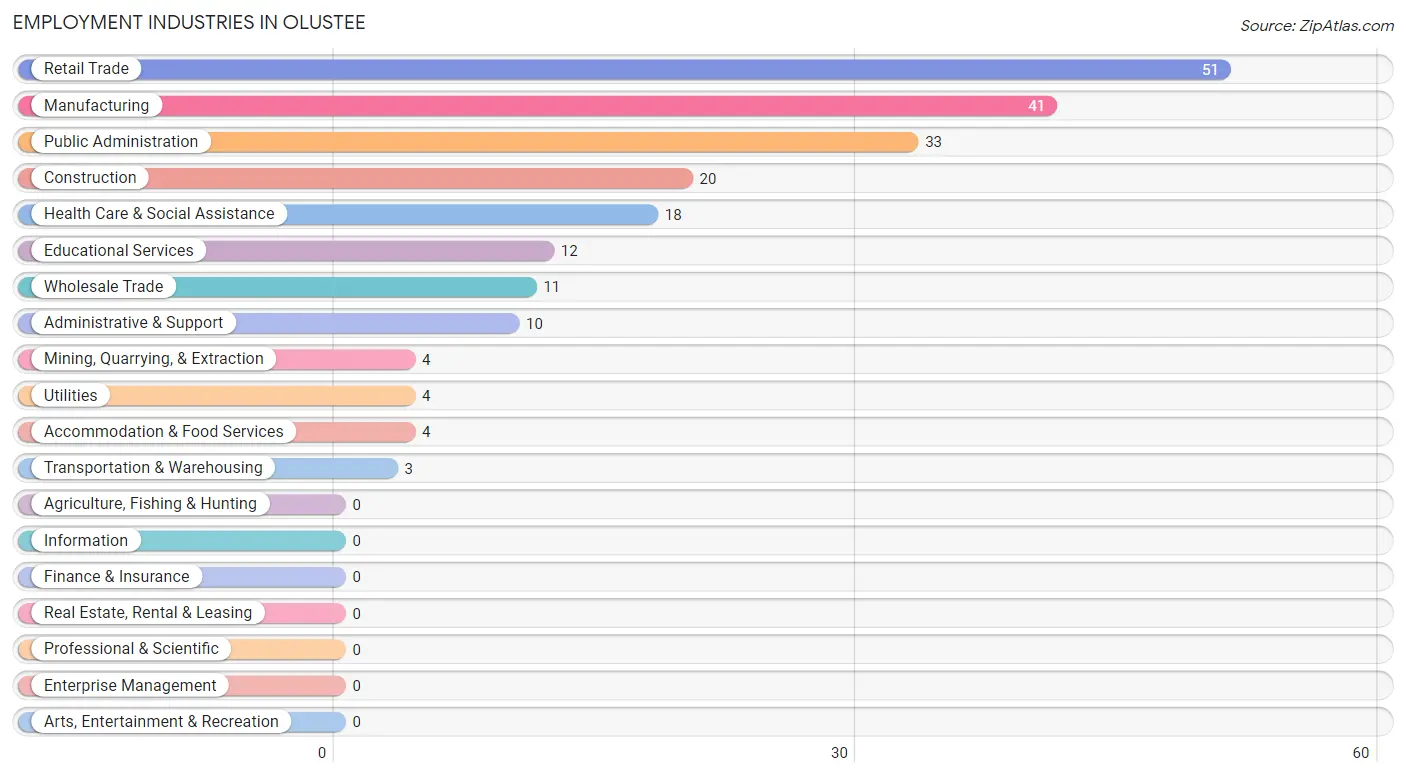
Employment Industries in Olustee
The major employment industries in Olustee include Retail Trade (51 | 23.8%), Manufacturing (41 | 19.2%), Public Administration (33 | 15.4%), Construction (20 | 9.3%), and Health Care & Social Assistance (18 | 8.4%).
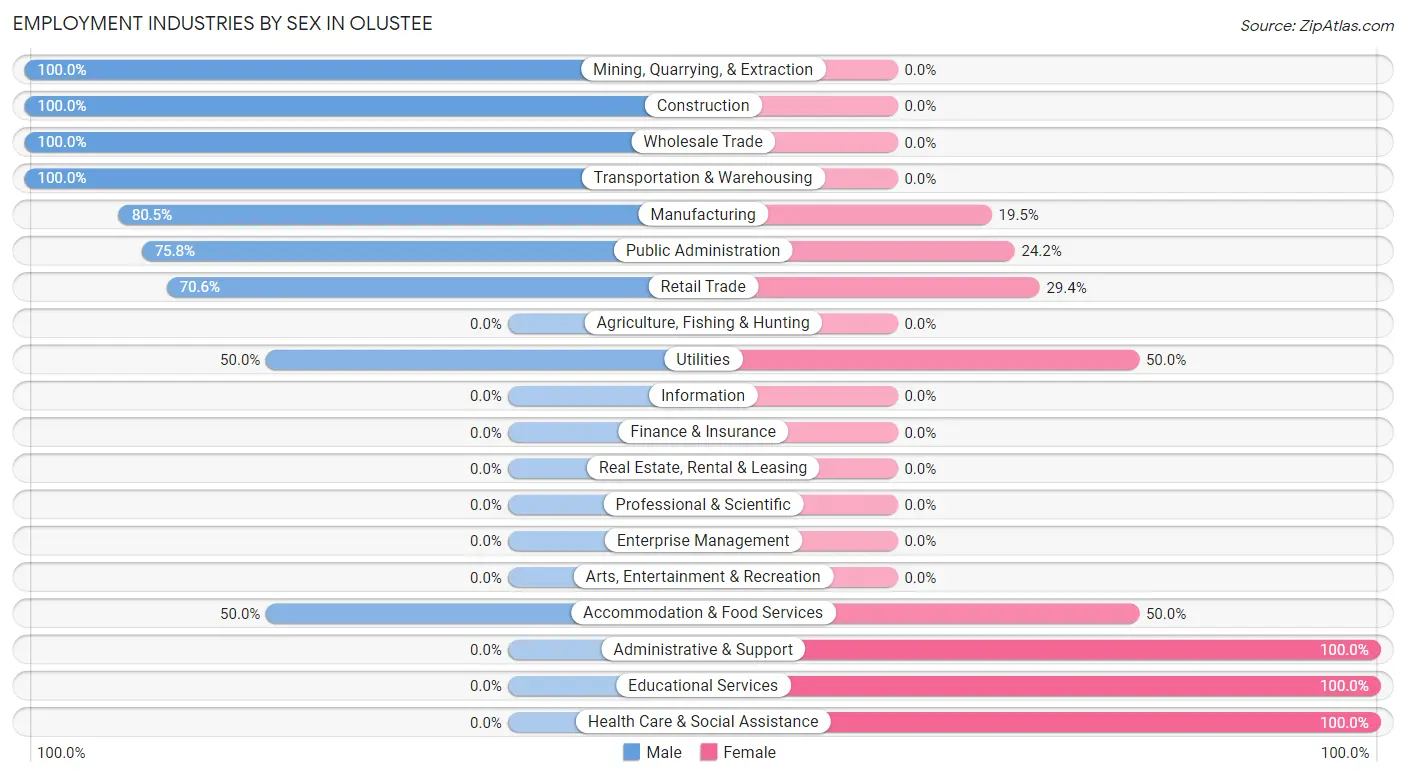
Employment Industries by Sex in Olustee
The Olustee industries that see more men than women are Mining, Quarrying, & Extraction (100.0%), Construction (100.0%), and Wholesale Trade (100.0%), whereas the industries that tend to have a higher number of women are Administrative & Support (100.0%), Educational Services (100.0%), and Health Care & Social Assistance (100.0%).
| Industry | Male | Female |
| Agriculture, Fishing & Hunting | 0 (0.0%) | 0 (0.0%) |
| Mining, Quarrying, & Extraction | 4 (100.0%) | 0 (0.0%) |
| Construction | 20 (100.0%) | 0 (0.0%) |
| Manufacturing | 33 (80.5%) | 8 (19.5%) |
| Wholesale Trade | 11 (100.0%) | 0 (0.0%) |
| Retail Trade | 36 (70.6%) | 15 (29.4%) |
| Transportation & Warehousing | 3 (100.0%) | 0 (0.0%) |
| Utilities | 2 (50.0%) | 2 (50.0%) |
| Information | 0 (0.0%) | 0 (0.0%) |
| Finance & Insurance | 0 (0.0%) | 0 (0.0%) |
| Real Estate, Rental & Leasing | 0 (0.0%) | 0 (0.0%) |
| Professional & Scientific | 0 (0.0%) | 0 (0.0%) |
| Enterprise Management | 0 (0.0%) | 0 (0.0%) |
| Administrative & Support | 0 (0.0%) | 10 (100.0%) |
| Educational Services | 0 (0.0%) | 12 (100.0%) |
| Health Care & Social Assistance | 0 (0.0%) | 18 (100.0%) |
| Arts, Entertainment & Recreation | 0 (0.0%) | 0 (0.0%) |
| Accommodation & Food Services | 2 (50.0%) | 2 (50.0%) |
| Public Administration | 25 (75.8%) | 8 (24.2%) |
| Total | 139 (64.9%) | 75 (35.0%) |
Education in Olustee
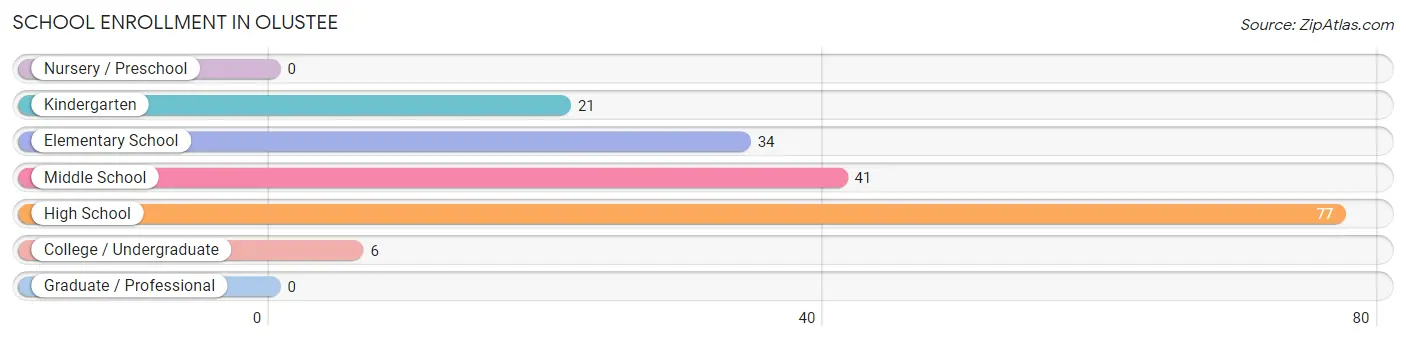
School Enrollment in Olustee
The most common levels of schooling among the 179 students in Olustee are high school (77 | 43.0%), middle school (41 | 22.9%), and elementary school (34 | 19.0%).
| School Level | # Students | % Students |
| Nursery / Preschool | 0 | 0.0% |
| Kindergarten | 21 | 11.7% |
| Elementary School | 34 | 19.0% |
| Middle School | 41 | 22.9% |
| High School | 77 | 43.0% |
| College / Undergraduate | 6 | 3.4% |
| Graduate / Professional | 0 | 0.0% |
| Total | 179 | 100.0% |
School Enrollment by Age by Funding Source in Olustee
Out of a total of 179 students who are enrolled in schools in Olustee, 7 (3.9%) attend a private institution, while the remaining 172 (96.1%) are enrolled in public schools. The age group of 5 to 9 year old has the highest likelihood of being enrolled in private schools, with 5 (10.4% in the age bracket) enrolled. Conversely, the age group of 15 to 17 year olds has the lowest likelihood of being enrolled in a private school, with 55 (100.0% in the age bracket) attending a public institution.
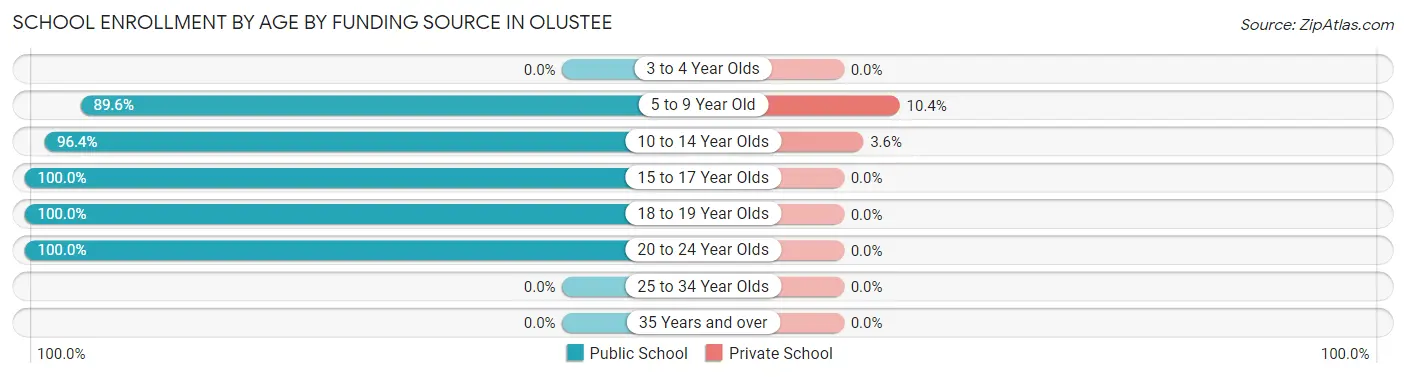
| Age Bracket | Public School | Private School |
| 3 to 4 Year Olds | 0 (0.0%) | 0 (0.0%) |
| 5 to 9 Year Old | 43 (89.6%) | 5 (10.4%) |
| 10 to 14 Year Olds | 53 (96.4%) | 2 (3.6%) |
| 15 to 17 Year Olds | 55 (100.0%) | 0 (0.0%) |
| 18 to 19 Year Olds | 15 (100.0%) | 0 (0.0%) |
| 20 to 24 Year Olds | 6 (100.0%) | 0 (0.0%) |
| 25 to 34 Year Olds | 0 (0.0%) | 0 (0.0%) |
| 35 Years and over | 0 (0.0%) | 0 (0.0%) |
| Total | 172 (96.1%) | 7 (3.9%) |
Educational Attainment by Field of Study in Olustee
Education (7 | 29.2%), business (5 | 20.8%), social sciences (4 | 16.7%), multidisciplinary studies (2 | 8.3%), and liberal arts & history (2 | 8.3%) are the most common fields of study among 24 individuals in Olustee who have obtained a bachelor's degree or higher.
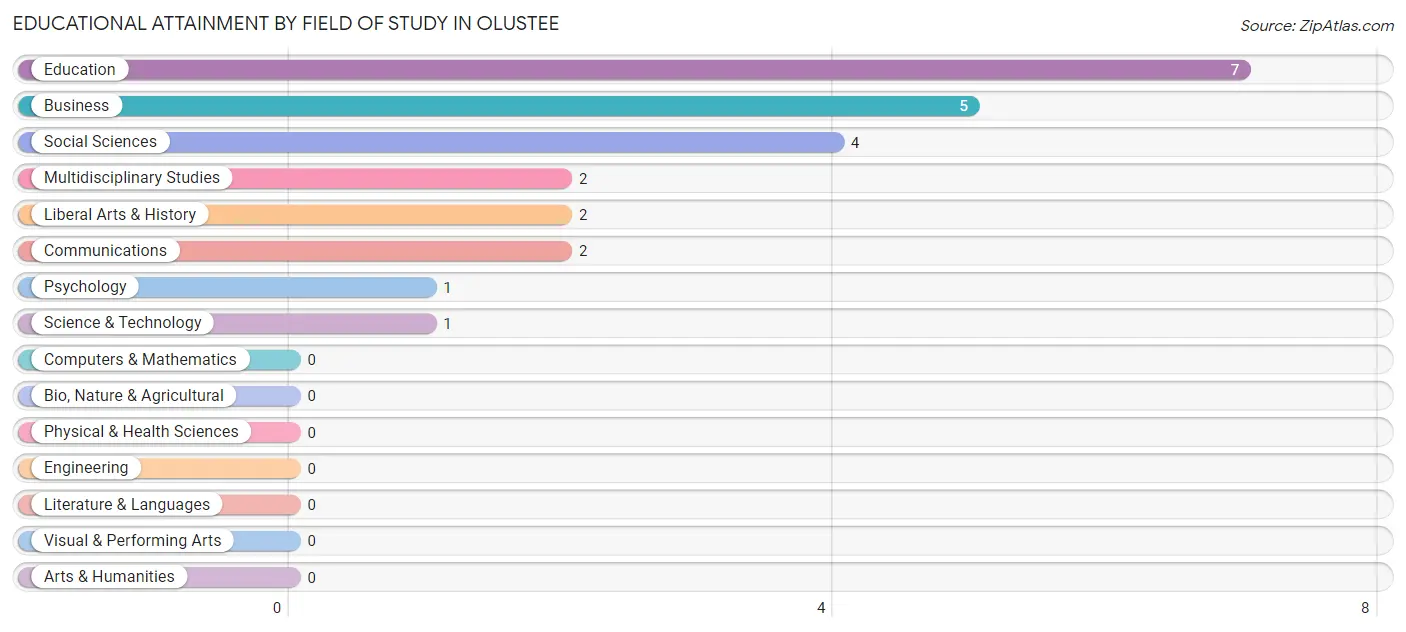
| Field of Study | # Graduates | % Graduates |
| Computers & Mathematics | 0 | 0.0% |
| Bio, Nature & Agricultural | 0 | 0.0% |
| Physical & Health Sciences | 0 | 0.0% |
| Psychology | 1 | 4.2% |
| Social Sciences | 4 | 16.7% |
| Engineering | 0 | 0.0% |
| Multidisciplinary Studies | 2 | 8.3% |
| Science & Technology | 1 | 4.2% |
| Business | 5 | 20.8% |
| Education | 7 | 29.2% |
| Literature & Languages | 0 | 0.0% |
| Liberal Arts & History | 2 | 8.3% |
| Visual & Performing Arts | 0 | 0.0% |
| Communications | 2 | 8.3% |
| Arts & Humanities | 0 | 0.0% |
| Total | 24 | 100.0% |
Transportation & Commute in Olustee
Vehicle Availability by Sex in Olustee
The most prevalent vehicle ownership categories in Olustee are males with 2 vehicles (77, accounting for 54.6%) and females with 2 vehicles (20, making up 102.7%).
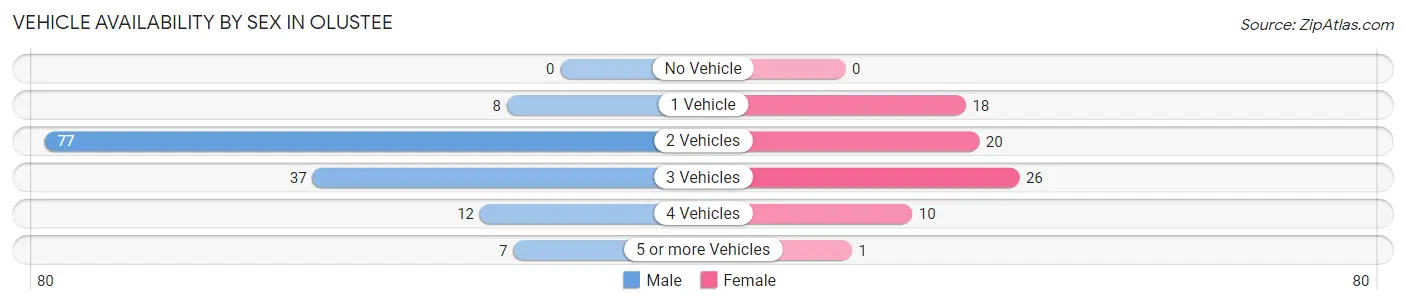
| Vehicles Available | Male | Female |
| No Vehicle | 0 (0.0%) | 0 (0.0%) |
| 1 Vehicle | 8 (5.7%) | 18 (24.0%) |
| 2 Vehicles | 77 (54.6%) | 20 (26.7%) |
| 3 Vehicles | 37 (26.2%) | 26 (34.7%) |
| 4 Vehicles | 12 (8.5%) | 10 (13.3%) |
| 5 or more Vehicles | 7 (5.0%) | 1 (1.3%) |
| Total | 141 (100.0%) | 75 (100.0%) |
Commute Time in Olustee
The most frequently occuring commute durations in Olustee are 20 to 24 minutes (71 commuters, 34.1%), 15 to 19 minutes (40 commuters, 19.2%), and 5 to 9 minutes (32 commuters, 15.4%).
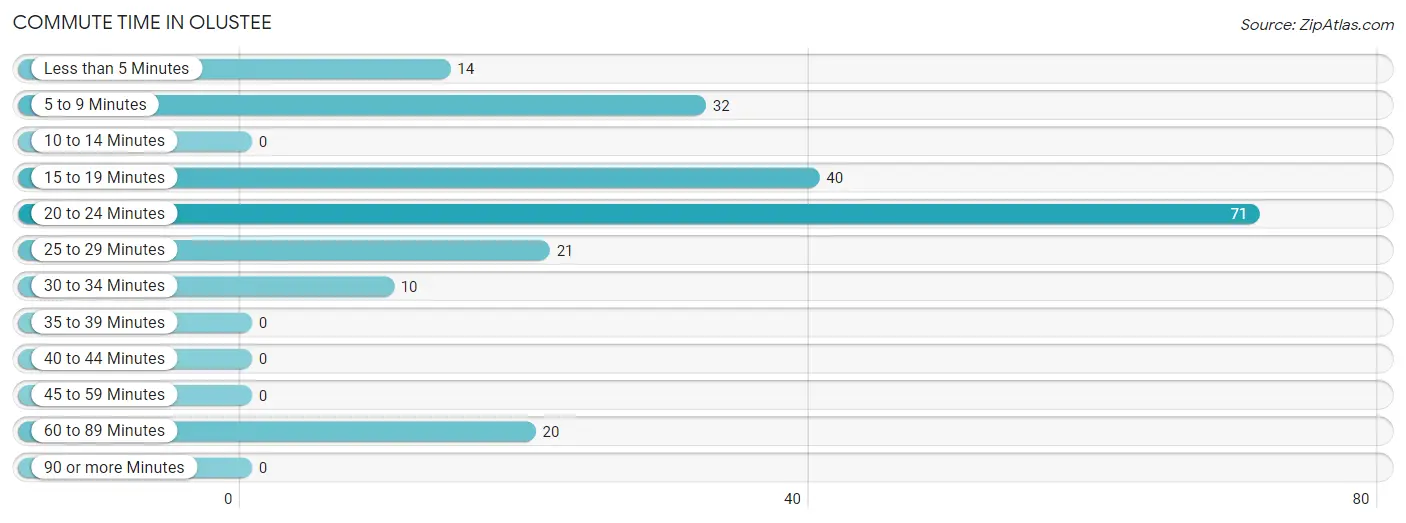
| Commute Time | # Commuters | % Commuters |
| Less than 5 Minutes | 14 | 6.7% |
| 5 to 9 Minutes | 32 | 15.4% |
| 10 to 14 Minutes | 0 | 0.0% |
| 15 to 19 Minutes | 40 | 19.2% |
| 20 to 24 Minutes | 71 | 34.1% |
| 25 to 29 Minutes | 21 | 10.1% |
| 30 to 34 Minutes | 10 | 4.8% |
| 35 to 39 Minutes | 0 | 0.0% |
| 40 to 44 Minutes | 0 | 0.0% |
| 45 to 59 Minutes | 0 | 0.0% |
| 60 to 89 Minutes | 20 | 9.6% |
| 90 or more Minutes | 0 | 0.0% |
Commute Time by Sex in Olustee
The most common commute times in Olustee are 20 to 24 minutes (39 commuters, 27.7%) for males and 20 to 24 minutes (32 commuters, 47.8%) for females.
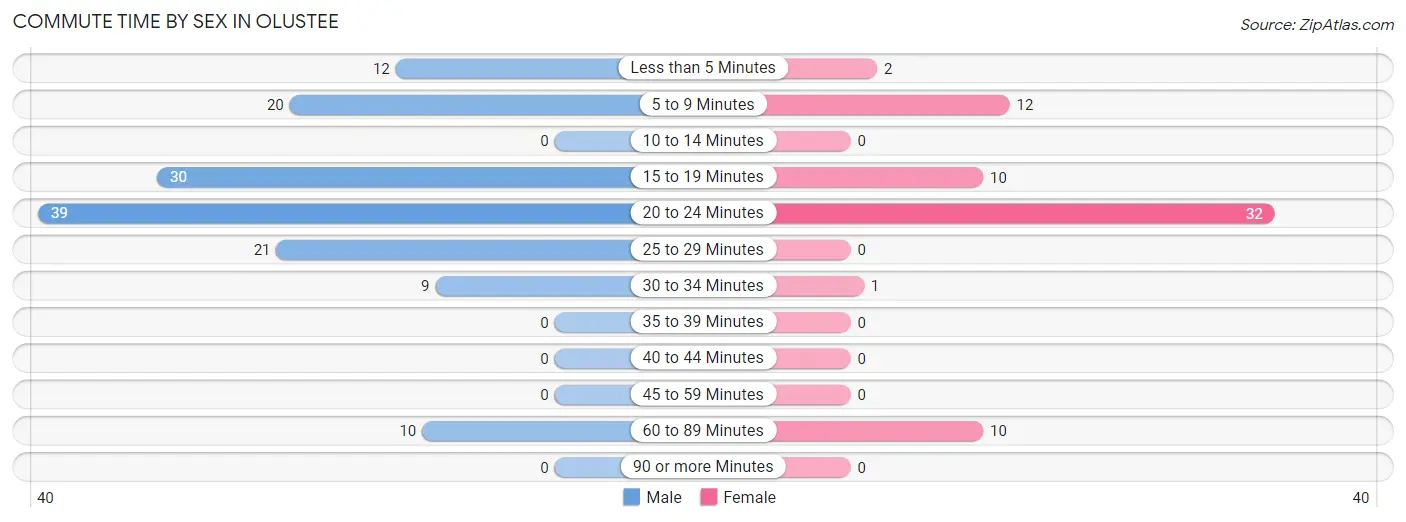
| Commute Time | Male | Female |
| Less than 5 Minutes | 12 (8.5%) | 2 (3.0%) |
| 5 to 9 Minutes | 20 (14.2%) | 12 (17.9%) |
| 10 to 14 Minutes | 0 (0.0%) | 0 (0.0%) |
| 15 to 19 Minutes | 30 (21.3%) | 10 (14.9%) |
| 20 to 24 Minutes | 39 (27.7%) | 32 (47.8%) |
| 25 to 29 Minutes | 21 (14.9%) | 0 (0.0%) |
| 30 to 34 Minutes | 9 (6.4%) | 1 (1.5%) |
| 35 to 39 Minutes | 0 (0.0%) | 0 (0.0%) |
| 40 to 44 Minutes | 0 (0.0%) | 0 (0.0%) |
| 45 to 59 Minutes | 0 (0.0%) | 0 (0.0%) |
| 60 to 89 Minutes | 10 (7.1%) | 10 (14.9%) |
| 90 or more Minutes | 0 (0.0%) | 0 (0.0%) |
Time of Departure to Work by Sex in Olustee
The most frequent times of departure to work in Olustee are 6:00 AM to 6:29 AM (36, 25.5%) for males and 4:00 PM to 11:59 PM (22, 32.8%) for females.
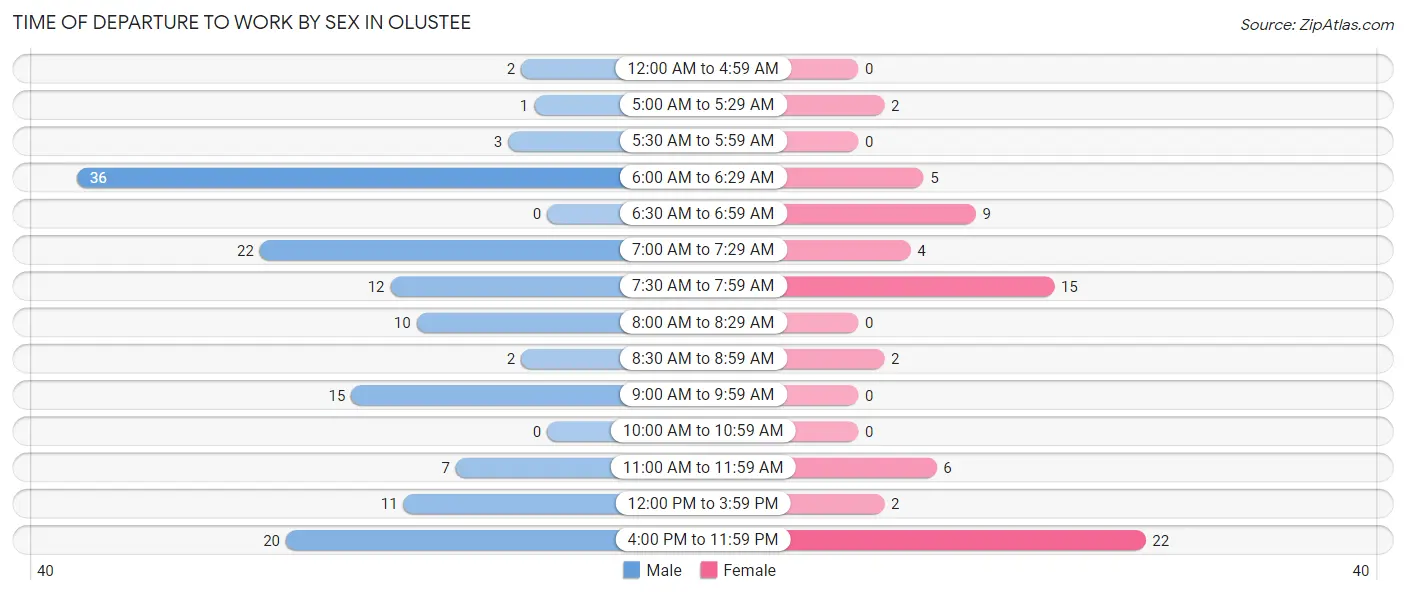
| Time of Departure | Male | Female |
| 12:00 AM to 4:59 AM | 2 (1.4%) | 0 (0.0%) |
| 5:00 AM to 5:29 AM | 1 (0.7%) | 2 (3.0%) |
| 5:30 AM to 5:59 AM | 3 (2.1%) | 0 (0.0%) |
| 6:00 AM to 6:29 AM | 36 (25.5%) | 5 (7.5%) |
| 6:30 AM to 6:59 AM | 0 (0.0%) | 9 (13.4%) |
| 7:00 AM to 7:29 AM | 22 (15.6%) | 4 (6.0%) |
| 7:30 AM to 7:59 AM | 12 (8.5%) | 15 (22.4%) |
| 8:00 AM to 8:29 AM | 10 (7.1%) | 0 (0.0%) |
| 8:30 AM to 8:59 AM | 2 (1.4%) | 2 (3.0%) |
| 9:00 AM to 9:59 AM | 15 (10.6%) | 0 (0.0%) |
| 10:00 AM to 10:59 AM | 0 (0.0%) | 0 (0.0%) |
| 11:00 AM to 11:59 AM | 7 (5.0%) | 6 (9.0%) |
| 12:00 PM to 3:59 PM | 11 (7.8%) | 2 (3.0%) |
| 4:00 PM to 11:59 PM | 20 (14.2%) | 22 (32.8%) |
| Total | 141 (100.0%) | 67 (100.0%) |
Housing Occupancy in Olustee
Occupancy by Ownership in Olustee
Of the total 273 dwellings in Olustee, owner-occupied units account for 107 (39.2%), while renter-occupied units make up 166 (60.8%).
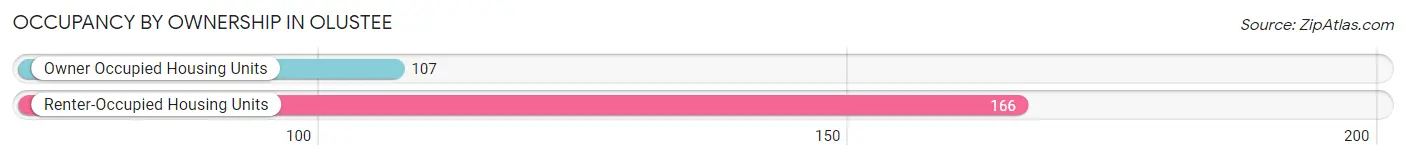
| Occupancy | # Housing Units | % Housing Units |
| Owner Occupied Housing Units | 107 | 39.2% |
| Renter-Occupied Housing Units | 166 | 60.8% |
| Total Occupied Housing Units | 273 | 100.0% |
Occupancy by Household Size in Olustee
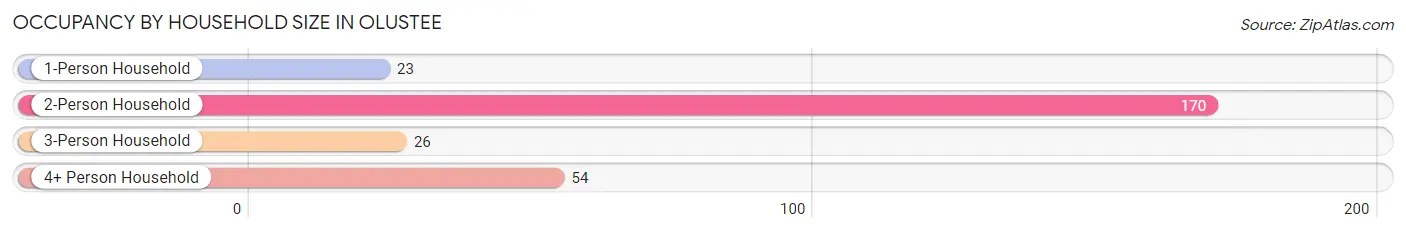
| Household Size | # Housing Units | % Housing Units |
| 1-Person Household | 23 | 8.4% |
| 2-Person Household | 170 | 62.3% |
| 3-Person Household | 26 | 9.5% |
| 4+ Person Household | 54 | 19.8% |
| Total Housing Units | 273 | 100.0% |
Occupancy by Ownership by Household Size in Olustee
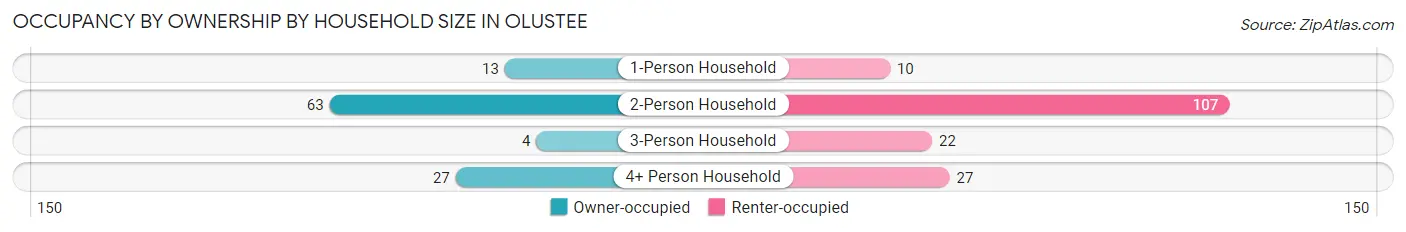
| Household Size | Owner-occupied | Renter-occupied |
| 1-Person Household | 13 (56.5%) | 10 (43.5%) |
| 2-Person Household | 63 (37.1%) | 107 (62.9%) |
| 3-Person Household | 4 (15.4%) | 22 (84.6%) |
| 4+ Person Household | 27 (50.0%) | 27 (50.0%) |
| Total Housing Units | 107 (39.2%) | 166 (60.8%) |
Occupancy by Educational Attainment in Olustee
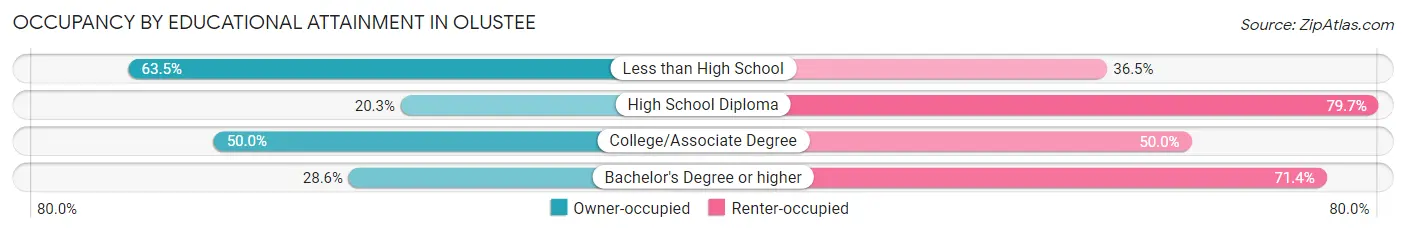
| Household Size | Owner-occupied | Renter-occupied |
| Less than High School | 40 (63.5%) | 23 (36.5%) |
| High School Diploma | 25 (20.3%) | 98 (79.7%) |
| College/Associate Degree | 40 (50.0%) | 40 (50.0%) |
| Bachelor's Degree or higher | 2 (28.6%) | 5 (71.4%) |
Occupancy by Age of Householder in Olustee
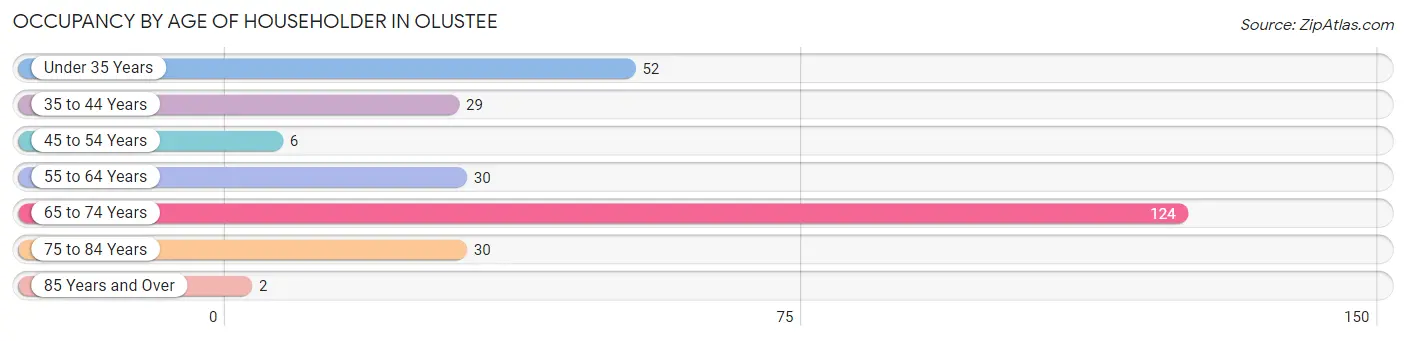
| Age Bracket | # Households | % Households |
| Under 35 Years | 52 | 19.1% |
| 35 to 44 Years | 29 | 10.6% |
| 45 to 54 Years | 6 | 2.2% |
| 55 to 64 Years | 30 | 11.0% |
| 65 to 74 Years | 124 | 45.4% |
| 75 to 84 Years | 30 | 11.0% |
| 85 Years and Over | 2 | 0.7% |
| Total | 273 | 100.0% |
Housing Finances in Olustee
Median Income by Occupancy in Olustee
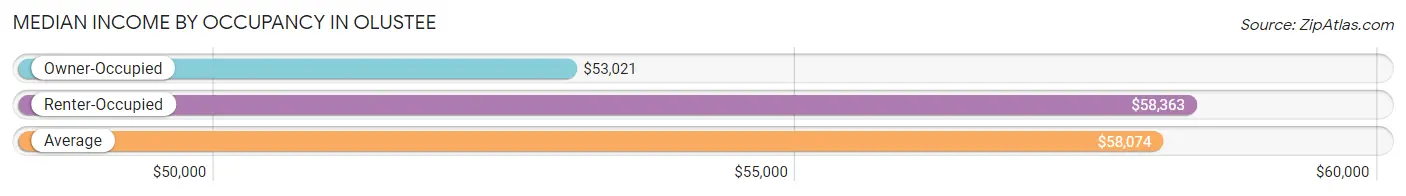
| Occupancy Type | # Households | Median Income |
| Owner-Occupied | 107 (39.2%) | $53,021 |
| Renter-Occupied | 166 (60.8%) | $58,363 |
| Average | 273 (100.0%) | $58,074 |
Occupancy by Householder Income Bracket in Olustee
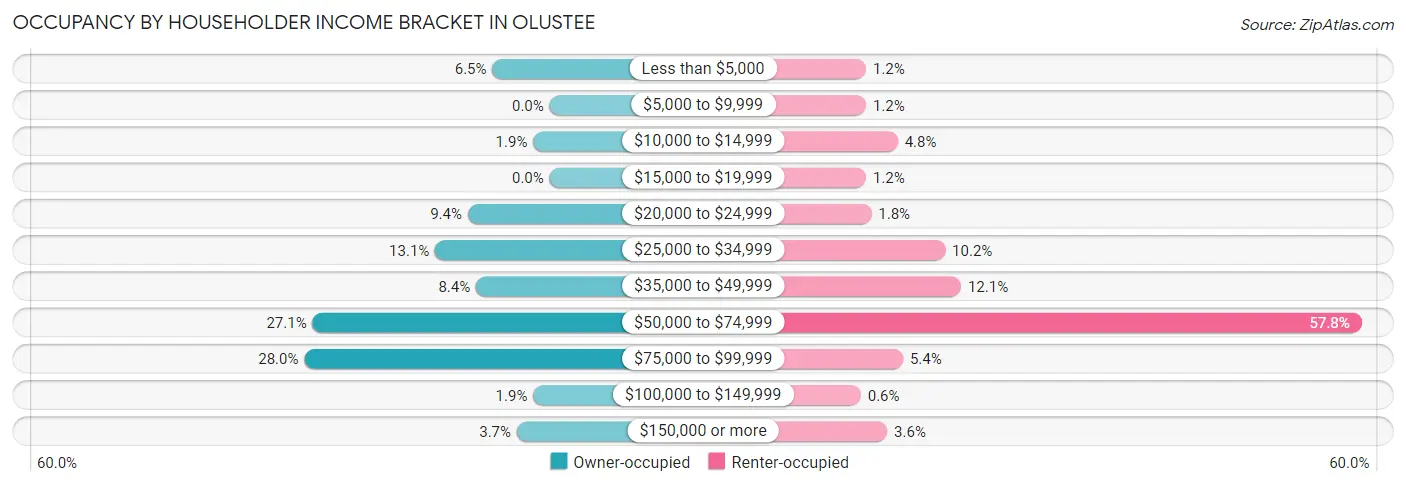
| Income Bracket | Owner-occupied | Renter-occupied |
| Less than $5,000 | 7 (6.5%) | 2 (1.2%) |
| $5,000 to $9,999 | 0 (0.0%) | 2 (1.2%) |
| $10,000 to $14,999 | 2 (1.9%) | 8 (4.8%) |
| $15,000 to $19,999 | 0 (0.0%) | 2 (1.2%) |
| $20,000 to $24,999 | 10 (9.3%) | 3 (1.8%) |
| $25,000 to $34,999 | 14 (13.1%) | 17 (10.2%) |
| $35,000 to $49,999 | 9 (8.4%) | 20 (12.0%) |
| $50,000 to $74,999 | 29 (27.1%) | 96 (57.8%) |
| $75,000 to $99,999 | 30 (28.0%) | 9 (5.4%) |
| $100,000 to $149,999 | 2 (1.9%) | 1 (0.6%) |
| $150,000 or more | 4 (3.7%) | 6 (3.6%) |
| Total | 107 (100.0%) | 166 (100.0%) |
Monthly Housing Cost Tiers in Olustee
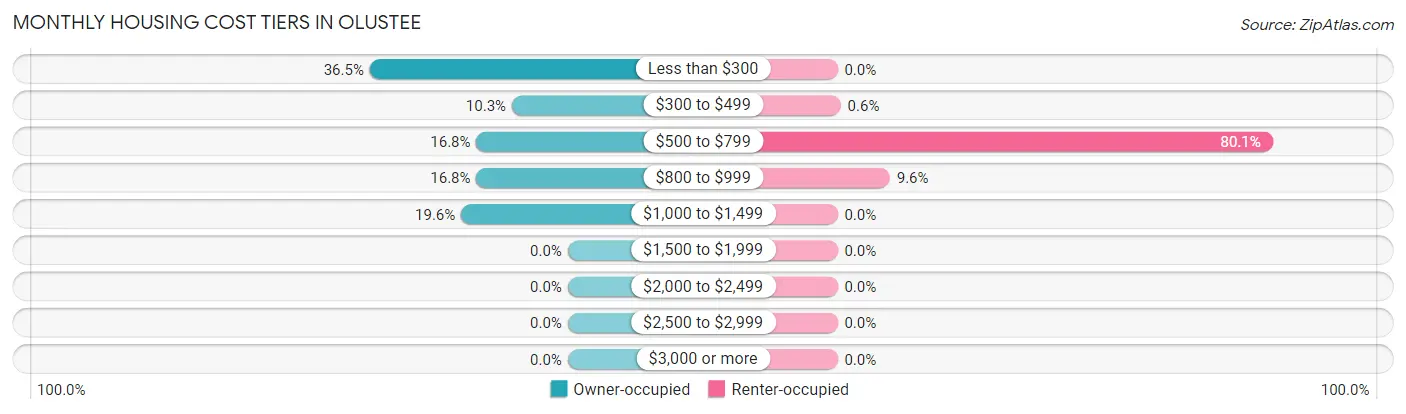
| Monthly Cost | Owner-occupied | Renter-occupied |
| Less than $300 | 39 (36.4%) | 0 (0.0%) |
| $300 to $499 | 11 (10.3%) | 1 (0.6%) |
| $500 to $799 | 18 (16.8%) | 133 (80.1%) |
| $800 to $999 | 18 (16.8%) | 16 (9.6%) |
| $1,000 to $1,499 | 21 (19.6%) | 0 (0.0%) |
| $1,500 to $1,999 | 0 (0.0%) | 0 (0.0%) |
| $2,000 to $2,499 | 0 (0.0%) | 0 (0.0%) |
| $2,500 to $2,999 | 0 (0.0%) | 0 (0.0%) |
| $3,000 or more | 0 (0.0%) | 0 (0.0%) |
| Total | 107 (100.0%) | 166 (100.0%) |
Physical Housing Characteristics in Olustee
Housing Structures in Olustee
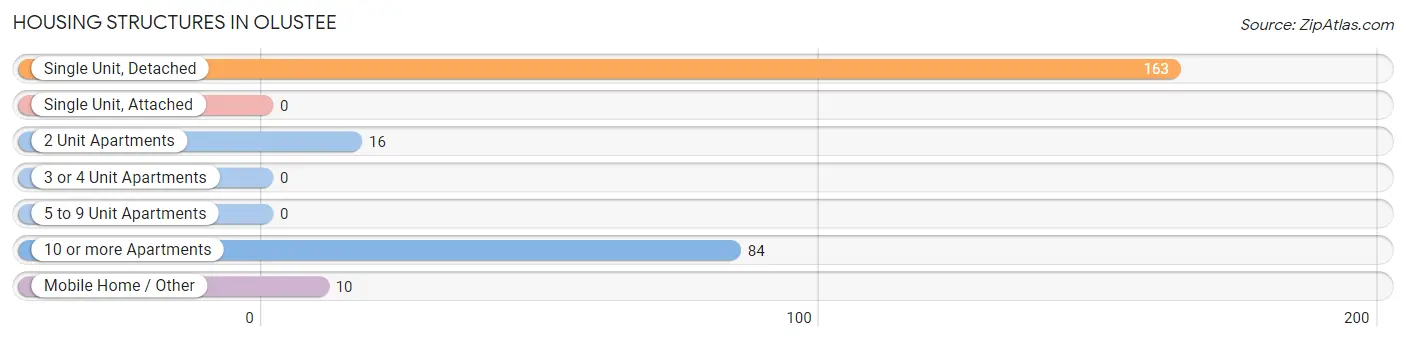
| Structure Type | # Housing Units | % Housing Units |
| Single Unit, Detached | 163 | 59.7% |
| Single Unit, Attached | 0 | 0.0% |
| 2 Unit Apartments | 16 | 5.9% |
| 3 or 4 Unit Apartments | 0 | 0.0% |
| 5 to 9 Unit Apartments | 0 | 0.0% |
| 10 or more Apartments | 84 | 30.8% |
| Mobile Home / Other | 10 | 3.7% |
| Total | 273 | 100.0% |
Housing Structures by Occupancy in Olustee
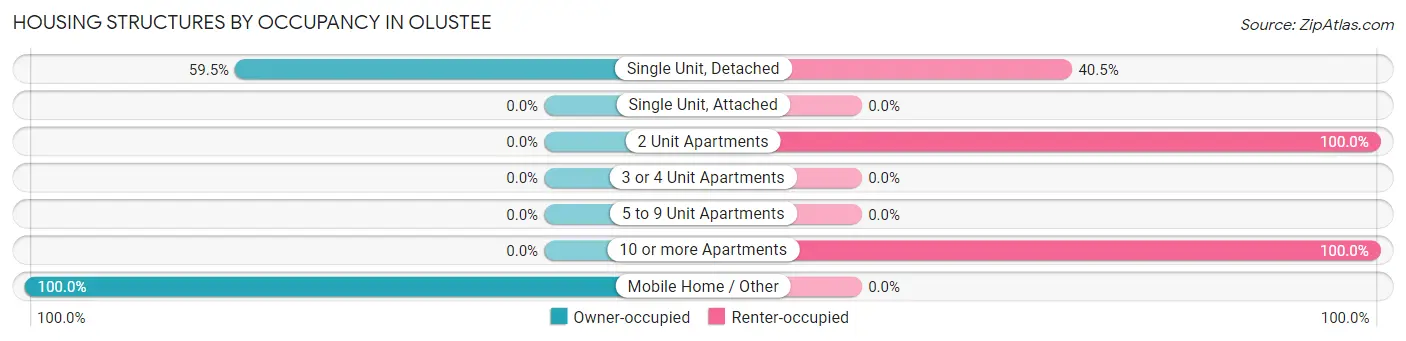
| Structure Type | Owner-occupied | Renter-occupied |
| Single Unit, Detached | 97 (59.5%) | 66 (40.5%) |
| Single Unit, Attached | 0 (0.0%) | 0 (0.0%) |
| 2 Unit Apartments | 0 (0.0%) | 16 (100.0%) |
| 3 or 4 Unit Apartments | 0 (0.0%) | 0 (0.0%) |
| 5 to 9 Unit Apartments | 0 (0.0%) | 0 (0.0%) |
| 10 or more Apartments | 0 (0.0%) | 84 (100.0%) |
| Mobile Home / Other | 10 (100.0%) | 0 (0.0%) |
| Total | 107 (39.2%) | 166 (60.8%) |
Housing Structures by Number of Rooms in Olustee
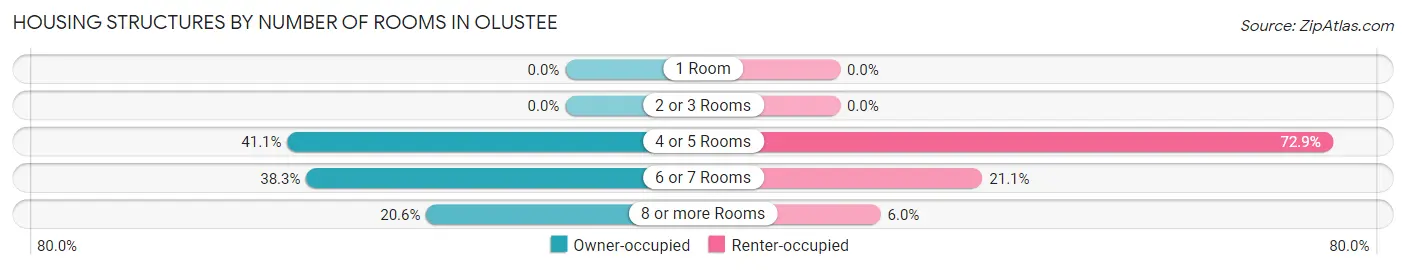
| Number of Rooms | Owner-occupied | Renter-occupied |
| 1 Room | 0 (0.0%) | 0 (0.0%) |
| 2 or 3 Rooms | 0 (0.0%) | 0 (0.0%) |
| 4 or 5 Rooms | 44 (41.1%) | 121 (72.9%) |
| 6 or 7 Rooms | 41 (38.3%) | 35 (21.1%) |
| 8 or more Rooms | 22 (20.6%) | 10 (6.0%) |
| Total | 107 (100.0%) | 166 (100.0%) |
Housing Structure by Heating Type in Olustee
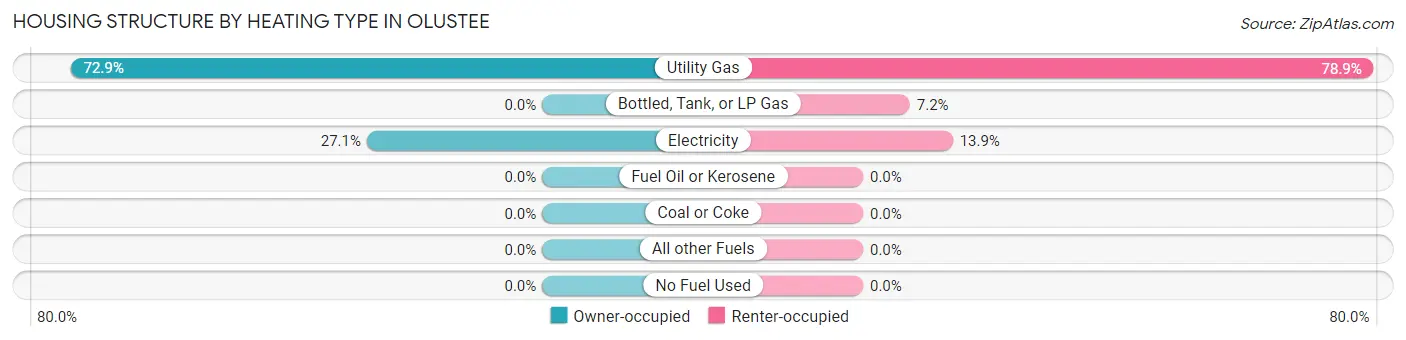
| Heating Type | Owner-occupied | Renter-occupied |
| Utility Gas | 78 (72.9%) | 131 (78.9%) |
| Bottled, Tank, or LP Gas | 0 (0.0%) | 12 (7.2%) |
| Electricity | 29 (27.1%) | 23 (13.9%) |
| Fuel Oil or Kerosene | 0 (0.0%) | 0 (0.0%) |
| Coal or Coke | 0 (0.0%) | 0 (0.0%) |
| All other Fuels | 0 (0.0%) | 0 (0.0%) |
| No Fuel Used | 0 (0.0%) | 0 (0.0%) |
| Total | 107 (100.0%) | 166 (100.0%) |
Household Vehicle Usage in Olustee
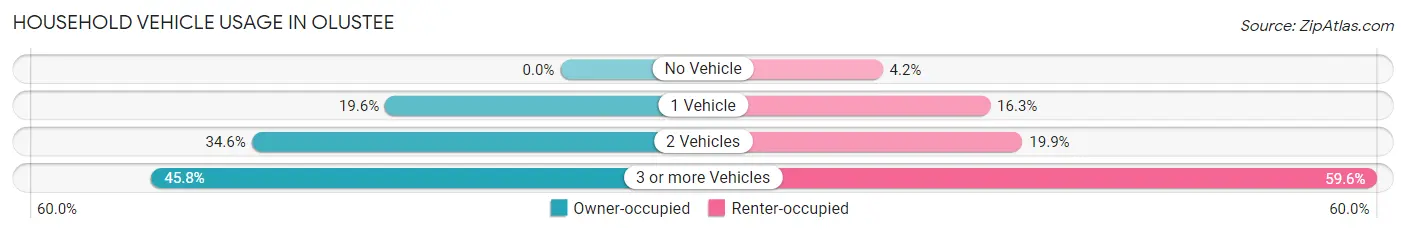
| Vehicles per Household | Owner-occupied | Renter-occupied |
| No Vehicle | 0 (0.0%) | 7 (4.2%) |
| 1 Vehicle | 21 (19.6%) | 27 (16.3%) |
| 2 Vehicles | 37 (34.6%) | 33 (19.9%) |
| 3 or more Vehicles | 49 (45.8%) | 99 (59.6%) |
| Total | 107 (100.0%) | 166 (100.0%) |
Real Estate & Mortgages in Olustee
Real Estate and Mortgage Overview in Olustee
| Characteristic | Without Mortgage | With Mortgage |
| Housing Units | 74 | 33 |
| Median Property Value | $86,700 | $99,300 |
| Median Household Income | $52,222 | $2 |
| Monthly Housing Costs | $293 | $0 |
| Real Estate Taxes | $369 | $0 |
Property Value by Mortgage Status in Olustee
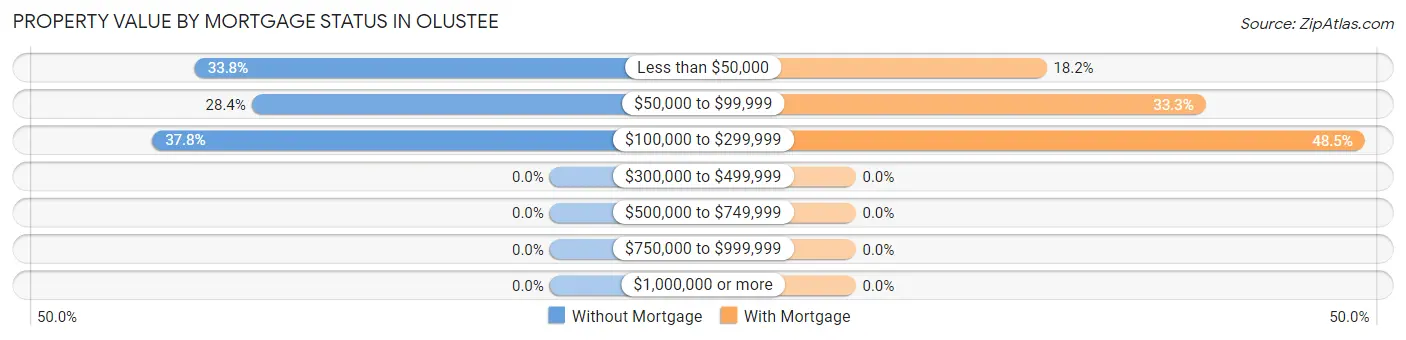
| Property Value | Without Mortgage | With Mortgage |
| Less than $50,000 | 25 (33.8%) | 6 (18.2%) |
| $50,000 to $99,999 | 21 (28.4%) | 11 (33.3%) |
| $100,000 to $299,999 | 28 (37.8%) | 16 (48.5%) |
| $300,000 to $499,999 | 0 (0.0%) | 0 (0.0%) |
| $500,000 to $749,999 | 0 (0.0%) | 0 (0.0%) |
| $750,000 to $999,999 | 0 (0.0%) | 0 (0.0%) |
| $1,000,000 or more | 0 (0.0%) | 0 (0.0%) |
| Total | 74 (100.0%) | 33 (100.0%) |
Household Income by Mortgage Status in Olustee
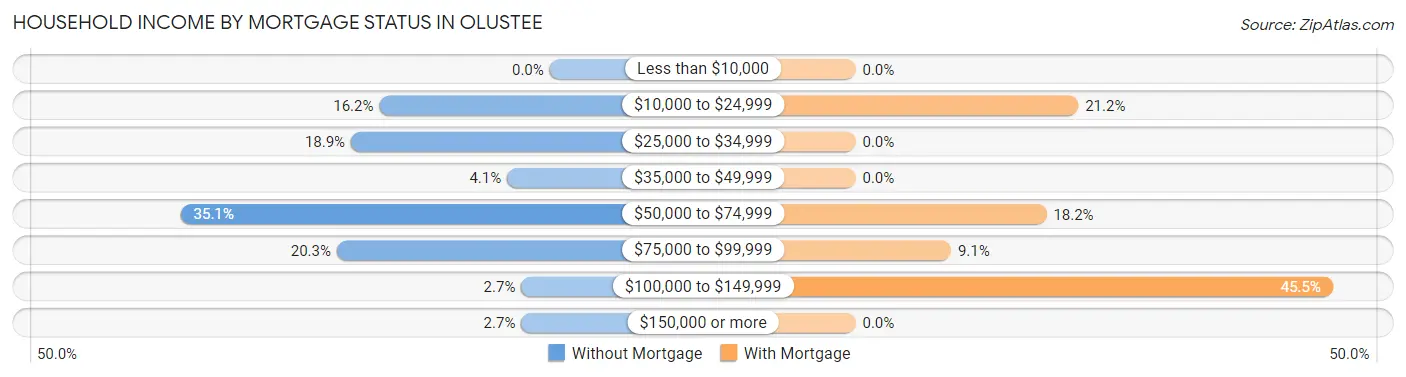
| Household Income | Without Mortgage | With Mortgage |
| Less than $10,000 | 0 (0.0%) | 0 (0.0%) |
| $10,000 to $24,999 | 12 (16.2%) | 7 (21.2%) |
| $25,000 to $34,999 | 14 (18.9%) | 0 (0.0%) |
| $35,000 to $49,999 | 3 (4.1%) | 0 (0.0%) |
| $50,000 to $74,999 | 26 (35.1%) | 6 (18.2%) |
| $75,000 to $99,999 | 15 (20.3%) | 3 (9.1%) |
| $100,000 to $149,999 | 2 (2.7%) | 15 (45.5%) |
| $150,000 or more | 2 (2.7%) | 0 (0.0%) |
| Total | 74 (100.0%) | 33 (100.0%) |
Property Value to Household Income Ratio in Olustee
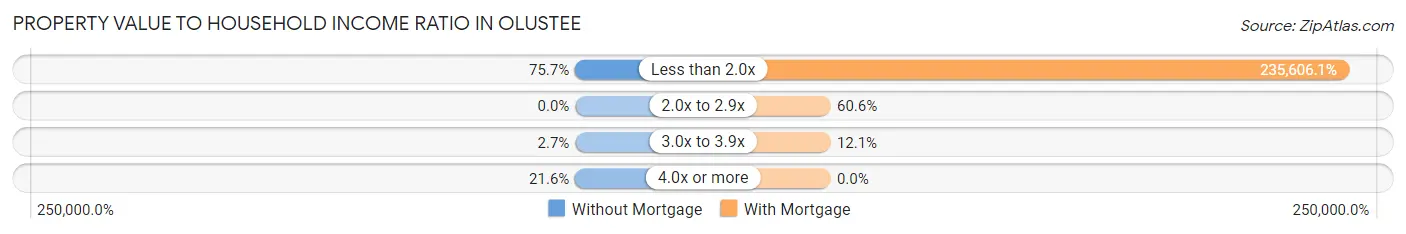
| Value-to-Income Ratio | Without Mortgage | With Mortgage |
| Less than 2.0x | 56 (75.7%) | 77,750 (235,606.1%) |
| 2.0x to 2.9x | 0 (0.0%) | 20 (60.6%) |
| 3.0x to 3.9x | 2 (2.7%) | 4 (12.1%) |
| 4.0x or more | 16 (21.6%) | 0 (0.0%) |
| Total | 74 (100.0%) | 33 (100.0%) |
Real Estate Taxes by Mortgage Status in Olustee
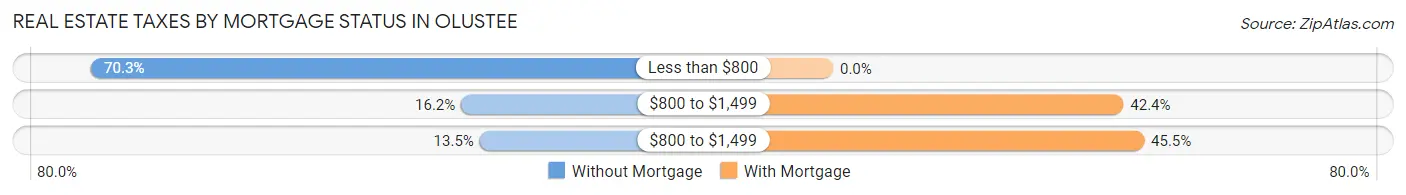
| Property Taxes | Without Mortgage | With Mortgage |
| Less than $800 | 52 (70.3%) | 0 (0.0%) |
| $800 to $1,499 | 12 (16.2%) | 14 (42.4%) |
| $800 to $1,499 | 10 (13.5%) | 15 (45.5%) |
| Total | 74 (100.0%) | 33 (100.0%) |
Health & Disability in Olustee
Health Insurance Coverage by Age in Olustee
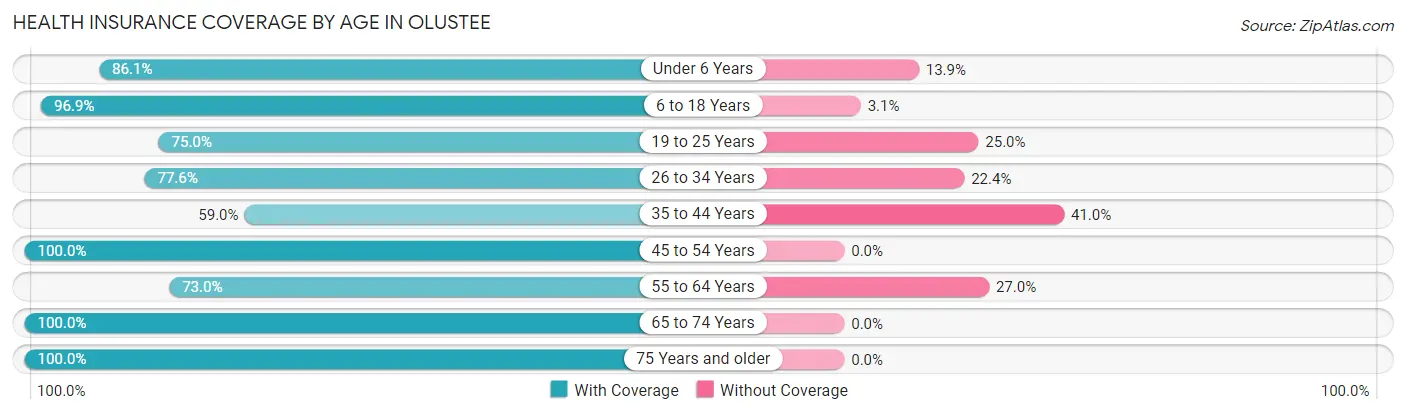
| Age Bracket | With Coverage | Without Coverage |
| Under 6 Years | 31 (86.1%) | 5 (13.9%) |
| 6 to 18 Years | 158 (96.9%) | 5 (3.1%) |
| 19 to 25 Years | 21 (75.0%) | 7 (25.0%) |
| 26 to 34 Years | 59 (77.6%) | 17 (22.4%) |
| 35 to 44 Years | 36 (59.0%) | 25 (41.0%) |
| 45 to 54 Years | 28 (100.0%) | 0 (0.0%) |
| 55 to 64 Years | 46 (73.0%) | 17 (27.0%) |
| 65 to 74 Years | 156 (100.0%) | 0 (0.0%) |
| 75 Years and older | 46 (100.0%) | 0 (0.0%) |
| Total | 581 (88.4%) | 76 (11.6%) |
Health Insurance Coverage by Citizenship Status in Olustee
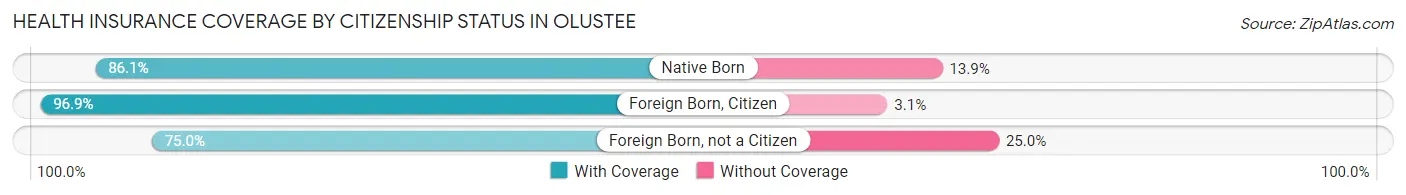
| Citizenship Status | With Coverage | Without Coverage |
| Native Born | 31 (86.1%) | 5 (13.9%) |
| Foreign Born, Citizen | 158 (96.9%) | 5 (3.1%) |
| Foreign Born, not a Citizen | 21 (75.0%) | 7 (25.0%) |
Health Insurance Coverage by Household Income in Olustee
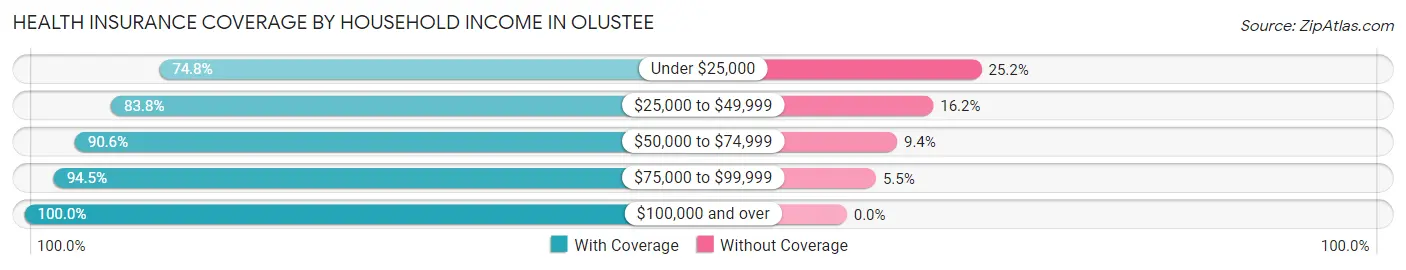
| Household Income | With Coverage | Without Coverage |
| Under $25,000 | 77 (74.8%) | 26 (25.2%) |
| $25,000 to $49,999 | 119 (83.8%) | 23 (16.2%) |
| $50,000 to $74,999 | 154 (90.6%) | 16 (9.4%) |
| $75,000 to $99,999 | 190 (94.5%) | 11 (5.5%) |
| $100,000 and over | 41 (100.0%) | 0 (0.0%) |
Public vs Private Health Insurance Coverage by Age in Olustee
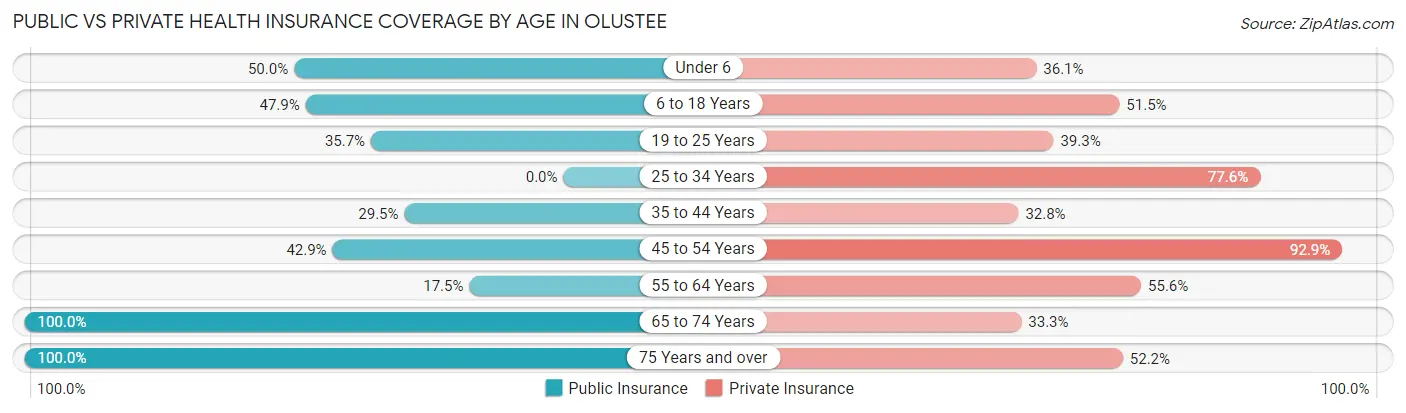
| Age Bracket | Public Insurance | Private Insurance |
| Under 6 | 18 (50.0%) | 13 (36.1%) |
| 6 to 18 Years | 78 (47.8%) | 84 (51.5%) |
| 19 to 25 Years | 10 (35.7%) | 11 (39.3%) |
| 25 to 34 Years | 0 (0.0%) | 59 (77.6%) |
| 35 to 44 Years | 18 (29.5%) | 20 (32.8%) |
| 45 to 54 Years | 12 (42.9%) | 26 (92.9%) |
| 55 to 64 Years | 11 (17.5%) | 35 (55.6%) |
| 65 to 74 Years | 156 (100.0%) | 52 (33.3%) |
| 75 Years and over | 46 (100.0%) | 24 (52.2%) |
| Total | 349 (53.1%) | 324 (49.3%) |
Disability Status by Sex by Age in Olustee
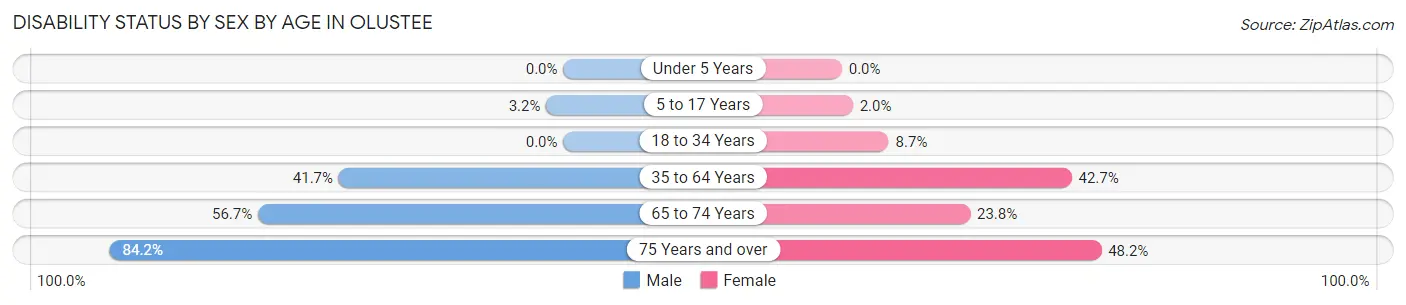
| Age Bracket | Male | Female |
| Under 5 Years | 0 (0.0%) | 0 (0.0%) |
| 5 to 17 Years | 2 (3.2%) | 2 (2.0%) |
| 18 to 34 Years | 0 (0.0%) | 4 (8.7%) |
| 35 to 64 Years | 35 (41.7%) | 29 (42.6%) |
| 65 to 74 Years | 17 (56.7%) | 30 (23.8%) |
| 75 Years and over | 16 (84.2%) | 13 (48.1%) |
Disability Class by Sex by Age in Olustee
Disability Class: Hearing Difficulty
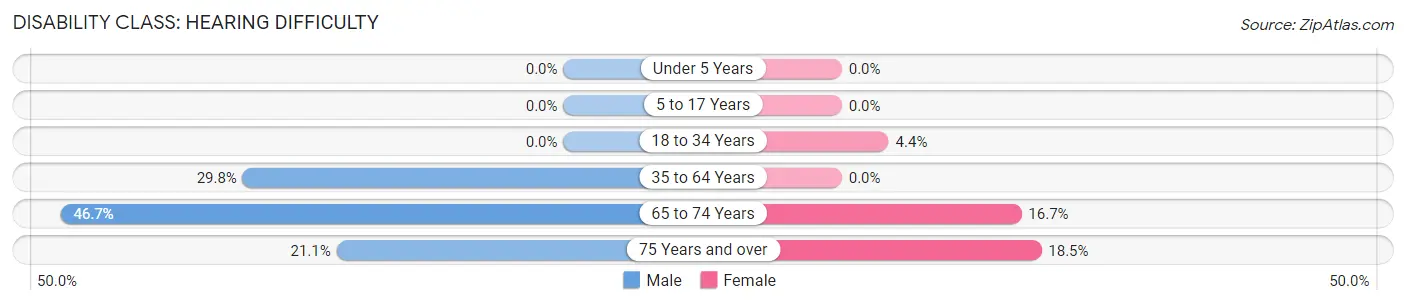
| Age Bracket | Male | Female |
| Under 5 Years | 0 (0.0%) | 0 (0.0%) |
| 5 to 17 Years | 0 (0.0%) | 0 (0.0%) |
| 18 to 34 Years | 0 (0.0%) | 2 (4.3%) |
| 35 to 64 Years | 25 (29.8%) | 0 (0.0%) |
| 65 to 74 Years | 14 (46.7%) | 21 (16.7%) |
| 75 Years and over | 4 (21.0%) | 5 (18.5%) |
Disability Class: Vision Difficulty
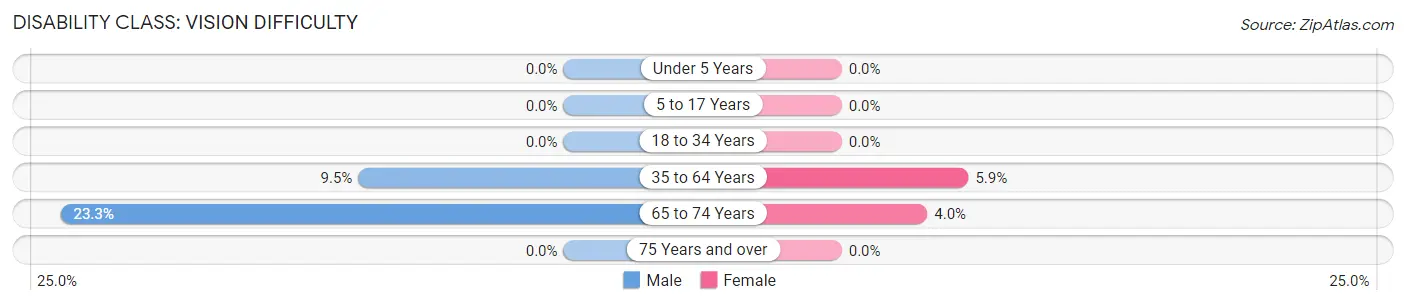
| Age Bracket | Male | Female |
| Under 5 Years | 0 (0.0%) | 0 (0.0%) |
| 5 to 17 Years | 0 (0.0%) | 0 (0.0%) |
| 18 to 34 Years | 0 (0.0%) | 0 (0.0%) |
| 35 to 64 Years | 8 (9.5%) | 4 (5.9%) |
| 65 to 74 Years | 7 (23.3%) | 5 (4.0%) |
| 75 Years and over | 0 (0.0%) | 0 (0.0%) |
Disability Class: Cognitive Difficulty
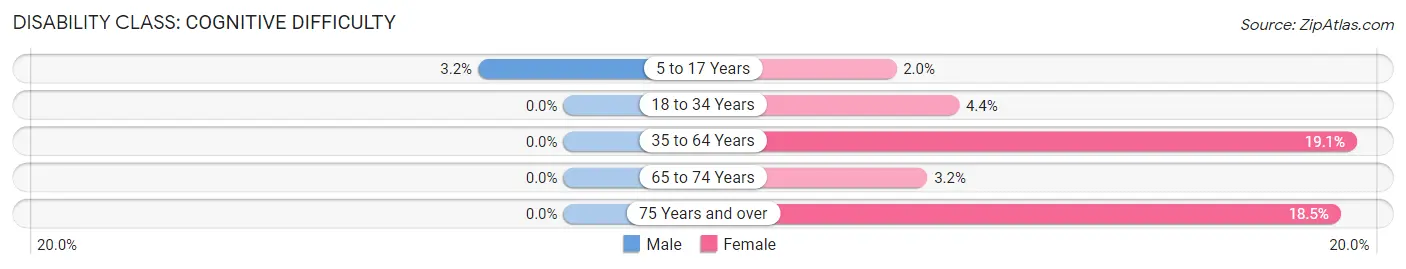
| Age Bracket | Male | Female |
| 5 to 17 Years | 2 (3.2%) | 2 (2.0%) |
| 18 to 34 Years | 0 (0.0%) | 2 (4.3%) |
| 35 to 64 Years | 0 (0.0%) | 13 (19.1%) |
| 65 to 74 Years | 0 (0.0%) | 4 (3.2%) |
| 75 Years and over | 0 (0.0%) | 5 (18.5%) |
Disability Class: Ambulatory Difficulty
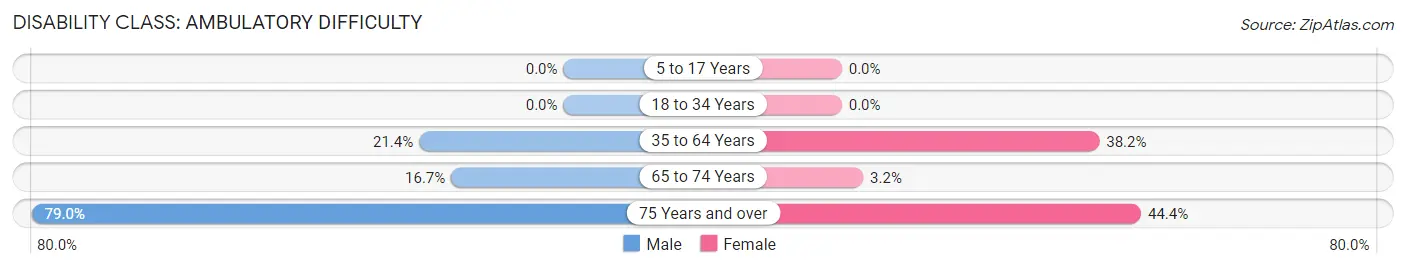
| Age Bracket | Male | Female |
| 5 to 17 Years | 0 (0.0%) | 0 (0.0%) |
| 18 to 34 Years | 0 (0.0%) | 0 (0.0%) |
| 35 to 64 Years | 18 (21.4%) | 26 (38.2%) |
| 65 to 74 Years | 5 (16.7%) | 4 (3.2%) |
| 75 Years and over | 15 (78.9%) | 12 (44.4%) |
Disability Class: Self-Care Difficulty
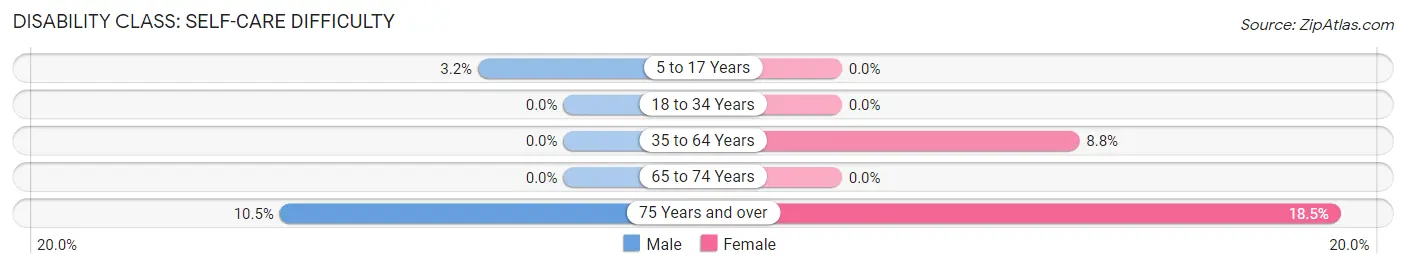
| Age Bracket | Male | Female |
| 5 to 17 Years | 2 (3.2%) | 0 (0.0%) |
| 18 to 34 Years | 0 (0.0%) | 0 (0.0%) |
| 35 to 64 Years | 0 (0.0%) | 6 (8.8%) |
| 65 to 74 Years | 0 (0.0%) | 0 (0.0%) |
| 75 Years and over | 2 (10.5%) | 5 (18.5%) |
Technology Access in Olustee
Computing Device Access in Olustee
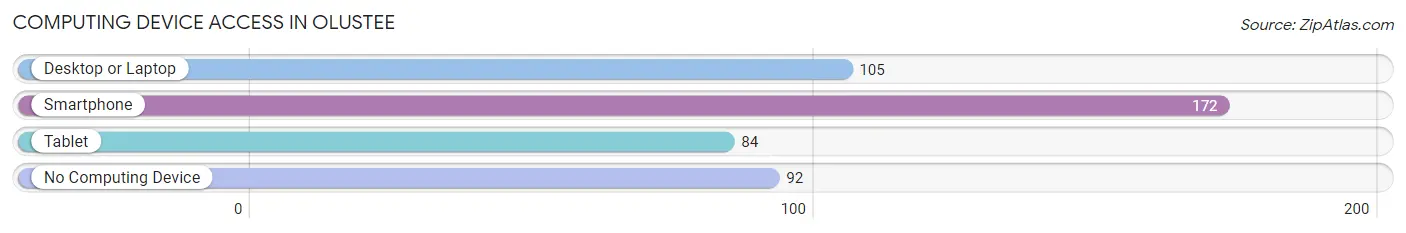
| Device Type | # Households | % Households |
| Desktop or Laptop | 105 | 38.5% |
| Smartphone | 172 | 63.0% |
| Tablet | 84 | 30.8% |
| No Computing Device | 92 | 33.7% |
| Total | 273 | 100.0% |
Internet Access in Olustee
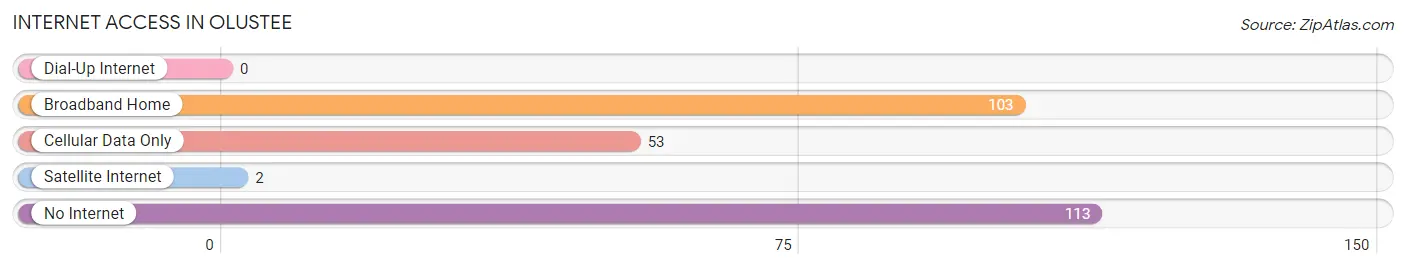
| Internet Type | # Households | % Households |
| Dial-Up Internet | 0 | 0.0% |
| Broadband Home | 103 | 37.7% |
| Cellular Data Only | 53 | 19.4% |
| Satellite Internet | 2 | 0.7% |
| No Internet | 113 | 41.4% |
| Total | 273 | 100.0% |
Olustee Summary
Olustee is a small town located in Jackson County, Oklahoma. It is situated in the southwestern part of the state, about 20 miles east of Altus. The town was founded in 1891 and was named after the nearby Olustee Creek. The population of Olustee was 545 at the 2010 census.
Geography
Olustee is located at 34°45'25" North, 99°25'25" West (34.756944, -99.423889). It is situated in the southwestern part of Oklahoma, about 20 miles east of Altus. The town is located in the Red Bed Plains region of the state, which is characterized by flat terrain and red-colored soils. The elevation of Olustee is 1,068 feet above sea level.
The climate in Olustee is semi-arid, with hot summers and mild winters. The average annual temperature is 64°F, and the average annual precipitation is 24.5 inches.
Economy
The economy of Olustee is largely based on agriculture. The town is home to several farms and ranches, which produce a variety of crops, including wheat, corn, cotton, and sorghum. The town also has a few small businesses, including a grocery store, a hardware store, and a restaurant.
Demographics
As of the 2010 census, the population of Olustee was 545. The racial makeup of the town was 95.3% White, 0.2% African American, 0.2% Native American, 0.2% Asian, 0.2% Pacific Islander, 0.2% from other races, and 3.7% from two or more races. Hispanic or Latino of any race were 1.3% of the population.
The median income for a household in Olustee was $30,000, and the median income for a family was $35,000. The per capita income for the town was $14,000. About 16.7% of the population was below the poverty line.
History
Olustee was founded in 1891 and was named after the nearby Olustee Creek. The town was originally a stop on the Fort Worth and Denver Railway. The town grew slowly over the years, and by the early 1900s, it had a population of about 200.
In the early 1900s, the town was home to several businesses, including a bank, a hotel, a general store, and a blacksmith shop. The town also had a school, which was established in 1901.
In the 1920s, the town experienced a period of growth, and several new businesses were established, including a movie theater, a drug store, and a hardware store. The population of Olustee peaked in the 1940s, with a population of about 500.
In the 1950s, the town began to decline, and many of the businesses closed. The population of Olustee has remained relatively stable since then, and the town has retained its small-town charm.
Common Questions
What is Per Capita Income in Olustee?
Per Capita income in Olustee is $22,923.
What is the Median Family Income in Olustee?
Median Family Income in Olustee is $57,679.
What is the Median Household income in Olustee?
Median Household Income in Olustee is $58,074.
What is Income or Wage Gap in Olustee?
Income or Wage Gap in Olustee is 25.7%.
Women in Olustee earn 74.3 cents for every dollar earned by a man.
What is Inequality or Gini Index in Olustee?
Inequality or Gini Index in Olustee is 0.29.
What is the Total Population of Olustee?
Total Population of Olustee is 659.
What is the Total Male Population of Olustee?
Total Male Population of Olustee is 273.
What is the Total Female Population of Olustee?
Total Female Population of Olustee is 386.
What is the Ratio of Males per 100 Females in Olustee?
There are 70.73 Males per 100 Females in Olustee.
What is the Ratio of Females per 100 Males in Olustee?
There are 141.39 Females per 100 Males in Olustee.
What is the Median Population Age in Olustee?
Median Population Age in Olustee is 39.0 Years.
What is the Average Family Size in Olustee
Average Family Size in Olustee is 2.3 People.
What is the Average Household Size in Olustee
Average Household Size in Olustee is 2.4 People.
How Large is the Labor Force in Olustee?
There are 221 People in the Labor Forcein in Olustee.
What is the Percentage of People in the Labor Force in Olustee?
42.7% of People are in the Labor Force in Olustee.
What is the Unemployment Rate in Olustee?
Unemployment Rate in Olustee is 2.3%.