Newcastle, OK Map & Demographics
Newcastle Map
Newcastle Overview
$51,071
PER CAPITA INCOME
$104,831
AVG FAMILY INCOME
$90,469
AVG HOUSEHOLD INCOME
37.6%
WAGE / INCOME GAP [ % ]
62.4¢/ $1
WAGE / INCOME GAP [ $ ]
0.43
INEQUALITY / GINI INDEX
11,508
TOTAL POPULATION
5,632
MALE POPULATION
5,876
FEMALE POPULATION
95.85
MALES / 100 FEMALES
104.33
FEMALES / 100 MALES
39.2
MEDIAN AGE
3.0
AVG FAMILY SIZE
2.6
AVG HOUSEHOLD SIZE
6,101
LABOR FORCE [ PEOPLE ]
68.1%
PERCENT IN LABOR FORCE
3.1%
UNEMPLOYMENT RATE
Newcastle Zip Codes
Newcastle Area Codes
Income in Newcastle
Income Overview in Newcastle
Per Capita Income in Newcastle is $51,071, while median incomes of families and households are $104,831 and $90,469 respectively.
| Characteristic | Number | Measure |
| Per Capita Income | 11,508 | $51,071 |
| Median Family Income | 3,332 | $104,831 |
| Mean Family Income | 3,332 | $131,515 |
| Median Household Income | 4,455 | $90,469 |
| Mean Household Income | 4,455 | $116,215 |
| Income Deficit | 3,332 | $0 |
| Wage / Income Gap (%) | 11,508 | 37.56% |
| Wage / Income Gap ($) | 11,508 | 62.44¢ per $1 |
| Gini / Inequality Index | 11,508 | 0.43 |
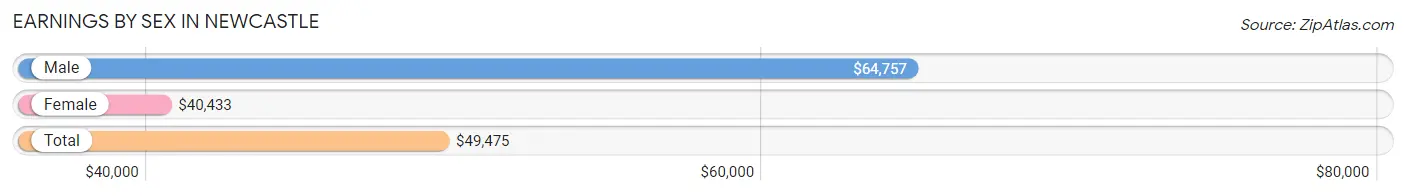
Earnings by Sex in Newcastle
Average Earnings in Newcastle are $49,475, $64,757 for men and $40,433 for women, a difference of 37.6%.
| Sex | Number | Average Earnings |
| Male | 3,541 (55.1%) | $64,757 |
| Female | 2,888 (44.9%) | $40,433 |
| Total | 6,429 (100.0%) | $49,475 |
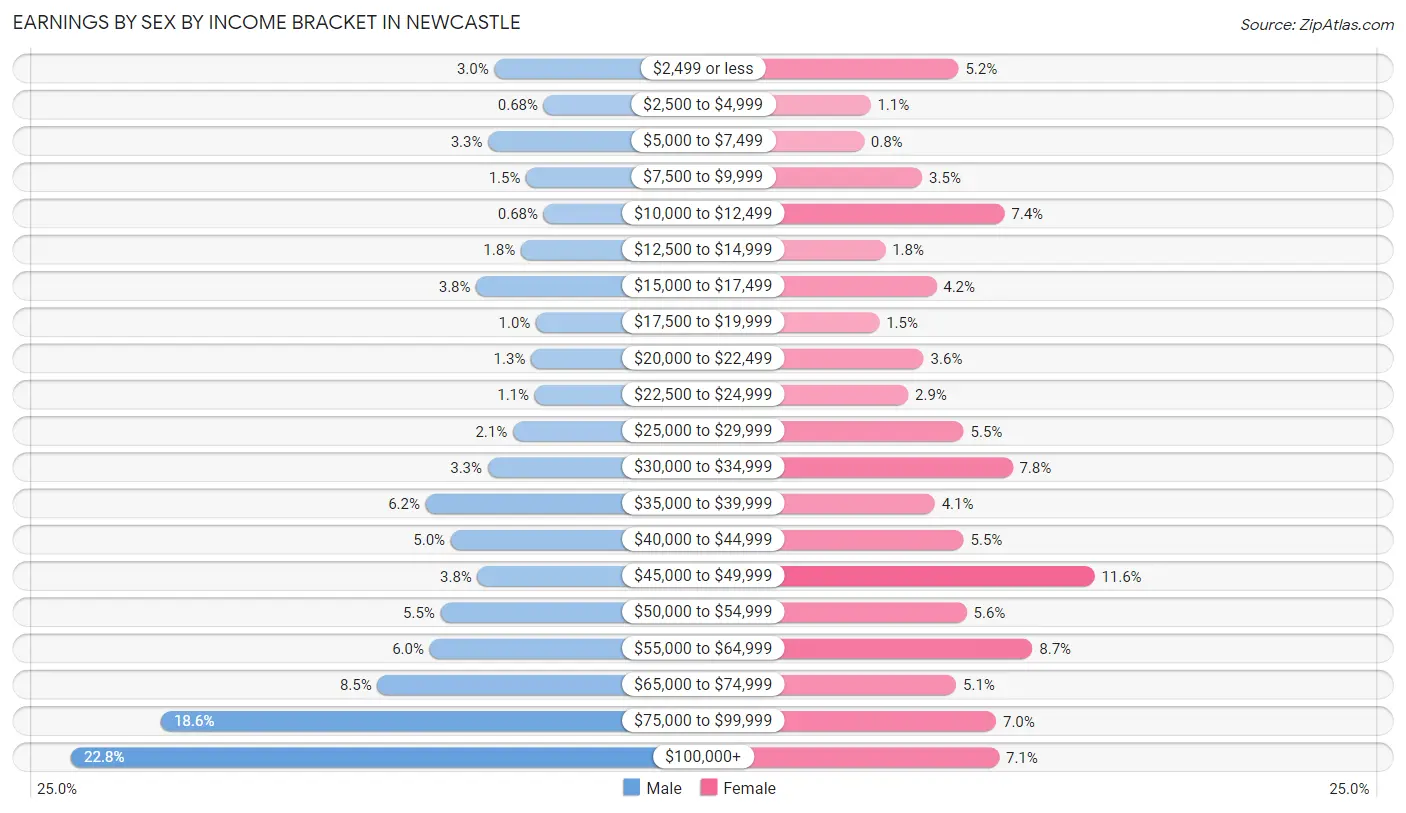
Earnings by Sex by Income Bracket in Newcastle
The most common earnings brackets in Newcastle are $100,000+ for men (808 | 22.8%) and $45,000 to $49,999 for women (335 | 11.6%).
| Income | Male | Female |
| $2,499 or less | 106 (3.0%) | 151 (5.2%) |
| $2,500 to $4,999 | 24 (0.7%) | 32 (1.1%) |
| $5,000 to $7,499 | 116 (3.3%) | 23 (0.8%) |
| $7,500 to $9,999 | 53 (1.5%) | 102 (3.5%) |
| $10,000 to $12,499 | 24 (0.7%) | 213 (7.4%) |
| $12,500 to $14,999 | 62 (1.8%) | 52 (1.8%) |
| $15,000 to $17,499 | 136 (3.8%) | 121 (4.2%) |
| $17,500 to $19,999 | 37 (1.0%) | 44 (1.5%) |
| $20,000 to $22,499 | 45 (1.3%) | 104 (3.6%) |
| $22,500 to $24,999 | 39 (1.1%) | 83 (2.9%) |
| $25,000 to $29,999 | 75 (2.1%) | 158 (5.5%) |
| $30,000 to $34,999 | 117 (3.3%) | 224 (7.8%) |
| $35,000 to $39,999 | 220 (6.2%) | 119 (4.1%) |
| $40,000 to $44,999 | 178 (5.0%) | 158 (5.5%) |
| $45,000 to $49,999 | 134 (3.8%) | 335 (11.6%) |
| $50,000 to $54,999 | 195 (5.5%) | 162 (5.6%) |
| $55,000 to $64,999 | 213 (6.0%) | 251 (8.7%) |
| $65,000 to $74,999 | 300 (8.5%) | 148 (5.1%) |
| $75,000 to $99,999 | 659 (18.6%) | 202 (7.0%) |
| $100,000+ | 808 (22.8%) | 206 (7.1%) |
| Total | 3,541 (100.0%) | 2,888 (100.0%) |
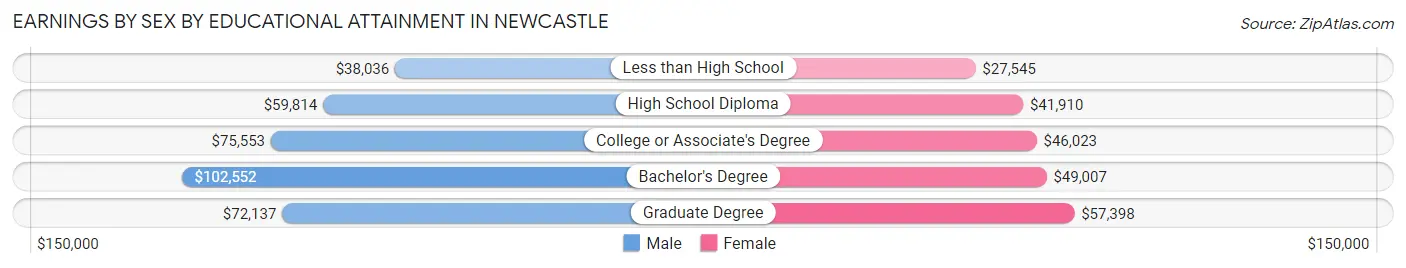
Earnings by Sex by Educational Attainment in Newcastle
Average earnings in Newcastle are $71,711 for men and $47,510 for women, a difference of 33.8%. Men with an educational attainment of bachelor's degree enjoy the highest average annual earnings of $102,552, while those with less than high school education earn the least with $38,036. Women with an educational attainment of graduate degree earn the most with the average annual earnings of $57,398, while those with less than high school education have the smallest earnings of $27,545.
| Educational Attainment | Male Income | Female Income |
| Less than High School | $38,036 | $27,545 |
| High School Diploma | $59,814 | $41,910 |
| College or Associate's Degree | $75,553 | $46,023 |
| Bachelor's Degree | $102,552 | $49,007 |
| Graduate Degree | $72,137 | $57,398 |
| Total | $71,711 | $47,510 |
Family Income in Newcastle
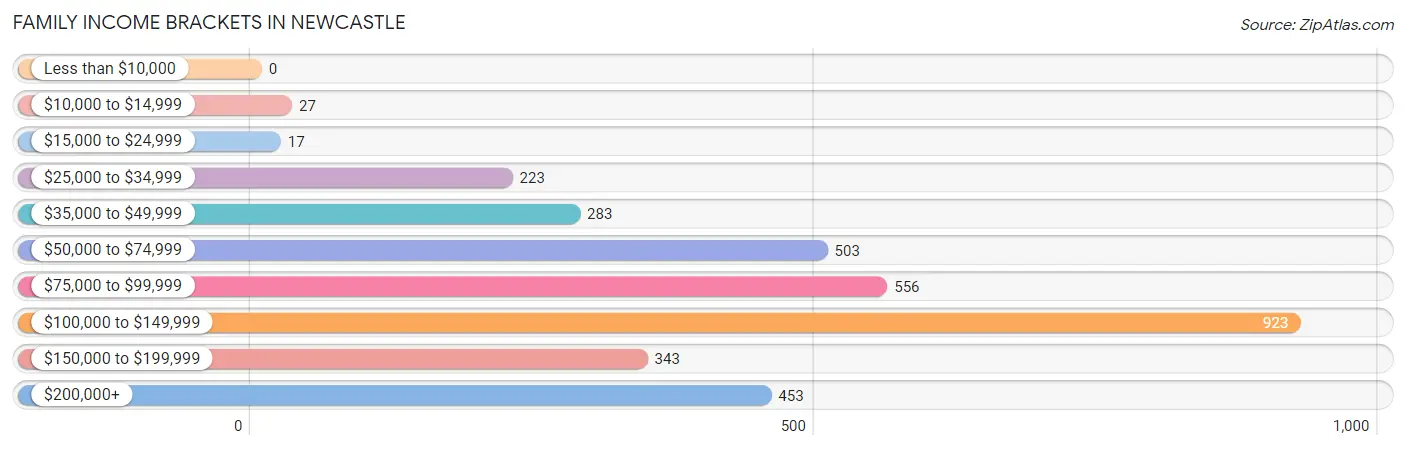
Family Income Brackets in Newcastle
According to the Newcastle family income data, there are 923 families falling into the $100,000 to $149,999 income range, which is the most common income bracket and makes up 27.7% of all families.
| Income Bracket | # Families | % Families |
| Less than $10,000 | 0 | 0.0% |
| $10,000 to $14,999 | 27 | 0.8% |
| $15,000 to $24,999 | 17 | 0.5% |
| $25,000 to $34,999 | 223 | 6.7% |
| $35,000 to $49,999 | 283 | 8.5% |
| $50,000 to $74,999 | 503 | 15.1% |
| $75,000 to $99,999 | 556 | 16.7% |
| $100,000 to $149,999 | 923 | 27.7% |
| $150,000 to $199,999 | 343 | 10.3% |
| $200,000+ | 453 | 13.6% |
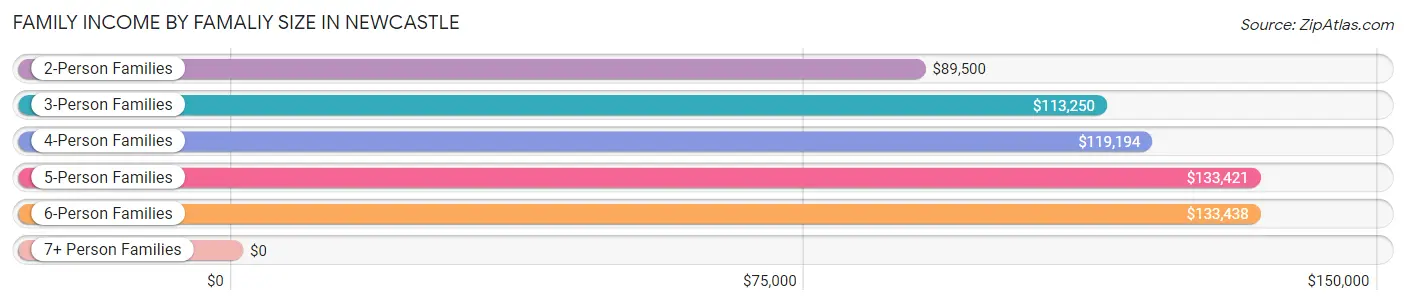
Family Income by Famaliy Size in Newcastle
6-person families (104 | 3.1%) account for the highest median family income in Newcastle with $133,438 per family, while 2-person families (1,772 | 53.2%) have the highest median income of $44,750 per family member.
| Income Bracket | # Families | Median Income |
| 2-Person Families | 1,772 (53.2%) | $89,500 |
| 3-Person Families | 524 (15.7%) | $113,250 |
| 4-Person Families | 702 (21.1%) | $119,194 |
| 5-Person Families | 230 (6.9%) | $133,421 |
| 6-Person Families | 104 (3.1%) | $133,438 |
| 7+ Person Families | 0 (0.0%) | $0 |
| Total | 3,332 (100.0%) | $104,831 |
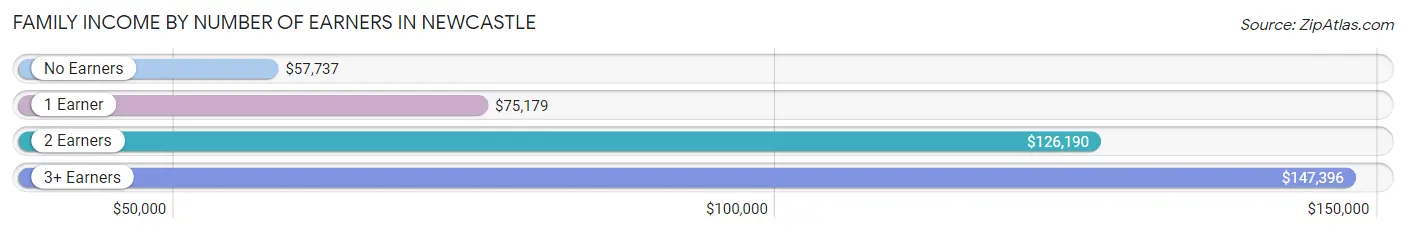
Family Income by Number of Earners in Newcastle
The median family income in Newcastle is $104,831, with families comprising 3+ earners (317) having the highest median family income of $147,396, while families with no earners (431) have the lowest median family income of $57,737, accounting for 9.5% and 12.9% of families, respectively.
| Number of Earners | # Families | Median Income |
| No Earners | 431 (12.9%) | $57,737 |
| 1 Earner | 1,006 (30.2%) | $75,179 |
| 2 Earners | 1,578 (47.4%) | $126,190 |
| 3+ Earners | 317 (9.5%) | $147,396 |
| Total | 3,332 (100.0%) | $104,831 |
Household Income in Newcastle
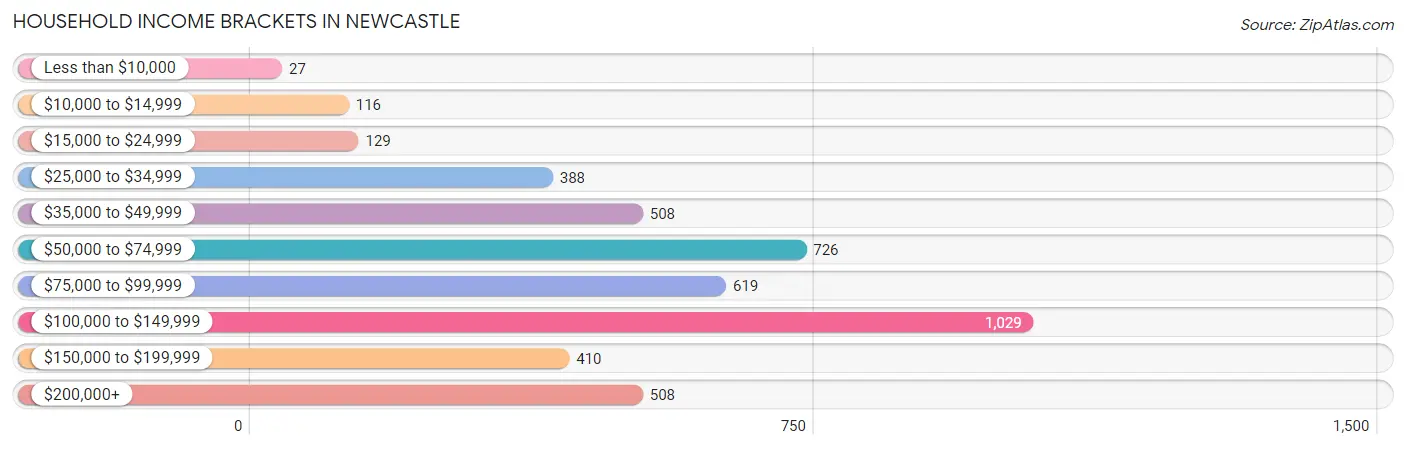
Household Income Brackets in Newcastle
With 1,029 households falling in the category, the $100,000 to $149,999 income range is the most frequent in Newcastle, accounting for 23.1% of all households. In contrast, only 27 households (0.6%) fall into the less than $10,000 income bracket, making it the least populous group.
| Income Bracket | # Households | % Households |
| Less than $10,000 | 27 | 0.6% |
| $10,000 to $14,999 | 116 | 2.6% |
| $15,000 to $24,999 | 129 | 2.9% |
| $25,000 to $34,999 | 388 | 8.7% |
| $35,000 to $49,999 | 508 | 11.4% |
| $50,000 to $74,999 | 726 | 16.3% |
| $75,000 to $99,999 | 619 | 13.9% |
| $100,000 to $149,999 | 1,029 | 23.1% |
| $150,000 to $199,999 | 410 | 9.2% |
| $200,000+ | 508 | 11.4% |
Household Income by Householder Age in Newcastle
The median household income in Newcastle is $90,469, with the highest median household income of $106,055 found in the 25 to 44 years age bracket for the primary householder. A total of 1,621 households (36.4%) fall into this category. Meanwhile, the 15 to 24 years age bracket for the primary householder has the lowest median household income of $29,388, with 119 households (2.7%) in this group.
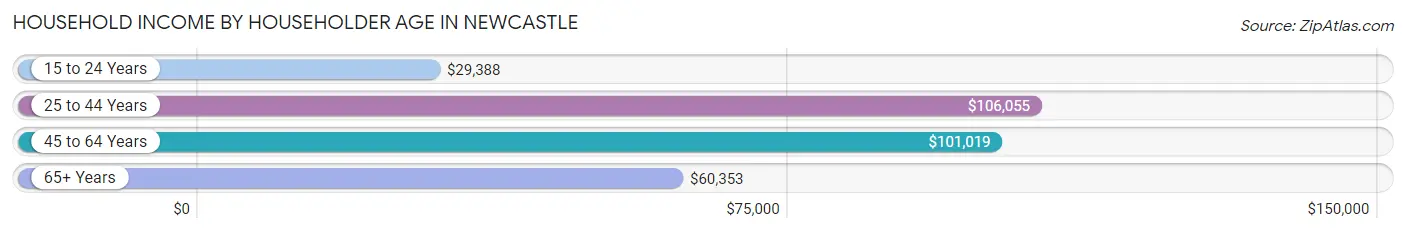
| Income Bracket | # Households | Median Income |
| 15 to 24 Years | 119 (2.7%) | $29,388 |
| 25 to 44 Years | 1,621 (36.4%) | $106,055 |
| 45 to 64 Years | 1,550 (34.8%) | $101,019 |
| 65+ Years | 1,165 (26.2%) | $60,353 |
| Total | 4,455 (100.0%) | $90,469 |
Poverty in Newcastle
Income Below Poverty by Sex and Age in Newcastle
With 2.0% poverty level for males and 5.2% for females among the residents of Newcastle, 16 and 17 year old males and 18 to 24 year old females are the most vulnerable to poverty, with 23 males (17.2%) and 69 females (15.7%) in their respective age groups living below the poverty level.
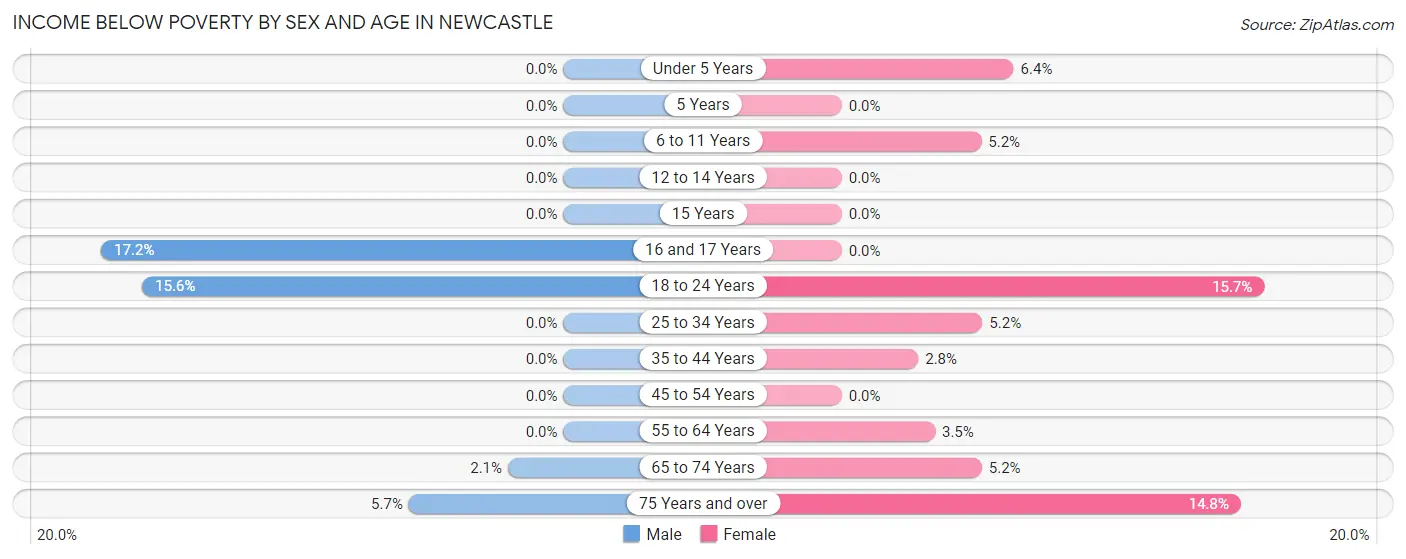
| Age Bracket | Male | Female |
| Under 5 Years | 0 (0.0%) | 19 (6.4%) |
| 5 Years | 0 (0.0%) | 0 (0.0%) |
| 6 to 11 Years | 0 (0.0%) | 28 (5.2%) |
| 12 to 14 Years | 0 (0.0%) | 0 (0.0%) |
| 15 Years | 0 (0.0%) | 0 (0.0%) |
| 16 and 17 Years | 23 (17.2%) | 0 (0.0%) |
| 18 to 24 Years | 61 (15.6%) | 69 (15.7%) |
| 25 to 34 Years | 0 (0.0%) | 43 (5.2%) |
| 35 to 44 Years | 0 (0.0%) | 24 (2.8%) |
| 45 to 54 Years | 0 (0.0%) | 0 (0.0%) |
| 55 to 64 Years | 0 (0.0%) | 31 (3.5%) |
| 65 to 74 Years | 11 (2.1%) | 25 (5.2%) |
| 75 Years and over | 17 (5.7%) | 65 (14.8%) |
| Total | 112 (2.0%) | 304 (5.2%) |
Income Above Poverty by Sex and Age in Newcastle
According to the poverty statistics in Newcastle, males aged under 5 years and females aged 5 years are the age groups that are most secure financially, with 100.0% of males and 100.0% of females in these age groups living above the poverty line.
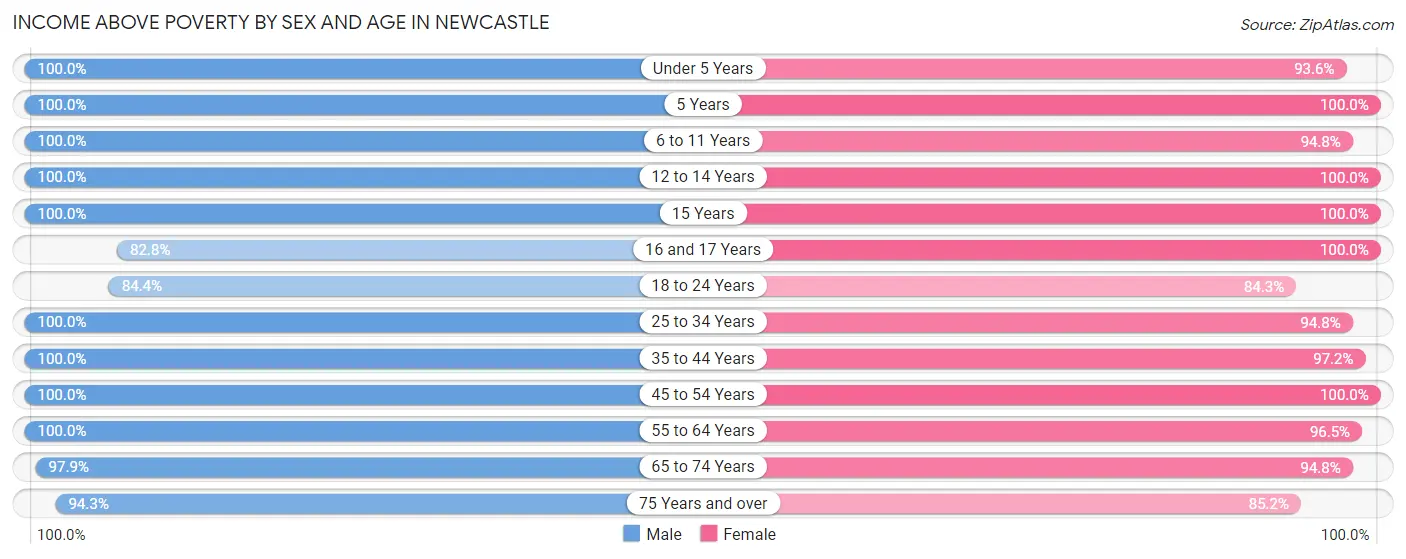
| Age Bracket | Male | Female |
| Under 5 Years | 305 (100.0%) | 279 (93.6%) |
| 5 Years | 152 (100.0%) | 26 (100.0%) |
| 6 to 11 Years | 510 (100.0%) | 513 (94.8%) |
| 12 to 14 Years | 296 (100.0%) | 281 (100.0%) |
| 15 Years | 43 (100.0%) | 97 (100.0%) |
| 16 and 17 Years | 111 (82.8%) | 198 (100.0%) |
| 18 to 24 Years | 329 (84.4%) | 371 (84.3%) |
| 25 to 34 Years | 697 (100.0%) | 780 (94.8%) |
| 35 to 44 Years | 854 (100.0%) | 821 (97.2%) |
| 45 to 54 Years | 657 (100.0%) | 512 (100.0%) |
| 55 to 64 Years | 764 (100.0%) | 864 (96.5%) |
| 65 to 74 Years | 523 (97.9%) | 456 (94.8%) |
| 75 Years and over | 279 (94.3%) | 374 (85.2%) |
| Total | 5,520 (98.0%) | 5,572 (94.8%) |
Income Below Poverty Among Married-Couple Families in Newcastle
The poverty statistics for married-couple families in Newcastle show that 1.0% or 28 of the total 2,851 families live below the poverty line. Families with no children have the highest poverty rate of 1.7%, comprising of 28 families. On the other hand, families with 1 or 2 children have the lowest poverty rate of 0.0%, which includes 0 families.
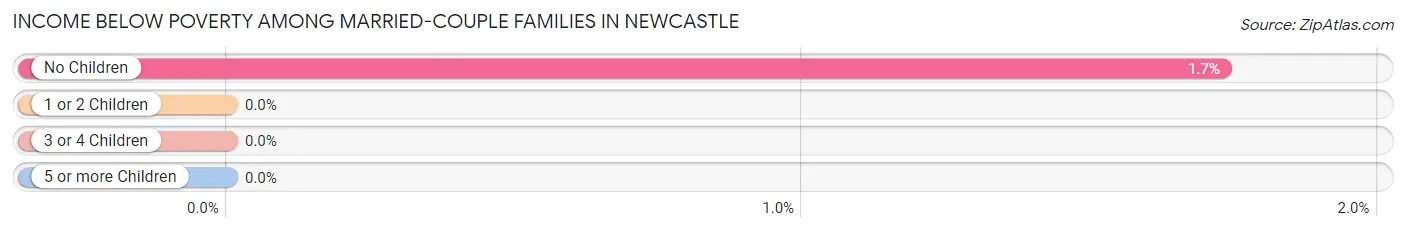
| Children | Above Poverty | Below Poverty |
| No Children | 1,595 (98.3%) | 28 (1.7%) |
| 1 or 2 Children | 999 (100.0%) | 0 (0.0%) |
| 3 or 4 Children | 229 (100.0%) | 0 (0.0%) |
| 5 or more Children | 0 (0.0%) | 0 (0.0%) |
| Total | 2,823 (99.0%) | 28 (1.0%) |
Income Below Poverty Among Single-Parent Households in Newcastle
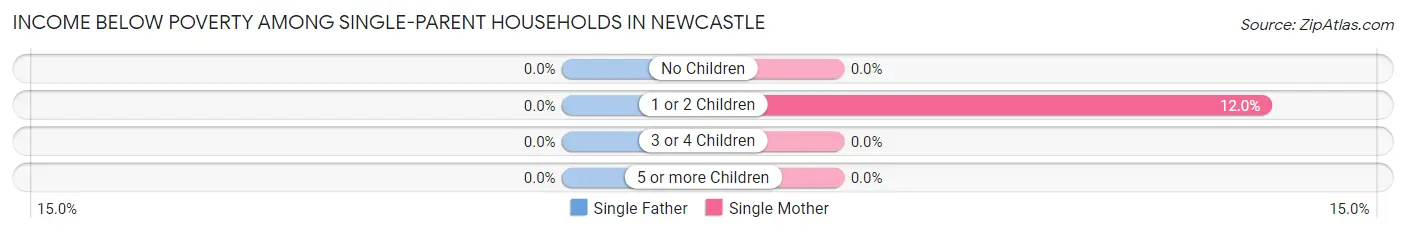
| Children | Single Father | Single Mother |
| No Children | 0 (0.0%) | 0 (0.0%) |
| 1 or 2 Children | 0 (0.0%) | 17 (12.0%) |
| 3 or 4 Children | 0 (0.0%) | 0 (0.0%) |
| 5 or more Children | 0 (0.0%) | 0 (0.0%) |
| Total | 0 (0.0%) | 17 (6.1%) |
Income Below Poverty Among Married-Couple vs Single-Parent Households in Newcastle
The poverty data for Newcastle shows that 28 of the married-couple family households (1.0%) and 17 of the single-parent households (3.5%) are living below the poverty level. Within the married-couple family households, those with no children have the highest poverty rate, with 28 households (1.7%) falling below the poverty line. Among the single-parent households, those with 1 or 2 children have the highest poverty rate, with 17 household (6.5%) living below poverty.
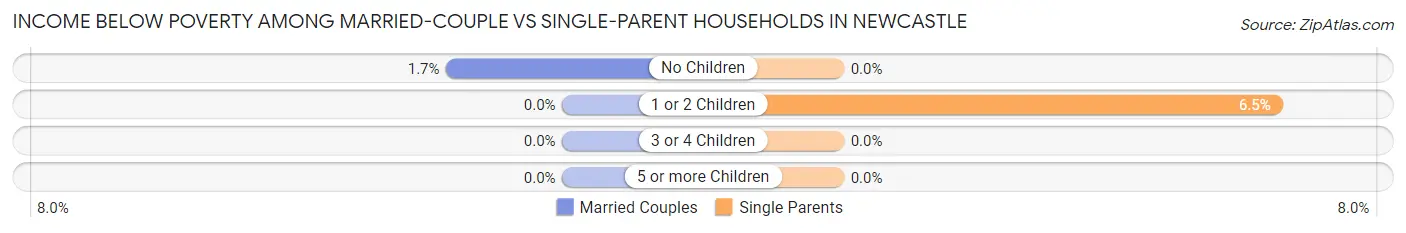
| Children | Married-Couple Families | Single-Parent Households |
| No Children | 28 (1.7%) | 0 (0.0%) |
| 1 or 2 Children | 0 (0.0%) | 17 (6.5%) |
| 3 or 4 Children | 0 (0.0%) | 0 (0.0%) |
| 5 or more Children | 0 (0.0%) | 0 (0.0%) |
| Total | 28 (1.0%) | 17 (3.5%) |
Race in Newcastle
The most populous races in Newcastle are White / Caucasian (9,331 | 81.1%), Two or more Races (1,188 | 10.3%), and Hispanic or Latino (676 | 5.9%).
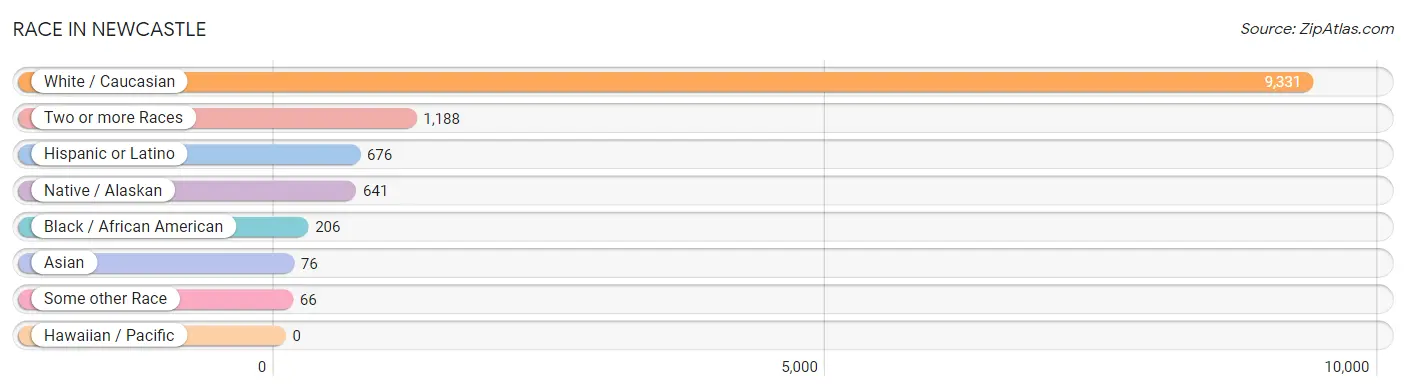
| Race | # Population | % Population |
| Asian | 76 | 0.7% |
| Black / African American | 206 | 1.8% |
| Hawaiian / Pacific | 0 | 0.0% |
| Hispanic or Latino | 676 | 5.9% |
| Native / Alaskan | 641 | 5.6% |
| White / Caucasian | 9,331 | 81.1% |
| Two or more Races | 1,188 | 10.3% |
| Some other Race | 66 | 0.6% |
| Total | 11,508 | 100.0% |
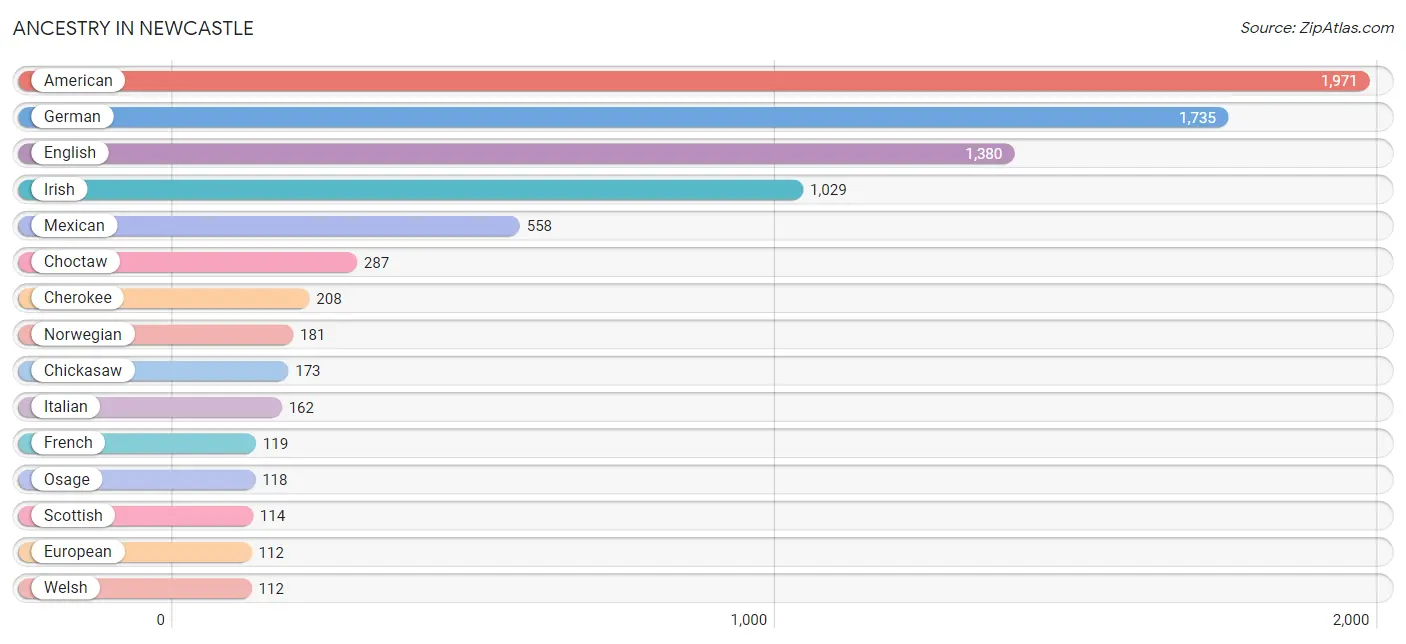
Ancestry in Newcastle
The most populous ancestries reported in Newcastle are American (1,971 | 17.1%), German (1,735 | 15.1%), English (1,380 | 12.0%), Irish (1,029 | 8.9%), and Mexican (558 | 4.9%), together accounting for 58.0% of all Newcastle residents.
| Ancestry | # Population | % Population |
| African | 15 | 0.1% |
| American | 1,971 | 17.1% |
| Apache | 20 | 0.2% |
| Austrian | 19 | 0.2% |
| Belgian | 22 | 0.2% |
| Bhutanese | 39 | 0.3% |
| British | 50 | 0.4% |
| Central American | 56 | 0.5% |
| Cherokee | 208 | 1.8% |
| Chickasaw | 173 | 1.5% |
| Choctaw | 287 | 2.5% |
| Creek | 44 | 0.4% |
| Cuban | 18 | 0.2% |
| Czech | 14 | 0.1% |
| Danish | 31 | 0.3% |
| Delaware | 47 | 0.4% |
| Dutch | 44 | 0.4% |
| English | 1,380 | 12.0% |
| European | 112 | 1.0% |
| French | 119 | 1.0% |
| German | 1,735 | 15.1% |
| Greek | 46 | 0.4% |
| Guatemalan | 35 | 0.3% |
| Hungarian | 13 | 0.1% |
| Indian (Asian) | 63 | 0.5% |
| Irish | 1,029 | 8.9% |
| Italian | 162 | 1.4% |
| Mexican | 558 | 4.9% |
| Northern European | 13 | 0.1% |
| Norwegian | 181 | 1.6% |
| Osage | 118 | 1.0% |
| Panamanian | 21 | 0.2% |
| Pennsylvania German | 7 | 0.1% |
| Polish | 49 | 0.4% |
| Potawatomi | 98 | 0.9% |
| Russian | 38 | 0.3% |
| Scandinavian | 28 | 0.2% |
| Scotch-Irish | 105 | 0.9% |
| Scottish | 114 | 1.0% |
| South African | 36 | 0.3% |
| Spanish | 16 | 0.1% |
| Spanish American | 28 | 0.2% |
| Subsaharan African | 51 | 0.4% |
| Swedish | 11 | 0.1% |
| Thai | 57 | 0.5% |
| Ukrainian | 1 | 0.0% |
| Welsh | 112 | 1.0% | View All 47 Rows |
Immigrants in Newcastle
The most numerous immigrant groups reported in Newcastle came from Latin America (218 | 1.9%), Central America (200 | 1.7%), Mexico (168 | 1.5%), Europe (36 | 0.3%), and Northern Europe (24 | 0.2%), together accounting for 5.6% of all Newcastle residents.
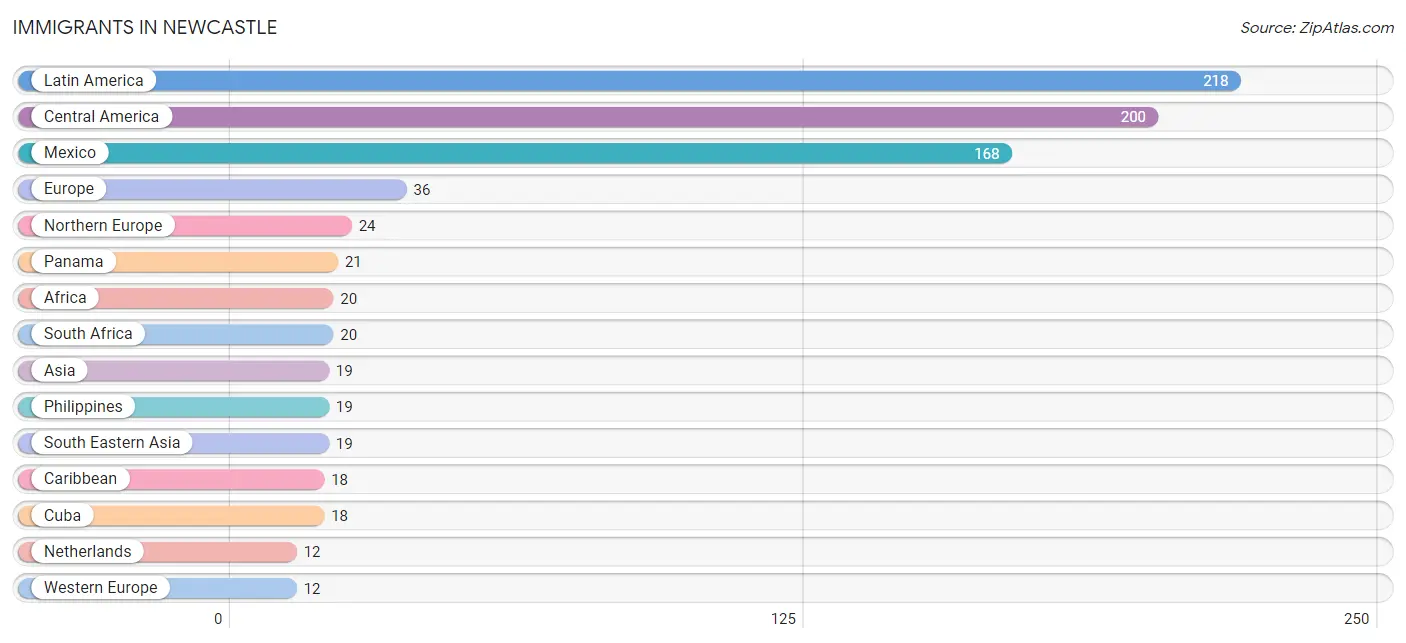
| Immigration Origin | # Population | % Population |
| Africa | 20 | 0.2% |
| Asia | 19 | 0.2% |
| Caribbean | 18 | 0.2% |
| Central America | 200 | 1.7% |
| Cuba | 18 | 0.2% |
| Europe | 36 | 0.3% |
| Guatemala | 11 | 0.1% |
| Latin America | 218 | 1.9% |
| Mexico | 168 | 1.5% |
| Netherlands | 12 | 0.1% |
| Northern Europe | 24 | 0.2% |
| Panama | 21 | 0.2% |
| Philippines | 19 | 0.2% |
| South Africa | 20 | 0.2% |
| South Eastern Asia | 19 | 0.2% |
| Western Europe | 12 | 0.1% | View All 16 Rows |
Sex and Age in Newcastle
Sex and Age in Newcastle
The most populous age groups in Newcastle are 40 to 44 Years (535 | 9.5%) for men and 40 to 44 Years (532 | 9.0%) for women.
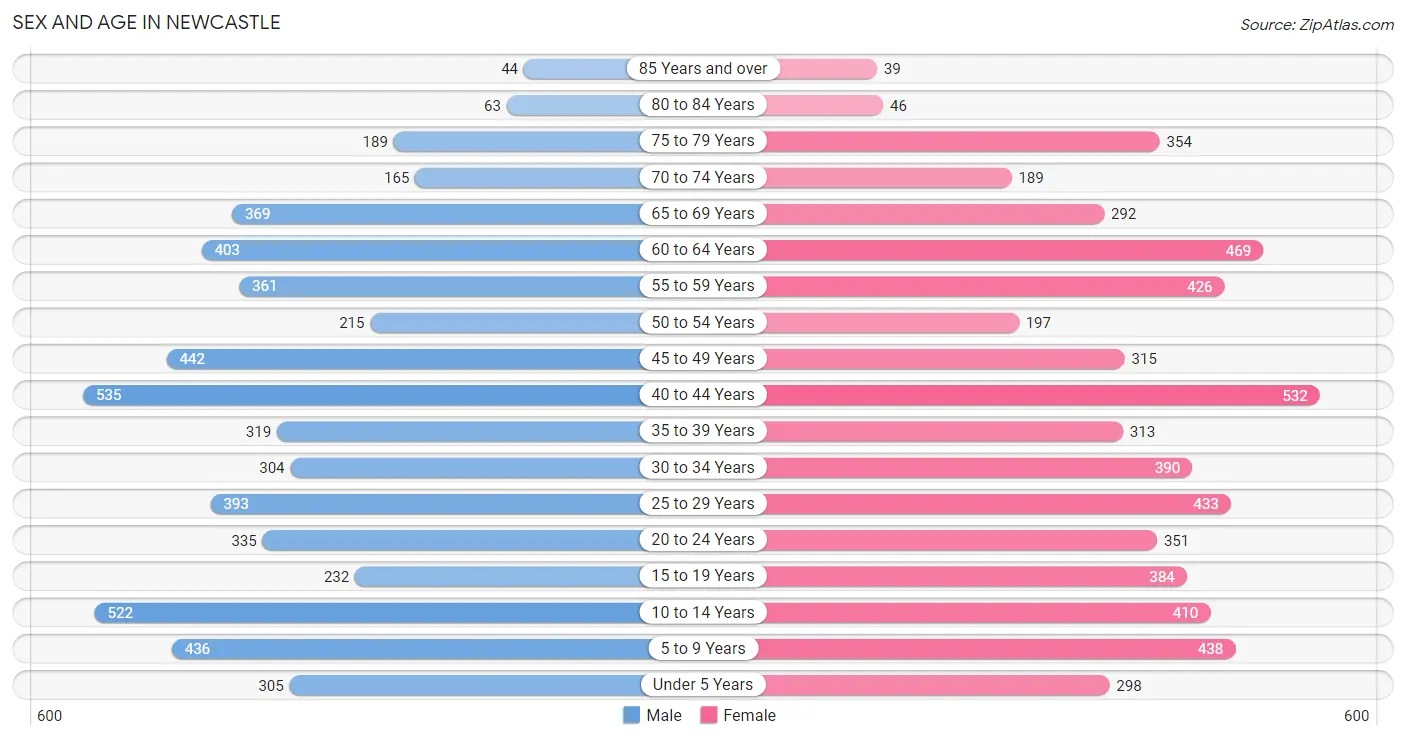
| Age Bracket | Male | Female |
| Under 5 Years | 305 (5.4%) | 298 (5.1%) |
| 5 to 9 Years | 436 (7.7%) | 438 (7.4%) |
| 10 to 14 Years | 522 (9.3%) | 410 (7.0%) |
| 15 to 19 Years | 232 (4.1%) | 384 (6.5%) |
| 20 to 24 Years | 335 (5.9%) | 351 (6.0%) |
| 25 to 29 Years | 393 (7.0%) | 433 (7.4%) |
| 30 to 34 Years | 304 (5.4%) | 390 (6.6%) |
| 35 to 39 Years | 319 (5.7%) | 313 (5.3%) |
| 40 to 44 Years | 535 (9.5%) | 532 (9.0%) |
| 45 to 49 Years | 442 (7.9%) | 315 (5.4%) |
| 50 to 54 Years | 215 (3.8%) | 197 (3.4%) |
| 55 to 59 Years | 361 (6.4%) | 426 (7.2%) |
| 60 to 64 Years | 403 (7.2%) | 469 (8.0%) |
| 65 to 69 Years | 369 (6.6%) | 292 (5.0%) |
| 70 to 74 Years | 165 (2.9%) | 189 (3.2%) |
| 75 to 79 Years | 189 (3.4%) | 354 (6.0%) |
| 80 to 84 Years | 63 (1.1%) | 46 (0.8%) |
| 85 Years and over | 44 (0.8%) | 39 (0.7%) |
| Total | 5,632 (100.0%) | 5,876 (100.0%) |
Families and Households in Newcastle
Median Family Size in Newcastle
The median family size in Newcastle is 3.02 persons per family, with single female/mother families (277 | 8.3%) accounting for the largest median family size of 3.12 persons per family. On the other hand, single male/father families (204 | 6.1%) represent the smallest median family size with 2.98 persons per family.
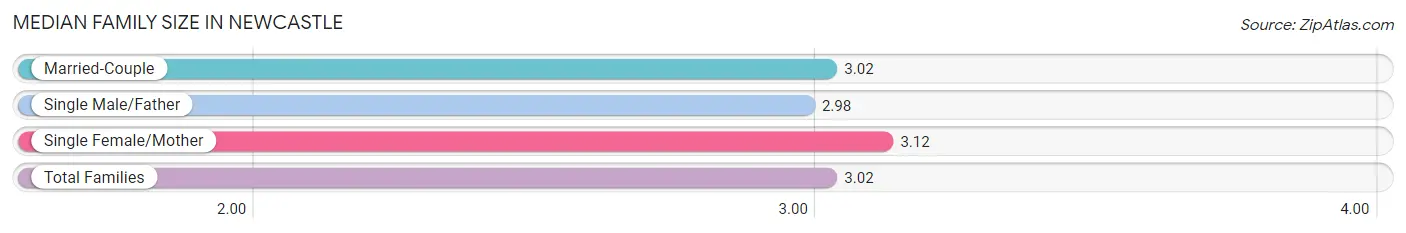
| Family Type | # Families | Family Size |
| Married-Couple | 2,851 (85.6%) | 3.02 |
| Single Male/Father | 204 (6.1%) | 2.98 |
| Single Female/Mother | 277 (8.3%) | 3.12 |
| Total Families | 3,332 (100.0%) | 3.02 |
Median Household Size in Newcastle
The median household size in Newcastle is 2.58 persons per household, with single male/father households (204 | 4.6%) accounting for the largest median household size of 3.15 persons per household. non-family households (1,123 | 25.2%) represent the smallest median household size with 1.16 persons per household.
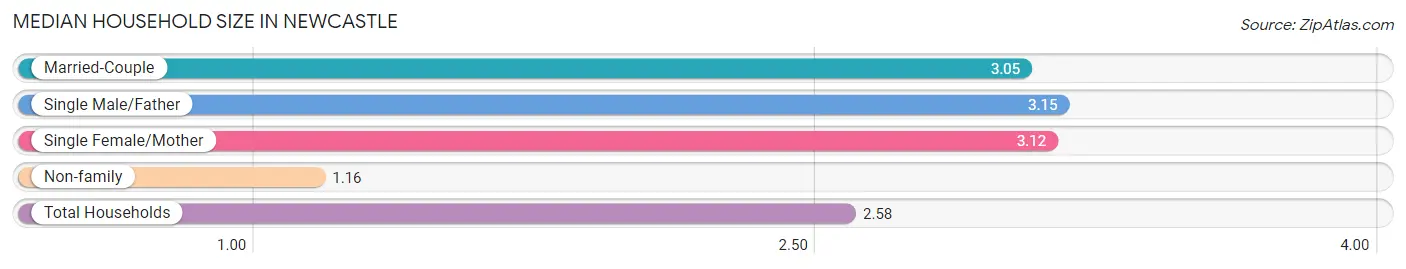
| Household Type | # Households | Household Size |
| Married-Couple | 2,851 (64.0%) | 3.05 |
| Single Male/Father | 204 (4.6%) | 3.15 |
| Single Female/Mother | 277 (6.2%) | 3.12 |
| Non-family | 1,123 (25.2%) | 1.16 |
| Total Households | 4,455 (100.0%) | 2.58 |
Household Size by Marriage Status in Newcastle
Out of a total of 4,455 households in Newcastle, 3,332 (74.8%) are family households, while 1,123 (25.2%) are nonfamily households. The most numerous type of family households are 2-person households, comprising 1,745, and the most common type of nonfamily households are 1-person households, comprising 982.
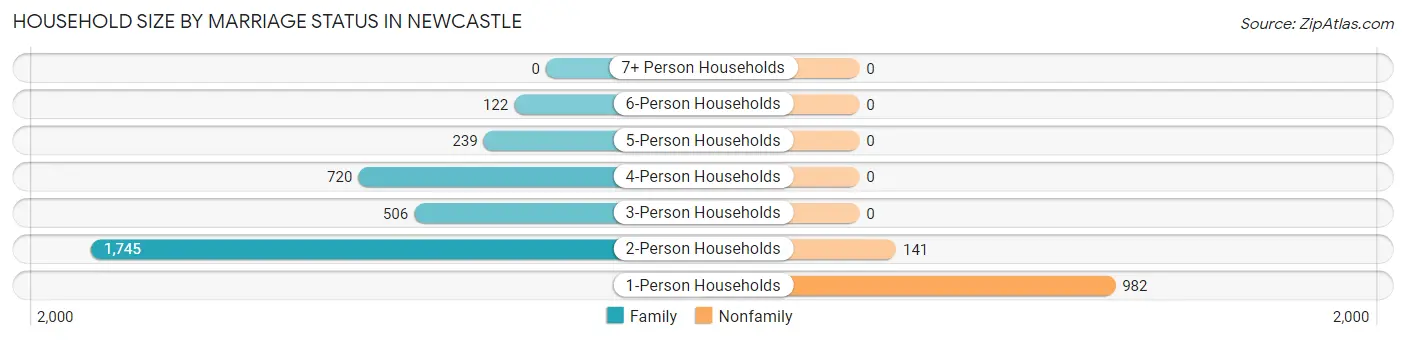
| Household Size | Family Households | Nonfamily Households |
| 1-Person Households | - | 982 (22.0%) |
| 2-Person Households | 1,745 (39.2%) | 141 (3.2%) |
| 3-Person Households | 506 (11.4%) | 0 (0.0%) |
| 4-Person Households | 720 (16.2%) | 0 (0.0%) |
| 5-Person Households | 239 (5.4%) | 0 (0.0%) |
| 6-Person Households | 122 (2.7%) | 0 (0.0%) |
| 7+ Person Households | 0 (0.0%) | 0 (0.0%) |
| Total | 3,332 (74.8%) | 1,123 (25.2%) |
Female Fertility in Newcastle
Fertility by Age in Newcastle
Average fertility rate in Newcastle is 29.0 births per 1,000 women. Women in the age bracket of 35 to 50 years have the highest fertility rate with 36.0 births per 1,000 women. Women in the age bracket of 35 to 50 years acount for 53.8% of all women with births.
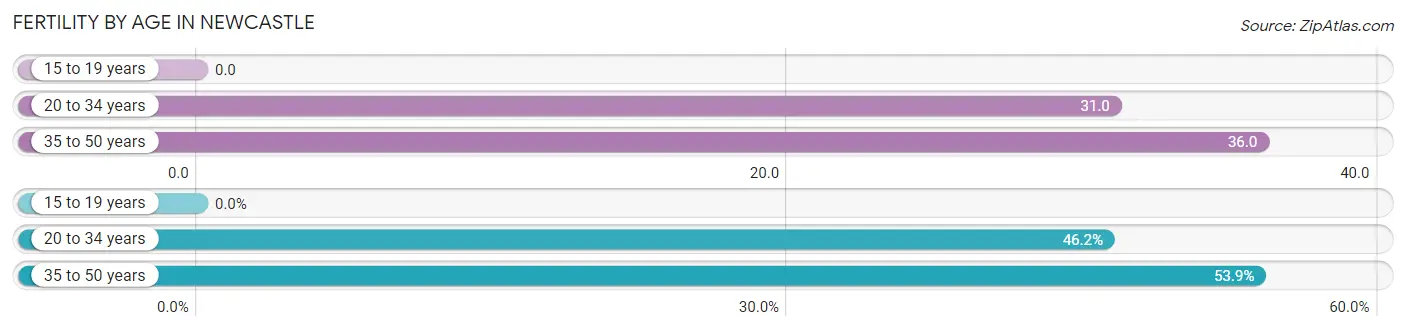
| Age Bracket | Women with Births | Births / 1,000 Women |
| 15 to 19 years | 0 (0.0%) | 0.0 |
| 20 to 34 years | 36 (46.2%) | 31.0 |
| 35 to 50 years | 42 (53.8%) | 36.0 |
| Total | 78 (100.0%) | 29.0 |
Fertility by Age by Marriage Status in Newcastle
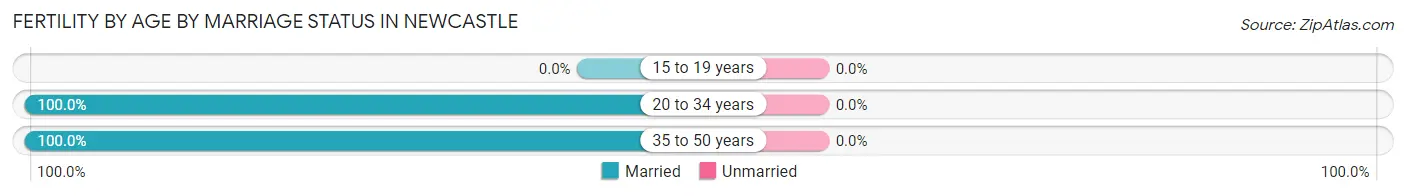
| Age Bracket | Married | Unmarried |
| 15 to 19 years | 0 (0.0%) | 0 (0.0%) |
| 20 to 34 years | 36 (100.0%) | 0 (0.0%) |
| 35 to 50 years | 42 (100.0%) | 0 (0.0%) |
| Total | 78 (100.0%) | 0 (0.0%) |
Fertility by Education in Newcastle
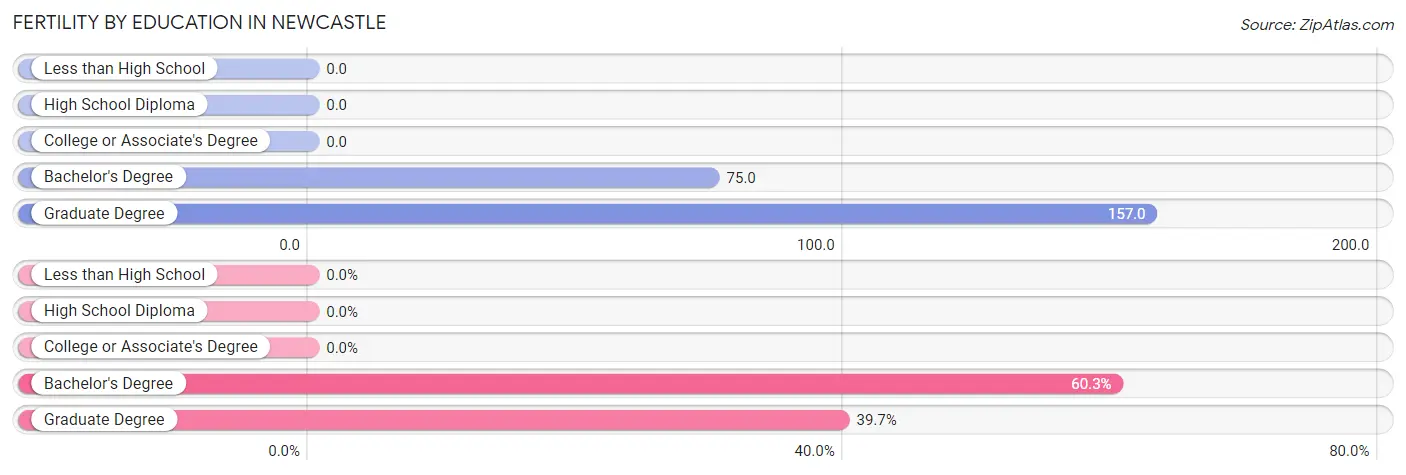
| Educational Attainment | Women with Births | Births / 1,000 Women |
| Less than High School | 0 (0.0%) | 0.0 |
| High School Diploma | 0 (0.0%) | 0.0 |
| College or Associate's Degree | 0 (0.0%) | 0.0 |
| Bachelor's Degree | 47 (60.3%) | 75.0 |
| Graduate Degree | 31 (39.7%) | 157.0 |
| Total | 78 (100.0%) | 29.0 |
Fertility by Education by Marriage Status in Newcastle
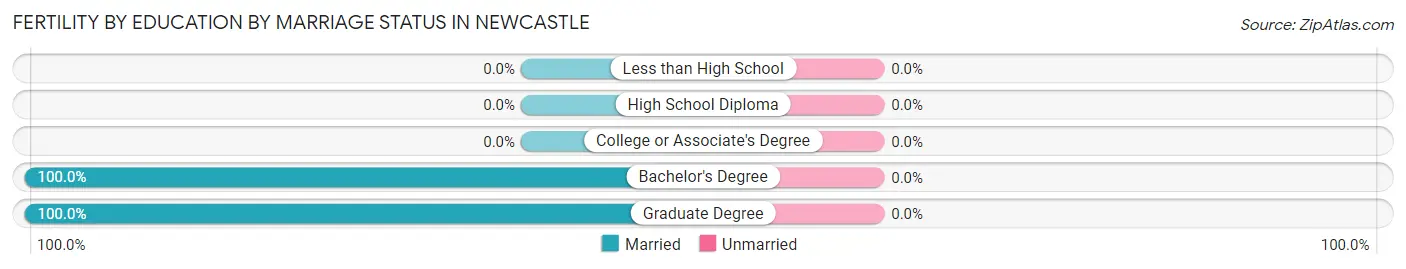
| Educational Attainment | Married | Unmarried |
| Less than High School | 0 (0.0%) | 0 (0.0%) |
| High School Diploma | 0 (0.0%) | 0 (0.0%) |
| College or Associate's Degree | 0 (0.0%) | 0 (0.0%) |
| Bachelor's Degree | 47 (100.0%) | 0 (0.0%) |
| Graduate Degree | 31 (100.0%) | 0 (0.0%) |
| Total | 78 (100.0%) | 0 (0.0%) |
Employment Characteristics in Newcastle
Employment by Class of Employer in Newcastle
Among the 5,857 employed individuals in Newcastle, private company employees (3,711 | 63.4%), federal government employees (549 | 9.4%), and state government employees (378 | 6.5%) make up the most common classes of employment.
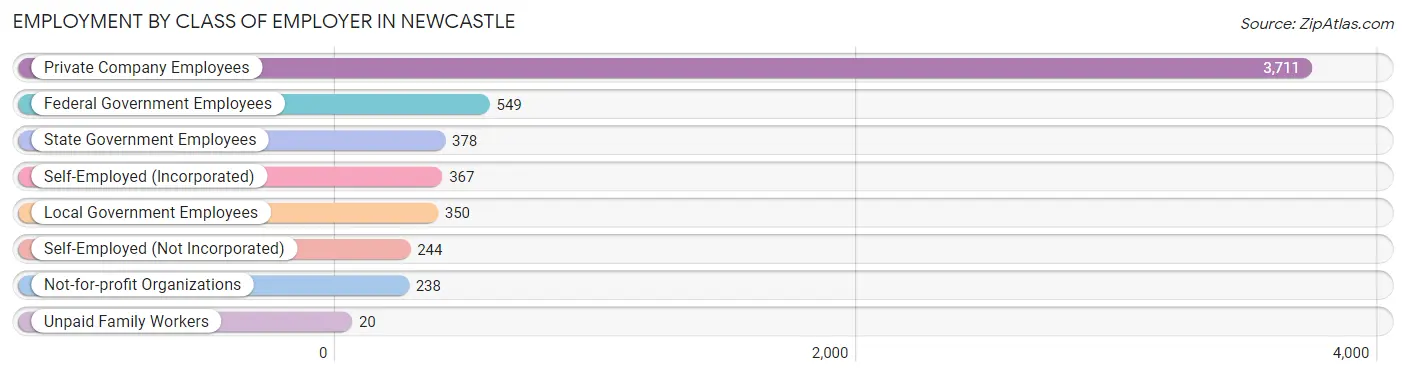
| Employer Class | # Employees | % Employees |
| Private Company Employees | 3,711 | 63.4% |
| Self-Employed (Incorporated) | 367 | 6.3% |
| Self-Employed (Not Incorporated) | 244 | 4.2% |
| Not-for-profit Organizations | 238 | 4.1% |
| Local Government Employees | 350 | 6.0% |
| State Government Employees | 378 | 6.5% |
| Federal Government Employees | 549 | 9.4% |
| Unpaid Family Workers | 20 | 0.3% |
| Total | 5,857 | 100.0% |
Employment Status by Age in Newcastle
According to the labor force statistics for Newcastle, out of the total population over 16 years of age (8,959), 68.1% or 6,101 individuals are in the labor force, with 3.1% or 189 of them unemployed. The age group with the highest labor force participation rate is 35 to 44 years, with 92.9% or 1,578 individuals in the labor force. Within the labor force, the 20 to 24 years age range has the highest percentage of unemployed individuals, with 13.3% or 67 of them being unemployed.
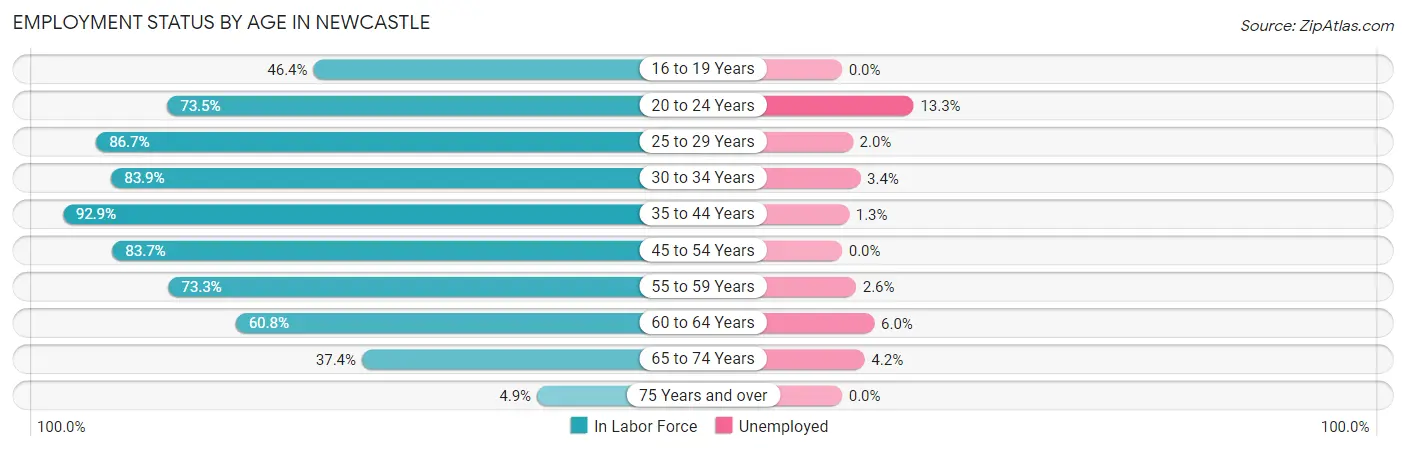
| Age Bracket | In Labor Force | Unemployed |
| 16 to 19 Years | 221 (46.4%) | 0 (0.0%) |
| 20 to 24 Years | 504 (73.5%) | 67 (13.3%) |
| 25 to 29 Years | 716 (86.7%) | 14 (2.0%) |
| 30 to 34 Years | 582 (83.9%) | 20 (3.4%) |
| 35 to 44 Years | 1,578 (92.9%) | 21 (1.3%) |
| 45 to 54 Years | 978 (83.7%) | 0 (0.0%) |
| 55 to 59 Years | 577 (73.3%) | 15 (2.6%) |
| 60 to 64 Years | 530 (60.8%) | 32 (6.0%) |
| 65 to 74 Years | 380 (37.4%) | 16 (4.2%) |
| 75 Years and over | 36 (4.9%) | 0 (0.0%) |
| Total | 6,101 (68.1%) | 189 (3.1%) |
Employment Status by Educational Attainment in Newcastle
According to labor force statistics for Newcastle, 82.1% of individuals (4,965) out of the total population between 25 and 64 years of age (6,047) are in the labor force, with 2.1% or 104 of them being unemployed. The group with the highest labor force participation rate are those with the educational attainment of high school diploma, with 84.6% or 1,207 individuals in the labor force. Within the labor force, individuals with college / associate degree education have the highest percentage of unemployment, with 4.3% or 77 of them being unemployed.
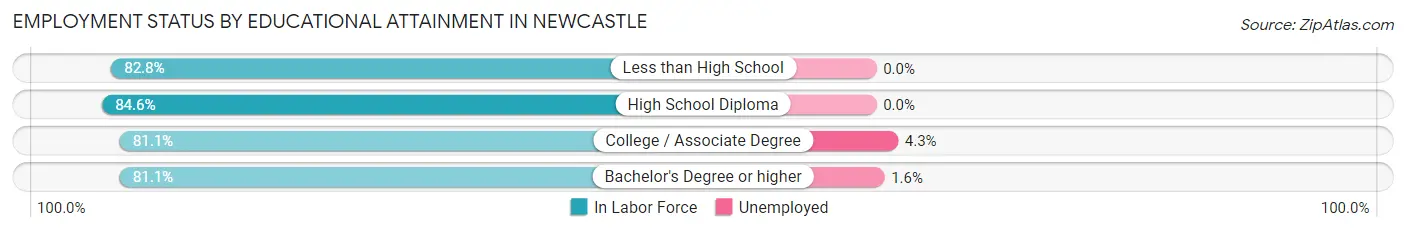
| Educational Attainment | In Labor Force | Unemployed |
| Less than High School | 336 (82.8%) | 0 (0.0%) |
| High School Diploma | 1,207 (84.6%) | 0 (0.0%) |
| College / Associate Degree | 1,794 (81.1%) | 95 (4.3%) |
| Bachelor's Degree or higher | 1,624 (81.1%) | 32 (1.6%) |
| Total | 4,965 (82.1%) | 127 (2.1%) |
Employment Occupations by Sex in Newcastle
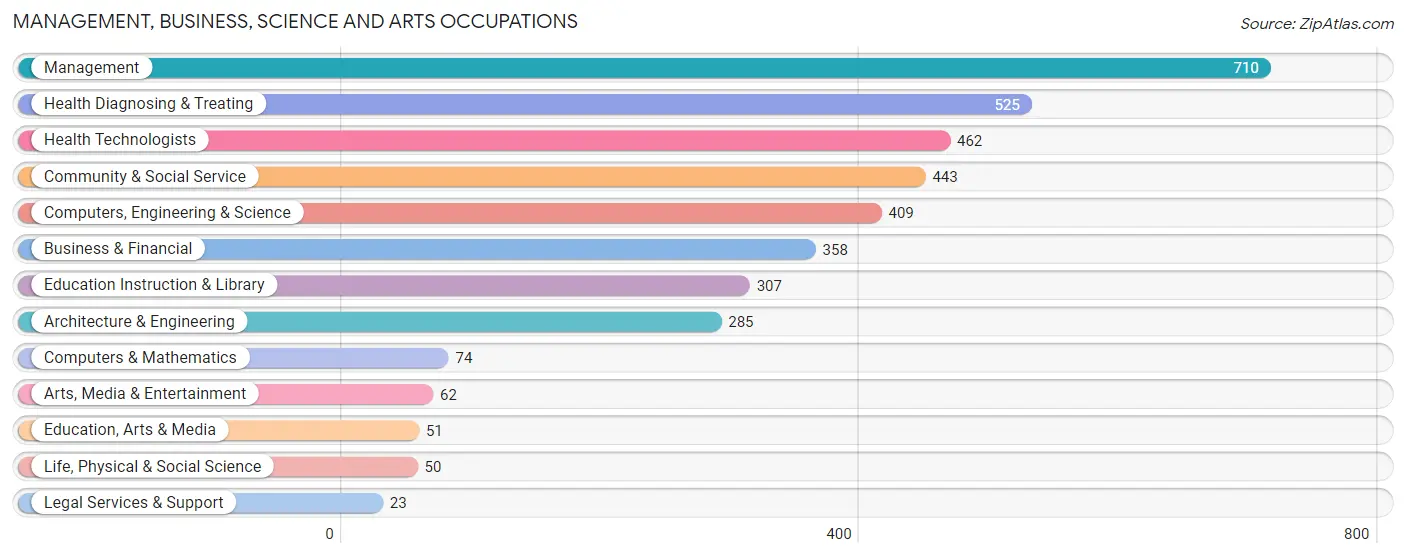
Management, Business, Science and Arts Occupations
The most common Management, Business, Science and Arts occupations in Newcastle are Management (710 | 12.2%), Health Diagnosing & Treating (525 | 9.0%), Health Technologists (462 | 7.9%), Community & Social Service (443 | 7.6%), and Computers, Engineering & Science (409 | 7.0%).
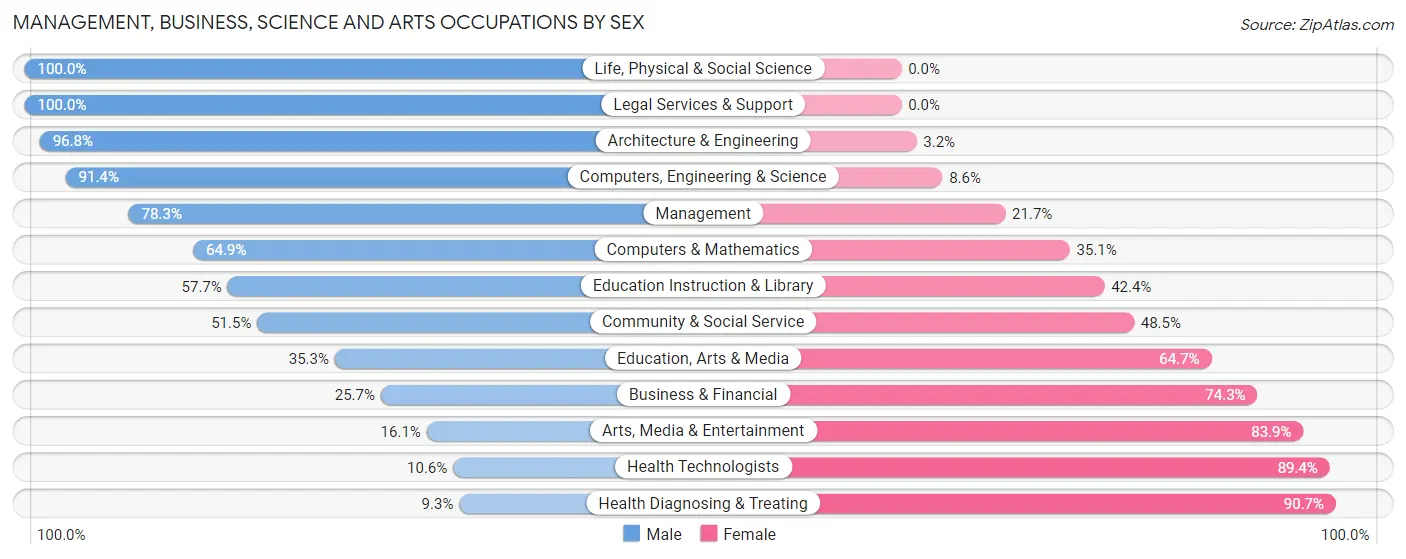
Management, Business, Science and Arts Occupations by Sex
Within the Management, Business, Science and Arts occupations in Newcastle, the most male-oriented occupations are Life, Physical & Social Science (100.0%), Legal Services & Support (100.0%), and Architecture & Engineering (96.8%), while the most female-oriented occupations are Health Diagnosing & Treating (90.7%), Health Technologists (89.4%), and Arts, Media & Entertainment (83.9%).
| Occupation | Male | Female |
| Management | 556 (78.3%) | 154 (21.7%) |
| Business & Financial | 92 (25.7%) | 266 (74.3%) |
| Computers, Engineering & Science | 374 (91.4%) | 35 (8.6%) |
| Computers & Mathematics | 48 (64.9%) | 26 (35.1%) |
| Architecture & Engineering | 276 (96.8%) | 9 (3.2%) |
| Life, Physical & Social Science | 50 (100.0%) | 0 (0.0%) |
| Community & Social Service | 228 (51.5%) | 215 (48.5%) |
| Education, Arts & Media | 18 (35.3%) | 33 (64.7%) |
| Legal Services & Support | 23 (100.0%) | 0 (0.0%) |
| Education Instruction & Library | 177 (57.7%) | 130 (42.3%) |
| Arts, Media & Entertainment | 10 (16.1%) | 52 (83.9%) |
| Health Diagnosing & Treating | 49 (9.3%) | 476 (90.7%) |
| Health Technologists | 49 (10.6%) | 413 (89.4%) |
| Total (Category) | 1,299 (53.1%) | 1,146 (46.9%) |
| Total (Overall) | 3,293 (56.5%) | 2,532 (43.5%) |
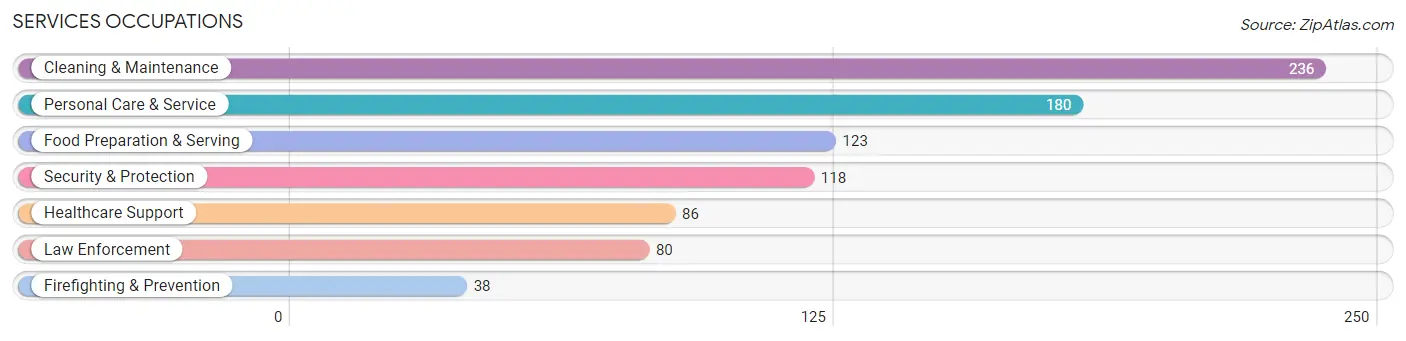
Services Occupations
The most common Services occupations in Newcastle are Cleaning & Maintenance (236 | 4.1%), Personal Care & Service (180 | 3.1%), Food Preparation & Serving (123 | 2.1%), Security & Protection (118 | 2.0%), and Healthcare Support (86 | 1.5%).
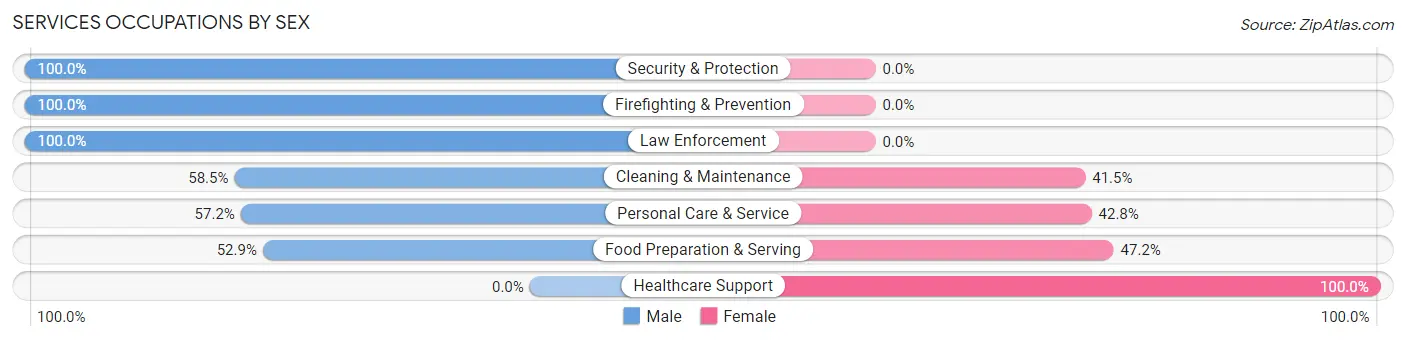
Services Occupations by Sex
Within the Services occupations in Newcastle, the most male-oriented occupations are Security & Protection (100.0%), Firefighting & Prevention (100.0%), and Law Enforcement (100.0%), while the most female-oriented occupations are Healthcare Support (100.0%), Food Preparation & Serving (47.1%), and Personal Care & Service (42.8%).
| Occupation | Male | Female |
| Healthcare Support | 0 (0.0%) | 86 (100.0%) |
| Security & Protection | 118 (100.0%) | 0 (0.0%) |
| Firefighting & Prevention | 38 (100.0%) | 0 (0.0%) |
| Law Enforcement | 80 (100.0%) | 0 (0.0%) |
| Food Preparation & Serving | 65 (52.8%) | 58 (47.1%) |
| Cleaning & Maintenance | 138 (58.5%) | 98 (41.5%) |
| Personal Care & Service | 103 (57.2%) | 77 (42.8%) |
| Total (Category) | 424 (57.1%) | 319 (42.9%) |
| Total (Overall) | 3,293 (56.5%) | 2,532 (43.5%) |
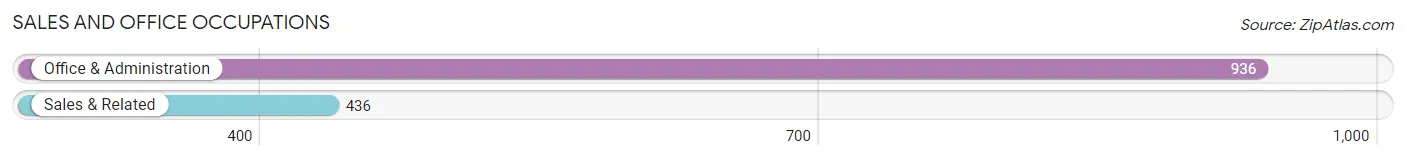
Sales and Office Occupations
The most common Sales and Office occupations in Newcastle are Office & Administration (936 | 16.1%), and Sales & Related (436 | 7.5%).
Sales and Office Occupations by Sex
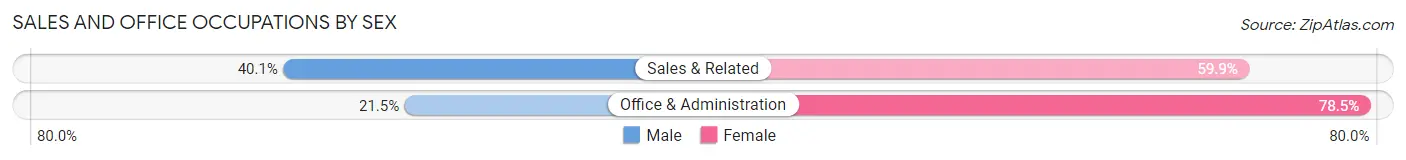
| Occupation | Male | Female |
| Sales & Related | 175 (40.1%) | 261 (59.9%) |
| Office & Administration | 201 (21.5%) | 735 (78.5%) |
| Total (Category) | 376 (27.4%) | 996 (72.6%) |
| Total (Overall) | 3,293 (56.5%) | 2,532 (43.5%) |
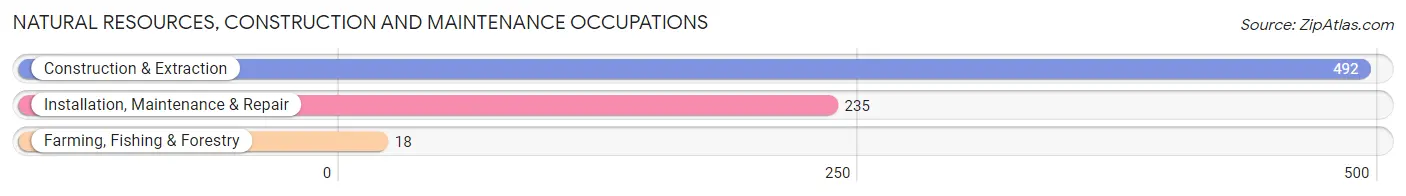
Natural Resources, Construction and Maintenance Occupations
The most common Natural Resources, Construction and Maintenance occupations in Newcastle are Construction & Extraction (492 | 8.5%), Installation, Maintenance & Repair (235 | 4.0%), and Farming, Fishing & Forestry (18 | 0.3%).
Natural Resources, Construction and Maintenance Occupations by Sex
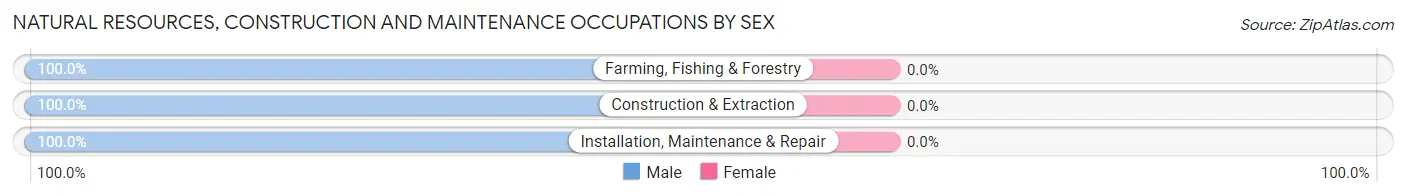
| Occupation | Male | Female |
| Farming, Fishing & Forestry | 18 (100.0%) | 0 (0.0%) |
| Construction & Extraction | 492 (100.0%) | 0 (0.0%) |
| Installation, Maintenance & Repair | 235 (100.0%) | 0 (0.0%) |
| Total (Category) | 745 (100.0%) | 0 (0.0%) |
| Total (Overall) | 3,293 (56.5%) | 2,532 (43.5%) |
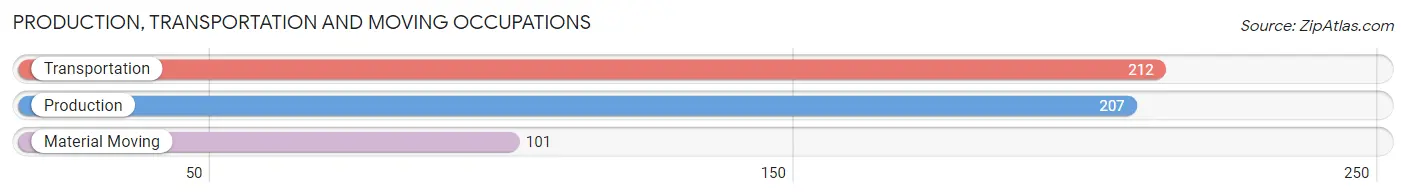
Production, Transportation and Moving Occupations
The most common Production, Transportation and Moving occupations in Newcastle are Transportation (212 | 3.6%), Production (207 | 3.5%), and Material Moving (101 | 1.7%).
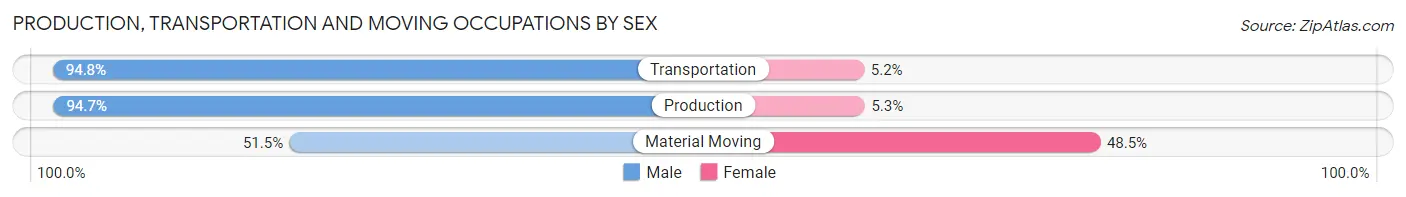
Production, Transportation and Moving Occupations by Sex
| Occupation | Male | Female |
| Production | 196 (94.7%) | 11 (5.3%) |
| Transportation | 201 (94.8%) | 11 (5.2%) |
| Material Moving | 52 (51.5%) | 49 (48.5%) |
| Total (Category) | 449 (86.4%) | 71 (13.7%) |
| Total (Overall) | 3,293 (56.5%) | 2,532 (43.5%) |
Employment Industries by Sex in Newcastle
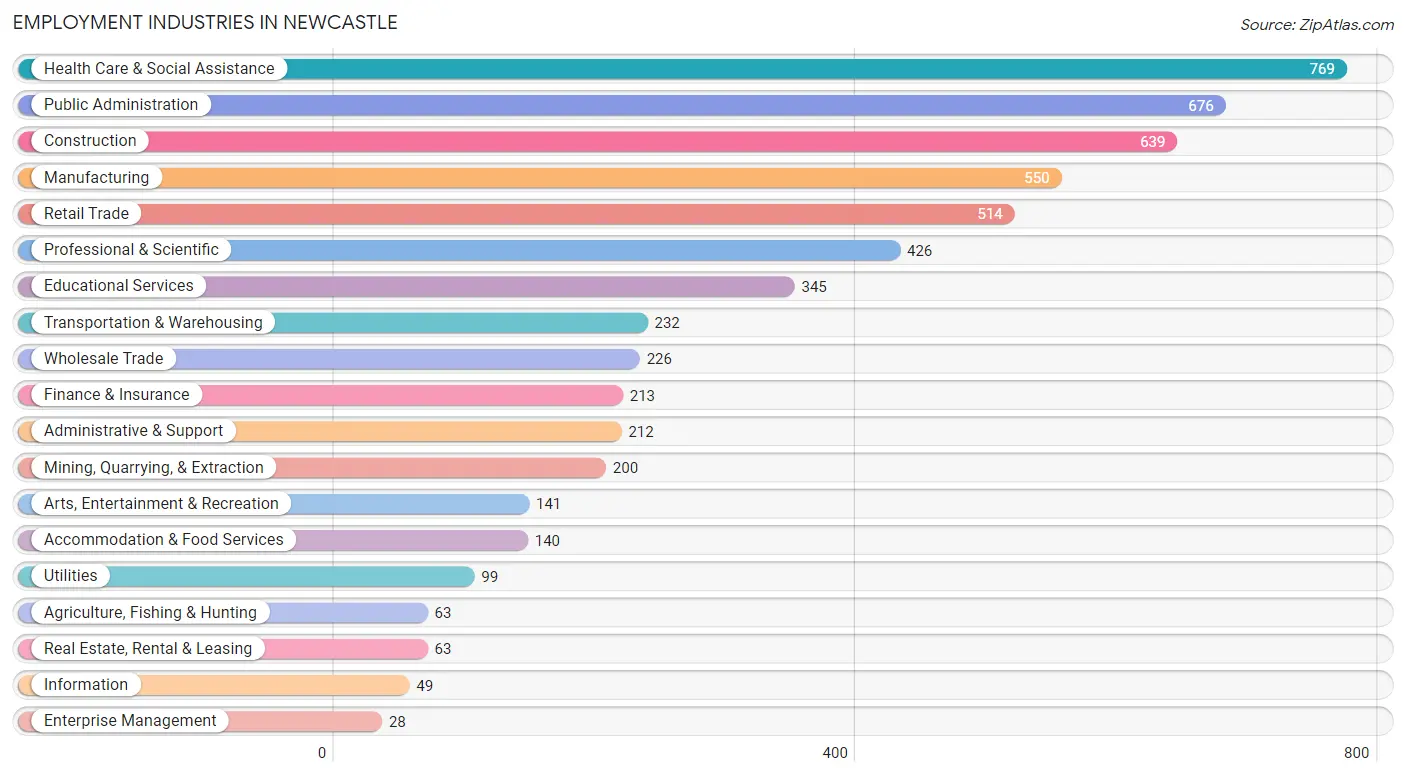
Employment Industries in Newcastle
The major employment industries in Newcastle include Health Care & Social Assistance (769 | 13.2%), Public Administration (676 | 11.6%), Construction (639 | 11.0%), Manufacturing (550 | 9.4%), and Retail Trade (514 | 8.8%).
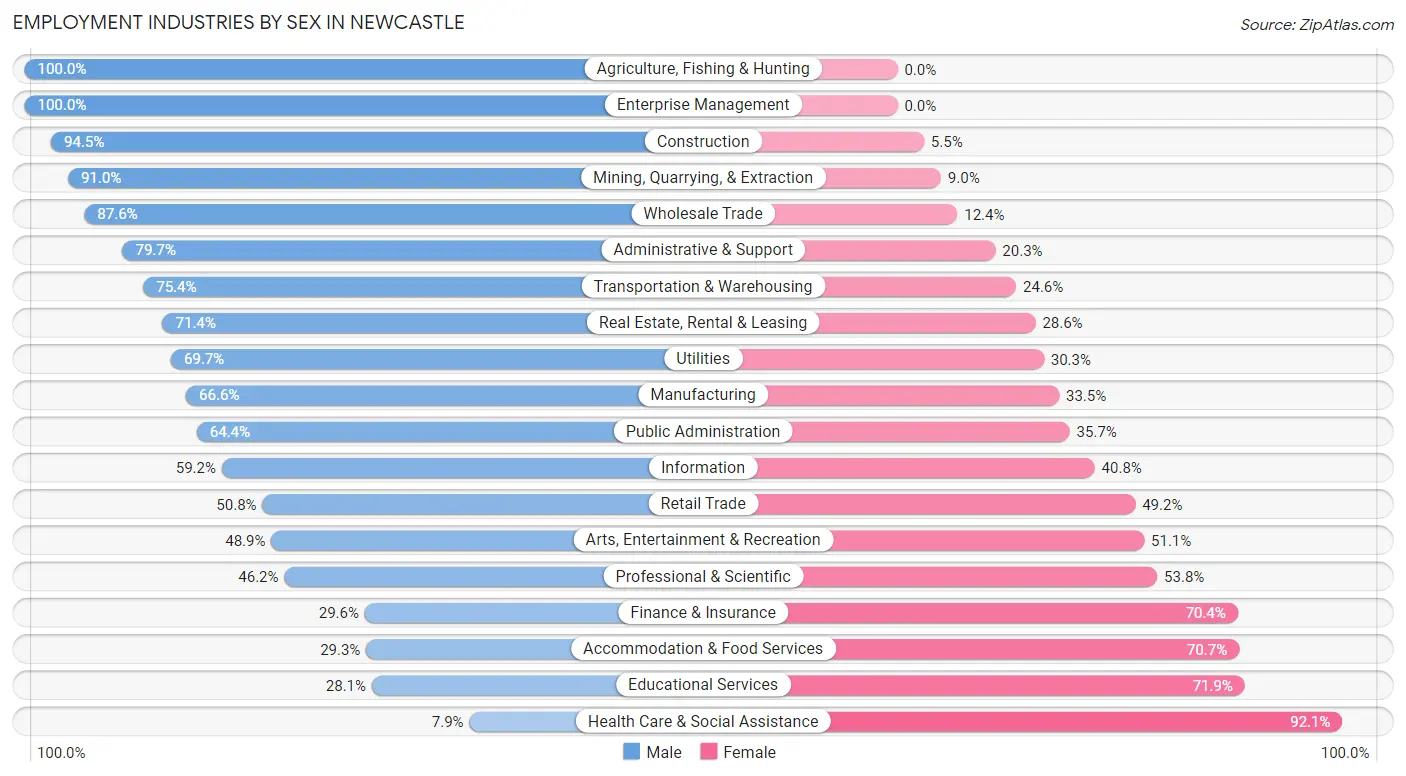
Employment Industries by Sex in Newcastle
The Newcastle industries that see more men than women are Agriculture, Fishing & Hunting (100.0%), Enterprise Management (100.0%), and Construction (94.5%), whereas the industries that tend to have a higher number of women are Health Care & Social Assistance (92.1%), Educational Services (71.9%), and Accommodation & Food Services (70.7%).
| Industry | Male | Female |
| Agriculture, Fishing & Hunting | 63 (100.0%) | 0 (0.0%) |
| Mining, Quarrying, & Extraction | 182 (91.0%) | 18 (9.0%) |
| Construction | 604 (94.5%) | 35 (5.5%) |
| Manufacturing | 366 (66.5%) | 184 (33.5%) |
| Wholesale Trade | 198 (87.6%) | 28 (12.4%) |
| Retail Trade | 261 (50.8%) | 253 (49.2%) |
| Transportation & Warehousing | 175 (75.4%) | 57 (24.6%) |
| Utilities | 69 (69.7%) | 30 (30.3%) |
| Information | 29 (59.2%) | 20 (40.8%) |
| Finance & Insurance | 63 (29.6%) | 150 (70.4%) |
| Real Estate, Rental & Leasing | 45 (71.4%) | 18 (28.6%) |
| Professional & Scientific | 197 (46.2%) | 229 (53.8%) |
| Enterprise Management | 28 (100.0%) | 0 (0.0%) |
| Administrative & Support | 169 (79.7%) | 43 (20.3%) |
| Educational Services | 97 (28.1%) | 248 (71.9%) |
| Health Care & Social Assistance | 61 (7.9%) | 708 (92.1%) |
| Arts, Entertainment & Recreation | 69 (48.9%) | 72 (51.1%) |
| Accommodation & Food Services | 41 (29.3%) | 99 (70.7%) |
| Public Administration | 435 (64.3%) | 241 (35.6%) |
| Total | 3,293 (56.5%) | 2,532 (43.5%) |
Education in Newcastle
School Enrollment in Newcastle
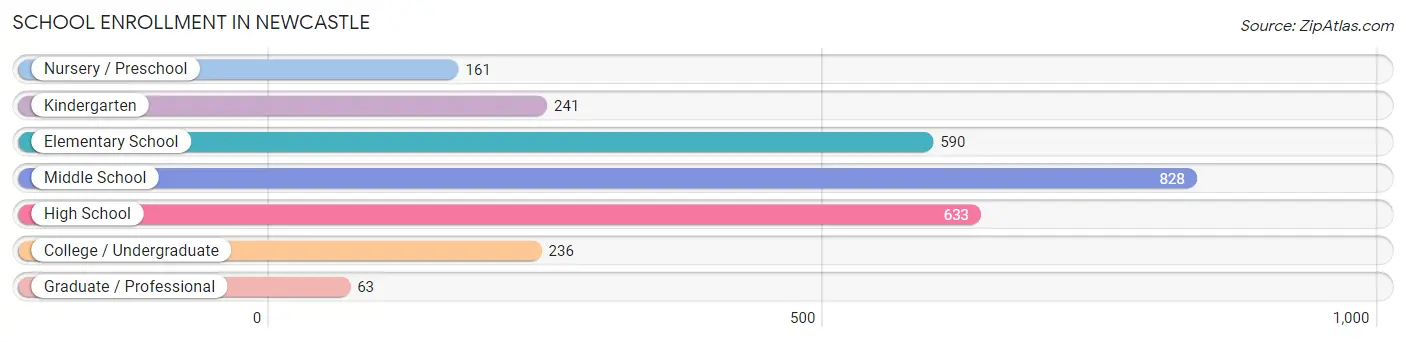
The most common levels of schooling among the 2,752 students in Newcastle are middle school (828 | 30.1%), high school (633 | 23.0%), and elementary school (590 | 21.4%).
| School Level | # Students | % Students |
| Nursery / Preschool | 161 | 5.9% |
| Kindergarten | 241 | 8.8% |
| Elementary School | 590 | 21.4% |
| Middle School | 828 | 30.1% |
| High School | 633 | 23.0% |
| College / Undergraduate | 236 | 8.6% |
| Graduate / Professional | 63 | 2.3% |
| Total | 2,752 | 100.0% |
School Enrollment by Age by Funding Source in Newcastle
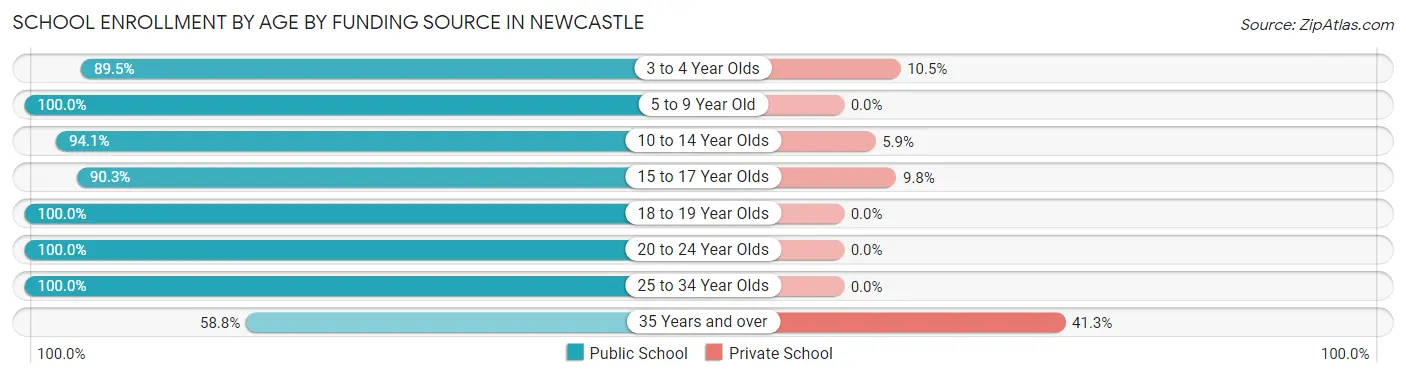
Out of a total of 2,752 students who are enrolled in schools in Newcastle, 143 (5.2%) attend a private institution, while the remaining 2,609 (94.8%) are enrolled in public schools. The age group of 35 years and over has the highest likelihood of being enrolled in private schools, with 33 (41.2% in the age bracket) enrolled. Conversely, the age group of 5 to 9 year old has the lowest likelihood of being enrolled in a private school, with 818 (100.0% in the age bracket) attending a public institution.
| Age Bracket | Public School | Private School |
| 3 to 4 Year Olds | 85 (89.5%) | 10 (10.5%) |
| 5 to 9 Year Old | 818 (100.0%) | 0 (0.0%) |
| 10 to 14 Year Olds | 866 (94.1%) | 54 (5.9%) |
| 15 to 17 Year Olds | 426 (90.2%) | 46 (9.8%) |
| 18 to 19 Year Olds | 113 (100.0%) | 0 (0.0%) |
| 20 to 24 Year Olds | 187 (100.0%) | 0 (0.0%) |
| 25 to 34 Year Olds | 67 (100.0%) | 0 (0.0%) |
| 35 Years and over | 47 (58.8%) | 33 (41.2%) |
| Total | 2,609 (94.8%) | 143 (5.2%) |
Educational Attainment by Field of Study in Newcastle
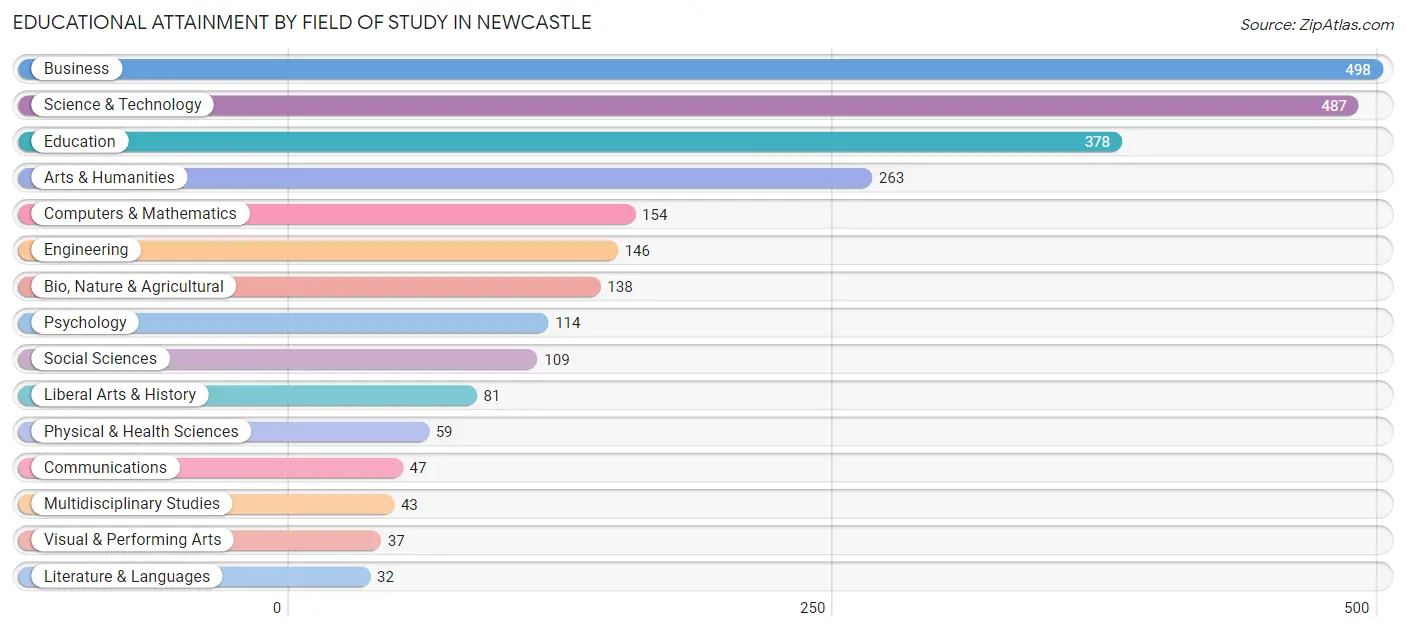
Business (498 | 19.3%), science & technology (487 | 18.8%), education (378 | 14.6%), arts & humanities (263 | 10.2%), and computers & mathematics (154 | 6.0%) are the most common fields of study among 2,586 individuals in Newcastle who have obtained a bachelor's degree or higher.
| Field of Study | # Graduates | % Graduates |
| Computers & Mathematics | 154 | 6.0% |
| Bio, Nature & Agricultural | 138 | 5.3% |
| Physical & Health Sciences | 59 | 2.3% |
| Psychology | 114 | 4.4% |
| Social Sciences | 109 | 4.2% |
| Engineering | 146 | 5.7% |
| Multidisciplinary Studies | 43 | 1.7% |
| Science & Technology | 487 | 18.8% |
| Business | 498 | 19.3% |
| Education | 378 | 14.6% |
| Literature & Languages | 32 | 1.2% |
| Liberal Arts & History | 81 | 3.1% |
| Visual & Performing Arts | 37 | 1.4% |
| Communications | 47 | 1.8% |
| Arts & Humanities | 263 | 10.2% |
| Total | 2,586 | 100.0% |
Transportation & Commute in Newcastle
Vehicle Availability by Sex in Newcastle
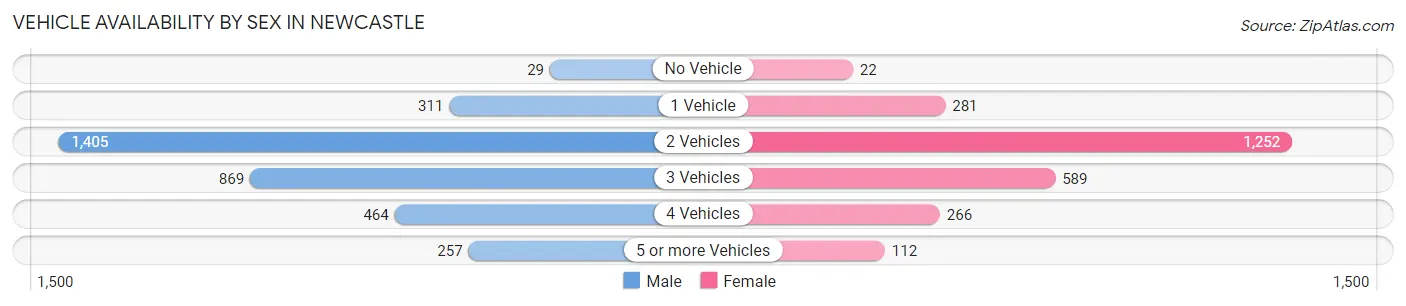
The most prevalent vehicle ownership categories in Newcastle are males with 2 vehicles (1,405, accounting for 42.1%) and females with 2 vehicles (1,252, making up 55.7%).
| Vehicles Available | Male | Female |
| No Vehicle | 29 (0.9%) | 22 (0.9%) |
| 1 Vehicle | 311 (9.3%) | 281 (11.1%) |
| 2 Vehicles | 1,405 (42.1%) | 1,252 (49.6%) |
| 3 Vehicles | 869 (26.1%) | 589 (23.4%) |
| 4 Vehicles | 464 (13.9%) | 266 (10.5%) |
| 5 or more Vehicles | 257 (7.7%) | 112 (4.4%) |
| Total | 3,335 (100.0%) | 2,522 (100.0%) |
Commute Time in Newcastle
The most frequently occuring commute durations in Newcastle are 20 to 24 minutes (1,015 commuters, 19.0%), 30 to 34 minutes (963 commuters, 18.0%), and 25 to 29 minutes (659 commuters, 12.3%).
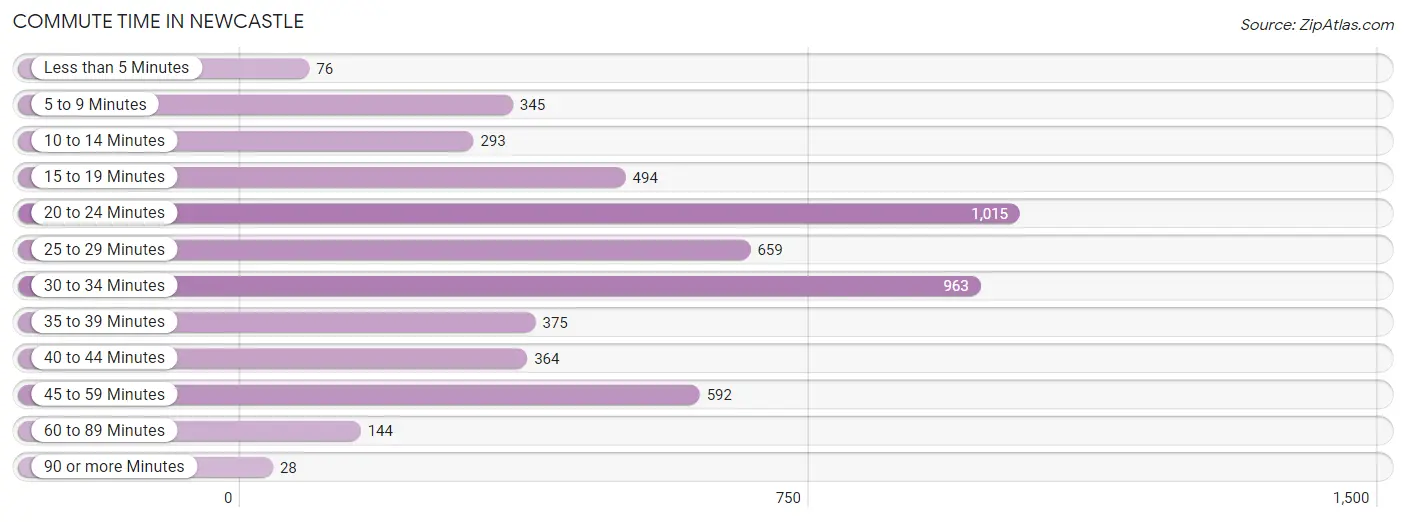
| Commute Time | # Commuters | % Commuters |
| Less than 5 Minutes | 76 | 1.4% |
| 5 to 9 Minutes | 345 | 6.5% |
| 10 to 14 Minutes | 293 | 5.5% |
| 15 to 19 Minutes | 494 | 9.2% |
| 20 to 24 Minutes | 1,015 | 19.0% |
| 25 to 29 Minutes | 659 | 12.3% |
| 30 to 34 Minutes | 963 | 18.0% |
| 35 to 39 Minutes | 375 | 7.0% |
| 40 to 44 Minutes | 364 | 6.8% |
| 45 to 59 Minutes | 592 | 11.1% |
| 60 to 89 Minutes | 144 | 2.7% |
| 90 or more Minutes | 28 | 0.5% |
Commute Time by Sex in Newcastle
The most common commute times in Newcastle are 30 to 34 minutes (563 commuters, 18.8%) for males and 20 to 24 minutes (580 commuters, 24.7%) for females.
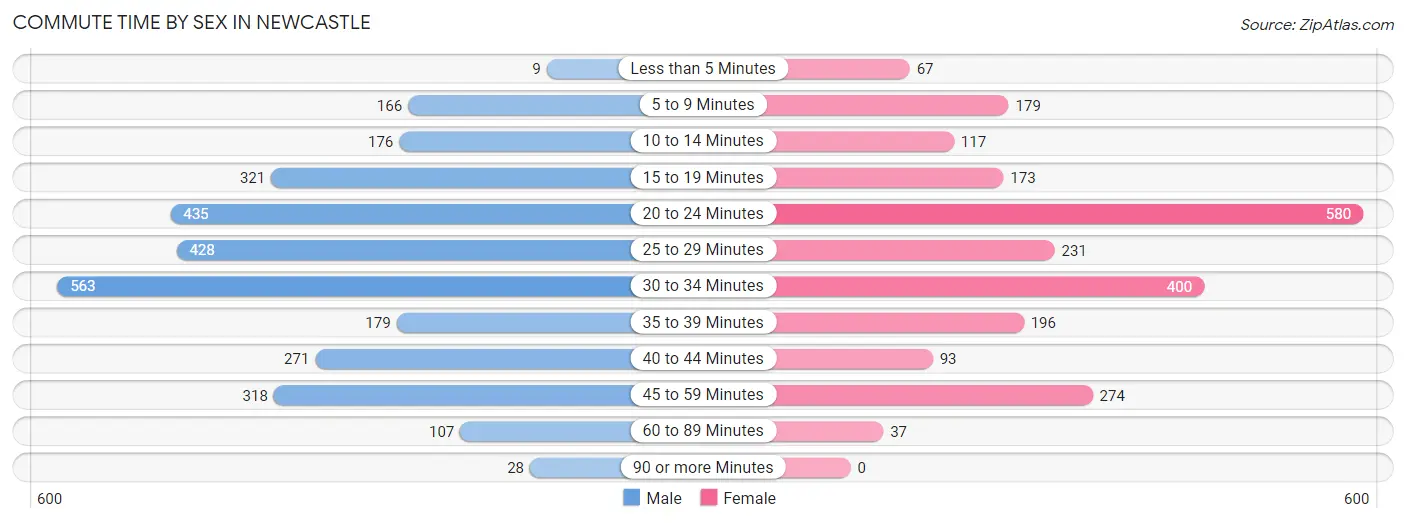
| Commute Time | Male | Female |
| Less than 5 Minutes | 9 (0.3%) | 67 (2.9%) |
| 5 to 9 Minutes | 166 (5.5%) | 179 (7.6%) |
| 10 to 14 Minutes | 176 (5.9%) | 117 (5.0%) |
| 15 to 19 Minutes | 321 (10.7%) | 173 (7.4%) |
| 20 to 24 Minutes | 435 (14.5%) | 580 (24.7%) |
| 25 to 29 Minutes | 428 (14.3%) | 231 (9.8%) |
| 30 to 34 Minutes | 563 (18.8%) | 400 (17.0%) |
| 35 to 39 Minutes | 179 (6.0%) | 196 (8.4%) |
| 40 to 44 Minutes | 271 (9.0%) | 93 (4.0%) |
| 45 to 59 Minutes | 318 (10.6%) | 274 (11.7%) |
| 60 to 89 Minutes | 107 (3.6%) | 37 (1.6%) |
| 90 or more Minutes | 28 (0.9%) | 0 (0.0%) |
Time of Departure to Work by Sex in Newcastle
The most frequent times of departure to work in Newcastle are 6:00 AM to 6:29 AM (532, 17.7%) for males and 7:00 AM to 7:29 AM (612, 26.1%) for females.
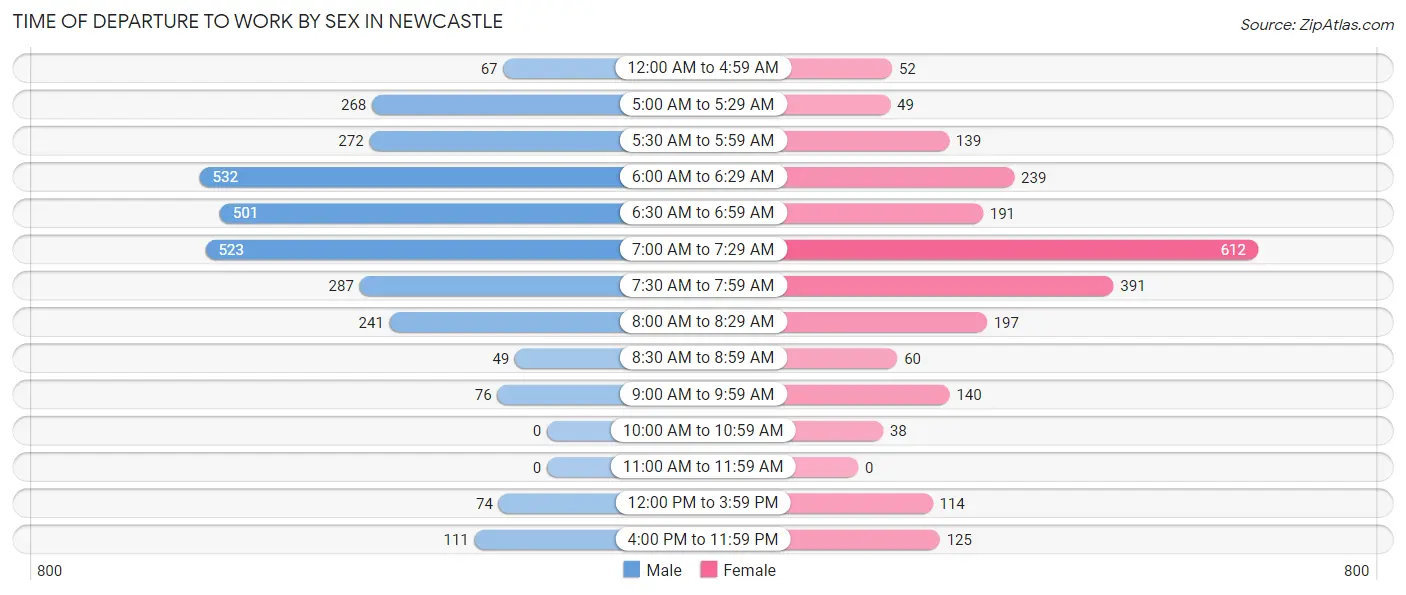
| Time of Departure | Male | Female |
| 12:00 AM to 4:59 AM | 67 (2.2%) | 52 (2.2%) |
| 5:00 AM to 5:29 AM | 268 (8.9%) | 49 (2.1%) |
| 5:30 AM to 5:59 AM | 272 (9.1%) | 139 (5.9%) |
| 6:00 AM to 6:29 AM | 532 (17.7%) | 239 (10.2%) |
| 6:30 AM to 6:59 AM | 501 (16.7%) | 191 (8.1%) |
| 7:00 AM to 7:29 AM | 523 (17.4%) | 612 (26.1%) |
| 7:30 AM to 7:59 AM | 287 (9.6%) | 391 (16.7%) |
| 8:00 AM to 8:29 AM | 241 (8.0%) | 197 (8.4%) |
| 8:30 AM to 8:59 AM | 49 (1.6%) | 60 (2.6%) |
| 9:00 AM to 9:59 AM | 76 (2.5%) | 140 (6.0%) |
| 10:00 AM to 10:59 AM | 0 (0.0%) | 38 (1.6%) |
| 11:00 AM to 11:59 AM | 0 (0.0%) | 0 (0.0%) |
| 12:00 PM to 3:59 PM | 74 (2.5%) | 114 (4.9%) |
| 4:00 PM to 11:59 PM | 111 (3.7%) | 125 (5.3%) |
| Total | 3,001 (100.0%) | 2,347 (100.0%) |
Housing Occupancy in Newcastle
Occupancy by Ownership in Newcastle
Of the total 4,455 dwellings in Newcastle, owner-occupied units account for 3,653 (82.0%), while renter-occupied units make up 802 (18.0%).
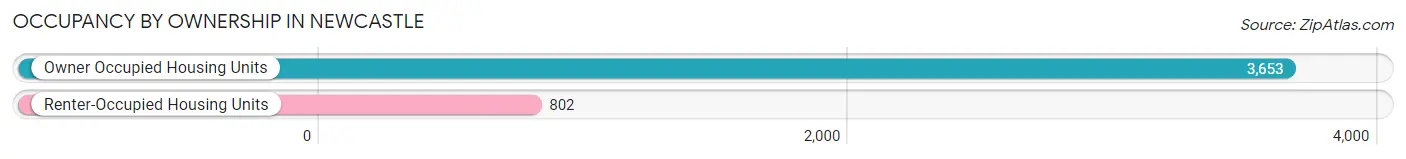
| Occupancy | # Housing Units | % Housing Units |
| Owner Occupied Housing Units | 3,653 | 82.0% |
| Renter-Occupied Housing Units | 802 | 18.0% |
| Total Occupied Housing Units | 4,455 | 100.0% |
Occupancy by Household Size in Newcastle
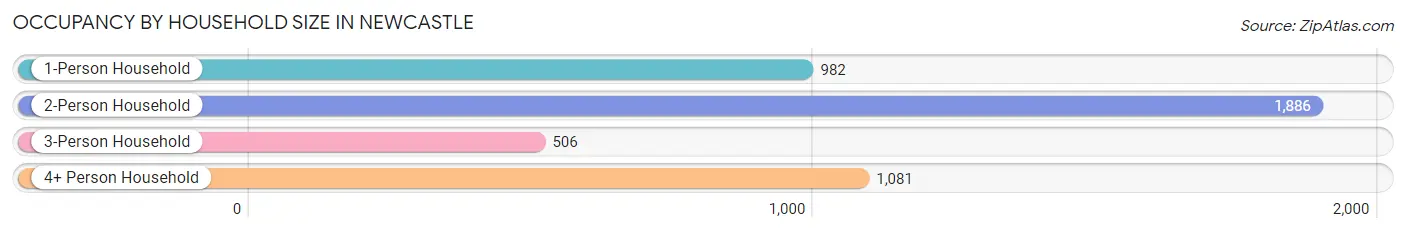
| Household Size | # Housing Units | % Housing Units |
| 1-Person Household | 982 | 22.0% |
| 2-Person Household | 1,886 | 42.3% |
| 3-Person Household | 506 | 11.4% |
| 4+ Person Household | 1,081 | 24.3% |
| Total Housing Units | 4,455 | 100.0% |
Occupancy by Ownership by Household Size in Newcastle
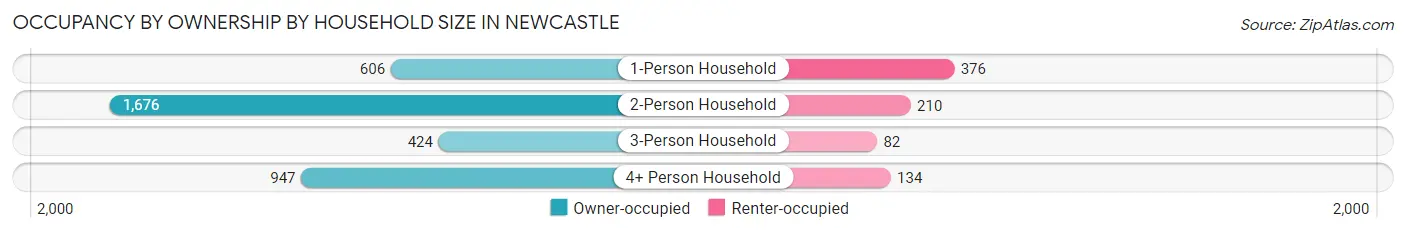
| Household Size | Owner-occupied | Renter-occupied |
| 1-Person Household | 606 (61.7%) | 376 (38.3%) |
| 2-Person Household | 1,676 (88.9%) | 210 (11.1%) |
| 3-Person Household | 424 (83.8%) | 82 (16.2%) |
| 4+ Person Household | 947 (87.6%) | 134 (12.4%) |
| Total Housing Units | 3,653 (82.0%) | 802 (18.0%) |
Occupancy by Educational Attainment in Newcastle
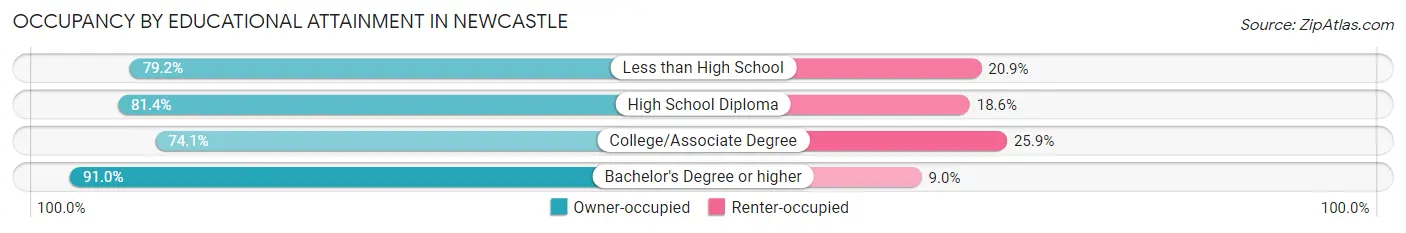
| Household Size | Owner-occupied | Renter-occupied |
| Less than High School | 167 (79.1%) | 44 (20.8%) |
| High School Diploma | 926 (81.4%) | 211 (18.6%) |
| College/Associate Degree | 1,168 (74.1%) | 409 (25.9%) |
| Bachelor's Degree or higher | 1,392 (91.0%) | 138 (9.0%) |
Occupancy by Age of Householder in Newcastle
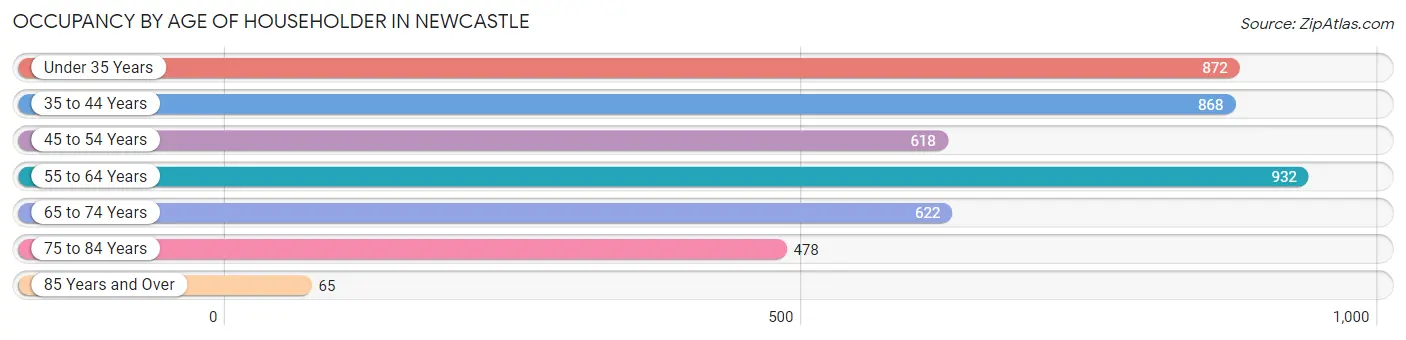
| Age Bracket | # Households | % Households |
| Under 35 Years | 872 | 19.6% |
| 35 to 44 Years | 868 | 19.5% |
| 45 to 54 Years | 618 | 13.9% |
| 55 to 64 Years | 932 | 20.9% |
| 65 to 74 Years | 622 | 14.0% |
| 75 to 84 Years | 478 | 10.7% |
| 85 Years and Over | 65 | 1.5% |
| Total | 4,455 | 100.0% |
Housing Finances in Newcastle
Median Income by Occupancy in Newcastle
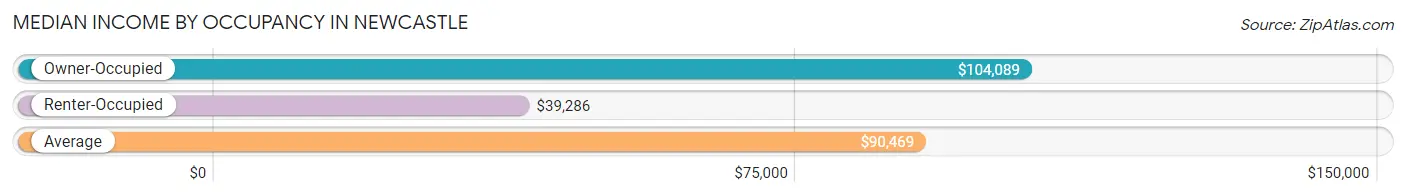
| Occupancy Type | # Households | Median Income |
| Owner-Occupied | 3,653 (82.0%) | $104,089 |
| Renter-Occupied | 802 (18.0%) | $39,286 |
| Average | 4,455 (100.0%) | $90,469 |
Occupancy by Householder Income Bracket in Newcastle
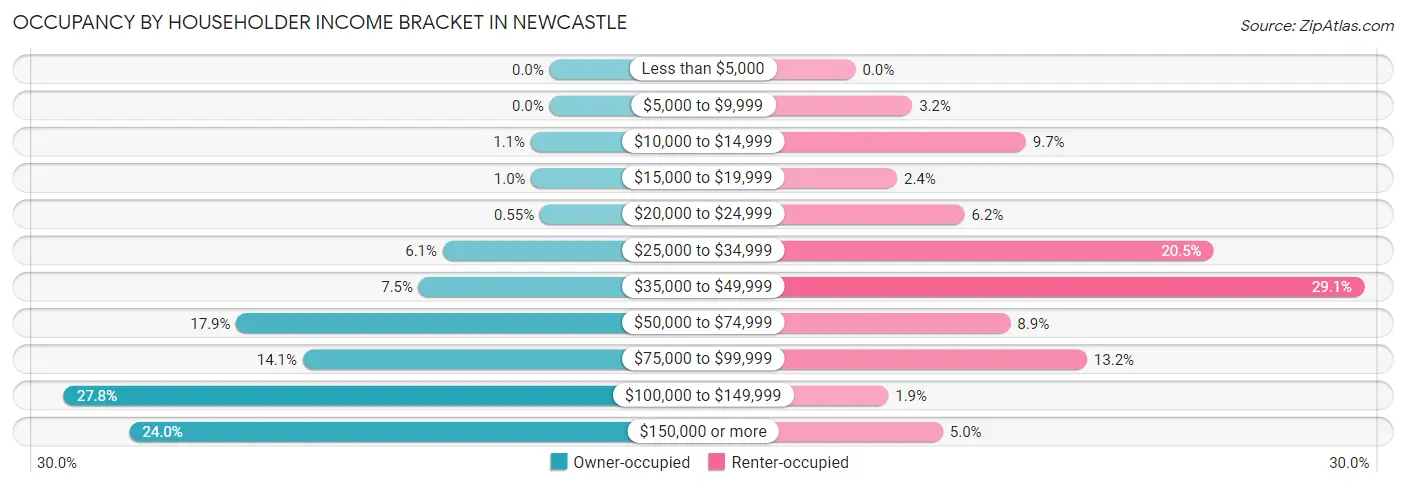
| Income Bracket | Owner-occupied | Renter-occupied |
| Less than $5,000 | 0 (0.0%) | 0 (0.0%) |
| $5,000 to $9,999 | 0 (0.0%) | 26 (3.2%) |
| $10,000 to $14,999 | 39 (1.1%) | 78 (9.7%) |
| $15,000 to $19,999 | 38 (1.0%) | 19 (2.4%) |
| $20,000 to $24,999 | 20 (0.5%) | 50 (6.2%) |
| $25,000 to $34,999 | 223 (6.1%) | 164 (20.4%) |
| $35,000 to $49,999 | 273 (7.5%) | 233 (29.0%) |
| $50,000 to $74,999 | 654 (17.9%) | 71 (8.8%) |
| $75,000 to $99,999 | 515 (14.1%) | 106 (13.2%) |
| $100,000 to $149,999 | 1,014 (27.8%) | 15 (1.9%) |
| $150,000 or more | 877 (24.0%) | 40 (5.0%) |
| Total | 3,653 (100.0%) | 802 (100.0%) |
Monthly Housing Cost Tiers in Newcastle
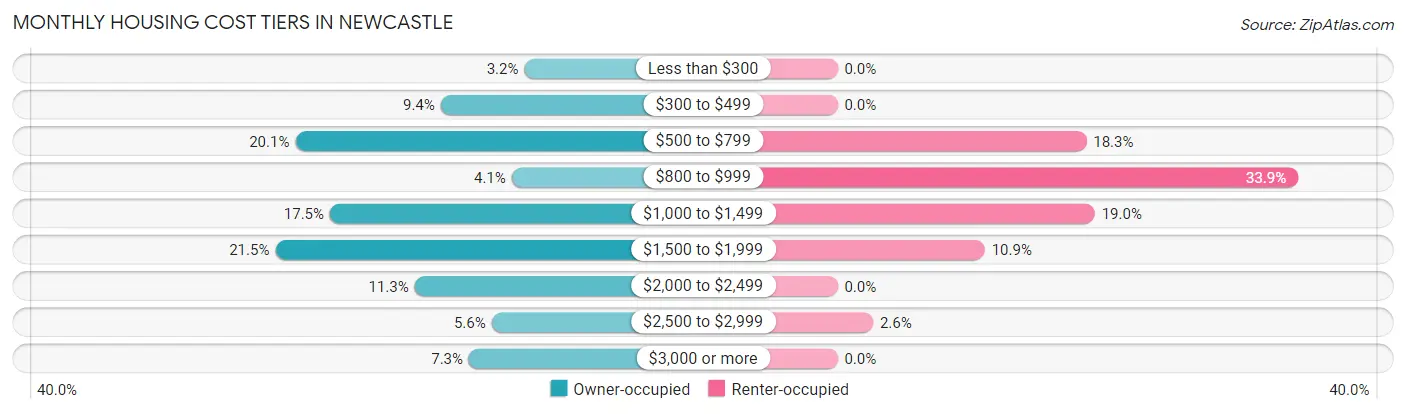
| Monthly Cost | Owner-occupied | Renter-occupied |
| Less than $300 | 117 (3.2%) | 0 (0.0%) |
| $300 to $499 | 342 (9.4%) | 0 (0.0%) |
| $500 to $799 | 733 (20.1%) | 147 (18.3%) |
| $800 to $999 | 151 (4.1%) | 272 (33.9%) |
| $1,000 to $1,499 | 640 (17.5%) | 152 (19.0%) |
| $1,500 to $1,999 | 787 (21.5%) | 87 (10.8%) |
| $2,000 to $2,499 | 412 (11.3%) | 0 (0.0%) |
| $2,500 to $2,999 | 205 (5.6%) | 21 (2.6%) |
| $3,000 or more | 266 (7.3%) | 0 (0.0%) |
| Total | 3,653 (100.0%) | 802 (100.0%) |
Physical Housing Characteristics in Newcastle
Housing Structures in Newcastle
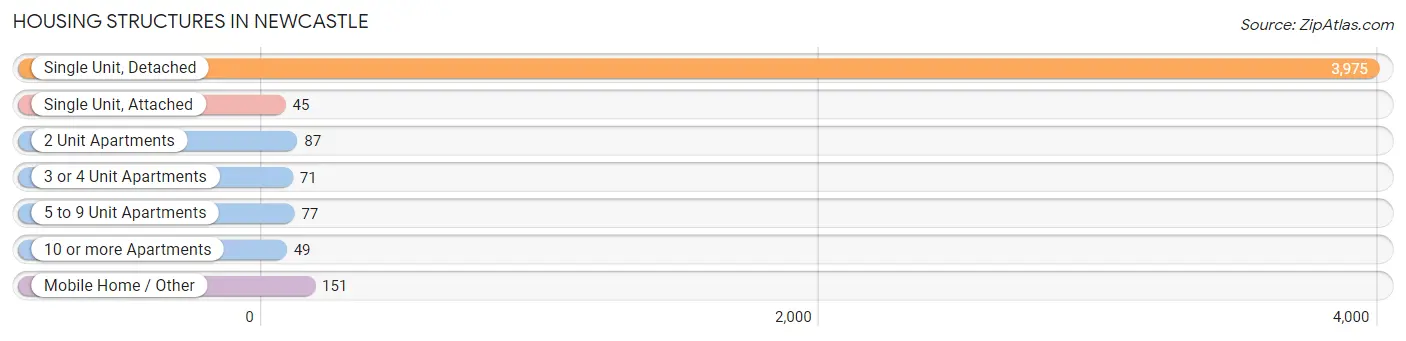
| Structure Type | # Housing Units | % Housing Units |
| Single Unit, Detached | 3,975 | 89.2% |
| Single Unit, Attached | 45 | 1.0% |
| 2 Unit Apartments | 87 | 1.9% |
| 3 or 4 Unit Apartments | 71 | 1.6% |
| 5 to 9 Unit Apartments | 77 | 1.7% |
| 10 or more Apartments | 49 | 1.1% |
| Mobile Home / Other | 151 | 3.4% |
| Total | 4,455 | 100.0% |
Housing Structures by Occupancy in Newcastle
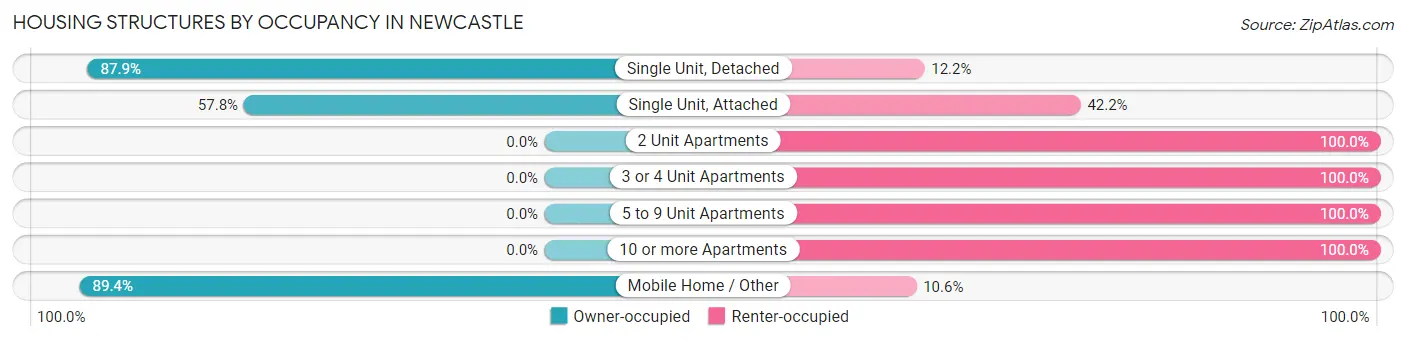
| Structure Type | Owner-occupied | Renter-occupied |
| Single Unit, Detached | 3,492 (87.8%) | 483 (12.1%) |
| Single Unit, Attached | 26 (57.8%) | 19 (42.2%) |
| 2 Unit Apartments | 0 (0.0%) | 87 (100.0%) |
| 3 or 4 Unit Apartments | 0 (0.0%) | 71 (100.0%) |
| 5 to 9 Unit Apartments | 0 (0.0%) | 77 (100.0%) |
| 10 or more Apartments | 0 (0.0%) | 49 (100.0%) |
| Mobile Home / Other | 135 (89.4%) | 16 (10.6%) |
| Total | 3,653 (82.0%) | 802 (18.0%) |
Housing Structures by Number of Rooms in Newcastle
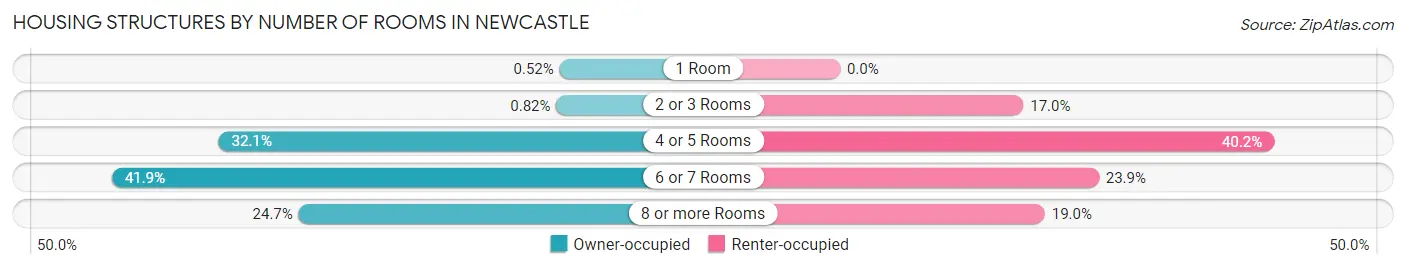
| Number of Rooms | Owner-occupied | Renter-occupied |
| 1 Room | 19 (0.5%) | 0 (0.0%) |
| 2 or 3 Rooms | 30 (0.8%) | 136 (17.0%) |
| 4 or 5 Rooms | 1,171 (32.1%) | 322 (40.2%) |
| 6 or 7 Rooms | 1,532 (41.9%) | 192 (23.9%) |
| 8 or more Rooms | 901 (24.7%) | 152 (19.0%) |
| Total | 3,653 (100.0%) | 802 (100.0%) |
Housing Structure by Heating Type in Newcastle
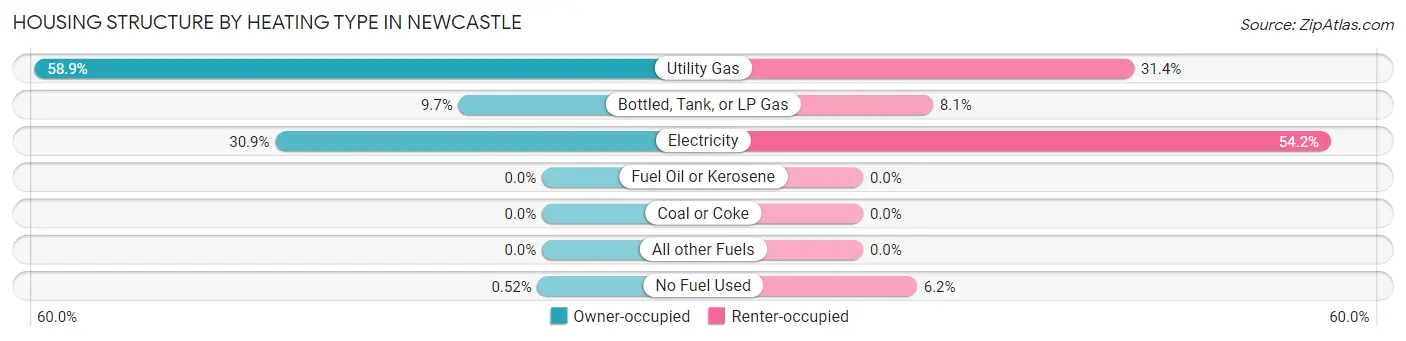
| Heating Type | Owner-occupied | Renter-occupied |
| Utility Gas | 2,150 (58.9%) | 252 (31.4%) |
| Bottled, Tank, or LP Gas | 354 (9.7%) | 65 (8.1%) |
| Electricity | 1,130 (30.9%) | 435 (54.2%) |
| Fuel Oil or Kerosene | 0 (0.0%) | 0 (0.0%) |
| Coal or Coke | 0 (0.0%) | 0 (0.0%) |
| All other Fuels | 0 (0.0%) | 0 (0.0%) |
| No Fuel Used | 19 (0.5%) | 50 (6.2%) |
| Total | 3,653 (100.0%) | 802 (100.0%) |
Household Vehicle Usage in Newcastle
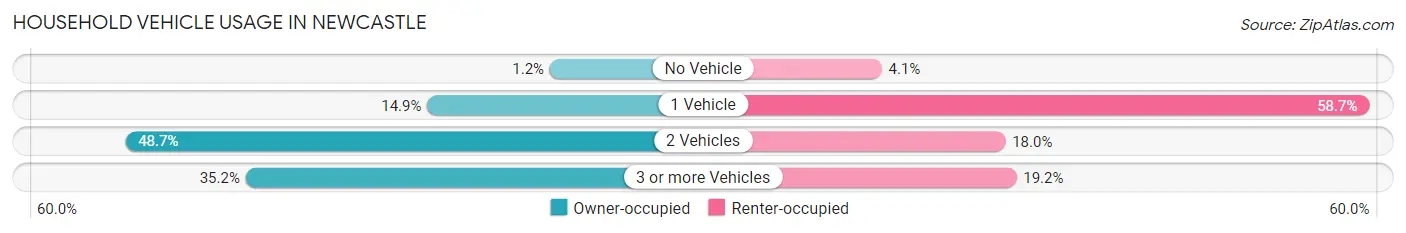
| Vehicles per Household | Owner-occupied | Renter-occupied |
| No Vehicle | 42 (1.1%) | 33 (4.1%) |
| 1 Vehicle | 544 (14.9%) | 471 (58.7%) |
| 2 Vehicles | 1,780 (48.7%) | 144 (18.0%) |
| 3 or more Vehicles | 1,287 (35.2%) | 154 (19.2%) |
| Total | 3,653 (100.0%) | 802 (100.0%) |
Real Estate & Mortgages in Newcastle
Real Estate and Mortgage Overview in Newcastle
| Characteristic | Without Mortgage | With Mortgage |
| Housing Units | 1,304 | 2,349 |
| Median Property Value | $229,800 | $242,600 |
| Median Household Income | $64,079 | $646 |
| Monthly Housing Costs | $612 | $266 |
| Real Estate Taxes | $1,667 | $167 |
Property Value by Mortgage Status in Newcastle
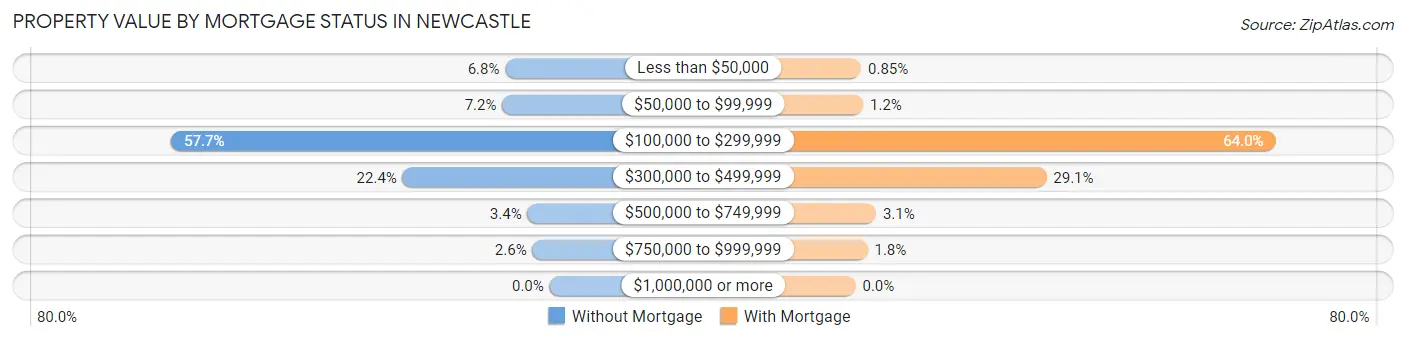
| Property Value | Without Mortgage | With Mortgage |
| Less than $50,000 | 88 (6.8%) | 20 (0.9%) |
| $50,000 to $99,999 | 94 (7.2%) | 27 (1.1%) |
| $100,000 to $299,999 | 752 (57.7%) | 1,503 (64.0%) |
| $300,000 to $499,999 | 292 (22.4%) | 683 (29.1%) |
| $500,000 to $749,999 | 44 (3.4%) | 73 (3.1%) |
| $750,000 to $999,999 | 34 (2.6%) | 43 (1.8%) |
| $1,000,000 or more | 0 (0.0%) | 0 (0.0%) |
| Total | 1,304 (100.0%) | 2,349 (100.0%) |
Household Income by Mortgage Status in Newcastle
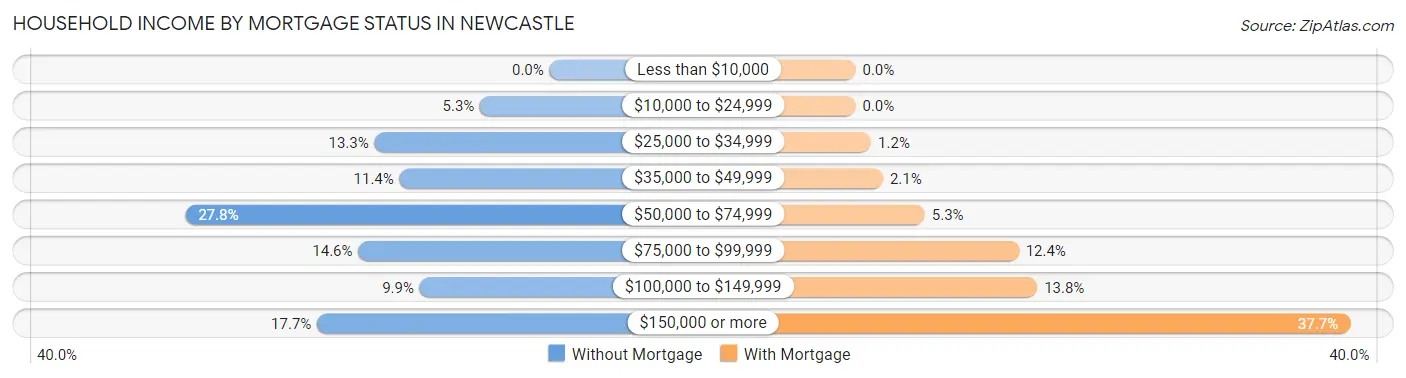
| Household Income | Without Mortgage | With Mortgage |
| Less than $10,000 | 0 (0.0%) | 0 (0.0%) |
| $10,000 to $24,999 | 69 (5.3%) | 0 (0.0%) |
| $25,000 to $34,999 | 174 (13.3%) | 28 (1.2%) |
| $35,000 to $49,999 | 149 (11.4%) | 49 (2.1%) |
| $50,000 to $74,999 | 362 (27.8%) | 124 (5.3%) |
| $75,000 to $99,999 | 190 (14.6%) | 292 (12.4%) |
| $100,000 to $149,999 | 129 (9.9%) | 325 (13.8%) |
| $150,000 or more | 231 (17.7%) | 885 (37.7%) |
| Total | 1,304 (100.0%) | 2,349 (100.0%) |
Property Value to Household Income Ratio in Newcastle
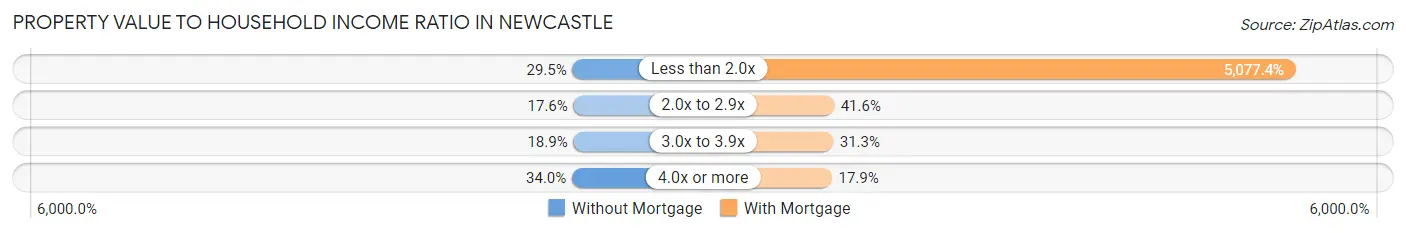
| Value-to-Income Ratio | Without Mortgage | With Mortgage |
| Less than 2.0x | 385 (29.5%) | 119,267 (5,077.3%) |
| 2.0x to 2.9x | 229 (17.6%) | 978 (41.6%) |
| 3.0x to 3.9x | 247 (18.9%) | 736 (31.3%) |
| 4.0x or more | 443 (34.0%) | 421 (17.9%) |
| Total | 1,304 (100.0%) | 2,349 (100.0%) |
Real Estate Taxes by Mortgage Status in Newcastle
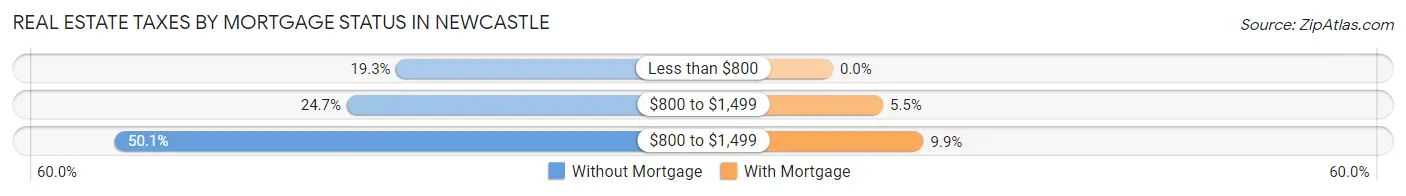
| Property Taxes | Without Mortgage | With Mortgage |
| Less than $800 | 251 (19.3%) | 0 (0.0%) |
| $800 to $1,499 | 322 (24.7%) | 129 (5.5%) |
| $800 to $1,499 | 653 (50.1%) | 233 (9.9%) |
| Total | 1,304 (100.0%) | 2,349 (100.0%) |
Health & Disability in Newcastle
Health Insurance Coverage by Age in Newcastle
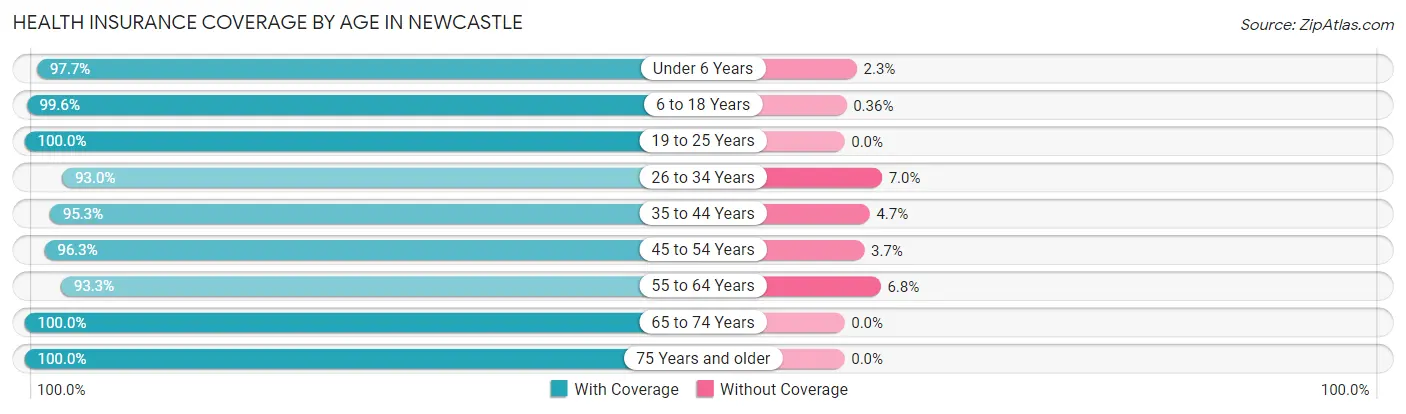
| Age Bracket | With Coverage | Without Coverage |
| Under 6 Years | 763 (97.7%) | 18 (2.3%) |
| 6 to 18 Years | 2,205 (99.6%) | 8 (0.4%) |
| 19 to 25 Years | 734 (100.0%) | 0 (0.0%) |
| 26 to 34 Years | 1,346 (93.0%) | 101 (7.0%) |
| 35 to 44 Years | 1,583 (95.3%) | 78 (4.7%) |
| 45 to 54 Years | 1,126 (96.3%) | 43 (3.7%) |
| 55 to 64 Years | 1,547 (93.2%) | 112 (6.8%) |
| 65 to 74 Years | 1,015 (100.0%) | 0 (0.0%) |
| 75 Years and older | 735 (100.0%) | 0 (0.0%) |
| Total | 11,054 (96.9%) | 360 (3.2%) |
Health Insurance Coverage by Citizenship Status in Newcastle
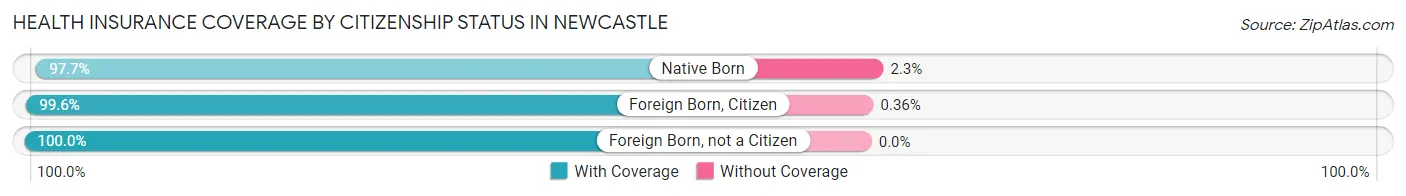
| Citizenship Status | With Coverage | Without Coverage |
| Native Born | 763 (97.7%) | 18 (2.3%) |
| Foreign Born, Citizen | 2,205 (99.6%) | 8 (0.4%) |
| Foreign Born, not a Citizen | 734 (100.0%) | 0 (0.0%) |
Health Insurance Coverage by Household Income in Newcastle
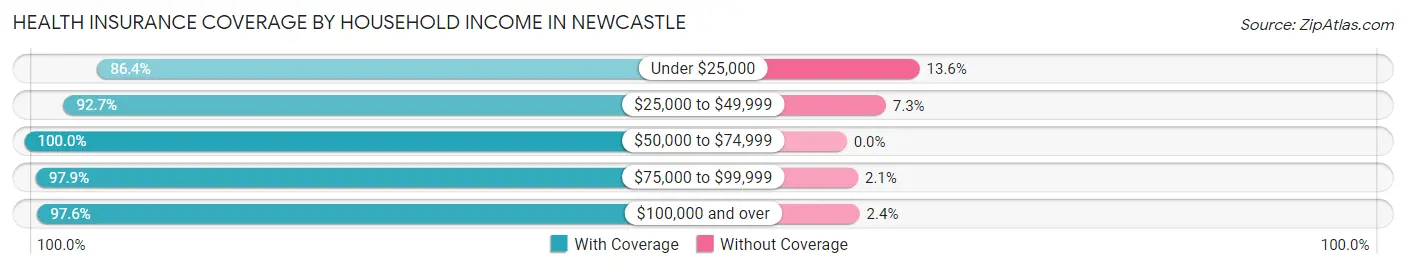
| Household Income | With Coverage | Without Coverage |
| Under $25,000 | 304 (86.4%) | 48 (13.6%) |
| $25,000 to $49,999 | 1,672 (92.7%) | 132 (7.3%) |
| $50,000 to $74,999 | 1,566 (100.0%) | 0 (0.0%) |
| $75,000 to $99,999 | 1,719 (97.9%) | 37 (2.1%) |
| $100,000 and over | 5,793 (97.6%) | 143 (2.4%) |
Public vs Private Health Insurance Coverage by Age in Newcastle
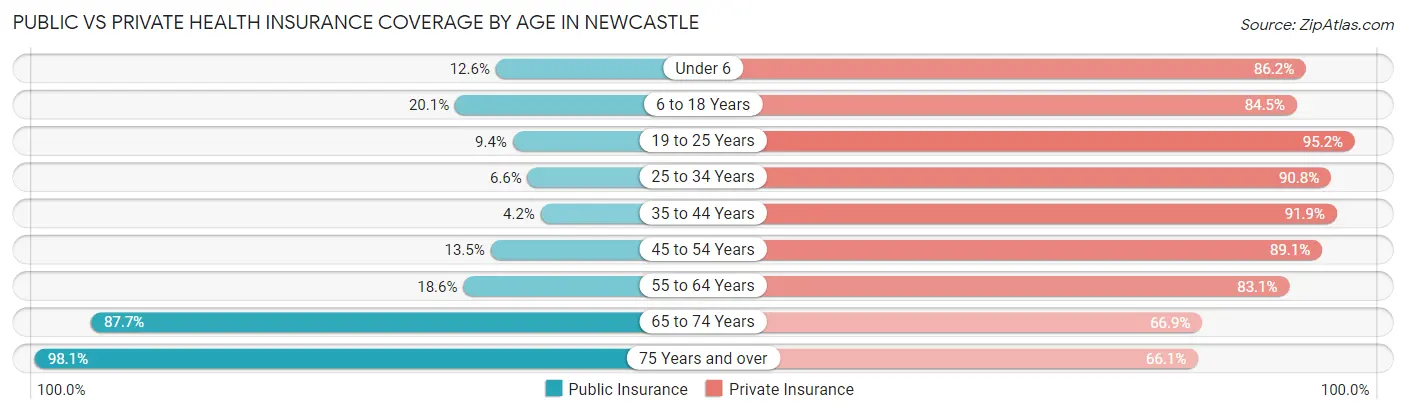
| Age Bracket | Public Insurance | Private Insurance |
| Under 6 | 98 (12.6%) | 673 (86.2%) |
| 6 to 18 Years | 445 (20.1%) | 1,869 (84.5%) |
| 19 to 25 Years | 69 (9.4%) | 699 (95.2%) |
| 25 to 34 Years | 96 (6.6%) | 1,314 (90.8%) |
| 35 to 44 Years | 70 (4.2%) | 1,526 (91.9%) |
| 45 to 54 Years | 158 (13.5%) | 1,042 (89.1%) |
| 55 to 64 Years | 308 (18.6%) | 1,378 (83.1%) |
| 65 to 74 Years | 890 (87.7%) | 679 (66.9%) |
| 75 Years and over | 721 (98.1%) | 486 (66.1%) |
| Total | 2,855 (25.0%) | 9,666 (84.7%) |
Disability Status by Sex by Age in Newcastle
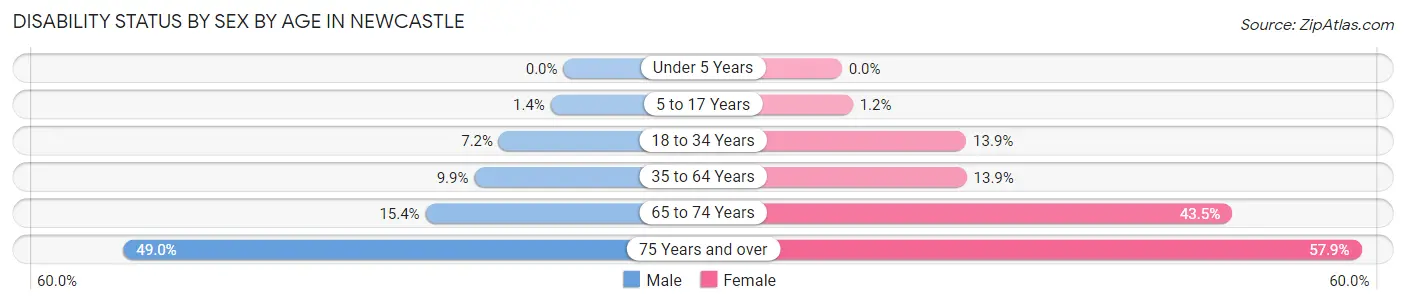
| Age Bracket | Male | Female |
| Under 5 Years | 0 (0.0%) | 0 (0.0%) |
| 5 to 17 Years | 16 (1.4%) | 14 (1.2%) |
| 18 to 34 Years | 75 (7.2%) | 173 (13.9%) |
| 35 to 64 Years | 222 (9.9%) | 313 (13.9%) |
| 65 to 74 Years | 82 (15.4%) | 209 (43.4%) |
| 75 Years and over | 145 (49.0%) | 254 (57.9%) |
Disability Class by Sex by Age in Newcastle
Disability Class: Hearing Difficulty
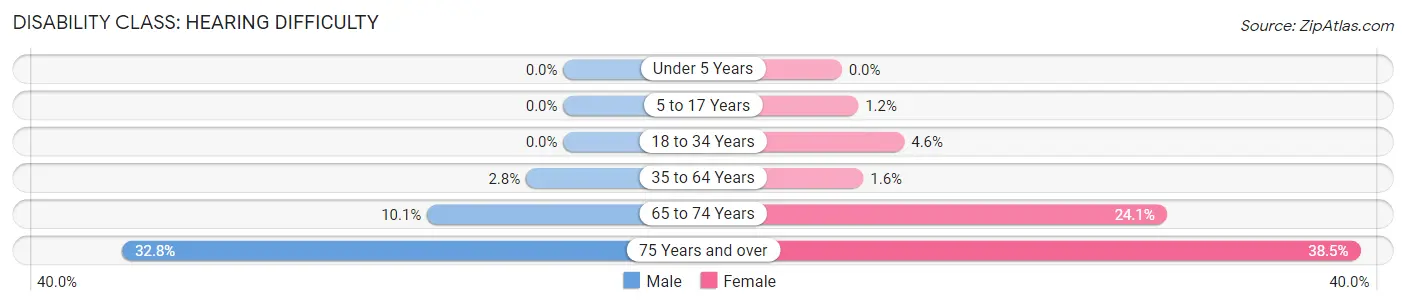
| Age Bracket | Male | Female |
| Under 5 Years | 0 (0.0%) | 0 (0.0%) |
| 5 to 17 Years | 0 (0.0%) | 14 (1.2%) |
| 18 to 34 Years | 0 (0.0%) | 58 (4.6%) |
| 35 to 64 Years | 62 (2.8%) | 36 (1.6%) |
| 65 to 74 Years | 54 (10.1%) | 116 (24.1%) |
| 75 Years and over | 97 (32.8%) | 169 (38.5%) |
Disability Class: Vision Difficulty
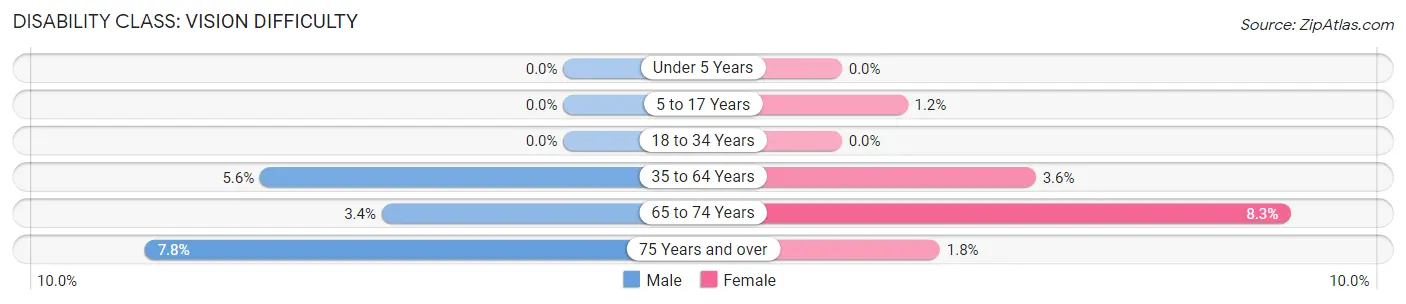
| Age Bracket | Male | Female |
| Under 5 Years | 0 (0.0%) | 0 (0.0%) |
| 5 to 17 Years | 0 (0.0%) | 14 (1.2%) |
| 18 to 34 Years | 0 (0.0%) | 0 (0.0%) |
| 35 to 64 Years | 126 (5.6%) | 81 (3.6%) |
| 65 to 74 Years | 18 (3.4%) | 40 (8.3%) |
| 75 Years and over | 23 (7.8%) | 8 (1.8%) |
Disability Class: Cognitive Difficulty
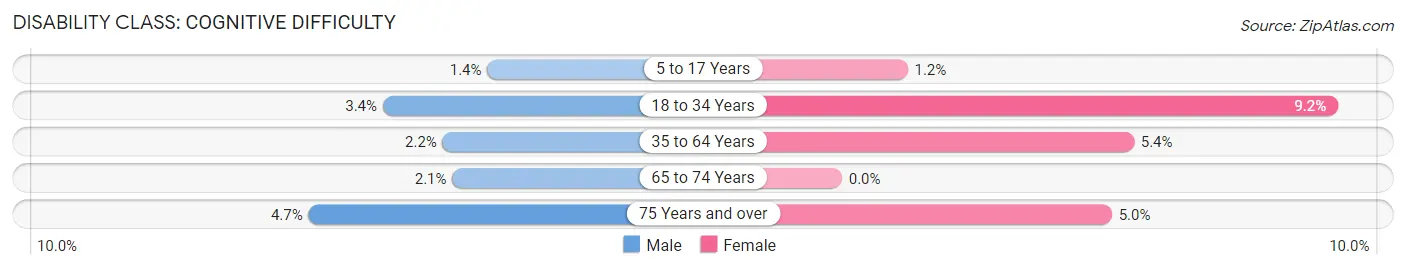
| Age Bracket | Male | Female |
| 5 to 17 Years | 16 (1.4%) | 14 (1.2%) |
| 18 to 34 Years | 35 (3.4%) | 115 (9.2%) |
| 35 to 64 Years | 50 (2.2%) | 122 (5.4%) |
| 65 to 74 Years | 11 (2.1%) | 0 (0.0%) |
| 75 Years and over | 14 (4.7%) | 22 (5.0%) |
Disability Class: Ambulatory Difficulty
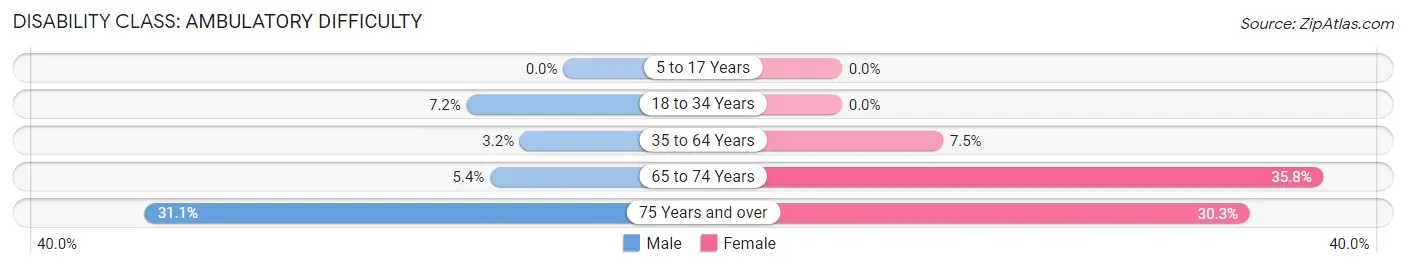
| Age Bracket | Male | Female |
| 5 to 17 Years | 0 (0.0%) | 0 (0.0%) |
| 18 to 34 Years | 75 (7.2%) | 0 (0.0%) |
| 35 to 64 Years | 72 (3.2%) | 169 (7.5%) |
| 65 to 74 Years | 29 (5.4%) | 172 (35.8%) |
| 75 Years and over | 92 (31.1%) | 133 (30.3%) |
Disability Class: Self-Care Difficulty
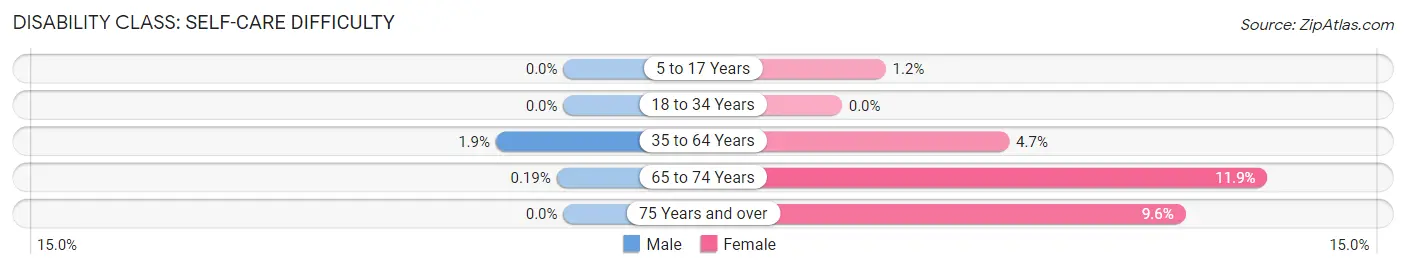
| Age Bracket | Male | Female |
| 5 to 17 Years | 0 (0.0%) | 14 (1.2%) |
| 18 to 34 Years | 0 (0.0%) | 0 (0.0%) |
| 35 to 64 Years | 42 (1.9%) | 105 (4.7%) |
| 65 to 74 Years | 1 (0.2%) | 57 (11.8%) |
| 75 Years and over | 0 (0.0%) | 42 (9.6%) |
Technology Access in Newcastle
Computing Device Access in Newcastle
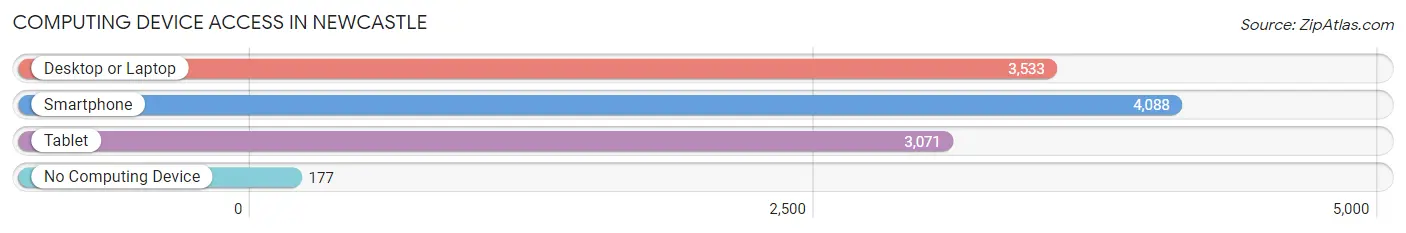
| Device Type | # Households | % Households |
| Desktop or Laptop | 3,533 | 79.3% |
| Smartphone | 4,088 | 91.8% |
| Tablet | 3,071 | 68.9% |
| No Computing Device | 177 | 4.0% |
| Total | 4,455 | 100.0% |
Internet Access in Newcastle
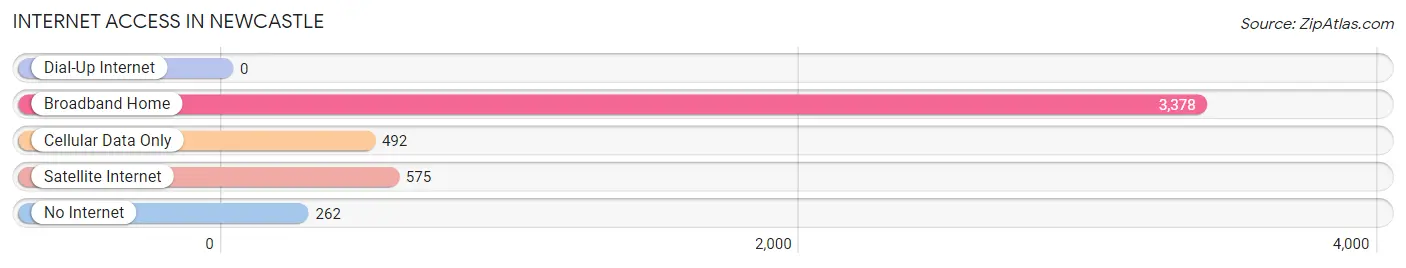
| Internet Type | # Households | % Households |
| Dial-Up Internet | 0 | 0.0% |
| Broadband Home | 3,378 | 75.8% |
| Cellular Data Only | 492 | 11.0% |
| Satellite Internet | 575 | 12.9% |
| No Internet | 262 | 5.9% |
| Total | 4,455 | 100.0% |
Newcastle Summary
Newcastle is a city located in McClain County, Oklahoma, United States. The population was 7,685 at the 2010 census, an increase of 11.2 percent from 6,926 at the 2000 census. Newcastle is part of the Oklahoma City Metropolitan Statistical Area.
Geography
Newcastle is located at 35°20'25" North, 97°44'17" West (35.340278, -97.737917). According to the United States Census Bureau, the city has a total area of 8.2 square miles (21.2 km2), all land.
History
The area that is now Newcastle was originally part of the Chickasaw Nation, Indian Territory. The town was founded in 1891 by the Choctaw, Oklahoma and Gulf Railroad. The town was named after Newcastle-upon-Tyne, England. The post office was established in 1892.
In 1895, the town was incorporated and a mayor and five aldermen were elected. The first mayor was J.W. Smith. The town grew rapidly and by 1900, the population had reached 1,000.
In the early 1900s, Newcastle was a thriving agricultural community. The town had a cotton gin, a grist mill, a bank, a hotel, a newspaper, and several churches.
Economy
Newcastle is a bedroom community for Oklahoma City, located about 20 miles to the south. The city is home to several businesses, including a Walmart Supercenter, a Lowe's Home Improvement store, and several restaurants.
The city is also home to several manufacturing companies, including a steel fabrication plant, a plastics manufacturer, and a food processing plant.
Demographics
As of the census of 2000, there were 6,926 people, 2,619 households, and 1,945 families residing in the city. The population density was 845.2 people per square mile (326.2/km2). There were 2,817 housing units at an average density of 345.3 per square mile (133.3/km2). The racial makeup of the city was 81.2% White, 4.2% African American, 5.7% Native American, 0.3% Asian, 0.1% Pacific Islander, 5.2% from other races, and 3.3% from two or more races. Hispanic or Latino of any race were 8.7% of the population.
There were 2,619 households, out of which 37.2% had children under the age of 18 living with them, 57.2% were married couples living together, 11.7% had a female householder with no husband present, and 26.2% were non-families. 22.2% of all households were made up of individuals, and 8.2% had someone living alone who was 65 years of age or older. The average household size was 2.63 and the average family size was 3.06.
In the city, the population was spread out, with 28.2% under the age of 18, 8.7% from 18 to 24, 29.2% from 25 to 44, 22.7% from 45 to 64, and 11.2% who were 65 years of age or older. The median age was 34 years. For every 100 females, there were 94.2 males. For every 100 females age 18 and over, there were 90.2 males.
The median income for a household in the city was $37,917, and the median income for a family was $43,917. Males had a median income of $31,917 versus $23,917 for females. The per capita income for the city was $17,917. About 8.2% of families and 10.2% of the population were below the poverty line, including 13.2% of those under age 18 and 8.2% of those age 65 or over.
Common Questions
What is Per Capita Income in Newcastle?
Per Capita income in Newcastle is $51,071.
What is the Median Family Income in Newcastle?
Median Family Income in Newcastle is $104,831.
What is the Median Household income in Newcastle?
Median Household Income in Newcastle is $90,469.
What is Income or Wage Gap in Newcastle?
Income or Wage Gap in Newcastle is 37.6%.
Women in Newcastle earn 62.4 cents for every dollar earned by a man.
What is Inequality or Gini Index in Newcastle?
Inequality or Gini Index in Newcastle is 0.43.
What is the Total Population of Newcastle?
Total Population of Newcastle is 11,508.
What is the Total Male Population of Newcastle?
Total Male Population of Newcastle is 5,632.
What is the Total Female Population of Newcastle?
Total Female Population of Newcastle is 5,876.
What is the Ratio of Males per 100 Females in Newcastle?
There are 95.85 Males per 100 Females in Newcastle.
What is the Ratio of Females per 100 Males in Newcastle?
There are 104.33 Females per 100 Males in Newcastle.
What is the Median Population Age in Newcastle?
Median Population Age in Newcastle is 39.2 Years.
What is the Average Family Size in Newcastle
Average Family Size in Newcastle is 3.0 People.
What is the Average Household Size in Newcastle
Average Household Size in Newcastle is 2.6 People.
How Large is the Labor Force in Newcastle?
There are 6,101 People in the Labor Forcein in Newcastle.
What is the Percentage of People in the Labor Force in Newcastle?
68.1% of People are in the Labor Force in Newcastle.
What is the Unemployment Rate in Newcastle?
Unemployment Rate in Newcastle is 3.1%.