New Alluwe, OK Map & Demographics
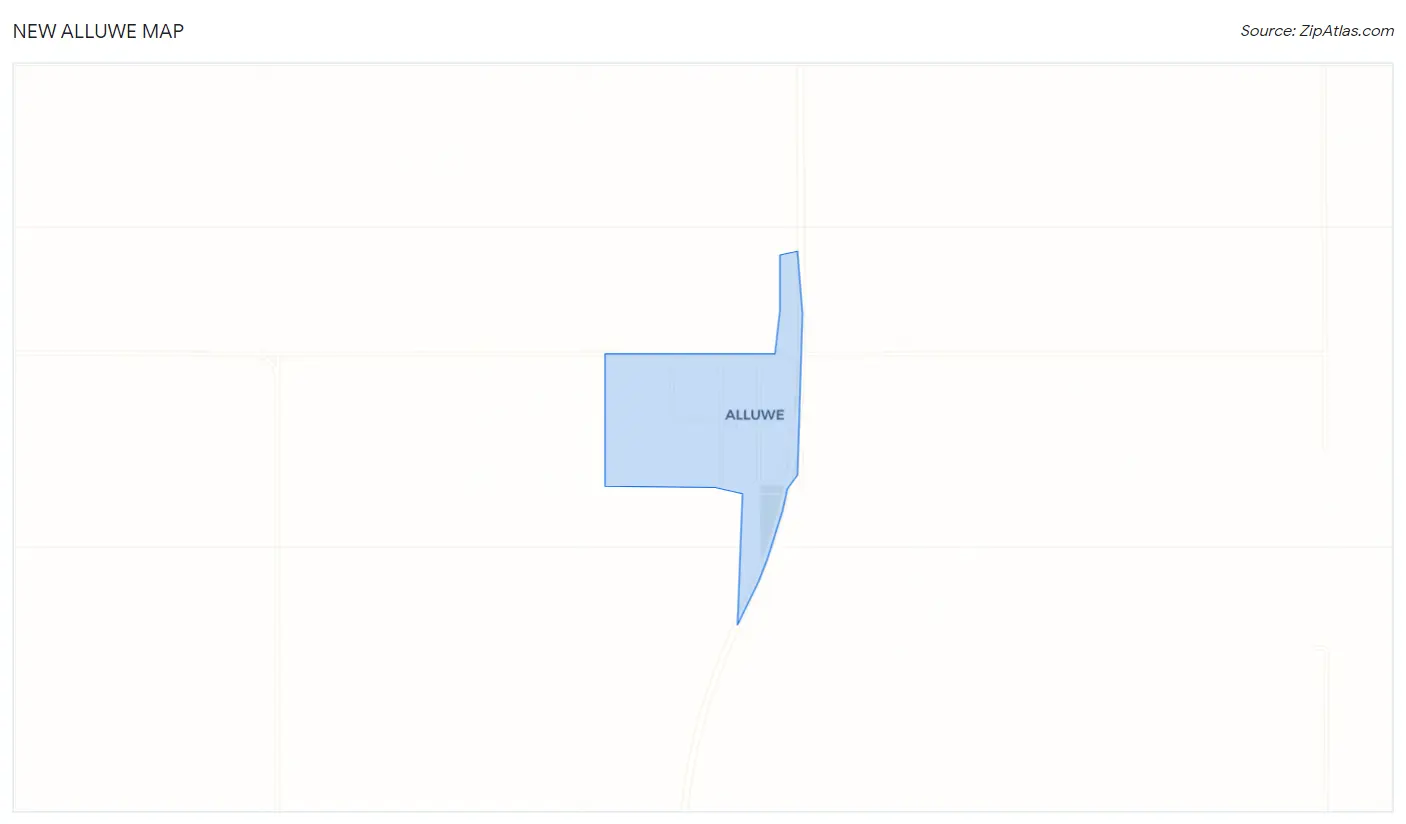
New Alluwe Map
New Alluwe Overview
$17,066
PER CAPITA INCOME
$37,500
AVG FAMILY INCOME
0.40
INEQUALITY / GINI INDEX
64
TOTAL POPULATION
40
MALE POPULATION
24
FEMALE POPULATION
166.67
MALES / 100 FEMALES
60.00
FEMALES / 100 MALES
48.0
MEDIAN AGE
2.8
AVG FAMILY SIZE
1.6
AVG HOUSEHOLD SIZE
23
LABOR FORCE [ PEOPLE ]
41.8%
PERCENT IN LABOR FORCE
8.7%
UNEMPLOYMENT RATE
Income in New Alluwe
Income Overview in New Alluwe
| Characteristic | Number | Measure |
| Per Capita Income | 64 | $17,066 |
| Median Family Income | 14 | $37,500 |
| Mean Family Income | 14 | $42,750 |
| Median Household Income | 39 | $0 |
| Mean Household Income | 39 | $27,382 |
| Income Deficit | 14 | $0 |
| Wage / Income Gap (%) | 64 | 0.00% |
| Wage / Income Gap ($) | 64 | 100.00¢ per $1 |
| Gini / Inequality Index | 64 | 0.40 |
Earnings by Sex in New Alluwe
| Sex | Number | Average Earnings |
| Male | 11 (42.3%) | $0 |
| Female | 15 (57.7%) | $0 |
| Total | 26 (100.0%) | $0 |
Earnings by Sex by Income Bracket in New Alluwe
The most common earnings brackets in New Alluwe are $10,000 to $12,499 for men (3 | 27.3%) and $12,500 to $14,999 for women (4 | 26.7%).
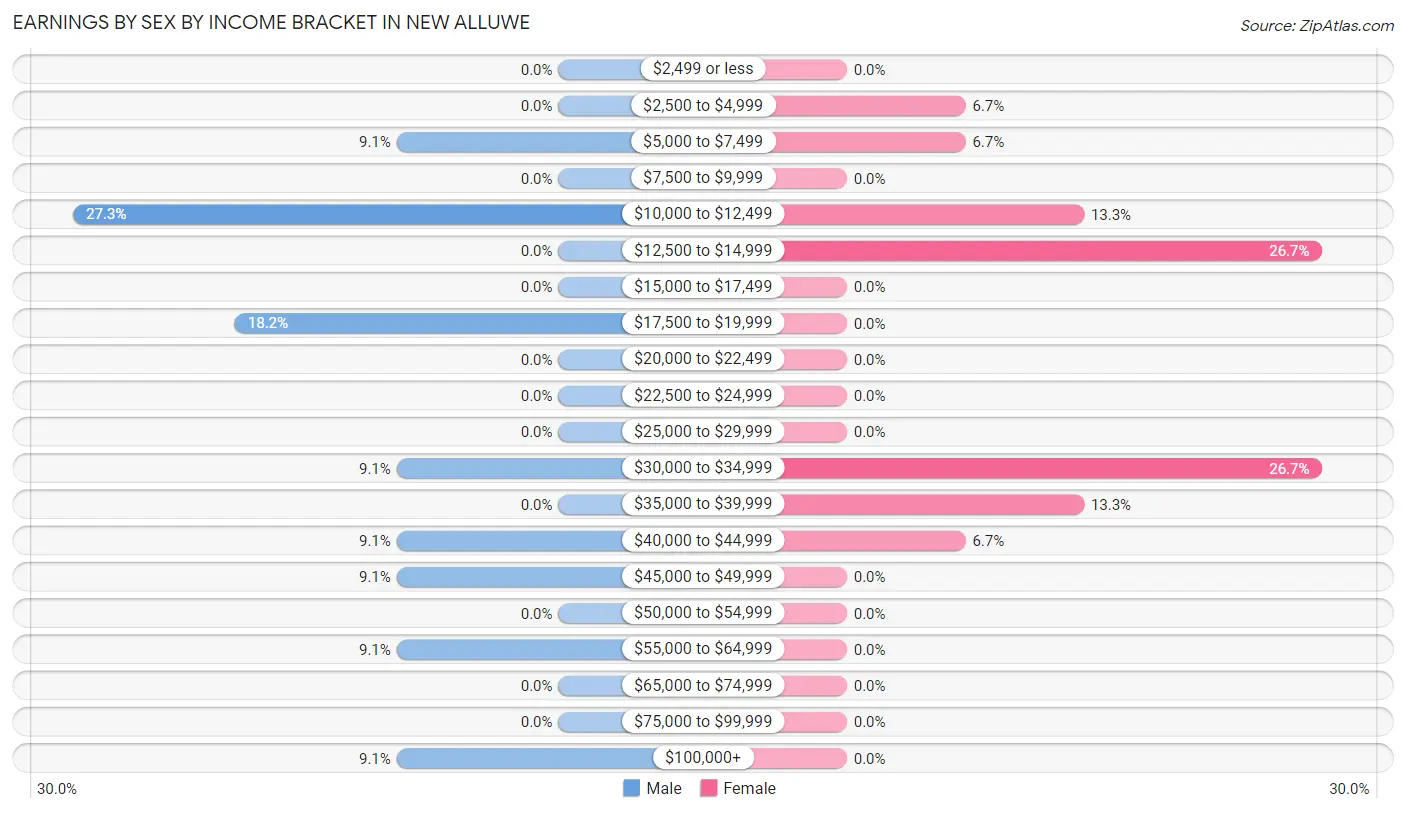
| Income | Male | Female |
| $2,499 or less | 0 (0.0%) | 0 (0.0%) |
| $2,500 to $4,999 | 0 (0.0%) | 1 (6.7%) |
| $5,000 to $7,499 | 1 (9.1%) | 1 (6.7%) |
| $7,500 to $9,999 | 0 (0.0%) | 0 (0.0%) |
| $10,000 to $12,499 | 3 (27.3%) | 2 (13.3%) |
| $12,500 to $14,999 | 0 (0.0%) | 4 (26.7%) |
| $15,000 to $17,499 | 0 (0.0%) | 0 (0.0%) |
| $17,500 to $19,999 | 2 (18.2%) | 0 (0.0%) |
| $20,000 to $22,499 | 0 (0.0%) | 0 (0.0%) |
| $22,500 to $24,999 | 0 (0.0%) | 0 (0.0%) |
| $25,000 to $29,999 | 0 (0.0%) | 0 (0.0%) |
| $30,000 to $34,999 | 1 (9.1%) | 4 (26.7%) |
| $35,000 to $39,999 | 0 (0.0%) | 2 (13.3%) |
| $40,000 to $44,999 | 1 (9.1%) | 1 (6.7%) |
| $45,000 to $49,999 | 1 (9.1%) | 0 (0.0%) |
| $50,000 to $54,999 | 0 (0.0%) | 0 (0.0%) |
| $55,000 to $64,999 | 1 (9.1%) | 0 (0.0%) |
| $65,000 to $74,999 | 0 (0.0%) | 0 (0.0%) |
| $75,000 to $99,999 | 0 (0.0%) | 0 (0.0%) |
| $100,000+ | 1 (9.1%) | 0 (0.0%) |
| Total | 11 (100.0%) | 15 (100.0%) |
Earnings by Sex by Educational Attainment in New Alluwe
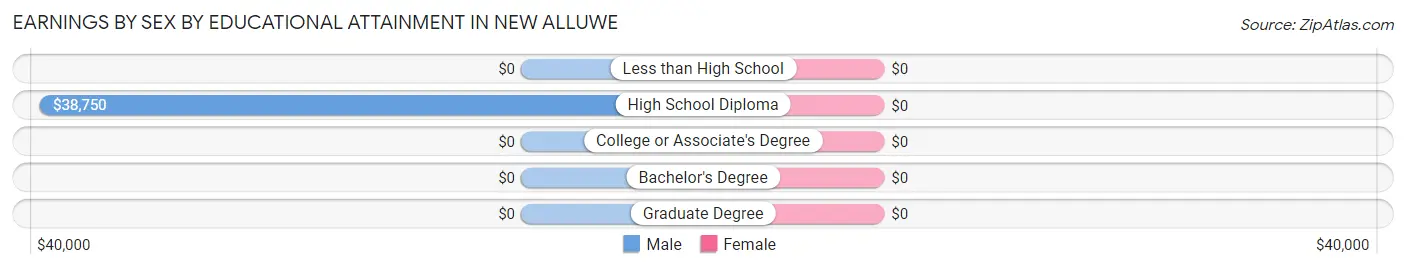
| Educational Attainment | Male Income | Female Income |
| Less than High School | - | - |
| High School Diploma | $38,750 | $0 |
| College or Associate's Degree | - | - |
| Bachelor's Degree | - | - |
| Graduate Degree | - | - |
| Total | - | - |
Family Income in New Alluwe
Family Income Brackets in New Alluwe
According to the New Alluwe family income data, there are 4 families falling into the $25,000 to $34,999 income range, which is the most common income bracket and makes up 28.6% of all families.
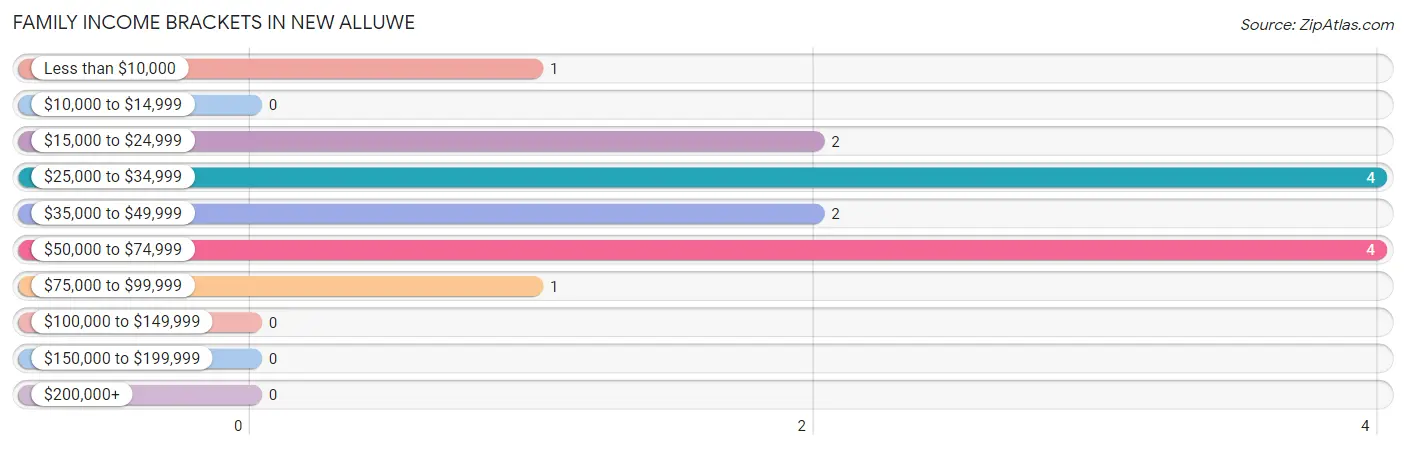
| Income Bracket | # Families | % Families |
| Less than $10,000 | 1 | 7.1% |
| $10,000 to $14,999 | 0 | 0.0% |
| $15,000 to $24,999 | 2 | 14.3% |
| $25,000 to $34,999 | 4 | 28.6% |
| $35,000 to $49,999 | 2 | 14.3% |
| $50,000 to $74,999 | 4 | 28.6% |
| $75,000 to $99,999 | 1 | 7.1% |
| $100,000 to $149,999 | 0 | 0.0% |
| $150,000 to $199,999 | 0 | 0.0% |
| $200,000+ | 0 | 0.0% |
Family Income by Famaliy Size in New Alluwe
2-person families (9 | 64.3%) account for the highest median family income in New Alluwe with $41,250 per family, while 2-person families (9 | 64.3%) have the highest median income of $20,625 per family member.
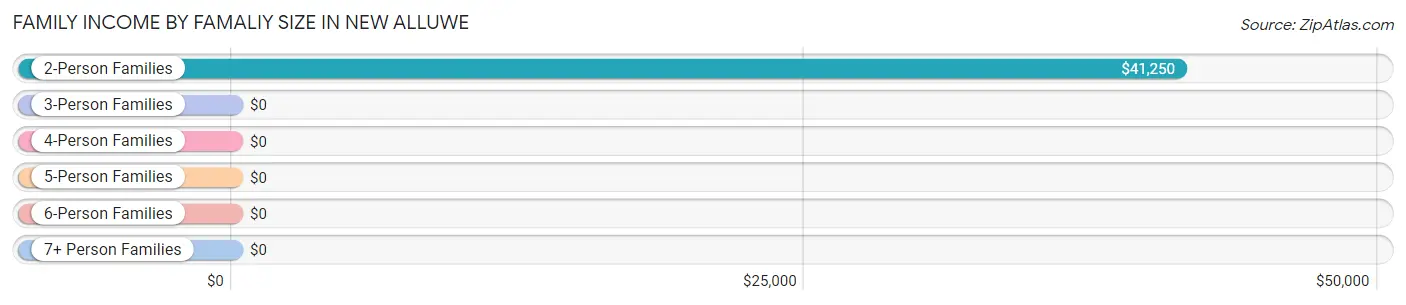
| Income Bracket | # Families | Median Income |
| 2-Person Families | 9 (64.3%) | $41,250 |
| 3-Person Families | 2 (14.3%) | $0 |
| 4-Person Families | 1 (7.1%) | $0 |
| 5-Person Families | 1 (7.1%) | $0 |
| 6-Person Families | 1 (7.1%) | $0 |
| 7+ Person Families | 0 (0.0%) | $0 |
| Total | 14 (100.0%) | $37,500 |
Family Income by Number of Earners in New Alluwe
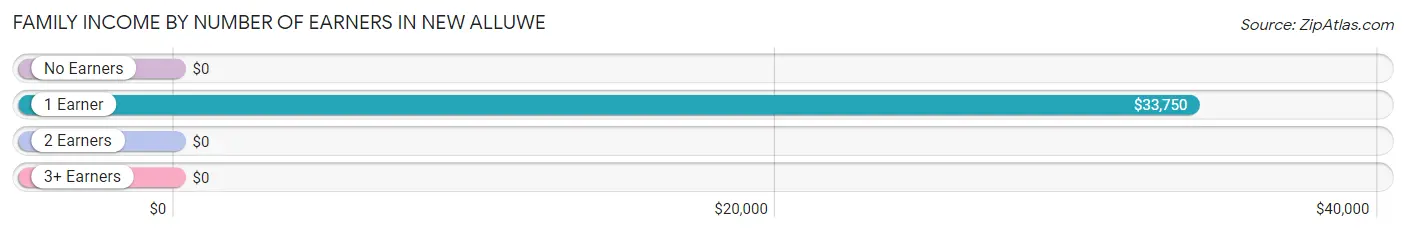
| Number of Earners | # Families | Median Income |
| No Earners | 1 (7.1%) | $0 |
| 1 Earner | 8 (57.1%) | $33,750 |
| 2 Earners | 5 (35.7%) | $0 |
| 3+ Earners | 0 (0.0%) | $0 |
| Total | 14 (100.0%) | $37,500 |
Household Income in New Alluwe
Household Income Brackets in New Alluwe
With 21 households falling in the category, the $10,000 to $14,999 income range is the most frequent in New Alluwe, accounting for 53.8% of all households.
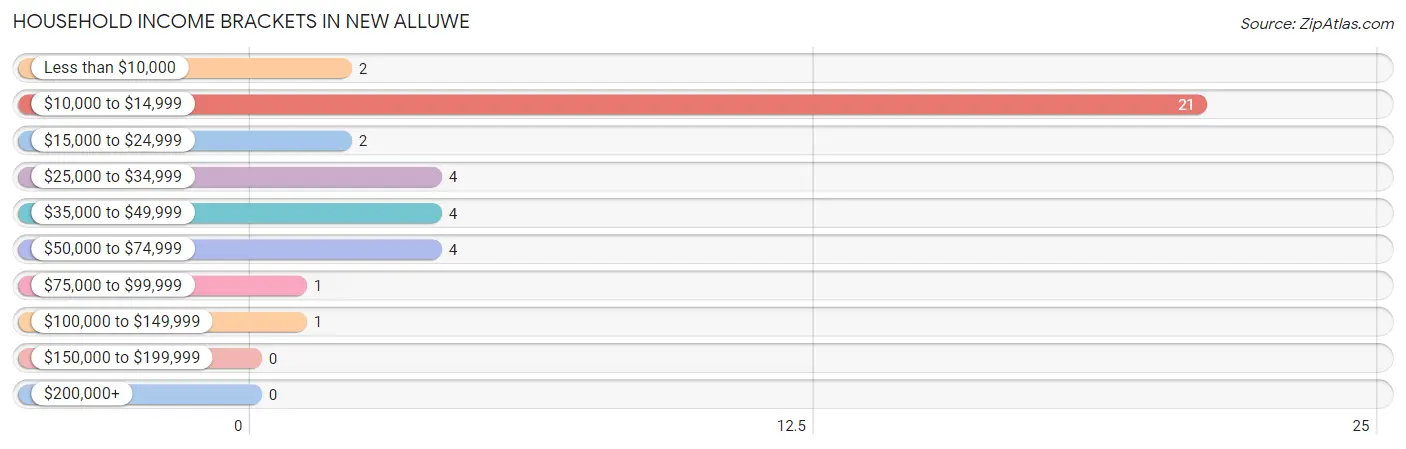
| Income Bracket | # Households | % Households |
| Less than $10,000 | 2 | 5.1% |
| $10,000 to $14,999 | 21 | 53.8% |
| $15,000 to $24,999 | 2 | 5.1% |
| $25,000 to $34,999 | 4 | 10.3% |
| $35,000 to $49,999 | 4 | 10.3% |
| $50,000 to $74,999 | 4 | 10.3% |
| $75,000 to $99,999 | 1 | 2.6% |
| $100,000 to $149,999 | 1 | 2.6% |
| $150,000 to $199,999 | 0 | 0.0% |
| $200,000+ | 0 | 0.0% |
Household Income by Householder Age in New Alluwe
The median household income in New Alluwe is $0, with the highest median household income of $33,438 found in the 45 to 64 years age bracket for the primary householder. A total of 15 households (38.5%) fall into this category.
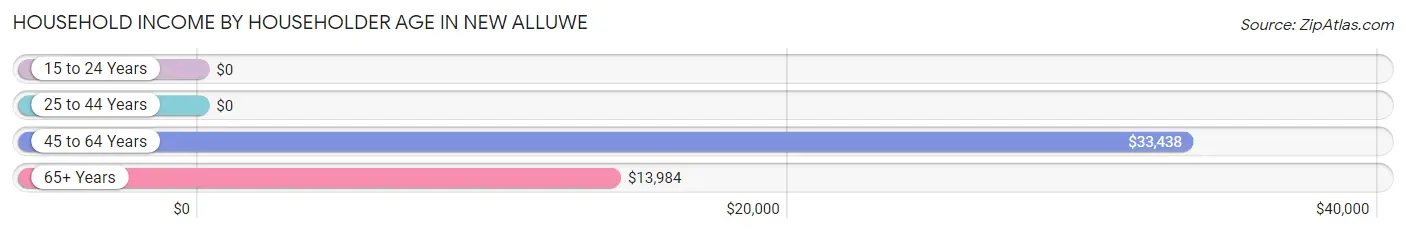
| Income Bracket | # Households | Median Income |
| 15 to 24 Years | 0 (0.0%) | $0 |
| 25 to 44 Years | 5 (12.8%) | $0 |
| 45 to 64 Years | 15 (38.5%) | $33,438 |
| 65+ Years | 19 (48.7%) | $13,984 |
| Total | 39 (100.0%) | $0 |
Poverty in New Alluwe
Income Below Poverty by Sex and Age in New Alluwe
With 70.0% poverty level for males and 20.8% for females among the residents of New Alluwe, under 5 year old males and under 5 year old females are the most vulnerable to poverty, with 1 males (100.0%) and 1 females (100.0%) in their respective age groups living below the poverty level.
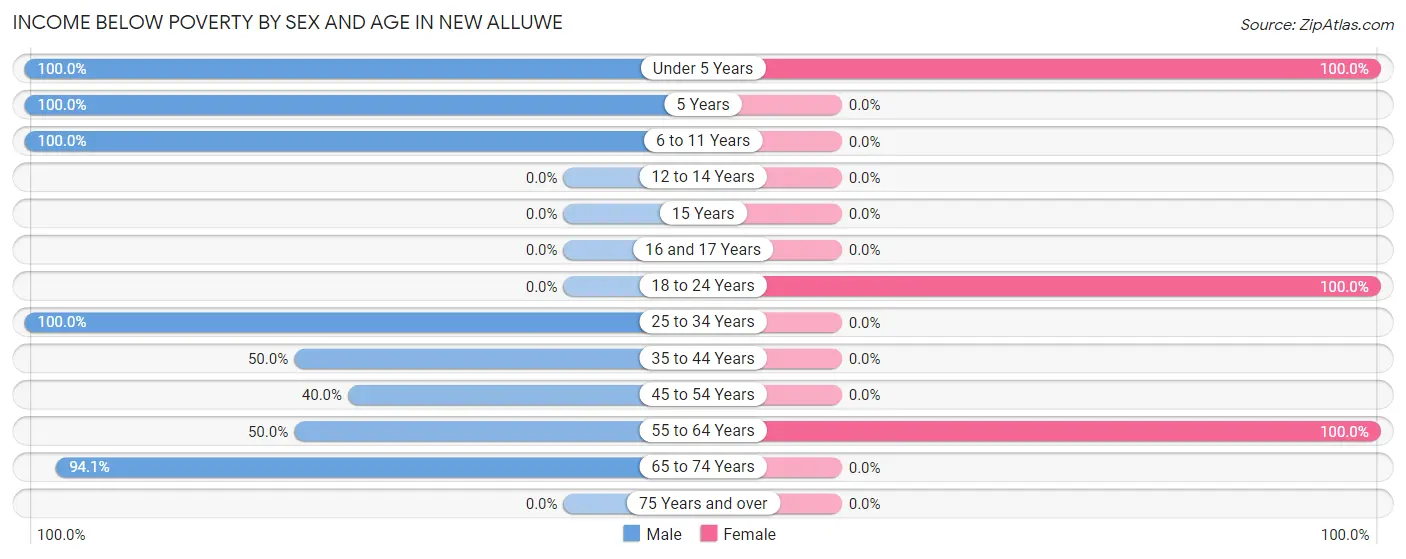
| Age Bracket | Male | Female |
| Under 5 Years | 1 (100.0%) | 1 (100.0%) |
| 5 Years | 1 (100.0%) | 0 (0.0%) |
| 6 to 11 Years | 4 (100.0%) | 0 (0.0%) |
| 12 to 14 Years | 0 (0.0%) | 0 (0.0%) |
| 15 Years | 0 (0.0%) | 0 (0.0%) |
| 16 and 17 Years | 0 (0.0%) | 0 (0.0%) |
| 18 to 24 Years | 0 (0.0%) | 1 (100.0%) |
| 25 to 34 Years | 1 (100.0%) | 0 (0.0%) |
| 35 to 44 Years | 2 (50.0%) | 0 (0.0%) |
| 45 to 54 Years | 2 (40.0%) | 0 (0.0%) |
| 55 to 64 Years | 1 (50.0%) | 3 (100.0%) |
| 65 to 74 Years | 16 (94.1%) | 0 (0.0%) |
| 75 Years and over | 0 (0.0%) | 0 (0.0%) |
| Total | 28 (70.0%) | 5 (20.8%) |
Income Above Poverty by Sex and Age in New Alluwe
According to the poverty statistics in New Alluwe, males aged 12 to 14 years and females aged 16 and 17 years are the age groups that are most secure financially, with 100.0% of males and 100.0% of females in these age groups living above the poverty line.
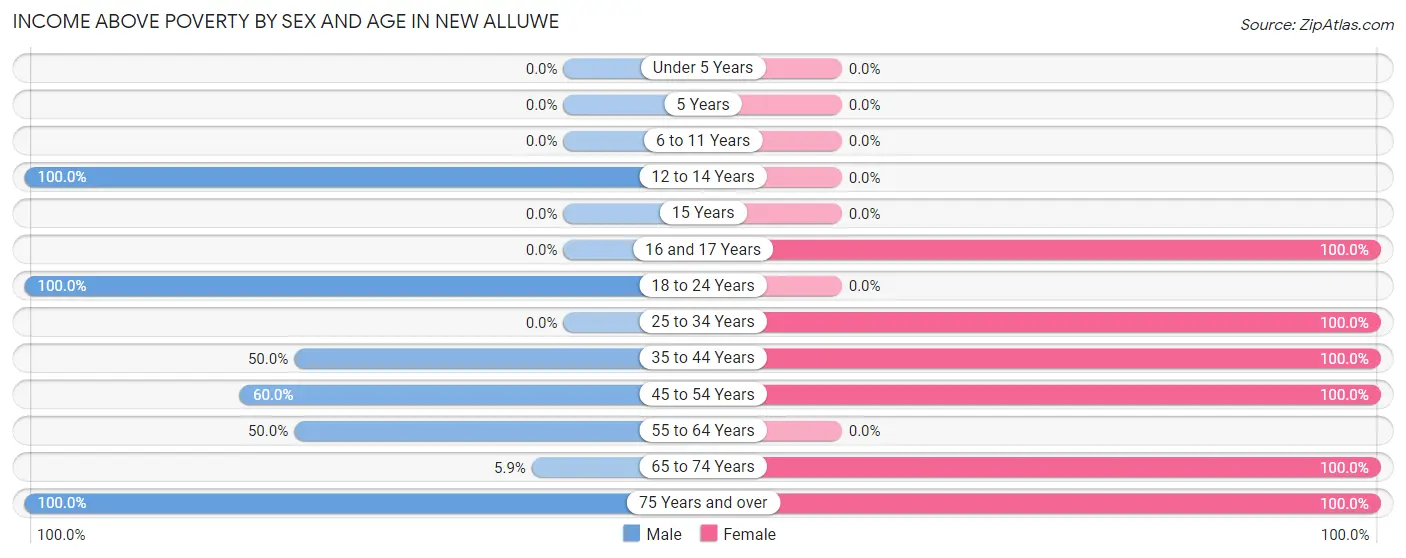
| Age Bracket | Male | Female |
| Under 5 Years | 0 (0.0%) | 0 (0.0%) |
| 5 Years | 0 (0.0%) | 0 (0.0%) |
| 6 to 11 Years | 0 (0.0%) | 0 (0.0%) |
| 12 to 14 Years | 2 (100.0%) | 0 (0.0%) |
| 15 Years | 0 (0.0%) | 0 (0.0%) |
| 16 and 17 Years | 0 (0.0%) | 2 (100.0%) |
| 18 to 24 Years | 1 (100.0%) | 0 (0.0%) |
| 25 to 34 Years | 0 (0.0%) | 2 (100.0%) |
| 35 to 44 Years | 2 (50.0%) | 4 (100.0%) |
| 45 to 54 Years | 3 (60.0%) | 8 (100.0%) |
| 55 to 64 Years | 1 (50.0%) | 0 (0.0%) |
| 65 to 74 Years | 1 (5.9%) | 2 (100.0%) |
| 75 Years and over | 2 (100.0%) | 1 (100.0%) |
| Total | 12 (30.0%) | 19 (79.2%) |
Income Below Poverty Among Married-Couple Families in New Alluwe
The poverty statistics for married-couple families in New Alluwe show that 12.5% or 1 of the total 8 families live below the poverty line. Families with 3 or 4 children have the highest poverty rate of 100.0%, comprising of 1 families. On the other hand, families with no children have the lowest poverty rate of 0.0%, which includes 0 families.
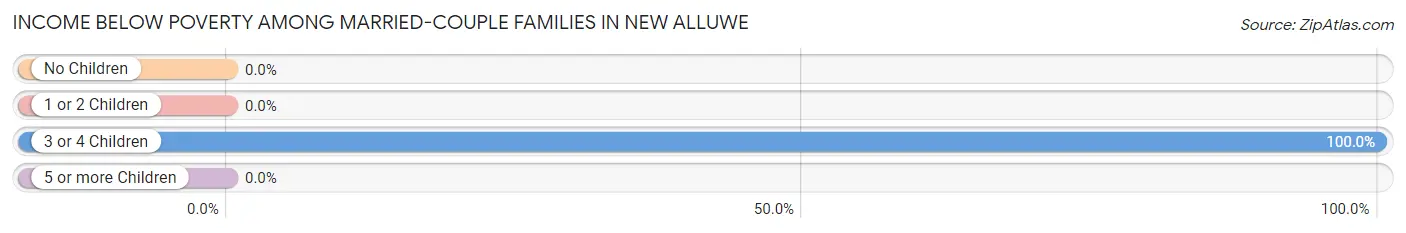
| Children | Above Poverty | Below Poverty |
| No Children | 6 (100.0%) | 0 (0.0%) |
| 1 or 2 Children | 1 (100.0%) | 0 (0.0%) |
| 3 or 4 Children | 0 (0.0%) | 1 (100.0%) |
| 5 or more Children | 0 (0.0%) | 0 (0.0%) |
| Total | 7 (87.5%) | 1 (12.5%) |
Income Below Poverty Among Single-Parent Households in New Alluwe
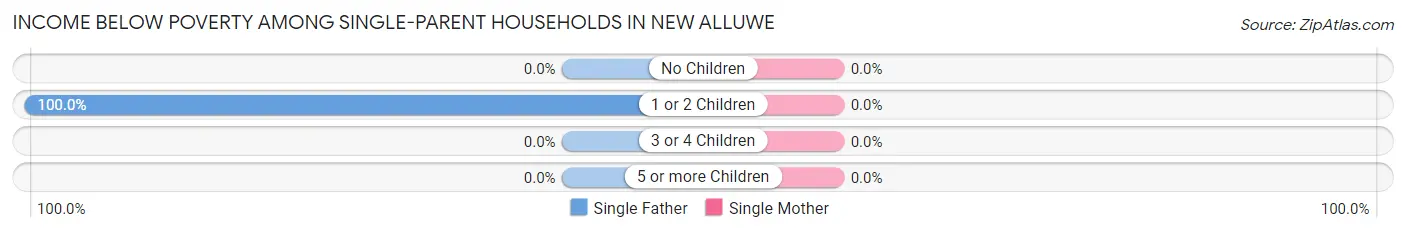
| Children | Single Father | Single Mother |
| No Children | 0 (0.0%) | 0 (0.0%) |
| 1 or 2 Children | 2 (100.0%) | 0 (0.0%) |
| 3 or 4 Children | 0 (0.0%) | 0 (0.0%) |
| 5 or more Children | 0 (0.0%) | 0 (0.0%) |
| Total | 2 (100.0%) | 0 (0.0%) |
Income Below Poverty Among Married-Couple vs Single-Parent Households in New Alluwe
The poverty data for New Alluwe shows that 1 of the married-couple family households (12.5%) and 2 of the single-parent households (33.3%) are living below the poverty level. Within the married-couple family households, those with 3 or 4 children have the highest poverty rate, with 1 households (100.0%) falling below the poverty line. Among the single-parent households, those with 1 or 2 children have the highest poverty rate, with 2 household (33.3%) living below poverty.
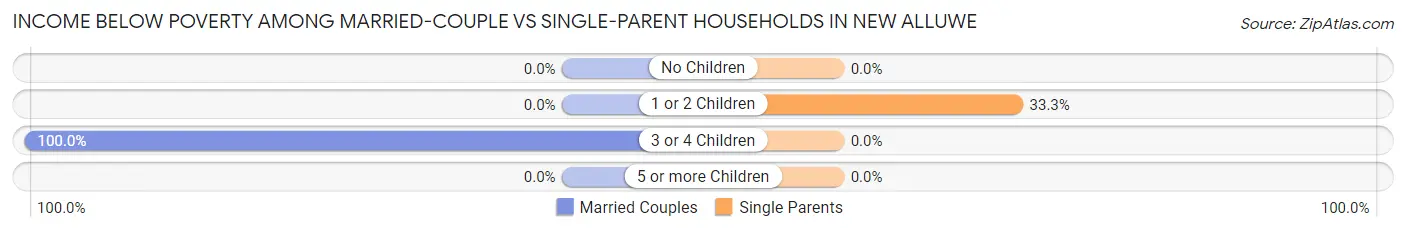
| Children | Married-Couple Families | Single-Parent Households |
| No Children | 0 (0.0%) | 0 (0.0%) |
| 1 or 2 Children | 0 (0.0%) | 2 (33.3%) |
| 3 or 4 Children | 1 (100.0%) | 0 (0.0%) |
| 5 or more Children | 0 (0.0%) | 0 (0.0%) |
| Total | 1 (12.5%) | 2 (33.3%) |
Race in New Alluwe
The most populous races in New Alluwe are White / Caucasian (38 | 59.4%), Hispanic or Latino (16 | 25.0%), and Two or more Races (16 | 25.0%).
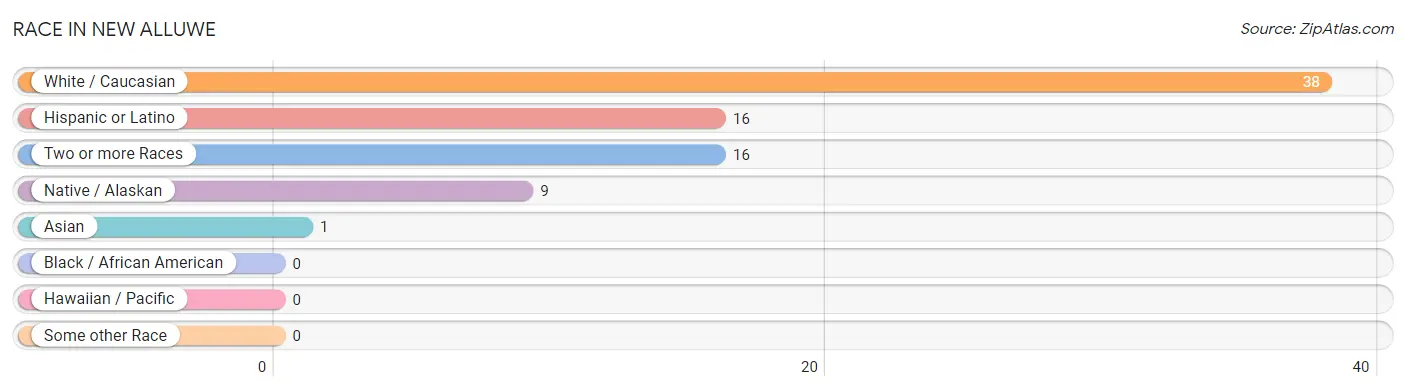
| Race | # Population | % Population |
| Asian | 1 | 1.6% |
| Black / African American | 0 | 0.0% |
| Hawaiian / Pacific | 0 | 0.0% |
| Hispanic or Latino | 16 | 25.0% |
| Native / Alaskan | 9 | 14.1% |
| White / Caucasian | 38 | 59.4% |
| Two or more Races | 16 | 25.0% |
| Some other Race | 0 | 0.0% |
| Total | 64 | 100.0% |
Ancestry in New Alluwe
The most populous ancestries reported in New Alluwe are Cherokee (17 | 26.6%), Welsh (17 | 26.6%), Central American (16 | 25.0%), Guatemalan (16 | 25.0%), and German (7 | 10.9%), together accounting for 114.1% of all New Alluwe residents.
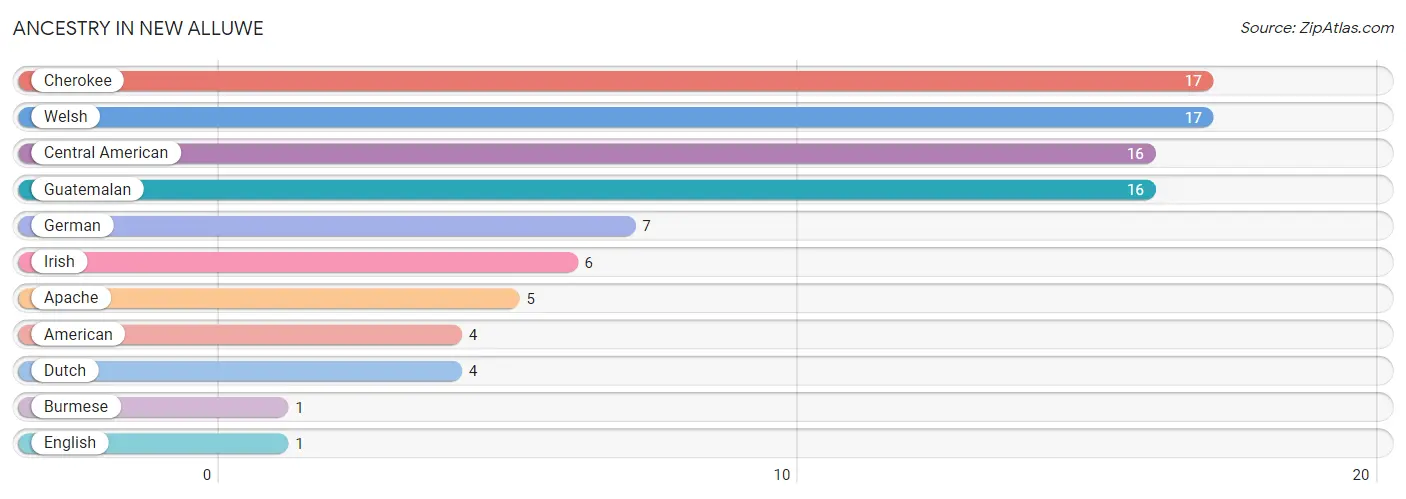
| Ancestry | # Population | % Population |
| American | 4 | 6.2% |
| Apache | 5 | 7.8% |
| Burmese | 1 | 1.6% |
| Central American | 16 | 25.0% |
| Cherokee | 17 | 26.6% |
| Dutch | 4 | 6.2% |
| English | 1 | 1.6% |
| German | 7 | 10.9% |
| Guatemalan | 16 | 25.0% |
| Irish | 6 | 9.4% |
| Welsh | 17 | 26.6% | View All 11 Rows |
Immigrants in New Alluwe
The most numerous immigrant groups reported in New Alluwe came from Asia (1 | 1.6%), Eastern Asia (1 | 1.6%), Europe (1 | 1.6%), Korea (1 | 1.6%), and Netherlands (1 | 1.6%), together accounting for 7.8% of all New Alluwe residents.
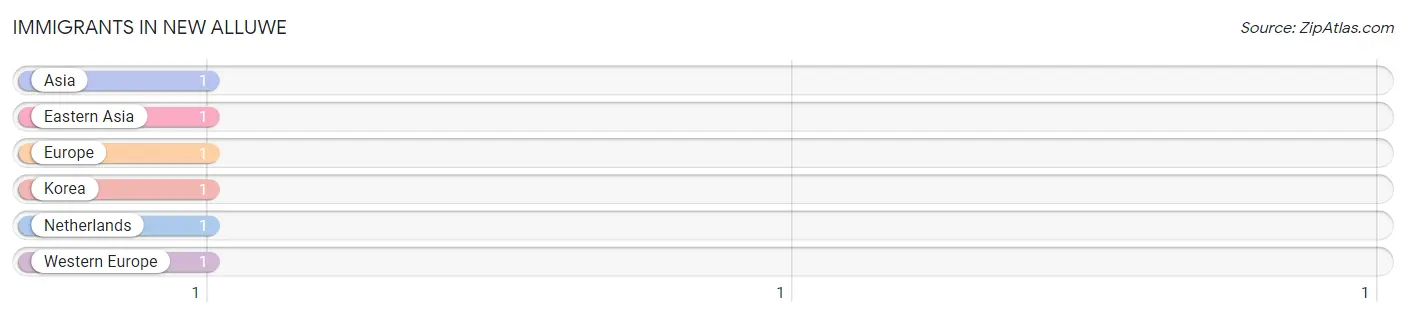
| Immigration Origin | # Population | % Population |
| Asia | 1 | 1.6% |
| Eastern Asia | 1 | 1.6% |
| Europe | 1 | 1.6% |
| Korea | 1 | 1.6% |
| Netherlands | 1 | 1.6% |
| Western Europe | 1 | 1.6% | View All 6 Rows |
Sex and Age in New Alluwe
Sex and Age in New Alluwe
The most populous age groups in New Alluwe are 65 to 69 Years (16 | 40.0%) for men and 45 to 49 Years (7 | 29.2%) for women.
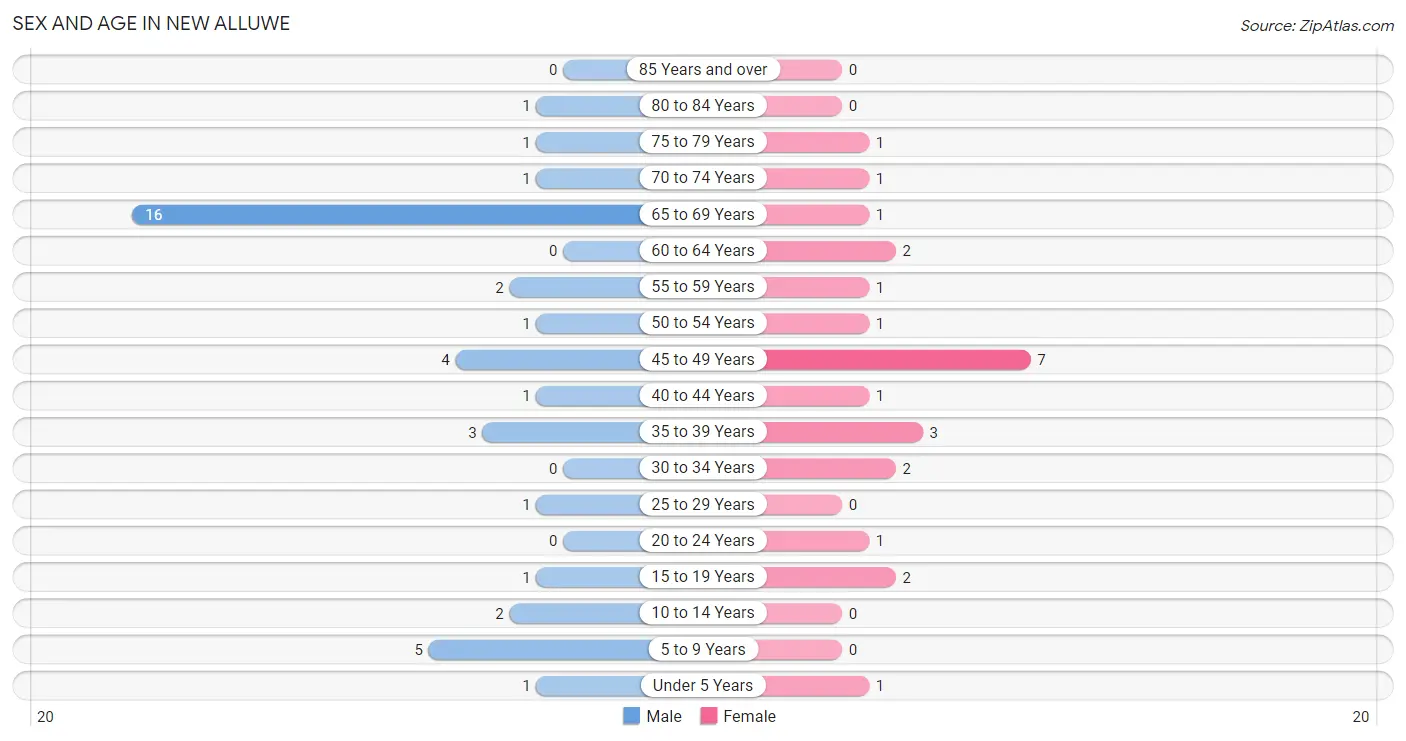
| Age Bracket | Male | Female |
| Under 5 Years | 1 (2.5%) | 1 (4.2%) |
| 5 to 9 Years | 5 (12.5%) | 0 (0.0%) |
| 10 to 14 Years | 2 (5.0%) | 0 (0.0%) |
| 15 to 19 Years | 1 (2.5%) | 2 (8.3%) |
| 20 to 24 Years | 0 (0.0%) | 1 (4.2%) |
| 25 to 29 Years | 1 (2.5%) | 0 (0.0%) |
| 30 to 34 Years | 0 (0.0%) | 2 (8.3%) |
| 35 to 39 Years | 3 (7.5%) | 3 (12.5%) |
| 40 to 44 Years | 1 (2.5%) | 1 (4.2%) |
| 45 to 49 Years | 4 (10.0%) | 7 (29.2%) |
| 50 to 54 Years | 1 (2.5%) | 1 (4.2%) |
| 55 to 59 Years | 2 (5.0%) | 1 (4.2%) |
| 60 to 64 Years | 0 (0.0%) | 2 (8.3%) |
| 65 to 69 Years | 16 (40.0%) | 1 (4.2%) |
| 70 to 74 Years | 1 (2.5%) | 1 (4.2%) |
| 75 to 79 Years | 1 (2.5%) | 1 (4.2%) |
| 80 to 84 Years | 1 (2.5%) | 0 (0.0%) |
| 85 Years and over | 0 (0.0%) | 0 (0.0%) |
| Total | 40 (100.0%) | 24 (100.0%) |
Families and Households in New Alluwe
Median Family Size in New Alluwe
The median family size in New Alluwe is 2.79 persons per family, with married-couple families (8 | 57.1%) accounting for the largest median family size of 3.63 persons per family. On the other hand, single female/mother families (4 | 28.6%) represent the smallest median family size with 1.25 persons per family.
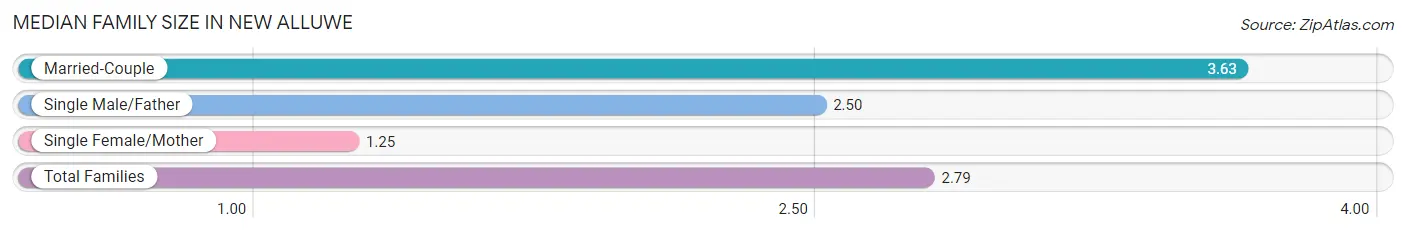
| Family Type | # Families | Family Size |
| Married-Couple | 8 (57.1%) | 3.63 |
| Single Male/Father | 2 (14.3%) | 2.50 |
| Single Female/Mother | 4 (28.6%) | 1.25 |
| Total Families | 14 (100.0%) | 2.79 |
Median Household Size in New Alluwe
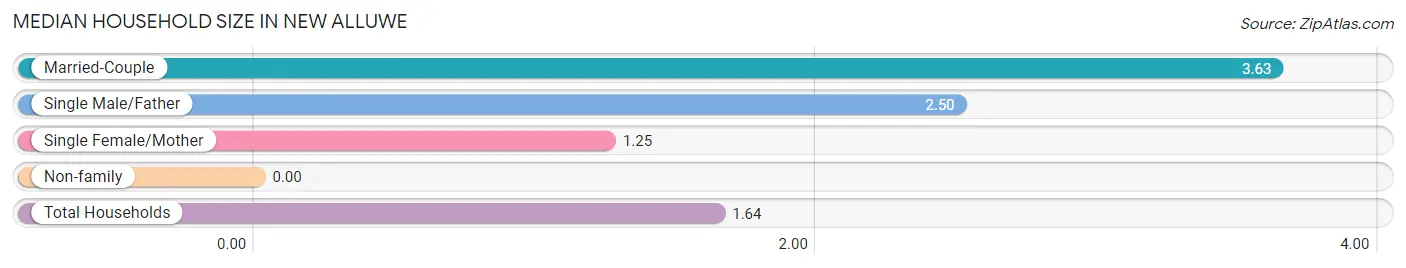
| Household Type | # Households | Household Size |
| Married-Couple | 8 (20.5%) | 3.63 |
| Single Male/Father | 2 (5.1%) | 2.50 |
| Single Female/Mother | 4 (10.3%) | 1.25 |
| Non-family | 25 (64.1%) | - |
| Total Households | 39 (100.0%) | 1.64 |
Household Size by Marriage Status in New Alluwe
Out of a total of 39 households in New Alluwe, 14 (35.9%) are family households, while 25 (64.1%) are nonfamily households. The most numerous type of family households are 2-person households, comprising 9, and the most common type of nonfamily households are 1-person households, comprising 25.
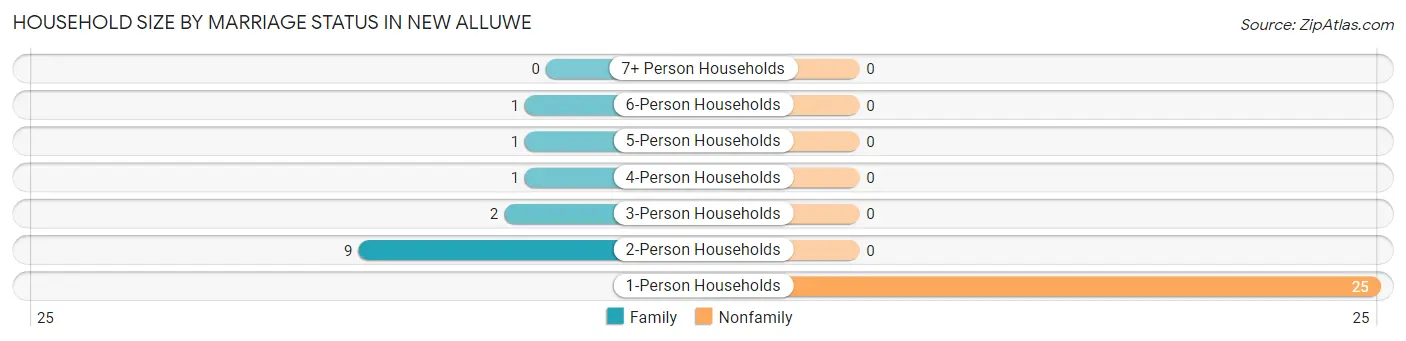
| Household Size | Family Households | Nonfamily Households |
| 1-Person Households | - | 25 (64.1%) |
| 2-Person Households | 9 (23.1%) | 0 (0.0%) |
| 3-Person Households | 2 (5.1%) | 0 (0.0%) |
| 4-Person Households | 1 (2.6%) | 0 (0.0%) |
| 5-Person Households | 1 (2.6%) | 0 (0.0%) |
| 6-Person Households | 1 (2.6%) | 0 (0.0%) |
| 7+ Person Households | 0 (0.0%) | 0 (0.0%) |
| Total | 14 (35.9%) | 25 (64.1%) |
Female Fertility in New Alluwe
Fertility by Age in New Alluwe
| Age Bracket | Women with Births | Births / 1,000 Women |
| 15 to 19 years | 0 (0.0%) | 0.0 |
| 20 to 34 years | 0 (0.0%) | 0.0 |
| 35 to 50 years | 0 (0.0%) | 0.0 |
| Total | 0 (0.0%) | 0.0 |
Fertility by Age by Marriage Status in New Alluwe
| Age Bracket | Married | Unmarried |
| 15 to 19 years | 0 (0.0%) | 0 (0.0%) |
| 20 to 34 years | 0 (0.0%) | 0 (0.0%) |
| 35 to 50 years | 0 (0.0%) | 0 (0.0%) |
| Total | 0 (0.0%) | 0 (0.0%) |
Fertility by Education in New Alluwe
| Educational Attainment | Women with Births | Births / 1,000 Women |
| Less than High School | 0 (0.0%) | 0.0 |
| High School Diploma | 0 (0.0%) | 0.0 |
| College or Associate's Degree | 0 (0.0%) | 0.0 |
| Bachelor's Degree | 0 (0.0%) | 0.0 |
| Graduate Degree | 0 (0.0%) | 0.0 |
| Total | 0 (0.0%) | 0.0 |
Fertility by Education by Marriage Status in New Alluwe
| Educational Attainment | Married | Unmarried |
| Less than High School | 0 (0.0%) | 0 (0.0%) |
| High School Diploma | 0 (0.0%) | 0 (0.0%) |
| College or Associate's Degree | 0 (0.0%) | 0 (0.0%) |
| Bachelor's Degree | 0 (0.0%) | 0 (0.0%) |
| Graduate Degree | 0 (0.0%) | 0 (0.0%) |
| Total | 0 (0.0%) | 0 (0.0%) |
Employment Characteristics in New Alluwe
Employment by Class of Employer in New Alluwe
Among the 21 employed individuals in New Alluwe, private company employees (16 | 76.2%), self-employed (not incorporated) (3 | 14.3%), and self-employed (incorporated) (1 | 4.8%) make up the most common classes of employment.
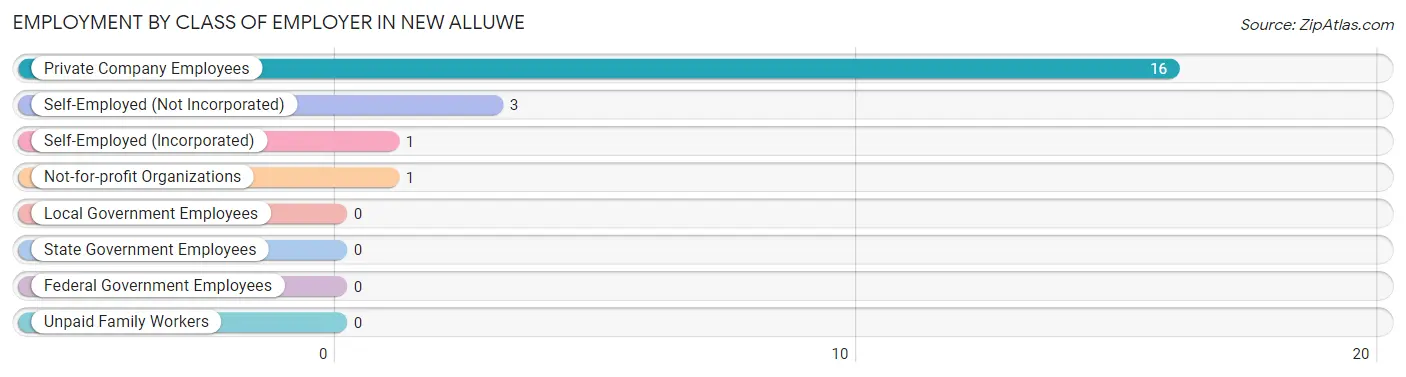
| Employer Class | # Employees | % Employees |
| Private Company Employees | 16 | 76.2% |
| Self-Employed (Incorporated) | 1 | 4.8% |
| Self-Employed (Not Incorporated) | 3 | 14.3% |
| Not-for-profit Organizations | 1 | 4.8% |
| Local Government Employees | 0 | 0.0% |
| State Government Employees | 0 | 0.0% |
| Federal Government Employees | 0 | 0.0% |
| Unpaid Family Workers | 0 | 0.0% |
| Total | 21 | 100.0% |
Employment Status by Age in New Alluwe
According to the labor force statistics for New Alluwe, out of the total population over 16 years of age (55), 41.8% or 23 individuals are in the labor force, with 8.7% or 2 of them unemployed. The age group with the highest labor force participation rate is 20 to 24 years, with 100.0% or 1 individuals in the labor force. Within the labor force, the 35 to 44 years age range has the highest percentage of unemployed individuals, with 25.0% or 2 of them being unemployed.
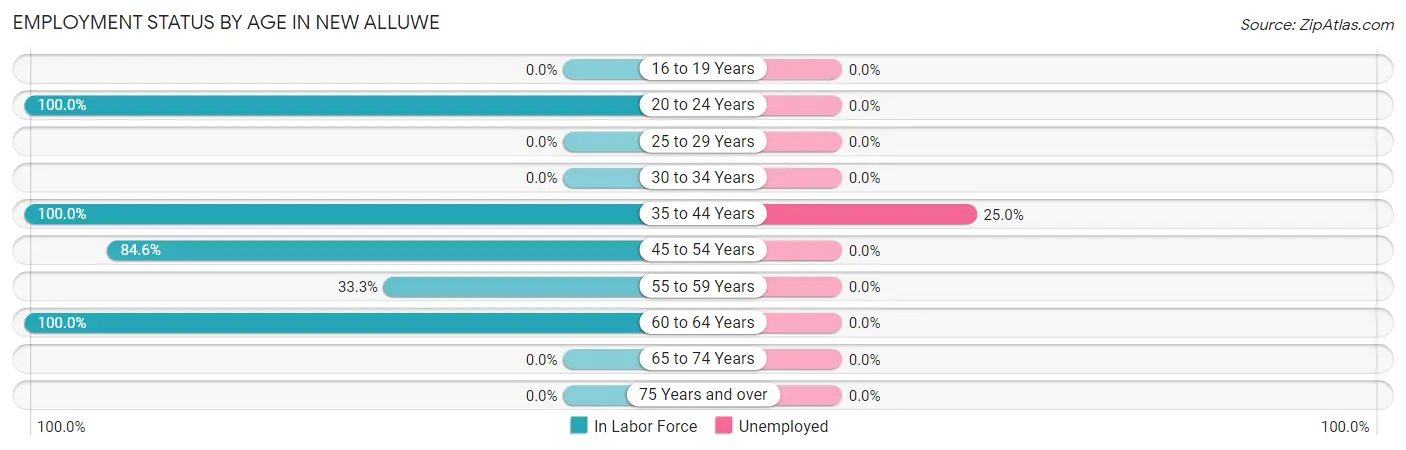
| Age Bracket | In Labor Force | Unemployed |
| 16 to 19 Years | 0 (0.0%) | 0 (0.0%) |
| 20 to 24 Years | 1 (100.0%) | 0 (0.0%) |
| 25 to 29 Years | 0 (0.0%) | 0 (0.0%) |
| 30 to 34 Years | 0 (0.0%) | 0 (0.0%) |
| 35 to 44 Years | 8 (100.0%) | 2 (25.0%) |
| 45 to 54 Years | 11 (84.6%) | 0 (0.0%) |
| 55 to 59 Years | 1 (33.3%) | 0 (0.0%) |
| 60 to 64 Years | 2 (100.0%) | 0 (0.0%) |
| 65 to 74 Years | 0 (0.0%) | 0 (0.0%) |
| 75 Years and over | 0 (0.0%) | 0 (0.0%) |
| Total | 23 (41.8%) | 2 (8.7%) |
Employment Status by Educational Attainment in New Alluwe
According to labor force statistics for New Alluwe, 75.9% of individuals (22) out of the total population between 25 and 64 years of age (29) are in the labor force, with 9.1% or 2 of them being unemployed. The group with the highest labor force participation rate are those with the educational attainment of bachelor's degree or higher, with 100.0% or 2 individuals in the labor force. Within the labor force, individuals with less than high school education have the highest percentage of unemployment, with 100.0% or 2 of them being unemployed.
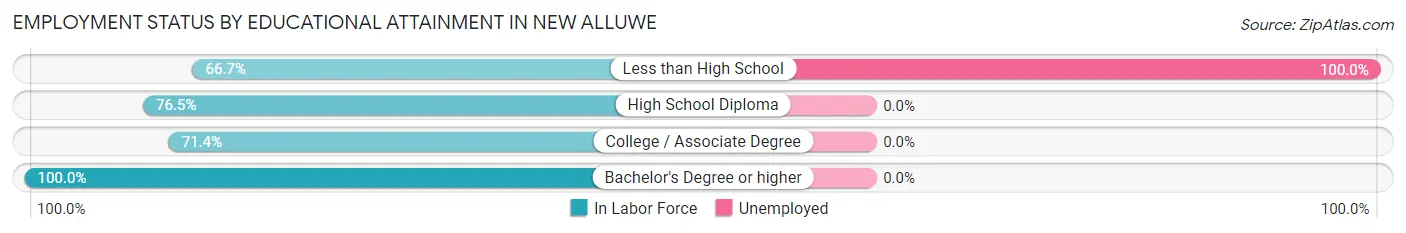
| Educational Attainment | In Labor Force | Unemployed |
| Less than High School | 2 (66.7%) | 3 (100.0%) |
| High School Diploma | 13 (76.5%) | 0 (0.0%) |
| College / Associate Degree | 5 (71.4%) | 0 (0.0%) |
| Bachelor's Degree or higher | 2 (100.0%) | 0 (0.0%) |
| Total | 22 (75.9%) | 3 (9.1%) |
Employment Occupations by Sex in New Alluwe
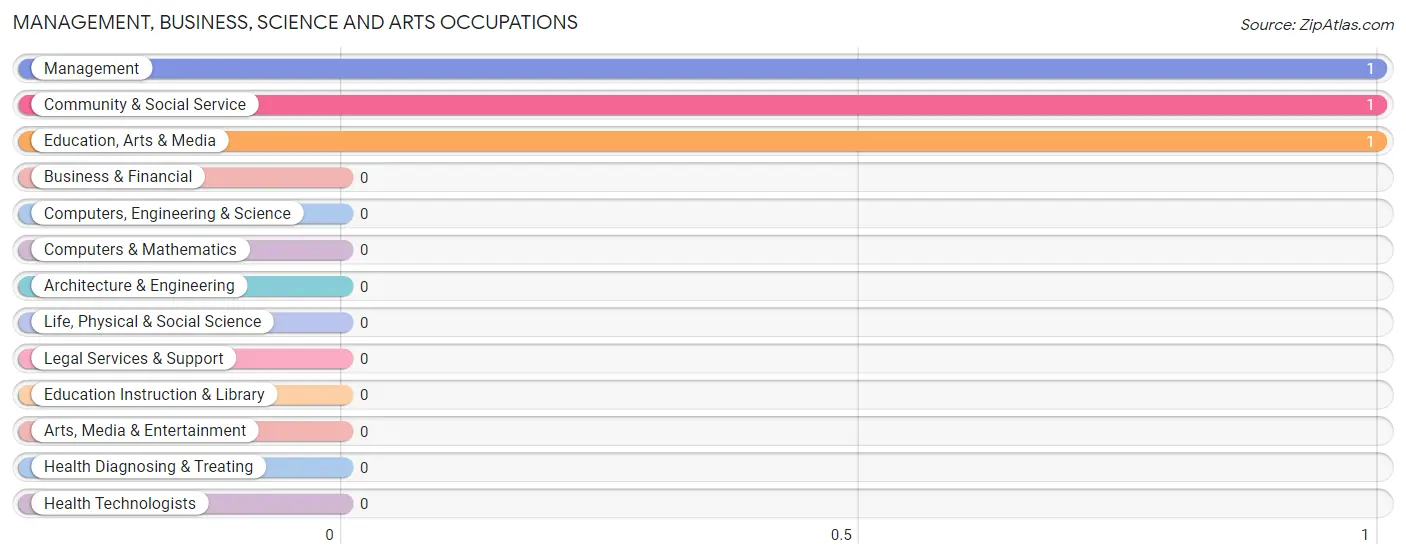
Management, Business, Science and Arts Occupations
The most common Management, Business, Science and Arts occupations in New Alluwe are Management (1 | 4.8%), Community & Social Service (1 | 4.8%), and Education, Arts & Media (1 | 4.8%).
Management, Business, Science and Arts Occupations by Sex
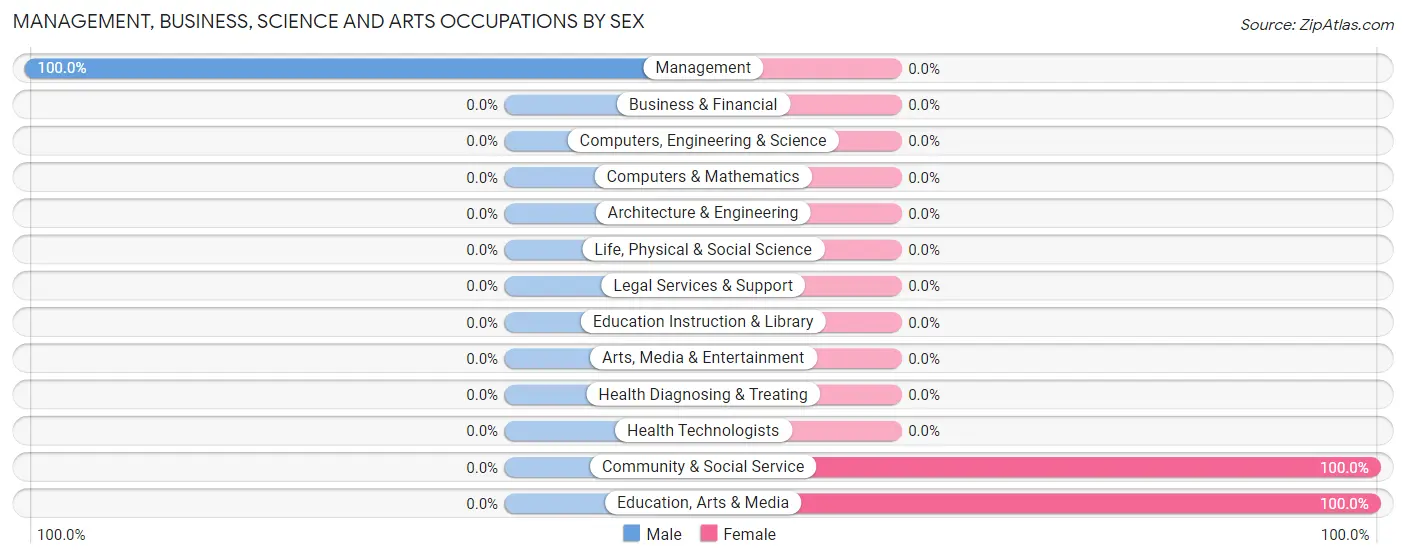
| Occupation | Male | Female |
| Management | 1 (100.0%) | 0 (0.0%) |
| Business & Financial | 0 (0.0%) | 0 (0.0%) |
| Computers, Engineering & Science | 0 (0.0%) | 0 (0.0%) |
| Computers & Mathematics | 0 (0.0%) | 0 (0.0%) |
| Architecture & Engineering | 0 (0.0%) | 0 (0.0%) |
| Life, Physical & Social Science | 0 (0.0%) | 0 (0.0%) |
| Community & Social Service | 0 (0.0%) | 1 (100.0%) |
| Education, Arts & Media | 0 (0.0%) | 1 (100.0%) |
| Legal Services & Support | 0 (0.0%) | 0 (0.0%) |
| Education Instruction & Library | 0 (0.0%) | 0 (0.0%) |
| Arts, Media & Entertainment | 0 (0.0%) | 0 (0.0%) |
| Health Diagnosing & Treating | 0 (0.0%) | 0 (0.0%) |
| Health Technologists | 0 (0.0%) | 0 (0.0%) |
| Total (Category) | 1 (50.0%) | 1 (50.0%) |
| Total (Overall) | 6 (28.6%) | 15 (71.4%) |
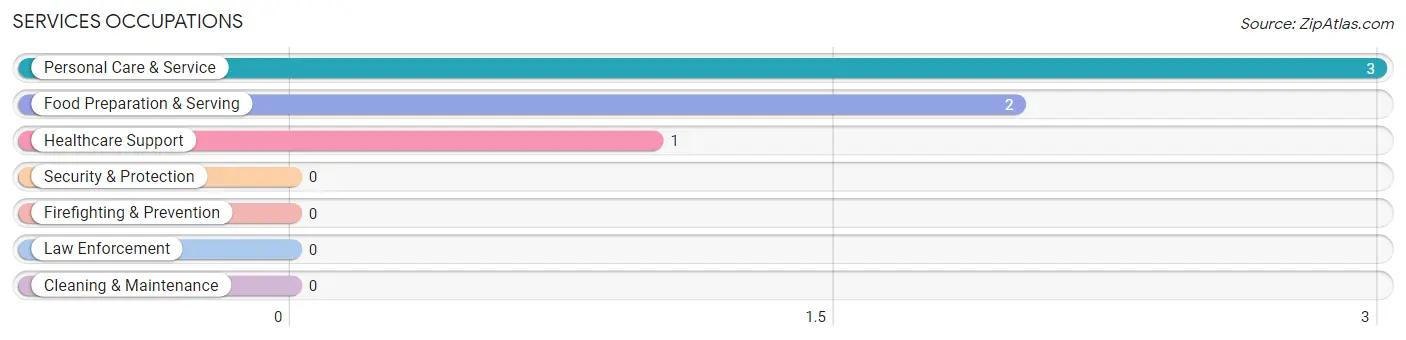
Services Occupations
The most common Services occupations in New Alluwe are Personal Care & Service (3 | 14.3%), Food Preparation & Serving (2 | 9.5%), and Healthcare Support (1 | 4.8%).
Services Occupations by Sex
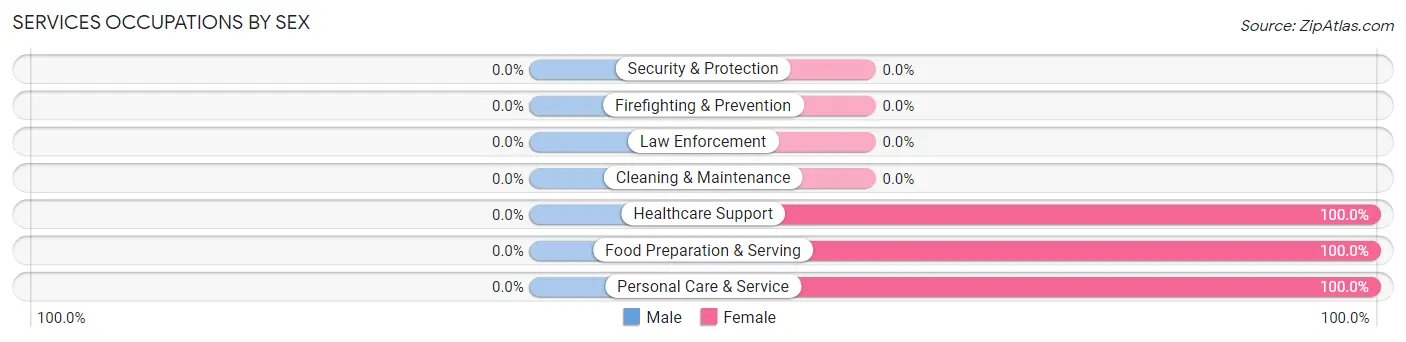
| Occupation | Male | Female |
| Healthcare Support | 0 (0.0%) | 1 (100.0%) |
| Security & Protection | 0 (0.0%) | 0 (0.0%) |
| Firefighting & Prevention | 0 (0.0%) | 0 (0.0%) |
| Law Enforcement | 0 (0.0%) | 0 (0.0%) |
| Food Preparation & Serving | 0 (0.0%) | 2 (100.0%) |
| Cleaning & Maintenance | 0 (0.0%) | 0 (0.0%) |
| Personal Care & Service | 0 (0.0%) | 3 (100.0%) |
| Total (Category) | 0 (0.0%) | 6 (100.0%) |
| Total (Overall) | 6 (28.6%) | 15 (71.4%) |
Sales and Office Occupations
The most common Sales and Office occupations in New Alluwe are Office & Administration (2 | 9.5%), and Sales & Related (1 | 4.8%).

Sales and Office Occupations by Sex
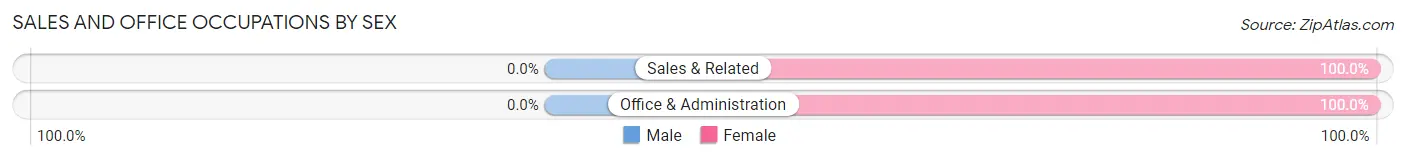
| Occupation | Male | Female |
| Sales & Related | 0 (0.0%) | 1 (100.0%) |
| Office & Administration | 0 (0.0%) | 2 (100.0%) |
| Total (Category) | 0 (0.0%) | 3 (100.0%) |
| Total (Overall) | 6 (28.6%) | 15 (71.4%) |
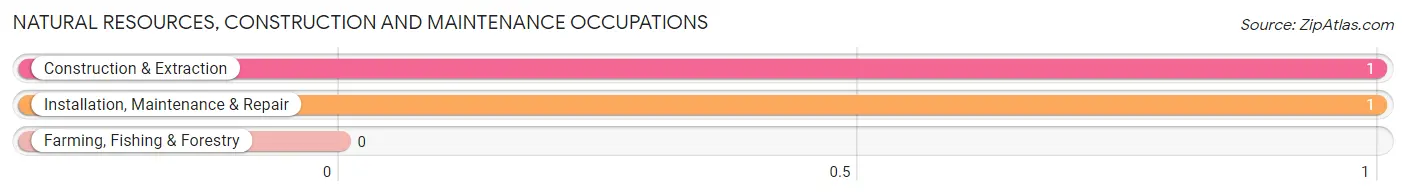
Natural Resources, Construction and Maintenance Occupations
The most common Natural Resources, Construction and Maintenance occupations in New Alluwe are Construction & Extraction (1 | 4.8%), and Installation, Maintenance & Repair (1 | 4.8%).
Natural Resources, Construction and Maintenance Occupations by Sex
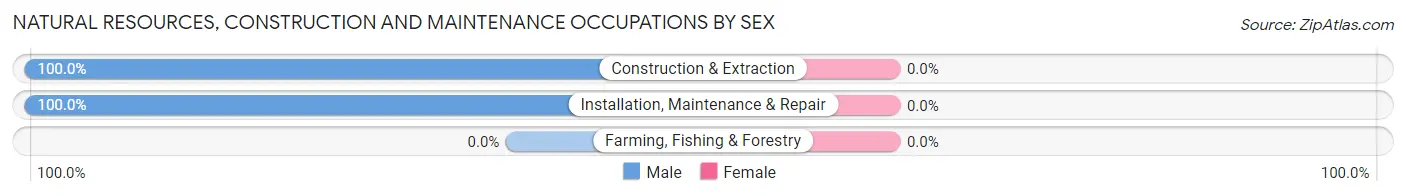
| Occupation | Male | Female |
| Farming, Fishing & Forestry | 0 (0.0%) | 0 (0.0%) |
| Construction & Extraction | 1 (100.0%) | 0 (0.0%) |
| Installation, Maintenance & Repair | 1 (100.0%) | 0 (0.0%) |
| Total (Category) | 2 (100.0%) | 0 (0.0%) |
| Total (Overall) | 6 (28.6%) | 15 (71.4%) |
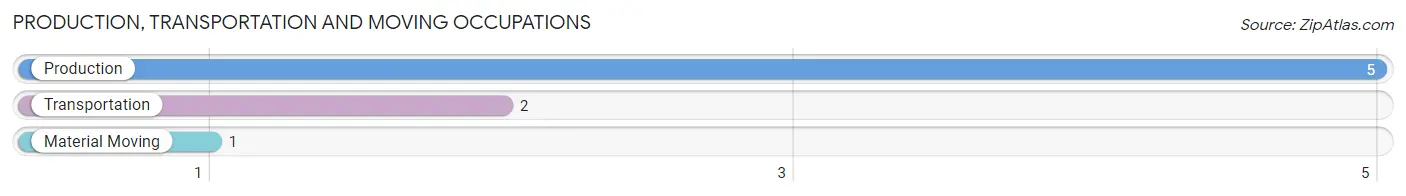
Production, Transportation and Moving Occupations
The most common Production, Transportation and Moving occupations in New Alluwe are Production (5 | 23.8%), Transportation (2 | 9.5%), and Material Moving (1 | 4.8%).
Production, Transportation and Moving Occupations by Sex
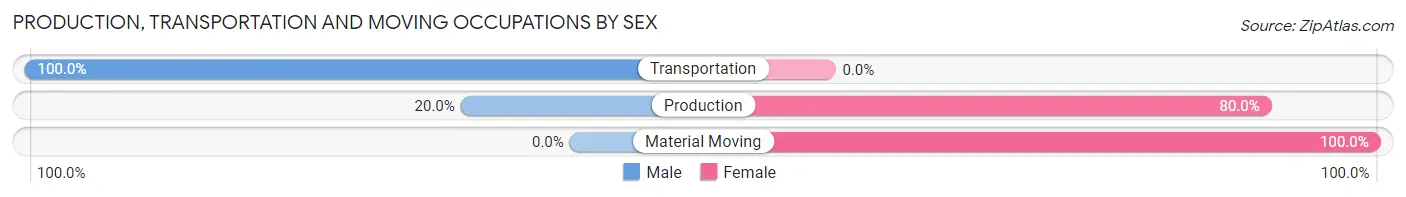
| Occupation | Male | Female |
| Production | 1 (20.0%) | 4 (80.0%) |
| Transportation | 2 (100.0%) | 0 (0.0%) |
| Material Moving | 0 (0.0%) | 1 (100.0%) |
| Total (Category) | 3 (37.5%) | 5 (62.5%) |
| Total (Overall) | 6 (28.6%) | 15 (71.4%) |
Employment Industries by Sex in New Alluwe
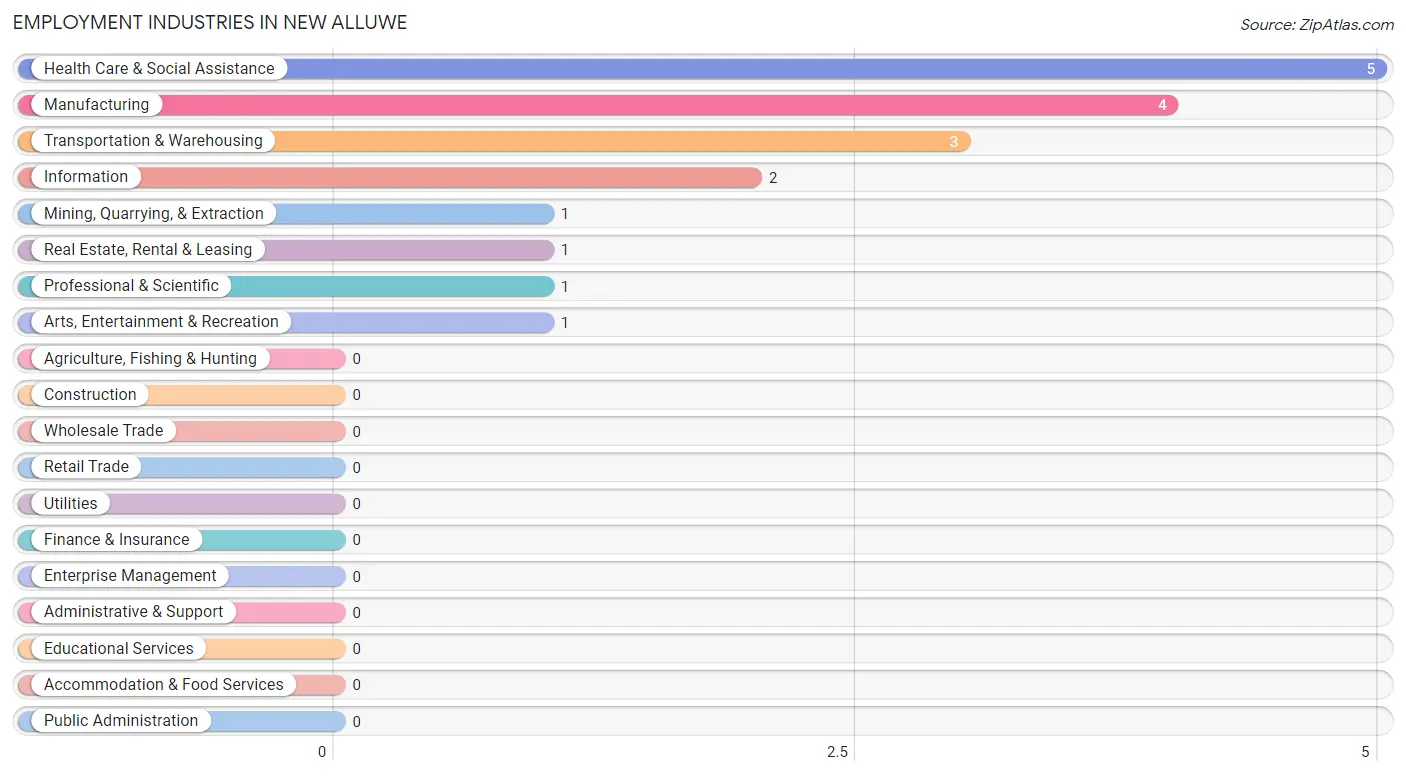
Employment Industries in New Alluwe
The major employment industries in New Alluwe include Health Care & Social Assistance (5 | 23.8%), Manufacturing (4 | 19.1%), Transportation & Warehousing (3 | 14.3%), Information (2 | 9.5%), and Mining, Quarrying, & Extraction (1 | 4.8%).
Employment Industries by Sex in New Alluwe
The New Alluwe industries that see more men than women are Mining, Quarrying, & Extraction (100.0%), Professional & Scientific (100.0%), and Arts, Entertainment & Recreation (100.0%), whereas the industries that tend to have a higher number of women are Manufacturing (100.0%), Information (100.0%), and Real Estate, Rental & Leasing (100.0%).
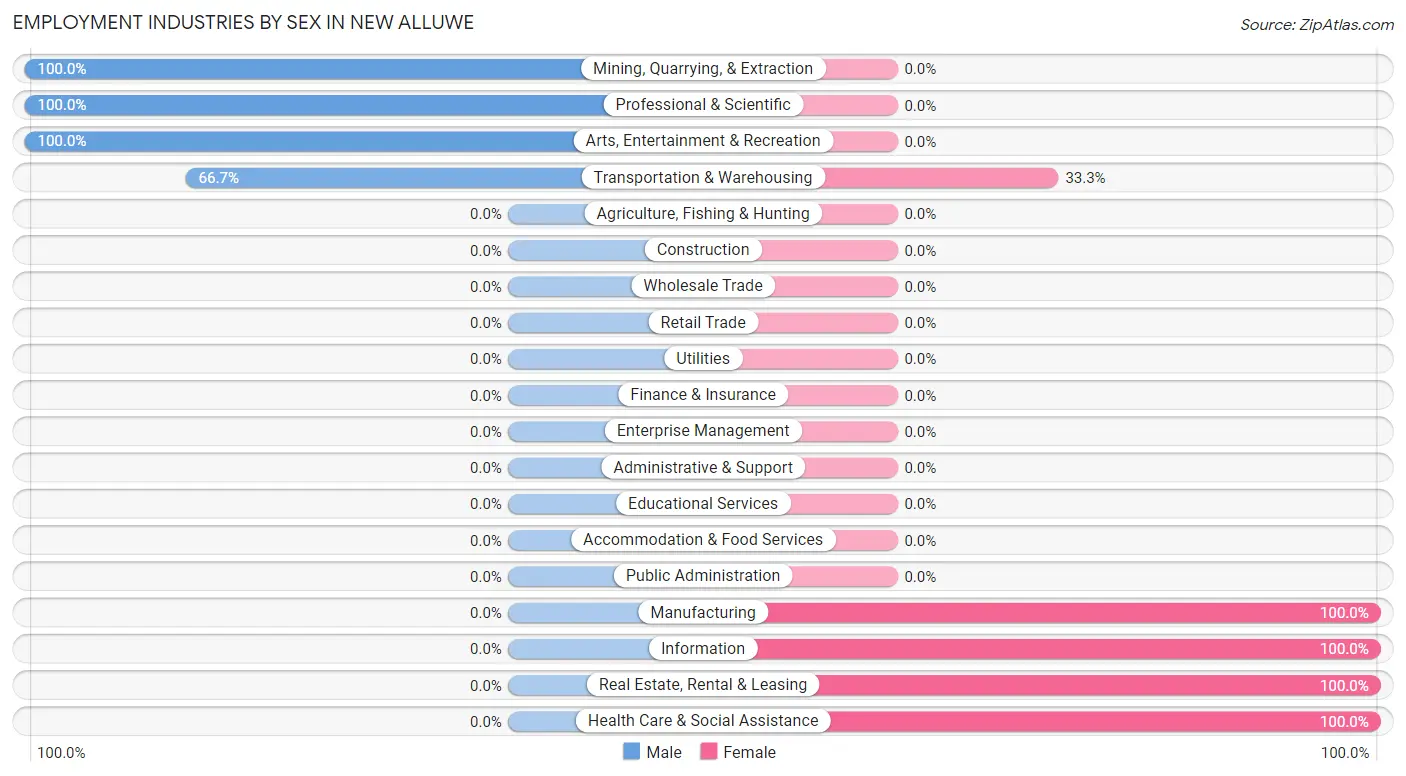
| Industry | Male | Female |
| Agriculture, Fishing & Hunting | 0 (0.0%) | 0 (0.0%) |
| Mining, Quarrying, & Extraction | 1 (100.0%) | 0 (0.0%) |
| Construction | 0 (0.0%) | 0 (0.0%) |
| Manufacturing | 0 (0.0%) | 4 (100.0%) |
| Wholesale Trade | 0 (0.0%) | 0 (0.0%) |
| Retail Trade | 0 (0.0%) | 0 (0.0%) |
| Transportation & Warehousing | 2 (66.7%) | 1 (33.3%) |
| Utilities | 0 (0.0%) | 0 (0.0%) |
| Information | 0 (0.0%) | 2 (100.0%) |
| Finance & Insurance | 0 (0.0%) | 0 (0.0%) |
| Real Estate, Rental & Leasing | 0 (0.0%) | 1 (100.0%) |
| Professional & Scientific | 1 (100.0%) | 0 (0.0%) |
| Enterprise Management | 0 (0.0%) | 0 (0.0%) |
| Administrative & Support | 0 (0.0%) | 0 (0.0%) |
| Educational Services | 0 (0.0%) | 0 (0.0%) |
| Health Care & Social Assistance | 0 (0.0%) | 5 (100.0%) |
| Arts, Entertainment & Recreation | 1 (100.0%) | 0 (0.0%) |
| Accommodation & Food Services | 0 (0.0%) | 0 (0.0%) |
| Public Administration | 0 (0.0%) | 0 (0.0%) |
| Total | 6 (28.6%) | 15 (71.4%) |
Education in New Alluwe
School Enrollment in New Alluwe
The most common levels of schooling among the 10 students in New Alluwe are elementary school (4 | 40.0%), middle school (2 | 20.0%), and high school (2 | 20.0%).
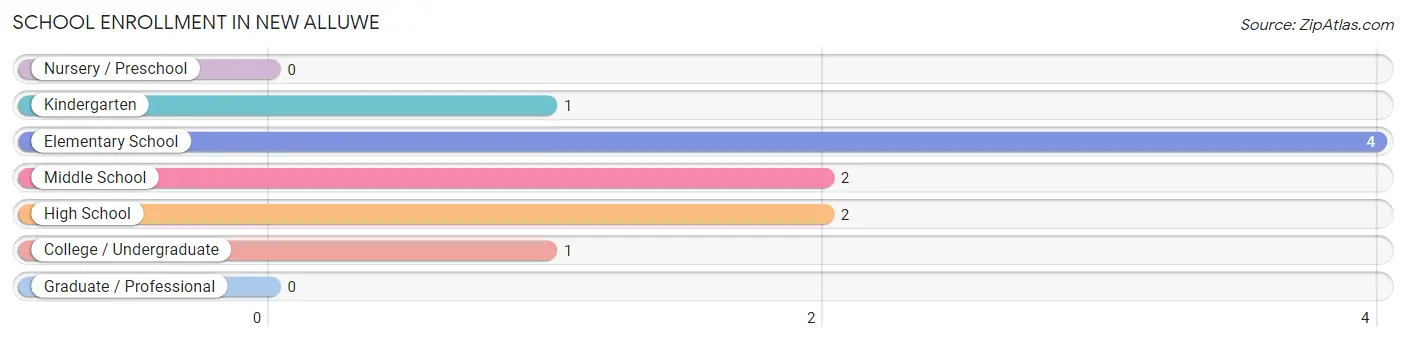
| School Level | # Students | % Students |
| Nursery / Preschool | 0 | 0.0% |
| Kindergarten | 1 | 10.0% |
| Elementary School | 4 | 40.0% |
| Middle School | 2 | 20.0% |
| High School | 2 | 20.0% |
| College / Undergraduate | 1 | 10.0% |
| Graduate / Professional | 0 | 0.0% |
| Total | 10 | 100.0% |
School Enrollment by Age by Funding Source in New Alluwe
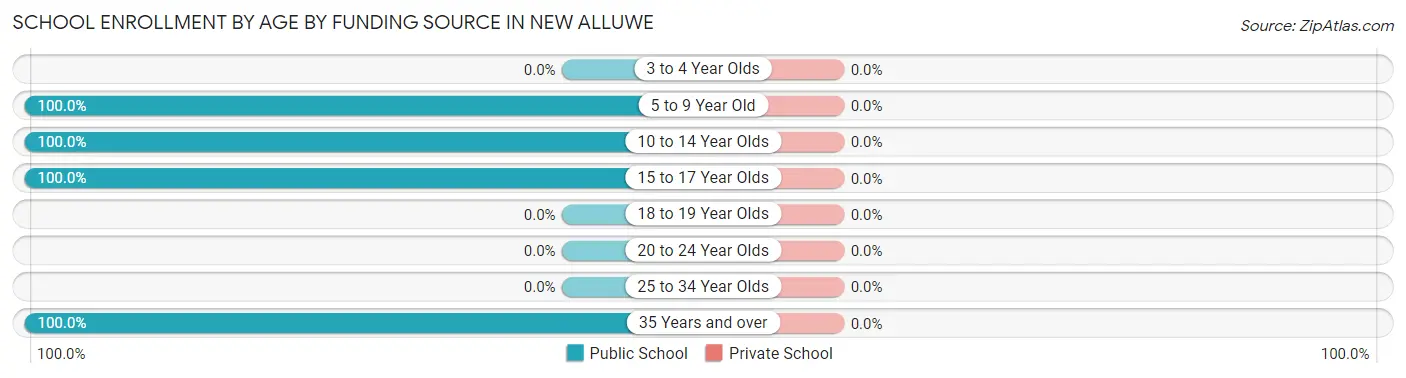
| Age Bracket | Public School | Private School |
| 3 to 4 Year Olds | 0 (0.0%) | 0 (0.0%) |
| 5 to 9 Year Old | 5 (100.0%) | 0 (0.0%) |
| 10 to 14 Year Olds | 2 (100.0%) | 0 (0.0%) |
| 15 to 17 Year Olds | 2 (100.0%) | 0 (0.0%) |
| 18 to 19 Year Olds | 0 (0.0%) | 0 (0.0%) |
| 20 to 24 Year Olds | 0 (0.0%) | 0 (0.0%) |
| 25 to 34 Year Olds | 0 (0.0%) | 0 (0.0%) |
| 35 Years and over | 1 (100.0%) | 0 (0.0%) |
| Total | 10 (100.0%) | 0 (0.0%) |
Educational Attainment by Field of Study in New Alluwe
Psychology (1 | 50.0%), and business (1 | 50.0%) are the most common fields of study among 2 individuals in New Alluwe who have obtained a bachelor's degree or higher.
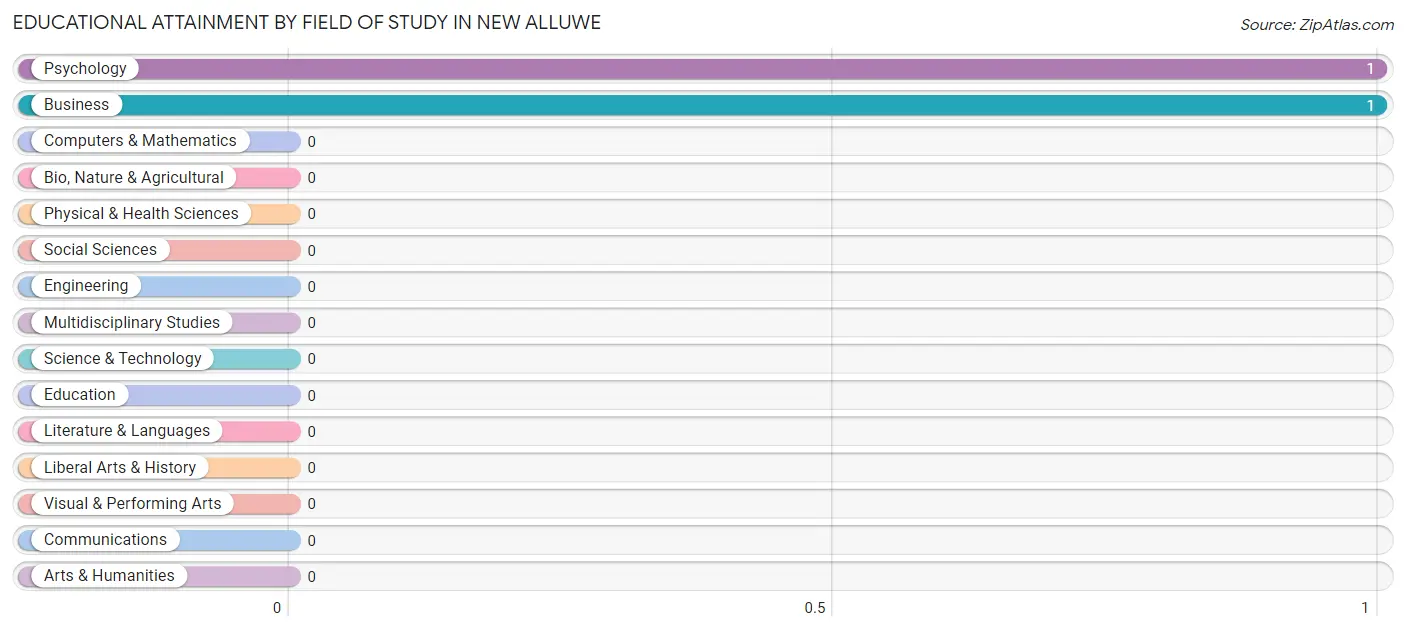
| Field of Study | # Graduates | % Graduates |
| Computers & Mathematics | 0 | 0.0% |
| Bio, Nature & Agricultural | 0 | 0.0% |
| Physical & Health Sciences | 0 | 0.0% |
| Psychology | 1 | 50.0% |
| Social Sciences | 0 | 0.0% |
| Engineering | 0 | 0.0% |
| Multidisciplinary Studies | 0 | 0.0% |
| Science & Technology | 0 | 0.0% |
| Business | 1 | 50.0% |
| Education | 0 | 0.0% |
| Literature & Languages | 0 | 0.0% |
| Liberal Arts & History | 0 | 0.0% |
| Visual & Performing Arts | 0 | 0.0% |
| Communications | 0 | 0.0% |
| Arts & Humanities | 0 | 0.0% |
| Total | 2 | 100.0% |
Transportation & Commute in New Alluwe
Vehicle Availability by Sex in New Alluwe
The most prevalent vehicle ownership categories in New Alluwe are males with 2 vehicles (2, accounting for 33.3%) and females with 2 vehicles (9, making up 13.3%).
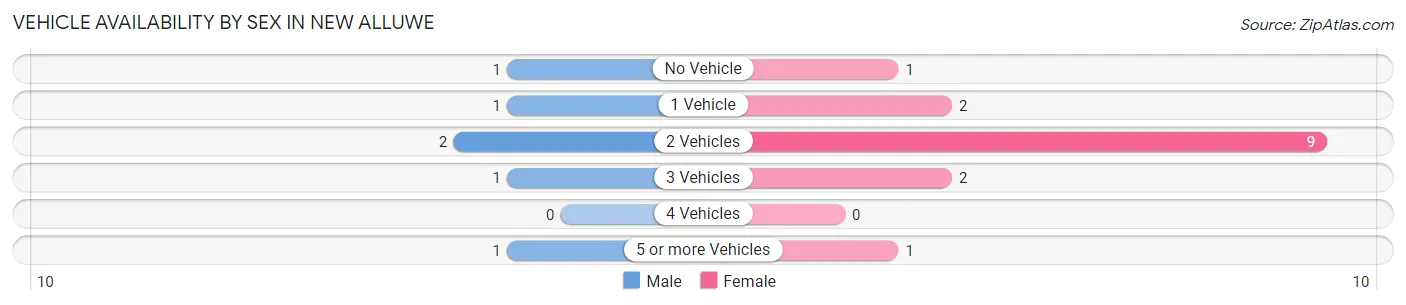
| Vehicles Available | Male | Female |
| No Vehicle | 1 (16.7%) | 1 (6.7%) |
| 1 Vehicle | 1 (16.7%) | 2 (13.3%) |
| 2 Vehicles | 2 (33.3%) | 9 (60.0%) |
| 3 Vehicles | 1 (16.7%) | 2 (13.3%) |
| 4 Vehicles | 0 (0.0%) | 0 (0.0%) |
| 5 or more Vehicles | 1 (16.7%) | 1 (6.7%) |
| Total | 6 (100.0%) | 15 (100.0%) |
Commute Time in New Alluwe
The most frequently occuring commute durations in New Alluwe are 45 to 59 minutes (6 commuters, 31.6%), 60 to 89 minutes (6 commuters, 31.6%), and 5 to 9 minutes (3 commuters, 15.8%).
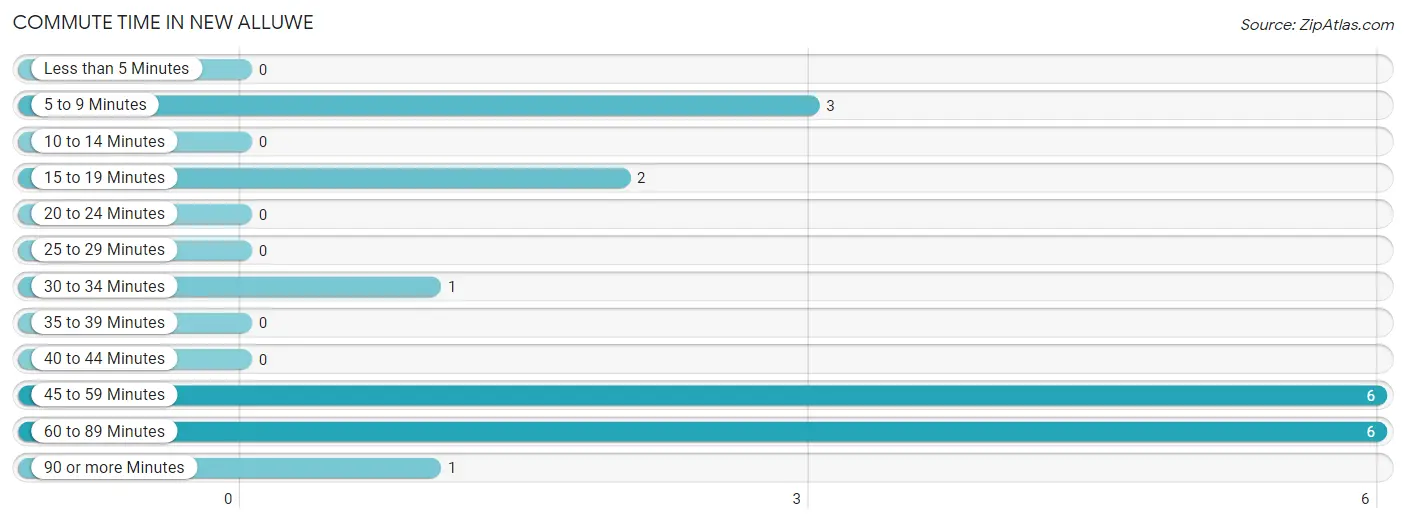
| Commute Time | # Commuters | % Commuters |
| Less than 5 Minutes | 0 | 0.0% |
| 5 to 9 Minutes | 3 | 15.8% |
| 10 to 14 Minutes | 0 | 0.0% |
| 15 to 19 Minutes | 2 | 10.5% |
| 20 to 24 Minutes | 0 | 0.0% |
| 25 to 29 Minutes | 0 | 0.0% |
| 30 to 34 Minutes | 1 | 5.3% |
| 35 to 39 Minutes | 0 | 0.0% |
| 40 to 44 Minutes | 0 | 0.0% |
| 45 to 59 Minutes | 6 | 31.6% |
| 60 to 89 Minutes | 6 | 31.6% |
| 90 or more Minutes | 1 | 5.3% |
Commute Time by Sex in New Alluwe
The most common commute times in New Alluwe are 5 to 9 minutes (3 commuters, 50.0%) for males and 60 to 89 minutes (6 commuters, 46.2%) for females.
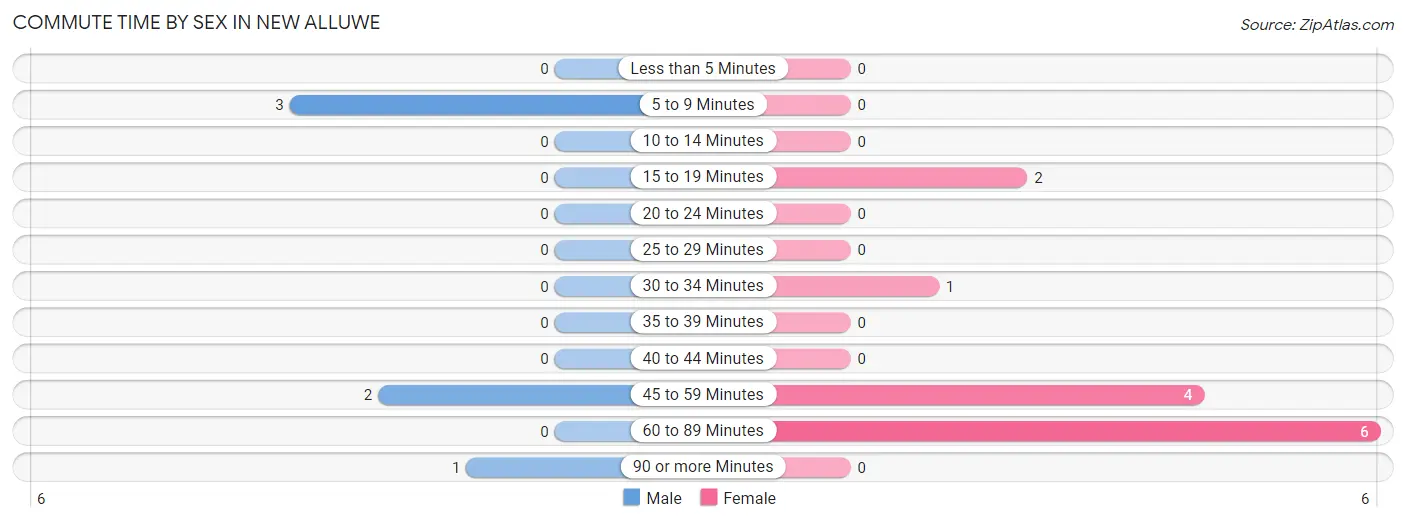
| Commute Time | Male | Female |
| Less than 5 Minutes | 0 (0.0%) | 0 (0.0%) |
| 5 to 9 Minutes | 3 (50.0%) | 0 (0.0%) |
| 10 to 14 Minutes | 0 (0.0%) | 0 (0.0%) |
| 15 to 19 Minutes | 0 (0.0%) | 2 (15.4%) |
| 20 to 24 Minutes | 0 (0.0%) | 0 (0.0%) |
| 25 to 29 Minutes | 0 (0.0%) | 0 (0.0%) |
| 30 to 34 Minutes | 0 (0.0%) | 1 (7.7%) |
| 35 to 39 Minutes | 0 (0.0%) | 0 (0.0%) |
| 40 to 44 Minutes | 0 (0.0%) | 0 (0.0%) |
| 45 to 59 Minutes | 2 (33.3%) | 4 (30.8%) |
| 60 to 89 Minutes | 0 (0.0%) | 6 (46.2%) |
| 90 or more Minutes | 1 (16.7%) | 0 (0.0%) |
Time of Departure to Work by Sex in New Alluwe
The most frequent times of departure to work in New Alluwe are 5:00 AM to 5:29 AM (2, 33.3%) for males and 12:00 AM to 4:59 AM (5, 38.5%) for females.
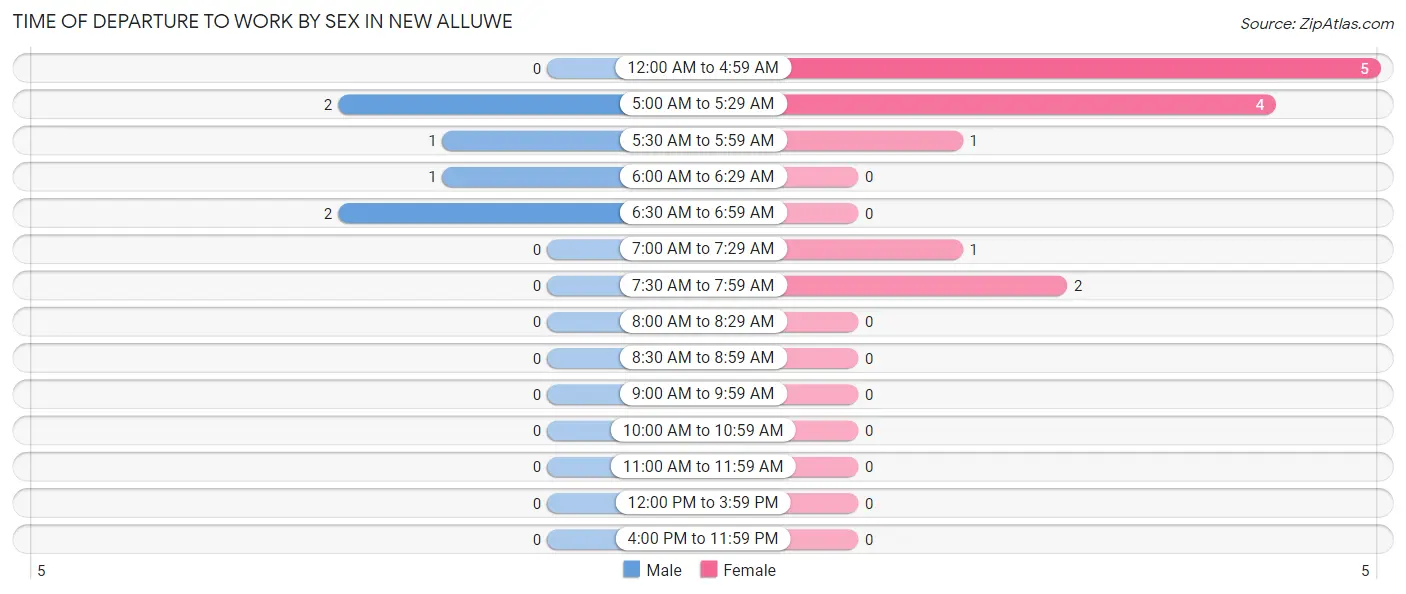
| Time of Departure | Male | Female |
| 12:00 AM to 4:59 AM | 0 (0.0%) | 5 (38.5%) |
| 5:00 AM to 5:29 AM | 2 (33.3%) | 4 (30.8%) |
| 5:30 AM to 5:59 AM | 1 (16.7%) | 1 (7.7%) |
| 6:00 AM to 6:29 AM | 1 (16.7%) | 0 (0.0%) |
| 6:30 AM to 6:59 AM | 2 (33.3%) | 0 (0.0%) |
| 7:00 AM to 7:29 AM | 0 (0.0%) | 1 (7.7%) |
| 7:30 AM to 7:59 AM | 0 (0.0%) | 2 (15.4%) |
| 8:00 AM to 8:29 AM | 0 (0.0%) | 0 (0.0%) |
| 8:30 AM to 8:59 AM | 0 (0.0%) | 0 (0.0%) |
| 9:00 AM to 9:59 AM | 0 (0.0%) | 0 (0.0%) |
| 10:00 AM to 10:59 AM | 0 (0.0%) | 0 (0.0%) |
| 11:00 AM to 11:59 AM | 0 (0.0%) | 0 (0.0%) |
| 12:00 PM to 3:59 PM | 0 (0.0%) | 0 (0.0%) |
| 4:00 PM to 11:59 PM | 0 (0.0%) | 0 (0.0%) |
| Total | 6 (100.0%) | 13 (100.0%) |
Housing Occupancy in New Alluwe
Occupancy by Ownership in New Alluwe
Of the total 39 dwellings in New Alluwe, owner-occupied units account for 19 (48.7%), while renter-occupied units make up 20 (51.3%).
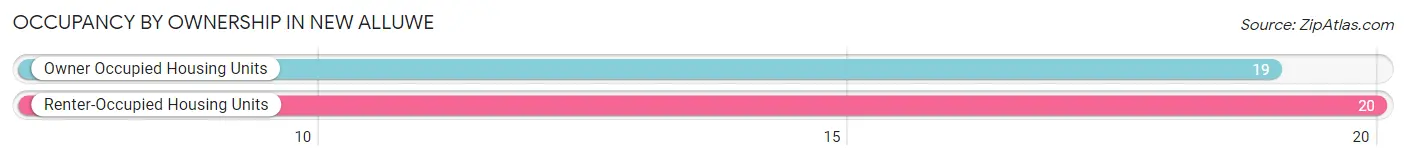
| Occupancy | # Housing Units | % Housing Units |
| Owner Occupied Housing Units | 19 | 48.7% |
| Renter-Occupied Housing Units | 20 | 51.3% |
| Total Occupied Housing Units | 39 | 100.0% |
Occupancy by Household Size in New Alluwe
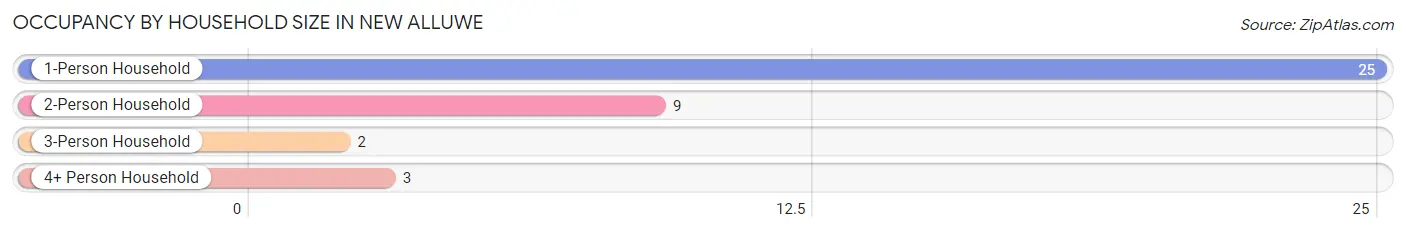
| Household Size | # Housing Units | % Housing Units |
| 1-Person Household | 25 | 64.1% |
| 2-Person Household | 9 | 23.1% |
| 3-Person Household | 2 | 5.1% |
| 4+ Person Household | 3 | 7.7% |
| Total Housing Units | 39 | 100.0% |
Occupancy by Ownership by Household Size in New Alluwe
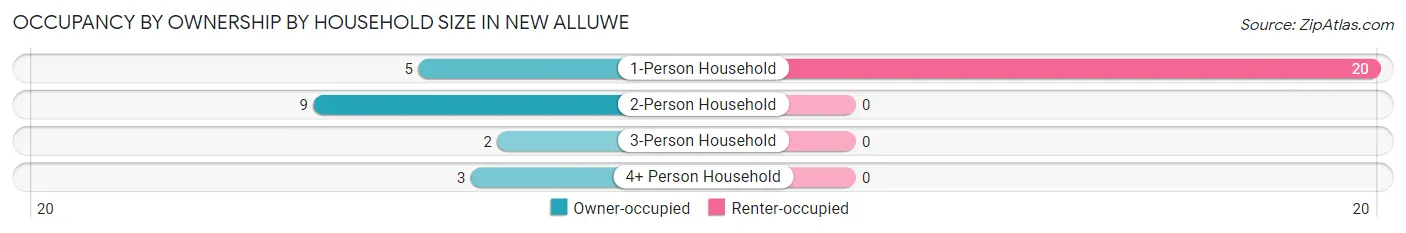
| Household Size | Owner-occupied | Renter-occupied |
| 1-Person Household | 5 (20.0%) | 20 (80.0%) |
| 2-Person Household | 9 (100.0%) | 0 (0.0%) |
| 3-Person Household | 2 (100.0%) | 0 (0.0%) |
| 4+ Person Household | 3 (100.0%) | 0 (0.0%) |
| Total Housing Units | 19 (48.7%) | 20 (51.3%) |
Occupancy by Educational Attainment in New Alluwe
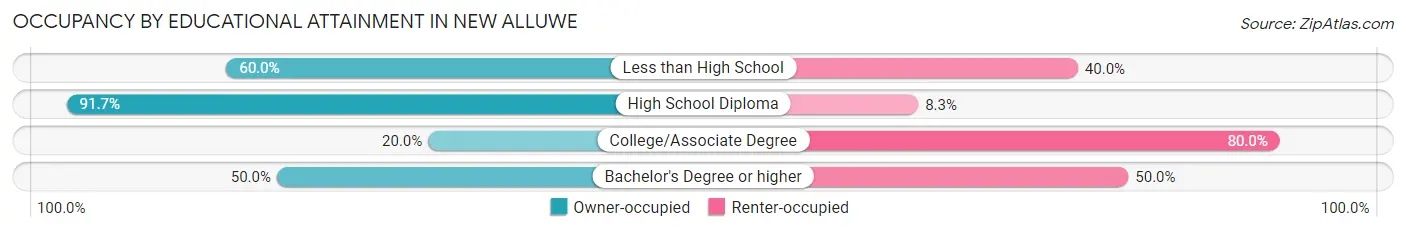
| Household Size | Owner-occupied | Renter-occupied |
| Less than High School | 3 (60.0%) | 2 (40.0%) |
| High School Diploma | 11 (91.7%) | 1 (8.3%) |
| College/Associate Degree | 4 (20.0%) | 16 (80.0%) |
| Bachelor's Degree or higher | 1 (50.0%) | 1 (50.0%) |
Occupancy by Age of Householder in New Alluwe
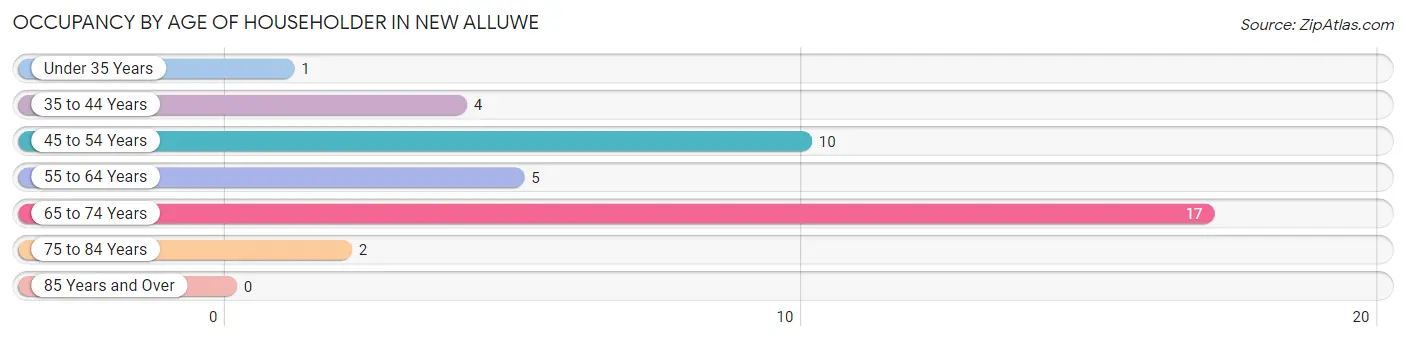
| Age Bracket | # Households | % Households |
| Under 35 Years | 1 | 2.6% |
| 35 to 44 Years | 4 | 10.3% |
| 45 to 54 Years | 10 | 25.6% |
| 55 to 64 Years | 5 | 12.8% |
| 65 to 74 Years | 17 | 43.6% |
| 75 to 84 Years | 2 | 5.1% |
| 85 Years and Over | 0 | 0.0% |
| Total | 39 | 100.0% |
Housing Finances in New Alluwe
Median Income by Occupancy in New Alluwe
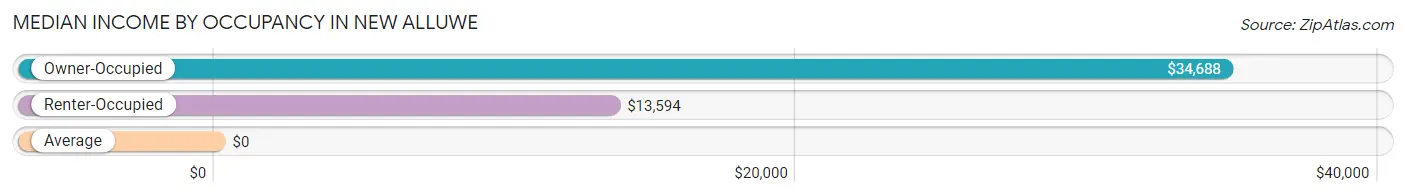
| Occupancy Type | # Households | Median Income |
| Owner-Occupied | 19 (48.7%) | $34,688 |
| Renter-Occupied | 20 (51.3%) | $13,594 |
| Average | 39 (100.0%) | $0 |
Occupancy by Householder Income Bracket in New Alluwe
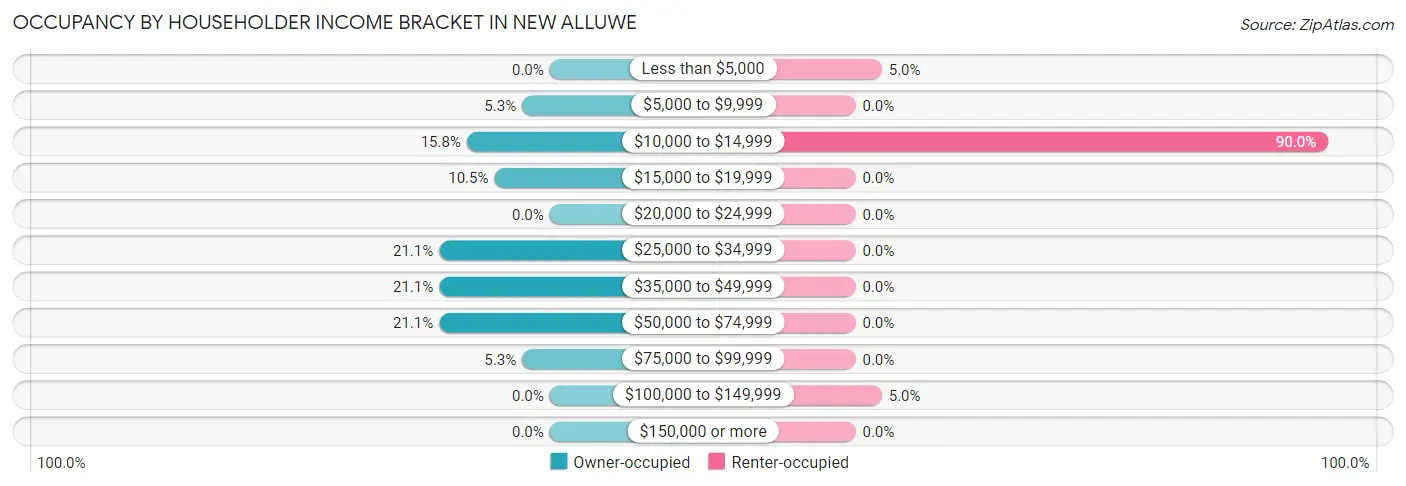
| Income Bracket | Owner-occupied | Renter-occupied |
| Less than $5,000 | 0 (0.0%) | 1 (5.0%) |
| $5,000 to $9,999 | 1 (5.3%) | 0 (0.0%) |
| $10,000 to $14,999 | 3 (15.8%) | 18 (90.0%) |
| $15,000 to $19,999 | 2 (10.5%) | 0 (0.0%) |
| $20,000 to $24,999 | 0 (0.0%) | 0 (0.0%) |
| $25,000 to $34,999 | 4 (21.0%) | 0 (0.0%) |
| $35,000 to $49,999 | 4 (21.0%) | 0 (0.0%) |
| $50,000 to $74,999 | 4 (21.0%) | 0 (0.0%) |
| $75,000 to $99,999 | 1 (5.3%) | 0 (0.0%) |
| $100,000 to $149,999 | 0 (0.0%) | 1 (5.0%) |
| $150,000 or more | 0 (0.0%) | 0 (0.0%) |
| Total | 19 (100.0%) | 20 (100.0%) |
Monthly Housing Cost Tiers in New Alluwe
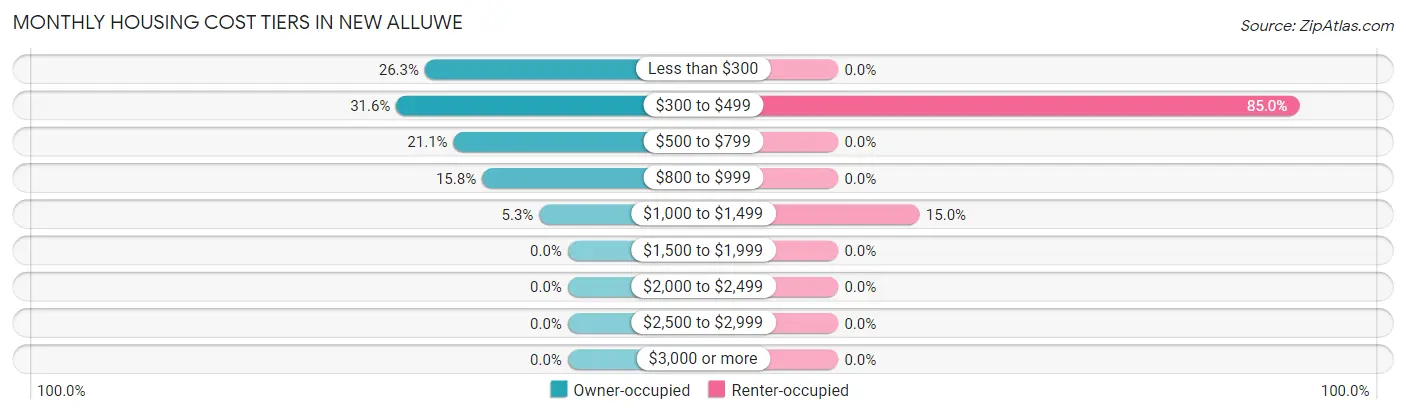
| Monthly Cost | Owner-occupied | Renter-occupied |
| Less than $300 | 5 (26.3%) | 0 (0.0%) |
| $300 to $499 | 6 (31.6%) | 17 (85.0%) |
| $500 to $799 | 4 (21.0%) | 0 (0.0%) |
| $800 to $999 | 3 (15.8%) | 0 (0.0%) |
| $1,000 to $1,499 | 1 (5.3%) | 3 (15.0%) |
| $1,500 to $1,999 | 0 (0.0%) | 0 (0.0%) |
| $2,000 to $2,499 | 0 (0.0%) | 0 (0.0%) |
| $2,500 to $2,999 | 0 (0.0%) | 0 (0.0%) |
| $3,000 or more | 0 (0.0%) | 0 (0.0%) |
| Total | 19 (100.0%) | 20 (100.0%) |
Physical Housing Characteristics in New Alluwe
Housing Structures in New Alluwe
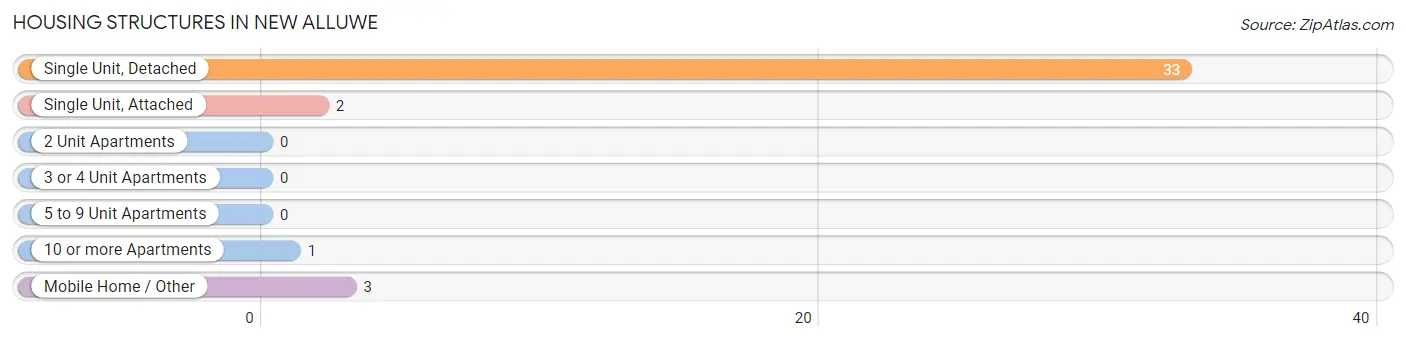
| Structure Type | # Housing Units | % Housing Units |
| Single Unit, Detached | 33 | 84.6% |
| Single Unit, Attached | 2 | 5.1% |
| 2 Unit Apartments | 0 | 0.0% |
| 3 or 4 Unit Apartments | 0 | 0.0% |
| 5 to 9 Unit Apartments | 0 | 0.0% |
| 10 or more Apartments | 1 | 2.6% |
| Mobile Home / Other | 3 | 7.7% |
| Total | 39 | 100.0% |
Housing Structures by Occupancy in New Alluwe
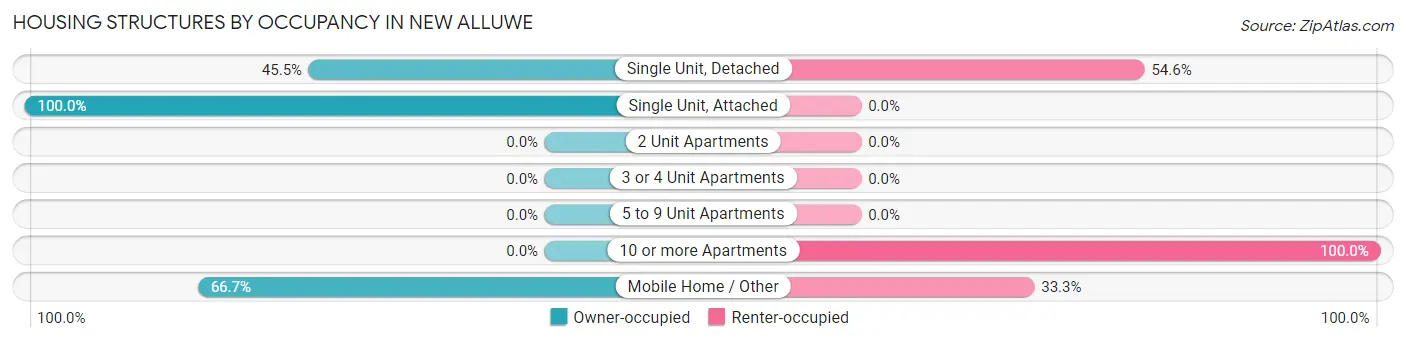
| Structure Type | Owner-occupied | Renter-occupied |
| Single Unit, Detached | 15 (45.5%) | 18 (54.5%) |
| Single Unit, Attached | 2 (100.0%) | 0 (0.0%) |
| 2 Unit Apartments | 0 (0.0%) | 0 (0.0%) |
| 3 or 4 Unit Apartments | 0 (0.0%) | 0 (0.0%) |
| 5 to 9 Unit Apartments | 0 (0.0%) | 0 (0.0%) |
| 10 or more Apartments | 0 (0.0%) | 1 (100.0%) |
| Mobile Home / Other | 2 (66.7%) | 1 (33.3%) |
| Total | 19 (48.7%) | 20 (51.3%) |
Housing Structures by Number of Rooms in New Alluwe
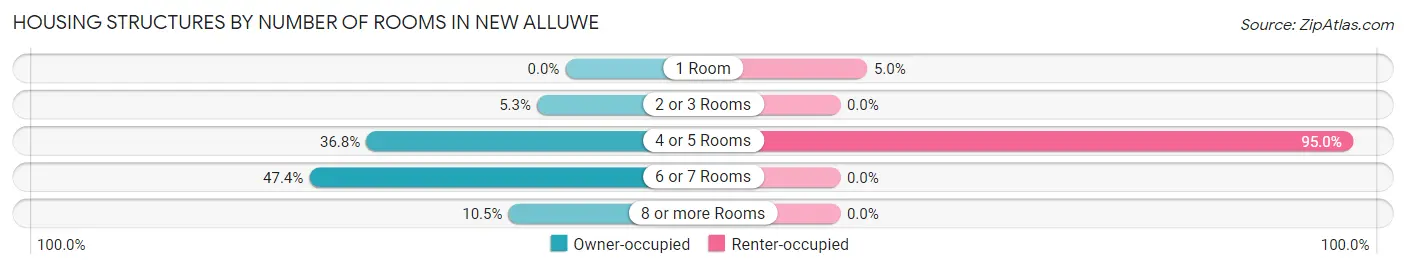
| Number of Rooms | Owner-occupied | Renter-occupied |
| 1 Room | 0 (0.0%) | 1 (5.0%) |
| 2 or 3 Rooms | 1 (5.3%) | 0 (0.0%) |
| 4 or 5 Rooms | 7 (36.8%) | 19 (95.0%) |
| 6 or 7 Rooms | 9 (47.4%) | 0 (0.0%) |
| 8 or more Rooms | 2 (10.5%) | 0 (0.0%) |
| Total | 19 (100.0%) | 20 (100.0%) |
Housing Structure by Heating Type in New Alluwe
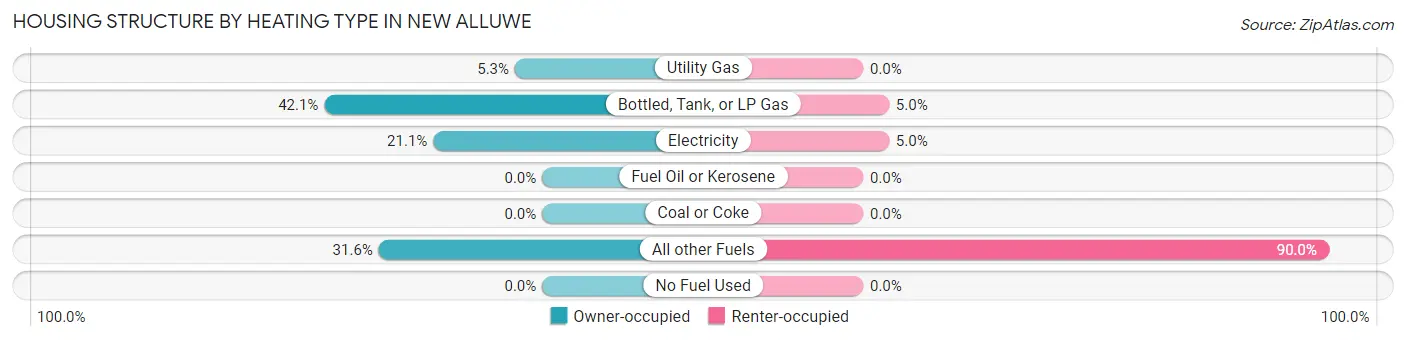
| Heating Type | Owner-occupied | Renter-occupied |
| Utility Gas | 1 (5.3%) | 0 (0.0%) |
| Bottled, Tank, or LP Gas | 8 (42.1%) | 1 (5.0%) |
| Electricity | 4 (21.0%) | 1 (5.0%) |
| Fuel Oil or Kerosene | 0 (0.0%) | 0 (0.0%) |
| Coal or Coke | 0 (0.0%) | 0 (0.0%) |
| All other Fuels | 6 (31.6%) | 18 (90.0%) |
| No Fuel Used | 0 (0.0%) | 0 (0.0%) |
| Total | 19 (100.0%) | 20 (100.0%) |
Household Vehicle Usage in New Alluwe
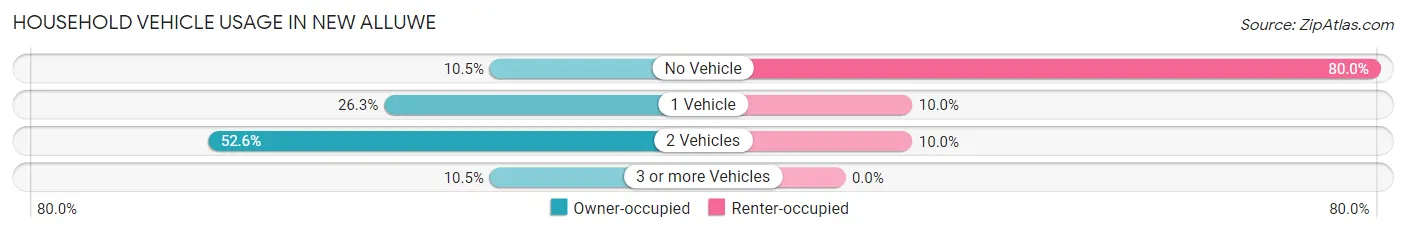
| Vehicles per Household | Owner-occupied | Renter-occupied |
| No Vehicle | 2 (10.5%) | 16 (80.0%) |
| 1 Vehicle | 5 (26.3%) | 2 (10.0%) |
| 2 Vehicles | 10 (52.6%) | 2 (10.0%) |
| 3 or more Vehicles | 2 (10.5%) | 0 (0.0%) |
| Total | 19 (100.0%) | 20 (100.0%) |
Real Estate & Mortgages in New Alluwe
Real Estate and Mortgage Overview in New Alluwe
| Characteristic | Without Mortgage | With Mortgage |
| Housing Units | 15 | 4 |
| Median Property Value | $37,500 | $42,500 |
| Median Household Income | $33,438 | $0 |
| Monthly Housing Costs | $331 | $0 |
| Real Estate Taxes | $199 | $0 |
Property Value by Mortgage Status in New Alluwe
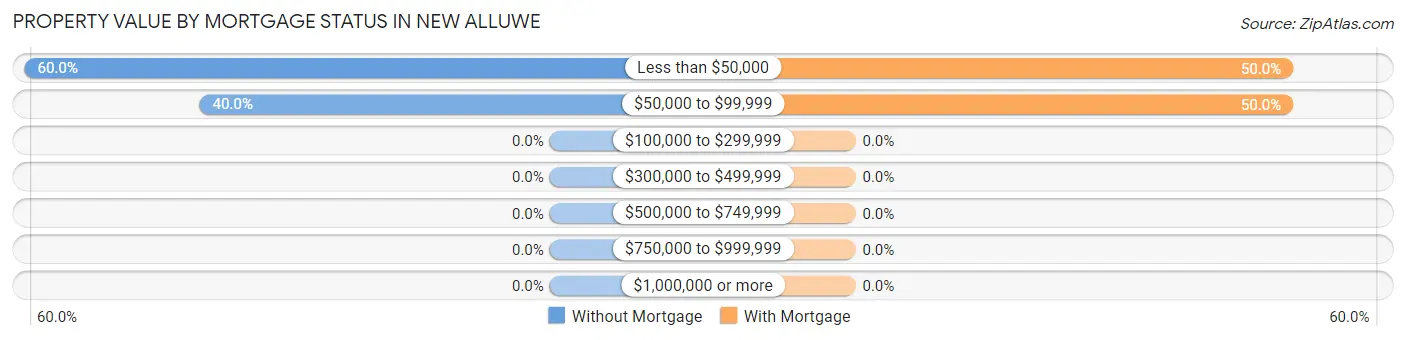
| Property Value | Without Mortgage | With Mortgage |
| Less than $50,000 | 9 (60.0%) | 2 (50.0%) |
| $50,000 to $99,999 | 6 (40.0%) | 2 (50.0%) |
| $100,000 to $299,999 | 0 (0.0%) | 0 (0.0%) |
| $300,000 to $499,999 | 0 (0.0%) | 0 (0.0%) |
| $500,000 to $749,999 | 0 (0.0%) | 0 (0.0%) |
| $750,000 to $999,999 | 0 (0.0%) | 0 (0.0%) |
| $1,000,000 or more | 0 (0.0%) | 0 (0.0%) |
| Total | 15 (100.0%) | 4 (100.0%) |
Household Income by Mortgage Status in New Alluwe
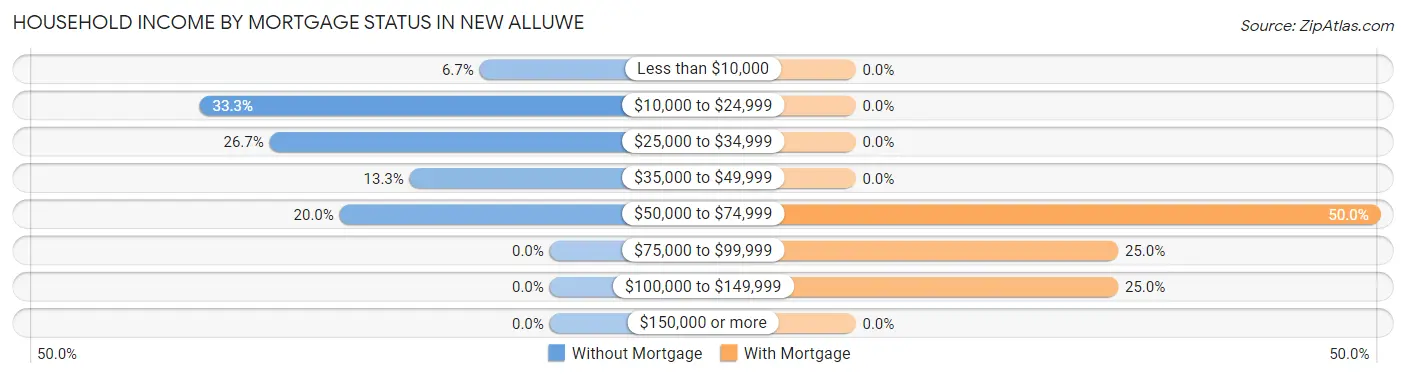
| Household Income | Without Mortgage | With Mortgage |
| Less than $10,000 | 1 (6.7%) | 0 (0.0%) |
| $10,000 to $24,999 | 5 (33.3%) | 0 (0.0%) |
| $25,000 to $34,999 | 4 (26.7%) | 0 (0.0%) |
| $35,000 to $49,999 | 2 (13.3%) | 0 (0.0%) |
| $50,000 to $74,999 | 3 (20.0%) | 2 (50.0%) |
| $75,000 to $99,999 | 0 (0.0%) | 1 (25.0%) |
| $100,000 to $149,999 | 0 (0.0%) | 1 (25.0%) |
| $150,000 or more | 0 (0.0%) | 0 (0.0%) |
| Total | 15 (100.0%) | 4 (100.0%) |
Property Value to Household Income Ratio in New Alluwe
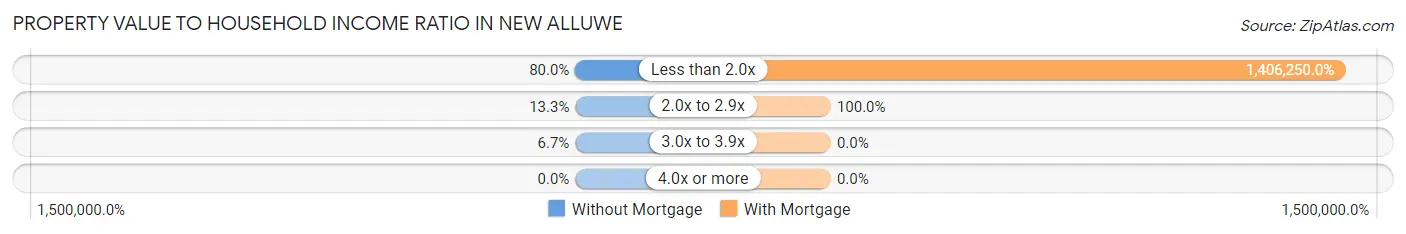
| Value-to-Income Ratio | Without Mortgage | With Mortgage |
| Less than 2.0x | 12 (80.0%) | 56,250 (1,406,250.0%) |
| 2.0x to 2.9x | 2 (13.3%) | 4 (100.0%) |
| 3.0x to 3.9x | 1 (6.7%) | 0 (0.0%) |
| 4.0x or more | 0 (0.0%) | 0 (0.0%) |
| Total | 15 (100.0%) | 4 (100.0%) |
Real Estate Taxes by Mortgage Status in New Alluwe
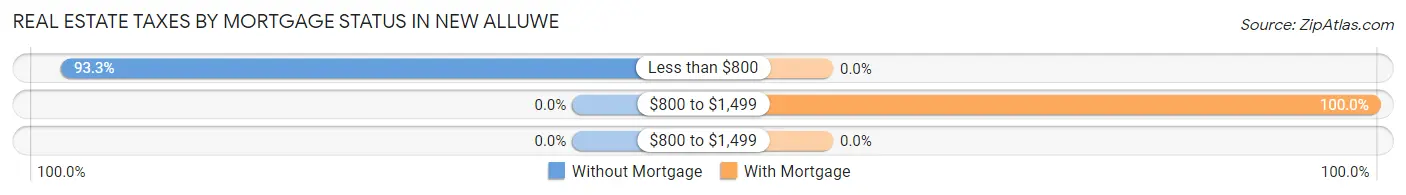
| Property Taxes | Without Mortgage | With Mortgage |
| Less than $800 | 14 (93.3%) | 0 (0.0%) |
| $800 to $1,499 | 0 (0.0%) | 4 (100.0%) |
| $800 to $1,499 | 0 (0.0%) | 0 (0.0%) |
| Total | 15 (100.0%) | 4 (100.0%) |
Health & Disability in New Alluwe
Health Insurance Coverage by Age in New Alluwe
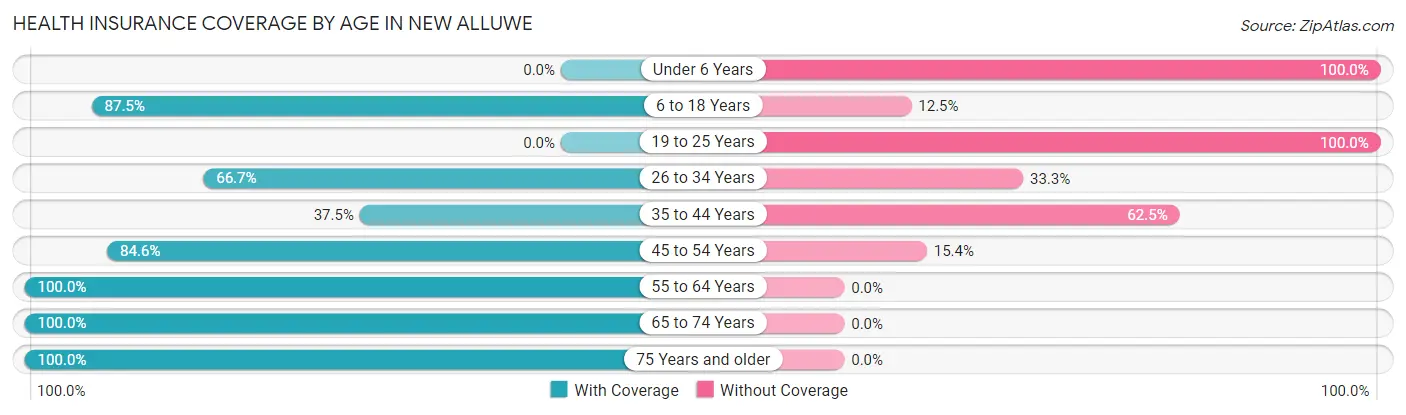
| Age Bracket | With Coverage | Without Coverage |
| Under 6 Years | 0 (0.0%) | 3 (100.0%) |
| 6 to 18 Years | 7 (87.5%) | 1 (12.5%) |
| 19 to 25 Years | 0 (0.0%) | 2 (100.0%) |
| 26 to 34 Years | 2 (66.7%) | 1 (33.3%) |
| 35 to 44 Years | 3 (37.5%) | 5 (62.5%) |
| 45 to 54 Years | 11 (84.6%) | 2 (15.4%) |
| 55 to 64 Years | 5 (100.0%) | 0 (0.0%) |
| 65 to 74 Years | 19 (100.0%) | 0 (0.0%) |
| 75 Years and older | 3 (100.0%) | 0 (0.0%) |
| Total | 50 (78.1%) | 14 (21.9%) |
Health Insurance Coverage by Citizenship Status in New Alluwe
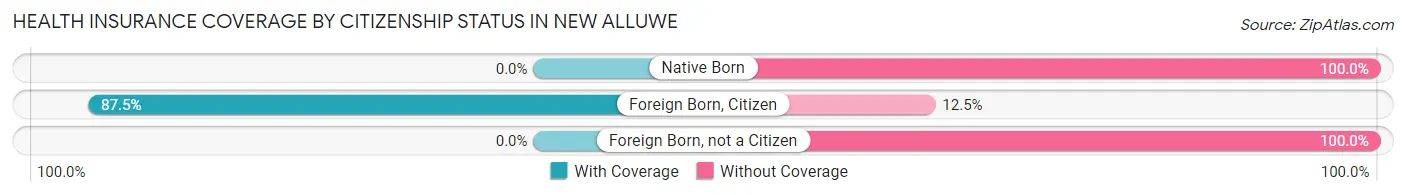
| Citizenship Status | With Coverage | Without Coverage |
| Native Born | 0 (0.0%) | 3 (100.0%) |
| Foreign Born, Citizen | 7 (87.5%) | 1 (12.5%) |
| Foreign Born, not a Citizen | 0 (0.0%) | 2 (100.0%) |
Health Insurance Coverage by Household Income in New Alluwe
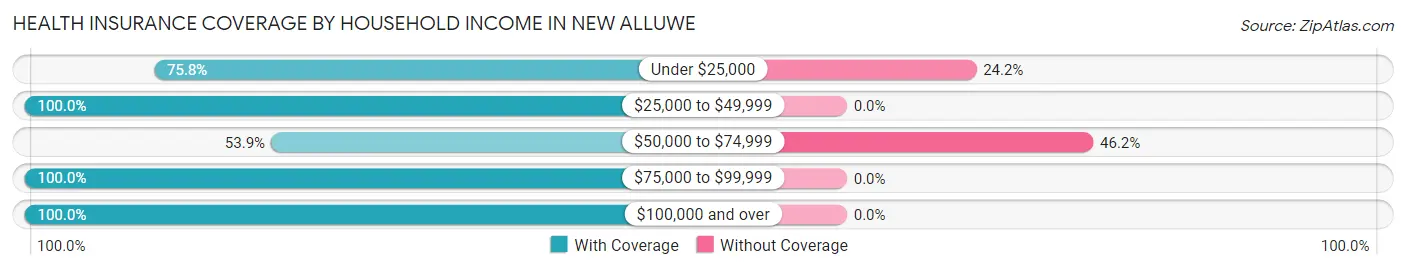
| Household Income | With Coverage | Without Coverage |
| Under $25,000 | 25 (75.8%) | 8 (24.2%) |
| $25,000 to $49,999 | 12 (100.0%) | 0 (0.0%) |
| $50,000 to $74,999 | 7 (53.8%) | 6 (46.2%) |
| $75,000 to $99,999 | 5 (100.0%) | 0 (0.0%) |
| $100,000 and over | 1 (100.0%) | 0 (0.0%) |
Public vs Private Health Insurance Coverage by Age in New Alluwe
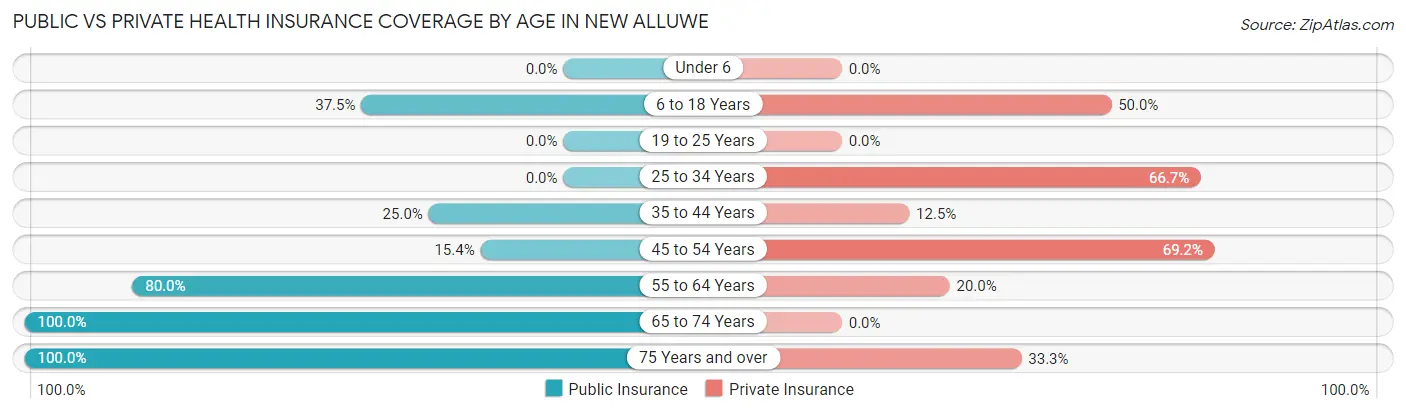
| Age Bracket | Public Insurance | Private Insurance |
| Under 6 | 0 (0.0%) | 0 (0.0%) |
| 6 to 18 Years | 3 (37.5%) | 4 (50.0%) |
| 19 to 25 Years | 0 (0.0%) | 0 (0.0%) |
| 25 to 34 Years | 0 (0.0%) | 2 (66.7%) |
| 35 to 44 Years | 2 (25.0%) | 1 (12.5%) |
| 45 to 54 Years | 2 (15.4%) | 9 (69.2%) |
| 55 to 64 Years | 4 (80.0%) | 1 (20.0%) |
| 65 to 74 Years | 19 (100.0%) | 0 (0.0%) |
| 75 Years and over | 3 (100.0%) | 1 (33.3%) |
| Total | 33 (51.6%) | 18 (28.1%) |
Disability Status by Sex by Age in New Alluwe
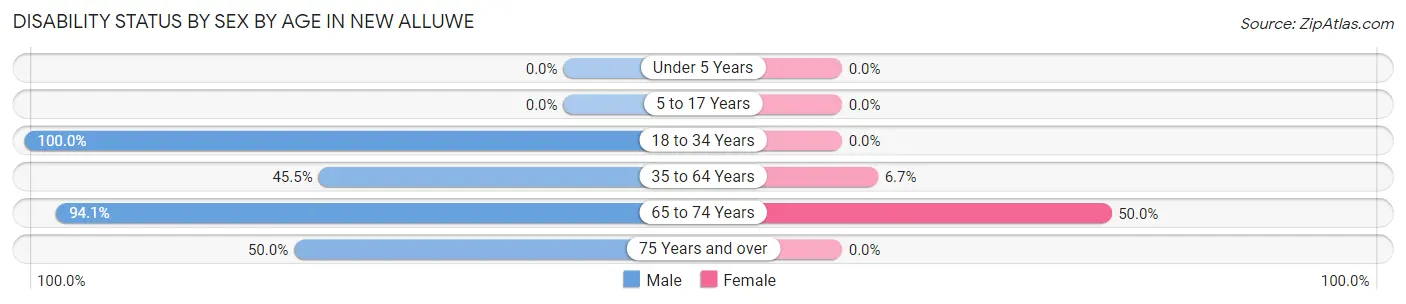
| Age Bracket | Male | Female |
| Under 5 Years | 0 (0.0%) | 0 (0.0%) |
| 5 to 17 Years | 0 (0.0%) | 0 (0.0%) |
| 18 to 34 Years | 2 (100.0%) | 0 (0.0%) |
| 35 to 64 Years | 5 (45.5%) | 1 (6.7%) |
| 65 to 74 Years | 16 (94.1%) | 1 (50.0%) |
| 75 Years and over | 1 (50.0%) | 0 (0.0%) |
Disability Class by Sex by Age in New Alluwe
Disability Class: Hearing Difficulty
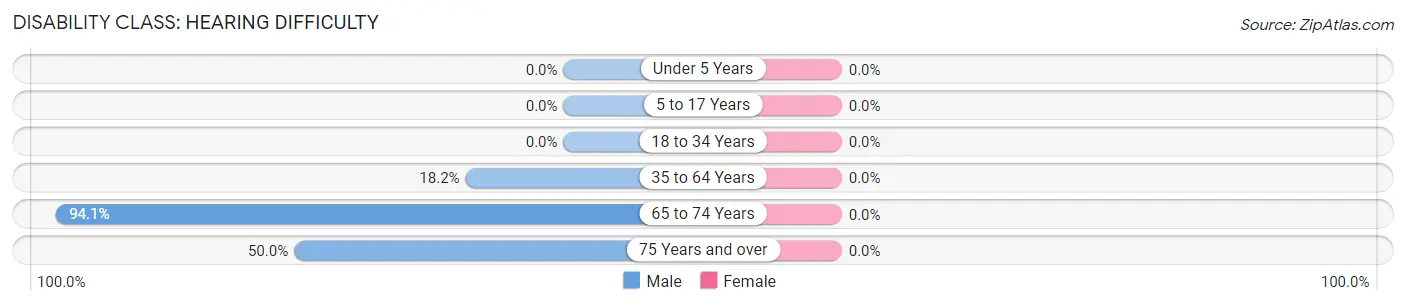
| Age Bracket | Male | Female |
| Under 5 Years | 0 (0.0%) | 0 (0.0%) |
| 5 to 17 Years | 0 (0.0%) | 0 (0.0%) |
| 18 to 34 Years | 0 (0.0%) | 0 (0.0%) |
| 35 to 64 Years | 2 (18.2%) | 0 (0.0%) |
| 65 to 74 Years | 16 (94.1%) | 0 (0.0%) |
| 75 Years and over | 1 (50.0%) | 0 (0.0%) |
Disability Class: Vision Difficulty
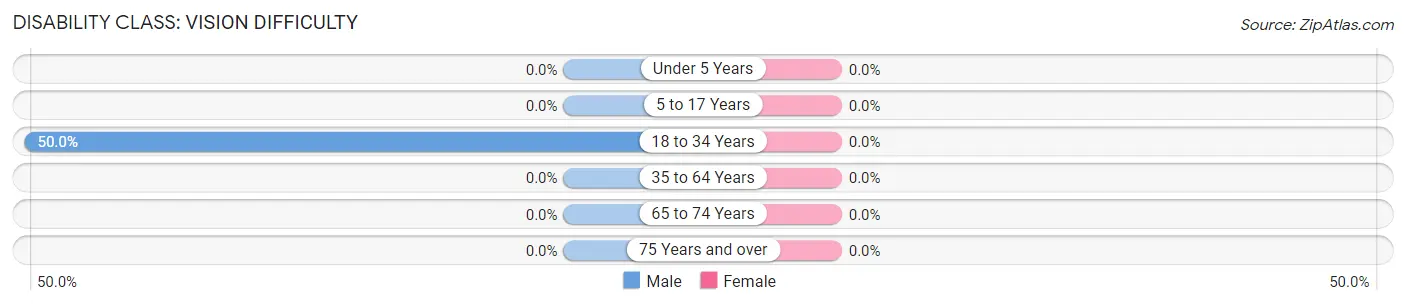
| Age Bracket | Male | Female |
| Under 5 Years | 0 (0.0%) | 0 (0.0%) |
| 5 to 17 Years | 0 (0.0%) | 0 (0.0%) |
| 18 to 34 Years | 1 (50.0%) | 0 (0.0%) |
| 35 to 64 Years | 0 (0.0%) | 0 (0.0%) |
| 65 to 74 Years | 0 (0.0%) | 0 (0.0%) |
| 75 Years and over | 0 (0.0%) | 0 (0.0%) |
Disability Class: Cognitive Difficulty
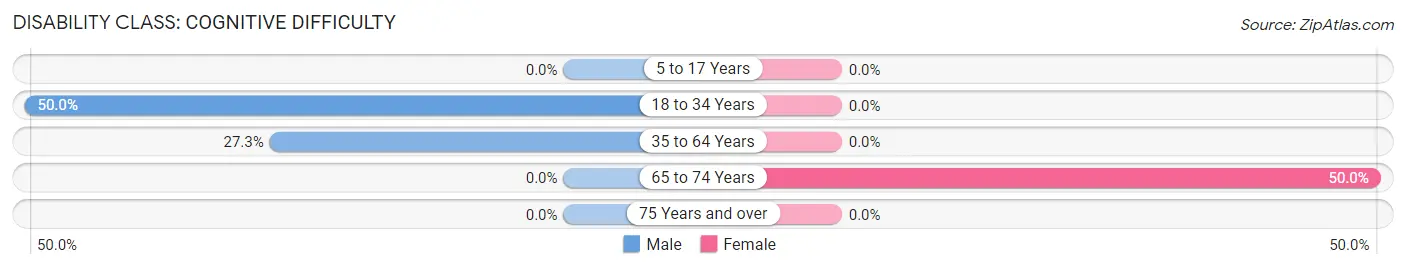
| Age Bracket | Male | Female |
| 5 to 17 Years | 0 (0.0%) | 0 (0.0%) |
| 18 to 34 Years | 1 (50.0%) | 0 (0.0%) |
| 35 to 64 Years | 3 (27.3%) | 0 (0.0%) |
| 65 to 74 Years | 0 (0.0%) | 1 (50.0%) |
| 75 Years and over | 0 (0.0%) | 0 (0.0%) |
Disability Class: Ambulatory Difficulty
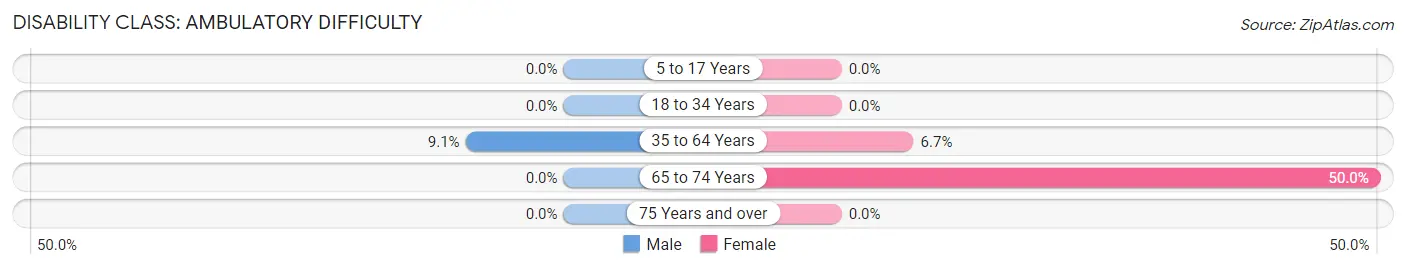
| Age Bracket | Male | Female |
| 5 to 17 Years | 0 (0.0%) | 0 (0.0%) |
| 18 to 34 Years | 0 (0.0%) | 0 (0.0%) |
| 35 to 64 Years | 1 (9.1%) | 1 (6.7%) |
| 65 to 74 Years | 0 (0.0%) | 1 (50.0%) |
| 75 Years and over | 0 (0.0%) | 0 (0.0%) |
Disability Class: Self-Care Difficulty
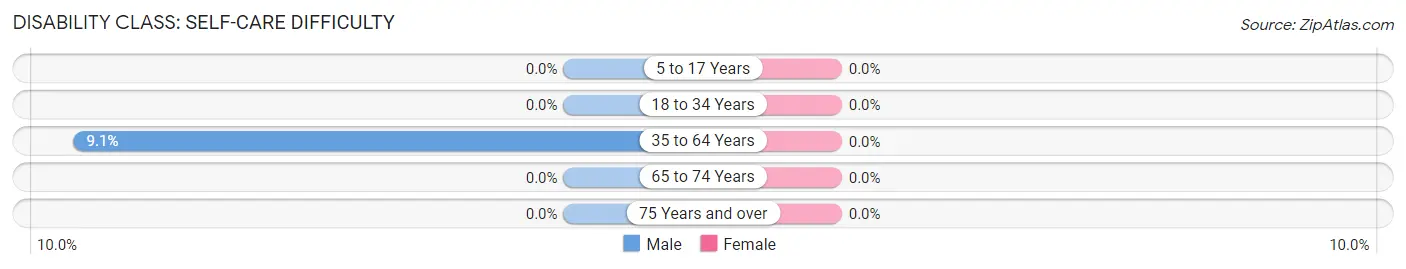
| Age Bracket | Male | Female |
| 5 to 17 Years | 0 (0.0%) | 0 (0.0%) |
| 18 to 34 Years | 0 (0.0%) | 0 (0.0%) |
| 35 to 64 Years | 1 (9.1%) | 0 (0.0%) |
| 65 to 74 Years | 0 (0.0%) | 0 (0.0%) |
| 75 Years and over | 0 (0.0%) | 0 (0.0%) |
Technology Access in New Alluwe
Computing Device Access in New Alluwe
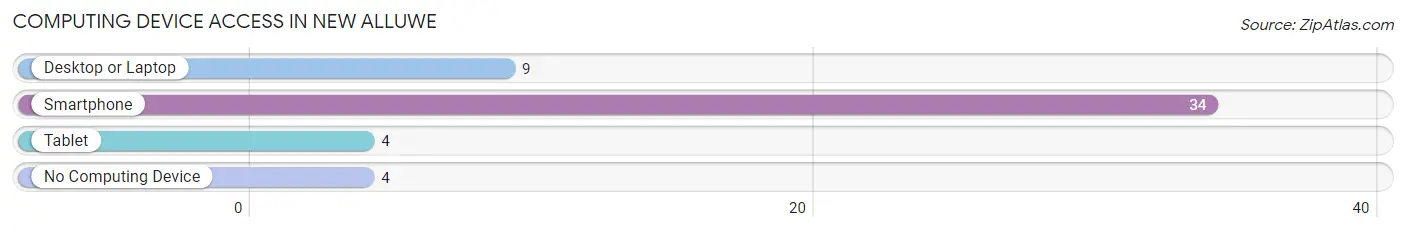
| Device Type | # Households | % Households |
| Desktop or Laptop | 9 | 23.1% |
| Smartphone | 34 | 87.2% |
| Tablet | 4 | 10.3% |
| No Computing Device | 4 | 10.3% |
| Total | 39 | 100.0% |
Internet Access in New Alluwe
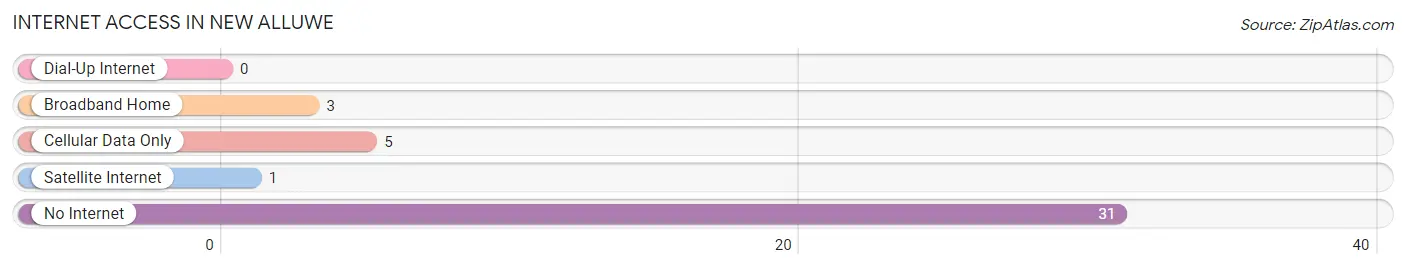
| Internet Type | # Households | % Households |
| Dial-Up Internet | 0 | 0.0% |
| Broadband Home | 3 | 7.7% |
| Cellular Data Only | 5 | 12.8% |
| Satellite Internet | 1 | 2.6% |
| No Internet | 31 | 79.5% |
| Total | 39 | 100.0% |
New Alluwe Summary
Alluwe is a small town located in the northeastern corner of Oklahoma, in the foothills of the Ozark Mountains. It is situated in the county of Nowata, and is part of the Tulsa Metropolitan Statistical Area. Alluwe is a rural community with a population of just over 500 people, and is known for its small-town charm and friendly atmosphere.
History
Alluwe was founded in 1891 by a group of settlers from the nearby town of Nowata. The town was named after the Alluwe Creek, which runs through the area. The creek was named after the Alluwe Indians, a tribe of Native Americans who lived in the area before the settlers arrived.
The town grew slowly over the years, and by the early 1900s it had become a thriving community. It was home to several businesses, including a general store, a blacksmith shop, and a post office. The town also had a school, which was attended by the children of the settlers.
In the 1920s, the town began to decline as the population moved away to larger cities. By the 1950s, the population had dropped to just over 200 people. However, in the late 1970s, the town began to experience a resurgence as people began to move back to the area. Today, the population of Alluwe is just over 500 people.
Geography
Alluwe is located in the northeastern corner of Oklahoma, in the foothills of the Ozark Mountains. The town is situated in the county of Nowata, and is part of the Tulsa Metropolitan Statistical Area.
The town is located on the banks of the Alluwe Creek, which runs through the area. The creek is a tributary of the Verdigris River, which flows through the state of Oklahoma. The town is surrounded by rolling hills and wooded areas, and is home to a variety of wildlife, including deer, turkey, and other small animals.
Economy
The economy of Alluwe is largely based on agriculture. The town is home to several farms, which produce a variety of crops, including corn, soybeans, and wheat. The town also has a few small businesses, including a general store, a gas station, and a post office.
Demographics
As of the 2010 census, the population of Alluwe was 514 people. The racial makeup of the town was 97.3% White, 0.6% African American, 0.2% Native American, 0.2% Asian, 0.4% from other races, and 1.3% from two or more races. Hispanic or Latino of any race were 1.2% of the population.
The median household income in Alluwe was $35,625, and the median family income was $41,250. The per capita income for the town was $17,845. About 11.2% of families and 14.2% of the population were below the poverty line, including 18.2% of those under age 18 and 8.3% of those age 65 or over.
Conclusion
Alluwe is a small town located in the northeastern corner of Oklahoma, in the foothills of the Ozark Mountains. It is a rural community with a population of just over 500 people, and is known for its small-town charm and friendly atmosphere. The economy of Alluwe is largely based on agriculture, and the town is home to several farms, which produce a variety of crops. The racial makeup of the town is predominantly White, with a small percentage of African American, Native American, and Asian residents. Alluwe is a peaceful and welcoming community, and is a great place to live and raise a family.
Common Questions
What is Per Capita Income in New Alluwe?
Per Capita income in New Alluwe is $17,066.
What is the Median Family Income in New Alluwe?
Median Family Income in New Alluwe is $37,500.
What is Inequality or Gini Index in New Alluwe?
Inequality or Gini Index in New Alluwe is 0.40.
What is the Total Population of New Alluwe?
Total Population of New Alluwe is 64.
What is the Total Male Population of New Alluwe?
Total Male Population of New Alluwe is 40.
What is the Total Female Population of New Alluwe?
Total Female Population of New Alluwe is 24.
What is the Ratio of Males per 100 Females in New Alluwe?
There are 166.67 Males per 100 Females in New Alluwe.
What is the Ratio of Females per 100 Males in New Alluwe?
There are 60.00 Females per 100 Males in New Alluwe.
What is the Median Population Age in New Alluwe?
Median Population Age in New Alluwe is 48.0 Years.
What is the Average Family Size in New Alluwe
Average Family Size in New Alluwe is 2.8 People.
What is the Average Household Size in New Alluwe
Average Household Size in New Alluwe is 1.6 People.
How Large is the Labor Force in New Alluwe?
There are 23 People in the Labor Forcein in New Alluwe.
What is the Percentage of People in the Labor Force in New Alluwe?
41.8% of People are in the Labor Force in New Alluwe.
What is the Unemployment Rate in New Alluwe?
Unemployment Rate in New Alluwe is 8.7%.