Mustang, OK Map & Demographics
Mustang Map
Mustang Overview
$40,015
PER CAPITA INCOME
$101,125
AVG FAMILY INCOME
$84,162
AVG HOUSEHOLD INCOME
33.9%
WAGE / INCOME GAP [ % ]
66.1¢/ $1
WAGE / INCOME GAP [ $ ]
$16,891
FAMILY INCOME DEFICIT
0.38
INEQUALITY / GINI INDEX
20,518
TOTAL POPULATION
10,000
MALE POPULATION
10,518
FEMALE POPULATION
95.08
MALES / 100 FEMALES
105.18
FEMALES / 100 MALES
39.0
MEDIAN AGE
3.1
AVG FAMILY SIZE
2.7
AVG HOUSEHOLD SIZE
10,858
LABOR FORCE [ PEOPLE ]
68.0%
PERCENT IN LABOR FORCE
4.1%
UNEMPLOYMENT RATE
Mustang Zip Codes
Mustang Area Codes
Income in Mustang
Income Overview in Mustang
Per Capita Income in Mustang is $40,015, while median incomes of families and households are $101,125 and $84,162 respectively.
| Characteristic | Number | Measure |
| Per Capita Income | 20,518 | $40,015 |
| Median Family Income | 5,786 | $101,125 |
| Mean Family Income | 5,786 | $118,187 |
| Median Household Income | 7,617 | $84,162 |
| Mean Household Income | 7,617 | $103,950 |
| Income Deficit | 5,786 | $16,891 |
| Wage / Income Gap (%) | 20,518 | 33.91% |
| Wage / Income Gap ($) | 20,518 | 66.09¢ per $1 |
| Gini / Inequality Index | 20,518 | 0.38 |
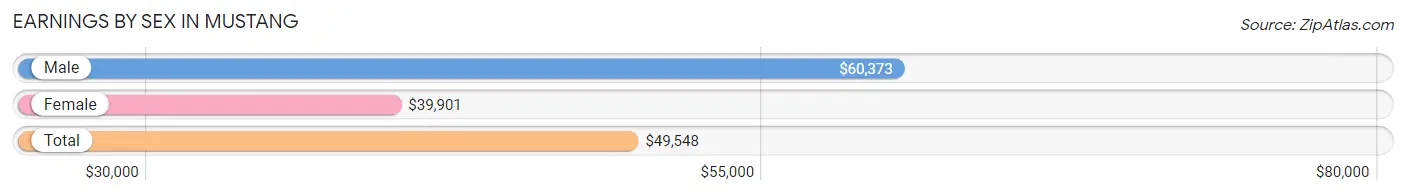
Earnings by Sex in Mustang
Average Earnings in Mustang are $49,548, $60,373 for men and $39,901 for women, a difference of 33.9%.
| Sex | Number | Average Earnings |
| Male | 5,966 (53.9%) | $60,373 |
| Female | 5,102 (46.1%) | $39,901 |
| Total | 11,068 (100.0%) | $49,548 |
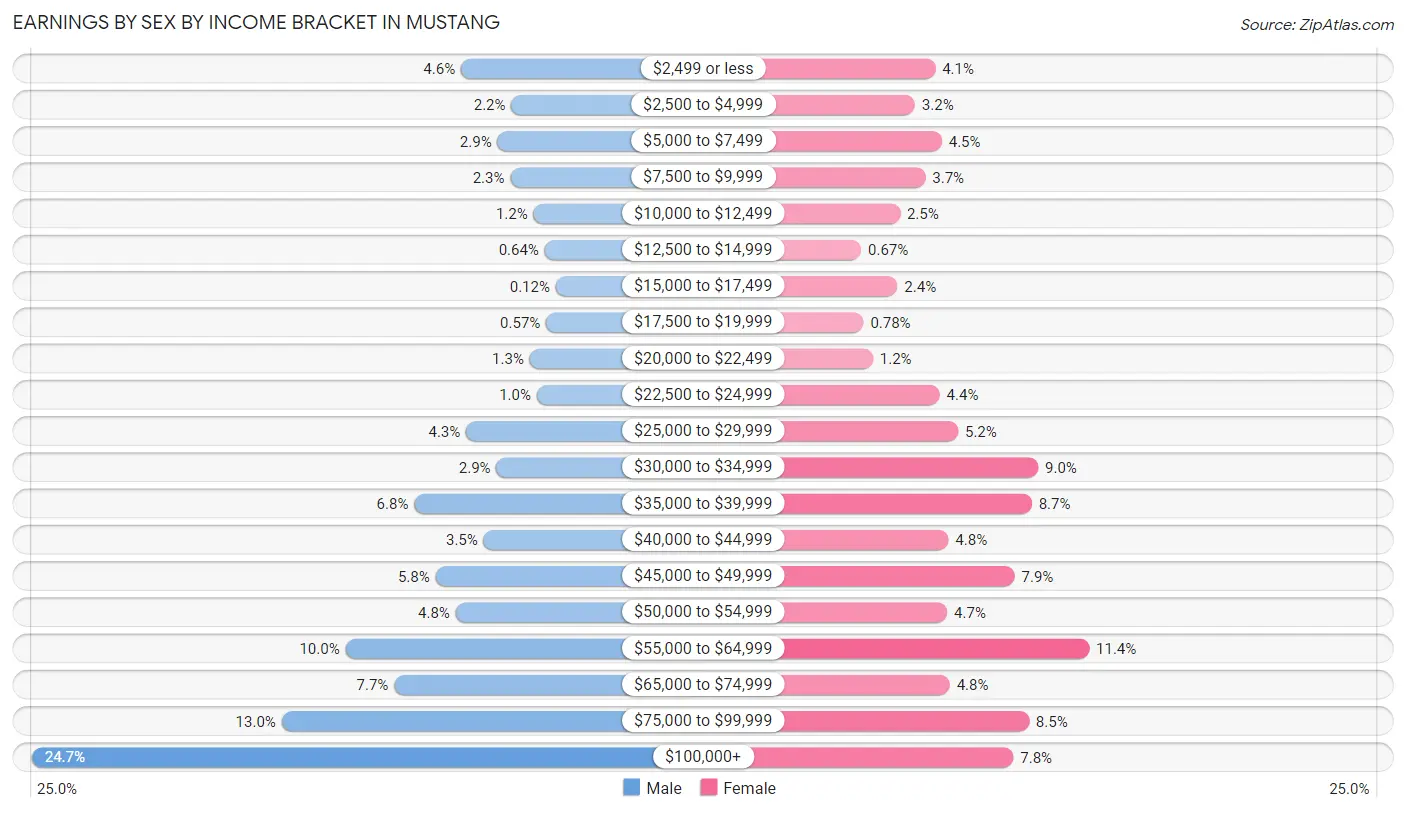
Earnings by Sex by Income Bracket in Mustang
The most common earnings brackets in Mustang are $100,000+ for men (1,471 | 24.7%) and $55,000 to $64,999 for women (579 | 11.4%).
| Income | Male | Female |
| $2,499 or less | 272 (4.6%) | 211 (4.1%) |
| $2,500 to $4,999 | 131 (2.2%) | 163 (3.2%) |
| $5,000 to $7,499 | 170 (2.9%) | 227 (4.4%) |
| $7,500 to $9,999 | 134 (2.2%) | 188 (3.7%) |
| $10,000 to $12,499 | 69 (1.2%) | 127 (2.5%) |
| $12,500 to $14,999 | 38 (0.6%) | 34 (0.7%) |
| $15,000 to $17,499 | 7 (0.1%) | 121 (2.4%) |
| $17,500 to $19,999 | 34 (0.6%) | 40 (0.8%) |
| $20,000 to $22,499 | 80 (1.3%) | 62 (1.2%) |
| $22,500 to $24,999 | 60 (1.0%) | 222 (4.3%) |
| $25,000 to $29,999 | 258 (4.3%) | 266 (5.2%) |
| $30,000 to $34,999 | 173 (2.9%) | 457 (9.0%) |
| $35,000 to $39,999 | 403 (6.8%) | 442 (8.7%) |
| $40,000 to $44,999 | 209 (3.5%) | 243 (4.8%) |
| $45,000 to $49,999 | 343 (5.8%) | 401 (7.9%) |
| $50,000 to $54,999 | 287 (4.8%) | 240 (4.7%) |
| $55,000 to $64,999 | 595 (10.0%) | 579 (11.4%) |
| $65,000 to $74,999 | 459 (7.7%) | 246 (4.8%) |
| $75,000 to $99,999 | 773 (13.0%) | 435 (8.5%) |
| $100,000+ | 1,471 (24.7%) | 398 (7.8%) |
| Total | 5,966 (100.0%) | 5,102 (100.0%) |
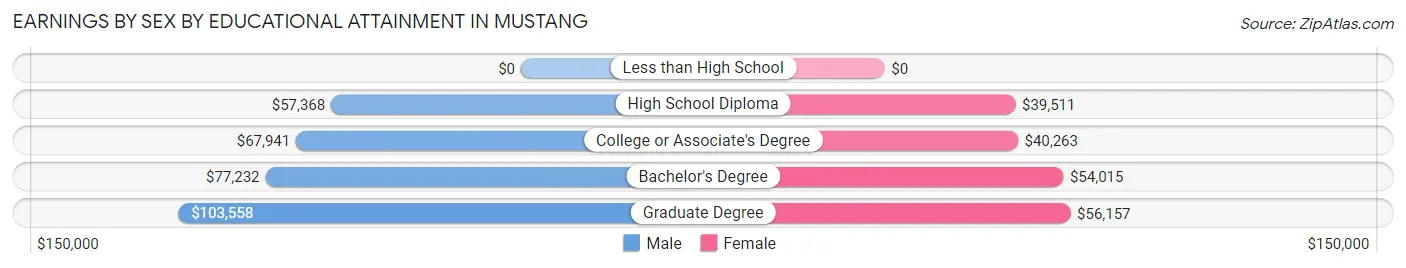
Earnings by Sex by Educational Attainment in Mustang
Average earnings in Mustang are $65,776 for men and $45,633 for women, a difference of 30.6%. Men with an educational attainment of graduate degree enjoy the highest average annual earnings of $103,558, while those with high school diploma education earn the least with $57,368. Women with an educational attainment of graduate degree earn the most with the average annual earnings of $56,157, while those with high school diploma education have the smallest earnings of $39,511.
| Educational Attainment | Male Income | Female Income |
| Less than High School | - | - |
| High School Diploma | $57,368 | $39,511 |
| College or Associate's Degree | $67,941 | $40,263 |
| Bachelor's Degree | $77,232 | $54,015 |
| Graduate Degree | $103,558 | $56,157 |
| Total | $65,776 | $45,633 |
Family Income in Mustang
Family Income Brackets in Mustang
According to the Mustang family income data, there are 1,435 families falling into the $100,000 to $149,999 income range, which is the most common income bracket and makes up 24.8% of all families. Conversely, the $10,000 to $14,999 income bracket is the least frequent group with only 6 families (0.1%) belonging to this category.
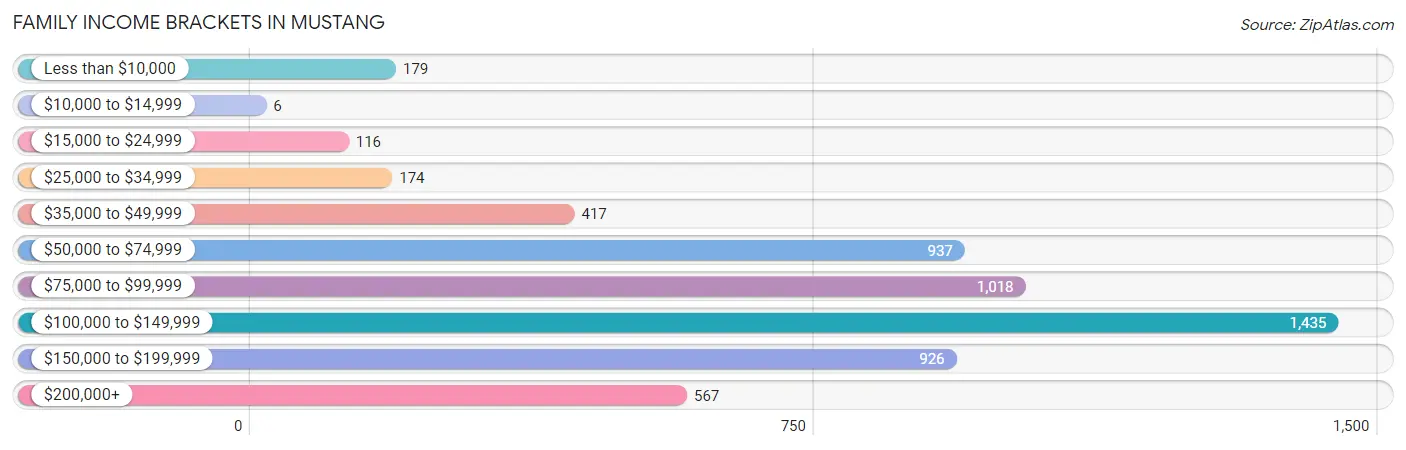
| Income Bracket | # Families | % Families |
| Less than $10,000 | 179 | 3.1% |
| $10,000 to $14,999 | 6 | 0.1% |
| $15,000 to $24,999 | 116 | 2.0% |
| $25,000 to $34,999 | 174 | 3.0% |
| $35,000 to $49,999 | 417 | 7.2% |
| $50,000 to $74,999 | 937 | 16.2% |
| $75,000 to $99,999 | 1,018 | 17.6% |
| $100,000 to $149,999 | 1,435 | 24.8% |
| $150,000 to $199,999 | 926 | 16.0% |
| $200,000+ | 567 | 9.8% |
Family Income by Famaliy Size in Mustang
4-person families (898 | 15.5%) account for the highest median family income in Mustang with $138,897 per family, while 2-person families (3,012 | 52.1%) have the highest median income of $51,211 per family member.
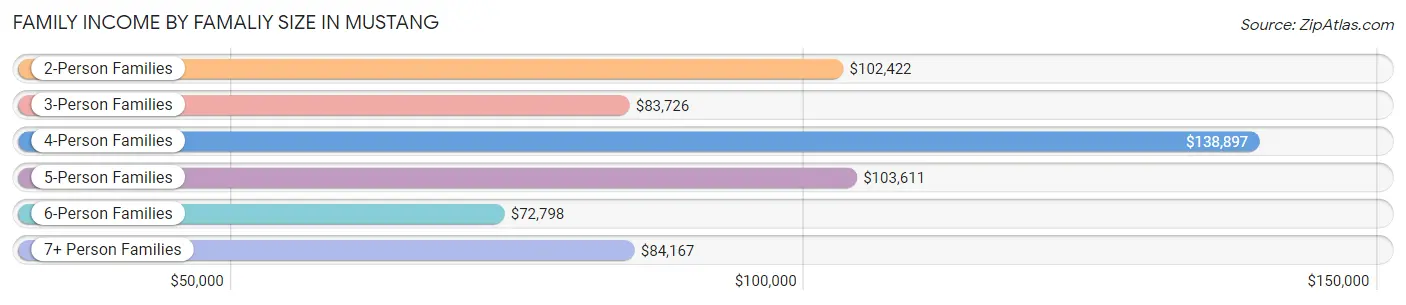
| Income Bracket | # Families | Median Income |
| 2-Person Families | 3,012 (52.1%) | $102,422 |
| 3-Person Families | 1,151 (19.9%) | $83,726 |
| 4-Person Families | 898 (15.5%) | $138,897 |
| 5-Person Families | 456 (7.9%) | $103,611 |
| 6-Person Families | 203 (3.5%) | $72,798 |
| 7+ Person Families | 66 (1.1%) | $84,167 |
| Total | 5,786 (100.0%) | $101,125 |
Family Income by Number of Earners in Mustang
The median family income in Mustang is $101,125, with families comprising 3+ earners (593) having the highest median family income of $160,878, while families with no earners (727) have the lowest median family income of $58,074, accounting for 10.2% and 12.6% of families, respectively.
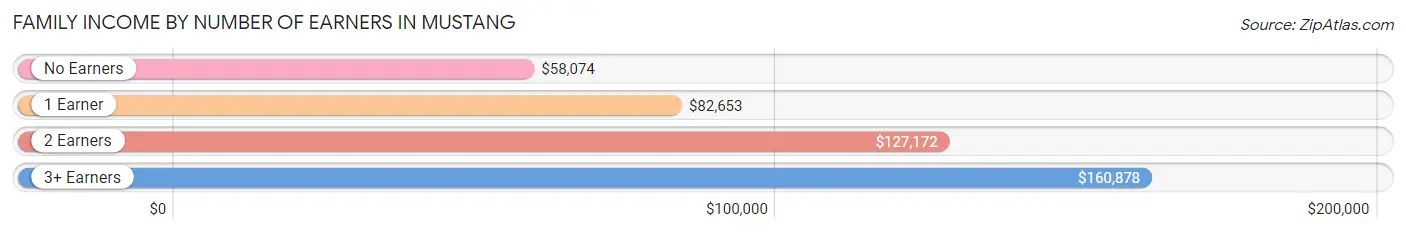
| Number of Earners | # Families | Median Income |
| No Earners | 727 (12.6%) | $58,074 |
| 1 Earner | 1,856 (32.1%) | $82,653 |
| 2 Earners | 2,610 (45.1%) | $127,172 |
| 3+ Earners | 593 (10.2%) | $160,878 |
| Total | 5,786 (100.0%) | $101,125 |
Household Income in Mustang
Household Income Brackets in Mustang
With 1,653 households falling in the category, the $100,000 to $149,999 income range is the most frequent in Mustang, accounting for 21.7% of all households. In contrast, only 91 households (1.2%) fall into the $10,000 to $14,999 income bracket, making it the least populous group.
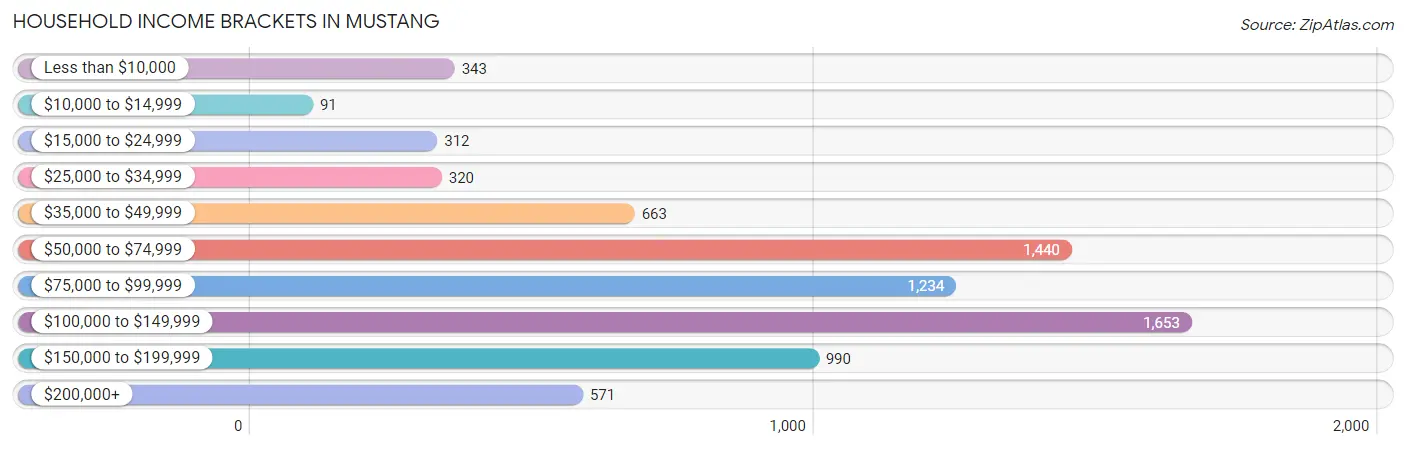
| Income Bracket | # Households | % Households |
| Less than $10,000 | 343 | 4.5% |
| $10,000 to $14,999 | 91 | 1.2% |
| $15,000 to $24,999 | 312 | 4.1% |
| $25,000 to $34,999 | 320 | 4.2% |
| $35,000 to $49,999 | 663 | 8.7% |
| $50,000 to $74,999 | 1,440 | 18.9% |
| $75,000 to $99,999 | 1,234 | 16.2% |
| $100,000 to $149,999 | 1,653 | 21.7% |
| $150,000 to $199,999 | 990 | 13.0% |
| $200,000+ | 571 | 7.5% |
Household Income by Householder Age in Mustang
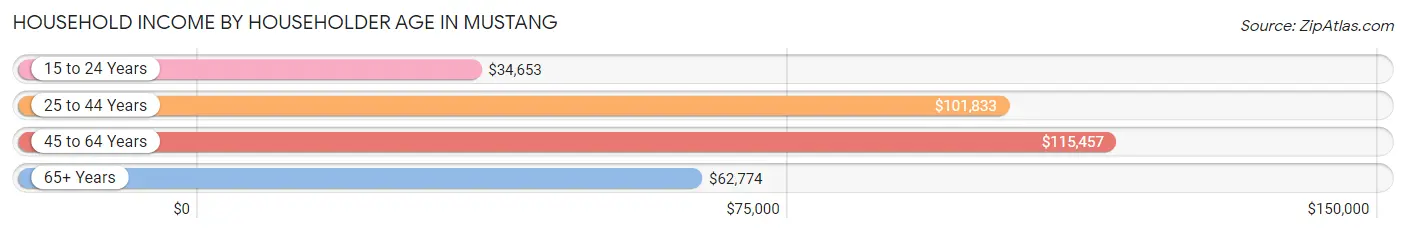
The median household income in Mustang is $84,162, with the highest median household income of $115,457 found in the 45 to 64 years age bracket for the primary householder. A total of 2,873 households (37.7%) fall into this category. Meanwhile, the 15 to 24 years age bracket for the primary householder has the lowest median household income of $34,653, with 173 households (2.3%) in this group.
| Income Bracket | # Households | Median Income |
| 15 to 24 Years | 173 (2.3%) | $34,653 |
| 25 to 44 Years | 2,536 (33.3%) | $101,833 |
| 45 to 64 Years | 2,873 (37.7%) | $115,457 |
| 65+ Years | 2,035 (26.7%) | $62,774 |
| Total | 7,617 (100.0%) | $84,162 |
Poverty in Mustang
Income Below Poverty by Sex and Age in Mustang
With 8.6% poverty level for males and 7.4% for females among the residents of Mustang, 6 to 11 year old males and 15 year old females are the most vulnerable to poverty, with 199 males (24.6%) and 40 females (37.7%) in their respective age groups living below the poverty level.
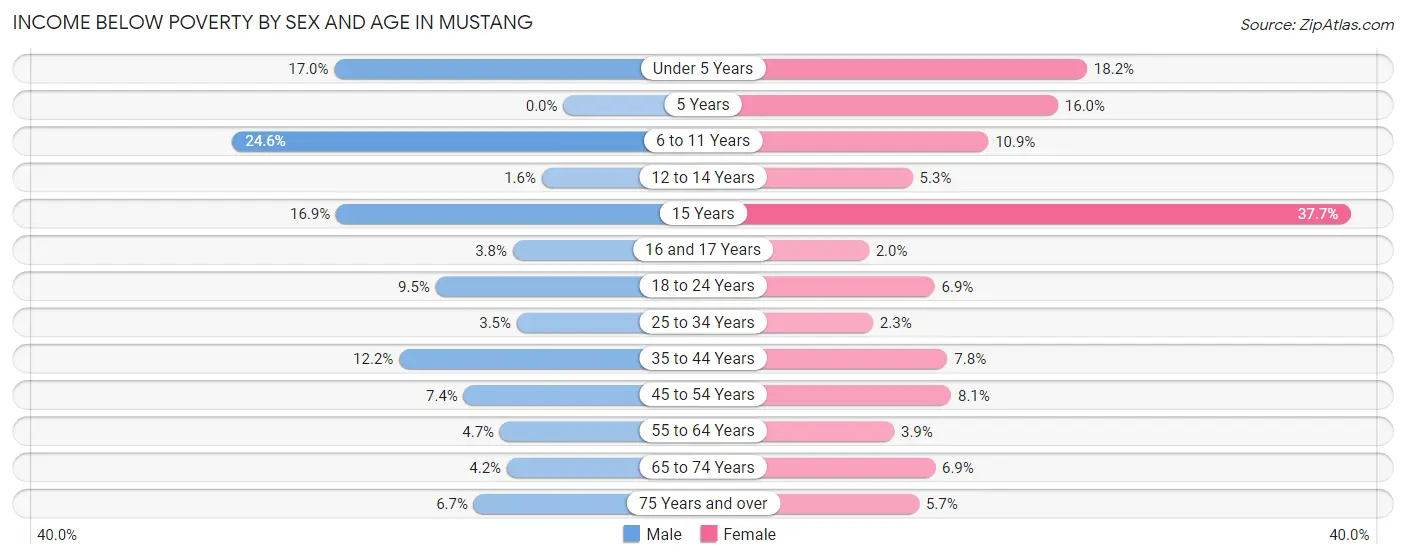
| Age Bracket | Male | Female |
| Under 5 Years | 94 (17.0%) | 93 (18.2%) |
| 5 Years | 0 (0.0%) | 34 (16.0%) |
| 6 to 11 Years | 199 (24.6%) | 114 (10.9%) |
| 12 to 14 Years | 7 (1.6%) | 24 (5.3%) |
| 15 Years | 14 (16.9%) | 40 (37.7%) |
| 16 and 17 Years | 12 (3.7%) | 5 (2.0%) |
| 18 to 24 Years | 68 (9.5%) | 49 (6.9%) |
| 25 to 34 Years | 46 (3.5%) | 30 (2.3%) |
| 35 to 44 Years | 183 (12.2%) | 114 (7.8%) |
| 45 to 54 Years | 85 (7.4%) | 96 (8.1%) |
| 55 to 64 Years | 71 (4.7%) | 55 (3.9%) |
| 65 to 74 Years | 34 (4.2%) | 70 (6.9%) |
| 75 Years and over | 36 (6.7%) | 39 (5.7%) |
| Total | 849 (8.6%) | 763 (7.4%) |
Income Above Poverty by Sex and Age in Mustang
According to the poverty statistics in Mustang, males aged 5 years and females aged 16 and 17 years are the age groups that are most secure financially, with 100.0% of males and 98.0% of females in these age groups living above the poverty line.
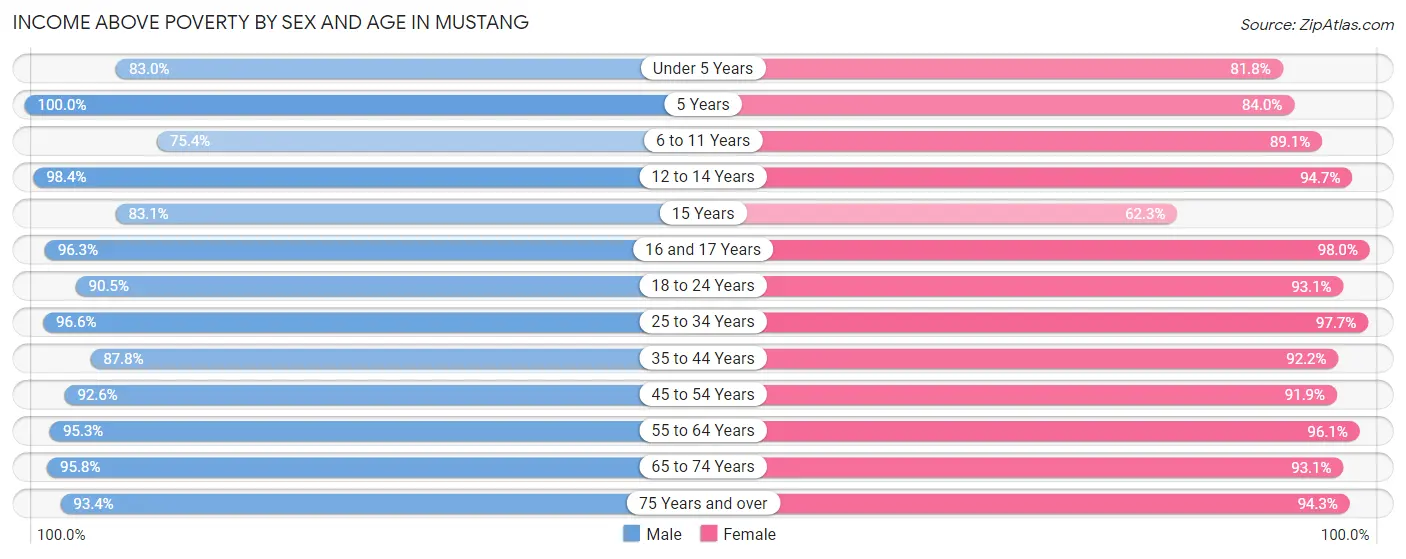
| Age Bracket | Male | Female |
| Under 5 Years | 459 (83.0%) | 418 (81.8%) |
| 5 Years | 147 (100.0%) | 178 (84.0%) |
| 6 to 11 Years | 611 (75.4%) | 935 (89.1%) |
| 12 to 14 Years | 431 (98.4%) | 432 (94.7%) |
| 15 Years | 69 (83.1%) | 66 (62.3%) |
| 16 and 17 Years | 308 (96.3%) | 245 (98.0%) |
| 18 to 24 Years | 649 (90.5%) | 662 (93.1%) |
| 25 to 34 Years | 1,288 (96.6%) | 1,270 (97.7%) |
| 35 to 44 Years | 1,318 (87.8%) | 1,340 (92.2%) |
| 45 to 54 Years | 1,063 (92.6%) | 1,088 (91.9%) |
| 55 to 64 Years | 1,438 (95.3%) | 1,363 (96.1%) |
| 65 to 74 Years | 777 (95.8%) | 941 (93.1%) |
| 75 Years and over | 505 (93.3%) | 642 (94.3%) |
| Total | 9,063 (91.4%) | 9,580 (92.6%) |
Income Below Poverty Among Married-Couple Families in Mustang
The poverty statistics for married-couple families in Mustang show that 3.5% or 165 of the total 4,714 families live below the poverty line. Families with 3 or 4 children have the highest poverty rate of 10.3%, comprising of 46 families. On the other hand, families with 5 or more children have the lowest poverty rate of 0.0%, which includes 0 families.
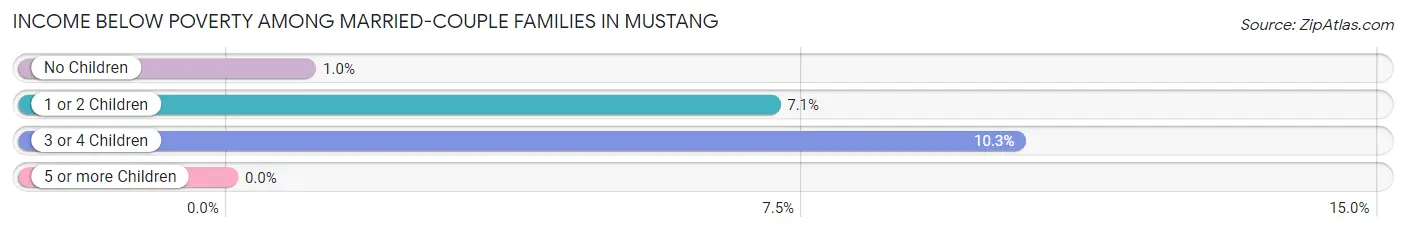
| Children | Above Poverty | Below Poverty |
| No Children | 2,921 (99.0%) | 30 (1.0%) |
| 1 or 2 Children | 1,168 (92.9%) | 89 (7.1%) |
| 3 or 4 Children | 401 (89.7%) | 46 (10.3%) |
| 5 or more Children | 59 (100.0%) | 0 (0.0%) |
| Total | 4,549 (96.5%) | 165 (3.5%) |
Income Below Poverty Among Single-Parent Households in Mustang
According to the poverty data in Mustang, 14.1% or 62 single-father households and 9.2% or 58 single-mother households are living below the poverty line. Among single-father households, those with 5 or more children have the highest poverty rate, with 31 households (100.0%) experiencing poverty. Likewise, among single-mother households, those with 1 or 2 children have the highest poverty rate, with 58 households (17.3%) falling below the poverty line.
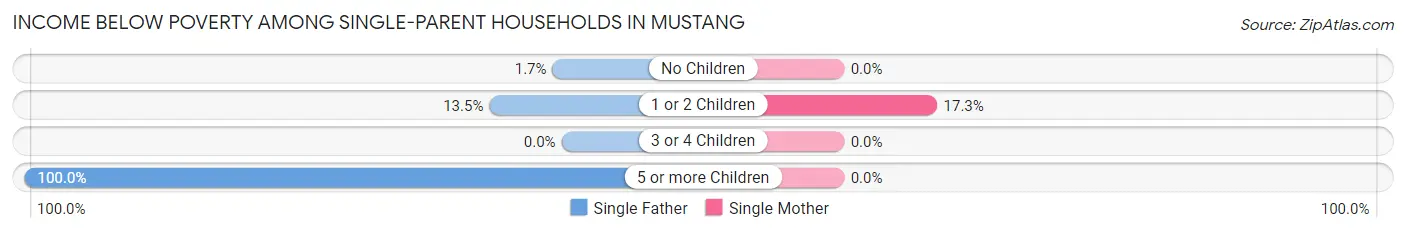
| Children | Single Father | Single Mother |
| No Children | 3 (1.7%) | 0 (0.0%) |
| 1 or 2 Children | 28 (13.5%) | 58 (17.3%) |
| 3 or 4 Children | 0 (0.0%) | 0 (0.0%) |
| 5 or more Children | 31 (100.0%) | 0 (0.0%) |
| Total | 62 (14.1%) | 58 (9.2%) |
Income Below Poverty Among Married-Couple vs Single-Parent Households in Mustang
The poverty data for Mustang shows that 165 of the married-couple family households (3.5%) and 120 of the single-parent households (11.2%) are living below the poverty level. Within the married-couple family households, those with 3 or 4 children have the highest poverty rate, with 46 households (10.3%) falling below the poverty line. Among the single-parent households, those with 5 or more children have the highest poverty rate, with 31 household (81.6%) living below poverty.
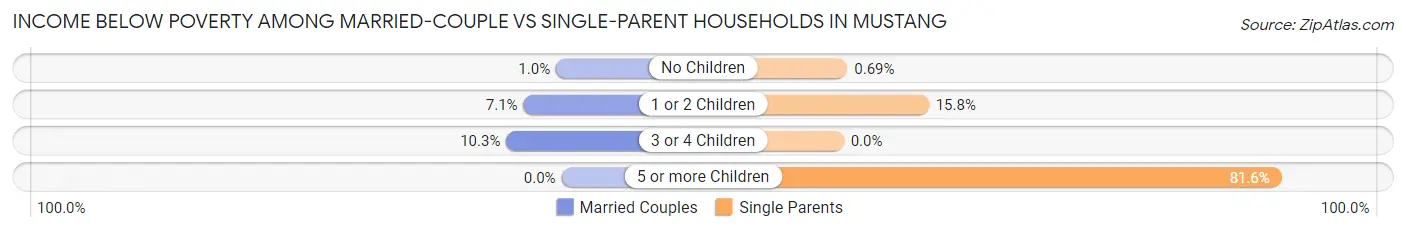
| Children | Married-Couple Families | Single-Parent Households |
| No Children | 30 (1.0%) | 3 (0.7%) |
| 1 or 2 Children | 89 (7.1%) | 86 (15.8%) |
| 3 or 4 Children | 46 (10.3%) | 0 (0.0%) |
| 5 or more Children | 0 (0.0%) | 31 (81.6%) |
| Total | 165 (3.5%) | 120 (11.2%) |
Race in Mustang
The most populous races in Mustang are White / Caucasian (15,893 | 77.5%), Hispanic or Latino (2,151 | 10.5%), and Two or more Races (1,821 | 8.9%).
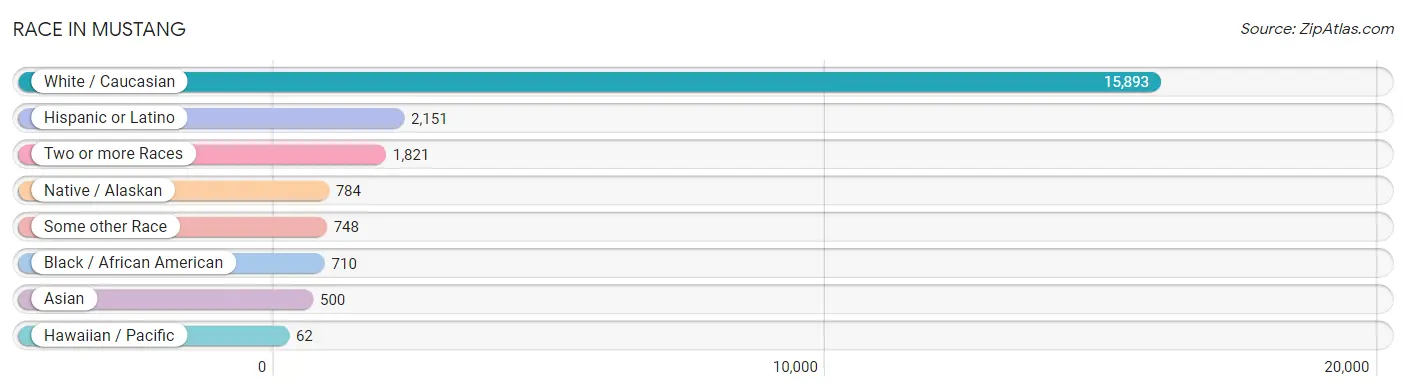
| Race | # Population | % Population |
| Asian | 500 | 2.4% |
| Black / African American | 710 | 3.5% |
| Hawaiian / Pacific | 62 | 0.3% |
| Hispanic or Latino | 2,151 | 10.5% |
| Native / Alaskan | 784 | 3.8% |
| White / Caucasian | 15,893 | 77.5% |
| Two or more Races | 1,821 | 8.9% |
| Some other Race | 748 | 3.6% |
| Total | 20,518 | 100.0% |
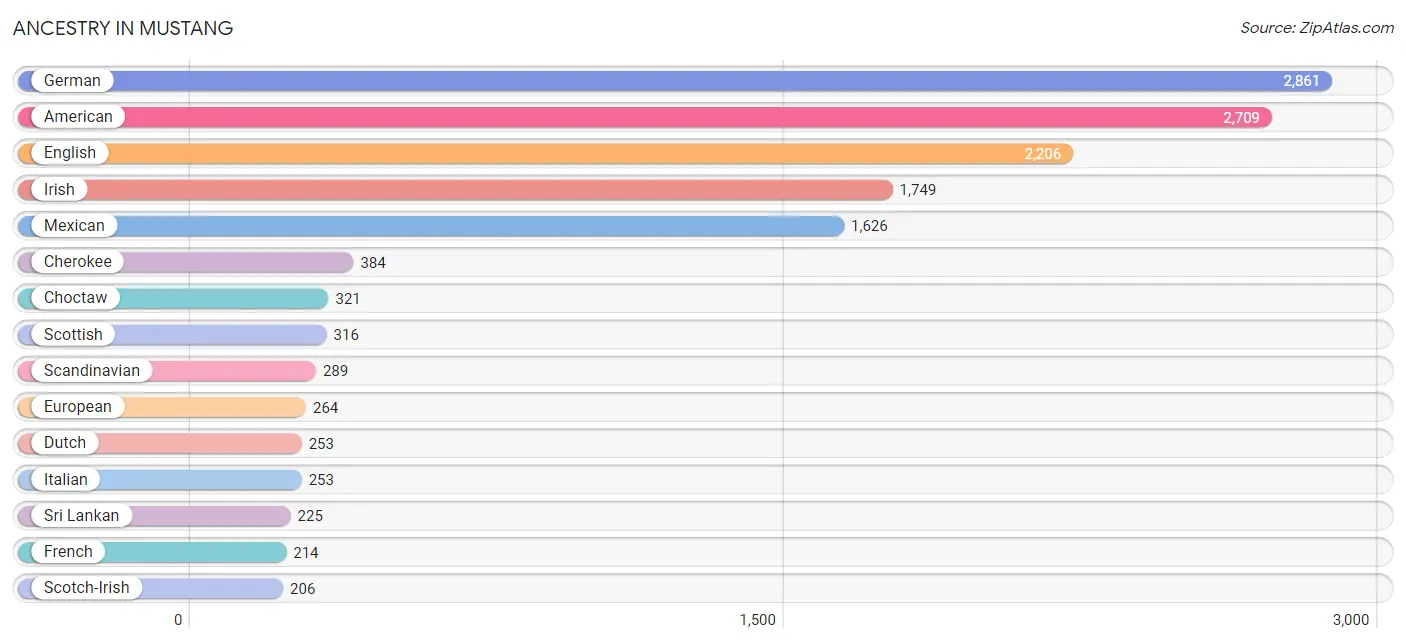
Ancestry in Mustang
The most populous ancestries reported in Mustang are German (2,861 | 13.9%), American (2,709 | 13.2%), English (2,206 | 10.7%), Irish (1,749 | 8.5%), and Mexican (1,626 | 7.9%), together accounting for 54.3% of all Mustang residents.
| Ancestry | # Population | % Population |
| American | 2,709 | 13.2% |
| Argentinean | 100 | 0.5% |
| Austrian | 28 | 0.1% |
| Belgian | 10 | 0.1% |
| Bhutanese | 8 | 0.0% |
| British | 50 | 0.2% |
| Bulgarian | 8 | 0.0% |
| Burmese | 22 | 0.1% |
| Central American | 38 | 0.2% |
| Cherokee | 384 | 1.9% |
| Chickasaw | 102 | 0.5% |
| Choctaw | 321 | 1.6% |
| Colombian | 51 | 0.3% |
| Comanche | 34 | 0.2% |
| Creek | 133 | 0.6% |
| Croatian | 6 | 0.0% |
| Cuban | 27 | 0.1% |
| Czech | 32 | 0.2% |
| Czechoslovakian | 3 | 0.0% |
| Danish | 16 | 0.1% |
| Dutch | 253 | 1.2% |
| Dutch West Indian | 37 | 0.2% |
| Eastern European | 58 | 0.3% |
| English | 2,206 | 10.7% |
| European | 264 | 1.3% |
| French | 214 | 1.0% |
| French Canadian | 74 | 0.4% |
| German | 2,861 | 13.9% |
| Ghanaian | 21 | 0.1% |
| Guatemalan | 16 | 0.1% |
| Hungarian | 9 | 0.0% |
| Indian (Asian) | 144 | 0.7% |
| Indonesian | 60 | 0.3% |
| Irish | 1,749 | 8.5% |
| Italian | 253 | 1.2% |
| Jamaican | 26 | 0.1% |
| Kiowa | 103 | 0.5% |
| Korean | 171 | 0.8% |
| Laotian | 10 | 0.1% |
| Mexican | 1,626 | 7.9% |
| Mexican American Indian | 28 | 0.1% |
| Native Hawaiian | 81 | 0.4% |
| Nicaraguan | 7 | 0.0% |
| Northern European | 47 | 0.2% |
| Norwegian | 96 | 0.5% |
| Polish | 81 | 0.4% |
| Portuguese | 6 | 0.0% |
| Potawatomi | 94 | 0.5% |
| Puerto Rican | 98 | 0.5% |
| Russian | 11 | 0.1% |
| Salvadoran | 15 | 0.1% |
| Scandinavian | 289 | 1.4% |
| Scotch-Irish | 206 | 1.0% |
| Scottish | 316 | 1.5% |
| Seminole | 88 | 0.4% |
| Sioux | 9 | 0.0% |
| South American | 151 | 0.7% |
| Spaniard | 84 | 0.4% |
| Spanish | 60 | 0.3% |
| Sri Lankan | 225 | 1.1% |
| Subsaharan African | 21 | 0.1% |
| Swedish | 109 | 0.5% |
| Swiss | 45 | 0.2% |
| Thai | 135 | 0.7% |
| Ukrainian | 35 | 0.2% |
| Welsh | 172 | 0.8% | View All 66 Rows |
Immigrants in Mustang
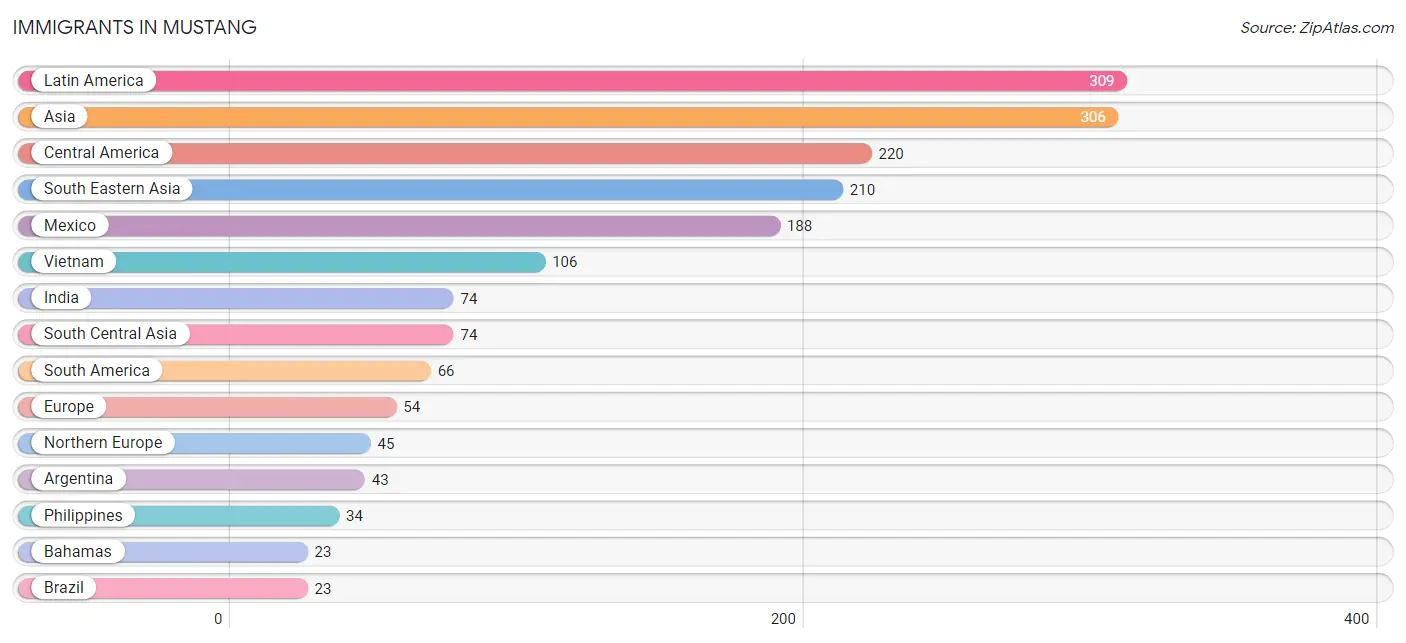
The most numerous immigrant groups reported in Mustang came from Latin America (309 | 1.5%), Asia (306 | 1.5%), Central America (220 | 1.1%), South Eastern Asia (210 | 1.0%), and Mexico (188 | 0.9%), together accounting for 6.0% of all Mustang residents.
| Immigration Origin | # Population | % Population |
| Africa | 21 | 0.1% |
| Argentina | 43 | 0.2% |
| Asia | 306 | 1.5% |
| Bahamas | 23 | 0.1% |
| Brazil | 23 | 0.1% |
| Caribbean | 23 | 0.1% |
| Central America | 220 | 1.1% |
| Eastern Africa | 21 | 0.1% |
| Eastern Asia | 22 | 0.1% |
| El Salvador | 15 | 0.1% |
| England | 14 | 0.1% |
| Europe | 54 | 0.3% |
| Germany | 9 | 0.0% |
| Guatemala | 10 | 0.1% |
| India | 74 | 0.4% |
| Kenya | 21 | 0.1% |
| Korea | 22 | 0.1% |
| Latin America | 309 | 1.5% |
| Mexico | 188 | 0.9% |
| Nicaragua | 7 | 0.0% |
| Northern Europe | 45 | 0.2% |
| Philippines | 34 | 0.2% |
| Singapore | 10 | 0.1% |
| South America | 66 | 0.3% |
| South Central Asia | 74 | 0.4% |
| South Eastern Asia | 210 | 1.0% |
| Vietnam | 106 | 0.5% |
| Western Europe | 9 | 0.0% | View All 28 Rows |
Sex and Age in Mustang
Sex and Age in Mustang
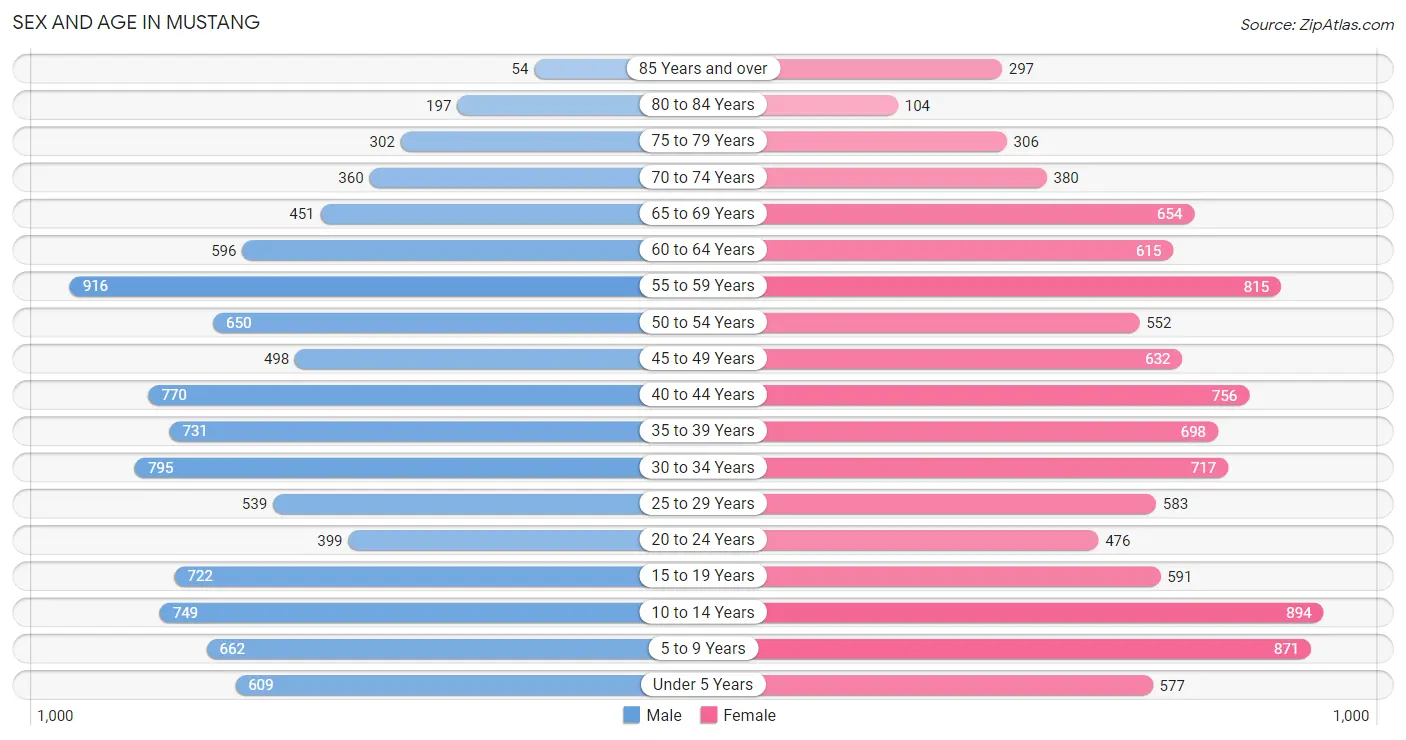
The most populous age groups in Mustang are 55 to 59 Years (916 | 9.2%) for men and 10 to 14 Years (894 | 8.5%) for women.
| Age Bracket | Male | Female |
| Under 5 Years | 609 (6.1%) | 577 (5.5%) |
| 5 to 9 Years | 662 (6.6%) | 871 (8.3%) |
| 10 to 14 Years | 749 (7.5%) | 894 (8.5%) |
| 15 to 19 Years | 722 (7.2%) | 591 (5.6%) |
| 20 to 24 Years | 399 (4.0%) | 476 (4.5%) |
| 25 to 29 Years | 539 (5.4%) | 583 (5.5%) |
| 30 to 34 Years | 795 (8.0%) | 717 (6.8%) |
| 35 to 39 Years | 731 (7.3%) | 698 (6.6%) |
| 40 to 44 Years | 770 (7.7%) | 756 (7.2%) |
| 45 to 49 Years | 498 (5.0%) | 632 (6.0%) |
| 50 to 54 Years | 650 (6.5%) | 552 (5.2%) |
| 55 to 59 Years | 916 (9.2%) | 815 (7.7%) |
| 60 to 64 Years | 596 (6.0%) | 615 (5.9%) |
| 65 to 69 Years | 451 (4.5%) | 654 (6.2%) |
| 70 to 74 Years | 360 (3.6%) | 380 (3.6%) |
| 75 to 79 Years | 302 (3.0%) | 306 (2.9%) |
| 80 to 84 Years | 197 (2.0%) | 104 (1.0%) |
| 85 Years and over | 54 (0.5%) | 297 (2.8%) |
| Total | 10,000 (100.0%) | 10,518 (100.0%) |
Families and Households in Mustang
Median Family Size in Mustang
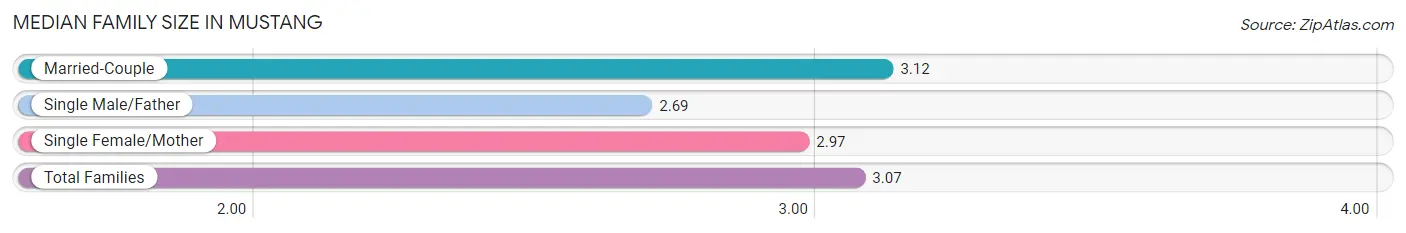
The median family size in Mustang is 3.07 persons per family, with married-couple families (4,714 | 81.5%) accounting for the largest median family size of 3.12 persons per family. On the other hand, single male/father families (440 | 7.6%) represent the smallest median family size with 2.69 persons per family.
| Family Type | # Families | Family Size |
| Married-Couple | 4,714 (81.5%) | 3.12 |
| Single Male/Father | 440 (7.6%) | 2.69 |
| Single Female/Mother | 632 (10.9%) | 2.97 |
| Total Families | 5,786 (100.0%) | 3.07 |
Median Household Size in Mustang
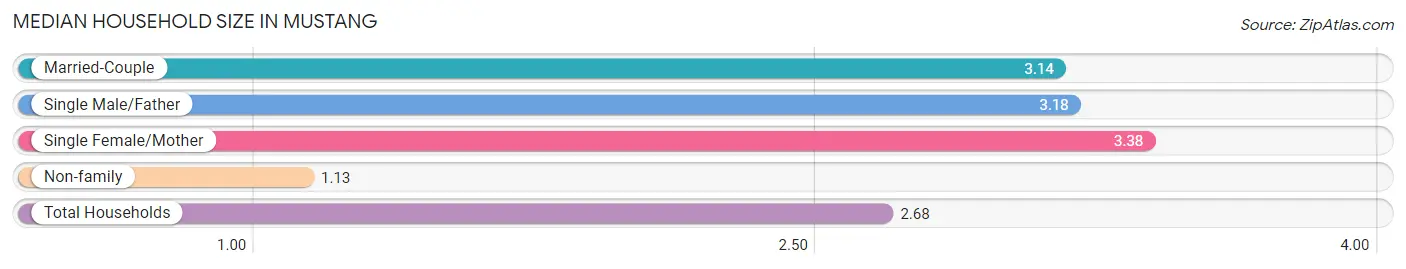
The median household size in Mustang is 2.68 persons per household, with single female/mother households (632 | 8.3%) accounting for the largest median household size of 3.38 persons per household. non-family households (1,831 | 24.0%) represent the smallest median household size with 1.13 persons per household.
| Household Type | # Households | Household Size |
| Married-Couple | 4,714 (61.9%) | 3.14 |
| Single Male/Father | 440 (5.8%) | 3.18 |
| Single Female/Mother | 632 (8.3%) | 3.38 |
| Non-family | 1,831 (24.0%) | 1.13 |
| Total Households | 7,617 (100.0%) | 2.68 |
Household Size by Marriage Status in Mustang
Out of a total of 7,617 households in Mustang, 5,786 (76.0%) are family households, while 1,831 (24.0%) are nonfamily households. The most numerous type of family households are 2-person households, comprising 2,875, and the most common type of nonfamily households are 1-person households, comprising 1,668.
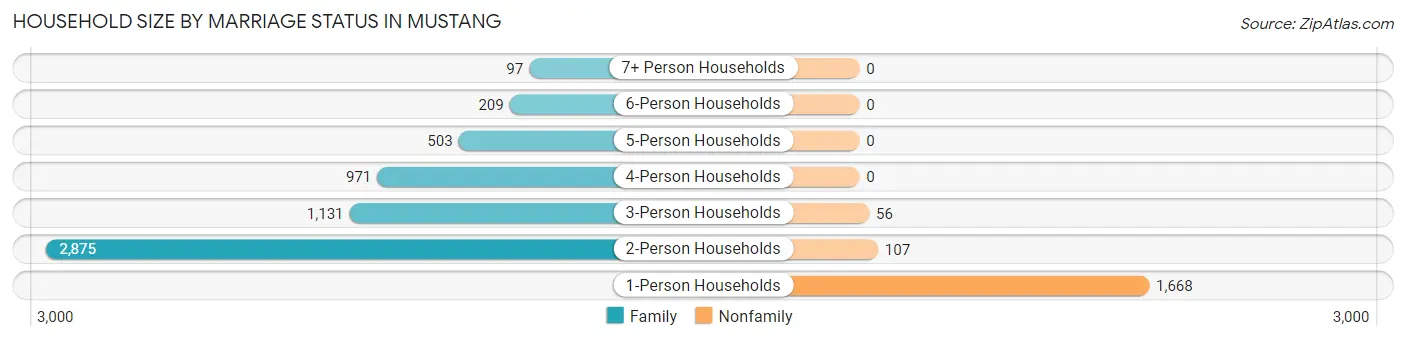
| Household Size | Family Households | Nonfamily Households |
| 1-Person Households | - | 1,668 (21.9%) |
| 2-Person Households | 2,875 (37.7%) | 107 (1.4%) |
| 3-Person Households | 1,131 (14.8%) | 56 (0.7%) |
| 4-Person Households | 971 (12.8%) | 0 (0.0%) |
| 5-Person Households | 503 (6.6%) | 0 (0.0%) |
| 6-Person Households | 209 (2.7%) | 0 (0.0%) |
| 7+ Person Households | 97 (1.3%) | 0 (0.0%) |
| Total | 5,786 (76.0%) | 1,831 (24.0%) |
Female Fertility in Mustang
Fertility by Age in Mustang
Average fertility rate in Mustang is 62.0 births per 1,000 women. Women in the age bracket of 20 to 34 years have the highest fertility rate with 132.0 births per 1,000 women. Women in the age bracket of 20 to 34 years acount for 80.5% of all women with births.
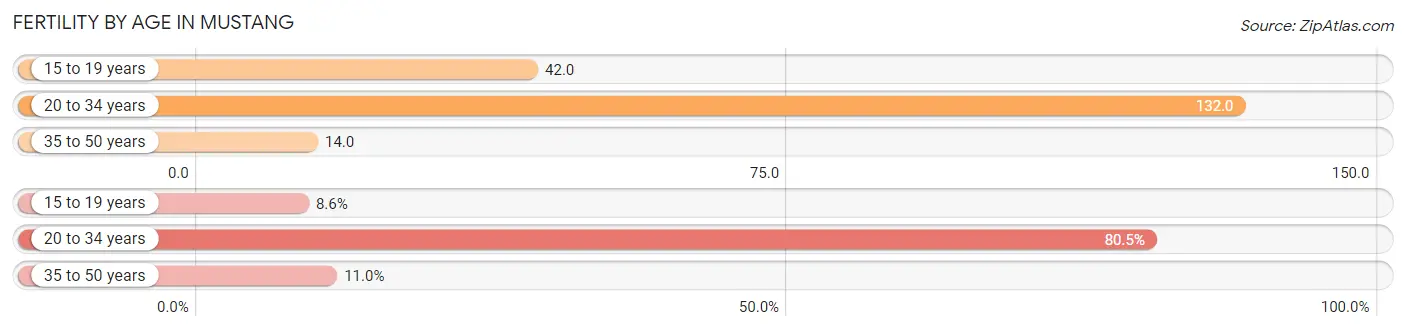
| Age Bracket | Women with Births | Births / 1,000 Women |
| 15 to 19 years | 25 (8.6%) | 42.0 |
| 20 to 34 years | 235 (80.5%) | 132.0 |
| 35 to 50 years | 32 (11.0%) | 14.0 |
| Total | 292 (100.0%) | 62.0 |
Fertility by Age by Marriage Status in Mustang
67.1% of women with births (292) in Mustang are married. The highest percentage of unmarried women with births falls into 15 to 19 years age bracket with 100.0% of them unmarried at the time of birth, while the lowest percentage of unmarried women with births belong to 35 to 50 years age bracket with 0.0% of them unmarried.
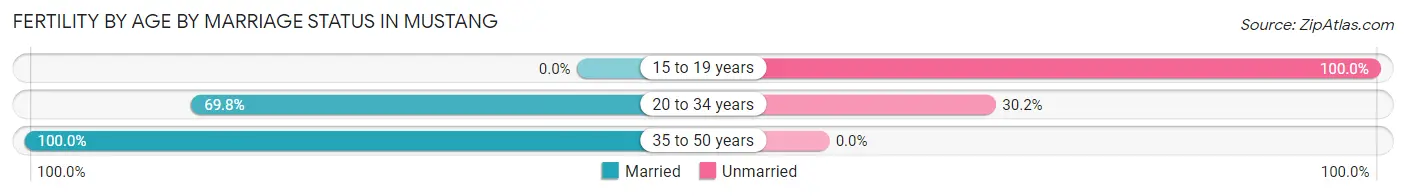
| Age Bracket | Married | Unmarried |
| 15 to 19 years | 0 (0.0%) | 25 (100.0%) |
| 20 to 34 years | 164 (69.8%) | 71 (30.2%) |
| 35 to 50 years | 32 (100.0%) | 0 (0.0%) |
| Total | 196 (67.1%) | 96 (32.9%) |
Fertility by Education in Mustang
Average fertility rate in Mustang is 62.0 births per 1,000 women. Women with the education attainment of bachelor's degree have the highest fertility rate of 108.0 births per 1,000 women, while women with the education attainment of less than high school have the lowest fertility at 40.0 births per 1,000 women. Women with the education attainment of bachelor's degree represent 38.7% of all women with births.
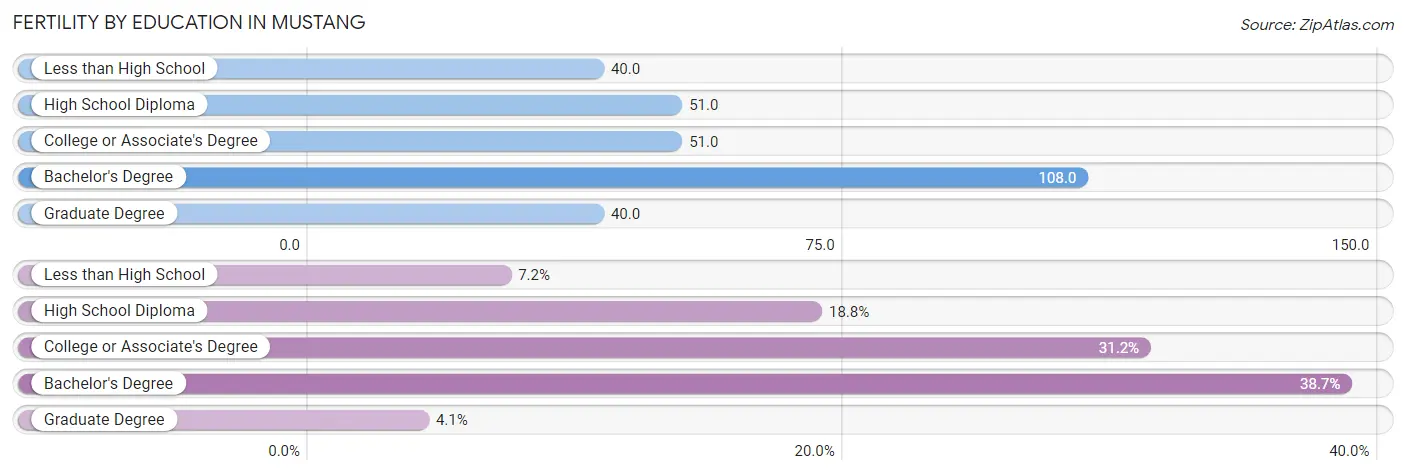
| Educational Attainment | Women with Births | Births / 1,000 Women |
| Less than High School | 21 (7.2%) | 40.0 |
| High School Diploma | 55 (18.8%) | 51.0 |
| College or Associate's Degree | 91 (31.2%) | 51.0 |
| Bachelor's Degree | 113 (38.7%) | 108.0 |
| Graduate Degree | 12 (4.1%) | 40.0 |
| Total | 292 (100.0%) | 62.0 |
Fertility by Education by Marriage Status in Mustang
32.9% of women with births in Mustang are unmarried. Women with the educational attainment of less than high school are most likely to be married with 100.0% of them married at childbirth, while women with the educational attainment of college or associate's degree are least likely to be married with 75.8% of them unmarried at childbirth.
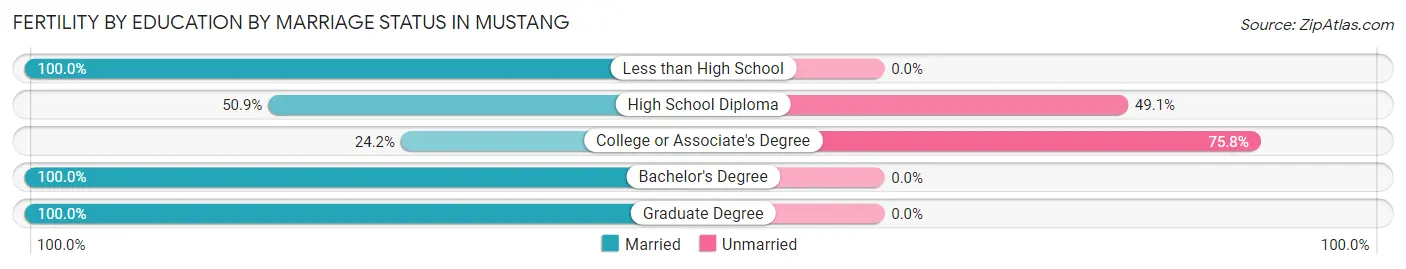
| Educational Attainment | Married | Unmarried |
| Less than High School | 21 (100.0%) | 0 (0.0%) |
| High School Diploma | 28 (50.9%) | 27 (49.1%) |
| College or Associate's Degree | 22 (24.2%) | 69 (75.8%) |
| Bachelor's Degree | 113 (100.0%) | 0 (0.0%) |
| Graduate Degree | 12 (100.0%) | 0 (0.0%) |
| Total | 196 (67.1%) | 96 (32.9%) |
Employment Characteristics in Mustang
Employment by Class of Employer in Mustang
Among the 10,282 employed individuals in Mustang, private company employees (7,057 | 68.6%), federal government employees (993 | 9.7%), and not-for-profit organizations (591 | 5.8%) make up the most common classes of employment.
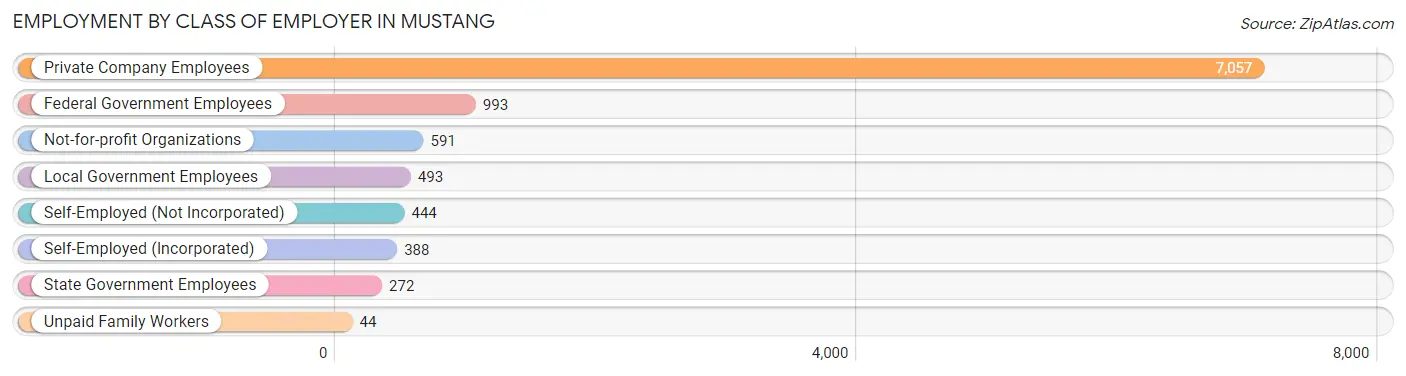
| Employer Class | # Employees | % Employees |
| Private Company Employees | 7,057 | 68.6% |
| Self-Employed (Incorporated) | 388 | 3.8% |
| Self-Employed (Not Incorporated) | 444 | 4.3% |
| Not-for-profit Organizations | 591 | 5.8% |
| Local Government Employees | 493 | 4.8% |
| State Government Employees | 272 | 2.6% |
| Federal Government Employees | 993 | 9.7% |
| Unpaid Family Workers | 44 | 0.4% |
| Total | 10,282 | 100.0% |
Employment Status by Age in Mustang
According to the labor force statistics for Mustang, out of the total population over 16 years of age (15,967), 68.0% or 10,858 individuals are in the labor force, with 4.1% or 445 of them unemployed. The age group with the highest labor force participation rate is 30 to 34 years, with 92.3% or 1,396 individuals in the labor force. Within the labor force, the 16 to 19 years age range has the highest percentage of unemployed individuals, with 24.8% or 141 of them being unemployed.
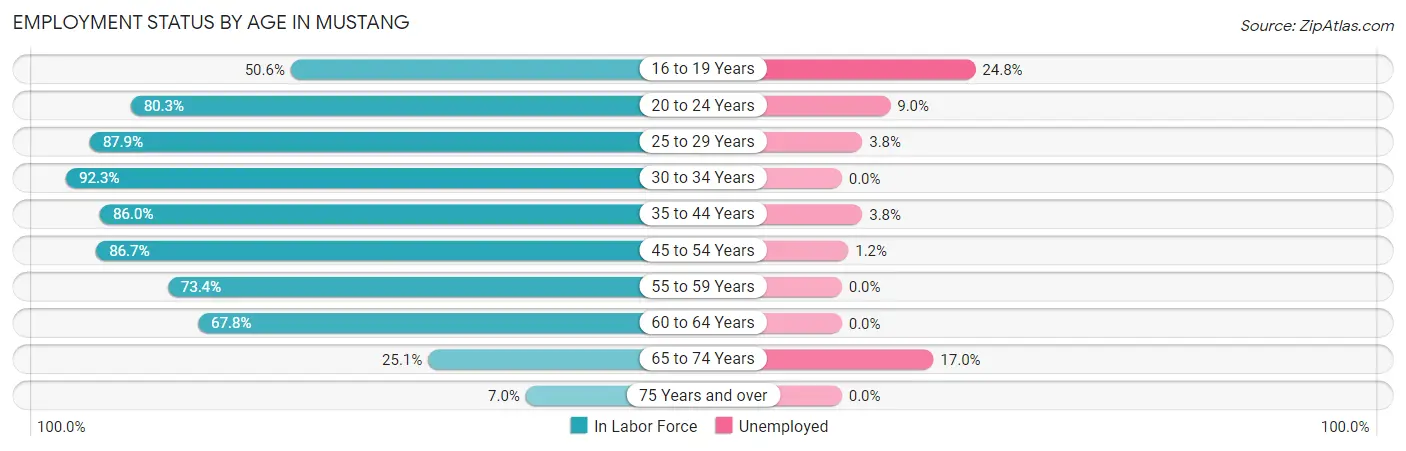
| Age Bracket | In Labor Force | Unemployed |
| 16 to 19 Years | 569 (50.6%) | 141 (24.8%) |
| 20 to 24 Years | 703 (80.3%) | 63 (9.0%) |
| 25 to 29 Years | 986 (87.9%) | 37 (3.8%) |
| 30 to 34 Years | 1,396 (92.3%) | 0 (0.0%) |
| 35 to 44 Years | 2,541 (86.0%) | 97 (3.8%) |
| 45 to 54 Years | 2,022 (86.7%) | 24 (1.2%) |
| 55 to 59 Years | 1,271 (73.4%) | 0 (0.0%) |
| 60 to 64 Years | 821 (67.8%) | 0 (0.0%) |
| 65 to 74 Years | 463 (25.1%) | 79 (17.0%) |
| 75 Years and over | 88 (7.0%) | 0 (0.0%) |
| Total | 10,858 (68.0%) | 445 (4.1%) |
Employment Status by Educational Attainment in Mustang
According to labor force statistics for Mustang, 83.2% of individuals (9,038) out of the total population between 25 and 64 years of age (10,863) are in the labor force, with 1.7% or 154 of them being unemployed. The group with the highest labor force participation rate are those with the educational attainment of bachelor's degree or higher, with 89.4% or 2,535 individuals in the labor force. Within the labor force, individuals with less than high school education have the highest percentage of unemployment, with 8.7% or 47 of them being unemployed.
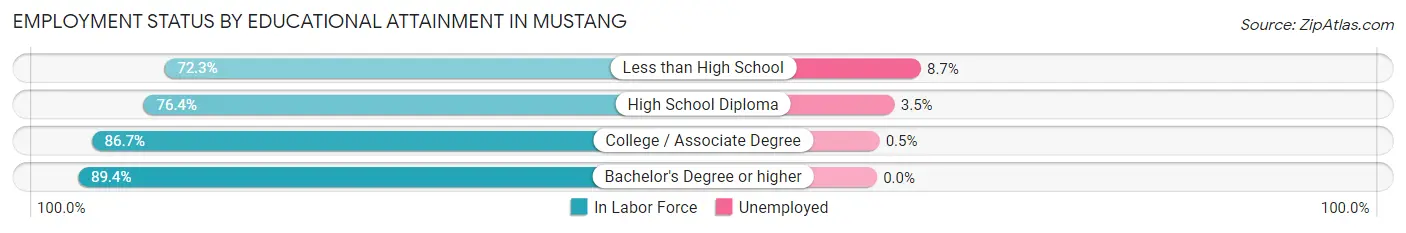
| Educational Attainment | In Labor Force | Unemployed |
| Less than High School | 539 (72.3%) | 65 (8.7%) |
| High School Diploma | 2,572 (76.4%) | 118 (3.5%) |
| College / Associate Degree | 3,394 (86.7%) | 20 (0.5%) |
| Bachelor's Degree or higher | 2,535 (89.4%) | 0 (0.0%) |
| Total | 9,038 (83.2%) | 185 (1.7%) |
Employment Occupations by Sex in Mustang
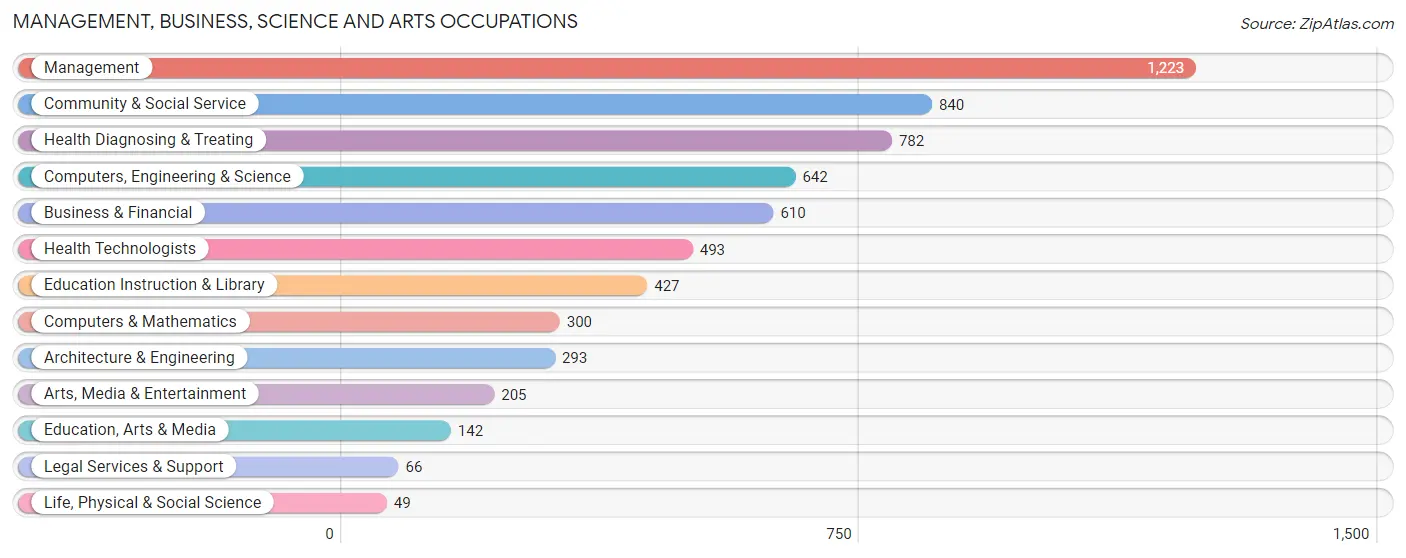
Management, Business, Science and Arts Occupations
The most common Management, Business, Science and Arts occupations in Mustang are Management (1,223 | 11.8%), Community & Social Service (840 | 8.1%), Health Diagnosing & Treating (782 | 7.5%), Computers, Engineering & Science (642 | 6.2%), and Business & Financial (610 | 5.9%).
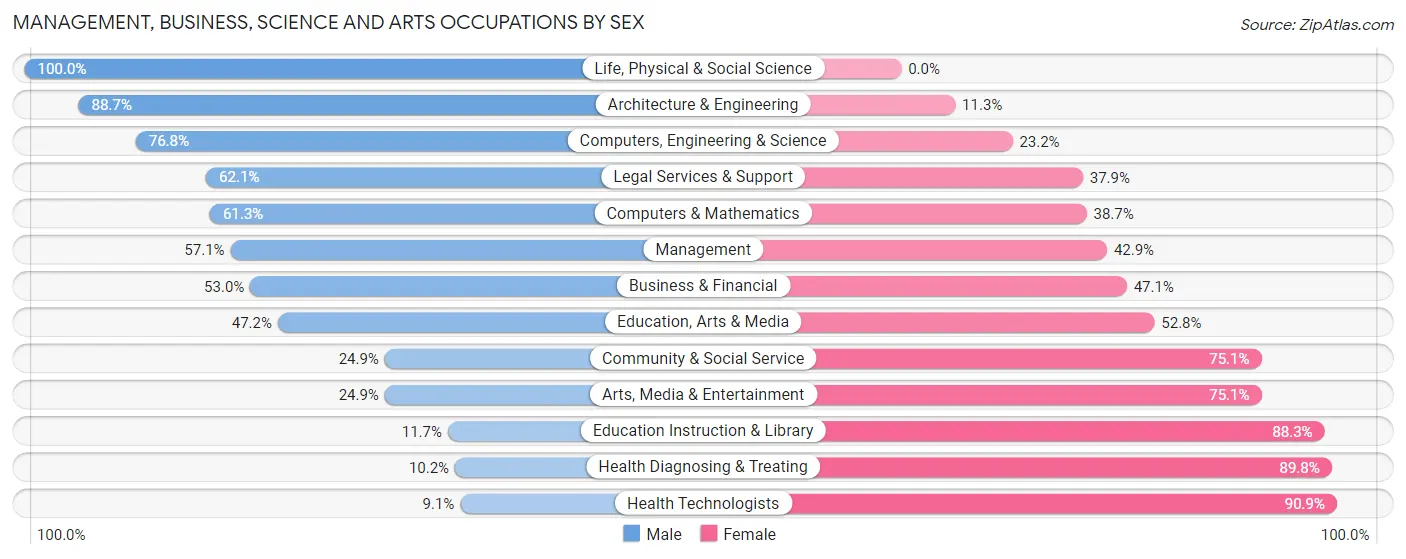
Management, Business, Science and Arts Occupations by Sex
Within the Management, Business, Science and Arts occupations in Mustang, the most male-oriented occupations are Life, Physical & Social Science (100.0%), Architecture & Engineering (88.7%), and Computers, Engineering & Science (76.8%), while the most female-oriented occupations are Health Technologists (90.9%), Health Diagnosing & Treating (89.8%), and Education Instruction & Library (88.3%).
| Occupation | Male | Female |
| Management | 698 (57.1%) | 525 (42.9%) |
| Business & Financial | 323 (52.9%) | 287 (47.0%) |
| Computers, Engineering & Science | 493 (76.8%) | 149 (23.2%) |
| Computers & Mathematics | 184 (61.3%) | 116 (38.7%) |
| Architecture & Engineering | 260 (88.7%) | 33 (11.3%) |
| Life, Physical & Social Science | 49 (100.0%) | 0 (0.0%) |
| Community & Social Service | 209 (24.9%) | 631 (75.1%) |
| Education, Arts & Media | 67 (47.2%) | 75 (52.8%) |
| Legal Services & Support | 41 (62.1%) | 25 (37.9%) |
| Education Instruction & Library | 50 (11.7%) | 377 (88.3%) |
| Arts, Media & Entertainment | 51 (24.9%) | 154 (75.1%) |
| Health Diagnosing & Treating | 80 (10.2%) | 702 (89.8%) |
| Health Technologists | 45 (9.1%) | 448 (90.9%) |
| Total (Category) | 1,803 (44.0%) | 2,294 (56.0%) |
| Total (Overall) | 5,689 (54.9%) | 4,664 (45.1%) |
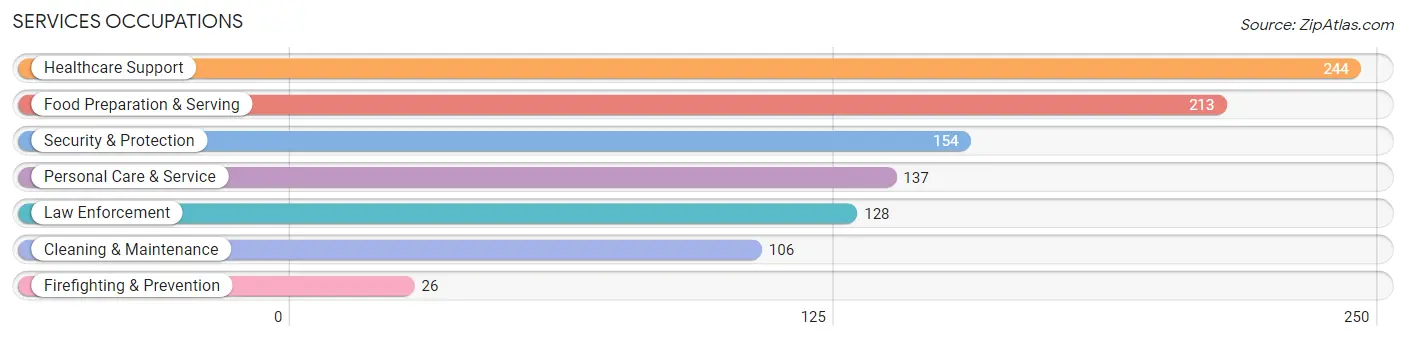
Services Occupations
The most common Services occupations in Mustang are Healthcare Support (244 | 2.4%), Food Preparation & Serving (213 | 2.1%), Security & Protection (154 | 1.5%), Personal Care & Service (137 | 1.3%), and Law Enforcement (128 | 1.2%).
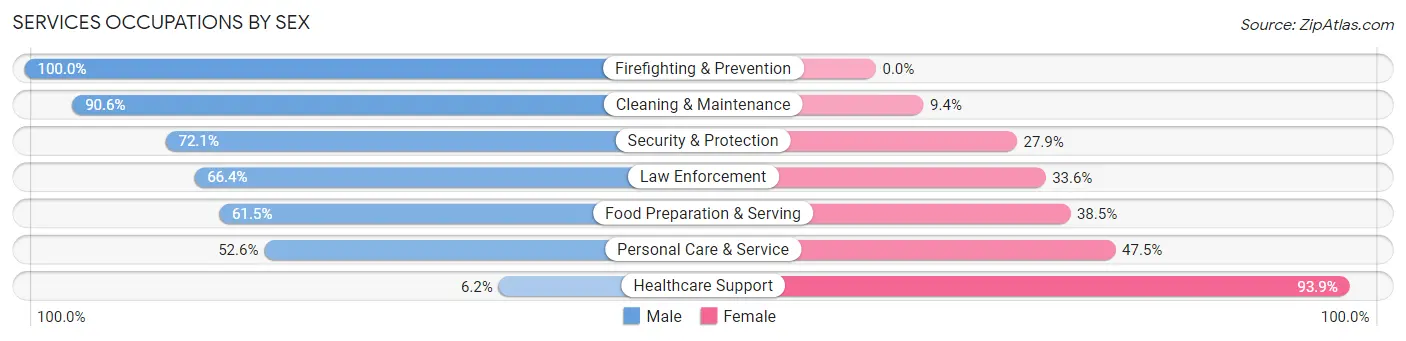
Services Occupations by Sex
Within the Services occupations in Mustang, the most male-oriented occupations are Firefighting & Prevention (100.0%), Cleaning & Maintenance (90.6%), and Security & Protection (72.1%), while the most female-oriented occupations are Healthcare Support (93.9%), Personal Care & Service (47.4%), and Food Preparation & Serving (38.5%).
| Occupation | Male | Female |
| Healthcare Support | 15 (6.1%) | 229 (93.9%) |
| Security & Protection | 111 (72.1%) | 43 (27.9%) |
| Firefighting & Prevention | 26 (100.0%) | 0 (0.0%) |
| Law Enforcement | 85 (66.4%) | 43 (33.6%) |
| Food Preparation & Serving | 131 (61.5%) | 82 (38.5%) |
| Cleaning & Maintenance | 96 (90.6%) | 10 (9.4%) |
| Personal Care & Service | 72 (52.5%) | 65 (47.4%) |
| Total (Category) | 425 (49.8%) | 429 (50.2%) |
| Total (Overall) | 5,689 (54.9%) | 4,664 (45.1%) |
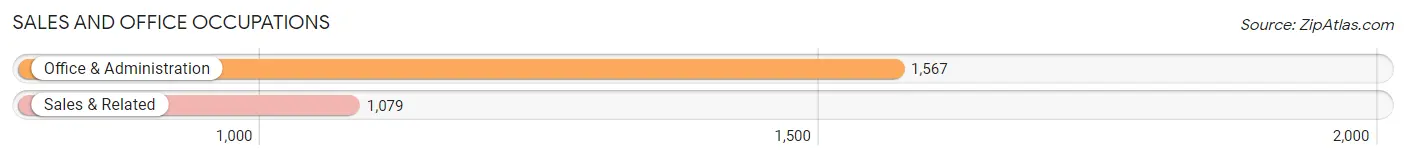
Sales and Office Occupations
The most common Sales and Office occupations in Mustang are Office & Administration (1,567 | 15.1%), and Sales & Related (1,079 | 10.4%).
Sales and Office Occupations by Sex
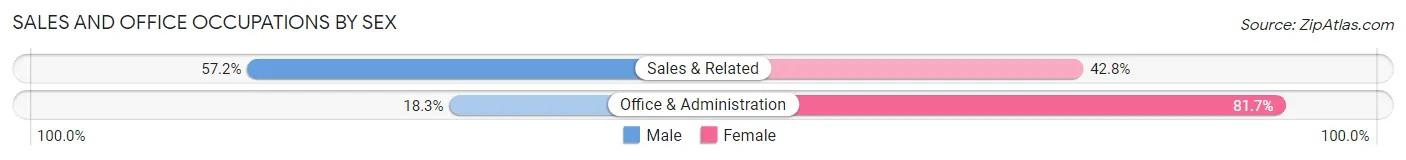
| Occupation | Male | Female |
| Sales & Related | 617 (57.2%) | 462 (42.8%) |
| Office & Administration | 287 (18.3%) | 1,280 (81.7%) |
| Total (Category) | 904 (34.2%) | 1,742 (65.8%) |
| Total (Overall) | 5,689 (54.9%) | 4,664 (45.1%) |
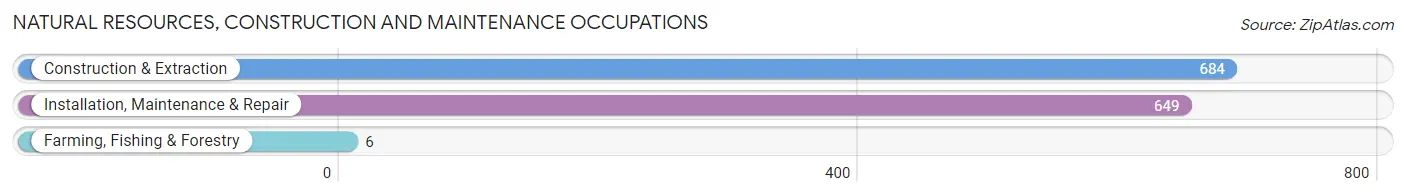
Natural Resources, Construction and Maintenance Occupations
The most common Natural Resources, Construction and Maintenance occupations in Mustang are Construction & Extraction (684 | 6.6%), Installation, Maintenance & Repair (649 | 6.3%), and Farming, Fishing & Forestry (6 | 0.1%).
Natural Resources, Construction and Maintenance Occupations by Sex
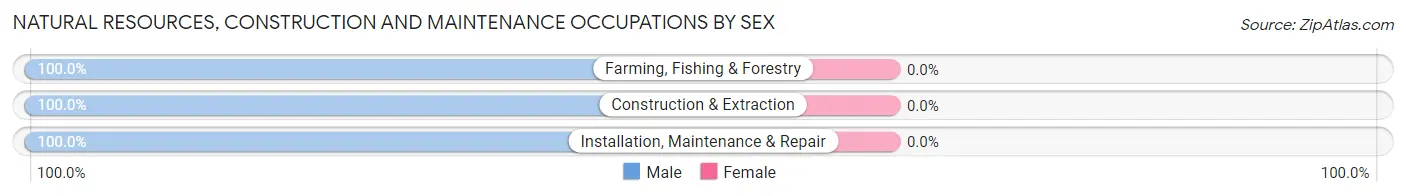
| Occupation | Male | Female |
| Farming, Fishing & Forestry | 6 (100.0%) | 0 (0.0%) |
| Construction & Extraction | 684 (100.0%) | 0 (0.0%) |
| Installation, Maintenance & Repair | 649 (100.0%) | 0 (0.0%) |
| Total (Category) | 1,339 (100.0%) | 0 (0.0%) |
| Total (Overall) | 5,689 (54.9%) | 4,664 (45.1%) |
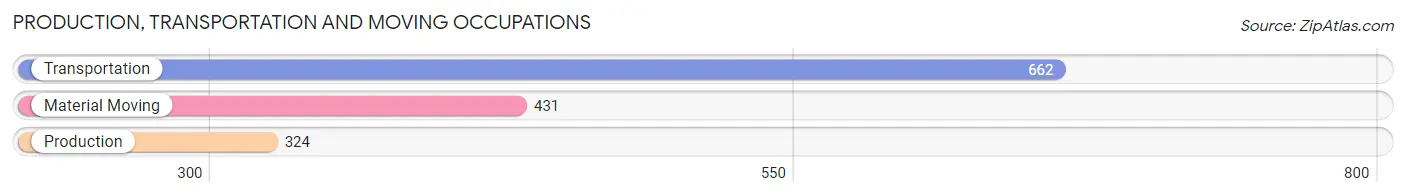
Production, Transportation and Moving Occupations
The most common Production, Transportation and Moving occupations in Mustang are Transportation (662 | 6.4%), Material Moving (431 | 4.2%), and Production (324 | 3.1%).
Production, Transportation and Moving Occupations by Sex
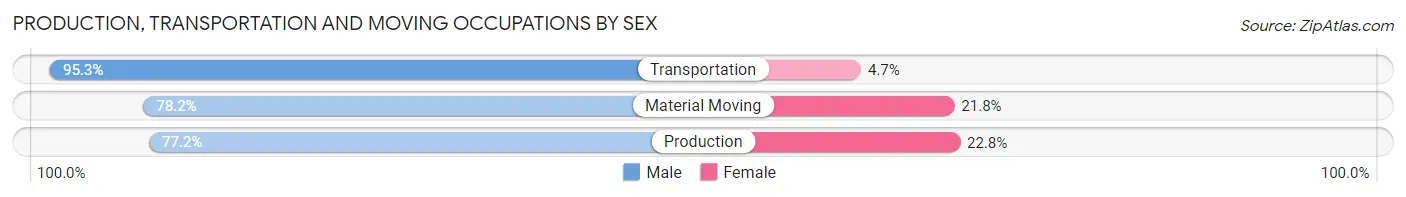
| Occupation | Male | Female |
| Production | 250 (77.2%) | 74 (22.8%) |
| Transportation | 631 (95.3%) | 31 (4.7%) |
| Material Moving | 337 (78.2%) | 94 (21.8%) |
| Total (Category) | 1,218 (86.0%) | 199 (14.0%) |
| Total (Overall) | 5,689 (54.9%) | 4,664 (45.1%) |
Employment Industries by Sex in Mustang
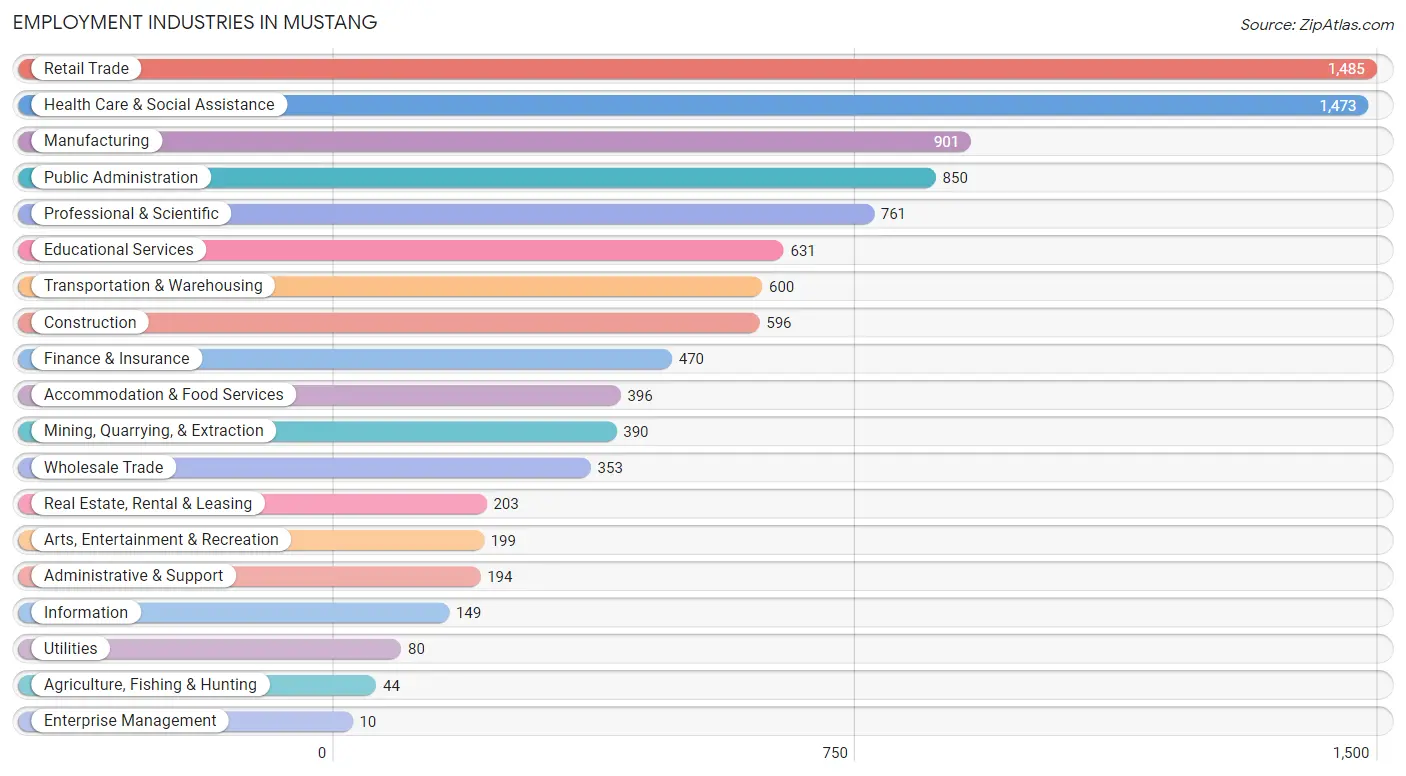
Employment Industries in Mustang
The major employment industries in Mustang include Retail Trade (1,485 | 14.3%), Health Care & Social Assistance (1,473 | 14.2%), Manufacturing (901 | 8.7%), Public Administration (850 | 8.2%), and Professional & Scientific (761 | 7.3%).
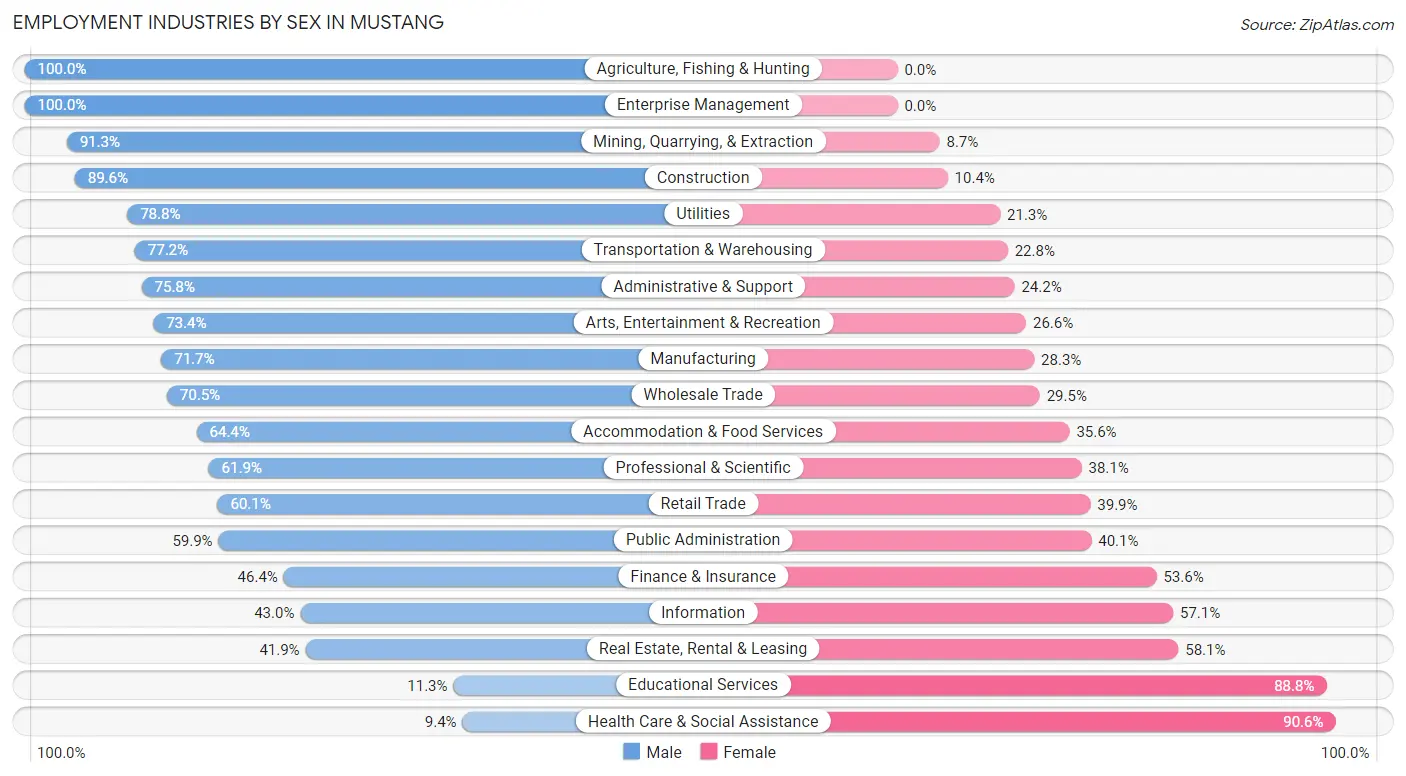
Employment Industries by Sex in Mustang
The Mustang industries that see more men than women are Agriculture, Fishing & Hunting (100.0%), Enterprise Management (100.0%), and Mining, Quarrying, & Extraction (91.3%), whereas the industries that tend to have a higher number of women are Health Care & Social Assistance (90.6%), Educational Services (88.7%), and Real Estate, Rental & Leasing (58.1%).
| Industry | Male | Female |
| Agriculture, Fishing & Hunting | 44 (100.0%) | 0 (0.0%) |
| Mining, Quarrying, & Extraction | 356 (91.3%) | 34 (8.7%) |
| Construction | 534 (89.6%) | 62 (10.4%) |
| Manufacturing | 646 (71.7%) | 255 (28.3%) |
| Wholesale Trade | 249 (70.5%) | 104 (29.5%) |
| Retail Trade | 892 (60.1%) | 593 (39.9%) |
| Transportation & Warehousing | 463 (77.2%) | 137 (22.8%) |
| Utilities | 63 (78.7%) | 17 (21.2%) |
| Information | 64 (42.9%) | 85 (57.1%) |
| Finance & Insurance | 218 (46.4%) | 252 (53.6%) |
| Real Estate, Rental & Leasing | 85 (41.9%) | 118 (58.1%) |
| Professional & Scientific | 471 (61.9%) | 290 (38.1%) |
| Enterprise Management | 10 (100.0%) | 0 (0.0%) |
| Administrative & Support | 147 (75.8%) | 47 (24.2%) |
| Educational Services | 71 (11.3%) | 560 (88.7%) |
| Health Care & Social Assistance | 138 (9.4%) | 1,335 (90.6%) |
| Arts, Entertainment & Recreation | 146 (73.4%) | 53 (26.6%) |
| Accommodation & Food Services | 255 (64.4%) | 141 (35.6%) |
| Public Administration | 509 (59.9%) | 341 (40.1%) |
| Total | 5,689 (54.9%) | 4,664 (45.1%) |
Education in Mustang
School Enrollment in Mustang
The most common levels of schooling among the 4,933 students in Mustang are elementary school (1,277 | 25.9%), middle school (1,211 | 24.5%), and high school (1,078 | 21.8%).
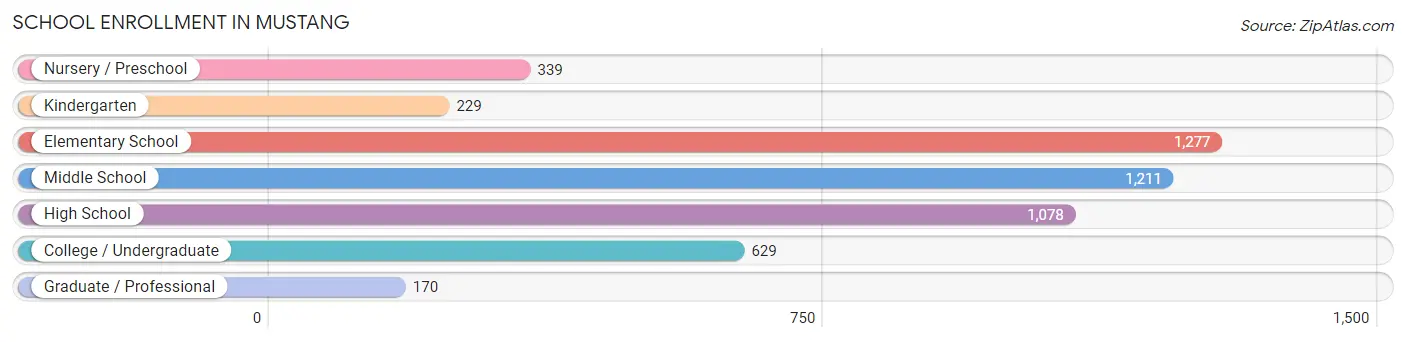
| School Level | # Students | % Students |
| Nursery / Preschool | 339 | 6.9% |
| Kindergarten | 229 | 4.6% |
| Elementary School | 1,277 | 25.9% |
| Middle School | 1,211 | 24.5% |
| High School | 1,078 | 21.8% |
| College / Undergraduate | 629 | 12.8% |
| Graduate / Professional | 170 | 3.5% |
| Total | 4,933 | 100.0% |
School Enrollment by Age by Funding Source in Mustang
Out of a total of 4,933 students who are enrolled in schools in Mustang, 429 (8.7%) attend a private institution, while the remaining 4,504 (91.3%) are enrolled in public schools. The age group of 25 to 34 year olds has the highest likelihood of being enrolled in private schools, with 68 (34.3% in the age bracket) enrolled. Conversely, the age group of 15 to 17 year olds has the lowest likelihood of being enrolled in a private school, with 658 (99.0% in the age bracket) attending a public institution.
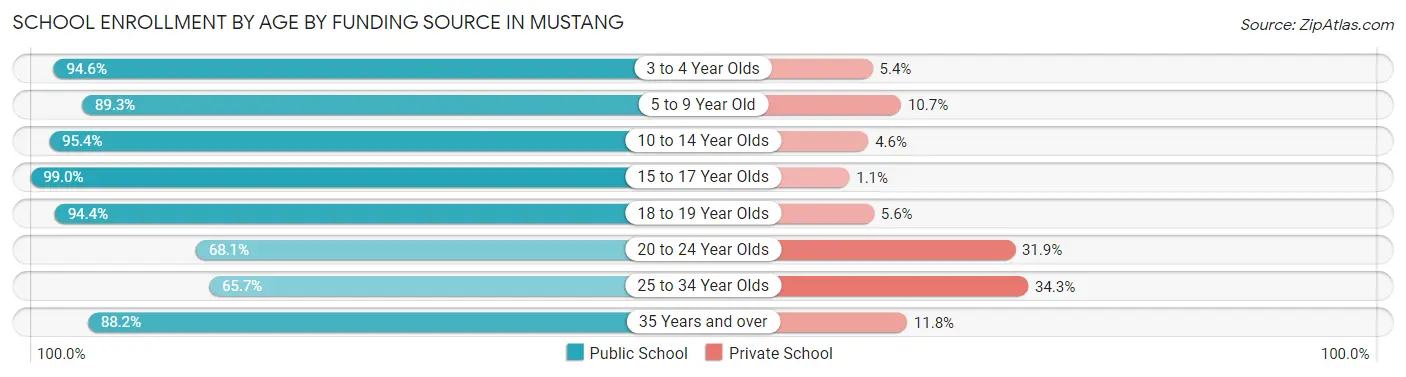
| Age Bracket | Public School | Private School |
| 3 to 4 Year Olds | 193 (94.6%) | 11 (5.4%) |
| 5 to 9 Year Old | 1,279 (89.3%) | 153 (10.7%) |
| 10 to 14 Year Olds | 1,504 (95.4%) | 72 (4.6%) |
| 15 to 17 Year Olds | 658 (99.0%) | 7 (1.1%) |
| 18 to 19 Year Olds | 336 (94.4%) | 20 (5.6%) |
| 20 to 24 Year Olds | 128 (68.1%) | 60 (31.9%) |
| 25 to 34 Year Olds | 130 (65.7%) | 68 (34.3%) |
| 35 Years and over | 277 (88.2%) | 37 (11.8%) |
| Total | 4,504 (91.3%) | 429 (8.7%) |
Educational Attainment by Field of Study in Mustang
Business (1,039 | 28.8%), education (431 | 11.9%), science & technology (377 | 10.4%), arts & humanities (352 | 9.8%), and engineering (222 | 6.1%) are the most common fields of study among 3,607 individuals in Mustang who have obtained a bachelor's degree or higher.
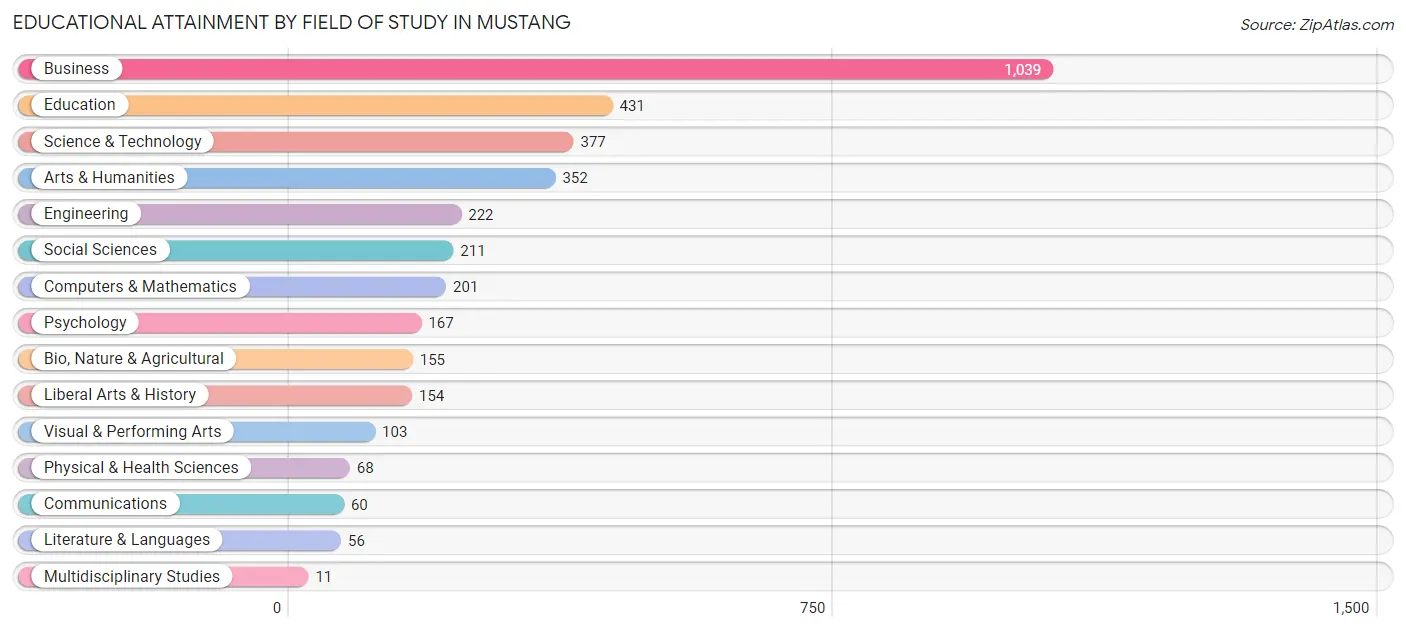
| Field of Study | # Graduates | % Graduates |
| Computers & Mathematics | 201 | 5.6% |
| Bio, Nature & Agricultural | 155 | 4.3% |
| Physical & Health Sciences | 68 | 1.9% |
| Psychology | 167 | 4.6% |
| Social Sciences | 211 | 5.9% |
| Engineering | 222 | 6.1% |
| Multidisciplinary Studies | 11 | 0.3% |
| Science & Technology | 377 | 10.4% |
| Business | 1,039 | 28.8% |
| Education | 431 | 11.9% |
| Literature & Languages | 56 | 1.5% |
| Liberal Arts & History | 154 | 4.3% |
| Visual & Performing Arts | 103 | 2.9% |
| Communications | 60 | 1.7% |
| Arts & Humanities | 352 | 9.8% |
| Total | 3,607 | 100.0% |
Transportation & Commute in Mustang
Vehicle Availability by Sex in Mustang
The most prevalent vehicle ownership categories in Mustang are males with 2 vehicles (2,641, accounting for 46.9%) and females with 2 vehicles (2,058, making up 56.9%).
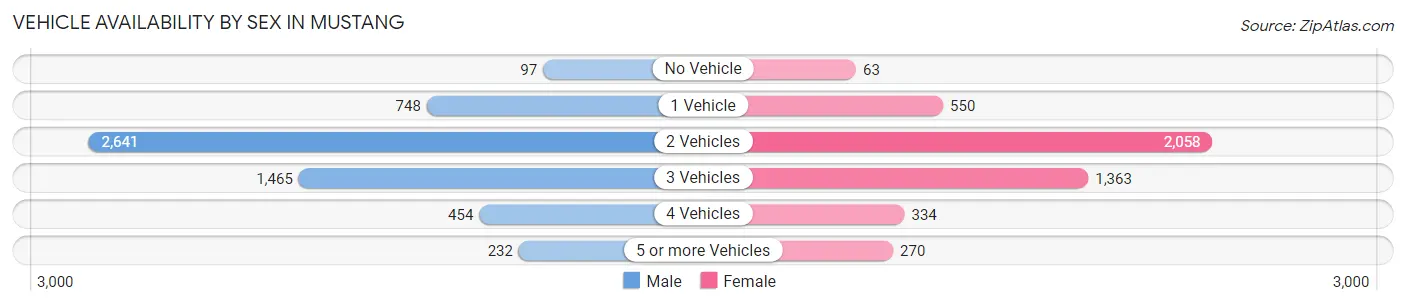
| Vehicles Available | Male | Female |
| No Vehicle | 97 (1.7%) | 63 (1.4%) |
| 1 Vehicle | 748 (13.3%) | 550 (11.9%) |
| 2 Vehicles | 2,641 (46.9%) | 2,058 (44.4%) |
| 3 Vehicles | 1,465 (26.0%) | 1,363 (29.4%) |
| 4 Vehicles | 454 (8.1%) | 334 (7.2%) |
| 5 or more Vehicles | 232 (4.1%) | 270 (5.8%) |
| Total | 5,637 (100.0%) | 4,638 (100.0%) |
Commute Time in Mustang
The most frequently occuring commute durations in Mustang are 30 to 34 minutes (2,106 commuters, 22.7%), 20 to 24 minutes (1,284 commuters, 13.8%), and 15 to 19 minutes (1,266 commuters, 13.6%).
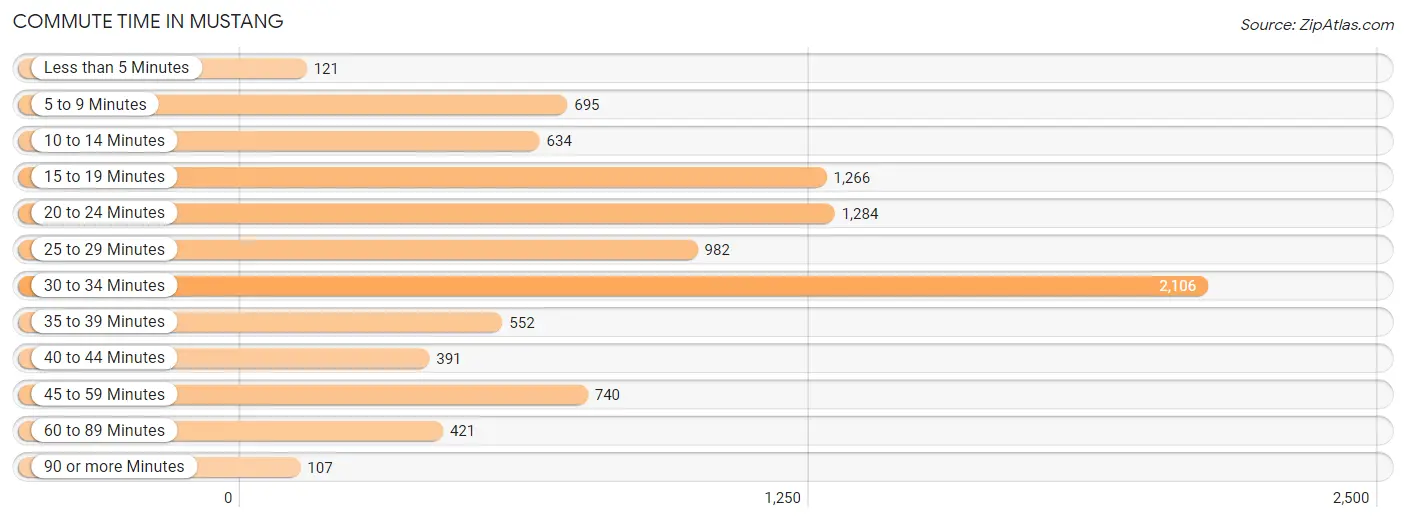
| Commute Time | # Commuters | % Commuters |
| Less than 5 Minutes | 121 | 1.3% |
| 5 to 9 Minutes | 695 | 7.5% |
| 10 to 14 Minutes | 634 | 6.8% |
| 15 to 19 Minutes | 1,266 | 13.6% |
| 20 to 24 Minutes | 1,284 | 13.8% |
| 25 to 29 Minutes | 982 | 10.6% |
| 30 to 34 Minutes | 2,106 | 22.7% |
| 35 to 39 Minutes | 552 | 5.9% |
| 40 to 44 Minutes | 391 | 4.2% |
| 45 to 59 Minutes | 740 | 8.0% |
| 60 to 89 Minutes | 421 | 4.5% |
| 90 or more Minutes | 107 | 1.1% |
Commute Time by Sex in Mustang
The most common commute times in Mustang are 30 to 34 minutes (1,087 commuters, 20.8%) for males and 30 to 34 minutes (1,019 commuters, 25.0%) for females.
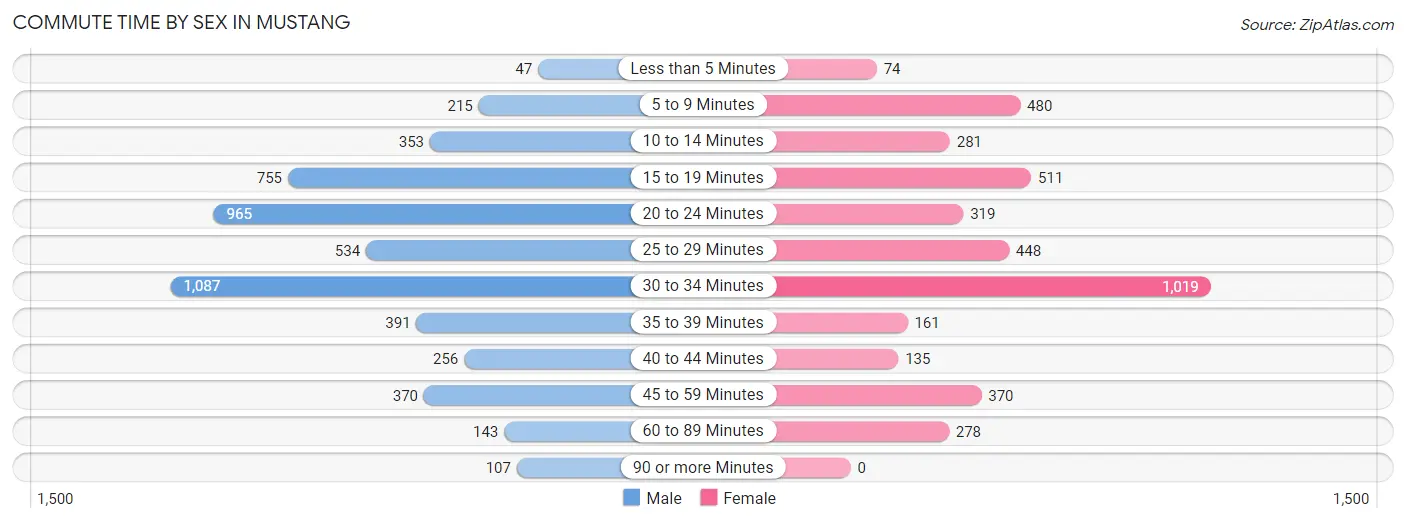
| Commute Time | Male | Female |
| Less than 5 Minutes | 47 (0.9%) | 74 (1.8%) |
| 5 to 9 Minutes | 215 (4.1%) | 480 (11.8%) |
| 10 to 14 Minutes | 353 (6.8%) | 281 (6.9%) |
| 15 to 19 Minutes | 755 (14.5%) | 511 (12.5%) |
| 20 to 24 Minutes | 965 (18.5%) | 319 (7.8%) |
| 25 to 29 Minutes | 534 (10.2%) | 448 (11.0%) |
| 30 to 34 Minutes | 1,087 (20.8%) | 1,019 (25.0%) |
| 35 to 39 Minutes | 391 (7.5%) | 161 (4.0%) |
| 40 to 44 Minutes | 256 (4.9%) | 135 (3.3%) |
| 45 to 59 Minutes | 370 (7.1%) | 370 (9.1%) |
| 60 to 89 Minutes | 143 (2.7%) | 278 (6.8%) |
| 90 or more Minutes | 107 (2.1%) | 0 (0.0%) |
Time of Departure to Work by Sex in Mustang
The most frequent times of departure to work in Mustang are 7:00 AM to 7:29 AM (924, 17.7%) for males and 7:30 AM to 7:59 AM (712, 17.5%) for females.
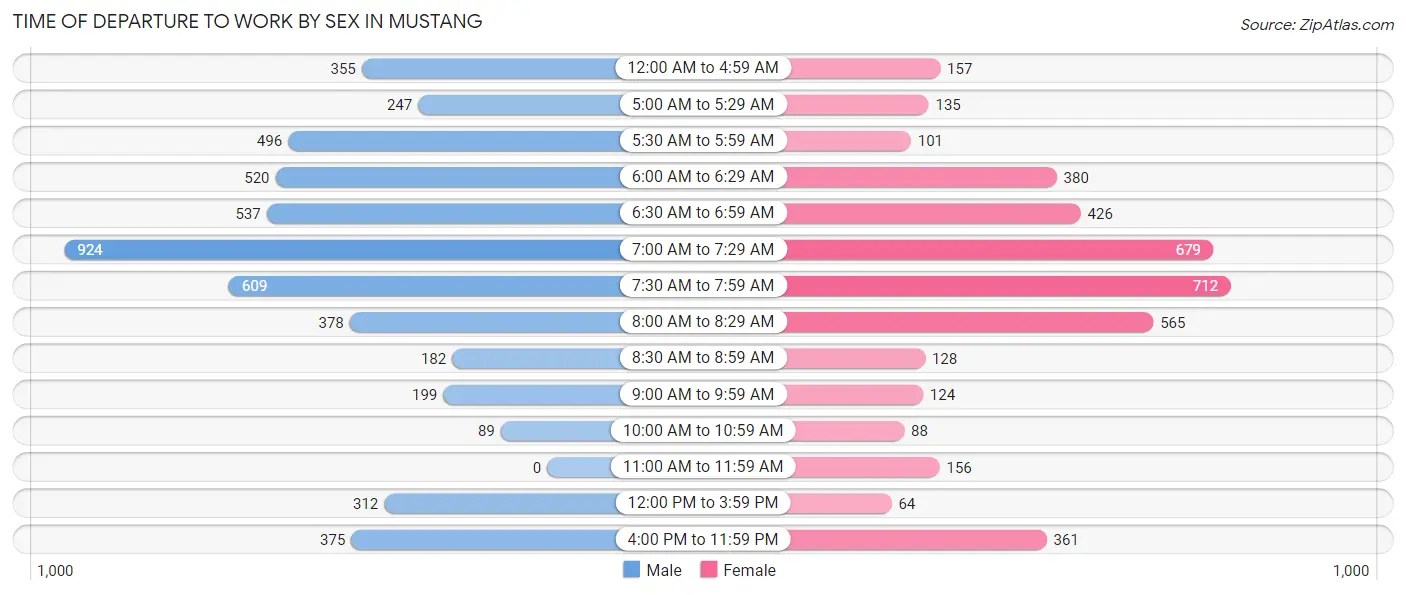
| Time of Departure | Male | Female |
| 12:00 AM to 4:59 AM | 355 (6.8%) | 157 (3.8%) |
| 5:00 AM to 5:29 AM | 247 (4.7%) | 135 (3.3%) |
| 5:30 AM to 5:59 AM | 496 (9.5%) | 101 (2.5%) |
| 6:00 AM to 6:29 AM | 520 (10.0%) | 380 (9.3%) |
| 6:30 AM to 6:59 AM | 537 (10.3%) | 426 (10.4%) |
| 7:00 AM to 7:29 AM | 924 (17.7%) | 679 (16.7%) |
| 7:30 AM to 7:59 AM | 609 (11.7%) | 712 (17.5%) |
| 8:00 AM to 8:29 AM | 378 (7.2%) | 565 (13.9%) |
| 8:30 AM to 8:59 AM | 182 (3.5%) | 128 (3.1%) |
| 9:00 AM to 9:59 AM | 199 (3.8%) | 124 (3.0%) |
| 10:00 AM to 10:59 AM | 89 (1.7%) | 88 (2.2%) |
| 11:00 AM to 11:59 AM | 0 (0.0%) | 156 (3.8%) |
| 12:00 PM to 3:59 PM | 312 (6.0%) | 64 (1.6%) |
| 4:00 PM to 11:59 PM | 375 (7.2%) | 361 (8.9%) |
| Total | 5,223 (100.0%) | 4,076 (100.0%) |
Housing Occupancy in Mustang
Occupancy by Ownership in Mustang
Of the total 7,617 dwellings in Mustang, owner-occupied units account for 5,892 (77.3%), while renter-occupied units make up 1,725 (22.7%).
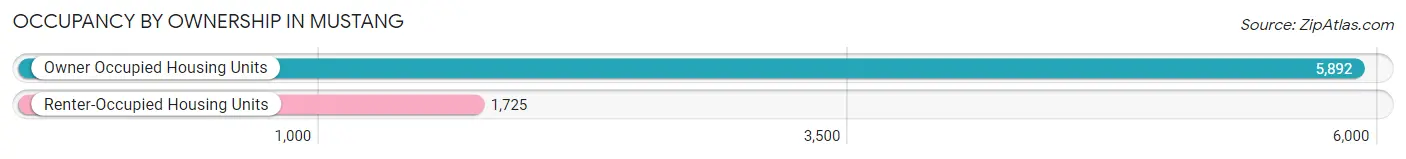
| Occupancy | # Housing Units | % Housing Units |
| Owner Occupied Housing Units | 5,892 | 77.3% |
| Renter-Occupied Housing Units | 1,725 | 22.7% |
| Total Occupied Housing Units | 7,617 | 100.0% |
Occupancy by Household Size in Mustang
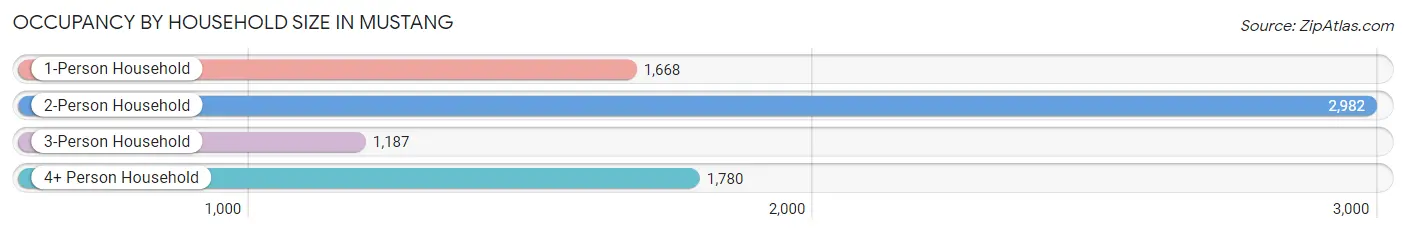
| Household Size | # Housing Units | % Housing Units |
| 1-Person Household | 1,668 | 21.9% |
| 2-Person Household | 2,982 | 39.2% |
| 3-Person Household | 1,187 | 15.6% |
| 4+ Person Household | 1,780 | 23.4% |
| Total Housing Units | 7,617 | 100.0% |
Occupancy by Ownership by Household Size in Mustang
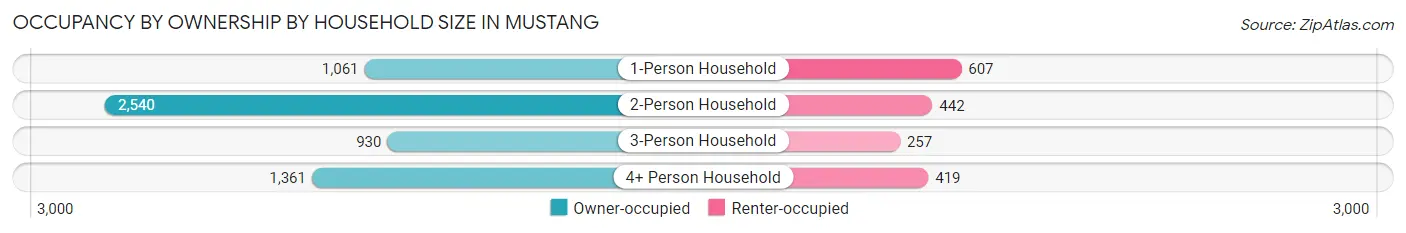
| Household Size | Owner-occupied | Renter-occupied |
| 1-Person Household | 1,061 (63.6%) | 607 (36.4%) |
| 2-Person Household | 2,540 (85.2%) | 442 (14.8%) |
| 3-Person Household | 930 (78.3%) | 257 (21.6%) |
| 4+ Person Household | 1,361 (76.5%) | 419 (23.5%) |
| Total Housing Units | 5,892 (77.3%) | 1,725 (22.7%) |
Occupancy by Educational Attainment in Mustang
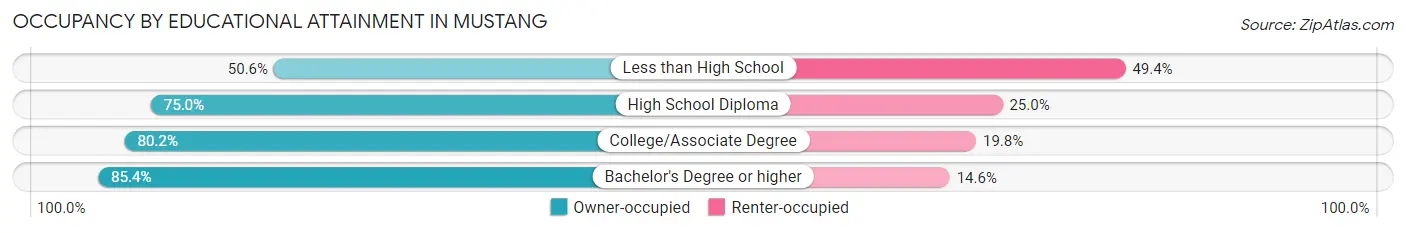
| Household Size | Owner-occupied | Renter-occupied |
| Less than High School | 307 (50.6%) | 300 (49.4%) |
| High School Diploma | 1,913 (75.0%) | 639 (25.0%) |
| College/Associate Degree | 2,085 (80.2%) | 515 (19.8%) |
| Bachelor's Degree or higher | 1,587 (85.4%) | 271 (14.6%) |
Occupancy by Age of Householder in Mustang
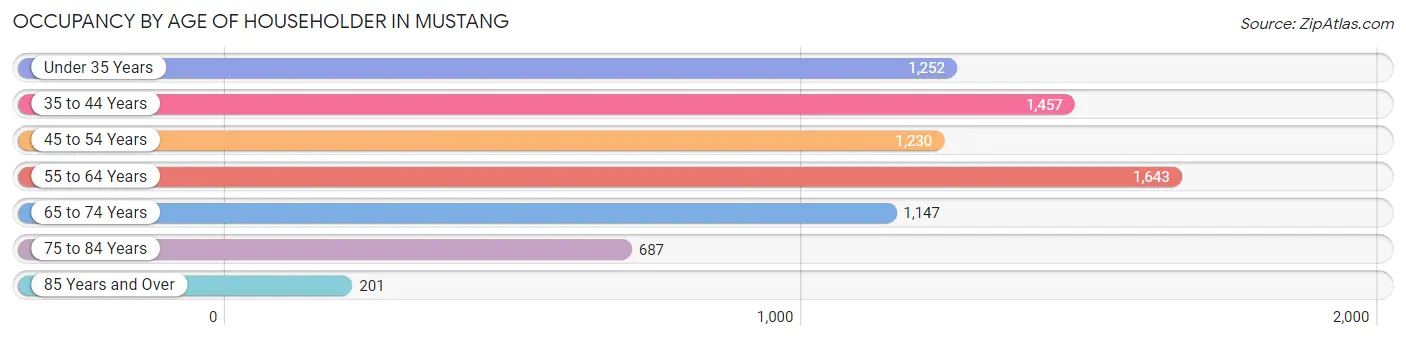
| Age Bracket | # Households | % Households |
| Under 35 Years | 1,252 | 16.4% |
| 35 to 44 Years | 1,457 | 19.1% |
| 45 to 54 Years | 1,230 | 16.2% |
| 55 to 64 Years | 1,643 | 21.6% |
| 65 to 74 Years | 1,147 | 15.1% |
| 75 to 84 Years | 687 | 9.0% |
| 85 Years and Over | 201 | 2.6% |
| Total | 7,617 | 100.0% |
Housing Finances in Mustang
Median Income by Occupancy in Mustang
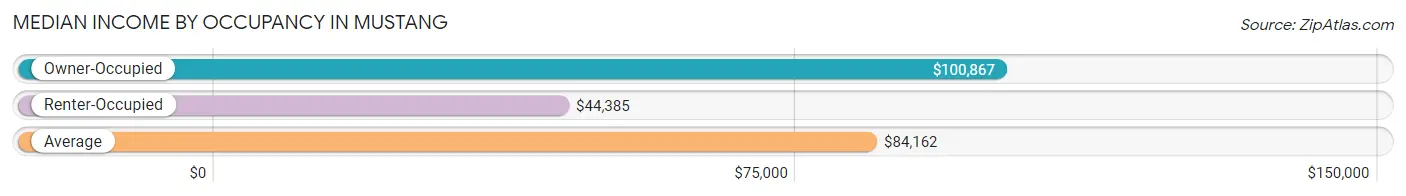
| Occupancy Type | # Households | Median Income |
| Owner-Occupied | 5,892 (77.3%) | $100,867 |
| Renter-Occupied | 1,725 (22.7%) | $44,385 |
| Average | 7,617 (100.0%) | $84,162 |
Occupancy by Householder Income Bracket in Mustang
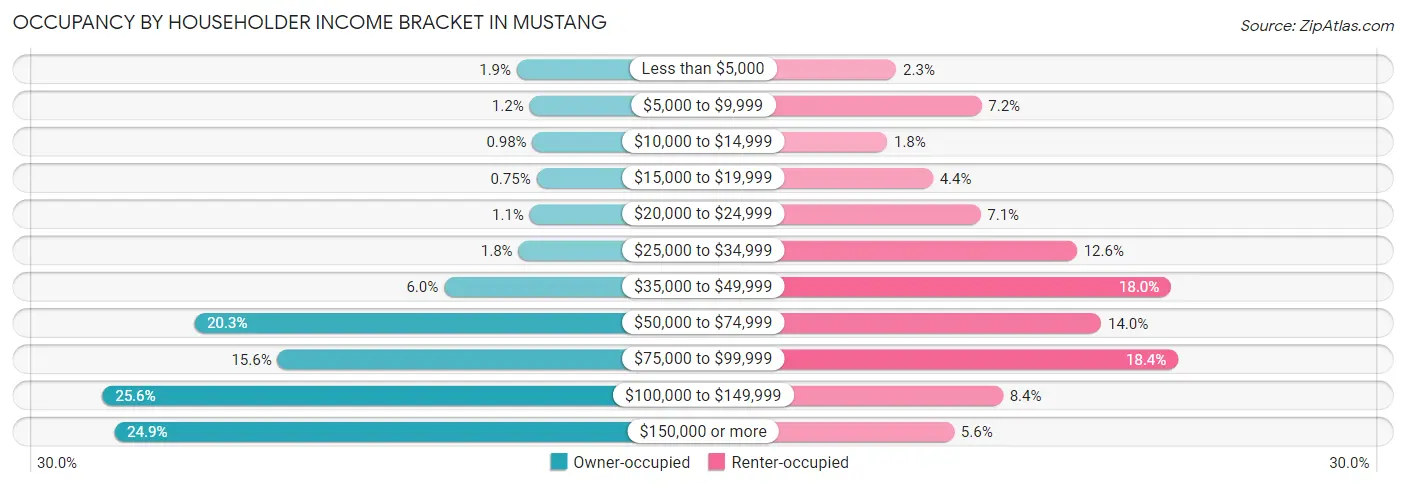
| Income Bracket | Owner-occupied | Renter-occupied |
| Less than $5,000 | 110 (1.9%) | 40 (2.3%) |
| $5,000 to $9,999 | 68 (1.1%) | 124 (7.2%) |
| $10,000 to $14,999 | 58 (1.0%) | 31 (1.8%) |
| $15,000 to $19,999 | 44 (0.7%) | 76 (4.4%) |
| $20,000 to $24,999 | 67 (1.1%) | 123 (7.1%) |
| $25,000 to $34,999 | 105 (1.8%) | 218 (12.6%) |
| $35,000 to $49,999 | 355 (6.0%) | 311 (18.0%) |
| $50,000 to $74,999 | 1,197 (20.3%) | 242 (14.0%) |
| $75,000 to $99,999 | 916 (15.5%) | 318 (18.4%) |
| $100,000 to $149,999 | 1,506 (25.6%) | 145 (8.4%) |
| $150,000 or more | 1,466 (24.9%) | 97 (5.6%) |
| Total | 5,892 (100.0%) | 1,725 (100.0%) |
Monthly Housing Cost Tiers in Mustang
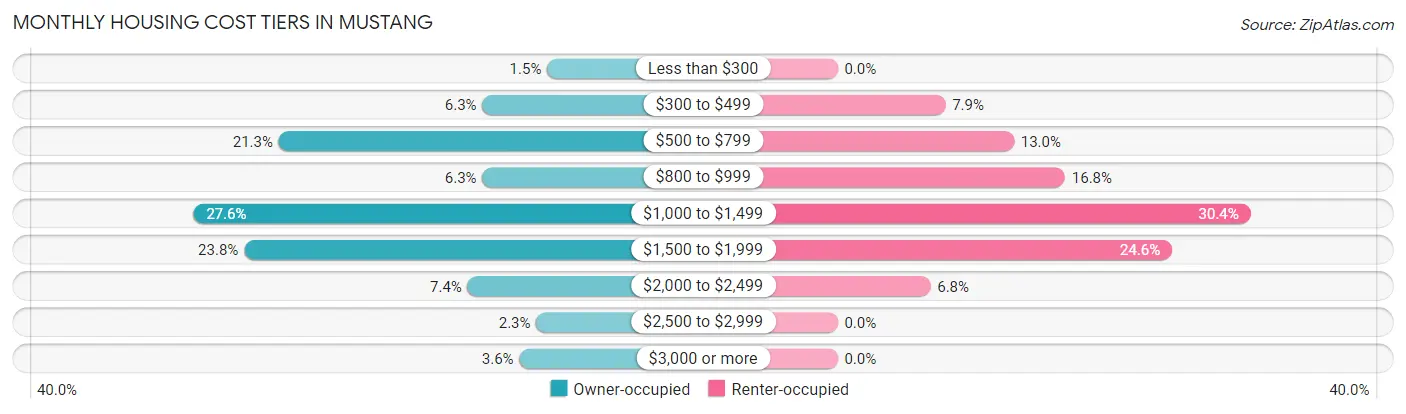
| Monthly Cost | Owner-occupied | Renter-occupied |
| Less than $300 | 89 (1.5%) | 0 (0.0%) |
| $300 to $499 | 370 (6.3%) | 137 (7.9%) |
| $500 to $799 | 1,254 (21.3%) | 224 (13.0%) |
| $800 to $999 | 370 (6.3%) | 289 (16.8%) |
| $1,000 to $1,499 | 1,625 (27.6%) | 525 (30.4%) |
| $1,500 to $1,999 | 1,404 (23.8%) | 425 (24.6%) |
| $2,000 to $2,499 | 434 (7.4%) | 118 (6.8%) |
| $2,500 to $2,999 | 136 (2.3%) | 0 (0.0%) |
| $3,000 or more | 210 (3.6%) | 0 (0.0%) |
| Total | 5,892 (100.0%) | 1,725 (100.0%) |
Physical Housing Characteristics in Mustang
Housing Structures in Mustang
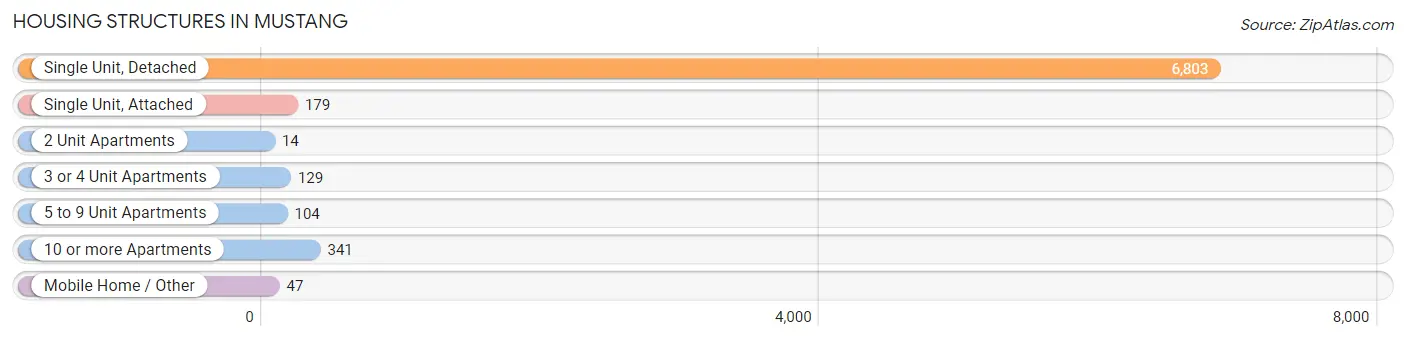
| Structure Type | # Housing Units | % Housing Units |
| Single Unit, Detached | 6,803 | 89.3% |
| Single Unit, Attached | 179 | 2.4% |
| 2 Unit Apartments | 14 | 0.2% |
| 3 or 4 Unit Apartments | 129 | 1.7% |
| 5 to 9 Unit Apartments | 104 | 1.4% |
| 10 or more Apartments | 341 | 4.5% |
| Mobile Home / Other | 47 | 0.6% |
| Total | 7,617 | 100.0% |
Housing Structures by Occupancy in Mustang
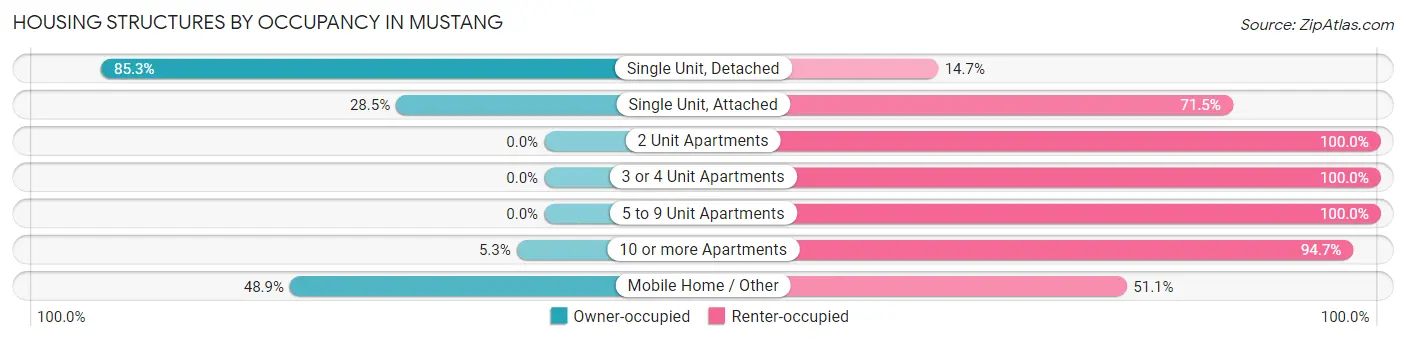
| Structure Type | Owner-occupied | Renter-occupied |
| Single Unit, Detached | 5,800 (85.3%) | 1,003 (14.7%) |
| Single Unit, Attached | 51 (28.5%) | 128 (71.5%) |
| 2 Unit Apartments | 0 (0.0%) | 14 (100.0%) |
| 3 or 4 Unit Apartments | 0 (0.0%) | 129 (100.0%) |
| 5 to 9 Unit Apartments | 0 (0.0%) | 104 (100.0%) |
| 10 or more Apartments | 18 (5.3%) | 323 (94.7%) |
| Mobile Home / Other | 23 (48.9%) | 24 (51.1%) |
| Total | 5,892 (77.3%) | 1,725 (22.7%) |
Housing Structures by Number of Rooms in Mustang
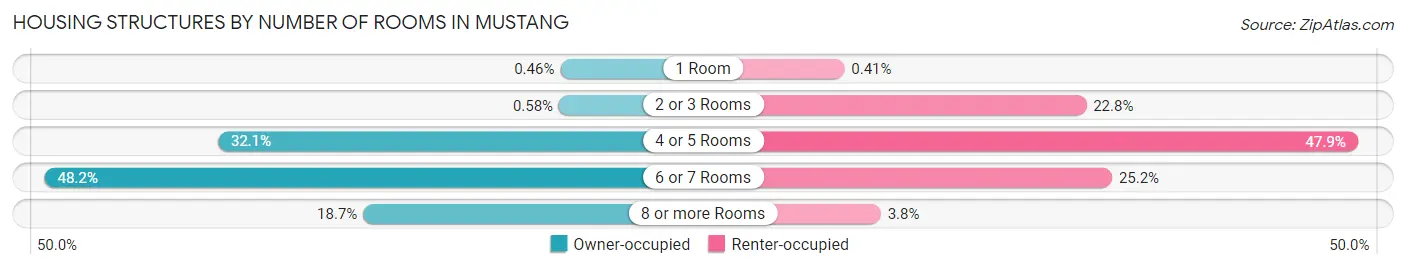
| Number of Rooms | Owner-occupied | Renter-occupied |
| 1 Room | 27 (0.5%) | 7 (0.4%) |
| 2 or 3 Rooms | 34 (0.6%) | 393 (22.8%) |
| 4 or 5 Rooms | 1,893 (32.1%) | 826 (47.9%) |
| 6 or 7 Rooms | 2,837 (48.1%) | 434 (25.2%) |
| 8 or more Rooms | 1,101 (18.7%) | 65 (3.8%) |
| Total | 5,892 (100.0%) | 1,725 (100.0%) |
Housing Structure by Heating Type in Mustang
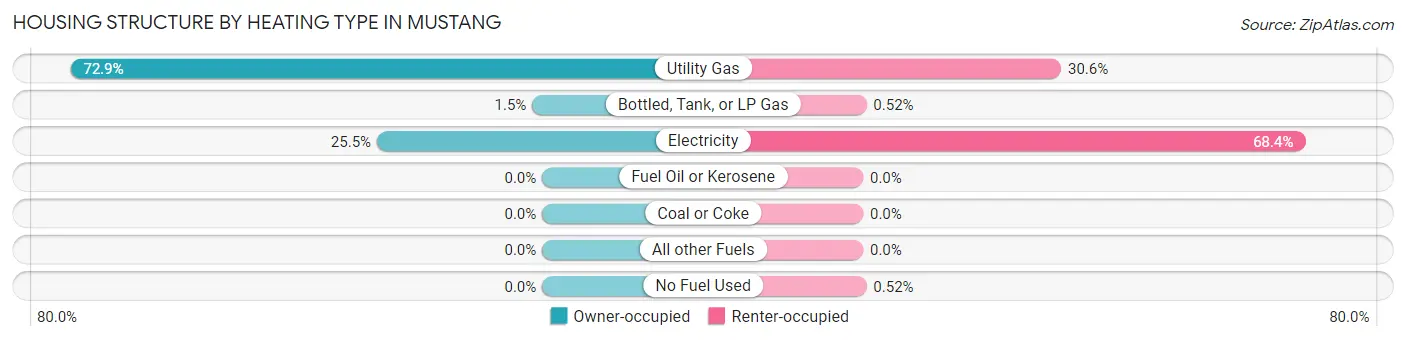
| Heating Type | Owner-occupied | Renter-occupied |
| Utility Gas | 4,297 (72.9%) | 528 (30.6%) |
| Bottled, Tank, or LP Gas | 90 (1.5%) | 9 (0.5%) |
| Electricity | 1,505 (25.5%) | 1,179 (68.3%) |
| Fuel Oil or Kerosene | 0 (0.0%) | 0 (0.0%) |
| Coal or Coke | 0 (0.0%) | 0 (0.0%) |
| All other Fuels | 0 (0.0%) | 0 (0.0%) |
| No Fuel Used | 0 (0.0%) | 9 (0.5%) |
| Total | 5,892 (100.0%) | 1,725 (100.0%) |
Household Vehicle Usage in Mustang
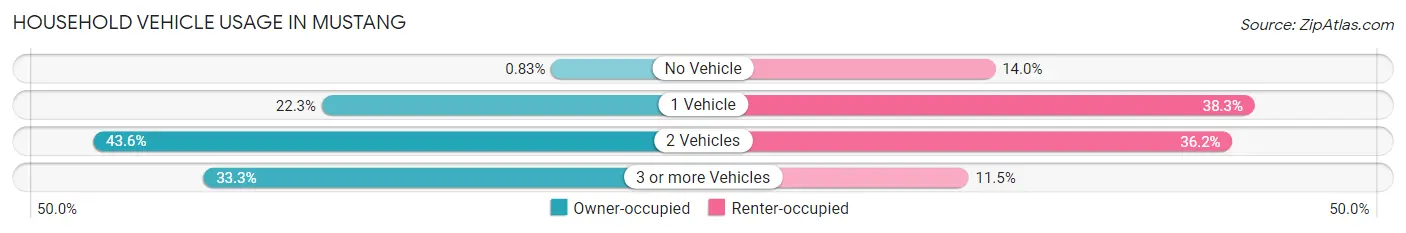
| Vehicles per Household | Owner-occupied | Renter-occupied |
| No Vehicle | 49 (0.8%) | 242 (14.0%) |
| 1 Vehicle | 1,311 (22.3%) | 660 (38.3%) |
| 2 Vehicles | 2,569 (43.6%) | 624 (36.2%) |
| 3 or more Vehicles | 1,963 (33.3%) | 199 (11.5%) |
| Total | 5,892 (100.0%) | 1,725 (100.0%) |
Real Estate & Mortgages in Mustang
Real Estate and Mortgage Overview in Mustang
| Characteristic | Without Mortgage | With Mortgage |
| Housing Units | 1,759 | 4,133 |
| Median Property Value | $204,400 | $214,300 |
| Median Household Income | $77,357 | $1,150 |
| Monthly Housing Costs | $603 | $210 |
| Real Estate Taxes | $1,916 | $187 |
Property Value by Mortgage Status in Mustang
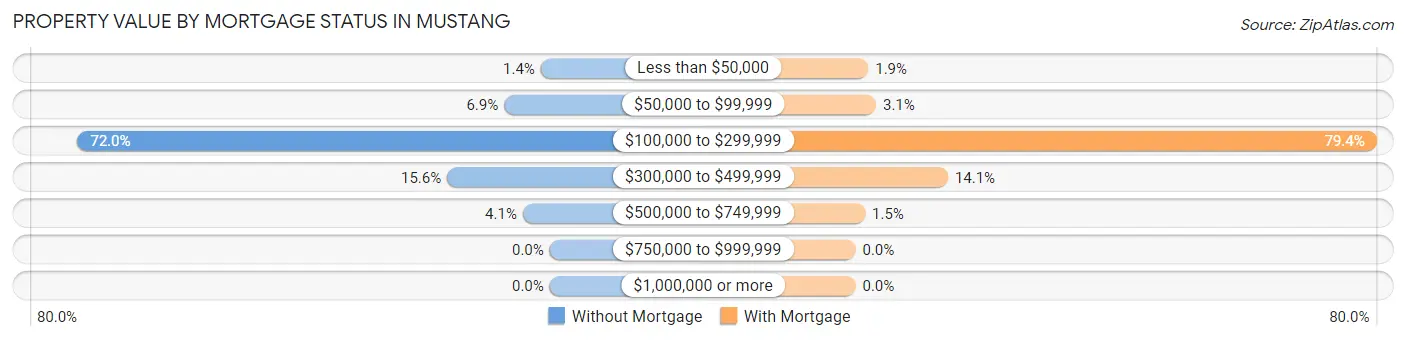
| Property Value | Without Mortgage | With Mortgage |
| Less than $50,000 | 24 (1.4%) | 80 (1.9%) |
| $50,000 to $99,999 | 122 (6.9%) | 129 (3.1%) |
| $100,000 to $299,999 | 1,266 (72.0%) | 3,282 (79.4%) |
| $300,000 to $499,999 | 275 (15.6%) | 582 (14.1%) |
| $500,000 to $749,999 | 72 (4.1%) | 60 (1.5%) |
| $750,000 to $999,999 | 0 (0.0%) | 0 (0.0%) |
| $1,000,000 or more | 0 (0.0%) | 0 (0.0%) |
| Total | 1,759 (100.0%) | 4,133 (100.0%) |
Household Income by Mortgage Status in Mustang
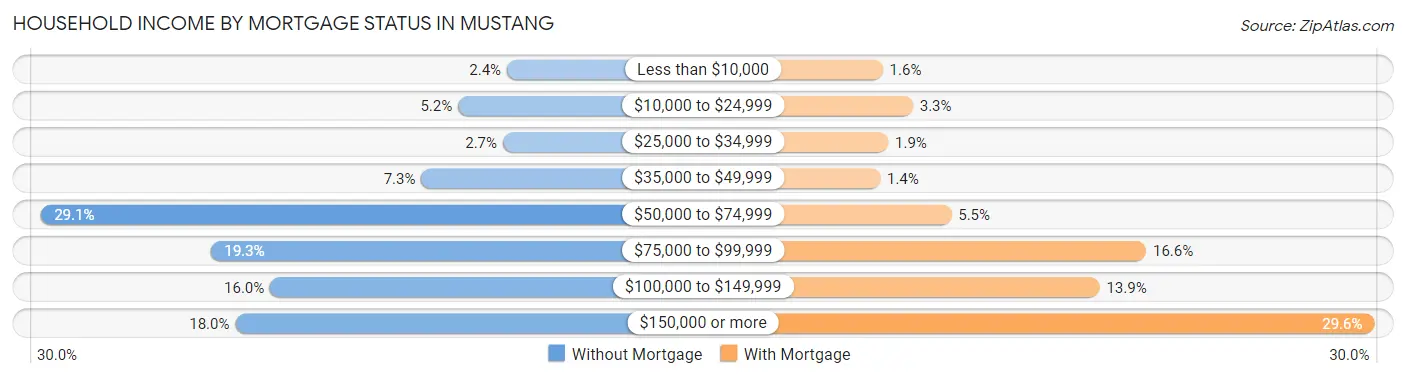
| Household Income | Without Mortgage | With Mortgage |
| Less than $10,000 | 43 (2.4%) | 64 (1.5%) |
| $10,000 to $24,999 | 92 (5.2%) | 135 (3.3%) |
| $25,000 to $34,999 | 47 (2.7%) | 77 (1.9%) |
| $35,000 to $49,999 | 129 (7.3%) | 58 (1.4%) |
| $50,000 to $74,999 | 511 (29.0%) | 226 (5.5%) |
| $75,000 to $99,999 | 340 (19.3%) | 686 (16.6%) |
| $100,000 to $149,999 | 281 (16.0%) | 576 (13.9%) |
| $150,000 or more | 316 (18.0%) | 1,225 (29.6%) |
| Total | 1,759 (100.0%) | 4,133 (100.0%) |
Property Value to Household Income Ratio in Mustang
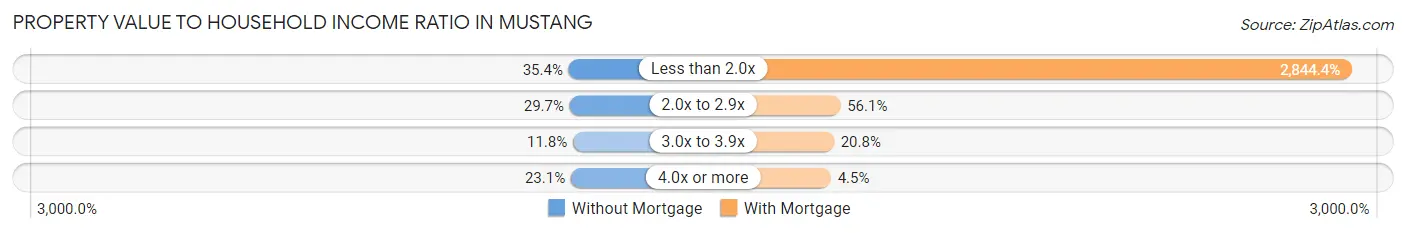
| Value-to-Income Ratio | Without Mortgage | With Mortgage |
| Less than 2.0x | 622 (35.4%) | 117,557 (2,844.4%) |
| 2.0x to 2.9x | 522 (29.7%) | 2,318 (56.1%) |
| 3.0x to 3.9x | 208 (11.8%) | 859 (20.8%) |
| 4.0x or more | 407 (23.1%) | 186 (4.5%) |
| Total | 1,759 (100.0%) | 4,133 (100.0%) |
Real Estate Taxes by Mortgage Status in Mustang
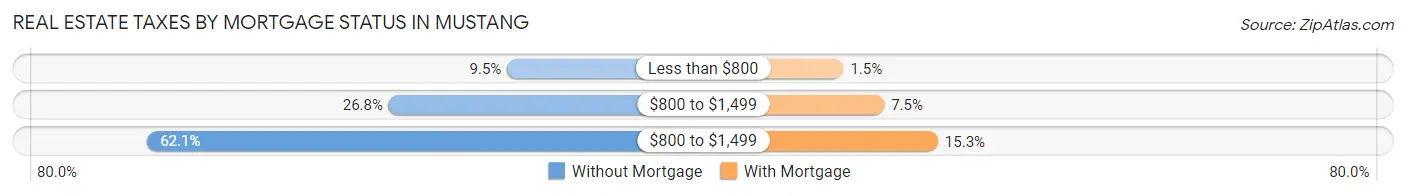
| Property Taxes | Without Mortgage | With Mortgage |
| Less than $800 | 167 (9.5%) | 63 (1.5%) |
| $800 to $1,499 | 471 (26.8%) | 309 (7.5%) |
| $800 to $1,499 | 1,092 (62.1%) | 633 (15.3%) |
| Total | 1,759 (100.0%) | 4,133 (100.0%) |
Health & Disability in Mustang
Health Insurance Coverage by Age in Mustang
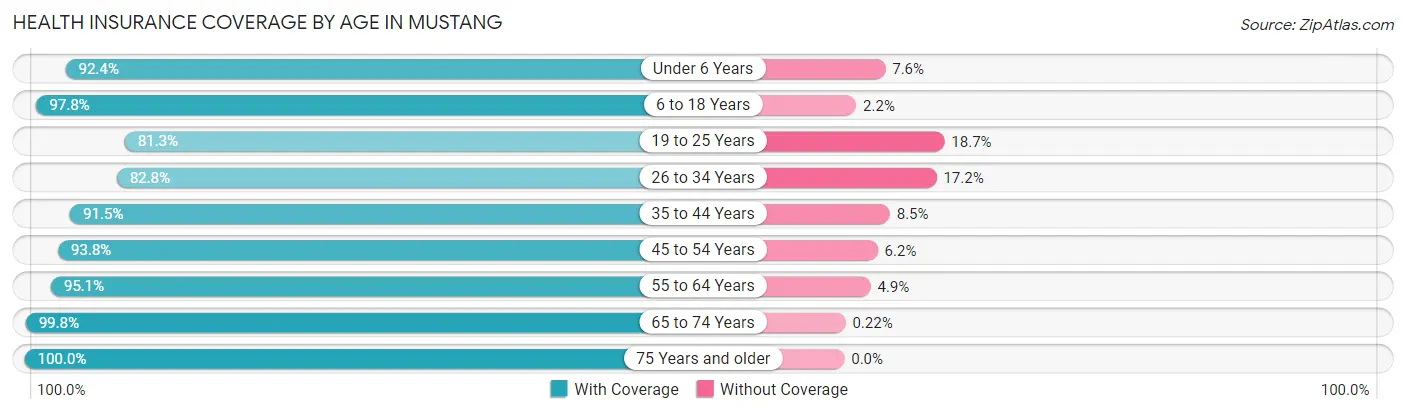
| Age Bracket | With Coverage | Without Coverage |
| Under 6 Years | 1,427 (92.4%) | 118 (7.6%) |
| 6 to 18 Years | 3,848 (97.8%) | 87 (2.2%) |
| 19 to 25 Years | 1,067 (81.3%) | 245 (18.7%) |
| 26 to 34 Years | 1,956 (82.8%) | 406 (17.2%) |
| 35 to 44 Years | 2,666 (91.5%) | 247 (8.5%) |
| 45 to 54 Years | 2,187 (93.8%) | 145 (6.2%) |
| 55 to 64 Years | 2,784 (95.1%) | 143 (4.9%) |
| 65 to 74 Years | 1,818 (99.8%) | 4 (0.2%) |
| 75 Years and older | 1,222 (100.0%) | 0 (0.0%) |
| Total | 18,975 (93.1%) | 1,395 (6.9%) |
Health Insurance Coverage by Citizenship Status in Mustang
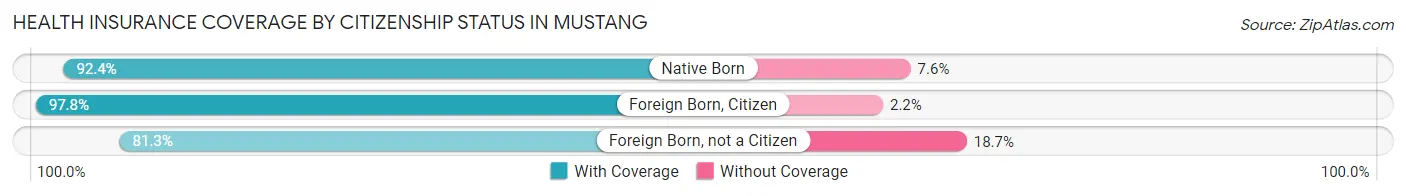
| Citizenship Status | With Coverage | Without Coverage |
| Native Born | 1,427 (92.4%) | 118 (7.6%) |
| Foreign Born, Citizen | 3,848 (97.8%) | 87 (2.2%) |
| Foreign Born, not a Citizen | 1,067 (81.3%) | 245 (18.7%) |
Health Insurance Coverage by Household Income in Mustang
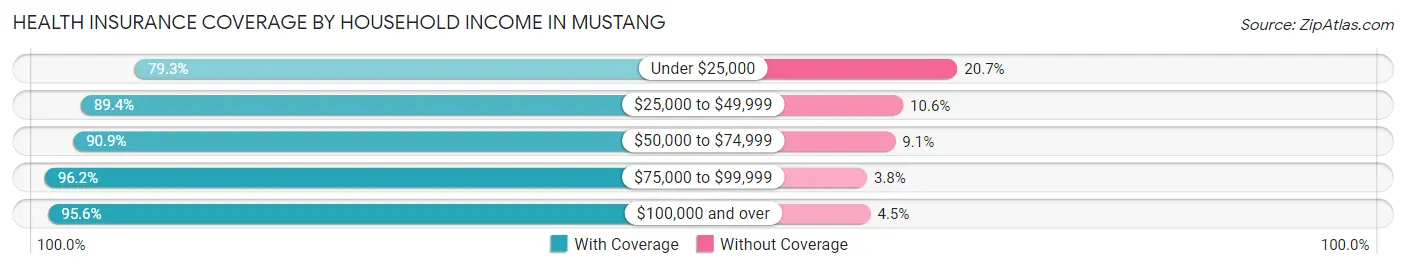
| Household Income | With Coverage | Without Coverage |
| Under $25,000 | 1,148 (79.3%) | 300 (20.7%) |
| $25,000 to $49,999 | 1,720 (89.4%) | 203 (10.6%) |
| $50,000 to $74,999 | 3,112 (90.9%) | 312 (9.1%) |
| $75,000 to $99,999 | 3,500 (96.2%) | 138 (3.8%) |
| $100,000 and over | 9,488 (95.6%) | 442 (4.4%) |
Public vs Private Health Insurance Coverage by Age in Mustang
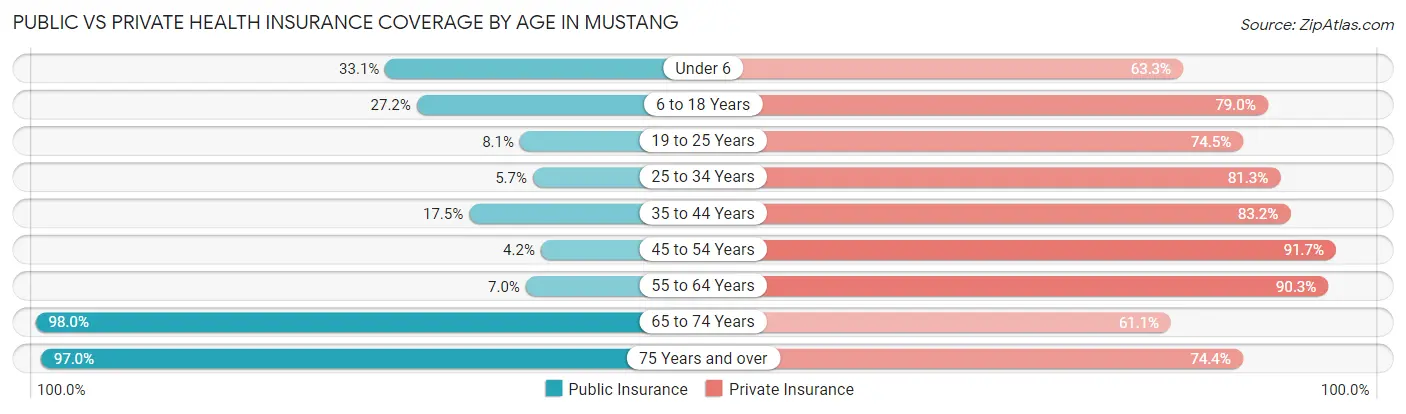
| Age Bracket | Public Insurance | Private Insurance |
| Under 6 | 511 (33.1%) | 978 (63.3%) |
| 6 to 18 Years | 1,072 (27.2%) | 3,109 (79.0%) |
| 19 to 25 Years | 106 (8.1%) | 977 (74.5%) |
| 25 to 34 Years | 134 (5.7%) | 1,921 (81.3%) |
| 35 to 44 Years | 510 (17.5%) | 2,424 (83.2%) |
| 45 to 54 Years | 98 (4.2%) | 2,138 (91.7%) |
| 55 to 64 Years | 205 (7.0%) | 2,642 (90.3%) |
| 65 to 74 Years | 1,785 (98.0%) | 1,113 (61.1%) |
| 75 Years and over | 1,185 (97.0%) | 909 (74.4%) |
| Total | 5,606 (27.5%) | 16,211 (79.6%) |
Disability Status by Sex by Age in Mustang
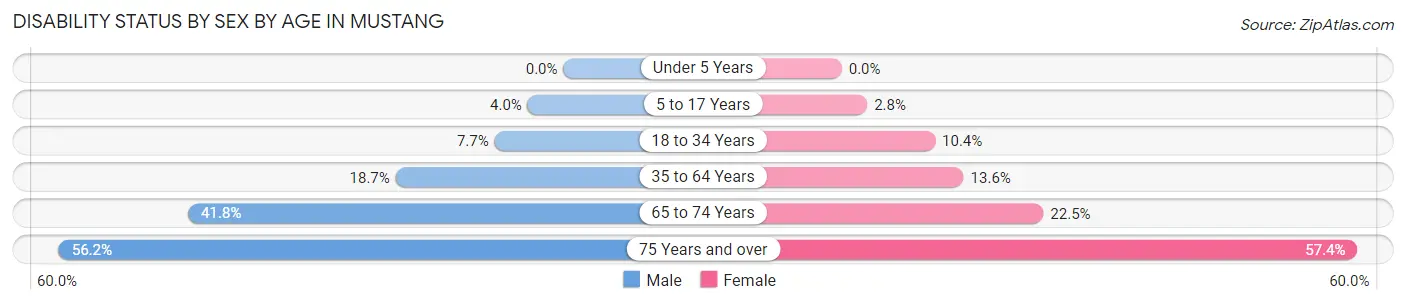
| Age Bracket | Male | Female |
| Under 5 Years | 0 (0.0%) | 0 (0.0%) |
| 5 to 17 Years | 72 (4.0%) | 60 (2.8%) |
| 18 to 34 Years | 155 (7.7%) | 209 (10.4%) |
| 35 to 64 Years | 775 (18.7%) | 546 (13.6%) |
| 65 to 74 Years | 339 (41.8%) | 227 (22.5%) |
| 75 Years and over | 304 (56.2%) | 391 (57.4%) |
Disability Class by Sex by Age in Mustang
Disability Class: Hearing Difficulty
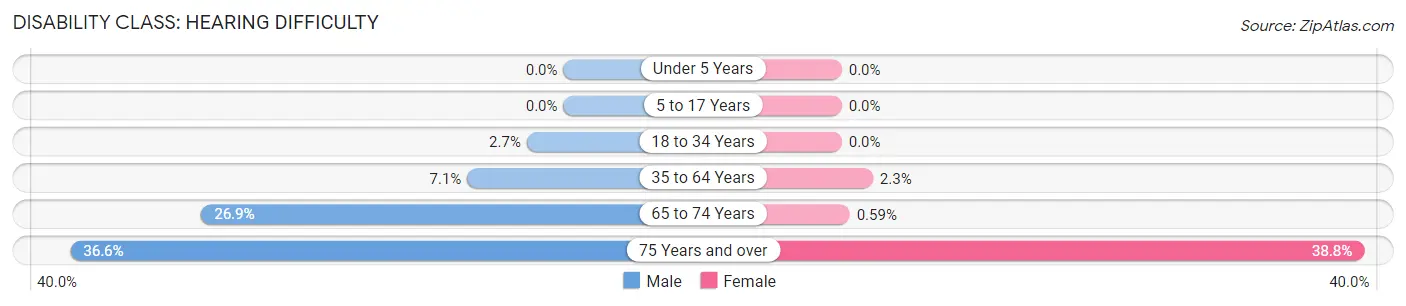
| Age Bracket | Male | Female |
| Under 5 Years | 0 (0.0%) | 0 (0.0%) |
| 5 to 17 Years | 0 (0.0%) | 0 (0.0%) |
| 18 to 34 Years | 55 (2.7%) | 0 (0.0%) |
| 35 to 64 Years | 296 (7.1%) | 93 (2.3%) |
| 65 to 74 Years | 218 (26.9%) | 6 (0.6%) |
| 75 Years and over | 198 (36.6%) | 264 (38.8%) |
Disability Class: Vision Difficulty
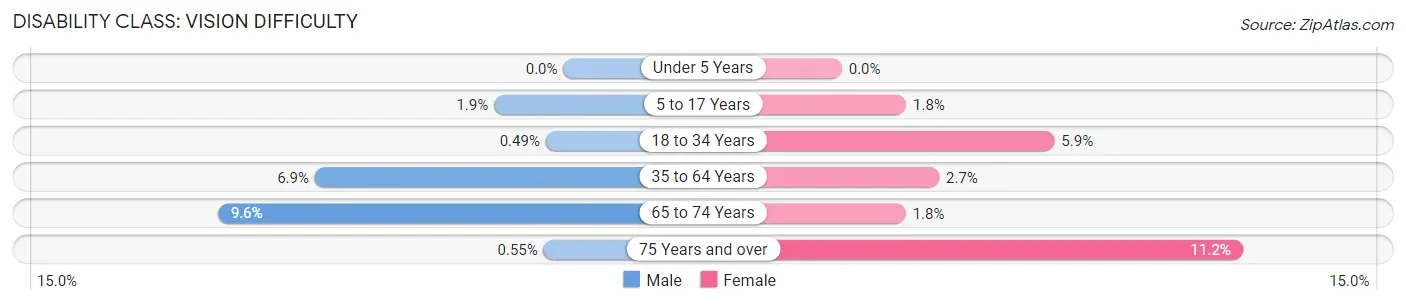
| Age Bracket | Male | Female |
| Under 5 Years | 0 (0.0%) | 0 (0.0%) |
| 5 to 17 Years | 35 (1.9%) | 38 (1.8%) |
| 18 to 34 Years | 10 (0.5%) | 119 (5.9%) |
| 35 to 64 Years | 287 (6.9%) | 109 (2.7%) |
| 65 to 74 Years | 78 (9.6%) | 18 (1.8%) |
| 75 Years and over | 3 (0.5%) | 76 (11.2%) |
Disability Class: Cognitive Difficulty
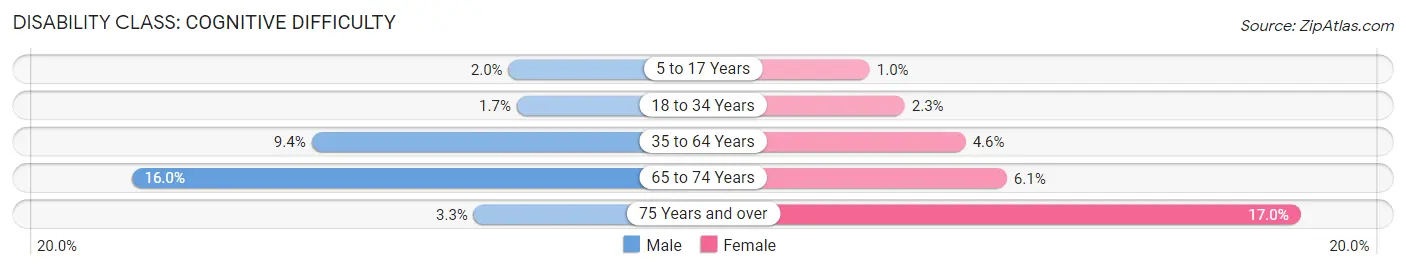
| Age Bracket | Male | Female |
| 5 to 17 Years | 37 (2.0%) | 22 (1.0%) |
| 18 to 34 Years | 35 (1.7%) | 47 (2.3%) |
| 35 to 64 Years | 388 (9.3%) | 185 (4.6%) |
| 65 to 74 Years | 130 (16.0%) | 62 (6.1%) |
| 75 Years and over | 18 (3.3%) | 116 (17.0%) |
Disability Class: Ambulatory Difficulty
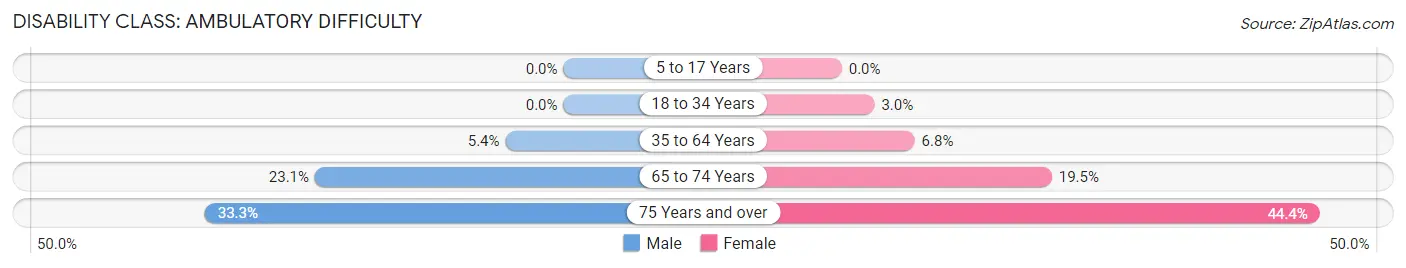
| Age Bracket | Male | Female |
| 5 to 17 Years | 0 (0.0%) | 0 (0.0%) |
| 18 to 34 Years | 0 (0.0%) | 61 (3.0%) |
| 35 to 64 Years | 223 (5.4%) | 272 (6.8%) |
| 65 to 74 Years | 187 (23.1%) | 197 (19.5%) |
| 75 Years and over | 180 (33.3%) | 302 (44.4%) |
Disability Class: Self-Care Difficulty
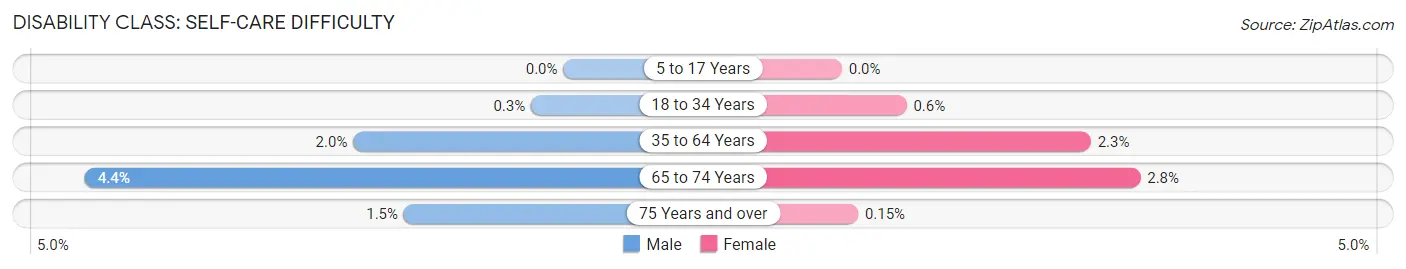
| Age Bracket | Male | Female |
| 5 to 17 Years | 0 (0.0%) | 0 (0.0%) |
| 18 to 34 Years | 6 (0.3%) | 12 (0.6%) |
| 35 to 64 Years | 81 (1.9%) | 93 (2.3%) |
| 65 to 74 Years | 36 (4.4%) | 28 (2.8%) |
| 75 Years and over | 8 (1.5%) | 1 (0.2%) |
Technology Access in Mustang
Computing Device Access in Mustang
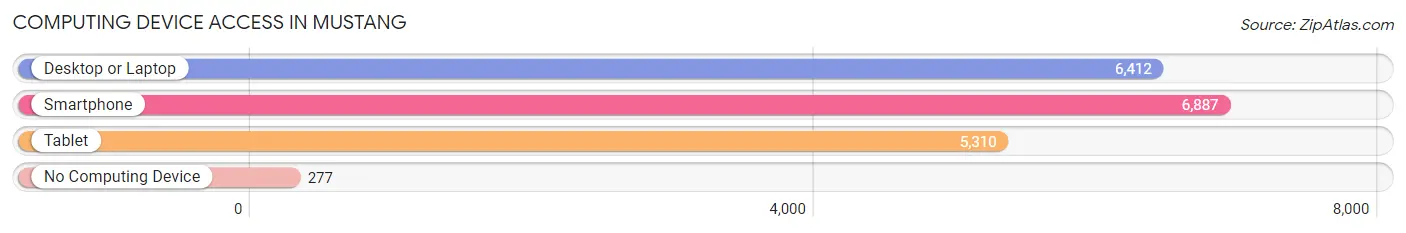
| Device Type | # Households | % Households |
| Desktop or Laptop | 6,412 | 84.2% |
| Smartphone | 6,887 | 90.4% |
| Tablet | 5,310 | 69.7% |
| No Computing Device | 277 | 3.6% |
| Total | 7,617 | 100.0% |
Internet Access in Mustang
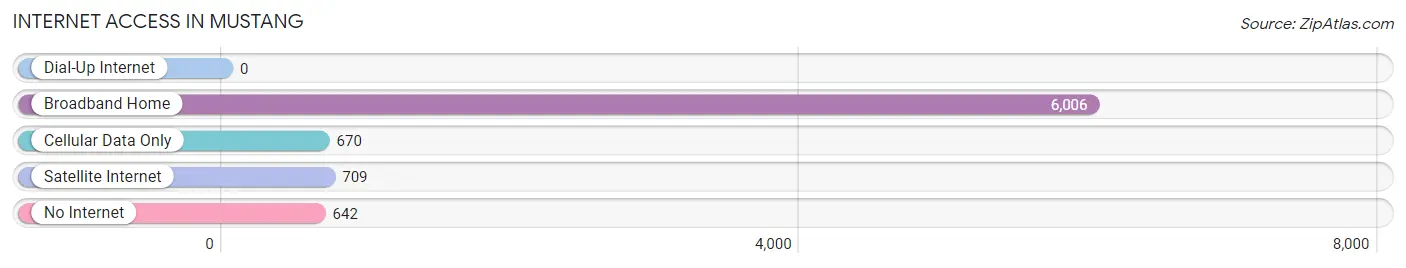
| Internet Type | # Households | % Households |
| Dial-Up Internet | 0 | 0.0% |
| Broadband Home | 6,006 | 78.8% |
| Cellular Data Only | 670 | 8.8% |
| Satellite Internet | 709 | 9.3% |
| No Internet | 642 | 8.4% |
| Total | 7,617 | 100.0% |
Mustang Summary
Mustang, Oklahoma is a city located in Canadian County, Oklahoma. It is part of the Oklahoma City Metropolitan Statistical Area and is located just west of the city of Oklahoma City. The population of Mustang was estimated to be 19,084 in 2019.
Geography
Mustang is located in the western part of Canadian County, Oklahoma, approximately 20 miles west of Oklahoma City. It is situated on the western edge of the Cross Timbers region, which is a transition zone between the Great Plains and the Ozark Plateau. The city is located at the intersection of State Highway 152 and State Highway 4. Mustang is bordered by the cities of Yukon to the north, Piedmont to the east, and Tuttle to the south.
Climate
Mustang has a humid subtropical climate, with hot summers and mild winters. The average annual temperature is 61.3°F, with an average high of 79.2°F in July and an average low of 43.4°F in January. The average annual precipitation is 37.2 inches, with an average of 4.3 inches of snowfall per year.
Demographics
As of the 2010 census, the population of Mustang was 17,395, with a population density of 1,092 people per square mile. The racial makeup of the city was 79.2% White, 4.2% African American, 0.7% Native American, 1.2% Asian, 0.1% Pacific Islander, 11.2% from other races, and 3.5% from two or more races. Hispanic or Latino of any race were 20.2% of the population.
Economy
Mustang is home to several major employers, including the Mustang Public Schools, the Mustang News, and the Mustang Historical Society. The city is also home to several retail stores, restaurants, and other businesses. The city is served by the Mustang Regional Airport, which provides general aviation services.
Mustang is also home to several major industrial parks, including the Mustang Industrial Park, the Mustang Business Park, and the Mustang Technology Park. These parks are home to a variety of businesses, including manufacturing, distribution, and technology companies.
Education
Mustang is served by the Mustang Public Schools, which includes five elementary schools, two middle schools, and one high school. The city is also home to several private schools, including Mustang Christian Academy and Mustang Montessori School.
Mustang is home to the University of Central Oklahoma, which is a public university located in the city. The university offers a variety of undergraduate and graduate degree programs, as well as a number of professional and continuing education programs.
Conclusion
Mustang, Oklahoma is a city located in Canadian County, Oklahoma. It is part of the Oklahoma City Metropolitan Statistical Area and is located just west of the city of Oklahoma City. The population of Mustang was estimated to be 19,084 in 2019. The city is located at the intersection of State Highway 152 and State Highway 4 and is bordered by the cities of Yukon to the north, Piedmont to the east, and Tuttle to the south. Mustang has a humid subtropical climate, with hot summers and mild winters. The city is home to several major employers, including the Mustang Public Schools, the Mustang News, and the Mustang Historical Society. Mustang is also home to several major industrial parks, and is served by the Mustang Regional Airport. The city is served by the Mustang Public Schools, which includes five elementary schools, two middle schools, and one high school. The city is also home to the University of Central Oklahoma, which is a public university located in the city.
Common Questions
What is Per Capita Income in Mustang?
Per Capita income in Mustang is $40,015.
What is the Median Family Income in Mustang?
Median Family Income in Mustang is $101,125.
What is the Median Household income in Mustang?
Median Household Income in Mustang is $84,162.
What is Income or Wage Gap in Mustang?
Income or Wage Gap in Mustang is 33.9%.
Women in Mustang earn 66.1 cents for every dollar earned by a man.
What is Family Income Deficit in Mustang?
Family Income Deficit in Mustang is $16,891.
Families that are below poverty line in Mustang earn $16,891 less on average than the poverty threshold level.
What is Inequality or Gini Index in Mustang?
Inequality or Gini Index in Mustang is 0.38.
What is the Total Population of Mustang?
Total Population of Mustang is 20,518.
What is the Total Male Population of Mustang?
Total Male Population of Mustang is 10,000.
What is the Total Female Population of Mustang?
Total Female Population of Mustang is 10,518.
What is the Ratio of Males per 100 Females in Mustang?
There are 95.08 Males per 100 Females in Mustang.
What is the Ratio of Females per 100 Males in Mustang?
There are 105.18 Females per 100 Males in Mustang.
What is the Median Population Age in Mustang?
Median Population Age in Mustang is 39.0 Years.
What is the Average Family Size in Mustang
Average Family Size in Mustang is 3.1 People.
What is the Average Household Size in Mustang
Average Household Size in Mustang is 2.7 People.
How Large is the Labor Force in Mustang?
There are 10,858 People in the Labor Forcein in Mustang.
What is the Percentage of People in the Labor Force in Mustang?
68.0% of People are in the Labor Force in Mustang.
What is the Unemployment Rate in Mustang?
Unemployment Rate in Mustang is 4.1%.