Minco, OK Map & Demographics
Minco Map
Minco Overview
$31,979
PER CAPITA INCOME
$78,942
AVG FAMILY INCOME
$56,667
AVG HOUSEHOLD INCOME
58.8%
WAGE / INCOME GAP [ % ]
41.2¢/ $1
WAGE / INCOME GAP [ $ ]
$8,520
FAMILY INCOME DEFICIT
0.43
INEQUALITY / GINI INDEX
1,502
TOTAL POPULATION
683
MALE POPULATION
819
FEMALE POPULATION
83.39
MALES / 100 FEMALES
119.91
FEMALES / 100 MALES
39.6
MEDIAN AGE
3.0
AVG FAMILY SIZE
2.2
AVG HOUSEHOLD SIZE
736
LABOR FORCE [ PEOPLE ]
58.5%
PERCENT IN LABOR FORCE
4.0%
UNEMPLOYMENT RATE
Minco Zip Codes
Minco Area Codes
Income in Minco
Income Overview in Minco
Per Capita Income in Minco is $31,979, while median incomes of families and households are $78,942 and $56,667 respectively.
| Characteristic | Number | Measure |
| Per Capita Income | 1,502 | $31,979 |
| Median Family Income | 361 | $78,942 |
| Mean Family Income | 361 | $93,755 |
| Median Household Income | 638 | $56,667 |
| Mean Household Income | 638 | $73,088 |
| Income Deficit | 361 | $8,520 |
| Wage / Income Gap (%) | 1,502 | 58.76% |
| Wage / Income Gap ($) | 1,502 | 41.24¢ per $1 |
| Gini / Inequality Index | 1,502 | 0.43 |
Earnings by Sex in Minco
Average Earnings in Minco are $37,443, $58,417 for men and $24,091 for women, a difference of 58.8%.

| Sex | Number | Average Earnings |
| Male | 385 (50.1%) | $58,417 |
| Female | 384 (49.9%) | $24,091 |
| Total | 769 (100.0%) | $37,443 |
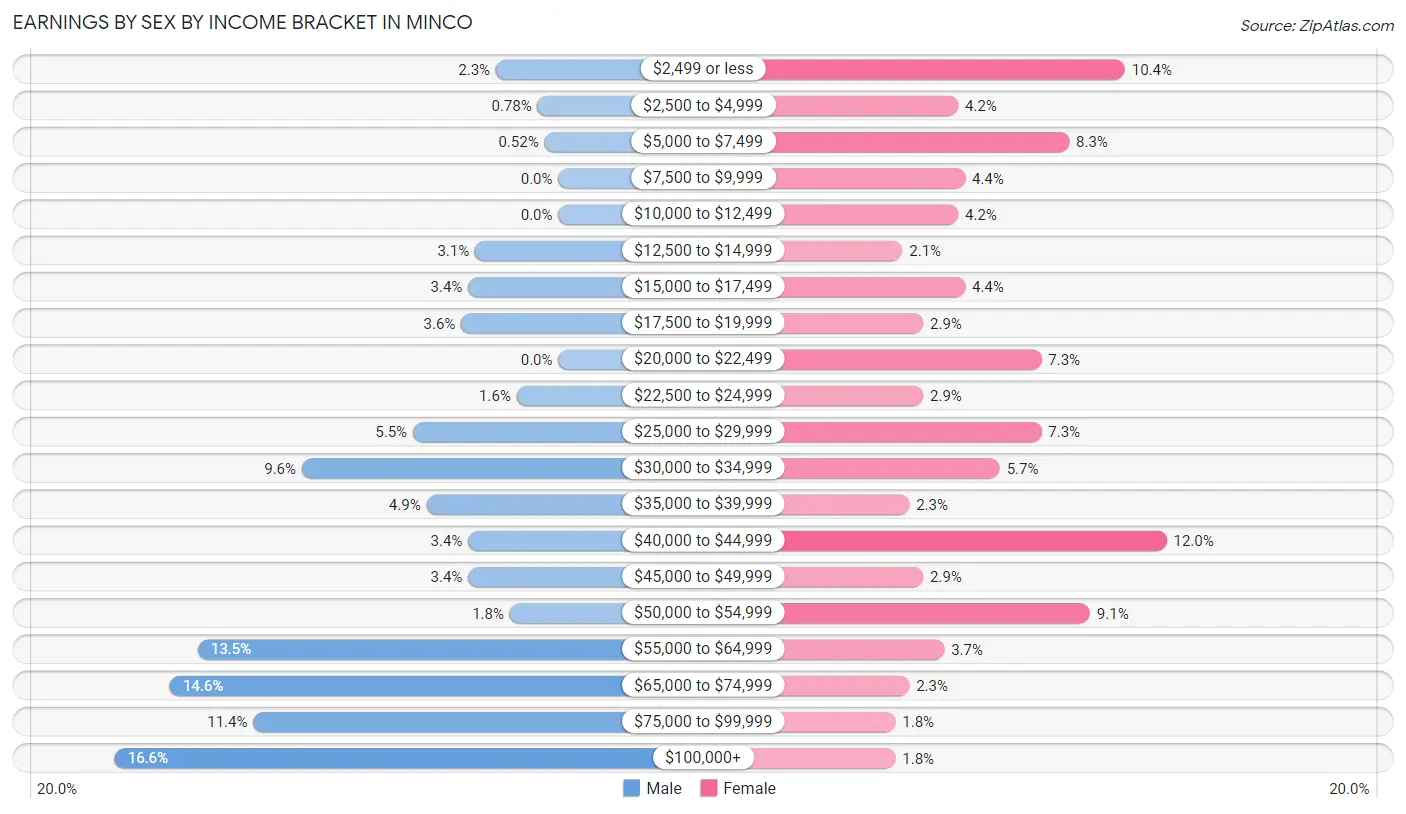
Earnings by Sex by Income Bracket in Minco
The most common earnings brackets in Minco are $100,000+ for men (64 | 16.6%) and $40,000 to $44,999 for women (46 | 12.0%).
| Income | Male | Female |
| $2,499 or less | 9 (2.3%) | 40 (10.4%) |
| $2,500 to $4,999 | 3 (0.8%) | 16 (4.2%) |
| $5,000 to $7,499 | 2 (0.5%) | 32 (8.3%) |
| $7,500 to $9,999 | 0 (0.0%) | 17 (4.4%) |
| $10,000 to $12,499 | 0 (0.0%) | 16 (4.2%) |
| $12,500 to $14,999 | 12 (3.1%) | 8 (2.1%) |
| $15,000 to $17,499 | 13 (3.4%) | 17 (4.4%) |
| $17,500 to $19,999 | 14 (3.6%) | 11 (2.9%) |
| $20,000 to $22,499 | 0 (0.0%) | 28 (7.3%) |
| $22,500 to $24,999 | 6 (1.6%) | 11 (2.9%) |
| $25,000 to $29,999 | 21 (5.4%) | 28 (7.3%) |
| $30,000 to $34,999 | 37 (9.6%) | 22 (5.7%) |
| $35,000 to $39,999 | 19 (4.9%) | 9 (2.3%) |
| $40,000 to $44,999 | 13 (3.4%) | 46 (12.0%) |
| $45,000 to $49,999 | 13 (3.4%) | 11 (2.9%) |
| $50,000 to $54,999 | 7 (1.8%) | 35 (9.1%) |
| $55,000 to $64,999 | 52 (13.5%) | 14 (3.6%) |
| $65,000 to $74,999 | 56 (14.5%) | 9 (2.3%) |
| $75,000 to $99,999 | 44 (11.4%) | 7 (1.8%) |
| $100,000+ | 64 (16.6%) | 7 (1.8%) |
| Total | 385 (100.0%) | 384 (100.0%) |
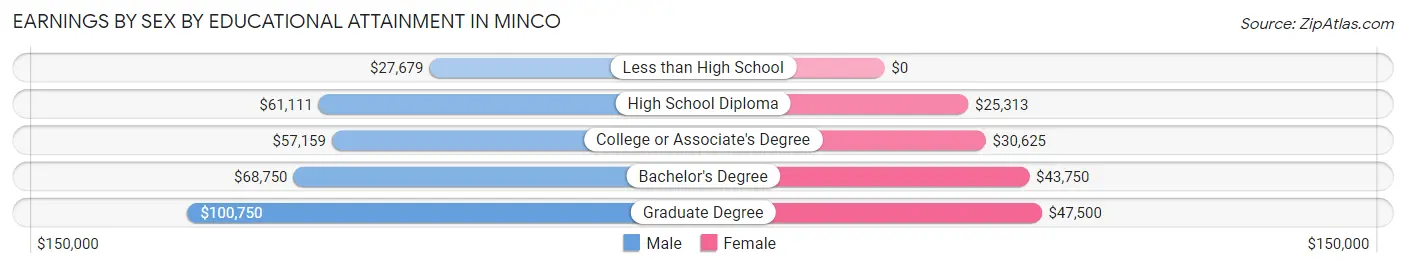
Earnings by Sex by Educational Attainment in Minco
Average earnings in Minco are $61,806 for men and $31,827 for women, a difference of 48.5%. Men with an educational attainment of graduate degree enjoy the highest average annual earnings of $100,750, while those with less than high school education earn the least with $27,679. Women with an educational attainment of graduate degree earn the most with the average annual earnings of $47,500, while those with high school diploma education have the smallest earnings of $25,313.
| Educational Attainment | Male Income | Female Income |
| Less than High School | $27,679 | $0 |
| High School Diploma | $61,111 | $25,313 |
| College or Associate's Degree | $57,159 | $30,625 |
| Bachelor's Degree | $68,750 | $43,750 |
| Graduate Degree | $100,750 | $47,500 |
| Total | $61,806 | $31,827 |
Family Income in Minco
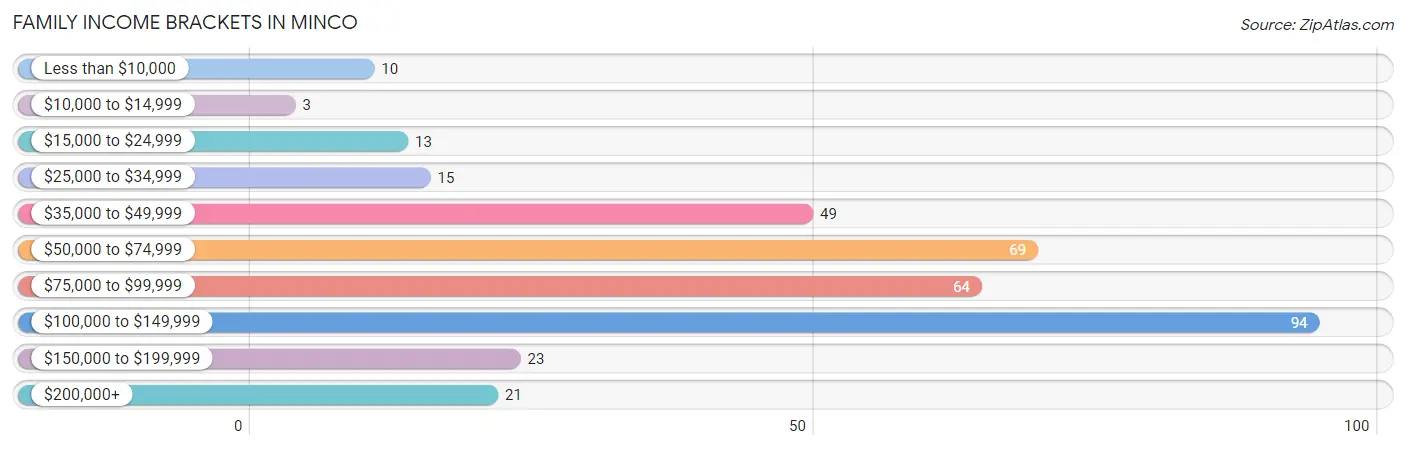
Family Income Brackets in Minco
According to the Minco family income data, there are 94 families falling into the $100,000 to $149,999 income range, which is the most common income bracket and makes up 26.0% of all families. Conversely, the $10,000 to $14,999 income bracket is the least frequent group with only 3 families (0.8%) belonging to this category.
| Income Bracket | # Families | % Families |
| Less than $10,000 | 10 | 2.8% |
| $10,000 to $14,999 | 3 | 0.8% |
| $15,000 to $24,999 | 13 | 3.6% |
| $25,000 to $34,999 | 15 | 4.2% |
| $35,000 to $49,999 | 49 | 13.6% |
| $50,000 to $74,999 | 69 | 19.1% |
| $75,000 to $99,999 | 64 | 17.7% |
| $100,000 to $149,999 | 94 | 26.0% |
| $150,000 to $199,999 | 23 | 6.4% |
| $200,000+ | 21 | 5.8% |
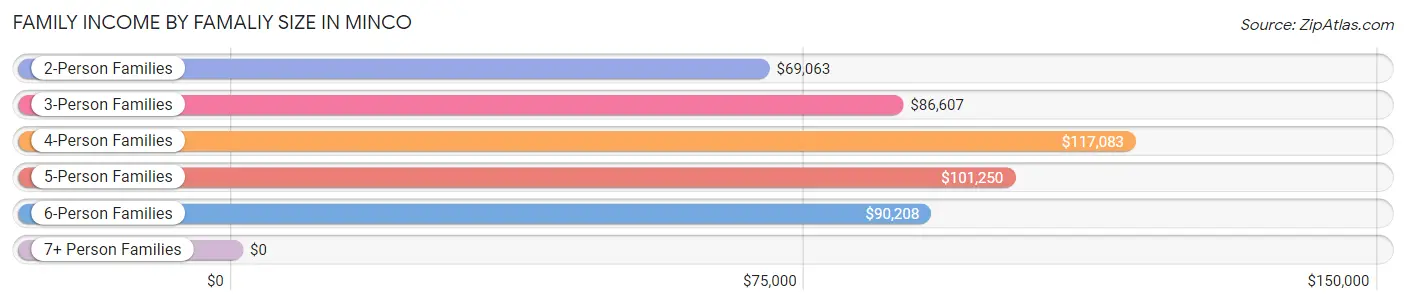
Family Income by Famaliy Size in Minco
4-person families (40 | 11.1%) account for the highest median family income in Minco with $117,083 per family, while 2-person families (189 | 52.3%) have the highest median income of $34,532 per family member.
| Income Bracket | # Families | Median Income |
| 2-Person Families | 189 (52.3%) | $69,063 |
| 3-Person Families | 81 (22.4%) | $86,607 |
| 4-Person Families | 40 (11.1%) | $117,083 |
| 5-Person Families | 30 (8.3%) | $101,250 |
| 6-Person Families | 17 (4.7%) | $90,208 |
| 7+ Person Families | 4 (1.1%) | $0 |
| Total | 361 (100.0%) | $78,942 |
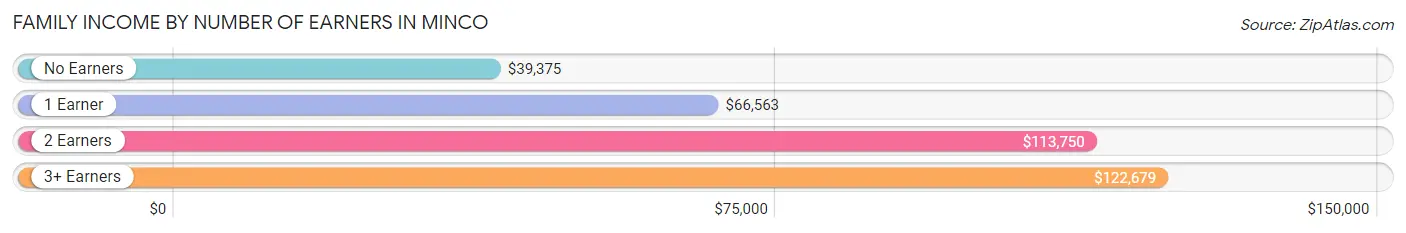
Family Income by Number of Earners in Minco
The median family income in Minco is $78,942, with families comprising 3+ earners (43) having the highest median family income of $122,679, while families with no earners (51) have the lowest median family income of $39,375, accounting for 11.9% and 14.1% of families, respectively.
| Number of Earners | # Families | Median Income |
| No Earners | 51 (14.1%) | $39,375 |
| 1 Earner | 123 (34.1%) | $66,563 |
| 2 Earners | 144 (39.9%) | $113,750 |
| 3+ Earners | 43 (11.9%) | $122,679 |
| Total | 361 (100.0%) | $78,942 |
Household Income in Minco
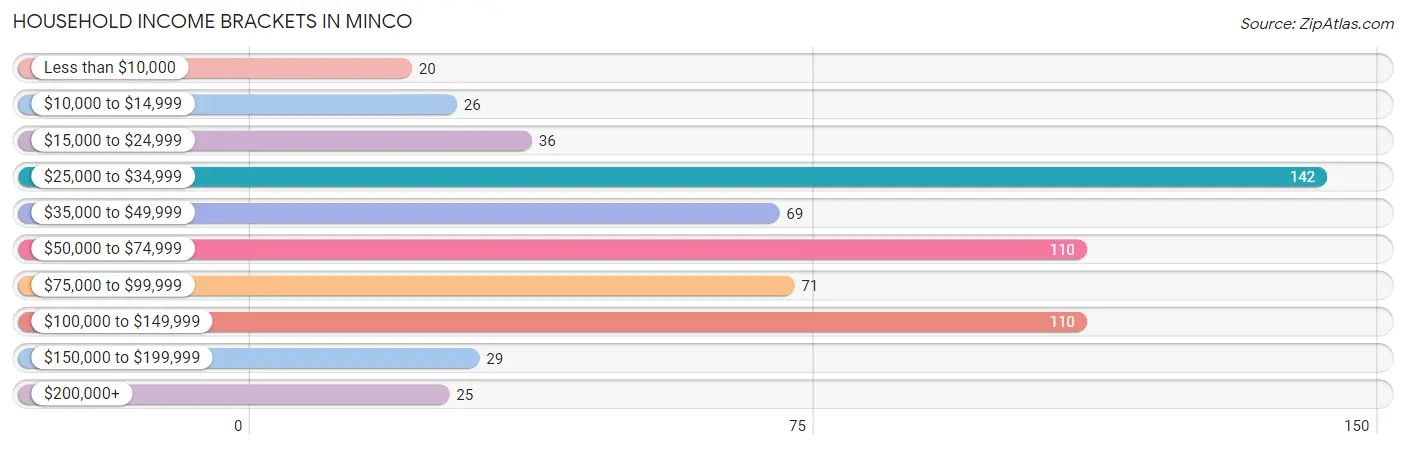
Household Income Brackets in Minco
With 142 households falling in the category, the $25,000 to $34,999 income range is the most frequent in Minco, accounting for 22.3% of all households. In contrast, only 20 households (3.1%) fall into the less than $10,000 income bracket, making it the least populous group.
| Income Bracket | # Households | % Households |
| Less than $10,000 | 20 | 3.1% |
| $10,000 to $14,999 | 26 | 4.1% |
| $15,000 to $24,999 | 36 | 5.6% |
| $25,000 to $34,999 | 142 | 22.3% |
| $35,000 to $49,999 | 69 | 10.8% |
| $50,000 to $74,999 | 110 | 17.2% |
| $75,000 to $99,999 | 71 | 11.1% |
| $100,000 to $149,999 | 110 | 17.2% |
| $150,000 to $199,999 | 29 | 4.5% |
| $200,000+ | 25 | 3.9% |
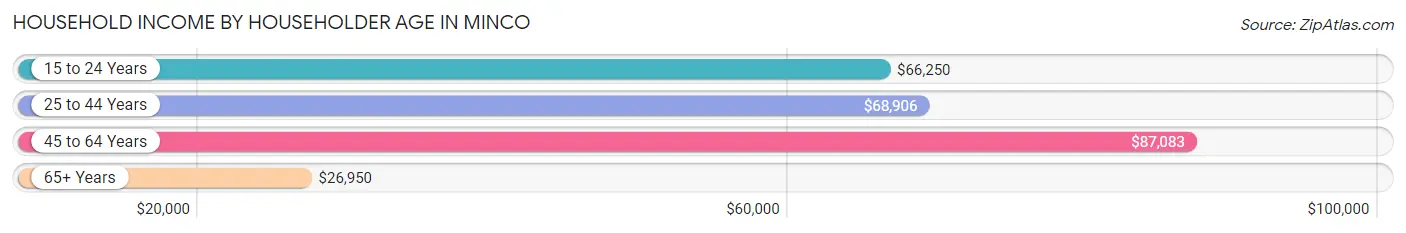
Household Income by Householder Age in Minco
The median household income in Minco is $56,667, with the highest median household income of $87,083 found in the 45 to 64 years age bracket for the primary householder. A total of 211 households (33.1%) fall into this category. Meanwhile, the 65+ years age bracket for the primary householder has the lowest median household income of $26,950, with 230 households (36.0%) in this group.
| Income Bracket | # Households | Median Income |
| 15 to 24 Years | 22 (3.5%) | $66,250 |
| 25 to 44 Years | 175 (27.4%) | $68,906 |
| 45 to 64 Years | 211 (33.1%) | $87,083 |
| 65+ Years | 230 (36.0%) | $26,950 |
| Total | 638 (100.0%) | $56,667 |
Poverty in Minco
Income Below Poverty by Sex and Age in Minco
With 7.8% poverty level for males and 14.2% for females among the residents of Minco, 12 to 14 year old males and 12 to 14 year old females are the most vulnerable to poverty, with 4 males (23.5%) and 11 females (50.0%) in their respective age groups living below the poverty level.
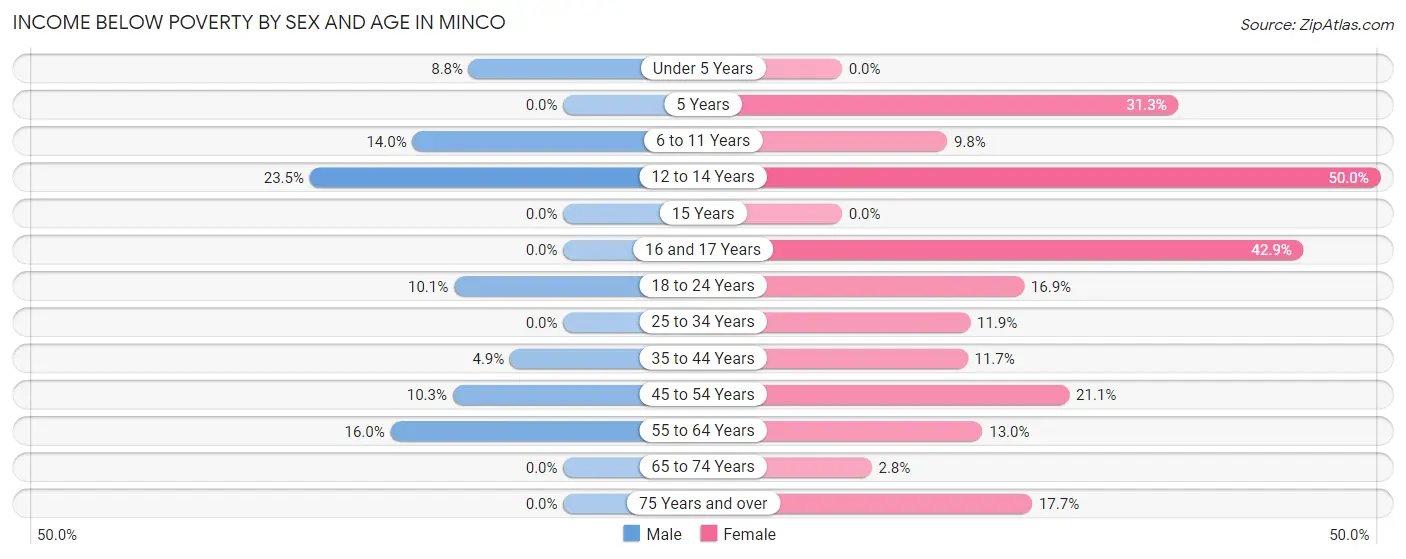
| Age Bracket | Male | Female |
| Under 5 Years | 5 (8.8%) | 0 (0.0%) |
| 5 Years | 0 (0.0%) | 5 (31.2%) |
| 6 to 11 Years | 7 (14.0%) | 4 (9.8%) |
| 12 to 14 Years | 4 (23.5%) | 11 (50.0%) |
| 15 Years | 0 (0.0%) | 0 (0.0%) |
| 16 and 17 Years | 0 (0.0%) | 9 (42.9%) |
| 18 to 24 Years | 7 (10.1%) | 12 (16.9%) |
| 25 to 34 Years | 0 (0.0%) | 10 (11.9%) |
| 35 to 44 Years | 4 (4.9%) | 7 (11.7%) |
| 45 to 54 Years | 8 (10.3%) | 23 (21.1%) |
| 55 to 64 Years | 17 (16.0%) | 12 (13.0%) |
| 65 to 74 Years | 0 (0.0%) | 4 (2.8%) |
| 75 Years and over | 0 (0.0%) | 9 (17.6%) |
| Total | 52 (7.8%) | 106 (14.2%) |
Income Above Poverty by Sex and Age in Minco
According to the poverty statistics in Minco, males aged 15 years and females aged under 5 years are the age groups that are most secure financially, with 100.0% of males and 100.0% of females in these age groups living above the poverty line.
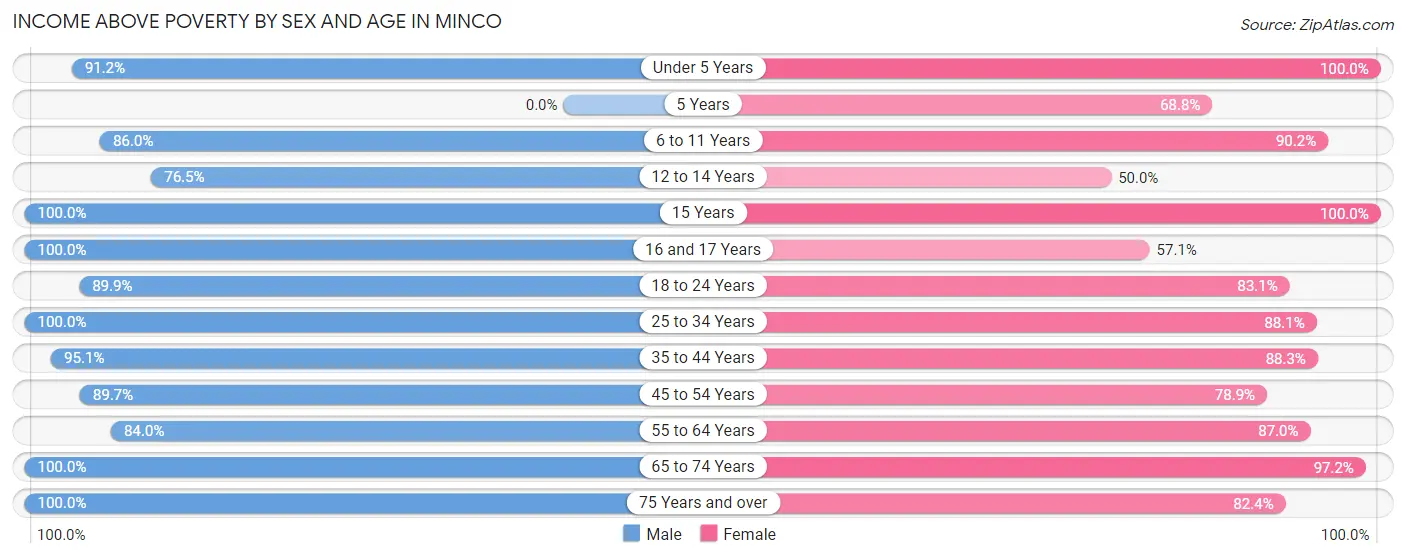
| Age Bracket | Male | Female |
| Under 5 Years | 52 (91.2%) | 17 (100.0%) |
| 5 Years | 0 (0.0%) | 11 (68.8%) |
| 6 to 11 Years | 43 (86.0%) | 37 (90.2%) |
| 12 to 14 Years | 13 (76.5%) | 11 (50.0%) |
| 15 Years | 5 (100.0%) | 19 (100.0%) |
| 16 and 17 Years | 8 (100.0%) | 12 (57.1%) |
| 18 to 24 Years | 62 (89.9%) | 59 (83.1%) |
| 25 to 34 Years | 101 (100.0%) | 74 (88.1%) |
| 35 to 44 Years | 77 (95.1%) | 53 (88.3%) |
| 45 to 54 Years | 70 (89.7%) | 86 (78.9%) |
| 55 to 64 Years | 89 (84.0%) | 80 (87.0%) |
| 65 to 74 Years | 47 (100.0%) | 141 (97.2%) |
| 75 Years and over | 44 (100.0%) | 42 (82.4%) |
| Total | 611 (92.2%) | 642 (85.8%) |
Income Below Poverty Among Married-Couple Families in Minco
The poverty statistics for married-couple families in Minco show that 3.0% or 9 of the total 299 families live below the poverty line. Families with 3 or 4 children have the highest poverty rate of 5.6%, comprising of 2 families. On the other hand, families with 1 or 2 children have the lowest poverty rate of 0.0%, which includes 0 families.
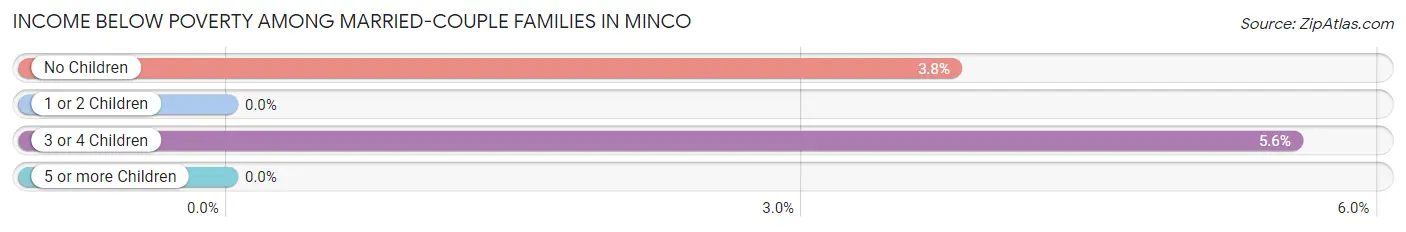
| Children | Above Poverty | Below Poverty |
| No Children | 178 (96.2%) | 7 (3.8%) |
| 1 or 2 Children | 78 (100.0%) | 0 (0.0%) |
| 3 or 4 Children | 34 (94.4%) | 2 (5.6%) |
| 5 or more Children | 0 (0.0%) | 0 (0.0%) |
| Total | 290 (97.0%) | 9 (3.0%) |
Income Below Poverty Among Single-Parent Households in Minco
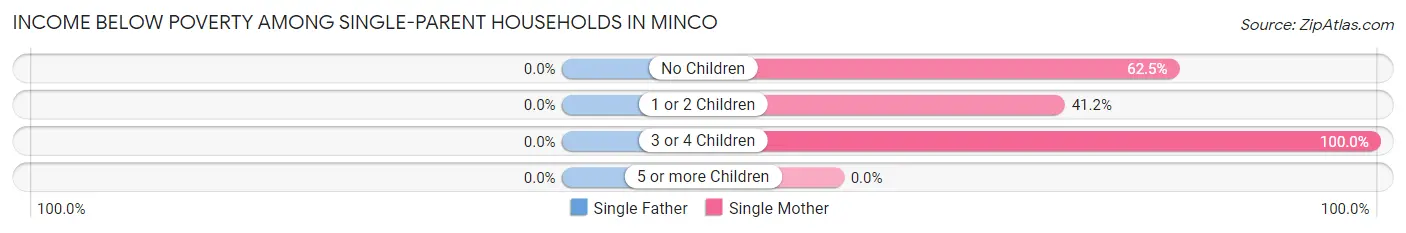
| Children | Single Father | Single Mother |
| No Children | 0 (0.0%) | 5 (62.5%) |
| 1 or 2 Children | 0 (0.0%) | 14 (41.2%) |
| 3 or 4 Children | 0 (0.0%) | 2 (100.0%) |
| 5 or more Children | 0 (0.0%) | 0 (0.0%) |
| Total | 0 (0.0%) | 21 (47.7%) |
Income Below Poverty Among Married-Couple vs Single-Parent Households in Minco
The poverty data for Minco shows that 9 of the married-couple family households (3.0%) and 21 of the single-parent households (33.9%) are living below the poverty level. Within the married-couple family households, those with 3 or 4 children have the highest poverty rate, with 2 households (5.6%) falling below the poverty line. Among the single-parent households, those with 3 or 4 children have the highest poverty rate, with 2 household (100.0%) living below poverty.
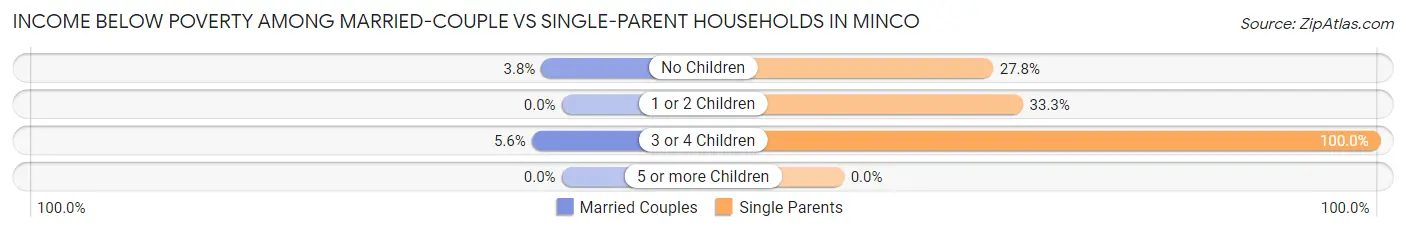
| Children | Married-Couple Families | Single-Parent Households |
| No Children | 7 (3.8%) | 5 (27.8%) |
| 1 or 2 Children | 0 (0.0%) | 14 (33.3%) |
| 3 or 4 Children | 2 (5.6%) | 2 (100.0%) |
| 5 or more Children | 0 (0.0%) | 0 (0.0%) |
| Total | 9 (3.0%) | 21 (33.9%) |
Race in Minco
The most populous races in Minco are White / Caucasian (1,317 | 87.7%), Hispanic or Latino (105 | 7.0%), and Two or more Races (100 | 6.7%).
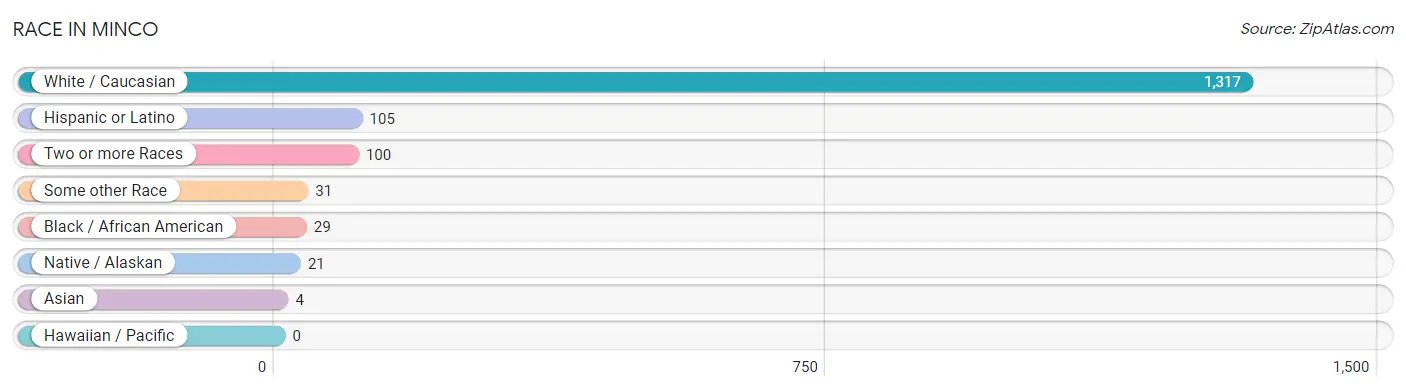
| Race | # Population | % Population |
| Asian | 4 | 0.3% |
| Black / African American | 29 | 1.9% |
| Hawaiian / Pacific | 0 | 0.0% |
| Hispanic or Latino | 105 | 7.0% |
| Native / Alaskan | 21 | 1.4% |
| White / Caucasian | 1,317 | 87.7% |
| Two or more Races | 100 | 6.7% |
| Some other Race | 31 | 2.1% |
| Total | 1,502 | 100.0% |
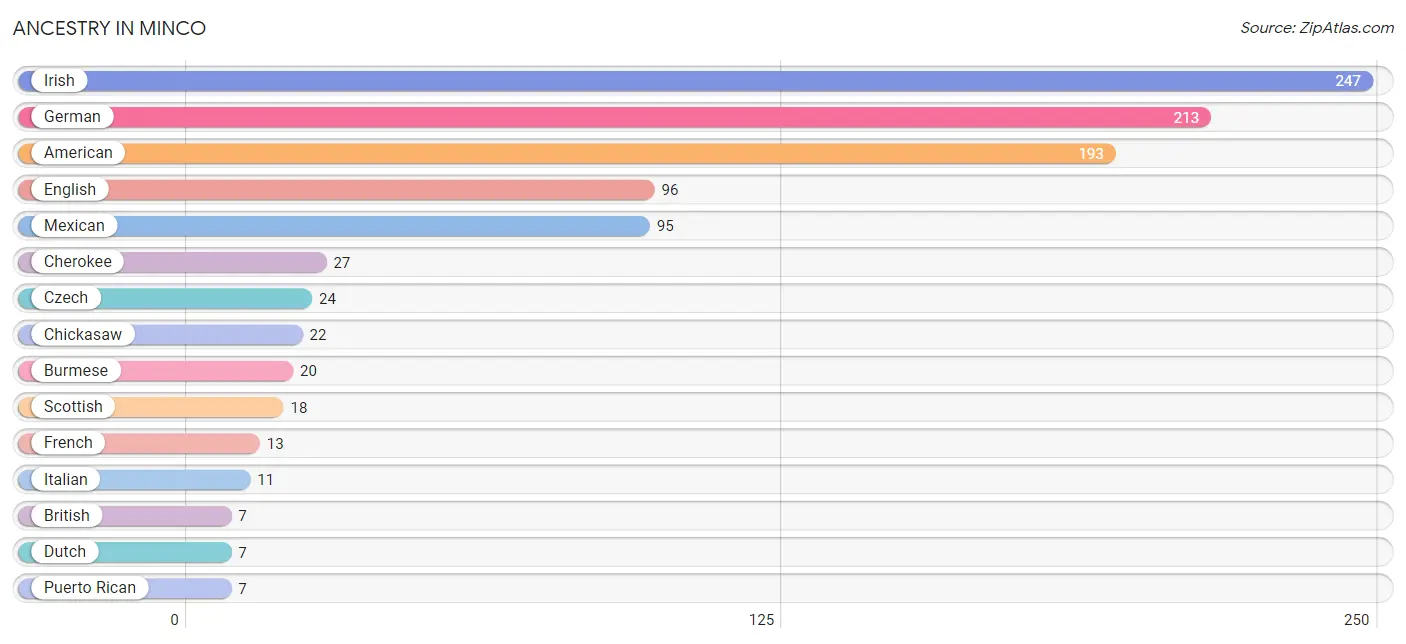
Ancestry in Minco
The most populous ancestries reported in Minco are Irish (247 | 16.4%), German (213 | 14.2%), American (193 | 12.9%), English (96 | 6.4%), and Mexican (95 | 6.3%), together accounting for 56.2% of all Minco residents.
| Ancestry | # Population | % Population |
| American | 193 | 12.9% |
| Apache | 2 | 0.1% |
| British | 7 | 0.5% |
| Burmese | 20 | 1.3% |
| Cherokee | 27 | 1.8% |
| Cheyenne | 2 | 0.1% |
| Chickasaw | 22 | 1.5% |
| Choctaw | 6 | 0.4% |
| Czech | 24 | 1.6% |
| Dutch | 7 | 0.5% |
| English | 96 | 6.4% |
| European | 6 | 0.4% |
| French | 13 | 0.9% |
| German | 213 | 14.2% |
| Indian (Asian) | 4 | 0.3% |
| Irish | 247 | 16.4% |
| Italian | 11 | 0.7% |
| Mexican | 95 | 6.3% |
| Norwegian | 2 | 0.1% |
| Pennsylvania German | 3 | 0.2% |
| Polish | 4 | 0.3% |
| Potawatomi | 2 | 0.1% |
| Puerto Rican | 7 | 0.5% |
| Russian | 3 | 0.2% |
| Scandinavian | 5 | 0.3% |
| Scotch-Irish | 4 | 0.3% |
| Scottish | 18 | 1.2% |
| Seminole | 1 | 0.1% |
| Sioux | 2 | 0.1% |
| Spaniard | 3 | 0.2% |
| Welsh | 3 | 0.2% | View All 31 Rows |
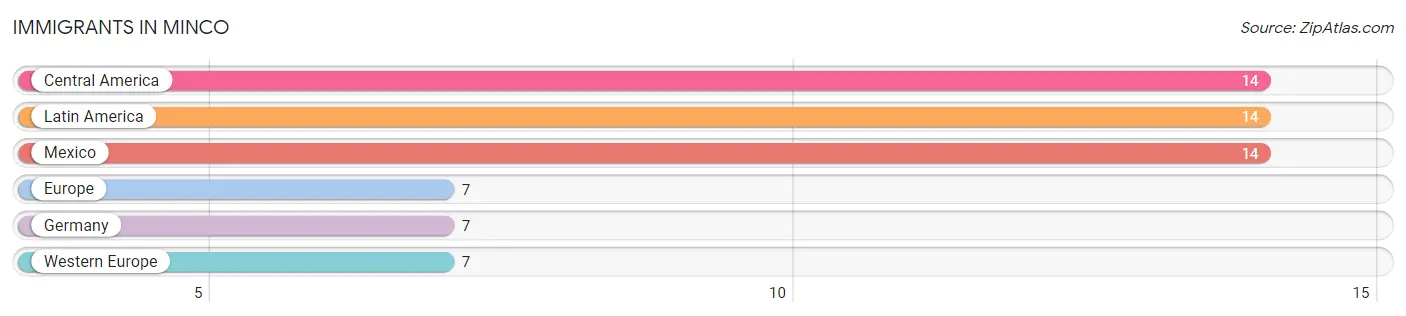
Immigrants in Minco
The most numerous immigrant groups reported in Minco came from Central America (14 | 0.9%), Latin America (14 | 0.9%), Mexico (14 | 0.9%), Europe (7 | 0.5%), and Germany (7 | 0.5%), together accounting for 3.7% of all Minco residents.
| Immigration Origin | # Population | % Population |
| Central America | 14 | 0.9% |
| Europe | 7 | 0.5% |
| Germany | 7 | 0.5% |
| Latin America | 14 | 0.9% |
| Mexico | 14 | 0.9% |
| Western Europe | 7 | 0.5% | View All 6 Rows |
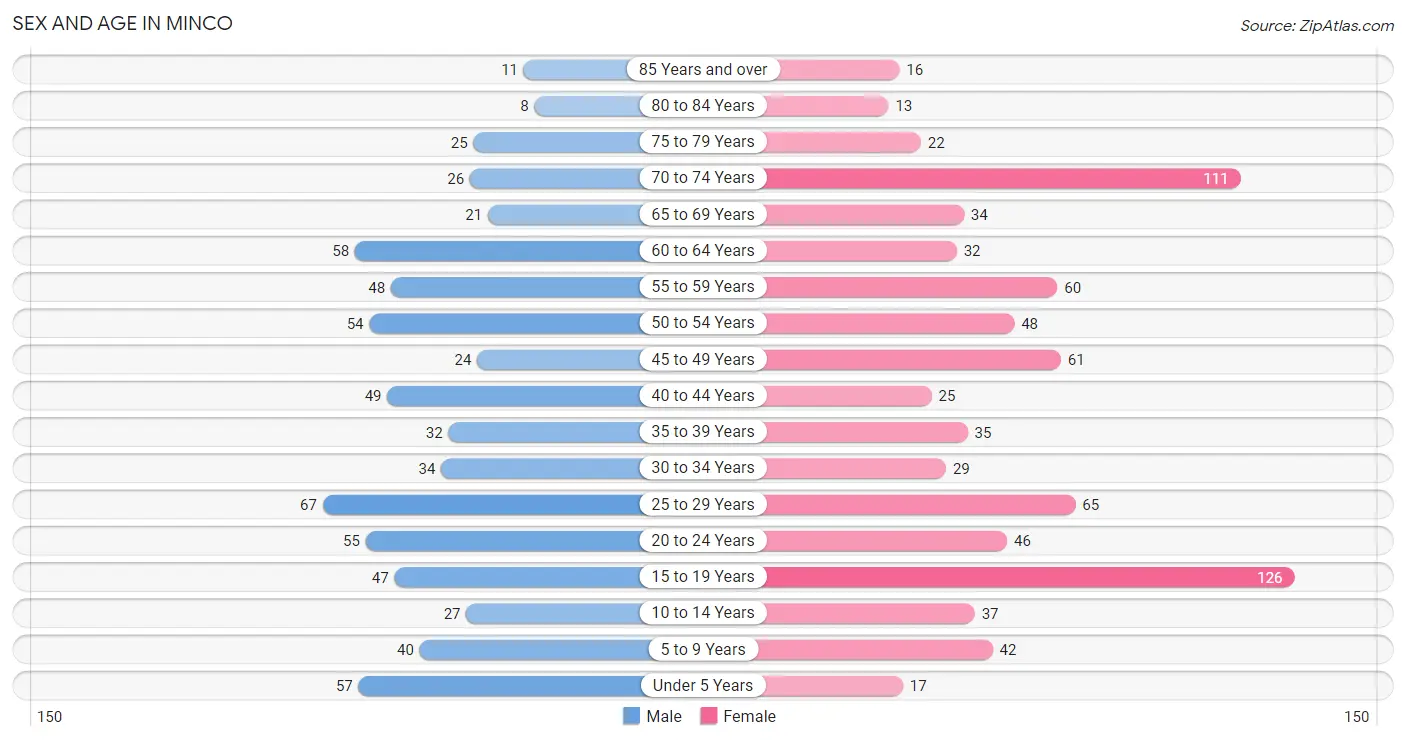
Sex and Age in Minco
Sex and Age in Minco
The most populous age groups in Minco are 25 to 29 Years (67 | 9.8%) for men and 15 to 19 Years (126 | 15.4%) for women.
| Age Bracket | Male | Female |
| Under 5 Years | 57 (8.4%) | 17 (2.1%) |
| 5 to 9 Years | 40 (5.9%) | 42 (5.1%) |
| 10 to 14 Years | 27 (4.0%) | 37 (4.5%) |
| 15 to 19 Years | 47 (6.9%) | 126 (15.4%) |
| 20 to 24 Years | 55 (8.1%) | 46 (5.6%) |
| 25 to 29 Years | 67 (9.8%) | 65 (7.9%) |
| 30 to 34 Years | 34 (5.0%) | 29 (3.5%) |
| 35 to 39 Years | 32 (4.7%) | 35 (4.3%) |
| 40 to 44 Years | 49 (7.2%) | 25 (3.0%) |
| 45 to 49 Years | 24 (3.5%) | 61 (7.4%) |
| 50 to 54 Years | 54 (7.9%) | 48 (5.9%) |
| 55 to 59 Years | 48 (7.0%) | 60 (7.3%) |
| 60 to 64 Years | 58 (8.5%) | 32 (3.9%) |
| 65 to 69 Years | 21 (3.1%) | 34 (4.2%) |
| 70 to 74 Years | 26 (3.8%) | 111 (13.6%) |
| 75 to 79 Years | 25 (3.7%) | 22 (2.7%) |
| 80 to 84 Years | 8 (1.2%) | 13 (1.6%) |
| 85 Years and over | 11 (1.6%) | 16 (1.9%) |
| Total | 683 (100.0%) | 819 (100.0%) |
Families and Households in Minco
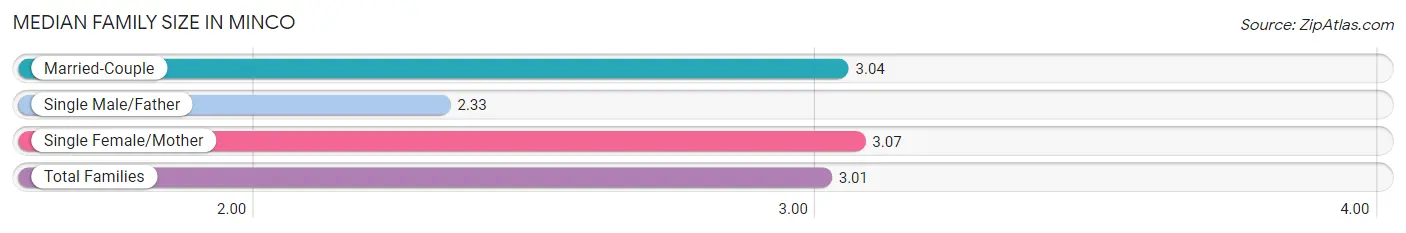
Median Family Size in Minco
The median family size in Minco is 3.01 persons per family, with single female/mother families (44 | 12.2%) accounting for the largest median family size of 3.07 persons per family. On the other hand, single male/father families (18 | 5.0%) represent the smallest median family size with 2.33 persons per family.
| Family Type | # Families | Family Size |
| Married-Couple | 299 (82.8%) | 3.04 |
| Single Male/Father | 18 (5.0%) | 2.33 |
| Single Female/Mother | 44 (12.2%) | 3.07 |
| Total Families | 361 (100.0%) | 3.01 |
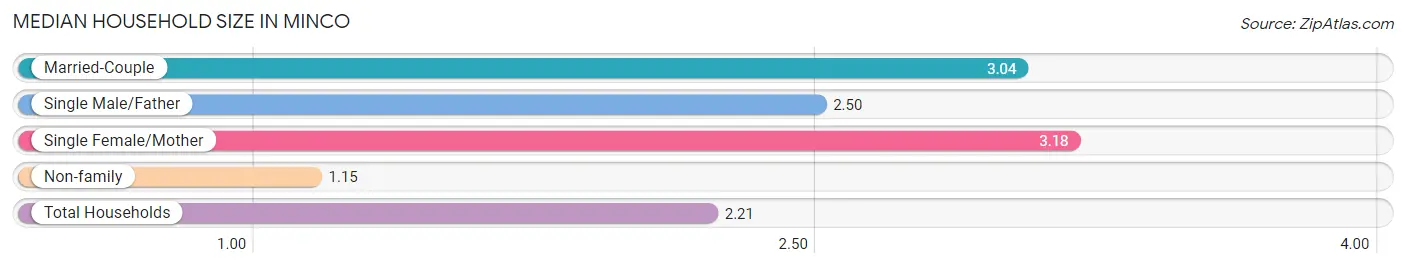
Median Household Size in Minco
The median household size in Minco is 2.21 persons per household, with single female/mother households (44 | 6.9%) accounting for the largest median household size of 3.18 persons per household. non-family households (277 | 43.4%) represent the smallest median household size with 1.15 persons per household.
| Household Type | # Households | Household Size |
| Married-Couple | 299 (46.9%) | 3.04 |
| Single Male/Father | 18 (2.8%) | 2.50 |
| Single Female/Mother | 44 (6.9%) | 3.18 |
| Non-family | 277 (43.4%) | 1.15 |
| Total Households | 638 (100.0%) | 2.21 |
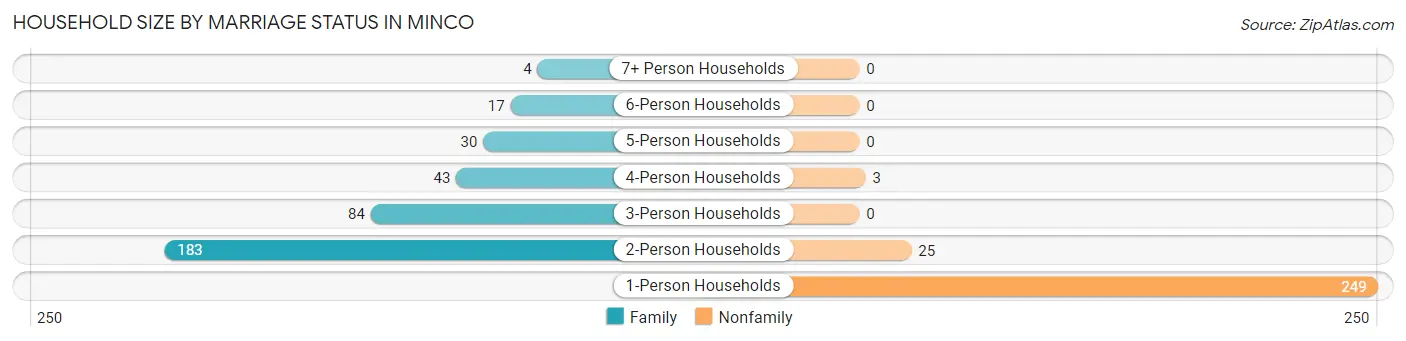
Household Size by Marriage Status in Minco
Out of a total of 638 households in Minco, 361 (56.6%) are family households, while 277 (43.4%) are nonfamily households. The most numerous type of family households are 2-person households, comprising 183, and the most common type of nonfamily households are 1-person households, comprising 249.
| Household Size | Family Households | Nonfamily Households |
| 1-Person Households | - | 249 (39.0%) |
| 2-Person Households | 183 (28.7%) | 25 (3.9%) |
| 3-Person Households | 84 (13.2%) | 0 (0.0%) |
| 4-Person Households | 43 (6.7%) | 3 (0.5%) |
| 5-Person Households | 30 (4.7%) | 0 (0.0%) |
| 6-Person Households | 17 (2.7%) | 0 (0.0%) |
| 7+ Person Households | 4 (0.6%) | 0 (0.0%) |
| Total | 361 (56.6%) | 277 (43.4%) |
Female Fertility in Minco
Fertility by Age in Minco
Average fertility rate in Minco is 43.0 births per 1,000 women. Women in the age bracket of 20 to 34 years have the highest fertility rate with 121.0 births per 1,000 women. Women in the age bracket of 20 to 34 years acount for 100.0% of all women with births.
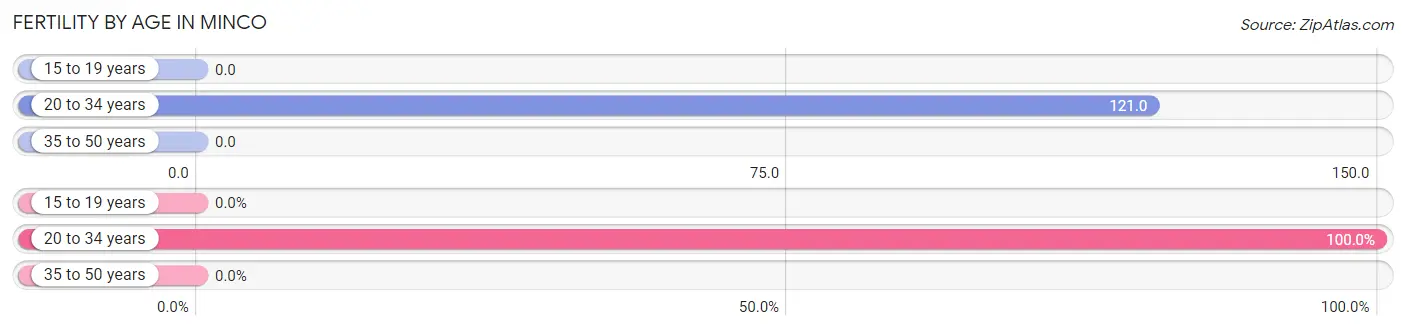
| Age Bracket | Women with Births | Births / 1,000 Women |
| 15 to 19 years | 0 (0.0%) | 0.0 |
| 20 to 34 years | 17 (100.0%) | 121.0 |
| 35 to 50 years | 0 (0.0%) | 0.0 |
| Total | 17 (100.0%) | 43.0 |
Fertility by Age by Marriage Status in Minco
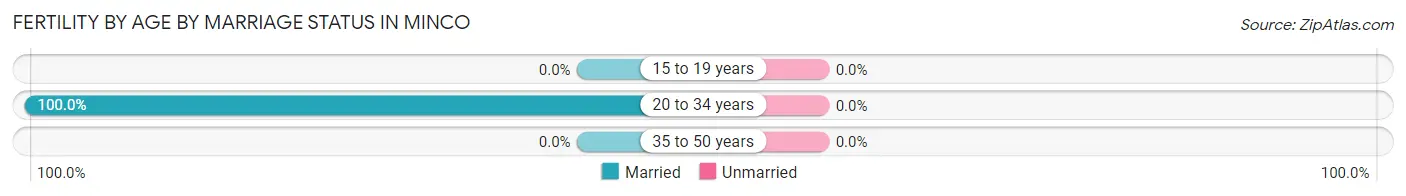
| Age Bracket | Married | Unmarried |
| 15 to 19 years | 0 (0.0%) | 0 (0.0%) |
| 20 to 34 years | 17 (100.0%) | 0 (0.0%) |
| 35 to 50 years | 0 (0.0%) | 0 (0.0%) |
| Total | 17 (100.0%) | 0 (0.0%) |
Fertility by Education in Minco
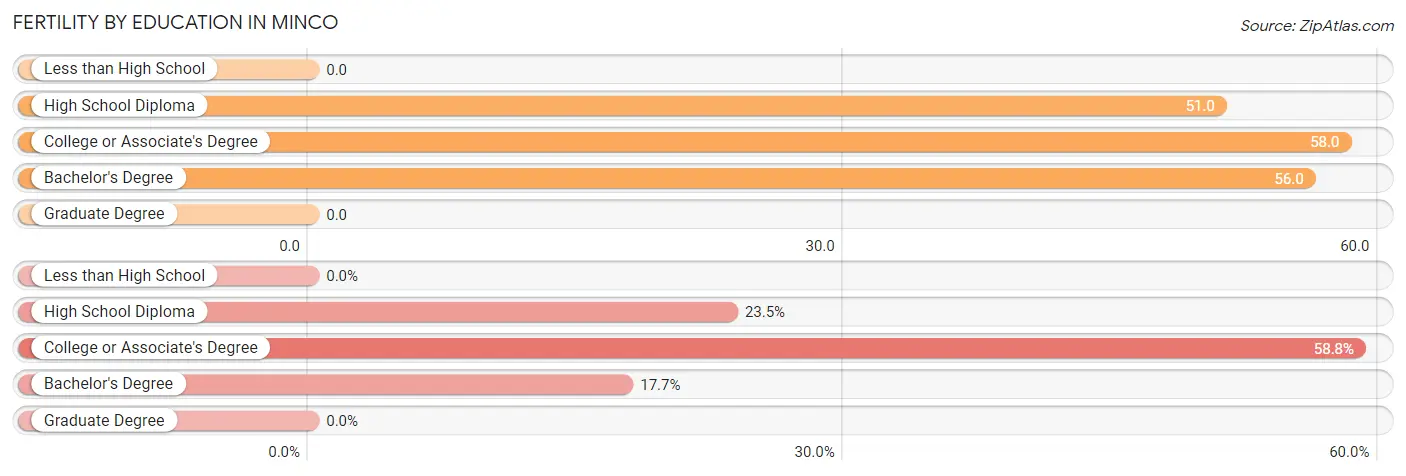
| Educational Attainment | Women with Births | Births / 1,000 Women |
| Less than High School | 0 (0.0%) | 0.0 |
| High School Diploma | 4 (23.5%) | 51.0 |
| College or Associate's Degree | 10 (58.8%) | 58.0 |
| Bachelor's Degree | 3 (17.6%) | 56.0 |
| Graduate Degree | 0 (0.0%) | 0.0 |
| Total | 17 (100.0%) | 43.0 |
Fertility by Education by Marriage Status in Minco
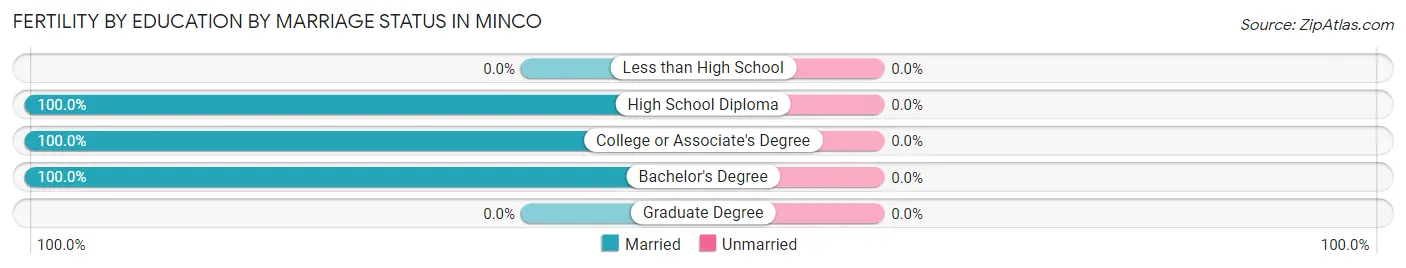
| Educational Attainment | Married | Unmarried |
| Less than High School | 0 (0.0%) | 0 (0.0%) |
| High School Diploma | 4 (100.0%) | 0 (0.0%) |
| College or Associate's Degree | 10 (100.0%) | 0 (0.0%) |
| Bachelor's Degree | 3 (100.0%) | 0 (0.0%) |
| Graduate Degree | 0 (0.0%) | 0 (0.0%) |
| Total | 17 (100.0%) | 0 (0.0%) |
Employment Characteristics in Minco
Employment by Class of Employer in Minco
Among the 698 employed individuals in Minco, private company employees (493 | 70.6%), local government employees (78 | 11.2%), and self-employed (not incorporated) (35 | 5.0%) make up the most common classes of employment.
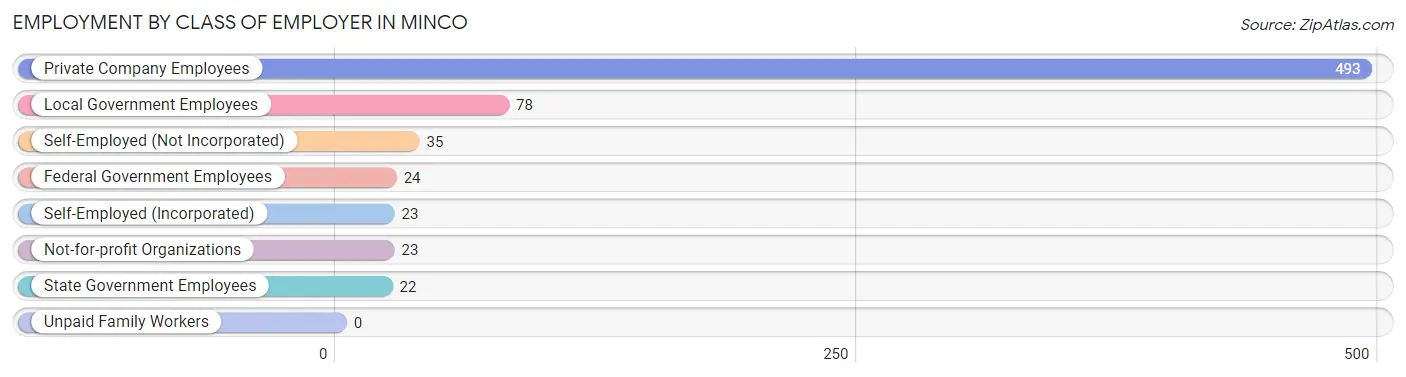
| Employer Class | # Employees | % Employees |
| Private Company Employees | 493 | 70.6% |
| Self-Employed (Incorporated) | 23 | 3.3% |
| Self-Employed (Not Incorporated) | 35 | 5.0% |
| Not-for-profit Organizations | 23 | 3.3% |
| Local Government Employees | 78 | 11.2% |
| State Government Employees | 22 | 3.2% |
| Federal Government Employees | 24 | 3.4% |
| Unpaid Family Workers | 0 | 0.0% |
| Total | 698 | 100.0% |
Employment Status by Age in Minco
According to the labor force statistics for Minco, out of the total population over 16 years of age (1,258), 58.5% or 736 individuals are in the labor force, with 4.0% or 29 of them unemployed. The age group with the highest labor force participation rate is 25 to 29 years, with 90.2% or 119 individuals in the labor force. Within the labor force, the 16 to 19 years age range has the highest percentage of unemployed individuals, with 13.8% or 11 of them being unemployed.
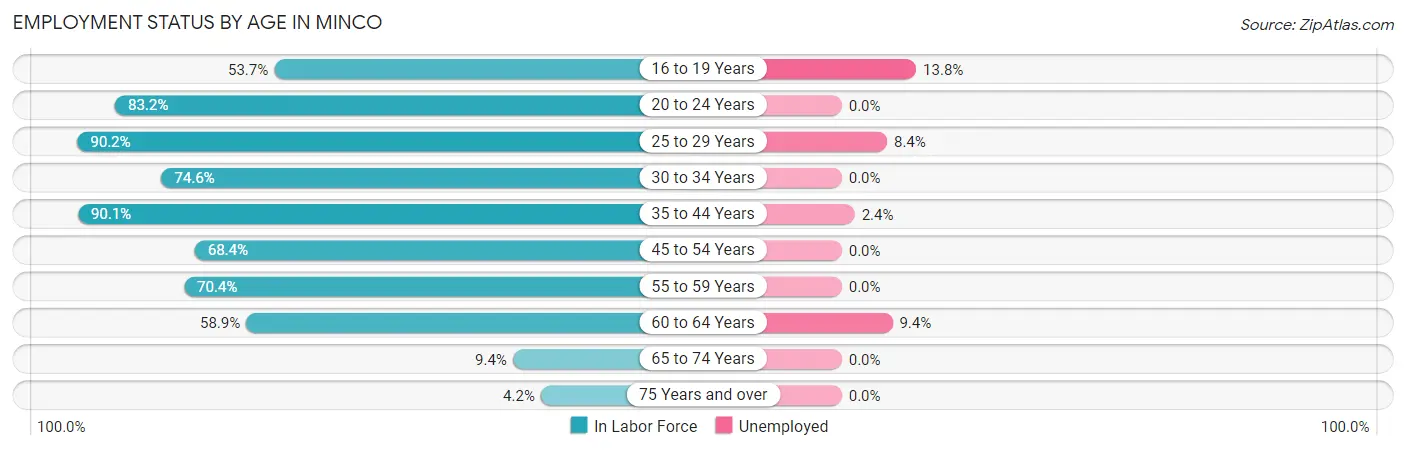
| Age Bracket | In Labor Force | Unemployed |
| 16 to 19 Years | 80 (53.7%) | 11 (13.8%) |
| 20 to 24 Years | 84 (83.2%) | 0 (0.0%) |
| 25 to 29 Years | 119 (90.2%) | 10 (8.4%) |
| 30 to 34 Years | 47 (74.6%) | 0 (0.0%) |
| 35 to 44 Years | 127 (90.1%) | 3 (2.4%) |
| 45 to 54 Years | 128 (68.4%) | 0 (0.0%) |
| 55 to 59 Years | 76 (70.4%) | 0 (0.0%) |
| 60 to 64 Years | 53 (58.9%) | 5 (9.4%) |
| 65 to 74 Years | 18 (9.4%) | 0 (0.0%) |
| 75 Years and over | 4 (4.2%) | 0 (0.0%) |
| Total | 736 (58.5%) | 29 (4.0%) |
Employment Status by Educational Attainment in Minco
According to labor force statistics for Minco, 76.3% of individuals (550) out of the total population between 25 and 64 years of age (721) are in the labor force, with 3.3% or 18 of them being unemployed. The group with the highest labor force participation rate are those with the educational attainment of bachelor's degree or higher, with 90.4% or 142 individuals in the labor force. Within the labor force, individuals with less than high school education have the highest percentage of unemployment, with 19.2% or 5 of them being unemployed.
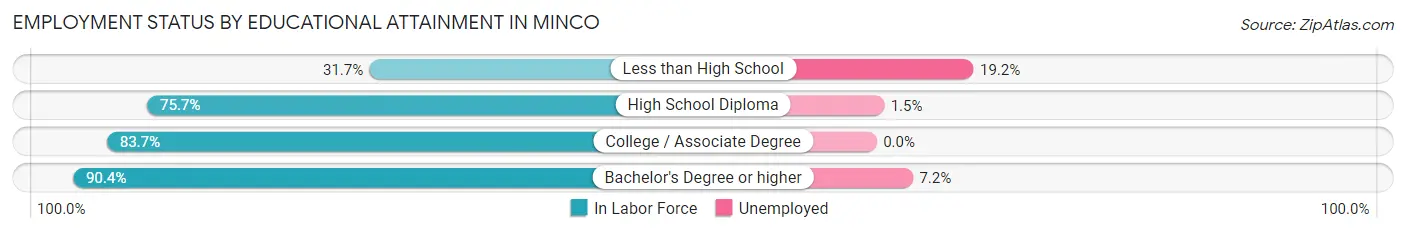
| Educational Attainment | In Labor Force | Unemployed |
| Less than High School | 26 (31.7%) | 16 (19.2%) |
| High School Diploma | 202 (75.7%) | 4 (1.5%) |
| College / Associate Degree | 180 (83.7%) | 0 (0.0%) |
| Bachelor's Degree or higher | 142 (90.4%) | 11 (7.2%) |
| Total | 550 (76.3%) | 24 (3.3%) |
Employment Occupations by Sex in Minco
Management, Business, Science and Arts Occupations
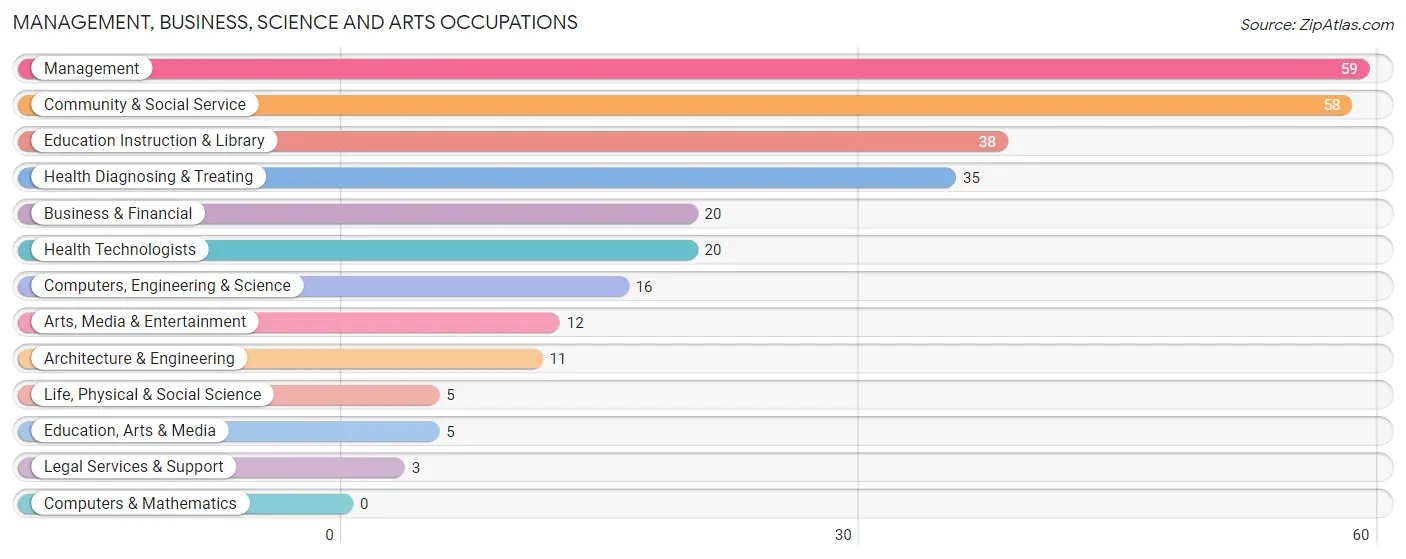
The most common Management, Business, Science and Arts occupations in Minco are Management (59 | 8.4%), Community & Social Service (58 | 8.2%), Education Instruction & Library (38 | 5.4%), Health Diagnosing & Treating (35 | 5.0%), and Business & Financial (20 | 2.8%).
Management, Business, Science and Arts Occupations by Sex
Within the Management, Business, Science and Arts occupations in Minco, the most male-oriented occupations are Computers, Engineering & Science (100.0%), Architecture & Engineering (100.0%), and Life, Physical & Social Science (100.0%), while the most female-oriented occupations are Legal Services & Support (100.0%), Education Instruction & Library (100.0%), and Arts, Media & Entertainment (100.0%).
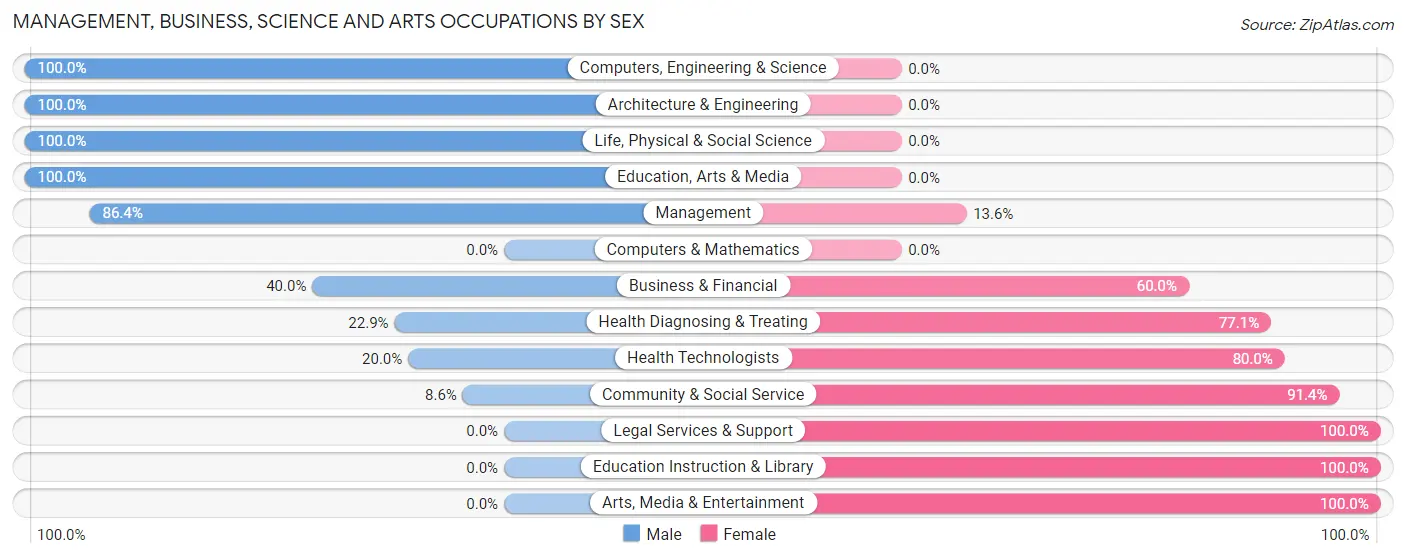
| Occupation | Male | Female |
| Management | 51 (86.4%) | 8 (13.6%) |
| Business & Financial | 8 (40.0%) | 12 (60.0%) |
| Computers, Engineering & Science | 16 (100.0%) | 0 (0.0%) |
| Computers & Mathematics | 0 (0.0%) | 0 (0.0%) |
| Architecture & Engineering | 11 (100.0%) | 0 (0.0%) |
| Life, Physical & Social Science | 5 (100.0%) | 0 (0.0%) |
| Community & Social Service | 5 (8.6%) | 53 (91.4%) |
| Education, Arts & Media | 5 (100.0%) | 0 (0.0%) |
| Legal Services & Support | 0 (0.0%) | 3 (100.0%) |
| Education Instruction & Library | 0 (0.0%) | 38 (100.0%) |
| Arts, Media & Entertainment | 0 (0.0%) | 12 (100.0%) |
| Health Diagnosing & Treating | 8 (22.9%) | 27 (77.1%) |
| Health Technologists | 4 (20.0%) | 16 (80.0%) |
| Total (Category) | 88 (46.8%) | 100 (53.2%) |
| Total (Overall) | 370 (52.6%) | 334 (47.4%) |
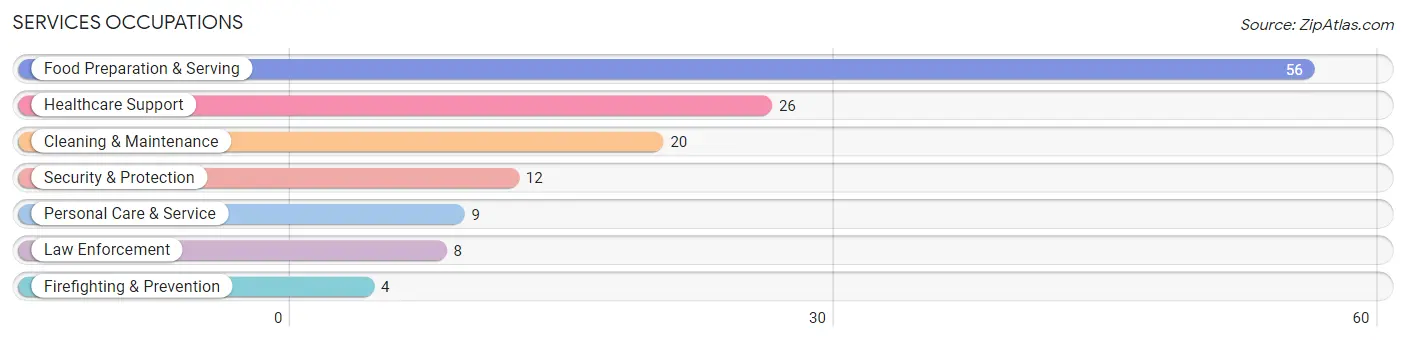
Services Occupations
The most common Services occupations in Minco are Food Preparation & Serving (56 | 8.0%), Healthcare Support (26 | 3.7%), Cleaning & Maintenance (20 | 2.8%), Security & Protection (12 | 1.7%), and Personal Care & Service (9 | 1.3%).
Services Occupations by Sex
Within the Services occupations in Minco, the most male-oriented occupations are Security & Protection (100.0%), Firefighting & Prevention (100.0%), and Law Enforcement (100.0%), while the most female-oriented occupations are Food Preparation & Serving (89.3%), Healthcare Support (80.8%), and Personal Care & Service (66.7%).
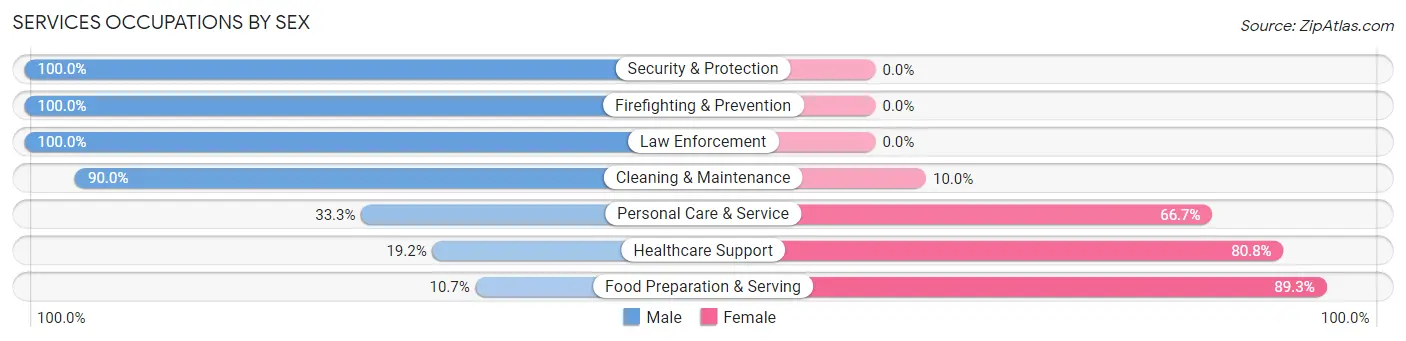
| Occupation | Male | Female |
| Healthcare Support | 5 (19.2%) | 21 (80.8%) |
| Security & Protection | 12 (100.0%) | 0 (0.0%) |
| Firefighting & Prevention | 4 (100.0%) | 0 (0.0%) |
| Law Enforcement | 8 (100.0%) | 0 (0.0%) |
| Food Preparation & Serving | 6 (10.7%) | 50 (89.3%) |
| Cleaning & Maintenance | 18 (90.0%) | 2 (10.0%) |
| Personal Care & Service | 3 (33.3%) | 6 (66.7%) |
| Total (Category) | 44 (35.8%) | 79 (64.2%) |
| Total (Overall) | 370 (52.6%) | 334 (47.4%) |
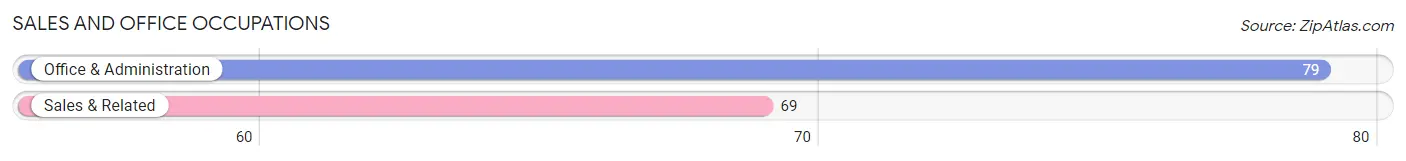
Sales and Office Occupations
The most common Sales and Office occupations in Minco are Office & Administration (79 | 11.2%), and Sales & Related (69 | 9.8%).
Sales and Office Occupations by Sex

| Occupation | Male | Female |
| Sales & Related | 18 (26.1%) | 51 (73.9%) |
| Office & Administration | 7 (8.9%) | 72 (91.1%) |
| Total (Category) | 25 (16.9%) | 123 (83.1%) |
| Total (Overall) | 370 (52.6%) | 334 (47.4%) |
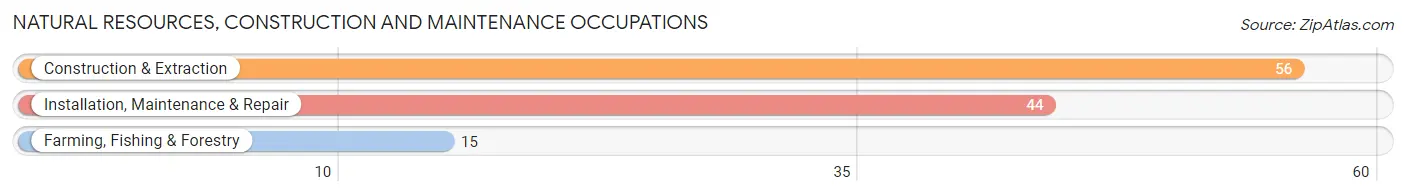
Natural Resources, Construction and Maintenance Occupations
The most common Natural Resources, Construction and Maintenance occupations in Minco are Construction & Extraction (56 | 8.0%), Installation, Maintenance & Repair (44 | 6.2%), and Farming, Fishing & Forestry (15 | 2.1%).
Natural Resources, Construction and Maintenance Occupations by Sex
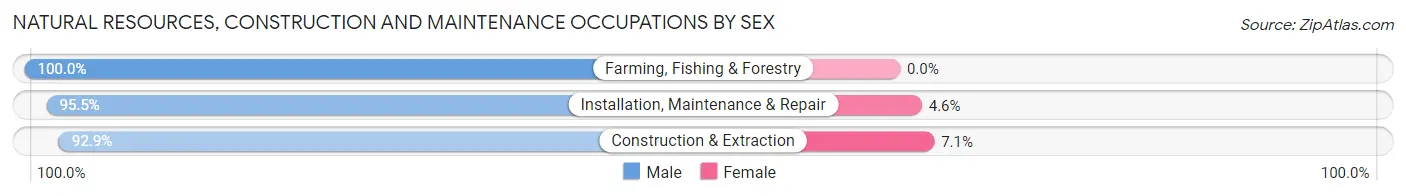
| Occupation | Male | Female |
| Farming, Fishing & Forestry | 15 (100.0%) | 0 (0.0%) |
| Construction & Extraction | 52 (92.9%) | 4 (7.1%) |
| Installation, Maintenance & Repair | 42 (95.5%) | 2 (4.5%) |
| Total (Category) | 109 (94.8%) | 6 (5.2%) |
| Total (Overall) | 370 (52.6%) | 334 (47.4%) |
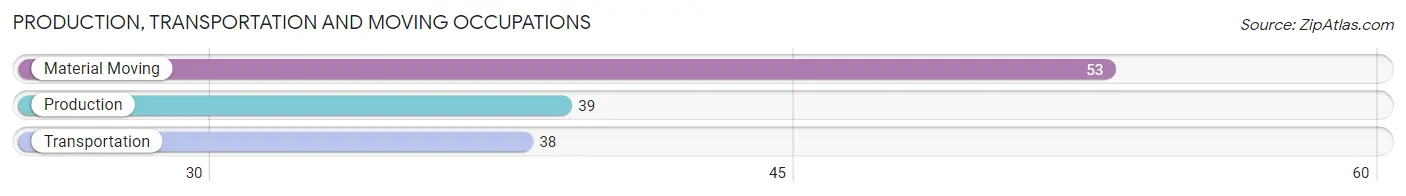
Production, Transportation and Moving Occupations
The most common Production, Transportation and Moving occupations in Minco are Material Moving (53 | 7.5%), Production (39 | 5.5%), and Transportation (38 | 5.4%).
Production, Transportation and Moving Occupations by Sex
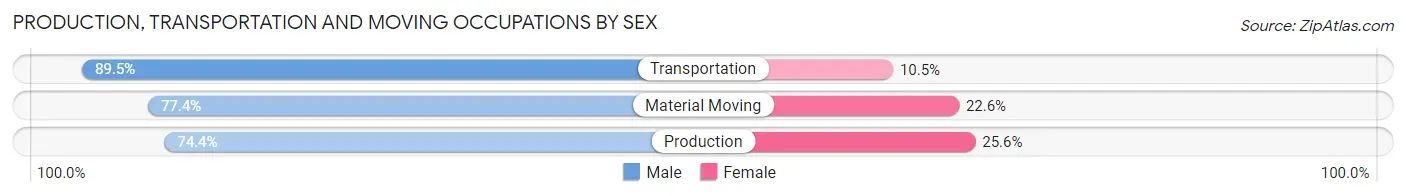
| Occupation | Male | Female |
| Production | 29 (74.4%) | 10 (25.6%) |
| Transportation | 34 (89.5%) | 4 (10.5%) |
| Material Moving | 41 (77.4%) | 12 (22.6%) |
| Total (Category) | 104 (80.0%) | 26 (20.0%) |
| Total (Overall) | 370 (52.6%) | 334 (47.4%) |
Employment Industries by Sex in Minco
Employment Industries in Minco
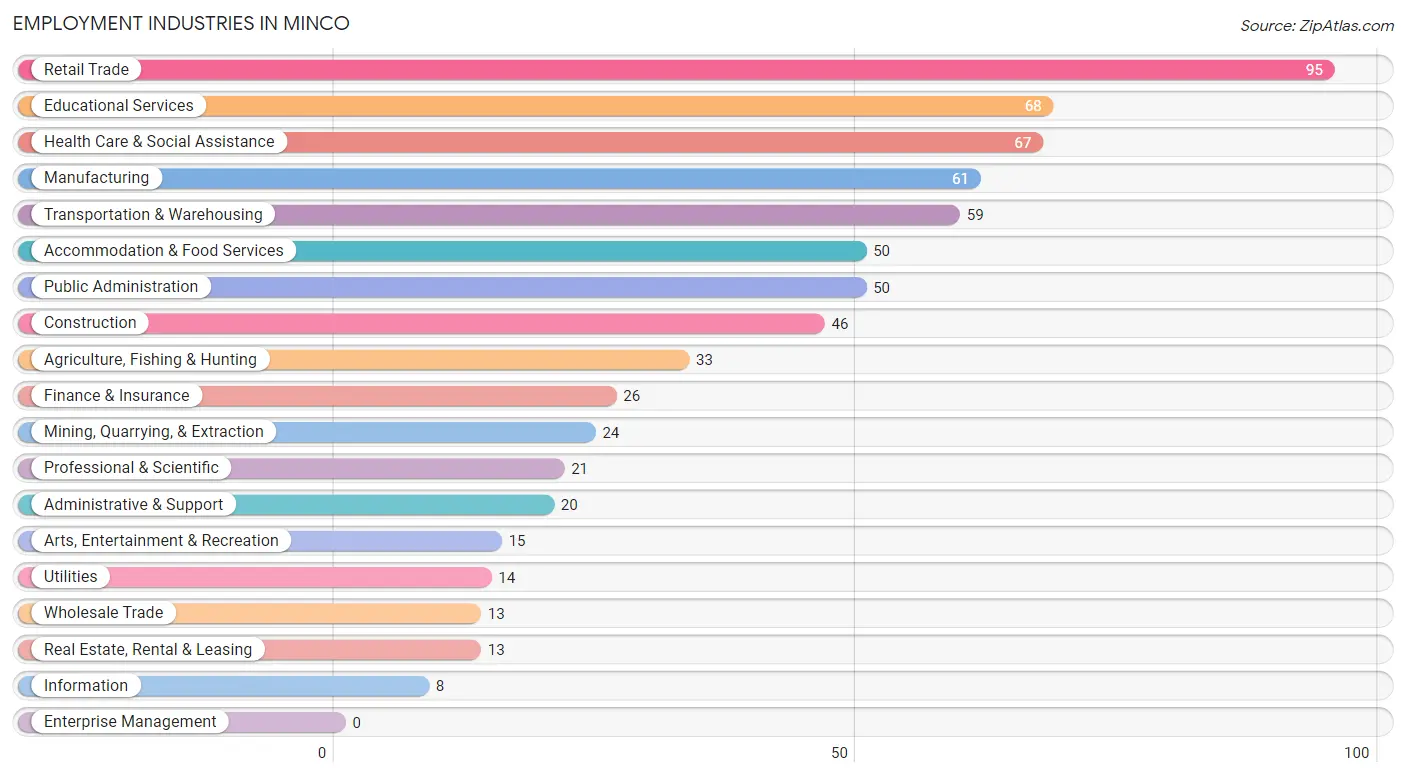
The major employment industries in Minco include Retail Trade (95 | 13.5%), Educational Services (68 | 9.7%), Health Care & Social Assistance (67 | 9.5%), Manufacturing (61 | 8.7%), and Transportation & Warehousing (59 | 8.4%).
Employment Industries by Sex in Minco
The Minco industries that see more men than women are Utilities (100.0%), Information (100.0%), and Mining, Quarrying, & Extraction (87.5%), whereas the industries that tend to have a higher number of women are Professional & Scientific (100.0%), Health Care & Social Assistance (82.1%), and Finance & Insurance (76.9%).
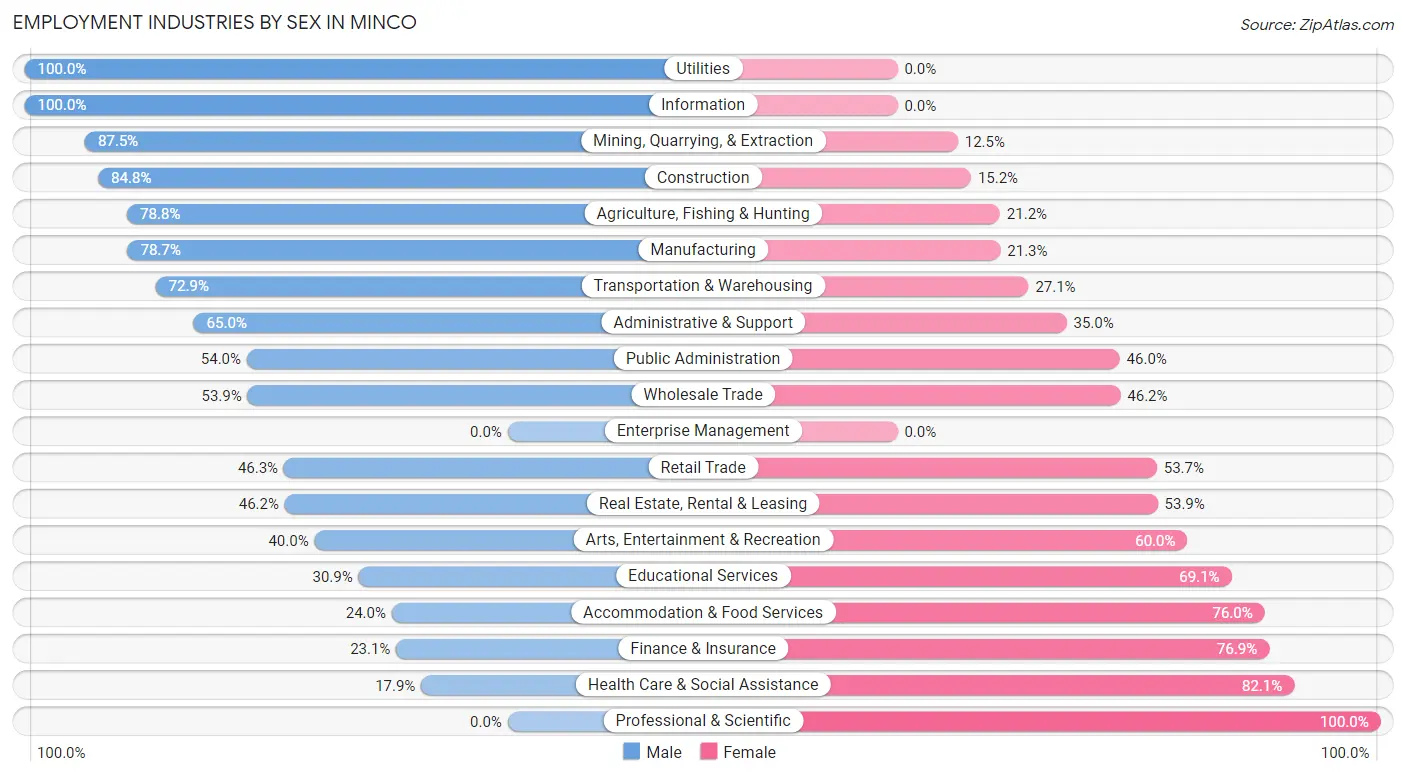
| Industry | Male | Female |
| Agriculture, Fishing & Hunting | 26 (78.8%) | 7 (21.2%) |
| Mining, Quarrying, & Extraction | 21 (87.5%) | 3 (12.5%) |
| Construction | 39 (84.8%) | 7 (15.2%) |
| Manufacturing | 48 (78.7%) | 13 (21.3%) |
| Wholesale Trade | 7 (53.8%) | 6 (46.2%) |
| Retail Trade | 44 (46.3%) | 51 (53.7%) |
| Transportation & Warehousing | 43 (72.9%) | 16 (27.1%) |
| Utilities | 14 (100.0%) | 0 (0.0%) |
| Information | 8 (100.0%) | 0 (0.0%) |
| Finance & Insurance | 6 (23.1%) | 20 (76.9%) |
| Real Estate, Rental & Leasing | 6 (46.2%) | 7 (53.8%) |
| Professional & Scientific | 0 (0.0%) | 21 (100.0%) |
| Enterprise Management | 0 (0.0%) | 0 (0.0%) |
| Administrative & Support | 13 (65.0%) | 7 (35.0%) |
| Educational Services | 21 (30.9%) | 47 (69.1%) |
| Health Care & Social Assistance | 12 (17.9%) | 55 (82.1%) |
| Arts, Entertainment & Recreation | 6 (40.0%) | 9 (60.0%) |
| Accommodation & Food Services | 12 (24.0%) | 38 (76.0%) |
| Public Administration | 27 (54.0%) | 23 (46.0%) |
| Total | 370 (52.6%) | 334 (47.4%) |
Education in Minco
School Enrollment in Minco
The most common levels of schooling among the 333 students in Minco are college / undergraduate (110 | 33.0%), high school (72 | 21.6%), and elementary school (56 | 16.8%).
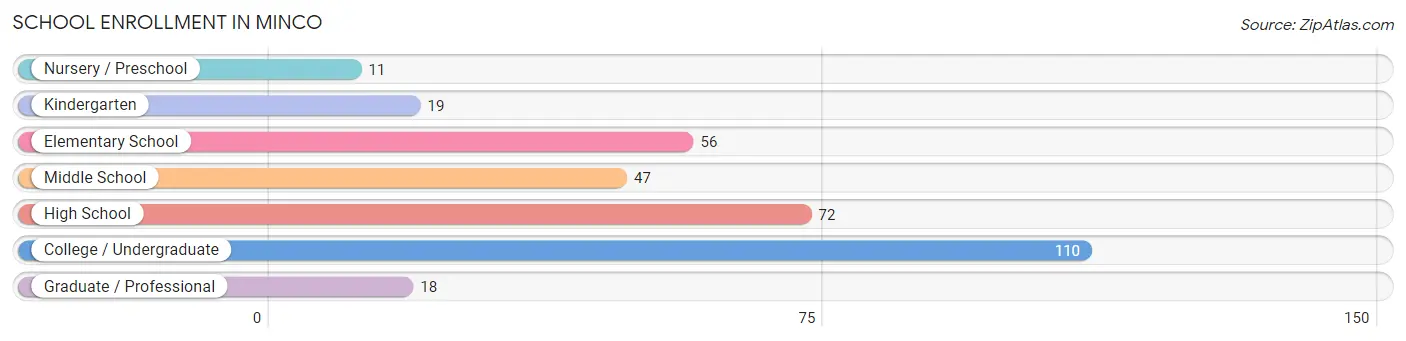
| School Level | # Students | % Students |
| Nursery / Preschool | 11 | 3.3% |
| Kindergarten | 19 | 5.7% |
| Elementary School | 56 | 16.8% |
| Middle School | 47 | 14.1% |
| High School | 72 | 21.6% |
| College / Undergraduate | 110 | 33.0% |
| Graduate / Professional | 18 | 5.4% |
| Total | 333 | 100.0% |
School Enrollment by Age by Funding Source in Minco
Out of a total of 333 students who are enrolled in schools in Minco, 27 (8.1%) attend a private institution, while the remaining 306 (91.9%) are enrolled in public schools. The age group of 25 to 34 year olds has the highest likelihood of being enrolled in private schools, with 8 (38.1% in the age bracket) enrolled. Conversely, the age group of 20 to 24 year olds has the lowest likelihood of being enrolled in a private school, with 11 (100.0% in the age bracket) attending a public institution.
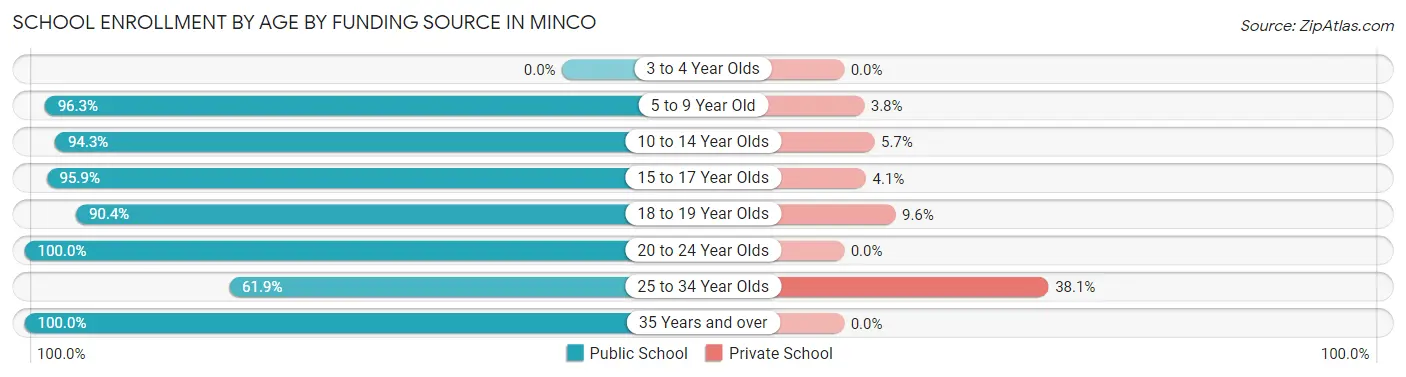
| Age Bracket | Public School | Private School |
| 3 to 4 Year Olds | 0 (0.0%) | 0 (0.0%) |
| 5 to 9 Year Old | 77 (96.3%) | 3 (3.7%) |
| 10 to 14 Year Olds | 50 (94.3%) | 3 (5.7%) |
| 15 to 17 Year Olds | 47 (95.9%) | 2 (4.1%) |
| 18 to 19 Year Olds | 104 (90.4%) | 11 (9.6%) |
| 20 to 24 Year Olds | 11 (100.0%) | 0 (0.0%) |
| 25 to 34 Year Olds | 13 (61.9%) | 8 (38.1%) |
| 35 Years and over | 4 (100.0%) | 0 (0.0%) |
| Total | 306 (91.9%) | 27 (8.1%) |
Educational Attainment by Field of Study in Minco
Education (65 | 31.9%), business (57 | 27.9%), bio, nature & agricultural (24 | 11.8%), psychology (13 | 6.4%), and physical & health sciences (9 | 4.4%) are the most common fields of study among 204 individuals in Minco who have obtained a bachelor's degree or higher.
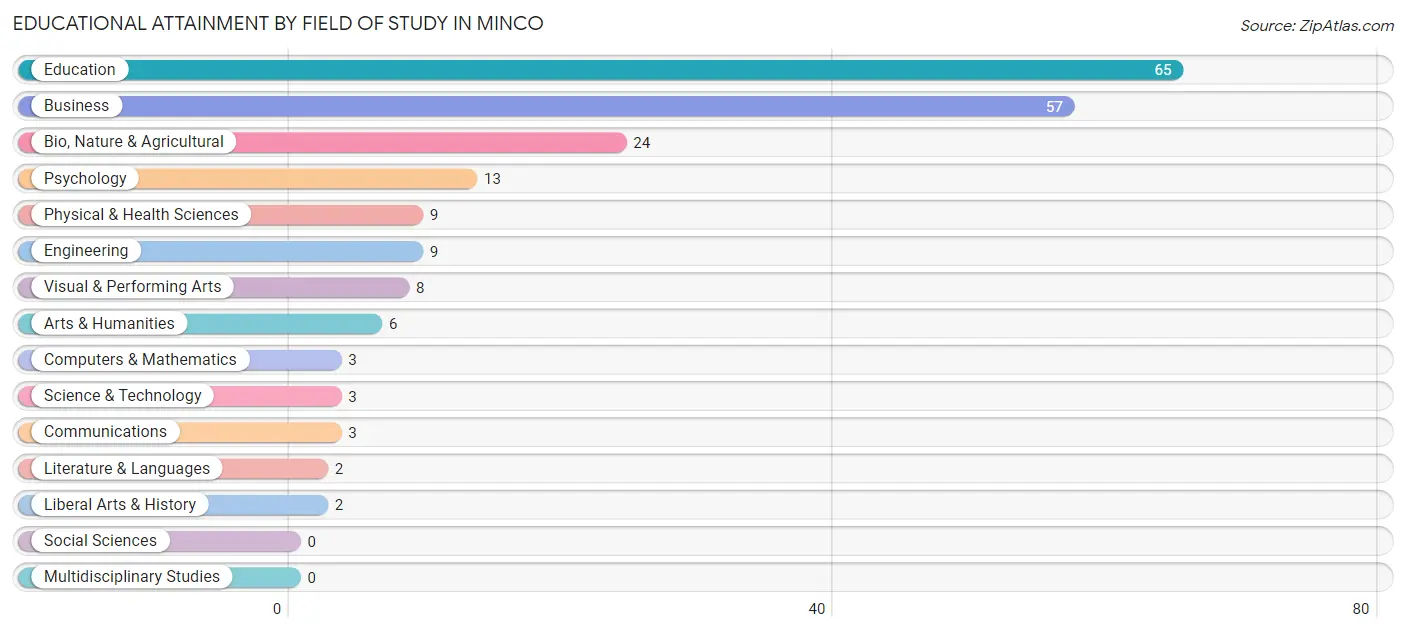
| Field of Study | # Graduates | % Graduates |
| Computers & Mathematics | 3 | 1.5% |
| Bio, Nature & Agricultural | 24 | 11.8% |
| Physical & Health Sciences | 9 | 4.4% |
| Psychology | 13 | 6.4% |
| Social Sciences | 0 | 0.0% |
| Engineering | 9 | 4.4% |
| Multidisciplinary Studies | 0 | 0.0% |
| Science & Technology | 3 | 1.5% |
| Business | 57 | 27.9% |
| Education | 65 | 31.9% |
| Literature & Languages | 2 | 1.0% |
| Liberal Arts & History | 2 | 1.0% |
| Visual & Performing Arts | 8 | 3.9% |
| Communications | 3 | 1.5% |
| Arts & Humanities | 6 | 2.9% |
| Total | 204 | 100.0% |
Transportation & Commute in Minco
Vehicle Availability by Sex in Minco
The most prevalent vehicle ownership categories in Minco are males with 2 vehicles (129, accounting for 35.1%) and females with 2 vehicles (87, making up 46.1%).
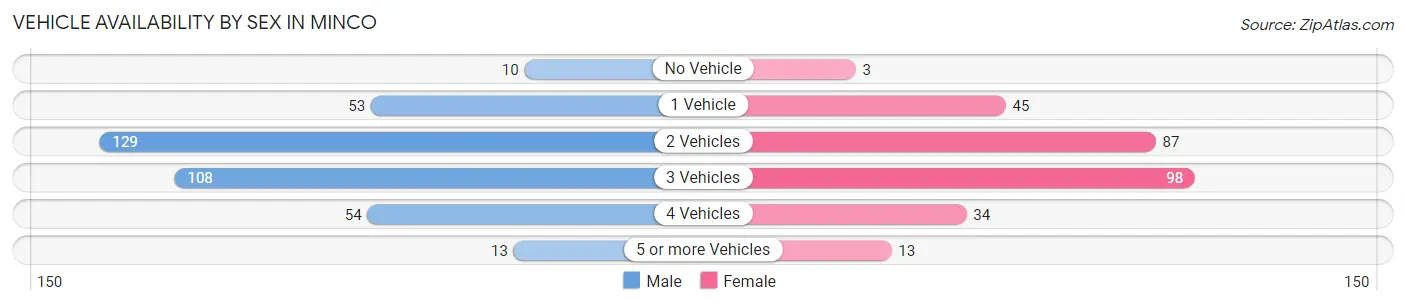
| Vehicles Available | Male | Female |
| No Vehicle | 10 (2.7%) | 3 (1.1%) |
| 1 Vehicle | 53 (14.4%) | 45 (16.1%) |
| 2 Vehicles | 129 (35.1%) | 87 (31.1%) |
| 3 Vehicles | 108 (29.4%) | 98 (35.0%) |
| 4 Vehicles | 54 (14.7%) | 34 (12.1%) |
| 5 or more Vehicles | 13 (3.5%) | 13 (4.6%) |
| Total | 367 (100.0%) | 280 (100.0%) |
Commute Time in Minco
The most frequently occuring commute durations in Minco are 5 to 9 minutes (131 commuters, 20.3%), 30 to 34 minutes (99 commuters, 15.4%), and 20 to 24 minutes (97 commuters, 15.1%).
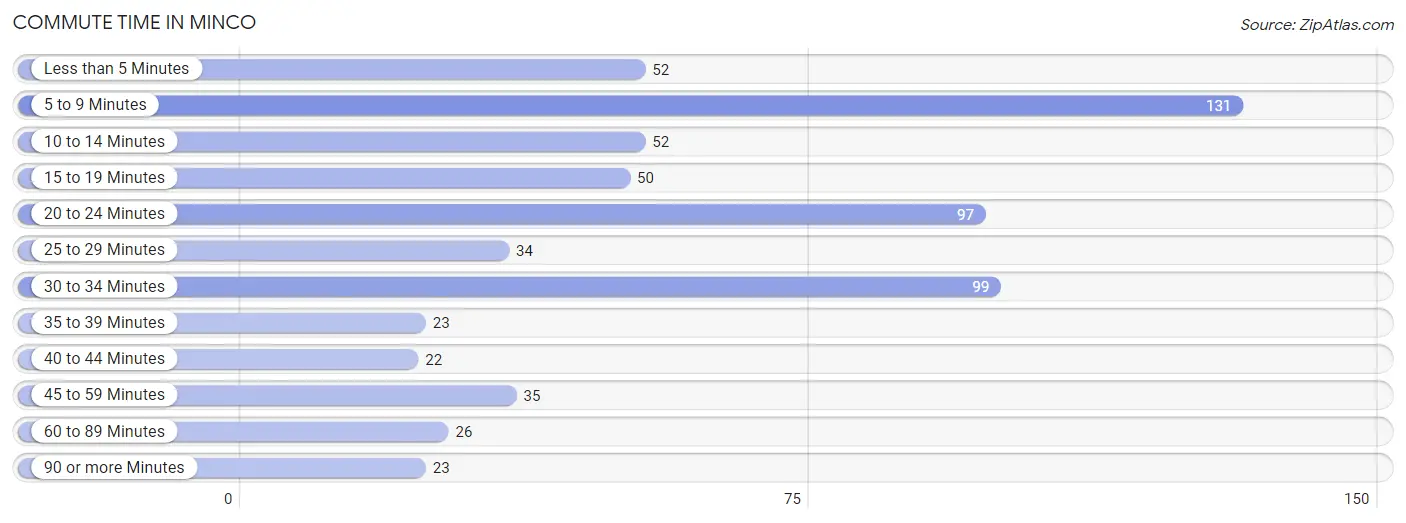
| Commute Time | # Commuters | % Commuters |
| Less than 5 Minutes | 52 | 8.1% |
| 5 to 9 Minutes | 131 | 20.3% |
| 10 to 14 Minutes | 52 | 8.1% |
| 15 to 19 Minutes | 50 | 7.8% |
| 20 to 24 Minutes | 97 | 15.1% |
| 25 to 29 Minutes | 34 | 5.3% |
| 30 to 34 Minutes | 99 | 15.4% |
| 35 to 39 Minutes | 23 | 3.6% |
| 40 to 44 Minutes | 22 | 3.4% |
| 45 to 59 Minutes | 35 | 5.4% |
| 60 to 89 Minutes | 26 | 4.0% |
| 90 or more Minutes | 23 | 3.6% |
Commute Time by Sex in Minco
The most common commute times in Minco are 20 to 24 minutes (63 commuters, 17.7%) for males and 5 to 9 minutes (88 commuters, 30.6%) for females.
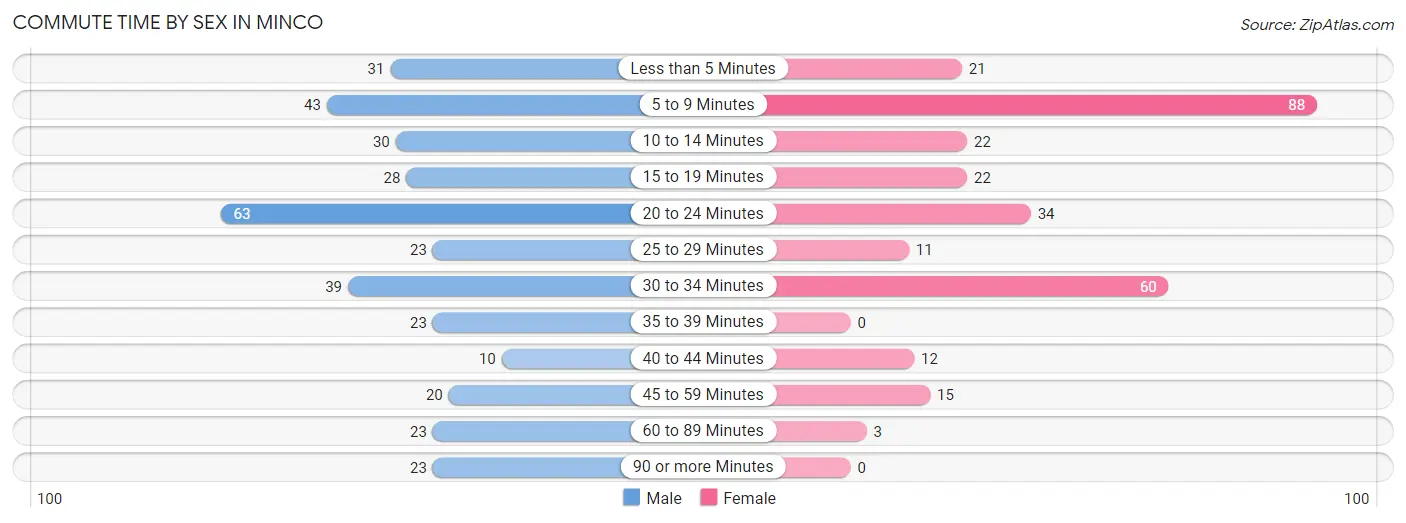
| Commute Time | Male | Female |
| Less than 5 Minutes | 31 (8.7%) | 21 (7.3%) |
| 5 to 9 Minutes | 43 (12.1%) | 88 (30.6%) |
| 10 to 14 Minutes | 30 (8.4%) | 22 (7.6%) |
| 15 to 19 Minutes | 28 (7.9%) | 22 (7.6%) |
| 20 to 24 Minutes | 63 (17.7%) | 34 (11.8%) |
| 25 to 29 Minutes | 23 (6.5%) | 11 (3.8%) |
| 30 to 34 Minutes | 39 (11.0%) | 60 (20.8%) |
| 35 to 39 Minutes | 23 (6.5%) | 0 (0.0%) |
| 40 to 44 Minutes | 10 (2.8%) | 12 (4.2%) |
| 45 to 59 Minutes | 20 (5.6%) | 15 (5.2%) |
| 60 to 89 Minutes | 23 (6.5%) | 3 (1.0%) |
| 90 or more Minutes | 23 (6.5%) | 0 (0.0%) |
Time of Departure to Work by Sex in Minco
The most frequent times of departure to work in Minco are 7:00 AM to 7:29 AM (99, 27.8%) for males and 7:30 AM to 7:59 AM (72, 25.0%) for females.
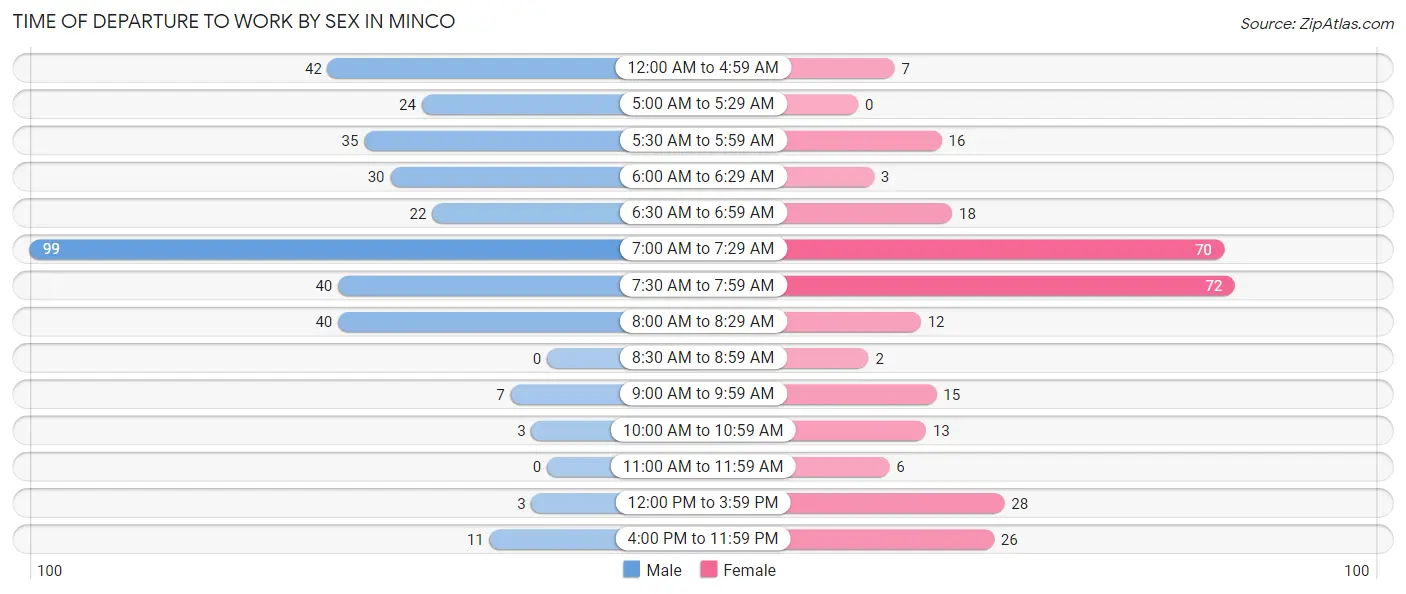
| Time of Departure | Male | Female |
| 12:00 AM to 4:59 AM | 42 (11.8%) | 7 (2.4%) |
| 5:00 AM to 5:29 AM | 24 (6.7%) | 0 (0.0%) |
| 5:30 AM to 5:59 AM | 35 (9.8%) | 16 (5.6%) |
| 6:00 AM to 6:29 AM | 30 (8.4%) | 3 (1.0%) |
| 6:30 AM to 6:59 AM | 22 (6.2%) | 18 (6.2%) |
| 7:00 AM to 7:29 AM | 99 (27.8%) | 70 (24.3%) |
| 7:30 AM to 7:59 AM | 40 (11.2%) | 72 (25.0%) |
| 8:00 AM to 8:29 AM | 40 (11.2%) | 12 (4.2%) |
| 8:30 AM to 8:59 AM | 0 (0.0%) | 2 (0.7%) |
| 9:00 AM to 9:59 AM | 7 (2.0%) | 15 (5.2%) |
| 10:00 AM to 10:59 AM | 3 (0.8%) | 13 (4.5%) |
| 11:00 AM to 11:59 AM | 0 (0.0%) | 6 (2.1%) |
| 12:00 PM to 3:59 PM | 3 (0.8%) | 28 (9.7%) |
| 4:00 PM to 11:59 PM | 11 (3.1%) | 26 (9.0%) |
| Total | 356 (100.0%) | 288 (100.0%) |
Housing Occupancy in Minco
Occupancy by Ownership in Minco
Of the total 638 dwellings in Minco, owner-occupied units account for 374 (58.6%), while renter-occupied units make up 264 (41.4%).
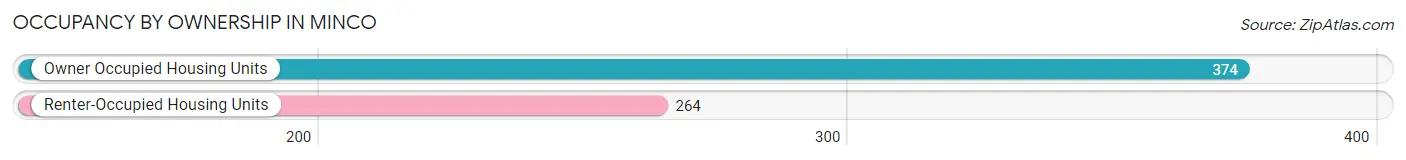
| Occupancy | # Housing Units | % Housing Units |
| Owner Occupied Housing Units | 374 | 58.6% |
| Renter-Occupied Housing Units | 264 | 41.4% |
| Total Occupied Housing Units | 638 | 100.0% |
Occupancy by Household Size in Minco
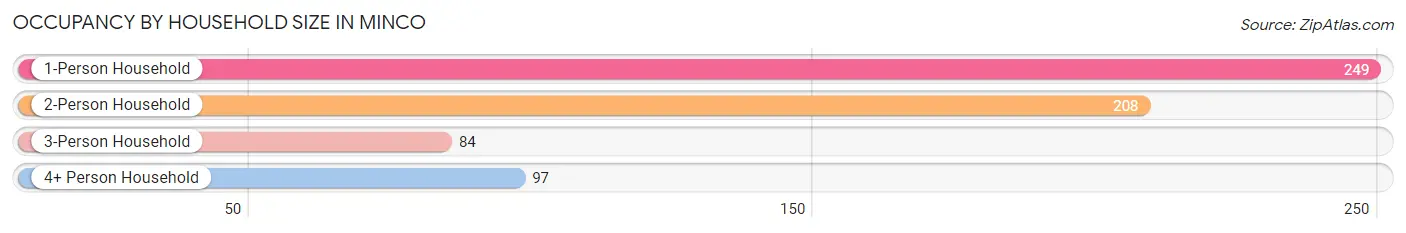
| Household Size | # Housing Units | % Housing Units |
| 1-Person Household | 249 | 39.0% |
| 2-Person Household | 208 | 32.6% |
| 3-Person Household | 84 | 13.2% |
| 4+ Person Household | 97 | 15.2% |
| Total Housing Units | 638 | 100.0% |
Occupancy by Ownership by Household Size in Minco
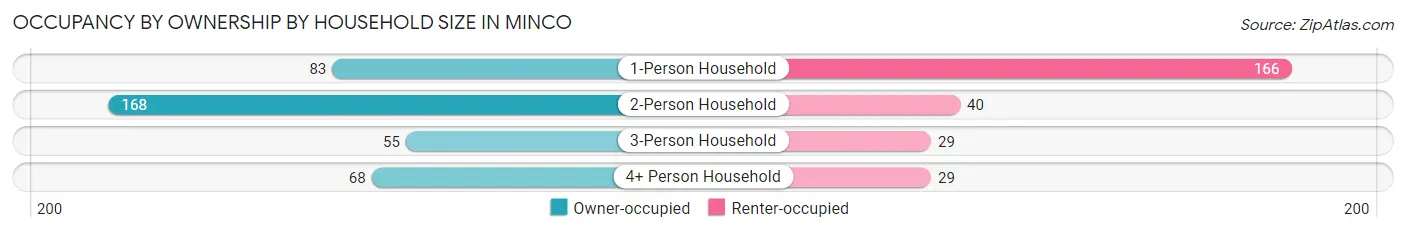
| Household Size | Owner-occupied | Renter-occupied |
| 1-Person Household | 83 (33.3%) | 166 (66.7%) |
| 2-Person Household | 168 (80.8%) | 40 (19.2%) |
| 3-Person Household | 55 (65.5%) | 29 (34.5%) |
| 4+ Person Household | 68 (70.1%) | 29 (29.9%) |
| Total Housing Units | 374 (58.6%) | 264 (41.4%) |
Occupancy by Educational Attainment in Minco
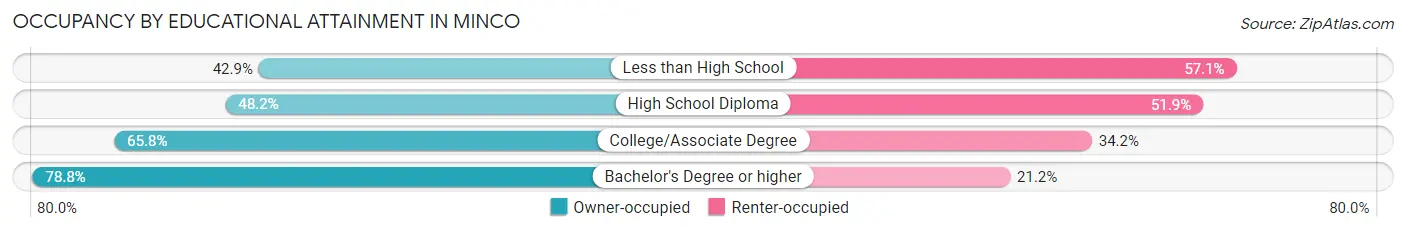
| Household Size | Owner-occupied | Renter-occupied |
| Less than High School | 15 (42.9%) | 20 (57.1%) |
| High School Diploma | 143 (48.1%) | 154 (51.8%) |
| College/Associate Degree | 127 (65.8%) | 66 (34.2%) |
| Bachelor's Degree or higher | 89 (78.8%) | 24 (21.2%) |
Occupancy by Age of Householder in Minco
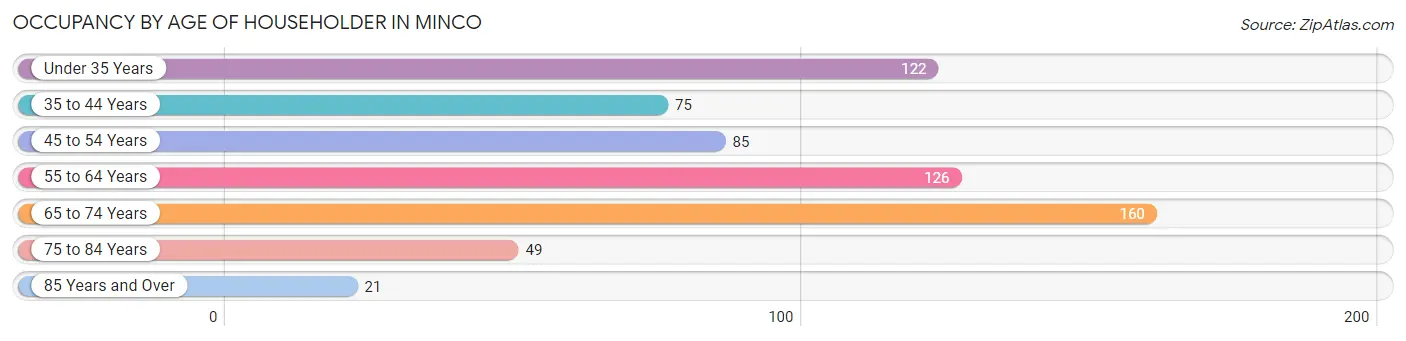
| Age Bracket | # Households | % Households |
| Under 35 Years | 122 | 19.1% |
| 35 to 44 Years | 75 | 11.8% |
| 45 to 54 Years | 85 | 13.3% |
| 55 to 64 Years | 126 | 19.8% |
| 65 to 74 Years | 160 | 25.1% |
| 75 to 84 Years | 49 | 7.7% |
| 85 Years and Over | 21 | 3.3% |
| Total | 638 | 100.0% |
Housing Finances in Minco
Median Income by Occupancy in Minco
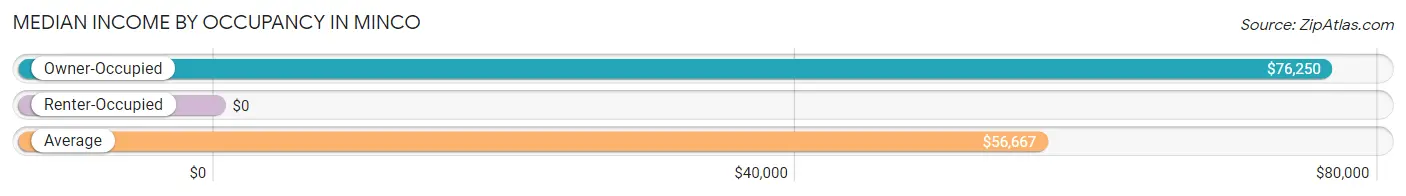
| Occupancy Type | # Households | Median Income |
| Owner-Occupied | 374 (58.6%) | $76,250 |
| Renter-Occupied | 264 (41.4%) | $0 |
| Average | 638 (100.0%) | $56,667 |
Occupancy by Householder Income Bracket in Minco
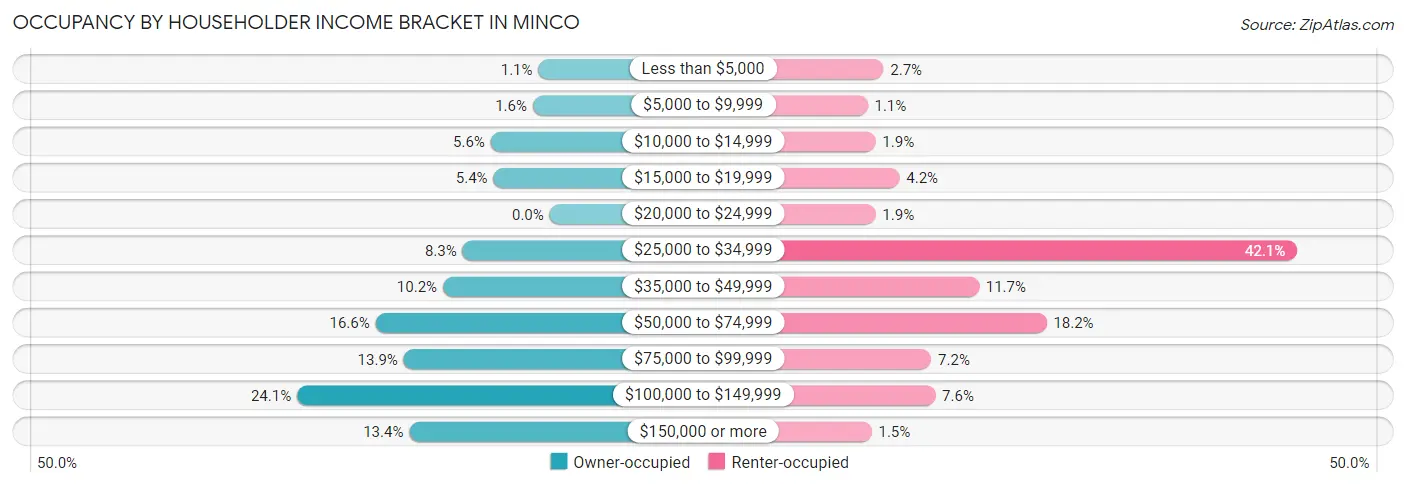
| Income Bracket | Owner-occupied | Renter-occupied |
| Less than $5,000 | 4 (1.1%) | 7 (2.6%) |
| $5,000 to $9,999 | 6 (1.6%) | 3 (1.1%) |
| $10,000 to $14,999 | 21 (5.6%) | 5 (1.9%) |
| $15,000 to $19,999 | 20 (5.3%) | 11 (4.2%) |
| $20,000 to $24,999 | 0 (0.0%) | 5 (1.9%) |
| $25,000 to $34,999 | 31 (8.3%) | 111 (42.0%) |
| $35,000 to $49,999 | 38 (10.2%) | 31 (11.7%) |
| $50,000 to $74,999 | 62 (16.6%) | 48 (18.2%) |
| $75,000 to $99,999 | 52 (13.9%) | 19 (7.2%) |
| $100,000 to $149,999 | 90 (24.1%) | 20 (7.6%) |
| $150,000 or more | 50 (13.4%) | 4 (1.5%) |
| Total | 374 (100.0%) | 264 (100.0%) |
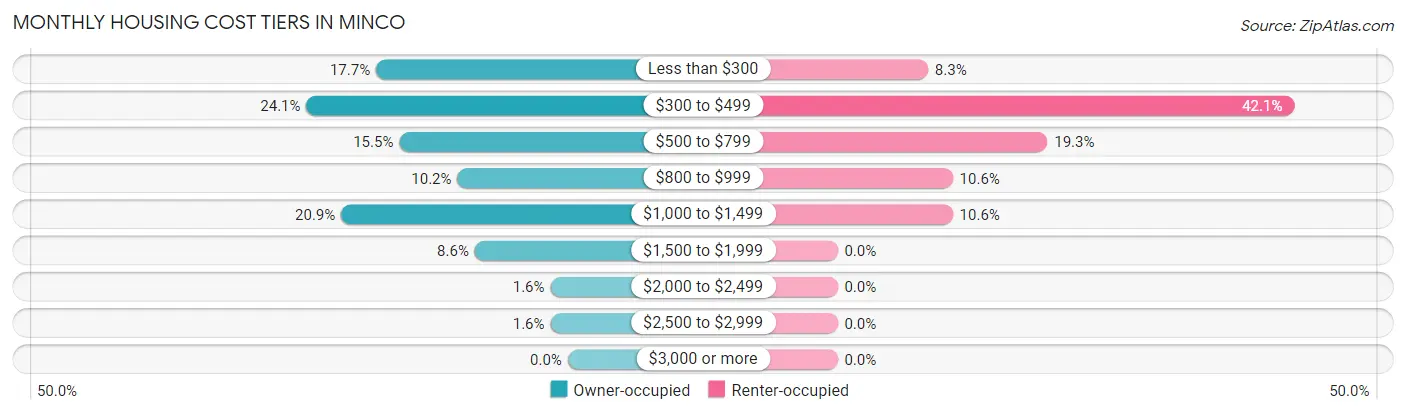
Monthly Housing Cost Tiers in Minco
| Monthly Cost | Owner-occupied | Renter-occupied |
| Less than $300 | 66 (17.6%) | 22 (8.3%) |
| $300 to $499 | 90 (24.1%) | 111 (42.0%) |
| $500 to $799 | 58 (15.5%) | 51 (19.3%) |
| $800 to $999 | 38 (10.2%) | 28 (10.6%) |
| $1,000 to $1,499 | 78 (20.9%) | 28 (10.6%) |
| $1,500 to $1,999 | 32 (8.6%) | 0 (0.0%) |
| $2,000 to $2,499 | 6 (1.6%) | 0 (0.0%) |
| $2,500 to $2,999 | 6 (1.6%) | 0 (0.0%) |
| $3,000 or more | 0 (0.0%) | 0 (0.0%) |
| Total | 374 (100.0%) | 264 (100.0%) |
Physical Housing Characteristics in Minco
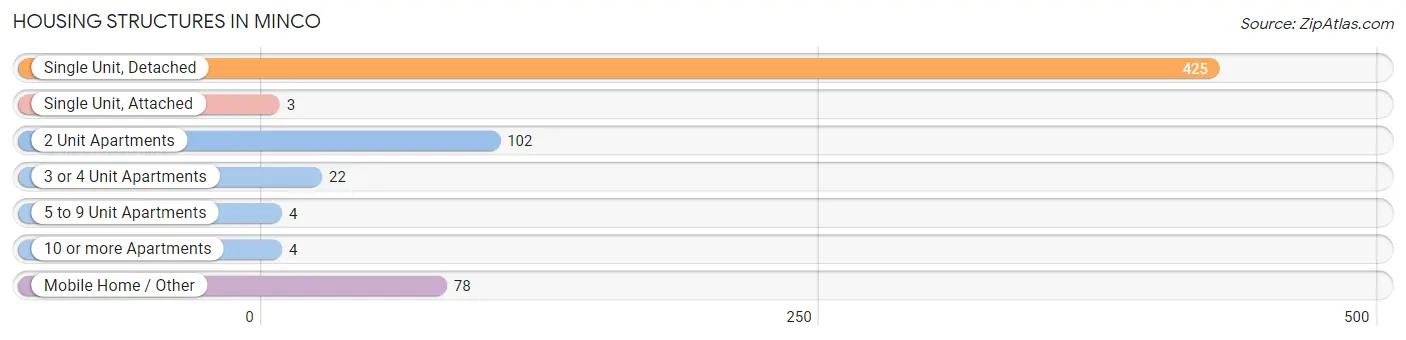
Housing Structures in Minco
| Structure Type | # Housing Units | % Housing Units |
| Single Unit, Detached | 425 | 66.6% |
| Single Unit, Attached | 3 | 0.5% |
| 2 Unit Apartments | 102 | 16.0% |
| 3 or 4 Unit Apartments | 22 | 3.5% |
| 5 to 9 Unit Apartments | 4 | 0.6% |
| 10 or more Apartments | 4 | 0.6% |
| Mobile Home / Other | 78 | 12.2% |
| Total | 638 | 100.0% |
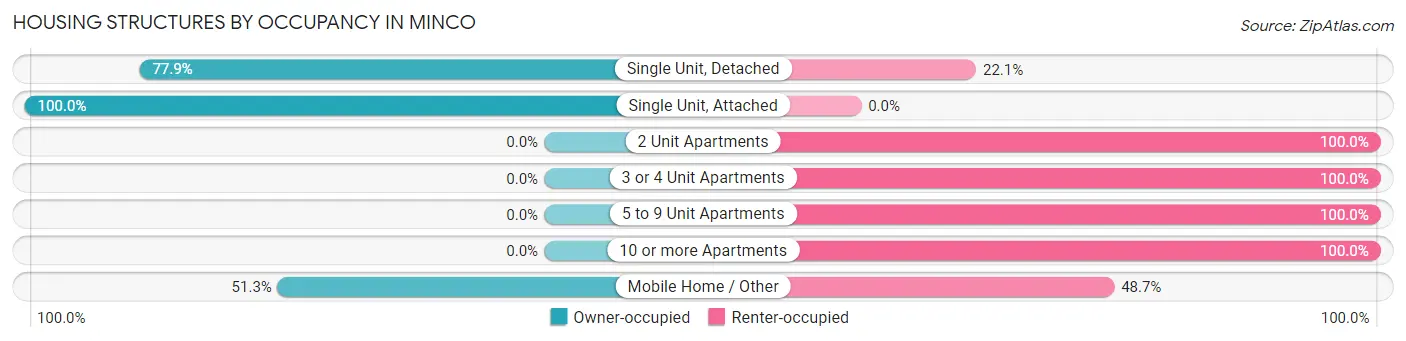
Housing Structures by Occupancy in Minco
| Structure Type | Owner-occupied | Renter-occupied |
| Single Unit, Detached | 331 (77.9%) | 94 (22.1%) |
| Single Unit, Attached | 3 (100.0%) | 0 (0.0%) |
| 2 Unit Apartments | 0 (0.0%) | 102 (100.0%) |
| 3 or 4 Unit Apartments | 0 (0.0%) | 22 (100.0%) |
| 5 to 9 Unit Apartments | 0 (0.0%) | 4 (100.0%) |
| 10 or more Apartments | 0 (0.0%) | 4 (100.0%) |
| Mobile Home / Other | 40 (51.3%) | 38 (48.7%) |
| Total | 374 (58.6%) | 264 (41.4%) |
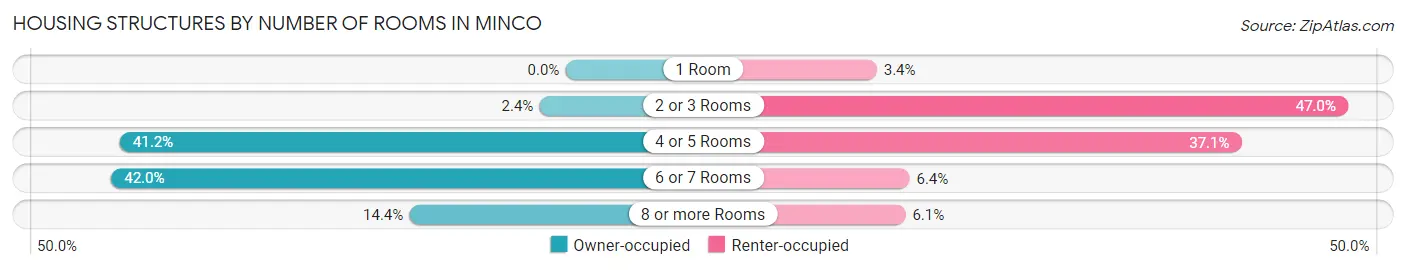
Housing Structures by Number of Rooms in Minco
| Number of Rooms | Owner-occupied | Renter-occupied |
| 1 Room | 0 (0.0%) | 9 (3.4%) |
| 2 or 3 Rooms | 9 (2.4%) | 124 (47.0%) |
| 4 or 5 Rooms | 154 (41.2%) | 98 (37.1%) |
| 6 or 7 Rooms | 157 (42.0%) | 17 (6.4%) |
| 8 or more Rooms | 54 (14.4%) | 16 (6.1%) |
| Total | 374 (100.0%) | 264 (100.0%) |
Housing Structure by Heating Type in Minco
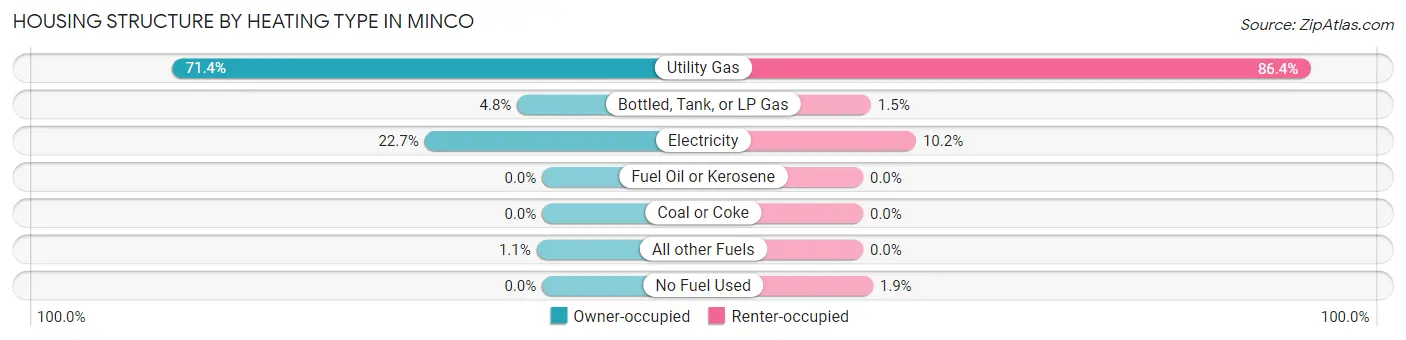
| Heating Type | Owner-occupied | Renter-occupied |
| Utility Gas | 267 (71.4%) | 228 (86.4%) |
| Bottled, Tank, or LP Gas | 18 (4.8%) | 4 (1.5%) |
| Electricity | 85 (22.7%) | 27 (10.2%) |
| Fuel Oil or Kerosene | 0 (0.0%) | 0 (0.0%) |
| Coal or Coke | 0 (0.0%) | 0 (0.0%) |
| All other Fuels | 4 (1.1%) | 0 (0.0%) |
| No Fuel Used | 0 (0.0%) | 5 (1.9%) |
| Total | 374 (100.0%) | 264 (100.0%) |
Household Vehicle Usage in Minco
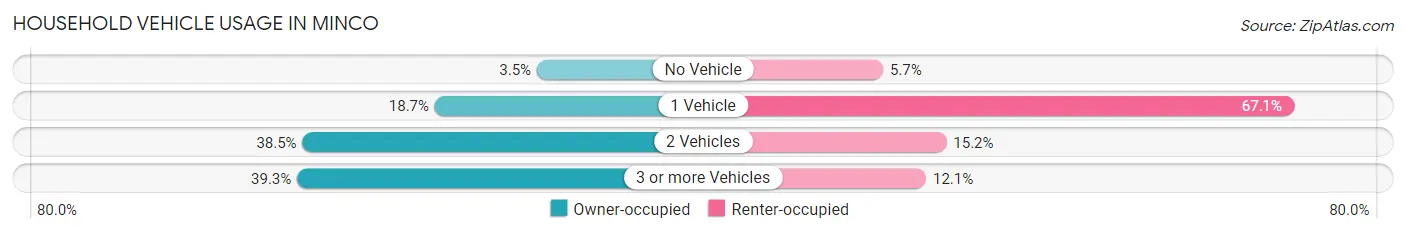
| Vehicles per Household | Owner-occupied | Renter-occupied |
| No Vehicle | 13 (3.5%) | 15 (5.7%) |
| 1 Vehicle | 70 (18.7%) | 177 (67.0%) |
| 2 Vehicles | 144 (38.5%) | 40 (15.1%) |
| 3 or more Vehicles | 147 (39.3%) | 32 (12.1%) |
| Total | 374 (100.0%) | 264 (100.0%) |
Real Estate & Mortgages in Minco
Real Estate and Mortgage Overview in Minco
| Characteristic | Without Mortgage | With Mortgage |
| Housing Units | 208 | 166 |
| Median Property Value | $92,500 | $139,700 |
| Median Household Income | $52,250 | $29 |
| Monthly Housing Costs | $379 | $0 |
| Real Estate Taxes | $600 | $4 |
Property Value by Mortgage Status in Minco
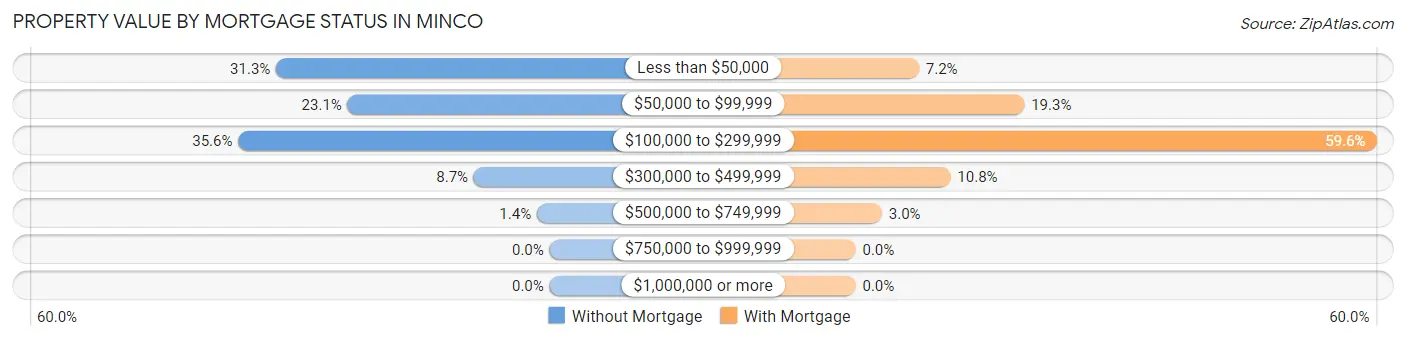
| Property Value | Without Mortgage | With Mortgage |
| Less than $50,000 | 65 (31.2%) | 12 (7.2%) |
| $50,000 to $99,999 | 48 (23.1%) | 32 (19.3%) |
| $100,000 to $299,999 | 74 (35.6%) | 99 (59.6%) |
| $300,000 to $499,999 | 18 (8.6%) | 18 (10.8%) |
| $500,000 to $749,999 | 3 (1.4%) | 5 (3.0%) |
| $750,000 to $999,999 | 0 (0.0%) | 0 (0.0%) |
| $1,000,000 or more | 0 (0.0%) | 0 (0.0%) |
| Total | 208 (100.0%) | 166 (100.0%) |
Household Income by Mortgage Status in Minco
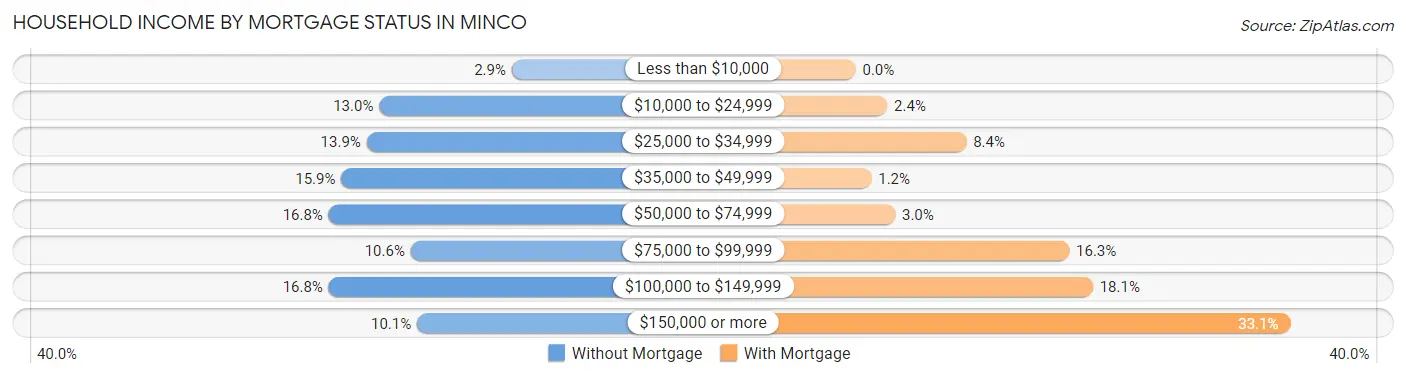
| Household Income | Without Mortgage | With Mortgage |
| Less than $10,000 | 6 (2.9%) | 0 (0.0%) |
| $10,000 to $24,999 | 27 (13.0%) | 4 (2.4%) |
| $25,000 to $34,999 | 29 (13.9%) | 14 (8.4%) |
| $35,000 to $49,999 | 33 (15.9%) | 2 (1.2%) |
| $50,000 to $74,999 | 35 (16.8%) | 5 (3.0%) |
| $75,000 to $99,999 | 22 (10.6%) | 27 (16.3%) |
| $100,000 to $149,999 | 35 (16.8%) | 30 (18.1%) |
| $150,000 or more | 21 (10.1%) | 55 (33.1%) |
| Total | 208 (100.0%) | 166 (100.0%) |
Property Value to Household Income Ratio in Minco
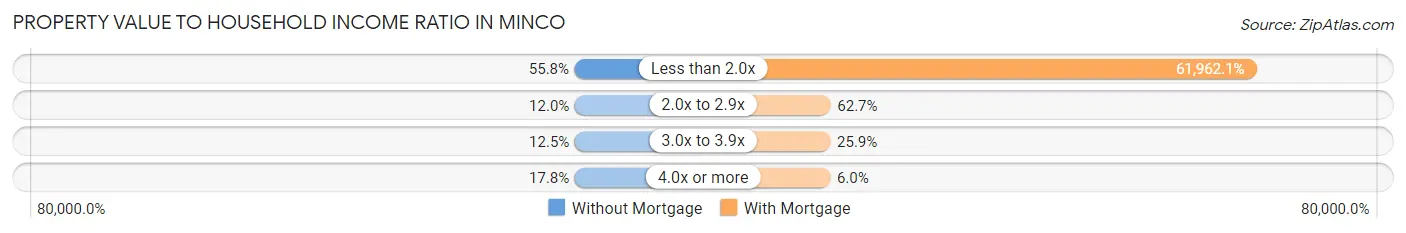
| Value-to-Income Ratio | Without Mortgage | With Mortgage |
| Less than 2.0x | 116 (55.8%) | 102,857 (61,962.0%) |
| 2.0x to 2.9x | 25 (12.0%) | 104 (62.6%) |
| 3.0x to 3.9x | 26 (12.5%) | 43 (25.9%) |
| 4.0x or more | 37 (17.8%) | 10 (6.0%) |
| Total | 208 (100.0%) | 166 (100.0%) |
Real Estate Taxes by Mortgage Status in Minco
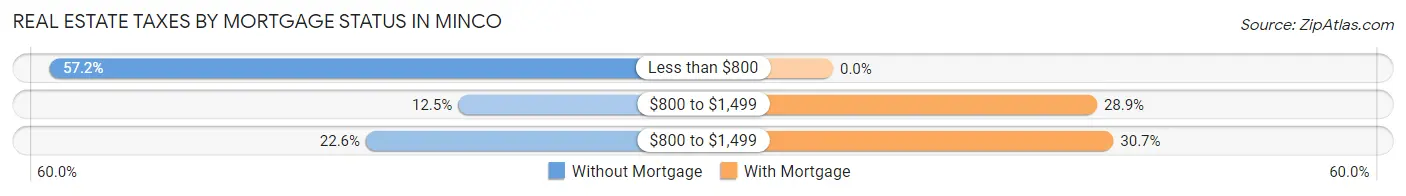
| Property Taxes | Without Mortgage | With Mortgage |
| Less than $800 | 119 (57.2%) | 0 (0.0%) |
| $800 to $1,499 | 26 (12.5%) | 48 (28.9%) |
| $800 to $1,499 | 47 (22.6%) | 51 (30.7%) |
| Total | 208 (100.0%) | 166 (100.0%) |
Health & Disability in Minco
Health Insurance Coverage by Age in Minco
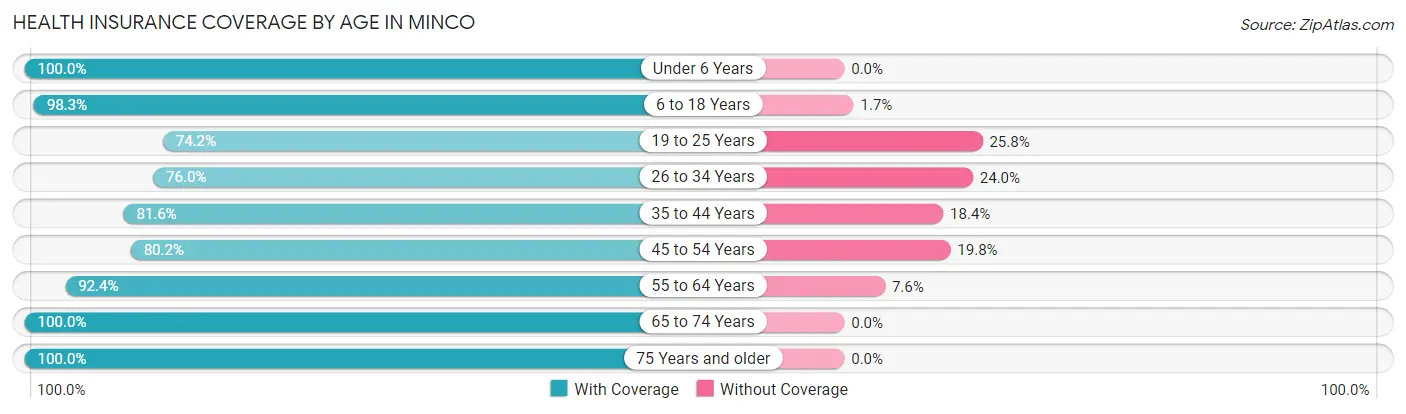
| Age Bracket | With Coverage | Without Coverage |
| Under 6 Years | 90 (100.0%) | 0 (0.0%) |
| 6 to 18 Years | 227 (98.3%) | 4 (1.7%) |
| 19 to 25 Years | 144 (74.2%) | 50 (25.8%) |
| 26 to 34 Years | 130 (76.0%) | 41 (24.0%) |
| 35 to 44 Years | 115 (81.6%) | 26 (18.4%) |
| 45 to 54 Years | 150 (80.2%) | 37 (19.8%) |
| 55 to 64 Years | 183 (92.4%) | 15 (7.6%) |
| 65 to 74 Years | 192 (100.0%) | 0 (0.0%) |
| 75 Years and older | 95 (100.0%) | 0 (0.0%) |
| Total | 1,326 (88.5%) | 173 (11.5%) |
Health Insurance Coverage by Citizenship Status in Minco
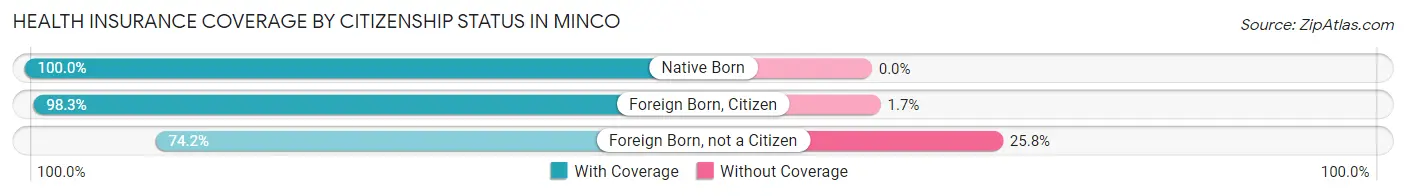
| Citizenship Status | With Coverage | Without Coverage |
| Native Born | 90 (100.0%) | 0 (0.0%) |
| Foreign Born, Citizen | 227 (98.3%) | 4 (1.7%) |
| Foreign Born, not a Citizen | 144 (74.2%) | 50 (25.8%) |
Health Insurance Coverage by Household Income in Minco
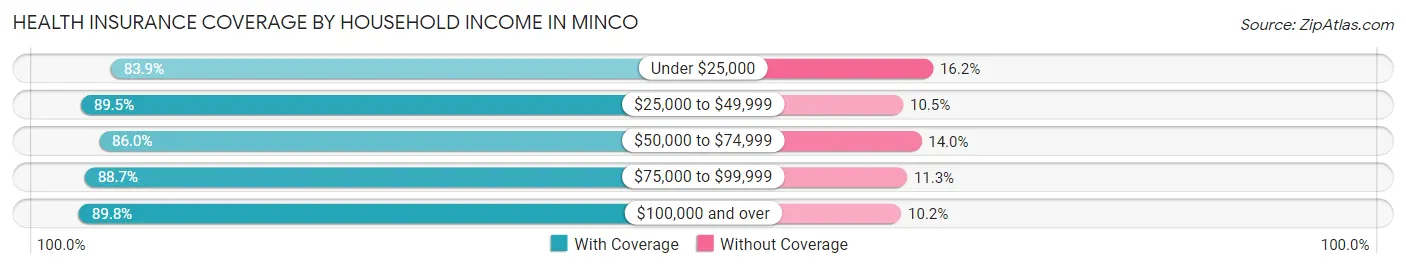
| Household Income | With Coverage | Without Coverage |
| Under $25,000 | 109 (83.9%) | 21 (16.2%) |
| $25,000 to $49,999 | 314 (89.5%) | 37 (10.5%) |
| $50,000 to $74,999 | 191 (86.0%) | 31 (14.0%) |
| $75,000 to $99,999 | 181 (88.7%) | 23 (11.3%) |
| $100,000 and over | 450 (89.8%) | 51 (10.2%) |
Public vs Private Health Insurance Coverage by Age in Minco
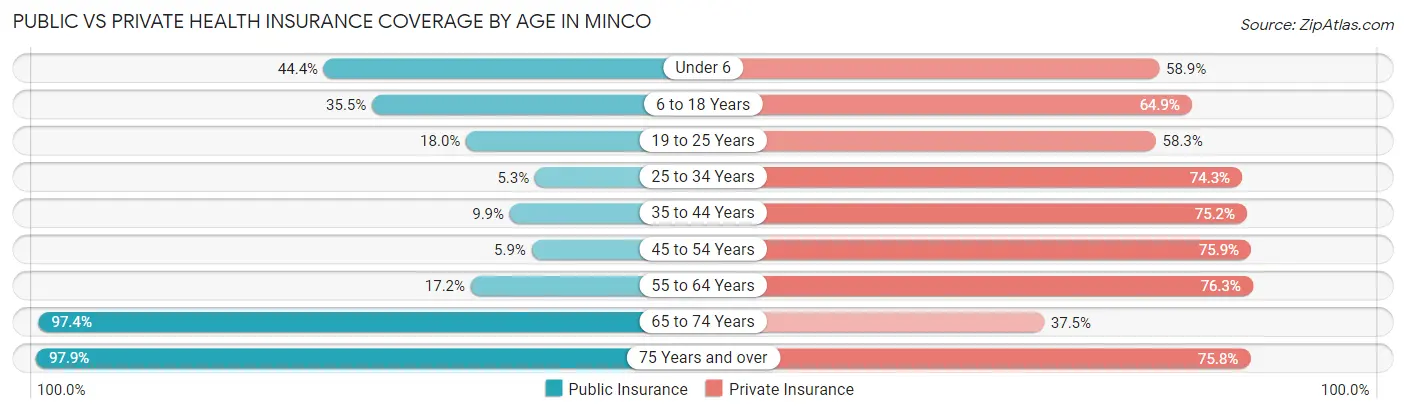
| Age Bracket | Public Insurance | Private Insurance |
| Under 6 | 40 (44.4%) | 53 (58.9%) |
| 6 to 18 Years | 82 (35.5%) | 150 (64.9%) |
| 19 to 25 Years | 35 (18.0%) | 113 (58.3%) |
| 25 to 34 Years | 9 (5.3%) | 127 (74.3%) |
| 35 to 44 Years | 14 (9.9%) | 106 (75.2%) |
| 45 to 54 Years | 11 (5.9%) | 142 (75.9%) |
| 55 to 64 Years | 34 (17.2%) | 151 (76.3%) |
| 65 to 74 Years | 187 (97.4%) | 72 (37.5%) |
| 75 Years and over | 93 (97.9%) | 72 (75.8%) |
| Total | 505 (33.7%) | 986 (65.8%) |
Disability Status by Sex by Age in Minco
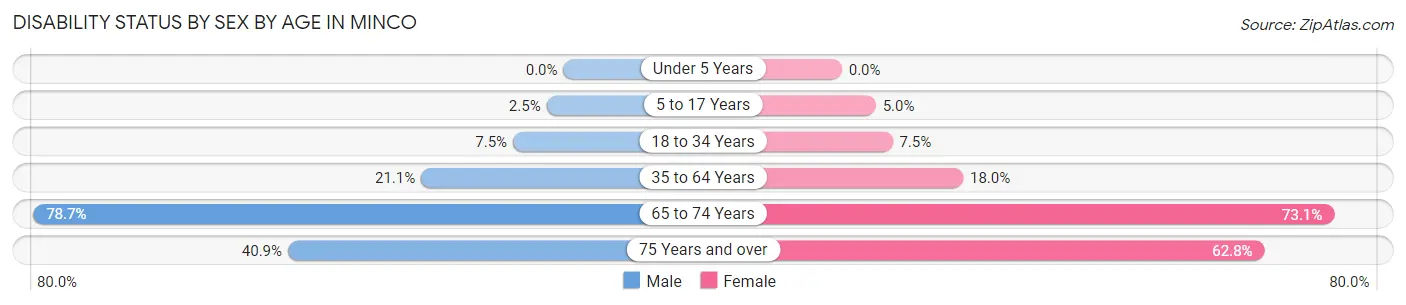
| Age Bracket | Male | Female |
| Under 5 Years | 0 (0.0%) | 0 (0.0%) |
| 5 to 17 Years | 2 (2.5%) | 6 (5.0%) |
| 18 to 34 Years | 14 (7.5%) | 17 (7.5%) |
| 35 to 64 Years | 56 (21.1%) | 47 (18.0%) |
| 65 to 74 Years | 37 (78.7%) | 106 (73.1%) |
| 75 Years and over | 18 (40.9%) | 32 (62.7%) |
Disability Class by Sex by Age in Minco
Disability Class: Hearing Difficulty
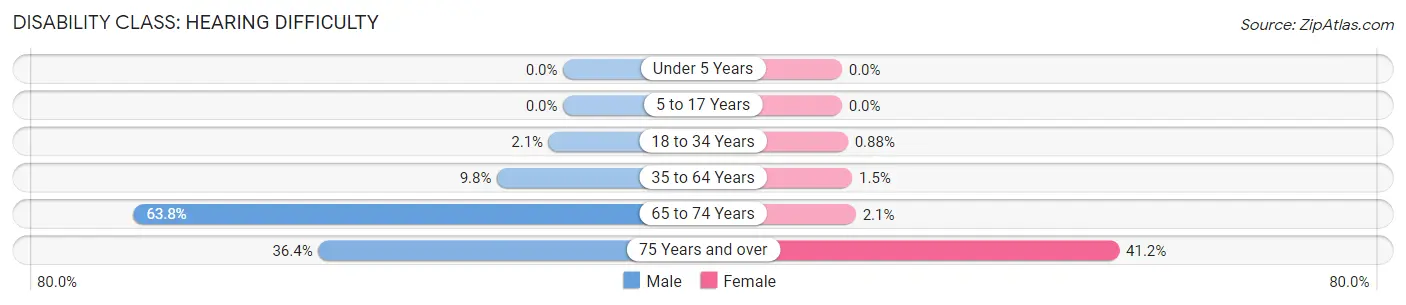
| Age Bracket | Male | Female |
| Under 5 Years | 0 (0.0%) | 0 (0.0%) |
| 5 to 17 Years | 0 (0.0%) | 0 (0.0%) |
| 18 to 34 Years | 4 (2.1%) | 2 (0.9%) |
| 35 to 64 Years | 26 (9.8%) | 4 (1.5%) |
| 65 to 74 Years | 30 (63.8%) | 3 (2.1%) |
| 75 Years and over | 16 (36.4%) | 21 (41.2%) |
Disability Class: Vision Difficulty
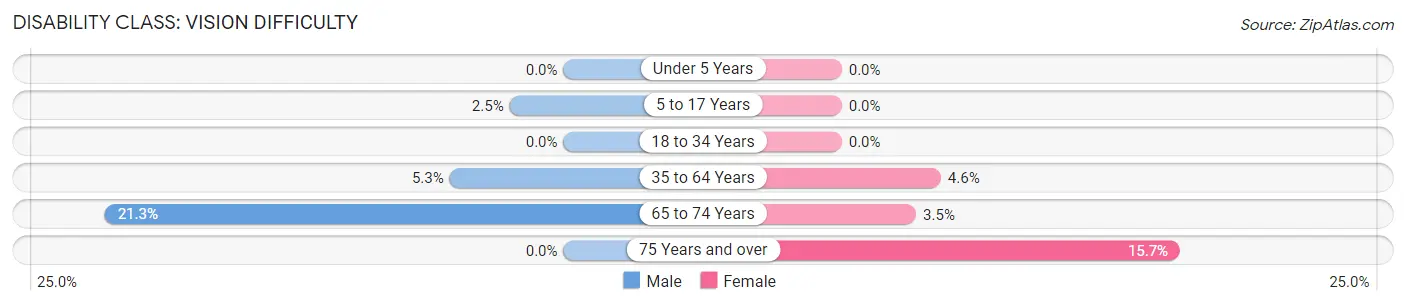
| Age Bracket | Male | Female |
| Under 5 Years | 0 (0.0%) | 0 (0.0%) |
| 5 to 17 Years | 2 (2.5%) | 0 (0.0%) |
| 18 to 34 Years | 0 (0.0%) | 0 (0.0%) |
| 35 to 64 Years | 14 (5.3%) | 12 (4.6%) |
| 65 to 74 Years | 10 (21.3%) | 5 (3.5%) |
| 75 Years and over | 0 (0.0%) | 8 (15.7%) |
Disability Class: Cognitive Difficulty
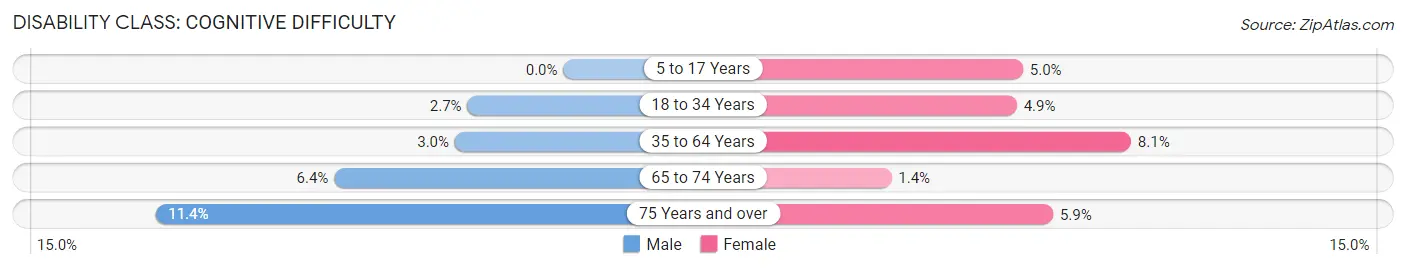
| Age Bracket | Male | Female |
| 5 to 17 Years | 0 (0.0%) | 6 (5.0%) |
| 18 to 34 Years | 5 (2.7%) | 11 (4.9%) |
| 35 to 64 Years | 8 (3.0%) | 21 (8.1%) |
| 65 to 74 Years | 3 (6.4%) | 2 (1.4%) |
| 75 Years and over | 5 (11.4%) | 3 (5.9%) |
Disability Class: Ambulatory Difficulty
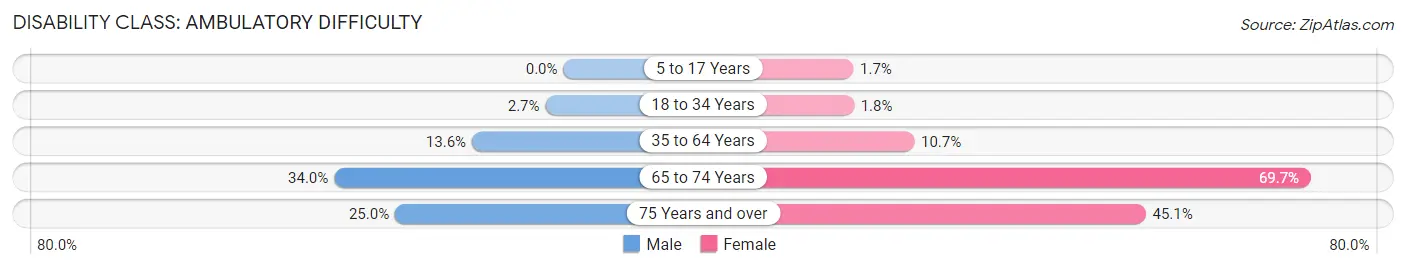
| Age Bracket | Male | Female |
| 5 to 17 Years | 0 (0.0%) | 2 (1.7%) |
| 18 to 34 Years | 5 (2.7%) | 4 (1.8%) |
| 35 to 64 Years | 36 (13.6%) | 28 (10.7%) |
| 65 to 74 Years | 16 (34.0%) | 101 (69.7%) |
| 75 Years and over | 11 (25.0%) | 23 (45.1%) |
Disability Class: Self-Care Difficulty
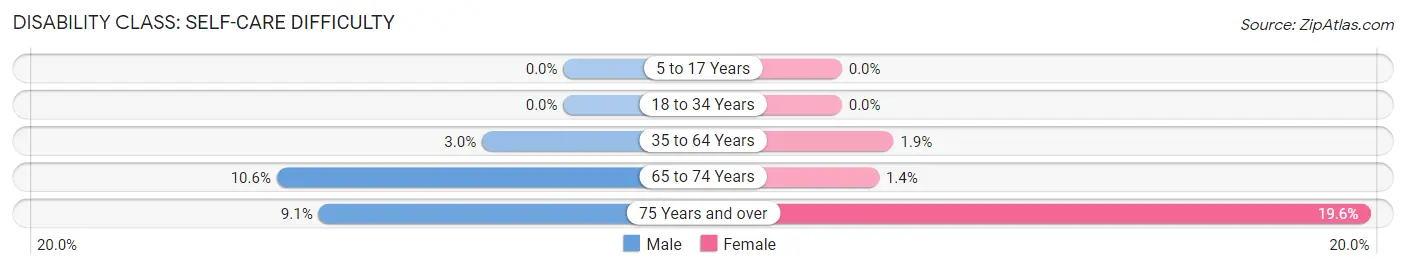
| Age Bracket | Male | Female |
| 5 to 17 Years | 0 (0.0%) | 0 (0.0%) |
| 18 to 34 Years | 0 (0.0%) | 0 (0.0%) |
| 35 to 64 Years | 8 (3.0%) | 5 (1.9%) |
| 65 to 74 Years | 5 (10.6%) | 2 (1.4%) |
| 75 Years and over | 4 (9.1%) | 10 (19.6%) |
Technology Access in Minco
Computing Device Access in Minco
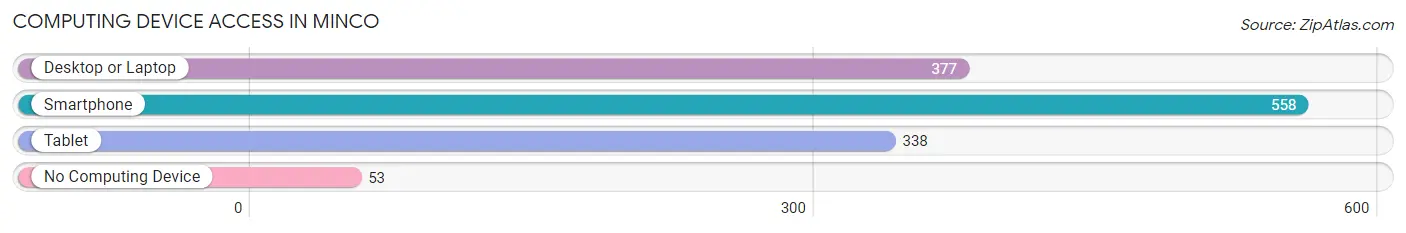
| Device Type | # Households | % Households |
| Desktop or Laptop | 377 | 59.1% |
| Smartphone | 558 | 87.5% |
| Tablet | 338 | 53.0% |
| No Computing Device | 53 | 8.3% |
| Total | 638 | 100.0% |
Internet Access in Minco
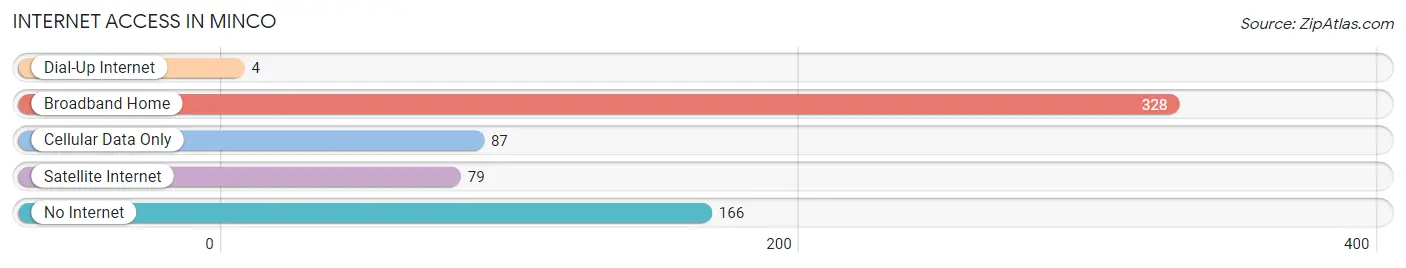
| Internet Type | # Households | % Households |
| Dial-Up Internet | 4 | 0.6% |
| Broadband Home | 328 | 51.4% |
| Cellular Data Only | 87 | 13.6% |
| Satellite Internet | 79 | 12.4% |
| No Internet | 166 | 26.0% |
| Total | 638 | 100.0% |
Minco Summary
Minco is a small town located in Grady County, Oklahoma. It is situated about 25 miles southwest of Oklahoma City and is part of the Oklahoma City Metropolitan Statistical Area. The town was founded in 1901 and was named after the Minco Indian tribe, which had lived in the area for centuries. As of the 2010 census, the population of Minco was 2,073.
Geography
Minco is located at 35°30'25" North, 97°56'45" West (35.506944, -97.945278). It is situated in the Red Bed Plains region of Oklahoma, which is characterized by flat terrain and red-colored soil. The town is located on the banks of the Washita River, which flows through the area. The town is surrounded by agricultural land, with cotton, wheat, and other crops being grown in the area.
Climate
Minco has a humid subtropical climate, with hot summers and mild winters. The average annual temperature is around 64°F (18°C), with the average high in July being around 95°F (35°C) and the average low in January being around 33°F (1°C). The average annual precipitation is around 36 inches (91 cm).
Demographics
As of the 2010 census, the population of Minco was 2,073. The racial makeup of the town was 94.2% White, 0.7% African American, 0.7% Native American, 0.3% Asian, 0.1% Pacific Islander, 1.3% from other races, and 2.1% from two or more races. Hispanic or Latino of any race were 3.2% of the population.
Economy
Minco's economy is largely based on agriculture. The town is home to several cotton gins, as well as a number of grain elevators. The town is also home to a number of small businesses, including a grocery store, a hardware store, and a few restaurants.
Education
Minco is served by the Minco Public Schools district, which includes an elementary school, a middle school, and a high school. The town is also home to a branch of the Canadian Valley Technology Center, which offers vocational and technical training.
Transportation
Minco is served by US Highway 81, which runs through the town. The town is also served by a number of local roads, as well as a bus service that connects the town to nearby cities.
Conclusion
Minco is a small town located in Grady County, Oklahoma. It is situated about 25 miles southwest of Oklahoma City and is part of the Oklahoma City Metropolitan Statistical Area. The town was founded in 1901 and was named after the Minco Indian tribe, which had lived in the area for centuries. As of the 2010 census, the population of Minco was 2,073. The town's economy is largely based on agriculture, with cotton, wheat, and other crops being grown in the area. Minco is served by the Minco Public Schools district, as well as a branch of the Canadian Valley Technology Center. The town is also served by US Highway 81, as well as a number of local roads and a bus service.
Common Questions
What is Per Capita Income in Minco?
Per Capita income in Minco is $31,979.
What is the Median Family Income in Minco?
Median Family Income in Minco is $78,942.
What is the Median Household income in Minco?
Median Household Income in Minco is $56,667.
What is Income or Wage Gap in Minco?
Income or Wage Gap in Minco is 58.8%.
Women in Minco earn 41.2 cents for every dollar earned by a man.
What is Family Income Deficit in Minco?
Family Income Deficit in Minco is $8,520.
Families that are below poverty line in Minco earn $8,520 less on average than the poverty threshold level.
What is Inequality or Gini Index in Minco?
Inequality or Gini Index in Minco is 0.43.
What is the Total Population of Minco?
Total Population of Minco is 1,502.
What is the Total Male Population of Minco?
Total Male Population of Minco is 683.
What is the Total Female Population of Minco?
Total Female Population of Minco is 819.
What is the Ratio of Males per 100 Females in Minco?
There are 83.39 Males per 100 Females in Minco.
What is the Ratio of Females per 100 Males in Minco?
There are 119.91 Females per 100 Males in Minco.
What is the Median Population Age in Minco?
Median Population Age in Minco is 39.6 Years.
What is the Average Family Size in Minco
Average Family Size in Minco is 3.0 People.
What is the Average Household Size in Minco
Average Household Size in Minco is 2.2 People.
How Large is the Labor Force in Minco?
There are 736 People in the Labor Forcein in Minco.
What is the Percentage of People in the Labor Force in Minco?
58.5% of People are in the Labor Force in Minco.
What is the Unemployment Rate in Minco?
Unemployment Rate in Minco is 4.0%.