Medicine Park, OK Map & Demographics
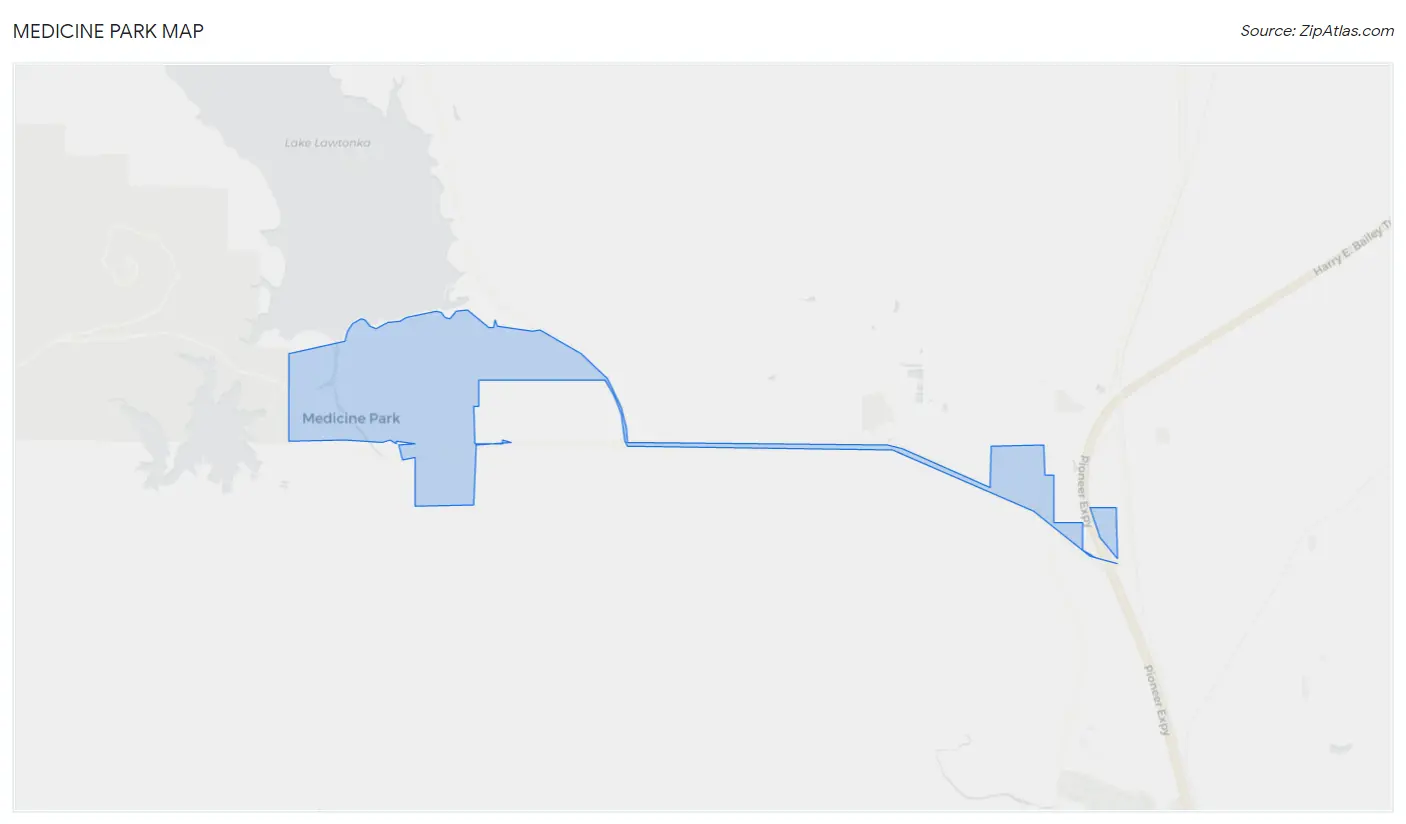
Medicine Park Map
Medicine Park Overview
$70,329
PER CAPITA INCOME
$171,250
AVG FAMILY INCOME
$111,071
AVG HOUSEHOLD INCOME
0.43
INEQUALITY / GINI INDEX
319
TOTAL POPULATION
147
MALE POPULATION
172
FEMALE POPULATION
85.47
MALES / 100 FEMALES
117.01
FEMALES / 100 MALES
47.8
MEDIAN AGE
2.4
AVG FAMILY SIZE
2.1
AVG HOUSEHOLD SIZE
184
LABOR FORCE [ PEOPLE ]
69.4%
PERCENT IN LABOR FORCE
3.5%
UNEMPLOYMENT RATE
Medicine Park Zip Codes
Medicine Park Area Codes
Income in Medicine Park
Income Overview in Medicine Park
Per Capita Income in Medicine Park is $70,329, while median incomes of families and households are $171,250 and $111,071 respectively.
| Characteristic | Number | Measure |
| Per Capita Income | 319 | $70,329 |
| Median Family Income | 101 | $171,250 |
| Mean Family Income | 101 | $193,238 |
| Median Household Income | 154 | $111,071 |
| Mean Household Income | 154 | $149,605 |
| Income Deficit | 101 | $0 |
| Wage / Income Gap (%) | 319 | 0.00% |
| Wage / Income Gap ($) | 319 | 100.00¢ per $1 |
| Gini / Inequality Index | 319 | 0.43 |
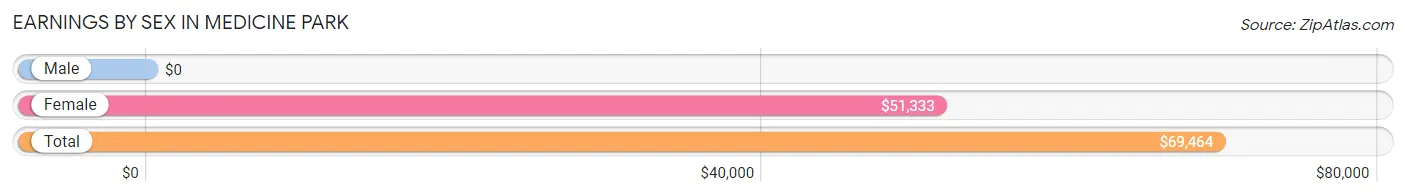
Earnings by Sex in Medicine Park
| Sex | Number | Average Earnings |
| Male | 101 (54.0%) | $0 |
| Female | 86 (46.0%) | $51,333 |
| Total | 187 (100.0%) | $69,464 |
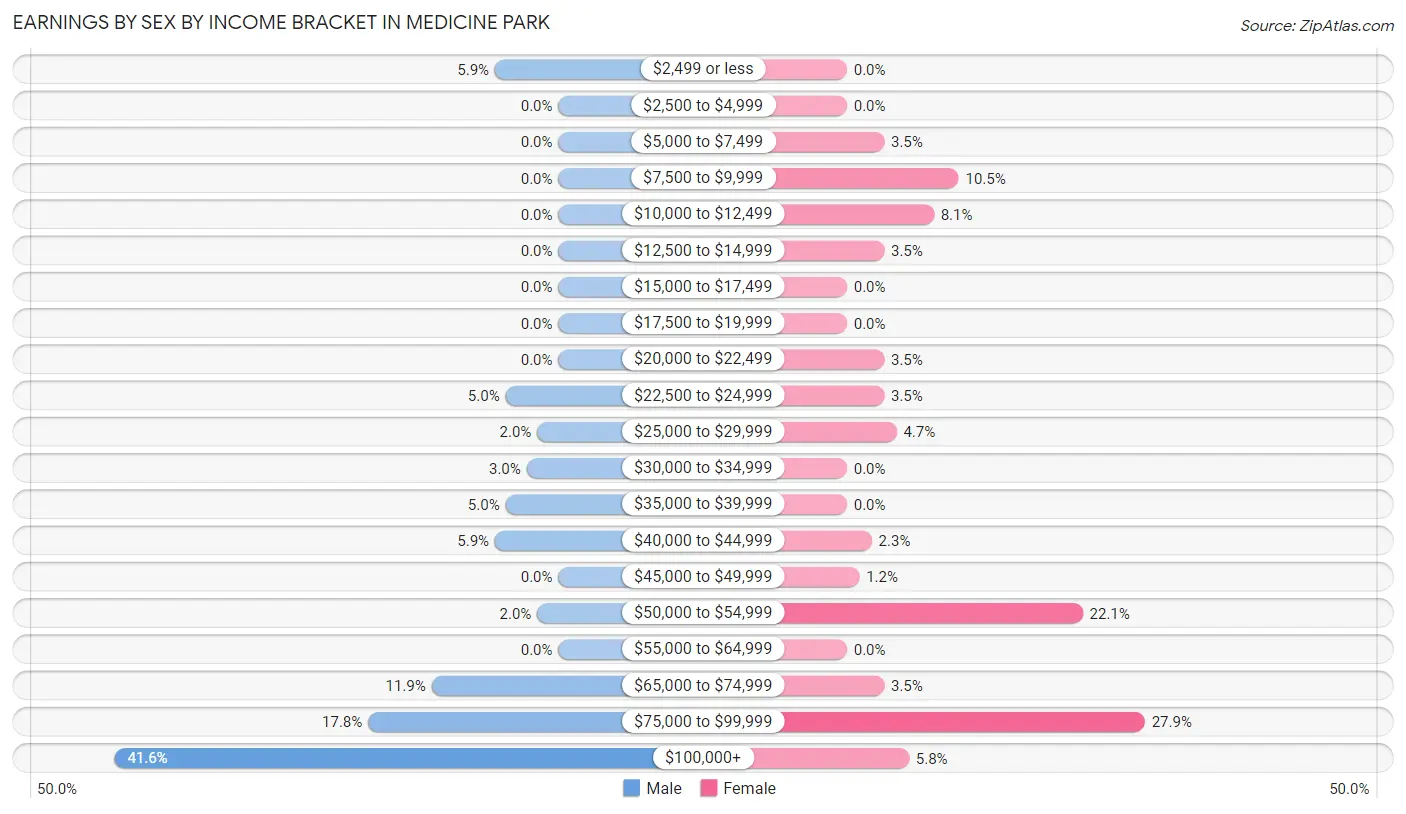
Earnings by Sex by Income Bracket in Medicine Park
The most common earnings brackets in Medicine Park are $100,000+ for men (42 | 41.6%) and $75,000 to $99,999 for women (24 | 27.9%).
| Income | Male | Female |
| $2,499 or less | 6 (5.9%) | 0 (0.0%) |
| $2,500 to $4,999 | 0 (0.0%) | 0 (0.0%) |
| $5,000 to $7,499 | 0 (0.0%) | 3 (3.5%) |
| $7,500 to $9,999 | 0 (0.0%) | 9 (10.5%) |
| $10,000 to $12,499 | 0 (0.0%) | 7 (8.1%) |
| $12,500 to $14,999 | 0 (0.0%) | 3 (3.5%) |
| $15,000 to $17,499 | 0 (0.0%) | 0 (0.0%) |
| $17,500 to $19,999 | 0 (0.0%) | 0 (0.0%) |
| $20,000 to $22,499 | 0 (0.0%) | 3 (3.5%) |
| $22,500 to $24,999 | 5 (5.0%) | 3 (3.5%) |
| $25,000 to $29,999 | 2 (2.0%) | 4 (4.6%) |
| $30,000 to $34,999 | 3 (3.0%) | 0 (0.0%) |
| $35,000 to $39,999 | 5 (5.0%) | 0 (0.0%) |
| $40,000 to $44,999 | 6 (5.9%) | 2 (2.3%) |
| $45,000 to $49,999 | 0 (0.0%) | 1 (1.2%) |
| $50,000 to $54,999 | 2 (2.0%) | 19 (22.1%) |
| $55,000 to $64,999 | 0 (0.0%) | 0 (0.0%) |
| $65,000 to $74,999 | 12 (11.9%) | 3 (3.5%) |
| $75,000 to $99,999 | 18 (17.8%) | 24 (27.9%) |
| $100,000+ | 42 (41.6%) | 5 (5.8%) |
| Total | 101 (100.0%) | 86 (100.0%) |
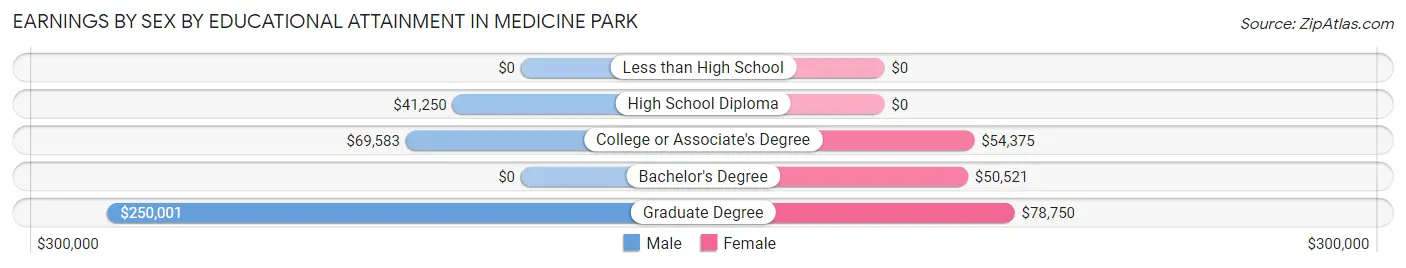
Earnings by Sex by Educational Attainment in Medicine Park
| Educational Attainment | Male Income | Female Income |
| Less than High School | - | - |
| High School Diploma | $41,250 | $0 |
| College or Associate's Degree | $69,583 | $54,375 |
| Bachelor's Degree | - | - |
| Graduate Degree | $250,001 | $78,750 |
| Total | - | - |
Family Income in Medicine Park
Family Income Brackets in Medicine Park
According to the Medicine Park family income data, there are 36 families falling into the $200,000+ income range, which is the most common income bracket and makes up 35.6% of all families.
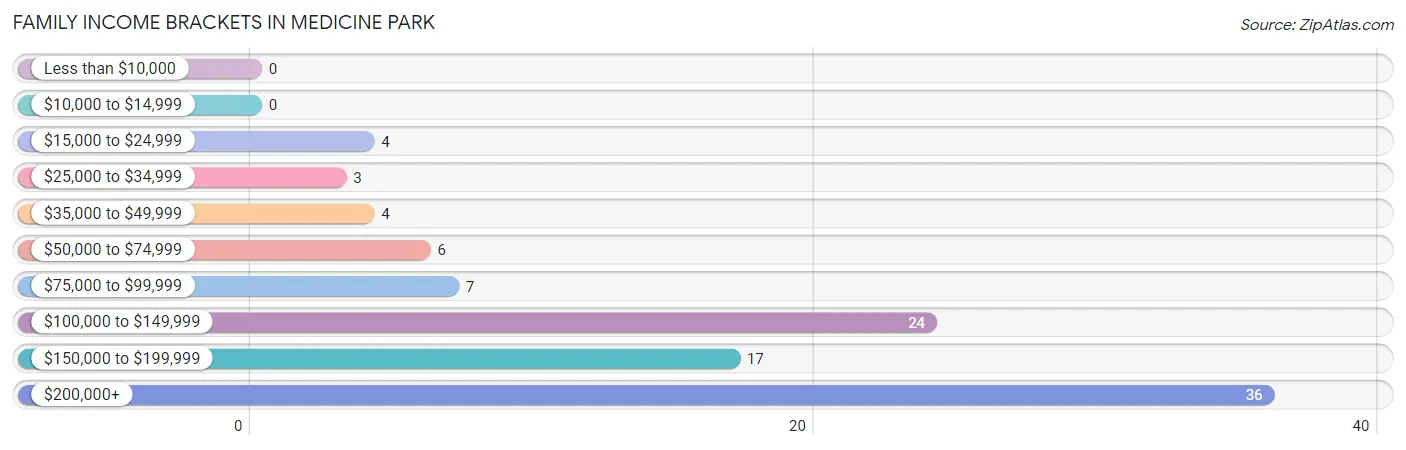
| Income Bracket | # Families | % Families |
| Less than $10,000 | 0 | 0.0% |
| $10,000 to $14,999 | 0 | 0.0% |
| $15,000 to $24,999 | 4 | 4.0% |
| $25,000 to $34,999 | 3 | 3.0% |
| $35,000 to $49,999 | 4 | 4.0% |
| $50,000 to $74,999 | 6 | 5.9% |
| $75,000 to $99,999 | 7 | 6.9% |
| $100,000 to $149,999 | 24 | 23.8% |
| $150,000 to $199,999 | 17 | 16.8% |
| $200,000+ | 36 | 35.6% |
Family Income by Famaliy Size in Medicine Park
2-person families (76 | 75.2%) account for the highest median family income in Medicine Park with $185,833 per family, while 2-person families (76 | 75.2%) have the highest median income of $92,916 per family member.
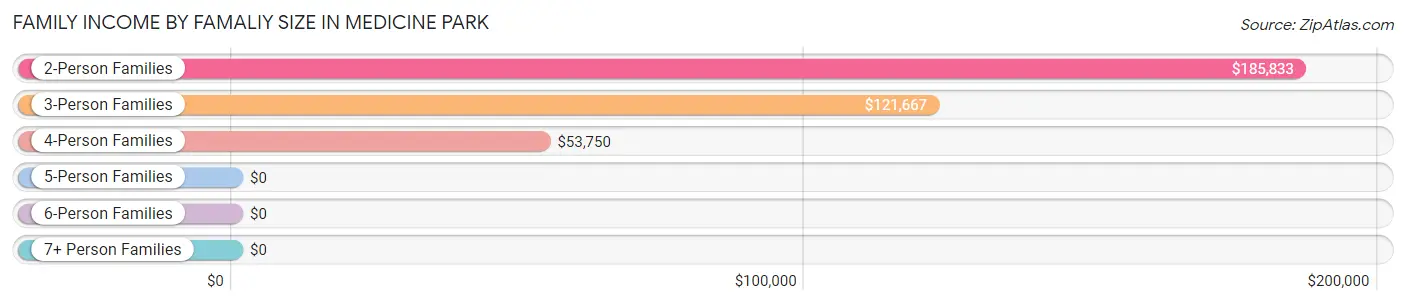
| Income Bracket | # Families | Median Income |
| 2-Person Families | 76 (75.2%) | $185,833 |
| 3-Person Families | 8 (7.9%) | $121,667 |
| 4-Person Families | 6 (5.9%) | $53,750 |
| 5-Person Families | 11 (10.9%) | $0 |
| 6-Person Families | 0 (0.0%) | $0 |
| 7+ Person Families | 0 (0.0%) | $0 |
| Total | 101 (100.0%) | $171,250 |
Family Income by Number of Earners in Medicine Park
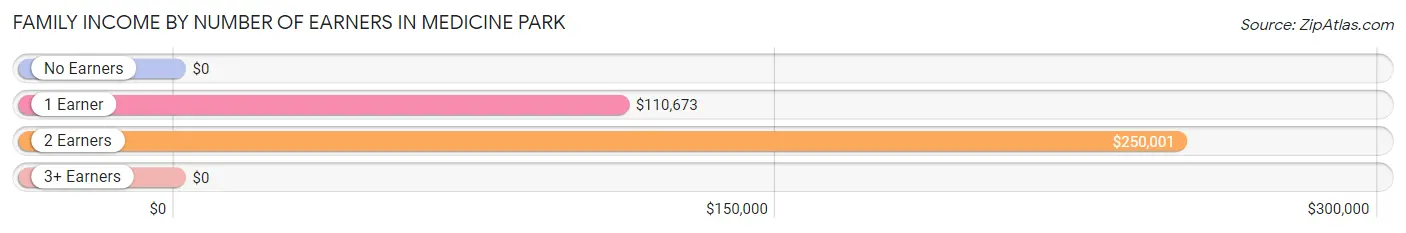
| Number of Earners | # Families | Median Income |
| No Earners | 2 (2.0%) | $0 |
| 1 Earner | 45 (44.6%) | $110,673 |
| 2 Earners | 53 (52.5%) | $250,001 |
| 3+ Earners | 1 (1.0%) | $0 |
| Total | 101 (100.0%) | $171,250 |
Household Income in Medicine Park
Household Income Brackets in Medicine Park
With 36 households falling in the category, the $200,000+ income range is the most frequent in Medicine Park, accounting for 23.4% of all households.
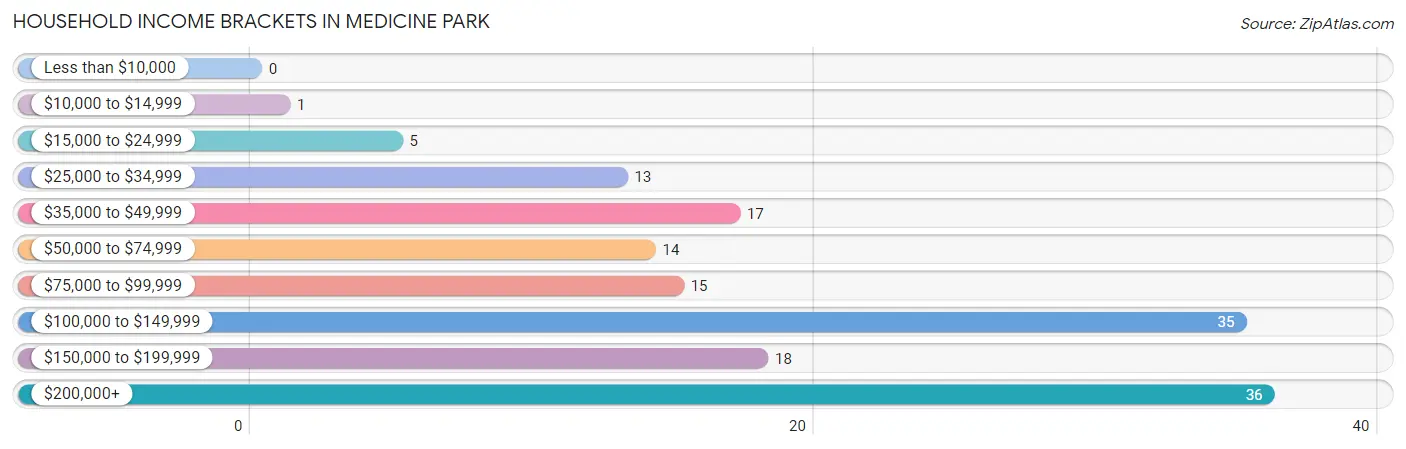
| Income Bracket | # Households | % Households |
| Less than $10,000 | 0 | 0.0% |
| $10,000 to $14,999 | 1 | 0.6% |
| $15,000 to $24,999 | 5 | 3.2% |
| $25,000 to $34,999 | 13 | 8.4% |
| $35,000 to $49,999 | 17 | 11.0% |
| $50,000 to $74,999 | 14 | 9.1% |
| $75,000 to $99,999 | 15 | 9.7% |
| $100,000 to $149,999 | 35 | 22.7% |
| $150,000 to $199,999 | 18 | 11.7% |
| $200,000+ | 36 | 23.4% |
Household Income by Householder Age in Medicine Park
The median household income in Medicine Park is $111,071, with the highest median household income of $118,438 found in the 25 to 44 years age bracket for the primary householder. A total of 27 households (17.5%) fall into this category.
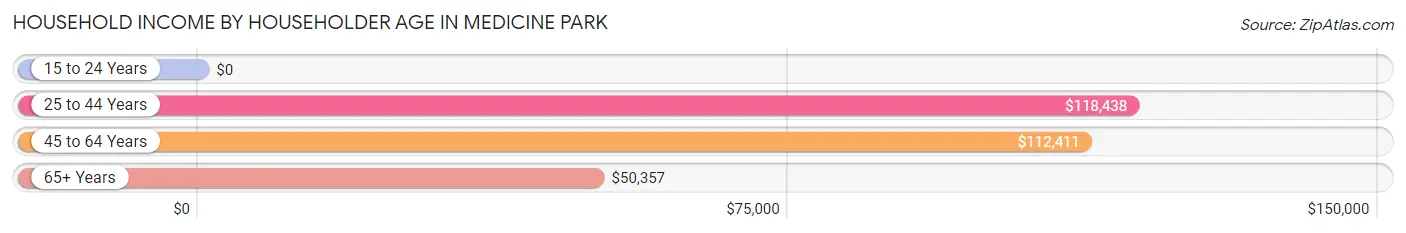
| Income Bracket | # Households | Median Income |
| 15 to 24 Years | 0 (0.0%) | $0 |
| 25 to 44 Years | 27 (17.5%) | $118,438 |
| 45 to 64 Years | 97 (63.0%) | $112,411 |
| 65+ Years | 30 (19.5%) | $50,357 |
| Total | 154 (100.0%) | $111,071 |
Poverty in Medicine Park
Income Below Poverty by Sex and Age in Medicine Park
With 5.4% poverty level for males and 2.9% for females among the residents of Medicine Park, 6 to 11 year old males and 55 to 64 year old females are the most vulnerable to poverty, with 2 males (100.0%) and 4 females (11.1%) in their respective age groups living below the poverty level.
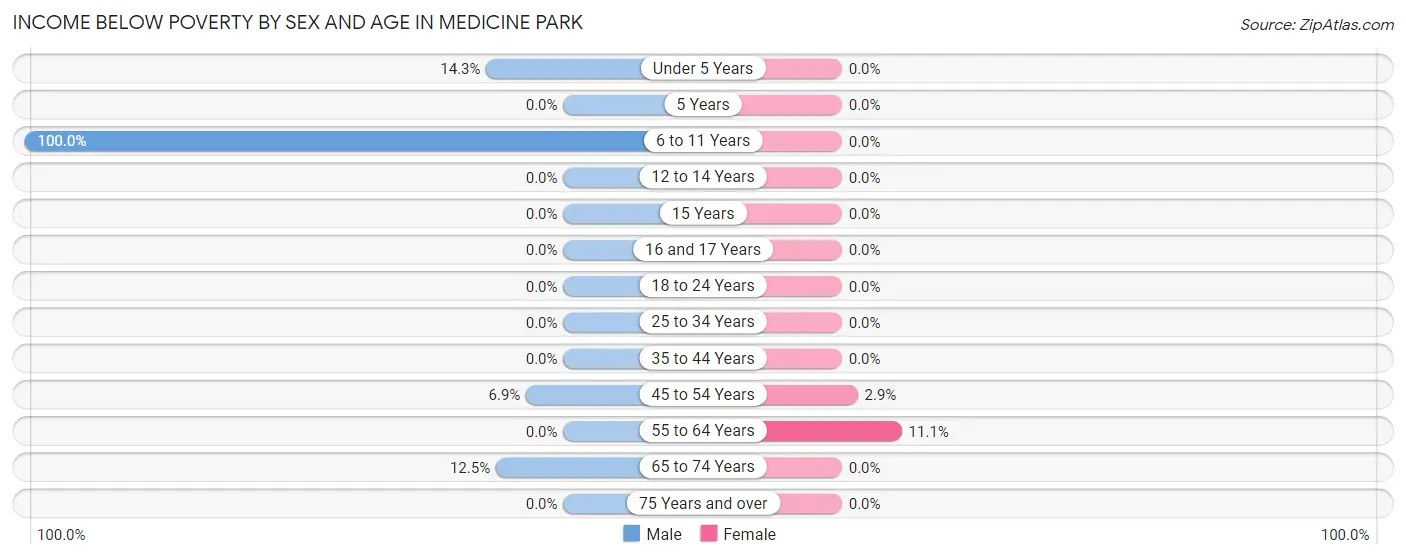
| Age Bracket | Male | Female |
| Under 5 Years | 1 (14.3%) | 0 (0.0%) |
| 5 Years | 0 (0.0%) | 0 (0.0%) |
| 6 to 11 Years | 2 (100.0%) | 0 (0.0%) |
| 12 to 14 Years | 0 (0.0%) | 0 (0.0%) |
| 15 Years | 0 (0.0%) | 0 (0.0%) |
| 16 and 17 Years | 0 (0.0%) | 0 (0.0%) |
| 18 to 24 Years | 0 (0.0%) | 0 (0.0%) |
| 25 to 34 Years | 0 (0.0%) | 0 (0.0%) |
| 35 to 44 Years | 0 (0.0%) | 0 (0.0%) |
| 45 to 54 Years | 4 (6.9%) | 1 (2.9%) |
| 55 to 64 Years | 0 (0.0%) | 4 (11.1%) |
| 65 to 74 Years | 1 (12.5%) | 0 (0.0%) |
| 75 Years and over | 0 (0.0%) | 0 (0.0%) |
| Total | 8 (5.4%) | 5 (2.9%) |
Income Above Poverty by Sex and Age in Medicine Park
According to the poverty statistics in Medicine Park, males aged 15 years and females aged 5 years are the age groups that are most secure financially, with 100.0% of males and 100.0% of females in these age groups living above the poverty line.
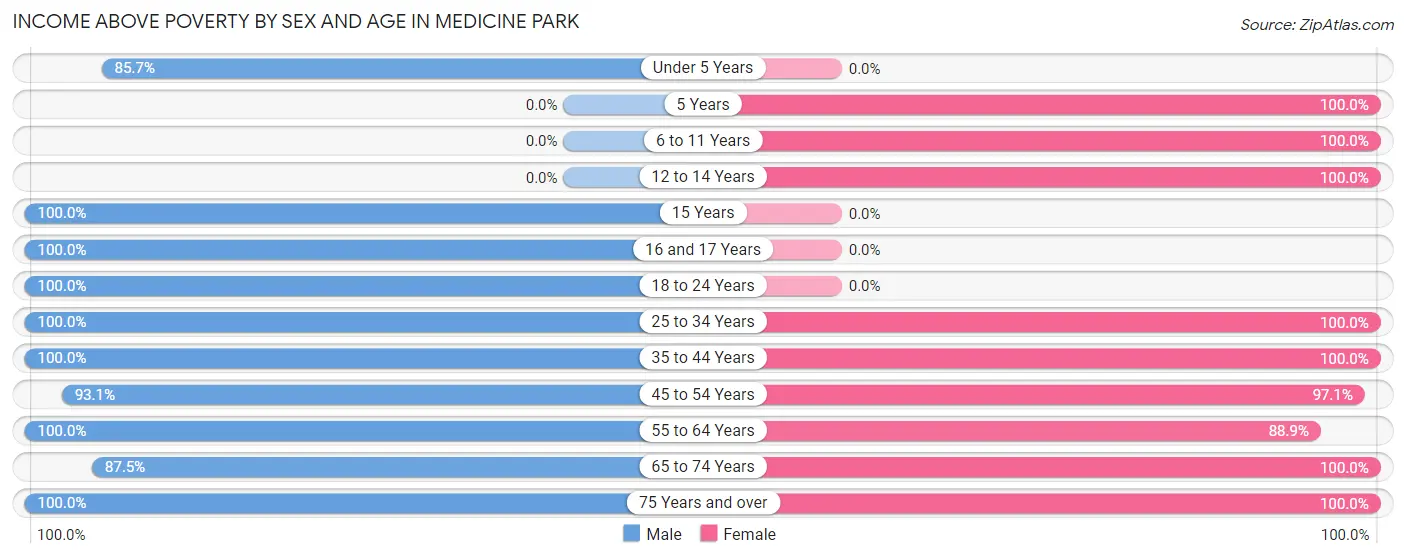
| Age Bracket | Male | Female |
| Under 5 Years | 6 (85.7%) | 0 (0.0%) |
| 5 Years | 0 (0.0%) | 9 (100.0%) |
| 6 to 11 Years | 0 (0.0%) | 25 (100.0%) |
| 12 to 14 Years | 0 (0.0%) | 10 (100.0%) |
| 15 Years | 1 (100.0%) | 0 (0.0%) |
| 16 and 17 Years | 1 (100.0%) | 0 (0.0%) |
| 18 to 24 Years | 5 (100.0%) | 0 (0.0%) |
| 25 to 34 Years | 18 (100.0%) | 6 (100.0%) |
| 35 to 44 Years | 17 (100.0%) | 30 (100.0%) |
| 45 to 54 Years | 54 (93.1%) | 33 (97.1%) |
| 55 to 64 Years | 24 (100.0%) | 32 (88.9%) |
| 65 to 74 Years | 7 (87.5%) | 13 (100.0%) |
| 75 Years and over | 6 (100.0%) | 9 (100.0%) |
| Total | 139 (94.6%) | 167 (97.1%) |
Income Below Poverty Among Married-Couple Families in Medicine Park
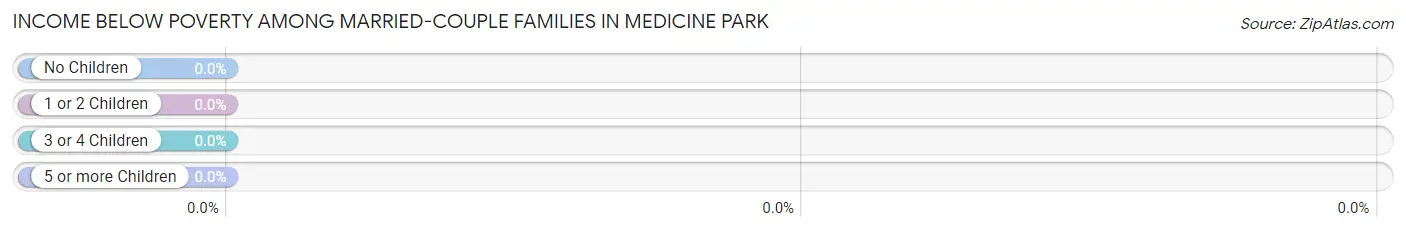
| Children | Above Poverty | Below Poverty |
| No Children | 69 (100.0%) | 0 (0.0%) |
| 1 or 2 Children | 9 (100.0%) | 0 (0.0%) |
| 3 or 4 Children | 11 (100.0%) | 0 (0.0%) |
| 5 or more Children | 0 (0.0%) | 0 (0.0%) |
| Total | 89 (100.0%) | 0 (0.0%) |
Income Below Poverty Among Single-Parent Households in Medicine Park
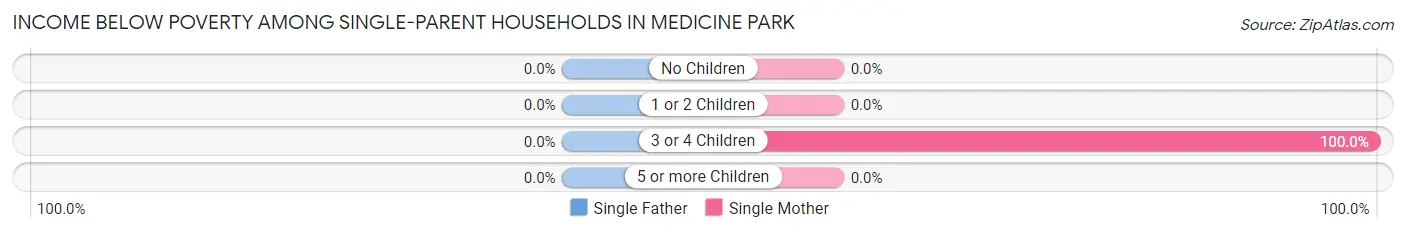
| Children | Single Father | Single Mother |
| No Children | 0 (0.0%) | 0 (0.0%) |
| 1 or 2 Children | 0 (0.0%) | 0 (0.0%) |
| 3 or 4 Children | 0 (0.0%) | 1 (100.0%) |
| 5 or more Children | 0 (0.0%) | 0 (0.0%) |
| Total | 0 (0.0%) | 1 (8.3%) |
Income Below Poverty Among Married-Couple vs Single-Parent Households in Medicine Park
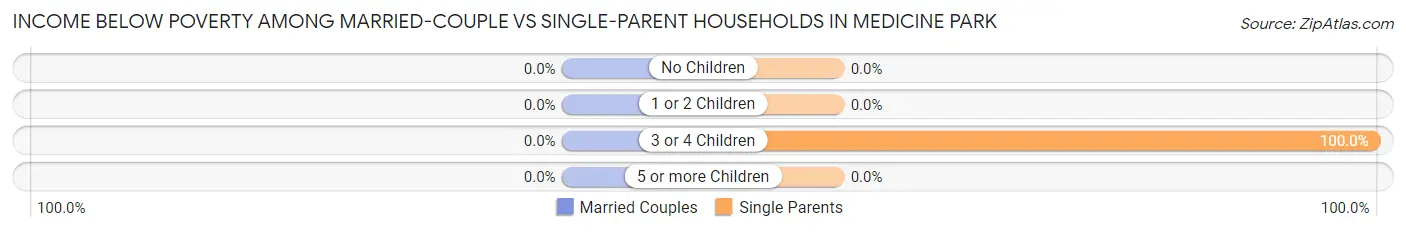
| Children | Married-Couple Families | Single-Parent Households |
| No Children | 0 (0.0%) | 0 (0.0%) |
| 1 or 2 Children | 0 (0.0%) | 0 (0.0%) |
| 3 or 4 Children | 0 (0.0%) | 1 (100.0%) |
| 5 or more Children | 0 (0.0%) | 0 (0.0%) |
| Total | 0 (0.0%) | 1 (8.3%) |
Race in Medicine Park
The most populous races in Medicine Park are White / Caucasian (284 | 89.0%), Two or more Races (15 | 4.7%), and Hispanic or Latino (12 | 3.8%).
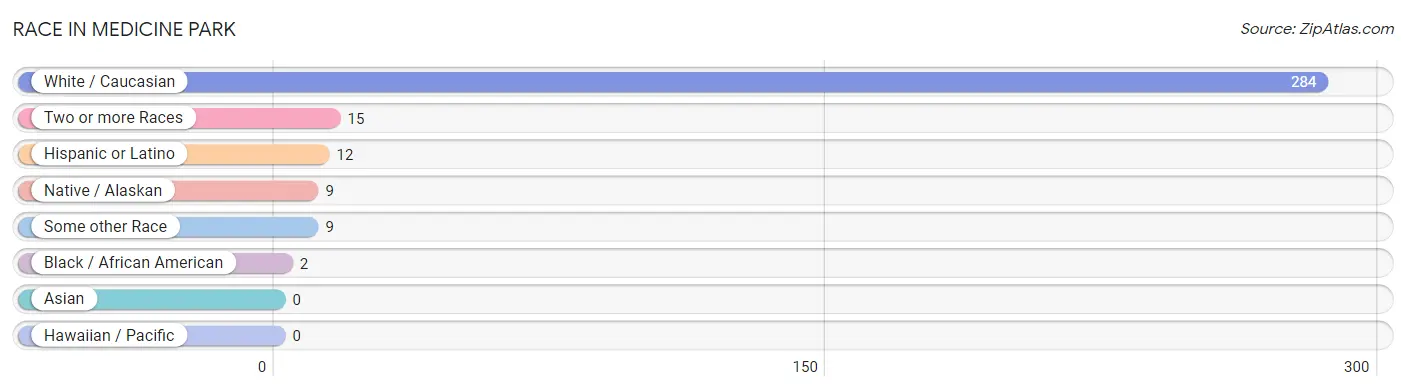
| Race | # Population | % Population |
| Asian | 0 | 0.0% |
| Black / African American | 2 | 0.6% |
| Hawaiian / Pacific | 0 | 0.0% |
| Hispanic or Latino | 12 | 3.8% |
| Native / Alaskan | 9 | 2.8% |
| White / Caucasian | 284 | 89.0% |
| Two or more Races | 15 | 4.7% |
| Some other Race | 9 | 2.8% |
| Total | 319 | 100.0% |
Ancestry in Medicine Park
The most populous ancestries reported in Medicine Park are German (118 | 37.0%), English (93 | 29.1%), Irish (74 | 23.2%), American (12 | 3.8%), and Dutch (12 | 3.8%), together accounting for 96.9% of all Medicine Park residents.
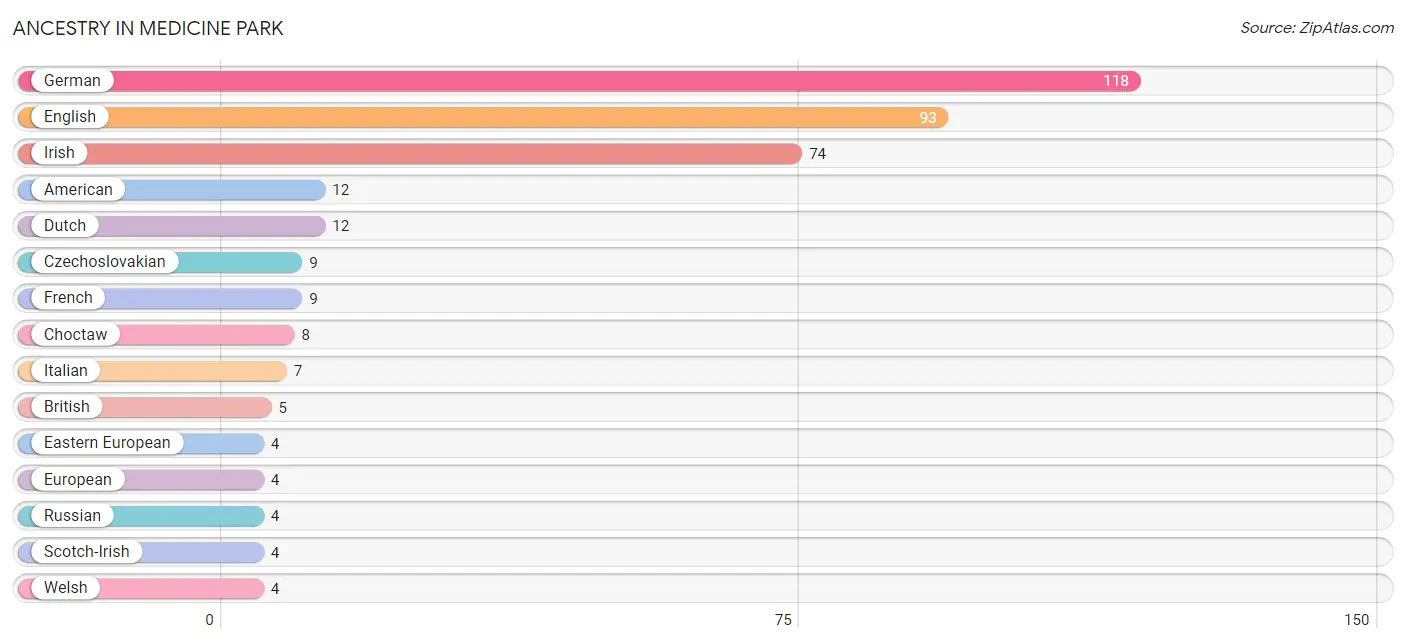
| Ancestry | # Population | % Population |
| American | 12 | 3.8% |
| Austrian | 1 | 0.3% |
| British | 5 | 1.6% |
| Central American | 3 | 0.9% |
| Cherokee | 3 | 0.9% |
| Choctaw | 8 | 2.5% |
| Comanche | 1 | 0.3% |
| Czechoslovakian | 9 | 2.8% |
| Delaware | 1 | 0.3% |
| Dutch | 12 | 3.8% |
| Eastern European | 4 | 1.3% |
| English | 93 | 29.1% |
| European | 4 | 1.3% |
| French | 9 | 2.8% |
| German | 118 | 37.0% |
| Irish | 74 | 23.2% |
| Italian | 7 | 2.2% |
| Mexican | 2 | 0.6% |
| Panamanian | 3 | 0.9% |
| Puerto Rican | 1 | 0.3% |
| Russian | 4 | 1.3% |
| Scandinavian | 3 | 0.9% |
| Scotch-Irish | 4 | 1.3% |
| Scottish | 3 | 0.9% |
| Welsh | 4 | 1.3% | View All 25 Rows |
Immigrants in Medicine Park
The most numerous immigrant groups reported in Medicine Park came from Central America (3 | 0.9%), Europe (3 | 0.9%), Germany (3 | 0.9%), Latin America (3 | 0.9%), and Panama (3 | 0.9%), together accounting for 4.7% of all Medicine Park residents.
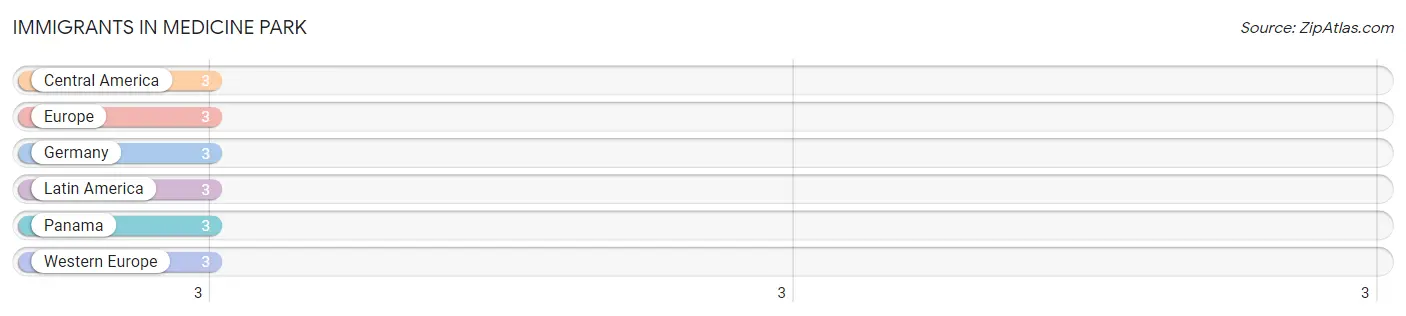
| Immigration Origin | # Population | % Population |
| Central America | 3 | 0.9% |
| Europe | 3 | 0.9% |
| Germany | 3 | 0.9% |
| Latin America | 3 | 0.9% |
| Panama | 3 | 0.9% |
| Western Europe | 3 | 0.9% | View All 6 Rows |
Sex and Age in Medicine Park
Sex and Age in Medicine Park
The most populous age groups in Medicine Park are 45 to 49 Years (44 | 29.9%) for men and 5 to 9 Years (34 | 19.8%) for women.
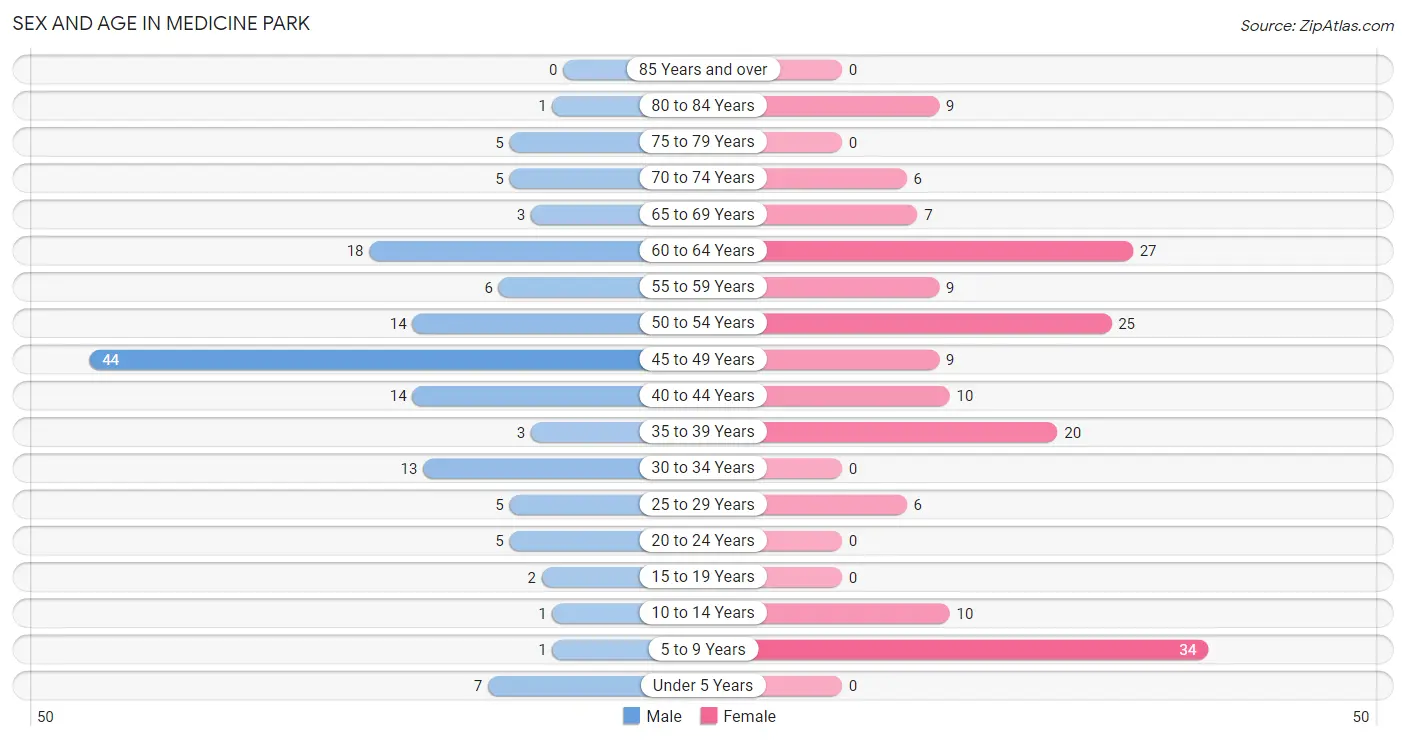
| Age Bracket | Male | Female |
| Under 5 Years | 7 (4.8%) | 0 (0.0%) |
| 5 to 9 Years | 1 (0.7%) | 34 (19.8%) |
| 10 to 14 Years | 1 (0.7%) | 10 (5.8%) |
| 15 to 19 Years | 2 (1.4%) | 0 (0.0%) |
| 20 to 24 Years | 5 (3.4%) | 0 (0.0%) |
| 25 to 29 Years | 5 (3.4%) | 6 (3.5%) |
| 30 to 34 Years | 13 (8.8%) | 0 (0.0%) |
| 35 to 39 Years | 3 (2.0%) | 20 (11.6%) |
| 40 to 44 Years | 14 (9.5%) | 10 (5.8%) |
| 45 to 49 Years | 44 (29.9%) | 9 (5.2%) |
| 50 to 54 Years | 14 (9.5%) | 25 (14.5%) |
| 55 to 59 Years | 6 (4.1%) | 9 (5.2%) |
| 60 to 64 Years | 18 (12.2%) | 27 (15.7%) |
| 65 to 69 Years | 3 (2.0%) | 7 (4.1%) |
| 70 to 74 Years | 5 (3.4%) | 6 (3.5%) |
| 75 to 79 Years | 5 (3.4%) | 0 (0.0%) |
| 80 to 84 Years | 1 (0.7%) | 9 (5.2%) |
| 85 Years and over | 0 (0.0%) | 0 (0.0%) |
| Total | 147 (100.0%) | 172 (100.0%) |
Families and Households in Medicine Park
Median Family Size in Medicine Park
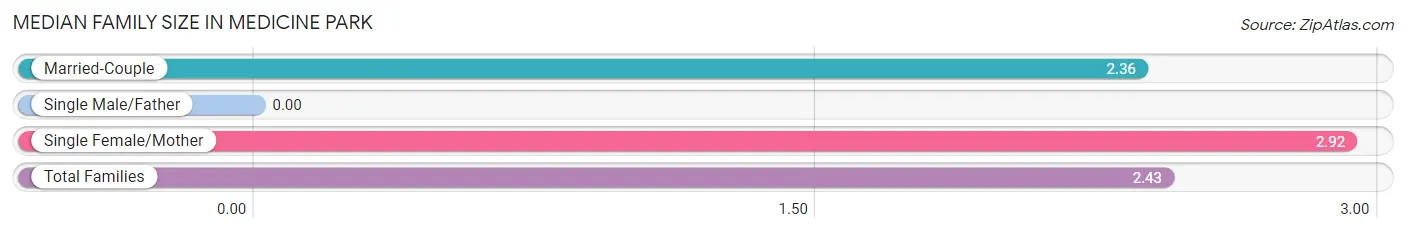
| Family Type | # Families | Family Size |
| Married-Couple | 89 (88.1%) | 2.36 |
| Single Male/Father | 0 (0.0%) | - |
| Single Female/Mother | 12 (11.9%) | 2.92 |
| Total Families | 101 (100.0%) | 2.43 |
Median Household Size in Medicine Park
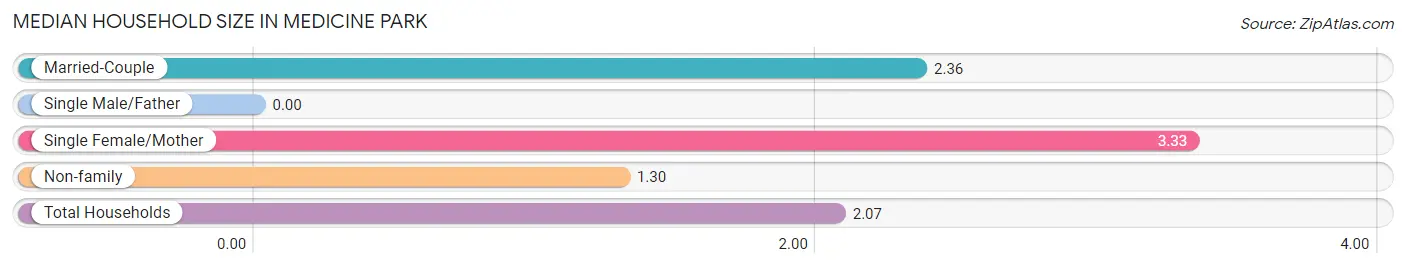
| Household Type | # Households | Household Size |
| Married-Couple | 89 (57.8%) | 2.36 |
| Single Male/Father | 0 (0.0%) | - |
| Single Female/Mother | 12 (7.8%) | 3.33 |
| Non-family | 53 (34.4%) | 1.30 |
| Total Households | 154 (100.0%) | 2.07 |
Household Size by Marriage Status in Medicine Park
Out of a total of 154 households in Medicine Park, 101 (65.6%) are family households, while 53 (34.4%) are nonfamily households. The most numerous type of family households are 2-person households, comprising 71, and the most common type of nonfamily households are 1-person households, comprising 38.
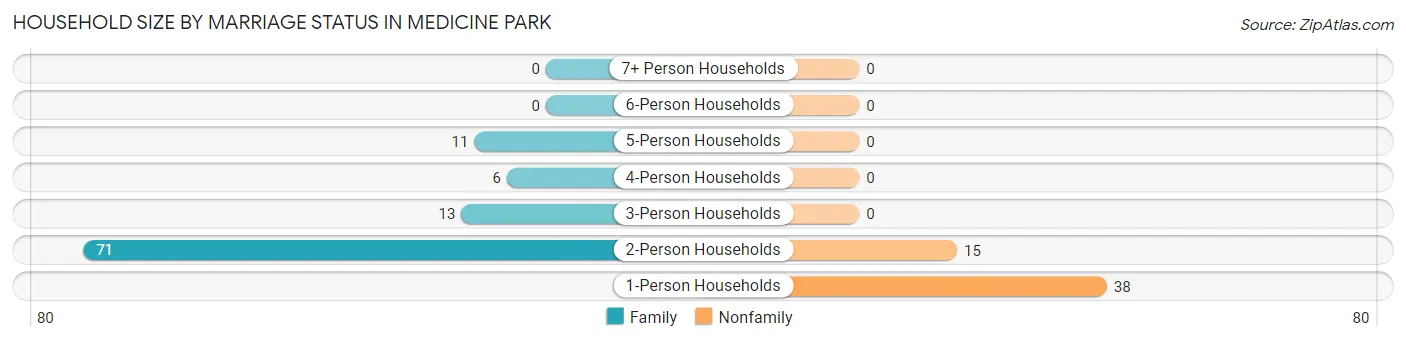
| Household Size | Family Households | Nonfamily Households |
| 1-Person Households | - | 38 (24.7%) |
| 2-Person Households | 71 (46.1%) | 15 (9.7%) |
| 3-Person Households | 13 (8.4%) | 0 (0.0%) |
| 4-Person Households | 6 (3.9%) | 0 (0.0%) |
| 5-Person Households | 11 (7.1%) | 0 (0.0%) |
| 6-Person Households | 0 (0.0%) | 0 (0.0%) |
| 7+ Person Households | 0 (0.0%) | 0 (0.0%) |
| Total | 101 (65.6%) | 53 (34.4%) |
Female Fertility in Medicine Park
Fertility by Age in Medicine Park
Average fertility rate in Medicine Park is 33.0 births per 1,000 women. Women in the age bracket of 20 to 34 years have the highest fertility rate with 333.0 births per 1,000 women. Women in the age bracket of 20 to 34 years acount for 100.0% of all women with births.
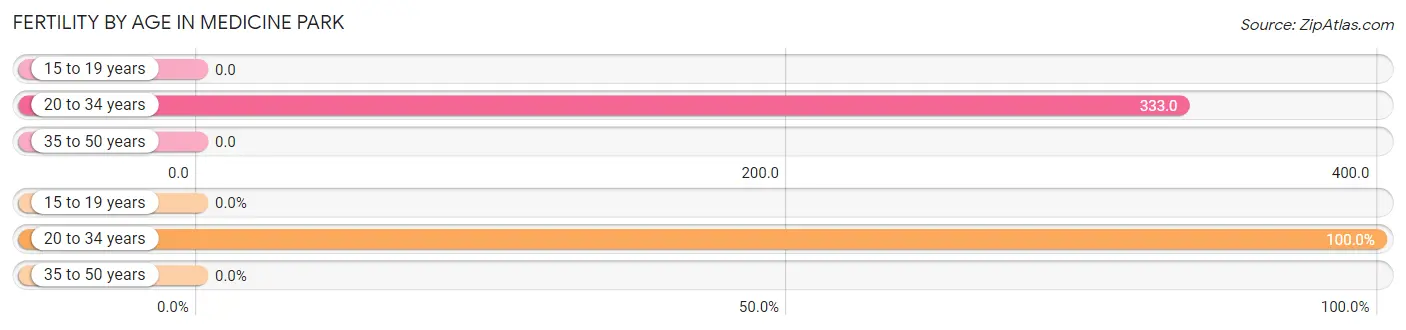
| Age Bracket | Women with Births | Births / 1,000 Women |
| 15 to 19 years | 0 (0.0%) | 0.0 |
| 20 to 34 years | 2 (100.0%) | 333.0 |
| 35 to 50 years | 0 (0.0%) | 0.0 |
| Total | 2 (100.0%) | 33.0 |
Fertility by Age by Marriage Status in Medicine Park
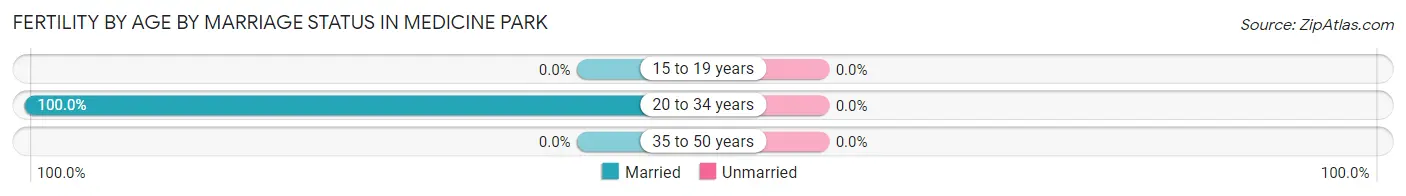
| Age Bracket | Married | Unmarried |
| 15 to 19 years | 0 (0.0%) | 0 (0.0%) |
| 20 to 34 years | 2 (100.0%) | 0 (0.0%) |
| 35 to 50 years | 0 (0.0%) | 0 (0.0%) |
| Total | 2 (100.0%) | 0 (0.0%) |
Fertility by Education in Medicine Park
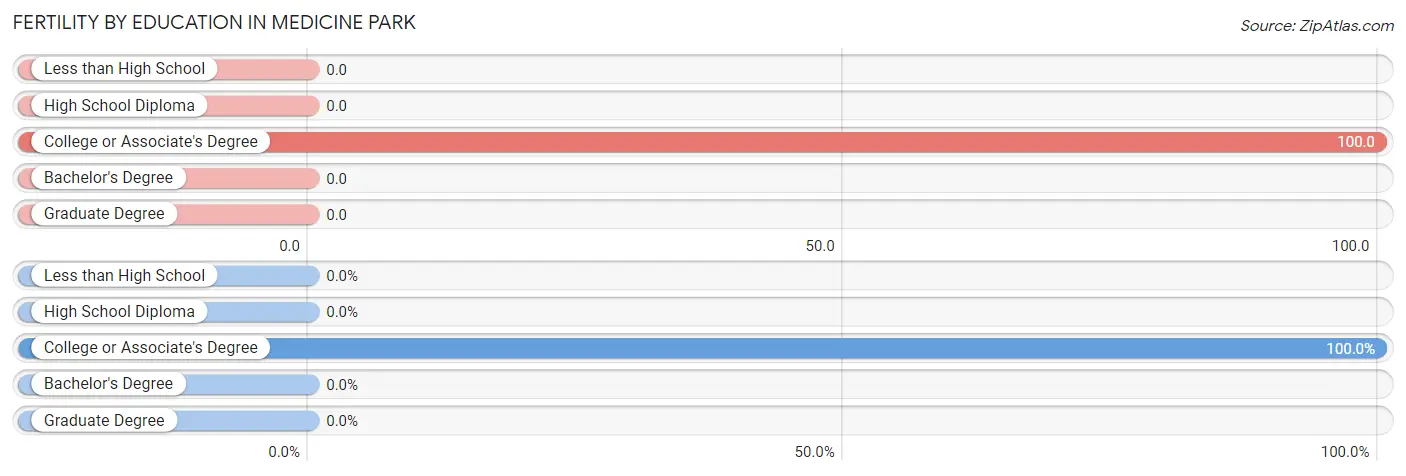
| Educational Attainment | Women with Births | Births / 1,000 Women |
| Less than High School | 0 (0.0%) | 0.0 |
| High School Diploma | 0 (0.0%) | 0.0 |
| College or Associate's Degree | 2 (100.0%) | 100.0 |
| Bachelor's Degree | 0 (0.0%) | 0.0 |
| Graduate Degree | 0 (0.0%) | 0.0 |
| Total | 2 (100.0%) | 33.0 |
Fertility by Education by Marriage Status in Medicine Park
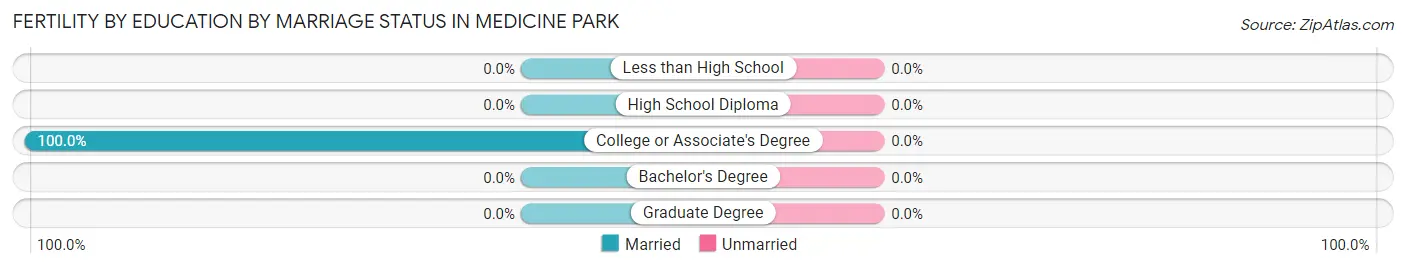
| Educational Attainment | Married | Unmarried |
| Less than High School | 0 (0.0%) | 0 (0.0%) |
| High School Diploma | 0 (0.0%) | 0 (0.0%) |
| College or Associate's Degree | 2 (100.0%) | 0 (0.0%) |
| Bachelor's Degree | 0 (0.0%) | 0 (0.0%) |
| Graduate Degree | 0 (0.0%) | 0 (0.0%) |
| Total | 2 (100.0%) | 0 (0.0%) |
Employment Characteristics in Medicine Park
Employment by Class of Employer in Medicine Park
Among the 166 employed individuals in Medicine Park, private company employees (73 | 44.0%), not-for-profit organizations (37 | 22.3%), and federal government employees (21 | 12.7%) make up the most common classes of employment.
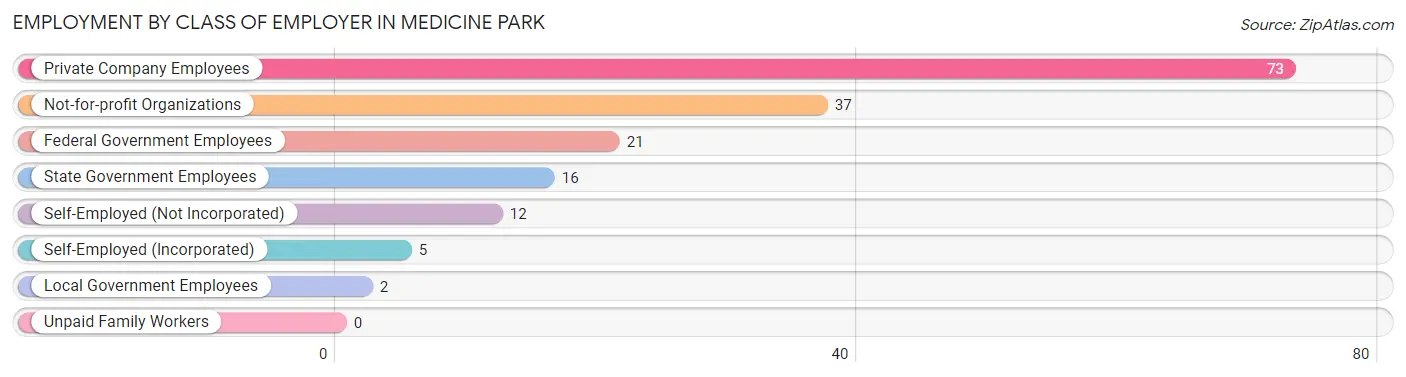
| Employer Class | # Employees | % Employees |
| Private Company Employees | 73 | 44.0% |
| Self-Employed (Incorporated) | 5 | 3.0% |
| Self-Employed (Not Incorporated) | 12 | 7.2% |
| Not-for-profit Organizations | 37 | 22.3% |
| Local Government Employees | 2 | 1.2% |
| State Government Employees | 16 | 9.6% |
| Federal Government Employees | 21 | 12.7% |
| Unpaid Family Workers | 0 | 0.0% |
| Total | 166 | 100.0% |
Employment Status by Age in Medicine Park
According to the labor force statistics for Medicine Park, out of the total population over 16 years of age (265), 69.4% or 184 individuals are in the labor force, with 3.5% or 6 of them unemployed. The age group with the highest labor force participation rate is 30 to 34 years, with 100.0% or 13 individuals in the labor force. Within the labor force, the 25 to 29 years age range has the highest percentage of unemployed individuals, with 50.0% or 4 of them being unemployed.
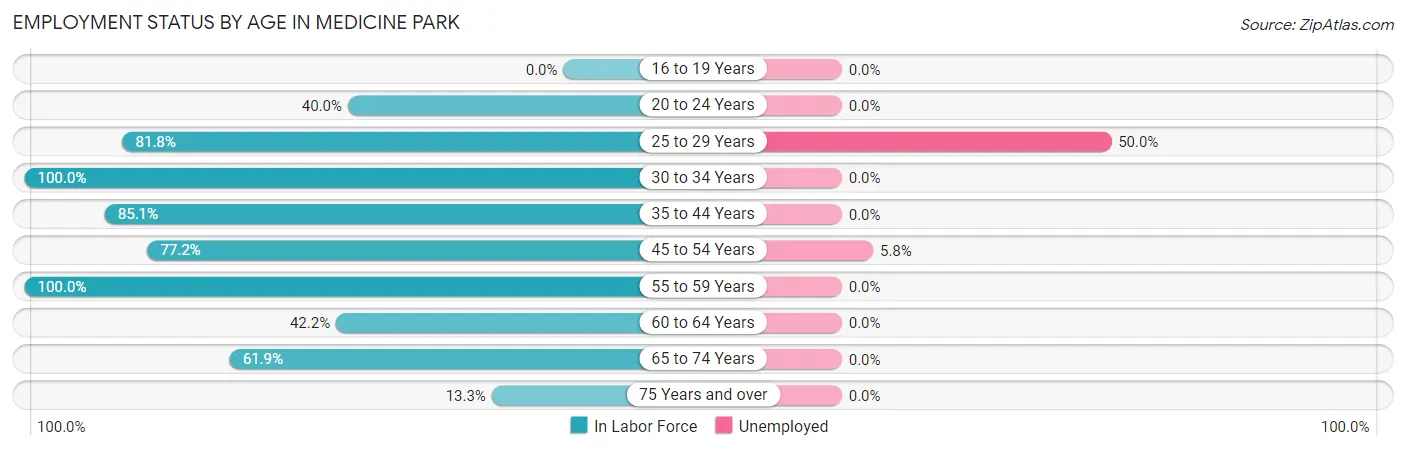
| Age Bracket | In Labor Force | Unemployed |
| 16 to 19 Years | 0 (0.0%) | 0 (0.0%) |
| 20 to 24 Years | 2 (40.0%) | 0 (0.0%) |
| 25 to 29 Years | 9 (81.8%) | 4 (50.0%) |
| 30 to 34 Years | 13 (100.0%) | 0 (0.0%) |
| 35 to 44 Years | 40 (85.1%) | 0 (0.0%) |
| 45 to 54 Years | 71 (77.2%) | 4 (5.8%) |
| 55 to 59 Years | 15 (100.0%) | 0 (0.0%) |
| 60 to 64 Years | 19 (42.2%) | 0 (0.0%) |
| 65 to 74 Years | 13 (61.9%) | 0 (0.0%) |
| 75 Years and over | 2 (13.3%) | 0 (0.0%) |
| Total | 184 (69.4%) | 6 (3.5%) |
Employment Status by Educational Attainment in Medicine Park
According to labor force statistics for Medicine Park, 74.9% of individuals (167) out of the total population between 25 and 64 years of age (223) are in the labor force, with 3.9% or 7 of them being unemployed. The group with the highest labor force participation rate are those with the educational attainment of bachelor's degree or higher, with 81.1% or 103 individuals in the labor force. Within the labor force, individuals with high school diploma education have the highest percentage of unemployment, with 14.8% or 5 of them being unemployed.
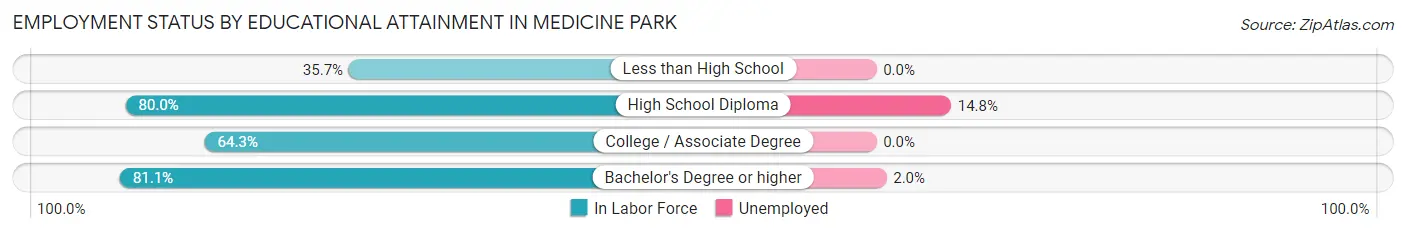
| Educational Attainment | In Labor Force | Unemployed |
| Less than High School | 5 (35.7%) | 0 (0.0%) |
| High School Diploma | 32 (80.0%) | 6 (14.8%) |
| College / Associate Degree | 27 (64.3%) | 0 (0.0%) |
| Bachelor's Degree or higher | 103 (81.1%) | 3 (2.0%) |
| Total | 167 (74.9%) | 9 (3.9%) |
Employment Occupations by Sex in Medicine Park
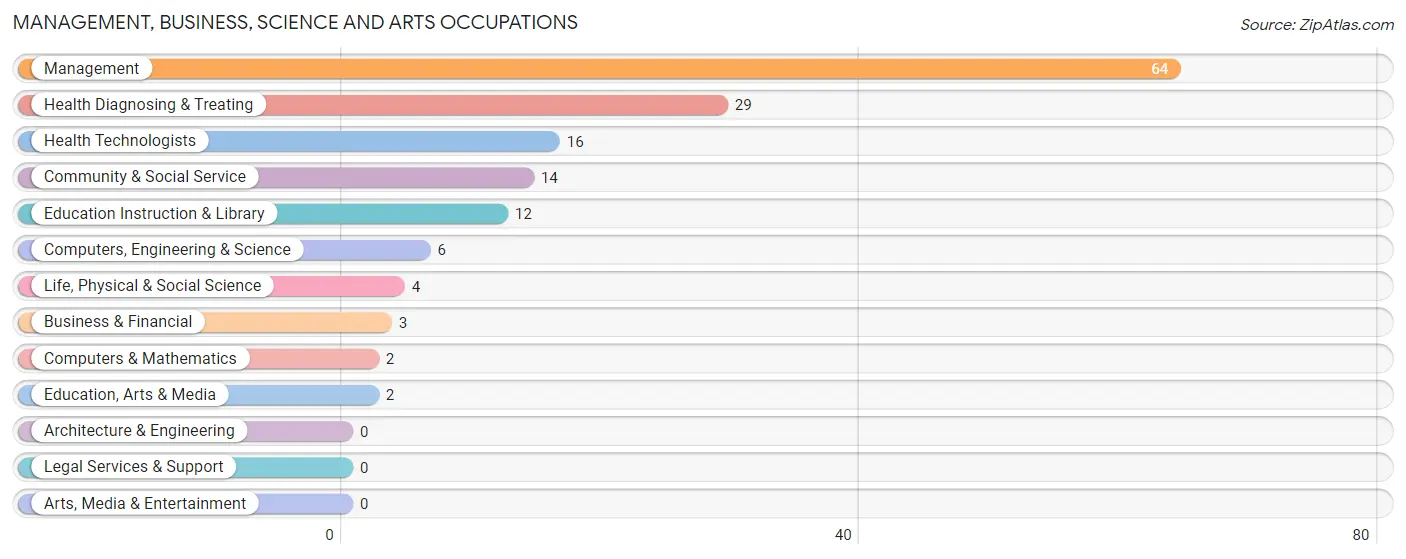
Management, Business, Science and Arts Occupations
The most common Management, Business, Science and Arts occupations in Medicine Park are Management (64 | 38.6%), Health Diagnosing & Treating (29 | 17.5%), Health Technologists (16 | 9.6%), Community & Social Service (14 | 8.4%), and Education Instruction & Library (12 | 7.2%).
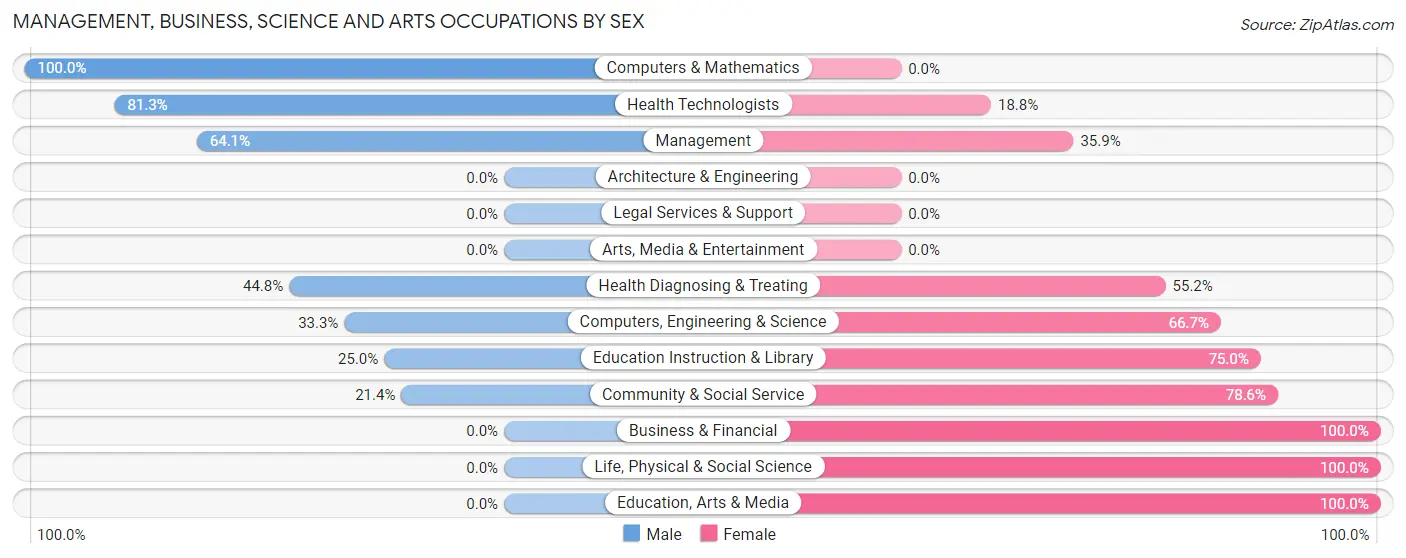
Management, Business, Science and Arts Occupations by Sex
Within the Management, Business, Science and Arts occupations in Medicine Park, the most male-oriented occupations are Computers & Mathematics (100.0%), Health Technologists (81.2%), and Management (64.1%), while the most female-oriented occupations are Business & Financial (100.0%), Life, Physical & Social Science (100.0%), and Education, Arts & Media (100.0%).
| Occupation | Male | Female |
| Management | 41 (64.1%) | 23 (35.9%) |
| Business & Financial | 0 (0.0%) | 3 (100.0%) |
| Computers, Engineering & Science | 2 (33.3%) | 4 (66.7%) |
| Computers & Mathematics | 2 (100.0%) | 0 (0.0%) |
| Architecture & Engineering | 0 (0.0%) | 0 (0.0%) |
| Life, Physical & Social Science | 0 (0.0%) | 4 (100.0%) |
| Community & Social Service | 3 (21.4%) | 11 (78.6%) |
| Education, Arts & Media | 0 (0.0%) | 2 (100.0%) |
| Legal Services & Support | 0 (0.0%) | 0 (0.0%) |
| Education Instruction & Library | 3 (25.0%) | 9 (75.0%) |
| Arts, Media & Entertainment | 0 (0.0%) | 0 (0.0%) |
| Health Diagnosing & Treating | 13 (44.8%) | 16 (55.2%) |
| Health Technologists | 13 (81.2%) | 3 (18.8%) |
| Total (Category) | 59 (50.9%) | 57 (49.1%) |
| Total (Overall) | 86 (51.8%) | 80 (48.2%) |
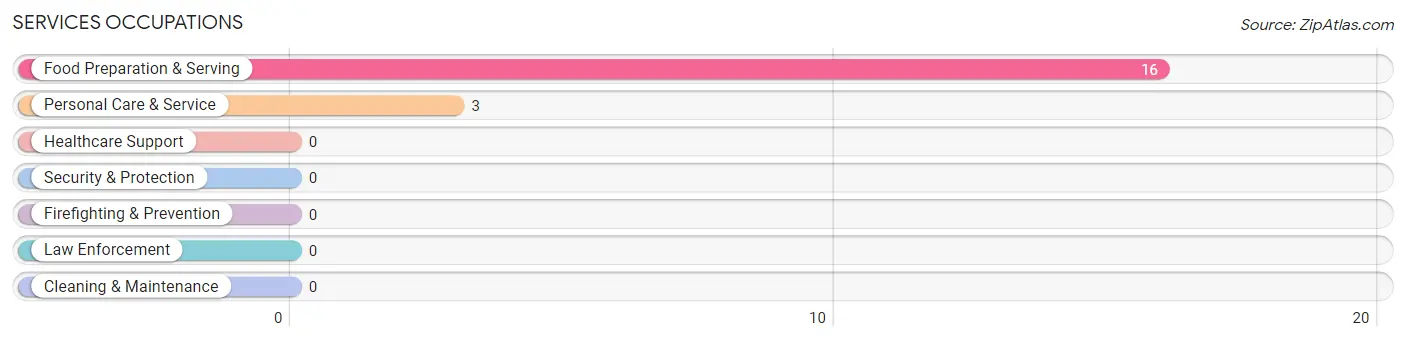
Services Occupations
The most common Services occupations in Medicine Park are Food Preparation & Serving (16 | 9.6%), and Personal Care & Service (3 | 1.8%).
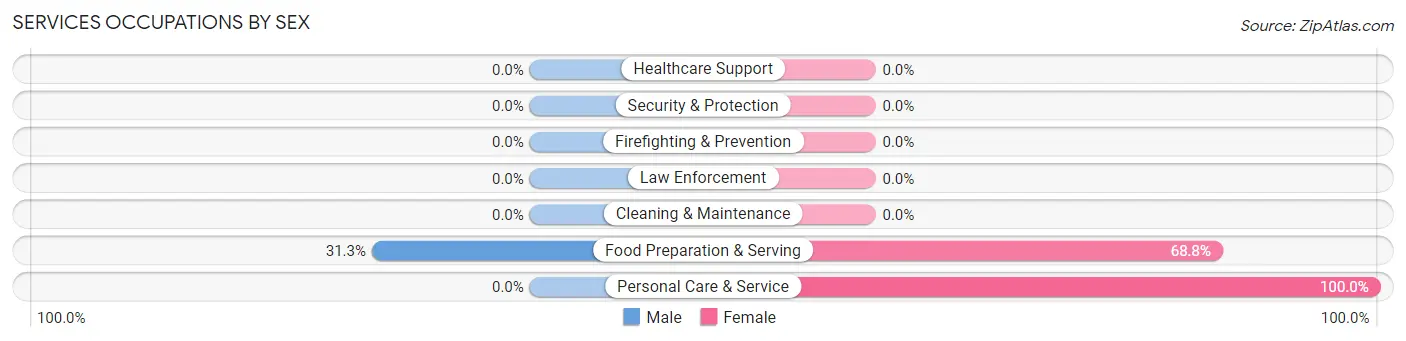
Services Occupations by Sex
| Occupation | Male | Female |
| Healthcare Support | 0 (0.0%) | 0 (0.0%) |
| Security & Protection | 0 (0.0%) | 0 (0.0%) |
| Firefighting & Prevention | 0 (0.0%) | 0 (0.0%) |
| Law Enforcement | 0 (0.0%) | 0 (0.0%) |
| Food Preparation & Serving | 5 (31.2%) | 11 (68.8%) |
| Cleaning & Maintenance | 0 (0.0%) | 0 (0.0%) |
| Personal Care & Service | 0 (0.0%) | 3 (100.0%) |
| Total (Category) | 5 (26.3%) | 14 (73.7%) |
| Total (Overall) | 86 (51.8%) | 80 (48.2%) |
Sales and Office Occupations
The most common Sales and Office occupations in Medicine Park are Office & Administration (10 | 6.0%), and Sales & Related (3 | 1.8%).
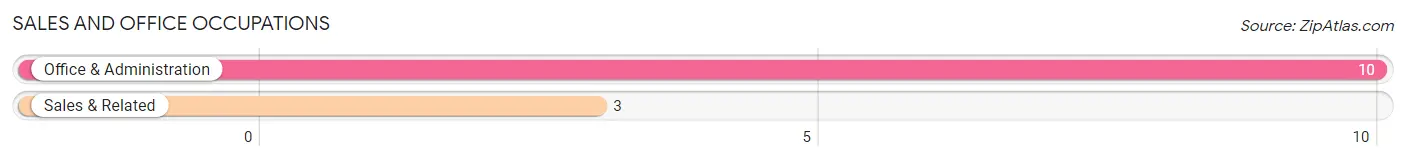
Sales and Office Occupations by Sex
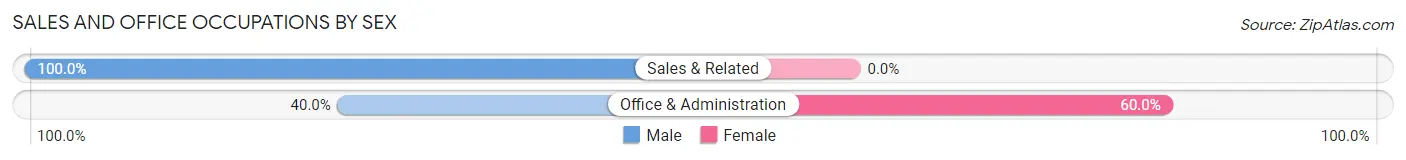
| Occupation | Male | Female |
| Sales & Related | 3 (100.0%) | 0 (0.0%) |
| Office & Administration | 4 (40.0%) | 6 (60.0%) |
| Total (Category) | 7 (53.8%) | 6 (46.2%) |
| Total (Overall) | 86 (51.8%) | 80 (48.2%) |
Natural Resources, Construction and Maintenance Occupations
The most common Natural Resources, Construction and Maintenance occupations in Medicine Park are Construction & Extraction (7 | 4.2%), and Installation, Maintenance & Repair (2 | 1.2%).
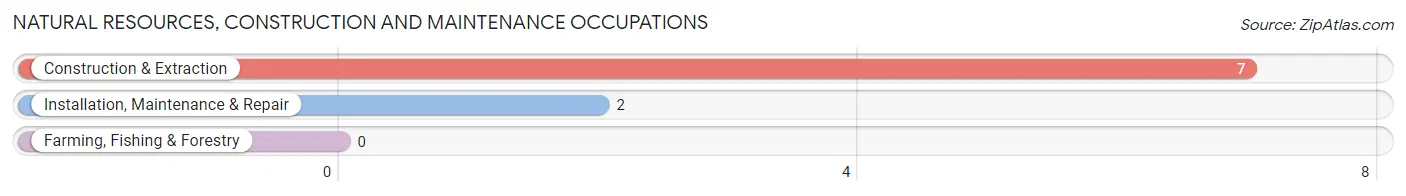
Natural Resources, Construction and Maintenance Occupations by Sex
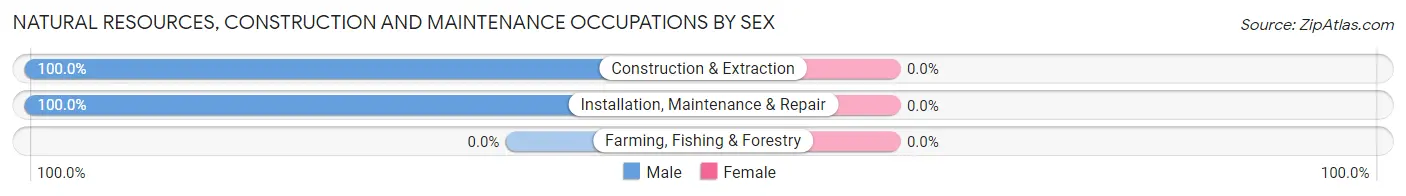
| Occupation | Male | Female |
| Farming, Fishing & Forestry | 0 (0.0%) | 0 (0.0%) |
| Construction & Extraction | 7 (100.0%) | 0 (0.0%) |
| Installation, Maintenance & Repair | 2 (100.0%) | 0 (0.0%) |
| Total (Category) | 9 (100.0%) | 0 (0.0%) |
| Total (Overall) | 86 (51.8%) | 80 (48.2%) |
Production, Transportation and Moving Occupations
The most common Production, Transportation and Moving occupations in Medicine Park are Transportation (7 | 4.2%), and Material Moving (2 | 1.2%).
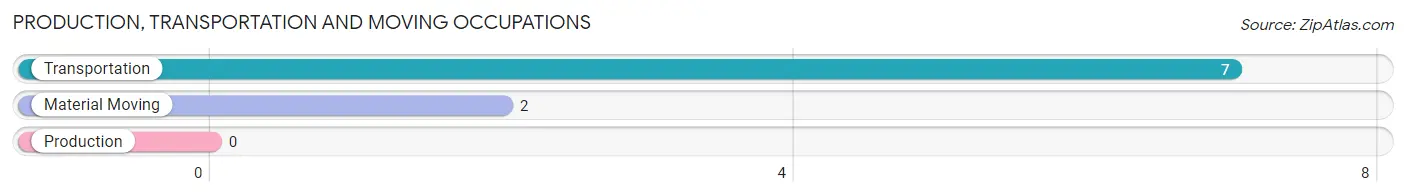
Production, Transportation and Moving Occupations by Sex
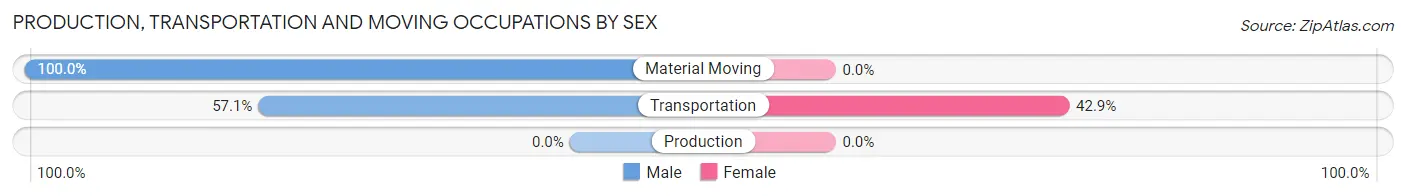
| Occupation | Male | Female |
| Production | 0 (0.0%) | 0 (0.0%) |
| Transportation | 4 (57.1%) | 3 (42.9%) |
| Material Moving | 2 (100.0%) | 0 (0.0%) |
| Total (Category) | 6 (66.7%) | 3 (33.3%) |
| Total (Overall) | 86 (51.8%) | 80 (48.2%) |
Employment Industries by Sex in Medicine Park
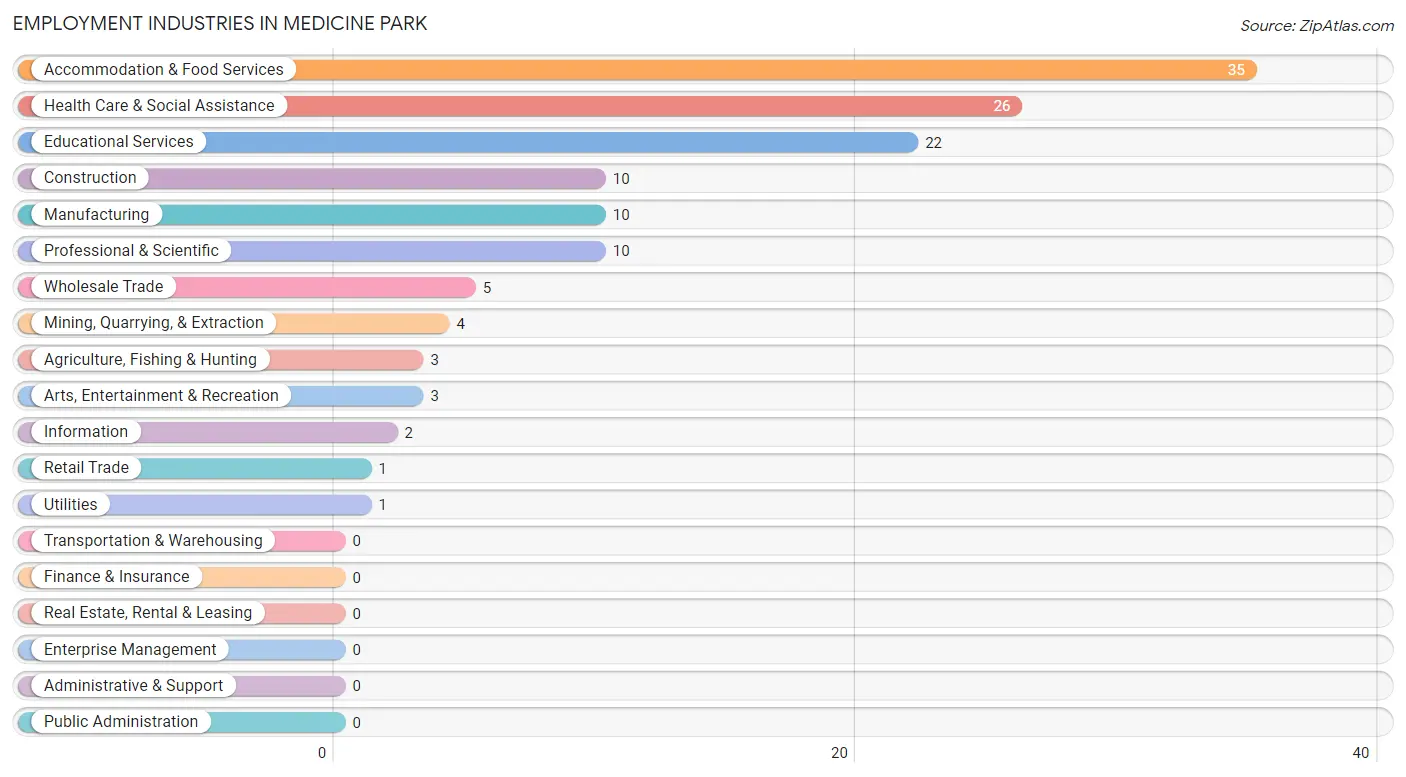
Employment Industries in Medicine Park
The major employment industries in Medicine Park include Accommodation & Food Services (35 | 21.1%), Health Care & Social Assistance (26 | 15.7%), Educational Services (22 | 13.3%), Construction (10 | 6.0%), and Manufacturing (10 | 6.0%).
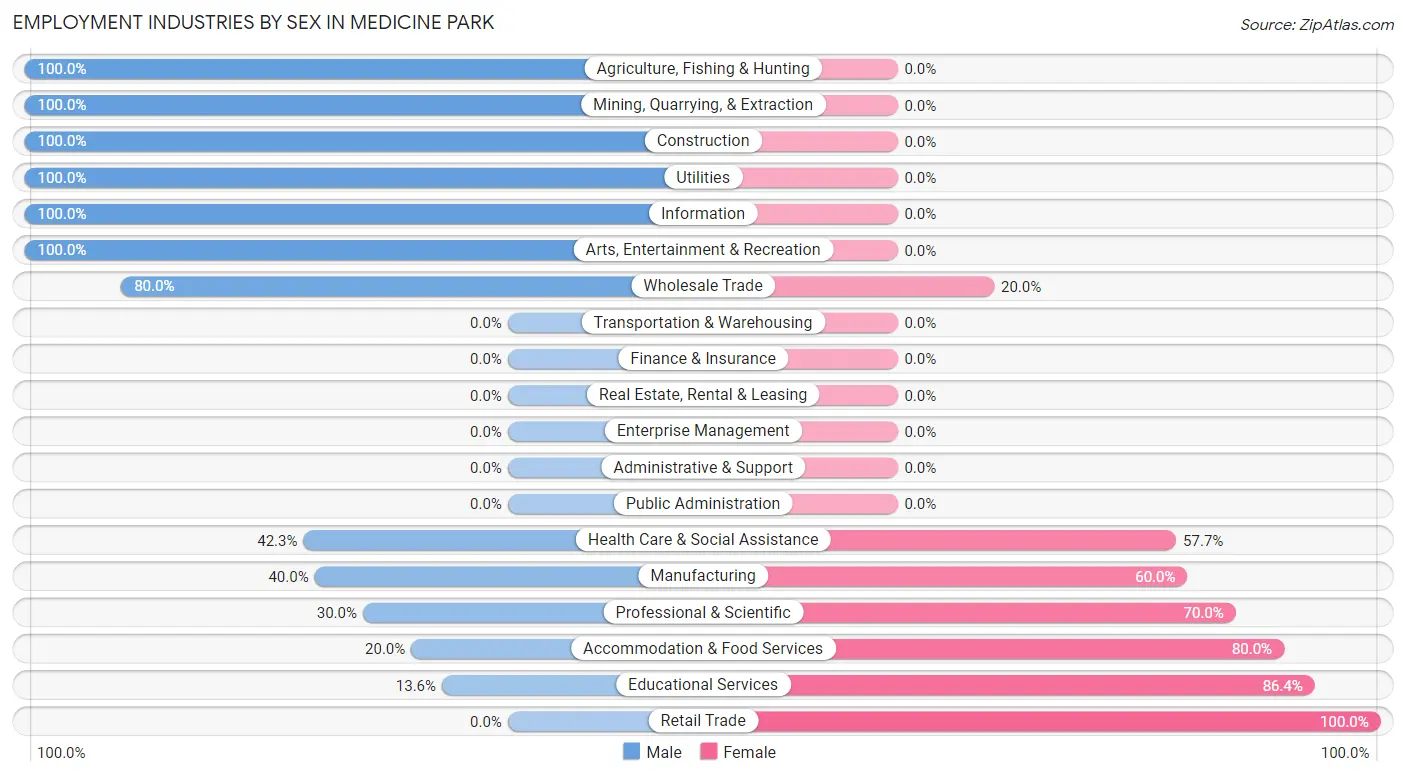
Employment Industries by Sex in Medicine Park
The Medicine Park industries that see more men than women are Agriculture, Fishing & Hunting (100.0%), Mining, Quarrying, & Extraction (100.0%), and Construction (100.0%), whereas the industries that tend to have a higher number of women are Retail Trade (100.0%), Educational Services (86.4%), and Accommodation & Food Services (80.0%).
| Industry | Male | Female |
| Agriculture, Fishing & Hunting | 3 (100.0%) | 0 (0.0%) |
| Mining, Quarrying, & Extraction | 4 (100.0%) | 0 (0.0%) |
| Construction | 10 (100.0%) | 0 (0.0%) |
| Manufacturing | 4 (40.0%) | 6 (60.0%) |
| Wholesale Trade | 4 (80.0%) | 1 (20.0%) |
| Retail Trade | 0 (0.0%) | 1 (100.0%) |
| Transportation & Warehousing | 0 (0.0%) | 0 (0.0%) |
| Utilities | 1 (100.0%) | 0 (0.0%) |
| Information | 2 (100.0%) | 0 (0.0%) |
| Finance & Insurance | 0 (0.0%) | 0 (0.0%) |
| Real Estate, Rental & Leasing | 0 (0.0%) | 0 (0.0%) |
| Professional & Scientific | 3 (30.0%) | 7 (70.0%) |
| Enterprise Management | 0 (0.0%) | 0 (0.0%) |
| Administrative & Support | 0 (0.0%) | 0 (0.0%) |
| Educational Services | 3 (13.6%) | 19 (86.4%) |
| Health Care & Social Assistance | 11 (42.3%) | 15 (57.7%) |
| Arts, Entertainment & Recreation | 3 (100.0%) | 0 (0.0%) |
| Accommodation & Food Services | 7 (20.0%) | 28 (80.0%) |
| Public Administration | 0 (0.0%) | 0 (0.0%) |
| Total | 86 (51.8%) | 80 (48.2%) |
Education in Medicine Park
School Enrollment in Medicine Park
The most common levels of schooling among the 17 students in Medicine Park are middle school (11 | 64.7%), high school (2 | 11.8%), and college / undergraduate (2 | 11.8%).
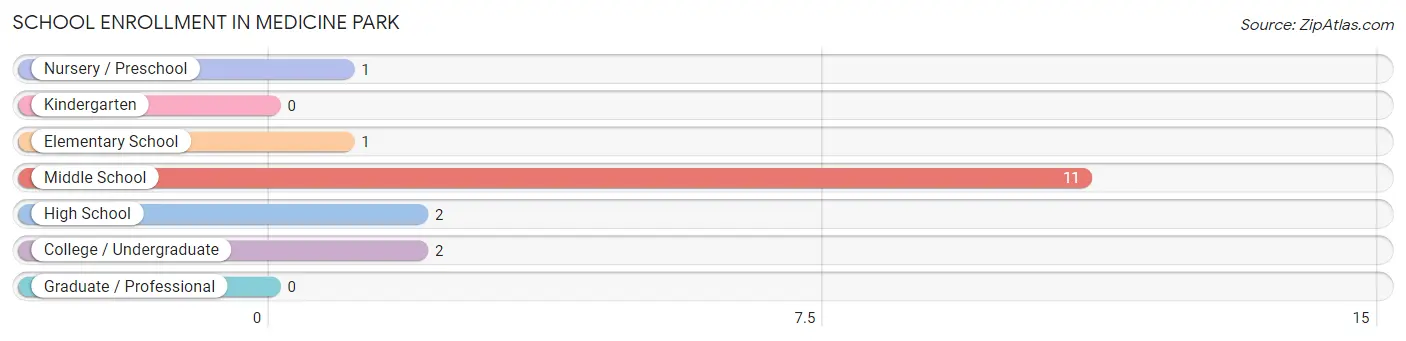
| School Level | # Students | % Students |
| Nursery / Preschool | 1 | 5.9% |
| Kindergarten | 0 | 0.0% |
| Elementary School | 1 | 5.9% |
| Middle School | 11 | 64.7% |
| High School | 2 | 11.8% |
| College / Undergraduate | 2 | 11.8% |
| Graduate / Professional | 0 | 0.0% |
| Total | 17 | 100.0% |
School Enrollment by Age by Funding Source in Medicine Park
Out of a total of 17 students who are enrolled in schools in Medicine Park, 6 (35.3%) attend a private institution, while the remaining 11 (64.7%) are enrolled in public schools. The age group of 3 to 4 year olds has the highest likelihood of being enrolled in private schools, with 1 (100.0% in the age bracket) enrolled. Conversely, the age group of 20 to 24 year olds has the lowest likelihood of being enrolled in a private school, with 2 (100.0% in the age bracket) attending a public institution.
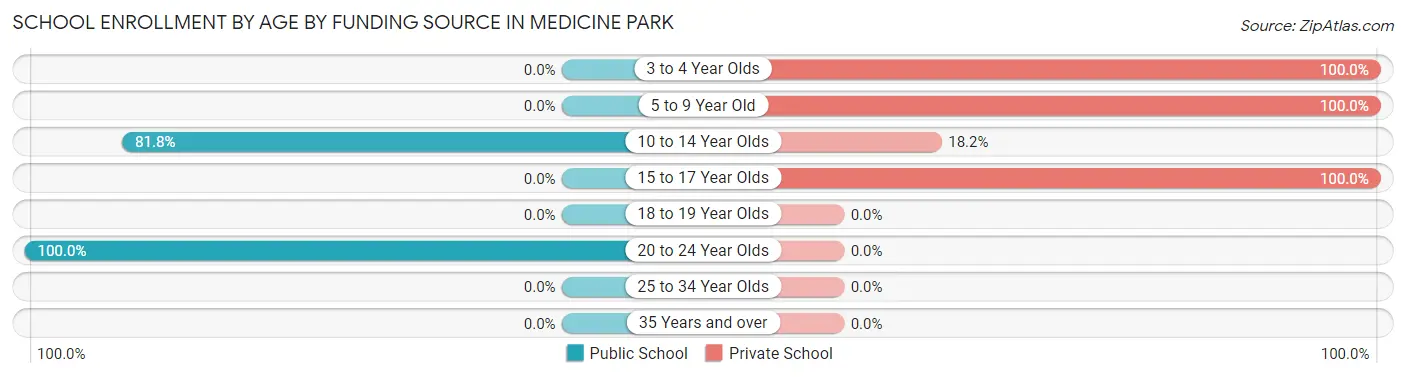
| Age Bracket | Public School | Private School |
| 3 to 4 Year Olds | 0 (0.0%) | 1 (100.0%) |
| 5 to 9 Year Old | 0 (0.0%) | 1 (100.0%) |
| 10 to 14 Year Olds | 9 (81.8%) | 2 (18.2%) |
| 15 to 17 Year Olds | 0 (0.0%) | 2 (100.0%) |
| 18 to 19 Year Olds | 0 (0.0%) | 0 (0.0%) |
| 20 to 24 Year Olds | 2 (100.0%) | 0 (0.0%) |
| 25 to 34 Year Olds | 0 (0.0%) | 0 (0.0%) |
| 35 Years and over | 0 (0.0%) | 0 (0.0%) |
| Total | 11 (64.7%) | 6 (35.3%) |
Educational Attainment by Field of Study in Medicine Park
Business (38 | 24.7%), science & technology (23 | 14.9%), arts & humanities (22 | 14.3%), education (19 | 12.3%), and bio, nature & agricultural (17 | 11.0%) are the most common fields of study among 154 individuals in Medicine Park who have obtained a bachelor's degree or higher.
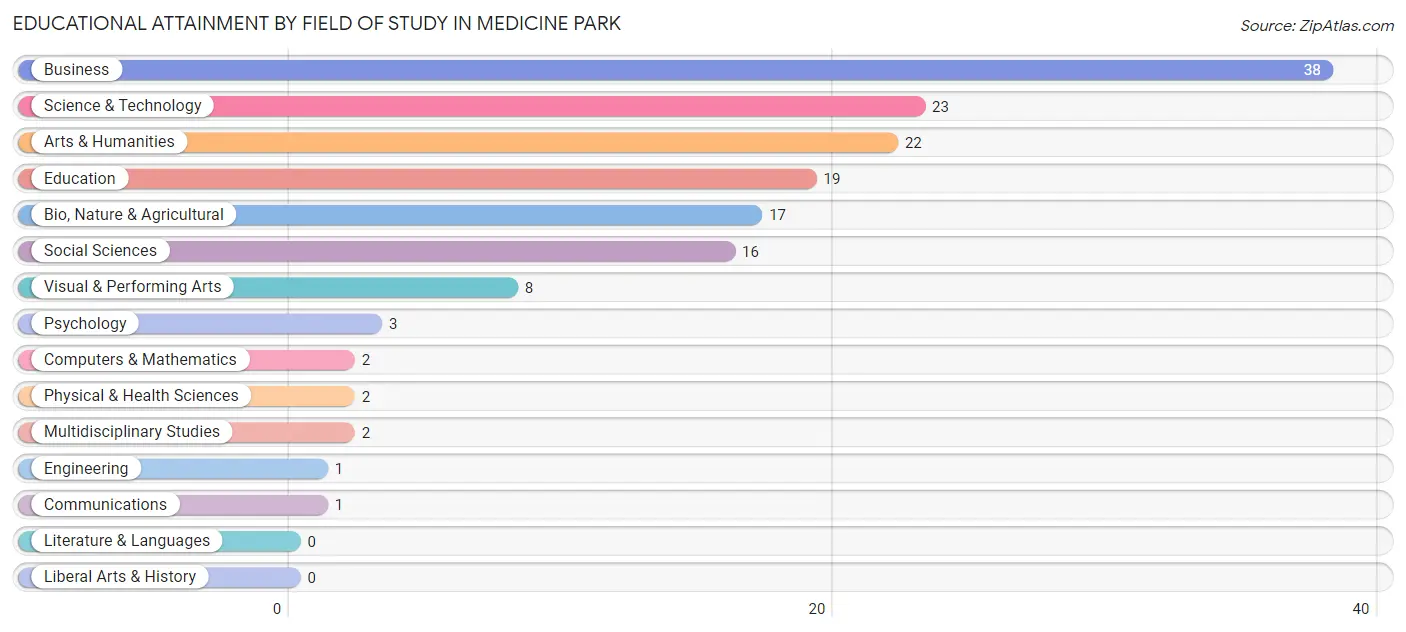
| Field of Study | # Graduates | % Graduates |
| Computers & Mathematics | 2 | 1.3% |
| Bio, Nature & Agricultural | 17 | 11.0% |
| Physical & Health Sciences | 2 | 1.3% |
| Psychology | 3 | 1.9% |
| Social Sciences | 16 | 10.4% |
| Engineering | 1 | 0.6% |
| Multidisciplinary Studies | 2 | 1.3% |
| Science & Technology | 23 | 14.9% |
| Business | 38 | 24.7% |
| Education | 19 | 12.3% |
| Literature & Languages | 0 | 0.0% |
| Liberal Arts & History | 0 | 0.0% |
| Visual & Performing Arts | 8 | 5.2% |
| Communications | 1 | 0.6% |
| Arts & Humanities | 22 | 14.3% |
| Total | 154 | 100.0% |
Transportation & Commute in Medicine Park
Vehicle Availability by Sex in Medicine Park
The most prevalent vehicle ownership categories in Medicine Park are males with 2 vehicles (65, accounting for 69.2%) and females with 2 vehicles (36, making up 90.3%).
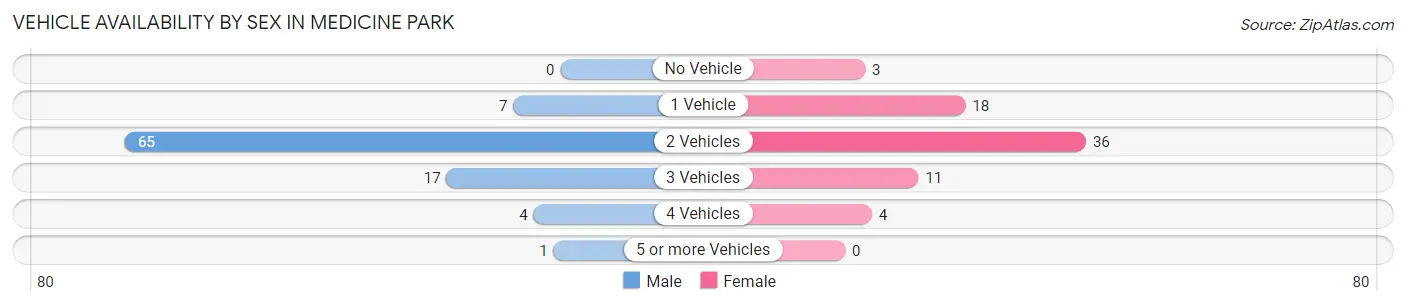
| Vehicles Available | Male | Female |
| No Vehicle | 0 (0.0%) | 3 (4.2%) |
| 1 Vehicle | 7 (7.4%) | 18 (25.0%) |
| 2 Vehicles | 65 (69.2%) | 36 (50.0%) |
| 3 Vehicles | 17 (18.1%) | 11 (15.3%) |
| 4 Vehicles | 4 (4.3%) | 4 (5.6%) |
| 5 or more Vehicles | 1 (1.1%) | 0 (0.0%) |
| Total | 94 (100.0%) | 72 (100.0%) |
Commute Time in Medicine Park
The most frequently occuring commute durations in Medicine Park are 20 to 24 minutes (48 commuters, 31.0%), 45 to 59 minutes (31 commuters, 20.0%), and 15 to 19 minutes (16 commuters, 10.3%).
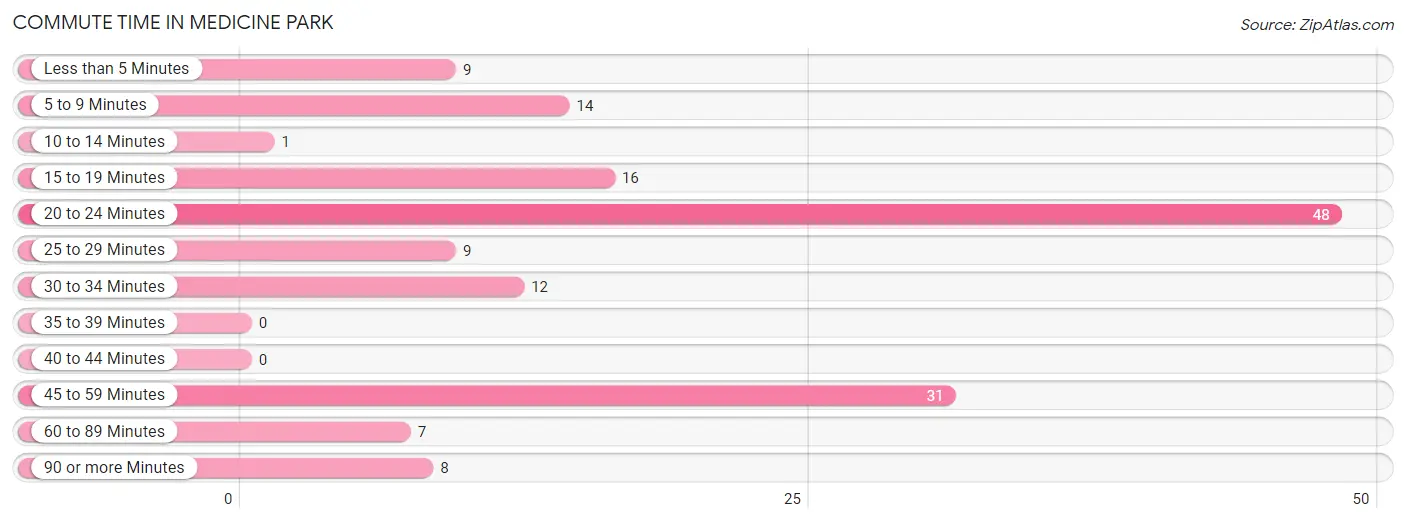
| Commute Time | # Commuters | % Commuters |
| Less than 5 Minutes | 9 | 5.8% |
| 5 to 9 Minutes | 14 | 9.0% |
| 10 to 14 Minutes | 1 | 0.6% |
| 15 to 19 Minutes | 16 | 10.3% |
| 20 to 24 Minutes | 48 | 31.0% |
| 25 to 29 Minutes | 9 | 5.8% |
| 30 to 34 Minutes | 12 | 7.7% |
| 35 to 39 Minutes | 0 | 0.0% |
| 40 to 44 Minutes | 0 | 0.0% |
| 45 to 59 Minutes | 31 | 20.0% |
| 60 to 89 Minutes | 7 | 4.5% |
| 90 or more Minutes | 8 | 5.2% |
Commute Time by Sex in Medicine Park
The most common commute times in Medicine Park are 45 to 59 minutes (31 commuters, 33.3%) for males and 20 to 24 minutes (30 commuters, 48.4%) for females.
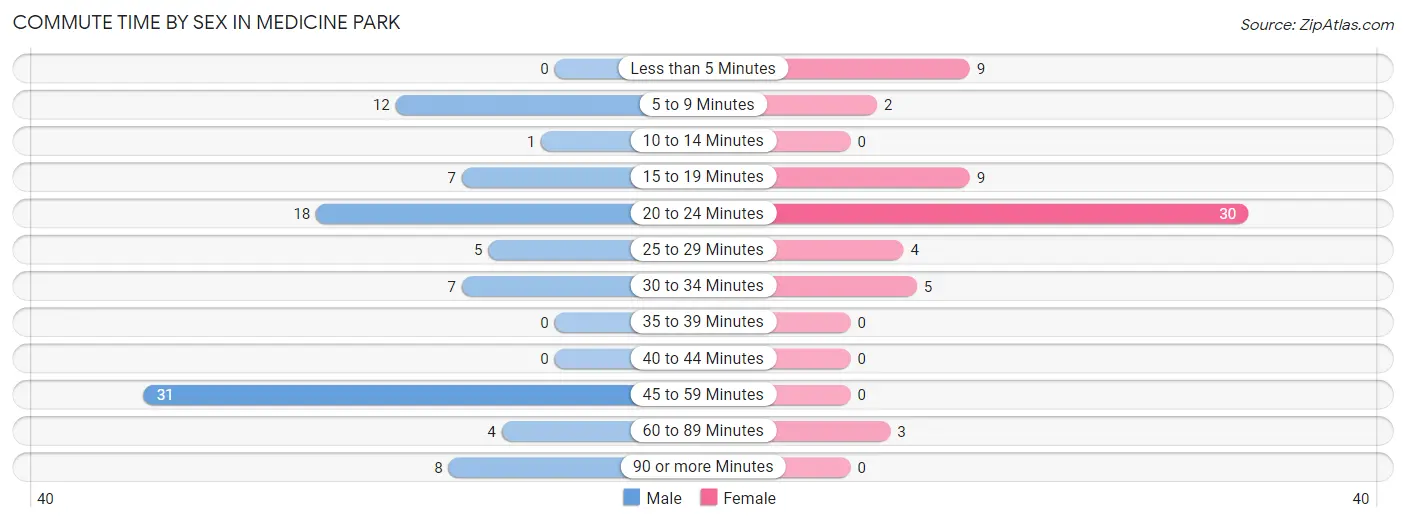
| Commute Time | Male | Female |
| Less than 5 Minutes | 0 (0.0%) | 9 (14.5%) |
| 5 to 9 Minutes | 12 (12.9%) | 2 (3.2%) |
| 10 to 14 Minutes | 1 (1.1%) | 0 (0.0%) |
| 15 to 19 Minutes | 7 (7.5%) | 9 (14.5%) |
| 20 to 24 Minutes | 18 (19.4%) | 30 (48.4%) |
| 25 to 29 Minutes | 5 (5.4%) | 4 (6.5%) |
| 30 to 34 Minutes | 7 (7.5%) | 5 (8.1%) |
| 35 to 39 Minutes | 0 (0.0%) | 0 (0.0%) |
| 40 to 44 Minutes | 0 (0.0%) | 0 (0.0%) |
| 45 to 59 Minutes | 31 (33.3%) | 0 (0.0%) |
| 60 to 89 Minutes | 4 (4.3%) | 3 (4.8%) |
| 90 or more Minutes | 8 (8.6%) | 0 (0.0%) |
Time of Departure to Work by Sex in Medicine Park
The most frequent times of departure to work in Medicine Park are 6:30 AM to 6:59 AM (32, 34.4%) for males and 7:00 AM to 7:29 AM (19, 30.6%) for females.
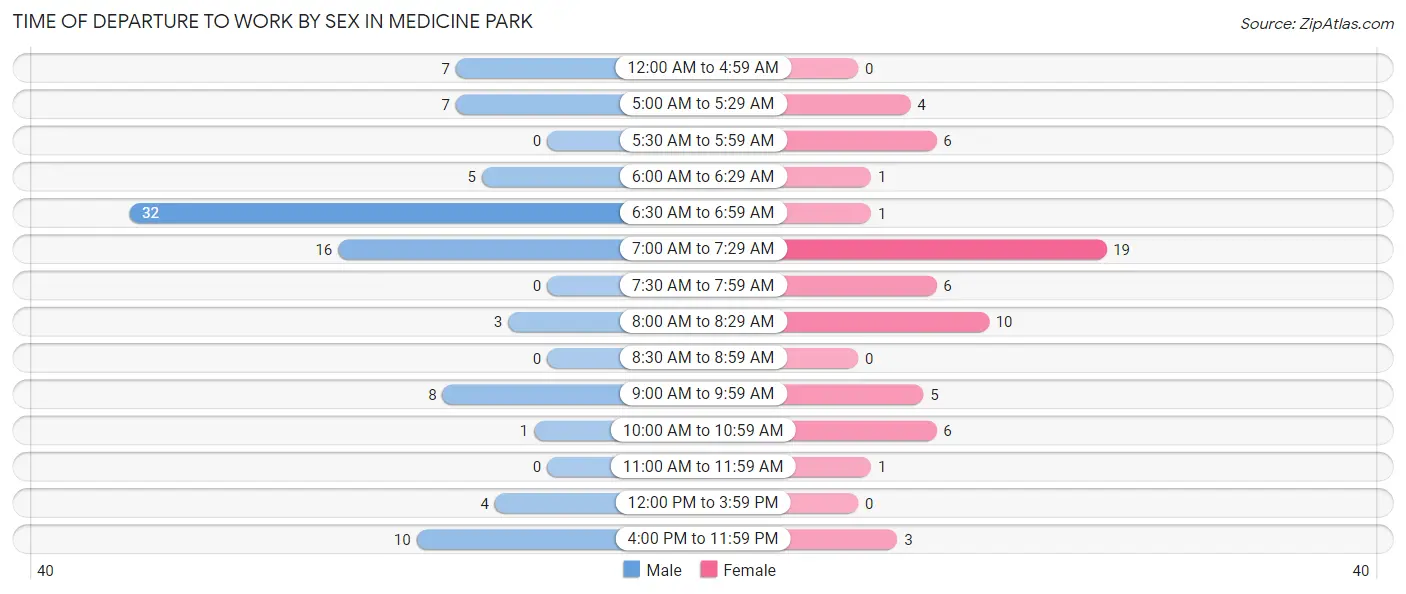
| Time of Departure | Male | Female |
| 12:00 AM to 4:59 AM | 7 (7.5%) | 0 (0.0%) |
| 5:00 AM to 5:29 AM | 7 (7.5%) | 4 (6.5%) |
| 5:30 AM to 5:59 AM | 0 (0.0%) | 6 (9.7%) |
| 6:00 AM to 6:29 AM | 5 (5.4%) | 1 (1.6%) |
| 6:30 AM to 6:59 AM | 32 (34.4%) | 1 (1.6%) |
| 7:00 AM to 7:29 AM | 16 (17.2%) | 19 (30.6%) |
| 7:30 AM to 7:59 AM | 0 (0.0%) | 6 (9.7%) |
| 8:00 AM to 8:29 AM | 3 (3.2%) | 10 (16.1%) |
| 8:30 AM to 8:59 AM | 0 (0.0%) | 0 (0.0%) |
| 9:00 AM to 9:59 AM | 8 (8.6%) | 5 (8.1%) |
| 10:00 AM to 10:59 AM | 1 (1.1%) | 6 (9.7%) |
| 11:00 AM to 11:59 AM | 0 (0.0%) | 1 (1.6%) |
| 12:00 PM to 3:59 PM | 4 (4.3%) | 0 (0.0%) |
| 4:00 PM to 11:59 PM | 10 (10.7%) | 3 (4.8%) |
| Total | 93 (100.0%) | 62 (100.0%) |
Housing Occupancy in Medicine Park
Occupancy by Ownership in Medicine Park
Of the total 154 dwellings in Medicine Park, owner-occupied units account for 134 (87.0%), while renter-occupied units make up 20 (13.0%).
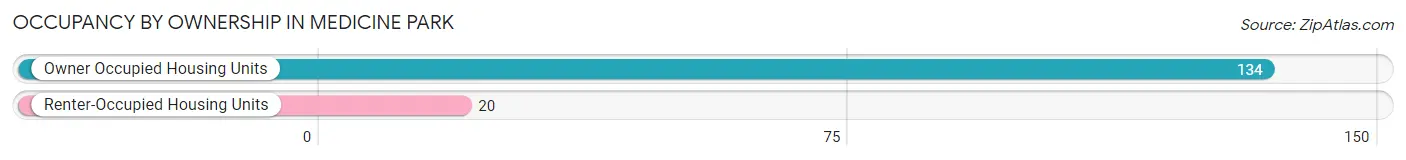
| Occupancy | # Housing Units | % Housing Units |
| Owner Occupied Housing Units | 134 | 87.0% |
| Renter-Occupied Housing Units | 20 | 13.0% |
| Total Occupied Housing Units | 154 | 100.0% |
Occupancy by Household Size in Medicine Park
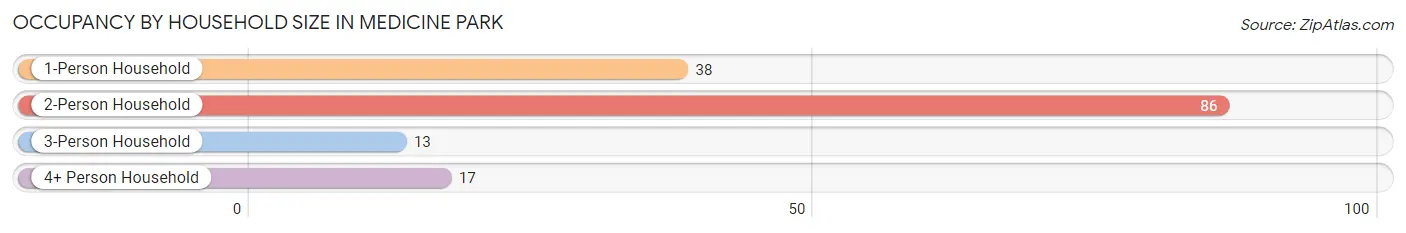
| Household Size | # Housing Units | % Housing Units |
| 1-Person Household | 38 | 24.7% |
| 2-Person Household | 86 | 55.8% |
| 3-Person Household | 13 | 8.4% |
| 4+ Person Household | 17 | 11.0% |
| Total Housing Units | 154 | 100.0% |
Occupancy by Ownership by Household Size in Medicine Park
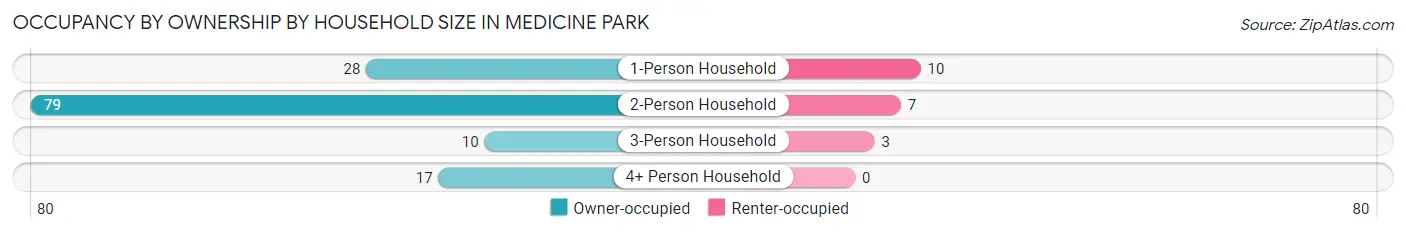
| Household Size | Owner-occupied | Renter-occupied |
| 1-Person Household | 28 (73.7%) | 10 (26.3%) |
| 2-Person Household | 79 (91.9%) | 7 (8.1%) |
| 3-Person Household | 10 (76.9%) | 3 (23.1%) |
| 4+ Person Household | 17 (100.0%) | 0 (0.0%) |
| Total Housing Units | 134 (87.0%) | 20 (13.0%) |
Occupancy by Educational Attainment in Medicine Park
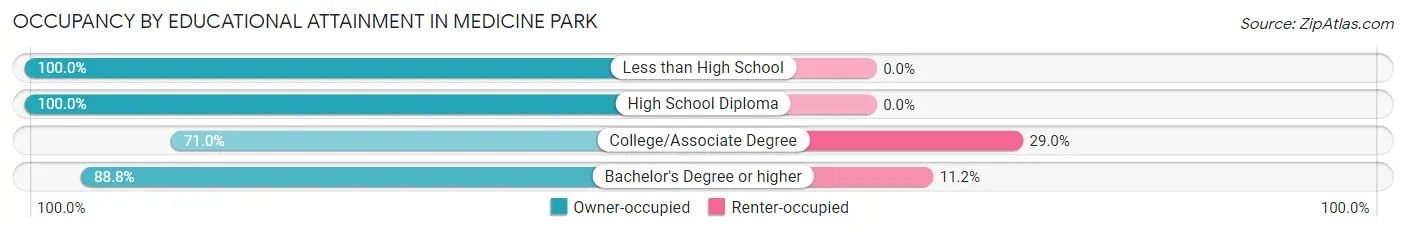
| Household Size | Owner-occupied | Renter-occupied |
| Less than High School | 5 (100.0%) | 0 (0.0%) |
| High School Diploma | 20 (100.0%) | 0 (0.0%) |
| College/Associate Degree | 22 (71.0%) | 9 (29.0%) |
| Bachelor's Degree or higher | 87 (88.8%) | 11 (11.2%) |
Occupancy by Age of Householder in Medicine Park
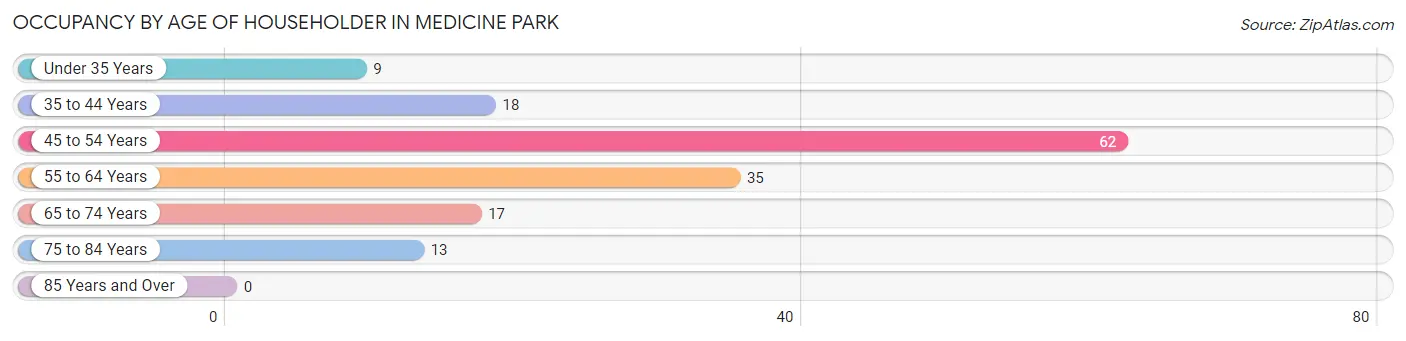
| Age Bracket | # Households | % Households |
| Under 35 Years | 9 | 5.8% |
| 35 to 44 Years | 18 | 11.7% |
| 45 to 54 Years | 62 | 40.3% |
| 55 to 64 Years | 35 | 22.7% |
| 65 to 74 Years | 17 | 11.0% |
| 75 to 84 Years | 13 | 8.4% |
| 85 Years and Over | 0 | 0.0% |
| Total | 154 | 100.0% |
Housing Finances in Medicine Park
Median Income by Occupancy in Medicine Park
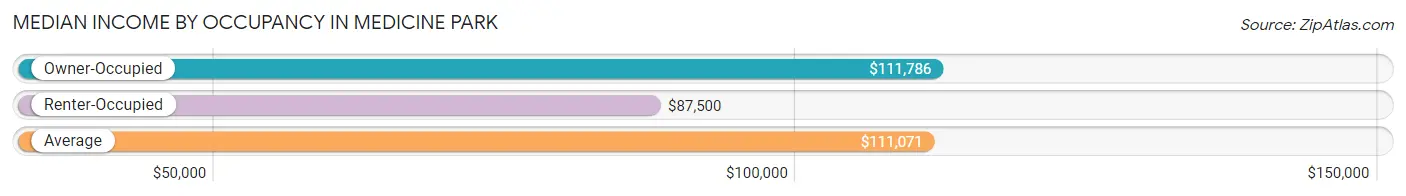
| Occupancy Type | # Households | Median Income |
| Owner-Occupied | 134 (87.0%) | $111,786 |
| Renter-Occupied | 20 (13.0%) | $87,500 |
| Average | 154 (100.0%) | $111,071 |
Occupancy by Householder Income Bracket in Medicine Park
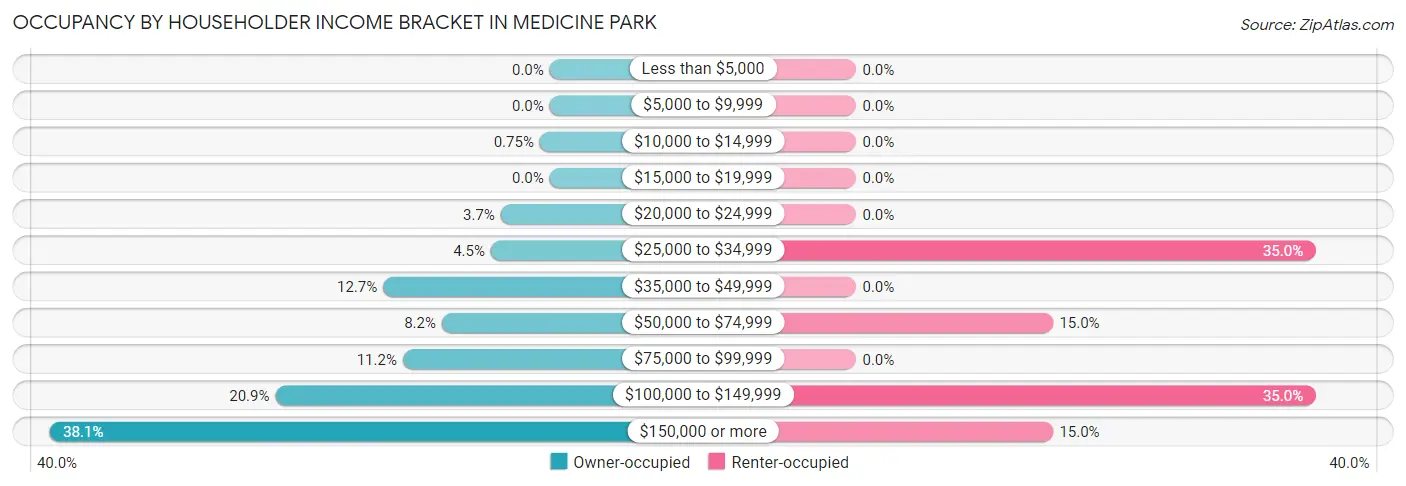
| Income Bracket | Owner-occupied | Renter-occupied |
| Less than $5,000 | 0 (0.0%) | 0 (0.0%) |
| $5,000 to $9,999 | 0 (0.0%) | 0 (0.0%) |
| $10,000 to $14,999 | 1 (0.7%) | 0 (0.0%) |
| $15,000 to $19,999 | 0 (0.0%) | 0 (0.0%) |
| $20,000 to $24,999 | 5 (3.7%) | 0 (0.0%) |
| $25,000 to $34,999 | 6 (4.5%) | 7 (35.0%) |
| $35,000 to $49,999 | 17 (12.7%) | 0 (0.0%) |
| $50,000 to $74,999 | 11 (8.2%) | 3 (15.0%) |
| $75,000 to $99,999 | 15 (11.2%) | 0 (0.0%) |
| $100,000 to $149,999 | 28 (20.9%) | 7 (35.0%) |
| $150,000 or more | 51 (38.1%) | 3 (15.0%) |
| Total | 134 (100.0%) | 20 (100.0%) |
Monthly Housing Cost Tiers in Medicine Park
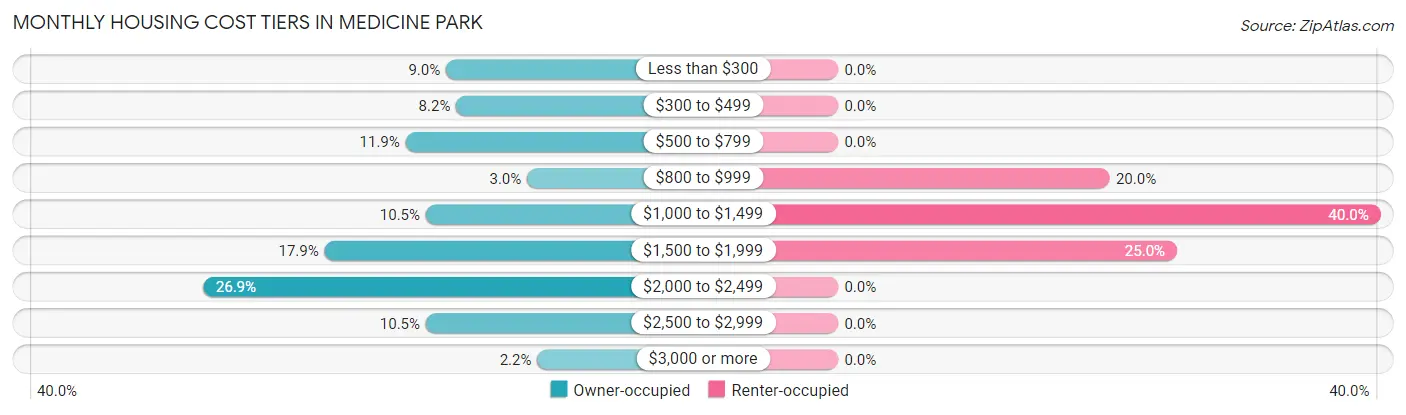
| Monthly Cost | Owner-occupied | Renter-occupied |
| Less than $300 | 12 (9.0%) | 0 (0.0%) |
| $300 to $499 | 11 (8.2%) | 0 (0.0%) |
| $500 to $799 | 16 (11.9%) | 0 (0.0%) |
| $800 to $999 | 4 (3.0%) | 4 (20.0%) |
| $1,000 to $1,499 | 14 (10.4%) | 8 (40.0%) |
| $1,500 to $1,999 | 24 (17.9%) | 5 (25.0%) |
| $2,000 to $2,499 | 36 (26.9%) | 0 (0.0%) |
| $2,500 to $2,999 | 14 (10.4%) | 0 (0.0%) |
| $3,000 or more | 3 (2.2%) | 0 (0.0%) |
| Total | 134 (100.0%) | 20 (100.0%) |
Physical Housing Characteristics in Medicine Park
Housing Structures in Medicine Park
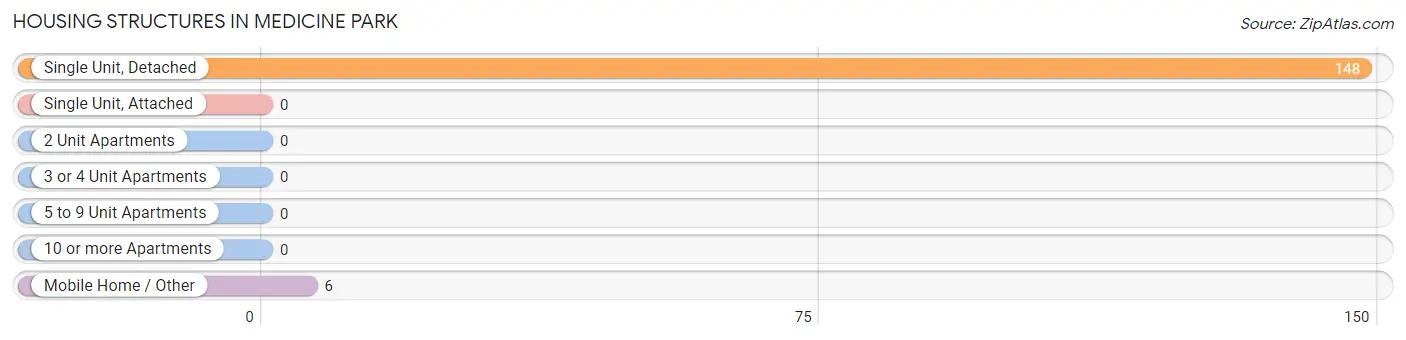
| Structure Type | # Housing Units | % Housing Units |
| Single Unit, Detached | 148 | 96.1% |
| Single Unit, Attached | 0 | 0.0% |
| 2 Unit Apartments | 0 | 0.0% |
| 3 or 4 Unit Apartments | 0 | 0.0% |
| 5 to 9 Unit Apartments | 0 | 0.0% |
| 10 or more Apartments | 0 | 0.0% |
| Mobile Home / Other | 6 | 3.9% |
| Total | 154 | 100.0% |
Housing Structures by Occupancy in Medicine Park
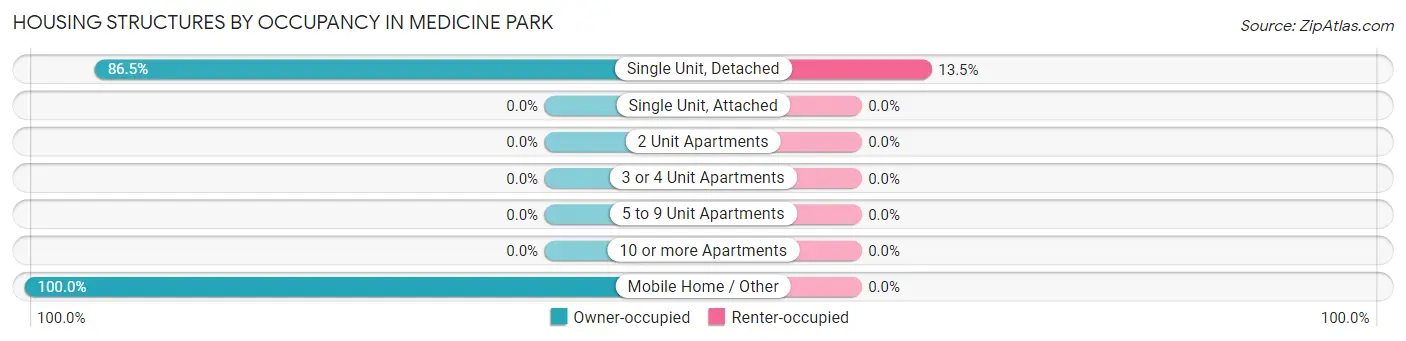
| Structure Type | Owner-occupied | Renter-occupied |
| Single Unit, Detached | 128 (86.5%) | 20 (13.5%) |
| Single Unit, Attached | 0 (0.0%) | 0 (0.0%) |
| 2 Unit Apartments | 0 (0.0%) | 0 (0.0%) |
| 3 or 4 Unit Apartments | 0 (0.0%) | 0 (0.0%) |
| 5 to 9 Unit Apartments | 0 (0.0%) | 0 (0.0%) |
| 10 or more Apartments | 0 (0.0%) | 0 (0.0%) |
| Mobile Home / Other | 6 (100.0%) | 0 (0.0%) |
| Total | 134 (87.0%) | 20 (13.0%) |
Housing Structures by Number of Rooms in Medicine Park
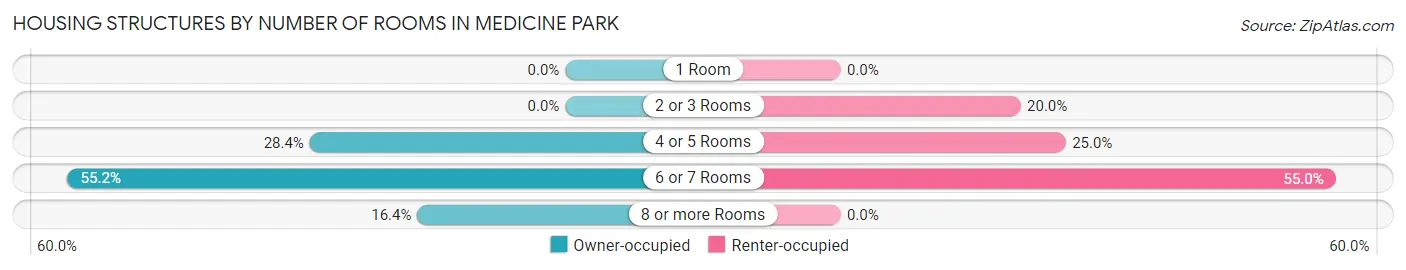
| Number of Rooms | Owner-occupied | Renter-occupied |
| 1 Room | 0 (0.0%) | 0 (0.0%) |
| 2 or 3 Rooms | 0 (0.0%) | 4 (20.0%) |
| 4 or 5 Rooms | 38 (28.4%) | 5 (25.0%) |
| 6 or 7 Rooms | 74 (55.2%) | 11 (55.0%) |
| 8 or more Rooms | 22 (16.4%) | 0 (0.0%) |
| Total | 134 (100.0%) | 20 (100.0%) |
Housing Structure by Heating Type in Medicine Park
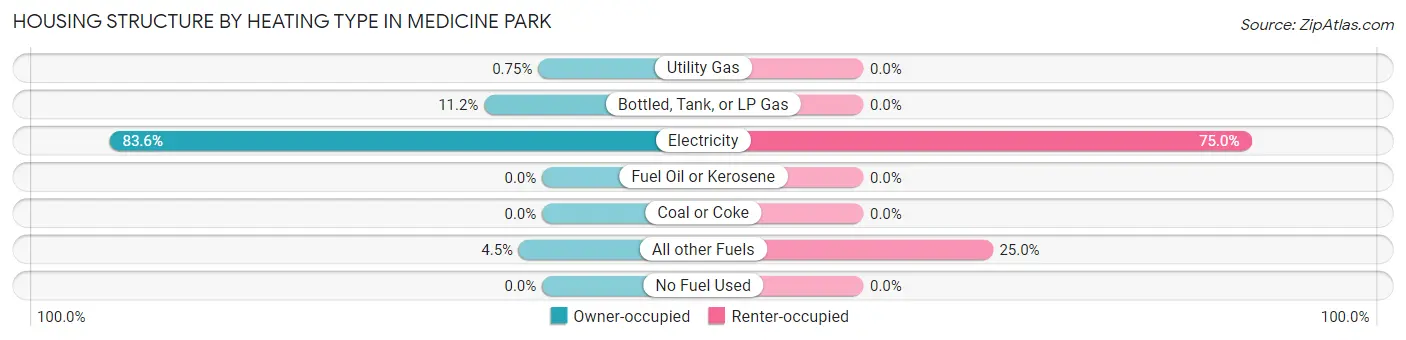
| Heating Type | Owner-occupied | Renter-occupied |
| Utility Gas | 1 (0.7%) | 0 (0.0%) |
| Bottled, Tank, or LP Gas | 15 (11.2%) | 0 (0.0%) |
| Electricity | 112 (83.6%) | 15 (75.0%) |
| Fuel Oil or Kerosene | 0 (0.0%) | 0 (0.0%) |
| Coal or Coke | 0 (0.0%) | 0 (0.0%) |
| All other Fuels | 6 (4.5%) | 5 (25.0%) |
| No Fuel Used | 0 (0.0%) | 0 (0.0%) |
| Total | 134 (100.0%) | 20 (100.0%) |
Household Vehicle Usage in Medicine Park
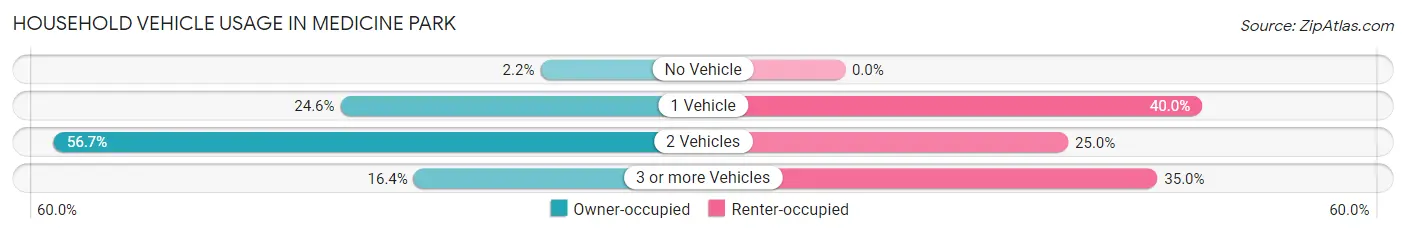
| Vehicles per Household | Owner-occupied | Renter-occupied |
| No Vehicle | 3 (2.2%) | 0 (0.0%) |
| 1 Vehicle | 33 (24.6%) | 8 (40.0%) |
| 2 Vehicles | 76 (56.7%) | 5 (25.0%) |
| 3 or more Vehicles | 22 (16.4%) | 7 (35.0%) |
| Total | 134 (100.0%) | 20 (100.0%) |
Real Estate & Mortgages in Medicine Park
Real Estate and Mortgage Overview in Medicine Park
| Characteristic | Without Mortgage | With Mortgage |
| Housing Units | 38 | 96 |
| Median Property Value | - | - |
| Median Household Income | $88,750 | $47 |
| Monthly Housing Costs | $420 | $3 |
| Real Estate Taxes | - | - |
Property Value by Mortgage Status in Medicine Park
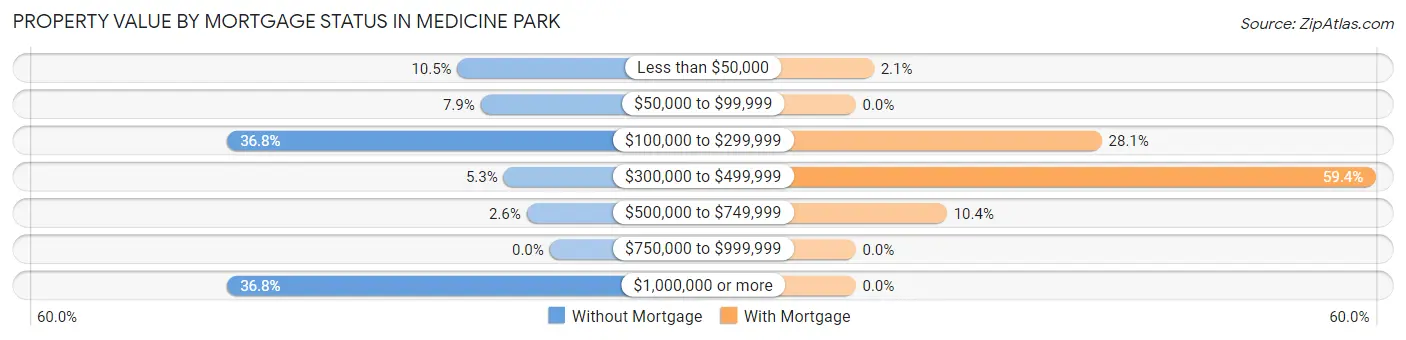
| Property Value | Without Mortgage | With Mortgage |
| Less than $50,000 | 4 (10.5%) | 2 (2.1%) |
| $50,000 to $99,999 | 3 (7.9%) | 0 (0.0%) |
| $100,000 to $299,999 | 14 (36.8%) | 27 (28.1%) |
| $300,000 to $499,999 | 2 (5.3%) | 57 (59.4%) |
| $500,000 to $749,999 | 1 (2.6%) | 10 (10.4%) |
| $750,000 to $999,999 | 0 (0.0%) | 0 (0.0%) |
| $1,000,000 or more | 14 (36.8%) | 0 (0.0%) |
| Total | 38 (100.0%) | 96 (100.0%) |
Household Income by Mortgage Status in Medicine Park
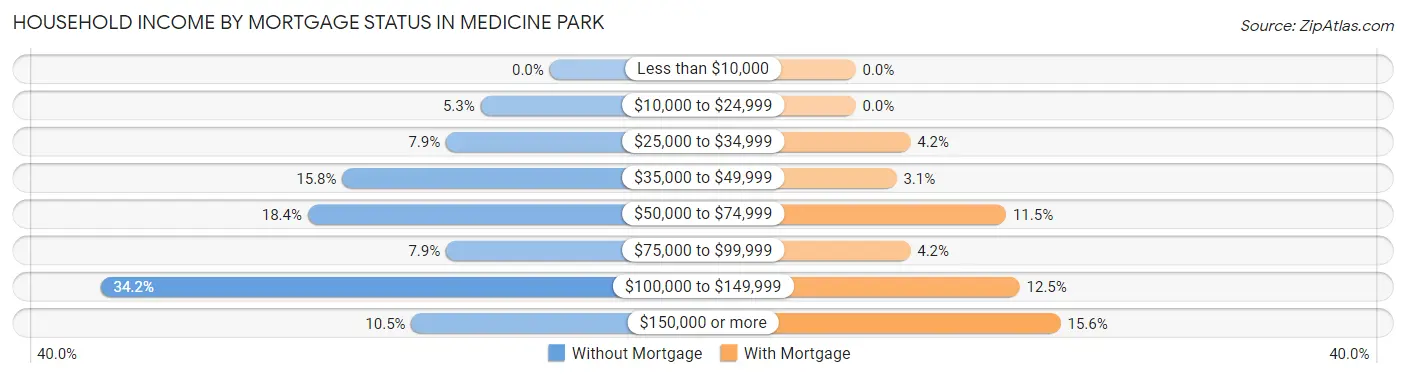
| Household Income | Without Mortgage | With Mortgage |
| Less than $10,000 | 0 (0.0%) | 0 (0.0%) |
| $10,000 to $24,999 | 2 (5.3%) | 0 (0.0%) |
| $25,000 to $34,999 | 3 (7.9%) | 4 (4.2%) |
| $35,000 to $49,999 | 6 (15.8%) | 3 (3.1%) |
| $50,000 to $74,999 | 7 (18.4%) | 11 (11.5%) |
| $75,000 to $99,999 | 3 (7.9%) | 4 (4.2%) |
| $100,000 to $149,999 | 13 (34.2%) | 12 (12.5%) |
| $150,000 or more | 4 (10.5%) | 15 (15.6%) |
| Total | 38 (100.0%) | 96 (100.0%) |
Property Value to Household Income Ratio in Medicine Park
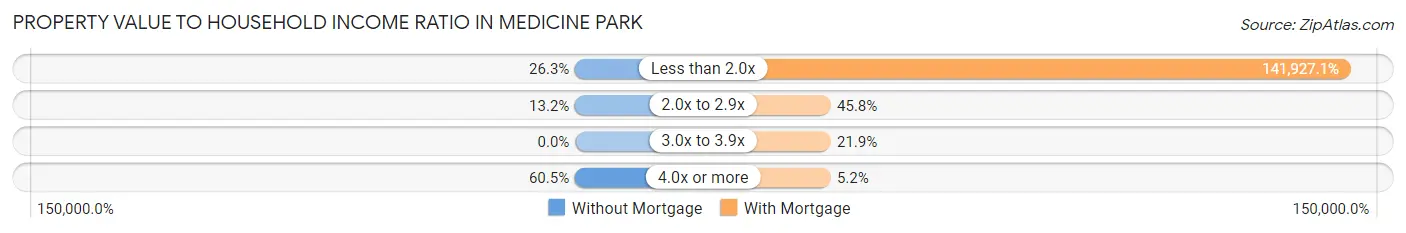
| Value-to-Income Ratio | Without Mortgage | With Mortgage |
| Less than 2.0x | 10 (26.3%) | 136,250 (141,927.1%) |
| 2.0x to 2.9x | 5 (13.2%) | 44 (45.8%) |
| 3.0x to 3.9x | 0 (0.0%) | 21 (21.9%) |
| 4.0x or more | 23 (60.5%) | 5 (5.2%) |
| Total | 38 (100.0%) | 96 (100.0%) |
Real Estate Taxes by Mortgage Status in Medicine Park
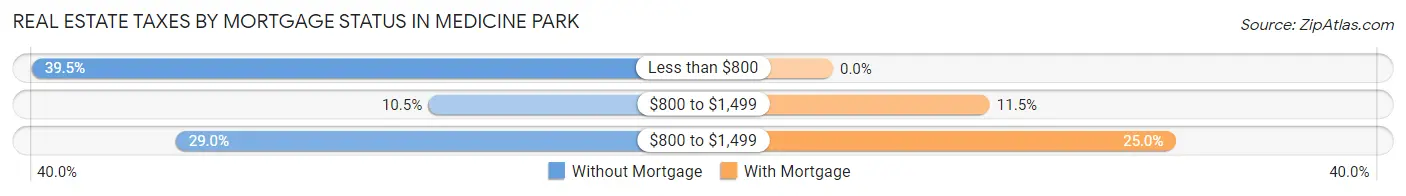
| Property Taxes | Without Mortgage | With Mortgage |
| Less than $800 | 15 (39.5%) | 0 (0.0%) |
| $800 to $1,499 | 4 (10.5%) | 11 (11.5%) |
| $800 to $1,499 | 11 (28.9%) | 24 (25.0%) |
| Total | 38 (100.0%) | 96 (100.0%) |
Health & Disability in Medicine Park
Health Insurance Coverage by Age in Medicine Park
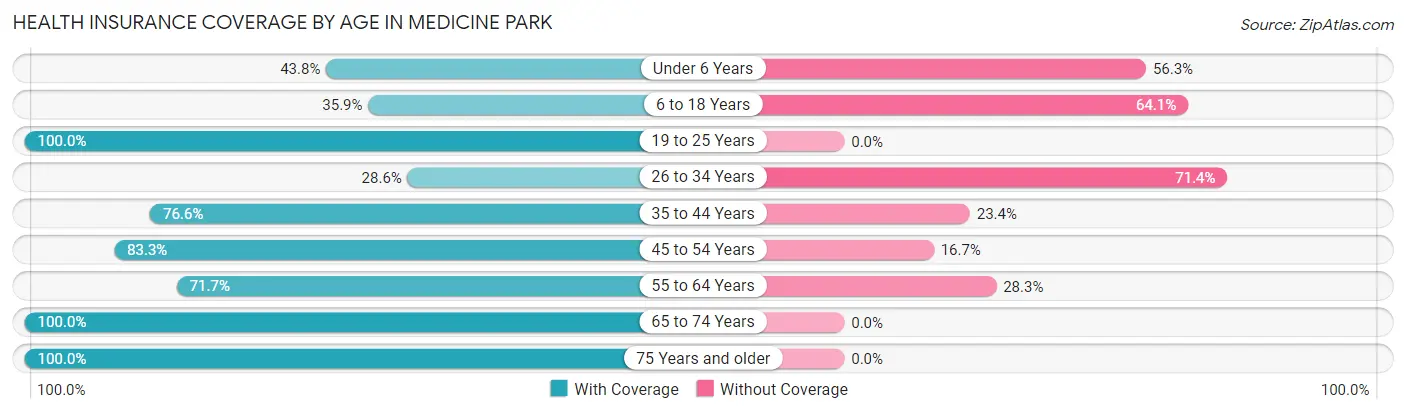
| Age Bracket | With Coverage | Without Coverage |
| Under 6 Years | 7 (43.8%) | 9 (56.2%) |
| 6 to 18 Years | 14 (35.9%) | 25 (64.1%) |
| 19 to 25 Years | 5 (100.0%) | 0 (0.0%) |
| 26 to 34 Years | 4 (28.6%) | 10 (71.4%) |
| 35 to 44 Years | 36 (76.6%) | 11 (23.4%) |
| 45 to 54 Years | 75 (83.3%) | 15 (16.7%) |
| 55 to 64 Years | 43 (71.7%) | 17 (28.3%) |
| 65 to 74 Years | 21 (100.0%) | 0 (0.0%) |
| 75 Years and older | 15 (100.0%) | 0 (0.0%) |
| Total | 220 (71.7%) | 87 (28.3%) |
Health Insurance Coverage by Citizenship Status in Medicine Park
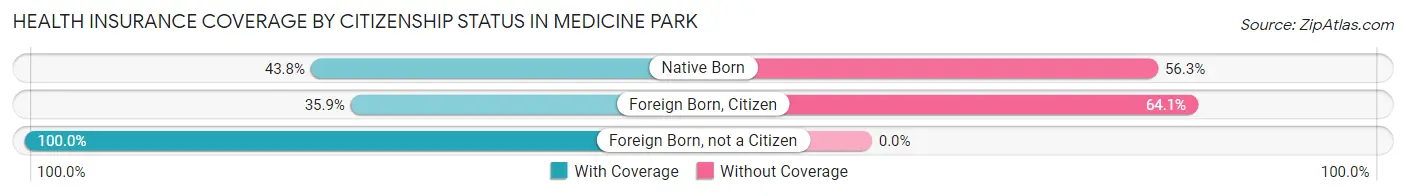
| Citizenship Status | With Coverage | Without Coverage |
| Native Born | 7 (43.8%) | 9 (56.2%) |
| Foreign Born, Citizen | 14 (35.9%) | 25 (64.1%) |
| Foreign Born, not a Citizen | 5 (100.0%) | 0 (0.0%) |
Health Insurance Coverage by Household Income in Medicine Park
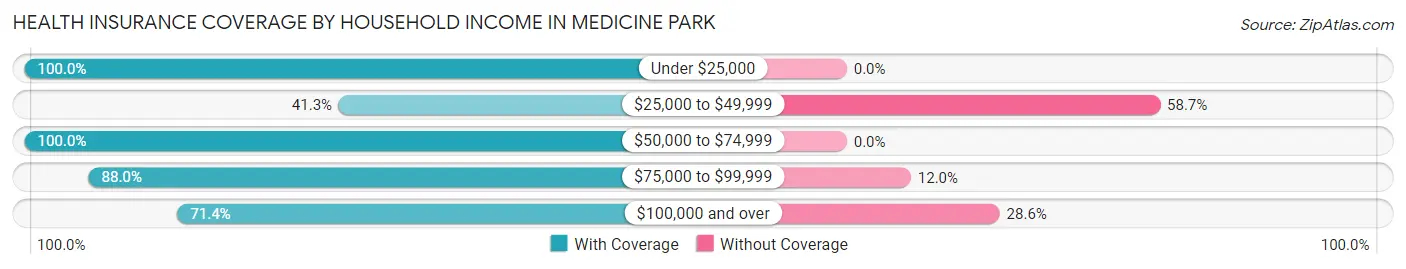
| Household Income | With Coverage | Without Coverage |
| Under $25,000 | 12 (100.0%) | 0 (0.0%) |
| $25,000 to $49,999 | 19 (41.3%) | 27 (58.7%) |
| $50,000 to $74,999 | 25 (100.0%) | 0 (0.0%) |
| $75,000 to $99,999 | 22 (88.0%) | 3 (12.0%) |
| $100,000 and over | 142 (71.4%) | 57 (28.6%) |
Public vs Private Health Insurance Coverage by Age in Medicine Park
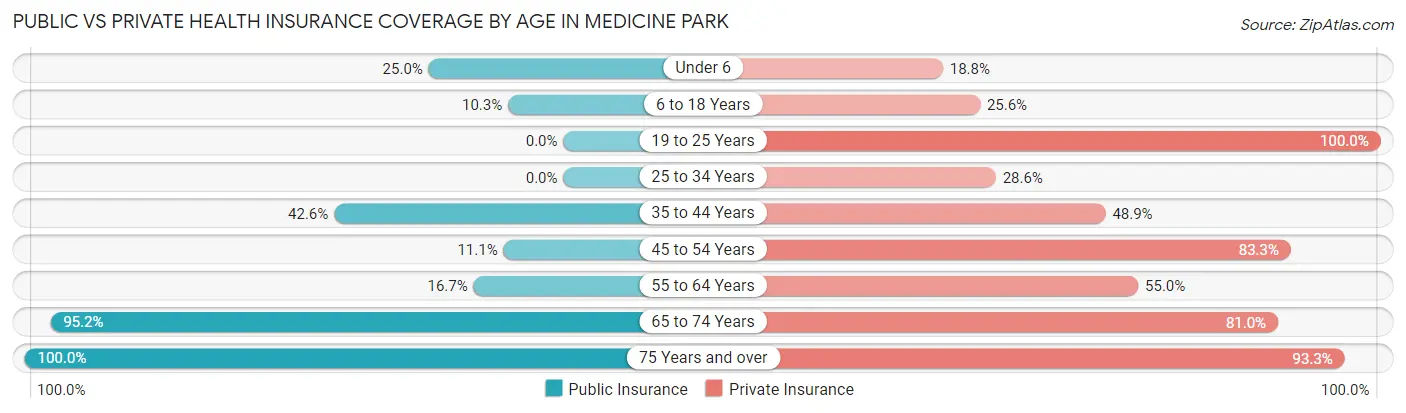
| Age Bracket | Public Insurance | Private Insurance |
| Under 6 | 4 (25.0%) | 3 (18.8%) |
| 6 to 18 Years | 4 (10.3%) | 10 (25.6%) |
| 19 to 25 Years | 0 (0.0%) | 5 (100.0%) |
| 25 to 34 Years | 0 (0.0%) | 4 (28.6%) |
| 35 to 44 Years | 20 (42.5%) | 23 (48.9%) |
| 45 to 54 Years | 10 (11.1%) | 75 (83.3%) |
| 55 to 64 Years | 10 (16.7%) | 33 (55.0%) |
| 65 to 74 Years | 20 (95.2%) | 17 (80.9%) |
| 75 Years and over | 15 (100.0%) | 14 (93.3%) |
| Total | 83 (27.0%) | 184 (59.9%) |
Disability Status by Sex by Age in Medicine Park
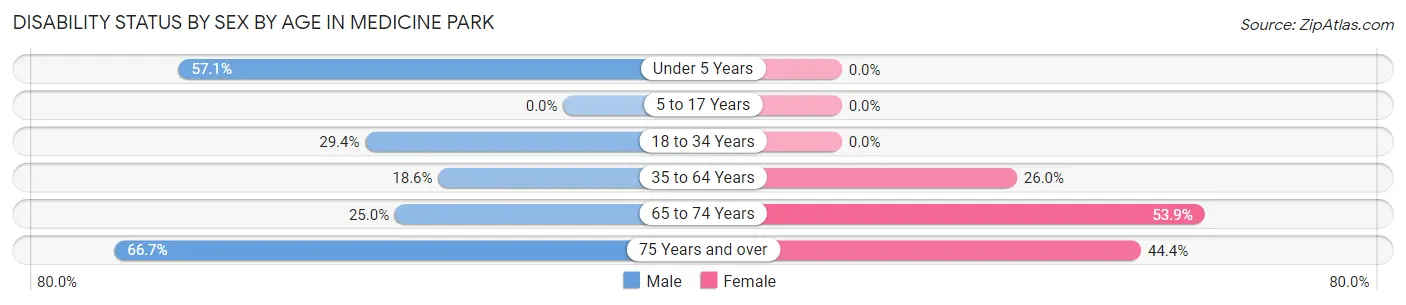
| Age Bracket | Male | Female |
| Under 5 Years | 4 (57.1%) | 0 (0.0%) |
| 5 to 17 Years | 0 (0.0%) | 0 (0.0%) |
| 18 to 34 Years | 5 (29.4%) | 0 (0.0%) |
| 35 to 64 Years | 18 (18.6%) | 26 (26.0%) |
| 65 to 74 Years | 2 (25.0%) | 7 (53.8%) |
| 75 Years and over | 4 (66.7%) | 4 (44.4%) |
Disability Class by Sex by Age in Medicine Park
Disability Class: Hearing Difficulty
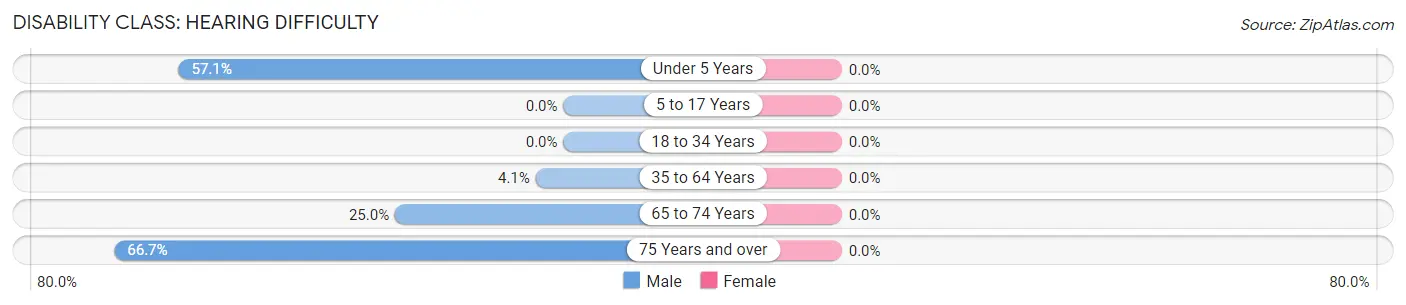
| Age Bracket | Male | Female |
| Under 5 Years | 4 (57.1%) | 0 (0.0%) |
| 5 to 17 Years | 0 (0.0%) | 0 (0.0%) |
| 18 to 34 Years | 0 (0.0%) | 0 (0.0%) |
| 35 to 64 Years | 4 (4.1%) | 0 (0.0%) |
| 65 to 74 Years | 2 (25.0%) | 0 (0.0%) |
| 75 Years and over | 4 (66.7%) | 0 (0.0%) |
Disability Class: Vision Difficulty
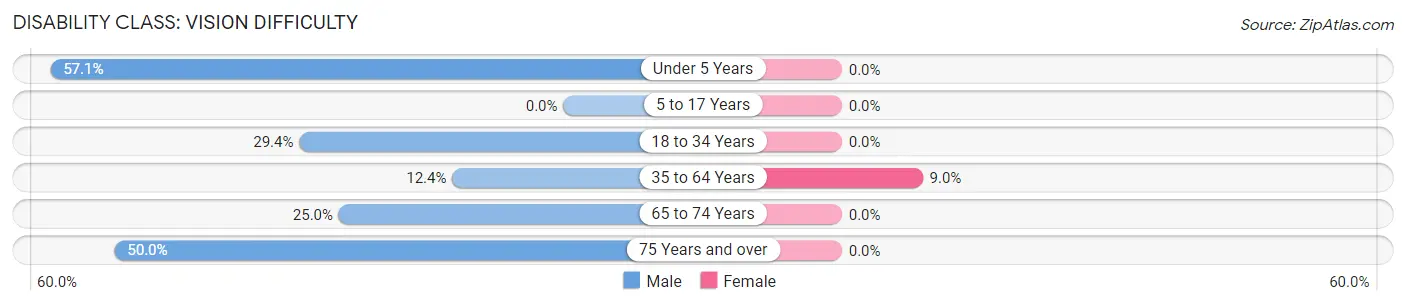
| Age Bracket | Male | Female |
| Under 5 Years | 4 (57.1%) | 0 (0.0%) |
| 5 to 17 Years | 0 (0.0%) | 0 (0.0%) |
| 18 to 34 Years | 5 (29.4%) | 0 (0.0%) |
| 35 to 64 Years | 12 (12.4%) | 9 (9.0%) |
| 65 to 74 Years | 2 (25.0%) | 0 (0.0%) |
| 75 Years and over | 3 (50.0%) | 0 (0.0%) |
Disability Class: Cognitive Difficulty
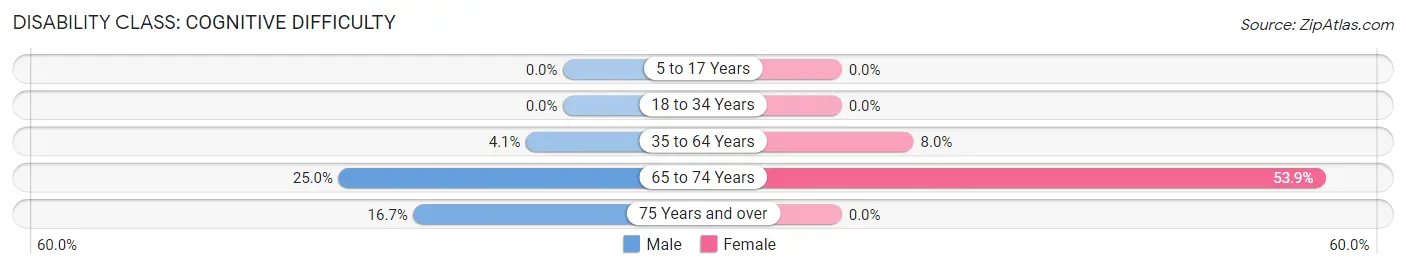
| Age Bracket | Male | Female |
| 5 to 17 Years | 0 (0.0%) | 0 (0.0%) |
| 18 to 34 Years | 0 (0.0%) | 0 (0.0%) |
| 35 to 64 Years | 4 (4.1%) | 8 (8.0%) |
| 65 to 74 Years | 2 (25.0%) | 7 (53.8%) |
| 75 Years and over | 1 (16.7%) | 0 (0.0%) |
Disability Class: Ambulatory Difficulty
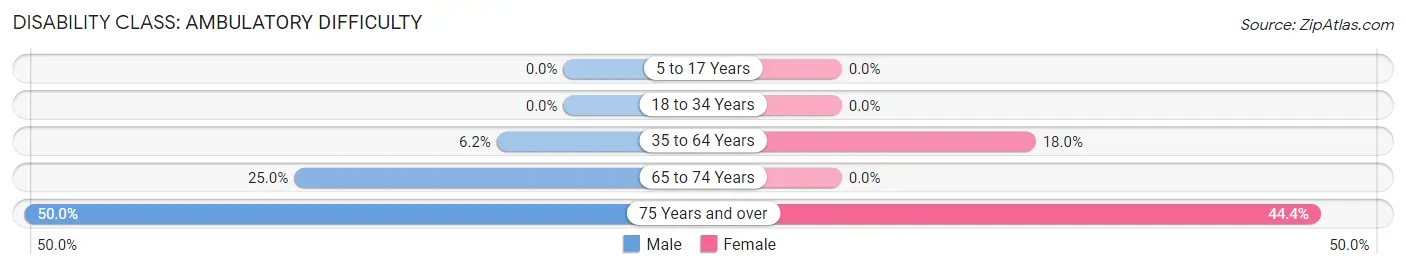
| Age Bracket | Male | Female |
| 5 to 17 Years | 0 (0.0%) | 0 (0.0%) |
| 18 to 34 Years | 0 (0.0%) | 0 (0.0%) |
| 35 to 64 Years | 6 (6.2%) | 18 (18.0%) |
| 65 to 74 Years | 2 (25.0%) | 0 (0.0%) |
| 75 Years and over | 3 (50.0%) | 4 (44.4%) |
Disability Class: Self-Care Difficulty
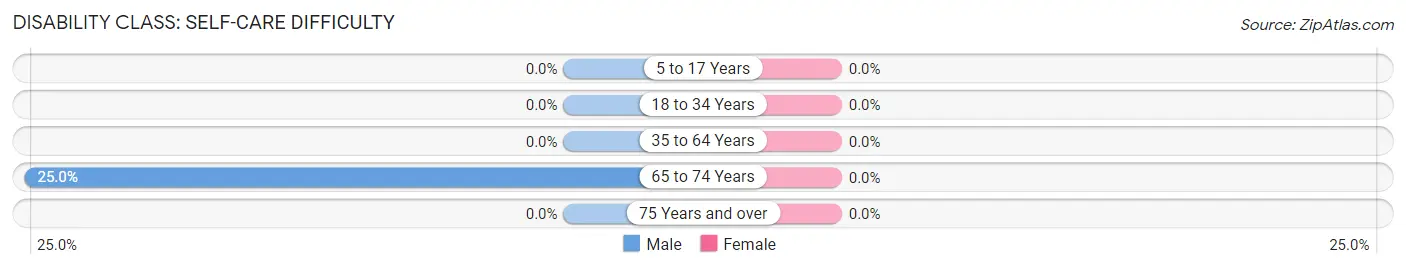
| Age Bracket | Male | Female |
| 5 to 17 Years | 0 (0.0%) | 0 (0.0%) |
| 18 to 34 Years | 0 (0.0%) | 0 (0.0%) |
| 35 to 64 Years | 0 (0.0%) | 0 (0.0%) |
| 65 to 74 Years | 2 (25.0%) | 0 (0.0%) |
| 75 Years and over | 0 (0.0%) | 0 (0.0%) |
Technology Access in Medicine Park
Computing Device Access in Medicine Park
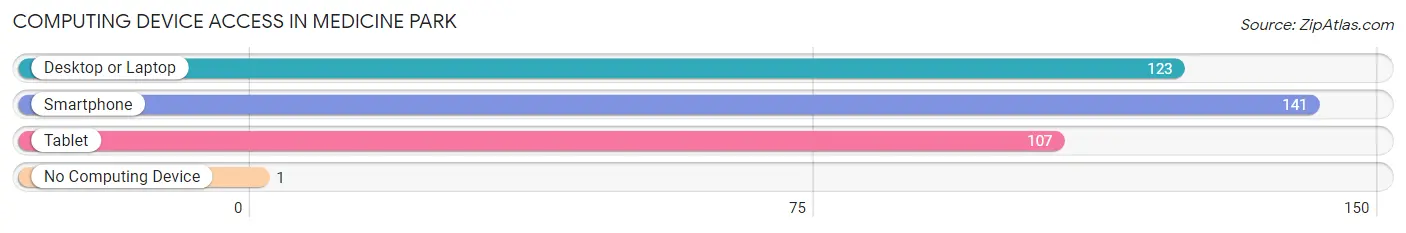
| Device Type | # Households | % Households |
| Desktop or Laptop | 123 | 79.9% |
| Smartphone | 141 | 91.6% |
| Tablet | 107 | 69.5% |
| No Computing Device | 1 | 0.6% |
| Total | 154 | 100.0% |
Internet Access in Medicine Park
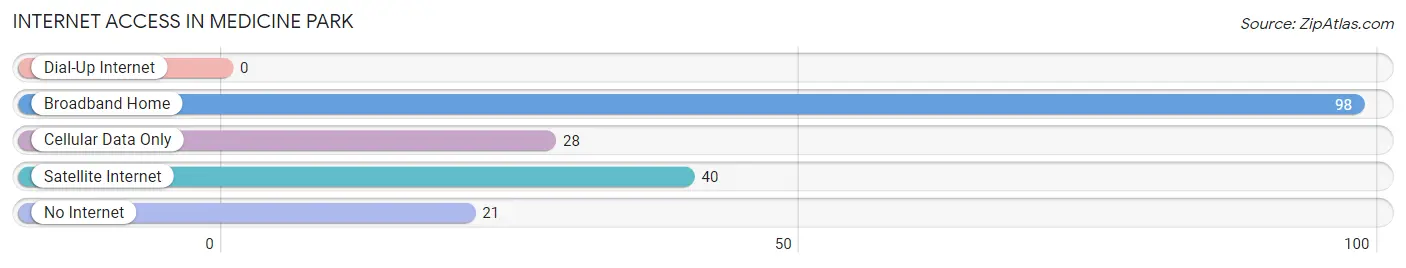
| Internet Type | # Households | % Households |
| Dial-Up Internet | 0 | 0.0% |
| Broadband Home | 98 | 63.6% |
| Cellular Data Only | 28 | 18.2% |
| Satellite Internet | 40 | 26.0% |
| No Internet | 21 | 13.6% |
| Total | 154 | 100.0% |
Medicine Park Summary
Medicine Park is a small town located in Comanche County, Oklahoma, United States. It is situated in the Wichita Mountains, near the city of Lawton. The town was founded in 1908 and is the oldest tourist resort in Oklahoma. It is known for its cobblestone streets, historic buildings, and natural beauty.
History
Medicine Park was founded in 1908 by the Kiowa-Comanche-Apache Tribes. The town was named after the nearby Medicine Creek, which was believed to have healing powers. The town was originally a resort destination for the tribes, and it quickly became a popular tourist destination for people from all over the country.
In the early 1900s, the town was home to a variety of businesses, including a hotel, a general store, a post office, a bank, and a saloon. The town also had a school, a church, and a movie theater.
In the 1920s, the town was home to a variety of celebrities, including Will Rogers, who often visited the town. The town was also home to a variety of famous musicians, including Bob Wills and the Texas Playboys.
In the 1930s, the town was hit hard by the Great Depression. Many of the businesses in the town closed, and the population decreased significantly.
In the 1940s, the town was revitalized by the construction of a dam on Medicine Creek. The dam created a lake, which became a popular destination for fishing and swimming.
In the 1950s, the town was home to a variety of celebrities, including Elvis Presley, who often visited the town. The town was also home to a variety of famous musicians, including Roy Orbison and Johnny Cash.
In the 1960s, the town was revitalized by the construction of a new highway, which connected the town to Lawton. The highway made the town more accessible to tourists, and the population began to increase.
In the 1970s, the town was home to a variety of celebrities, including Willie Nelson, who often visited the town. The town was also home to a variety of famous musicians, including Waylon Jennings and Merle Haggard.
In the 1980s, the town was revitalized by the construction of a new golf course. The golf course became a popular destination for golfers from all over the country.
In the 1990s, the town was revitalized by the construction of a new casino. The casino became a popular destination for gamblers from all over the country.
Geography
Medicine Park is located in Comanche County, Oklahoma, United States. It is situated in the Wichita Mountains, near the city of Lawton. The town is located at an elevation of 1,400 feet (427 m).
The town is surrounded by the Wichita Mountains Wildlife Refuge, which is home to a variety of wildlife, including bison, elk, and deer. The refuge is also home to a variety of birds, including bald eagles and golden eagles.
Economy
The economy of Medicine Park is largely based on tourism. The town is home to a variety of attractions, including the Medicine Park Aquarium and the Medicine Park Wildlife Refuge. The town is also home to a variety of restaurants, shops, and hotels.
The town is also home to a variety of businesses, including a bank, a post office, and a general store. The town is also home to a variety of manufacturing companies, including a furniture factory and a metal fabrication plant.
Demographics
As of the 2010 census, the population of Medicine Park was 1,053. The median age of the population was 44.7 years. The median household income was $37,917. The median home value was $90,000.
The town is predominantly white, with 91.3% of the population identifying as white. The town is also home to a variety of other ethnicities, including African American (3.2%), Native American (2.2%), and Asian (1.2%).
Conclusion
Medicine Park is a small town located in Comanche County, Oklahoma, United States. It is situated in the Wichita Mountains, near the city of Lawton. The town was founded in 1908 and is the oldest tourist resort in Oklahoma. It is known for its cobblestone streets, historic buildings, and natural beauty. The economy of Medicine Park is largely based on tourism, and the town is home to a variety of attractions, businesses, and restaurants. As of the 2010 census, the population of Medicine Park was 1,053. The town is predominantly white, with 91.3% of the population identifying as white.
Common Questions
What is Per Capita Income in Medicine Park?
Per Capita income in Medicine Park is $70,329.
What is the Median Family Income in Medicine Park?
Median Family Income in Medicine Park is $171,250.
What is the Median Household income in Medicine Park?
Median Household Income in Medicine Park is $111,071.
What is Inequality or Gini Index in Medicine Park?
Inequality or Gini Index in Medicine Park is 0.43.
What is the Total Population of Medicine Park?
Total Population of Medicine Park is 319.
What is the Total Male Population of Medicine Park?
Total Male Population of Medicine Park is 147.
What is the Total Female Population of Medicine Park?
Total Female Population of Medicine Park is 172.
What is the Ratio of Males per 100 Females in Medicine Park?
There are 85.47 Males per 100 Females in Medicine Park.
What is the Ratio of Females per 100 Males in Medicine Park?
There are 117.01 Females per 100 Males in Medicine Park.
What is the Median Population Age in Medicine Park?
Median Population Age in Medicine Park is 47.8 Years.
What is the Average Family Size in Medicine Park
Average Family Size in Medicine Park is 2.4 People.
What is the Average Household Size in Medicine Park
Average Household Size in Medicine Park is 2.1 People.
How Large is the Labor Force in Medicine Park?
There are 184 People in the Labor Forcein in Medicine Park.
What is the Percentage of People in the Labor Force in Medicine Park?
69.4% of People are in the Labor Force in Medicine Park.
What is the Unemployment Rate in Medicine Park?
Unemployment Rate in Medicine Park is 3.5%.