Mcloud, OK Map & Demographics
Mcloud Map
Mcloud Overview
$22,172
PER CAPITA INCOME
$83,336
AVG FAMILY INCOME
$67,207
AVG HOUSEHOLD INCOME
54.8%
WAGE / INCOME GAP [ % ]
45.2¢/ $1
WAGE / INCOME GAP [ $ ]
0.43
INEQUALITY / GINI INDEX
4,394
TOTAL POPULATION
1,397
MALE POPULATION
2,997
FEMALE POPULATION
46.61
MALES / 100 FEMALES
214.53
FEMALES / 100 MALES
40.8
MEDIAN AGE
3.2
AVG FAMILY SIZE
2.6
AVG HOUSEHOLD SIZE
1,430
LABOR FORCE [ PEOPLE ]
37.9%
PERCENT IN LABOR FORCE
3.7%
UNEMPLOYMENT RATE
Mcloud Zip Codes
Mcloud Area Codes
Income in Mcloud
Income Overview in Mcloud
Per Capita Income in Mcloud is $22,172, while median incomes of families and households are $83,336 and $67,207 respectively.
| Characteristic | Number | Measure |
| Per Capita Income | 4,394 | $22,172 |
| Median Family Income | 863 | $83,336 |
| Mean Family Income | 863 | $91,524 |
| Median Household Income | 1,187 | $67,207 |
| Mean Household Income | 1,187 | $77,087 |
| Income Deficit | 863 | $0 |
| Wage / Income Gap (%) | 4,394 | 54.78% |
| Wage / Income Gap ($) | 4,394 | 45.22¢ per $1 |
| Gini / Inequality Index | 4,394 | 0.43 |
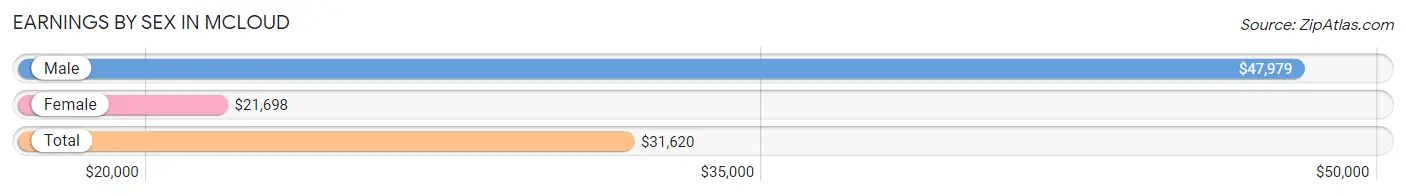
Earnings by Sex in Mcloud
Average Earnings in Mcloud are $31,620, $47,979 for men and $21,698 for women, a difference of 54.8%.
| Sex | Number | Average Earnings |
| Male | 657 (37.9%) | $47,979 |
| Female | 1,075 (62.1%) | $21,698 |
| Total | 1,732 (100.0%) | $31,620 |
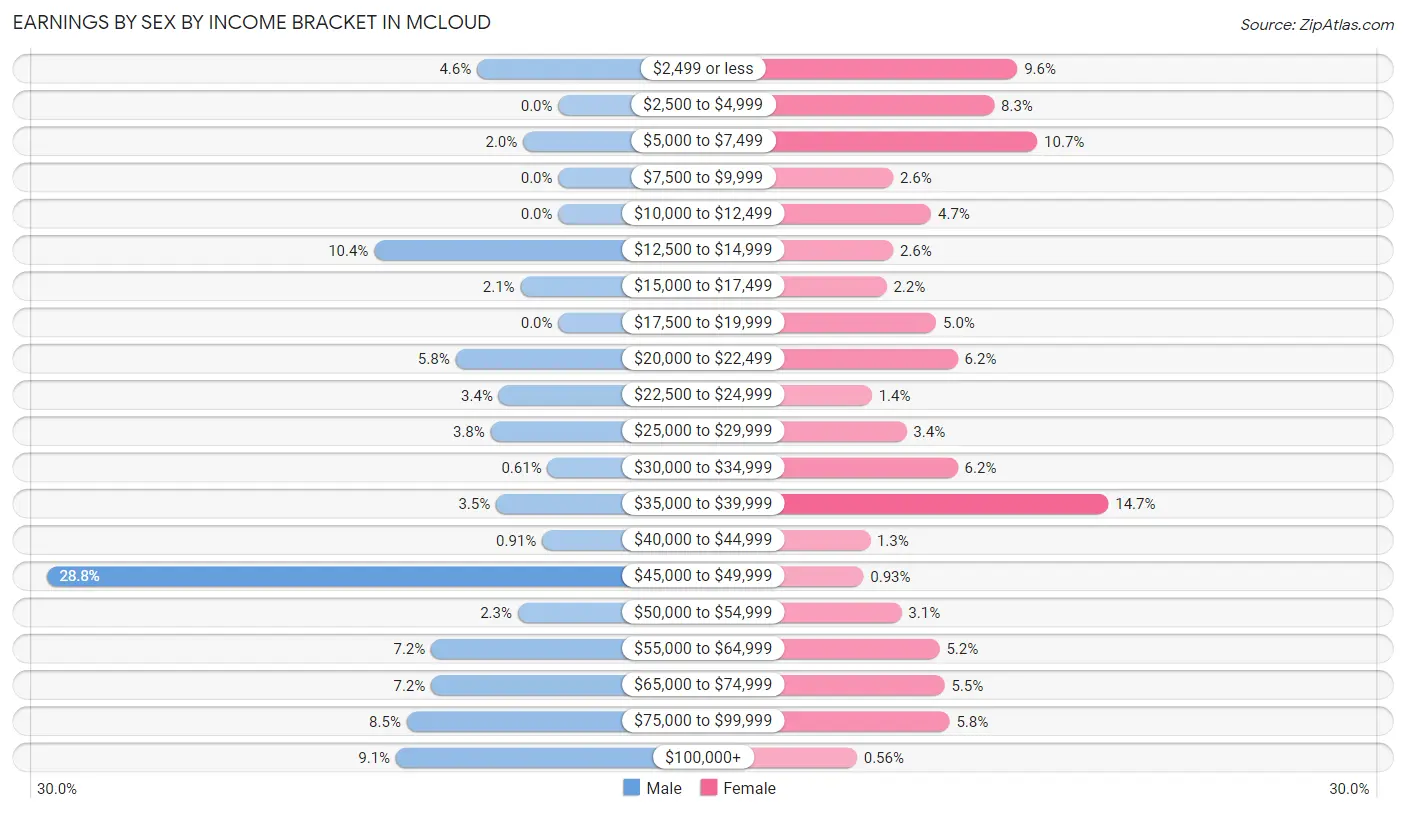
Earnings by Sex by Income Bracket in Mcloud
The most common earnings brackets in Mcloud are $45,000 to $49,999 for men (189 | 28.8%) and $35,000 to $39,999 for women (158 | 14.7%).
| Income | Male | Female |
| $2,499 or less | 30 (4.6%) | 103 (9.6%) |
| $2,500 to $4,999 | 0 (0.0%) | 89 (8.3%) |
| $5,000 to $7,499 | 13 (2.0%) | 115 (10.7%) |
| $7,500 to $9,999 | 0 (0.0%) | 28 (2.6%) |
| $10,000 to $12,499 | 0 (0.0%) | 51 (4.7%) |
| $12,500 to $14,999 | 68 (10.3%) | 28 (2.6%) |
| $15,000 to $17,499 | 14 (2.1%) | 24 (2.2%) |
| $17,500 to $19,999 | 0 (0.0%) | 54 (5.0%) |
| $20,000 to $22,499 | 38 (5.8%) | 67 (6.2%) |
| $22,500 to $24,999 | 22 (3.4%) | 15 (1.4%) |
| $25,000 to $29,999 | 25 (3.8%) | 36 (3.4%) |
| $30,000 to $34,999 | 4 (0.6%) | 67 (6.2%) |
| $35,000 to $39,999 | 23 (3.5%) | 158 (14.7%) |
| $40,000 to $44,999 | 6 (0.9%) | 14 (1.3%) |
| $45,000 to $49,999 | 189 (28.8%) | 10 (0.9%) |
| $50,000 to $54,999 | 15 (2.3%) | 33 (3.1%) |
| $55,000 to $64,999 | 47 (7.1%) | 56 (5.2%) |
| $65,000 to $74,999 | 47 (7.1%) | 59 (5.5%) |
| $75,000 to $99,999 | 56 (8.5%) | 62 (5.8%) |
| $100,000+ | 60 (9.1%) | 6 (0.6%) |
| Total | 657 (100.0%) | 1,075 (100.0%) |
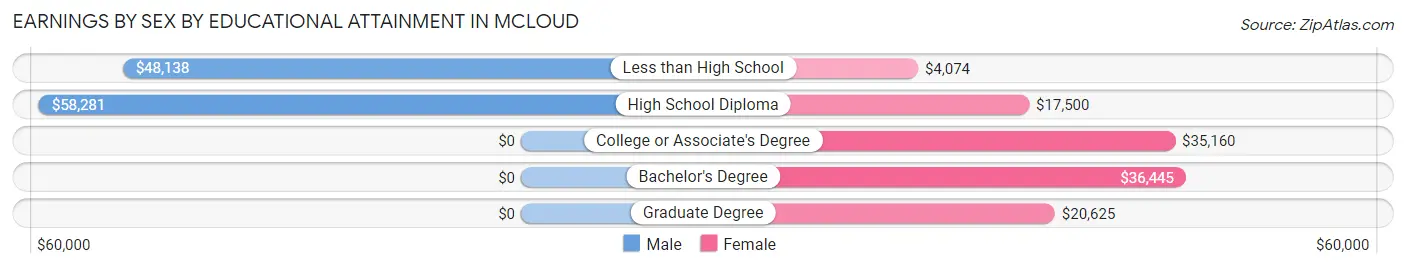
Earnings by Sex by Educational Attainment in Mcloud
Average earnings in Mcloud are $48,047 for men and $31,549 for women, a difference of 34.3%. Men with an educational attainment of high school diploma enjoy the highest average annual earnings of $58,281, while those with less than high school education earn the least with $48,138. Women with an educational attainment of bachelor's degree earn the most with the average annual earnings of $36,445, while those with less than high school education have the smallest earnings of $4,074.
| Educational Attainment | Male Income | Female Income |
| Less than High School | $48,138 | $4,074 |
| High School Diploma | $58,281 | $17,500 |
| College or Associate's Degree | - | - |
| Bachelor's Degree | - | - |
| Graduate Degree | - | - |
| Total | $48,047 | $31,549 |
Family Income in Mcloud
Family Income Brackets in Mcloud
According to the Mcloud family income data, there are 248 families falling into the $75,000 to $99,999 income range, which is the most common income bracket and makes up 28.7% of all families. Conversely, the $25,000 to $34,999 income bracket is the least frequent group with only 13 families (1.5%) belonging to this category.
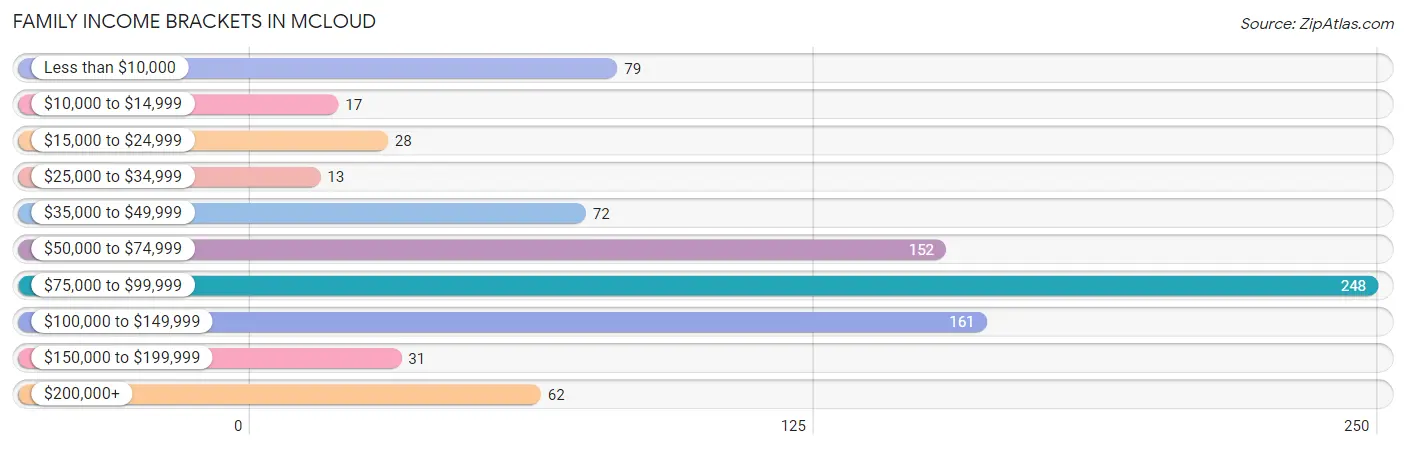
| Income Bracket | # Families | % Families |
| Less than $10,000 | 79 | 9.2% |
| $10,000 to $14,999 | 17 | 2.0% |
| $15,000 to $24,999 | 28 | 3.2% |
| $25,000 to $34,999 | 13 | 1.5% |
| $35,000 to $49,999 | 72 | 8.3% |
| $50,000 to $74,999 | 152 | 17.6% |
| $75,000 to $99,999 | 248 | 28.7% |
| $100,000 to $149,999 | 161 | 18.7% |
| $150,000 to $199,999 | 31 | 3.6% |
| $200,000+ | 62 | 7.2% |
Family Income by Famaliy Size in Mcloud
3-person families (117 | 13.6%) account for the highest median family income in Mcloud with $112,986 per family, while 2-person families (434 | 50.3%) have the highest median income of $41,453 per family member.
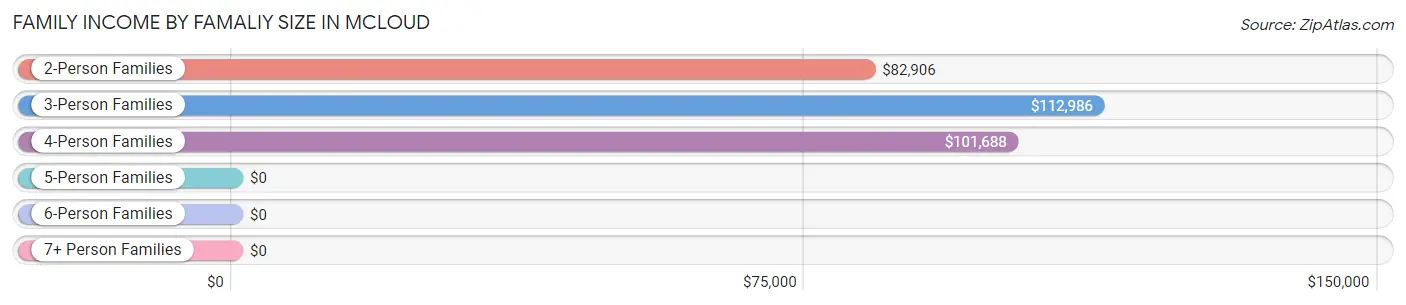
| Income Bracket | # Families | Median Income |
| 2-Person Families | 434 (50.3%) | $82,906 |
| 3-Person Families | 117 (13.6%) | $112,986 |
| 4-Person Families | 179 (20.7%) | $101,688 |
| 5-Person Families | 133 (15.4%) | $0 |
| 6-Person Families | 0 (0.0%) | $0 |
| 7+ Person Families | 0 (0.0%) | $0 |
| Total | 863 (100.0%) | $83,336 |
Family Income by Number of Earners in Mcloud
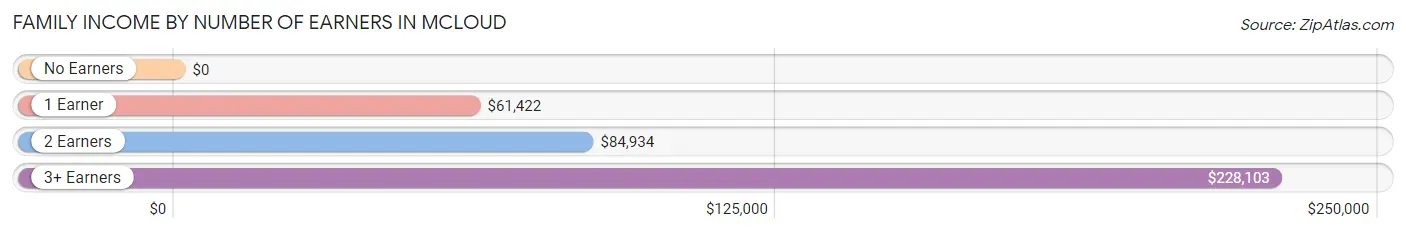
| Number of Earners | # Families | Median Income |
| No Earners | 169 (19.6%) | $0 |
| 1 Earner | 221 (25.6%) | $61,422 |
| 2 Earners | 417 (48.3%) | $84,934 |
| 3+ Earners | 56 (6.5%) | $228,103 |
| Total | 863 (100.0%) | $83,336 |
Household Income in Mcloud
Household Income Brackets in Mcloud
With 274 households falling in the category, the $75,000 to $99,999 income range is the most frequent in Mcloud, accounting for 23.1% of all households. In contrast, only 31 households (2.6%) fall into the $150,000 to $199,999 income bracket, making it the least populous group.
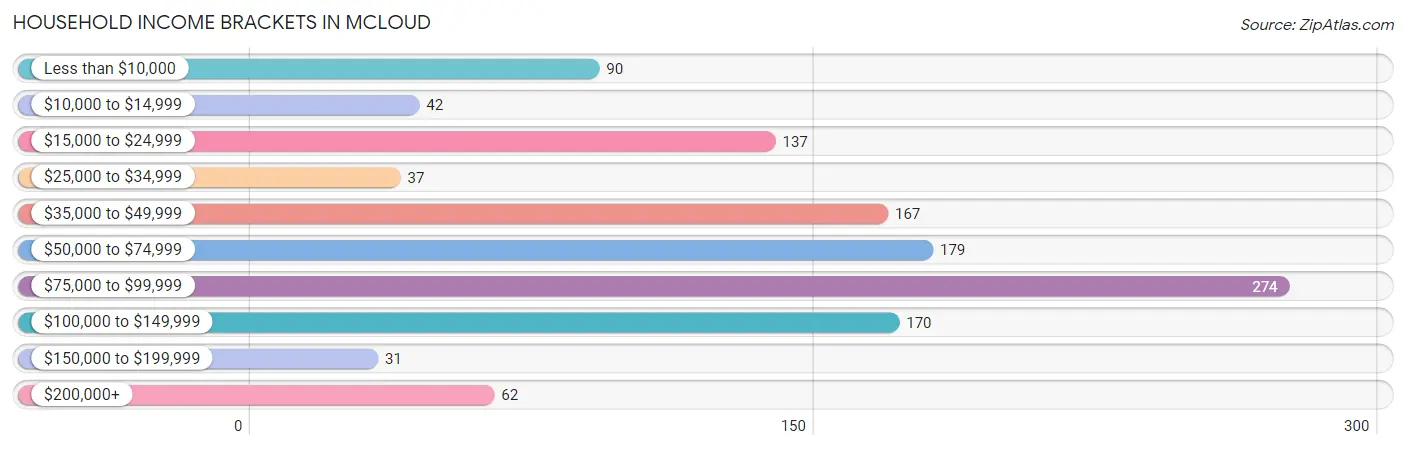
| Income Bracket | # Households | % Households |
| Less than $10,000 | 90 | 7.6% |
| $10,000 to $14,999 | 42 | 3.5% |
| $15,000 to $24,999 | 137 | 11.5% |
| $25,000 to $34,999 | 37 | 3.1% |
| $35,000 to $49,999 | 167 | 14.1% |
| $50,000 to $74,999 | 179 | 15.1% |
| $75,000 to $99,999 | 274 | 23.1% |
| $100,000 to $149,999 | 170 | 14.3% |
| $150,000 to $199,999 | 31 | 2.6% |
| $200,000+ | 62 | 5.2% |
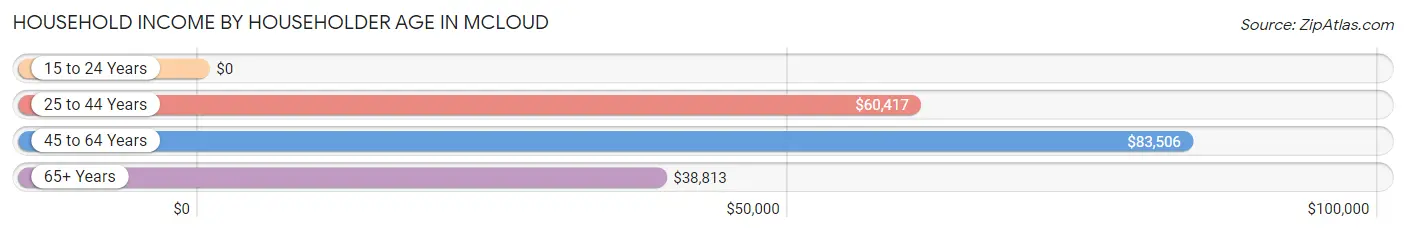
Household Income by Householder Age in Mcloud
The median household income in Mcloud is $67,207, with the highest median household income of $83,506 found in the 45 to 64 years age bracket for the primary householder. A total of 555 households (46.8%) fall into this category. Meanwhile, the 15 to 24 years age bracket for the primary householder has the lowest median household income of $0, with 29 households (2.4%) in this group.
| Income Bracket | # Households | Median Income |
| 15 to 24 Years | 29 (2.4%) | $0 |
| 25 to 44 Years | 307 (25.9%) | $60,417 |
| 45 to 64 Years | 555 (46.8%) | $83,506 |
| 65+ Years | 296 (24.9%) | $38,813 |
| Total | 1,187 (100.0%) | $67,207 |
Poverty in Mcloud
Income Below Poverty by Sex and Age in Mcloud
With 13.6% poverty level for males and 14.3% for females among the residents of Mcloud, 6 to 11 year old males and 6 to 11 year old females are the most vulnerable to poverty, with 102 males (48.3%) and 74 females (51.0%) in their respective age groups living below the poverty level.
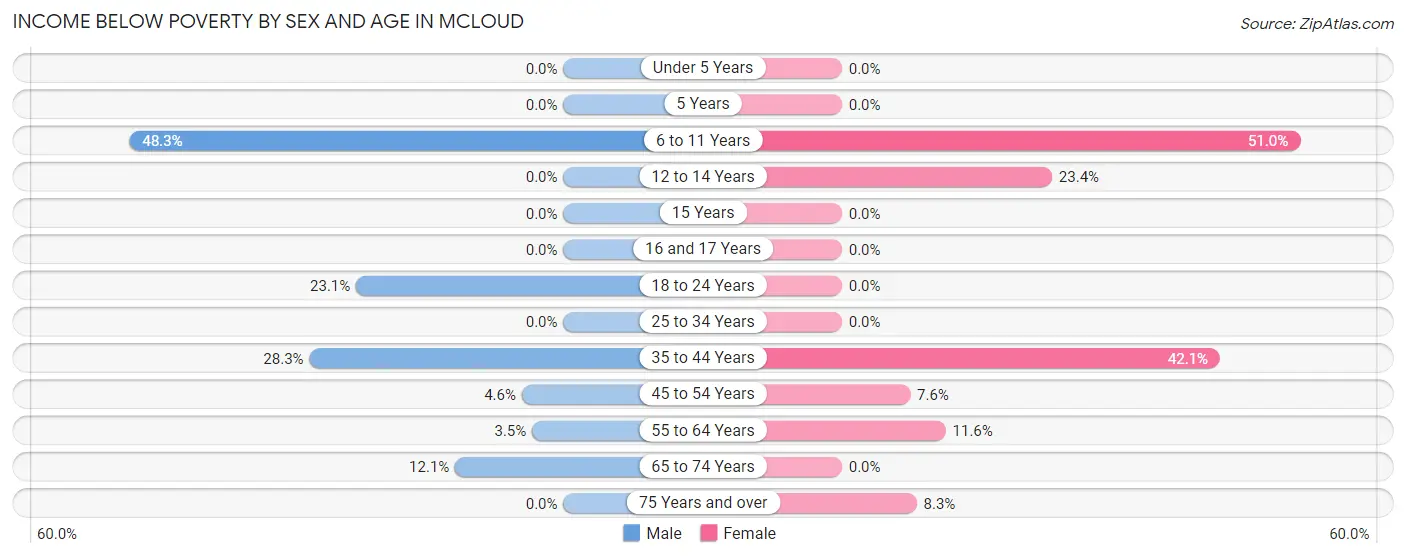
| Age Bracket | Male | Female |
| Under 5 Years | 0 (0.0%) | 0 (0.0%) |
| 5 Years | 0 (0.0%) | 0 (0.0%) |
| 6 to 11 Years | 102 (48.3%) | 74 (51.0%) |
| 12 to 14 Years | 0 (0.0%) | 11 (23.4%) |
| 15 Years | 0 (0.0%) | 0 (0.0%) |
| 16 and 17 Years | 0 (0.0%) | 0 (0.0%) |
| 18 to 24 Years | 9 (23.1%) | 0 (0.0%) |
| 25 to 34 Years | 0 (0.0%) | 0 (0.0%) |
| 35 to 44 Years | 41 (28.3%) | 104 (42.1%) |
| 45 to 54 Years | 15 (4.6%) | 30 (7.6%) |
| 55 to 64 Years | 8 (3.5%) | 26 (11.6%) |
| 65 to 74 Years | 10 (12.0%) | 0 (0.0%) |
| 75 Years and over | 0 (0.0%) | 7 (8.3%) |
| Total | 185 (13.6%) | 252 (14.3%) |
Income Above Poverty by Sex and Age in Mcloud
According to the poverty statistics in Mcloud, males aged under 5 years and females aged under 5 years are the age groups that are most secure financially, with 100.0% of males and 100.0% of females in these age groups living above the poverty line.
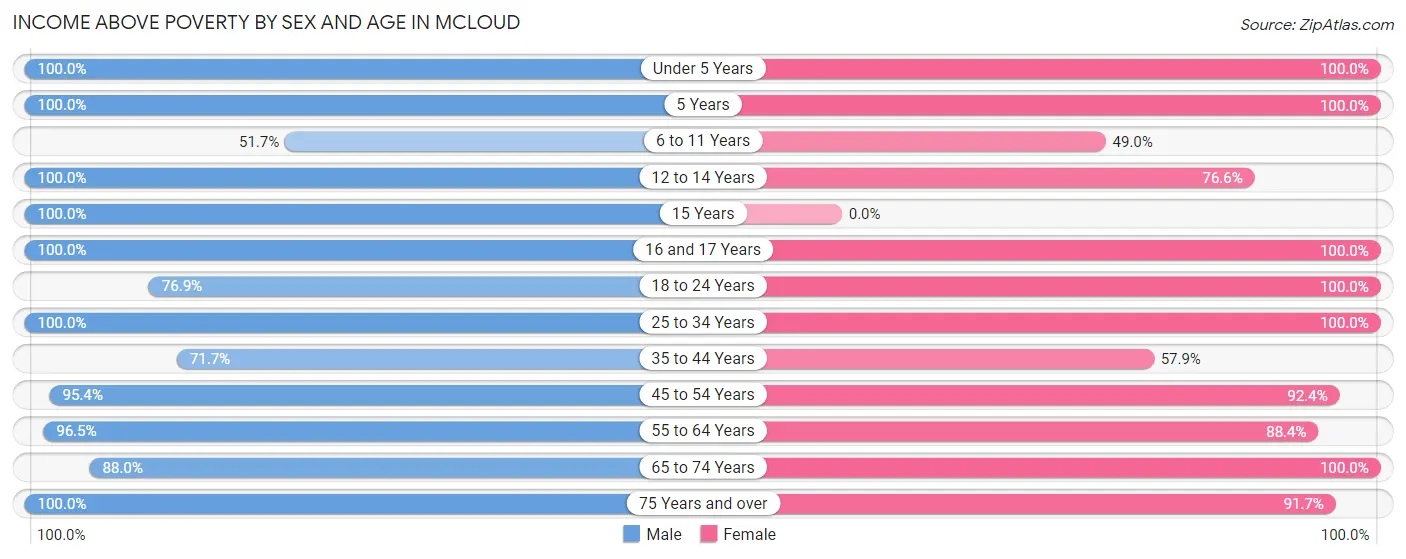
| Age Bracket | Male | Female |
| Under 5 Years | 83 (100.0%) | 68 (100.0%) |
| 5 Years | 6 (100.0%) | 8 (100.0%) |
| 6 to 11 Years | 109 (51.7%) | 71 (49.0%) |
| 12 to 14 Years | 32 (100.0%) | 36 (76.6%) |
| 15 Years | 22 (100.0%) | 0 (0.0%) |
| 16 and 17 Years | 22 (100.0%) | 79 (100.0%) |
| 18 to 24 Years | 30 (76.9%) | 124 (100.0%) |
| 25 to 34 Years | 72 (100.0%) | 177 (100.0%) |
| 35 to 44 Years | 104 (71.7%) | 143 (57.9%) |
| 45 to 54 Years | 309 (95.4%) | 364 (92.4%) |
| 55 to 64 Years | 222 (96.5%) | 199 (88.4%) |
| 65 to 74 Years | 73 (87.9%) | 169 (100.0%) |
| 75 Years and over | 91 (100.0%) | 77 (91.7%) |
| Total | 1,175 (86.4%) | 1,515 (85.7%) |
Income Below Poverty Among Married-Couple Families in Mcloud
The poverty statistics for married-couple families in Mcloud show that 6.7% or 45 of the total 675 families live below the poverty line. Families with 1 or 2 children have the highest poverty rate of 11.0%, comprising of 20 families. On the other hand, families with 3 or 4 children have the lowest poverty rate of 0.0%, which includes 0 families.
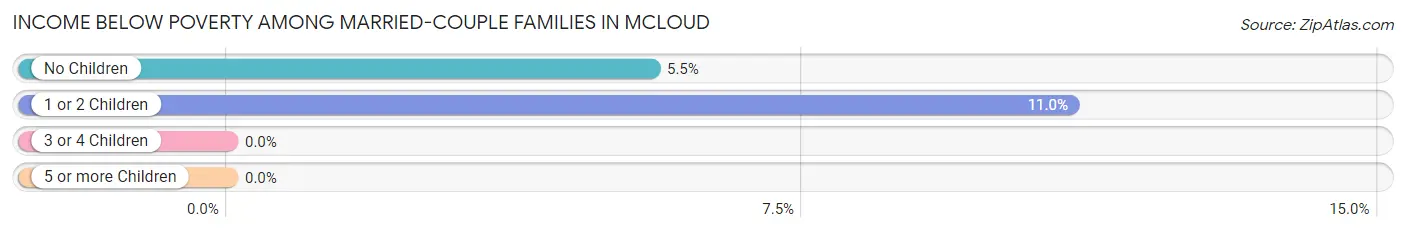
| Children | Above Poverty | Below Poverty |
| No Children | 429 (94.5%) | 25 (5.5%) |
| 1 or 2 Children | 162 (89.0%) | 20 (11.0%) |
| 3 or 4 Children | 39 (100.0%) | 0 (0.0%) |
| 5 or more Children | 0 (0.0%) | 0 (0.0%) |
| Total | 630 (93.3%) | 45 (6.7%) |
Income Below Poverty Among Single-Parent Households in Mcloud
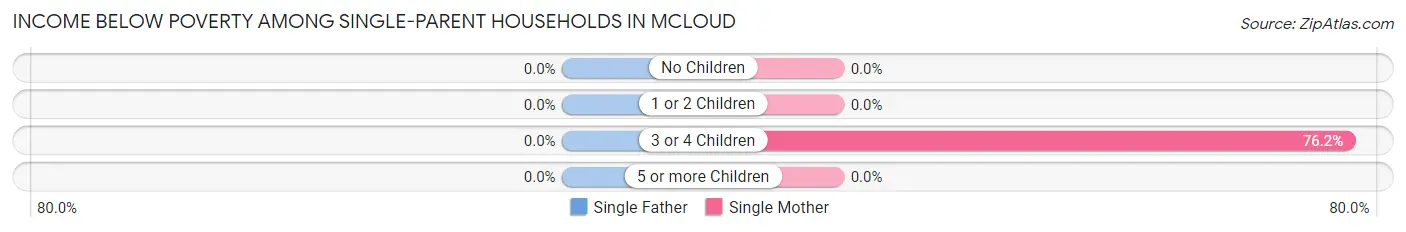
| Children | Single Father | Single Mother |
| No Children | 0 (0.0%) | 0 (0.0%) |
| 1 or 2 Children | 0 (0.0%) | 0 (0.0%) |
| 3 or 4 Children | 0 (0.0%) | 64 (76.2%) |
| 5 or more Children | 0 (0.0%) | 0 (0.0%) |
| Total | 0 (0.0%) | 64 (37.9%) |
Income Below Poverty Among Married-Couple vs Single-Parent Households in Mcloud
The poverty data for Mcloud shows that 45 of the married-couple family households (6.7%) and 64 of the single-parent households (34.0%) are living below the poverty level. Within the married-couple family households, those with 1 or 2 children have the highest poverty rate, with 20 households (11.0%) falling below the poverty line. Among the single-parent households, those with 3 or 4 children have the highest poverty rate, with 64 household (76.2%) living below poverty.
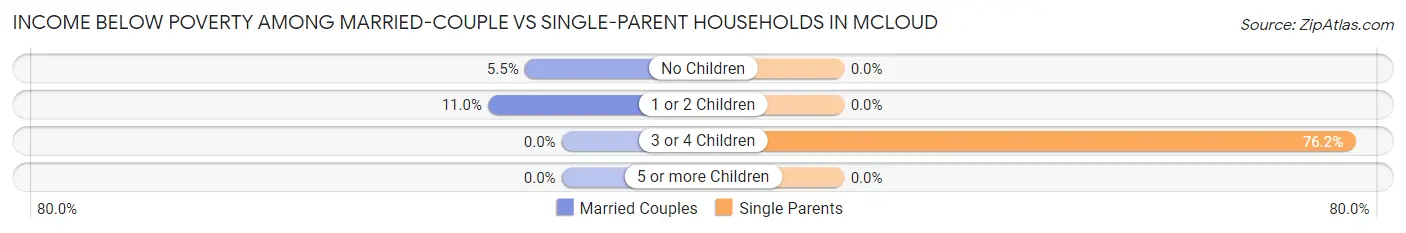
| Children | Married-Couple Families | Single-Parent Households |
| No Children | 25 (5.5%) | 0 (0.0%) |
| 1 or 2 Children | 20 (11.0%) | 0 (0.0%) |
| 3 or 4 Children | 0 (0.0%) | 64 (76.2%) |
| 5 or more Children | 0 (0.0%) | 0 (0.0%) |
| Total | 45 (6.7%) | 64 (34.0%) |
Race in Mcloud
The most populous races in Mcloud are White / Caucasian (2,813 | 64.0%), Native / Alaskan (734 | 16.7%), and Two or more Races (544 | 12.4%).
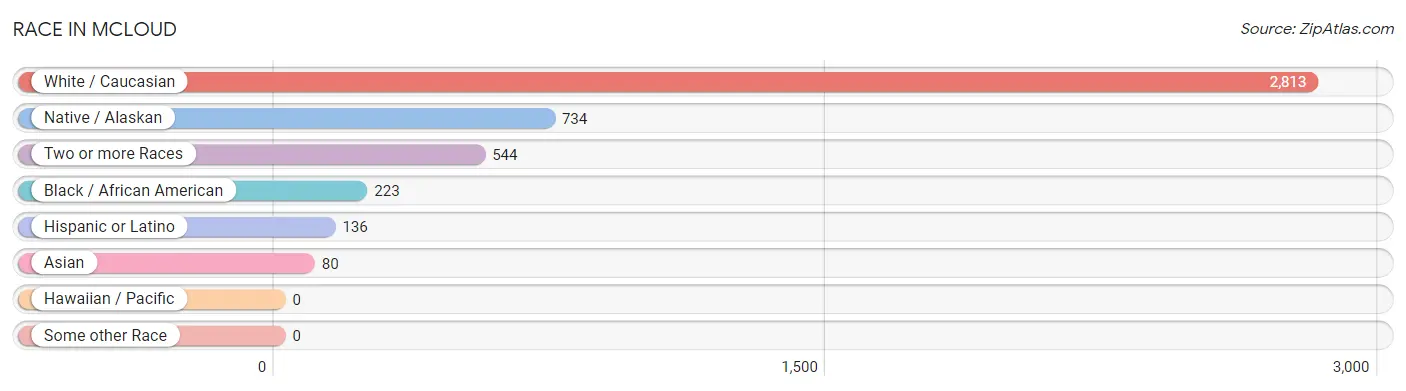
| Race | # Population | % Population |
| Asian | 80 | 1.8% |
| Black / African American | 223 | 5.1% |
| Hawaiian / Pacific | 0 | 0.0% |
| Hispanic or Latino | 136 | 3.1% |
| Native / Alaskan | 734 | 16.7% |
| White / Caucasian | 2,813 | 64.0% |
| Two or more Races | 544 | 12.4% |
| Some other Race | 0 | 0.0% |
| Total | 4,394 | 100.0% |
Ancestry in Mcloud
The most populous ancestries reported in Mcloud are German (705 | 16.0%), Irish (537 | 12.2%), French Canadian (201 | 4.6%), Cherokee (175 | 4.0%), and English (169 | 3.8%), together accounting for 40.7% of all Mcloud residents.
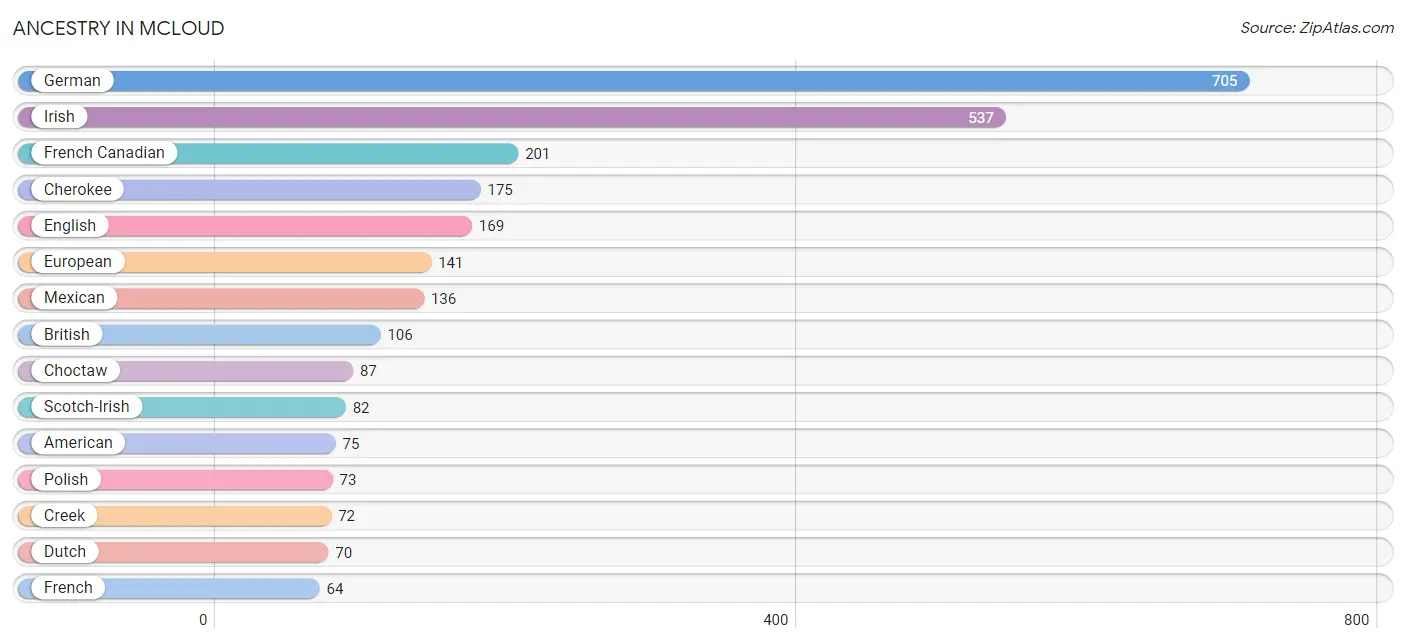
| Ancestry | # Population | % Population |
| African | 28 | 0.6% |
| American | 75 | 1.7% |
| Apache | 29 | 0.7% |
| British | 106 | 2.4% |
| Cherokee | 175 | 4.0% |
| Cheyenne | 27 | 0.6% |
| Chickasaw | 48 | 1.1% |
| Choctaw | 87 | 2.0% |
| Creek | 72 | 1.6% |
| Czech | 41 | 0.9% |
| Danish | 11 | 0.3% |
| Delaware | 25 | 0.6% |
| Dutch | 70 | 1.6% |
| English | 169 | 3.8% |
| European | 141 | 3.2% |
| Finnish | 15 | 0.3% |
| French | 64 | 1.5% |
| French Canadian | 201 | 4.6% |
| German | 705 | 16.0% |
| Irish | 537 | 12.2% |
| Iroquois | 13 | 0.3% |
| Italian | 10 | 0.2% |
| Kiowa | 19 | 0.4% |
| Korean | 38 | 0.9% |
| Mexican | 136 | 3.1% |
| Norwegian | 20 | 0.5% |
| Osage | 26 | 0.6% |
| Pakistani | 60 | 1.4% |
| Polish | 73 | 1.7% |
| Potawatomi | 35 | 0.8% |
| Pueblo | 6 | 0.1% |
| Romanian | 29 | 0.7% |
| Russian | 6 | 0.1% |
| Scotch-Irish | 82 | 1.9% |
| Scottish | 14 | 0.3% |
| Seminole | 29 | 0.7% |
| Shoshone | 2 | 0.1% |
| Sioux | 53 | 1.2% |
| Subsaharan African | 28 | 0.6% |
| Thai | 19 | 0.4% |
| Ukrainian | 16 | 0.4% |
| Welsh | 17 | 0.4% |
| Yuman | 5 | 0.1% | View All 43 Rows |
Immigrants in Mcloud
The most numerous immigrant groups reported in Mcloud came from Asia (82 | 1.9%), South Eastern Asia (63 | 1.4%), Thailand (54 | 1.2%), Africa (28 | 0.6%), and Eastern Africa (28 | 0.6%), together accounting for 5.8% of all Mcloud residents.
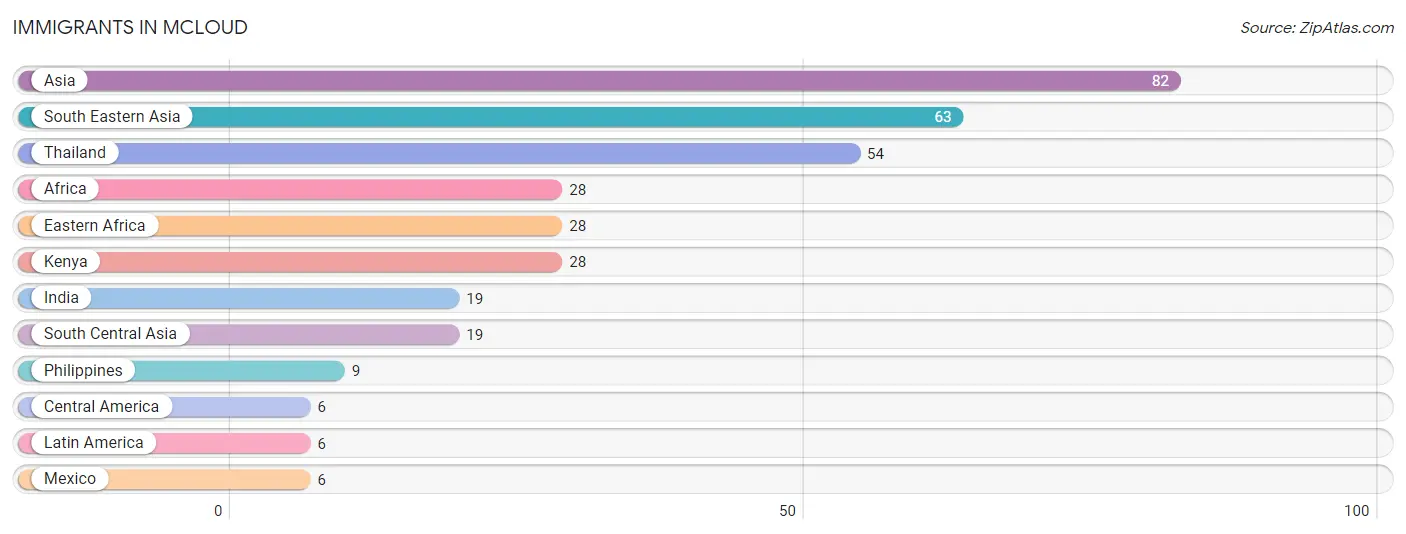
| Immigration Origin | # Population | % Population |
| Africa | 28 | 0.6% |
| Asia | 82 | 1.9% |
| Central America | 6 | 0.1% |
| Eastern Africa | 28 | 0.6% |
| India | 19 | 0.4% |
| Kenya | 28 | 0.6% |
| Latin America | 6 | 0.1% |
| Mexico | 6 | 0.1% |
| Philippines | 9 | 0.2% |
| South Central Asia | 19 | 0.4% |
| South Eastern Asia | 63 | 1.4% |
| Thailand | 54 | 1.2% | View All 12 Rows |
Sex and Age in Mcloud
Sex and Age in Mcloud
The most populous age groups in Mcloud are 50 to 54 Years (215 | 15.4%) for men and 25 to 29 Years (371 | 12.4%) for women.
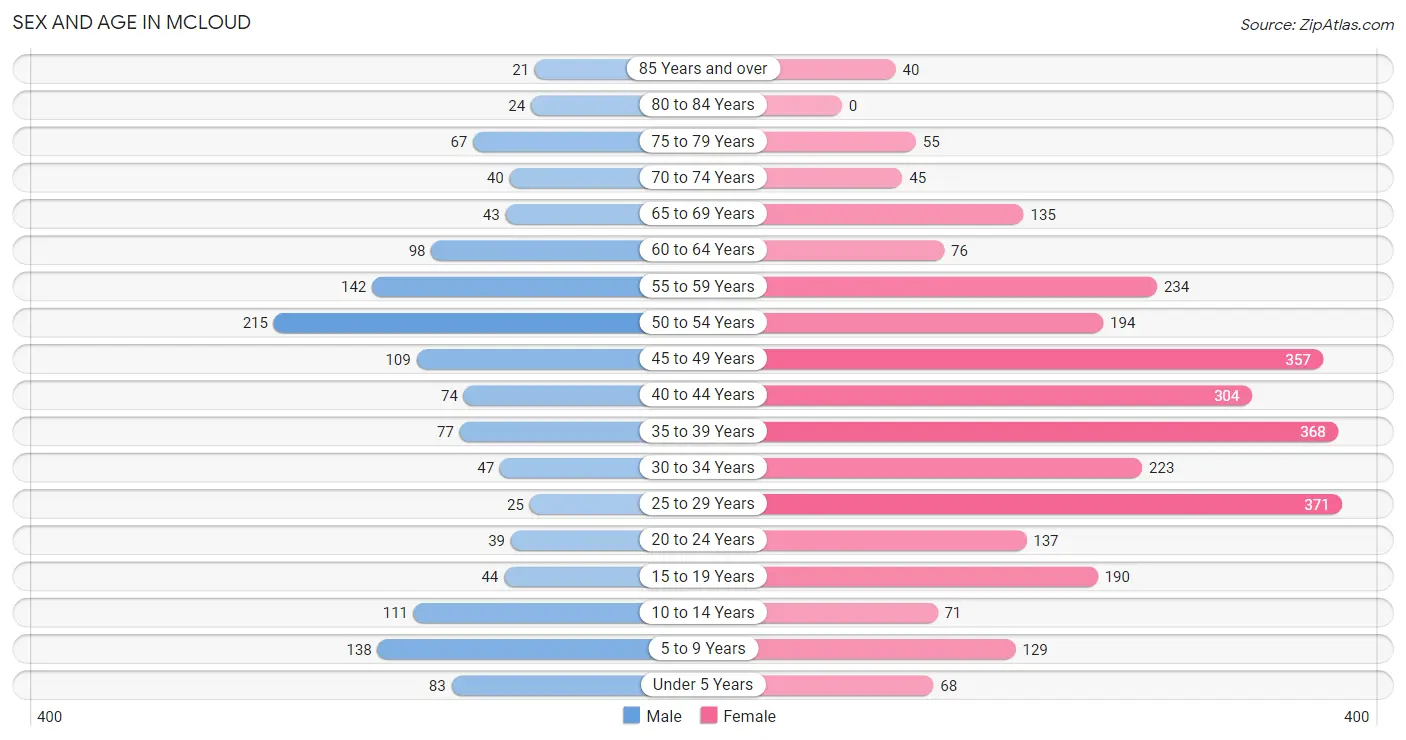
| Age Bracket | Male | Female |
| Under 5 Years | 83 (5.9%) | 68 (2.3%) |
| 5 to 9 Years | 138 (9.9%) | 129 (4.3%) |
| 10 to 14 Years | 111 (8.0%) | 71 (2.4%) |
| 15 to 19 Years | 44 (3.2%) | 190 (6.3%) |
| 20 to 24 Years | 39 (2.8%) | 137 (4.6%) |
| 25 to 29 Years | 25 (1.8%) | 371 (12.4%) |
| 30 to 34 Years | 47 (3.4%) | 223 (7.4%) |
| 35 to 39 Years | 77 (5.5%) | 368 (12.3%) |
| 40 to 44 Years | 74 (5.3%) | 304 (10.1%) |
| 45 to 49 Years | 109 (7.8%) | 357 (11.9%) |
| 50 to 54 Years | 215 (15.4%) | 194 (6.5%) |
| 55 to 59 Years | 142 (10.2%) | 234 (7.8%) |
| 60 to 64 Years | 98 (7.0%) | 76 (2.5%) |
| 65 to 69 Years | 43 (3.1%) | 135 (4.5%) |
| 70 to 74 Years | 40 (2.9%) | 45 (1.5%) |
| 75 to 79 Years | 67 (4.8%) | 55 (1.8%) |
| 80 to 84 Years | 24 (1.7%) | 0 (0.0%) |
| 85 Years and over | 21 (1.5%) | 40 (1.3%) |
| Total | 1,397 (100.0%) | 2,997 (100.0%) |
Families and Households in Mcloud
Median Family Size in Mcloud
The median family size in Mcloud is 3.17 persons per family, with single female/mother families (169 | 19.6%) accounting for the largest median family size of 4.14 persons per family. On the other hand, single male/father families (19 | 2.2%) represent the smallest median family size with 2.21 persons per family.
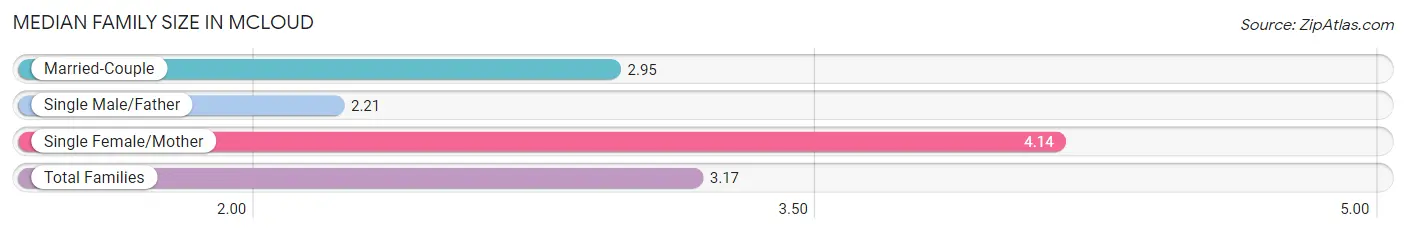
| Family Type | # Families | Family Size |
| Married-Couple | 675 (78.2%) | 2.95 |
| Single Male/Father | 19 (2.2%) | 2.21 |
| Single Female/Mother | 169 (19.6%) | 4.14 |
| Total Families | 863 (100.0%) | 3.17 |
Median Household Size in Mcloud
The median household size in Mcloud is 2.63 persons per household, with single female/mother households (169 | 14.2%) accounting for the largest median household size of 4.24 persons per household. non-family households (324 | 27.3%) represent the smallest median household size with 1.07 persons per household.
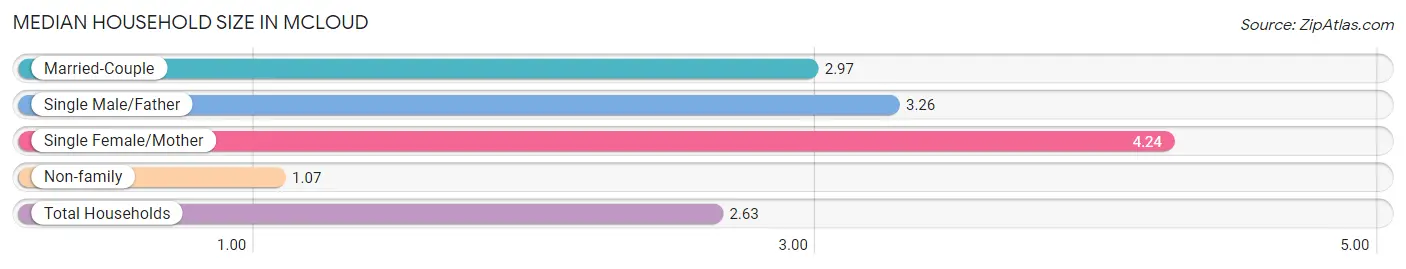
| Household Type | # Households | Household Size |
| Married-Couple | 675 (56.9%) | 2.97 |
| Single Male/Father | 19 (1.6%) | 3.26 |
| Single Female/Mother | 169 (14.2%) | 4.24 |
| Non-family | 324 (27.3%) | 1.07 |
| Total Households | 1,187 (100.0%) | 2.63 |
Household Size by Marriage Status in Mcloud
Out of a total of 1,187 households in Mcloud, 863 (72.7%) are family households, while 324 (27.3%) are nonfamily households. The most numerous type of family households are 2-person households, comprising 412, and the most common type of nonfamily households are 1-person households, comprising 304.
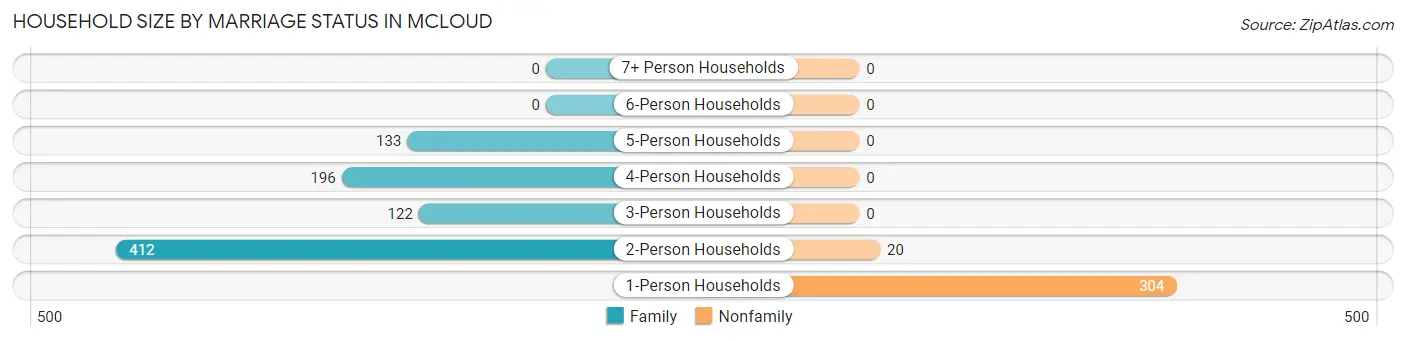
| Household Size | Family Households | Nonfamily Households |
| 1-Person Households | - | 304 (25.6%) |
| 2-Person Households | 412 (34.7%) | 20 (1.7%) |
| 3-Person Households | 122 (10.3%) | 0 (0.0%) |
| 4-Person Households | 196 (16.5%) | 0 (0.0%) |
| 5-Person Households | 133 (11.2%) | 0 (0.0%) |
| 6-Person Households | 0 (0.0%) | 0 (0.0%) |
| 7+ Person Households | 0 (0.0%) | 0 (0.0%) |
| Total | 863 (72.7%) | 324 (27.3%) |
Female Fertility in Mcloud
Fertility by Age in Mcloud
Average fertility rate in Mcloud is 48.0 births per 1,000 women. Women in the age bracket of 15 to 19 years have the highest fertility rate with 189.0 births per 1,000 women. Women in the age bracket of 20 to 34 years acount for 62.5% of all women with births.
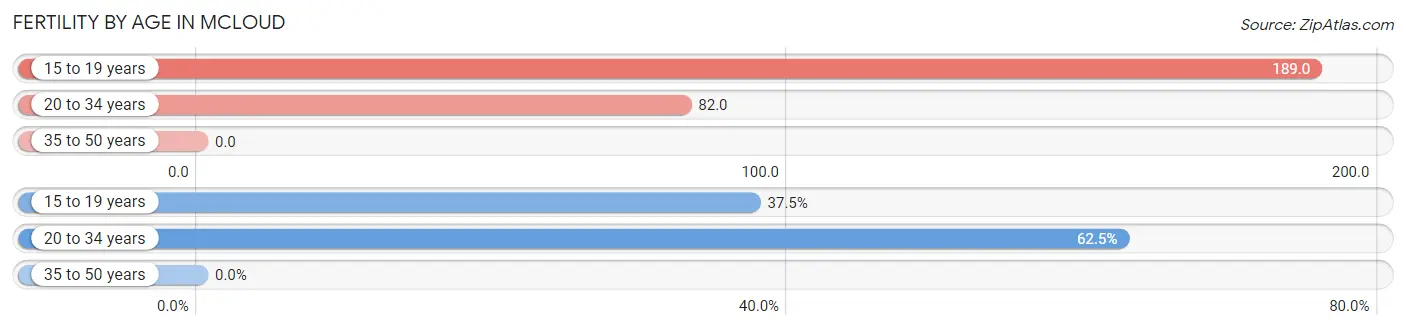
| Age Bracket | Women with Births | Births / 1,000 Women |
| 15 to 19 years | 36 (37.5%) | 189.0 |
| 20 to 34 years | 60 (62.5%) | 82.0 |
| 35 to 50 years | 0 (0.0%) | 0.0 |
| Total | 96 (100.0%) | 48.0 |
Fertility by Age by Marriage Status in Mcloud
19.8% of women with births (96) in Mcloud are married. The highest percentage of unmarried women with births falls into 15 to 19 years age bracket with 100.0% of them unmarried at the time of birth, while the lowest percentage of unmarried women with births belong to 20 to 34 years age bracket with 68.3% of them unmarried.
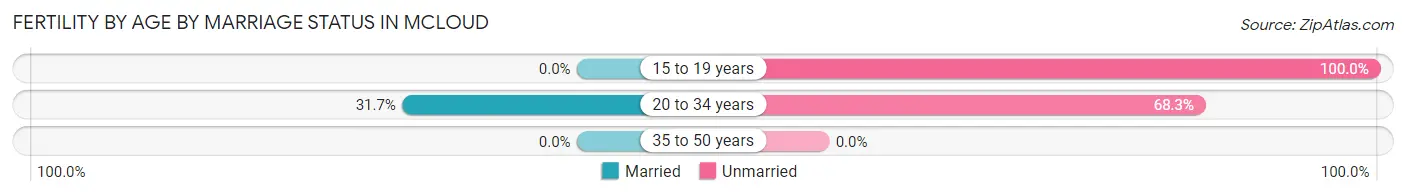
| Age Bracket | Married | Unmarried |
| 15 to 19 years | 0 (0.0%) | 36 (100.0%) |
| 20 to 34 years | 19 (31.7%) | 41 (68.3%) |
| 35 to 50 years | 0 (0.0%) | 0 (0.0%) |
| Total | 19 (19.8%) | 77 (80.2%) |
Fertility by Education in Mcloud
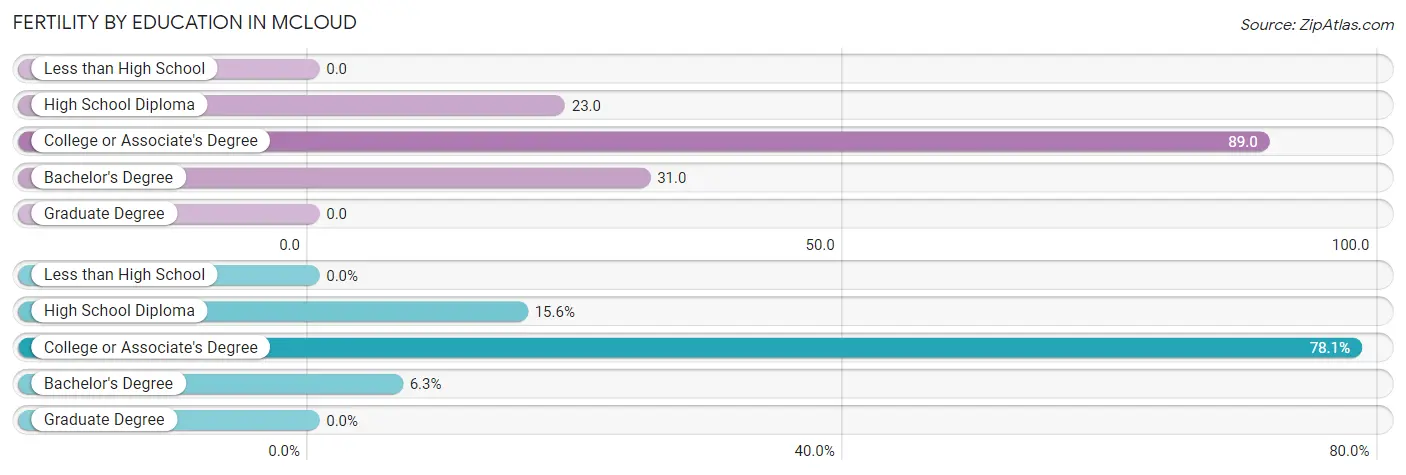
| Educational Attainment | Women with Births | Births / 1,000 Women |
| Less than High School | 0 (0.0%) | 0.0 |
| High School Diploma | 15 (15.6%) | 23.0 |
| College or Associate's Degree | 75 (78.1%) | 89.0 |
| Bachelor's Degree | 6 (6.2%) | 31.0 |
| Graduate Degree | 0 (0.0%) | 0.0 |
| Total | 96 (100.0%) | 48.0 |
Fertility by Education by Marriage Status in Mcloud
80.2% of women with births in Mcloud are unmarried. Women with the educational attainment of bachelor's degree are most likely to be married with 100.0% of them married at childbirth, while women with the educational attainment of high school diploma are least likely to be married with 100.0% of them unmarried at childbirth.
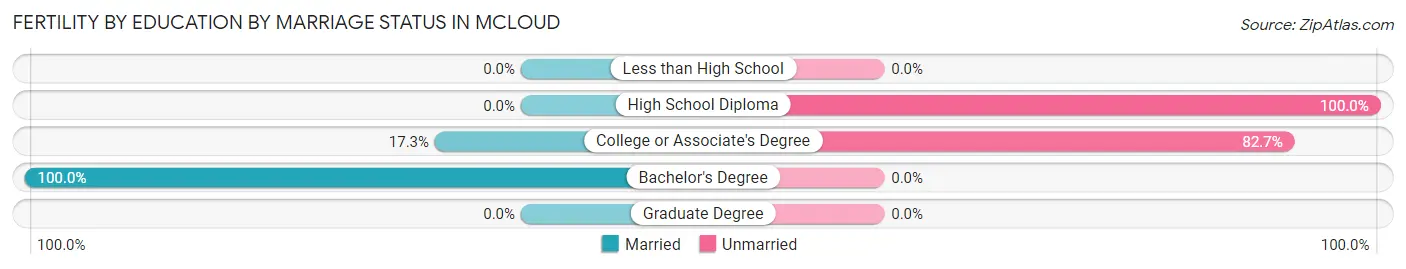
| Educational Attainment | Married | Unmarried |
| Less than High School | 0 (0.0%) | 0 (0.0%) |
| High School Diploma | 0 (0.0%) | 15 (100.0%) |
| College or Associate's Degree | 13 (17.3%) | 62 (82.7%) |
| Bachelor's Degree | 6 (100.0%) | 0 (0.0%) |
| Graduate Degree | 0 (0.0%) | 0 (0.0%) |
| Total | 19 (19.8%) | 77 (80.2%) |
Employment Characteristics in Mcloud
Employment by Class of Employer in Mcloud
Among the 1,371 employed individuals in Mcloud, private company employees (791 | 57.7%), state government employees (265 | 19.3%), and federal government employees (141 | 10.3%) make up the most common classes of employment.
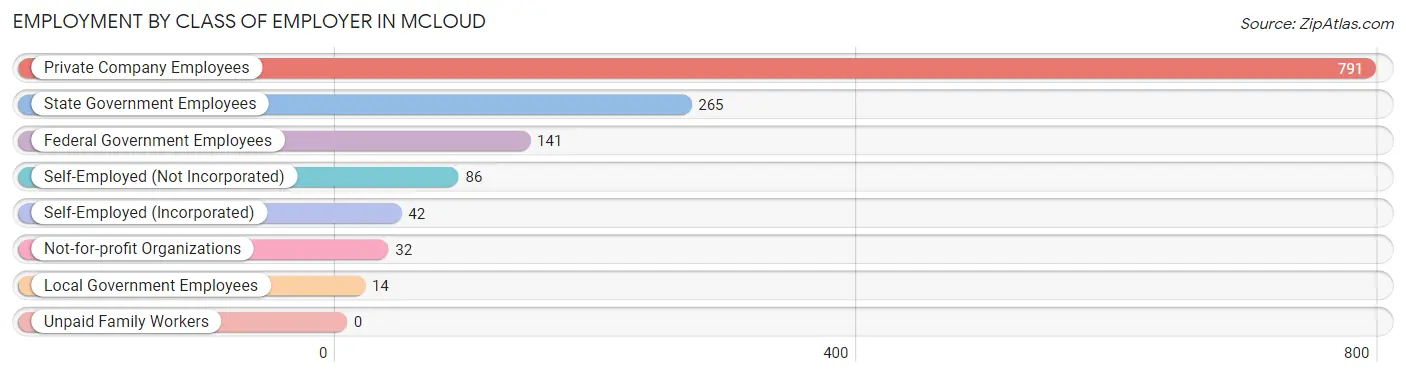
| Employer Class | # Employees | % Employees |
| Private Company Employees | 791 | 57.7% |
| Self-Employed (Incorporated) | 42 | 3.1% |
| Self-Employed (Not Incorporated) | 86 | 6.3% |
| Not-for-profit Organizations | 32 | 2.3% |
| Local Government Employees | 14 | 1.0% |
| State Government Employees | 265 | 19.3% |
| Federal Government Employees | 141 | 10.3% |
| Unpaid Family Workers | 0 | 0.0% |
| Total | 1,371 | 100.0% |
Employment Status by Age in Mcloud
According to the labor force statistics for Mcloud, out of the total population over 16 years of age (3,772), 37.9% or 1,430 individuals are in the labor force, with 3.7% or 53 of them unemployed. The age group with the highest labor force participation rate is 45 to 54 years, with 57.8% or 506 individuals in the labor force. Within the labor force, the 35 to 44 years age range has the highest percentage of unemployed individuals, with 10.5% or 27 of them being unemployed.
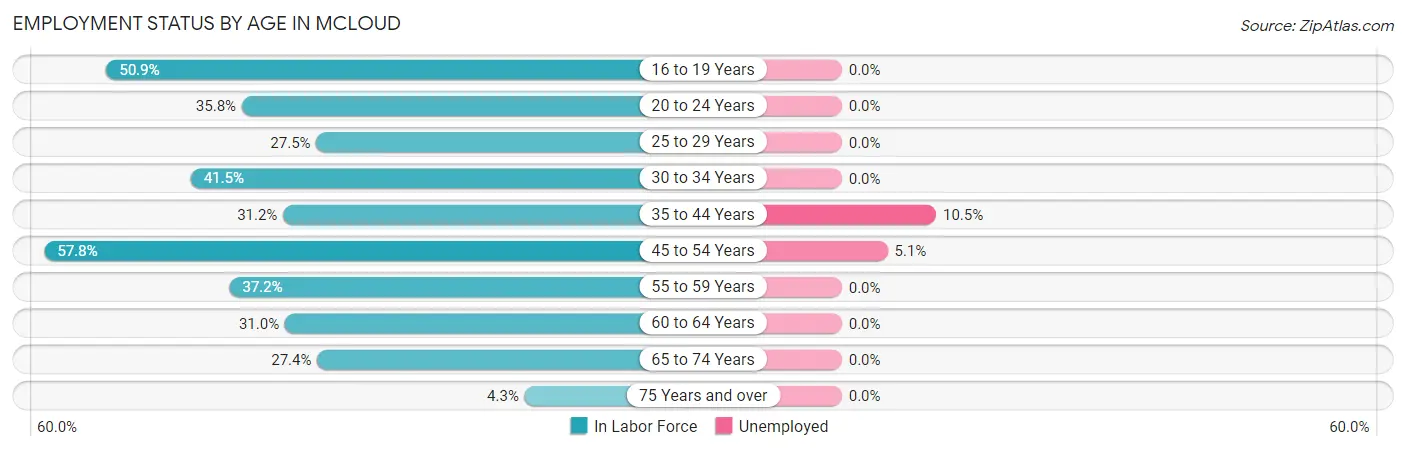
| Age Bracket | In Labor Force | Unemployed |
| 16 to 19 Years | 108 (50.9%) | 0 (0.0%) |
| 20 to 24 Years | 63 (35.8%) | 0 (0.0%) |
| 25 to 29 Years | 109 (27.5%) | 0 (0.0%) |
| 30 to 34 Years | 112 (41.5%) | 0 (0.0%) |
| 35 to 44 Years | 257 (31.2%) | 27 (10.5%) |
| 45 to 54 Years | 506 (57.8%) | 26 (5.1%) |
| 55 to 59 Years | 140 (37.2%) | 0 (0.0%) |
| 60 to 64 Years | 54 (31.0%) | 0 (0.0%) |
| 65 to 74 Years | 72 (27.4%) | 0 (0.0%) |
| 75 Years and over | 9 (4.3%) | 0 (0.0%) |
| Total | 1,430 (37.9%) | 53 (3.7%) |
Employment Status by Educational Attainment in Mcloud
According to labor force statistics for Mcloud, 40.4% of individuals (1,177) out of the total population between 25 and 64 years of age (2,914) are in the labor force, with 4.5% or 53 of them being unemployed. The group with the highest labor force participation rate are those with the educational attainment of bachelor's degree or higher, with 67.8% or 240 individuals in the labor force. Within the labor force, individuals with less than high school education have the highest percentage of unemployment, with 10.8% or 18 of them being unemployed.
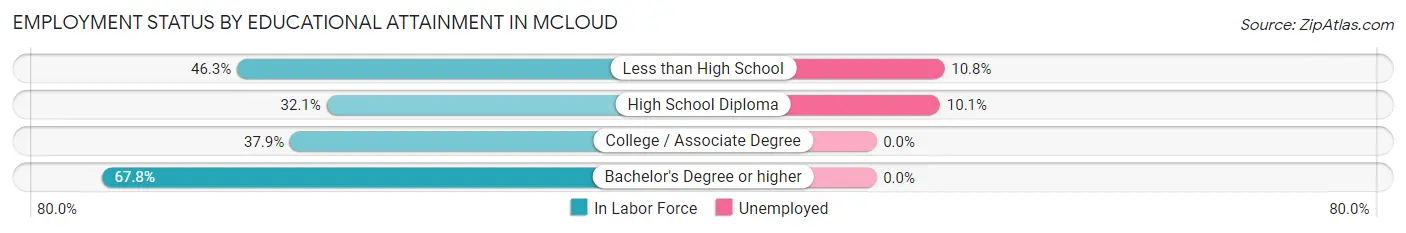
| Educational Attainment | In Labor Force | Unemployed |
| Less than High School | 167 (46.3%) | 39 (10.8%) |
| High School Diploma | 347 (32.1%) | 109 (10.1%) |
| College / Associate Degree | 424 (37.9%) | 0 (0.0%) |
| Bachelor's Degree or higher | 240 (67.8%) | 0 (0.0%) |
| Total | 1,177 (40.4%) | 131 (4.5%) |
Employment Occupations by Sex in Mcloud
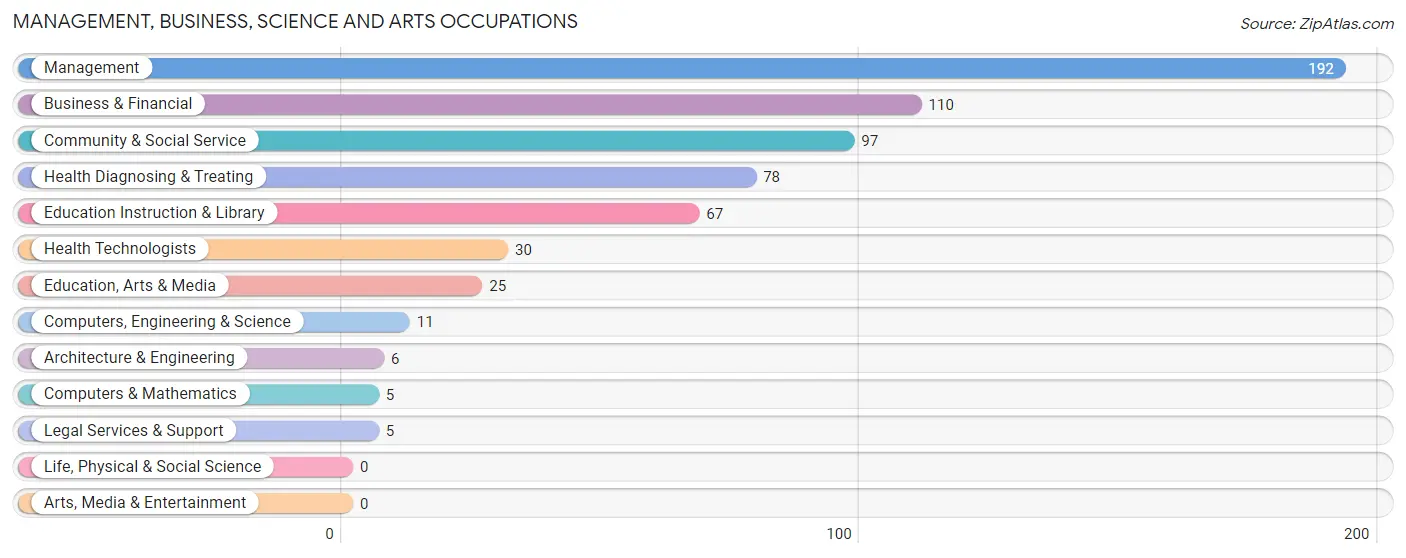
Management, Business, Science and Arts Occupations
The most common Management, Business, Science and Arts occupations in Mcloud are Management (192 | 13.9%), Business & Financial (110 | 8.0%), Community & Social Service (97 | 7.0%), Health Diagnosing & Treating (78 | 5.7%), and Education Instruction & Library (67 | 4.9%).
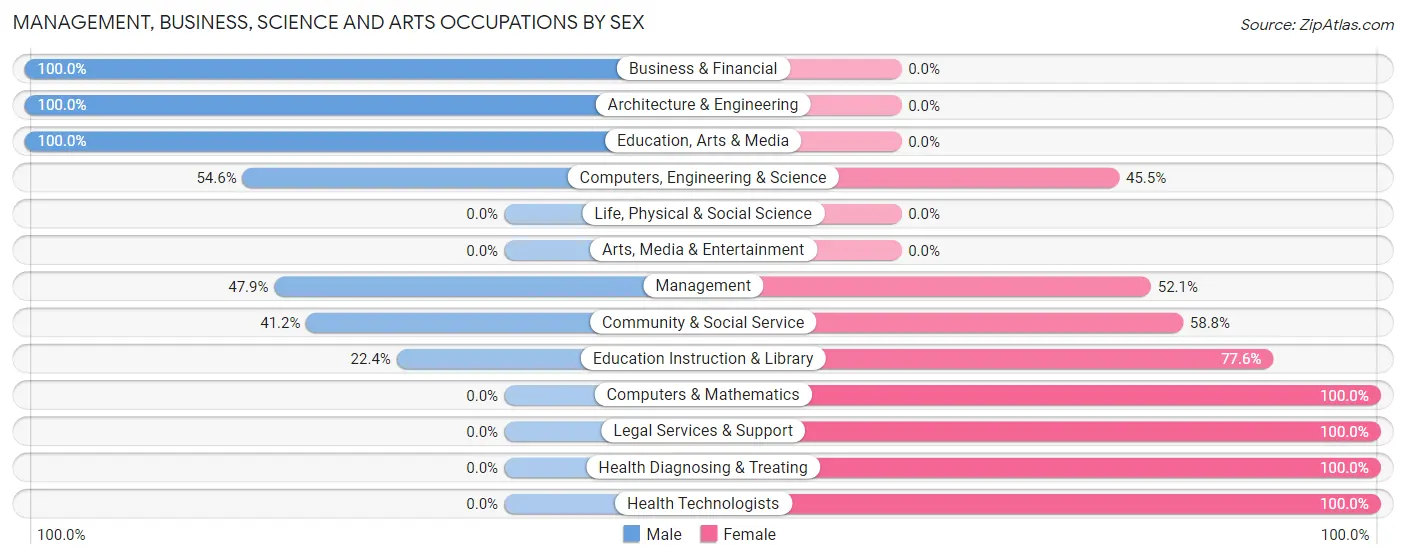
Management, Business, Science and Arts Occupations by Sex
Within the Management, Business, Science and Arts occupations in Mcloud, the most male-oriented occupations are Business & Financial (100.0%), Architecture & Engineering (100.0%), and Education, Arts & Media (100.0%), while the most female-oriented occupations are Computers & Mathematics (100.0%), Legal Services & Support (100.0%), and Health Diagnosing & Treating (100.0%).
| Occupation | Male | Female |
| Management | 92 (47.9%) | 100 (52.1%) |
| Business & Financial | 110 (100.0%) | 0 (0.0%) |
| Computers, Engineering & Science | 6 (54.5%) | 5 (45.5%) |
| Computers & Mathematics | 0 (0.0%) | 5 (100.0%) |
| Architecture & Engineering | 6 (100.0%) | 0 (0.0%) |
| Life, Physical & Social Science | 0 (0.0%) | 0 (0.0%) |
| Community & Social Service | 40 (41.2%) | 57 (58.8%) |
| Education, Arts & Media | 25 (100.0%) | 0 (0.0%) |
| Legal Services & Support | 0 (0.0%) | 5 (100.0%) |
| Education Instruction & Library | 15 (22.4%) | 52 (77.6%) |
| Arts, Media & Entertainment | 0 (0.0%) | 0 (0.0%) |
| Health Diagnosing & Treating | 0 (0.0%) | 78 (100.0%) |
| Health Technologists | 0 (0.0%) | 30 (100.0%) |
| Total (Category) | 248 (50.8%) | 240 (49.2%) |
| Total (Overall) | 589 (42.8%) | 788 (57.2%) |
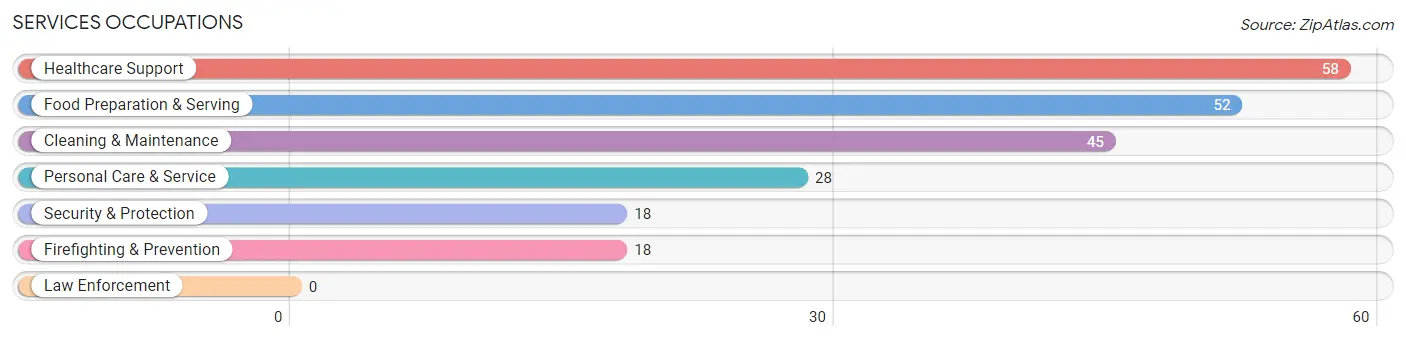
Services Occupations
The most common Services occupations in Mcloud are Healthcare Support (58 | 4.2%), Food Preparation & Serving (52 | 3.8%), Cleaning & Maintenance (45 | 3.3%), Personal Care & Service (28 | 2.0%), and Security & Protection (18 | 1.3%).
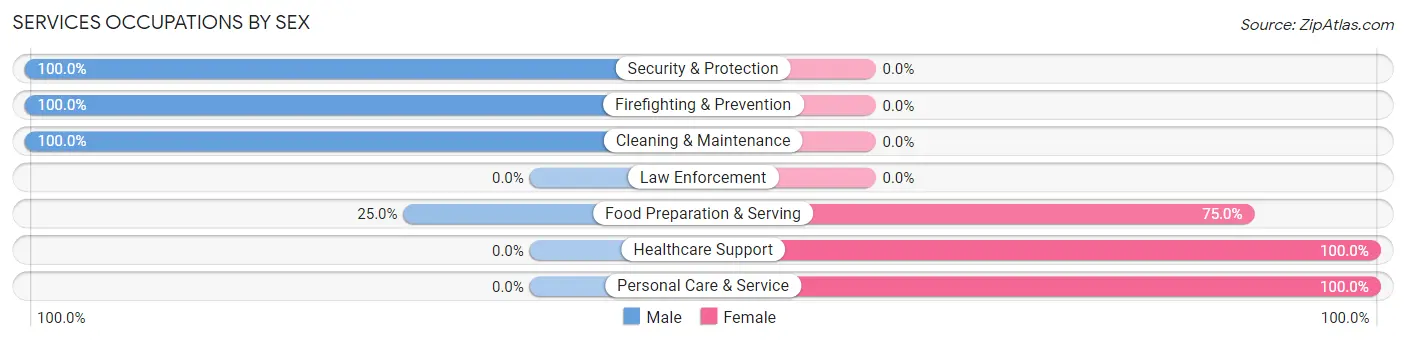
Services Occupations by Sex
Within the Services occupations in Mcloud, the most male-oriented occupations are Security & Protection (100.0%), Firefighting & Prevention (100.0%), and Cleaning & Maintenance (100.0%), while the most female-oriented occupations are Healthcare Support (100.0%), Personal Care & Service (100.0%), and Food Preparation & Serving (75.0%).
| Occupation | Male | Female |
| Healthcare Support | 0 (0.0%) | 58 (100.0%) |
| Security & Protection | 18 (100.0%) | 0 (0.0%) |
| Firefighting & Prevention | 18 (100.0%) | 0 (0.0%) |
| Law Enforcement | 0 (0.0%) | 0 (0.0%) |
| Food Preparation & Serving | 13 (25.0%) | 39 (75.0%) |
| Cleaning & Maintenance | 45 (100.0%) | 0 (0.0%) |
| Personal Care & Service | 0 (0.0%) | 28 (100.0%) |
| Total (Category) | 76 (37.8%) | 125 (62.2%) |
| Total (Overall) | 589 (42.8%) | 788 (57.2%) |
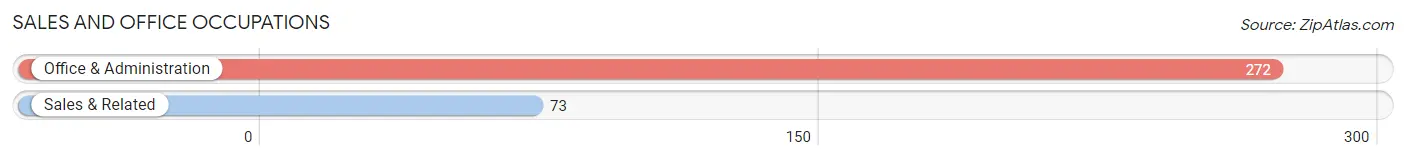
Sales and Office Occupations
The most common Sales and Office occupations in Mcloud are Office & Administration (272 | 19.8%), and Sales & Related (73 | 5.3%).
Sales and Office Occupations by Sex
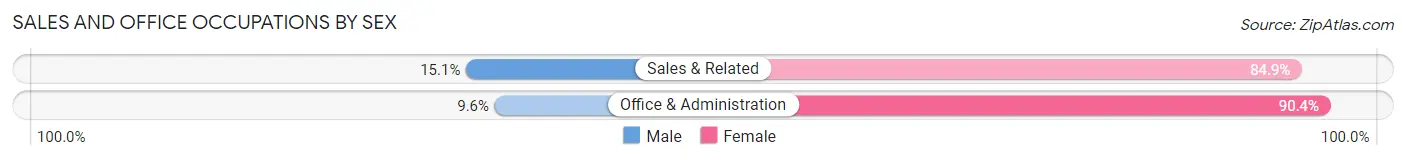
| Occupation | Male | Female |
| Sales & Related | 11 (15.1%) | 62 (84.9%) |
| Office & Administration | 26 (9.6%) | 246 (90.4%) |
| Total (Category) | 37 (10.7%) | 308 (89.3%) |
| Total (Overall) | 589 (42.8%) | 788 (57.2%) |
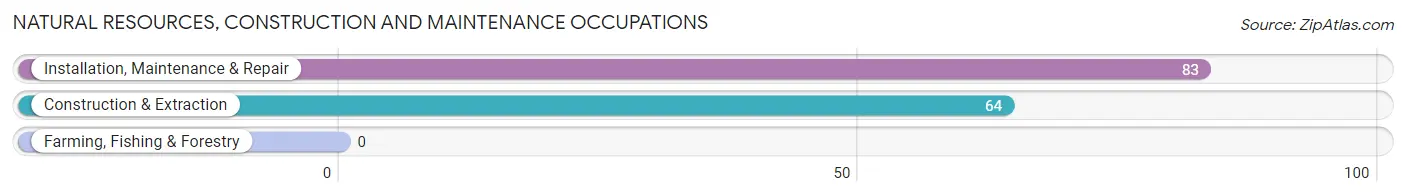
Natural Resources, Construction and Maintenance Occupations
The most common Natural Resources, Construction and Maintenance occupations in Mcloud are Installation, Maintenance & Repair (83 | 6.0%), and Construction & Extraction (64 | 4.6%).
Natural Resources, Construction and Maintenance Occupations by Sex
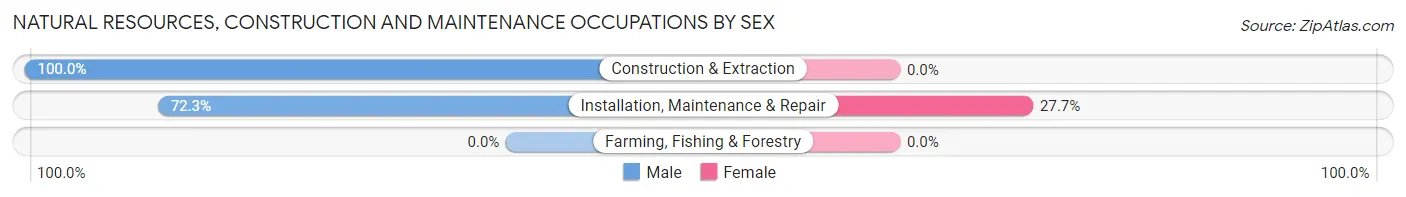
| Occupation | Male | Female |
| Farming, Fishing & Forestry | 0 (0.0%) | 0 (0.0%) |
| Construction & Extraction | 64 (100.0%) | 0 (0.0%) |
| Installation, Maintenance & Repair | 60 (72.3%) | 23 (27.7%) |
| Total (Category) | 124 (84.4%) | 23 (15.7%) |
| Total (Overall) | 589 (42.8%) | 788 (57.2%) |
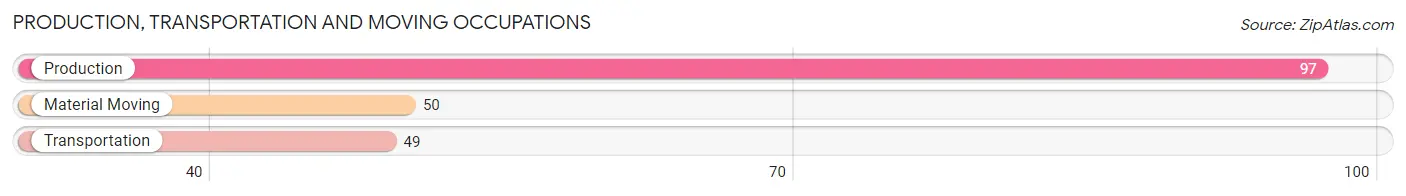
Production, Transportation and Moving Occupations
The most common Production, Transportation and Moving occupations in Mcloud are Production (97 | 7.0%), Material Moving (50 | 3.6%), and Transportation (49 | 3.6%).
Production, Transportation and Moving Occupations by Sex
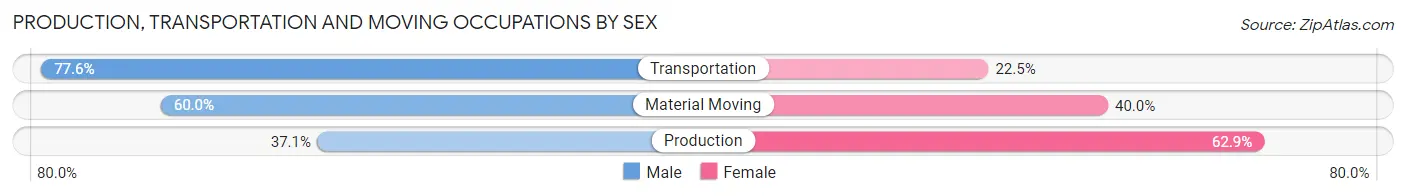
| Occupation | Male | Female |
| Production | 36 (37.1%) | 61 (62.9%) |
| Transportation | 38 (77.5%) | 11 (22.5%) |
| Material Moving | 30 (60.0%) | 20 (40.0%) |
| Total (Category) | 104 (53.1%) | 92 (46.9%) |
| Total (Overall) | 589 (42.8%) | 788 (57.2%) |
Employment Industries by Sex in Mcloud
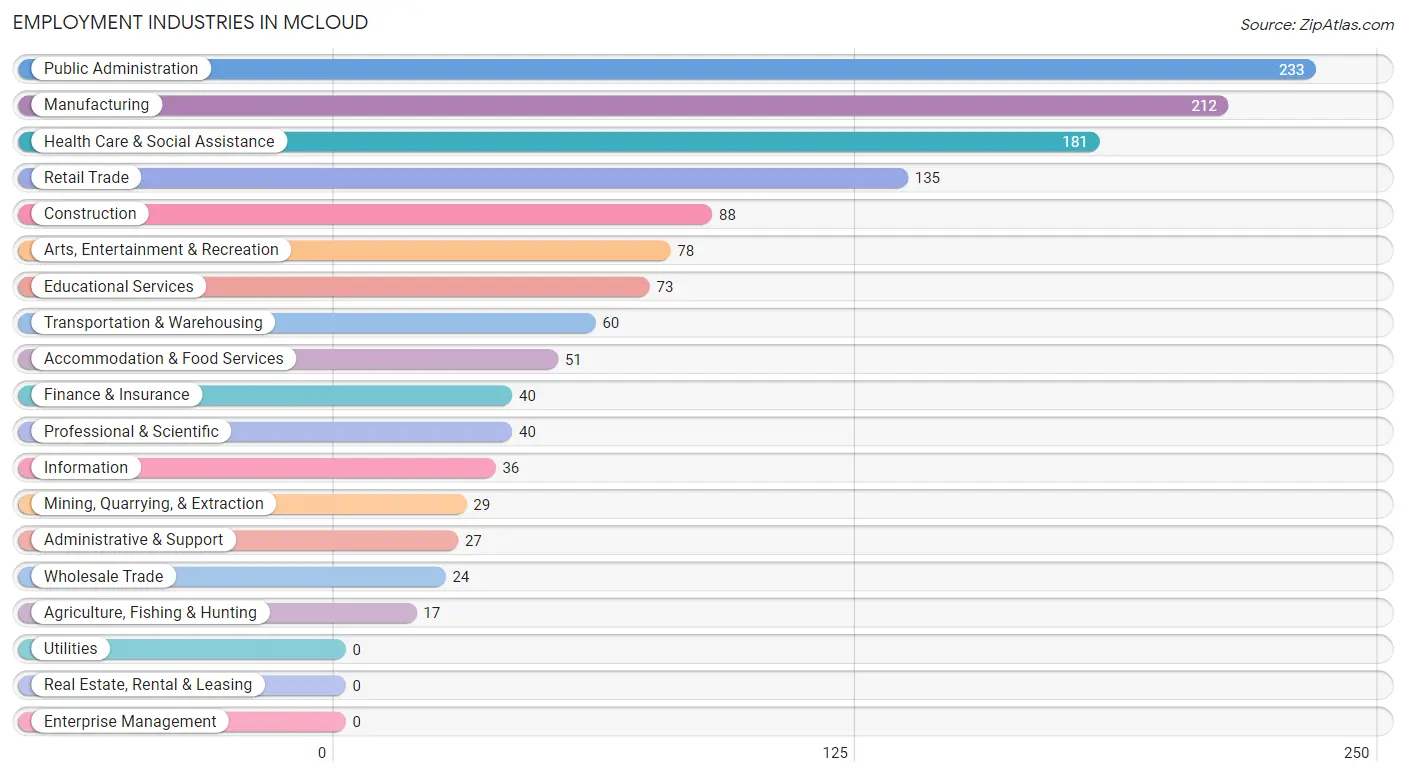
Employment Industries in Mcloud
The major employment industries in Mcloud include Public Administration (233 | 16.9%), Manufacturing (212 | 15.4%), Health Care & Social Assistance (181 | 13.1%), Retail Trade (135 | 9.8%), and Construction (88 | 6.4%).
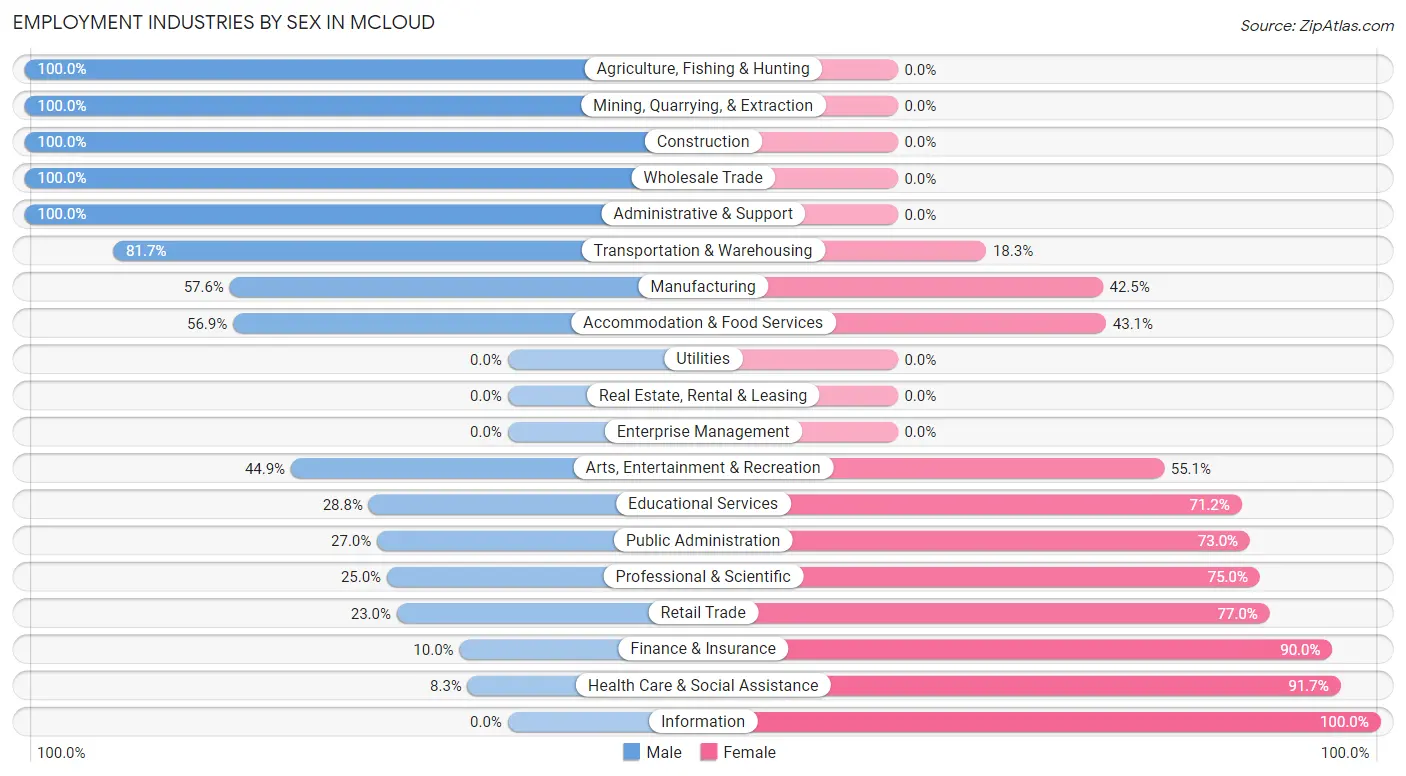
Employment Industries by Sex in Mcloud
The Mcloud industries that see more men than women are Agriculture, Fishing & Hunting (100.0%), Mining, Quarrying, & Extraction (100.0%), and Construction (100.0%), whereas the industries that tend to have a higher number of women are Information (100.0%), Health Care & Social Assistance (91.7%), and Finance & Insurance (90.0%).
| Industry | Male | Female |
| Agriculture, Fishing & Hunting | 17 (100.0%) | 0 (0.0%) |
| Mining, Quarrying, & Extraction | 29 (100.0%) | 0 (0.0%) |
| Construction | 88 (100.0%) | 0 (0.0%) |
| Manufacturing | 122 (57.6%) | 90 (42.4%) |
| Wholesale Trade | 24 (100.0%) | 0 (0.0%) |
| Retail Trade | 31 (23.0%) | 104 (77.0%) |
| Transportation & Warehousing | 49 (81.7%) | 11 (18.3%) |
| Utilities | 0 (0.0%) | 0 (0.0%) |
| Information | 0 (0.0%) | 36 (100.0%) |
| Finance & Insurance | 4 (10.0%) | 36 (90.0%) |
| Real Estate, Rental & Leasing | 0 (0.0%) | 0 (0.0%) |
| Professional & Scientific | 10 (25.0%) | 30 (75.0%) |
| Enterprise Management | 0 (0.0%) | 0 (0.0%) |
| Administrative & Support | 27 (100.0%) | 0 (0.0%) |
| Educational Services | 21 (28.8%) | 52 (71.2%) |
| Health Care & Social Assistance | 15 (8.3%) | 166 (91.7%) |
| Arts, Entertainment & Recreation | 35 (44.9%) | 43 (55.1%) |
| Accommodation & Food Services | 29 (56.9%) | 22 (43.1%) |
| Public Administration | 63 (27.0%) | 170 (73.0%) |
| Total | 589 (42.8%) | 788 (57.2%) |
Education in Mcloud
School Enrollment in Mcloud
The most common levels of schooling among the 805 students in Mcloud are elementary school (249 | 30.9%), high school (163 | 20.3%), and middle school (160 | 19.9%).
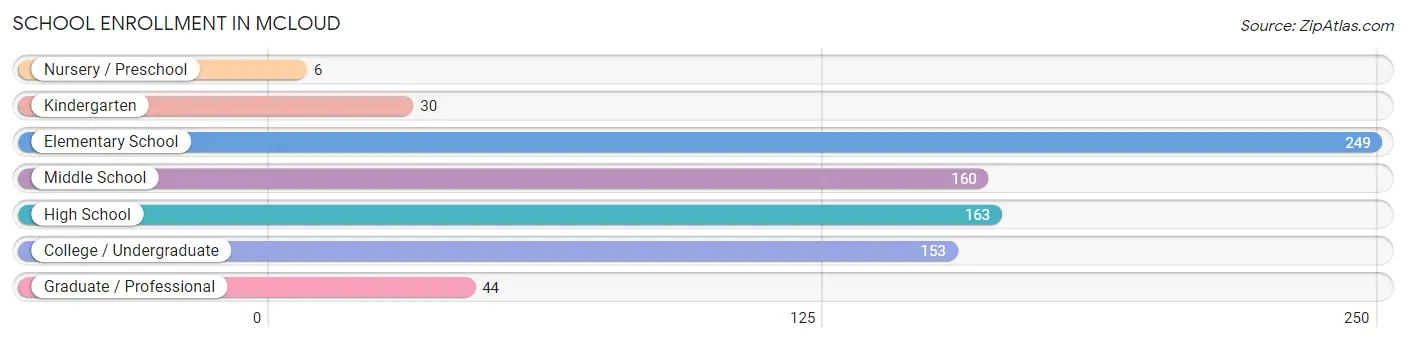
| School Level | # Students | % Students |
| Nursery / Preschool | 6 | 0.7% |
| Kindergarten | 30 | 3.7% |
| Elementary School | 249 | 30.9% |
| Middle School | 160 | 19.9% |
| High School | 163 | 20.3% |
| College / Undergraduate | 153 | 19.0% |
| Graduate / Professional | 44 | 5.5% |
| Total | 805 | 100.0% |
School Enrollment by Age by Funding Source in Mcloud
Out of a total of 805 students who are enrolled in schools in Mcloud, 323 (40.1%) attend a private institution, while the remaining 482 (59.9%) are enrolled in public schools. The age group of 18 to 19 year olds has the highest likelihood of being enrolled in private schools, with 51 (58.6% in the age bracket) enrolled. Conversely, the age group of 25 to 34 year olds has the lowest likelihood of being enrolled in a private school, with 25 (100.0% in the age bracket) attending a public institution.
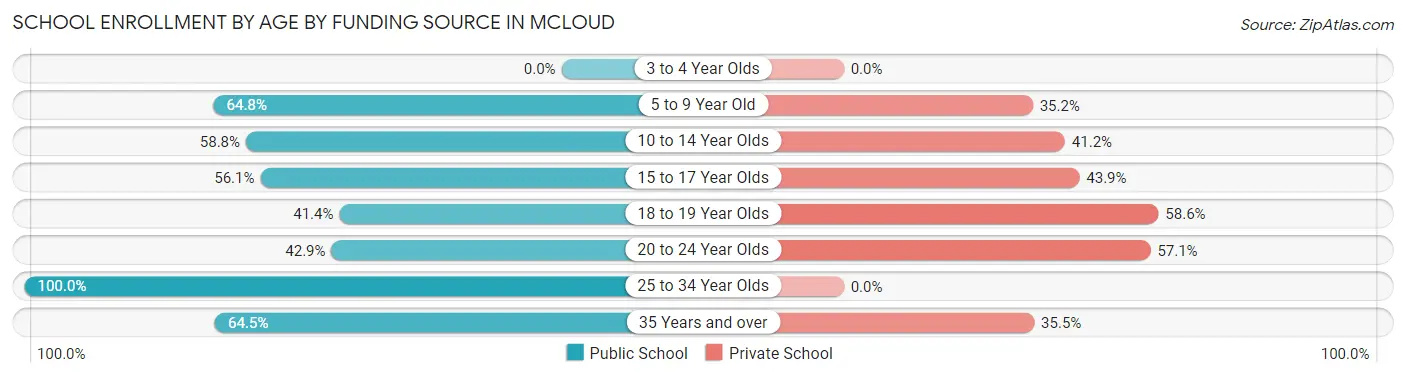
| Age Bracket | Public School | Private School |
| 3 to 4 Year Olds | 0 (0.0%) | 0 (0.0%) |
| 5 to 9 Year Old | 173 (64.8%) | 94 (35.2%) |
| 10 to 14 Year Olds | 107 (58.8%) | 75 (41.2%) |
| 15 to 17 Year Olds | 69 (56.1%) | 54 (43.9%) |
| 18 to 19 Year Olds | 36 (41.4%) | 51 (58.6%) |
| 20 to 24 Year Olds | 12 (42.9%) | 16 (57.1%) |
| 25 to 34 Year Olds | 25 (100.0%) | 0 (0.0%) |
| 35 Years and over | 60 (64.5%) | 33 (35.5%) |
| Total | 482 (59.9%) | 323 (40.1%) |
Educational Attainment by Field of Study in Mcloud
Business (141 | 32.1%), education (136 | 30.9%), arts & humanities (51 | 11.6%), communications (40 | 9.1%), and science & technology (27 | 6.1%) are the most common fields of study among 440 individuals in Mcloud who have obtained a bachelor's degree or higher.
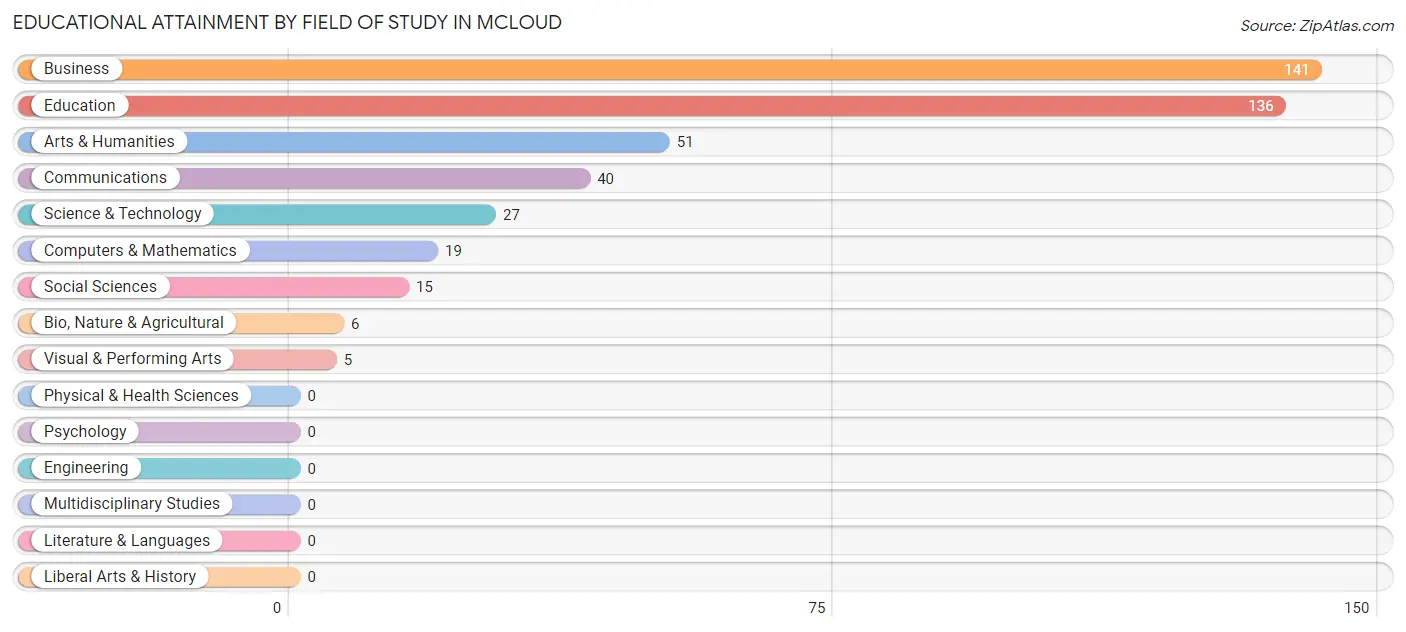
| Field of Study | # Graduates | % Graduates |
| Computers & Mathematics | 19 | 4.3% |
| Bio, Nature & Agricultural | 6 | 1.4% |
| Physical & Health Sciences | 0 | 0.0% |
| Psychology | 0 | 0.0% |
| Social Sciences | 15 | 3.4% |
| Engineering | 0 | 0.0% |
| Multidisciplinary Studies | 0 | 0.0% |
| Science & Technology | 27 | 6.1% |
| Business | 141 | 32.1% |
| Education | 136 | 30.9% |
| Literature & Languages | 0 | 0.0% |
| Liberal Arts & History | 0 | 0.0% |
| Visual & Performing Arts | 5 | 1.1% |
| Communications | 40 | 9.1% |
| Arts & Humanities | 51 | 11.6% |
| Total | 440 | 100.0% |
Transportation & Commute in Mcloud
Vehicle Availability by Sex in Mcloud
The most prevalent vehicle ownership categories in Mcloud are males with 2 vehicles (300, accounting for 50.9%) and females with 2 vehicles (298, making up 38.4%).
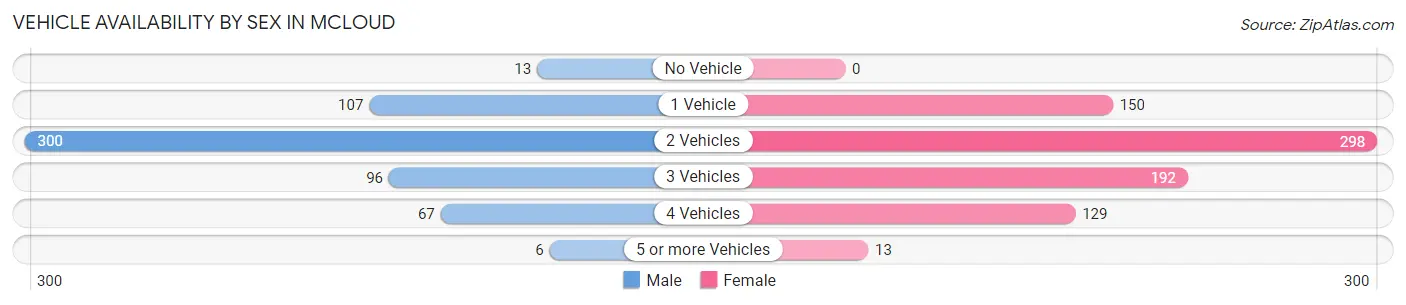
| Vehicles Available | Male | Female |
| No Vehicle | 13 (2.2%) | 0 (0.0%) |
| 1 Vehicle | 107 (18.2%) | 150 (19.2%) |
| 2 Vehicles | 300 (50.9%) | 298 (38.1%) |
| 3 Vehicles | 96 (16.3%) | 192 (24.5%) |
| 4 Vehicles | 67 (11.4%) | 129 (16.5%) |
| 5 or more Vehicles | 6 (1.0%) | 13 (1.7%) |
| Total | 589 (100.0%) | 782 (100.0%) |
Commute Time in Mcloud
The most frequently occuring commute durations in Mcloud are 45 to 59 minutes (298 commuters, 22.1%), 20 to 24 minutes (209 commuters, 15.5%), and 15 to 19 minutes (194 commuters, 14.4%).
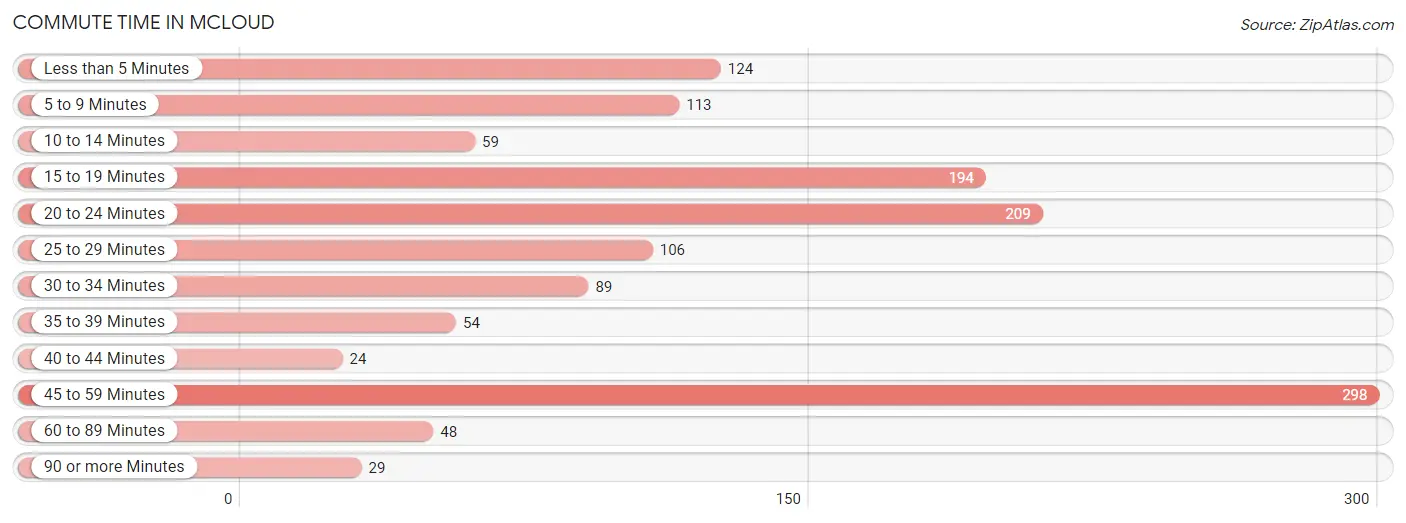
| Commute Time | # Commuters | % Commuters |
| Less than 5 Minutes | 124 | 9.2% |
| 5 to 9 Minutes | 113 | 8.4% |
| 10 to 14 Minutes | 59 | 4.4% |
| 15 to 19 Minutes | 194 | 14.4% |
| 20 to 24 Minutes | 209 | 15.5% |
| 25 to 29 Minutes | 106 | 7.9% |
| 30 to 34 Minutes | 89 | 6.6% |
| 35 to 39 Minutes | 54 | 4.0% |
| 40 to 44 Minutes | 24 | 1.8% |
| 45 to 59 Minutes | 298 | 22.1% |
| 60 to 89 Minutes | 48 | 3.6% |
| 90 or more Minutes | 29 | 2.1% |
Commute Time by Sex in Mcloud
The most common commute times in Mcloud are 45 to 59 minutes (158 commuters, 27.2%) for males and 20 to 24 minutes (146 commuters, 19.1%) for females.
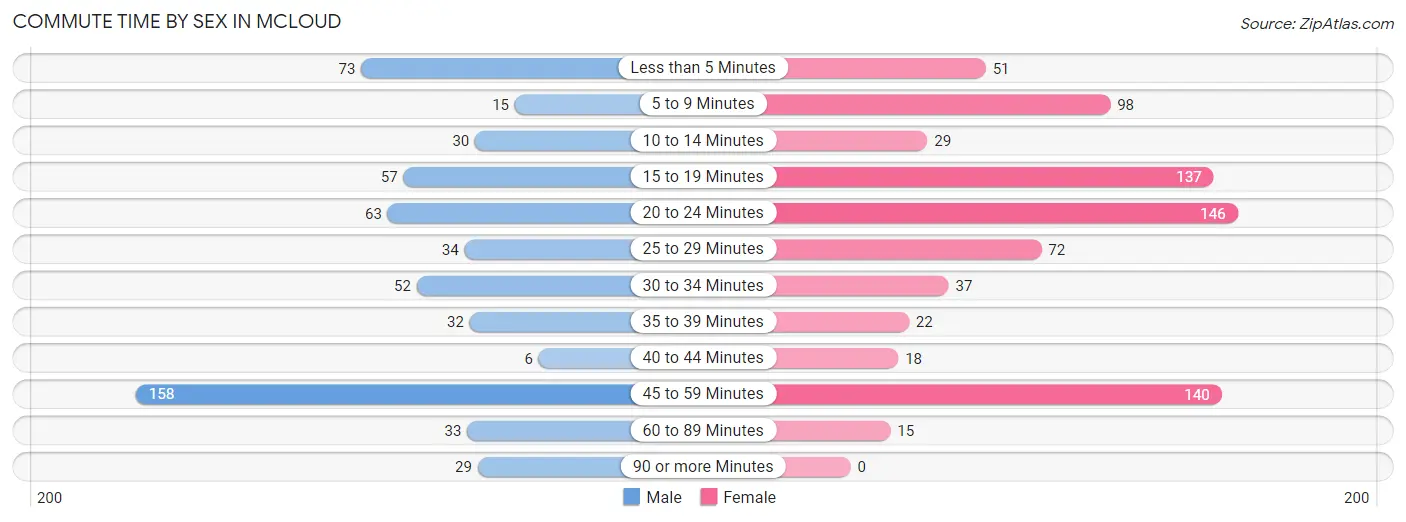
| Commute Time | Male | Female |
| Less than 5 Minutes | 73 (12.5%) | 51 (6.7%) |
| 5 to 9 Minutes | 15 (2.6%) | 98 (12.8%) |
| 10 to 14 Minutes | 30 (5.1%) | 29 (3.8%) |
| 15 to 19 Minutes | 57 (9.8%) | 137 (17.9%) |
| 20 to 24 Minutes | 63 (10.8%) | 146 (19.1%) |
| 25 to 29 Minutes | 34 (5.8%) | 72 (9.4%) |
| 30 to 34 Minutes | 52 (8.9%) | 37 (4.8%) |
| 35 to 39 Minutes | 32 (5.5%) | 22 (2.9%) |
| 40 to 44 Minutes | 6 (1.0%) | 18 (2.4%) |
| 45 to 59 Minutes | 158 (27.2%) | 140 (18.3%) |
| 60 to 89 Minutes | 33 (5.7%) | 15 (2.0%) |
| 90 or more Minutes | 29 (5.0%) | 0 (0.0%) |
Time of Departure to Work by Sex in Mcloud
The most frequent times of departure to work in Mcloud are 12:00 AM to 4:59 AM (175, 30.1%) for males and 7:30 AM to 7:59 AM (155, 20.3%) for females.
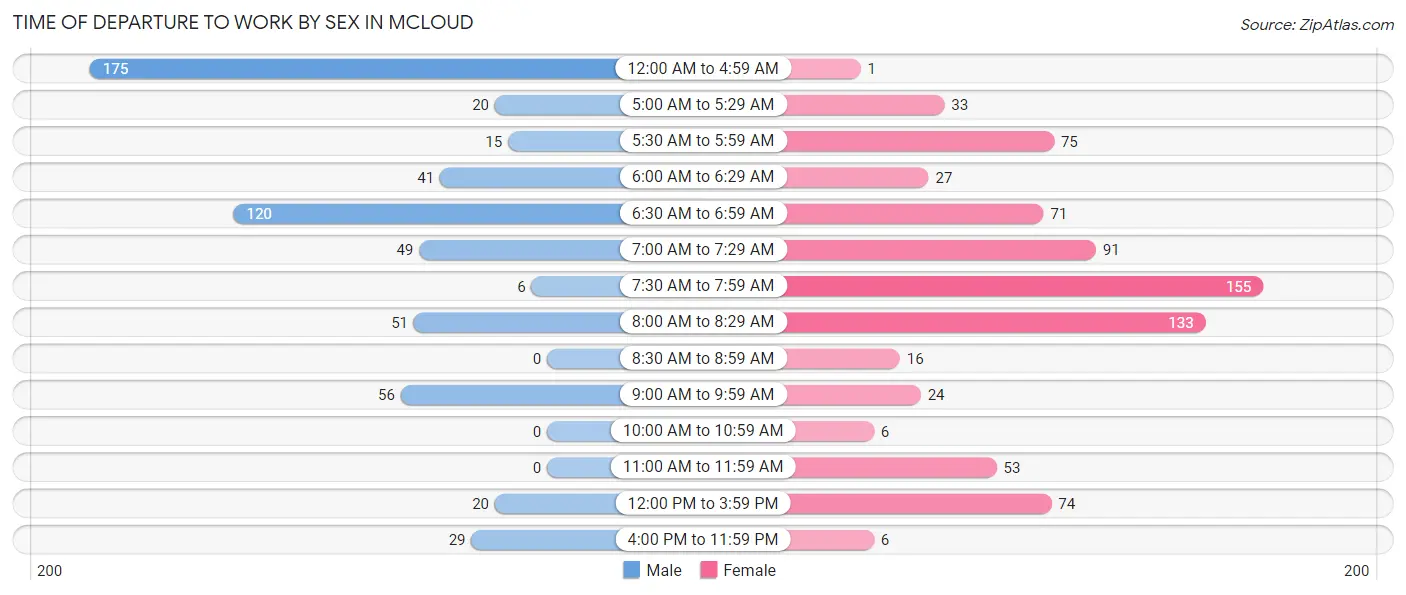
| Time of Departure | Male | Female |
| 12:00 AM to 4:59 AM | 175 (30.1%) | 1 (0.1%) |
| 5:00 AM to 5:29 AM | 20 (3.4%) | 33 (4.3%) |
| 5:30 AM to 5:59 AM | 15 (2.6%) | 75 (9.8%) |
| 6:00 AM to 6:29 AM | 41 (7.0%) | 27 (3.5%) |
| 6:30 AM to 6:59 AM | 120 (20.6%) | 71 (9.3%) |
| 7:00 AM to 7:29 AM | 49 (8.4%) | 91 (11.9%) |
| 7:30 AM to 7:59 AM | 6 (1.0%) | 155 (20.3%) |
| 8:00 AM to 8:29 AM | 51 (8.8%) | 133 (17.4%) |
| 8:30 AM to 8:59 AM | 0 (0.0%) | 16 (2.1%) |
| 9:00 AM to 9:59 AM | 56 (9.6%) | 24 (3.1%) |
| 10:00 AM to 10:59 AM | 0 (0.0%) | 6 (0.8%) |
| 11:00 AM to 11:59 AM | 0 (0.0%) | 53 (6.9%) |
| 12:00 PM to 3:59 PM | 20 (3.4%) | 74 (9.7%) |
| 4:00 PM to 11:59 PM | 29 (5.0%) | 6 (0.8%) |
| Total | 582 (100.0%) | 765 (100.0%) |
Housing Occupancy in Mcloud
Occupancy by Ownership in Mcloud
Of the total 1,187 dwellings in Mcloud, owner-occupied units account for 812 (68.4%), while renter-occupied units make up 375 (31.6%).
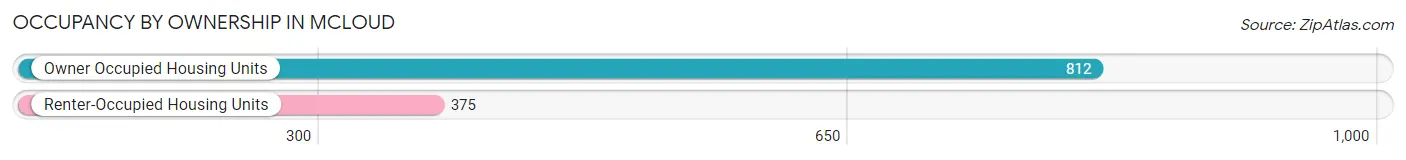
| Occupancy | # Housing Units | % Housing Units |
| Owner Occupied Housing Units | 812 | 68.4% |
| Renter-Occupied Housing Units | 375 | 31.6% |
| Total Occupied Housing Units | 1,187 | 100.0% |
Occupancy by Household Size in Mcloud
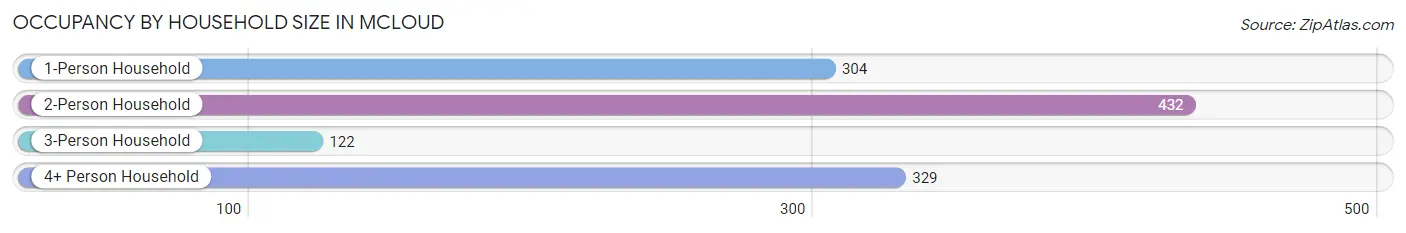
| Household Size | # Housing Units | % Housing Units |
| 1-Person Household | 304 | 25.6% |
| 2-Person Household | 432 | 36.4% |
| 3-Person Household | 122 | 10.3% |
| 4+ Person Household | 329 | 27.7% |
| Total Housing Units | 1,187 | 100.0% |
Occupancy by Ownership by Household Size in Mcloud
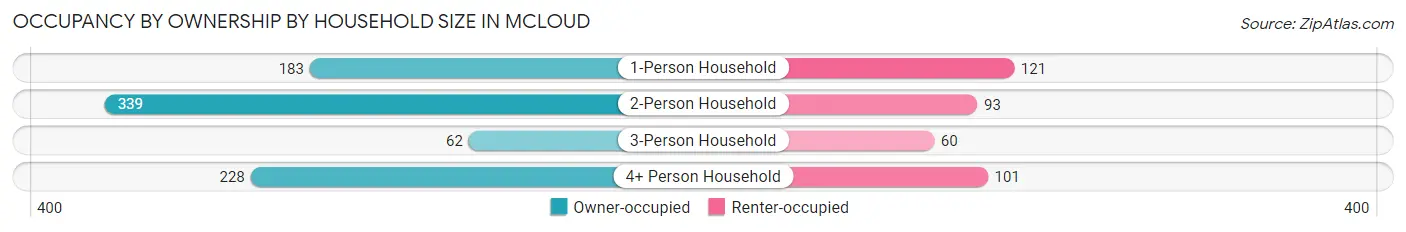
| Household Size | Owner-occupied | Renter-occupied |
| 1-Person Household | 183 (60.2%) | 121 (39.8%) |
| 2-Person Household | 339 (78.5%) | 93 (21.5%) |
| 3-Person Household | 62 (50.8%) | 60 (49.2%) |
| 4+ Person Household | 228 (69.3%) | 101 (30.7%) |
| Total Housing Units | 812 (68.4%) | 375 (31.6%) |
Occupancy by Educational Attainment in Mcloud
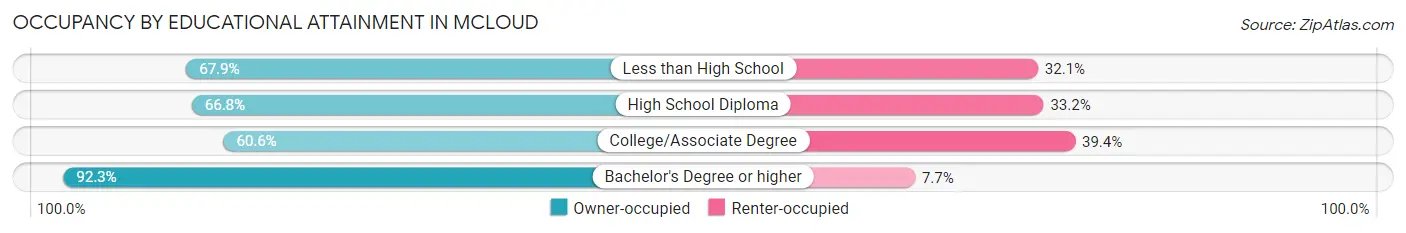
| Household Size | Owner-occupied | Renter-occupied |
| Less than High School | 125 (67.9%) | 59 (32.1%) |
| High School Diploma | 276 (66.8%) | 137 (33.2%) |
| College/Associate Degree | 255 (60.6%) | 166 (39.4%) |
| Bachelor's Degree or higher | 156 (92.3%) | 13 (7.7%) |
Occupancy by Age of Householder in Mcloud
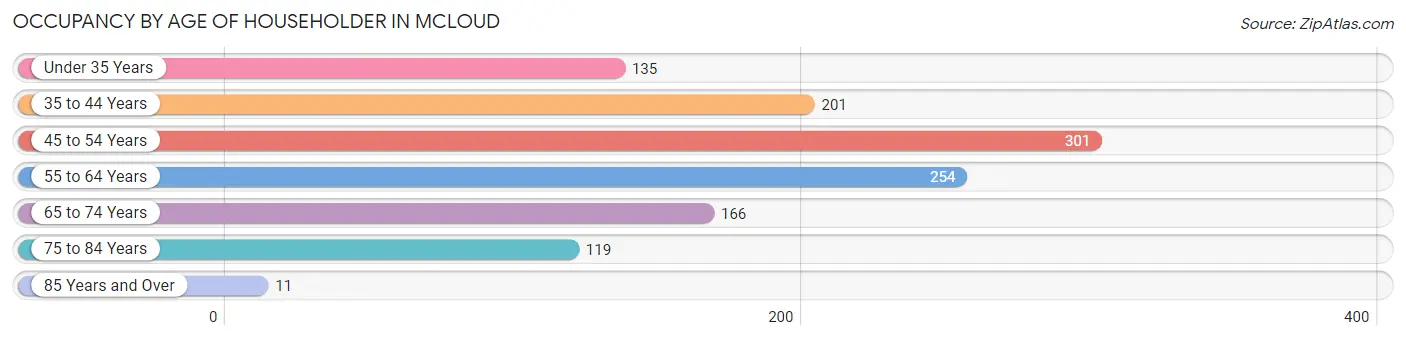
| Age Bracket | # Households | % Households |
| Under 35 Years | 135 | 11.4% |
| 35 to 44 Years | 201 | 16.9% |
| 45 to 54 Years | 301 | 25.4% |
| 55 to 64 Years | 254 | 21.4% |
| 65 to 74 Years | 166 | 14.0% |
| 75 to 84 Years | 119 | 10.0% |
| 85 Years and Over | 11 | 0.9% |
| Total | 1,187 | 100.0% |
Housing Finances in Mcloud
Median Income by Occupancy in Mcloud
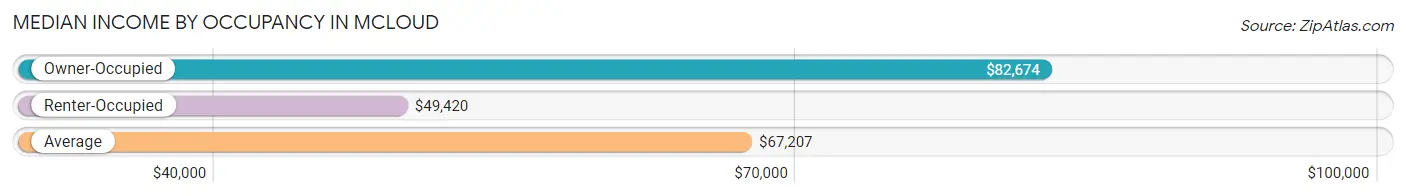
| Occupancy Type | # Households | Median Income |
| Owner-Occupied | 812 (68.4%) | $82,674 |
| Renter-Occupied | 375 (31.6%) | $49,420 |
| Average | 1,187 (100.0%) | $67,207 |
Occupancy by Householder Income Bracket in Mcloud
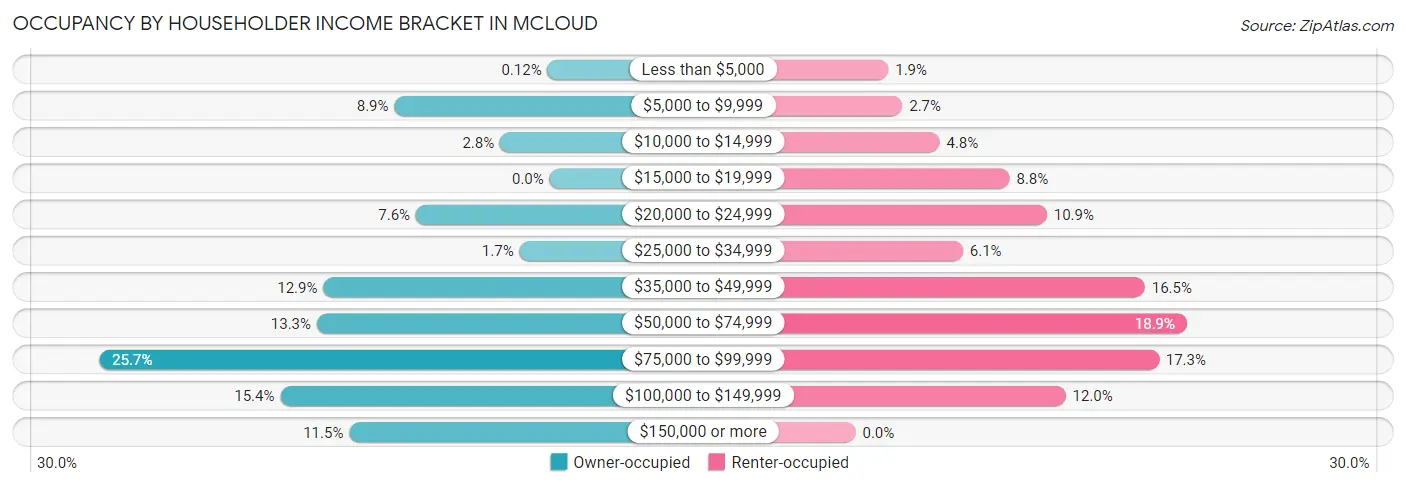
| Income Bracket | Owner-occupied | Renter-occupied |
| Less than $5,000 | 1 (0.1%) | 7 (1.9%) |
| $5,000 to $9,999 | 72 (8.9%) | 10 (2.7%) |
| $10,000 to $14,999 | 23 (2.8%) | 18 (4.8%) |
| $15,000 to $19,999 | 0 (0.0%) | 33 (8.8%) |
| $20,000 to $24,999 | 62 (7.6%) | 41 (10.9%) |
| $25,000 to $34,999 | 14 (1.7%) | 23 (6.1%) |
| $35,000 to $49,999 | 105 (12.9%) | 62 (16.5%) |
| $50,000 to $74,999 | 108 (13.3%) | 71 (18.9%) |
| $75,000 to $99,999 | 209 (25.7%) | 65 (17.3%) |
| $100,000 to $149,999 | 125 (15.4%) | 45 (12.0%) |
| $150,000 or more | 93 (11.5%) | 0 (0.0%) |
| Total | 812 (100.0%) | 375 (100.0%) |
Monthly Housing Cost Tiers in Mcloud
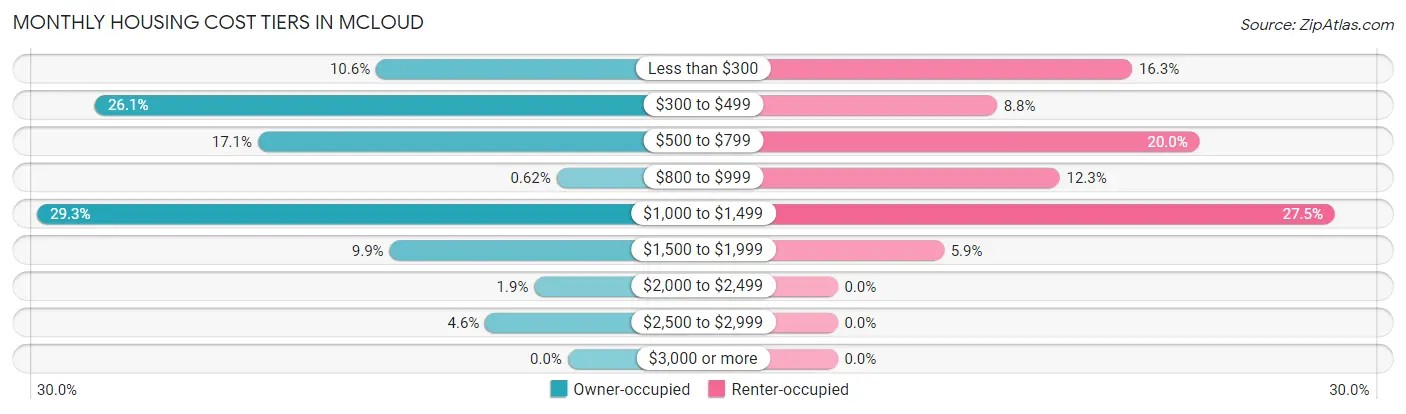
| Monthly Cost | Owner-occupied | Renter-occupied |
| Less than $300 | 86 (10.6%) | 61 (16.3%) |
| $300 to $499 | 212 (26.1%) | 33 (8.8%) |
| $500 to $799 | 139 (17.1%) | 75 (20.0%) |
| $800 to $999 | 5 (0.6%) | 46 (12.3%) |
| $1,000 to $1,499 | 238 (29.3%) | 103 (27.5%) |
| $1,500 to $1,999 | 80 (9.9%) | 22 (5.9%) |
| $2,000 to $2,499 | 15 (1.8%) | 0 (0.0%) |
| $2,500 to $2,999 | 37 (4.6%) | 0 (0.0%) |
| $3,000 or more | 0 (0.0%) | 0 (0.0%) |
| Total | 812 (100.0%) | 375 (100.0%) |
Physical Housing Characteristics in Mcloud
Housing Structures in Mcloud
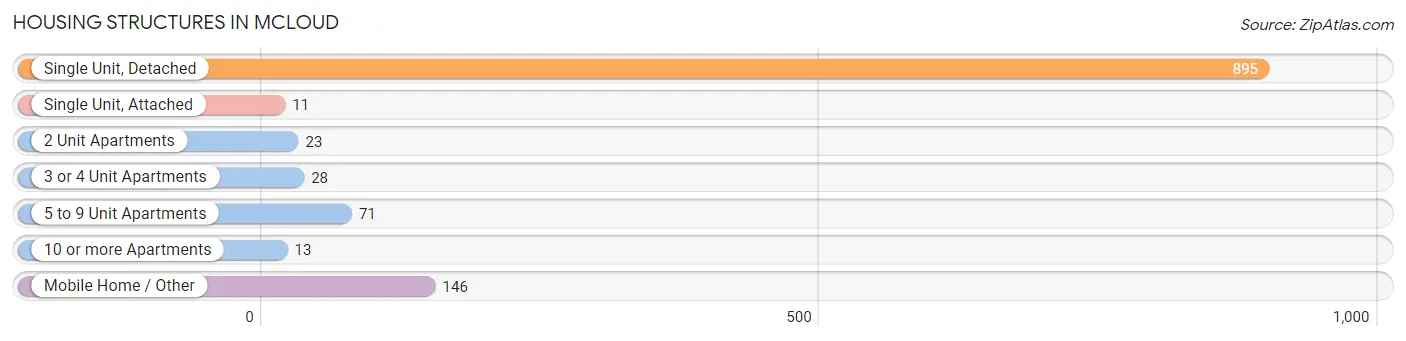
| Structure Type | # Housing Units | % Housing Units |
| Single Unit, Detached | 895 | 75.4% |
| Single Unit, Attached | 11 | 0.9% |
| 2 Unit Apartments | 23 | 1.9% |
| 3 or 4 Unit Apartments | 28 | 2.4% |
| 5 to 9 Unit Apartments | 71 | 6.0% |
| 10 or more Apartments | 13 | 1.1% |
| Mobile Home / Other | 146 | 12.3% |
| Total | 1,187 | 100.0% |
Housing Structures by Occupancy in Mcloud
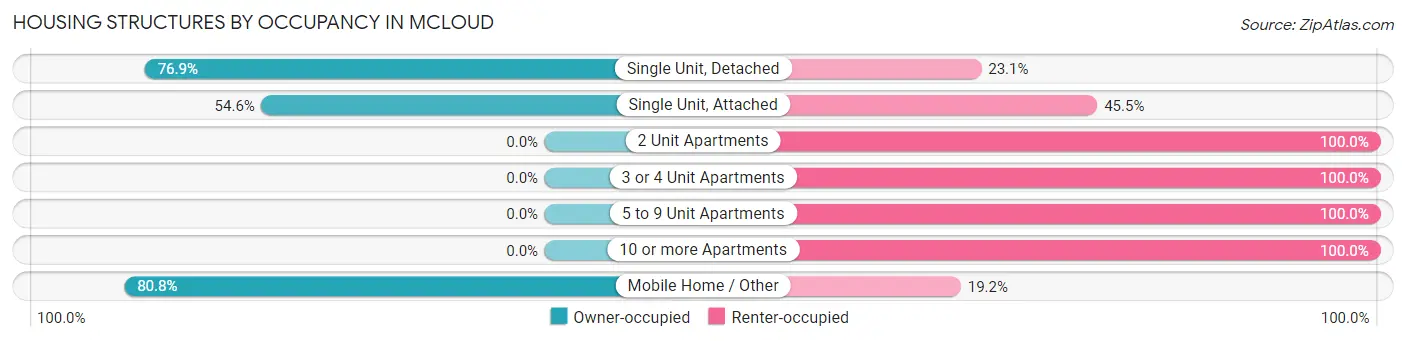
| Structure Type | Owner-occupied | Renter-occupied |
| Single Unit, Detached | 688 (76.9%) | 207 (23.1%) |
| Single Unit, Attached | 6 (54.5%) | 5 (45.5%) |
| 2 Unit Apartments | 0 (0.0%) | 23 (100.0%) |
| 3 or 4 Unit Apartments | 0 (0.0%) | 28 (100.0%) |
| 5 to 9 Unit Apartments | 0 (0.0%) | 71 (100.0%) |
| 10 or more Apartments | 0 (0.0%) | 13 (100.0%) |
| Mobile Home / Other | 118 (80.8%) | 28 (19.2%) |
| Total | 812 (68.4%) | 375 (31.6%) |
Housing Structures by Number of Rooms in Mcloud
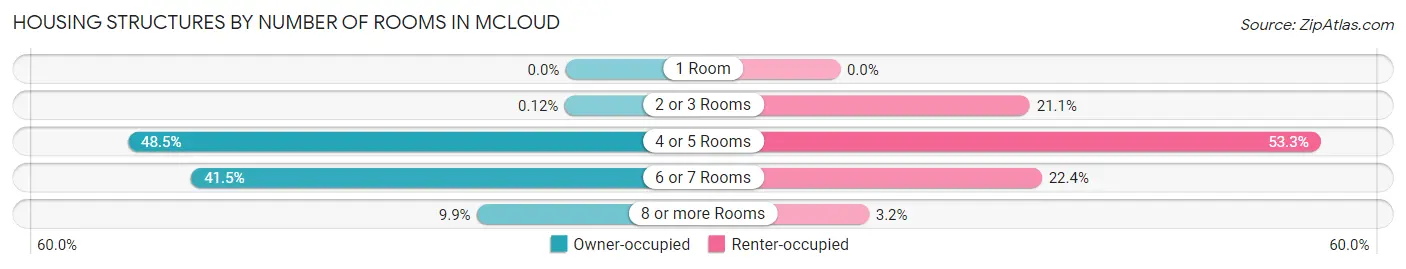
| Number of Rooms | Owner-occupied | Renter-occupied |
| 1 Room | 0 (0.0%) | 0 (0.0%) |
| 2 or 3 Rooms | 1 (0.1%) | 79 (21.1%) |
| 4 or 5 Rooms | 394 (48.5%) | 200 (53.3%) |
| 6 or 7 Rooms | 337 (41.5%) | 84 (22.4%) |
| 8 or more Rooms | 80 (9.9%) | 12 (3.2%) |
| Total | 812 (100.0%) | 375 (100.0%) |
Housing Structure by Heating Type in Mcloud
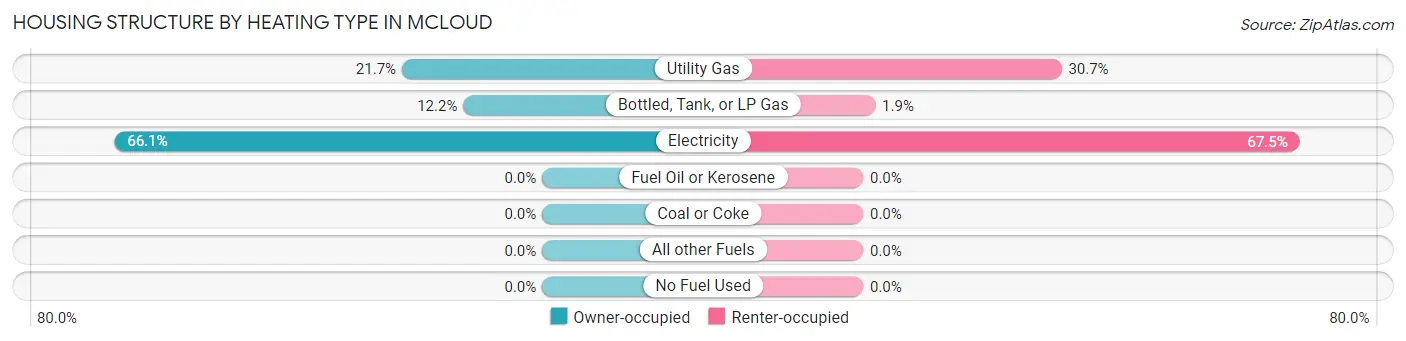
| Heating Type | Owner-occupied | Renter-occupied |
| Utility Gas | 176 (21.7%) | 115 (30.7%) |
| Bottled, Tank, or LP Gas | 99 (12.2%) | 7 (1.9%) |
| Electricity | 537 (66.1%) | 253 (67.5%) |
| Fuel Oil or Kerosene | 0 (0.0%) | 0 (0.0%) |
| Coal or Coke | 0 (0.0%) | 0 (0.0%) |
| All other Fuels | 0 (0.0%) | 0 (0.0%) |
| No Fuel Used | 0 (0.0%) | 0 (0.0%) |
| Total | 812 (100.0%) | 375 (100.0%) |
Household Vehicle Usage in Mcloud
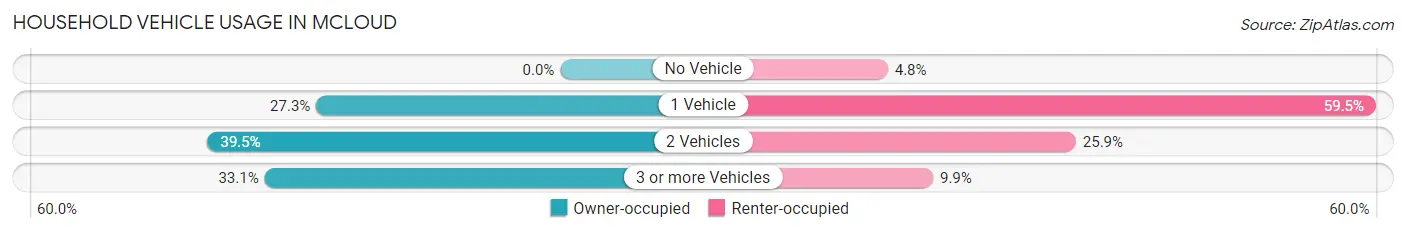
| Vehicles per Household | Owner-occupied | Renter-occupied |
| No Vehicle | 0 (0.0%) | 18 (4.8%) |
| 1 Vehicle | 222 (27.3%) | 223 (59.5%) |
| 2 Vehicles | 321 (39.5%) | 97 (25.9%) |
| 3 or more Vehicles | 269 (33.1%) | 37 (9.9%) |
| Total | 812 (100.0%) | 375 (100.0%) |
Real Estate & Mortgages in Mcloud
Real Estate and Mortgage Overview in Mcloud
| Characteristic | Without Mortgage | With Mortgage |
| Housing Units | 328 | 484 |
| Median Property Value | $161,200 | $141,900 |
| Median Household Income | $46,250 | $93 |
| Monthly Housing Costs | $369 | $0 |
| Real Estate Taxes | $725 | $57 |
Property Value by Mortgage Status in Mcloud
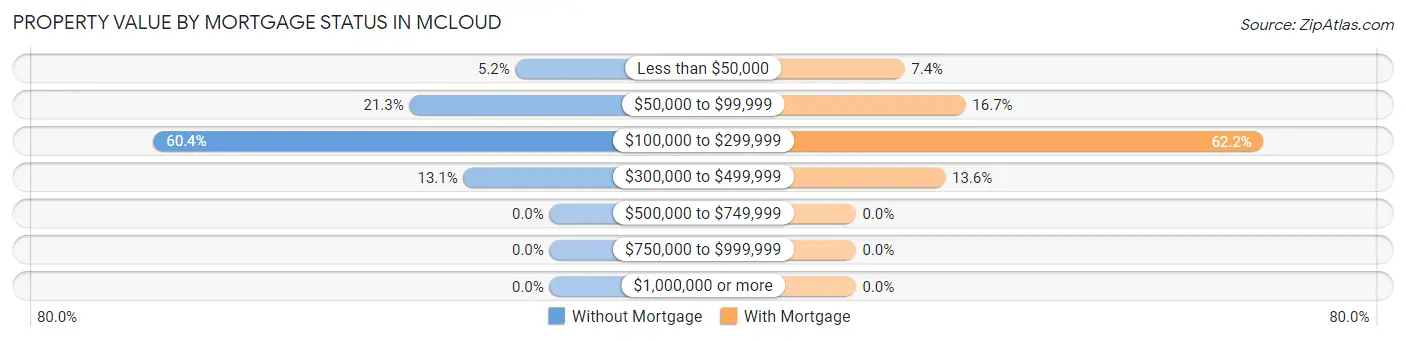
| Property Value | Without Mortgage | With Mortgage |
| Less than $50,000 | 17 (5.2%) | 36 (7.4%) |
| $50,000 to $99,999 | 70 (21.3%) | 81 (16.7%) |
| $100,000 to $299,999 | 198 (60.4%) | 301 (62.2%) |
| $300,000 to $499,999 | 43 (13.1%) | 66 (13.6%) |
| $500,000 to $749,999 | 0 (0.0%) | 0 (0.0%) |
| $750,000 to $999,999 | 0 (0.0%) | 0 (0.0%) |
| $1,000,000 or more | 0 (0.0%) | 0 (0.0%) |
| Total | 328 (100.0%) | 484 (100.0%) |
Household Income by Mortgage Status in Mcloud
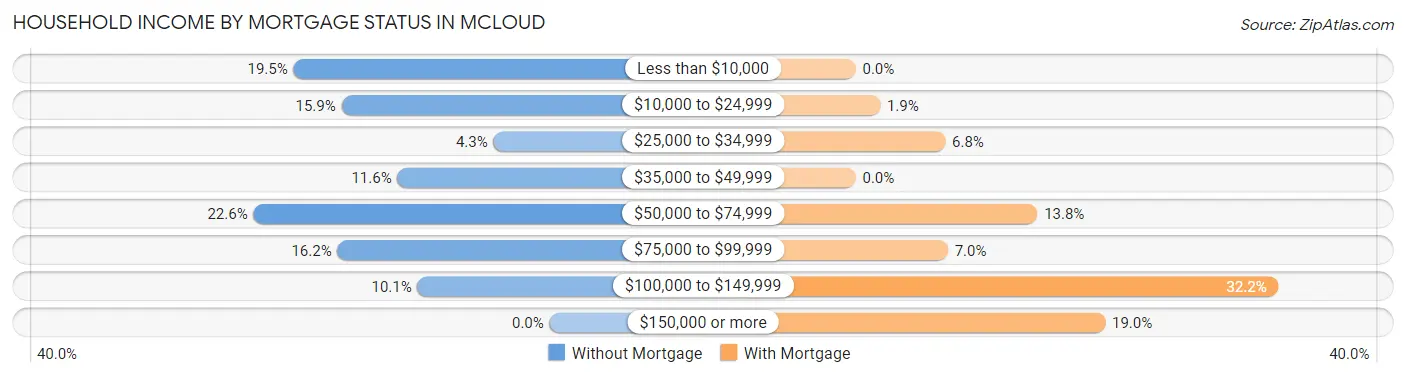
| Household Income | Without Mortgage | With Mortgage |
| Less than $10,000 | 64 (19.5%) | 0 (0.0%) |
| $10,000 to $24,999 | 52 (15.9%) | 9 (1.9%) |
| $25,000 to $34,999 | 14 (4.3%) | 33 (6.8%) |
| $35,000 to $49,999 | 38 (11.6%) | 0 (0.0%) |
| $50,000 to $74,999 | 74 (22.6%) | 67 (13.8%) |
| $75,000 to $99,999 | 53 (16.2%) | 34 (7.0%) |
| $100,000 to $149,999 | 33 (10.1%) | 156 (32.2%) |
| $150,000 or more | 0 (0.0%) | 92 (19.0%) |
| Total | 328 (100.0%) | 484 (100.0%) |
Property Value to Household Income Ratio in Mcloud
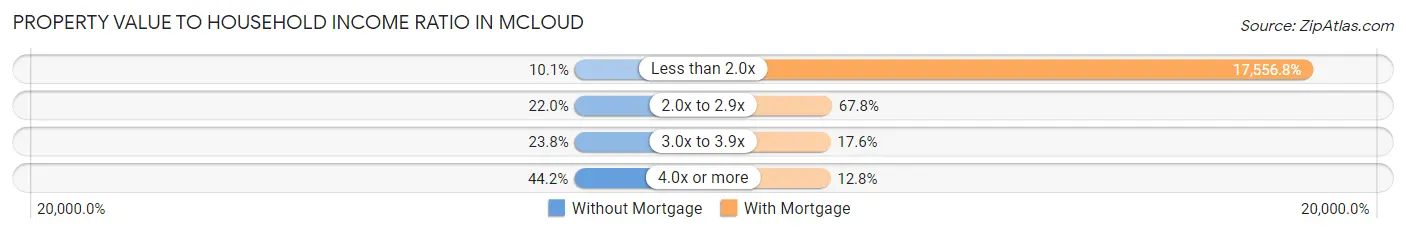
| Value-to-Income Ratio | Without Mortgage | With Mortgage |
| Less than 2.0x | 33 (10.1%) | 84,975 (17,556.8%) |
| 2.0x to 2.9x | 72 (22.0%) | 328 (67.8%) |
| 3.0x to 3.9x | 78 (23.8%) | 85 (17.6%) |
| 4.0x or more | 145 (44.2%) | 62 (12.8%) |
| Total | 328 (100.0%) | 484 (100.0%) |
Real Estate Taxes by Mortgage Status in Mcloud
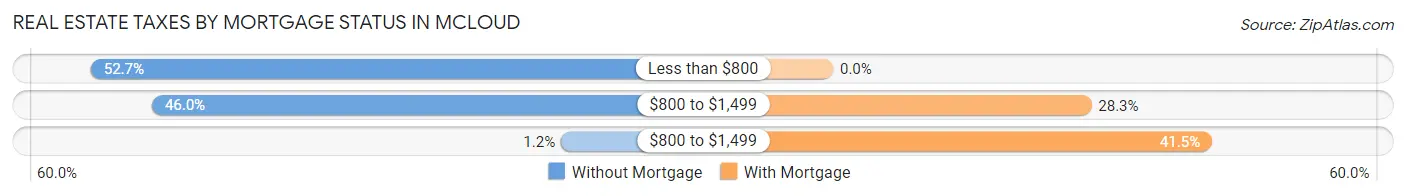
| Property Taxes | Without Mortgage | With Mortgage |
| Less than $800 | 173 (52.7%) | 0 (0.0%) |
| $800 to $1,499 | 151 (46.0%) | 137 (28.3%) |
| $800 to $1,499 | 4 (1.2%) | 201 (41.5%) |
| Total | 328 (100.0%) | 484 (100.0%) |
Health & Disability in Mcloud
Health Insurance Coverage by Age in Mcloud
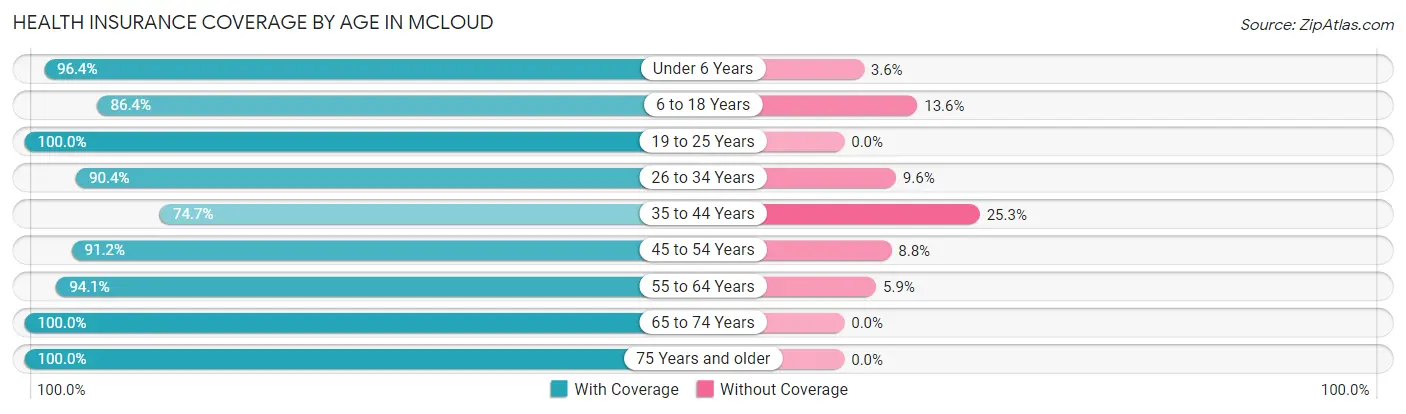
| Age Bracket | With Coverage | Without Coverage |
| Under 6 Years | 159 (96.4%) | 6 (3.6%) |
| 6 to 18 Years | 482 (86.4%) | 76 (13.6%) |
| 19 to 25 Years | 173 (100.0%) | 0 (0.0%) |
| 26 to 34 Years | 216 (90.4%) | 23 (9.6%) |
| 35 to 44 Years | 293 (74.7%) | 99 (25.3%) |
| 45 to 54 Years | 655 (91.2%) | 63 (8.8%) |
| 55 to 64 Years | 428 (94.1%) | 27 (5.9%) |
| 65 to 74 Years | 252 (100.0%) | 0 (0.0%) |
| 75 Years and older | 175 (100.0%) | 0 (0.0%) |
| Total | 2,833 (90.6%) | 294 (9.4%) |
Health Insurance Coverage by Citizenship Status in Mcloud
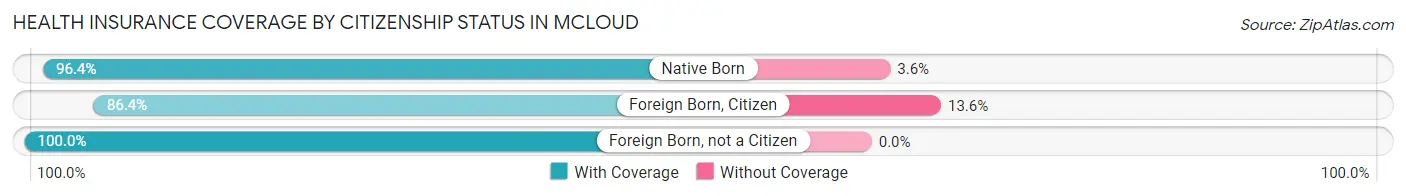
| Citizenship Status | With Coverage | Without Coverage |
| Native Born | 159 (96.4%) | 6 (3.6%) |
| Foreign Born, Citizen | 482 (86.4%) | 76 (13.6%) |
| Foreign Born, not a Citizen | 173 (100.0%) | 0 (0.0%) |
Health Insurance Coverage by Household Income in Mcloud
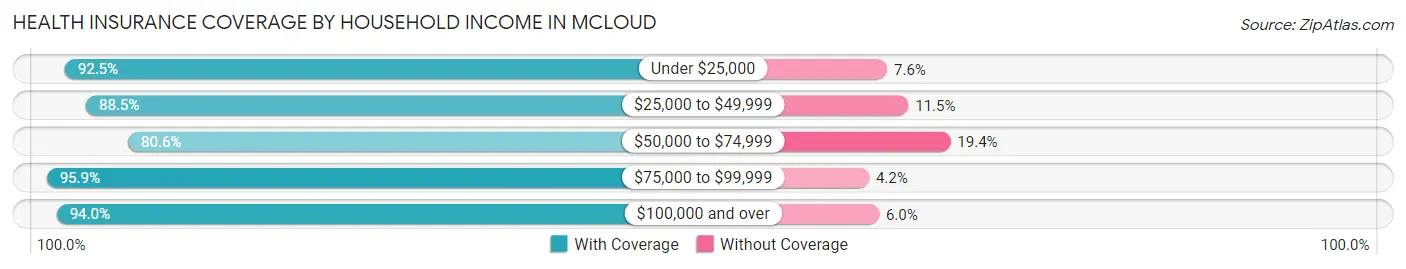
| Household Income | With Coverage | Without Coverage |
| Under $25,000 | 465 (92.4%) | 38 (7.5%) |
| $25,000 to $49,999 | 376 (88.5%) | 49 (11.5%) |
| $50,000 to $74,999 | 519 (80.6%) | 125 (19.4%) |
| $75,000 to $99,999 | 601 (95.9%) | 26 (4.2%) |
| $100,000 and over | 872 (94.0%) | 56 (6.0%) |
Public vs Private Health Insurance Coverage by Age in Mcloud
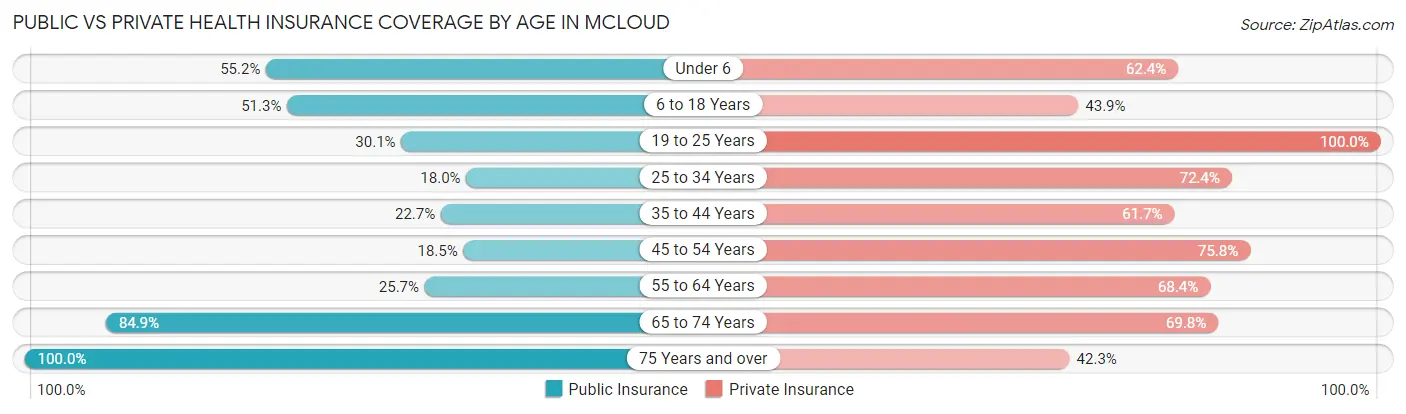
| Age Bracket | Public Insurance | Private Insurance |
| Under 6 | 91 (55.1%) | 103 (62.4%) |
| 6 to 18 Years | 286 (51.2%) | 245 (43.9%) |
| 19 to 25 Years | 52 (30.1%) | 173 (100.0%) |
| 25 to 34 Years | 43 (18.0%) | 173 (72.4%) |
| 35 to 44 Years | 89 (22.7%) | 242 (61.7%) |
| 45 to 54 Years | 133 (18.5%) | 544 (75.8%) |
| 55 to 64 Years | 117 (25.7%) | 311 (68.3%) |
| 65 to 74 Years | 214 (84.9%) | 176 (69.8%) |
| 75 Years and over | 175 (100.0%) | 74 (42.3%) |
| Total | 1,200 (38.4%) | 2,041 (65.3%) |
Disability Status by Sex by Age in Mcloud
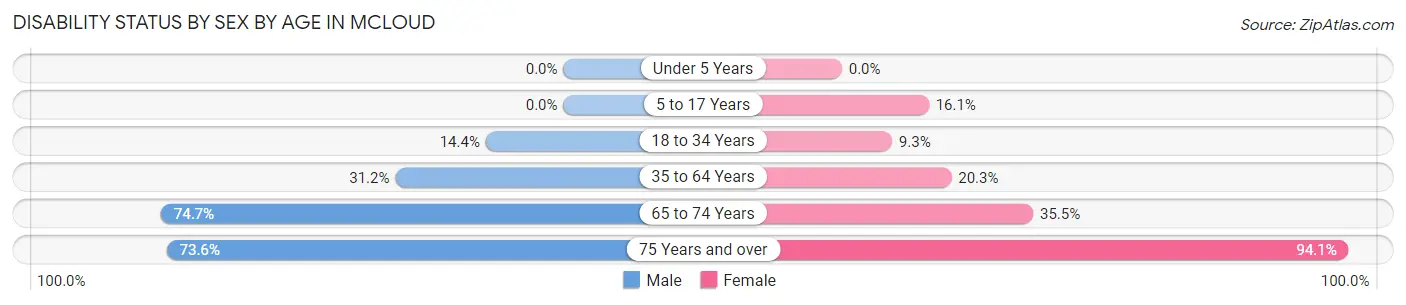
| Age Bracket | Male | Female |
| Under 5 Years | 0 (0.0%) | 0 (0.0%) |
| 5 to 17 Years | 0 (0.0%) | 45 (16.1%) |
| 18 to 34 Years | 16 (14.4%) | 28 (9.3%) |
| 35 to 64 Years | 218 (31.2%) | 176 (20.3%) |
| 65 to 74 Years | 62 (74.7%) | 60 (35.5%) |
| 75 Years and over | 67 (73.6%) | 79 (94.1%) |
Disability Class by Sex by Age in Mcloud
Disability Class: Hearing Difficulty
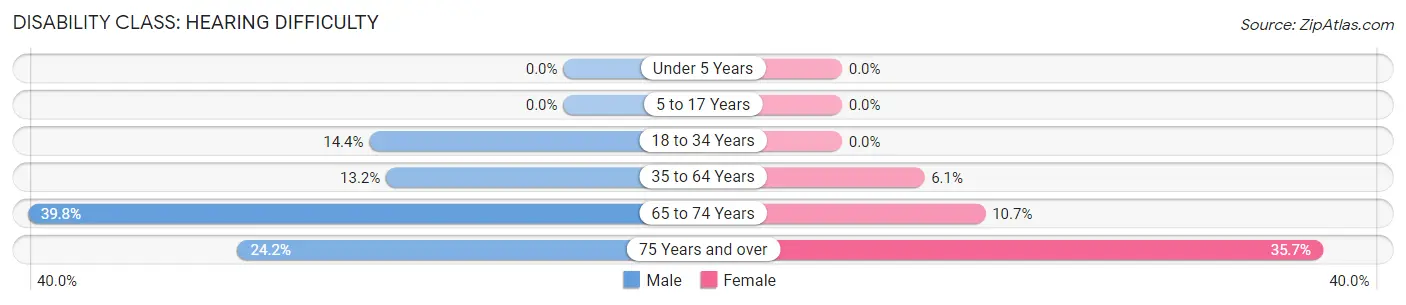
| Age Bracket | Male | Female |
| Under 5 Years | 0 (0.0%) | 0 (0.0%) |
| 5 to 17 Years | 0 (0.0%) | 0 (0.0%) |
| 18 to 34 Years | 16 (14.4%) | 0 (0.0%) |
| 35 to 64 Years | 92 (13.2%) | 53 (6.1%) |
| 65 to 74 Years | 33 (39.8%) | 18 (10.6%) |
| 75 Years and over | 22 (24.2%) | 30 (35.7%) |
Disability Class: Vision Difficulty
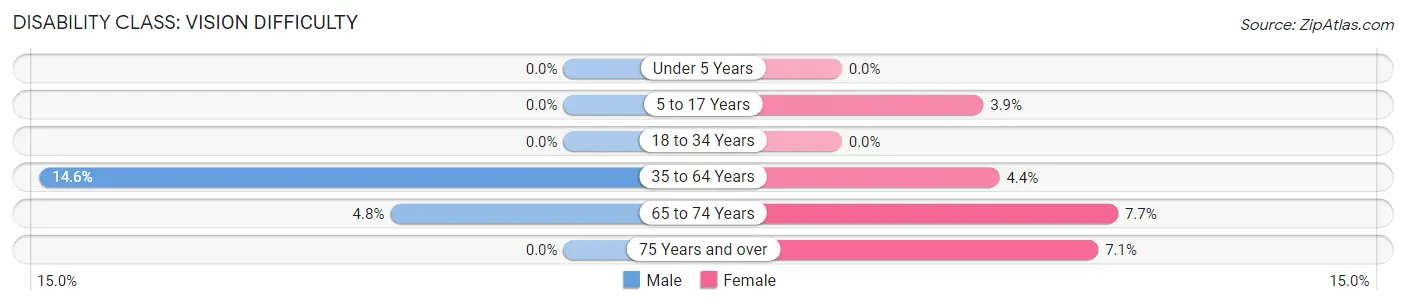
| Age Bracket | Male | Female |
| Under 5 Years | 0 (0.0%) | 0 (0.0%) |
| 5 to 17 Years | 0 (0.0%) | 11 (3.9%) |
| 18 to 34 Years | 0 (0.0%) | 0 (0.0%) |
| 35 to 64 Years | 102 (14.6%) | 38 (4.4%) |
| 65 to 74 Years | 4 (4.8%) | 13 (7.7%) |
| 75 Years and over | 0 (0.0%) | 6 (7.1%) |
Disability Class: Cognitive Difficulty
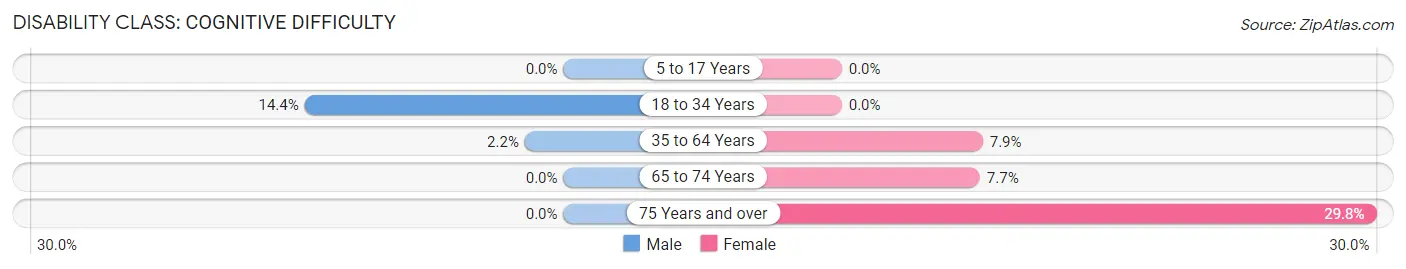
| Age Bracket | Male | Female |
| 5 to 17 Years | 0 (0.0%) | 0 (0.0%) |
| 18 to 34 Years | 16 (14.4%) | 0 (0.0%) |
| 35 to 64 Years | 15 (2.1%) | 68 (7.9%) |
| 65 to 74 Years | 0 (0.0%) | 13 (7.7%) |
| 75 Years and over | 0 (0.0%) | 25 (29.8%) |
Disability Class: Ambulatory Difficulty
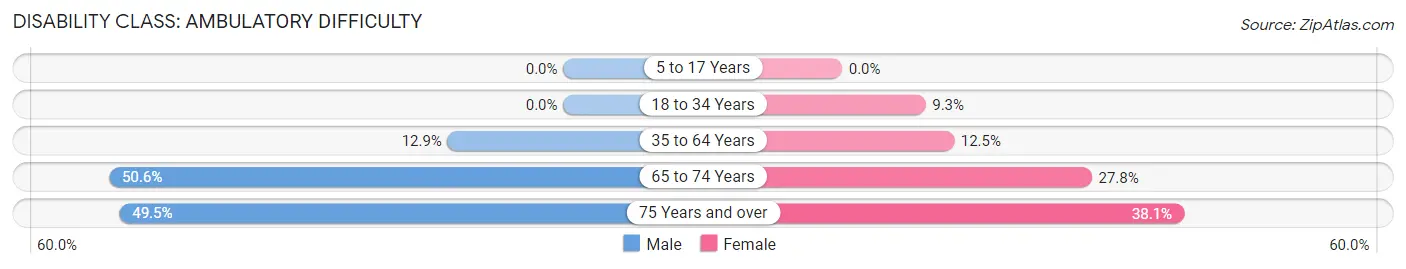
| Age Bracket | Male | Female |
| 5 to 17 Years | 0 (0.0%) | 0 (0.0%) |
| 18 to 34 Years | 0 (0.0%) | 28 (9.3%) |
| 35 to 64 Years | 90 (12.9%) | 108 (12.5%) |
| 65 to 74 Years | 42 (50.6%) | 47 (27.8%) |
| 75 Years and over | 45 (49.4%) | 32 (38.1%) |
Disability Class: Self-Care Difficulty
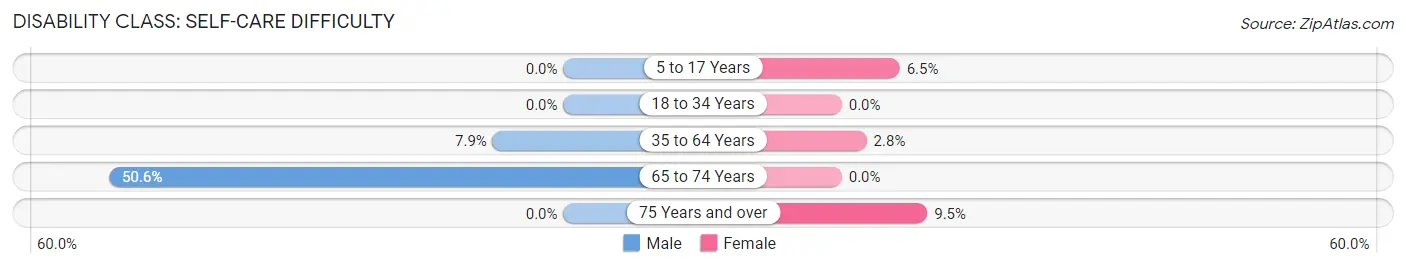
| Age Bracket | Male | Female |
| 5 to 17 Years | 0 (0.0%) | 18 (6.5%) |
| 18 to 34 Years | 0 (0.0%) | 0 (0.0%) |
| 35 to 64 Years | 55 (7.9%) | 24 (2.8%) |
| 65 to 74 Years | 42 (50.6%) | 0 (0.0%) |
| 75 Years and over | 0 (0.0%) | 8 (9.5%) |
Technology Access in Mcloud
Computing Device Access in Mcloud
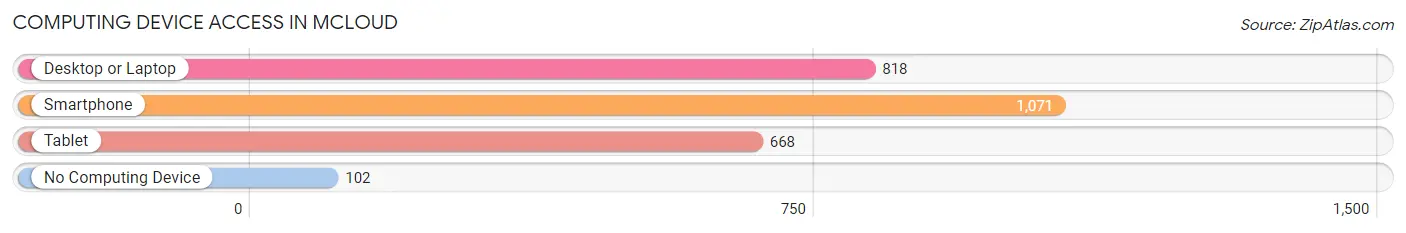
| Device Type | # Households | % Households |
| Desktop or Laptop | 818 | 68.9% |
| Smartphone | 1,071 | 90.2% |
| Tablet | 668 | 56.3% |
| No Computing Device | 102 | 8.6% |
| Total | 1,187 | 100.0% |
Internet Access in Mcloud
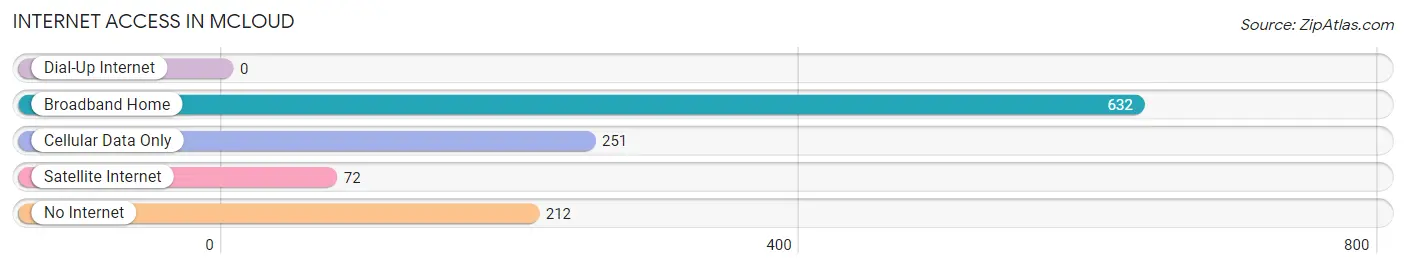
| Internet Type | # Households | % Households |
| Dial-Up Internet | 0 | 0.0% |
| Broadband Home | 632 | 53.2% |
| Cellular Data Only | 251 | 21.1% |
| Satellite Internet | 72 | 6.1% |
| No Internet | 212 | 17.9% |
| Total | 1,187 | 100.0% |
Mcloud Summary
Mcloud is a city located in the state of Oklahoma. It is situated in the southeastern part of the state, about 30 miles south of Oklahoma City. The city has a population of approximately 5,000 people and is part of the Oklahoma City metropolitan area.
History
Mcloud was founded in 1891 by the Choctaw Nation. The town was named after Chief Mcloud, a prominent leader of the Choctaw Nation. The town was originally a trading post and was used as a stopover for travelers on the Chisholm Trail. In the early 1900s, the town began to grow and develop as a center for agriculture and industry. The town was incorporated in 1910 and by the 1920s, it had become a thriving community with a population of over 1,000 people.
In the 1950s, Mcloud experienced a period of growth and development. The town was home to several businesses, including a cotton gin, a lumber mill, and a brick factory. The town also had a number of churches, schools, and other amenities.
Geography
Mcloud is located in the southeastern part of Oklahoma, about 30 miles south of Oklahoma City. The city is situated in the Cross Timbers region of the state, which is characterized by rolling hills and wooded areas. The city is located on the banks of the North Canadian River, which flows through the city. The city is also located near several lakes, including Lake Thunderbird and Lake Stanley Draper.
Economy
Mcloud’s economy is largely based on agriculture and manufacturing. The city is home to several large agricultural operations, including a cotton gin, a lumber mill, and a brick factory. The city also has a number of small businesses, including restaurants, retail stores, and service providers.
Demographics
As of the 2010 census, the population of Mcloud was 5,000 people. The racial makeup of the city was 79.2% White, 15.2% African American, 0.7% Native American, 0.3% Asian, and 4.6% from other races. The median household income was $37,500 and the median family income was $45,000. The per capita income was $18,000.
Mcloud is a small city with a rich history and a diverse economy. The city is home to a number of businesses and amenities, and is a great place to live and work. The city is also home to a number of parks and recreational areas, making it a great place to spend time outdoors.
Common Questions
What is Per Capita Income in Mcloud?
Per Capita income in Mcloud is $22,172.
What is the Median Family Income in Mcloud?
Median Family Income in Mcloud is $83,336.
What is the Median Household income in Mcloud?
Median Household Income in Mcloud is $67,207.
What is Income or Wage Gap in Mcloud?
Income or Wage Gap in Mcloud is 54.8%.
Women in Mcloud earn 45.2 cents for every dollar earned by a man.
What is Inequality or Gini Index in Mcloud?
Inequality or Gini Index in Mcloud is 0.43.
What is the Total Population of Mcloud?
Total Population of Mcloud is 4,394.
What is the Total Male Population of Mcloud?
Total Male Population of Mcloud is 1,397.
What is the Total Female Population of Mcloud?
Total Female Population of Mcloud is 2,997.
What is the Ratio of Males per 100 Females in Mcloud?
There are 46.61 Males per 100 Females in Mcloud.
What is the Ratio of Females per 100 Males in Mcloud?
There are 214.53 Females per 100 Males in Mcloud.
What is the Median Population Age in Mcloud?
Median Population Age in Mcloud is 40.8 Years.
What is the Average Family Size in Mcloud
Average Family Size in Mcloud is 3.2 People.
What is the Average Household Size in Mcloud
Average Household Size in Mcloud is 2.6 People.
How Large is the Labor Force in Mcloud?
There are 1,430 People in the Labor Forcein in Mcloud.
What is the Percentage of People in the Labor Force in Mcloud?
37.9% of People are in the Labor Force in Mcloud.
What is the Unemployment Rate in Mcloud?
Unemployment Rate in Mcloud is 3.7%.