Mcalester, OK Map & Demographics
Mcalester Map
Mcalester Overview
$26,239
PER CAPITA INCOME
$63,434
AVG FAMILY INCOME
$46,875
AVG HOUSEHOLD INCOME
33.9%
WAGE / INCOME GAP [ % ]
66.1¢/ $1
WAGE / INCOME GAP [ $ ]
$10,932
FAMILY INCOME DEFICIT
0.49
INEQUALITY / GINI INDEX
18,110
TOTAL POPULATION
9,554
MALE POPULATION
8,556
FEMALE POPULATION
111.66
MALES / 100 FEMALES
89.55
FEMALES / 100 MALES
36.3
MEDIAN AGE
3.0
AVG FAMILY SIZE
2.3
AVG HOUSEHOLD SIZE
7,520
LABOR FORCE [ PEOPLE ]
52.6%
PERCENT IN LABOR FORCE
8.0%
UNEMPLOYMENT RATE
Mcalester Zip Codes
Mcalester Area Codes
Income in Mcalester
Income Overview in Mcalester
Per Capita Income in Mcalester is $26,239, while median incomes of families and households are $63,434 and $46,875 respectively.
| Characteristic | Number | Measure |
| Per Capita Income | 18,110 | $26,239 |
| Median Family Income | 4,172 | $63,434 |
| Mean Family Income | 4,172 | $84,608 |
| Median Household Income | 6,970 | $46,875 |
| Mean Household Income | 6,970 | $67,873 |
| Income Deficit | 4,172 | $10,932 |
| Wage / Income Gap (%) | 18,110 | 33.88% |
| Wage / Income Gap ($) | 18,110 | 66.12¢ per $1 |
| Gini / Inequality Index | 18,110 | 0.49 |
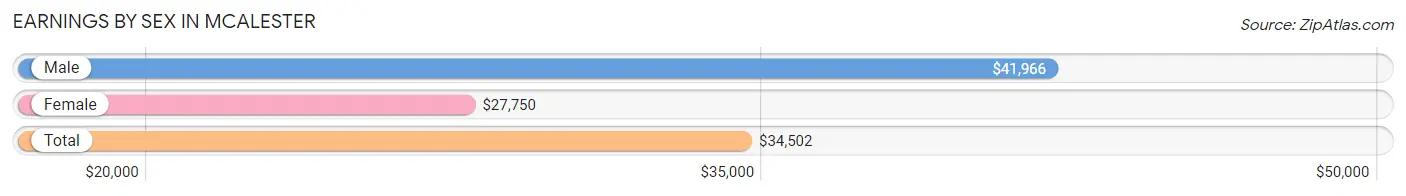
Earnings by Sex in Mcalester
Average Earnings in Mcalester are $34,502, $41,966 for men and $27,750 for women, a difference of 33.9%.
| Sex | Number | Average Earnings |
| Male | 3,980 (51.6%) | $41,966 |
| Female | 3,727 (48.4%) | $27,750 |
| Total | 7,707 (100.0%) | $34,502 |
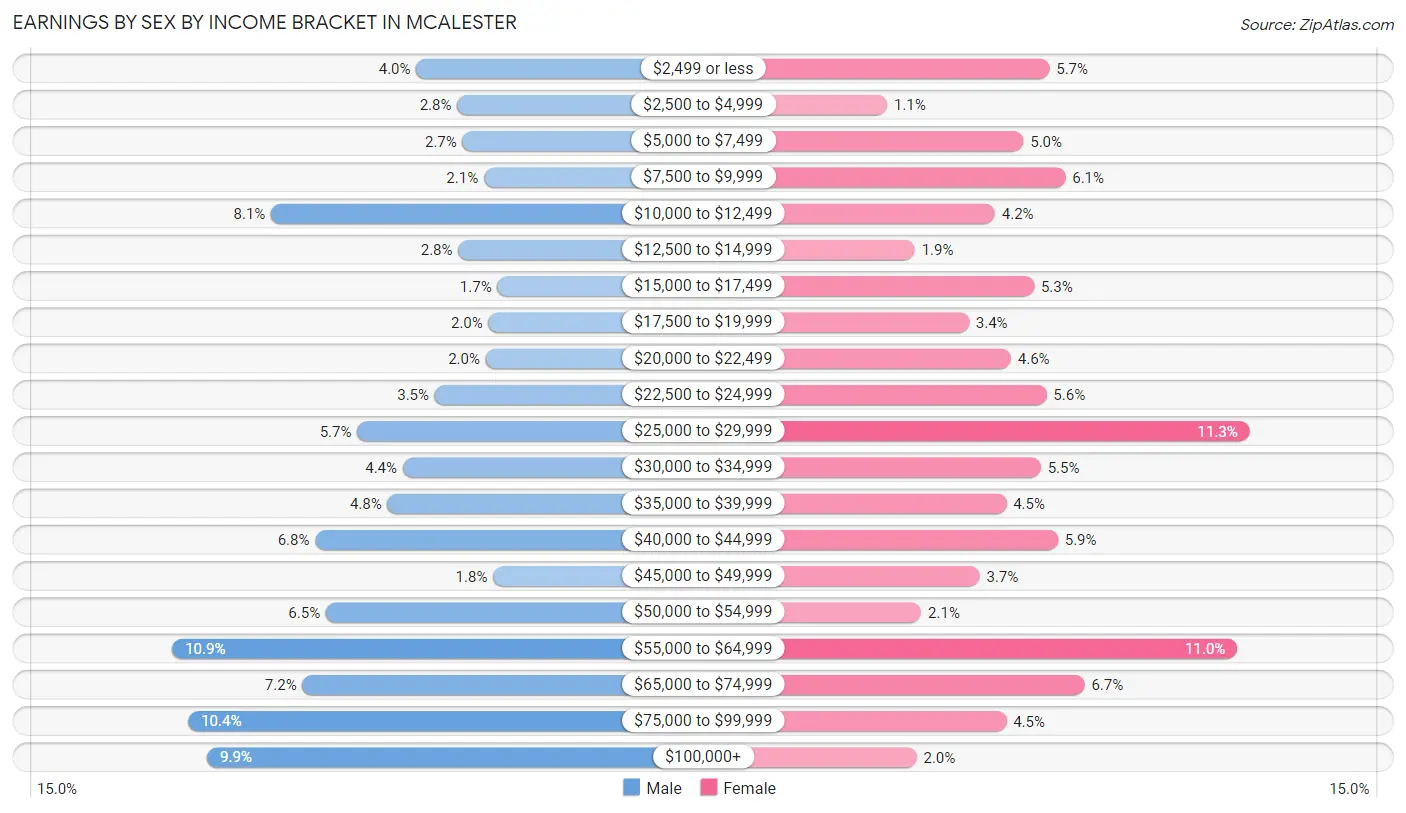
Earnings by Sex by Income Bracket in Mcalester
The most common earnings brackets in Mcalester are $55,000 to $64,999 for men (432 | 10.8%) and $25,000 to $29,999 for women (422 | 11.3%).
| Income | Male | Female |
| $2,499 or less | 159 (4.0%) | 212 (5.7%) |
| $2,500 to $4,999 | 113 (2.8%) | 42 (1.1%) |
| $5,000 to $7,499 | 107 (2.7%) | 185 (5.0%) |
| $7,500 to $9,999 | 83 (2.1%) | 229 (6.1%) |
| $10,000 to $12,499 | 321 (8.1%) | 155 (4.2%) |
| $12,500 to $14,999 | 112 (2.8%) | 71 (1.9%) |
| $15,000 to $17,499 | 68 (1.7%) | 196 (5.3%) |
| $17,500 to $19,999 | 78 (2.0%) | 128 (3.4%) |
| $20,000 to $22,499 | 81 (2.0%) | 172 (4.6%) |
| $22,500 to $24,999 | 138 (3.5%) | 209 (5.6%) |
| $25,000 to $29,999 | 225 (5.7%) | 422 (11.3%) |
| $30,000 to $34,999 | 174 (4.4%) | 203 (5.4%) |
| $35,000 to $39,999 | 191 (4.8%) | 167 (4.5%) |
| $40,000 to $44,999 | 272 (6.8%) | 221 (5.9%) |
| $45,000 to $49,999 | 73 (1.8%) | 139 (3.7%) |
| $50,000 to $54,999 | 260 (6.5%) | 78 (2.1%) |
| $55,000 to $64,999 | 432 (10.8%) | 409 (11.0%) |
| $65,000 to $74,999 | 286 (7.2%) | 249 (6.7%) |
| $75,000 to $99,999 | 414 (10.4%) | 167 (4.5%) |
| $100,000+ | 393 (9.9%) | 73 (2.0%) |
| Total | 3,980 (100.0%) | 3,727 (100.0%) |
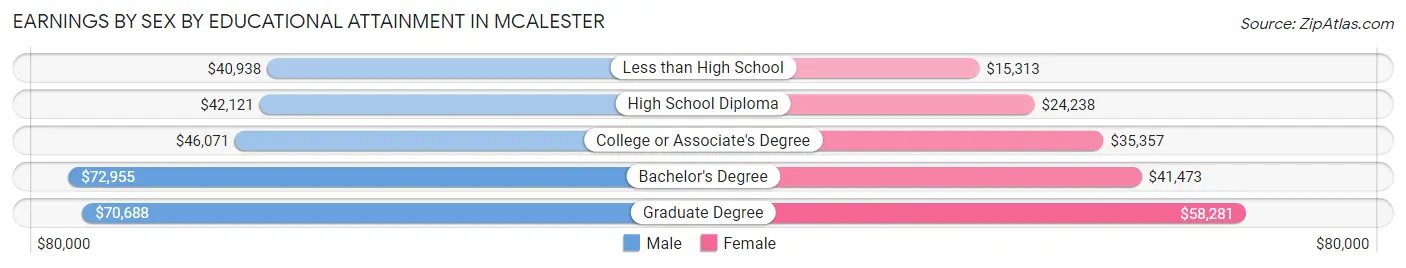
Earnings by Sex by Educational Attainment in Mcalester
Average earnings in Mcalester are $51,647 for men and $31,139 for women, a difference of 39.7%. Men with an educational attainment of bachelor's degree enjoy the highest average annual earnings of $72,955, while those with less than high school education earn the least with $40,938. Women with an educational attainment of graduate degree earn the most with the average annual earnings of $58,281, while those with less than high school education have the smallest earnings of $15,313.
| Educational Attainment | Male Income | Female Income |
| Less than High School | $40,938 | $15,313 |
| High School Diploma | $42,121 | $24,238 |
| College or Associate's Degree | $46,071 | $35,357 |
| Bachelor's Degree | $72,955 | $41,473 |
| Graduate Degree | $70,688 | $58,281 |
| Total | $51,647 | $31,139 |
Family Income in Mcalester
Family Income Brackets in Mcalester
According to the Mcalester family income data, there are 734 families falling into the $100,000 to $149,999 income range, which is the most common income bracket and makes up 17.6% of all families. Conversely, the $10,000 to $14,999 income bracket is the least frequent group with only 188 families (4.5%) belonging to this category.
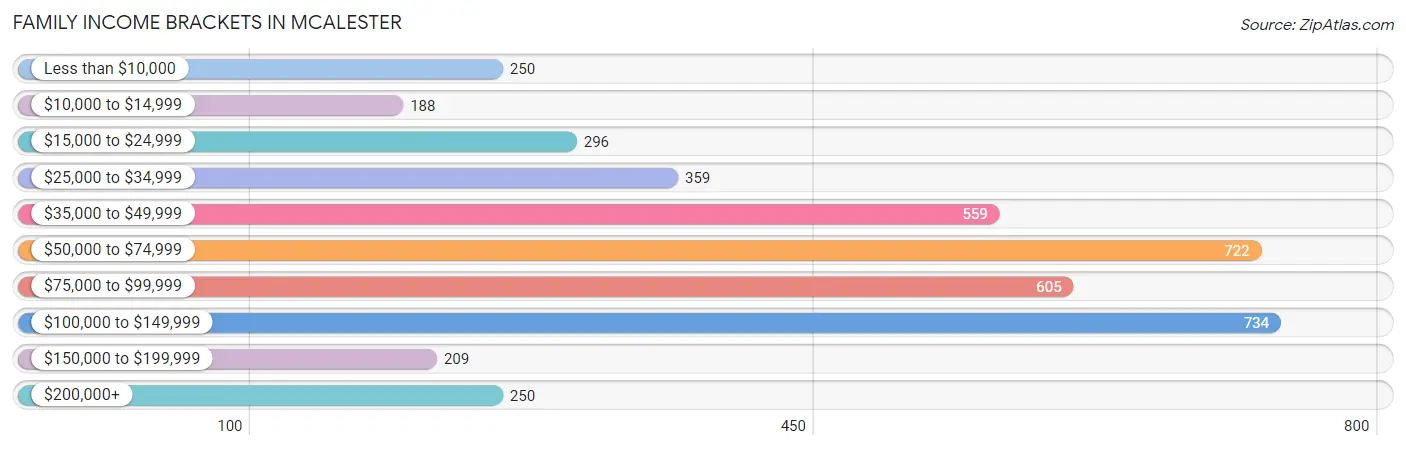
| Income Bracket | # Families | % Families |
| Less than $10,000 | 250 | 6.0% |
| $10,000 to $14,999 | 188 | 4.5% |
| $15,000 to $24,999 | 296 | 7.1% |
| $25,000 to $34,999 | 359 | 8.6% |
| $35,000 to $49,999 | 559 | 13.4% |
| $50,000 to $74,999 | 722 | 17.3% |
| $75,000 to $99,999 | 605 | 14.5% |
| $100,000 to $149,999 | 734 | 17.6% |
| $150,000 to $199,999 | 209 | 5.0% |
| $200,000+ | 250 | 6.0% |
Family Income by Famaliy Size in Mcalester
5-person families (322 | 7.7%) account for the highest median family income in Mcalester with $76,618 per family, while 2-person families (1,935 | 46.4%) have the highest median income of $31,380 per family member.
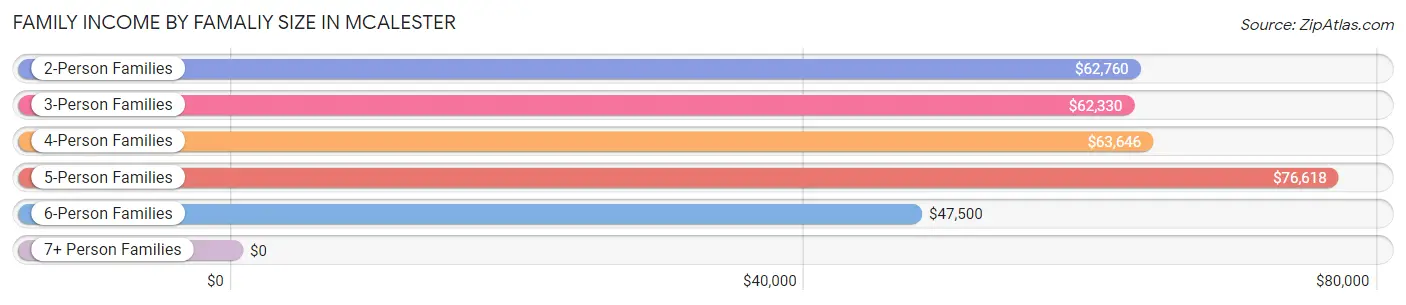
| Income Bracket | # Families | Median Income |
| 2-Person Families | 1,935 (46.4%) | $62,760 |
| 3-Person Families | 1,038 (24.9%) | $62,330 |
| 4-Person Families | 704 (16.9%) | $63,646 |
| 5-Person Families | 322 (7.7%) | $76,618 |
| 6-Person Families | 166 (4.0%) | $47,500 |
| 7+ Person Families | 7 (0.2%) | $0 |
| Total | 4,172 (100.0%) | $63,434 |
Family Income by Number of Earners in Mcalester
The median family income in Mcalester is $63,434, with families comprising 3+ earners (254) having the highest median family income of $150,875, while families with no earners (636) have the lowest median family income of $42,031, accounting for 6.1% and 15.2% of families, respectively.
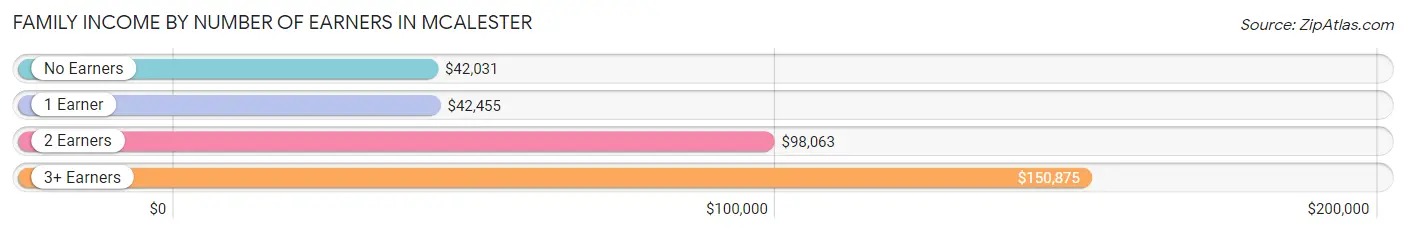
| Number of Earners | # Families | Median Income |
| No Earners | 636 (15.2%) | $42,031 |
| 1 Earner | 1,748 (41.9%) | $42,455 |
| 2 Earners | 1,534 (36.8%) | $98,063 |
| 3+ Earners | 254 (6.1%) | $150,875 |
| Total | 4,172 (100.0%) | $63,434 |
Household Income in Mcalester
Household Income Brackets in Mcalester
With 1,255 households falling in the category, the $50,000 to $74,999 income range is the most frequent in Mcalester, accounting for 18.0% of all households. In contrast, only 258 households (3.7%) fall into the $200,000+ income bracket, making it the least populous group.
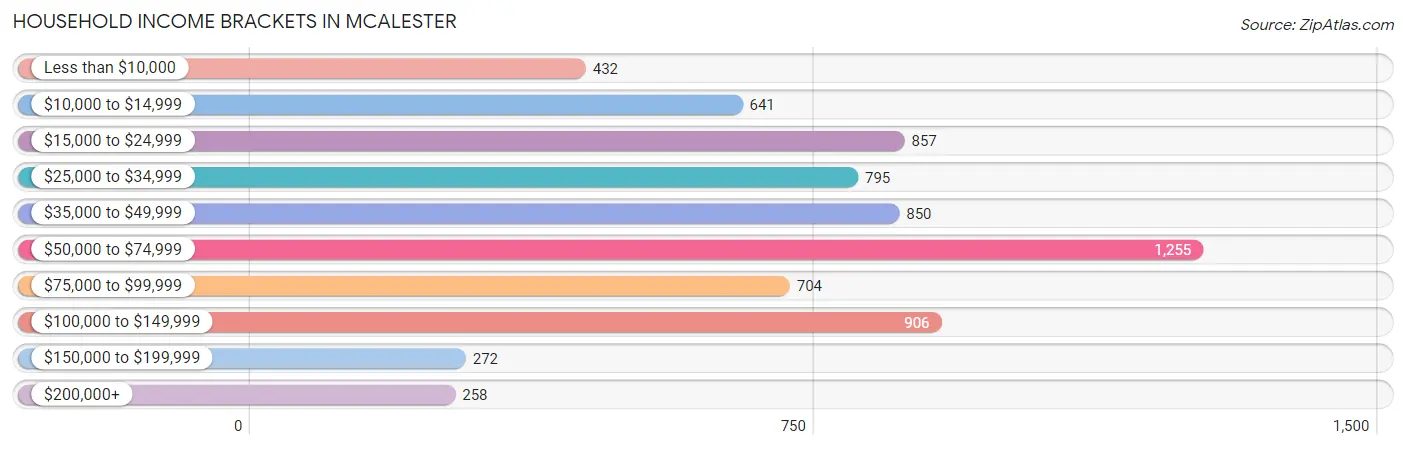
| Income Bracket | # Households | % Households |
| Less than $10,000 | 432 | 6.2% |
| $10,000 to $14,999 | 641 | 9.2% |
| $15,000 to $24,999 | 857 | 12.3% |
| $25,000 to $34,999 | 795 | 11.4% |
| $35,000 to $49,999 | 850 | 12.2% |
| $50,000 to $74,999 | 1,255 | 18.0% |
| $75,000 to $99,999 | 704 | 10.1% |
| $100,000 to $149,999 | 906 | 13.0% |
| $150,000 to $199,999 | 272 | 3.9% |
| $200,000+ | 258 | 3.7% |
Household Income by Householder Age in Mcalester
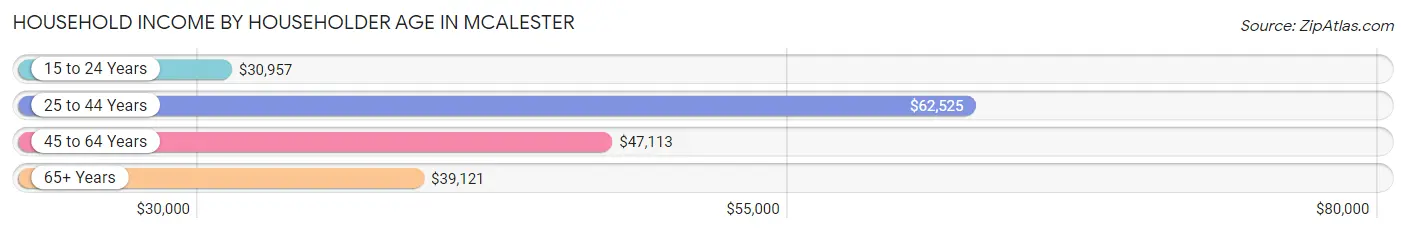
The median household income in Mcalester is $46,875, with the highest median household income of $62,525 found in the 25 to 44 years age bracket for the primary householder. A total of 2,399 households (34.4%) fall into this category. Meanwhile, the 15 to 24 years age bracket for the primary householder has the lowest median household income of $30,957, with 492 households (7.1%) in this group.
| Income Bracket | # Households | Median Income |
| 15 to 24 Years | 492 (7.1%) | $30,957 |
| 25 to 44 Years | 2,399 (34.4%) | $62,525 |
| 45 to 64 Years | 2,110 (30.3%) | $47,113 |
| 65+ Years | 1,969 (28.2%) | $39,121 |
| Total | 6,970 (100.0%) | $46,875 |
Poverty in Mcalester
Income Below Poverty by Sex and Age in Mcalester
With 24.0% poverty level for males and 24.2% for females among the residents of Mcalester, 5 year old males and 15 year old females are the most vulnerable to poverty, with 28 males (56.0%) and 53 females (46.9%) in their respective age groups living below the poverty level.
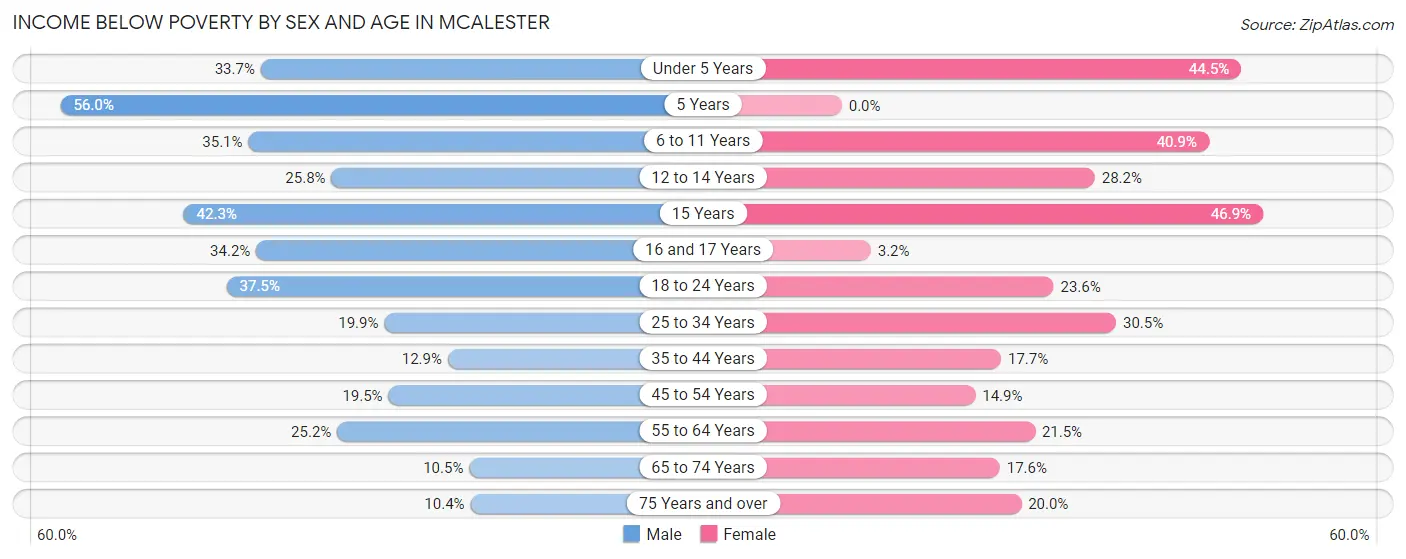
| Age Bracket | Male | Female |
| Under 5 Years | 184 (33.7%) | 225 (44.5%) |
| 5 Years | 28 (56.0%) | 0 (0.0%) |
| 6 to 11 Years | 302 (35.1%) | 277 (40.9%) |
| 12 to 14 Years | 101 (25.8%) | 82 (28.2%) |
| 15 Years | 63 (42.3%) | 53 (46.9%) |
| 16 and 17 Years | 78 (34.2%) | 5 (3.2%) |
| 18 to 24 Years | 261 (37.5%) | 166 (23.6%) |
| 25 to 34 Years | 204 (19.9%) | 353 (30.5%) |
| 35 to 44 Years | 147 (12.9%) | 192 (17.7%) |
| 45 to 54 Years | 135 (19.5%) | 124 (14.9%) |
| 55 to 64 Years | 262 (25.2%) | 231 (21.5%) |
| 65 to 74 Years | 59 (10.5%) | 129 (17.6%) |
| 75 Years and over | 41 (10.3%) | 177 (20.0%) |
| Total | 1,865 (24.0%) | 2,014 (24.2%) |
Income Above Poverty by Sex and Age in Mcalester
According to the poverty statistics in Mcalester, males aged 75 years and over and females aged 5 years are the age groups that are most secure financially, with 89.6% of males and 100.0% of females in these age groups living above the poverty line.
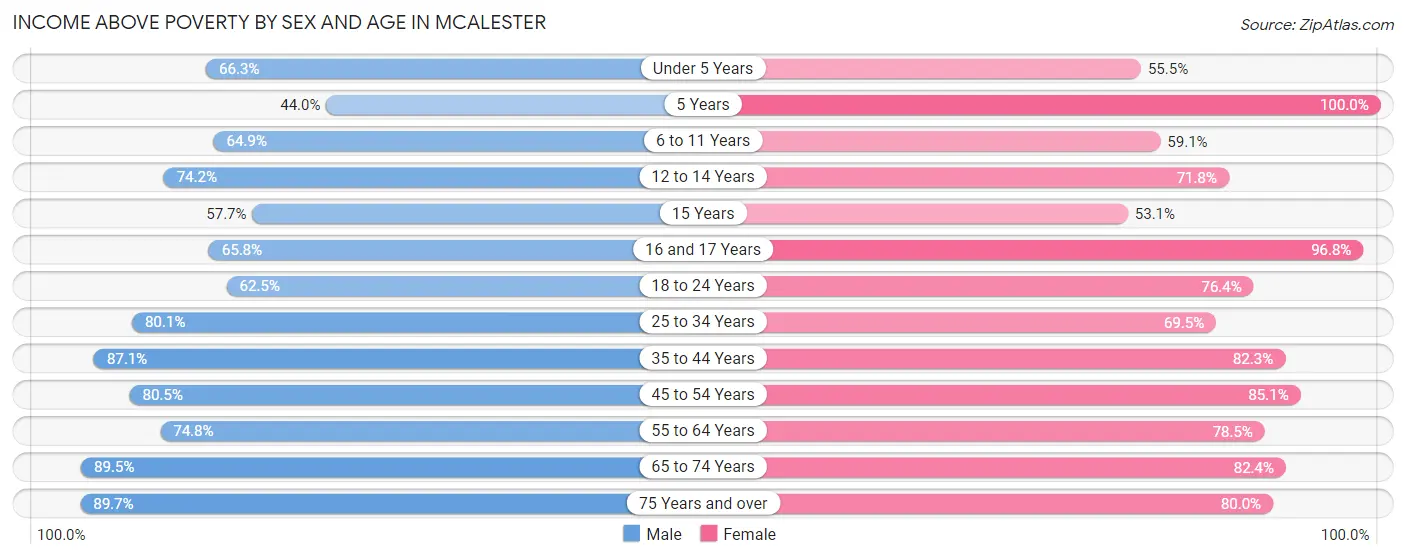
| Age Bracket | Male | Female |
| Under 5 Years | 362 (66.3%) | 281 (55.5%) |
| 5 Years | 22 (44.0%) | 121 (100.0%) |
| 6 to 11 Years | 559 (64.9%) | 401 (59.1%) |
| 12 to 14 Years | 290 (74.2%) | 209 (71.8%) |
| 15 Years | 86 (57.7%) | 60 (53.1%) |
| 16 and 17 Years | 150 (65.8%) | 150 (96.8%) |
| 18 to 24 Years | 435 (62.5%) | 538 (76.4%) |
| 25 to 34 Years | 819 (80.1%) | 803 (69.5%) |
| 35 to 44 Years | 995 (87.1%) | 890 (82.3%) |
| 45 to 54 Years | 558 (80.5%) | 710 (85.1%) |
| 55 to 64 Years | 778 (74.8%) | 843 (78.5%) |
| 65 to 74 Years | 504 (89.5%) | 604 (82.4%) |
| 75 Years and over | 355 (89.6%) | 709 (80.0%) |
| Total | 5,913 (76.0%) | 6,319 (75.8%) |
Income Below Poverty Among Married-Couple Families in Mcalester
The poverty statistics for married-couple families in Mcalester show that 10.9% or 316 of the total 2,900 families live below the poverty line. Families with 3 or 4 children have the highest poverty rate of 17.3%, comprising of 36 families. On the other hand, families with no children have the lowest poverty rate of 7.8%, which includes 125 families.
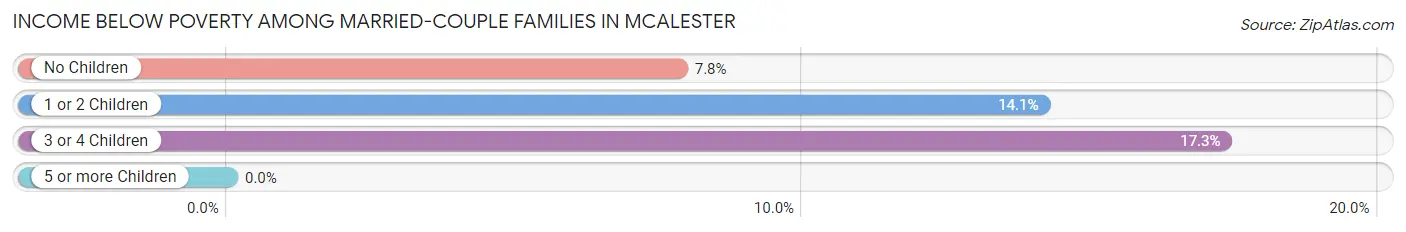
| Children | Above Poverty | Below Poverty |
| No Children | 1,471 (92.2%) | 125 (7.8%) |
| 1 or 2 Children | 941 (85.9%) | 155 (14.1%) |
| 3 or 4 Children | 172 (82.7%) | 36 (17.3%) |
| 5 or more Children | 0 (0.0%) | 0 (0.0%) |
| Total | 2,584 (89.1%) | 316 (10.9%) |
Income Below Poverty Among Single-Parent Households in Mcalester
According to the poverty data in Mcalester, 35.3% or 101 single-father households and 34.3% or 338 single-mother households are living below the poverty line. Among single-father households, those with 5 or more children have the highest poverty rate, with 26 households (100.0%) experiencing poverty. Likewise, among single-mother households, those with 5 or more children have the highest poverty rate, with 49 households (100.0%) falling below the poverty line.
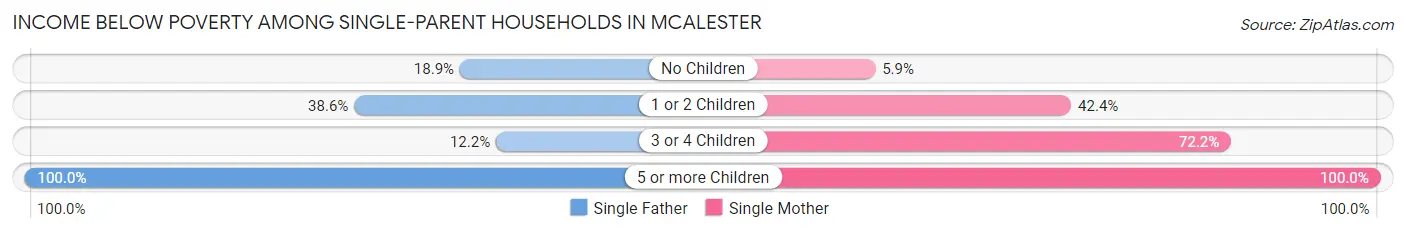
| Children | Single Father | Single Mother |
| No Children | 14 (18.9%) | 22 (5.9%) |
| 1 or 2 Children | 56 (38.6%) | 197 (42.4%) |
| 3 or 4 Children | 5 (12.2%) | 70 (72.2%) |
| 5 or more Children | 26 (100.0%) | 49 (100.0%) |
| Total | 101 (35.3%) | 338 (34.3%) |
Income Below Poverty Among Married-Couple vs Single-Parent Households in Mcalester
The poverty data for Mcalester shows that 316 of the married-couple family households (10.9%) and 439 of the single-parent households (34.5%) are living below the poverty level. Within the married-couple family households, those with 3 or 4 children have the highest poverty rate, with 36 households (17.3%) falling below the poverty line. Among the single-parent households, those with 5 or more children have the highest poverty rate, with 75 household (100.0%) living below poverty.
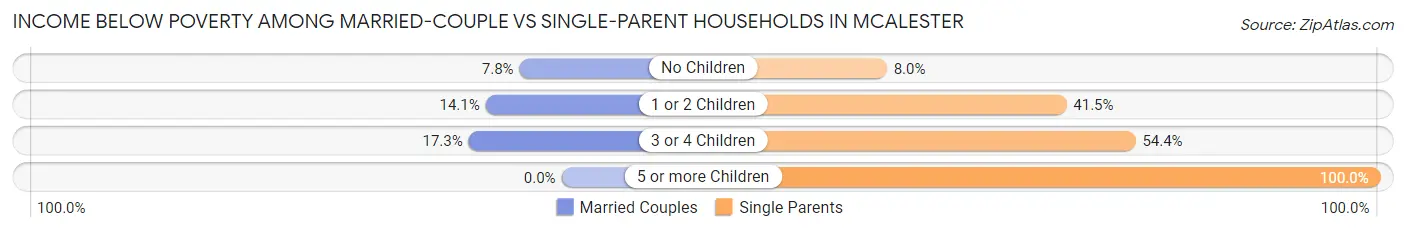
| Children | Married-Couple Families | Single-Parent Households |
| No Children | 125 (7.8%) | 36 (8.0%) |
| 1 or 2 Children | 155 (14.1%) | 253 (41.5%) |
| 3 or 4 Children | 36 (17.3%) | 75 (54.3%) |
| 5 or more Children | 0 (0.0%) | 75 (100.0%) |
| Total | 316 (10.9%) | 439 (34.5%) |
Race in Mcalester
The most populous races in Mcalester are White / Caucasian (12,504 | 69.0%), Two or more Races (2,833 | 15.6%), and Native / Alaskan (1,449 | 8.0%).
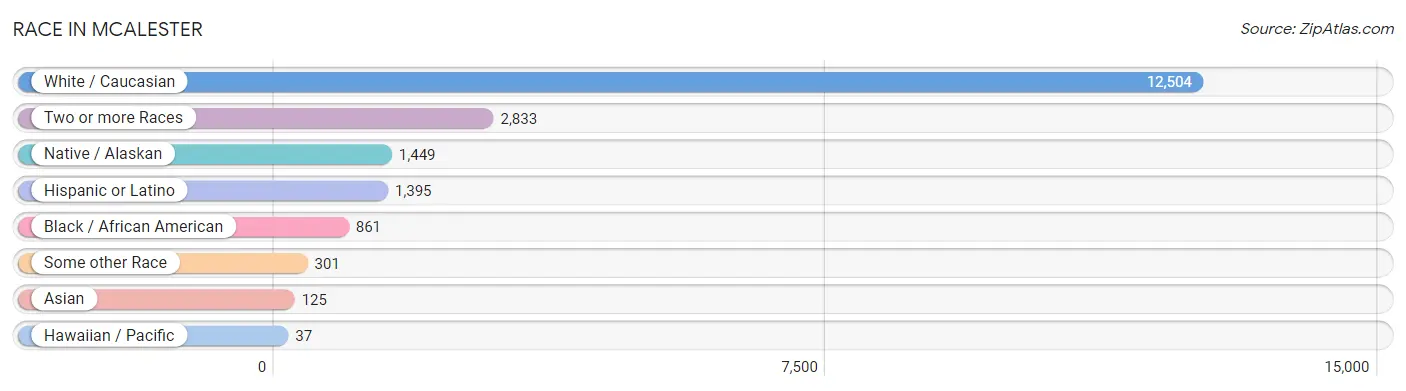
| Race | # Population | % Population |
| Asian | 125 | 0.7% |
| Black / African American | 861 | 4.8% |
| Hawaiian / Pacific | 37 | 0.2% |
| Hispanic or Latino | 1,395 | 7.7% |
| Native / Alaskan | 1,449 | 8.0% |
| White / Caucasian | 12,504 | 69.0% |
| Two or more Races | 2,833 | 15.6% |
| Some other Race | 301 | 1.7% |
| Total | 18,110 | 100.0% |
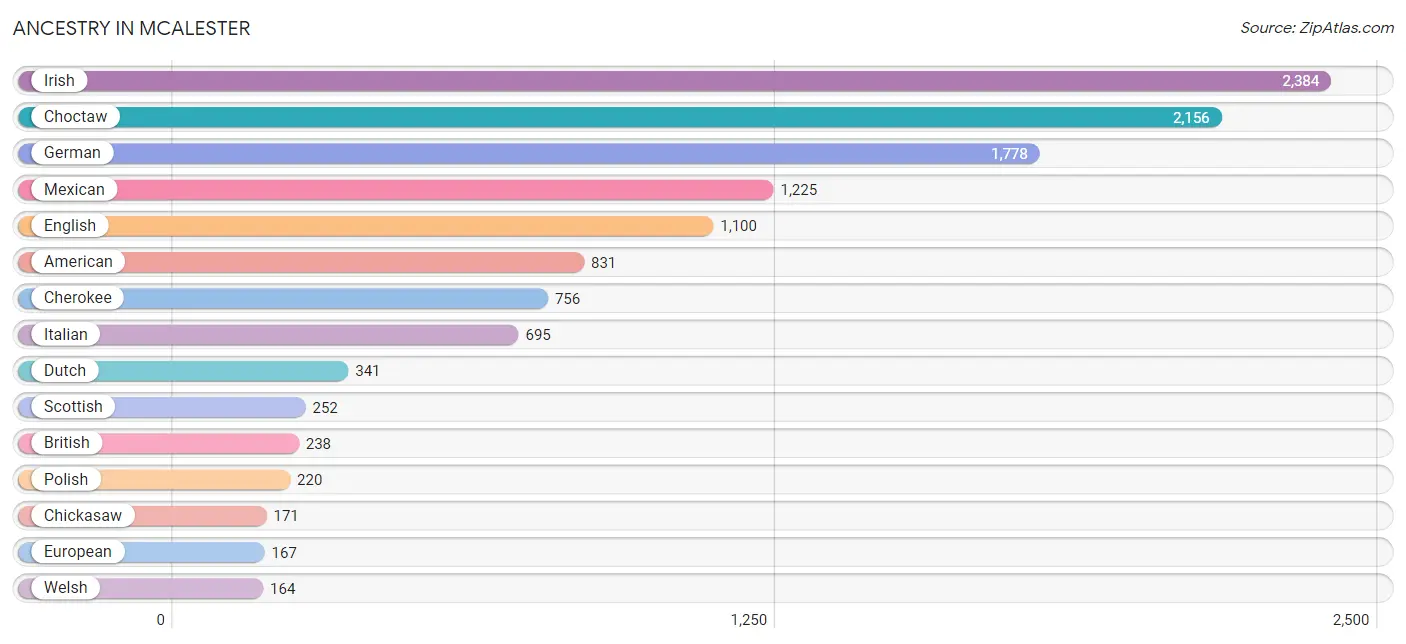
Ancestry in Mcalester
The most populous ancestries reported in Mcalester are Irish (2,384 | 13.2%), Choctaw (2,156 | 11.9%), German (1,778 | 9.8%), Mexican (1,225 | 6.8%), and English (1,100 | 6.1%), together accounting for 47.7% of all Mcalester residents.
| Ancestry | # Population | % Population |
| Alaska Native | 7 | 0.0% |
| American | 831 | 4.6% |
| Arab | 5 | 0.0% |
| Bhutanese | 17 | 0.1% |
| Blackfeet | 37 | 0.2% |
| British | 238 | 1.3% |
| Burmese | 25 | 0.1% |
| Cajun | 12 | 0.1% |
| Canadian | 8 | 0.0% |
| Central American | 22 | 0.1% |
| Cherokee | 756 | 4.2% |
| Cheyenne | 12 | 0.1% |
| Chickasaw | 171 | 0.9% |
| Choctaw | 2,156 | 11.9% |
| Comanche | 101 | 0.6% |
| Creek | 117 | 0.6% |
| Danish | 9 | 0.1% |
| Dutch | 341 | 1.9% |
| Dutch West Indian | 11 | 0.1% |
| English | 1,100 | 6.1% |
| European | 167 | 0.9% |
| Finnish | 20 | 0.1% |
| French | 142 | 0.8% |
| French Canadian | 60 | 0.3% |
| German | 1,778 | 9.8% |
| Ghanaian | 2 | 0.0% |
| Greek | 14 | 0.1% |
| Guatemalan | 20 | 0.1% |
| Hungarian | 18 | 0.1% |
| Indian (Asian) | 29 | 0.2% |
| Irish | 2,384 | 13.2% |
| Iroquois | 22 | 0.1% |
| Italian | 695 | 3.8% |
| Kiowa | 69 | 0.4% |
| Korean | 18 | 0.1% |
| Liberian | 5 | 0.0% |
| Lithuanian | 43 | 0.2% |
| Mexican | 1,225 | 6.8% |
| Navajo | 31 | 0.2% |
| Nigerian | 36 | 0.2% |
| Northern European | 16 | 0.1% |
| Norwegian | 55 | 0.3% |
| Osage | 2 | 0.0% |
| Polish | 220 | 1.2% |
| Portuguese | 148 | 0.8% |
| Potawatomi | 3 | 0.0% |
| Puerto Rican | 106 | 0.6% |
| Russian | 15 | 0.1% |
| Salvadoran | 2 | 0.0% |
| Samoan | 37 | 0.2% |
| Scandinavian | 8 | 0.0% |
| Scotch-Irish | 160 | 0.9% |
| Scottish | 252 | 1.4% |
| Seminole | 31 | 0.2% |
| Shoshone | 31 | 0.2% |
| Sioux | 33 | 0.2% |
| South African | 28 | 0.2% |
| Spaniard | 18 | 0.1% |
| Sri Lankan | 28 | 0.2% |
| Subsaharan African | 71 | 0.4% |
| Swedish | 21 | 0.1% |
| Thai | 43 | 0.2% |
| Ukrainian | 23 | 0.1% |
| Welsh | 164 | 0.9% |
| Yup'ik | 8 | 0.0% | View All 65 Rows |
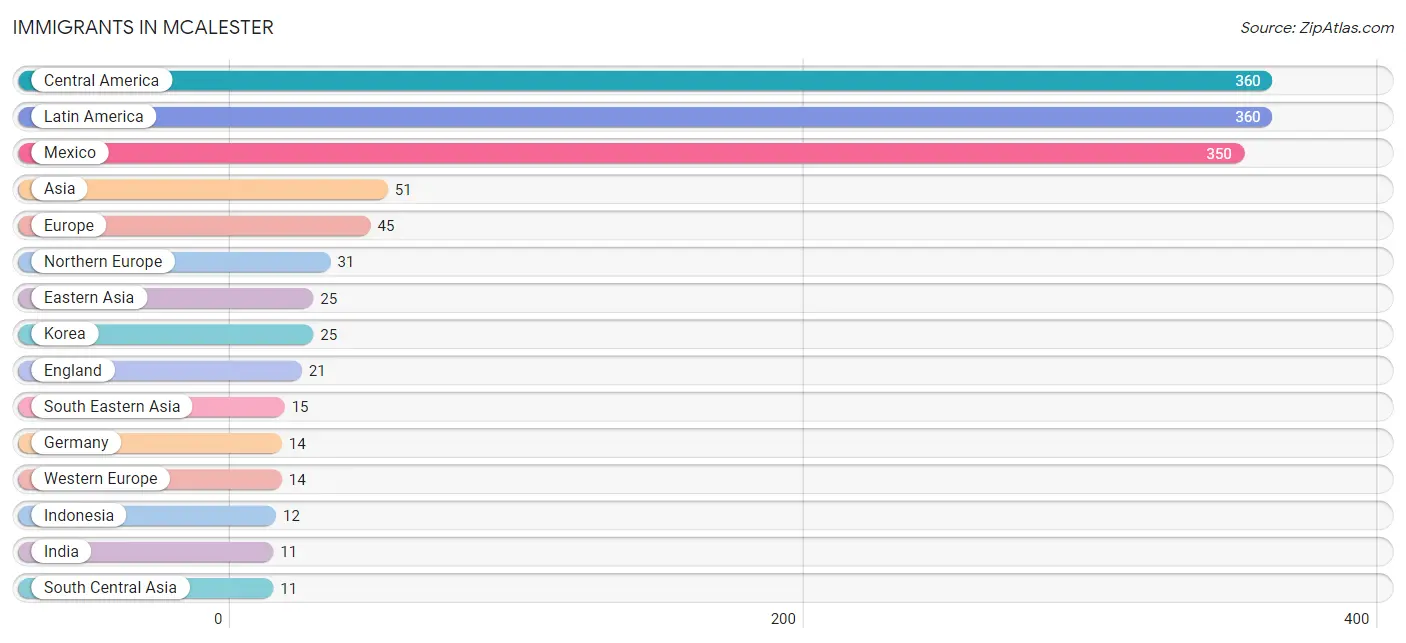
Immigrants in Mcalester
The most numerous immigrant groups reported in Mcalester came from Central America (360 | 2.0%), Latin America (360 | 2.0%), Mexico (350 | 1.9%), Asia (51 | 0.3%), and Europe (45 | 0.3%), together accounting for 6.4% of all Mcalester residents.
| Immigration Origin | # Population | % Population |
| Asia | 51 | 0.3% |
| Canada | 9 | 0.1% |
| Central America | 360 | 2.0% |
| Eastern Asia | 25 | 0.1% |
| England | 21 | 0.1% |
| Europe | 45 | 0.3% |
| Germany | 14 | 0.1% |
| Honduras | 10 | 0.1% |
| India | 11 | 0.1% |
| Indonesia | 12 | 0.1% |
| Korea | 25 | 0.1% |
| Latin America | 360 | 2.0% |
| Mexico | 350 | 1.9% |
| Northern Europe | 31 | 0.2% |
| Philippines | 3 | 0.0% |
| South Central Asia | 11 | 0.1% |
| South Eastern Asia | 15 | 0.1% |
| Western Europe | 14 | 0.1% | View All 18 Rows |
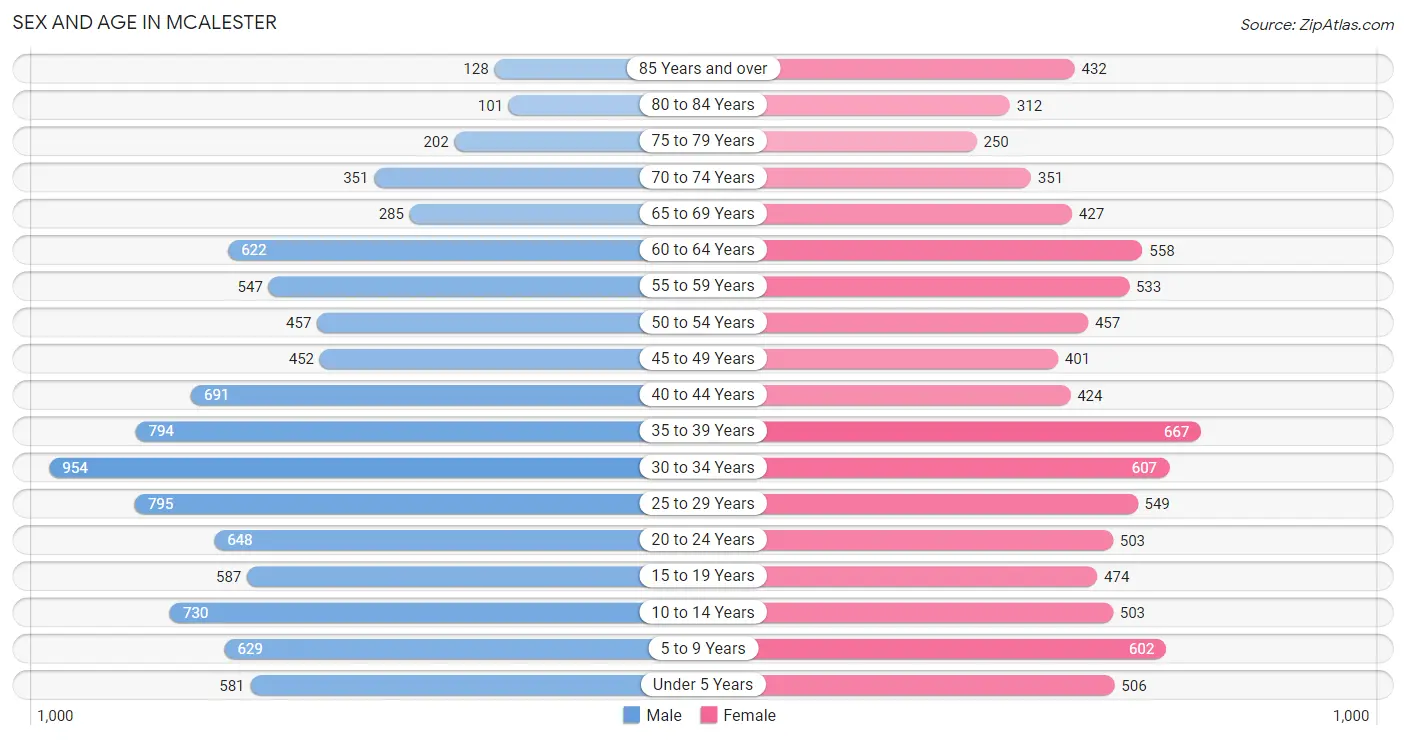
Sex and Age in Mcalester
Sex and Age in Mcalester
The most populous age groups in Mcalester are 30 to 34 Years (954 | 10.0%) for men and 35 to 39 Years (667 | 7.8%) for women.
| Age Bracket | Male | Female |
| Under 5 Years | 581 (6.1%) | 506 (5.9%) |
| 5 to 9 Years | 629 (6.6%) | 602 (7.0%) |
| 10 to 14 Years | 730 (7.6%) | 503 (5.9%) |
| 15 to 19 Years | 587 (6.1%) | 474 (5.5%) |
| 20 to 24 Years | 648 (6.8%) | 503 (5.9%) |
| 25 to 29 Years | 795 (8.3%) | 549 (6.4%) |
| 30 to 34 Years | 954 (10.0%) | 607 (7.1%) |
| 35 to 39 Years | 794 (8.3%) | 667 (7.8%) |
| 40 to 44 Years | 691 (7.2%) | 424 (5.0%) |
| 45 to 49 Years | 452 (4.7%) | 401 (4.7%) |
| 50 to 54 Years | 457 (4.8%) | 457 (5.3%) |
| 55 to 59 Years | 547 (5.7%) | 533 (6.2%) |
| 60 to 64 Years | 622 (6.5%) | 558 (6.5%) |
| 65 to 69 Years | 285 (3.0%) | 427 (5.0%) |
| 70 to 74 Years | 351 (3.7%) | 351 (4.1%) |
| 75 to 79 Years | 202 (2.1%) | 250 (2.9%) |
| 80 to 84 Years | 101 (1.1%) | 312 (3.6%) |
| 85 Years and over | 128 (1.3%) | 432 (5.1%) |
| Total | 9,554 (100.0%) | 8,556 (100.0%) |
Families and Households in Mcalester
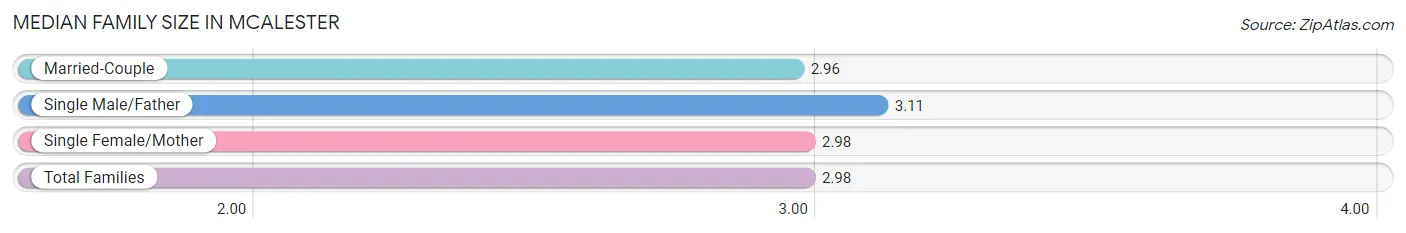
Median Family Size in Mcalester
The median family size in Mcalester is 2.98 persons per family, with single male/father families (286 | 6.9%) accounting for the largest median family size of 3.11 persons per family. On the other hand, married-couple families (2,900 | 69.5%) represent the smallest median family size with 2.96 persons per family.
| Family Type | # Families | Family Size |
| Married-Couple | 2,900 (69.5%) | 2.96 |
| Single Male/Father | 286 (6.9%) | 3.11 |
| Single Female/Mother | 986 (23.6%) | 2.98 |
| Total Families | 4,172 (100.0%) | 2.98 |
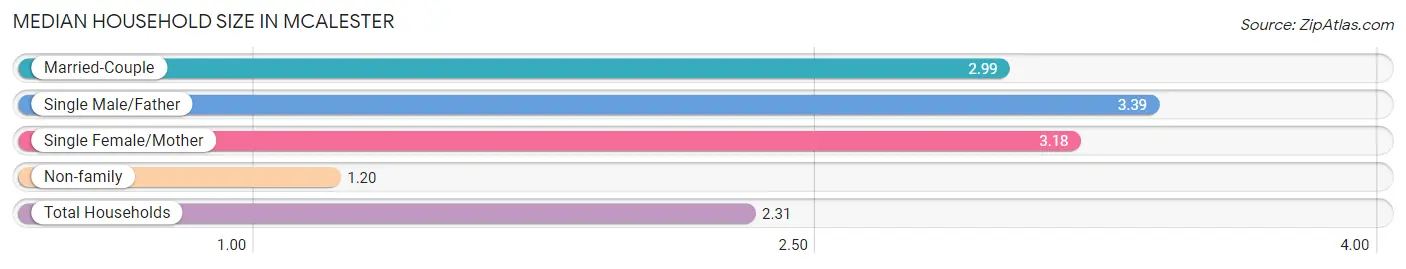
Median Household Size in Mcalester
The median household size in Mcalester is 2.31 persons per household, with single male/father households (286 | 4.1%) accounting for the largest median household size of 3.39 persons per household. non-family households (2,798 | 40.1%) represent the smallest median household size with 1.20 persons per household.
| Household Type | # Households | Household Size |
| Married-Couple | 2,900 (41.6%) | 2.99 |
| Single Male/Father | 286 (4.1%) | 3.39 |
| Single Female/Mother | 986 (14.1%) | 3.18 |
| Non-family | 2,798 (40.1%) | 1.20 |
| Total Households | 6,970 (100.0%) | 2.31 |
Household Size by Marriage Status in Mcalester
Out of a total of 6,970 households in Mcalester, 4,172 (59.9%) are family households, while 2,798 (40.1%) are nonfamily households. The most numerous type of family households are 2-person households, comprising 1,825, and the most common type of nonfamily households are 1-person households, comprising 2,319.
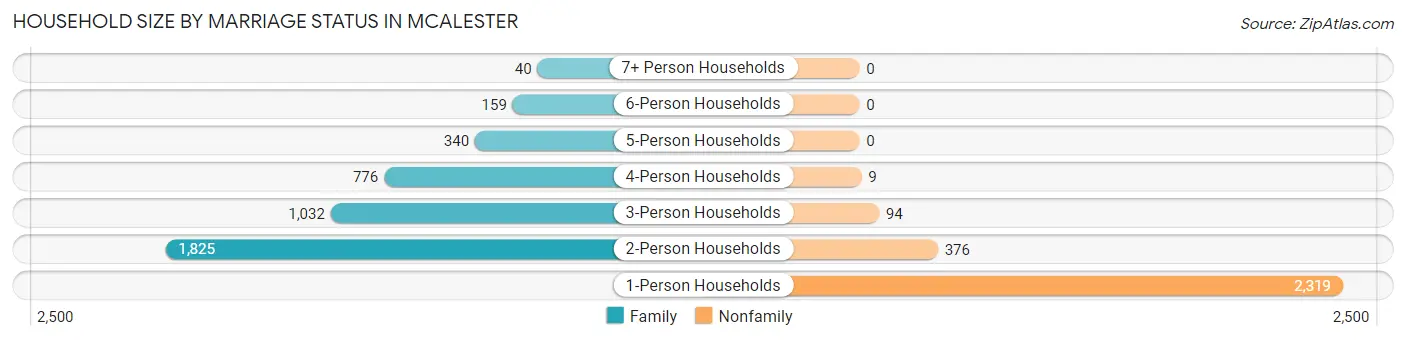
| Household Size | Family Households | Nonfamily Households |
| 1-Person Households | - | 2,319 (33.3%) |
| 2-Person Households | 1,825 (26.2%) | 376 (5.4%) |
| 3-Person Households | 1,032 (14.8%) | 94 (1.3%) |
| 4-Person Households | 776 (11.1%) | 9 (0.1%) |
| 5-Person Households | 340 (4.9%) | 0 (0.0%) |
| 6-Person Households | 159 (2.3%) | 0 (0.0%) |
| 7+ Person Households | 40 (0.6%) | 0 (0.0%) |
| Total | 4,172 (59.9%) | 2,798 (40.1%) |
Female Fertility in Mcalester
Fertility by Age in Mcalester
Average fertility rate in Mcalester is 69.0 births per 1,000 women. Women in the age bracket of 20 to 34 years have the highest fertility rate with 144.0 births per 1,000 women. Women in the age bracket of 20 to 34 years acount for 93.4% of all women with births.
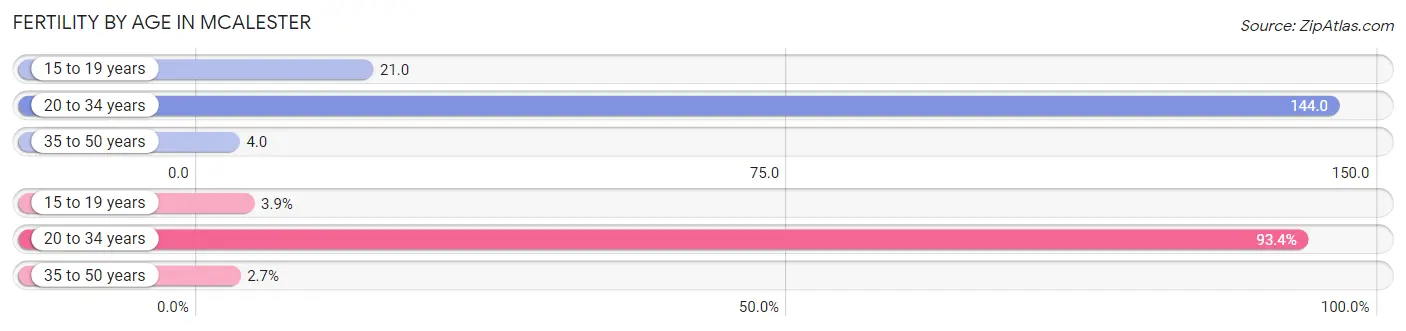
| Age Bracket | Women with Births | Births / 1,000 Women |
| 15 to 19 years | 10 (3.9%) | 21.0 |
| 20 to 34 years | 239 (93.4%) | 144.0 |
| 35 to 50 years | 7 (2.7%) | 4.0 |
| Total | 256 (100.0%) | 69.0 |
Fertility by Age by Marriage Status in Mcalester
60.9% of women with births (256) in Mcalester are married. The highest percentage of unmarried women with births falls into 20 to 34 years age bracket with 41.8% of them unmarried at the time of birth, while the lowest percentage of unmarried women with births belong to 15 to 19 years age bracket with 0.0% of them unmarried.
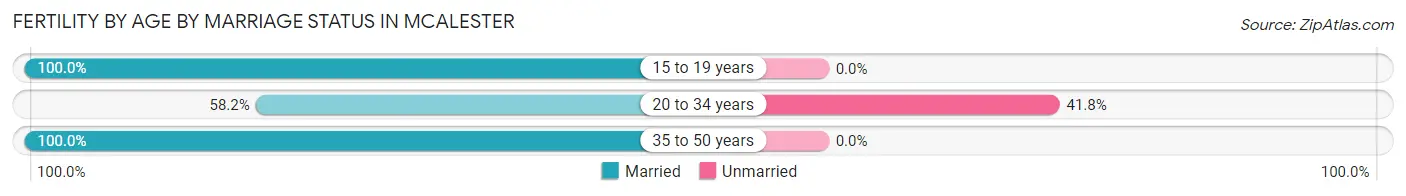
| Age Bracket | Married | Unmarried |
| 15 to 19 years | 10 (100.0%) | 0 (0.0%) |
| 20 to 34 years | 139 (58.2%) | 100 (41.8%) |
| 35 to 50 years | 7 (100.0%) | 0 (0.0%) |
| Total | 156 (60.9%) | 100 (39.1%) |
Fertility by Education in Mcalester
Average fertility rate in Mcalester is 69.0 births per 1,000 women. Women with the education attainment of graduate degree have the highest fertility rate of 190.0 births per 1,000 women, while women with the education attainment of high school diploma have the lowest fertility at 25.0 births per 1,000 women. Women with the education attainment of college or associate's degree represent 30.5% of all women with births.
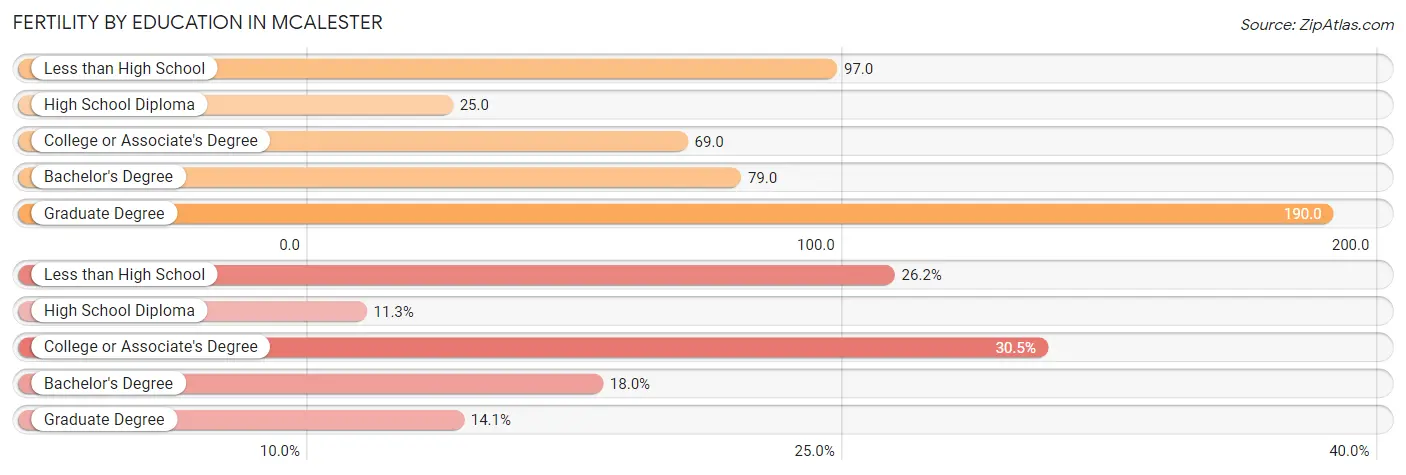
| Educational Attainment | Women with Births | Births / 1,000 Women |
| Less than High School | 67 (26.2%) | 97.0 |
| High School Diploma | 29 (11.3%) | 25.0 |
| College or Associate's Degree | 78 (30.5%) | 69.0 |
| Bachelor's Degree | 46 (18.0%) | 79.0 |
| Graduate Degree | 36 (14.1%) | 190.0 |
| Total | 256 (100.0%) | 69.0 |
Fertility by Education by Marriage Status in Mcalester
39.1% of women with births in Mcalester are unmarried. Women with the educational attainment of bachelor's degree are most likely to be married with 100.0% of them married at childbirth, while women with the educational attainment of high school diploma are least likely to be married with 100.0% of them unmarried at childbirth.
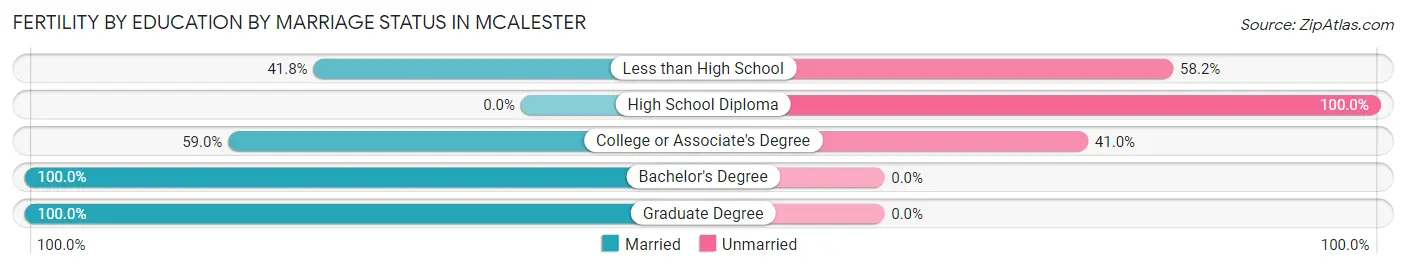
| Educational Attainment | Married | Unmarried |
| Less than High School | 28 (41.8%) | 39 (58.2%) |
| High School Diploma | 0 (0.0%) | 29 (100.0%) |
| College or Associate's Degree | 46 (59.0%) | 32 (41.0%) |
| Bachelor's Degree | 46 (100.0%) | 0 (0.0%) |
| Graduate Degree | 36 (100.0%) | 0 (0.0%) |
| Total | 156 (60.9%) | 100 (39.1%) |
Employment Characteristics in Mcalester
Employment by Class of Employer in Mcalester
Among the 6,779 employed individuals in Mcalester, private company employees (3,671 | 54.1%), federal government employees (866 | 12.8%), and local government employees (617 | 9.1%) make up the most common classes of employment.
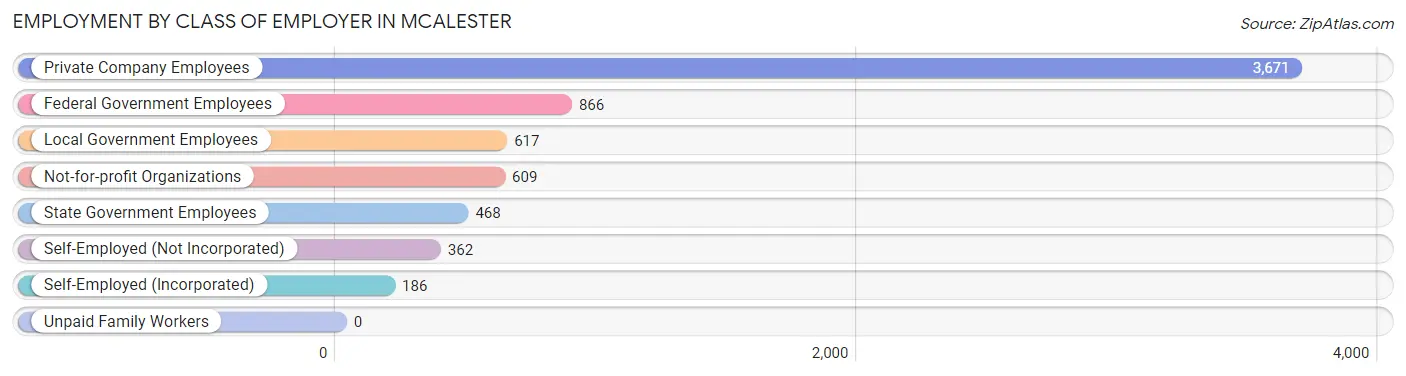
| Employer Class | # Employees | % Employees |
| Private Company Employees | 3,671 | 54.1% |
| Self-Employed (Incorporated) | 186 | 2.7% |
| Self-Employed (Not Incorporated) | 362 | 5.3% |
| Not-for-profit Organizations | 609 | 9.0% |
| Local Government Employees | 617 | 9.1% |
| State Government Employees | 468 | 6.9% |
| Federal Government Employees | 866 | 12.8% |
| Unpaid Family Workers | 0 | 0.0% |
| Total | 6,779 | 100.0% |
Employment Status by Age in Mcalester
According to the labor force statistics for Mcalester, out of the total population over 16 years of age (14,296), 52.6% or 7,520 individuals are in the labor force, with 8.0% or 602 of them unemployed. The age group with the highest labor force participation rate is 35 to 44 years, with 72.9% or 1,878 individuals in the labor force. Within the labor force, the 16 to 19 years age range has the highest percentage of unemployed individuals, with 26.1% or 70 of them being unemployed.
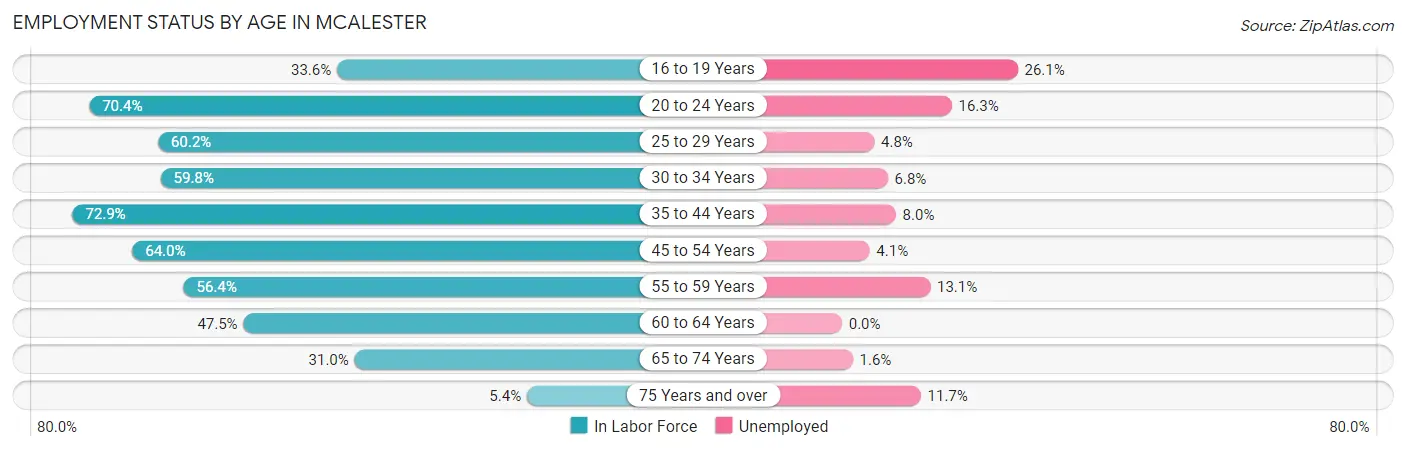
| Age Bracket | In Labor Force | Unemployed |
| 16 to 19 Years | 268 (33.6%) | 70 (26.1%) |
| 20 to 24 Years | 810 (70.4%) | 132 (16.3%) |
| 25 to 29 Years | 809 (60.2%) | 39 (4.8%) |
| 30 to 34 Years | 933 (59.8%) | 63 (6.8%) |
| 35 to 44 Years | 1,878 (72.9%) | 150 (8.0%) |
| 45 to 54 Years | 1,131 (64.0%) | 46 (4.1%) |
| 55 to 59 Years | 609 (56.4%) | 80 (13.1%) |
| 60 to 64 Years | 560 (47.5%) | 0 (0.0%) |
| 65 to 74 Years | 438 (31.0%) | 7 (1.6%) |
| 75 Years and over | 77 (5.4%) | 9 (11.7%) |
| Total | 7,520 (52.6%) | 602 (8.0%) |
Employment Status by Educational Attainment in Mcalester
According to labor force statistics for Mcalester, 62.3% of individuals (5,923) out of the total population between 25 and 64 years of age (9,508) are in the labor force, with 6.4% or 379 of them being unemployed. The group with the highest labor force participation rate are those with the educational attainment of bachelor's degree or higher, with 83.7% or 1,403 individuals in the labor force. Within the labor force, individuals with less than high school education have the highest percentage of unemployment, with 25.0% or 135 of them being unemployed.
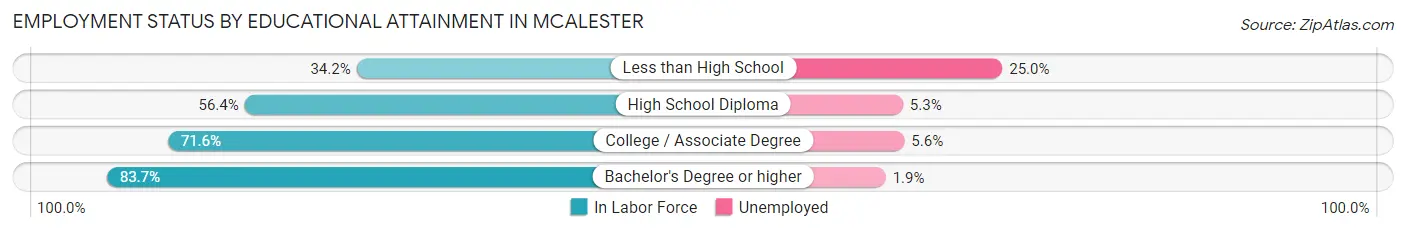
| Educational Attainment | In Labor Force | Unemployed |
| Less than High School | 540 (34.2%) | 395 (25.0%) |
| High School Diploma | 1,853 (56.4%) | 174 (5.3%) |
| College / Associate Degree | 2,124 (71.6%) | 166 (5.6%) |
| Bachelor's Degree or higher | 1,403 (83.7%) | 32 (1.9%) |
| Total | 5,923 (62.3%) | 609 (6.4%) |
Employment Occupations by Sex in Mcalester
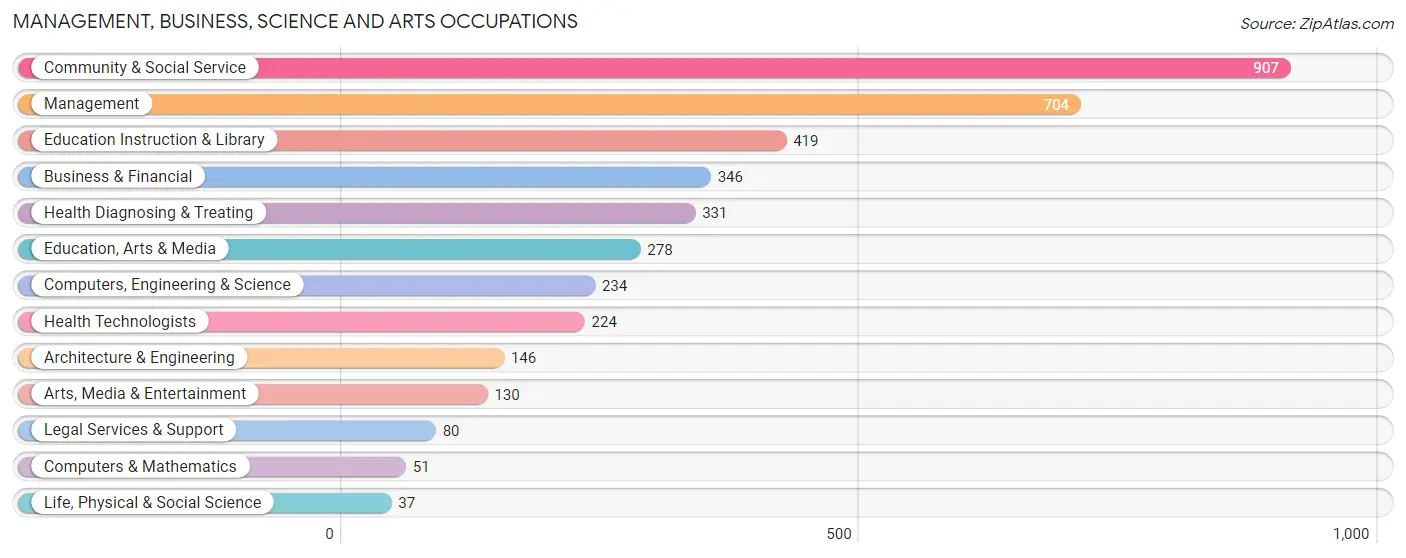
Management, Business, Science and Arts Occupations
The most common Management, Business, Science and Arts occupations in Mcalester are Community & Social Service (907 | 13.2%), Management (704 | 10.2%), Education Instruction & Library (419 | 6.1%), Business & Financial (346 | 5.0%), and Health Diagnosing & Treating (331 | 4.8%).
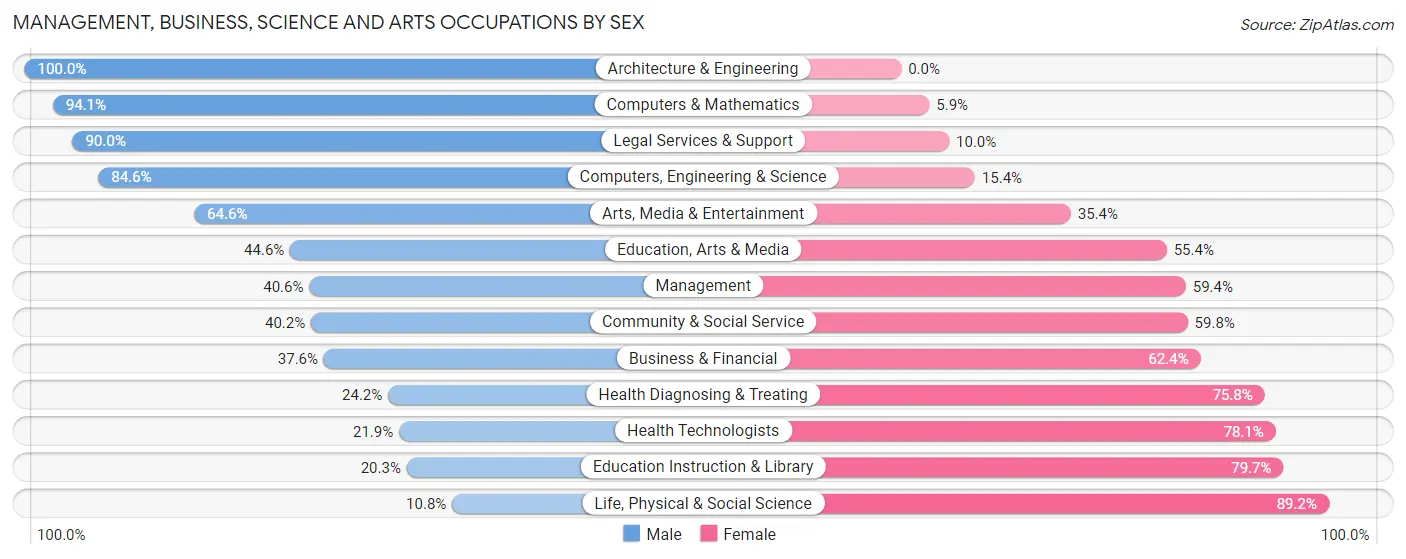
Management, Business, Science and Arts Occupations by Sex
Within the Management, Business, Science and Arts occupations in Mcalester, the most male-oriented occupations are Architecture & Engineering (100.0%), Computers & Mathematics (94.1%), and Legal Services & Support (90.0%), while the most female-oriented occupations are Life, Physical & Social Science (89.2%), Education Instruction & Library (79.7%), and Health Technologists (78.1%).
| Occupation | Male | Female |
| Management | 286 (40.6%) | 418 (59.4%) |
| Business & Financial | 130 (37.6%) | 216 (62.4%) |
| Computers, Engineering & Science | 198 (84.6%) | 36 (15.4%) |
| Computers & Mathematics | 48 (94.1%) | 3 (5.9%) |
| Architecture & Engineering | 146 (100.0%) | 0 (0.0%) |
| Life, Physical & Social Science | 4 (10.8%) | 33 (89.2%) |
| Community & Social Service | 365 (40.2%) | 542 (59.8%) |
| Education, Arts & Media | 124 (44.6%) | 154 (55.4%) |
| Legal Services & Support | 72 (90.0%) | 8 (10.0%) |
| Education Instruction & Library | 85 (20.3%) | 334 (79.7%) |
| Arts, Media & Entertainment | 84 (64.6%) | 46 (35.4%) |
| Health Diagnosing & Treating | 80 (24.2%) | 251 (75.8%) |
| Health Technologists | 49 (21.9%) | 175 (78.1%) |
| Total (Category) | 1,059 (42.0%) | 1,463 (58.0%) |
| Total (Overall) | 3,557 (51.6%) | 3,340 (48.4%) |
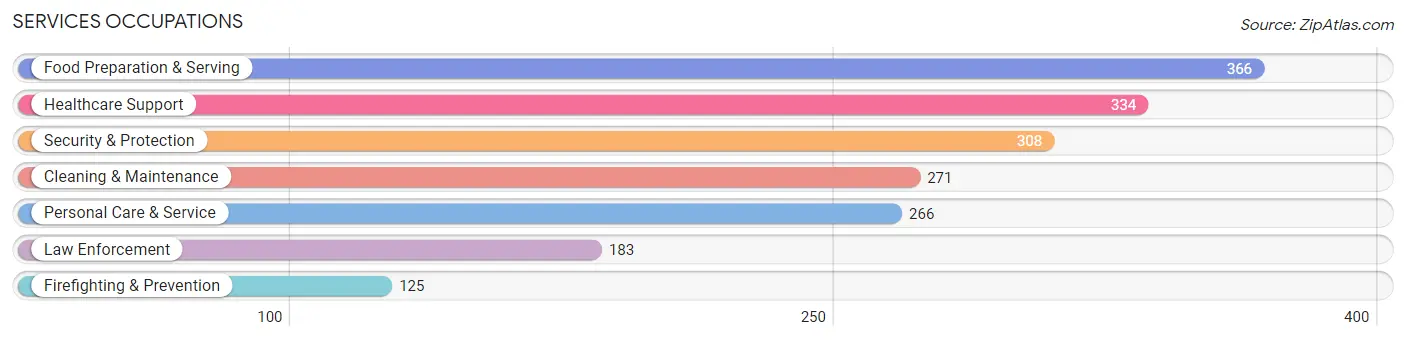
Services Occupations
The most common Services occupations in Mcalester are Food Preparation & Serving (366 | 5.3%), Healthcare Support (334 | 4.8%), Security & Protection (308 | 4.5%), Cleaning & Maintenance (271 | 3.9%), and Personal Care & Service (266 | 3.9%).
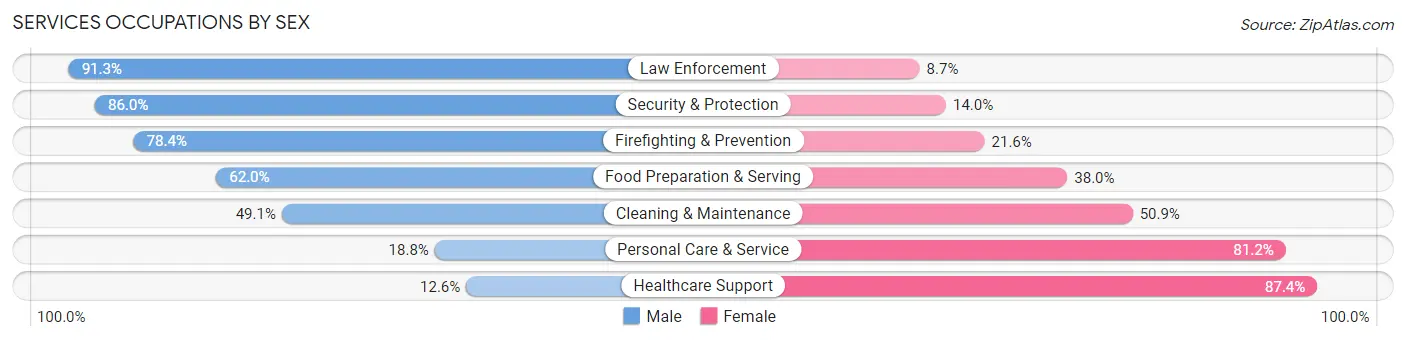
Services Occupations by Sex
Within the Services occupations in Mcalester, the most male-oriented occupations are Law Enforcement (91.3%), Security & Protection (86.0%), and Firefighting & Prevention (78.4%), while the most female-oriented occupations are Healthcare Support (87.4%), Personal Care & Service (81.2%), and Cleaning & Maintenance (50.9%).
| Occupation | Male | Female |
| Healthcare Support | 42 (12.6%) | 292 (87.4%) |
| Security & Protection | 265 (86.0%) | 43 (14.0%) |
| Firefighting & Prevention | 98 (78.4%) | 27 (21.6%) |
| Law Enforcement | 167 (91.3%) | 16 (8.7%) |
| Food Preparation & Serving | 227 (62.0%) | 139 (38.0%) |
| Cleaning & Maintenance | 133 (49.1%) | 138 (50.9%) |
| Personal Care & Service | 50 (18.8%) | 216 (81.2%) |
| Total (Category) | 717 (46.4%) | 828 (53.6%) |
| Total (Overall) | 3,557 (51.6%) | 3,340 (48.4%) |
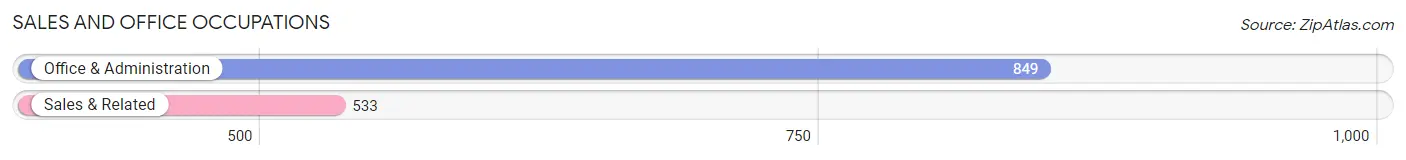
Sales and Office Occupations
The most common Sales and Office occupations in Mcalester are Office & Administration (849 | 12.3%), and Sales & Related (533 | 7.7%).
Sales and Office Occupations by Sex
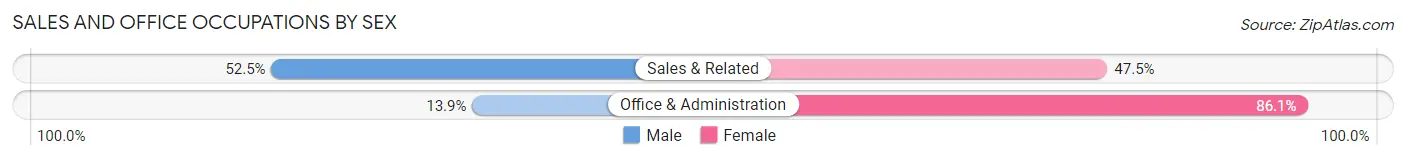
| Occupation | Male | Female |
| Sales & Related | 280 (52.5%) | 253 (47.5%) |
| Office & Administration | 118 (13.9%) | 731 (86.1%) |
| Total (Category) | 398 (28.8%) | 984 (71.2%) |
| Total (Overall) | 3,557 (51.6%) | 3,340 (48.4%) |
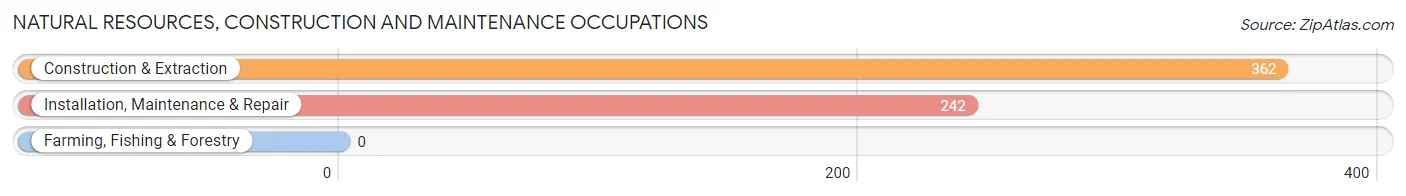
Natural Resources, Construction and Maintenance Occupations
The most common Natural Resources, Construction and Maintenance occupations in Mcalester are Construction & Extraction (362 | 5.2%), and Installation, Maintenance & Repair (242 | 3.5%).
Natural Resources, Construction and Maintenance Occupations by Sex
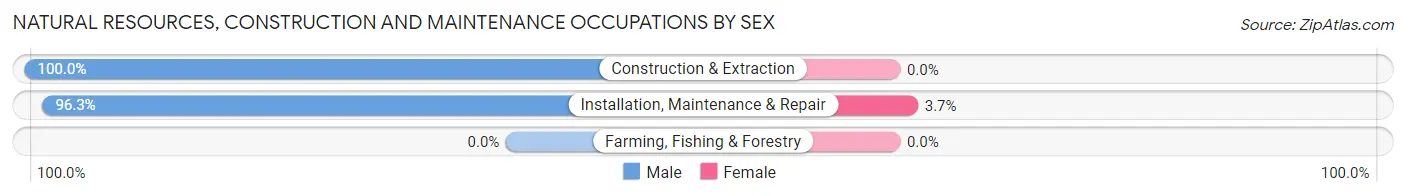
| Occupation | Male | Female |
| Farming, Fishing & Forestry | 0 (0.0%) | 0 (0.0%) |
| Construction & Extraction | 362 (100.0%) | 0 (0.0%) |
| Installation, Maintenance & Repair | 233 (96.3%) | 9 (3.7%) |
| Total (Category) | 595 (98.5%) | 9 (1.5%) |
| Total (Overall) | 3,557 (51.6%) | 3,340 (48.4%) |
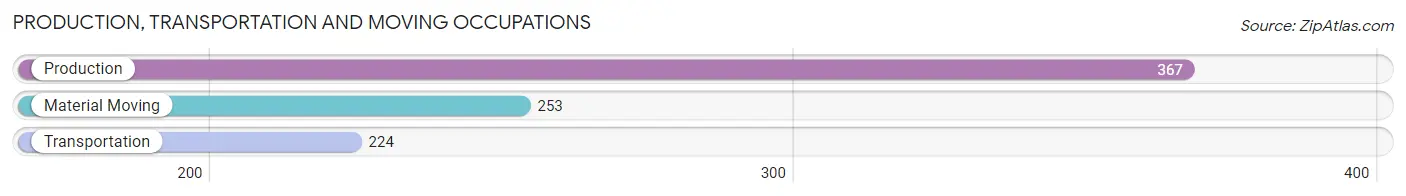
Production, Transportation and Moving Occupations
The most common Production, Transportation and Moving occupations in Mcalester are Production (367 | 5.3%), Material Moving (253 | 3.7%), and Transportation (224 | 3.3%).
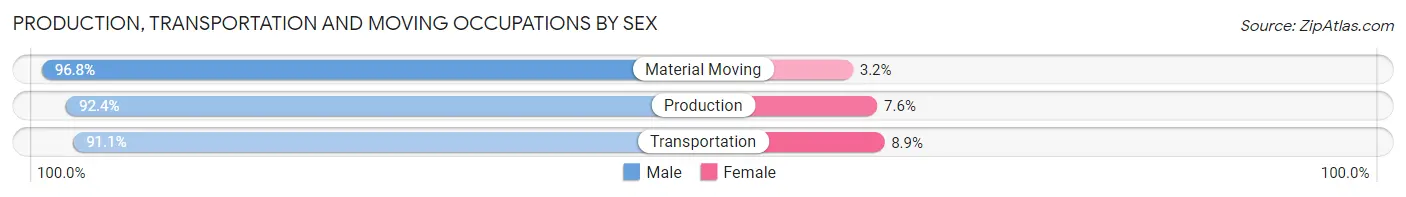
Production, Transportation and Moving Occupations by Sex
| Occupation | Male | Female |
| Production | 339 (92.4%) | 28 (7.6%) |
| Transportation | 204 (91.1%) | 20 (8.9%) |
| Material Moving | 245 (96.8%) | 8 (3.2%) |
| Total (Category) | 788 (93.4%) | 56 (6.6%) |
| Total (Overall) | 3,557 (51.6%) | 3,340 (48.4%) |
Employment Industries by Sex in Mcalester
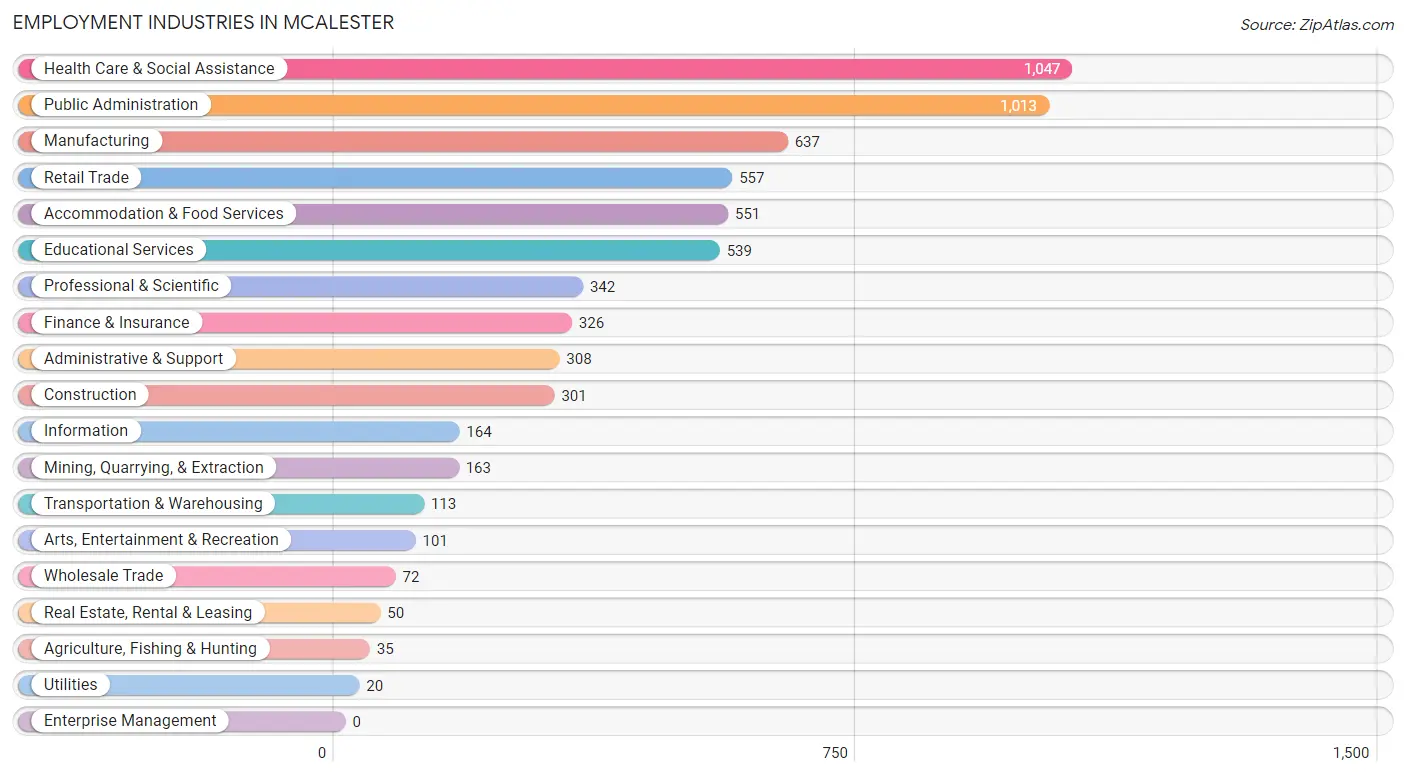
Employment Industries in Mcalester
The major employment industries in Mcalester include Health Care & Social Assistance (1,047 | 15.2%), Public Administration (1,013 | 14.7%), Manufacturing (637 | 9.2%), Retail Trade (557 | 8.1%), and Accommodation & Food Services (551 | 8.0%).
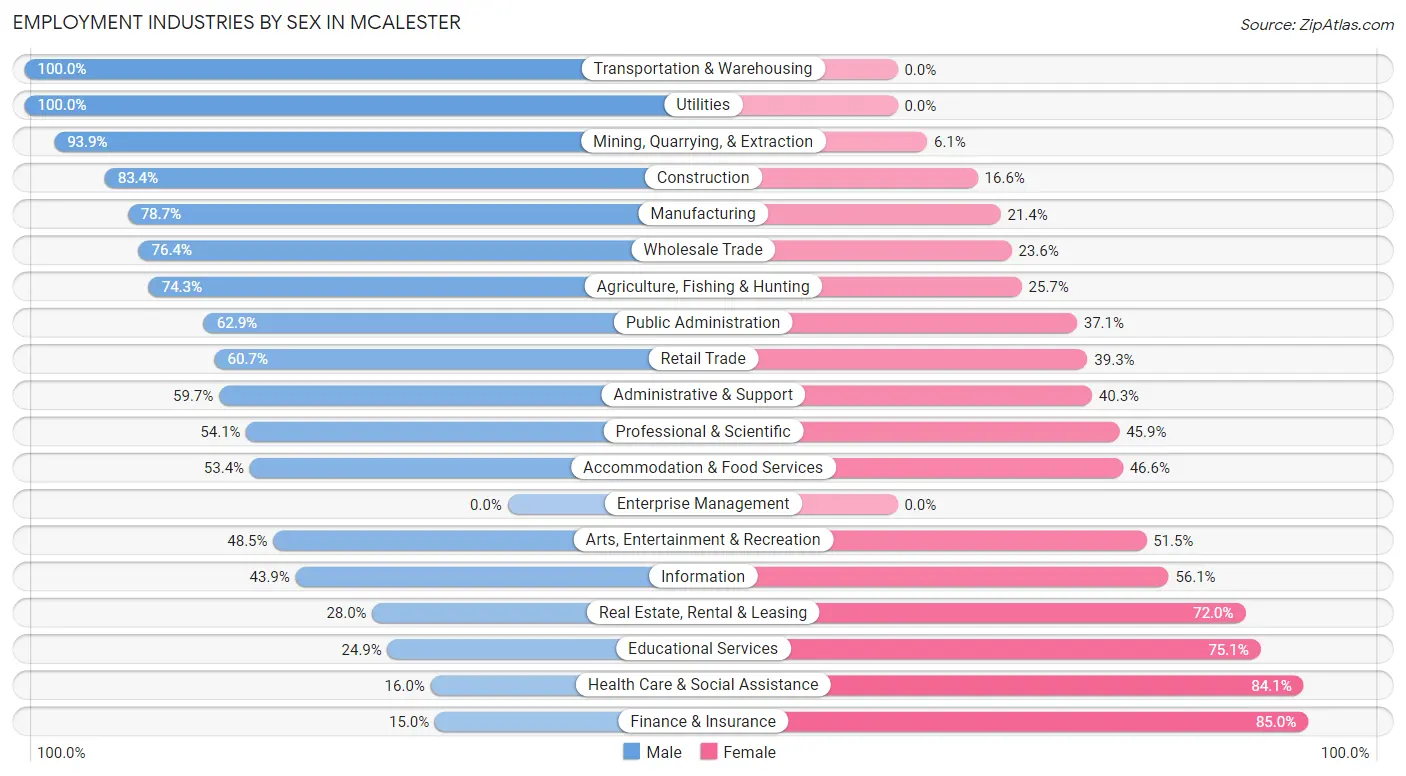
Employment Industries by Sex in Mcalester
The Mcalester industries that see more men than women are Transportation & Warehousing (100.0%), Utilities (100.0%), and Mining, Quarrying, & Extraction (93.9%), whereas the industries that tend to have a higher number of women are Finance & Insurance (85.0%), Health Care & Social Assistance (84.1%), and Educational Services (75.1%).
| Industry | Male | Female |
| Agriculture, Fishing & Hunting | 26 (74.3%) | 9 (25.7%) |
| Mining, Quarrying, & Extraction | 153 (93.9%) | 10 (6.1%) |
| Construction | 251 (83.4%) | 50 (16.6%) |
| Manufacturing | 501 (78.6%) | 136 (21.3%) |
| Wholesale Trade | 55 (76.4%) | 17 (23.6%) |
| Retail Trade | 338 (60.7%) | 219 (39.3%) |
| Transportation & Warehousing | 113 (100.0%) | 0 (0.0%) |
| Utilities | 20 (100.0%) | 0 (0.0%) |
| Information | 72 (43.9%) | 92 (56.1%) |
| Finance & Insurance | 49 (15.0%) | 277 (85.0%) |
| Real Estate, Rental & Leasing | 14 (28.0%) | 36 (72.0%) |
| Professional & Scientific | 185 (54.1%) | 157 (45.9%) |
| Enterprise Management | 0 (0.0%) | 0 (0.0%) |
| Administrative & Support | 184 (59.7%) | 124 (40.3%) |
| Educational Services | 134 (24.9%) | 405 (75.1%) |
| Health Care & Social Assistance | 167 (16.0%) | 880 (84.1%) |
| Arts, Entertainment & Recreation | 49 (48.5%) | 52 (51.5%) |
| Accommodation & Food Services | 294 (53.4%) | 257 (46.6%) |
| Public Administration | 637 (62.9%) | 376 (37.1%) |
| Total | 3,557 (51.6%) | 3,340 (48.4%) |
Education in Mcalester
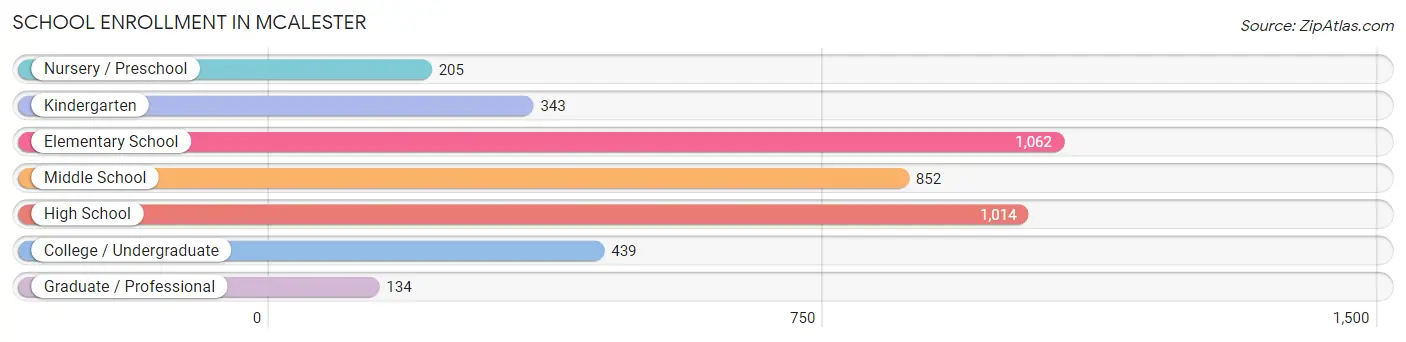
School Enrollment in Mcalester
The most common levels of schooling among the 4,049 students in Mcalester are elementary school (1,062 | 26.2%), high school (1,014 | 25.0%), and middle school (852 | 21.0%).
| School Level | # Students | % Students |
| Nursery / Preschool | 205 | 5.1% |
| Kindergarten | 343 | 8.5% |
| Elementary School | 1,062 | 26.2% |
| Middle School | 852 | 21.0% |
| High School | 1,014 | 25.0% |
| College / Undergraduate | 439 | 10.8% |
| Graduate / Professional | 134 | 3.3% |
| Total | 4,049 | 100.0% |
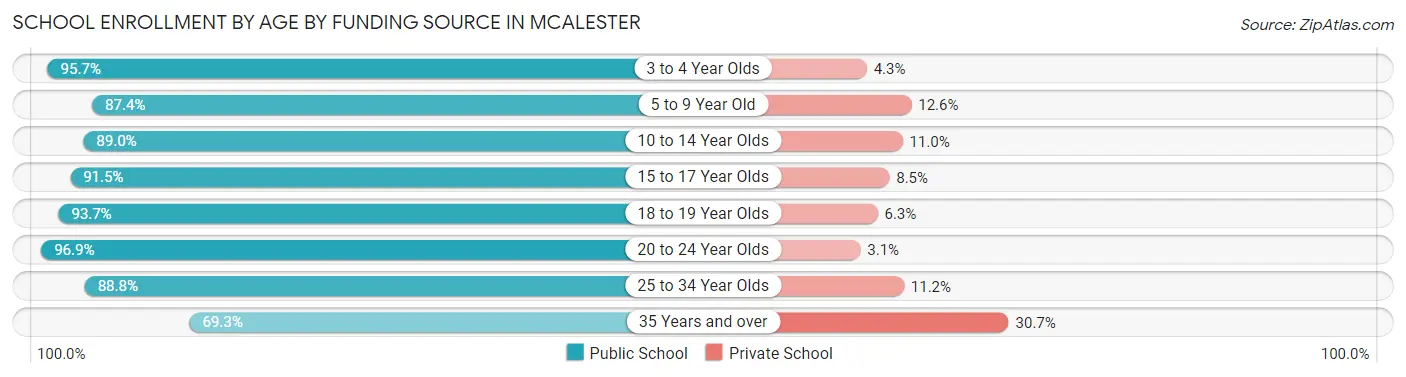
School Enrollment by Age by Funding Source in Mcalester
Out of a total of 4,049 students who are enrolled in schools in Mcalester, 449 (11.1%) attend a private institution, while the remaining 3,600 (88.9%) are enrolled in public schools. The age group of 35 years and over has the highest likelihood of being enrolled in private schools, with 51 (30.7% in the age bracket) enrolled. Conversely, the age group of 20 to 24 year olds has the lowest likelihood of being enrolled in a private school, with 125 (96.9% in the age bracket) attending a public institution.
| Age Bracket | Public School | Private School |
| 3 to 4 Year Olds | 156 (95.7%) | 7 (4.3%) |
| 5 to 9 Year Old | 1,055 (87.4%) | 152 (12.6%) |
| 10 to 14 Year Olds | 1,080 (89.0%) | 133 (11.0%) |
| 15 to 17 Year Olds | 581 (91.5%) | 54 (8.5%) |
| 18 to 19 Year Olds | 193 (93.7%) | 13 (6.3%) |
| 20 to 24 Year Olds | 125 (96.9%) | 4 (3.1%) |
| 25 to 34 Year Olds | 293 (88.8%) | 37 (11.2%) |
| 35 Years and over | 115 (69.3%) | 51 (30.7%) |
| Total | 3,600 (88.9%) | 449 (11.1%) |
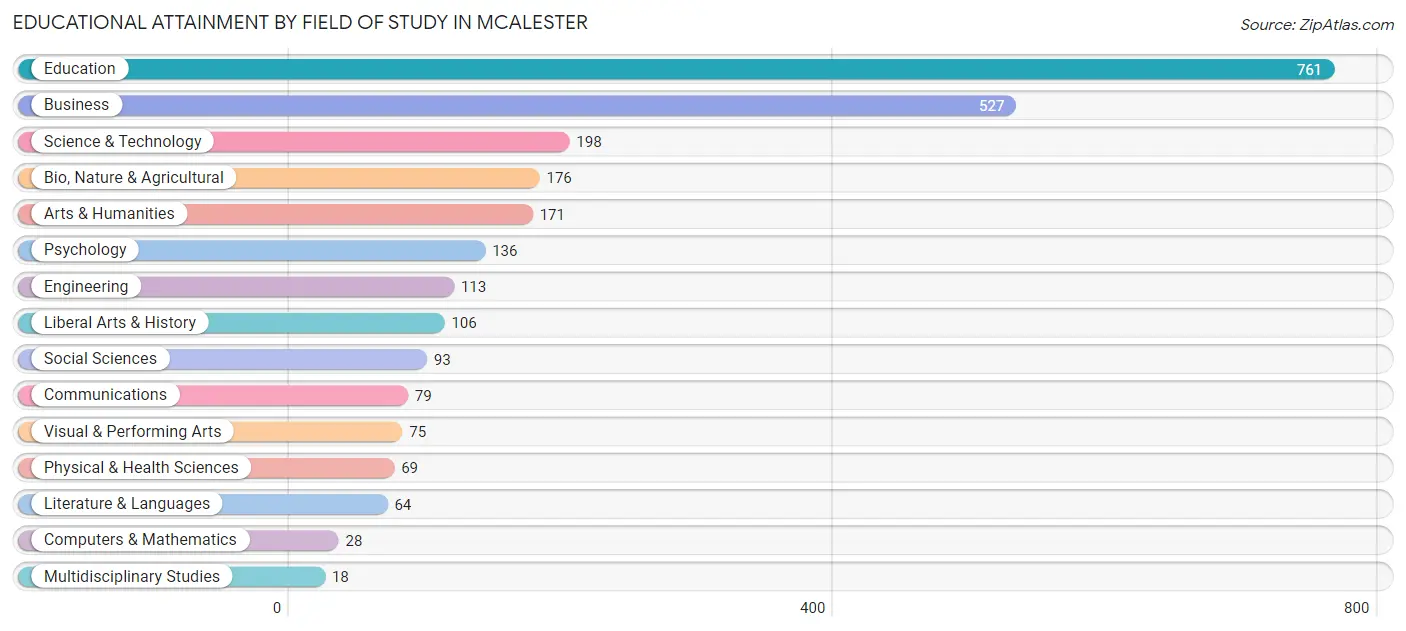
Educational Attainment by Field of Study in Mcalester
Education (761 | 29.1%), business (527 | 20.2%), science & technology (198 | 7.6%), bio, nature & agricultural (176 | 6.7%), and arts & humanities (171 | 6.5%) are the most common fields of study among 2,614 individuals in Mcalester who have obtained a bachelor's degree or higher.
| Field of Study | # Graduates | % Graduates |
| Computers & Mathematics | 28 | 1.1% |
| Bio, Nature & Agricultural | 176 | 6.7% |
| Physical & Health Sciences | 69 | 2.6% |
| Psychology | 136 | 5.2% |
| Social Sciences | 93 | 3.6% |
| Engineering | 113 | 4.3% |
| Multidisciplinary Studies | 18 | 0.7% |
| Science & Technology | 198 | 7.6% |
| Business | 527 | 20.2% |
| Education | 761 | 29.1% |
| Literature & Languages | 64 | 2.5% |
| Liberal Arts & History | 106 | 4.1% |
| Visual & Performing Arts | 75 | 2.9% |
| Communications | 79 | 3.0% |
| Arts & Humanities | 171 | 6.5% |
| Total | 2,614 | 100.0% |
Transportation & Commute in Mcalester
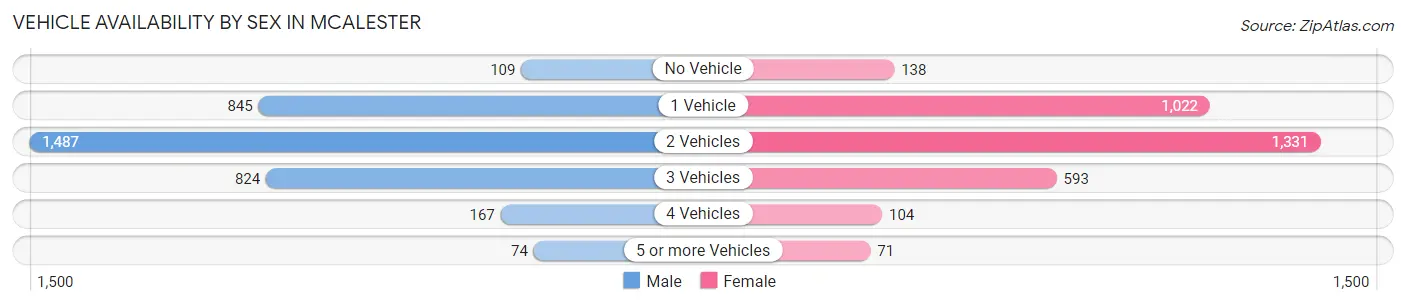
Vehicle Availability by Sex in Mcalester
The most prevalent vehicle ownership categories in Mcalester are males with 2 vehicles (1,487, accounting for 42.4%) and females with 2 vehicles (1,331, making up 45.6%).
| Vehicles Available | Male | Female |
| No Vehicle | 109 (3.1%) | 138 (4.2%) |
| 1 Vehicle | 845 (24.1%) | 1,022 (31.4%) |
| 2 Vehicles | 1,487 (42.4%) | 1,331 (40.8%) |
| 3 Vehicles | 824 (23.5%) | 593 (18.2%) |
| 4 Vehicles | 167 (4.8%) | 104 (3.2%) |
| 5 or more Vehicles | 74 (2.1%) | 71 (2.2%) |
| Total | 3,506 (100.0%) | 3,259 (100.0%) |
Commute Time in Mcalester
The most frequently occuring commute durations in Mcalester are 5 to 9 minutes (1,900 commuters, 29.9%), 10 to 14 minutes (1,669 commuters, 26.3%), and 15 to 19 minutes (1,021 commuters, 16.1%).
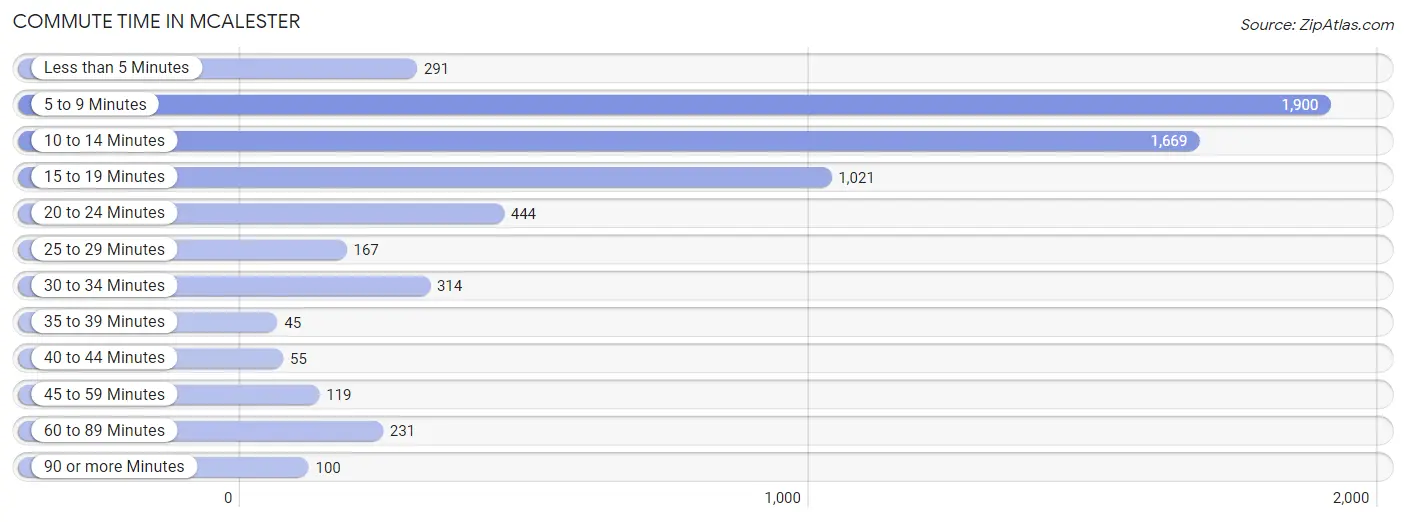
| Commute Time | # Commuters | % Commuters |
| Less than 5 Minutes | 291 | 4.6% |
| 5 to 9 Minutes | 1,900 | 29.9% |
| 10 to 14 Minutes | 1,669 | 26.3% |
| 15 to 19 Minutes | 1,021 | 16.1% |
| 20 to 24 Minutes | 444 | 7.0% |
| 25 to 29 Minutes | 167 | 2.6% |
| 30 to 34 Minutes | 314 | 4.9% |
| 35 to 39 Minutes | 45 | 0.7% |
| 40 to 44 Minutes | 55 | 0.9% |
| 45 to 59 Minutes | 119 | 1.9% |
| 60 to 89 Minutes | 231 | 3.6% |
| 90 or more Minutes | 100 | 1.6% |
Commute Time by Sex in Mcalester
The most common commute times in Mcalester are 5 to 9 minutes (960 commuters, 28.8%) for males and 10 to 14 minutes (960 commuters, 31.8%) for females.
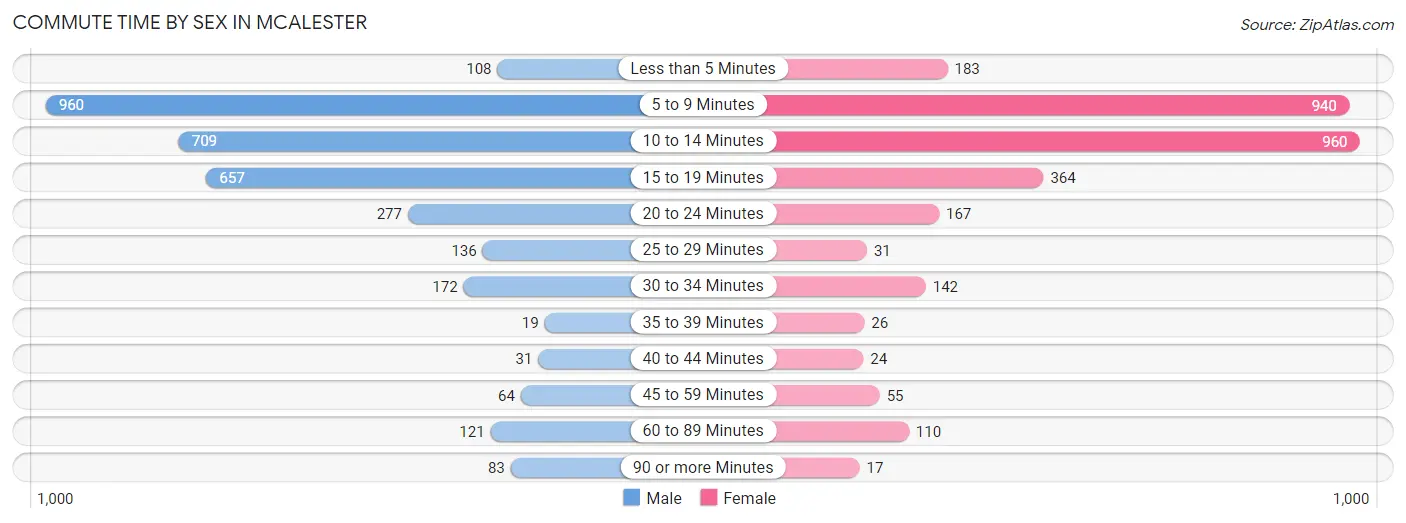
| Commute Time | Male | Female |
| Less than 5 Minutes | 108 (3.2%) | 183 (6.1%) |
| 5 to 9 Minutes | 960 (28.8%) | 940 (31.1%) |
| 10 to 14 Minutes | 709 (21.2%) | 960 (31.8%) |
| 15 to 19 Minutes | 657 (19.7%) | 364 (12.1%) |
| 20 to 24 Minutes | 277 (8.3%) | 167 (5.5%) |
| 25 to 29 Minutes | 136 (4.1%) | 31 (1.0%) |
| 30 to 34 Minutes | 172 (5.1%) | 142 (4.7%) |
| 35 to 39 Minutes | 19 (0.6%) | 26 (0.9%) |
| 40 to 44 Minutes | 31 (0.9%) | 24 (0.8%) |
| 45 to 59 Minutes | 64 (1.9%) | 55 (1.8%) |
| 60 to 89 Minutes | 121 (3.6%) | 110 (3.6%) |
| 90 or more Minutes | 83 (2.5%) | 17 (0.6%) |
Time of Departure to Work by Sex in Mcalester
The most frequent times of departure to work in Mcalester are 7:30 AM to 7:59 AM (516, 15.5%) for males and 7:30 AM to 7:59 AM (786, 26.0%) for females.
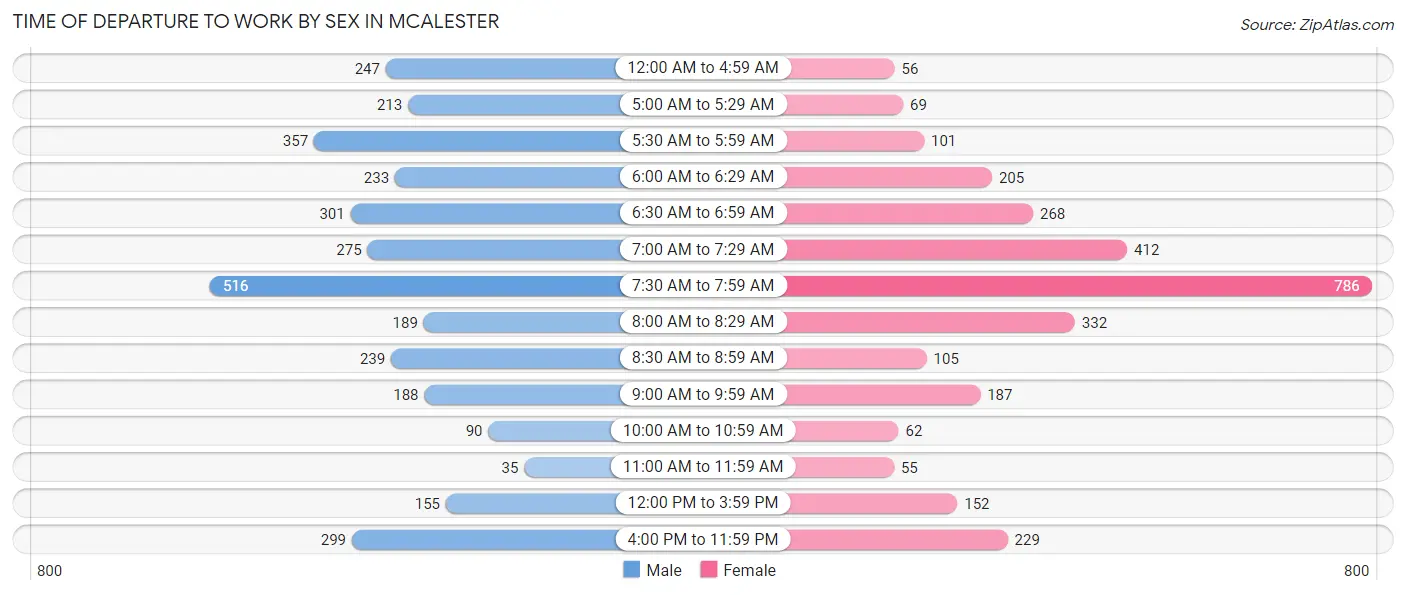
| Time of Departure | Male | Female |
| 12:00 AM to 4:59 AM | 247 (7.4%) | 56 (1.8%) |
| 5:00 AM to 5:29 AM | 213 (6.4%) | 69 (2.3%) |
| 5:30 AM to 5:59 AM | 357 (10.7%) | 101 (3.4%) |
| 6:00 AM to 6:29 AM | 233 (7.0%) | 205 (6.8%) |
| 6:30 AM to 6:59 AM | 301 (9.0%) | 268 (8.9%) |
| 7:00 AM to 7:29 AM | 275 (8.2%) | 412 (13.7%) |
| 7:30 AM to 7:59 AM | 516 (15.5%) | 786 (26.0%) |
| 8:00 AM to 8:29 AM | 189 (5.7%) | 332 (11.0%) |
| 8:30 AM to 8:59 AM | 239 (7.2%) | 105 (3.5%) |
| 9:00 AM to 9:59 AM | 188 (5.6%) | 187 (6.2%) |
| 10:00 AM to 10:59 AM | 90 (2.7%) | 62 (2.1%) |
| 11:00 AM to 11:59 AM | 35 (1.1%) | 55 (1.8%) |
| 12:00 PM to 3:59 PM | 155 (4.6%) | 152 (5.0%) |
| 4:00 PM to 11:59 PM | 299 (9.0%) | 229 (7.6%) |
| Total | 3,337 (100.0%) | 3,019 (100.0%) |
Housing Occupancy in Mcalester
Occupancy by Ownership in Mcalester
Of the total 6,970 dwellings in Mcalester, owner-occupied units account for 4,178 (59.9%), while renter-occupied units make up 2,792 (40.1%).
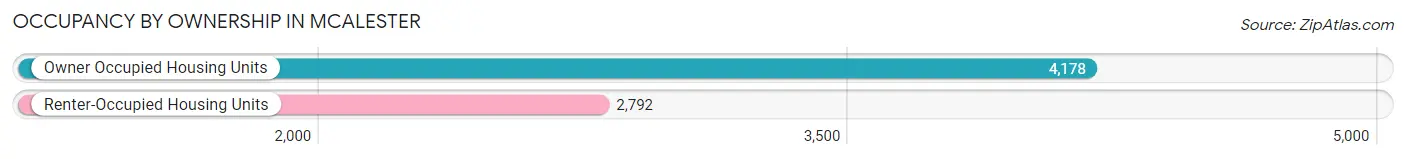
| Occupancy | # Housing Units | % Housing Units |
| Owner Occupied Housing Units | 4,178 | 59.9% |
| Renter-Occupied Housing Units | 2,792 | 40.1% |
| Total Occupied Housing Units | 6,970 | 100.0% |
Occupancy by Household Size in Mcalester
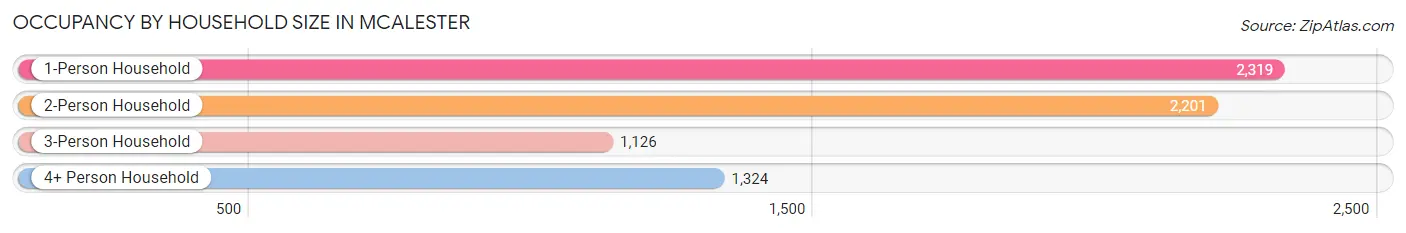
| Household Size | # Housing Units | % Housing Units |
| 1-Person Household | 2,319 | 33.3% |
| 2-Person Household | 2,201 | 31.6% |
| 3-Person Household | 1,126 | 16.2% |
| 4+ Person Household | 1,324 | 19.0% |
| Total Housing Units | 6,970 | 100.0% |
Occupancy by Ownership by Household Size in Mcalester
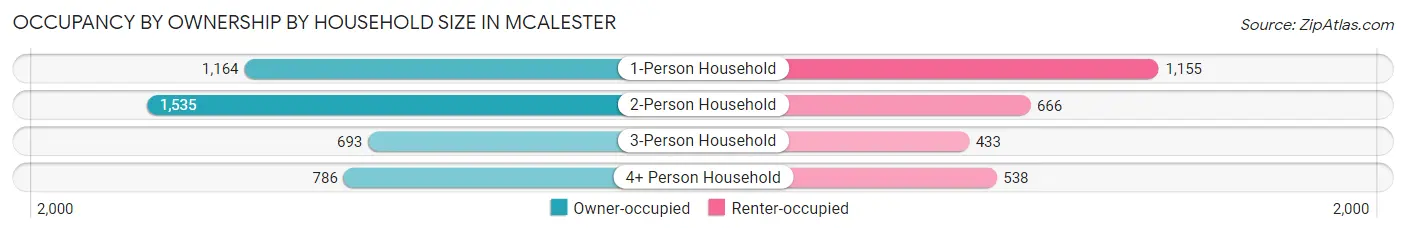
| Household Size | Owner-occupied | Renter-occupied |
| 1-Person Household | 1,164 (50.2%) | 1,155 (49.8%) |
| 2-Person Household | 1,535 (69.7%) | 666 (30.3%) |
| 3-Person Household | 693 (61.6%) | 433 (38.5%) |
| 4+ Person Household | 786 (59.4%) | 538 (40.6%) |
| Total Housing Units | 4,178 (59.9%) | 2,792 (40.1%) |
Occupancy by Educational Attainment in Mcalester
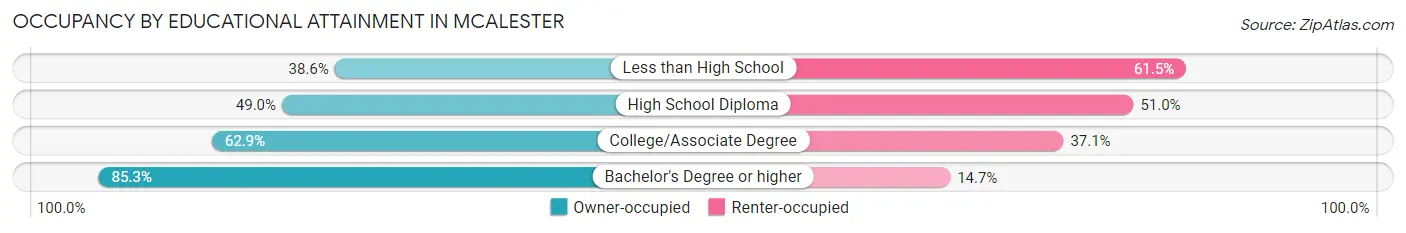
| Household Size | Owner-occupied | Renter-occupied |
| Less than High School | 352 (38.6%) | 561 (61.5%) |
| High School Diploma | 1,232 (49.0%) | 1,283 (51.0%) |
| College/Associate Degree | 1,199 (62.9%) | 708 (37.1%) |
| Bachelor's Degree or higher | 1,395 (85.3%) | 240 (14.7%) |
Occupancy by Age of Householder in Mcalester
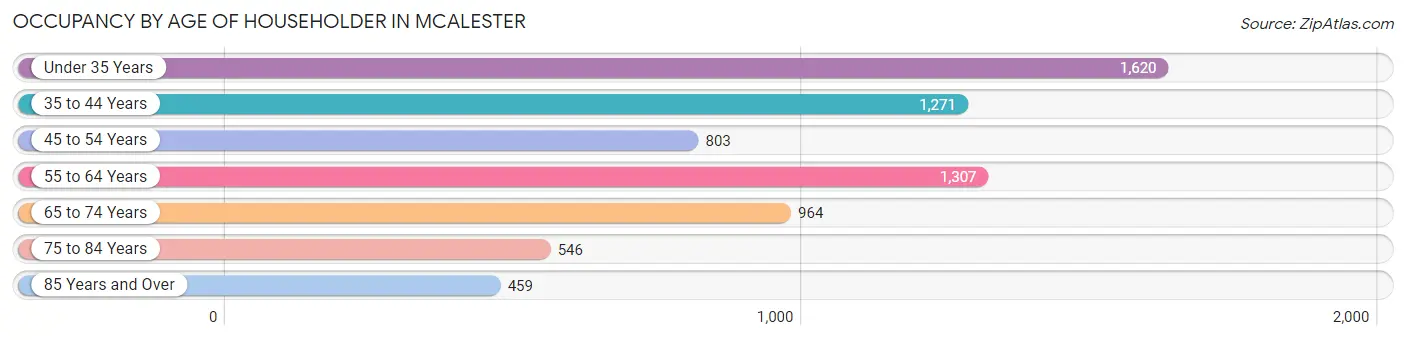
| Age Bracket | # Households | % Households |
| Under 35 Years | 1,620 | 23.2% |
| 35 to 44 Years | 1,271 | 18.2% |
| 45 to 54 Years | 803 | 11.5% |
| 55 to 64 Years | 1,307 | 18.8% |
| 65 to 74 Years | 964 | 13.8% |
| 75 to 84 Years | 546 | 7.8% |
| 85 Years and Over | 459 | 6.6% |
| Total | 6,970 | 100.0% |
Housing Finances in Mcalester
Median Income by Occupancy in Mcalester
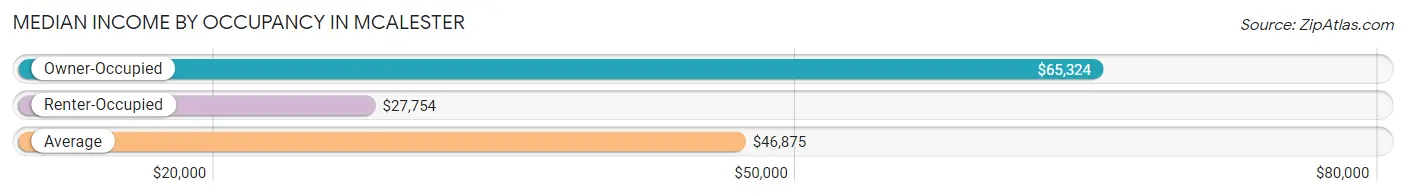
| Occupancy Type | # Households | Median Income |
| Owner-Occupied | 4,178 (59.9%) | $65,324 |
| Renter-Occupied | 2,792 (40.1%) | $27,754 |
| Average | 6,970 (100.0%) | $46,875 |
Occupancy by Householder Income Bracket in Mcalester
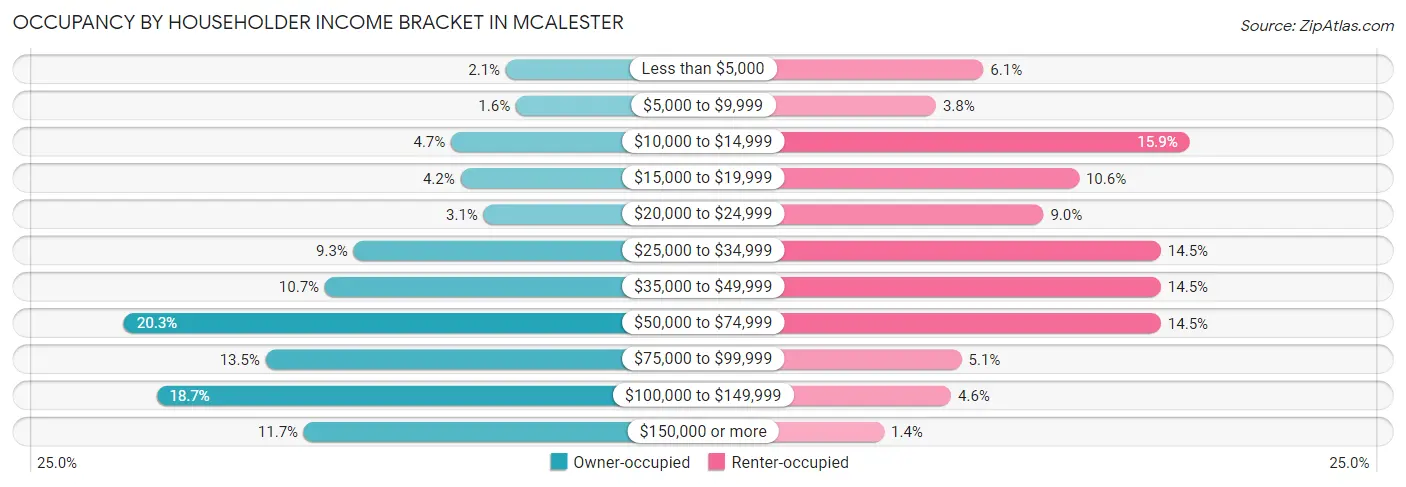
| Income Bracket | Owner-occupied | Renter-occupied |
| Less than $5,000 | 87 (2.1%) | 170 (6.1%) |
| $5,000 to $9,999 | 67 (1.6%) | 107 (3.8%) |
| $10,000 to $14,999 | 196 (4.7%) | 444 (15.9%) |
| $15,000 to $19,999 | 177 (4.2%) | 297 (10.6%) |
| $20,000 to $24,999 | 131 (3.1%) | 250 (8.9%) |
| $25,000 to $34,999 | 390 (9.3%) | 406 (14.5%) |
| $35,000 to $49,999 | 447 (10.7%) | 406 (14.5%) |
| $50,000 to $74,999 | 847 (20.3%) | 406 (14.5%) |
| $75,000 to $99,999 | 565 (13.5%) | 141 (5.1%) |
| $100,000 to $149,999 | 782 (18.7%) | 127 (4.5%) |
| $150,000 or more | 489 (11.7%) | 38 (1.4%) |
| Total | 4,178 (100.0%) | 2,792 (100.0%) |
Monthly Housing Cost Tiers in Mcalester
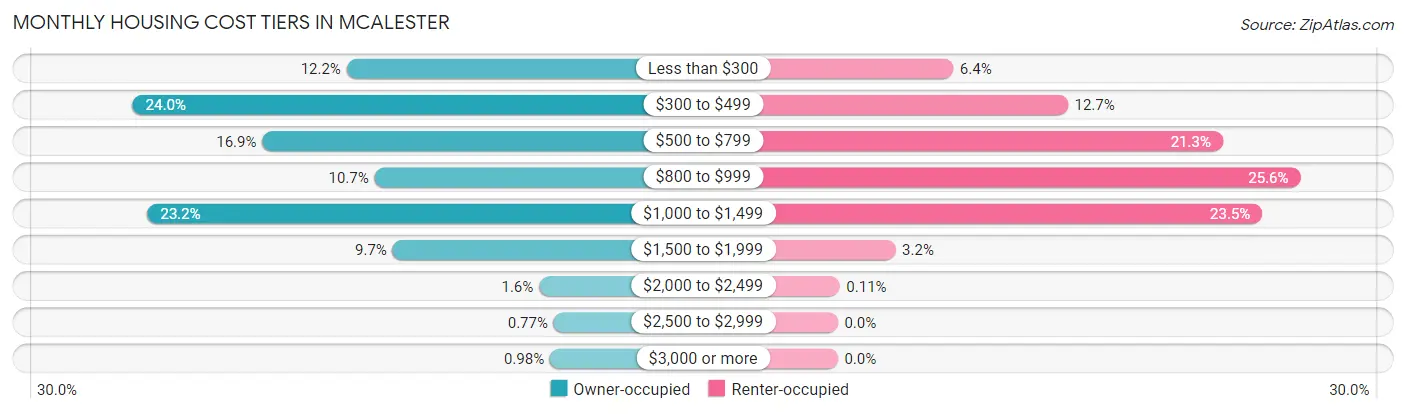
| Monthly Cost | Owner-occupied | Renter-occupied |
| Less than $300 | 510 (12.2%) | 178 (6.4%) |
| $300 to $499 | 1,004 (24.0%) | 355 (12.7%) |
| $500 to $799 | 705 (16.9%) | 594 (21.3%) |
| $800 to $999 | 446 (10.7%) | 714 (25.6%) |
| $1,000 to $1,499 | 970 (23.2%) | 655 (23.5%) |
| $1,500 to $1,999 | 404 (9.7%) | 89 (3.2%) |
| $2,000 to $2,499 | 66 (1.6%) | 3 (0.1%) |
| $2,500 to $2,999 | 32 (0.8%) | 0 (0.0%) |
| $3,000 or more | 41 (1.0%) | 0 (0.0%) |
| Total | 4,178 (100.0%) | 2,792 (100.0%) |
Physical Housing Characteristics in Mcalester
Housing Structures in Mcalester
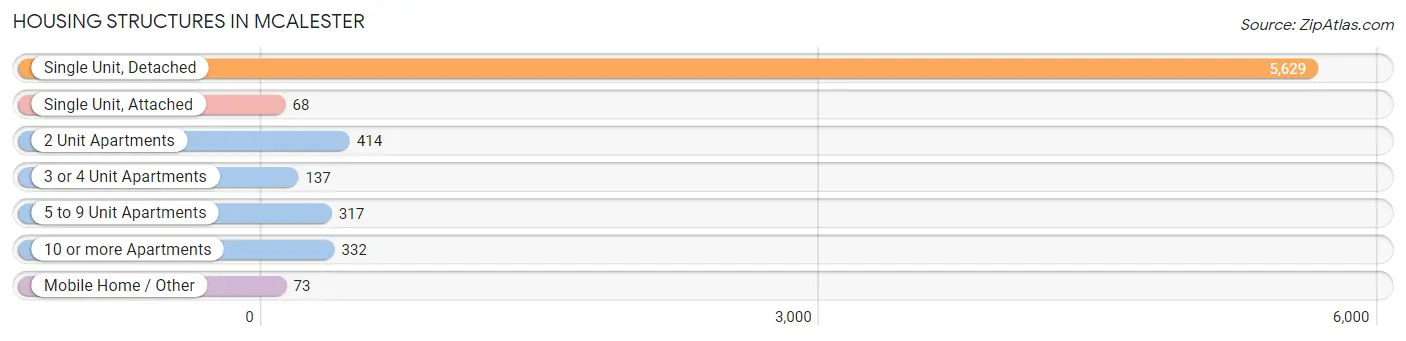
| Structure Type | # Housing Units | % Housing Units |
| Single Unit, Detached | 5,629 | 80.8% |
| Single Unit, Attached | 68 | 1.0% |
| 2 Unit Apartments | 414 | 5.9% |
| 3 or 4 Unit Apartments | 137 | 2.0% |
| 5 to 9 Unit Apartments | 317 | 4.5% |
| 10 or more Apartments | 332 | 4.8% |
| Mobile Home / Other | 73 | 1.1% |
| Total | 6,970 | 100.0% |
Housing Structures by Occupancy in Mcalester
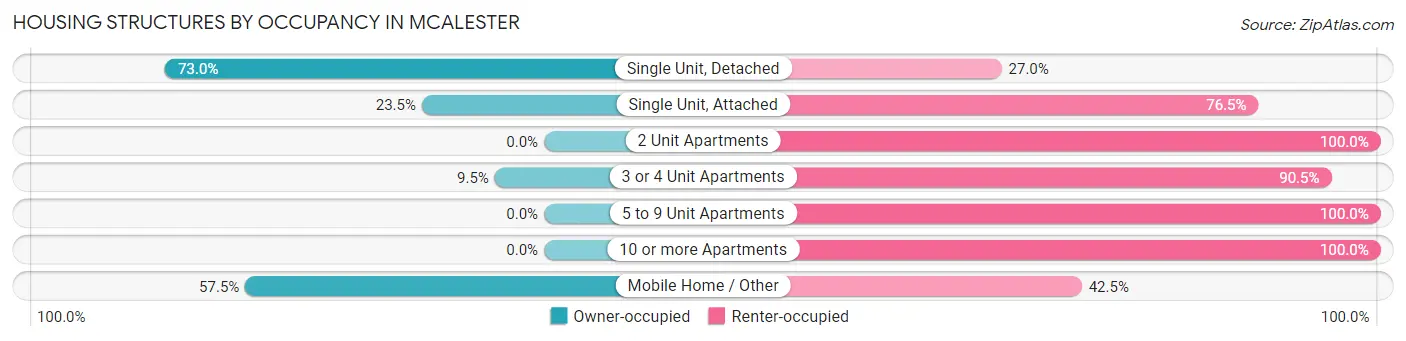
| Structure Type | Owner-occupied | Renter-occupied |
| Single Unit, Detached | 4,107 (73.0%) | 1,522 (27.0%) |
| Single Unit, Attached | 16 (23.5%) | 52 (76.5%) |
| 2 Unit Apartments | 0 (0.0%) | 414 (100.0%) |
| 3 or 4 Unit Apartments | 13 (9.5%) | 124 (90.5%) |
| 5 to 9 Unit Apartments | 0 (0.0%) | 317 (100.0%) |
| 10 or more Apartments | 0 (0.0%) | 332 (100.0%) |
| Mobile Home / Other | 42 (57.5%) | 31 (42.5%) |
| Total | 4,178 (59.9%) | 2,792 (40.1%) |
Housing Structures by Number of Rooms in Mcalester
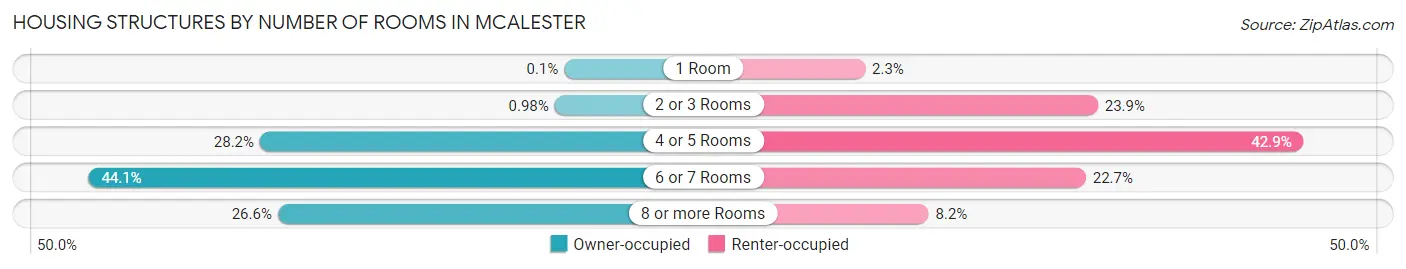
| Number of Rooms | Owner-occupied | Renter-occupied |
| 1 Room | 4 (0.1%) | 65 (2.3%) |
| 2 or 3 Rooms | 41 (1.0%) | 666 (23.8%) |
| 4 or 5 Rooms | 1,180 (28.2%) | 1,197 (42.9%) |
| 6 or 7 Rooms | 1,842 (44.1%) | 635 (22.7%) |
| 8 or more Rooms | 1,111 (26.6%) | 229 (8.2%) |
| Total | 4,178 (100.0%) | 2,792 (100.0%) |
Housing Structure by Heating Type in Mcalester
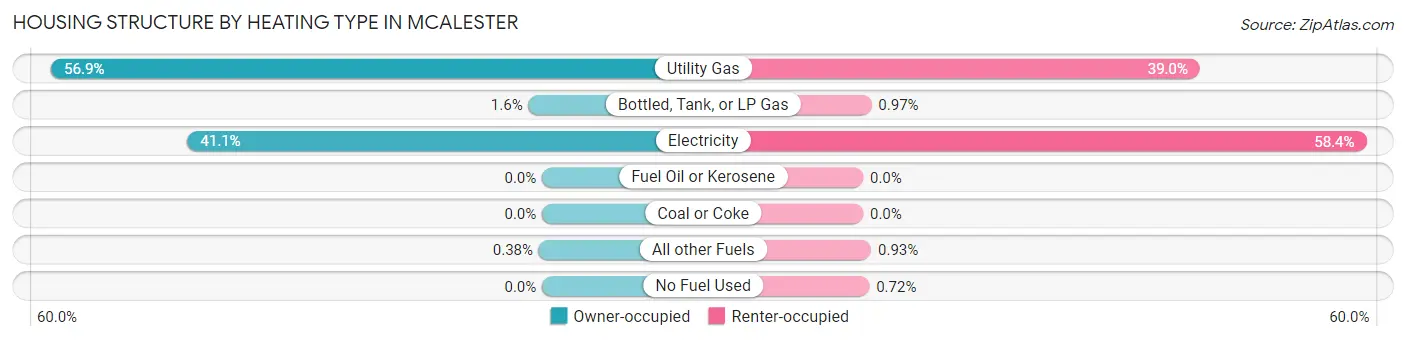
| Heating Type | Owner-occupied | Renter-occupied |
| Utility Gas | 2,378 (56.9%) | 1,090 (39.0%) |
| Bottled, Tank, or LP Gas | 66 (1.6%) | 27 (1.0%) |
| Electricity | 1,718 (41.1%) | 1,629 (58.4%) |
| Fuel Oil or Kerosene | 0 (0.0%) | 0 (0.0%) |
| Coal or Coke | 0 (0.0%) | 0 (0.0%) |
| All other Fuels | 16 (0.4%) | 26 (0.9%) |
| No Fuel Used | 0 (0.0%) | 20 (0.7%) |
| Total | 4,178 (100.0%) | 2,792 (100.0%) |
Household Vehicle Usage in Mcalester
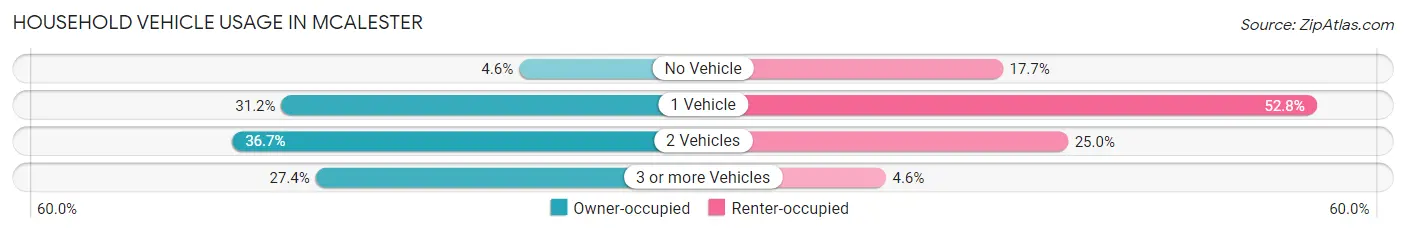
| Vehicles per Household | Owner-occupied | Renter-occupied |
| No Vehicle | 193 (4.6%) | 493 (17.7%) |
| 1 Vehicle | 1,305 (31.2%) | 1,475 (52.8%) |
| 2 Vehicles | 1,535 (36.7%) | 697 (25.0%) |
| 3 or more Vehicles | 1,145 (27.4%) | 127 (4.5%) |
| Total | 4,178 (100.0%) | 2,792 (100.0%) |
Real Estate & Mortgages in Mcalester
Real Estate and Mortgage Overview in Mcalester
| Characteristic | Without Mortgage | With Mortgage |
| Housing Units | 1,910 | 2,268 |
| Median Property Value | $110,300 | $150,700 |
| Median Household Income | $46,938 | $391 |
| Monthly Housing Costs | $392 | $41 |
| Real Estate Taxes | $566 | $119 |
Property Value by Mortgage Status in Mcalester
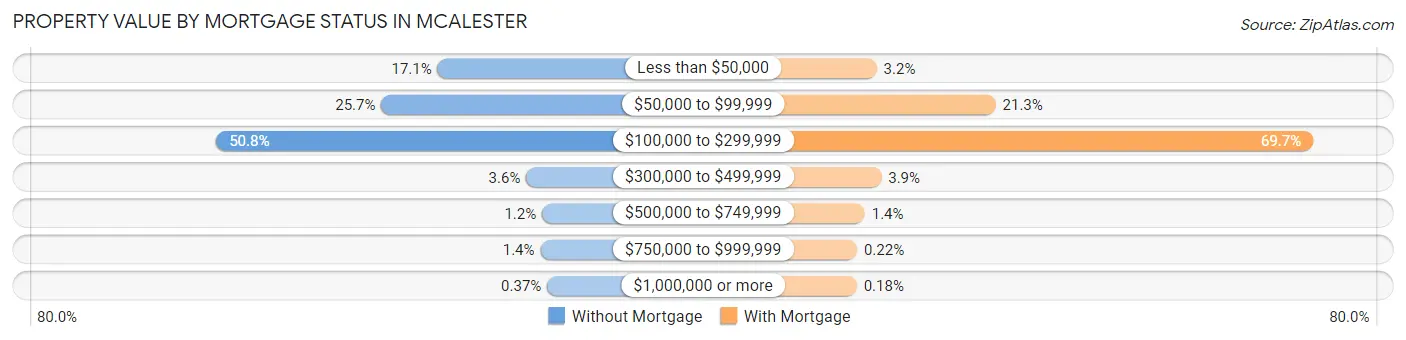
| Property Value | Without Mortgage | With Mortgage |
| Less than $50,000 | 326 (17.1%) | 73 (3.2%) |
| $50,000 to $99,999 | 490 (25.7%) | 484 (21.3%) |
| $100,000 to $299,999 | 970 (50.8%) | 1,581 (69.7%) |
| $300,000 to $499,999 | 68 (3.6%) | 89 (3.9%) |
| $500,000 to $749,999 | 22 (1.1%) | 32 (1.4%) |
| $750,000 to $999,999 | 27 (1.4%) | 5 (0.2%) |
| $1,000,000 or more | 7 (0.4%) | 4 (0.2%) |
| Total | 1,910 (100.0%) | 2,268 (100.0%) |
Household Income by Mortgage Status in Mcalester
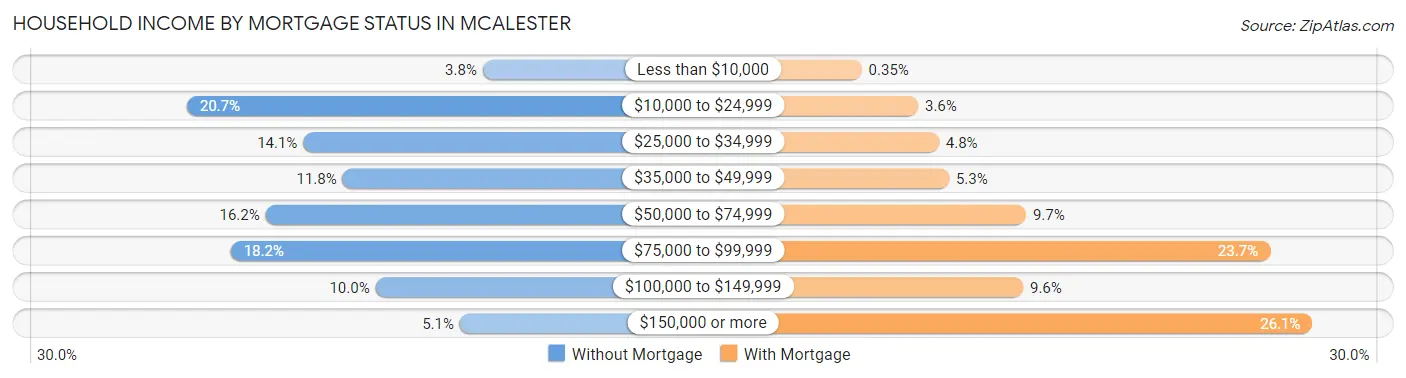
| Household Income | Without Mortgage | With Mortgage |
| Less than $10,000 | 73 (3.8%) | 8 (0.4%) |
| $10,000 to $24,999 | 396 (20.7%) | 81 (3.6%) |
| $25,000 to $34,999 | 269 (14.1%) | 108 (4.8%) |
| $35,000 to $49,999 | 226 (11.8%) | 121 (5.3%) |
| $50,000 to $74,999 | 310 (16.2%) | 221 (9.7%) |
| $75,000 to $99,999 | 348 (18.2%) | 537 (23.7%) |
| $100,000 to $149,999 | 190 (10.0%) | 217 (9.6%) |
| $150,000 or more | 98 (5.1%) | 592 (26.1%) |
| Total | 1,910 (100.0%) | 2,268 (100.0%) |
Property Value to Household Income Ratio in Mcalester
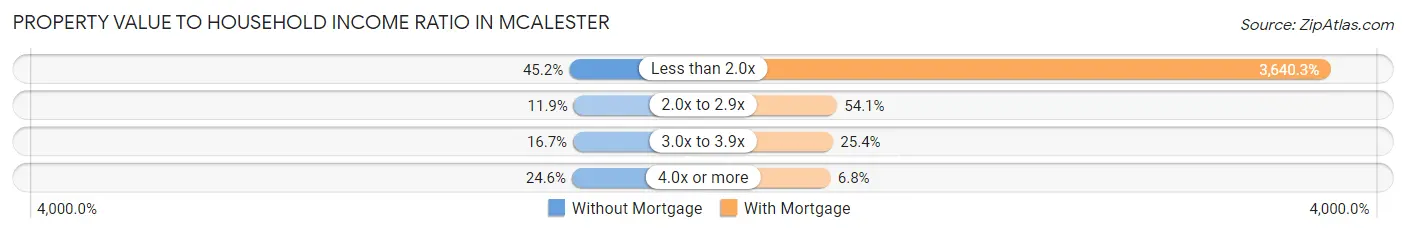
| Value-to-Income Ratio | Without Mortgage | With Mortgage |
| Less than 2.0x | 863 (45.2%) | 82,563 (3,640.3%) |
| 2.0x to 2.9x | 227 (11.9%) | 1,226 (54.1%) |
| 3.0x to 3.9x | 318 (16.7%) | 575 (25.4%) |
| 4.0x or more | 470 (24.6%) | 155 (6.8%) |
| Total | 1,910 (100.0%) | 2,268 (100.0%) |
Real Estate Taxes by Mortgage Status in Mcalester
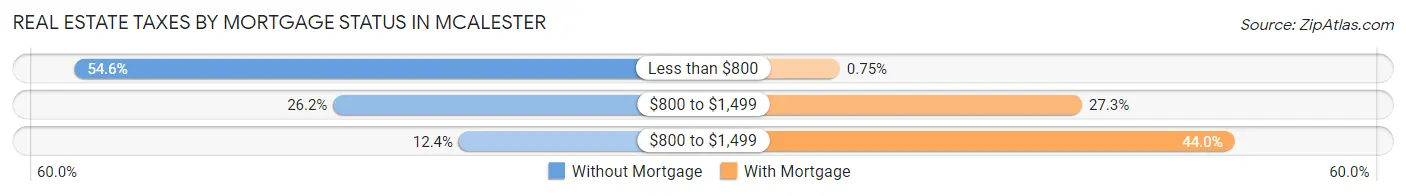
| Property Taxes | Without Mortgage | With Mortgage |
| Less than $800 | 1,042 (54.5%) | 17 (0.7%) |
| $800 to $1,499 | 500 (26.2%) | 619 (27.3%) |
| $800 to $1,499 | 237 (12.4%) | 998 (44.0%) |
| Total | 1,910 (100.0%) | 2,268 (100.0%) |
Health & Disability in Mcalester
Health Insurance Coverage by Age in Mcalester
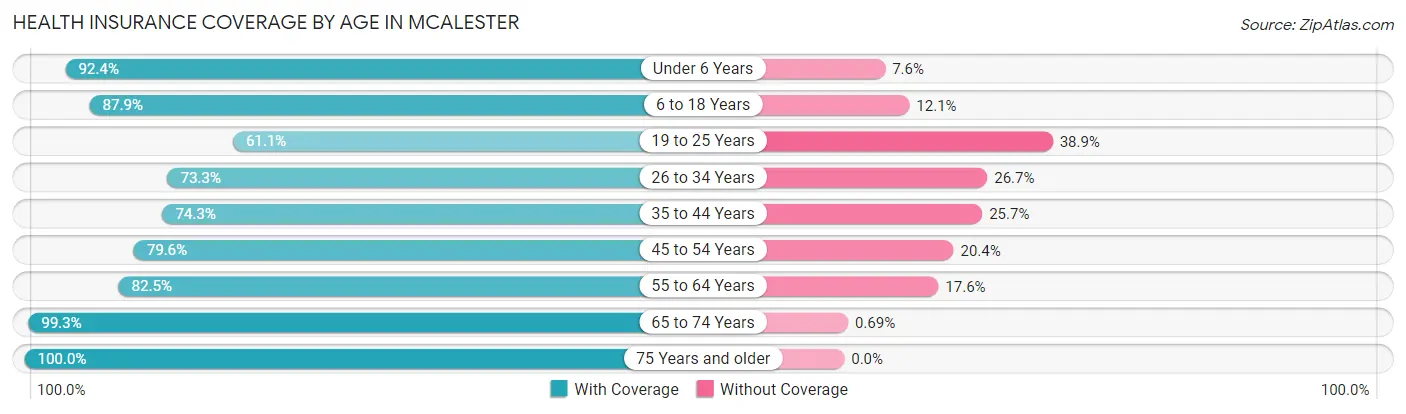
| Age Bracket | With Coverage | Without Coverage |
| Under 6 Years | 1,162 (92.4%) | 96 (7.6%) |
| 6 to 18 Years | 2,751 (87.9%) | 380 (12.1%) |
| 19 to 25 Years | 818 (61.1%) | 520 (38.9%) |
| 26 to 34 Years | 1,485 (73.3%) | 540 (26.7%) |
| 35 to 44 Years | 1,652 (74.3%) | 572 (25.7%) |
| 45 to 54 Years | 1,216 (79.6%) | 311 (20.4%) |
| 55 to 64 Years | 1,743 (82.5%) | 371 (17.5%) |
| 65 to 74 Years | 1,287 (99.3%) | 9 (0.7%) |
| 75 Years and older | 1,282 (100.0%) | 0 (0.0%) |
| Total | 13,396 (82.7%) | 2,799 (17.3%) |
Health Insurance Coverage by Citizenship Status in Mcalester
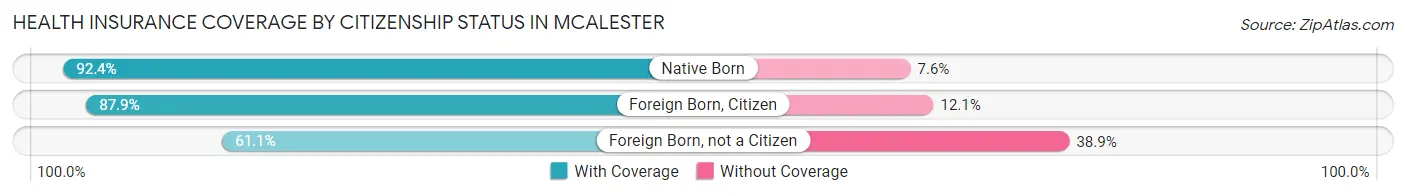
| Citizenship Status | With Coverage | Without Coverage |
| Native Born | 1,162 (92.4%) | 96 (7.6%) |
| Foreign Born, Citizen | 2,751 (87.9%) | 380 (12.1%) |
| Foreign Born, not a Citizen | 818 (61.1%) | 520 (38.9%) |
Health Insurance Coverage by Household Income in Mcalester
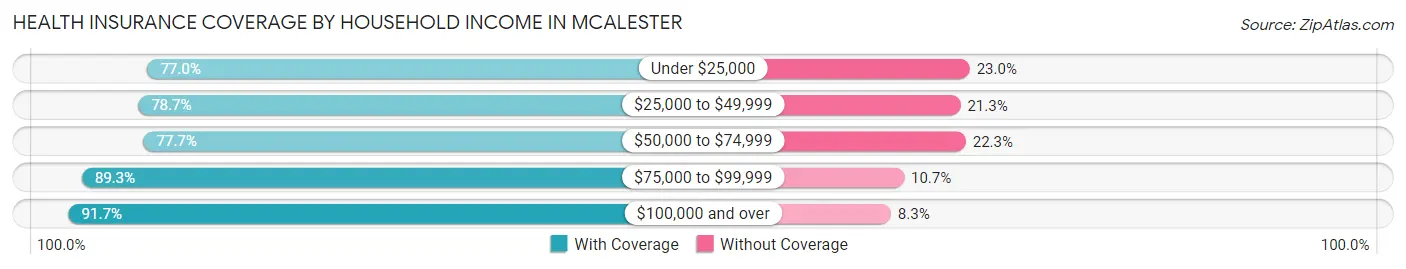
| Household Income | With Coverage | Without Coverage |
| Under $25,000 | 2,613 (77.0%) | 782 (23.0%) |
| $25,000 to $49,999 | 2,727 (78.7%) | 738 (21.3%) |
| $50,000 to $74,999 | 2,371 (77.7%) | 680 (22.3%) |
| $75,000 to $99,999 | 1,715 (89.3%) | 206 (10.7%) |
| $100,000 and over | 3,910 (91.7%) | 352 (8.3%) |
Public vs Private Health Insurance Coverage by Age in Mcalester
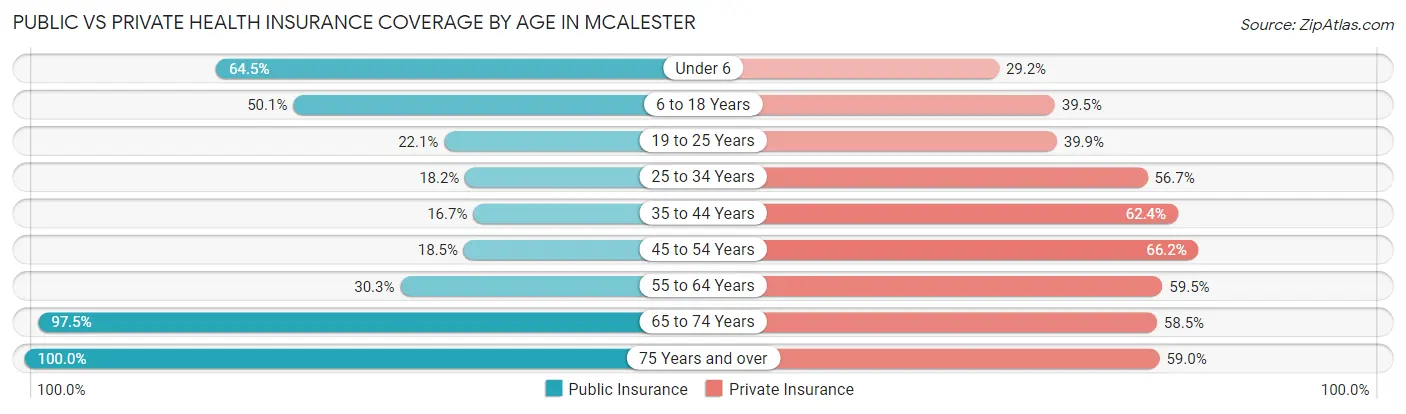
| Age Bracket | Public Insurance | Private Insurance |
| Under 6 | 811 (64.5%) | 367 (29.2%) |
| 6 to 18 Years | 1,570 (50.1%) | 1,238 (39.5%) |
| 19 to 25 Years | 296 (22.1%) | 534 (39.9%) |
| 25 to 34 Years | 369 (18.2%) | 1,149 (56.7%) |
| 35 to 44 Years | 372 (16.7%) | 1,387 (62.4%) |
| 45 to 54 Years | 282 (18.5%) | 1,011 (66.2%) |
| 55 to 64 Years | 640 (30.3%) | 1,258 (59.5%) |
| 65 to 74 Years | 1,263 (97.5%) | 758 (58.5%) |
| 75 Years and over | 1,282 (100.0%) | 756 (59.0%) |
| Total | 6,885 (42.5%) | 8,458 (52.2%) |
Disability Status by Sex by Age in Mcalester
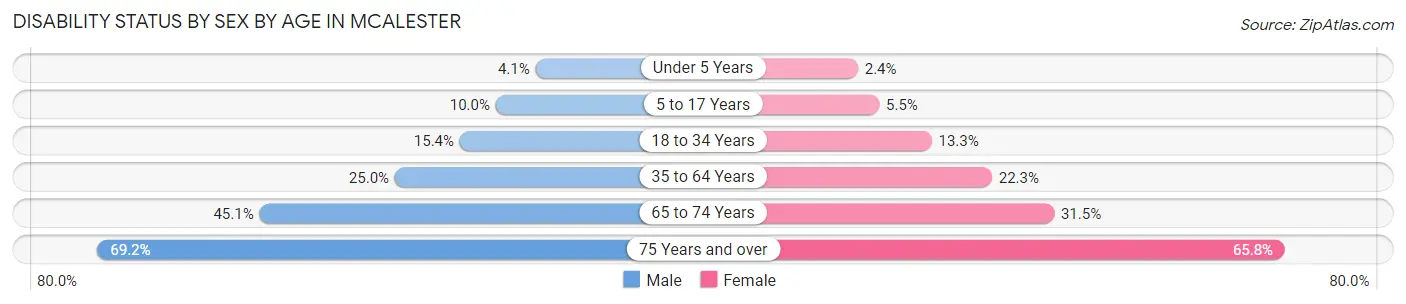
| Age Bracket | Male | Female |
| Under 5 Years | 24 (4.1%) | 12 (2.4%) |
| 5 to 17 Years | 174 (10.0%) | 76 (5.5%) |
| 18 to 34 Years | 261 (15.4%) | 248 (13.3%) |
| 35 to 64 Years | 719 (25.0%) | 666 (22.3%) |
| 65 to 74 Years | 254 (45.1%) | 231 (31.5%) |
| 75 Years and over | 274 (69.2%) | 583 (65.8%) |
Disability Class by Sex by Age in Mcalester
Disability Class: Hearing Difficulty
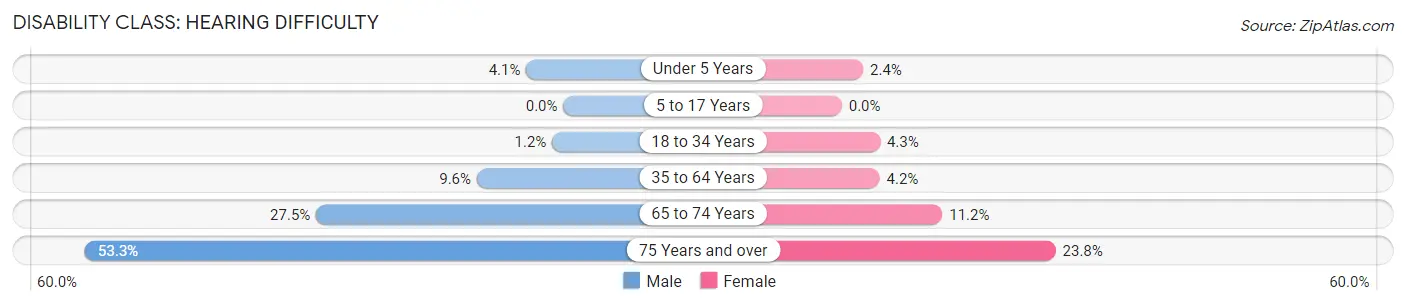
| Age Bracket | Male | Female |
| Under 5 Years | 24 (4.1%) | 12 (2.4%) |
| 5 to 17 Years | 0 (0.0%) | 0 (0.0%) |
| 18 to 34 Years | 21 (1.2%) | 79 (4.3%) |
| 35 to 64 Years | 277 (9.6%) | 126 (4.2%) |
| 65 to 74 Years | 155 (27.5%) | 82 (11.2%) |
| 75 Years and over | 211 (53.3%) | 211 (23.8%) |
Disability Class: Vision Difficulty
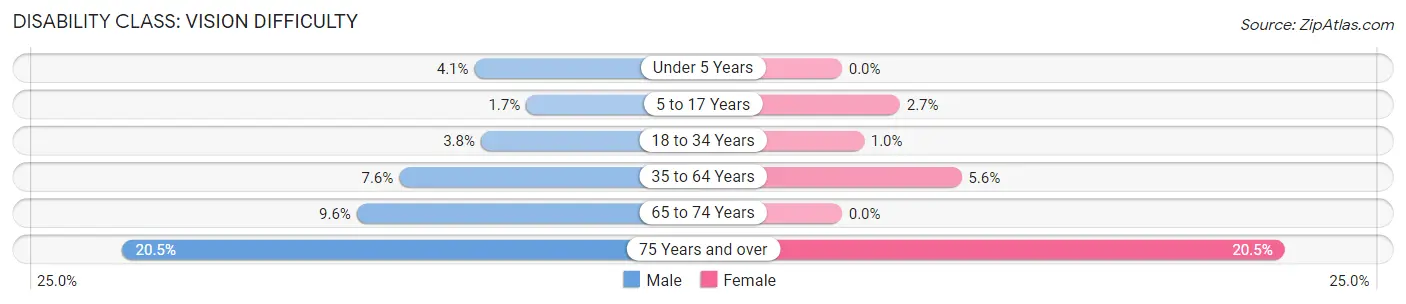
| Age Bracket | Male | Female |
| Under 5 Years | 24 (4.1%) | 0 (0.0%) |
| 5 to 17 Years | 30 (1.7%) | 37 (2.7%) |
| 18 to 34 Years | 65 (3.8%) | 19 (1.0%) |
| 35 to 64 Years | 219 (7.6%) | 166 (5.6%) |
| 65 to 74 Years | 54 (9.6%) | 0 (0.0%) |
| 75 Years and over | 81 (20.4%) | 182 (20.5%) |
Disability Class: Cognitive Difficulty
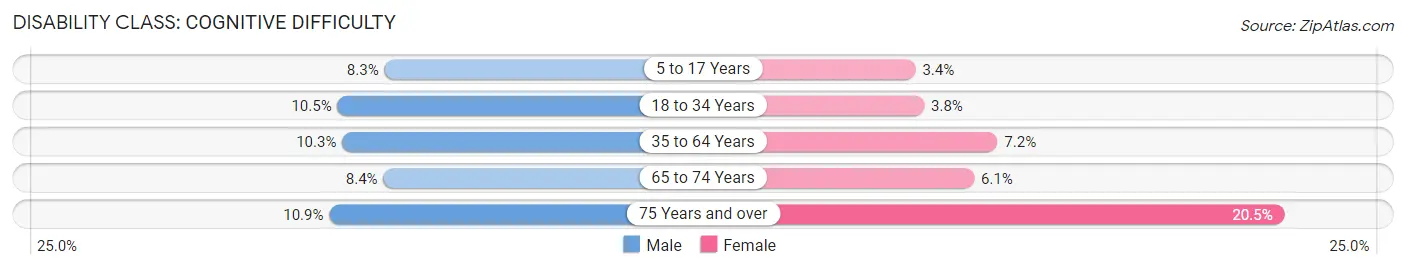
| Age Bracket | Male | Female |
| 5 to 17 Years | 144 (8.3%) | 47 (3.4%) |
| 18 to 34 Years | 178 (10.5%) | 71 (3.8%) |
| 35 to 64 Years | 295 (10.3%) | 216 (7.2%) |
| 65 to 74 Years | 47 (8.4%) | 45 (6.1%) |
| 75 Years and over | 43 (10.9%) | 182 (20.5%) |
Disability Class: Ambulatory Difficulty
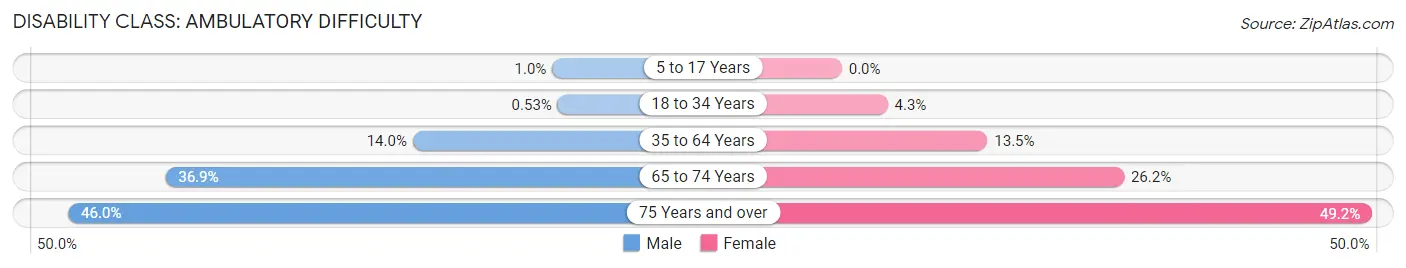
| Age Bracket | Male | Female |
| 5 to 17 Years | 18 (1.0%) | 0 (0.0%) |
| 18 to 34 Years | 9 (0.5%) | 79 (4.3%) |
| 35 to 64 Years | 402 (14.0%) | 404 (13.5%) |
| 65 to 74 Years | 208 (36.9%) | 192 (26.2%) |
| 75 Years and over | 182 (46.0%) | 436 (49.2%) |
Disability Class: Self-Care Difficulty
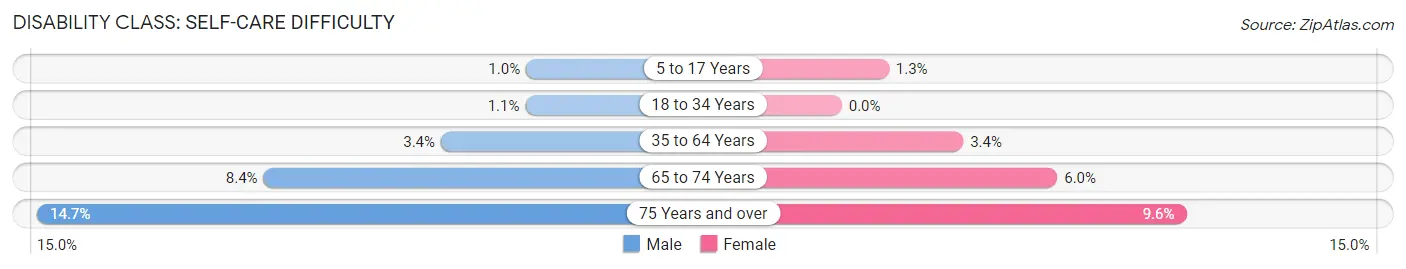
| Age Bracket | Male | Female |
| 5 to 17 Years | 18 (1.0%) | 18 (1.3%) |
| 18 to 34 Years | 18 (1.1%) | 0 (0.0%) |
| 35 to 64 Years | 98 (3.4%) | 101 (3.4%) |
| 65 to 74 Years | 47 (8.4%) | 44 (6.0%) |
| 75 Years and over | 58 (14.6%) | 85 (9.6%) |
Technology Access in Mcalester
Computing Device Access in Mcalester
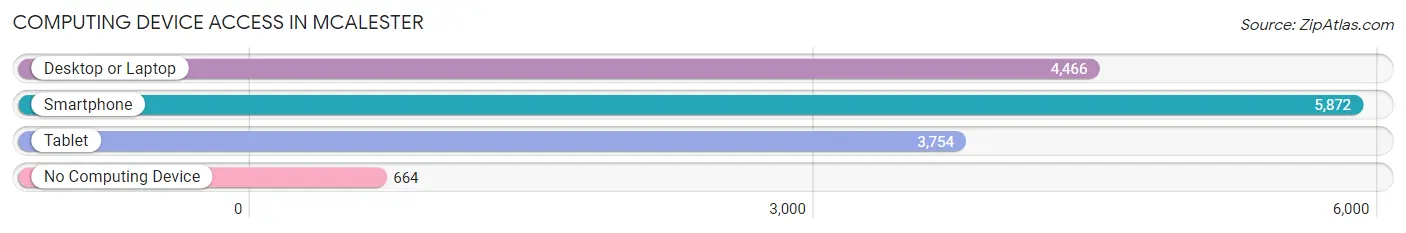
| Device Type | # Households | % Households |
| Desktop or Laptop | 4,466 | 64.1% |
| Smartphone | 5,872 | 84.3% |
| Tablet | 3,754 | 53.9% |
| No Computing Device | 664 | 9.5% |
| Total | 6,970 | 100.0% |
Internet Access in Mcalester
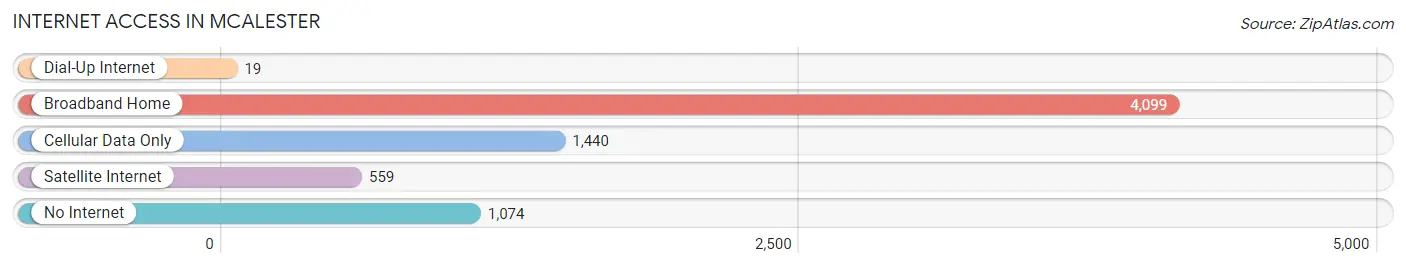
| Internet Type | # Households | % Households |
| Dial-Up Internet | 19 | 0.3% |
| Broadband Home | 4,099 | 58.8% |
| Cellular Data Only | 1,440 | 20.7% |
| Satellite Internet | 559 | 8.0% |
| No Internet | 1,074 | 15.4% |
| Total | 6,970 | 100.0% |
Mcalester Summary
Mcalester, Oklahoma is a city located in Pittsburg County, Oklahoma. It is the county seat of Pittsburg County and is the largest city in the county. The city is located in the southeastern part of the state, about 100 miles southeast of Tulsa. The population of Mcalester was estimated to be 18,363 in 2019.
History
Mcalester was founded in 1872 by a group of settlers led by James McAllister, who named the town after himself. The town was originally located in the Choctaw Nation, Indian Territory. The town was incorporated in 1887 and was designated as the county seat of Pittsburg County in 1895.
Mcalester was a major railroad hub in the early 20th century, with the St. Louis and San Francisco Railway, the Kansas City, Pittsburg and Gulf Railroad, and the Missouri, Kansas and Texas Railroad all having lines that ran through the city. The city was also the site of a major oil boom in the early 1900s, with the discovery of the nearby McAlester Oil Field in 1914.
Geography
Mcalester is located in southeastern Oklahoma, about 100 miles southeast of Tulsa. The city is situated in the rolling hills of the Ouachita Mountains, and is surrounded by the Kiamichi Mountains to the east and the Ozark Mountains to the west. The city is located at the intersection of U.S. Route 69 and U.S. Route 270.
The city has a total area of 16.2 square miles, of which 16.1 square miles is land and 0.1 square miles is water. The city is located in the humid subtropical climate zone, with hot, humid summers and mild winters.
Economy
Mcalester’s economy is largely based on the oil and gas industry, with the city being home to several major oil and gas companies. The city is also home to several manufacturing companies, including a paper mill, a steel mill, and a tire plant. The city is also home to several retail stores, restaurants, and other businesses.
Mcalester is home to several educational institutions, including Eastern Oklahoma State College, Pittsburg County Technology Center, and the McAlester Public Schools. The city is also home to several healthcare facilities, including McAlester Regional Health Center and McAlester Regional Medical Center.
Demographics
As of the 2019 census, the population of Mcalester was estimated to be 18,363. The racial makeup of the city was 75.3% White, 15.2% African American, 0.7% Native American, 0.7% Asian, 0.1% Pacific Islander, and 6.9% from other races. The median household income was $37,945, and the median family income was $45,945. The per capita income was $20,945.
Mcalester is home to several churches, including the First United Methodist Church, the First Baptist Church, and the Church of Christ. The city is also home to several parks, including the McAlester City Park, the Pittsburg County Park, and the Kiamichi Park. The city is also home to several museums, including the Pittsburg County Historical Museum and the McAlester Army Ammunition Plant Museum.
Common Questions
What is Per Capita Income in Mcalester?
Per Capita income in Mcalester is $26,239.
What is the Median Family Income in Mcalester?
Median Family Income in Mcalester is $63,434.
What is the Median Household income in Mcalester?
Median Household Income in Mcalester is $46,875.
What is Income or Wage Gap in Mcalester?
Income or Wage Gap in Mcalester is 33.9%.
Women in Mcalester earn 66.1 cents for every dollar earned by a man.
What is Family Income Deficit in Mcalester?
Family Income Deficit in Mcalester is $10,932.
Families that are below poverty line in Mcalester earn $10,932 less on average than the poverty threshold level.
What is Inequality or Gini Index in Mcalester?
Inequality or Gini Index in Mcalester is 0.49.
What is the Total Population of Mcalester?
Total Population of Mcalester is 18,110.
What is the Total Male Population of Mcalester?
Total Male Population of Mcalester is 9,554.
What is the Total Female Population of Mcalester?
Total Female Population of Mcalester is 8,556.
What is the Ratio of Males per 100 Females in Mcalester?
There are 111.66 Males per 100 Females in Mcalester.
What is the Ratio of Females per 100 Males in Mcalester?
There are 89.55 Females per 100 Males in Mcalester.
What is the Median Population Age in Mcalester?
Median Population Age in Mcalester is 36.3 Years.
What is the Average Family Size in Mcalester
Average Family Size in Mcalester is 3.0 People.
What is the Average Household Size in Mcalester
Average Household Size in Mcalester is 2.3 People.
How Large is the Labor Force in Mcalester?
There are 7,520 People in the Labor Forcein in Mcalester.
What is the Percentage of People in the Labor Force in Mcalester?
52.6% of People are in the Labor Force in Mcalester.
What is the Unemployment Rate in Mcalester?
Unemployment Rate in Mcalester is 8.0%.