Mannford, OK Map & Demographics
Mannford Map
Mannford Overview
$25,535
PER CAPITA INCOME
$72,824
AVG FAMILY INCOME
$60,125
AVG HOUSEHOLD INCOME
47.9%
WAGE / INCOME GAP [ % ]
52.1¢/ $1
WAGE / INCOME GAP [ $ ]
0.39
INEQUALITY / GINI INDEX
3,275
TOTAL POPULATION
1,684
MALE POPULATION
1,591
FEMALE POPULATION
105.85
MALES / 100 FEMALES
94.48
FEMALES / 100 MALES
30.1
MEDIAN AGE
3.4
AVG FAMILY SIZE
2.8
AVG HOUSEHOLD SIZE
1,417
LABOR FORCE [ PEOPLE ]
60.6%
PERCENT IN LABOR FORCE
1.9%
UNEMPLOYMENT RATE
Mannford Zip Codes
Mannford Area Codes
Income in Mannford
Income Overview in Mannford
Per Capita Income in Mannford is $25,535, while median incomes of families and households are $72,824 and $60,125 respectively.
| Characteristic | Number | Measure |
| Per Capita Income | 3,275 | $25,535 |
| Median Family Income | 795 | $72,824 |
| Mean Family Income | 795 | $80,876 |
| Median Household Income | 1,151 | $60,125 |
| Mean Household Income | 1,151 | $69,973 |
| Income Deficit | 795 | $0 |
| Wage / Income Gap (%) | 3,275 | 47.93% |
| Wage / Income Gap ($) | 3,275 | 52.07¢ per $1 |
| Gini / Inequality Index | 3,275 | 0.39 |
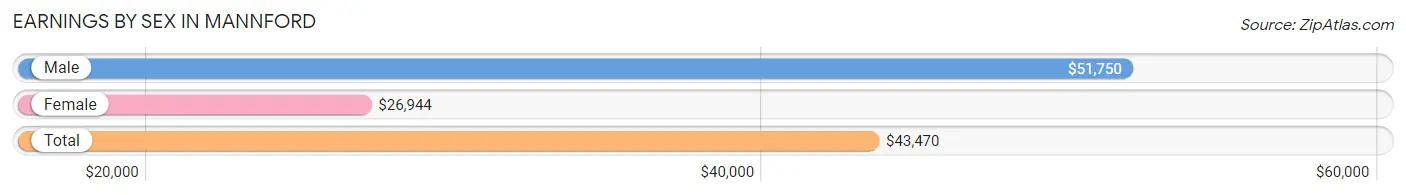
Earnings by Sex in Mannford
Average Earnings in Mannford are $43,470, $51,750 for men and $26,944 for women, a difference of 47.9%.
| Sex | Number | Average Earnings |
| Male | 795 (54.8%) | $51,750 |
| Female | 656 (45.2%) | $26,944 |
| Total | 1,451 (100.0%) | $43,470 |
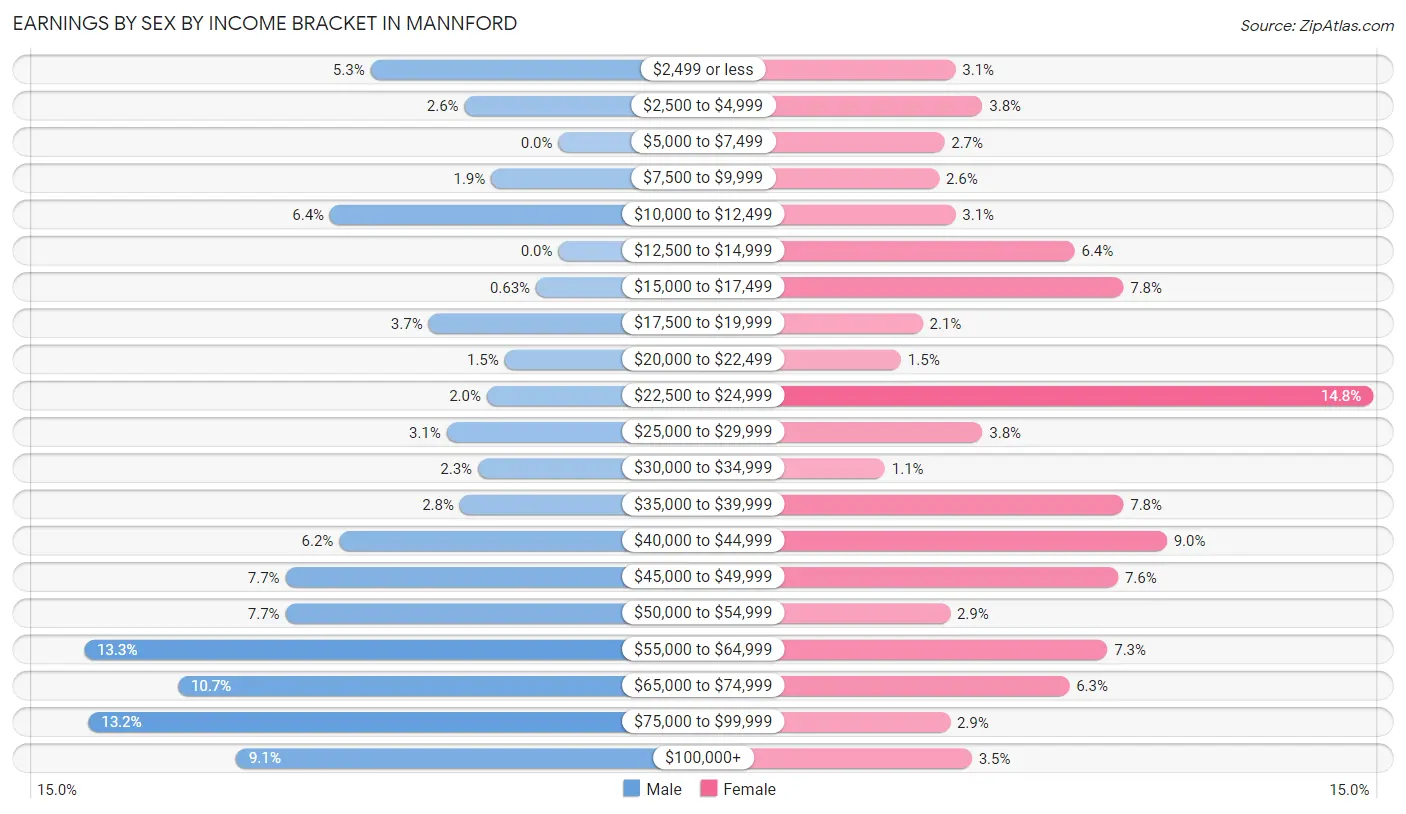
Earnings by Sex by Income Bracket in Mannford
The most common earnings brackets in Mannford are $55,000 to $64,999 for men (106 | 13.3%) and $22,500 to $24,999 for women (97 | 14.8%).
| Income | Male | Female |
| $2,499 or less | 42 (5.3%) | 20 (3.0%) |
| $2,500 to $4,999 | 21 (2.6%) | 25 (3.8%) |
| $5,000 to $7,499 | 0 (0.0%) | 18 (2.7%) |
| $7,500 to $9,999 | 15 (1.9%) | 17 (2.6%) |
| $10,000 to $12,499 | 51 (6.4%) | 20 (3.0%) |
| $12,500 to $14,999 | 0 (0.0%) | 42 (6.4%) |
| $15,000 to $17,499 | 5 (0.6%) | 51 (7.8%) |
| $17,500 to $19,999 | 29 (3.6%) | 14 (2.1%) |
| $20,000 to $22,499 | 12 (1.5%) | 10 (1.5%) |
| $22,500 to $24,999 | 16 (2.0%) | 97 (14.8%) |
| $25,000 to $29,999 | 25 (3.1%) | 25 (3.8%) |
| $30,000 to $34,999 | 18 (2.3%) | 7 (1.1%) |
| $35,000 to $39,999 | 22 (2.8%) | 51 (7.8%) |
| $40,000 to $44,999 | 49 (6.2%) | 59 (9.0%) |
| $45,000 to $49,999 | 61 (7.7%) | 50 (7.6%) |
| $50,000 to $54,999 | 61 (7.7%) | 19 (2.9%) |
| $55,000 to $64,999 | 106 (13.3%) | 48 (7.3%) |
| $65,000 to $74,999 | 85 (10.7%) | 41 (6.2%) |
| $75,000 to $99,999 | 105 (13.2%) | 19 (2.9%) |
| $100,000+ | 72 (9.1%) | 23 (3.5%) |
| Total | 795 (100.0%) | 656 (100.0%) |
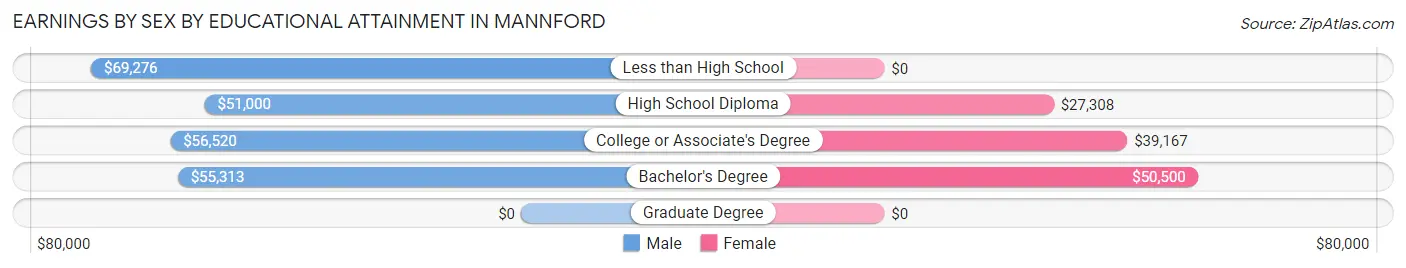
Earnings by Sex by Educational Attainment in Mannford
Average earnings in Mannford are $56,792 for men and $39,420 for women, a difference of 30.6%. Men with an educational attainment of less than high school enjoy the highest average annual earnings of $69,276, while those with high school diploma education earn the least with $51,000. Women with an educational attainment of bachelor's degree earn the most with the average annual earnings of $50,500, while those with high school diploma education have the smallest earnings of $27,308.
| Educational Attainment | Male Income | Female Income |
| Less than High School | $69,276 | $0 |
| High School Diploma | $51,000 | $27,308 |
| College or Associate's Degree | $56,520 | $39,167 |
| Bachelor's Degree | $55,313 | $50,500 |
| Graduate Degree | - | - |
| Total | $56,792 | $39,420 |
Family Income in Mannford
Family Income Brackets in Mannford
According to the Mannford family income data, there are 166 families falling into the $50,000 to $74,999 income range, which is the most common income bracket and makes up 20.9% of all families. Conversely, the less than $10,000 income bracket is the least frequent group with only 14 families (1.8%) belonging to this category.
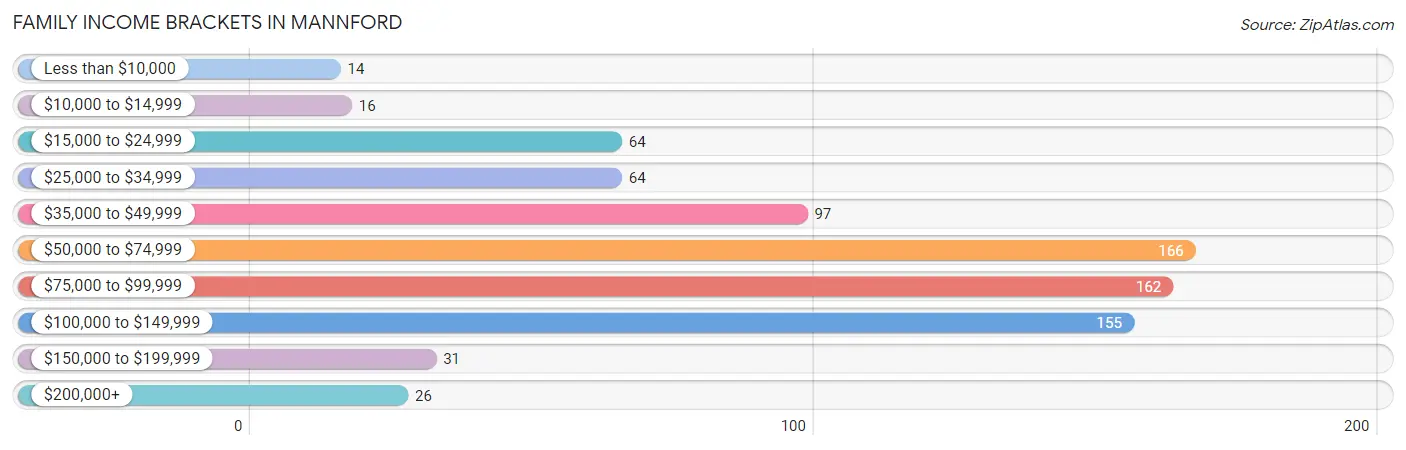
| Income Bracket | # Families | % Families |
| Less than $10,000 | 14 | 1.8% |
| $10,000 to $14,999 | 16 | 2.0% |
| $15,000 to $24,999 | 64 | 8.1% |
| $25,000 to $34,999 | 64 | 8.1% |
| $35,000 to $49,999 | 97 | 12.2% |
| $50,000 to $74,999 | 166 | 20.9% |
| $75,000 to $99,999 | 162 | 20.4% |
| $100,000 to $149,999 | 155 | 19.5% |
| $150,000 to $199,999 | 31 | 3.9% |
| $200,000+ | 26 | 3.3% |
Family Income by Famaliy Size in Mannford
5-person families (69 | 8.7%) account for the highest median family income in Mannford with $106,250 per family, while 2-person families (365 | 45.9%) have the highest median income of $30,438 per family member.
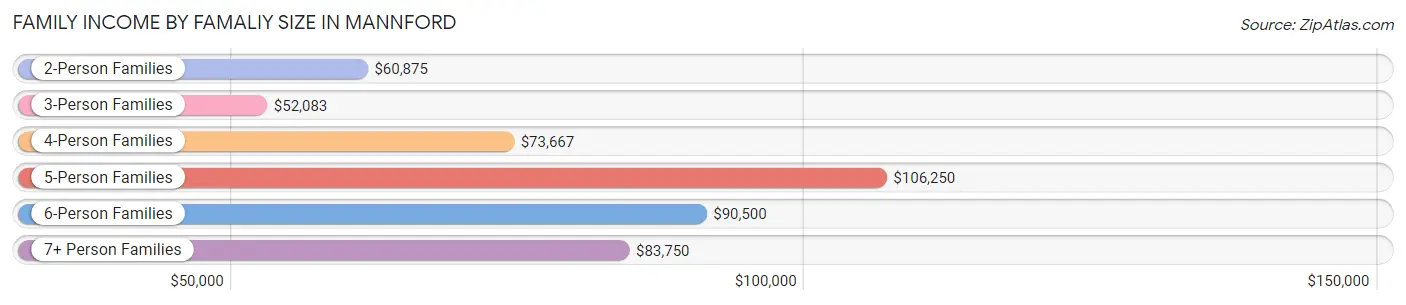
| Income Bracket | # Families | Median Income |
| 2-Person Families | 365 (45.9%) | $60,875 |
| 3-Person Families | 92 (11.6%) | $52,083 |
| 4-Person Families | 194 (24.4%) | $73,667 |
| 5-Person Families | 69 (8.7%) | $106,250 |
| 6-Person Families | 34 (4.3%) | $90,500 |
| 7+ Person Families | 41 (5.2%) | $83,750 |
| Total | 795 (100.0%) | $72,824 |
Family Income by Number of Earners in Mannford
The median family income in Mannford is $72,824, with families comprising 3+ earners (71) having the highest median family income of $133,750, while families with no earners (110) have the lowest median family income of $44,286, accounting for 8.9% and 13.8% of families, respectively.
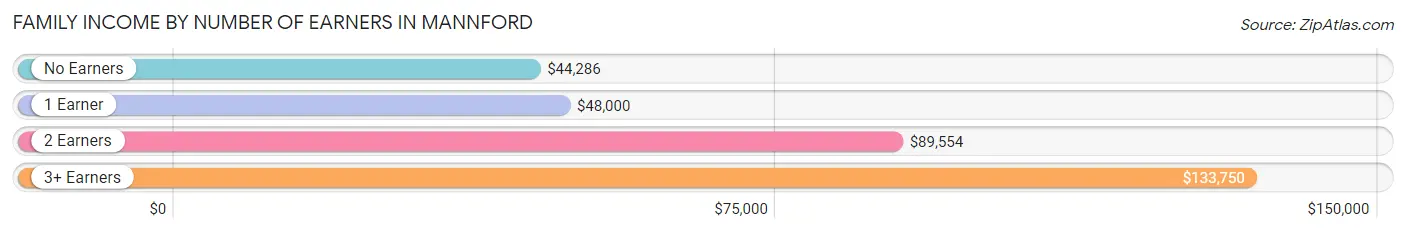
| Number of Earners | # Families | Median Income |
| No Earners | 110 (13.8%) | $44,286 |
| 1 Earner | 292 (36.7%) | $48,000 |
| 2 Earners | 322 (40.5%) | $89,554 |
| 3+ Earners | 71 (8.9%) | $133,750 |
| Total | 795 (100.0%) | $72,824 |
Household Income in Mannford
Household Income Brackets in Mannford
With 228 households falling in the category, the $50,000 to $74,999 income range is the most frequent in Mannford, accounting for 19.8% of all households. In contrast, only 26 households (2.3%) fall into the $200,000+ income bracket, making it the least populous group.
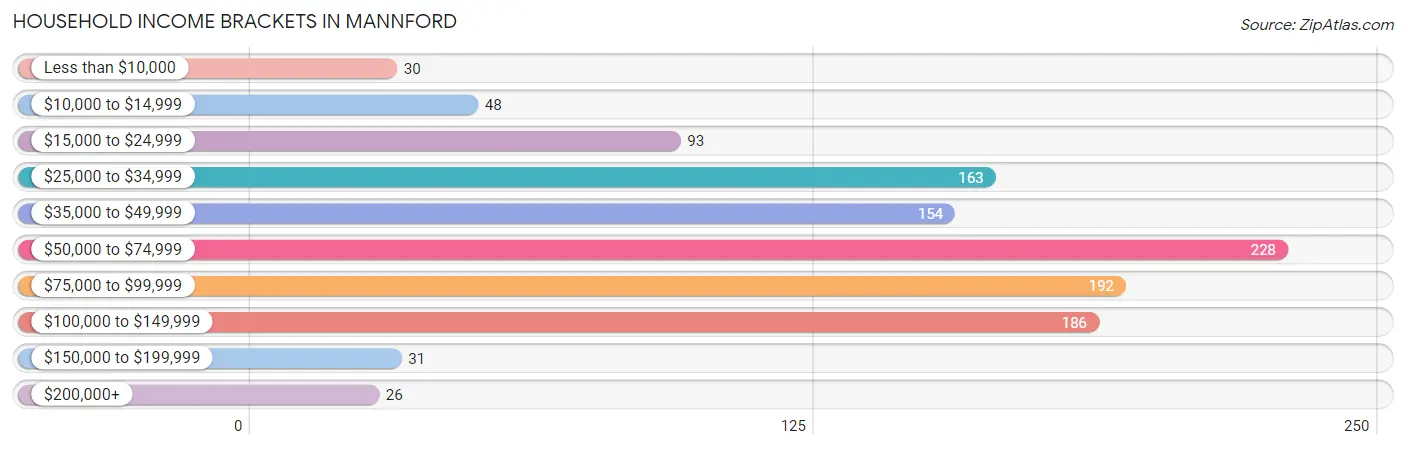
| Income Bracket | # Households | % Households |
| Less than $10,000 | 30 | 2.6% |
| $10,000 to $14,999 | 48 | 4.2% |
| $15,000 to $24,999 | 93 | 8.1% |
| $25,000 to $34,999 | 163 | 14.2% |
| $35,000 to $49,999 | 154 | 13.4% |
| $50,000 to $74,999 | 228 | 19.8% |
| $75,000 to $99,999 | 192 | 16.7% |
| $100,000 to $149,999 | 186 | 16.2% |
| $150,000 to $199,999 | 31 | 2.7% |
| $200,000+ | 26 | 2.3% |
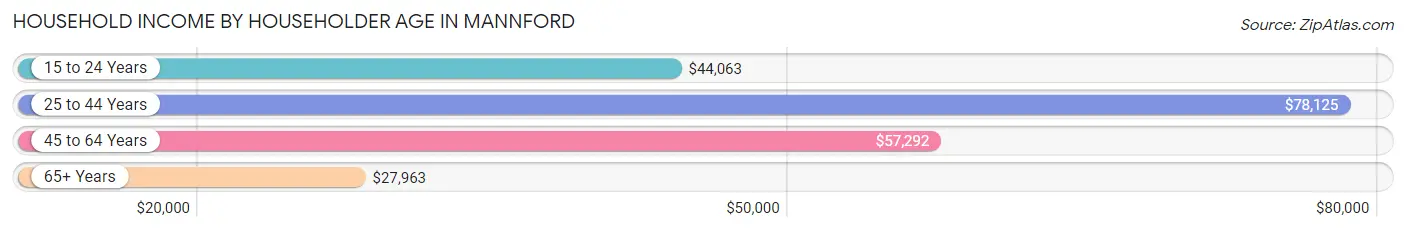
Household Income by Householder Age in Mannford
The median household income in Mannford is $60,125, with the highest median household income of $78,125 found in the 25 to 44 years age bracket for the primary householder. A total of 506 households (44.0%) fall into this category. Meanwhile, the 65+ years age bracket for the primary householder has the lowest median household income of $27,963, with 268 households (23.3%) in this group.
| Income Bracket | # Households | Median Income |
| 15 to 24 Years | 50 (4.3%) | $44,063 |
| 25 to 44 Years | 506 (44.0%) | $78,125 |
| 45 to 64 Years | 327 (28.4%) | $57,292 |
| 65+ Years | 268 (23.3%) | $27,963 |
| Total | 1,151 (100.0%) | $60,125 |
Poverty in Mannford
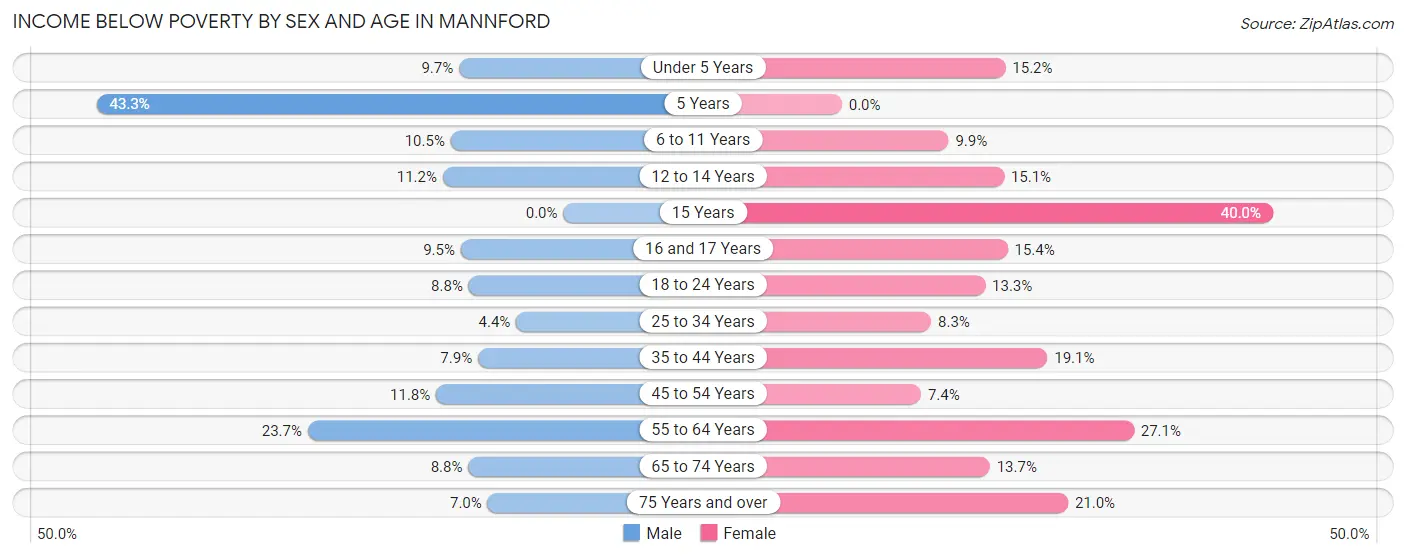
Income Below Poverty by Sex and Age in Mannford
With 10.4% poverty level for males and 15.3% for females among the residents of Mannford, 5 year old males and 15 year old females are the most vulnerable to poverty, with 13 males (43.3%) and 10 females (40.0%) in their respective age groups living below the poverty level.
| Age Bracket | Male | Female |
| Under 5 Years | 12 (9.7%) | 17 (15.2%) |
| 5 Years | 13 (43.3%) | 0 (0.0%) |
| 6 to 11 Years | 14 (10.4%) | 19 (9.9%) |
| 12 to 14 Years | 16 (11.2%) | 14 (15.0%) |
| 15 Years | 0 (0.0%) | 10 (40.0%) |
| 16 and 17 Years | 10 (9.5%) | 4 (15.4%) |
| 18 to 24 Years | 13 (8.8%) | 29 (13.3%) |
| 25 to 34 Years | 11 (4.4%) | 17 (8.3%) |
| 35 to 44 Years | 16 (7.9%) | 45 (19.1%) |
| 45 to 54 Years | 15 (11.8%) | 5 (7.3%) |
| 55 to 64 Years | 37 (23.7%) | 42 (27.1%) |
| 65 to 74 Years | 6 (8.8%) | 14 (13.7%) |
| 75 Years and over | 9 (7.0%) | 17 (21.0%) |
| Total | 172 (10.4%) | 233 (15.3%) |
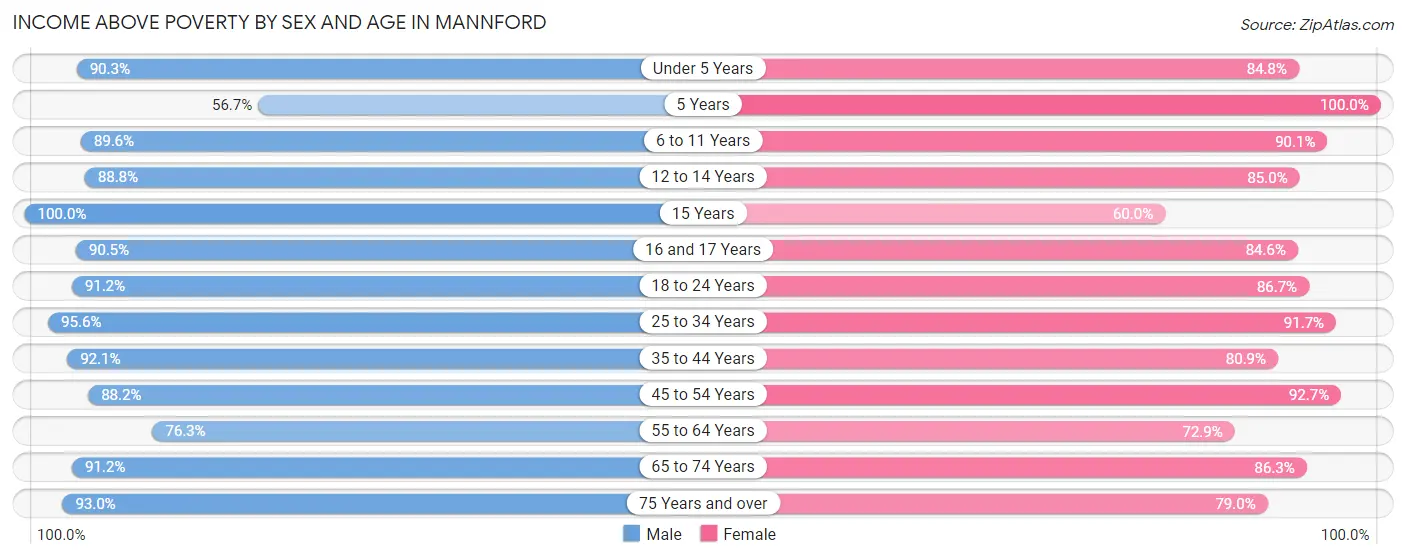
Income Above Poverty by Sex and Age in Mannford
According to the poverty statistics in Mannford, males aged 15 years and females aged 5 years are the age groups that are most secure financially, with 100.0% of males and 100.0% of females in these age groups living above the poverty line.
| Age Bracket | Male | Female |
| Under 5 Years | 112 (90.3%) | 95 (84.8%) |
| 5 Years | 17 (56.7%) | 14 (100.0%) |
| 6 to 11 Years | 120 (89.5%) | 173 (90.1%) |
| 12 to 14 Years | 127 (88.8%) | 79 (85.0%) |
| 15 Years | 38 (100.0%) | 15 (60.0%) |
| 16 and 17 Years | 95 (90.5%) | 22 (84.6%) |
| 18 to 24 Years | 135 (91.2%) | 189 (86.7%) |
| 25 to 34 Years | 240 (95.6%) | 188 (91.7%) |
| 35 to 44 Years | 186 (92.1%) | 191 (80.9%) |
| 45 to 54 Years | 112 (88.2%) | 63 (92.6%) |
| 55 to 64 Years | 119 (76.3%) | 113 (72.9%) |
| 65 to 74 Years | 62 (91.2%) | 88 (86.3%) |
| 75 Years and over | 119 (93.0%) | 64 (79.0%) |
| Total | 1,482 (89.6%) | 1,294 (84.7%) |
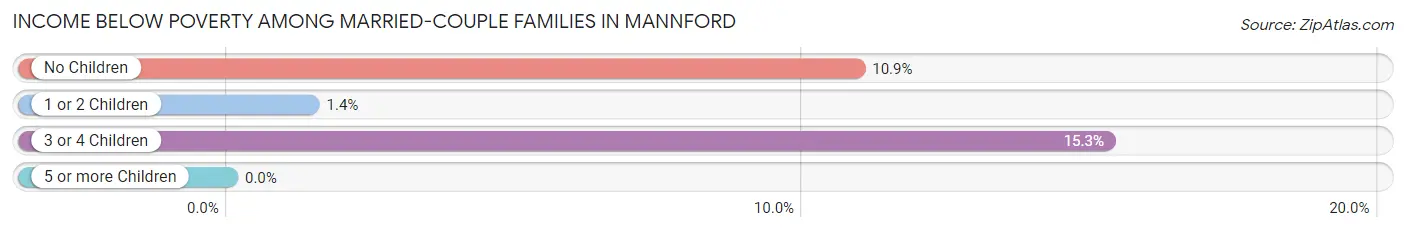
Income Below Poverty Among Married-Couple Families in Mannford
The poverty statistics for married-couple families in Mannford show that 7.4% or 39 of the total 527 families live below the poverty line. Families with 3 or 4 children have the highest poverty rate of 15.3%, comprising of 11 families. On the other hand, families with 5 or more children have the lowest poverty rate of 0.0%, which includes 0 families.
| Children | Above Poverty | Below Poverty |
| No Children | 204 (89.1%) | 25 (10.9%) |
| 1 or 2 Children | 208 (98.6%) | 3 (1.4%) |
| 3 or 4 Children | 61 (84.7%) | 11 (15.3%) |
| 5 or more Children | 15 (100.0%) | 0 (0.0%) |
| Total | 488 (92.6%) | 39 (7.4%) |
Income Below Poverty Among Single-Parent Households in Mannford
According to the poverty data in Mannford, 12.6% or 15 single-father households and 28.9% or 43 single-mother households are living below the poverty line. Among single-father households, those with 3 or 4 children have the highest poverty rate, with 8 households (57.1%) experiencing poverty. Likewise, among single-mother households, those with 1 or 2 children have the highest poverty rate, with 27 households (38.0%) falling below the poverty line.
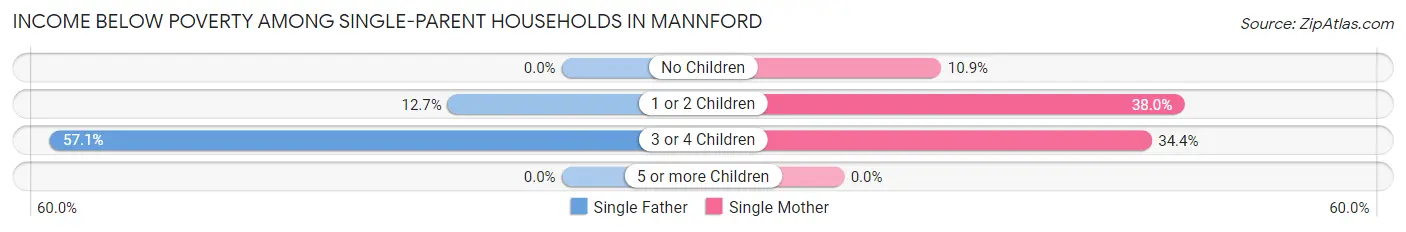
| Children | Single Father | Single Mother |
| No Children | 0 (0.0%) | 5 (10.9%) |
| 1 or 2 Children | 7 (12.7%) | 27 (38.0%) |
| 3 or 4 Children | 8 (57.1%) | 11 (34.4%) |
| 5 or more Children | 0 (0.0%) | 0 (0.0%) |
| Total | 15 (12.6%) | 43 (28.9%) |
Income Below Poverty Among Married-Couple vs Single-Parent Households in Mannford
The poverty data for Mannford shows that 39 of the married-couple family households (7.4%) and 58 of the single-parent households (21.6%) are living below the poverty level. Within the married-couple family households, those with 3 or 4 children have the highest poverty rate, with 11 households (15.3%) falling below the poverty line. Among the single-parent households, those with 3 or 4 children have the highest poverty rate, with 19 household (41.3%) living below poverty.
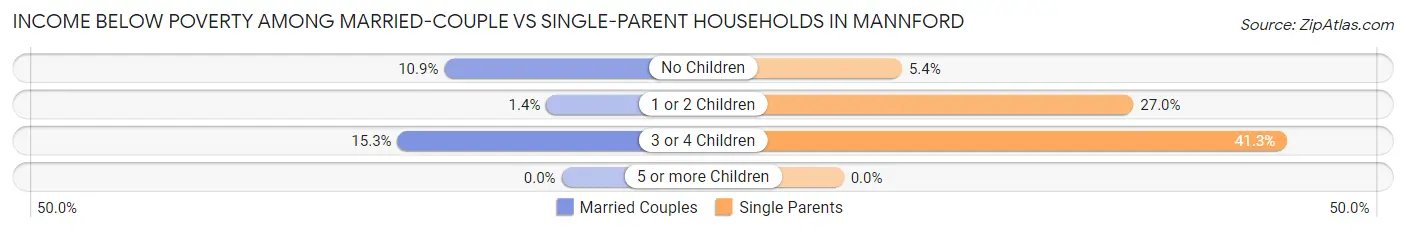
| Children | Married-Couple Families | Single-Parent Households |
| No Children | 25 (10.9%) | 5 (5.4%) |
| 1 or 2 Children | 3 (1.4%) | 34 (27.0%) |
| 3 or 4 Children | 11 (15.3%) | 19 (41.3%) |
| 5 or more Children | 0 (0.0%) | 0 (0.0%) |
| Total | 39 (7.4%) | 58 (21.6%) |
Race in Mannford
The most populous races in Mannford are White / Caucasian (2,565 | 78.3%), Native / Alaskan (414 | 12.6%), and Hispanic or Latino (341 | 10.4%).
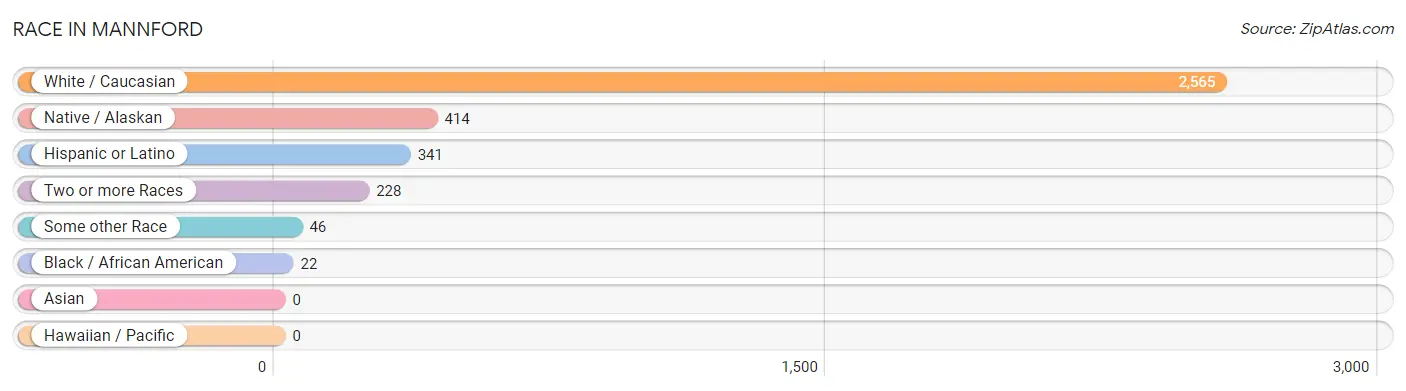
| Race | # Population | % Population |
| Asian | 0 | 0.0% |
| Black / African American | 22 | 0.7% |
| Hawaiian / Pacific | 0 | 0.0% |
| Hispanic or Latino | 341 | 10.4% |
| Native / Alaskan | 414 | 12.6% |
| White / Caucasian | 2,565 | 78.3% |
| Two or more Races | 228 | 7.0% |
| Some other Race | 46 | 1.4% |
| Total | 3,275 | 100.0% |
Ancestry in Mannford
The most populous ancestries reported in Mannford are Irish (549 | 16.8%), German (514 | 15.7%), Cherokee (369 | 11.3%), English (350 | 10.7%), and Mexican (315 | 9.6%), together accounting for 64.0% of all Mannford residents.
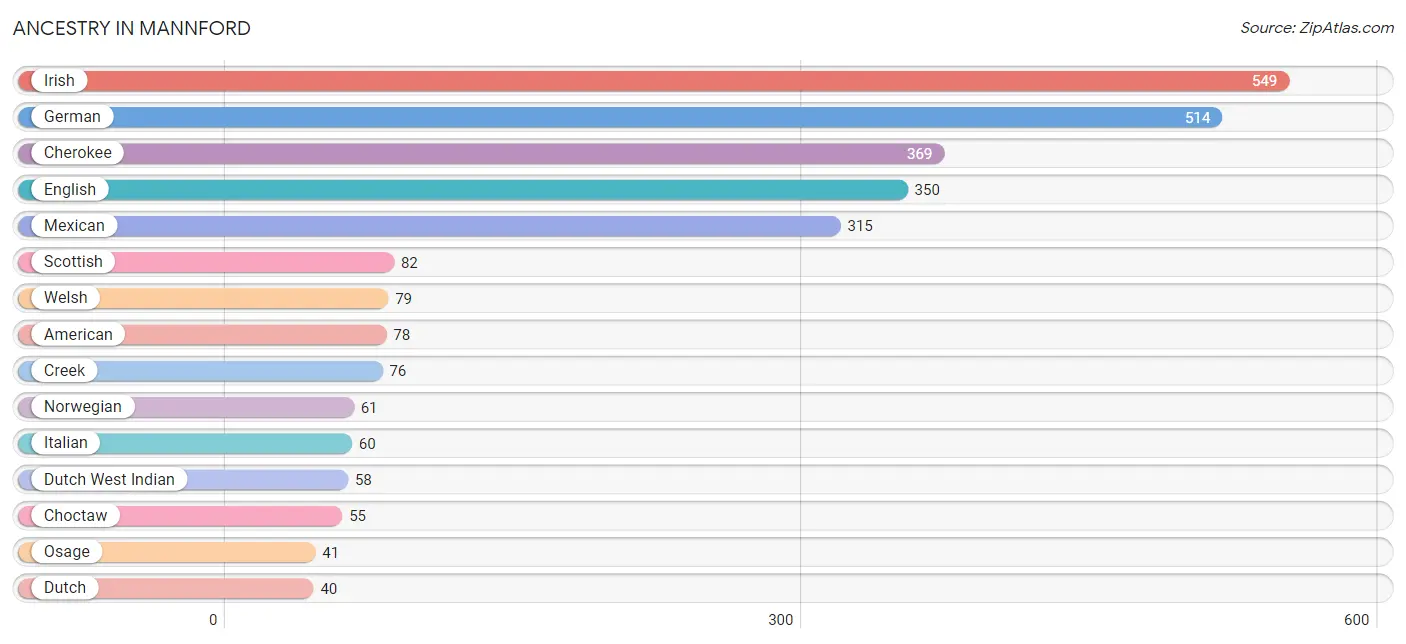
| Ancestry | # Population | % Population |
| African | 6 | 0.2% |
| American | 78 | 2.4% |
| Austrian | 16 | 0.5% |
| Canadian | 5 | 0.2% |
| Central American | 10 | 0.3% |
| Cherokee | 369 | 11.3% |
| Chickasaw | 8 | 0.2% |
| Choctaw | 55 | 1.7% |
| Creek | 76 | 2.3% |
| Czech | 19 | 0.6% |
| Dutch | 40 | 1.2% |
| Dutch West Indian | 58 | 1.8% |
| Eastern European | 16 | 0.5% |
| English | 350 | 10.7% |
| European | 27 | 0.8% |
| French | 37 | 1.1% |
| German | 514 | 15.7% |
| Irish | 549 | 16.8% |
| Italian | 60 | 1.8% |
| Mexican | 315 | 9.6% |
| Norwegian | 61 | 1.9% |
| Osage | 41 | 1.3% |
| Panamanian | 10 | 0.3% |
| Polish | 4 | 0.1% |
| Puerto Rican | 16 | 0.5% |
| Scotch-Irish | 14 | 0.4% |
| Scottish | 82 | 2.5% |
| Subsaharan African | 6 | 0.2% |
| Swedish | 5 | 0.2% |
| Swiss | 6 | 0.2% |
| Welsh | 79 | 2.4% | View All 31 Rows |
Immigrants in Mannford
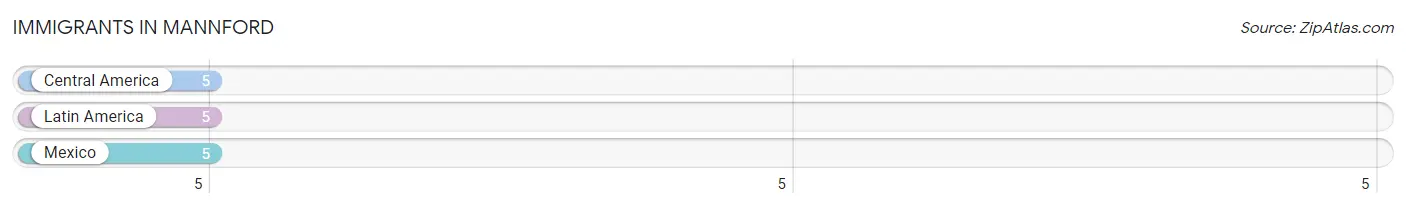
The most numerous immigrant groups reported in Mannford came from Central America (5 | 0.2%), Latin America (5 | 0.2%), and Mexico (5 | 0.2%), together accounting for 0.5% of all Mannford residents.
| Immigration Origin | # Population | % Population |
| Central America | 5 | 0.2% |
| Latin America | 5 | 0.2% |
| Mexico | 5 | 0.2% | View All 3 Rows |
Sex and Age in Mannford
Sex and Age in Mannford
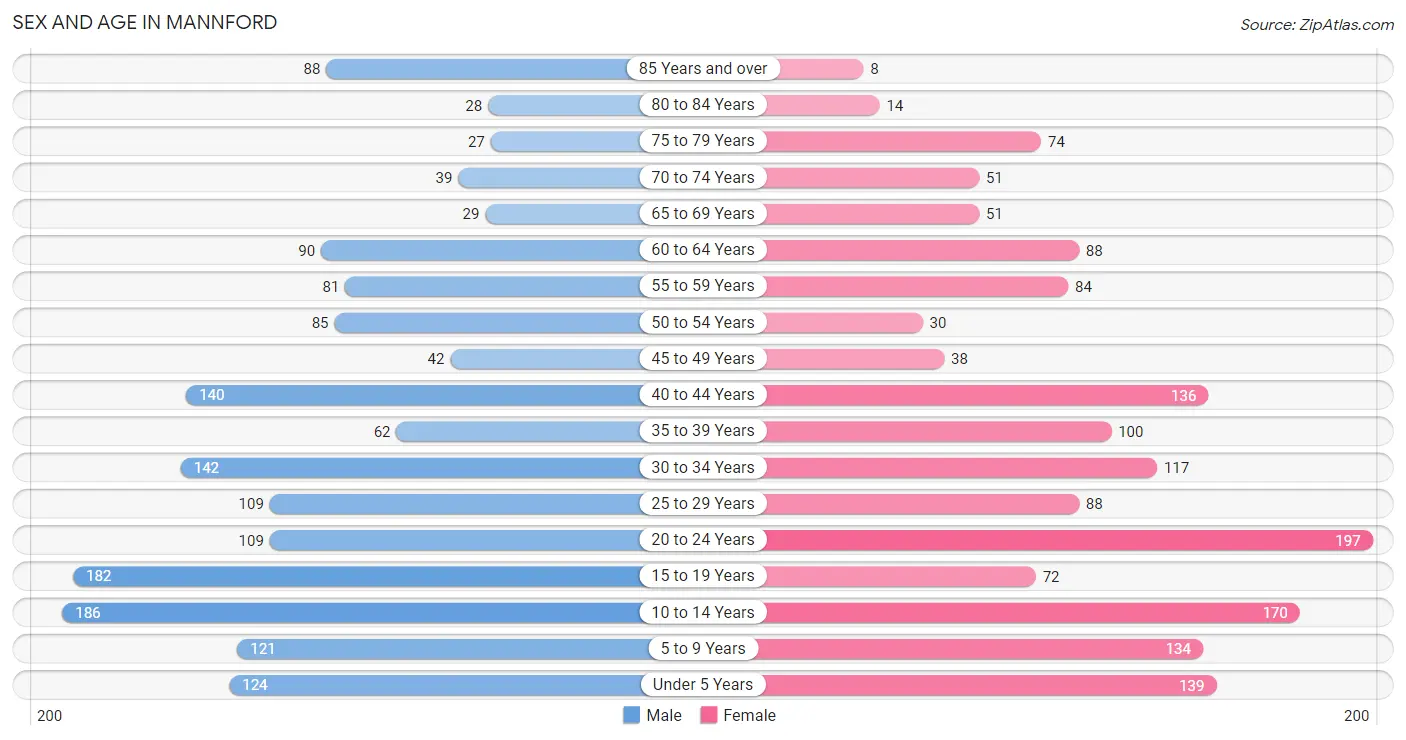
The most populous age groups in Mannford are 10 to 14 Years (186 | 11.1%) for men and 20 to 24 Years (197 | 12.4%) for women.
| Age Bracket | Male | Female |
| Under 5 Years | 124 (7.4%) | 139 (8.7%) |
| 5 to 9 Years | 121 (7.2%) | 134 (8.4%) |
| 10 to 14 Years | 186 (11.1%) | 170 (10.7%) |
| 15 to 19 Years | 182 (10.8%) | 72 (4.5%) |
| 20 to 24 Years | 109 (6.5%) | 197 (12.4%) |
| 25 to 29 Years | 109 (6.5%) | 88 (5.5%) |
| 30 to 34 Years | 142 (8.4%) | 117 (7.3%) |
| 35 to 39 Years | 62 (3.7%) | 100 (6.3%) |
| 40 to 44 Years | 140 (8.3%) | 136 (8.6%) |
| 45 to 49 Years | 42 (2.5%) | 38 (2.4%) |
| 50 to 54 Years | 85 (5.1%) | 30 (1.9%) |
| 55 to 59 Years | 81 (4.8%) | 84 (5.3%) |
| 60 to 64 Years | 90 (5.3%) | 88 (5.5%) |
| 65 to 69 Years | 29 (1.7%) | 51 (3.2%) |
| 70 to 74 Years | 39 (2.3%) | 51 (3.2%) |
| 75 to 79 Years | 27 (1.6%) | 74 (4.6%) |
| 80 to 84 Years | 28 (1.7%) | 14 (0.9%) |
| 85 Years and over | 88 (5.2%) | 8 (0.5%) |
| Total | 1,684 (100.0%) | 1,591 (100.0%) |
Families and Households in Mannford
Median Family Size in Mannford
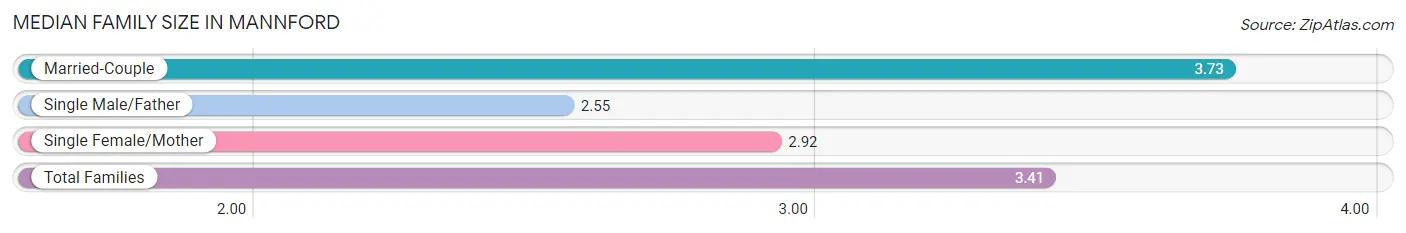
The median family size in Mannford is 3.41 persons per family, with married-couple families (527 | 66.3%) accounting for the largest median family size of 3.73 persons per family. On the other hand, single male/father families (119 | 15.0%) represent the smallest median family size with 2.55 persons per family.
| Family Type | # Families | Family Size |
| Married-Couple | 527 (66.3%) | 3.73 |
| Single Male/Father | 119 (15.0%) | 2.55 |
| Single Female/Mother | 149 (18.7%) | 2.92 |
| Total Families | 795 (100.0%) | 3.41 |
Median Household Size in Mannford
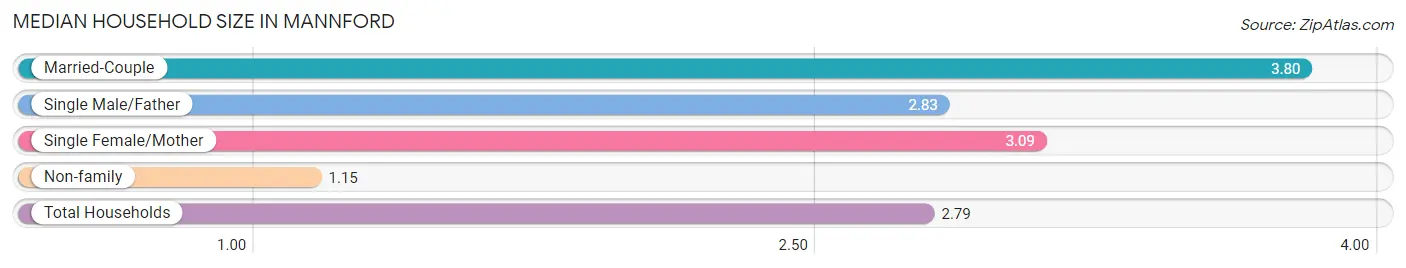
The median household size in Mannford is 2.79 persons per household, with married-couple households (527 | 45.8%) accounting for the largest median household size of 3.8 persons per household. non-family households (356 | 30.9%) represent the smallest median household size with 1.15 persons per household.
| Household Type | # Households | Household Size |
| Married-Couple | 527 (45.8%) | 3.80 |
| Single Male/Father | 119 (10.3%) | 2.83 |
| Single Female/Mother | 149 (13.0%) | 3.09 |
| Non-family | 356 (30.9%) | 1.15 |
| Total Households | 1,151 (100.0%) | 2.79 |
Household Size by Marriage Status in Mannford
Out of a total of 1,151 households in Mannford, 795 (69.1%) are family households, while 356 (30.9%) are nonfamily households. The most numerous type of family households are 2-person households, comprising 335, and the most common type of nonfamily households are 1-person households, comprising 306.
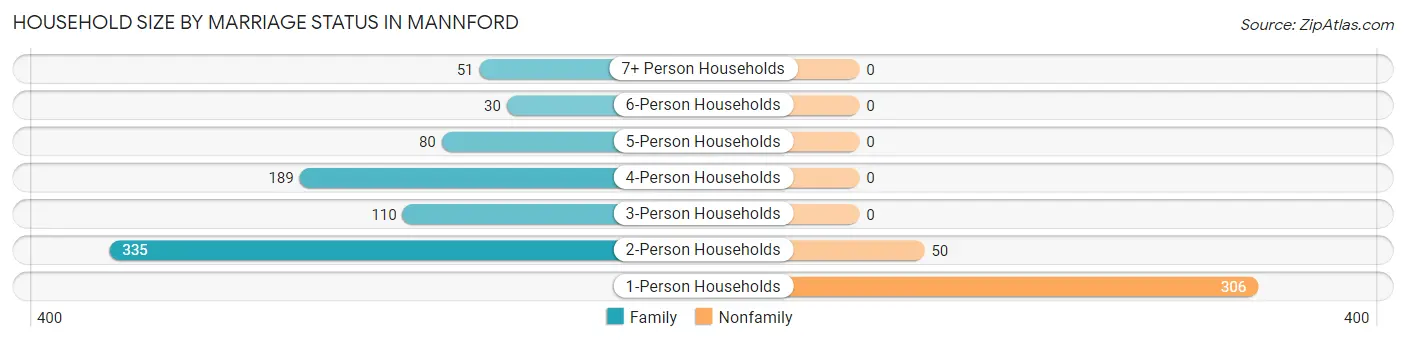
| Household Size | Family Households | Nonfamily Households |
| 1-Person Households | - | 306 (26.6%) |
| 2-Person Households | 335 (29.1%) | 50 (4.3%) |
| 3-Person Households | 110 (9.6%) | 0 (0.0%) |
| 4-Person Households | 189 (16.4%) | 0 (0.0%) |
| 5-Person Households | 80 (7.0%) | 0 (0.0%) |
| 6-Person Households | 30 (2.6%) | 0 (0.0%) |
| 7+ Person Households | 51 (4.4%) | 0 (0.0%) |
| Total | 795 (69.1%) | 356 (30.9%) |
Female Fertility in Mannford
Fertility by Age in Mannford
Average fertility rate in Mannford is 66.0 births per 1,000 women. Women in the age bracket of 20 to 34 years have the highest fertility rate with 109.0 births per 1,000 women. Women in the age bracket of 20 to 34 years acount for 89.8% of all women with births.
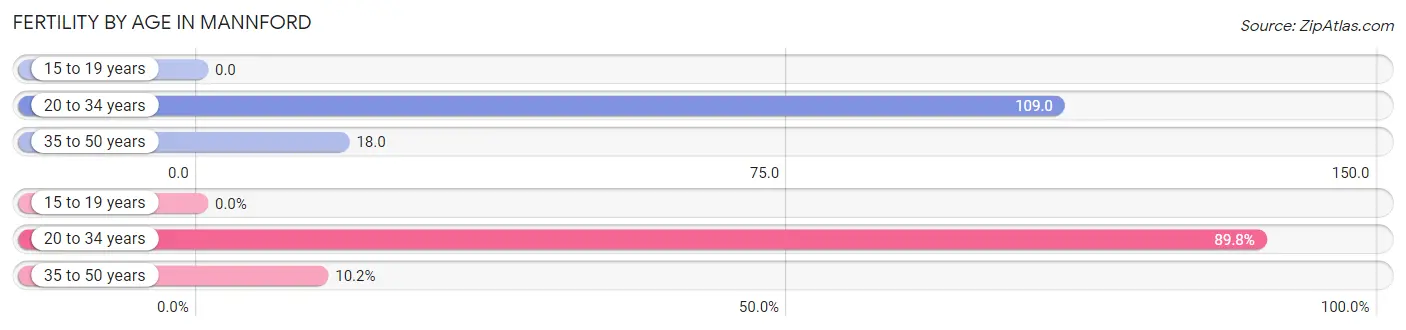
| Age Bracket | Women with Births | Births / 1,000 Women |
| 15 to 19 years | 0 (0.0%) | 0.0 |
| 20 to 34 years | 44 (89.8%) | 109.0 |
| 35 to 50 years | 5 (10.2%) | 18.0 |
| Total | 49 (100.0%) | 66.0 |
Fertility by Age by Marriage Status in Mannford
46.9% of women with births (49) in Mannford are married. The highest percentage of unmarried women with births falls into 35 to 50 years age bracket with 100.0% of them unmarried at the time of birth, while the lowest percentage of unmarried women with births belong to 20 to 34 years age bracket with 47.7% of them unmarried.
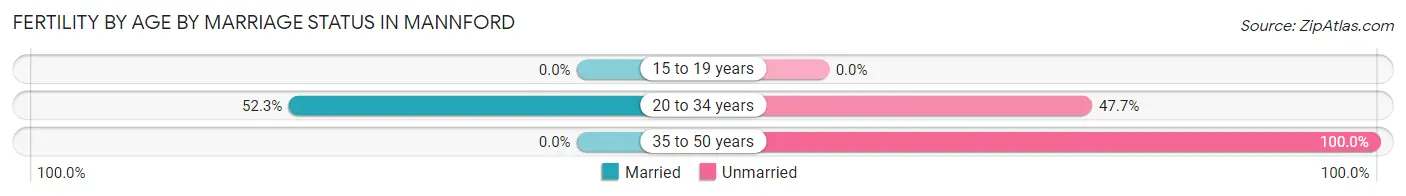
| Age Bracket | Married | Unmarried |
| 15 to 19 years | 0 (0.0%) | 0 (0.0%) |
| 20 to 34 years | 23 (52.3%) | 21 (47.7%) |
| 35 to 50 years | 0 (0.0%) | 5 (100.0%) |
| Total | 23 (46.9%) | 26 (53.1%) |
Fertility by Education in Mannford
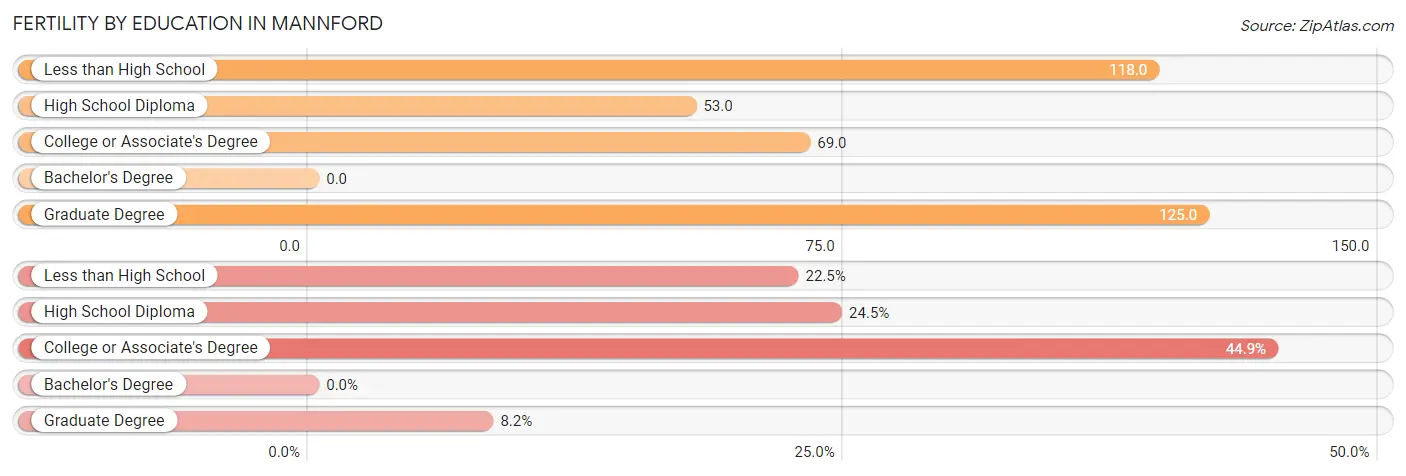
| Educational Attainment | Women with Births | Births / 1,000 Women |
| Less than High School | 11 (22.5%) | 118.0 |
| High School Diploma | 12 (24.5%) | 53.0 |
| College or Associate's Degree | 22 (44.9%) | 69.0 |
| Bachelor's Degree | 0 (0.0%) | 0.0 |
| Graduate Degree | 4 (8.2%) | 125.0 |
| Total | 49 (100.0%) | 66.0 |
Fertility by Education by Marriage Status in Mannford
53.1% of women with births in Mannford are unmarried. Women with the educational attainment of less than high school are most likely to be married with 100.0% of them married at childbirth, while women with the educational attainment of college or associate's degree are least likely to be married with 100.0% of them unmarried at childbirth.
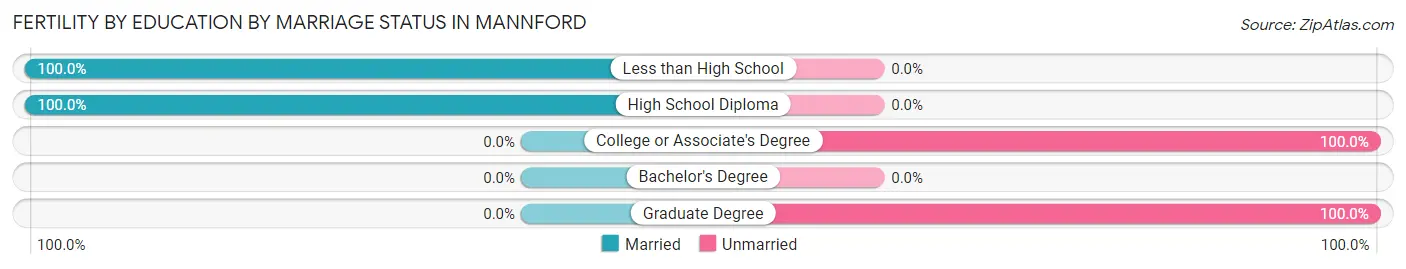
| Educational Attainment | Married | Unmarried |
| Less than High School | 11 (100.0%) | 0 (0.0%) |
| High School Diploma | 12 (100.0%) | 0 (0.0%) |
| College or Associate's Degree | 0 (0.0%) | 22 (100.0%) |
| Bachelor's Degree | 0 (0.0%) | 0 (0.0%) |
| Graduate Degree | 0 (0.0%) | 4 (100.0%) |
| Total | 23 (46.9%) | 26 (53.1%) |
Employment Characteristics in Mannford
Employment by Class of Employer in Mannford
Among the 1,383 employed individuals in Mannford, private company employees (989 | 71.5%), self-employed (not incorporated) (109 | 7.9%), and local government employees (108 | 7.8%) make up the most common classes of employment.
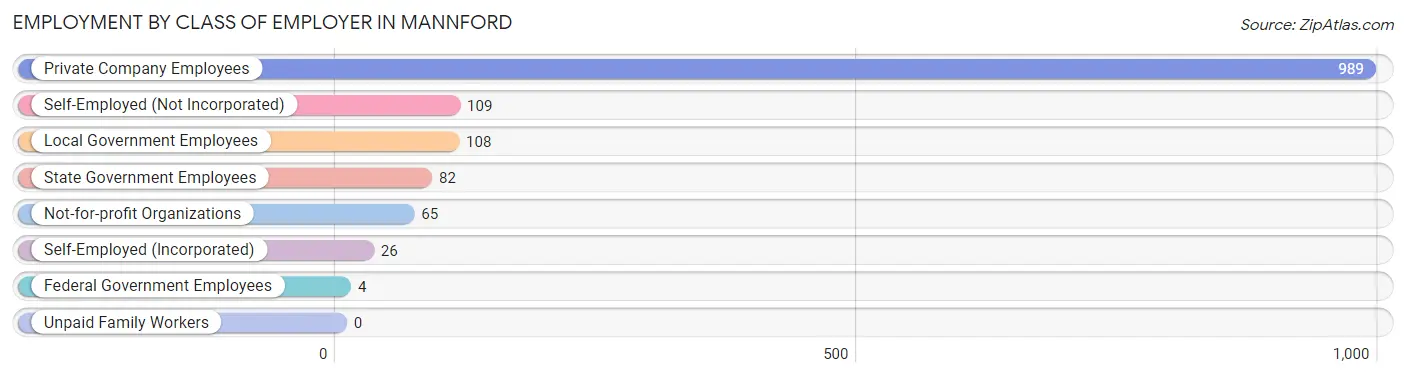
| Employer Class | # Employees | % Employees |
| Private Company Employees | 989 | 71.5% |
| Self-Employed (Incorporated) | 26 | 1.9% |
| Self-Employed (Not Incorporated) | 109 | 7.9% |
| Not-for-profit Organizations | 65 | 4.7% |
| Local Government Employees | 108 | 7.8% |
| State Government Employees | 82 | 5.9% |
| Federal Government Employees | 4 | 0.3% |
| Unpaid Family Workers | 0 | 0.0% |
| Total | 1,383 | 100.0% |
Employment Status by Age in Mannford
According to the labor force statistics for Mannford, out of the total population over 16 years of age (2,338), 60.6% or 1,417 individuals are in the labor force, with 1.9% or 27 of them unemployed. The age group with the highest labor force participation rate is 30 to 34 years, with 93.4% or 242 individuals in the labor force. Within the labor force, the 45 to 54 years age range has the highest percentage of unemployed individuals, with 8.4% or 14 of them being unemployed.
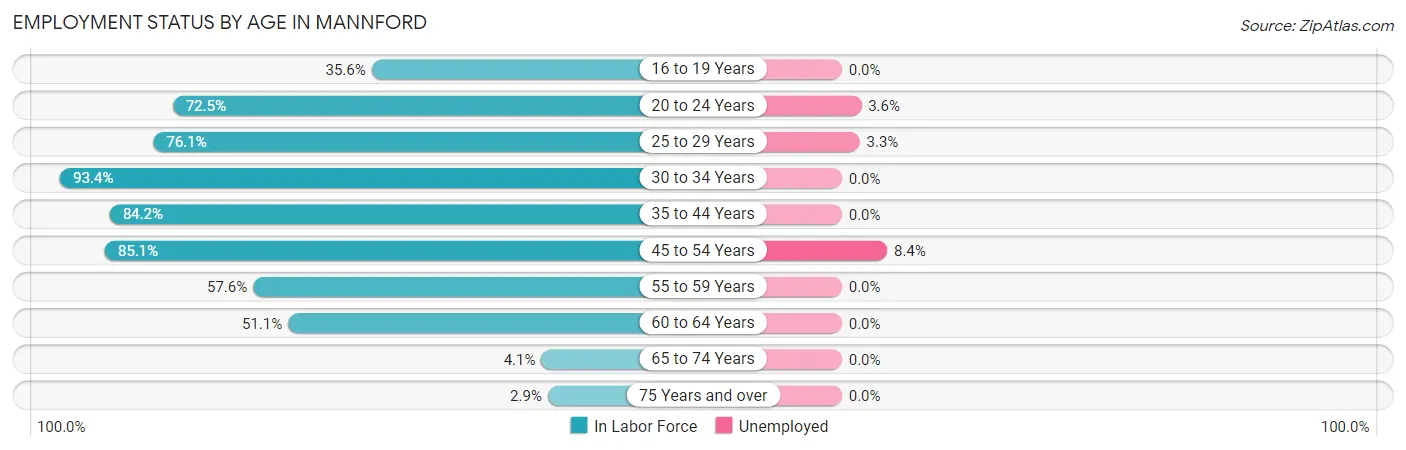
| Age Bracket | In Labor Force | Unemployed |
| 16 to 19 Years | 68 (35.6%) | 0 (0.0%) |
| 20 to 24 Years | 222 (72.5%) | 8 (3.6%) |
| 25 to 29 Years | 150 (76.1%) | 5 (3.3%) |
| 30 to 34 Years | 242 (93.4%) | 0 (0.0%) |
| 35 to 44 Years | 369 (84.2%) | 0 (0.0%) |
| 45 to 54 Years | 166 (85.1%) | 14 (8.4%) |
| 55 to 59 Years | 95 (57.6%) | 0 (0.0%) |
| 60 to 64 Years | 91 (51.1%) | 0 (0.0%) |
| 65 to 74 Years | 7 (4.1%) | 0 (0.0%) |
| 75 Years and over | 7 (2.9%) | 0 (0.0%) |
| Total | 1,417 (60.6%) | 27 (1.9%) |
Employment Status by Educational Attainment in Mannford
According to labor force statistics for Mannford, 77.7% of individuals (1,113) out of the total population between 25 and 64 years of age (1,432) are in the labor force, with 1.7% or 19 of them being unemployed. The group with the highest labor force participation rate are those with the educational attainment of college / associate degree, with 88.7% or 479 individuals in the labor force. Within the labor force, individuals with high school diploma education have the highest percentage of unemployment, with 4.1% or 14 of them being unemployed.
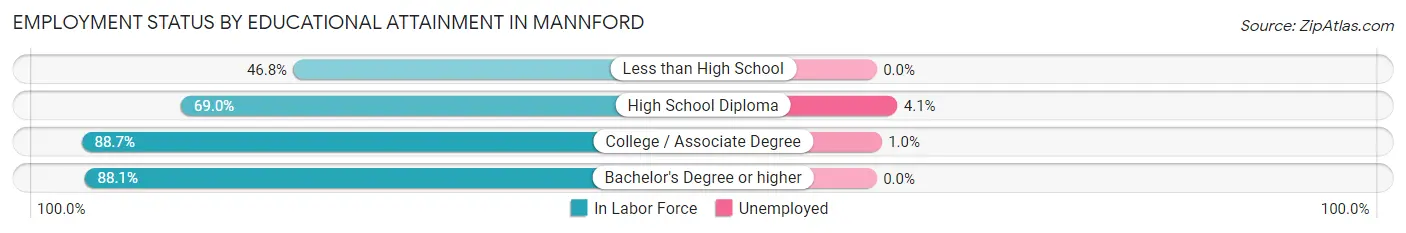
| Educational Attainment | In Labor Force | Unemployed |
| Less than High School | 65 (46.8%) | 0 (0.0%) |
| High School Diploma | 340 (69.0%) | 20 (4.1%) |
| College / Associate Degree | 479 (88.7%) | 5 (1.0%) |
| Bachelor's Degree or higher | 229 (88.1%) | 0 (0.0%) |
| Total | 1,113 (77.7%) | 24 (1.7%) |
Employment Occupations by Sex in Mannford
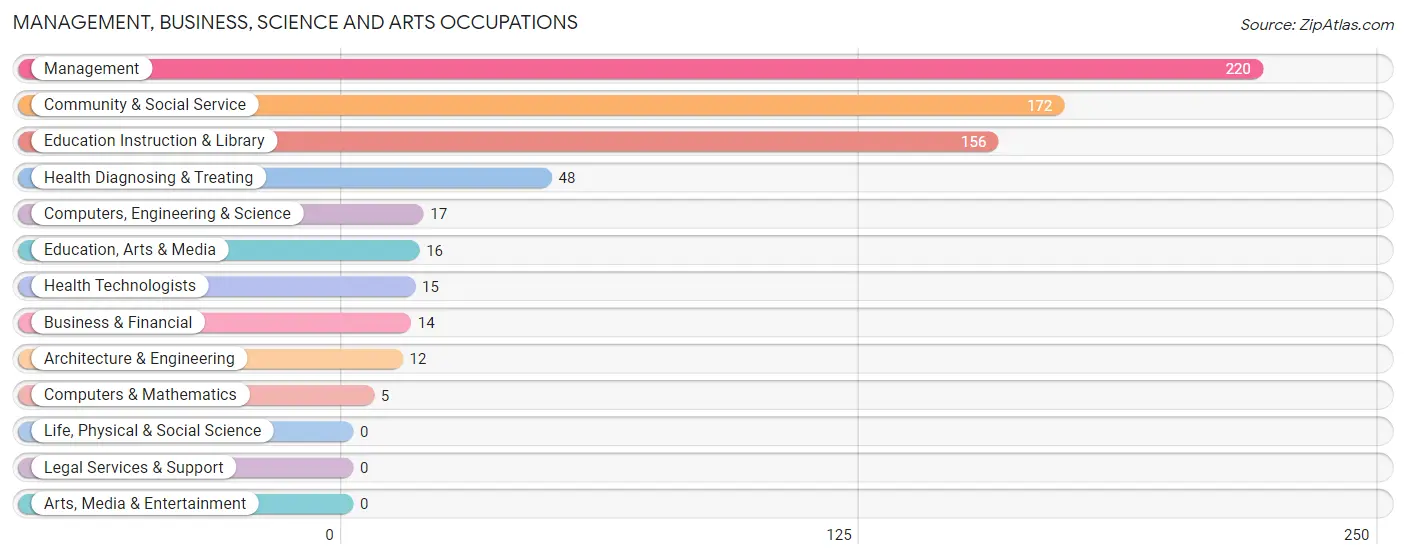
Management, Business, Science and Arts Occupations
The most common Management, Business, Science and Arts occupations in Mannford are Management (220 | 15.8%), Community & Social Service (172 | 12.4%), Education Instruction & Library (156 | 11.2%), Health Diagnosing & Treating (48 | 3.5%), and Computers, Engineering & Science (17 | 1.2%).
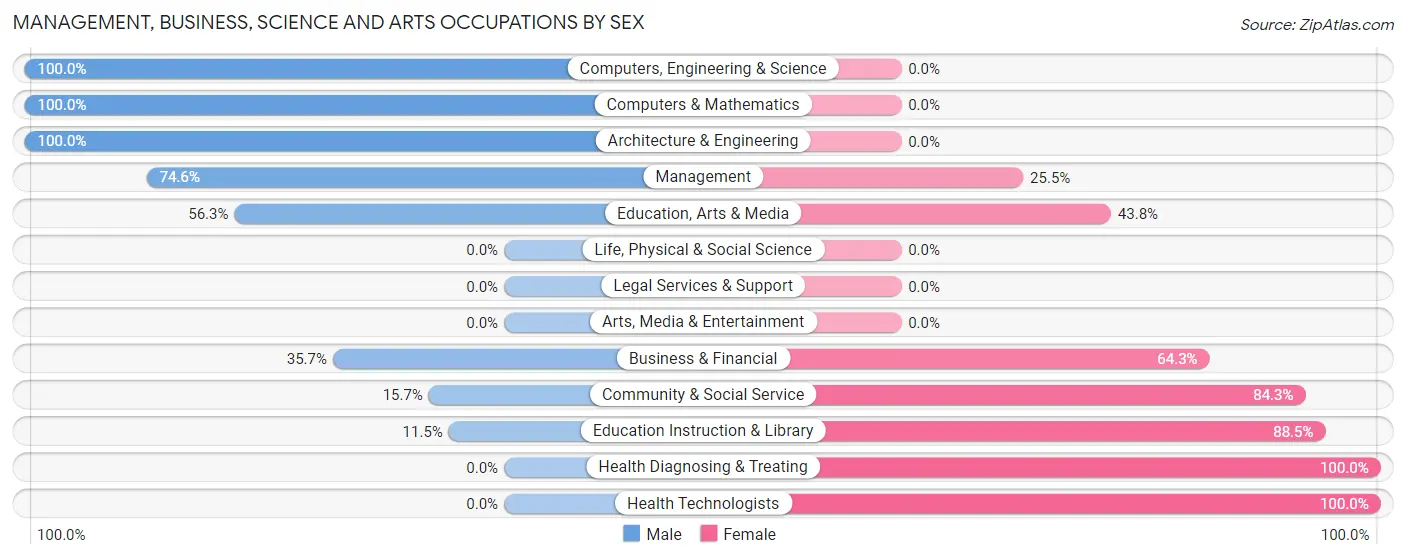
Management, Business, Science and Arts Occupations by Sex
Within the Management, Business, Science and Arts occupations in Mannford, the most male-oriented occupations are Computers, Engineering & Science (100.0%), Computers & Mathematics (100.0%), and Architecture & Engineering (100.0%), while the most female-oriented occupations are Health Diagnosing & Treating (100.0%), Health Technologists (100.0%), and Education Instruction & Library (88.5%).
| Occupation | Male | Female |
| Management | 164 (74.6%) | 56 (25.5%) |
| Business & Financial | 5 (35.7%) | 9 (64.3%) |
| Computers, Engineering & Science | 17 (100.0%) | 0 (0.0%) |
| Computers & Mathematics | 5 (100.0%) | 0 (0.0%) |
| Architecture & Engineering | 12 (100.0%) | 0 (0.0%) |
| Life, Physical & Social Science | 0 (0.0%) | 0 (0.0%) |
| Community & Social Service | 27 (15.7%) | 145 (84.3%) |
| Education, Arts & Media | 9 (56.2%) | 7 (43.8%) |
| Legal Services & Support | 0 (0.0%) | 0 (0.0%) |
| Education Instruction & Library | 18 (11.5%) | 138 (88.5%) |
| Arts, Media & Entertainment | 0 (0.0%) | 0 (0.0%) |
| Health Diagnosing & Treating | 0 (0.0%) | 48 (100.0%) |
| Health Technologists | 0 (0.0%) | 15 (100.0%) |
| Total (Category) | 213 (45.2%) | 258 (54.8%) |
| Total (Overall) | 776 (55.8%) | 614 (44.2%) |
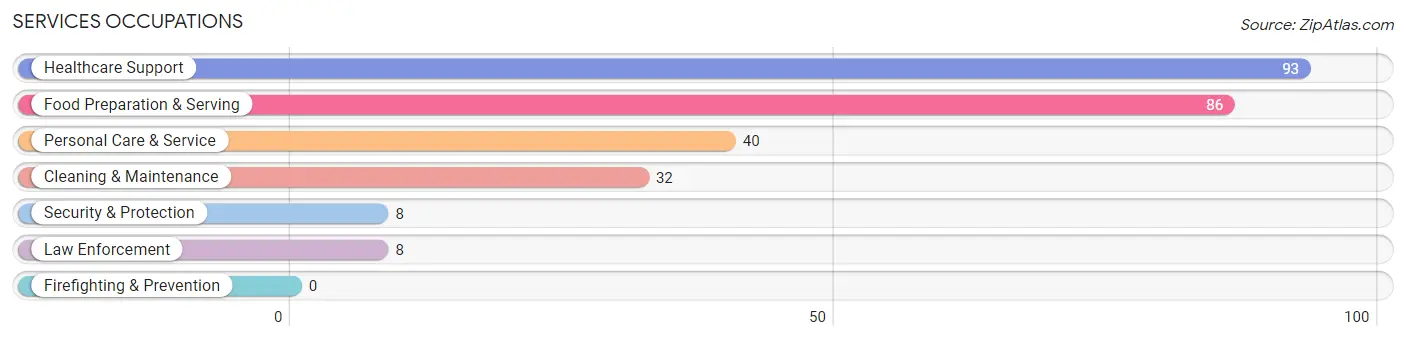
Services Occupations
The most common Services occupations in Mannford are Healthcare Support (93 | 6.7%), Food Preparation & Serving (86 | 6.2%), Personal Care & Service (40 | 2.9%), Cleaning & Maintenance (32 | 2.3%), and Security & Protection (8 | 0.6%).
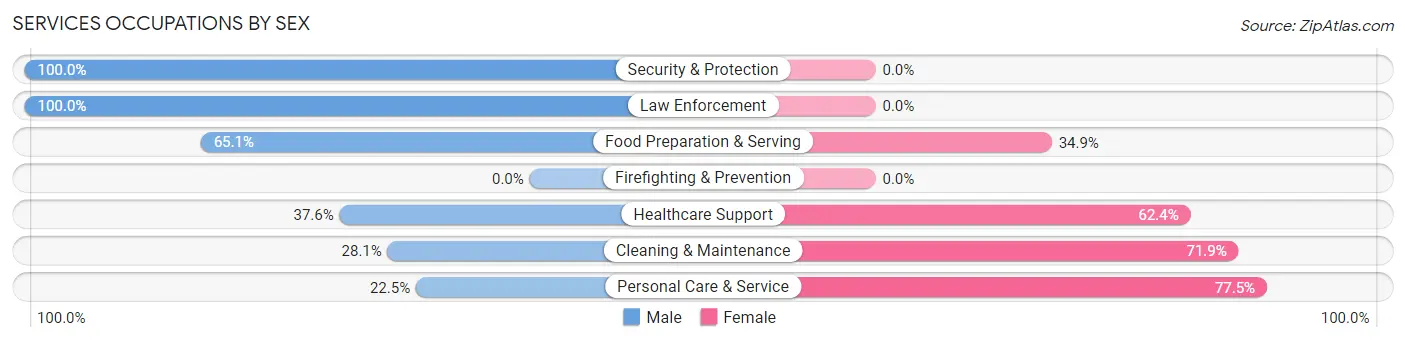
Services Occupations by Sex
Within the Services occupations in Mannford, the most male-oriented occupations are Security & Protection (100.0%), Law Enforcement (100.0%), and Food Preparation & Serving (65.1%), while the most female-oriented occupations are Personal Care & Service (77.5%), Cleaning & Maintenance (71.9%), and Healthcare Support (62.4%).
| Occupation | Male | Female |
| Healthcare Support | 35 (37.6%) | 58 (62.4%) |
| Security & Protection | 8 (100.0%) | 0 (0.0%) |
| Firefighting & Prevention | 0 (0.0%) | 0 (0.0%) |
| Law Enforcement | 8 (100.0%) | 0 (0.0%) |
| Food Preparation & Serving | 56 (65.1%) | 30 (34.9%) |
| Cleaning & Maintenance | 9 (28.1%) | 23 (71.9%) |
| Personal Care & Service | 9 (22.5%) | 31 (77.5%) |
| Total (Category) | 117 (45.2%) | 142 (54.8%) |
| Total (Overall) | 776 (55.8%) | 614 (44.2%) |
Sales and Office Occupations
The most common Sales and Office occupations in Mannford are Office & Administration (178 | 12.8%), and Sales & Related (138 | 9.9%).
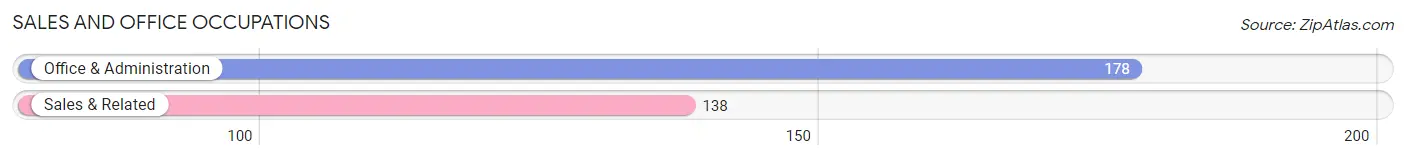
Sales and Office Occupations by Sex
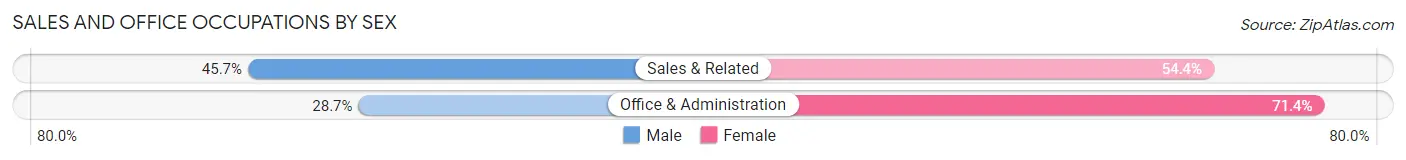
| Occupation | Male | Female |
| Sales & Related | 63 (45.7%) | 75 (54.3%) |
| Office & Administration | 51 (28.6%) | 127 (71.4%) |
| Total (Category) | 114 (36.1%) | 202 (63.9%) |
| Total (Overall) | 776 (55.8%) | 614 (44.2%) |
Natural Resources, Construction and Maintenance Occupations
The most common Natural Resources, Construction and Maintenance occupations in Mannford are Construction & Extraction (115 | 8.3%), and Installation, Maintenance & Repair (68 | 4.9%).
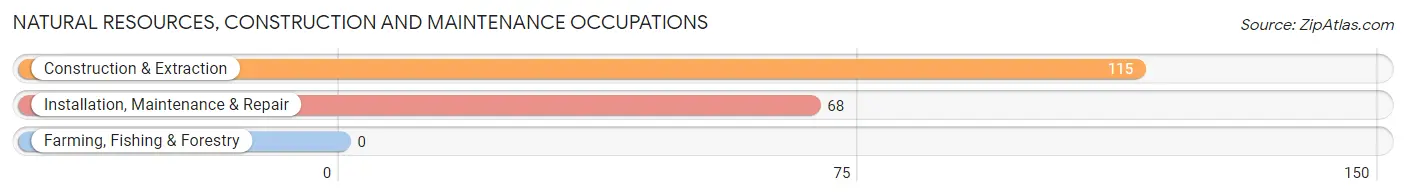
Natural Resources, Construction and Maintenance Occupations by Sex
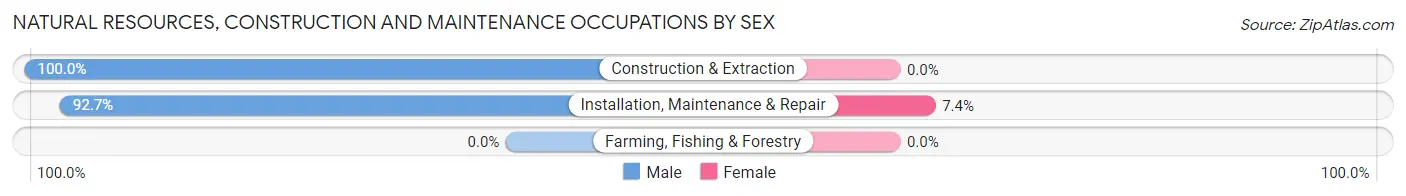
| Occupation | Male | Female |
| Farming, Fishing & Forestry | 0 (0.0%) | 0 (0.0%) |
| Construction & Extraction | 115 (100.0%) | 0 (0.0%) |
| Installation, Maintenance & Repair | 63 (92.6%) | 5 (7.3%) |
| Total (Category) | 178 (97.3%) | 5 (2.7%) |
| Total (Overall) | 776 (55.8%) | 614 (44.2%) |
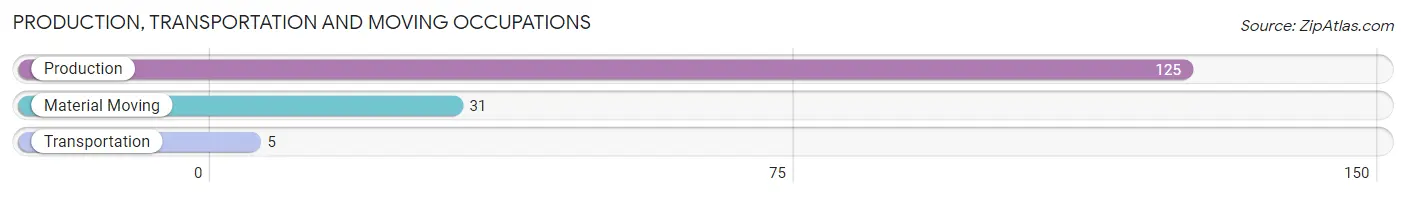
Production, Transportation and Moving Occupations
The most common Production, Transportation and Moving occupations in Mannford are Production (125 | 9.0%), Material Moving (31 | 2.2%), and Transportation (5 | 0.4%).
Production, Transportation and Moving Occupations by Sex
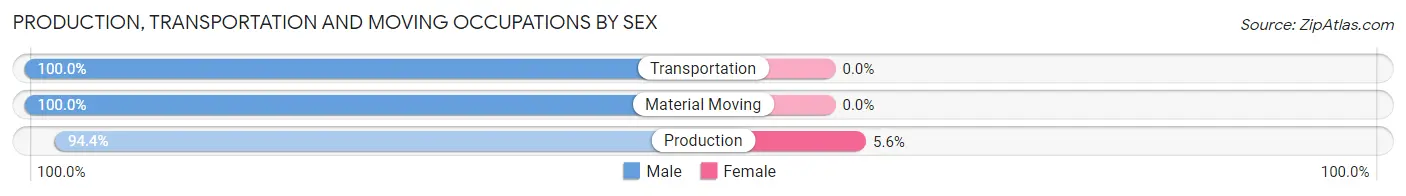
| Occupation | Male | Female |
| Production | 118 (94.4%) | 7 (5.6%) |
| Transportation | 5 (100.0%) | 0 (0.0%) |
| Material Moving | 31 (100.0%) | 0 (0.0%) |
| Total (Category) | 154 (95.7%) | 7 (4.3%) |
| Total (Overall) | 776 (55.8%) | 614 (44.2%) |
Employment Industries by Sex in Mannford
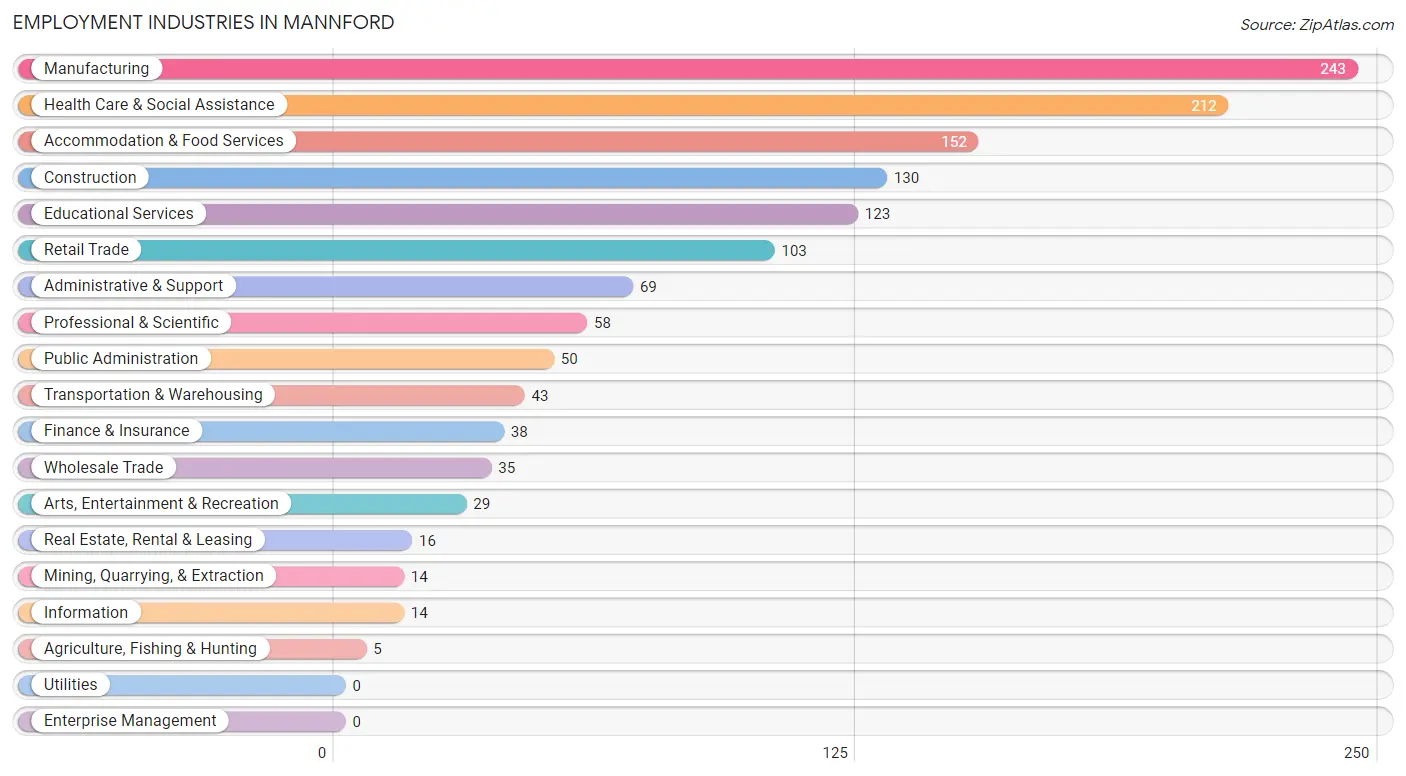
Employment Industries in Mannford
The major employment industries in Mannford include Manufacturing (243 | 17.5%), Health Care & Social Assistance (212 | 15.2%), Accommodation & Food Services (152 | 10.9%), Construction (130 | 9.3%), and Educational Services (123 | 8.8%).
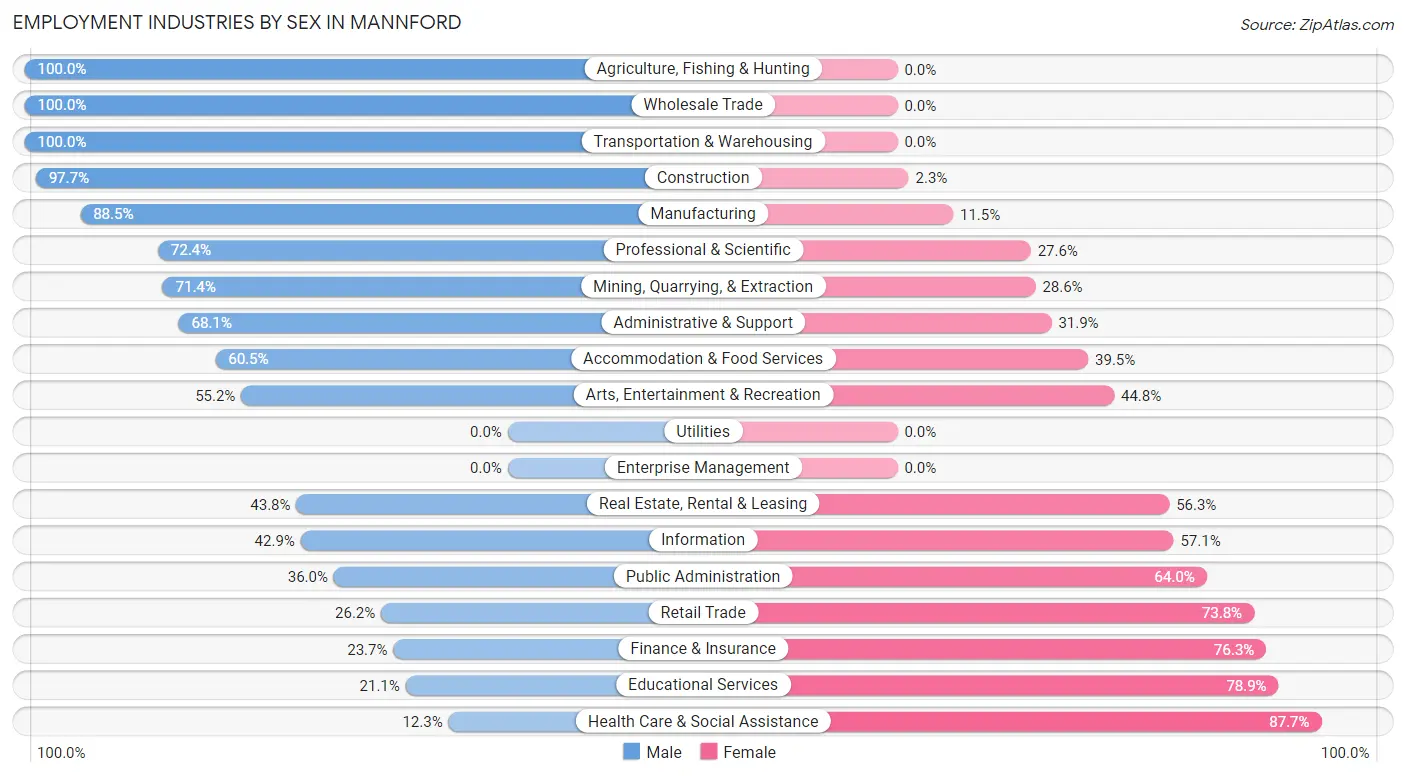
Employment Industries by Sex in Mannford
The Mannford industries that see more men than women are Agriculture, Fishing & Hunting (100.0%), Wholesale Trade (100.0%), and Transportation & Warehousing (100.0%), whereas the industries that tend to have a higher number of women are Health Care & Social Assistance (87.7%), Educational Services (78.9%), and Finance & Insurance (76.3%).
| Industry | Male | Female |
| Agriculture, Fishing & Hunting | 5 (100.0%) | 0 (0.0%) |
| Mining, Quarrying, & Extraction | 10 (71.4%) | 4 (28.6%) |
| Construction | 127 (97.7%) | 3 (2.3%) |
| Manufacturing | 215 (88.5%) | 28 (11.5%) |
| Wholesale Trade | 35 (100.0%) | 0 (0.0%) |
| Retail Trade | 27 (26.2%) | 76 (73.8%) |
| Transportation & Warehousing | 43 (100.0%) | 0 (0.0%) |
| Utilities | 0 (0.0%) | 0 (0.0%) |
| Information | 6 (42.9%) | 8 (57.1%) |
| Finance & Insurance | 9 (23.7%) | 29 (76.3%) |
| Real Estate, Rental & Leasing | 7 (43.8%) | 9 (56.2%) |
| Professional & Scientific | 42 (72.4%) | 16 (27.6%) |
| Enterprise Management | 0 (0.0%) | 0 (0.0%) |
| Administrative & Support | 47 (68.1%) | 22 (31.9%) |
| Educational Services | 26 (21.1%) | 97 (78.9%) |
| Health Care & Social Assistance | 26 (12.3%) | 186 (87.7%) |
| Arts, Entertainment & Recreation | 16 (55.2%) | 13 (44.8%) |
| Accommodation & Food Services | 92 (60.5%) | 60 (39.5%) |
| Public Administration | 18 (36.0%) | 32 (64.0%) |
| Total | 776 (55.8%) | 614 (44.2%) |
Education in Mannford
School Enrollment in Mannford
The most common levels of schooling among the 893 students in Mannford are middle school (335 | 37.5%), high school (216 | 24.2%), and elementary school (192 | 21.5%).
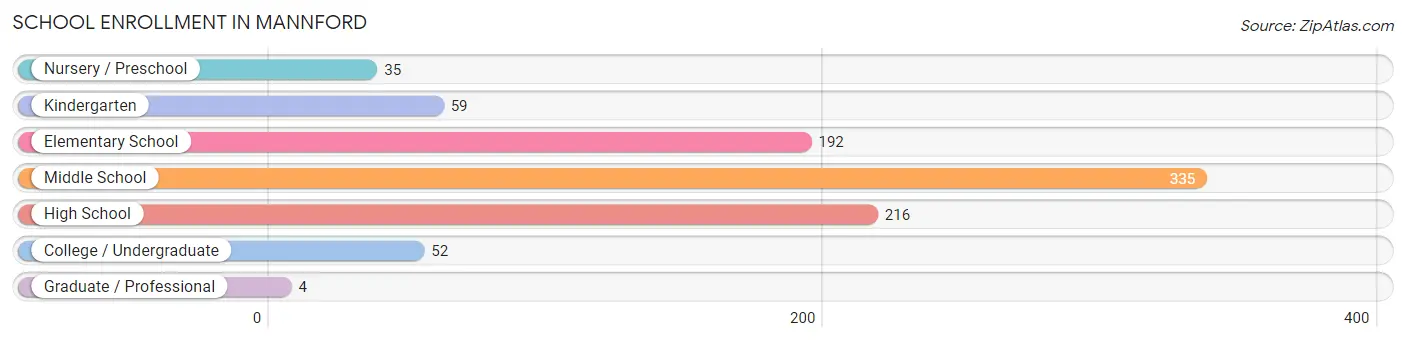
| School Level | # Students | % Students |
| Nursery / Preschool | 35 | 3.9% |
| Kindergarten | 59 | 6.6% |
| Elementary School | 192 | 21.5% |
| Middle School | 335 | 37.5% |
| High School | 216 | 24.2% |
| College / Undergraduate | 52 | 5.8% |
| Graduate / Professional | 4 | 0.4% |
| Total | 893 | 100.0% |
School Enrollment by Age by Funding Source in Mannford
Out of a total of 893 students who are enrolled in schools in Mannford, 79 (8.8%) attend a private institution, while the remaining 814 (91.2%) are enrolled in public schools. The age group of 25 to 34 year olds has the highest likelihood of being enrolled in private schools, with 9 (36.0% in the age bracket) enrolled. Conversely, the age group of 20 to 24 year olds has the lowest likelihood of being enrolled in a private school, with 27 (100.0% in the age bracket) attending a public institution.
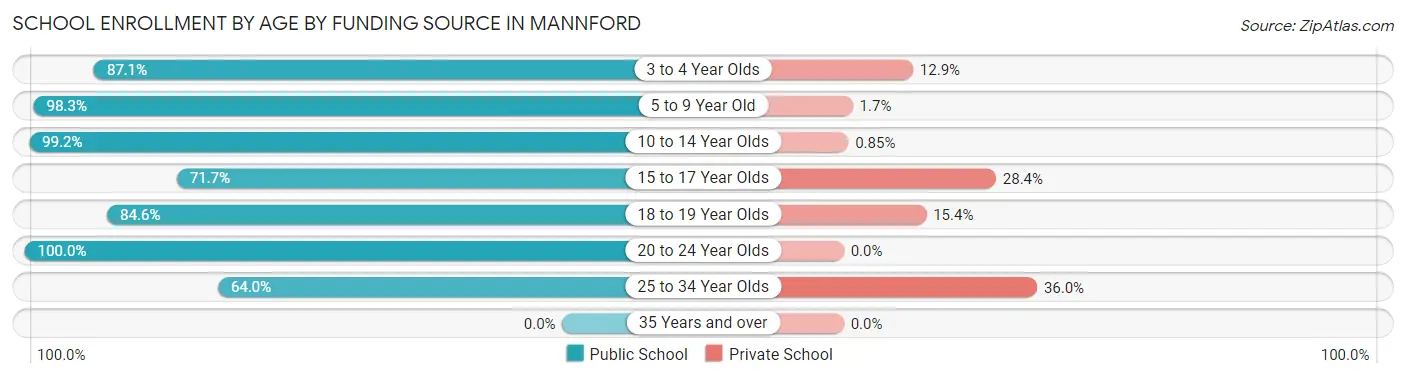
| Age Bracket | Public School | Private School |
| 3 to 4 Year Olds | 27 (87.1%) | 4 (12.9%) |
| 5 to 9 Year Old | 235 (98.3%) | 4 (1.7%) |
| 10 to 14 Year Olds | 348 (99.2%) | 3 (0.9%) |
| 15 to 17 Year Olds | 139 (71.7%) | 55 (28.3%) |
| 18 to 19 Year Olds | 22 (84.6%) | 4 (15.4%) |
| 20 to 24 Year Olds | 27 (100.0%) | 0 (0.0%) |
| 25 to 34 Year Olds | 16 (64.0%) | 9 (36.0%) |
| 35 Years and over | 0 (0.0%) | 0 (0.0%) |
| Total | 814 (91.2%) | 79 (8.8%) |
Educational Attainment by Field of Study in Mannford
Education (112 | 32.0%), business (73 | 20.9%), social sciences (25 | 7.1%), liberal arts & history (24 | 6.9%), and science & technology (23 | 6.6%) are the most common fields of study among 350 individuals in Mannford who have obtained a bachelor's degree or higher.
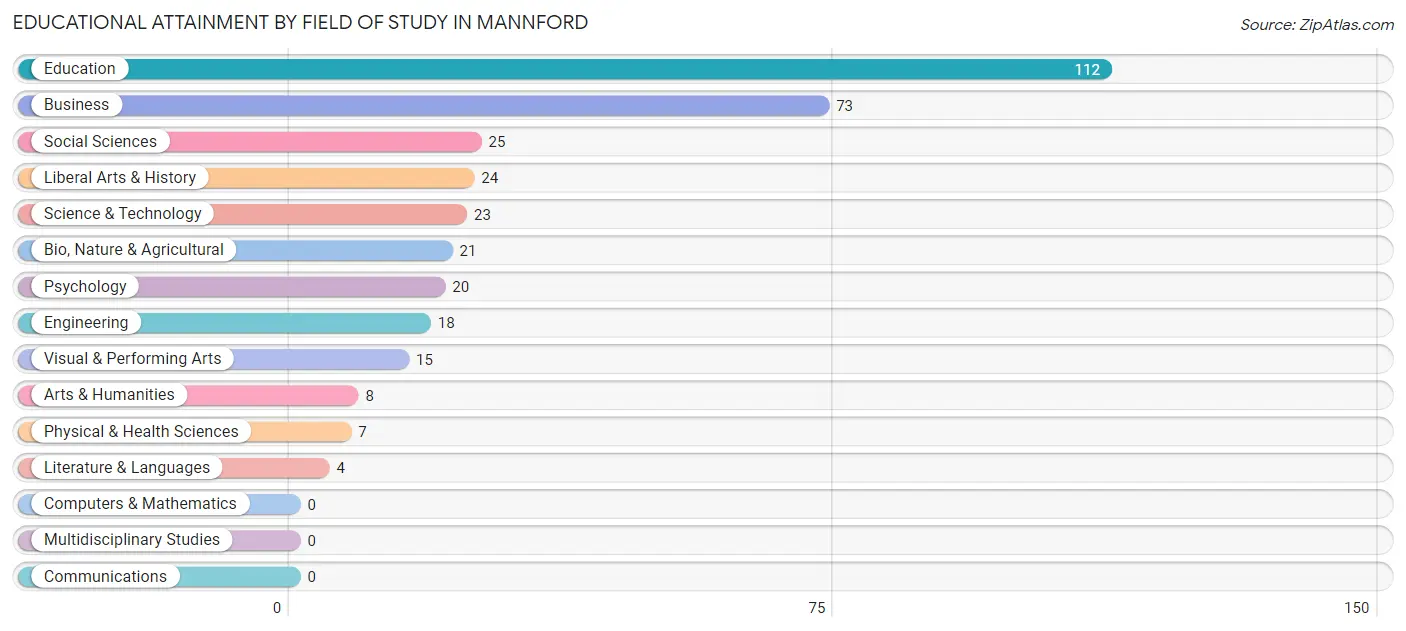
| Field of Study | # Graduates | % Graduates |
| Computers & Mathematics | 0 | 0.0% |
| Bio, Nature & Agricultural | 21 | 6.0% |
| Physical & Health Sciences | 7 | 2.0% |
| Psychology | 20 | 5.7% |
| Social Sciences | 25 | 7.1% |
| Engineering | 18 | 5.1% |
| Multidisciplinary Studies | 0 | 0.0% |
| Science & Technology | 23 | 6.6% |
| Business | 73 | 20.9% |
| Education | 112 | 32.0% |
| Literature & Languages | 4 | 1.1% |
| Liberal Arts & History | 24 | 6.9% |
| Visual & Performing Arts | 15 | 4.3% |
| Communications | 0 | 0.0% |
| Arts & Humanities | 8 | 2.3% |
| Total | 350 | 100.0% |
Transportation & Commute in Mannford
Vehicle Availability by Sex in Mannford
The most prevalent vehicle ownership categories in Mannford are males with 2 vehicles (346, accounting for 44.6%) and females with 2 vehicles (218, making up 57.0%).
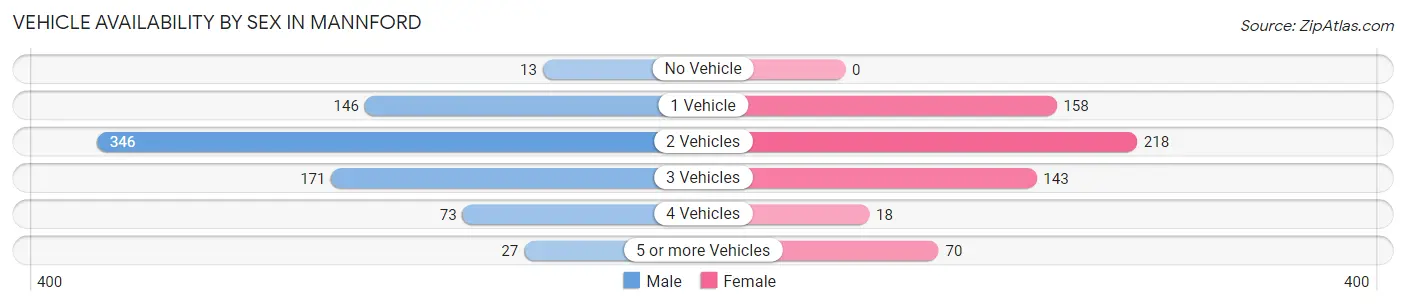
| Vehicles Available | Male | Female |
| No Vehicle | 13 (1.7%) | 0 (0.0%) |
| 1 Vehicle | 146 (18.8%) | 158 (26.0%) |
| 2 Vehicles | 346 (44.6%) | 218 (35.9%) |
| 3 Vehicles | 171 (22.0%) | 143 (23.6%) |
| 4 Vehicles | 73 (9.4%) | 18 (3.0%) |
| 5 or more Vehicles | 27 (3.5%) | 70 (11.5%) |
| Total | 776 (100.0%) | 607 (100.0%) |
Commute Time in Mannford
The most frequently occuring commute durations in Mannford are 30 to 34 minutes (364 commuters, 28.2%), 45 to 59 minutes (175 commuters, 13.6%), and 5 to 9 minutes (130 commuters, 10.1%).
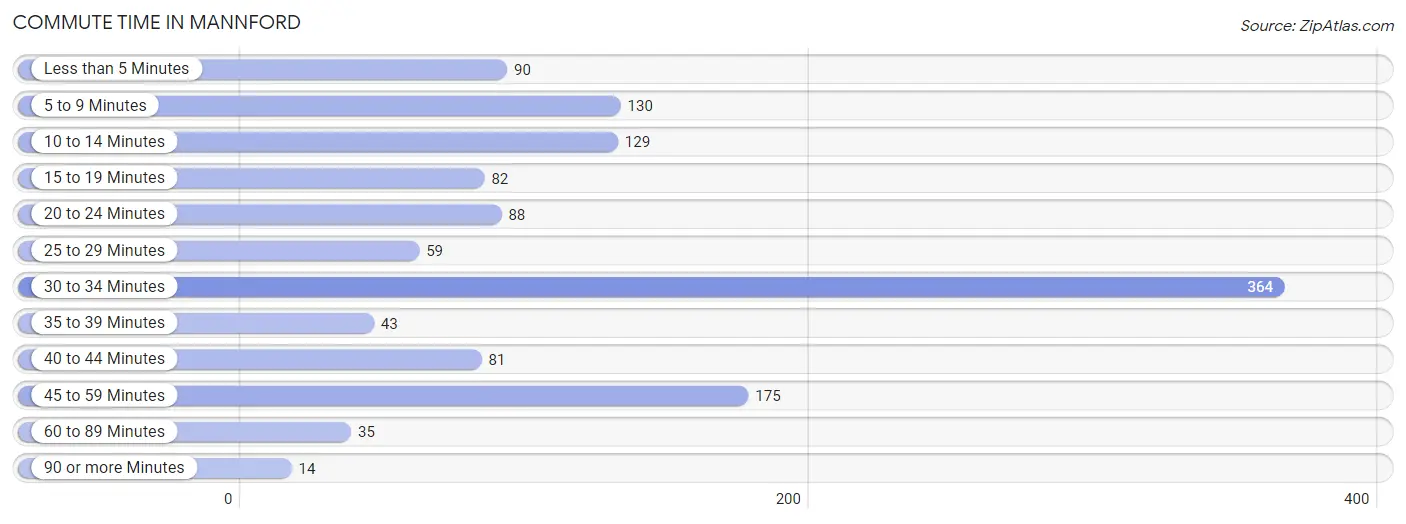
| Commute Time | # Commuters | % Commuters |
| Less than 5 Minutes | 90 | 7.0% |
| 5 to 9 Minutes | 130 | 10.1% |
| 10 to 14 Minutes | 129 | 10.0% |
| 15 to 19 Minutes | 82 | 6.4% |
| 20 to 24 Minutes | 88 | 6.8% |
| 25 to 29 Minutes | 59 | 4.6% |
| 30 to 34 Minutes | 364 | 28.2% |
| 35 to 39 Minutes | 43 | 3.3% |
| 40 to 44 Minutes | 81 | 6.3% |
| 45 to 59 Minutes | 175 | 13.6% |
| 60 to 89 Minutes | 35 | 2.7% |
| 90 or more Minutes | 14 | 1.1% |
Commute Time by Sex in Mannford
The most common commute times in Mannford are 30 to 34 minutes (203 commuters, 27.7%) for males and 30 to 34 minutes (161 commuters, 29.0%) for females.
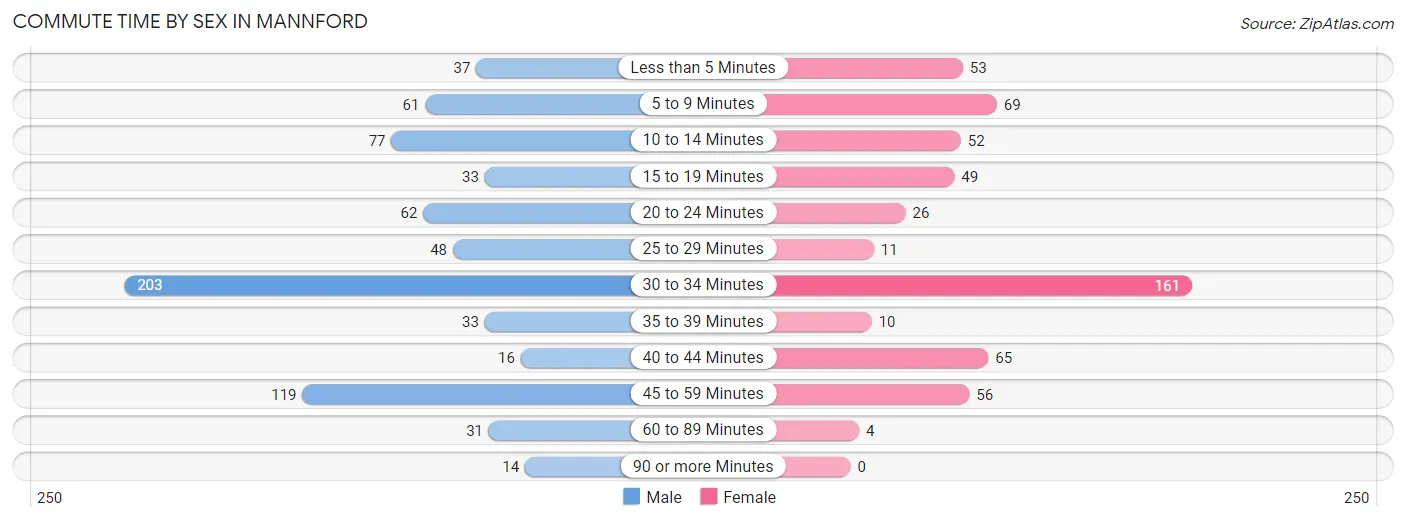
| Commute Time | Male | Female |
| Less than 5 Minutes | 37 (5.0%) | 53 (9.5%) |
| 5 to 9 Minutes | 61 (8.3%) | 69 (12.4%) |
| 10 to 14 Minutes | 77 (10.5%) | 52 (9.3%) |
| 15 to 19 Minutes | 33 (4.5%) | 49 (8.8%) |
| 20 to 24 Minutes | 62 (8.5%) | 26 (4.7%) |
| 25 to 29 Minutes | 48 (6.5%) | 11 (2.0%) |
| 30 to 34 Minutes | 203 (27.7%) | 161 (29.0%) |
| 35 to 39 Minutes | 33 (4.5%) | 10 (1.8%) |
| 40 to 44 Minutes | 16 (2.2%) | 65 (11.7%) |
| 45 to 59 Minutes | 119 (16.2%) | 56 (10.1%) |
| 60 to 89 Minutes | 31 (4.2%) | 4 (0.7%) |
| 90 or more Minutes | 14 (1.9%) | 0 (0.0%) |
Time of Departure to Work by Sex in Mannford
The most frequent times of departure to work in Mannford are 7:00 AM to 7:29 AM (125, 17.0%) for males and 7:00 AM to 7:29 AM (120, 21.6%) for females.
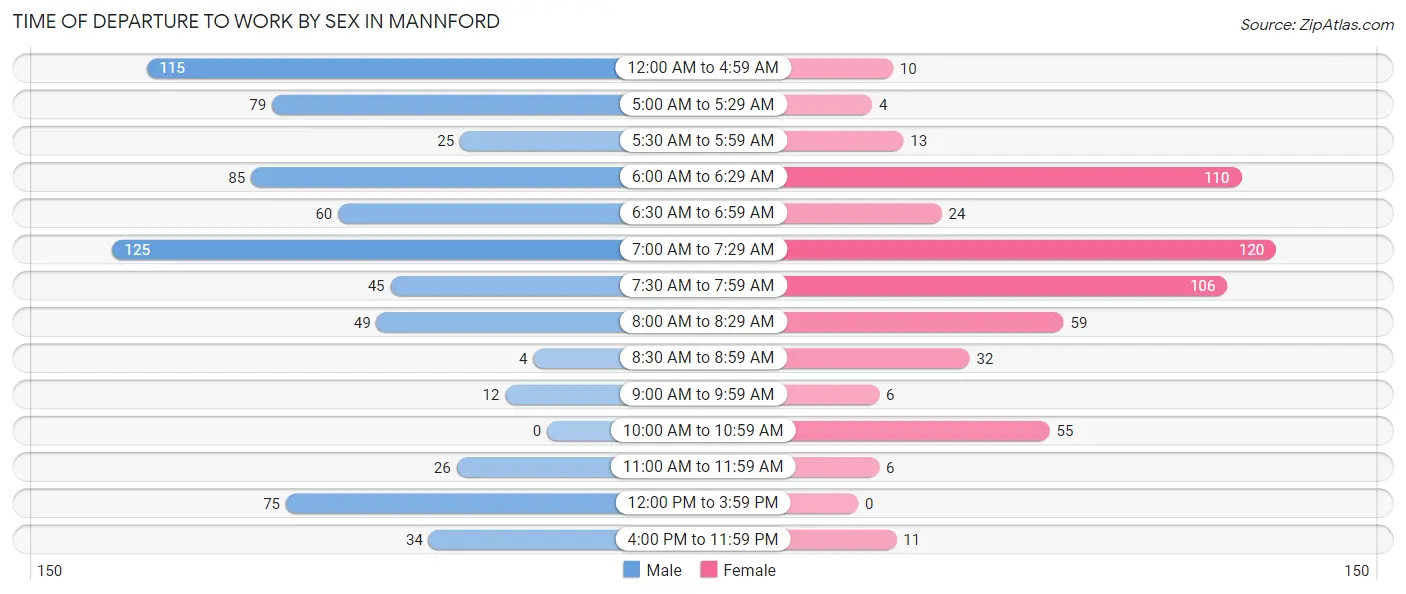
| Time of Departure | Male | Female |
| 12:00 AM to 4:59 AM | 115 (15.7%) | 10 (1.8%) |
| 5:00 AM to 5:29 AM | 79 (10.8%) | 4 (0.7%) |
| 5:30 AM to 5:59 AM | 25 (3.4%) | 13 (2.3%) |
| 6:00 AM to 6:29 AM | 85 (11.6%) | 110 (19.8%) |
| 6:30 AM to 6:59 AM | 60 (8.2%) | 24 (4.3%) |
| 7:00 AM to 7:29 AM | 125 (17.0%) | 120 (21.6%) |
| 7:30 AM to 7:59 AM | 45 (6.1%) | 106 (19.1%) |
| 8:00 AM to 8:29 AM | 49 (6.7%) | 59 (10.6%) |
| 8:30 AM to 8:59 AM | 4 (0.5%) | 32 (5.8%) |
| 9:00 AM to 9:59 AM | 12 (1.6%) | 6 (1.1%) |
| 10:00 AM to 10:59 AM | 0 (0.0%) | 55 (9.9%) |
| 11:00 AM to 11:59 AM | 26 (3.5%) | 6 (1.1%) |
| 12:00 PM to 3:59 PM | 75 (10.2%) | 0 (0.0%) |
| 4:00 PM to 11:59 PM | 34 (4.6%) | 11 (2.0%) |
| Total | 734 (100.0%) | 556 (100.0%) |
Housing Occupancy in Mannford
Occupancy by Ownership in Mannford
Of the total 1,151 dwellings in Mannford, owner-occupied units account for 671 (58.3%), while renter-occupied units make up 480 (41.7%).
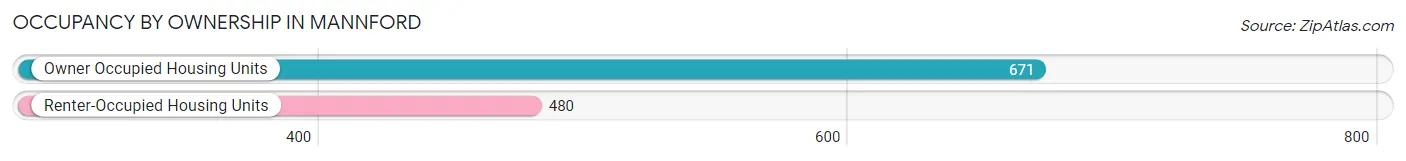
| Occupancy | # Housing Units | % Housing Units |
| Owner Occupied Housing Units | 671 | 58.3% |
| Renter-Occupied Housing Units | 480 | 41.7% |
| Total Occupied Housing Units | 1,151 | 100.0% |
Occupancy by Household Size in Mannford
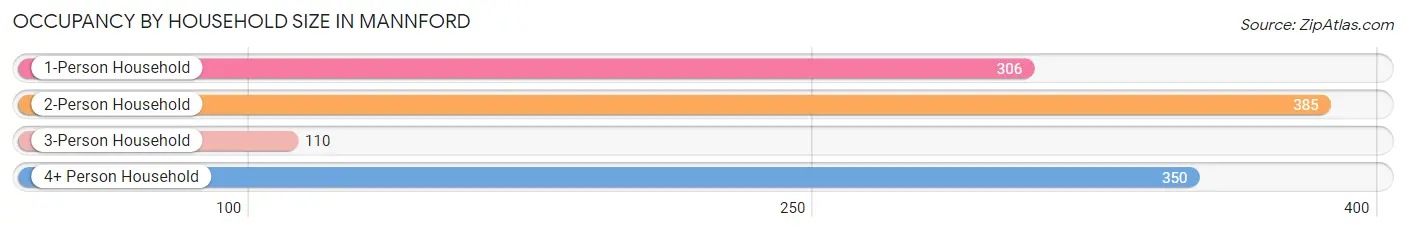
| Household Size | # Housing Units | % Housing Units |
| 1-Person Household | 306 | 26.6% |
| 2-Person Household | 385 | 33.5% |
| 3-Person Household | 110 | 9.6% |
| 4+ Person Household | 350 | 30.4% |
| Total Housing Units | 1,151 | 100.0% |
Occupancy by Ownership by Household Size in Mannford
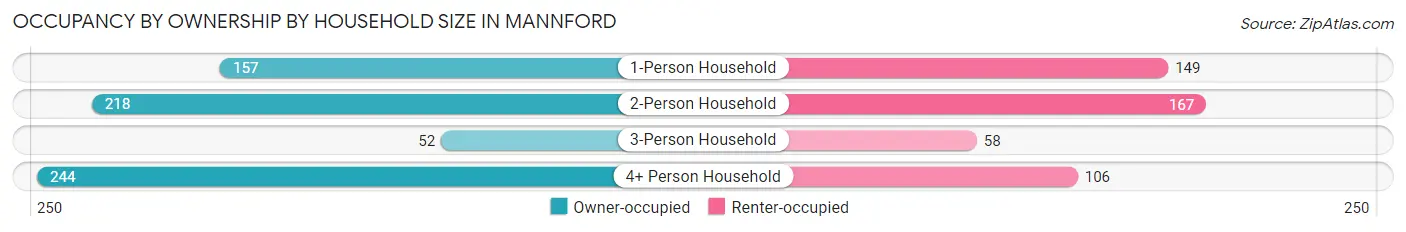
| Household Size | Owner-occupied | Renter-occupied |
| 1-Person Household | 157 (51.3%) | 149 (48.7%) |
| 2-Person Household | 218 (56.6%) | 167 (43.4%) |
| 3-Person Household | 52 (47.3%) | 58 (52.7%) |
| 4+ Person Household | 244 (69.7%) | 106 (30.3%) |
| Total Housing Units | 671 (58.3%) | 480 (41.7%) |
Occupancy by Educational Attainment in Mannford
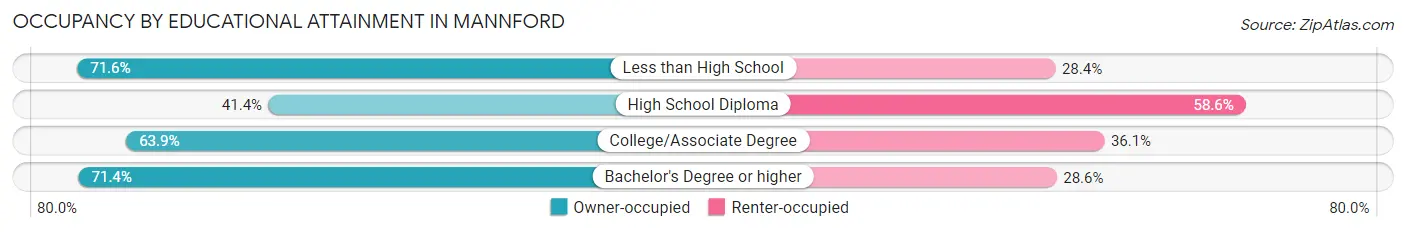
| Household Size | Owner-occupied | Renter-occupied |
| Less than High School | 48 (71.6%) | 19 (28.4%) |
| High School Diploma | 159 (41.4%) | 225 (58.6%) |
| College/Associate Degree | 304 (63.9%) | 172 (36.1%) |
| Bachelor's Degree or higher | 160 (71.4%) | 64 (28.6%) |
Occupancy by Age of Householder in Mannford
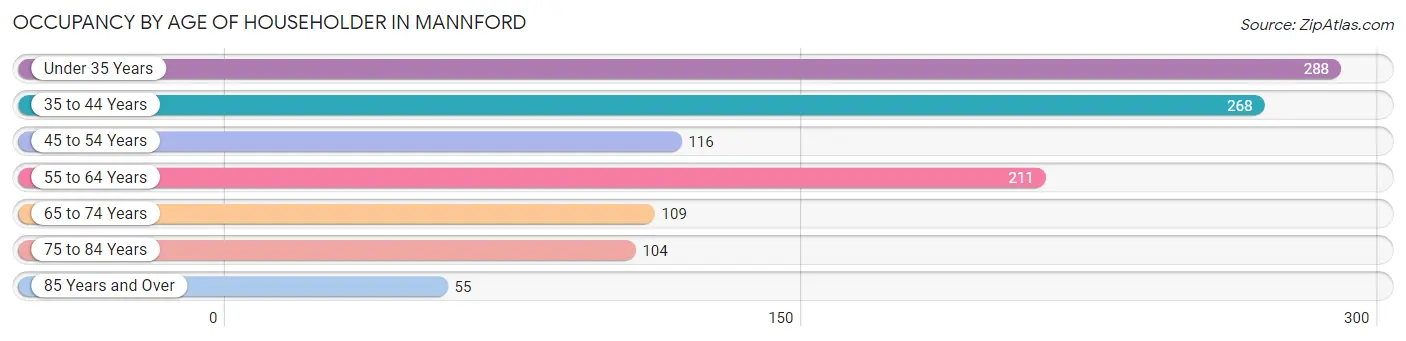
| Age Bracket | # Households | % Households |
| Under 35 Years | 288 | 25.0% |
| 35 to 44 Years | 268 | 23.3% |
| 45 to 54 Years | 116 | 10.1% |
| 55 to 64 Years | 211 | 18.3% |
| 65 to 74 Years | 109 | 9.5% |
| 75 to 84 Years | 104 | 9.0% |
| 85 Years and Over | 55 | 4.8% |
| Total | 1,151 | 100.0% |
Housing Finances in Mannford
Median Income by Occupancy in Mannford
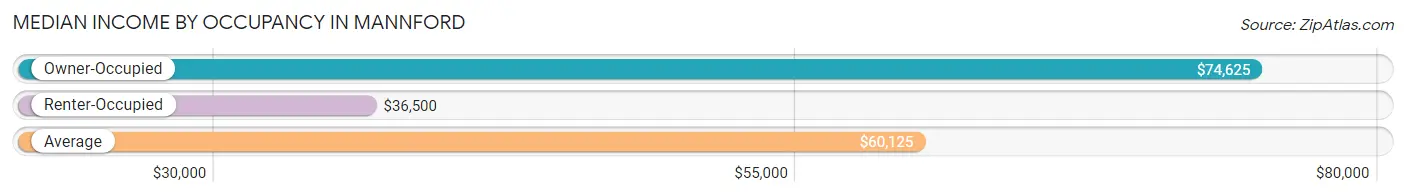
| Occupancy Type | # Households | Median Income |
| Owner-Occupied | 671 (58.3%) | $74,625 |
| Renter-Occupied | 480 (41.7%) | $36,500 |
| Average | 1,151 (100.0%) | $60,125 |
Occupancy by Householder Income Bracket in Mannford
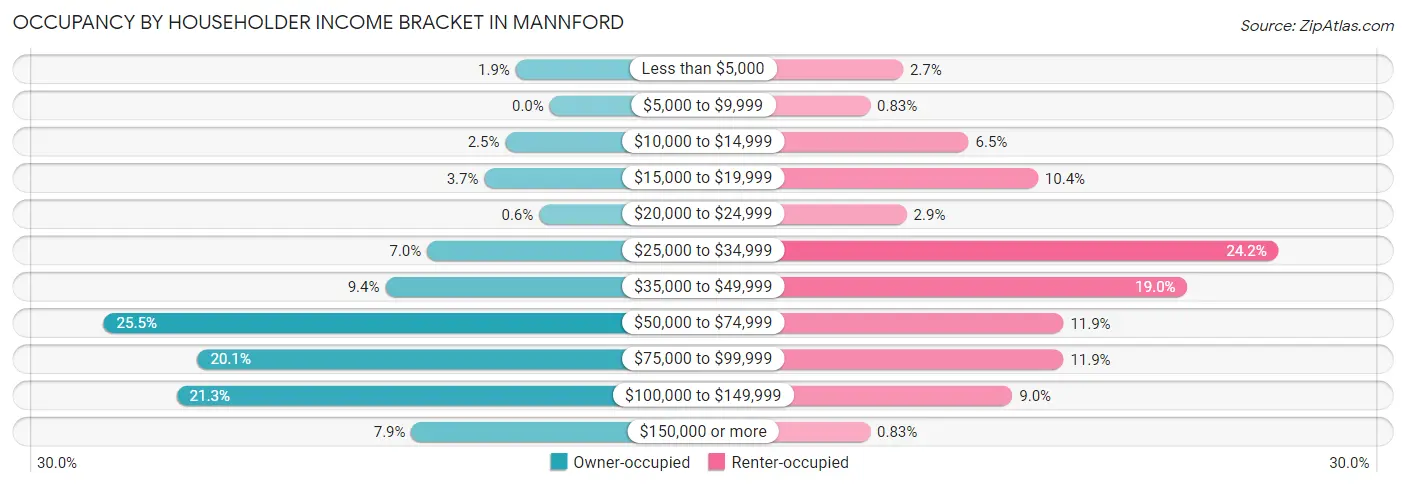
| Income Bracket | Owner-occupied | Renter-occupied |
| Less than $5,000 | 13 (1.9%) | 13 (2.7%) |
| $5,000 to $9,999 | 0 (0.0%) | 4 (0.8%) |
| $10,000 to $14,999 | 17 (2.5%) | 31 (6.5%) |
| $15,000 to $19,999 | 25 (3.7%) | 50 (10.4%) |
| $20,000 to $24,999 | 4 (0.6%) | 14 (2.9%) |
| $25,000 to $34,999 | 47 (7.0%) | 116 (24.2%) |
| $35,000 to $49,999 | 63 (9.4%) | 91 (19.0%) |
| $50,000 to $74,999 | 171 (25.5%) | 57 (11.9%) |
| $75,000 to $99,999 | 135 (20.1%) | 57 (11.9%) |
| $100,000 to $149,999 | 143 (21.3%) | 43 (9.0%) |
| $150,000 or more | 53 (7.9%) | 4 (0.8%) |
| Total | 671 (100.0%) | 480 (100.0%) |
Monthly Housing Cost Tiers in Mannford
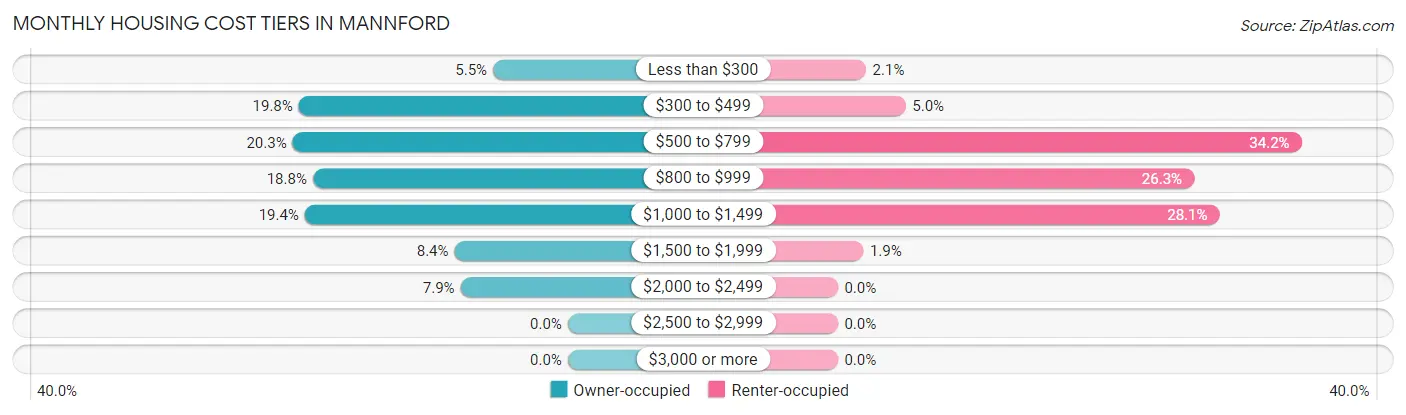
| Monthly Cost | Owner-occupied | Renter-occupied |
| Less than $300 | 37 (5.5%) | 10 (2.1%) |
| $300 to $499 | 133 (19.8%) | 24 (5.0%) |
| $500 to $799 | 136 (20.3%) | 164 (34.2%) |
| $800 to $999 | 126 (18.8%) | 126 (26.3%) |
| $1,000 to $1,499 | 130 (19.4%) | 135 (28.1%) |
| $1,500 to $1,999 | 56 (8.4%) | 9 (1.9%) |
| $2,000 to $2,499 | 53 (7.9%) | 0 (0.0%) |
| $2,500 to $2,999 | 0 (0.0%) | 0 (0.0%) |
| $3,000 or more | 0 (0.0%) | 0 (0.0%) |
| Total | 671 (100.0%) | 480 (100.0%) |
Physical Housing Characteristics in Mannford
Housing Structures in Mannford
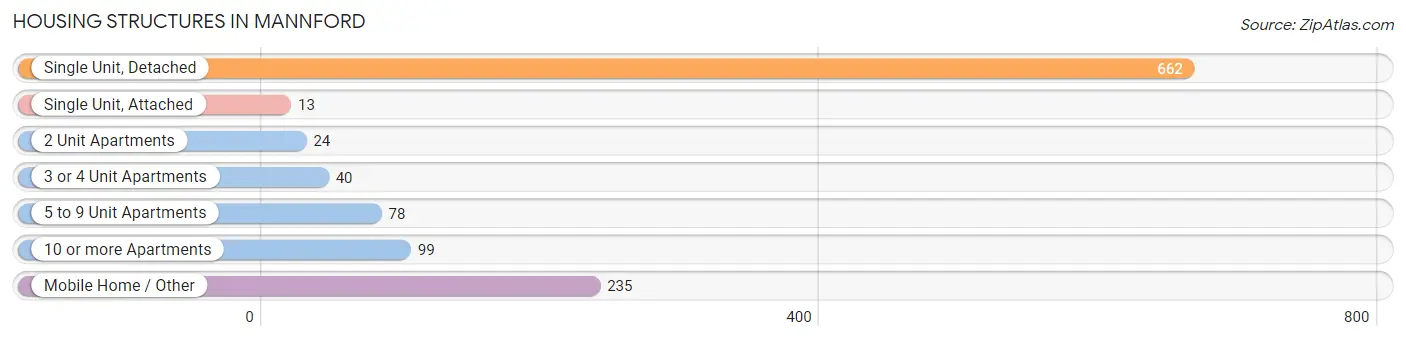
| Structure Type | # Housing Units | % Housing Units |
| Single Unit, Detached | 662 | 57.5% |
| Single Unit, Attached | 13 | 1.1% |
| 2 Unit Apartments | 24 | 2.1% |
| 3 or 4 Unit Apartments | 40 | 3.5% |
| 5 to 9 Unit Apartments | 78 | 6.8% |
| 10 or more Apartments | 99 | 8.6% |
| Mobile Home / Other | 235 | 20.4% |
| Total | 1,151 | 100.0% |
Housing Structures by Occupancy in Mannford
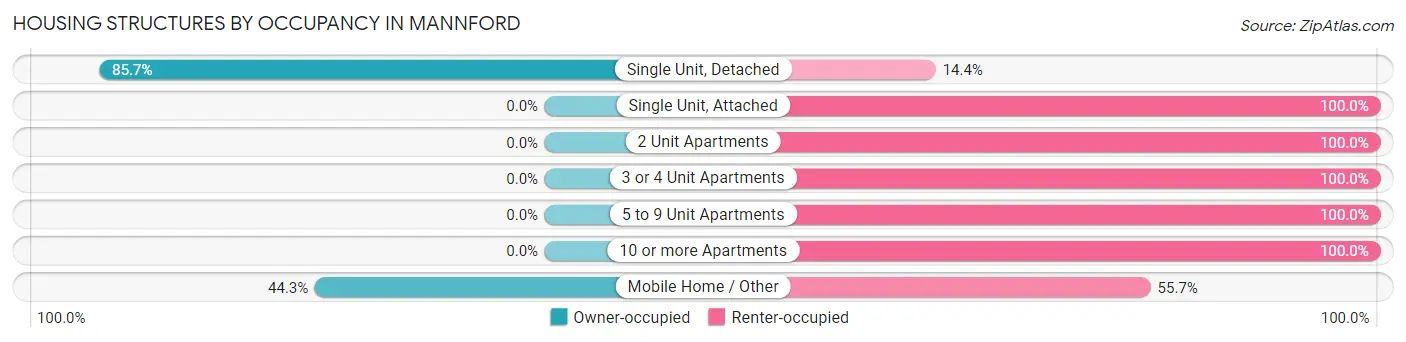
| Structure Type | Owner-occupied | Renter-occupied |
| Single Unit, Detached | 567 (85.7%) | 95 (14.3%) |
| Single Unit, Attached | 0 (0.0%) | 13 (100.0%) |
| 2 Unit Apartments | 0 (0.0%) | 24 (100.0%) |
| 3 or 4 Unit Apartments | 0 (0.0%) | 40 (100.0%) |
| 5 to 9 Unit Apartments | 0 (0.0%) | 78 (100.0%) |
| 10 or more Apartments | 0 (0.0%) | 99 (100.0%) |
| Mobile Home / Other | 104 (44.3%) | 131 (55.7%) |
| Total | 671 (58.3%) | 480 (41.7%) |
Housing Structures by Number of Rooms in Mannford
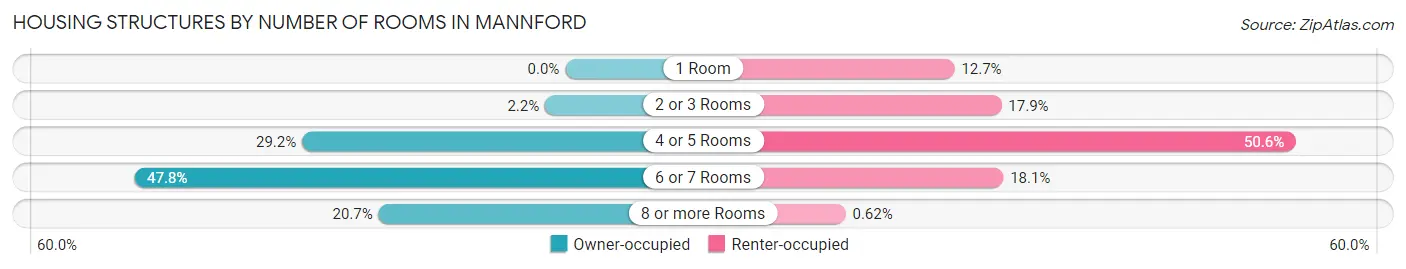
| Number of Rooms | Owner-occupied | Renter-occupied |
| 1 Room | 0 (0.0%) | 61 (12.7%) |
| 2 or 3 Rooms | 15 (2.2%) | 86 (17.9%) |
| 4 or 5 Rooms | 196 (29.2%) | 243 (50.6%) |
| 6 or 7 Rooms | 321 (47.8%) | 87 (18.1%) |
| 8 or more Rooms | 139 (20.7%) | 3 (0.6%) |
| Total | 671 (100.0%) | 480 (100.0%) |
Housing Structure by Heating Type in Mannford
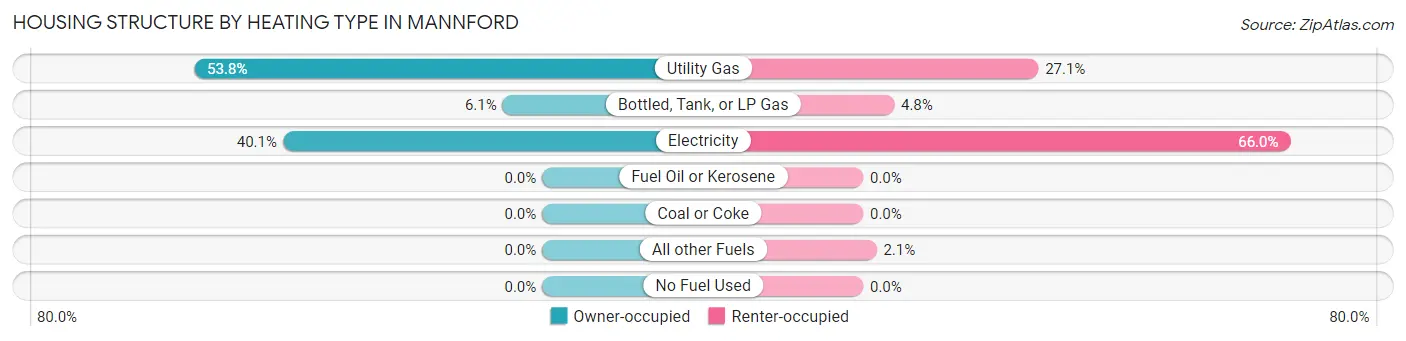
| Heating Type | Owner-occupied | Renter-occupied |
| Utility Gas | 361 (53.8%) | 130 (27.1%) |
| Bottled, Tank, or LP Gas | 41 (6.1%) | 23 (4.8%) |
| Electricity | 269 (40.1%) | 317 (66.0%) |
| Fuel Oil or Kerosene | 0 (0.0%) | 0 (0.0%) |
| Coal or Coke | 0 (0.0%) | 0 (0.0%) |
| All other Fuels | 0 (0.0%) | 10 (2.1%) |
| No Fuel Used | 0 (0.0%) | 0 (0.0%) |
| Total | 671 (100.0%) | 480 (100.0%) |
Household Vehicle Usage in Mannford
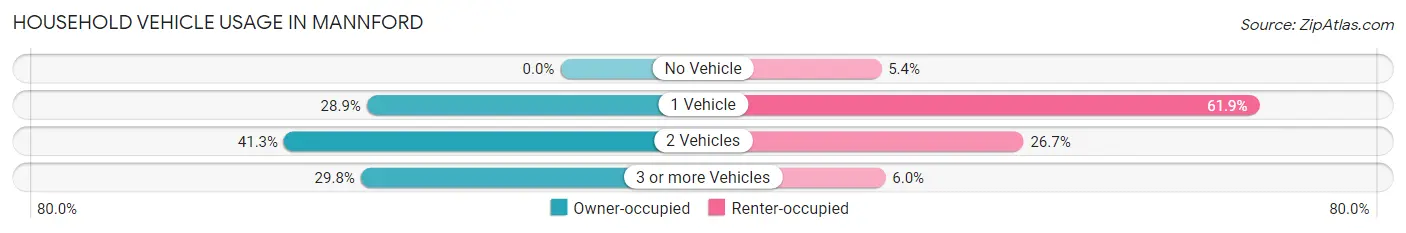
| Vehicles per Household | Owner-occupied | Renter-occupied |
| No Vehicle | 0 (0.0%) | 26 (5.4%) |
| 1 Vehicle | 194 (28.9%) | 297 (61.9%) |
| 2 Vehicles | 277 (41.3%) | 128 (26.7%) |
| 3 or more Vehicles | 200 (29.8%) | 29 (6.0%) |
| Total | 671 (100.0%) | 480 (100.0%) |
Real Estate & Mortgages in Mannford
Real Estate and Mortgage Overview in Mannford
| Characteristic | Without Mortgage | With Mortgage |
| Housing Units | 295 | 376 |
| Median Property Value | $159,300 | $164,100 |
| Median Household Income | $75,288 | $29 |
| Monthly Housing Costs | $485 | $0 |
| Real Estate Taxes | $1,150 | $0 |
Property Value by Mortgage Status in Mannford
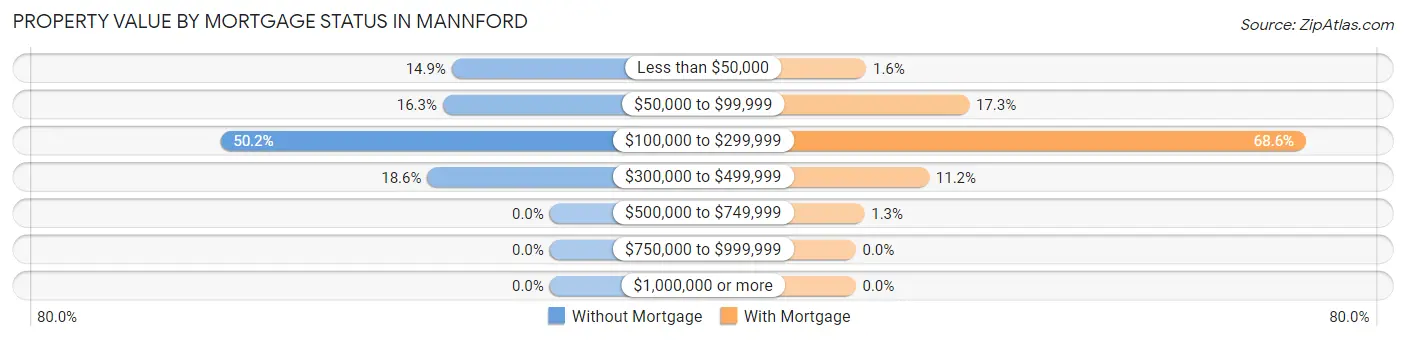
| Property Value | Without Mortgage | With Mortgage |
| Less than $50,000 | 44 (14.9%) | 6 (1.6%) |
| $50,000 to $99,999 | 48 (16.3%) | 65 (17.3%) |
| $100,000 to $299,999 | 148 (50.2%) | 258 (68.6%) |
| $300,000 to $499,999 | 55 (18.6%) | 42 (11.2%) |
| $500,000 to $749,999 | 0 (0.0%) | 5 (1.3%) |
| $750,000 to $999,999 | 0 (0.0%) | 0 (0.0%) |
| $1,000,000 or more | 0 (0.0%) | 0 (0.0%) |
| Total | 295 (100.0%) | 376 (100.0%) |
Household Income by Mortgage Status in Mannford
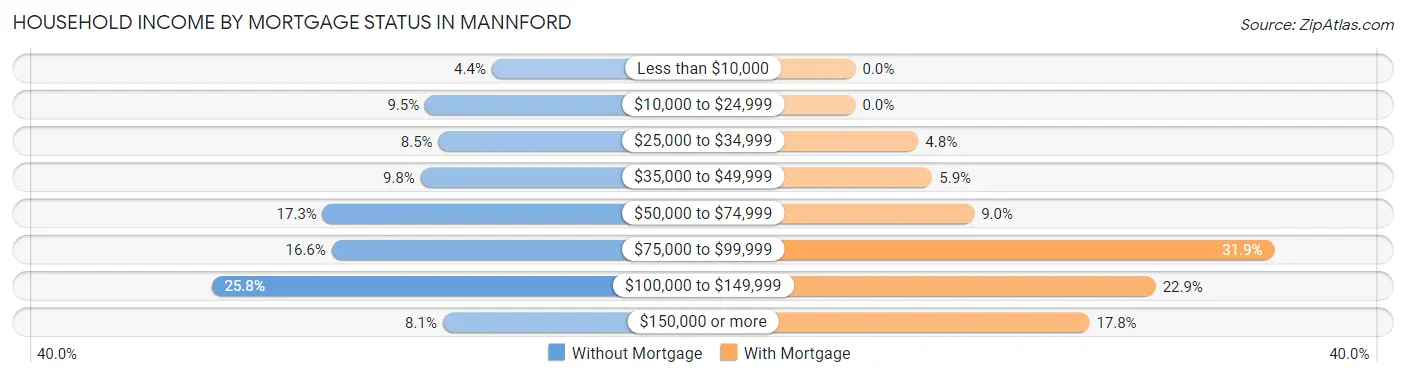
| Household Income | Without Mortgage | With Mortgage |
| Less than $10,000 | 13 (4.4%) | 0 (0.0%) |
| $10,000 to $24,999 | 28 (9.5%) | 0 (0.0%) |
| $25,000 to $34,999 | 25 (8.5%) | 18 (4.8%) |
| $35,000 to $49,999 | 29 (9.8%) | 22 (5.9%) |
| $50,000 to $74,999 | 51 (17.3%) | 34 (9.0%) |
| $75,000 to $99,999 | 49 (16.6%) | 120 (31.9%) |
| $100,000 to $149,999 | 76 (25.8%) | 86 (22.9%) |
| $150,000 or more | 24 (8.1%) | 67 (17.8%) |
| Total | 295 (100.0%) | 376 (100.0%) |
Property Value to Household Income Ratio in Mannford
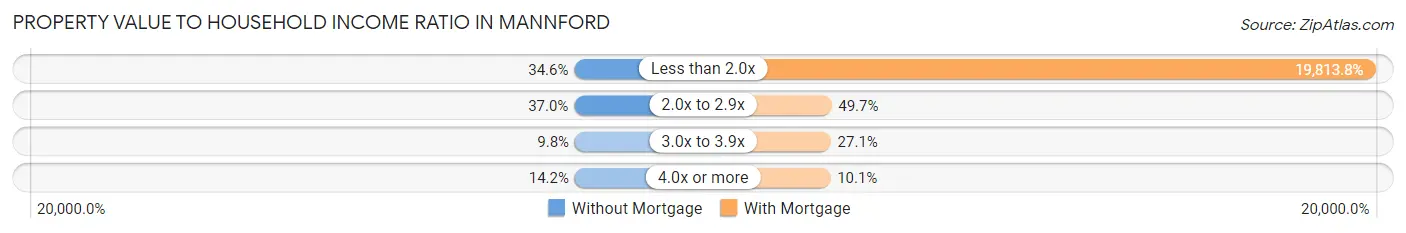
| Value-to-Income Ratio | Without Mortgage | With Mortgage |
| Less than 2.0x | 102 (34.6%) | 74,500 (19,813.8%) |
| 2.0x to 2.9x | 109 (36.9%) | 187 (49.7%) |
| 3.0x to 3.9x | 29 (9.8%) | 102 (27.1%) |
| 4.0x or more | 42 (14.2%) | 38 (10.1%) |
| Total | 295 (100.0%) | 376 (100.0%) |
Real Estate Taxes by Mortgage Status in Mannford
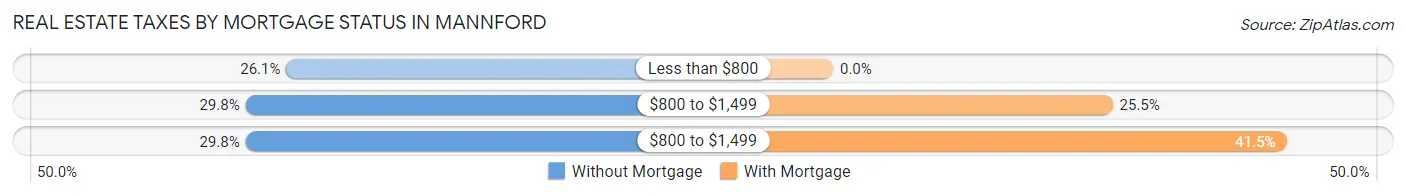
| Property Taxes | Without Mortgage | With Mortgage |
| Less than $800 | 77 (26.1%) | 0 (0.0%) |
| $800 to $1,499 | 88 (29.8%) | 96 (25.5%) |
| $800 to $1,499 | 88 (29.8%) | 156 (41.5%) |
| Total | 295 (100.0%) | 376 (100.0%) |
Health & Disability in Mannford
Health Insurance Coverage by Age in Mannford
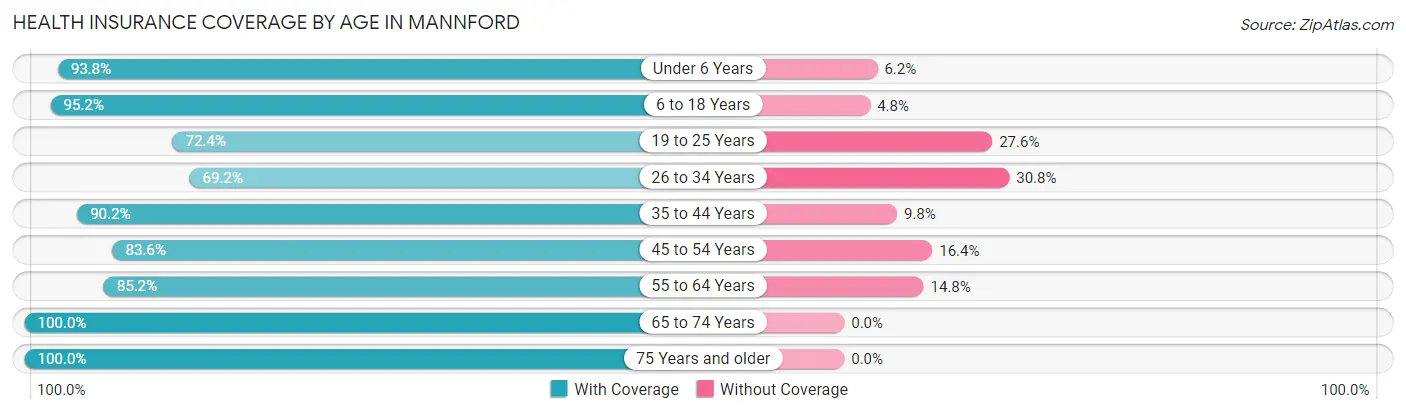
| Age Bracket | With Coverage | Without Coverage |
| Under 6 Years | 288 (93.8%) | 19 (6.2%) |
| 6 to 18 Years | 749 (95.2%) | 38 (4.8%) |
| 19 to 25 Years | 294 (72.4%) | 112 (27.6%) |
| 26 to 34 Years | 270 (69.2%) | 120 (30.8%) |
| 35 to 44 Years | 395 (90.2%) | 43 (9.8%) |
| 45 to 54 Years | 163 (83.6%) | 32 (16.4%) |
| 55 to 64 Years | 265 (85.2%) | 46 (14.8%) |
| 65 to 74 Years | 170 (100.0%) | 0 (0.0%) |
| 75 Years and older | 209 (100.0%) | 0 (0.0%) |
| Total | 2,803 (87.2%) | 410 (12.8%) |
Health Insurance Coverage by Citizenship Status in Mannford
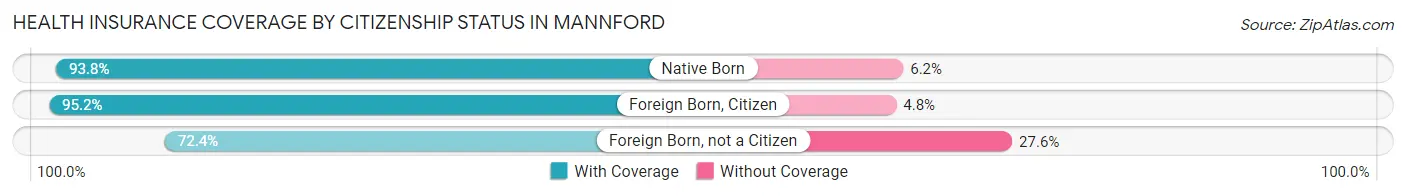
| Citizenship Status | With Coverage | Without Coverage |
| Native Born | 288 (93.8%) | 19 (6.2%) |
| Foreign Born, Citizen | 749 (95.2%) | 38 (4.8%) |
| Foreign Born, not a Citizen | 294 (72.4%) | 112 (27.6%) |
Health Insurance Coverage by Household Income in Mannford
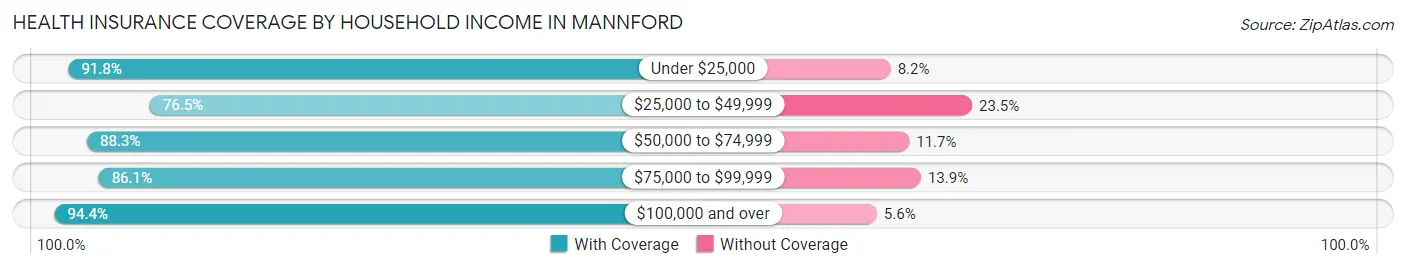
| Household Income | With Coverage | Without Coverage |
| Under $25,000 | 301 (91.8%) | 27 (8.2%) |
| $25,000 to $49,999 | 515 (76.5%) | 158 (23.5%) |
| $50,000 to $74,999 | 490 (88.3%) | 65 (11.7%) |
| $75,000 to $99,999 | 694 (86.1%) | 112 (13.9%) |
| $100,000 and over | 803 (94.4%) | 48 (5.6%) |
Public vs Private Health Insurance Coverage by Age in Mannford
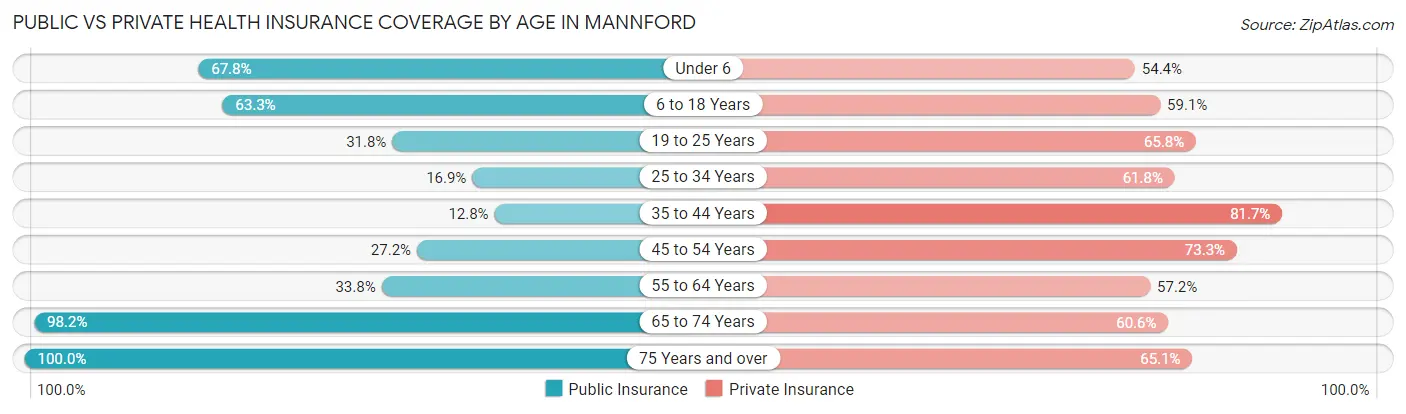
| Age Bracket | Public Insurance | Private Insurance |
| Under 6 | 208 (67.7%) | 167 (54.4%) |
| 6 to 18 Years | 498 (63.3%) | 465 (59.1%) |
| 19 to 25 Years | 129 (31.8%) | 267 (65.8%) |
| 25 to 34 Years | 66 (16.9%) | 241 (61.8%) |
| 35 to 44 Years | 56 (12.8%) | 358 (81.7%) |
| 45 to 54 Years | 53 (27.2%) | 143 (73.3%) |
| 55 to 64 Years | 105 (33.8%) | 178 (57.2%) |
| 65 to 74 Years | 167 (98.2%) | 103 (60.6%) |
| 75 Years and over | 209 (100.0%) | 136 (65.1%) |
| Total | 1,491 (46.4%) | 2,058 (64.0%) |
Disability Status by Sex by Age in Mannford
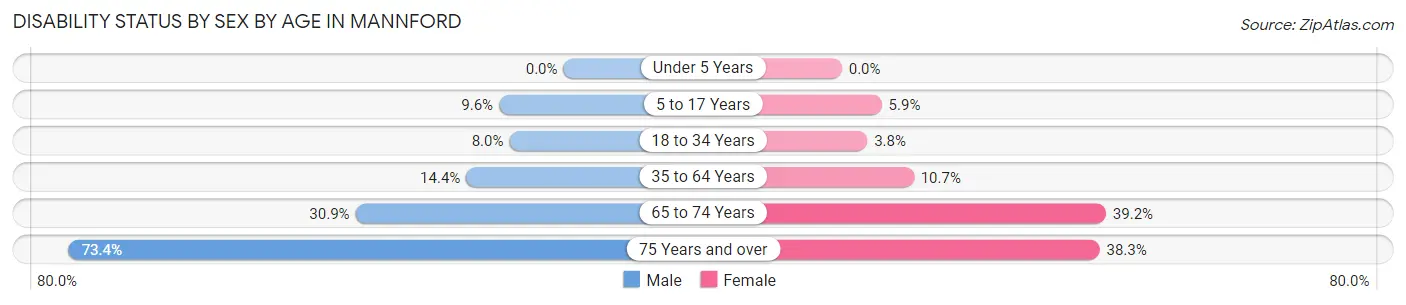
| Age Bracket | Male | Female |
| Under 5 Years | 0 (0.0%) | 0 (0.0%) |
| 5 to 17 Years | 43 (9.6%) | 21 (5.9%) |
| 18 to 34 Years | 32 (8.0%) | 16 (3.8%) |
| 35 to 64 Years | 70 (14.4%) | 49 (10.7%) |
| 65 to 74 Years | 21 (30.9%) | 40 (39.2%) |
| 75 Years and over | 94 (73.4%) | 31 (38.3%) |
Disability Class by Sex by Age in Mannford
Disability Class: Hearing Difficulty
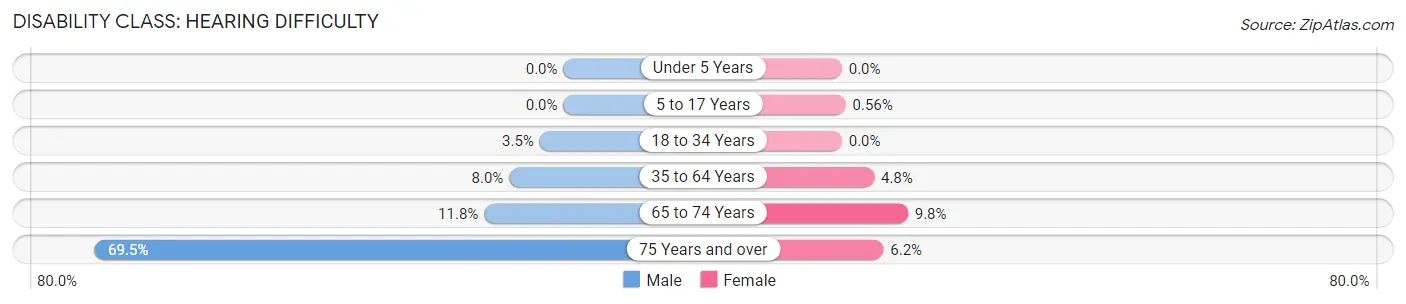
| Age Bracket | Male | Female |
| Under 5 Years | 0 (0.0%) | 0 (0.0%) |
| 5 to 17 Years | 0 (0.0%) | 2 (0.6%) |
| 18 to 34 Years | 14 (3.5%) | 0 (0.0%) |
| 35 to 64 Years | 39 (8.0%) | 22 (4.8%) |
| 65 to 74 Years | 8 (11.8%) | 10 (9.8%) |
| 75 Years and over | 89 (69.5%) | 5 (6.2%) |
Disability Class: Vision Difficulty
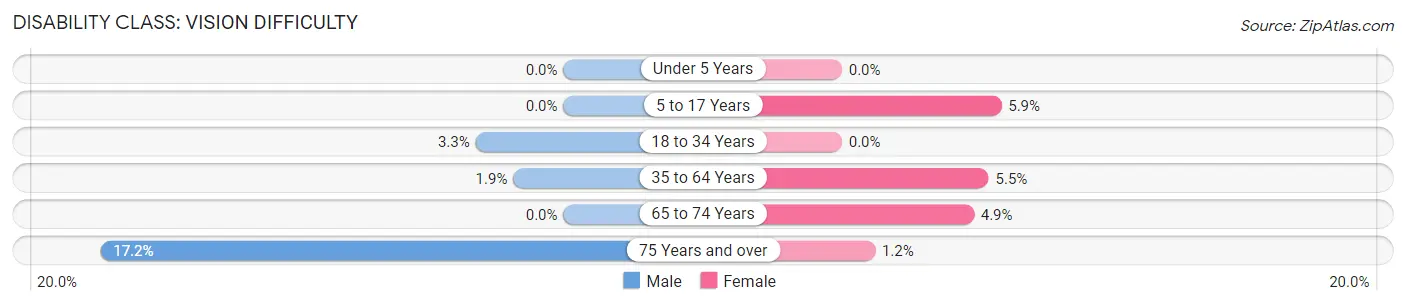
| Age Bracket | Male | Female |
| Under 5 Years | 0 (0.0%) | 0 (0.0%) |
| 5 to 17 Years | 0 (0.0%) | 21 (5.9%) |
| 18 to 34 Years | 13 (3.3%) | 0 (0.0%) |
| 35 to 64 Years | 9 (1.9%) | 25 (5.4%) |
| 65 to 74 Years | 0 (0.0%) | 5 (4.9%) |
| 75 Years and over | 22 (17.2%) | 1 (1.2%) |
Disability Class: Cognitive Difficulty
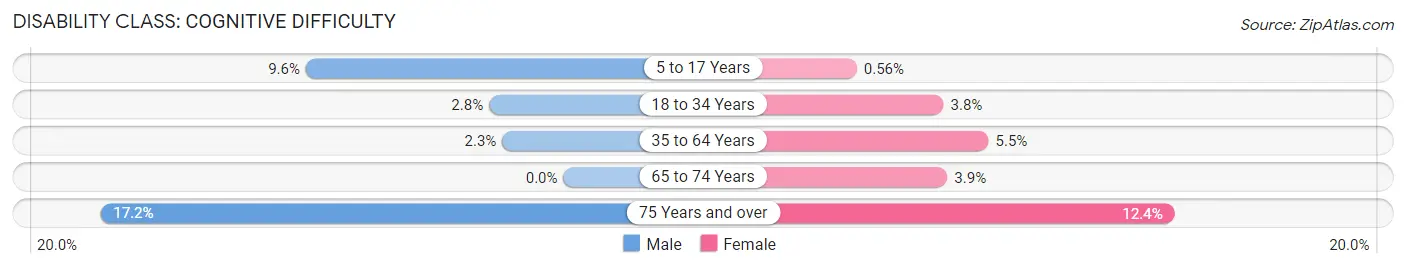
| Age Bracket | Male | Female |
| 5 to 17 Years | 43 (9.6%) | 2 (0.6%) |
| 18 to 34 Years | 11 (2.8%) | 16 (3.8%) |
| 35 to 64 Years | 11 (2.3%) | 25 (5.4%) |
| 65 to 74 Years | 0 (0.0%) | 4 (3.9%) |
| 75 Years and over | 22 (17.2%) | 10 (12.3%) |
Disability Class: Ambulatory Difficulty
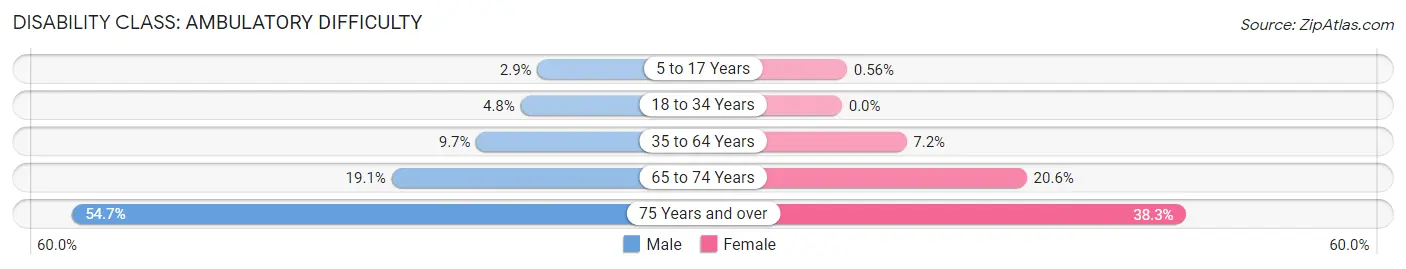
| Age Bracket | Male | Female |
| 5 to 17 Years | 13 (2.9%) | 2 (0.6%) |
| 18 to 34 Years | 19 (4.8%) | 0 (0.0%) |
| 35 to 64 Years | 47 (9.7%) | 33 (7.2%) |
| 65 to 74 Years | 13 (19.1%) | 21 (20.6%) |
| 75 Years and over | 70 (54.7%) | 31 (38.3%) |
Disability Class: Self-Care Difficulty
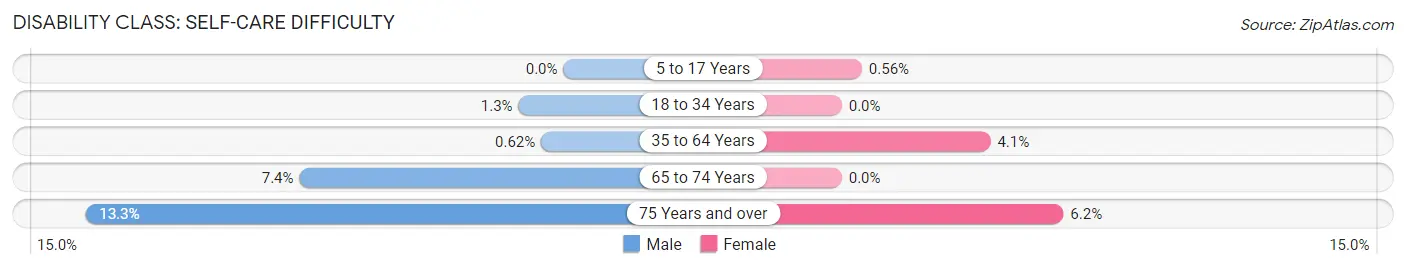
| Age Bracket | Male | Female |
| 5 to 17 Years | 0 (0.0%) | 2 (0.6%) |
| 18 to 34 Years | 5 (1.3%) | 0 (0.0%) |
| 35 to 64 Years | 3 (0.6%) | 19 (4.1%) |
| 65 to 74 Years | 5 (7.3%) | 0 (0.0%) |
| 75 Years and over | 17 (13.3%) | 5 (6.2%) |
Technology Access in Mannford
Computing Device Access in Mannford
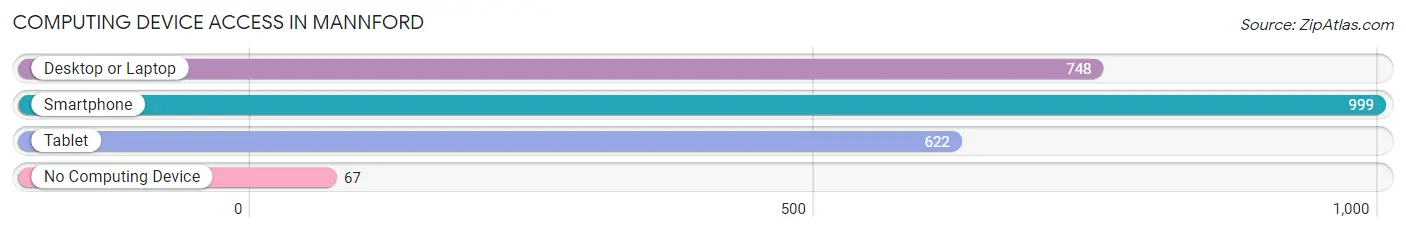
| Device Type | # Households | % Households |
| Desktop or Laptop | 748 | 65.0% |
| Smartphone | 999 | 86.8% |
| Tablet | 622 | 54.0% |
| No Computing Device | 67 | 5.8% |
| Total | 1,151 | 100.0% |
Internet Access in Mannford
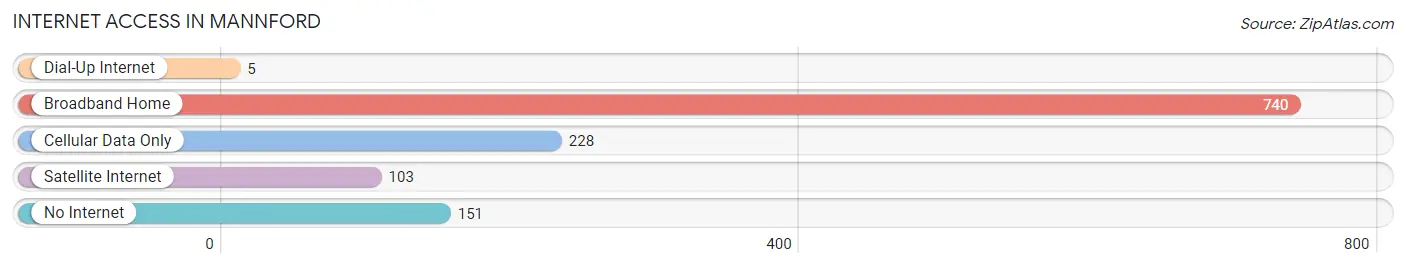
| Internet Type | # Households | % Households |
| Dial-Up Internet | 5 | 0.4% |
| Broadband Home | 740 | 64.3% |
| Cellular Data Only | 228 | 19.8% |
| Satellite Internet | 103 | 8.9% |
| No Internet | 151 | 13.1% |
| Total | 1,151 | 100.0% |
Mannford Summary
Mannford is a city located in Creek County, Oklahoma, United States. It is situated on the banks of Keystone Lake, a reservoir on the Arkansas River. The population was 2,073 at the 2010 census, an increase of 11.3 percent from 1,868 at the 2000 census.
History
Mannford was founded in 1912 by the Mann brothers, who were looking for a place to settle and start a farm. The town was named after the brothers, and the post office was established in 1913. The town grew slowly, but by the 1930s it had become a thriving community with a population of over 500.
In the 1940s, the U.S. Army Corps of Engineers began construction of Keystone Dam, which created Keystone Lake. The lake provided a source of recreation and economic development for the area, and the town grew rapidly. By the 1950s, Mannford had become a popular tourist destination, and the population had grown to over 1,000.
Geography
Mannford is located in Creek County, Oklahoma, at (36.0050, -96.4667). It is situated on the banks of Keystone Lake, a reservoir on the Arkansas River. According to the United States Census Bureau, the city has a total area of 2.2 square miles (5.7 km2), of which 2.1 square miles (5.4 km2) is land and 0.1 square mile (0.3 km2) (4.55%) is water.
Economy
Mannford's economy is largely based on tourism and recreation. The city is home to several marinas, campgrounds, and other recreational facilities. The city also has a number of retail stores, restaurants, and other businesses.
Demographics
As of the census of 2000, there were 1,868 people, 745 households, and 517 families residing in the city. The population density was 890.2 people per square mile (344.3/km2). There were 845 housing units at an average density of 400.2 per square mile (154.5/km2). The racial makeup of the city was 87.45% White, 0.64% African American, 5.90% Native American, 0.05% Asian, 0.05% Pacific Islander, 0.43% from other races, and 5.98% from two or more races. Hispanic or Latino of any race were 1.45% of the population.
There were 745 households out of which 33.2% had children under the age of 18 living with them, 51.7% were married couples living together, 12.2% had a female householder with no husband present, and 31.7% were non-families. 28.2% of all households were made up of individuals and 14.2% had someone living alone who was 65 years of age or older. The average household size was 2.50 and the average family size was 3.06.
In the city, the population was spread out with 28.2% under the age of 18, 8.2% from 18 to 24, 26.2% from 25 to 44, 22.2% from 45 to 64, and 15.2% who were 65 years of age or older. The median age was 36 years. For every 100 females, there were 93.2 males. For every 100 females age 18 and over, there were 88.2 males.
The median income for a household in the city was $27,917, and the median income for a family was $32,917. Males had a median income of $27,500 versus $20,000 for females. The per capita income for the city was $14,845. About 11.2% of families and 14.2% of the population were below the poverty line, including 17.2% of those under age 18 and 11.2% of those age 65 or over.
Common Questions
What is Per Capita Income in Mannford?
Per Capita income in Mannford is $25,535.
What is the Median Family Income in Mannford?
Median Family Income in Mannford is $72,824.
What is the Median Household income in Mannford?
Median Household Income in Mannford is $60,125.
What is Income or Wage Gap in Mannford?
Income or Wage Gap in Mannford is 47.9%.
Women in Mannford earn 52.1 cents for every dollar earned by a man.
What is Inequality or Gini Index in Mannford?
Inequality or Gini Index in Mannford is 0.39.
What is the Total Population of Mannford?
Total Population of Mannford is 3,275.
What is the Total Male Population of Mannford?
Total Male Population of Mannford is 1,684.
What is the Total Female Population of Mannford?
Total Female Population of Mannford is 1,591.
What is the Ratio of Males per 100 Females in Mannford?
There are 105.85 Males per 100 Females in Mannford.
What is the Ratio of Females per 100 Males in Mannford?
There are 94.48 Females per 100 Males in Mannford.
What is the Median Population Age in Mannford?
Median Population Age in Mannford is 30.1 Years.
What is the Average Family Size in Mannford
Average Family Size in Mannford is 3.4 People.
What is the Average Household Size in Mannford
Average Household Size in Mannford is 2.8 People.
How Large is the Labor Force in Mannford?
There are 1,417 People in the Labor Forcein in Mannford.
What is the Percentage of People in the Labor Force in Mannford?
60.6% of People are in the Labor Force in Mannford.
What is the Unemployment Rate in Mannford?
Unemployment Rate in Mannford is 1.9%.