Krebs, OK Map & Demographics
Krebs Map
Krebs Overview
$23,696
PER CAPITA INCOME
$49,583
AVG FAMILY INCOME
$45,761
AVG HOUSEHOLD INCOME
45.8%
WAGE / INCOME GAP [ % ]
54.2¢/ $1
WAGE / INCOME GAP [ $ ]
$6,043
FAMILY INCOME DEFICIT
0.39
INEQUALITY / GINI INDEX
1,994
TOTAL POPULATION
947
MALE POPULATION
1,047
FEMALE POPULATION
90.45
MALES / 100 FEMALES
110.56
FEMALES / 100 MALES
37.6
MEDIAN AGE
2.8
AVG FAMILY SIZE
2.3
AVG HOUSEHOLD SIZE
783
LABOR FORCE [ PEOPLE ]
50.1%
PERCENT IN LABOR FORCE
5.2%
UNEMPLOYMENT RATE
Krebs Zip Codes
Krebs Area Codes
Income in Krebs
Income Overview in Krebs
Per Capita Income in Krebs is $23,696, while median incomes of families and households are $49,583 and $45,761 respectively.
| Characteristic | Number | Measure |
| Per Capita Income | 1,994 | $23,696 |
| Median Family Income | 552 | $49,583 |
| Mean Family Income | 552 | $59,333 |
| Median Household Income | 864 | $45,761 |
| Mean Household Income | 864 | $54,240 |
| Income Deficit | 552 | $6,043 |
| Wage / Income Gap (%) | 1,994 | 45.75% |
| Wage / Income Gap ($) | 1,994 | 54.25¢ per $1 |
| Gini / Inequality Index | 1,994 | 0.39 |
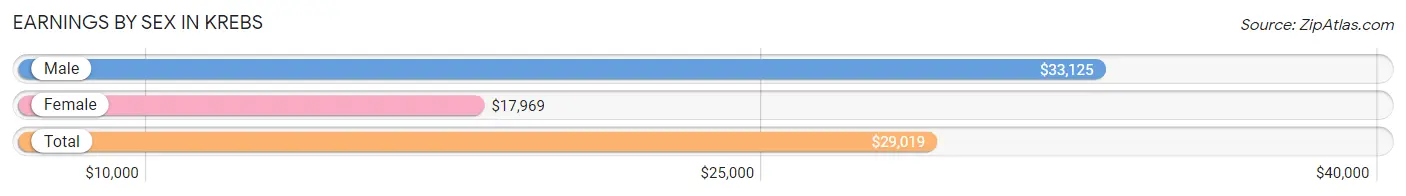
Earnings by Sex in Krebs
Average Earnings in Krebs are $29,019, $33,125 for men and $17,969 for women, a difference of 45.8%.
| Sex | Number | Average Earnings |
| Male | 439 (46.3%) | $33,125 |
| Female | 510 (53.7%) | $17,969 |
| Total | 949 (100.0%) | $29,019 |
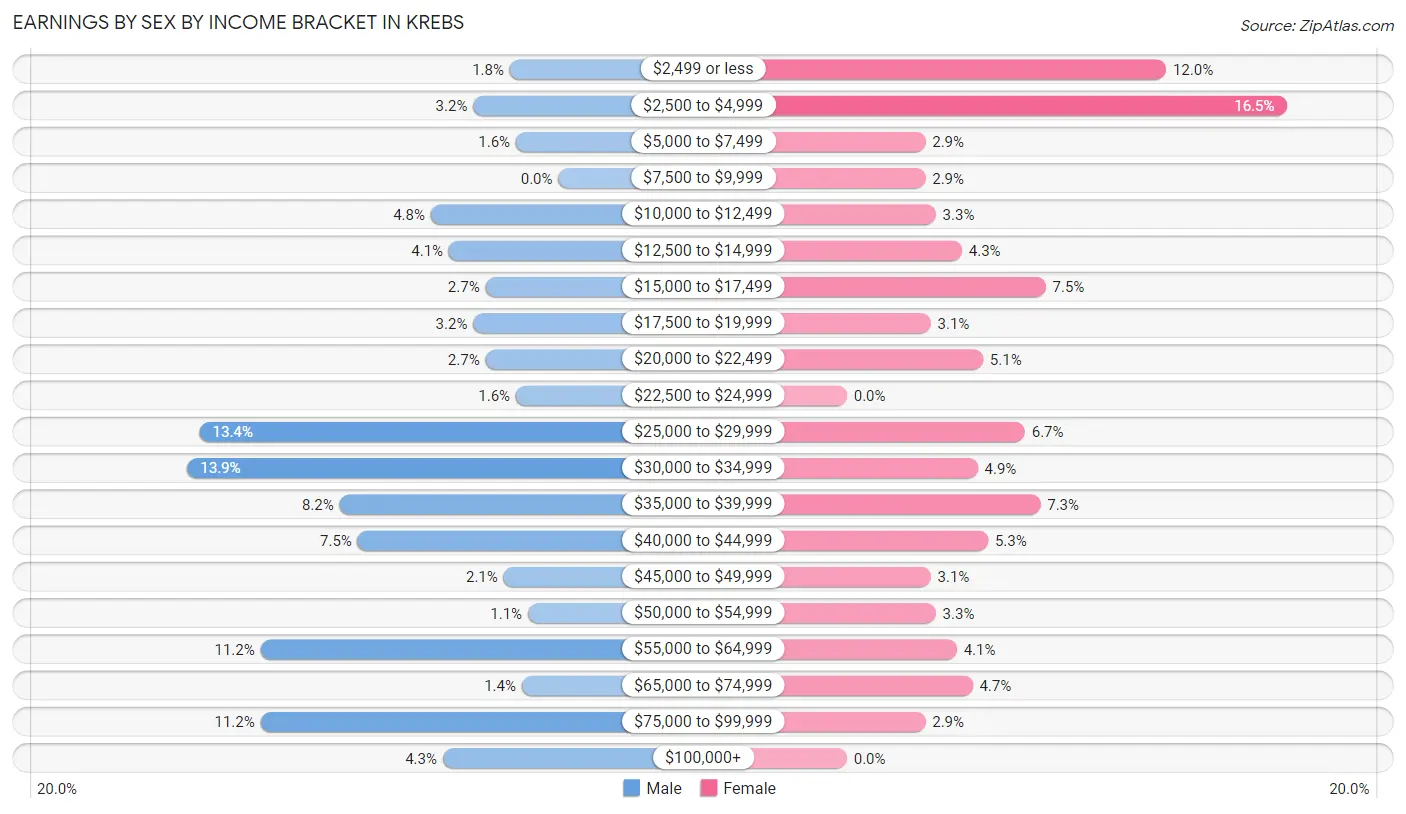
Earnings by Sex by Income Bracket in Krebs
The most common earnings brackets in Krebs are $30,000 to $34,999 for men (61 | 13.9%) and $2,500 to $4,999 for women (84 | 16.5%).
| Income | Male | Female |
| $2,499 or less | 8 (1.8%) | 61 (12.0%) |
| $2,500 to $4,999 | 14 (3.2%) | 84 (16.5%) |
| $5,000 to $7,499 | 7 (1.6%) | 15 (2.9%) |
| $7,500 to $9,999 | 0 (0.0%) | 15 (2.9%) |
| $10,000 to $12,499 | 21 (4.8%) | 17 (3.3%) |
| $12,500 to $14,999 | 18 (4.1%) | 22 (4.3%) |
| $15,000 to $17,499 | 12 (2.7%) | 38 (7.4%) |
| $17,500 to $19,999 | 14 (3.2%) | 16 (3.1%) |
| $20,000 to $22,499 | 12 (2.7%) | 26 (5.1%) |
| $22,500 to $24,999 | 7 (1.6%) | 0 (0.0%) |
| $25,000 to $29,999 | 59 (13.4%) | 34 (6.7%) |
| $30,000 to $34,999 | 61 (13.9%) | 25 (4.9%) |
| $35,000 to $39,999 | 36 (8.2%) | 37 (7.2%) |
| $40,000 to $44,999 | 33 (7.5%) | 27 (5.3%) |
| $45,000 to $49,999 | 9 (2.1%) | 16 (3.1%) |
| $50,000 to $54,999 | 5 (1.1%) | 17 (3.3%) |
| $55,000 to $64,999 | 49 (11.2%) | 21 (4.1%) |
| $65,000 to $74,999 | 6 (1.4%) | 24 (4.7%) |
| $75,000 to $99,999 | 49 (11.2%) | 15 (2.9%) |
| $100,000+ | 19 (4.3%) | 0 (0.0%) |
| Total | 439 (100.0%) | 510 (100.0%) |
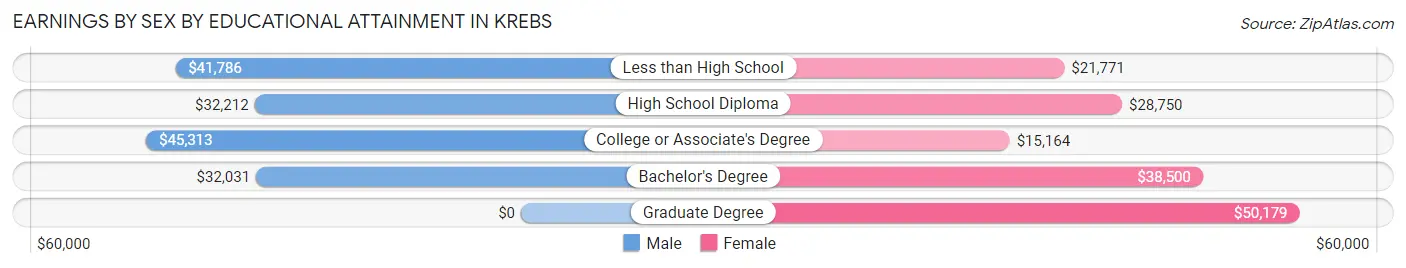
Earnings by Sex by Educational Attainment in Krebs
Average earnings in Krebs are $35,481 for men and $20,048 for women, a difference of 43.5%. Men with an educational attainment of college or associate's degree enjoy the highest average annual earnings of $45,313, while those with bachelor's degree education earn the least with $32,031. Women with an educational attainment of graduate degree earn the most with the average annual earnings of $50,179, while those with college or associate's degree education have the smallest earnings of $15,164.
| Educational Attainment | Male Income | Female Income |
| Less than High School | $41,786 | $21,771 |
| High School Diploma | $32,212 | $28,750 |
| College or Associate's Degree | $45,313 | $15,164 |
| Bachelor's Degree | $32,031 | $38,500 |
| Graduate Degree | - | - |
| Total | $35,481 | $20,048 |
Family Income in Krebs
Family Income Brackets in Krebs
According to the Krebs family income data, there are 115 families falling into the $50,000 to $74,999 income range, which is the most common income bracket and makes up 20.8% of all families.
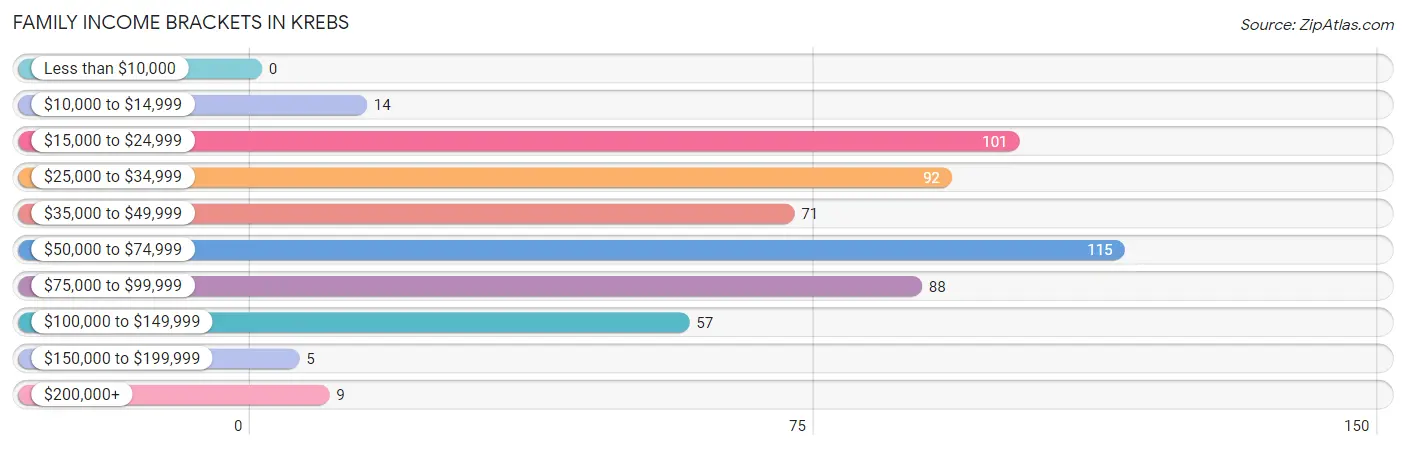
| Income Bracket | # Families | % Families |
| Less than $10,000 | 0 | 0.0% |
| $10,000 to $14,999 | 14 | 2.5% |
| $15,000 to $24,999 | 101 | 18.3% |
| $25,000 to $34,999 | 92 | 16.7% |
| $35,000 to $49,999 | 71 | 12.9% |
| $50,000 to $74,999 | 115 | 20.8% |
| $75,000 to $99,999 | 88 | 15.9% |
| $100,000 to $149,999 | 57 | 10.3% |
| $150,000 to $199,999 | 5 | 0.9% |
| $200,000+ | 9 | 1.6% |
Family Income by Famaliy Size in Krebs
4-person families (39 | 7.1%) account for the highest median family income in Krebs with $97,750 per family, while 2-person families (187 | 33.9%) have the highest median income of $26,648 per family member.
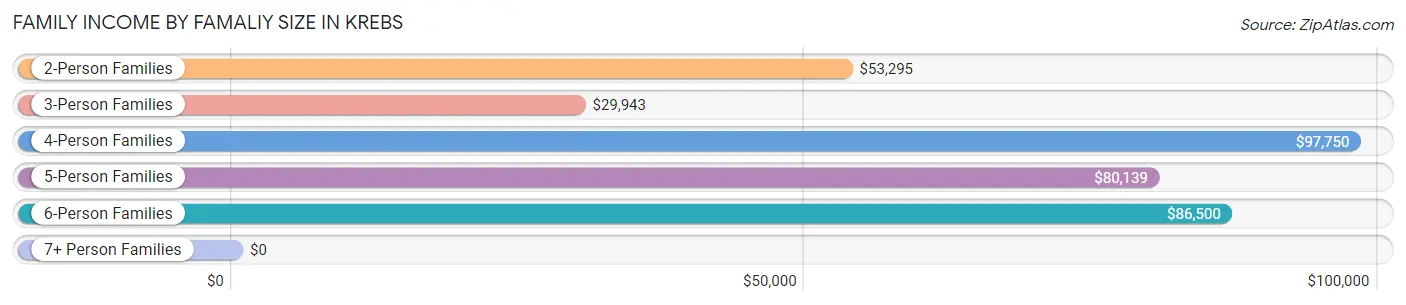
| Income Bracket | # Families | Median Income |
| 2-Person Families | 187 (33.9%) | $53,295 |
| 3-Person Families | 252 (45.7%) | $29,943 |
| 4-Person Families | 39 (7.1%) | $97,750 |
| 5-Person Families | 58 (10.5%) | $80,139 |
| 6-Person Families | 16 (2.9%) | $86,500 |
| 7+ Person Families | 0 (0.0%) | $0 |
| Total | 552 (100.0%) | $49,583 |
Family Income by Number of Earners in Krebs
The median family income in Krebs is $49,583, with families comprising 3+ earners (35) having the highest median family income of $103,750, while families with no earners (83) have the lowest median family income of $46,635, accounting for 6.3% and 15.0% of families, respectively.
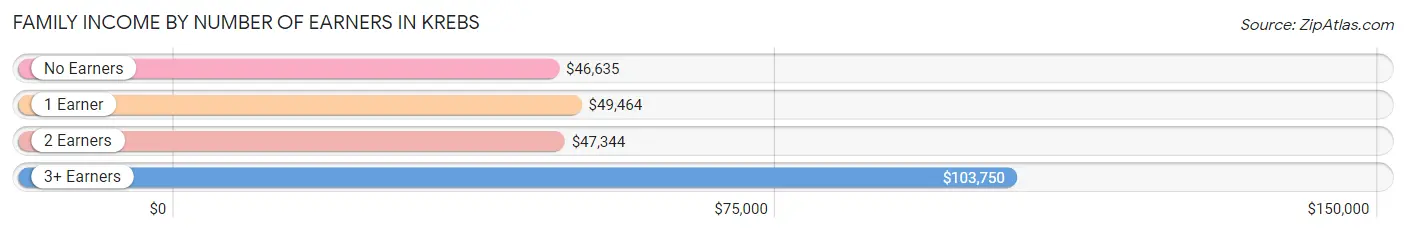
| Number of Earners | # Families | Median Income |
| No Earners | 83 (15.0%) | $46,635 |
| 1 Earner | 239 (43.3%) | $49,464 |
| 2 Earners | 195 (35.3%) | $47,344 |
| 3+ Earners | 35 (6.3%) | $103,750 |
| Total | 552 (100.0%) | $49,583 |
Household Income in Krebs
Household Income Brackets in Krebs
With 178 households falling in the category, the $50,000 to $74,999 income range is the most frequent in Krebs, accounting for 20.6% of all households. In contrast, only 9 households (1.0%) fall into the $200,000+ income bracket, making it the least populous group.
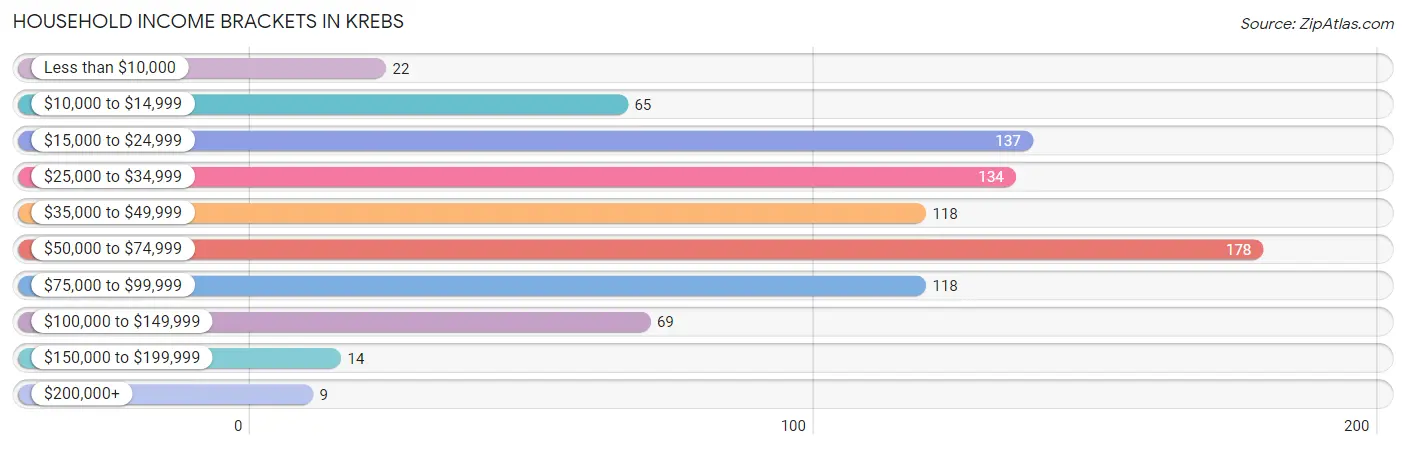
| Income Bracket | # Households | % Households |
| Less than $10,000 | 22 | 2.5% |
| $10,000 to $14,999 | 65 | 7.5% |
| $15,000 to $24,999 | 137 | 15.9% |
| $25,000 to $34,999 | 134 | 15.5% |
| $35,000 to $49,999 | 118 | 13.7% |
| $50,000 to $74,999 | 178 | 20.6% |
| $75,000 to $99,999 | 118 | 13.7% |
| $100,000 to $149,999 | 69 | 8.0% |
| $150,000 to $199,999 | 14 | 1.6% |
| $200,000+ | 9 | 1.0% |
Household Income by Householder Age in Krebs
The median household income in Krebs is $45,761, with the highest median household income of $55,833 found in the 25 to 44 years age bracket for the primary householder. A total of 276 households (31.9%) fall into this category. Meanwhile, the 65+ years age bracket for the primary householder has the lowest median household income of $29,193, with 251 households (29.0%) in this group.
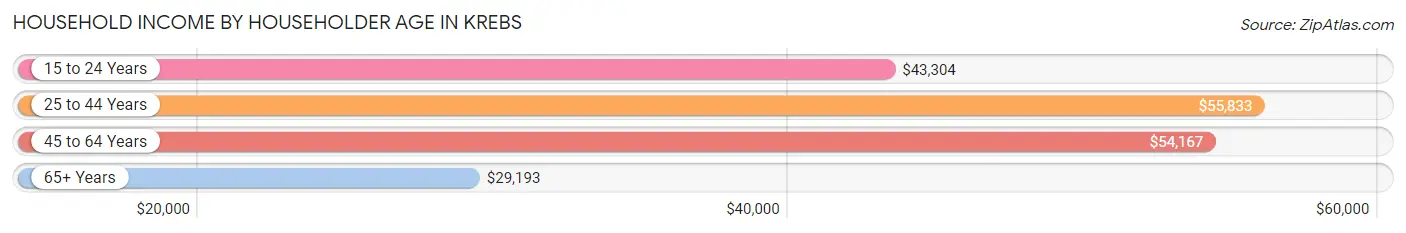
| Income Bracket | # Households | Median Income |
| 15 to 24 Years | 49 (5.7%) | $43,304 |
| 25 to 44 Years | 276 (31.9%) | $55,833 |
| 45 to 64 Years | 288 (33.3%) | $54,167 |
| 65+ Years | 251 (29.0%) | $29,193 |
| Total | 864 (100.0%) | $45,761 |
Poverty in Krebs
Income Below Poverty by Sex and Age in Krebs
With 17.1% poverty level for males and 17.6% for females among the residents of Krebs, 15 year old males and 5 year old females are the most vulnerable to poverty, with 24 males (54.5%) and 7 females (58.3%) in their respective age groups living below the poverty level.
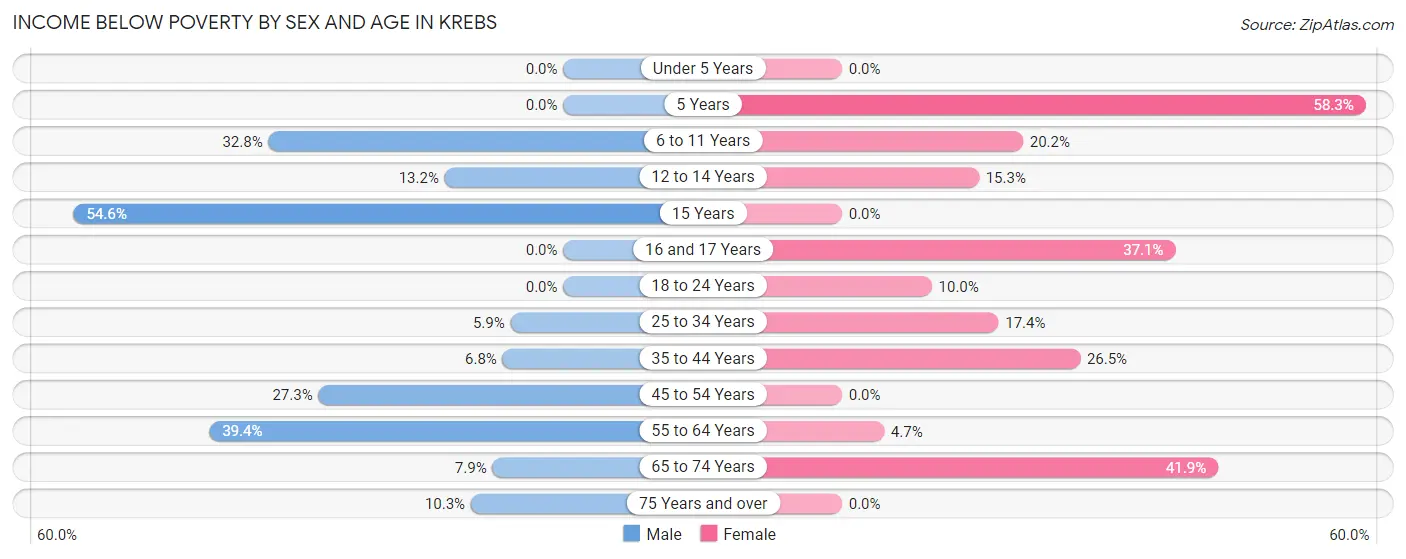
| Age Bracket | Male | Female |
| Under 5 Years | 0 (0.0%) | 0 (0.0%) |
| 5 Years | 0 (0.0%) | 7 (58.3%) |
| 6 to 11 Years | 22 (32.8%) | 25 (20.2%) |
| 12 to 14 Years | 7 (13.2%) | 9 (15.2%) |
| 15 Years | 24 (54.5%) | 0 (0.0%) |
| 16 and 17 Years | 0 (0.0%) | 13 (37.1%) |
| 18 to 24 Years | 0 (0.0%) | 5 (10.0%) |
| 25 to 34 Years | 5 (5.9%) | 19 (17.4%) |
| 35 to 44 Years | 14 (6.8%) | 35 (26.5%) |
| 45 to 54 Years | 21 (27.3%) | 0 (0.0%) |
| 55 to 64 Years | 56 (39.4%) | 9 (4.7%) |
| 65 to 74 Years | 6 (7.9%) | 62 (41.9%) |
| 75 Years and over | 7 (10.3%) | 0 (0.0%) |
| Total | 162 (17.1%) | 184 (17.6%) |
Income Above Poverty by Sex and Age in Krebs
According to the poverty statistics in Krebs, males aged under 5 years and females aged under 5 years are the age groups that are most secure financially, with 100.0% of males and 100.0% of females in these age groups living above the poverty line.
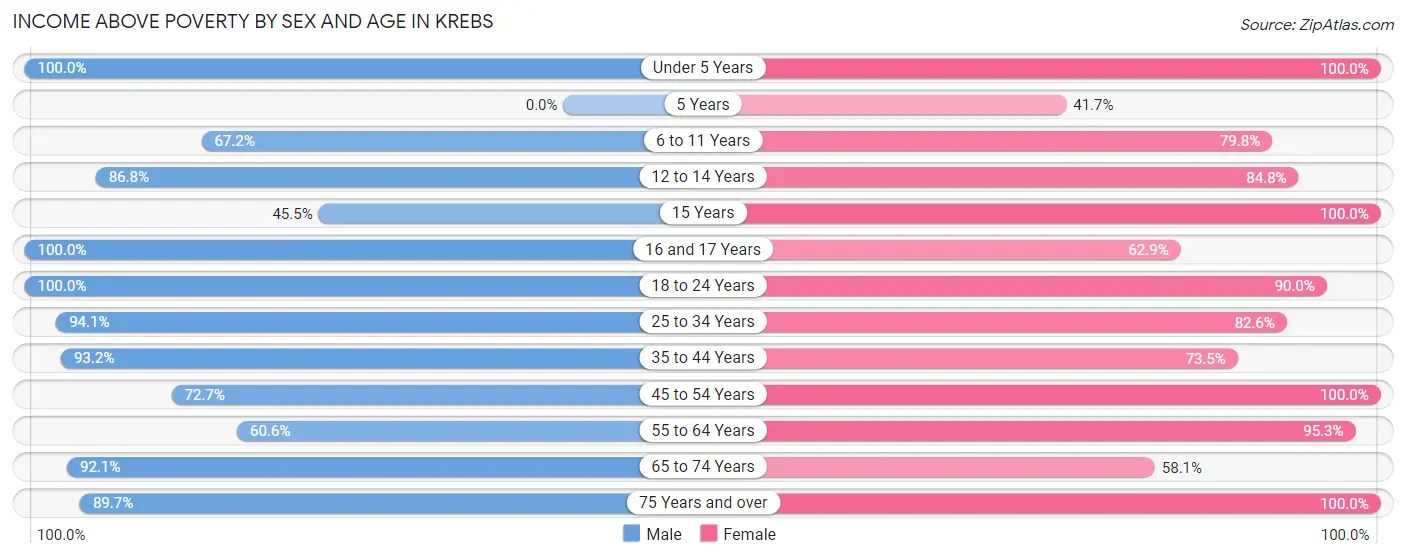
| Age Bracket | Male | Female |
| Under 5 Years | 10 (100.0%) | 53 (100.0%) |
| 5 Years | 0 (0.0%) | 5 (41.7%) |
| 6 to 11 Years | 45 (67.2%) | 99 (79.8%) |
| 12 to 14 Years | 46 (86.8%) | 50 (84.8%) |
| 15 Years | 20 (45.5%) | 9 (100.0%) |
| 16 and 17 Years | 42 (100.0%) | 22 (62.9%) |
| 18 to 24 Years | 76 (100.0%) | 45 (90.0%) |
| 25 to 34 Years | 80 (94.1%) | 90 (82.6%) |
| 35 to 44 Years | 193 (93.2%) | 97 (73.5%) |
| 45 to 54 Years | 56 (72.7%) | 84 (100.0%) |
| 55 to 64 Years | 86 (60.6%) | 183 (95.3%) |
| 65 to 74 Years | 70 (92.1%) | 86 (58.1%) |
| 75 Years and over | 61 (89.7%) | 40 (100.0%) |
| Total | 785 (82.9%) | 863 (82.4%) |
Income Below Poverty Among Married-Couple Families in Krebs
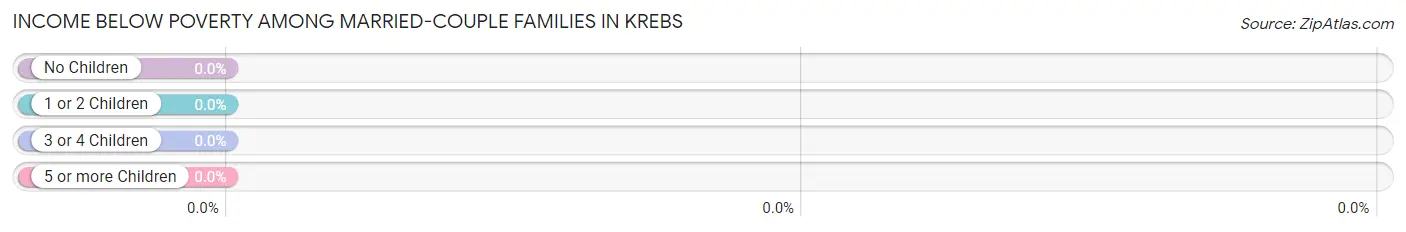
| Children | Above Poverty | Below Poverty |
| No Children | 172 (100.0%) | 0 (0.0%) |
| 1 or 2 Children | 88 (100.0%) | 0 (0.0%) |
| 3 or 4 Children | 50 (100.0%) | 0 (0.0%) |
| 5 or more Children | 0 (0.0%) | 0 (0.0%) |
| Total | 310 (100.0%) | 0 (0.0%) |
Income Below Poverty Among Single-Parent Households in Krebs
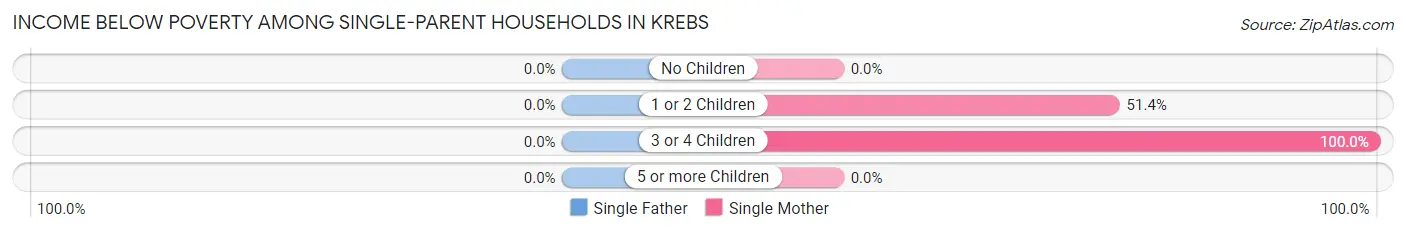
| Children | Single Father | Single Mother |
| No Children | 0 (0.0%) | 0 (0.0%) |
| 1 or 2 Children | 0 (0.0%) | 91 (51.4%) |
| 3 or 4 Children | 0 (0.0%) | 7 (100.0%) |
| 5 or more Children | 0 (0.0%) | 0 (0.0%) |
| Total | 0 (0.0%) | 98 (47.8%) |
Income Below Poverty Among Married-Couple vs Single-Parent Households in Krebs
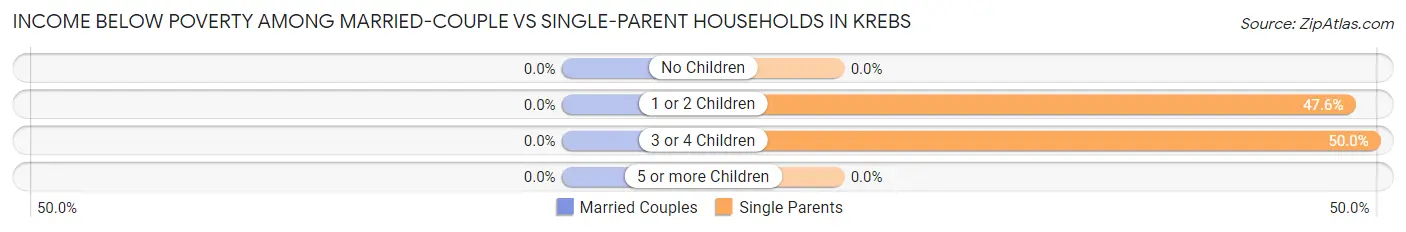
| Children | Married-Couple Families | Single-Parent Households |
| No Children | 0 (0.0%) | 0 (0.0%) |
| 1 or 2 Children | 0 (0.0%) | 91 (47.6%) |
| 3 or 4 Children | 0 (0.0%) | 7 (50.0%) |
| 5 or more Children | 0 (0.0%) | 0 (0.0%) |
| Total | 0 (0.0%) | 98 (40.5%) |
Race in Krebs
The most populous races in Krebs are White / Caucasian (1,486 | 74.5%), Two or more Races (404 | 20.3%), and Hispanic or Latino (115 | 5.8%).
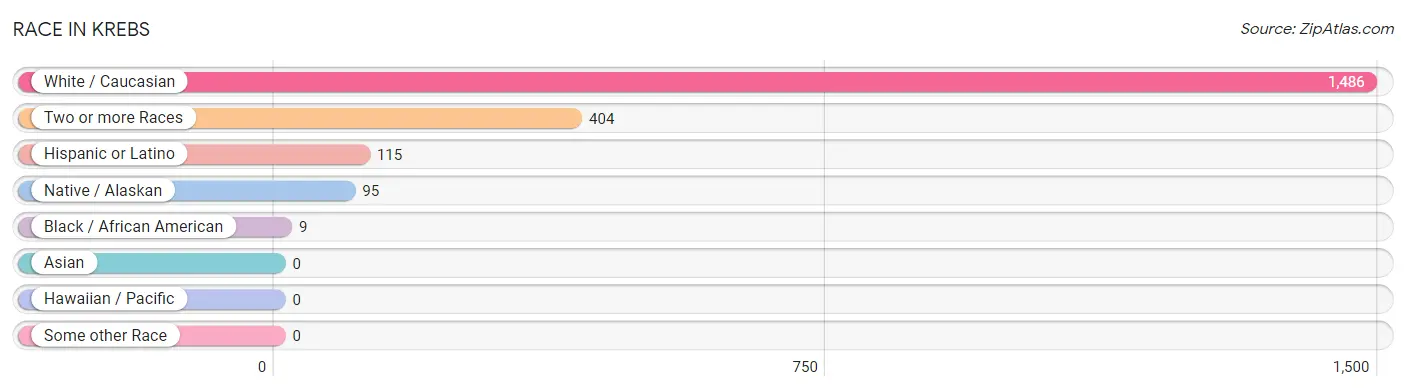
| Race | # Population | % Population |
| Asian | 0 | 0.0% |
| Black / African American | 9 | 0.4% |
| Hawaiian / Pacific | 0 | 0.0% |
| Hispanic or Latino | 115 | 5.8% |
| Native / Alaskan | 95 | 4.8% |
| White / Caucasian | 1,486 | 74.5% |
| Two or more Races | 404 | 20.3% |
| Some other Race | 0 | 0.0% |
| Total | 1,994 | 100.0% |
Ancestry in Krebs
The most populous ancestries reported in Krebs are German (408 | 20.5%), Irish (342 | 17.2%), Italian (237 | 11.9%), Choctaw (228 | 11.4%), and English (159 | 8.0%), together accounting for 68.9% of all Krebs residents.
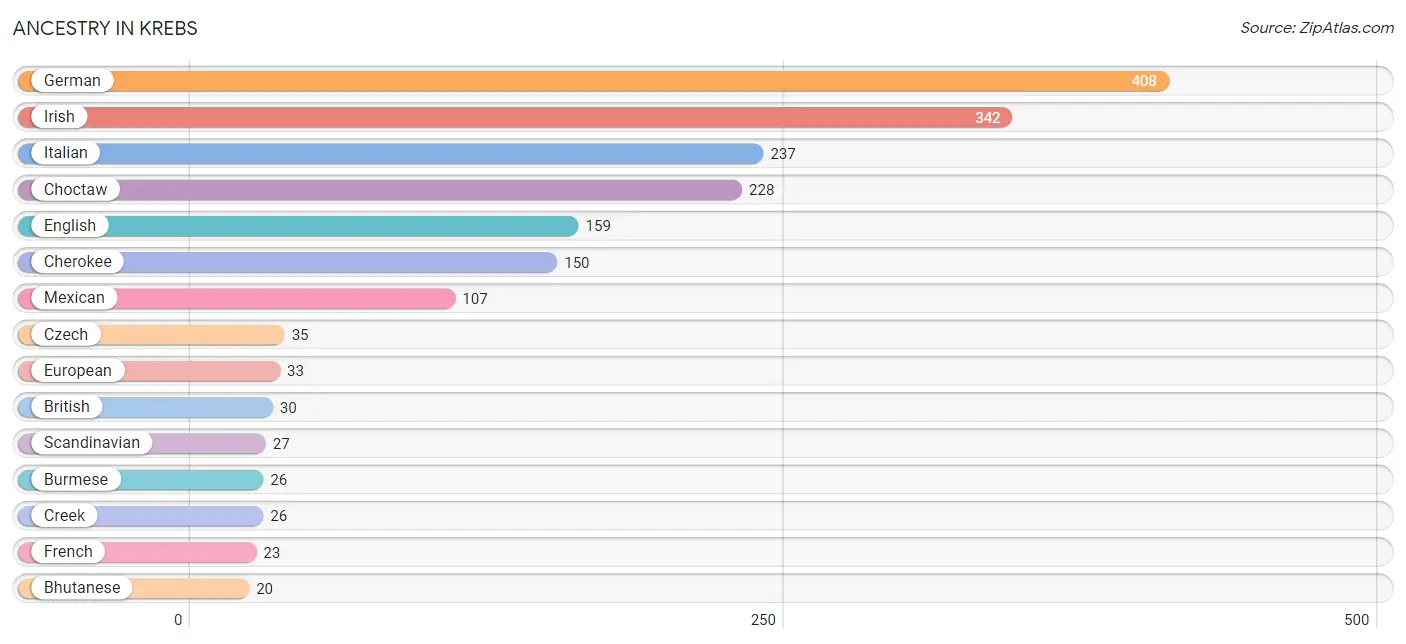
| Ancestry | # Population | % Population |
| American | 6 | 0.3% |
| Apache | 6 | 0.3% |
| Belgian | 1 | 0.1% |
| Bhutanese | 20 | 1.0% |
| British | 30 | 1.5% |
| Burmese | 26 | 1.3% |
| Cherokee | 150 | 7.5% |
| Chickasaw | 20 | 1.0% |
| Choctaw | 228 | 11.4% |
| Creek | 26 | 1.3% |
| Czech | 35 | 1.8% |
| Dutch | 6 | 0.3% |
| Dutch West Indian | 4 | 0.2% |
| English | 159 | 8.0% |
| European | 33 | 1.7% |
| French | 23 | 1.1% |
| German | 408 | 20.5% |
| Hungarian | 6 | 0.3% |
| Irish | 342 | 17.2% |
| Italian | 237 | 11.9% |
| Korean | 4 | 0.2% |
| Mexican | 107 | 5.4% |
| Norwegian | 7 | 0.4% |
| Osage | 12 | 0.6% |
| Polish | 18 | 0.9% |
| Puerto Rican | 8 | 0.4% |
| Scandinavian | 27 | 1.3% |
| Scotch-Irish | 5 | 0.3% |
| Scottish | 17 | 0.9% |
| Swiss | 6 | 0.3% |
| Welsh | 9 | 0.4% | View All 31 Rows |
Immigrants in Krebs
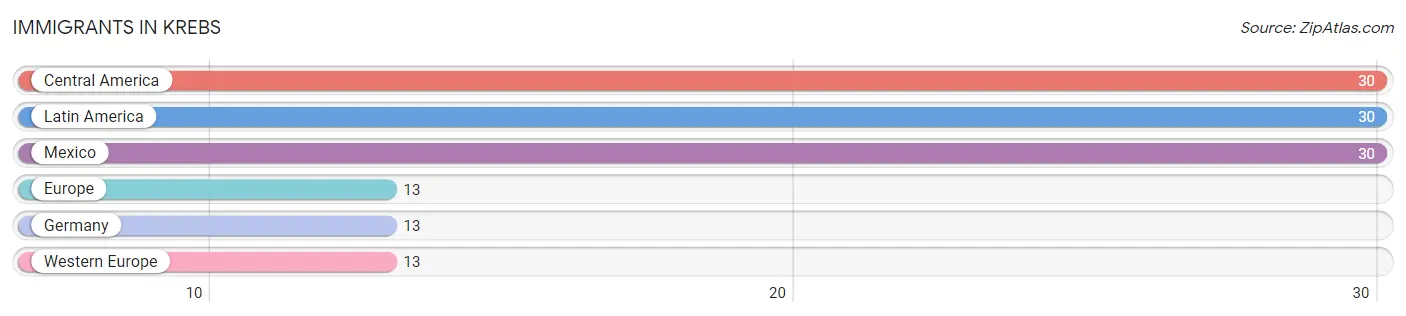
The most numerous immigrant groups reported in Krebs came from Central America (30 | 1.5%), Latin America (30 | 1.5%), Mexico (30 | 1.5%), Europe (13 | 0.6%), and Germany (13 | 0.6%), together accounting for 5.8% of all Krebs residents.
| Immigration Origin | # Population | % Population |
| Central America | 30 | 1.5% |
| Europe | 13 | 0.6% |
| Germany | 13 | 0.6% |
| Latin America | 30 | 1.5% |
| Mexico | 30 | 1.5% |
| Western Europe | 13 | 0.6% | View All 6 Rows |
Sex and Age in Krebs
Sex and Age in Krebs
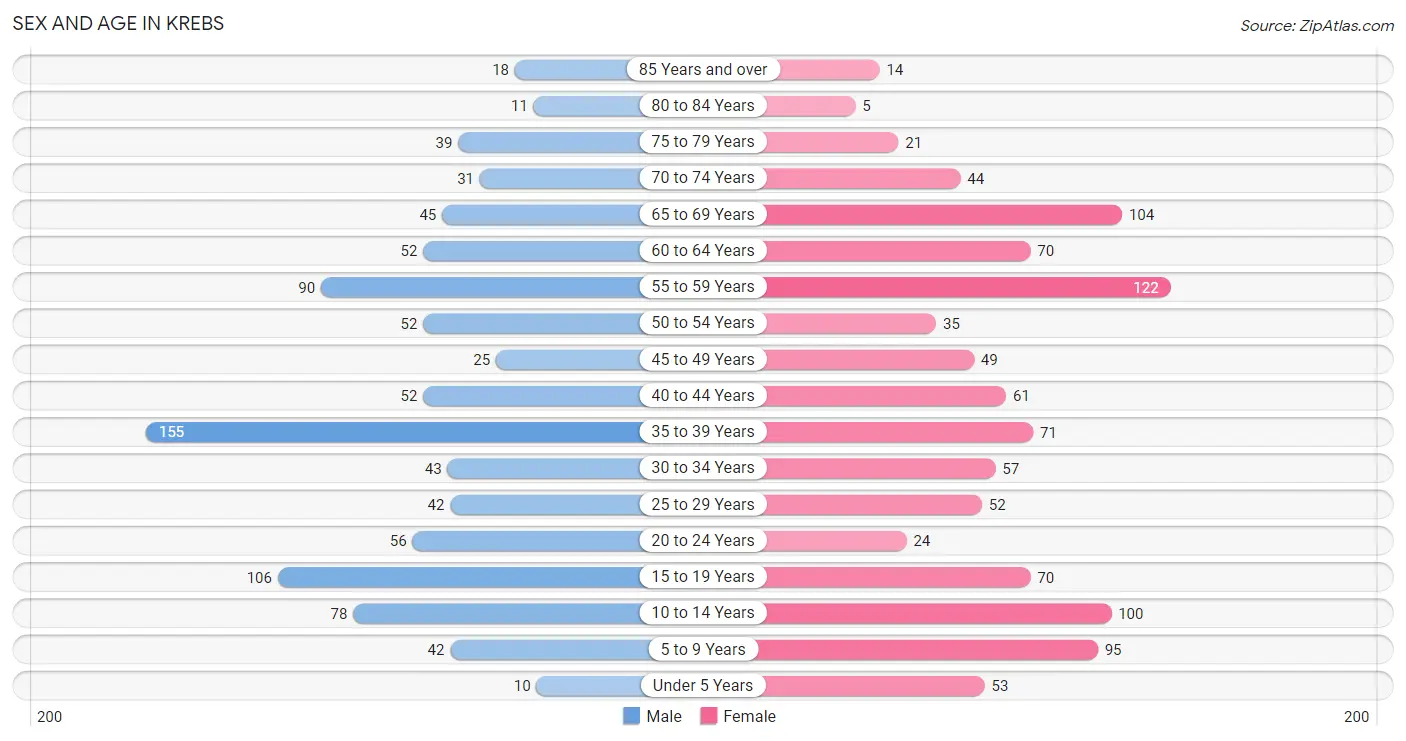
The most populous age groups in Krebs are 35 to 39 Years (155 | 16.4%) for men and 55 to 59 Years (122 | 11.7%) for women.
| Age Bracket | Male | Female |
| Under 5 Years | 10 (1.1%) | 53 (5.1%) |
| 5 to 9 Years | 42 (4.4%) | 95 (9.1%) |
| 10 to 14 Years | 78 (8.2%) | 100 (9.6%) |
| 15 to 19 Years | 106 (11.2%) | 70 (6.7%) |
| 20 to 24 Years | 56 (5.9%) | 24 (2.3%) |
| 25 to 29 Years | 42 (4.4%) | 52 (5.0%) |
| 30 to 34 Years | 43 (4.5%) | 57 (5.4%) |
| 35 to 39 Years | 155 (16.4%) | 71 (6.8%) |
| 40 to 44 Years | 52 (5.5%) | 61 (5.8%) |
| 45 to 49 Years | 25 (2.6%) | 49 (4.7%) |
| 50 to 54 Years | 52 (5.5%) | 35 (3.3%) |
| 55 to 59 Years | 90 (9.5%) | 122 (11.7%) |
| 60 to 64 Years | 52 (5.5%) | 70 (6.7%) |
| 65 to 69 Years | 45 (4.8%) | 104 (9.9%) |
| 70 to 74 Years | 31 (3.3%) | 44 (4.2%) |
| 75 to 79 Years | 39 (4.1%) | 21 (2.0%) |
| 80 to 84 Years | 11 (1.2%) | 5 (0.5%) |
| 85 Years and over | 18 (1.9%) | 14 (1.3%) |
| Total | 947 (100.0%) | 1,047 (100.0%) |
Families and Households in Krebs
Median Family Size in Krebs
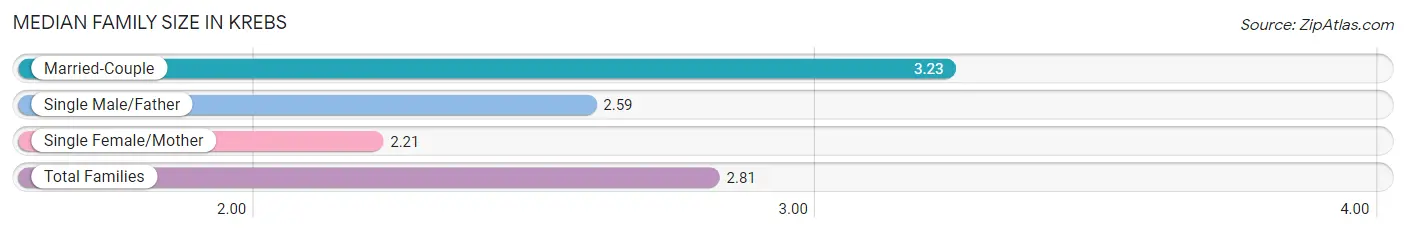
The median family size in Krebs is 2.81 persons per family, with married-couple families (310 | 56.2%) accounting for the largest median family size of 3.23 persons per family. On the other hand, single female/mother families (205 | 37.1%) represent the smallest median family size with 2.21 persons per family.
| Family Type | # Families | Family Size |
| Married-Couple | 310 (56.2%) | 3.23 |
| Single Male/Father | 37 (6.7%) | 2.59 |
| Single Female/Mother | 205 (37.1%) | 2.21 |
| Total Families | 552 (100.0%) | 2.81 |
Median Household Size in Krebs
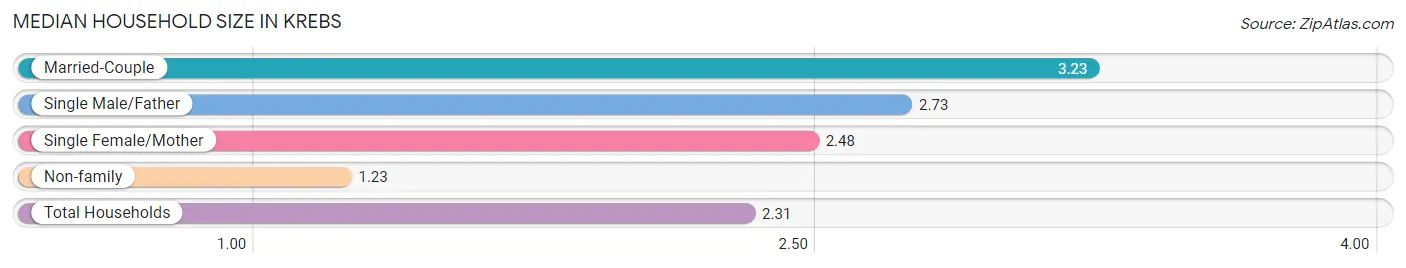
The median household size in Krebs is 2.31 persons per household, with married-couple households (310 | 35.9%) accounting for the largest median household size of 3.23 persons per household. non-family households (312 | 36.1%) represent the smallest median household size with 1.23 persons per household.
| Household Type | # Households | Household Size |
| Married-Couple | 310 (35.9%) | 3.23 |
| Single Male/Father | 37 (4.3%) | 2.73 |
| Single Female/Mother | 205 (23.7%) | 2.48 |
| Non-family | 312 (36.1%) | 1.23 |
| Total Households | 864 (100.0%) | 2.31 |
Household Size by Marriage Status in Krebs
Out of a total of 864 households in Krebs, 552 (63.9%) are family households, while 312 (36.1%) are nonfamily households. The most numerous type of family households are 3-person households, comprising 228, and the most common type of nonfamily households are 1-person households, comprising 235.
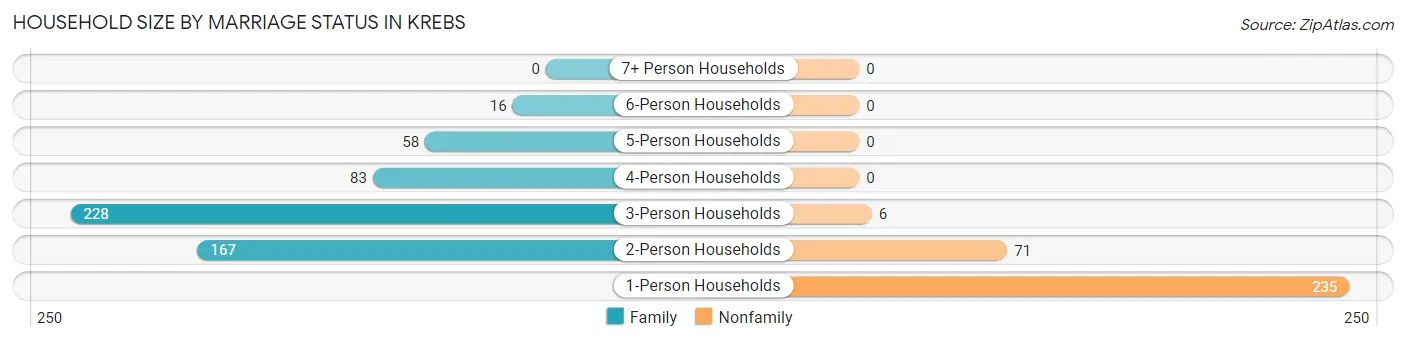
| Household Size | Family Households | Nonfamily Households |
| 1-Person Households | - | 235 (27.2%) |
| 2-Person Households | 167 (19.3%) | 71 (8.2%) |
| 3-Person Households | 228 (26.4%) | 6 (0.7%) |
| 4-Person Households | 83 (9.6%) | 0 (0.0%) |
| 5-Person Households | 58 (6.7%) | 0 (0.0%) |
| 6-Person Households | 16 (1.8%) | 0 (0.0%) |
| 7+ Person Households | 0 (0.0%) | 0 (0.0%) |
| Total | 552 (63.9%) | 312 (36.1%) |
Female Fertility in Krebs
Fertility by Age in Krebs
Average fertility rate in Krebs is 28.0 births per 1,000 women. Women in the age bracket of 20 to 34 years have the highest fertility rate with 83.0 births per 1,000 women. Women in the age bracket of 20 to 34 years acount for 100.0% of all women with births.
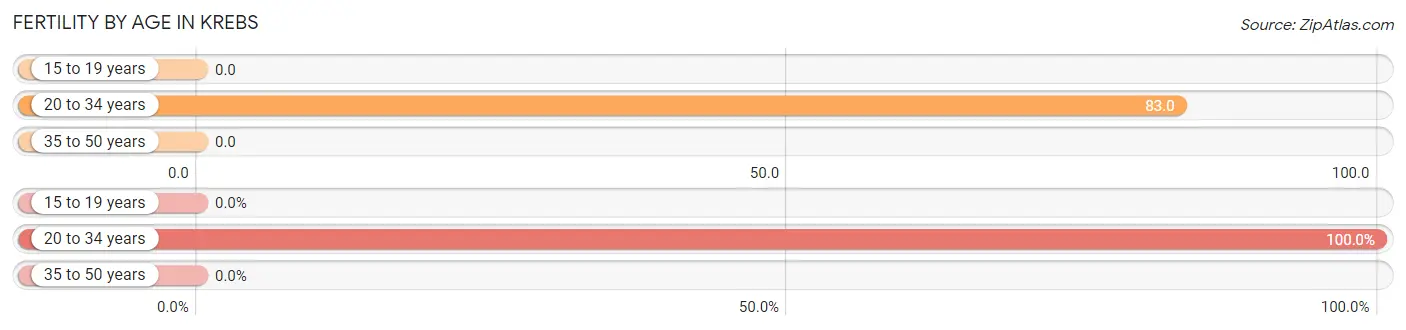
| Age Bracket | Women with Births | Births / 1,000 Women |
| 15 to 19 years | 0 (0.0%) | 0.0 |
| 20 to 34 years | 11 (100.0%) | 83.0 |
| 35 to 50 years | 0 (0.0%) | 0.0 |
| Total | 11 (100.0%) | 28.0 |
Fertility by Age by Marriage Status in Krebs
54.5% of women with births (11) in Krebs are married. The highest percentage of unmarried women with births falls into 20 to 34 years age bracket with 45.5% of them unmarried at the time of birth, while the lowest percentage of unmarried women with births belong to 20 to 34 years age bracket with 45.5% of them unmarried.
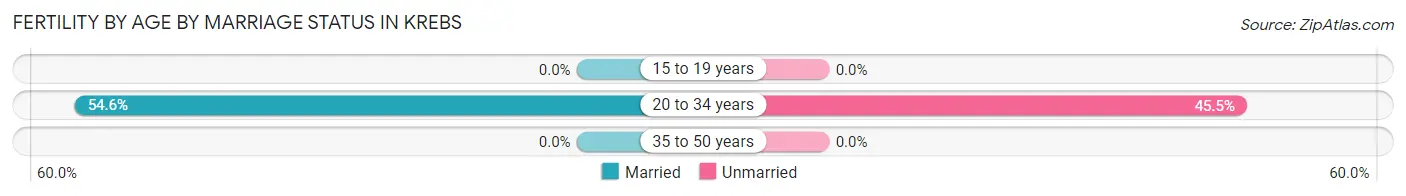
| Age Bracket | Married | Unmarried |
| 15 to 19 years | 0 (0.0%) | 0 (0.0%) |
| 20 to 34 years | 6 (54.5%) | 5 (45.5%) |
| 35 to 50 years | 0 (0.0%) | 0 (0.0%) |
| Total | 6 (54.5%) | 5 (45.5%) |
Fertility by Education in Krebs
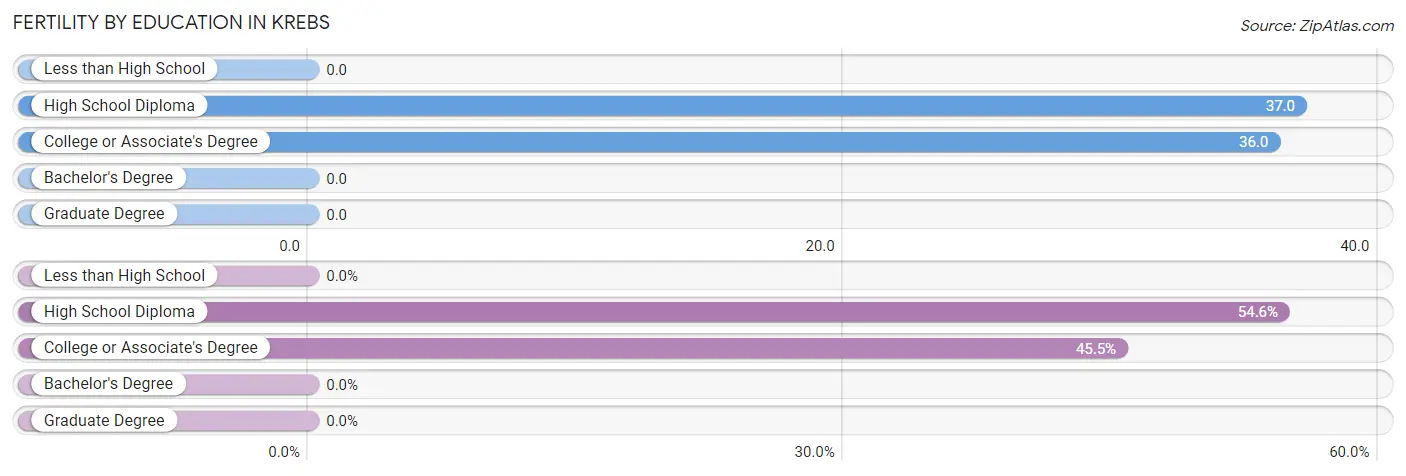
| Educational Attainment | Women with Births | Births / 1,000 Women |
| Less than High School | 0 (0.0%) | 0.0 |
| High School Diploma | 6 (54.5%) | 37.0 |
| College or Associate's Degree | 5 (45.5%) | 36.0 |
| Bachelor's Degree | 0 (0.0%) | 0.0 |
| Graduate Degree | 0 (0.0%) | 0.0 |
| Total | 11 (100.0%) | 28.0 |
Fertility by Education by Marriage Status in Krebs
45.5% of women with births in Krebs are unmarried. Women with the educational attainment of high school diploma are most likely to be married with 100.0% of them married at childbirth, while women with the educational attainment of college or associate's degree are least likely to be married with 100.0% of them unmarried at childbirth.
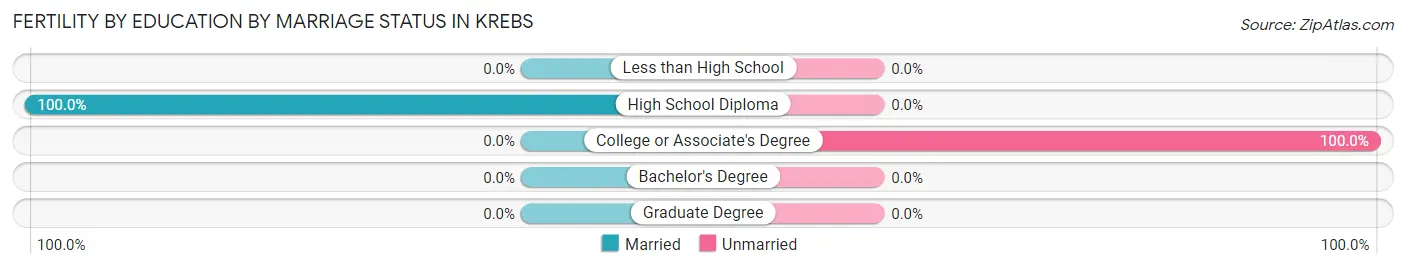
| Educational Attainment | Married | Unmarried |
| Less than High School | 0 (0.0%) | 0 (0.0%) |
| High School Diploma | 6 (100.0%) | 0 (0.0%) |
| College or Associate's Degree | 0 (0.0%) | 5 (100.0%) |
| Bachelor's Degree | 0 (0.0%) | 0 (0.0%) |
| Graduate Degree | 0 (0.0%) | 0 (0.0%) |
| Total | 6 (54.5%) | 5 (45.5%) |
Employment Characteristics in Krebs
Employment by Class of Employer in Krebs
Among the 693 employed individuals in Krebs, private company employees (488 | 70.4%), state government employees (64 | 9.2%), and federal government employees (50 | 7.2%) make up the most common classes of employment.
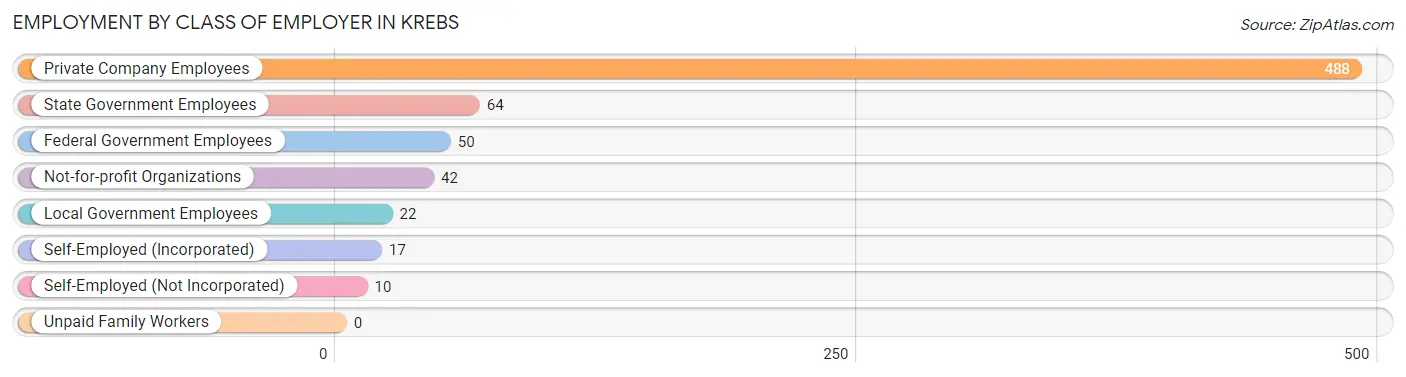
| Employer Class | # Employees | % Employees |
| Private Company Employees | 488 | 70.4% |
| Self-Employed (Incorporated) | 17 | 2.5% |
| Self-Employed (Not Incorporated) | 10 | 1.4% |
| Not-for-profit Organizations | 42 | 6.1% |
| Local Government Employees | 22 | 3.2% |
| State Government Employees | 64 | 9.2% |
| Federal Government Employees | 50 | 7.2% |
| Unpaid Family Workers | 0 | 0.0% |
| Total | 693 | 100.0% |
Employment Status by Age in Krebs
According to the labor force statistics for Krebs, out of the total population over 16 years of age (1,563), 50.1% or 783 individuals are in the labor force, with 5.2% or 41 of them unemployed. The age group with the highest labor force participation rate is 20 to 24 years, with 85.0% or 68 individuals in the labor force. Within the labor force, the 55 to 59 years age range has the highest percentage of unemployed individuals, with 15.5% or 16 of them being unemployed.
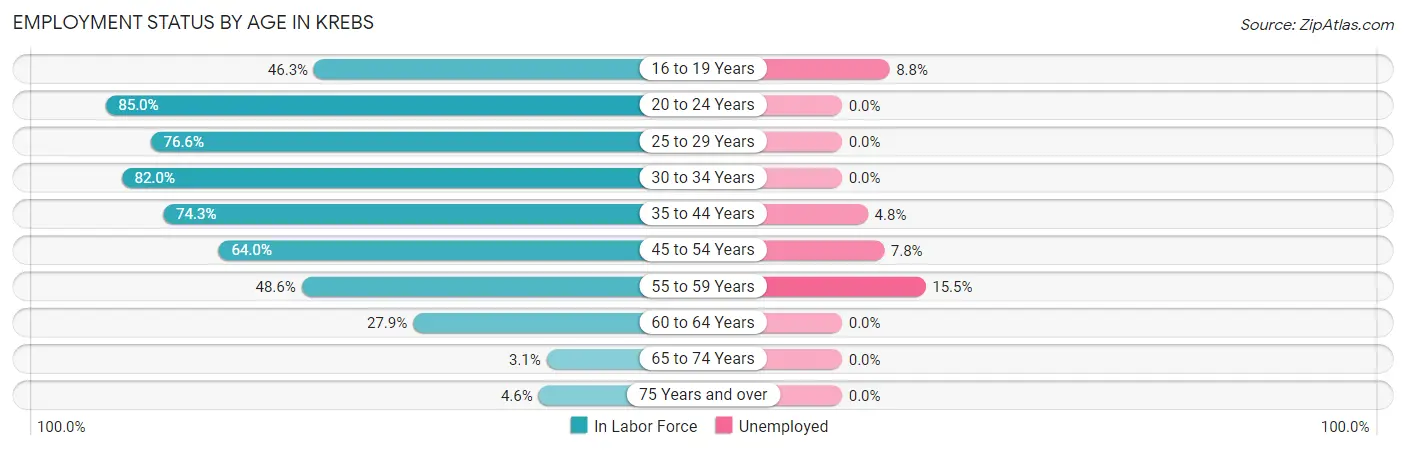
| Age Bracket | In Labor Force | Unemployed |
| 16 to 19 Years | 57 (46.3%) | 5 (8.8%) |
| 20 to 24 Years | 68 (85.0%) | 0 (0.0%) |
| 25 to 29 Years | 72 (76.6%) | 0 (0.0%) |
| 30 to 34 Years | 82 (82.0%) | 0 (0.0%) |
| 35 to 44 Years | 252 (74.3%) | 12 (4.8%) |
| 45 to 54 Years | 103 (64.0%) | 8 (7.8%) |
| 55 to 59 Years | 103 (48.6%) | 16 (15.5%) |
| 60 to 64 Years | 34 (27.9%) | 0 (0.0%) |
| 65 to 74 Years | 7 (3.1%) | 0 (0.0%) |
| 75 Years and over | 5 (4.6%) | 0 (0.0%) |
| Total | 783 (50.1%) | 41 (5.2%) |
Employment Status by Educational Attainment in Krebs
According to labor force statistics for Krebs, 62.8% of individuals (646) out of the total population between 25 and 64 years of age (1,028) are in the labor force, with 5.6% or 36 of them being unemployed. The group with the highest labor force participation rate are those with the educational attainment of bachelor's degree or higher, with 84.0% or 89 individuals in the labor force. Within the labor force, individuals with college / associate degree education have the highest percentage of unemployment, with 7.5% or 20 of them being unemployed.
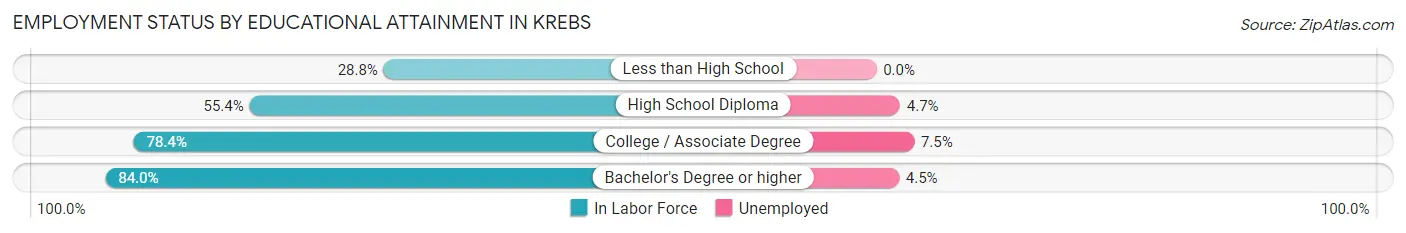
| Educational Attainment | In Labor Force | Unemployed |
| Less than High School | 34 (28.8%) | 0 (0.0%) |
| High School Diploma | 258 (55.4%) | 22 (4.7%) |
| College / Associate Degree | 265 (78.4%) | 25 (7.5%) |
| Bachelor's Degree or higher | 89 (84.0%) | 5 (4.5%) |
| Total | 646 (62.8%) | 58 (5.6%) |
Employment Occupations by Sex in Krebs
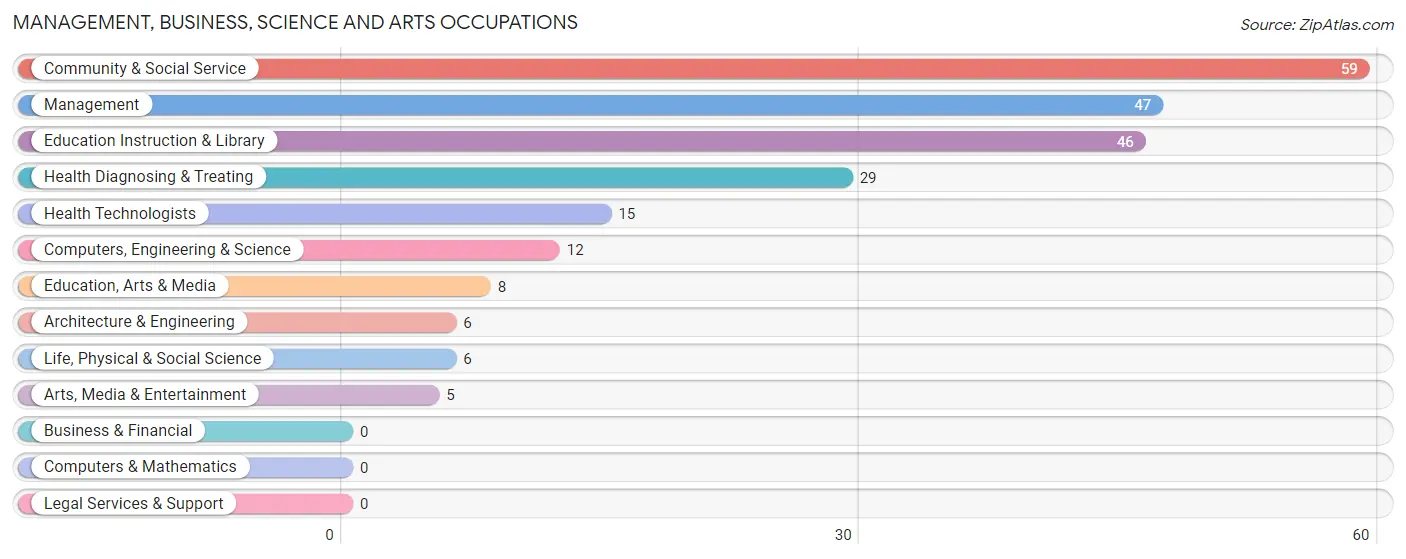
Management, Business, Science and Arts Occupations
The most common Management, Business, Science and Arts occupations in Krebs are Community & Social Service (59 | 8.0%), Management (47 | 6.3%), Education Instruction & Library (46 | 6.2%), Health Diagnosing & Treating (29 | 3.9%), and Health Technologists (15 | 2.0%).
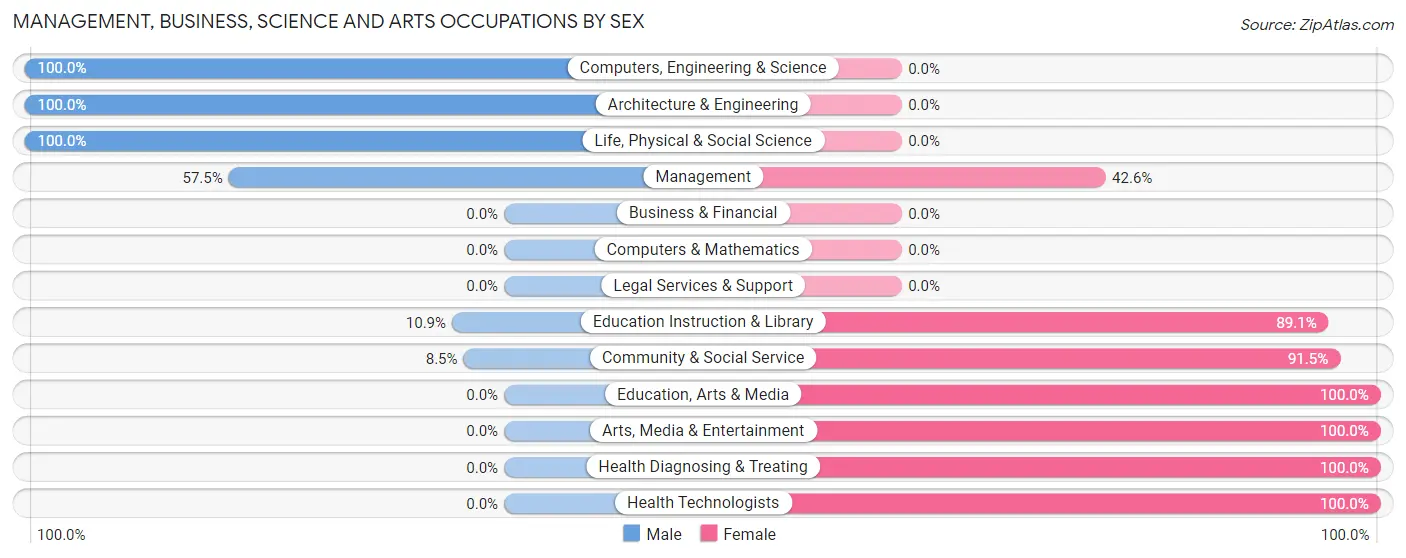
Management, Business, Science and Arts Occupations by Sex
Within the Management, Business, Science and Arts occupations in Krebs, the most male-oriented occupations are Computers, Engineering & Science (100.0%), Architecture & Engineering (100.0%), and Life, Physical & Social Science (100.0%), while the most female-oriented occupations are Education, Arts & Media (100.0%), Arts, Media & Entertainment (100.0%), and Health Diagnosing & Treating (100.0%).
| Occupation | Male | Female |
| Management | 27 (57.5%) | 20 (42.5%) |
| Business & Financial | 0 (0.0%) | 0 (0.0%) |
| Computers, Engineering & Science | 12 (100.0%) | 0 (0.0%) |
| Computers & Mathematics | 0 (0.0%) | 0 (0.0%) |
| Architecture & Engineering | 6 (100.0%) | 0 (0.0%) |
| Life, Physical & Social Science | 6 (100.0%) | 0 (0.0%) |
| Community & Social Service | 5 (8.5%) | 54 (91.5%) |
| Education, Arts & Media | 0 (0.0%) | 8 (100.0%) |
| Legal Services & Support | 0 (0.0%) | 0 (0.0%) |
| Education Instruction & Library | 5 (10.9%) | 41 (89.1%) |
| Arts, Media & Entertainment | 0 (0.0%) | 5 (100.0%) |
| Health Diagnosing & Treating | 0 (0.0%) | 29 (100.0%) |
| Health Technologists | 0 (0.0%) | 15 (100.0%) |
| Total (Category) | 44 (29.9%) | 103 (70.1%) |
| Total (Overall) | 365 (49.2%) | 377 (50.8%) |
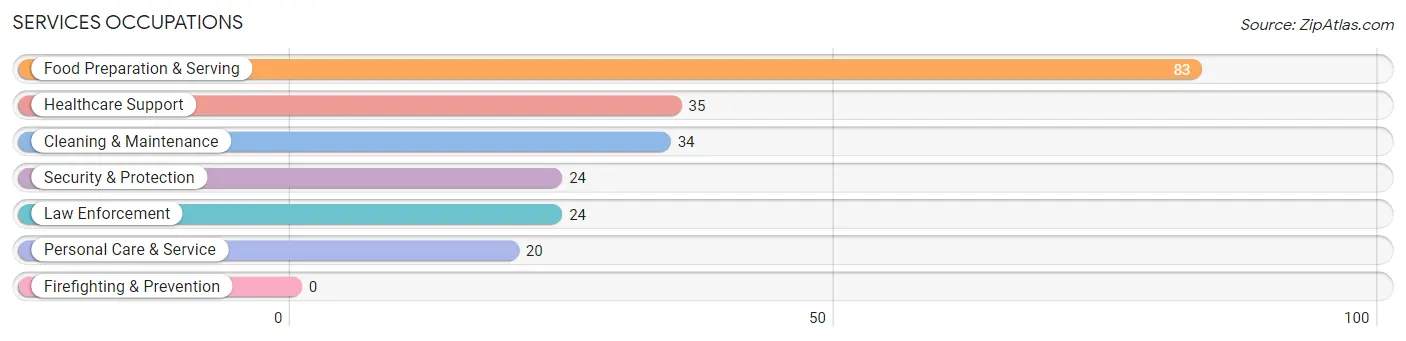
Services Occupations
The most common Services occupations in Krebs are Food Preparation & Serving (83 | 11.2%), Healthcare Support (35 | 4.7%), Cleaning & Maintenance (34 | 4.6%), Security & Protection (24 | 3.2%), and Law Enforcement (24 | 3.2%).
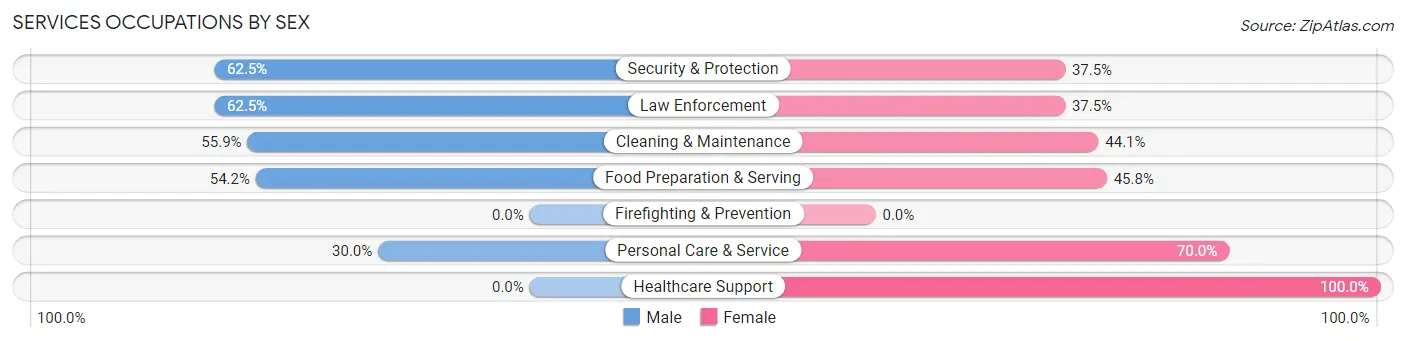
Services Occupations by Sex
Within the Services occupations in Krebs, the most male-oriented occupations are Security & Protection (62.5%), Law Enforcement (62.5%), and Cleaning & Maintenance (55.9%), while the most female-oriented occupations are Healthcare Support (100.0%), Personal Care & Service (70.0%), and Food Preparation & Serving (45.8%).
| Occupation | Male | Female |
| Healthcare Support | 0 (0.0%) | 35 (100.0%) |
| Security & Protection | 15 (62.5%) | 9 (37.5%) |
| Firefighting & Prevention | 0 (0.0%) | 0 (0.0%) |
| Law Enforcement | 15 (62.5%) | 9 (37.5%) |
| Food Preparation & Serving | 45 (54.2%) | 38 (45.8%) |
| Cleaning & Maintenance | 19 (55.9%) | 15 (44.1%) |
| Personal Care & Service | 6 (30.0%) | 14 (70.0%) |
| Total (Category) | 85 (43.4%) | 111 (56.6%) |
| Total (Overall) | 365 (49.2%) | 377 (50.8%) |
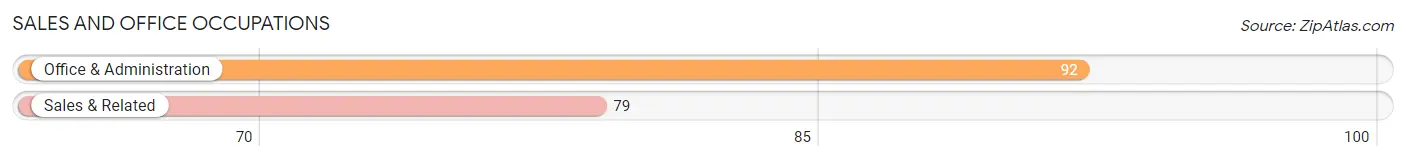
Sales and Office Occupations
The most common Sales and Office occupations in Krebs are Office & Administration (92 | 12.4%), and Sales & Related (79 | 10.6%).
Sales and Office Occupations by Sex
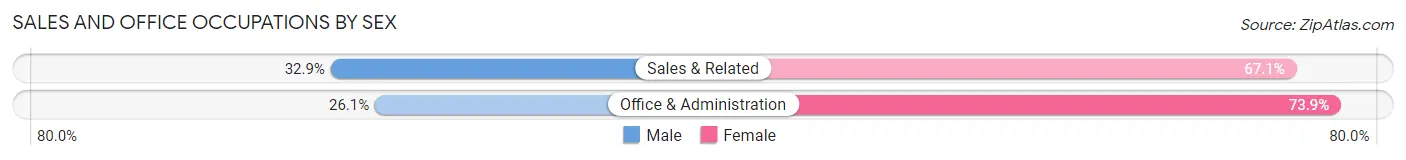
| Occupation | Male | Female |
| Sales & Related | 26 (32.9%) | 53 (67.1%) |
| Office & Administration | 24 (26.1%) | 68 (73.9%) |
| Total (Category) | 50 (29.2%) | 121 (70.8%) |
| Total (Overall) | 365 (49.2%) | 377 (50.8%) |
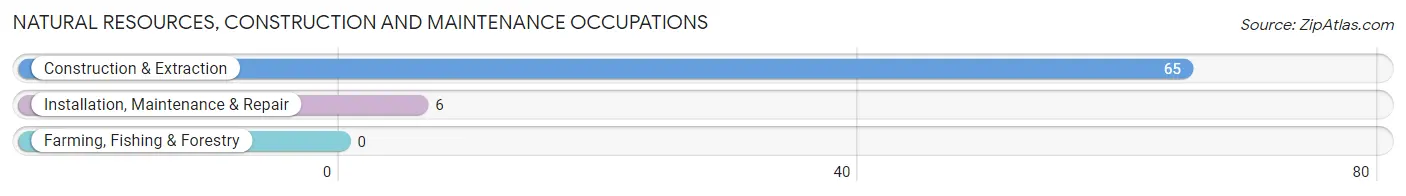
Natural Resources, Construction and Maintenance Occupations
The most common Natural Resources, Construction and Maintenance occupations in Krebs are Construction & Extraction (65 | 8.8%), and Installation, Maintenance & Repair (6 | 0.8%).
Natural Resources, Construction and Maintenance Occupations by Sex
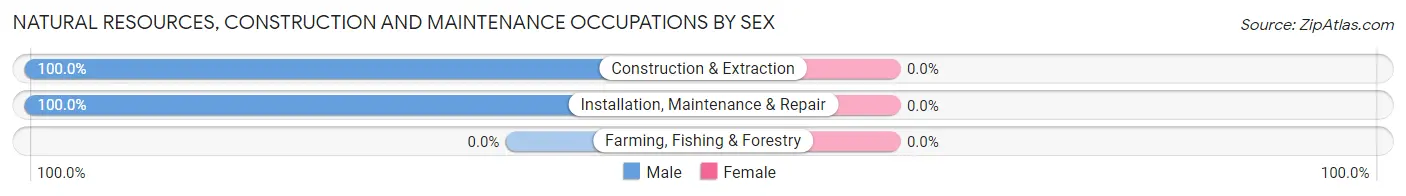
| Occupation | Male | Female |
| Farming, Fishing & Forestry | 0 (0.0%) | 0 (0.0%) |
| Construction & Extraction | 65 (100.0%) | 0 (0.0%) |
| Installation, Maintenance & Repair | 6 (100.0%) | 0 (0.0%) |
| Total (Category) | 71 (100.0%) | 0 (0.0%) |
| Total (Overall) | 365 (49.2%) | 377 (50.8%) |
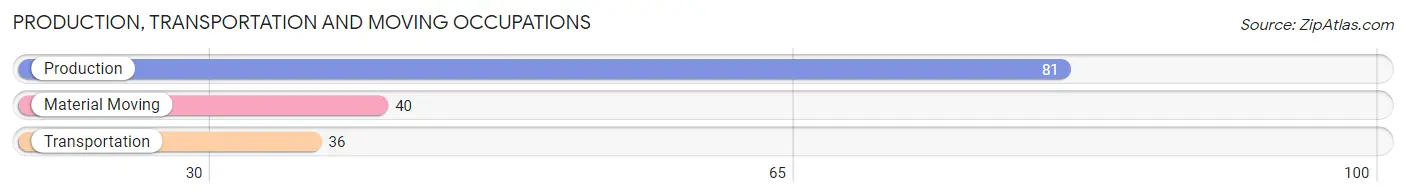
Production, Transportation and Moving Occupations
The most common Production, Transportation and Moving occupations in Krebs are Production (81 | 10.9%), Material Moving (40 | 5.4%), and Transportation (36 | 4.9%).
Production, Transportation and Moving Occupations by Sex
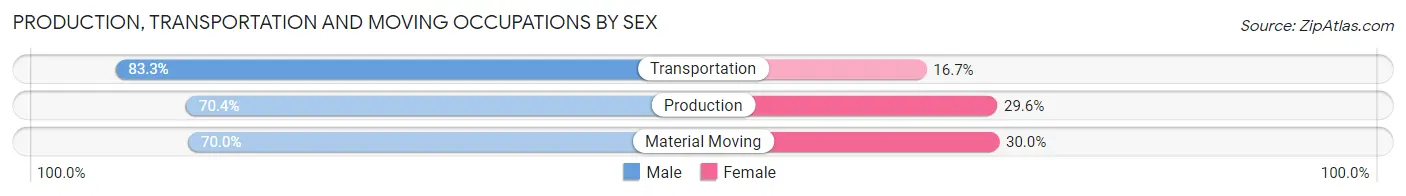
| Occupation | Male | Female |
| Production | 57 (70.4%) | 24 (29.6%) |
| Transportation | 30 (83.3%) | 6 (16.7%) |
| Material Moving | 28 (70.0%) | 12 (30.0%) |
| Total (Category) | 115 (73.3%) | 42 (26.8%) |
| Total (Overall) | 365 (49.2%) | 377 (50.8%) |
Employment Industries by Sex in Krebs
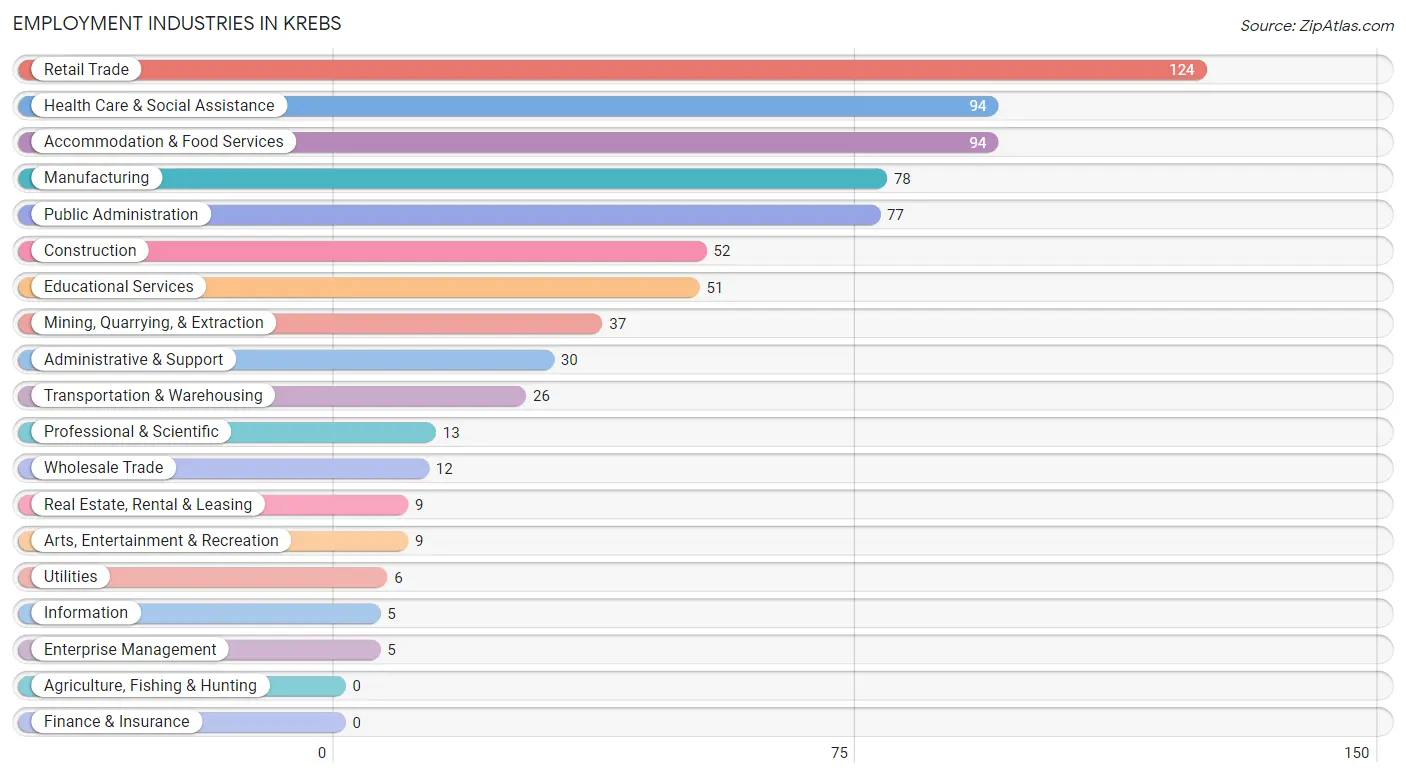
Employment Industries in Krebs
The major employment industries in Krebs include Retail Trade (124 | 16.7%), Health Care & Social Assistance (94 | 12.7%), Accommodation & Food Services (94 | 12.7%), Manufacturing (78 | 10.5%), and Public Administration (77 | 10.4%).
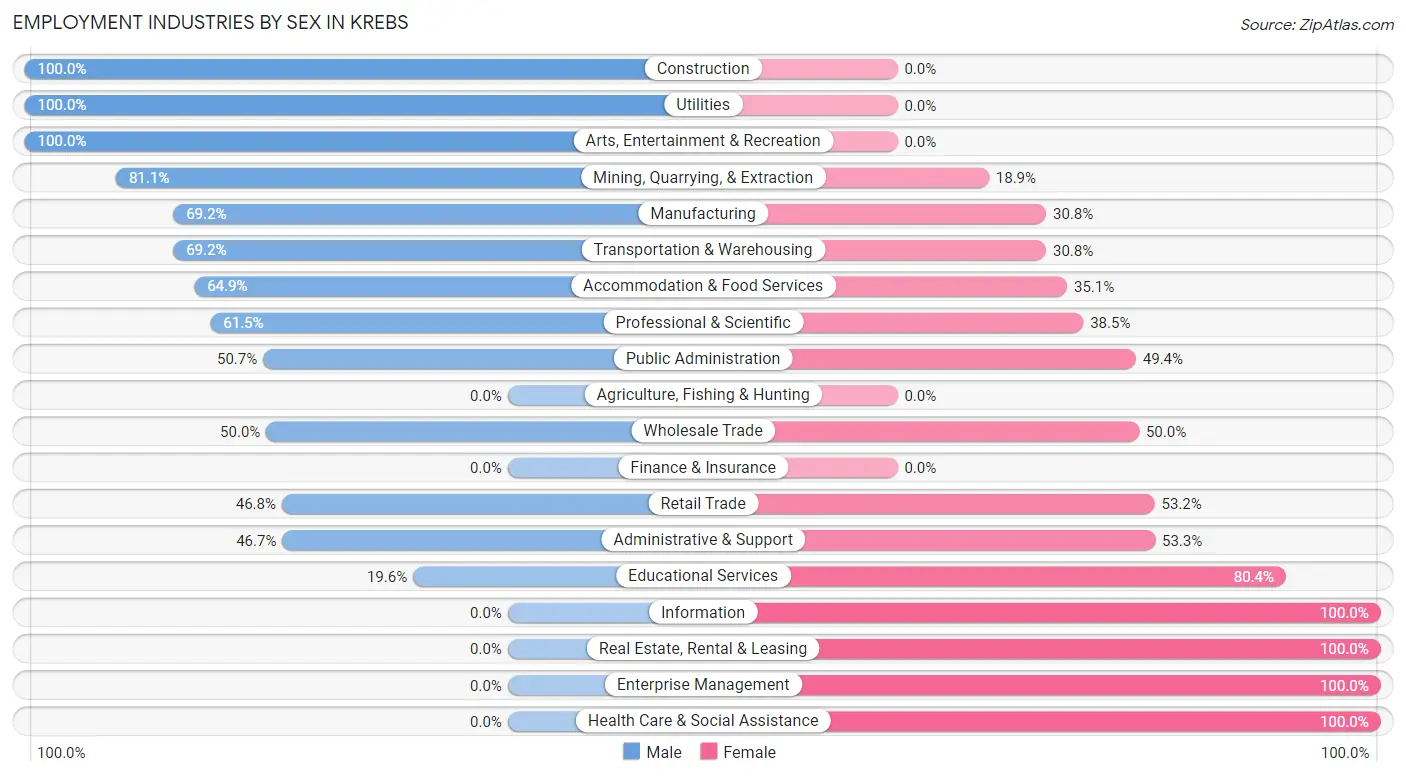
Employment Industries by Sex in Krebs
The Krebs industries that see more men than women are Construction (100.0%), Utilities (100.0%), and Arts, Entertainment & Recreation (100.0%), whereas the industries that tend to have a higher number of women are Information (100.0%), Real Estate, Rental & Leasing (100.0%), and Enterprise Management (100.0%).
| Industry | Male | Female |
| Agriculture, Fishing & Hunting | 0 (0.0%) | 0 (0.0%) |
| Mining, Quarrying, & Extraction | 30 (81.1%) | 7 (18.9%) |
| Construction | 52 (100.0%) | 0 (0.0%) |
| Manufacturing | 54 (69.2%) | 24 (30.8%) |
| Wholesale Trade | 6 (50.0%) | 6 (50.0%) |
| Retail Trade | 58 (46.8%) | 66 (53.2%) |
| Transportation & Warehousing | 18 (69.2%) | 8 (30.8%) |
| Utilities | 6 (100.0%) | 0 (0.0%) |
| Information | 0 (0.0%) | 5 (100.0%) |
| Finance & Insurance | 0 (0.0%) | 0 (0.0%) |
| Real Estate, Rental & Leasing | 0 (0.0%) | 9 (100.0%) |
| Professional & Scientific | 8 (61.5%) | 5 (38.5%) |
| Enterprise Management | 0 (0.0%) | 5 (100.0%) |
| Administrative & Support | 14 (46.7%) | 16 (53.3%) |
| Educational Services | 10 (19.6%) | 41 (80.4%) |
| Health Care & Social Assistance | 0 (0.0%) | 94 (100.0%) |
| Arts, Entertainment & Recreation | 9 (100.0%) | 0 (0.0%) |
| Accommodation & Food Services | 61 (64.9%) | 33 (35.1%) |
| Public Administration | 39 (50.6%) | 38 (49.3%) |
| Total | 365 (49.2%) | 377 (50.8%) |
Education in Krebs
School Enrollment in Krebs
The most common levels of schooling among the 510 students in Krebs are elementary school (152 | 29.8%), middle school (136 | 26.7%), and high school (134 | 26.3%).
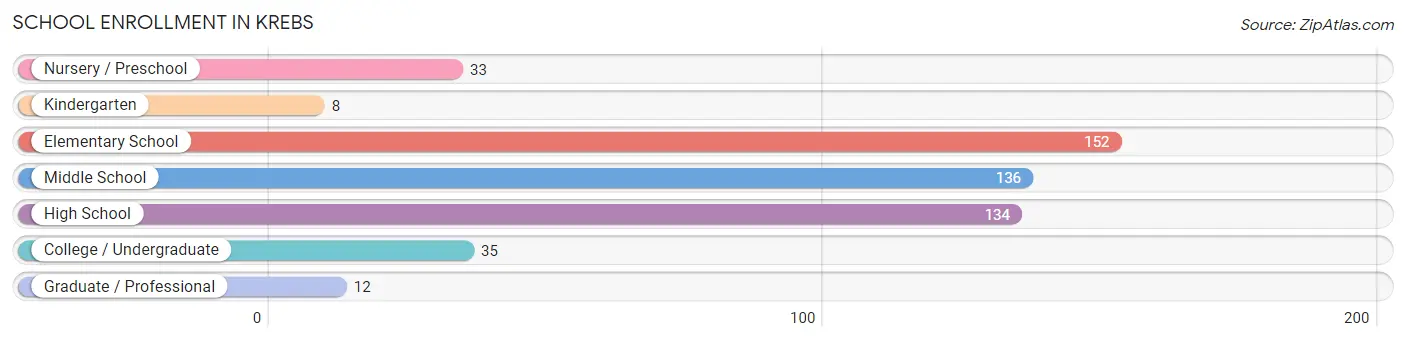
| School Level | # Students | % Students |
| Nursery / Preschool | 33 | 6.5% |
| Kindergarten | 8 | 1.6% |
| Elementary School | 152 | 29.8% |
| Middle School | 136 | 26.7% |
| High School | 134 | 26.3% |
| College / Undergraduate | 35 | 6.9% |
| Graduate / Professional | 12 | 2.4% |
| Total | 510 | 100.0% |
School Enrollment by Age by Funding Source in Krebs
Out of a total of 510 students who are enrolled in schools in Krebs, 53 (10.4%) attend a private institution, while the remaining 457 (89.6%) are enrolled in public schools. The age group of 35 years and over has the highest likelihood of being enrolled in private schools, with 5 (17.9% in the age bracket) enrolled. Conversely, the age group of 3 to 4 year olds has the lowest likelihood of being enrolled in a private school, with 14 (100.0% in the age bracket) attending a public institution.
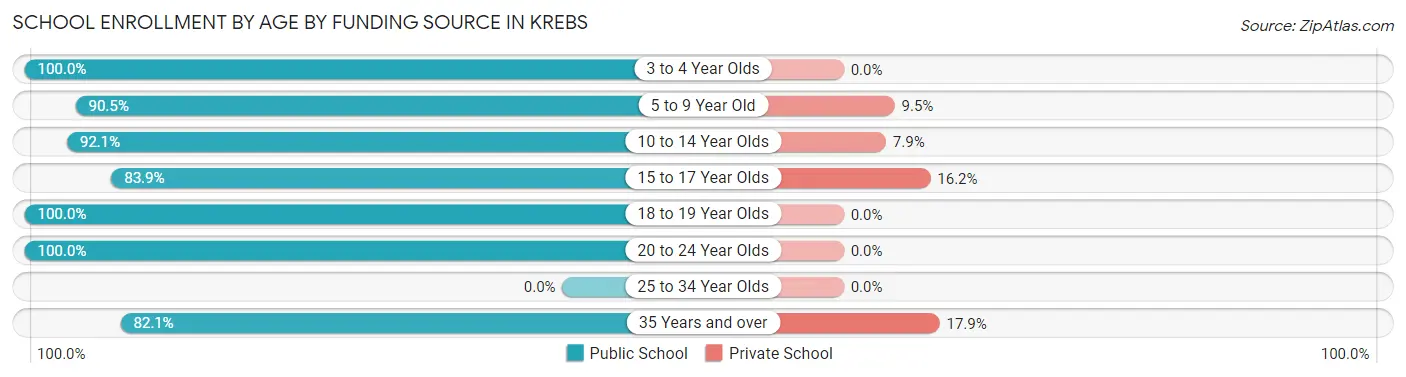
| Age Bracket | Public School | Private School |
| 3 to 4 Year Olds | 14 (100.0%) | 0 (0.0%) |
| 5 to 9 Year Old | 124 (90.5%) | 13 (9.5%) |
| 10 to 14 Year Olds | 164 (92.1%) | 14 (7.9%) |
| 15 to 17 Year Olds | 109 (83.9%) | 21 (16.2%) |
| 18 to 19 Year Olds | 4 (100.0%) | 0 (0.0%) |
| 20 to 24 Year Olds | 19 (100.0%) | 0 (0.0%) |
| 25 to 34 Year Olds | 0 (0.0%) | 0 (0.0%) |
| 35 Years and over | 23 (82.1%) | 5 (17.9%) |
| Total | 457 (89.6%) | 53 (10.4%) |
Educational Attainment by Field of Study in Krebs
Education (36 | 29.0%), science & technology (21 | 16.9%), business (17 | 13.7%), liberal arts & history (12 | 9.7%), and arts & humanities (12 | 9.7%) are the most common fields of study among 124 individuals in Krebs who have obtained a bachelor's degree or higher.
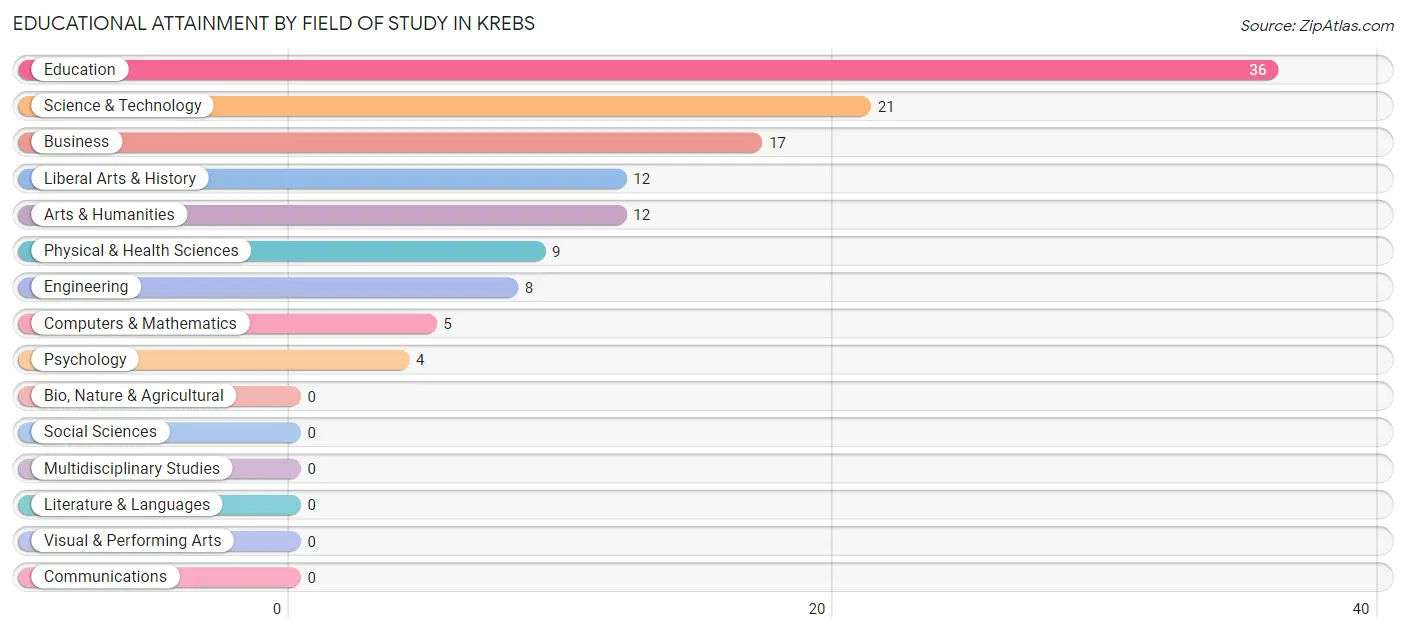
| Field of Study | # Graduates | % Graduates |
| Computers & Mathematics | 5 | 4.0% |
| Bio, Nature & Agricultural | 0 | 0.0% |
| Physical & Health Sciences | 9 | 7.3% |
| Psychology | 4 | 3.2% |
| Social Sciences | 0 | 0.0% |
| Engineering | 8 | 6.5% |
| Multidisciplinary Studies | 0 | 0.0% |
| Science & Technology | 21 | 16.9% |
| Business | 17 | 13.7% |
| Education | 36 | 29.0% |
| Literature & Languages | 0 | 0.0% |
| Liberal Arts & History | 12 | 9.7% |
| Visual & Performing Arts | 0 | 0.0% |
| Communications | 0 | 0.0% |
| Arts & Humanities | 12 | 9.7% |
| Total | 124 | 100.0% |
Transportation & Commute in Krebs
Vehicle Availability by Sex in Krebs
The most prevalent vehicle ownership categories in Krebs are males with 2 vehicles (139, accounting for 40.3%) and females with 2 vehicles (159, making up 39.9%).
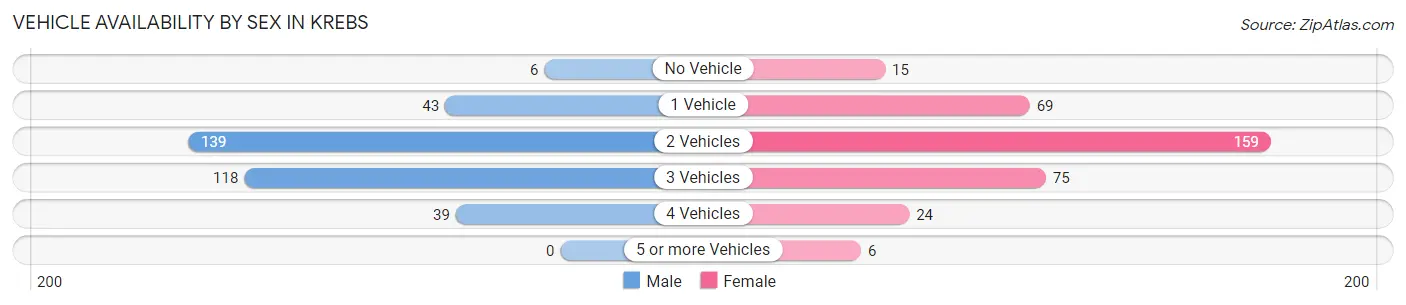
| Vehicles Available | Male | Female |
| No Vehicle | 6 (1.7%) | 15 (4.3%) |
| 1 Vehicle | 43 (12.5%) | 69 (19.8%) |
| 2 Vehicles | 139 (40.3%) | 159 (45.7%) |
| 3 Vehicles | 118 (34.2%) | 75 (21.5%) |
| 4 Vehicles | 39 (11.3%) | 24 (6.9%) |
| 5 or more Vehicles | 0 (0.0%) | 6 (1.7%) |
| Total | 345 (100.0%) | 348 (100.0%) |
Commute Time in Krebs
The most frequently occuring commute durations in Krebs are 10 to 14 minutes (221 commuters, 32.4%), 5 to 9 minutes (152 commuters, 22.3%), and 15 to 19 minutes (138 commuters, 20.2%).
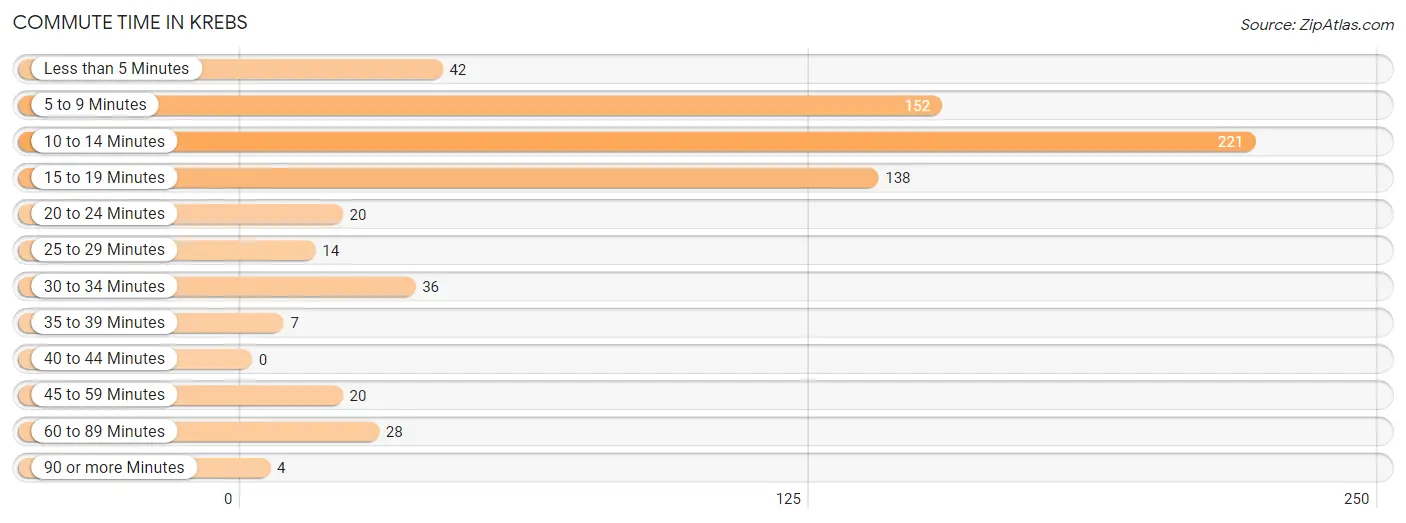
| Commute Time | # Commuters | % Commuters |
| Less than 5 Minutes | 42 | 6.2% |
| 5 to 9 Minutes | 152 | 22.3% |
| 10 to 14 Minutes | 221 | 32.4% |
| 15 to 19 Minutes | 138 | 20.2% |
| 20 to 24 Minutes | 20 | 2.9% |
| 25 to 29 Minutes | 14 | 2.1% |
| 30 to 34 Minutes | 36 | 5.3% |
| 35 to 39 Minutes | 7 | 1.0% |
| 40 to 44 Minutes | 0 | 0.0% |
| 45 to 59 Minutes | 20 | 2.9% |
| 60 to 89 Minutes | 28 | 4.1% |
| 90 or more Minutes | 4 | 0.6% |
Commute Time by Sex in Krebs
The most common commute times in Krebs are 10 to 14 minutes (98 commuters, 28.4%) for males and 10 to 14 minutes (123 commuters, 36.5%) for females.
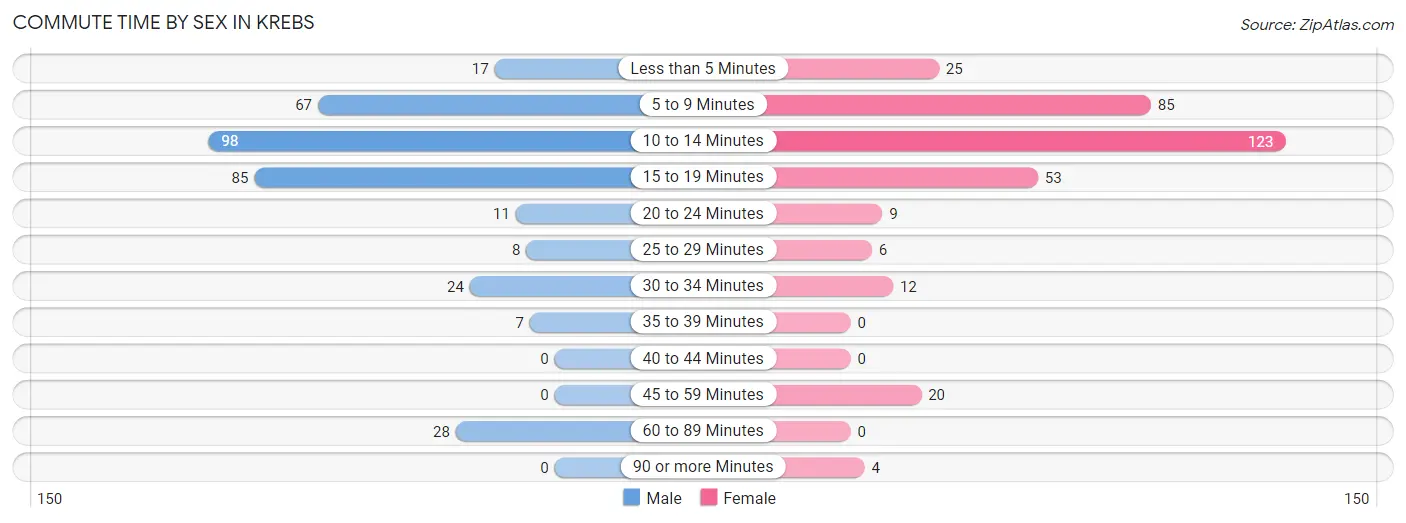
| Commute Time | Male | Female |
| Less than 5 Minutes | 17 (4.9%) | 25 (7.4%) |
| 5 to 9 Minutes | 67 (19.4%) | 85 (25.2%) |
| 10 to 14 Minutes | 98 (28.4%) | 123 (36.5%) |
| 15 to 19 Minutes | 85 (24.6%) | 53 (15.7%) |
| 20 to 24 Minutes | 11 (3.2%) | 9 (2.7%) |
| 25 to 29 Minutes | 8 (2.3%) | 6 (1.8%) |
| 30 to 34 Minutes | 24 (7.0%) | 12 (3.6%) |
| 35 to 39 Minutes | 7 (2.0%) | 0 (0.0%) |
| 40 to 44 Minutes | 0 (0.0%) | 0 (0.0%) |
| 45 to 59 Minutes | 0 (0.0%) | 20 (5.9%) |
| 60 to 89 Minutes | 28 (8.1%) | 0 (0.0%) |
| 90 or more Minutes | 0 (0.0%) | 4 (1.2%) |
Time of Departure to Work by Sex in Krebs
The most frequent times of departure to work in Krebs are 7:30 AM to 7:59 AM (62, 18.0%) for males and 7:30 AM to 7:59 AM (83, 24.6%) for females.

| Time of Departure | Male | Female |
| 12:00 AM to 4:59 AM | 8 (2.3%) | 12 (3.6%) |
| 5:00 AM to 5:29 AM | 33 (9.6%) | 12 (3.6%) |
| 5:30 AM to 5:59 AM | 31 (9.0%) | 12 (3.6%) |
| 6:00 AM to 6:29 AM | 15 (4.3%) | 26 (7.7%) |
| 6:30 AM to 6:59 AM | 41 (11.9%) | 21 (6.2%) |
| 7:00 AM to 7:29 AM | 50 (14.5%) | 54 (16.0%) |
| 7:30 AM to 7:59 AM | 62 (18.0%) | 83 (24.6%) |
| 8:00 AM to 8:29 AM | 15 (4.3%) | 28 (8.3%) |
| 8:30 AM to 8:59 AM | 6 (1.7%) | 11 (3.3%) |
| 9:00 AM to 9:59 AM | 12 (3.5%) | 5 (1.5%) |
| 10:00 AM to 10:59 AM | 7 (2.0%) | 0 (0.0%) |
| 11:00 AM to 11:59 AM | 0 (0.0%) | 0 (0.0%) |
| 12:00 PM to 3:59 PM | 14 (4.1%) | 31 (9.2%) |
| 4:00 PM to 11:59 PM | 51 (14.8%) | 42 (12.5%) |
| Total | 345 (100.0%) | 337 (100.0%) |
Housing Occupancy in Krebs
Occupancy by Ownership in Krebs
Of the total 864 dwellings in Krebs, owner-occupied units account for 509 (58.9%), while renter-occupied units make up 355 (41.1%).
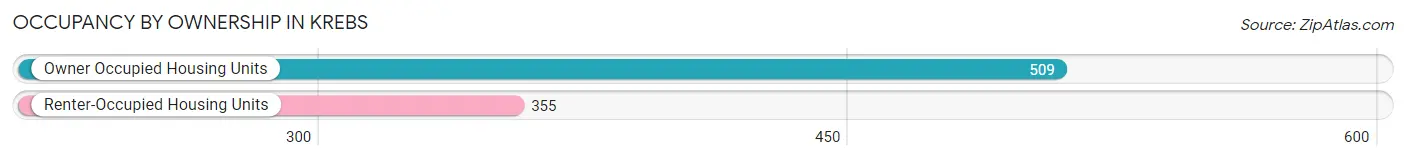
| Occupancy | # Housing Units | % Housing Units |
| Owner Occupied Housing Units | 509 | 58.9% |
| Renter-Occupied Housing Units | 355 | 41.1% |
| Total Occupied Housing Units | 864 | 100.0% |
Occupancy by Household Size in Krebs
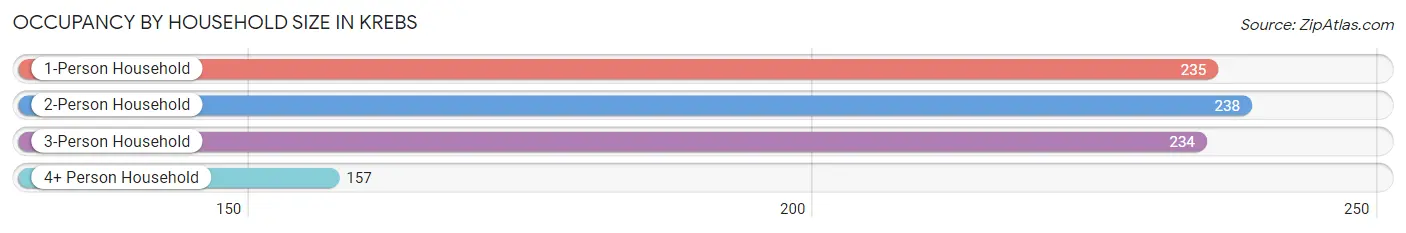
| Household Size | # Housing Units | % Housing Units |
| 1-Person Household | 235 | 27.2% |
| 2-Person Household | 238 | 27.6% |
| 3-Person Household | 234 | 27.1% |
| 4+ Person Household | 157 | 18.2% |
| Total Housing Units | 864 | 100.0% |
Occupancy by Ownership by Household Size in Krebs
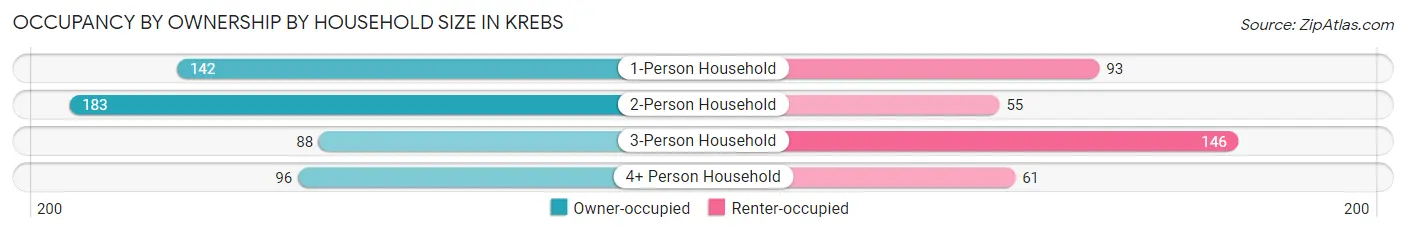
| Household Size | Owner-occupied | Renter-occupied |
| 1-Person Household | 142 (60.4%) | 93 (39.6%) |
| 2-Person Household | 183 (76.9%) | 55 (23.1%) |
| 3-Person Household | 88 (37.6%) | 146 (62.4%) |
| 4+ Person Household | 96 (61.2%) | 61 (38.9%) |
| Total Housing Units | 509 (58.9%) | 355 (41.1%) |
Occupancy by Educational Attainment in Krebs
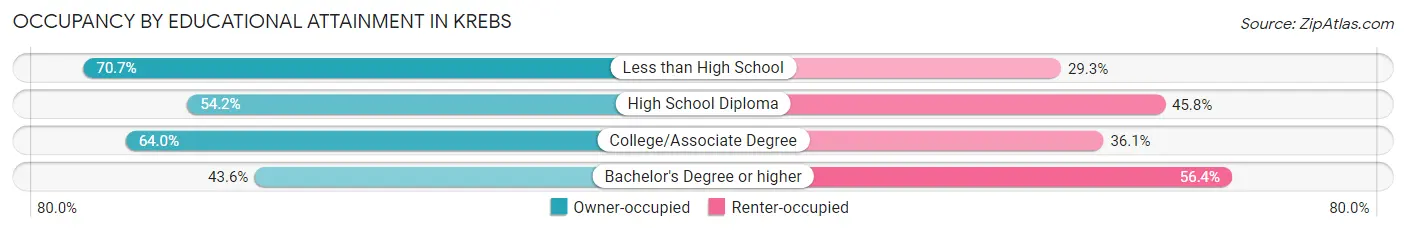
| Household Size | Owner-occupied | Renter-occupied |
| Less than High School | 41 (70.7%) | 17 (29.3%) |
| High School Diploma | 175 (54.2%) | 148 (45.8%) |
| College/Associate Degree | 259 (63.9%) | 146 (36.0%) |
| Bachelor's Degree or higher | 34 (43.6%) | 44 (56.4%) |
Occupancy by Age of Householder in Krebs
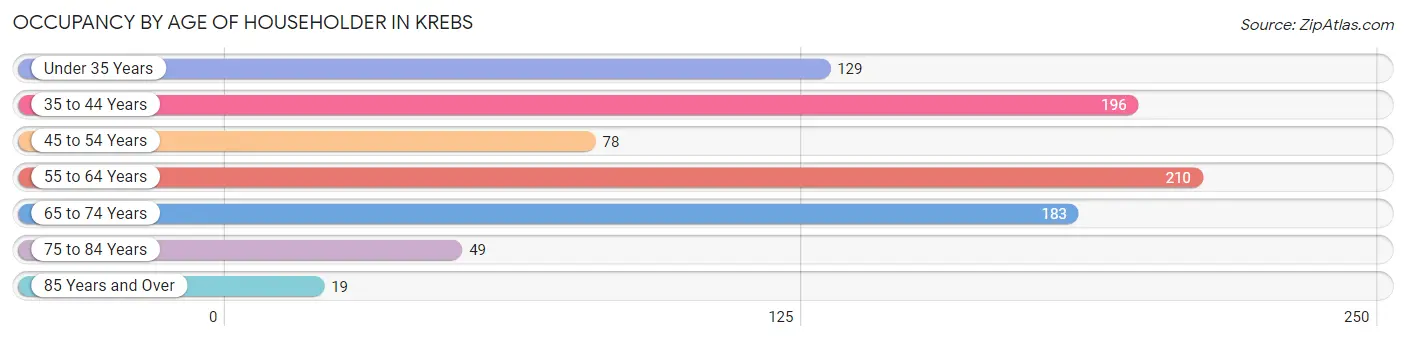
| Age Bracket | # Households | % Households |
| Under 35 Years | 129 | 14.9% |
| 35 to 44 Years | 196 | 22.7% |
| 45 to 54 Years | 78 | 9.0% |
| 55 to 64 Years | 210 | 24.3% |
| 65 to 74 Years | 183 | 21.2% |
| 75 to 84 Years | 49 | 5.7% |
| 85 Years and Over | 19 | 2.2% |
| Total | 864 | 100.0% |
Housing Finances in Krebs
Median Income by Occupancy in Krebs
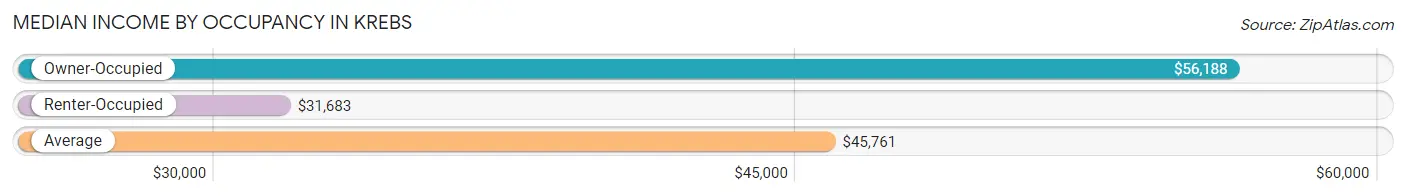
| Occupancy Type | # Households | Median Income |
| Owner-Occupied | 509 (58.9%) | $56,188 |
| Renter-Occupied | 355 (41.1%) | $31,683 |
| Average | 864 (100.0%) | $45,761 |
Occupancy by Householder Income Bracket in Krebs
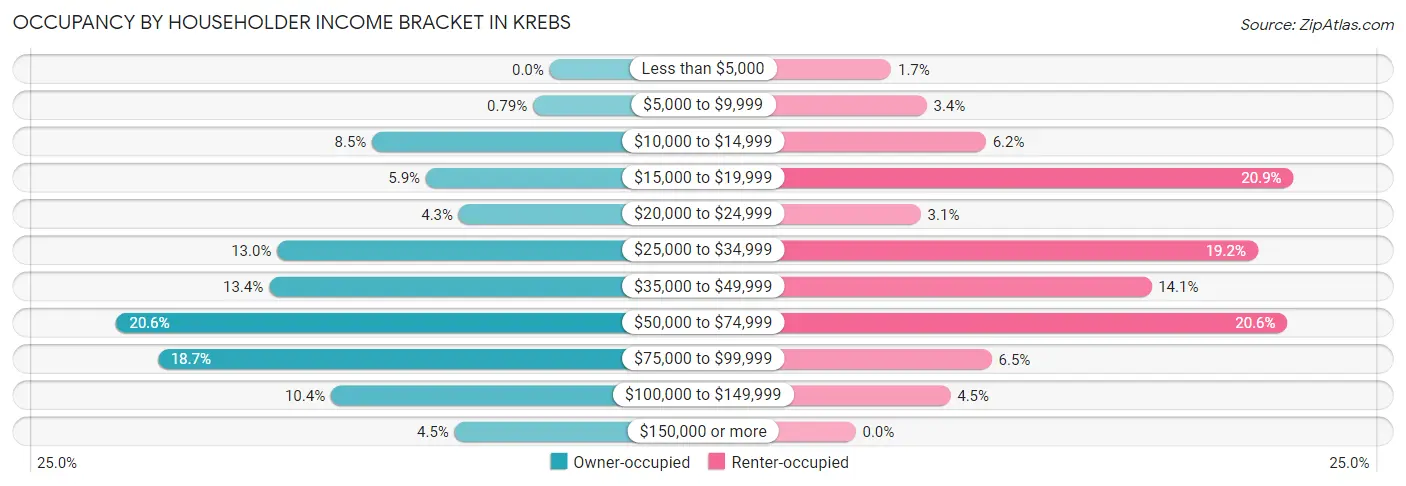
| Income Bracket | Owner-occupied | Renter-occupied |
| Less than $5,000 | 0 (0.0%) | 6 (1.7%) |
| $5,000 to $9,999 | 4 (0.8%) | 12 (3.4%) |
| $10,000 to $14,999 | 43 (8.5%) | 22 (6.2%) |
| $15,000 to $19,999 | 30 (5.9%) | 74 (20.8%) |
| $20,000 to $24,999 | 22 (4.3%) | 11 (3.1%) |
| $25,000 to $34,999 | 66 (13.0%) | 68 (19.2%) |
| $35,000 to $49,999 | 68 (13.4%) | 50 (14.1%) |
| $50,000 to $74,999 | 105 (20.6%) | 73 (20.6%) |
| $75,000 to $99,999 | 95 (18.7%) | 23 (6.5%) |
| $100,000 to $149,999 | 53 (10.4%) | 16 (4.5%) |
| $150,000 or more | 23 (4.5%) | 0 (0.0%) |
| Total | 509 (100.0%) | 355 (100.0%) |
Monthly Housing Cost Tiers in Krebs
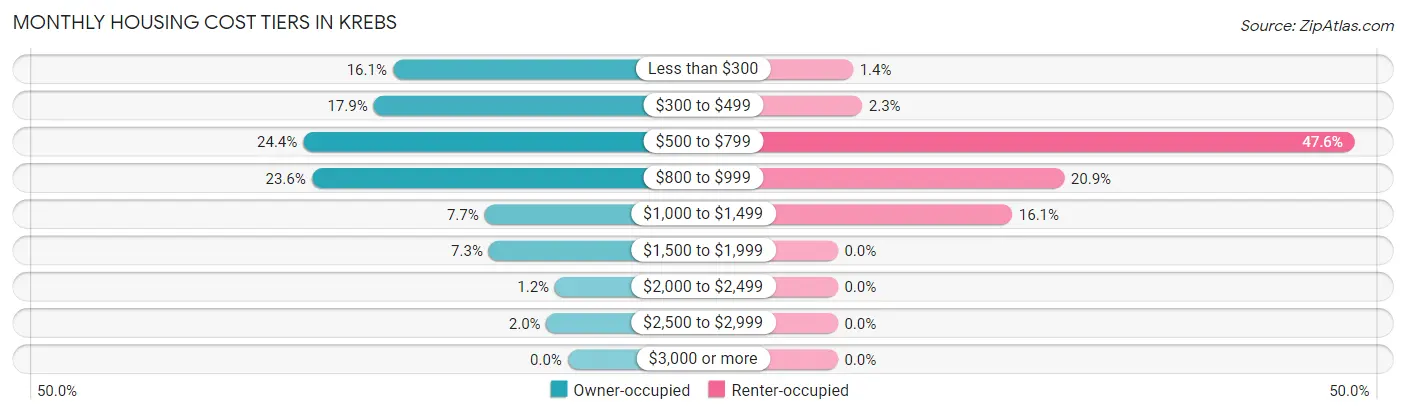
| Monthly Cost | Owner-occupied | Renter-occupied |
| Less than $300 | 82 (16.1%) | 5 (1.4%) |
| $300 to $499 | 91 (17.9%) | 8 (2.2%) |
| $500 to $799 | 124 (24.4%) | 169 (47.6%) |
| $800 to $999 | 120 (23.6%) | 74 (20.8%) |
| $1,000 to $1,499 | 39 (7.7%) | 57 (16.1%) |
| $1,500 to $1,999 | 37 (7.3%) | 0 (0.0%) |
| $2,000 to $2,499 | 6 (1.2%) | 0 (0.0%) |
| $2,500 to $2,999 | 10 (2.0%) | 0 (0.0%) |
| $3,000 or more | 0 (0.0%) | 0 (0.0%) |
| Total | 509 (100.0%) | 355 (100.0%) |
Physical Housing Characteristics in Krebs
Housing Structures in Krebs
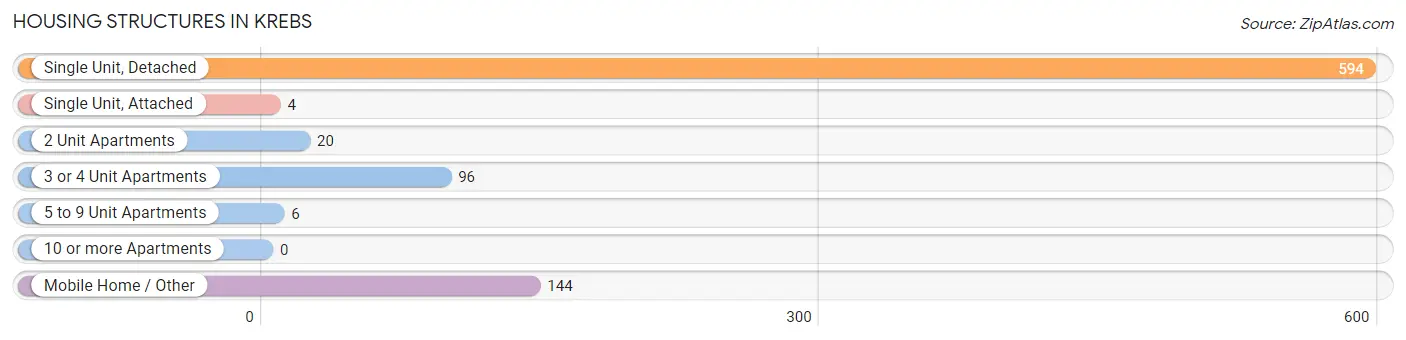
| Structure Type | # Housing Units | % Housing Units |
| Single Unit, Detached | 594 | 68.8% |
| Single Unit, Attached | 4 | 0.5% |
| 2 Unit Apartments | 20 | 2.3% |
| 3 or 4 Unit Apartments | 96 | 11.1% |
| 5 to 9 Unit Apartments | 6 | 0.7% |
| 10 or more Apartments | 0 | 0.0% |
| Mobile Home / Other | 144 | 16.7% |
| Total | 864 | 100.0% |
Housing Structures by Occupancy in Krebs
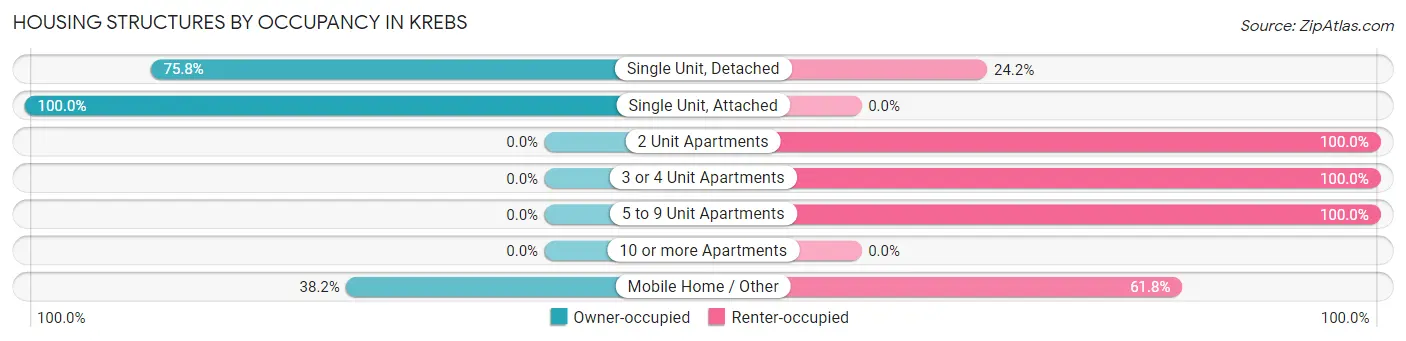
| Structure Type | Owner-occupied | Renter-occupied |
| Single Unit, Detached | 450 (75.8%) | 144 (24.2%) |
| Single Unit, Attached | 4 (100.0%) | 0 (0.0%) |
| 2 Unit Apartments | 0 (0.0%) | 20 (100.0%) |
| 3 or 4 Unit Apartments | 0 (0.0%) | 96 (100.0%) |
| 5 to 9 Unit Apartments | 0 (0.0%) | 6 (100.0%) |
| 10 or more Apartments | 0 (0.0%) | 0 (0.0%) |
| Mobile Home / Other | 55 (38.2%) | 89 (61.8%) |
| Total | 509 (58.9%) | 355 (41.1%) |
Housing Structures by Number of Rooms in Krebs
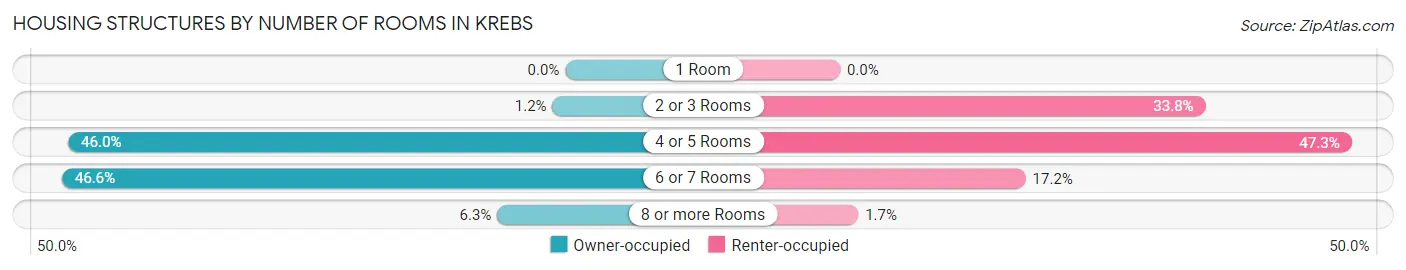
| Number of Rooms | Owner-occupied | Renter-occupied |
| 1 Room | 0 (0.0%) | 0 (0.0%) |
| 2 or 3 Rooms | 6 (1.2%) | 120 (33.8%) |
| 4 or 5 Rooms | 234 (46.0%) | 168 (47.3%) |
| 6 or 7 Rooms | 237 (46.6%) | 61 (17.2%) |
| 8 or more Rooms | 32 (6.3%) | 6 (1.7%) |
| Total | 509 (100.0%) | 355 (100.0%) |
Housing Structure by Heating Type in Krebs
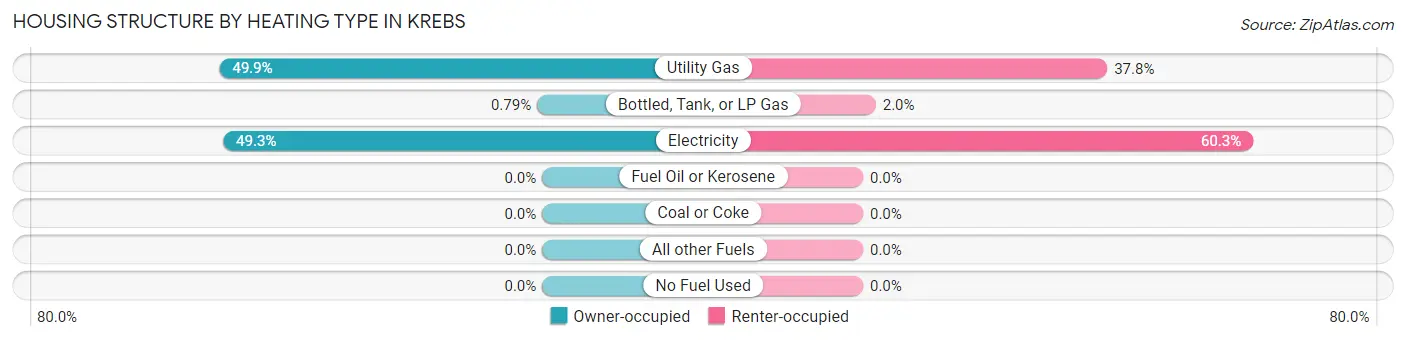
| Heating Type | Owner-occupied | Renter-occupied |
| Utility Gas | 254 (49.9%) | 134 (37.8%) |
| Bottled, Tank, or LP Gas | 4 (0.8%) | 7 (2.0%) |
| Electricity | 251 (49.3%) | 214 (60.3%) |
| Fuel Oil or Kerosene | 0 (0.0%) | 0 (0.0%) |
| Coal or Coke | 0 (0.0%) | 0 (0.0%) |
| All other Fuels | 0 (0.0%) | 0 (0.0%) |
| No Fuel Used | 0 (0.0%) | 0 (0.0%) |
| Total | 509 (100.0%) | 355 (100.0%) |
Household Vehicle Usage in Krebs
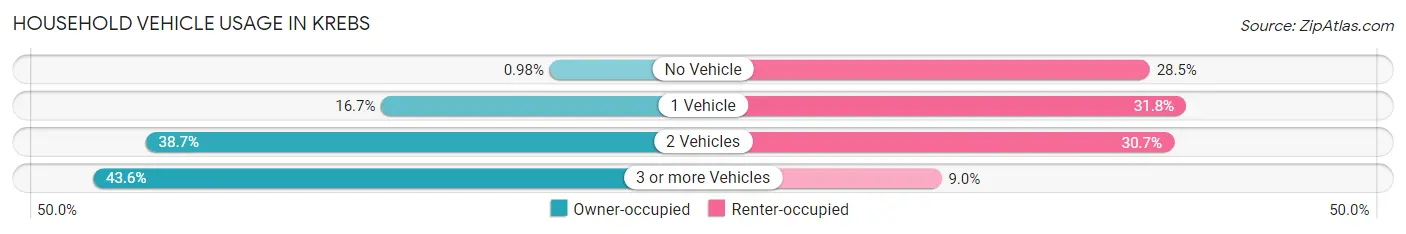
| Vehicles per Household | Owner-occupied | Renter-occupied |
| No Vehicle | 5 (1.0%) | 101 (28.4%) |
| 1 Vehicle | 85 (16.7%) | 113 (31.8%) |
| 2 Vehicles | 197 (38.7%) | 109 (30.7%) |
| 3 or more Vehicles | 222 (43.6%) | 32 (9.0%) |
| Total | 509 (100.0%) | 355 (100.0%) |
Real Estate & Mortgages in Krebs
Real Estate and Mortgage Overview in Krebs
| Characteristic | Without Mortgage | With Mortgage |
| Housing Units | 235 | 274 |
| Median Property Value | $95,400 | $108,000 |
| Median Household Income | $47,292 | $14 |
| Monthly Housing Costs | $399 | $0 |
| Real Estate Taxes | $510 | $9 |
Property Value by Mortgage Status in Krebs
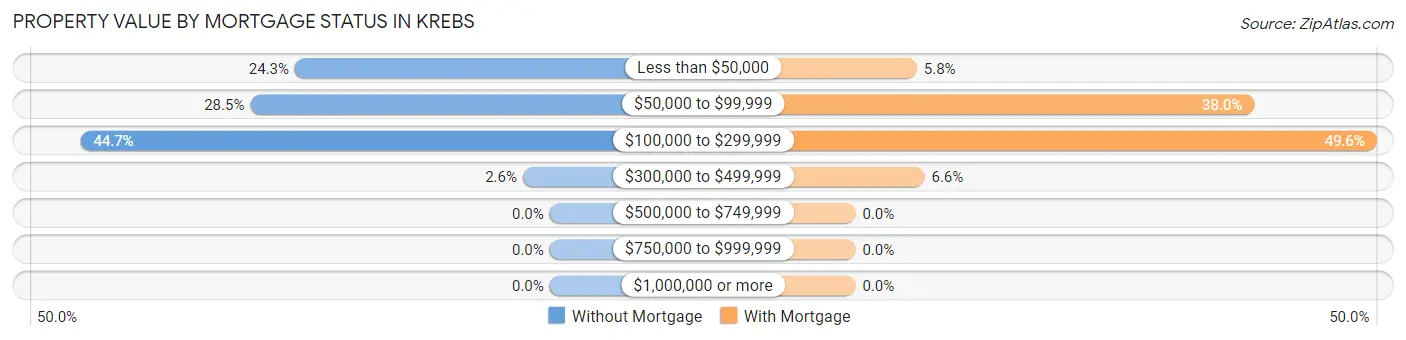
| Property Value | Without Mortgage | With Mortgage |
| Less than $50,000 | 57 (24.3%) | 16 (5.8%) |
| $50,000 to $99,999 | 67 (28.5%) | 104 (38.0%) |
| $100,000 to $299,999 | 105 (44.7%) | 136 (49.6%) |
| $300,000 to $499,999 | 6 (2.5%) | 18 (6.6%) |
| $500,000 to $749,999 | 0 (0.0%) | 0 (0.0%) |
| $750,000 to $999,999 | 0 (0.0%) | 0 (0.0%) |
| $1,000,000 or more | 0 (0.0%) | 0 (0.0%) |
| Total | 235 (100.0%) | 274 (100.0%) |
Household Income by Mortgage Status in Krebs
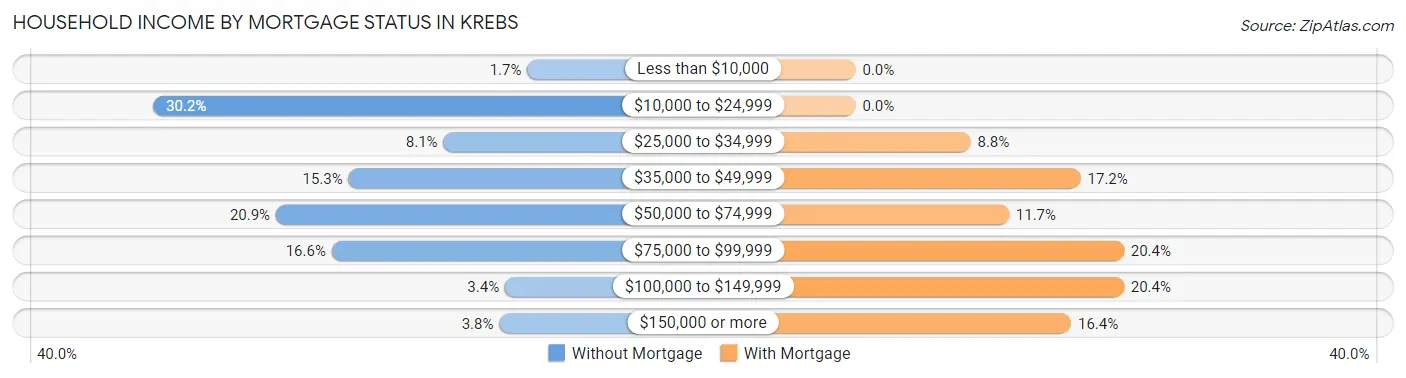
| Household Income | Without Mortgage | With Mortgage |
| Less than $10,000 | 4 (1.7%) | 0 (0.0%) |
| $10,000 to $24,999 | 71 (30.2%) | 0 (0.0%) |
| $25,000 to $34,999 | 19 (8.1%) | 24 (8.8%) |
| $35,000 to $49,999 | 36 (15.3%) | 47 (17.2%) |
| $50,000 to $74,999 | 49 (20.8%) | 32 (11.7%) |
| $75,000 to $99,999 | 39 (16.6%) | 56 (20.4%) |
| $100,000 to $149,999 | 8 (3.4%) | 56 (20.4%) |
| $150,000 or more | 9 (3.8%) | 45 (16.4%) |
| Total | 235 (100.0%) | 274 (100.0%) |
Property Value to Household Income Ratio in Krebs
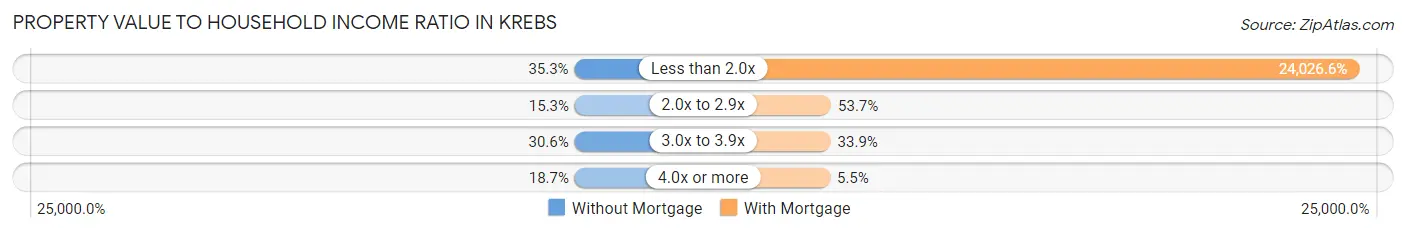
| Value-to-Income Ratio | Without Mortgage | With Mortgage |
| Less than 2.0x | 83 (35.3%) | 65,833 (24,026.6%) |
| 2.0x to 2.9x | 36 (15.3%) | 147 (53.6%) |
| 3.0x to 3.9x | 72 (30.6%) | 93 (33.9%) |
| 4.0x or more | 44 (18.7%) | 15 (5.5%) |
| Total | 235 (100.0%) | 274 (100.0%) |
Real Estate Taxes by Mortgage Status in Krebs
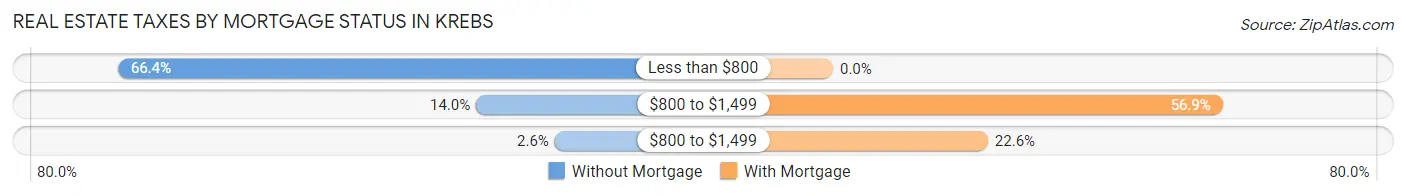
| Property Taxes | Without Mortgage | With Mortgage |
| Less than $800 | 156 (66.4%) | 0 (0.0%) |
| $800 to $1,499 | 33 (14.0%) | 156 (56.9%) |
| $800 to $1,499 | 6 (2.5%) | 62 (22.6%) |
| Total | 235 (100.0%) | 274 (100.0%) |
Health & Disability in Krebs
Health Insurance Coverage by Age in Krebs
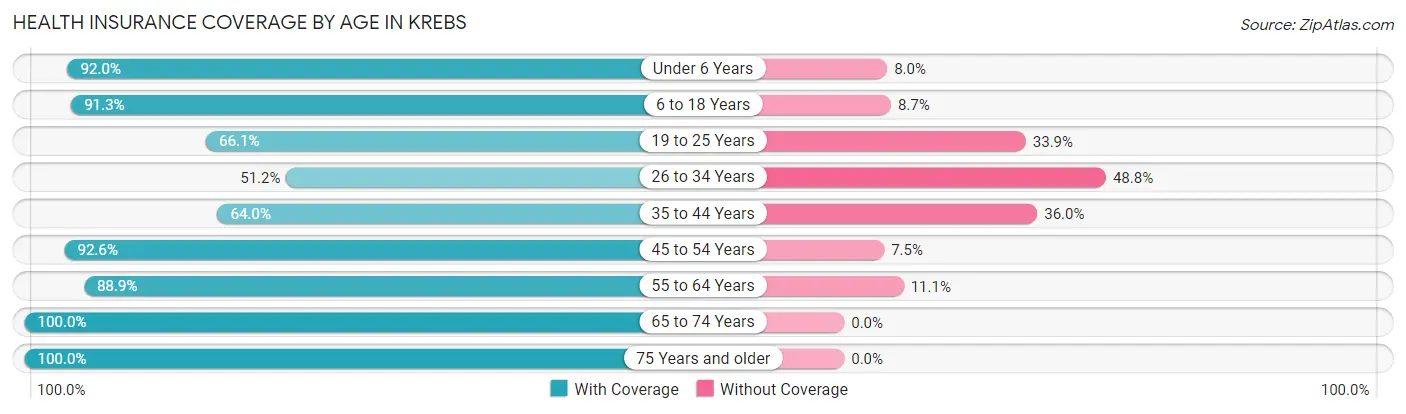
| Age Bracket | With Coverage | Without Coverage |
| Under 6 Years | 69 (92.0%) | 6 (8.0%) |
| 6 to 18 Years | 420 (91.3%) | 40 (8.7%) |
| 19 to 25 Years | 84 (66.1%) | 43 (33.9%) |
| 26 to 34 Years | 85 (51.2%) | 81 (48.8%) |
| 35 to 44 Years | 217 (64.0%) | 122 (36.0%) |
| 45 to 54 Years | 149 (92.5%) | 12 (7.4%) |
| 55 to 64 Years | 297 (88.9%) | 37 (11.1%) |
| 65 to 74 Years | 224 (100.0%) | 0 (0.0%) |
| 75 Years and older | 108 (100.0%) | 0 (0.0%) |
| Total | 1,653 (82.9%) | 341 (17.1%) |
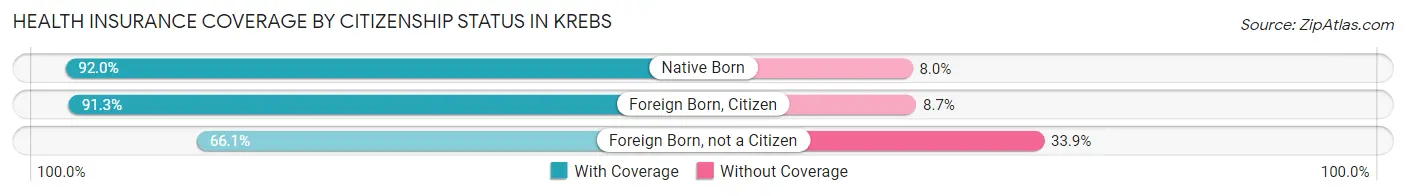
Health Insurance Coverage by Citizenship Status in Krebs
| Citizenship Status | With Coverage | Without Coverage |
| Native Born | 69 (92.0%) | 6 (8.0%) |
| Foreign Born, Citizen | 420 (91.3%) | 40 (8.7%) |
| Foreign Born, not a Citizen | 84 (66.1%) | 43 (33.9%) |
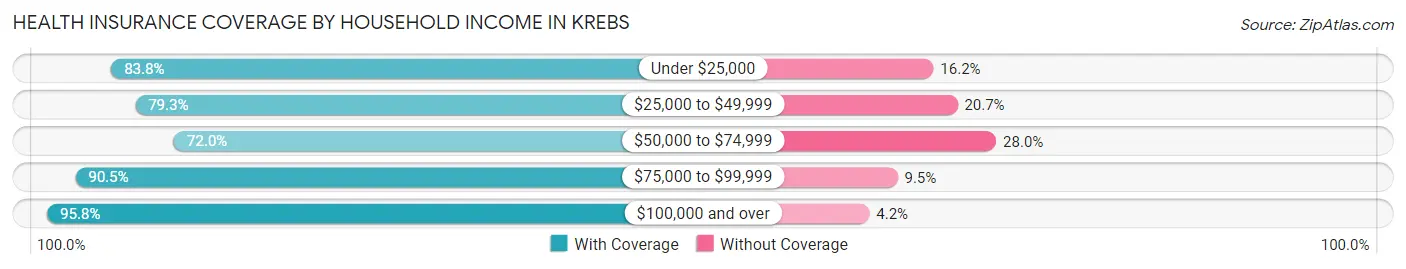
Health Insurance Coverage by Household Income in Krebs
| Household Income | With Coverage | Without Coverage |
| Under $25,000 | 258 (83.8%) | 50 (16.2%) |
| $25,000 to $49,999 | 436 (79.3%) | 114 (20.7%) |
| $50,000 to $74,999 | 332 (72.0%) | 129 (28.0%) |
| $75,000 to $99,999 | 333 (90.5%) | 35 (9.5%) |
| $100,000 and over | 294 (95.8%) | 13 (4.2%) |
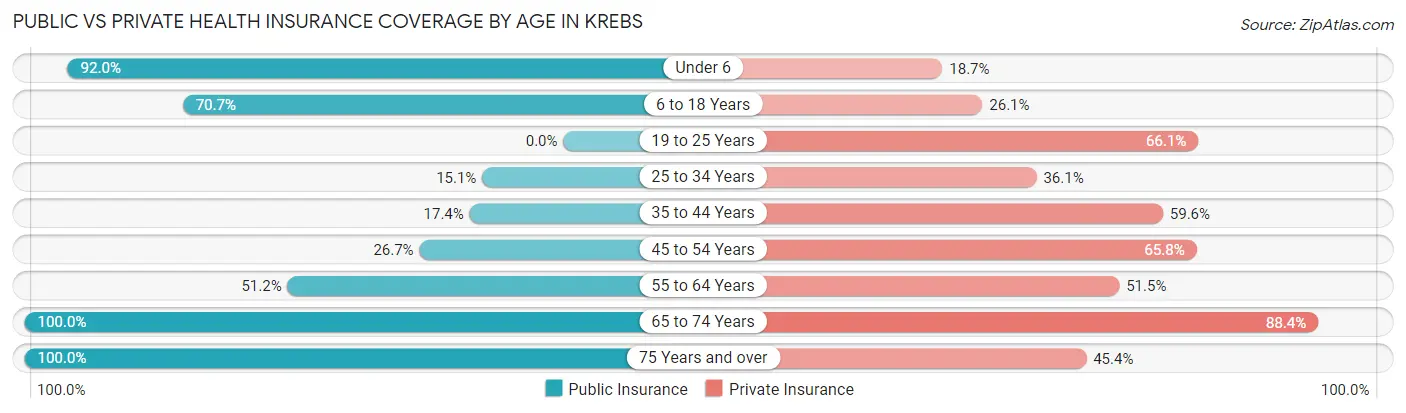
Public vs Private Health Insurance Coverage by Age in Krebs
| Age Bracket | Public Insurance | Private Insurance |
| Under 6 | 69 (92.0%) | 14 (18.7%) |
| 6 to 18 Years | 325 (70.7%) | 120 (26.1%) |
| 19 to 25 Years | 0 (0.0%) | 84 (66.1%) |
| 25 to 34 Years | 25 (15.1%) | 60 (36.1%) |
| 35 to 44 Years | 59 (17.4%) | 202 (59.6%) |
| 45 to 54 Years | 43 (26.7%) | 106 (65.8%) |
| 55 to 64 Years | 171 (51.2%) | 172 (51.5%) |
| 65 to 74 Years | 224 (100.0%) | 198 (88.4%) |
| 75 Years and over | 108 (100.0%) | 49 (45.4%) |
| Total | 1,024 (51.3%) | 1,005 (50.4%) |
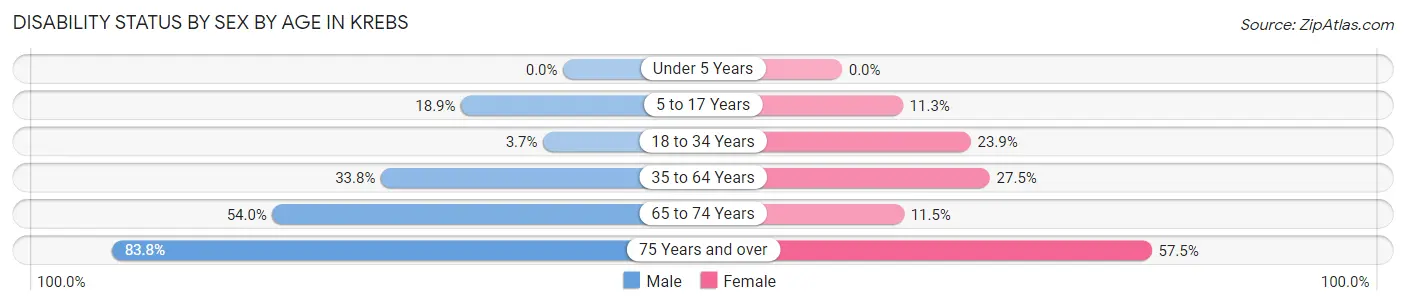
Disability Status by Sex by Age in Krebs
| Age Bracket | Male | Female |
| Under 5 Years | 0 (0.0%) | 0 (0.0%) |
| 5 to 17 Years | 39 (18.9%) | 27 (11.3%) |
| 18 to 34 Years | 6 (3.7%) | 38 (23.9%) |
| 35 to 64 Years | 144 (33.8%) | 112 (27.5%) |
| 65 to 74 Years | 41 (53.9%) | 17 (11.5%) |
| 75 Years and over | 57 (83.8%) | 23 (57.5%) |
Disability Class by Sex by Age in Krebs
Disability Class: Hearing Difficulty
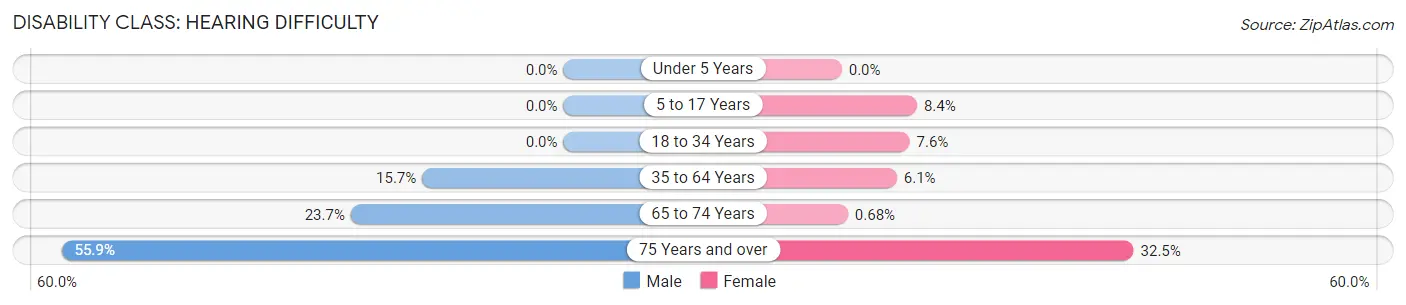
| Age Bracket | Male | Female |
| Under 5 Years | 0 (0.0%) | 0 (0.0%) |
| 5 to 17 Years | 0 (0.0%) | 20 (8.4%) |
| 18 to 34 Years | 0 (0.0%) | 12 (7.5%) |
| 35 to 64 Years | 67 (15.7%) | 25 (6.1%) |
| 65 to 74 Years | 18 (23.7%) | 1 (0.7%) |
| 75 Years and over | 38 (55.9%) | 13 (32.5%) |
Disability Class: Vision Difficulty
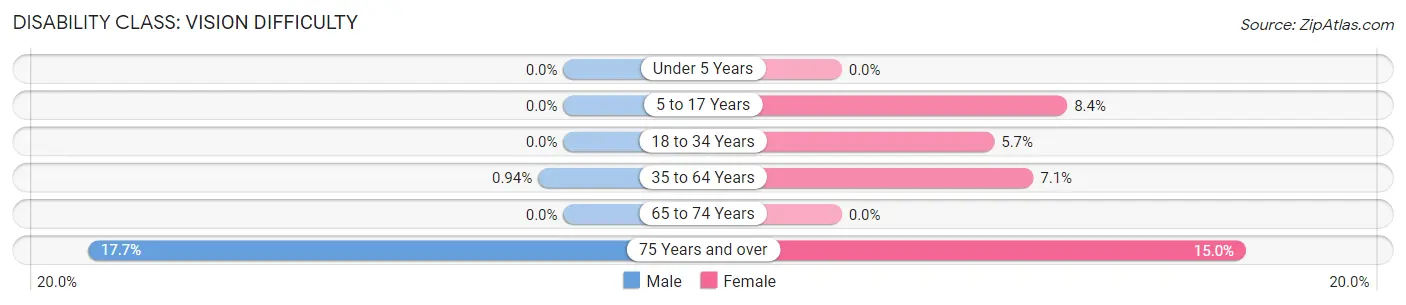
| Age Bracket | Male | Female |
| Under 5 Years | 0 (0.0%) | 0 (0.0%) |
| 5 to 17 Years | 0 (0.0%) | 20 (8.4%) |
| 18 to 34 Years | 0 (0.0%) | 9 (5.7%) |
| 35 to 64 Years | 4 (0.9%) | 29 (7.1%) |
| 65 to 74 Years | 0 (0.0%) | 0 (0.0%) |
| 75 Years and over | 12 (17.6%) | 6 (15.0%) |
Disability Class: Cognitive Difficulty
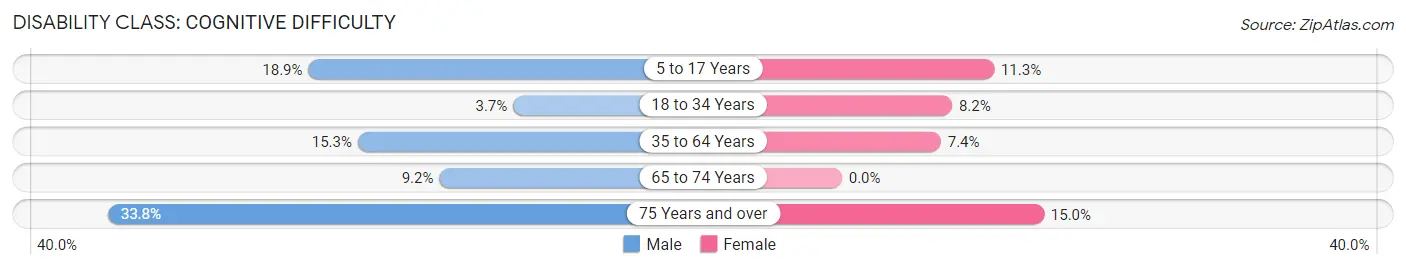
| Age Bracket | Male | Female |
| 5 to 17 Years | 39 (18.9%) | 27 (11.3%) |
| 18 to 34 Years | 6 (3.7%) | 13 (8.2%) |
| 35 to 64 Years | 65 (15.3%) | 30 (7.3%) |
| 65 to 74 Years | 7 (9.2%) | 0 (0.0%) |
| 75 Years and over | 23 (33.8%) | 6 (15.0%) |
Disability Class: Ambulatory Difficulty
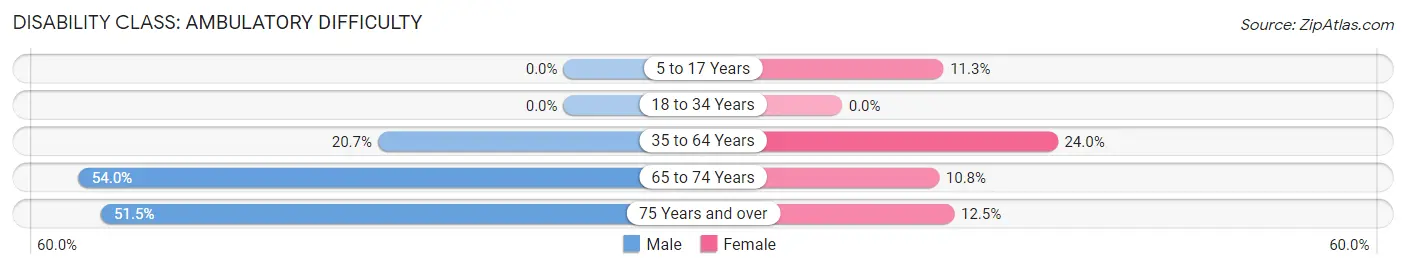
| Age Bracket | Male | Female |
| 5 to 17 Years | 0 (0.0%) | 27 (11.3%) |
| 18 to 34 Years | 0 (0.0%) | 0 (0.0%) |
| 35 to 64 Years | 88 (20.7%) | 98 (24.0%) |
| 65 to 74 Years | 41 (53.9%) | 16 (10.8%) |
| 75 Years and over | 35 (51.5%) | 5 (12.5%) |
Disability Class: Self-Care Difficulty
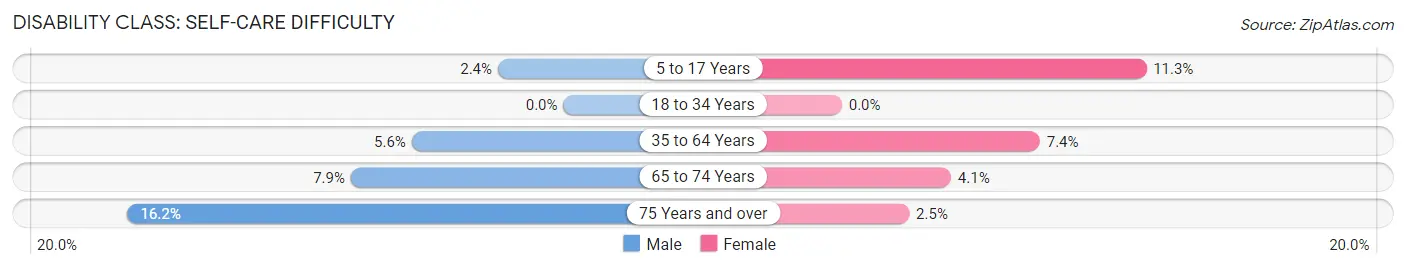
| Age Bracket | Male | Female |
| 5 to 17 Years | 5 (2.4%) | 27 (11.3%) |
| 18 to 34 Years | 0 (0.0%) | 0 (0.0%) |
| 35 to 64 Years | 24 (5.6%) | 30 (7.3%) |
| 65 to 74 Years | 6 (7.9%) | 6 (4.1%) |
| 75 Years and over | 11 (16.2%) | 1 (2.5%) |
Technology Access in Krebs
Computing Device Access in Krebs
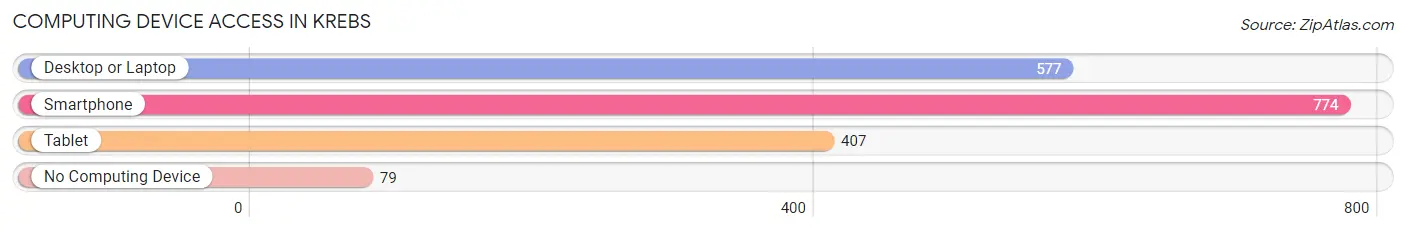
| Device Type | # Households | % Households |
| Desktop or Laptop | 577 | 66.8% |
| Smartphone | 774 | 89.6% |
| Tablet | 407 | 47.1% |
| No Computing Device | 79 | 9.1% |
| Total | 864 | 100.0% |
Internet Access in Krebs
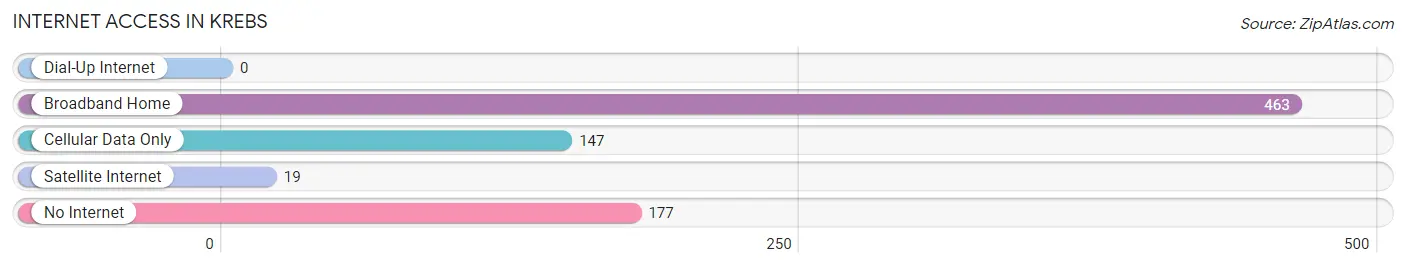
| Internet Type | # Households | % Households |
| Dial-Up Internet | 0 | 0.0% |
| Broadband Home | 463 | 53.6% |
| Cellular Data Only | 147 | 17.0% |
| Satellite Internet | 19 | 2.2% |
| No Internet | 177 | 20.5% |
| Total | 864 | 100.0% |
Krebs Summary
Krebs, Oklahoma is a small town located in Pittsburg County, in the southeastern part of the state. It is situated on the banks of the Kiamichi River, and is home to a population of approximately 2,000 people. The town was founded in 1898, and was named after a German immigrant, John Krebs, who had settled in the area.
Krebs is located in the foothills of the Ouachita Mountains, and is surrounded by rolling hills and lush forests. The town is known for its scenic beauty, and is a popular destination for outdoor recreation. The Kiamichi River provides excellent fishing opportunities, and the nearby lakes and streams offer excellent swimming and boating.
Krebs has a rich history, and was once a thriving coal mining town. The coal industry was the main source of employment for many of the town’s residents, and the town was home to several coal mines. The coal industry began to decline in the 1950s, and the town’s population began to decline as well.
Today, Krebs is a small, rural town with a population of just over 2,000 people. The town is home to a variety of businesses, including a grocery store, a hardware store, a pharmacy, and several restaurants. The town also has a post office, a library, and a few churches.
Krebs is served by the Pittsburg County School District, which includes two elementary schools, a middle school, and a high school. The town is also home to a branch of Eastern Oklahoma State College.
Krebs has a diverse economy, with a variety of industries providing employment opportunities for its residents. The town is home to several manufacturing companies, including a furniture factory, a plastics factory, and a metal fabrication plant. The town also has a number of retail stores, including a grocery store, a hardware store, and several restaurants.
Krebs is a small, rural town with a population of just over 2,000 people. The town is home to a variety of businesses, including a grocery store, a hardware store, a pharmacy, and several restaurants. The town also has a post office, a library, and a few churches. The town is served by the Pittsburg County School District, which includes two elementary schools, a middle school, and a high school. The town is also home to a branch of Eastern Oklahoma State College.
Krebs has a diverse economy, with a variety of industries providing employment opportunities for its residents. The town is home to several manufacturing companies, including a furniture factory, a plastics factory, and a metal fabrication plant. The town also has a number of retail stores, including a grocery store, a hardware store, and several restaurants. The town is also home to a number of small businesses, such as auto repair shops, beauty salons, and barber shops.
Krebs is a small, rural town with a population of just over 2,000 people. The town is home to a variety of businesses, including a grocery store, a hardware store, a pharmacy, and several restaurants. The town also has a post office, a library, and a few churches. The town is served by the Pittsburg County School District, which includes two elementary schools, a middle school, and a high school. The town is also home to a branch of Eastern Oklahoma State College.
Krebs has a diverse economy, with a variety of industries providing employment opportunities for its residents. The town is home to several manufacturing companies, including a furniture factory, a plastics factory, and a metal fabrication plant. The town also has a number of retail stores, including a grocery store, a hardware store, and several restaurants. The town is also home to a number of small businesses, such as auto repair shops, beauty salons, and barber shops. The town is also home to a number of agricultural businesses, including cattle ranches, poultry farms, and vegetable farms.
Krebs is a small, rural town with a population of just over 2,000 people. The town is home to a variety of businesses, including a grocery store, a hardware store, a pharmacy, and several restaurants. The town also has a post office, a library, and a few churches. The town is served by the Pittsburg County School District, which includes two elementary schools, a middle school, and a high school. The town is also home to a branch of Eastern Oklahoma State College.
Krebs is a diverse community, with a population that is made up of a variety of ethnic and racial backgrounds. The town is home to a large Native American population, as well as a significant Hispanic population. The town also has a large population of African Americans, as well as a small population of Asian Americans. The town is also home to a number of religious denominations, including Baptist, Methodist, and Catholic.
Krebs is a small, rural town with a population of just over 2,000 people. The town is home to a variety of businesses, including a grocery store, a hardware store, a pharmacy, and several restaurants. The town also has a post office, a library, and a few churches. The town is served by the Pittsburg County School District, which includes two elementary schools, a middle school, and a high school. The town is also home to a branch of Eastern Oklahoma State College. The town has a diverse economy, with a variety of industries providing employment opportunities for its residents. The town is home to several manufacturing companies, including a furniture factory, a plastics factory, and a metal fabrication plant. The town also has a number of retail stores, including a grocery store, a hardware store, and several restaurants. The town is also home to a number of small businesses, such as auto repair shops, beauty salons, and barber shops. The town is also home to a number of agricultural businesses, including cattle ranches, poultry farms, and vegetable farms. Krebs is a diverse community, with a population that is made up of a variety of ethnic and racial backgrounds. The town is home to a large Native American population, as well as a significant Hispanic population. The town also has a large population of African Americans, as well as a small population of Asian Americans. The town is also home to a number of religious denominations, including Baptist, Methodist, and Catholic.
Common Questions
What is Per Capita Income in Krebs?
Per Capita income in Krebs is $23,696.
What is the Median Family Income in Krebs?
Median Family Income in Krebs is $49,583.
What is the Median Household income in Krebs?
Median Household Income in Krebs is $45,761.
What is Income or Wage Gap in Krebs?
Income or Wage Gap in Krebs is 45.8%.
Women in Krebs earn 54.2 cents for every dollar earned by a man.
What is Family Income Deficit in Krebs?
Family Income Deficit in Krebs is $6,043.
Families that are below poverty line in Krebs earn $6,043 less on average than the poverty threshold level.
What is Inequality or Gini Index in Krebs?
Inequality or Gini Index in Krebs is 0.39.
What is the Total Population of Krebs?
Total Population of Krebs is 1,994.
What is the Total Male Population of Krebs?
Total Male Population of Krebs is 947.
What is the Total Female Population of Krebs?
Total Female Population of Krebs is 1,047.
What is the Ratio of Males per 100 Females in Krebs?
There are 90.45 Males per 100 Females in Krebs.
What is the Ratio of Females per 100 Males in Krebs?
There are 110.56 Females per 100 Males in Krebs.
What is the Median Population Age in Krebs?
Median Population Age in Krebs is 37.6 Years.
What is the Average Family Size in Krebs
Average Family Size in Krebs is 2.8 People.
What is the Average Household Size in Krebs
Average Household Size in Krebs is 2.3 People.
How Large is the Labor Force in Krebs?
There are 783 People in the Labor Forcein in Krebs.
What is the Percentage of People in the Labor Force in Krebs?
50.1% of People are in the Labor Force in Krebs.
What is the Unemployment Rate in Krebs?
Unemployment Rate in Krebs is 5.2%.