Kansas, OK Map & Demographics
Kansas Map
Kansas Overview
$23,386
PER CAPITA INCOME
$76,250
AVG FAMILY INCOME
$32,917
AVG HOUSEHOLD INCOME
9.5%
WAGE / INCOME GAP [ % ]
90.5¢/ $1
WAGE / INCOME GAP [ $ ]
0.56
INEQUALITY / GINI INDEX
770
TOTAL POPULATION
290
MALE POPULATION
480
FEMALE POPULATION
60.42
MALES / 100 FEMALES
165.52
FEMALES / 100 MALES
55.1
MEDIAN AGE
3.2
AVG FAMILY SIZE
2.2
AVG HOUSEHOLD SIZE
383
LABOR FORCE [ PEOPLE ]
56.7%
PERCENT IN LABOR FORCE
3.1%
UNEMPLOYMENT RATE
Kansas Zip Codes
Kansas Area Codes
Income in Kansas
Income Overview in Kansas
Per Capita Income in Kansas is $23,386, while median incomes of families and households are $76,250 and $32,917 respectively.
| Characteristic | Number | Measure |
| Per Capita Income | 770 | $23,386 |
| Median Family Income | 174 | $76,250 |
| Mean Family Income | 174 | $108,812 |
| Median Household Income | 347 | $32,917 |
| Mean Household Income | 347 | $66,530 |
| Income Deficit | 174 | $0 |
| Wage / Income Gap (%) | 770 | 9.47% |
| Wage / Income Gap ($) | 770 | 90.53¢ per $1 |
| Gini / Inequality Index | 770 | 0.56 |
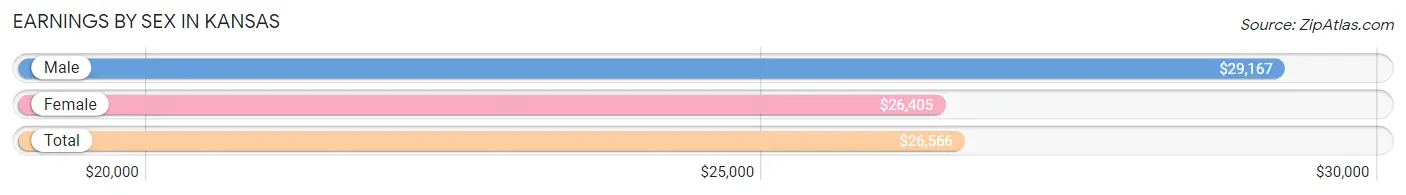
Earnings by Sex in Kansas
Average Earnings in Kansas are $26,566, $29,167 for men and $26,405 for women, a difference of 9.5%.
| Sex | Number | Average Earnings |
| Male | 176 (44.8%) | $29,167 |
| Female | 217 (55.2%) | $26,405 |
| Total | 393 (100.0%) | $26,566 |
Earnings by Sex by Income Bracket in Kansas
The most common earnings brackets in Kansas are $2,500 to $4,999 for men (20 | 11.4%) and $25,000 to $29,999 for women (103 | 47.5%).
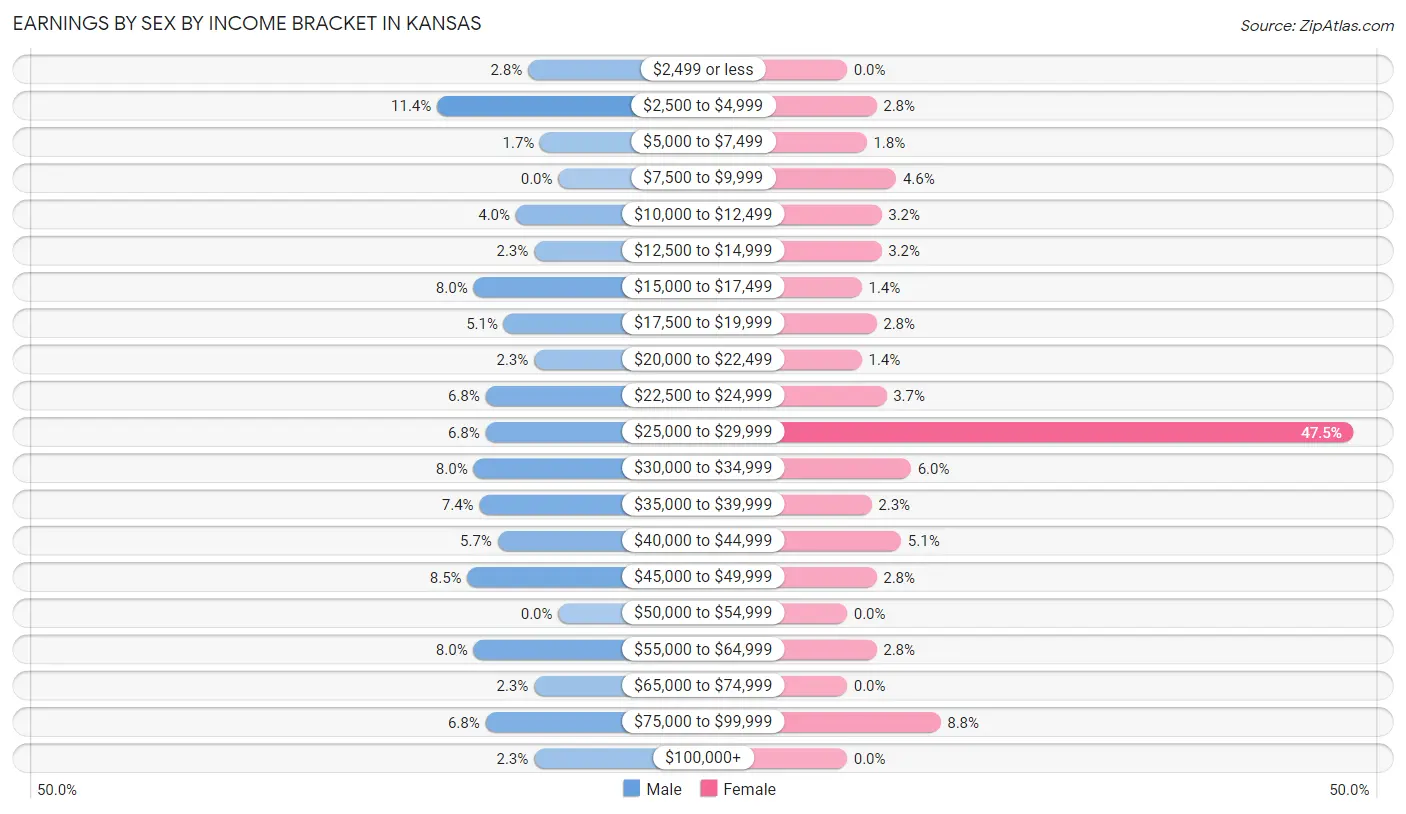
| Income | Male | Female |
| $2,499 or less | 5 (2.8%) | 0 (0.0%) |
| $2,500 to $4,999 | 20 (11.4%) | 6 (2.8%) |
| $5,000 to $7,499 | 3 (1.7%) | 4 (1.8%) |
| $7,500 to $9,999 | 0 (0.0%) | 10 (4.6%) |
| $10,000 to $12,499 | 7 (4.0%) | 7 (3.2%) |
| $12,500 to $14,999 | 4 (2.3%) | 7 (3.2%) |
| $15,000 to $17,499 | 14 (8.0%) | 3 (1.4%) |
| $17,500 to $19,999 | 9 (5.1%) | 6 (2.8%) |
| $20,000 to $22,499 | 4 (2.3%) | 3 (1.4%) |
| $22,500 to $24,999 | 12 (6.8%) | 8 (3.7%) |
| $25,000 to $29,999 | 12 (6.8%) | 103 (47.5%) |
| $30,000 to $34,999 | 14 (8.0%) | 13 (6.0%) |
| $35,000 to $39,999 | 13 (7.4%) | 5 (2.3%) |
| $40,000 to $44,999 | 10 (5.7%) | 11 (5.1%) |
| $45,000 to $49,999 | 15 (8.5%) | 6 (2.8%) |
| $50,000 to $54,999 | 0 (0.0%) | 0 (0.0%) |
| $55,000 to $64,999 | 14 (8.0%) | 6 (2.8%) |
| $65,000 to $74,999 | 4 (2.3%) | 0 (0.0%) |
| $75,000 to $99,999 | 12 (6.8%) | 19 (8.8%) |
| $100,000+ | 4 (2.3%) | 0 (0.0%) |
| Total | 176 (100.0%) | 217 (100.0%) |
Earnings by Sex by Educational Attainment in Kansas
Average earnings in Kansas are $33,864 for men and $26,478 for women, a difference of 21.8%. Men with an educational attainment of bachelor's degree enjoy the highest average annual earnings of $48,750, while those with high school diploma education earn the least with $30,417. Women with an educational attainment of bachelor's degree earn the most with the average annual earnings of $85,288, while those with less than high school education have the smallest earnings of $25,417.
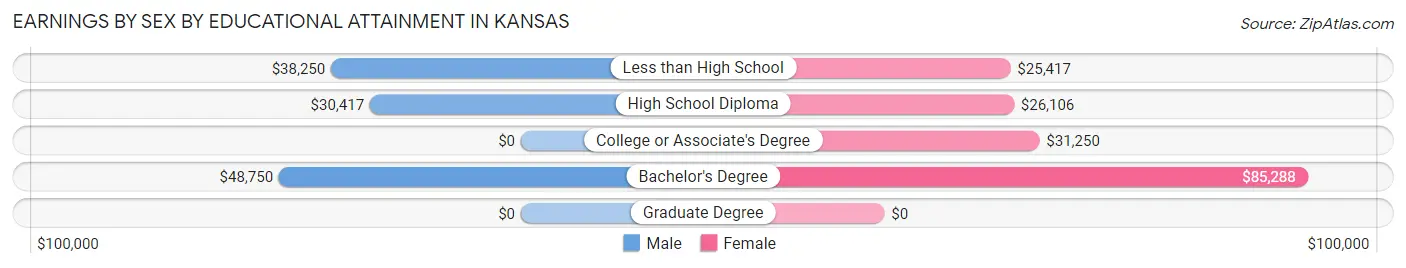
| Educational Attainment | Male Income | Female Income |
| Less than High School | $38,250 | $25,417 |
| High School Diploma | $30,417 | $26,106 |
| College or Associate's Degree | - | - |
| Bachelor's Degree | $48,750 | $85,288 |
| Graduate Degree | - | - |
| Total | $33,864 | $26,478 |
Family Income in Kansas
Family Income Brackets in Kansas
According to the Kansas family income data, there are 39 families falling into the $200,000+ income range, which is the most common income bracket and makes up 22.4% of all families.
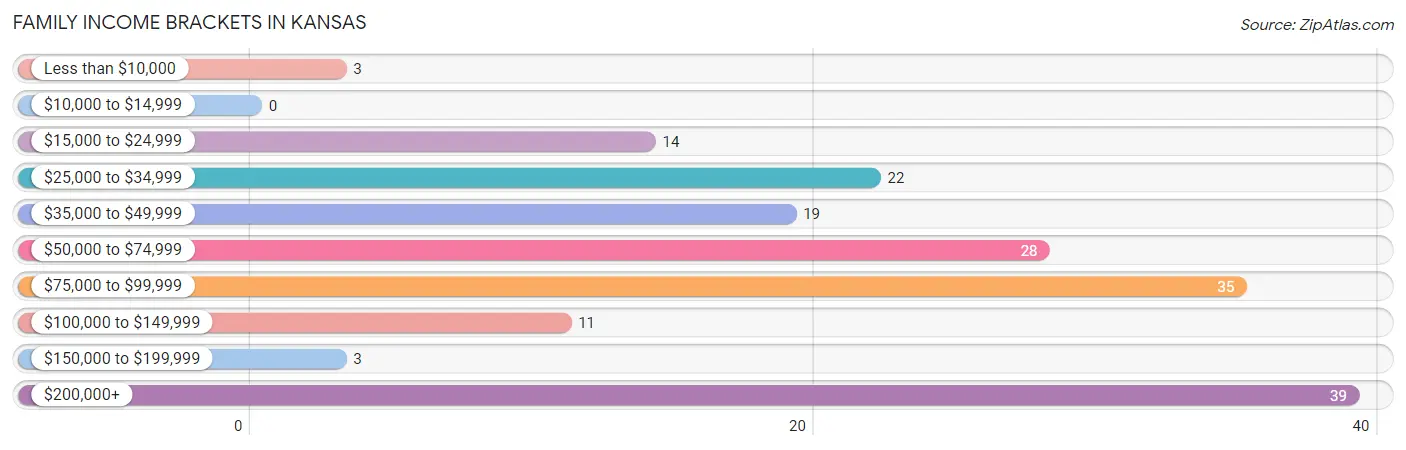
| Income Bracket | # Families | % Families |
| Less than $10,000 | 3 | 1.7% |
| $10,000 to $14,999 | 0 | 0.0% |
| $15,000 to $24,999 | 14 | 8.0% |
| $25,000 to $34,999 | 22 | 12.6% |
| $35,000 to $49,999 | 19 | 10.9% |
| $50,000 to $74,999 | 28 | 16.1% |
| $75,000 to $99,999 | 35 | 20.1% |
| $100,000 to $149,999 | 11 | 6.3% |
| $150,000 to $199,999 | 3 | 1.7% |
| $200,000+ | 39 | 22.4% |
Family Income by Famaliy Size in Kansas
7+ person families (7 | 4.0%) account for the highest median family income in Kansas with $92,813 per family, while 3-person families (31 | 17.8%) have the highest median income of $22,917 per family member.
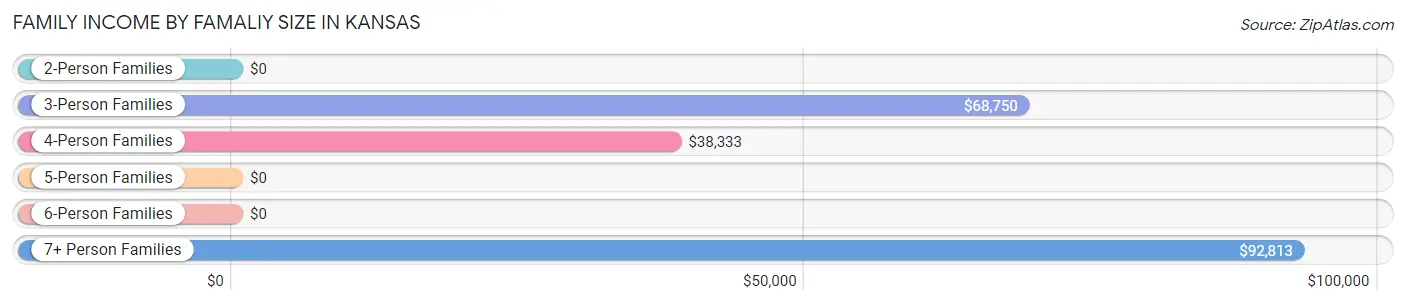
| Income Bracket | # Families | Median Income |
| 2-Person Families | 106 (60.9%) | $0 |
| 3-Person Families | 31 (17.8%) | $68,750 |
| 4-Person Families | 22 (12.6%) | $38,333 |
| 5-Person Families | 2 (1.1%) | $0 |
| 6-Person Families | 6 (3.5%) | $0 |
| 7+ Person Families | 7 (4.0%) | $92,813 |
| Total | 174 (100.0%) | $76,250 |
Family Income by Number of Earners in Kansas
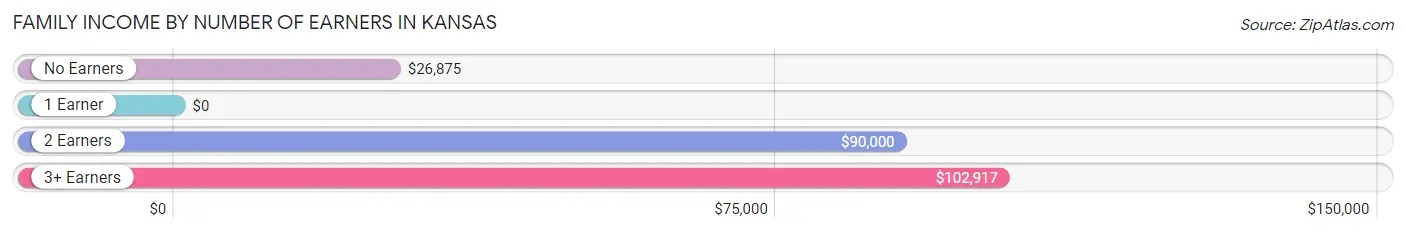
| Number of Earners | # Families | Median Income |
| No Earners | 15 (8.6%) | $26,875 |
| 1 Earner | 92 (52.9%) | $0 |
| 2 Earners | 48 (27.6%) | $90,000 |
| 3+ Earners | 19 (10.9%) | $102,917 |
| Total | 174 (100.0%) | $76,250 |
Household Income in Kansas
Household Income Brackets in Kansas
With 98 households falling in the category, the $10,000 to $14,999 income range is the most frequent in Kansas, accounting for 28.2% of all households. In contrast, only 5 households (1.4%) fall into the $150,000 to $199,999 income bracket, making it the least populous group.
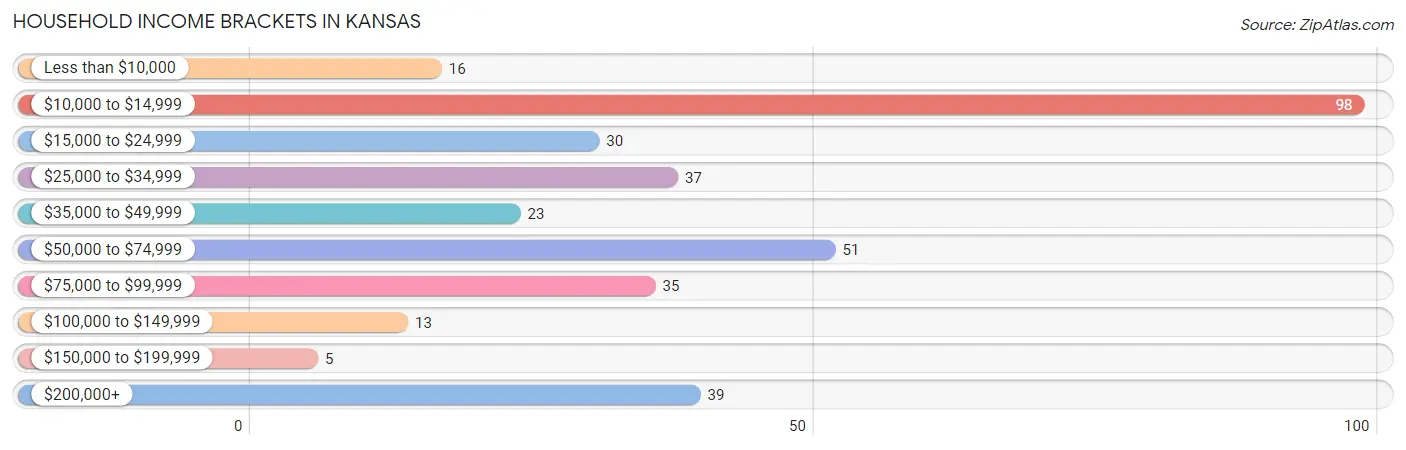
| Income Bracket | # Households | % Households |
| Less than $10,000 | 16 | 4.6% |
| $10,000 to $14,999 | 98 | 28.2% |
| $15,000 to $24,999 | 30 | 8.6% |
| $25,000 to $34,999 | 37 | 10.7% |
| $35,000 to $49,999 | 23 | 6.6% |
| $50,000 to $74,999 | 51 | 14.7% |
| $75,000 to $99,999 | 35 | 10.1% |
| $100,000 to $149,999 | 13 | 3.7% |
| $150,000 to $199,999 | 5 | 1.4% |
| $200,000+ | 39 | 11.2% |
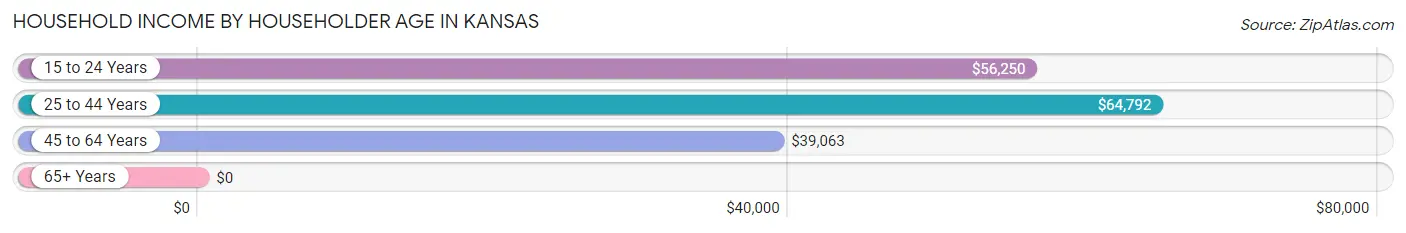
Household Income by Householder Age in Kansas
The median household income in Kansas is $32,917, with the highest median household income of $64,792 found in the 25 to 44 years age bracket for the primary householder. A total of 71 households (20.5%) fall into this category. Meanwhile, the 65+ years age bracket for the primary householder has the lowest median household income of $0, with 185 households (53.3%) in this group.
| Income Bracket | # Households | Median Income |
| 15 to 24 Years | 10 (2.9%) | $56,250 |
| 25 to 44 Years | 71 (20.5%) | $64,792 |
| 45 to 64 Years | 81 (23.3%) | $39,063 |
| 65+ Years | 185 (53.3%) | $0 |
| Total | 347 (100.0%) | $32,917 |
Poverty in Kansas
Income Below Poverty by Sex and Age in Kansas
With 8.6% poverty level for males and 29.6% for females among the residents of Kansas, 15 year old males and 15 year old females are the most vulnerable to poverty, with 2 males (40.0%) and 1 females (100.0%) in their respective age groups living below the poverty level.
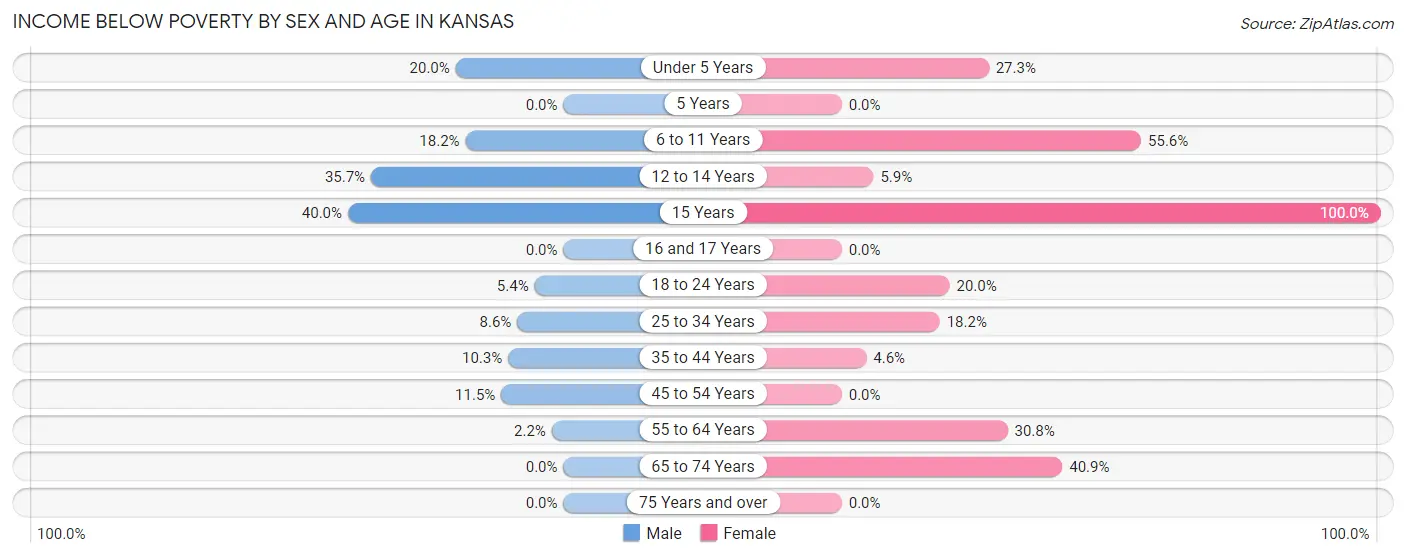
| Age Bracket | Male | Female |
| Under 5 Years | 2 (20.0%) | 3 (27.3%) |
| 5 Years | 0 (0.0%) | 0 (0.0%) |
| 6 to 11 Years | 2 (18.2%) | 10 (55.6%) |
| 12 to 14 Years | 5 (35.7%) | 1 (5.9%) |
| 15 Years | 2 (40.0%) | 1 (100.0%) |
| 16 and 17 Years | 0 (0.0%) | 0 (0.0%) |
| 18 to 24 Years | 3 (5.4%) | 5 (20.0%) |
| 25 to 34 Years | 3 (8.6%) | 8 (18.2%) |
| 35 to 44 Years | 4 (10.3%) | 1 (4.5%) |
| 45 to 54 Years | 3 (11.5%) | 0 (0.0%) |
| 55 to 64 Years | 1 (2.2%) | 16 (30.8%) |
| 65 to 74 Years | 0 (0.0%) | 97 (40.9%) |
| 75 Years and over | 0 (0.0%) | 0 (0.0%) |
| Total | 25 (8.6%) | 142 (29.6%) |
Income Above Poverty by Sex and Age in Kansas
According to the poverty statistics in Kansas, males aged 5 years and females aged 5 years are the age groups that are most secure financially, with 100.0% of males and 100.0% of females in these age groups living above the poverty line.
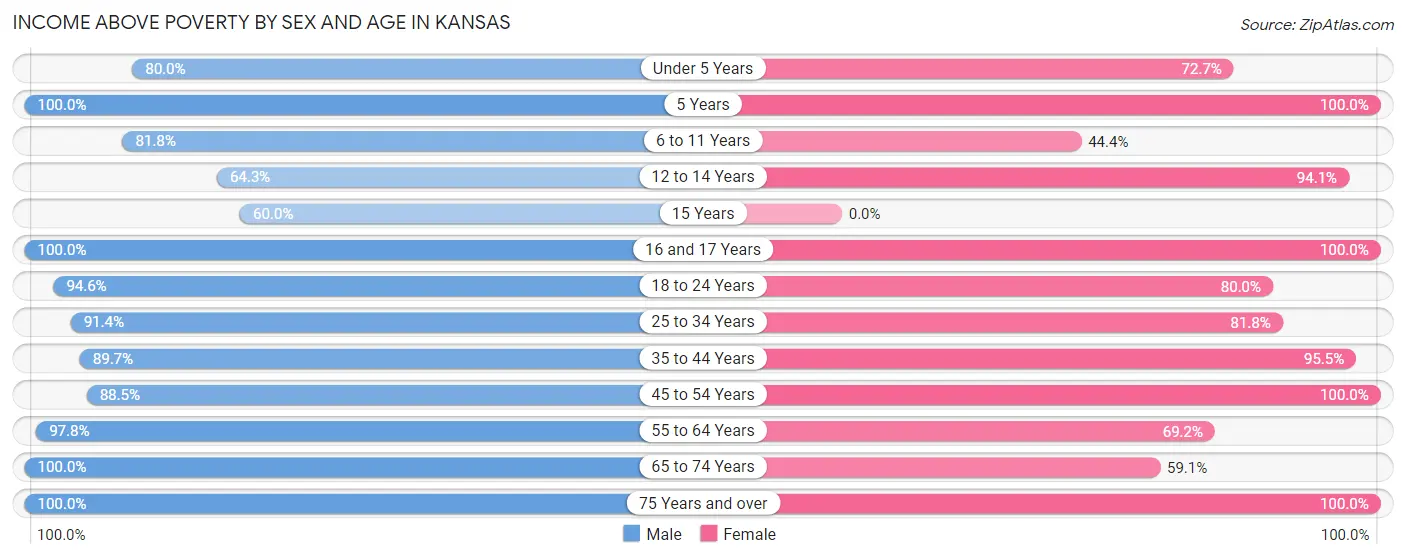
| Age Bracket | Male | Female |
| Under 5 Years | 8 (80.0%) | 8 (72.7%) |
| 5 Years | 5 (100.0%) | 2 (100.0%) |
| 6 to 11 Years | 9 (81.8%) | 8 (44.4%) |
| 12 to 14 Years | 9 (64.3%) | 16 (94.1%) |
| 15 Years | 3 (60.0%) | 0 (0.0%) |
| 16 and 17 Years | 7 (100.0%) | 9 (100.0%) |
| 18 to 24 Years | 53 (94.6%) | 20 (80.0%) |
| 25 to 34 Years | 32 (91.4%) | 36 (81.8%) |
| 35 to 44 Years | 35 (89.7%) | 21 (95.5%) |
| 45 to 54 Years | 23 (88.5%) | 25 (100.0%) |
| 55 to 64 Years | 45 (97.8%) | 36 (69.2%) |
| 65 to 74 Years | 22 (100.0%) | 140 (59.1%) |
| 75 Years and over | 13 (100.0%) | 17 (100.0%) |
| Total | 264 (91.3%) | 338 (70.4%) |
Income Below Poverty Among Married-Couple Families in Kansas
The poverty statistics for married-couple families in Kansas show that 4.0% or 5 of the total 125 families live below the poverty line. Families with 5 or more children have the highest poverty rate of 20.0%, comprising of 1 families. On the other hand, families with no children have the lowest poverty rate of 0.0%, which includes 0 families.
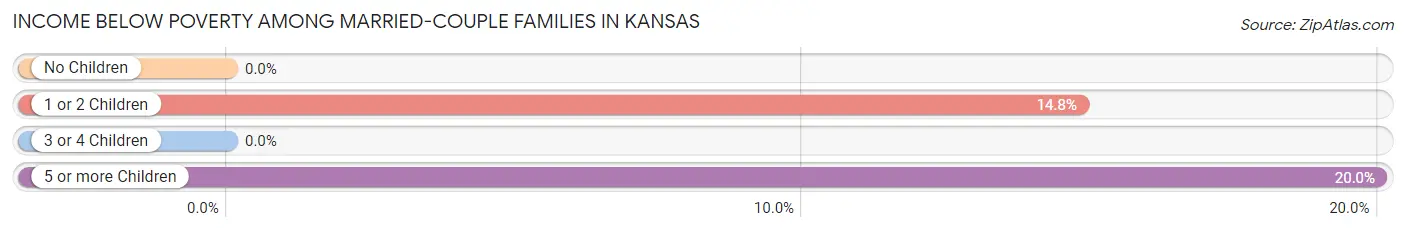
| Children | Above Poverty | Below Poverty |
| No Children | 88 (100.0%) | 0 (0.0%) |
| 1 or 2 Children | 23 (85.2%) | 4 (14.8%) |
| 3 or 4 Children | 5 (100.0%) | 0 (0.0%) |
| 5 or more Children | 4 (80.0%) | 1 (20.0%) |
| Total | 120 (96.0%) | 5 (4.0%) |
Income Below Poverty Among Single-Parent Households in Kansas
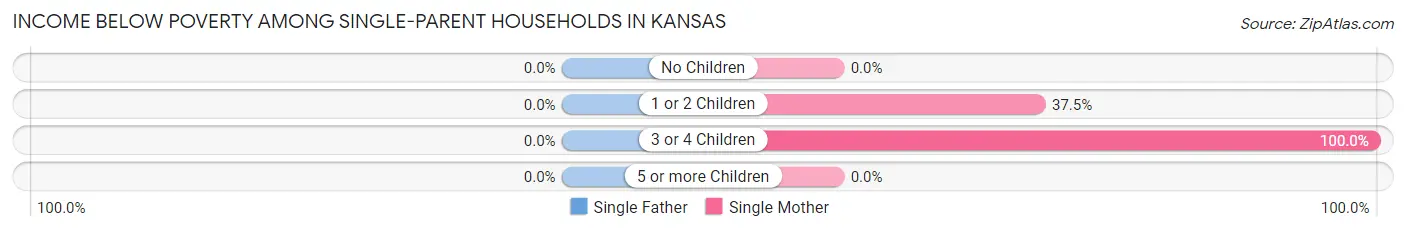
| Children | Single Father | Single Mother |
| No Children | 0 (0.0%) | 0 (0.0%) |
| 1 or 2 Children | 0 (0.0%) | 3 (37.5%) |
| 3 or 4 Children | 0 (0.0%) | 3 (100.0%) |
| 5 or more Children | 0 (0.0%) | 0 (0.0%) |
| Total | 0 (0.0%) | 6 (14.3%) |
Income Below Poverty Among Married-Couple vs Single-Parent Households in Kansas
The poverty data for Kansas shows that 5 of the married-couple family households (4.0%) and 6 of the single-parent households (12.2%) are living below the poverty level. Within the married-couple family households, those with 5 or more children have the highest poverty rate, with 1 households (20.0%) falling below the poverty line. Among the single-parent households, those with 3 or 4 children have the highest poverty rate, with 3 household (100.0%) living below poverty.
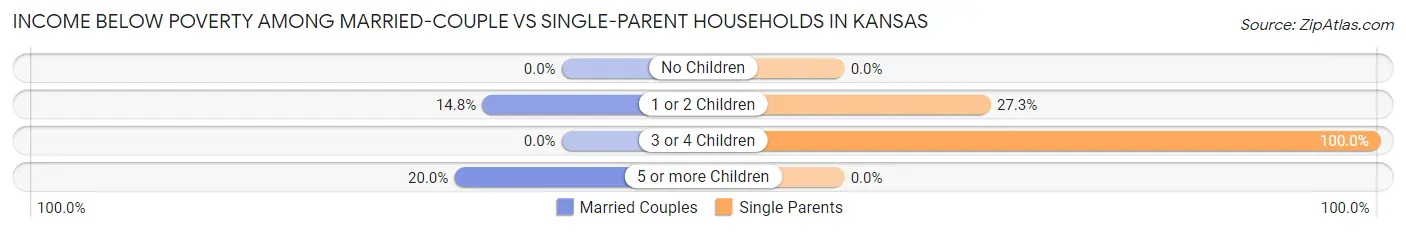
| Children | Married-Couple Families | Single-Parent Households |
| No Children | 0 (0.0%) | 0 (0.0%) |
| 1 or 2 Children | 4 (14.8%) | 3 (27.3%) |
| 3 or 4 Children | 0 (0.0%) | 3 (100.0%) |
| 5 or more Children | 1 (20.0%) | 0 (0.0%) |
| Total | 5 (4.0%) | 6 (12.2%) |
Race in Kansas
The most populous races in Kansas are White / Caucasian (379 | 49.2%), Native / Alaskan (357 | 46.4%), and Two or more Races (29 | 3.8%).
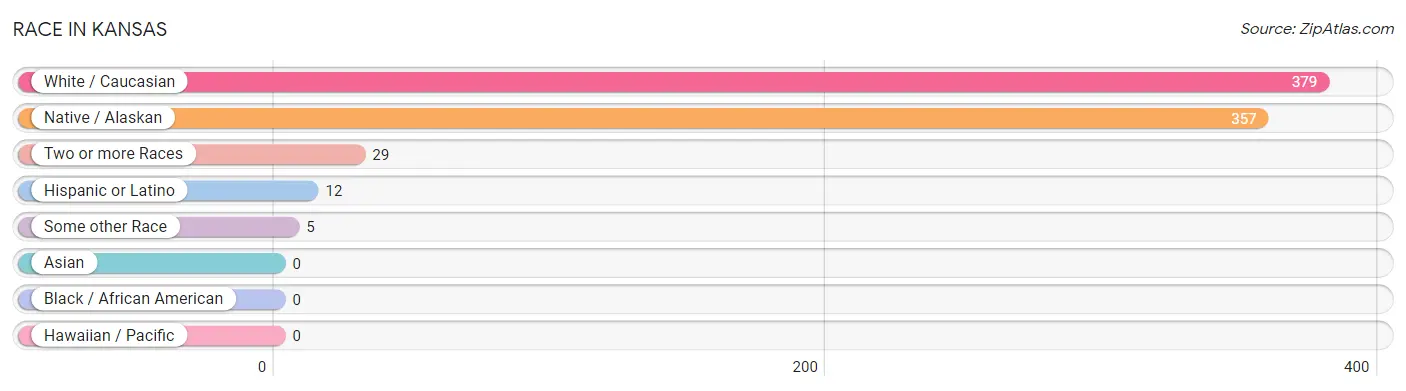
| Race | # Population | % Population |
| Asian | 0 | 0.0% |
| Black / African American | 0 | 0.0% |
| Hawaiian / Pacific | 0 | 0.0% |
| Hispanic or Latino | 12 | 1.6% |
| Native / Alaskan | 357 | 46.4% |
| White / Caucasian | 379 | 49.2% |
| Two or more Races | 29 | 3.8% |
| Some other Race | 5 | 0.6% |
| Total | 770 | 100.0% |
Ancestry in Kansas
The most populous ancestries reported in Kansas are Cherokee (367 | 47.7%), English (84 | 10.9%), German (32 | 4.2%), Choctaw (25 | 3.3%), and American (20 | 2.6%), together accounting for 68.6% of all Kansas residents.
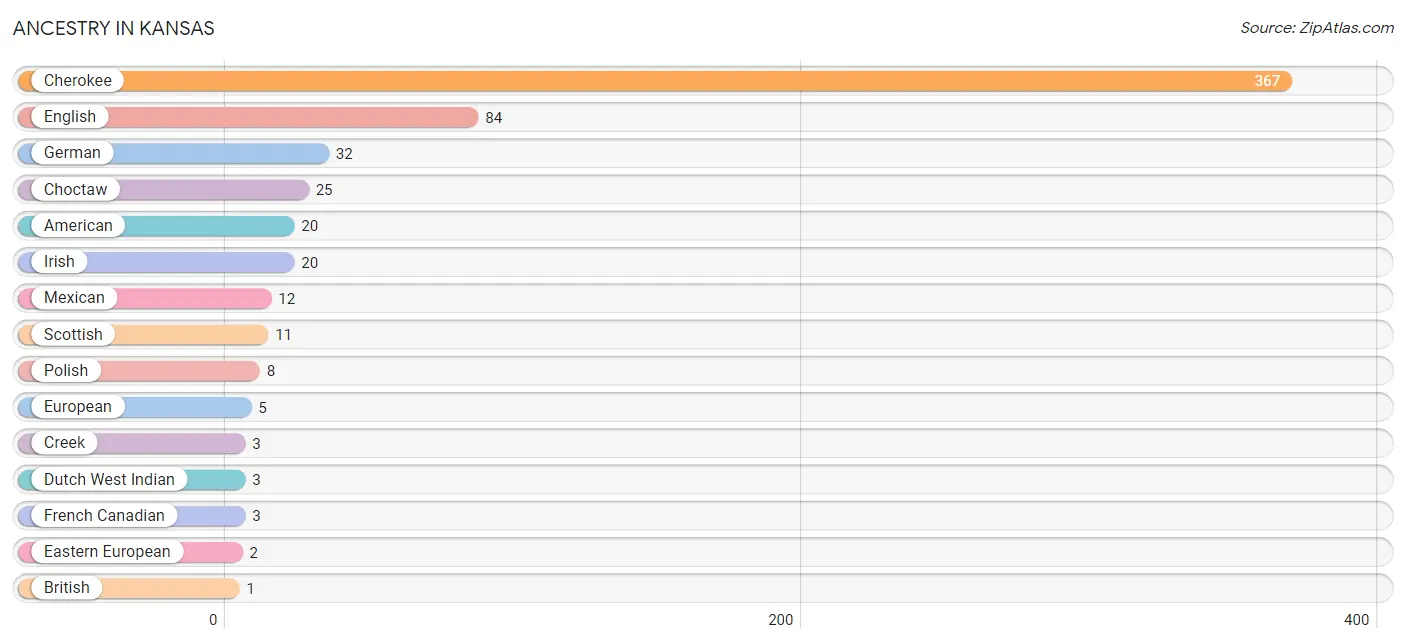
| Ancestry | # Population | % Population |
| American | 20 | 2.6% |
| British | 1 | 0.1% |
| Cherokee | 367 | 47.7% |
| Choctaw | 25 | 3.3% |
| Creek | 3 | 0.4% |
| Dutch West Indian | 3 | 0.4% |
| Eastern European | 2 | 0.3% |
| English | 84 | 10.9% |
| European | 5 | 0.6% |
| French Canadian | 3 | 0.4% |
| German | 32 | 4.2% |
| Irish | 20 | 2.6% |
| Mexican | 12 | 1.6% |
| Polish | 8 | 1.0% |
| Scottish | 11 | 1.4% | View All 15 Rows |
Immigrants in Kansas
The most numerous immigrant groups reported in Kansas came from Central America (8 | 1.0%), Latin America (8 | 1.0%), and Mexico (8 | 1.0%), together accounting for 3.1% of all Kansas residents.
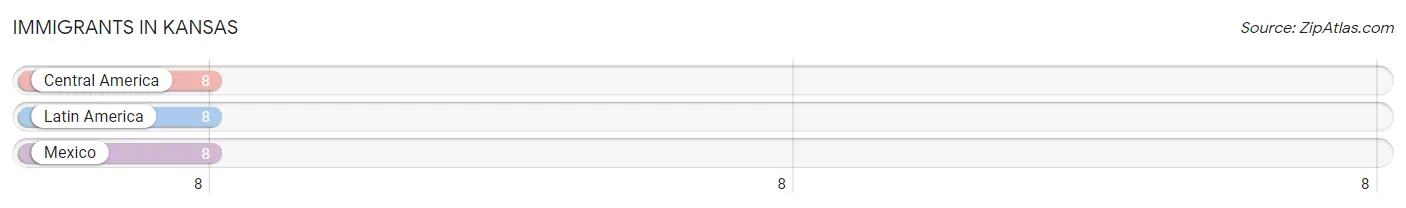
| Immigration Origin | # Population | % Population |
| Central America | 8 | 1.0% |
| Latin America | 8 | 1.0% |
| Mexico | 8 | 1.0% | View All 3 Rows |
Sex and Age in Kansas
Sex and Age in Kansas
The most populous age groups in Kansas are 20 to 24 Years (40 | 13.8%) for men and 65 to 69 Years (214 | 44.6%) for women.
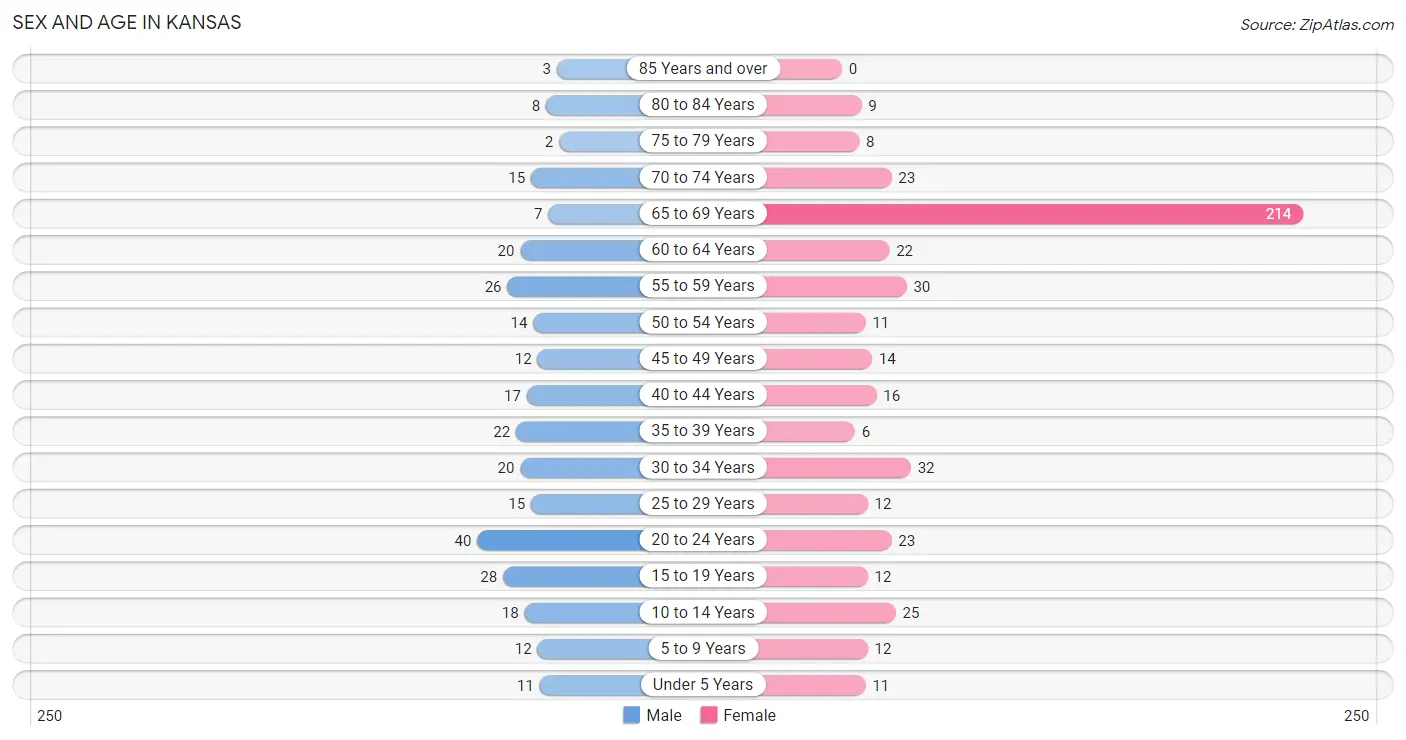
| Age Bracket | Male | Female |
| Under 5 Years | 11 (3.8%) | 11 (2.3%) |
| 5 to 9 Years | 12 (4.1%) | 12 (2.5%) |
| 10 to 14 Years | 18 (6.2%) | 25 (5.2%) |
| 15 to 19 Years | 28 (9.7%) | 12 (2.5%) |
| 20 to 24 Years | 40 (13.8%) | 23 (4.8%) |
| 25 to 29 Years | 15 (5.2%) | 12 (2.5%) |
| 30 to 34 Years | 20 (6.9%) | 32 (6.7%) |
| 35 to 39 Years | 22 (7.6%) | 6 (1.3%) |
| 40 to 44 Years | 17 (5.9%) | 16 (3.3%) |
| 45 to 49 Years | 12 (4.1%) | 14 (2.9%) |
| 50 to 54 Years | 14 (4.8%) | 11 (2.3%) |
| 55 to 59 Years | 26 (9.0%) | 30 (6.2%) |
| 60 to 64 Years | 20 (6.9%) | 22 (4.6%) |
| 65 to 69 Years | 7 (2.4%) | 214 (44.6%) |
| 70 to 74 Years | 15 (5.2%) | 23 (4.8%) |
| 75 to 79 Years | 2 (0.7%) | 8 (1.7%) |
| 80 to 84 Years | 8 (2.8%) | 9 (1.9%) |
| 85 Years and over | 3 (1.0%) | 0 (0.0%) |
| Total | 290 (100.0%) | 480 (100.0%) |
Families and Households in Kansas
Median Family Size in Kansas
The median family size in Kansas is 3.21 persons per family, with married-couple families (125 | 71.8%) accounting for the largest median family size of 3.31 persons per family. On the other hand, single male/father families (7 | 4.0%) represent the smallest median family size with 1.71 persons per family.
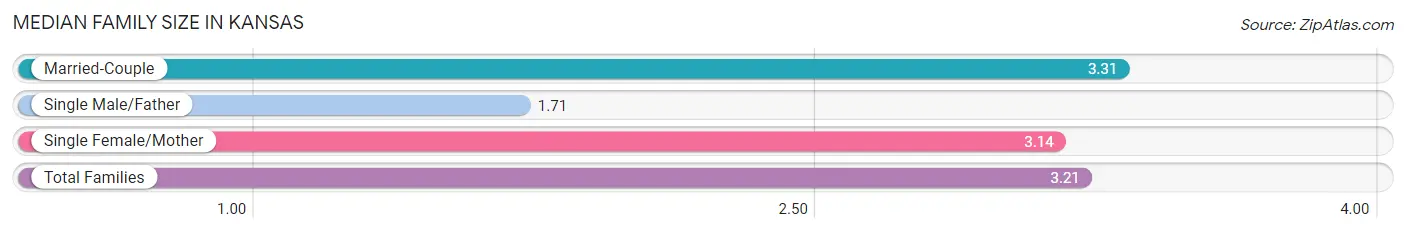
| Family Type | # Families | Family Size |
| Married-Couple | 125 (71.8%) | 3.31 |
| Single Male/Father | 7 (4.0%) | 1.71 |
| Single Female/Mother | 42 (24.1%) | 3.14 |
| Total Families | 174 (100.0%) | 3.21 |
Median Household Size in Kansas
The median household size in Kansas is 2.22 persons per household, with married-couple households (125 | 36.0%) accounting for the largest median household size of 3.31 persons per household. non-family households (173 | 49.9%) represent the smallest median household size with 1.17 persons per household.
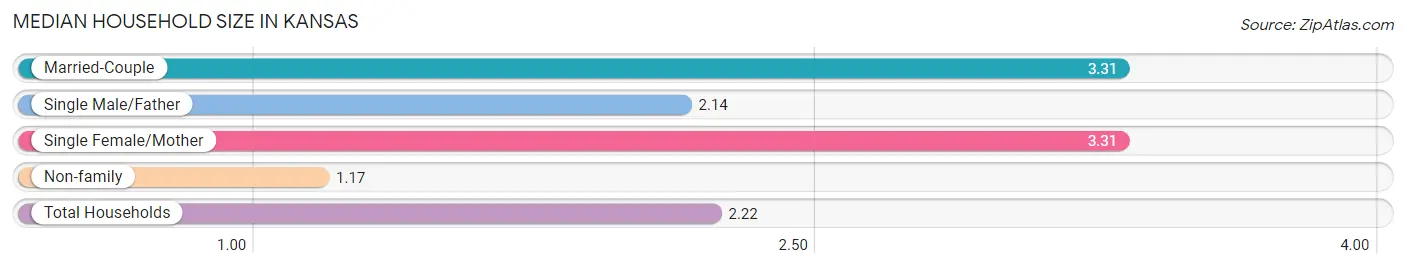
| Household Type | # Households | Household Size |
| Married-Couple | 125 (36.0%) | 3.31 |
| Single Male/Father | 7 (2.0%) | 2.14 |
| Single Female/Mother | 42 (12.1%) | 3.31 |
| Non-family | 173 (49.9%) | 1.17 |
| Total Households | 347 (100.0%) | 2.22 |
Household Size by Marriage Status in Kansas
Out of a total of 347 households in Kansas, 174 (50.1%) are family households, while 173 (49.9%) are nonfamily households. The most numerous type of family households are 2-person households, comprising 101, and the most common type of nonfamily households are 1-person households, comprising 159.
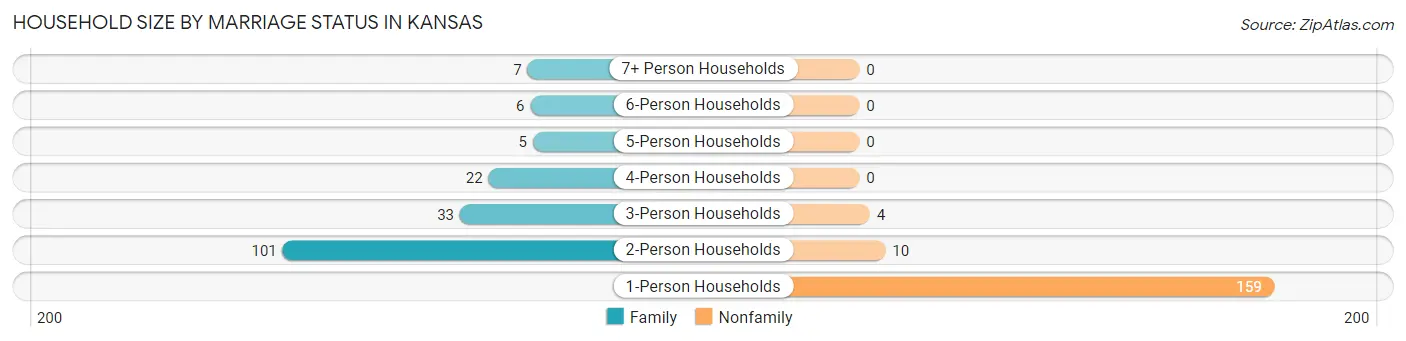
| Household Size | Family Households | Nonfamily Households |
| 1-Person Households | - | 159 (45.8%) |
| 2-Person Households | 101 (29.1%) | 10 (2.9%) |
| 3-Person Households | 33 (9.5%) | 4 (1.1%) |
| 4-Person Households | 22 (6.3%) | 0 (0.0%) |
| 5-Person Households | 5 (1.4%) | 0 (0.0%) |
| 6-Person Households | 6 (1.7%) | 0 (0.0%) |
| 7+ Person Households | 7 (2.0%) | 0 (0.0%) |
| Total | 174 (50.1%) | 173 (49.9%) |
Female Fertility in Kansas
Fertility by Age in Kansas
Average fertility rate in Kansas is 61.0 births per 1,000 women. Women in the age bracket of 20 to 34 years have the highest fertility rate with 104.0 births per 1,000 women. Women in the age bracket of 20 to 34 years acount for 100.0% of all women with births.
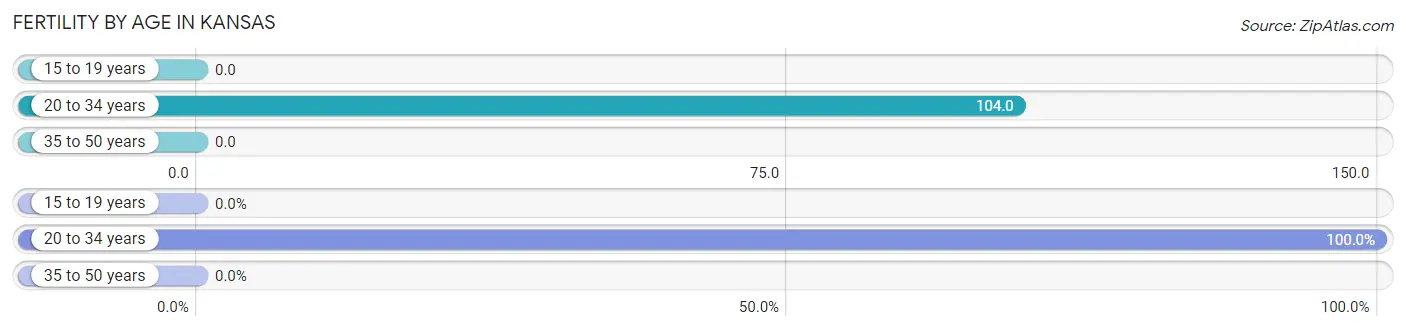
| Age Bracket | Women with Births | Births / 1,000 Women |
| 15 to 19 years | 0 (0.0%) | 0.0 |
| 20 to 34 years | 7 (100.0%) | 104.0 |
| 35 to 50 years | 0 (0.0%) | 0.0 |
| Total | 7 (100.0%) | 61.0 |
Fertility by Age by Marriage Status in Kansas
42.9% of women with births (7) in Kansas are married. The highest percentage of unmarried women with births falls into 20 to 34 years age bracket with 57.1% of them unmarried at the time of birth, while the lowest percentage of unmarried women with births belong to 20 to 34 years age bracket with 57.1% of them unmarried.
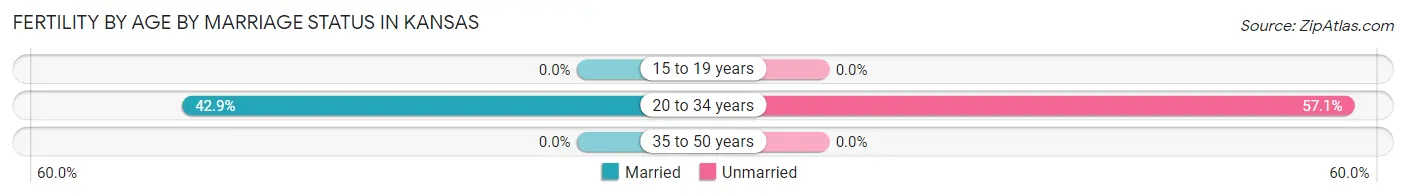
| Age Bracket | Married | Unmarried |
| 15 to 19 years | 0 (0.0%) | 0 (0.0%) |
| 20 to 34 years | 3 (42.9%) | 4 (57.1%) |
| 35 to 50 years | 0 (0.0%) | 0 (0.0%) |
| Total | 3 (42.9%) | 4 (57.1%) |
Fertility by Education in Kansas
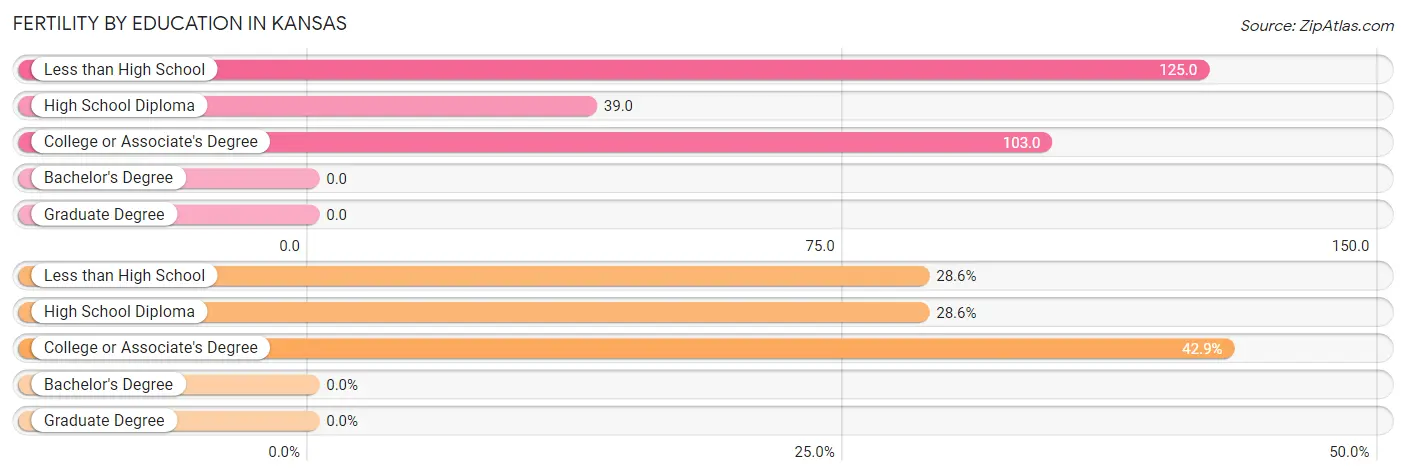
| Educational Attainment | Women with Births | Births / 1,000 Women |
| Less than High School | 2 (28.6%) | 125.0 |
| High School Diploma | 2 (28.6%) | 39.0 |
| College or Associate's Degree | 3 (42.9%) | 103.0 |
| Bachelor's Degree | 0 (0.0%) | 0.0 |
| Graduate Degree | 0 (0.0%) | 0.0 |
| Total | 7 (100.0%) | 61.0 |
Fertility by Education by Marriage Status in Kansas
57.1% of women with births in Kansas are unmarried. Women with the educational attainment of college or associate's degree are most likely to be married with 100.0% of them married at childbirth, while women with the educational attainment of less than high school are least likely to be married with 100.0% of them unmarried at childbirth.
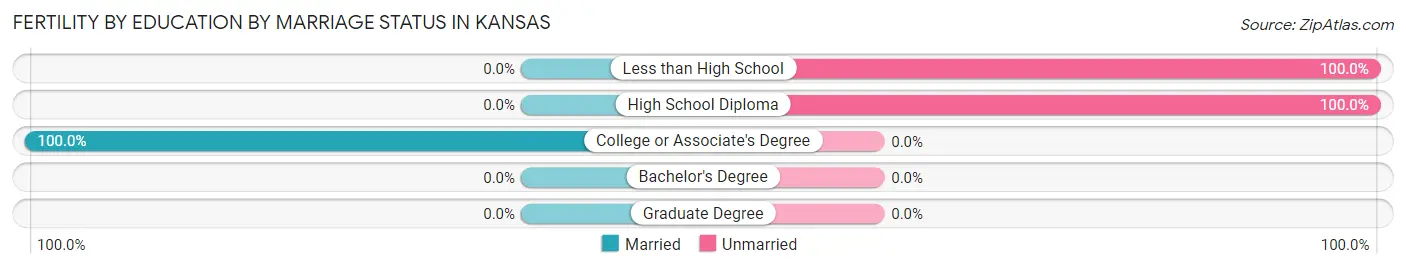
| Educational Attainment | Married | Unmarried |
| Less than High School | 0 (0.0%) | 2 (100.0%) |
| High School Diploma | 0 (0.0%) | 2 (100.0%) |
| College or Associate's Degree | 3 (100.0%) | 0 (0.0%) |
| Bachelor's Degree | 0 (0.0%) | 0 (0.0%) |
| Graduate Degree | 0 (0.0%) | 0 (0.0%) |
| Total | 3 (42.9%) | 4 (57.1%) |
Employment Characteristics in Kansas
Employment by Class of Employer in Kansas
Among the 367 employed individuals in Kansas, private company employees (269 | 73.3%), state government employees (37 | 10.1%), and local government employees (24 | 6.5%) make up the most common classes of employment.
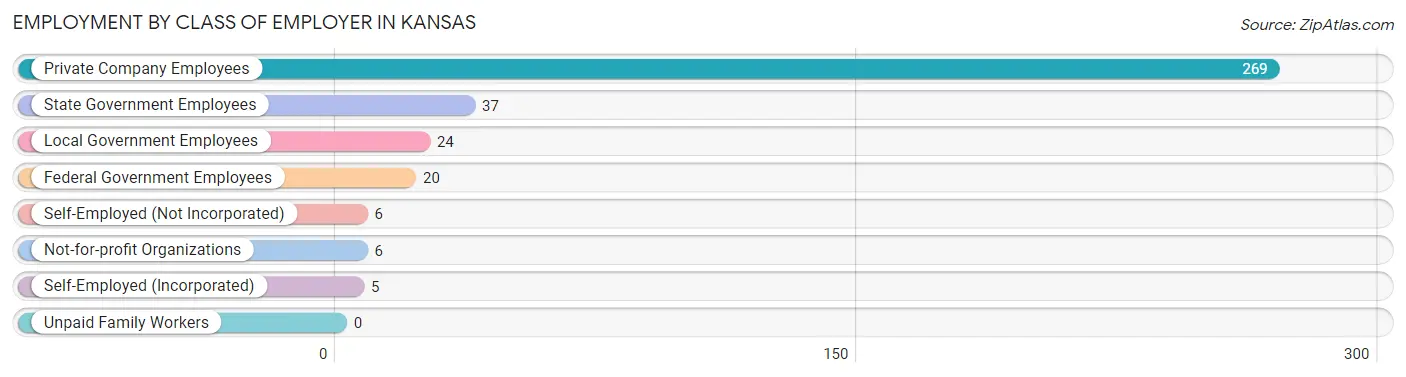
| Employer Class | # Employees | % Employees |
| Private Company Employees | 269 | 73.3% |
| Self-Employed (Incorporated) | 5 | 1.4% |
| Self-Employed (Not Incorporated) | 6 | 1.6% |
| Not-for-profit Organizations | 6 | 1.6% |
| Local Government Employees | 24 | 6.5% |
| State Government Employees | 37 | 10.1% |
| Federal Government Employees | 20 | 5.4% |
| Unpaid Family Workers | 0 | 0.0% |
| Total | 367 | 100.0% |
Employment Status by Age in Kansas
According to the labor force statistics for Kansas, out of the total population over 16 years of age (675), 56.7% or 383 individuals are in the labor force, with 3.1% or 12 of them unemployed. The age group with the highest labor force participation rate is 20 to 24 years, with 93.7% or 59 individuals in the labor force. Within the labor force, the 25 to 29 years age range has the highest percentage of unemployed individuals, with 18.2% or 4 of them being unemployed.
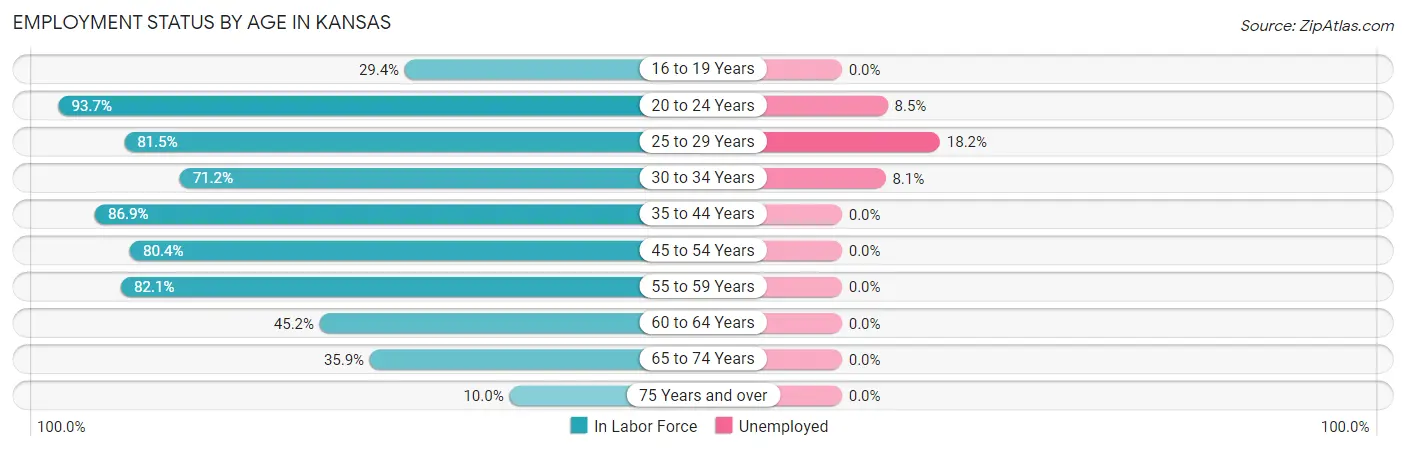
| Age Bracket | In Labor Force | Unemployed |
| 16 to 19 Years | 10 (29.4%) | 0 (0.0%) |
| 20 to 24 Years | 59 (93.7%) | 5 (8.5%) |
| 25 to 29 Years | 22 (81.5%) | 4 (18.2%) |
| 30 to 34 Years | 37 (71.2%) | 3 (8.1%) |
| 35 to 44 Years | 53 (86.9%) | 0 (0.0%) |
| 45 to 54 Years | 41 (80.4%) | 0 (0.0%) |
| 55 to 59 Years | 46 (82.1%) | 0 (0.0%) |
| 60 to 64 Years | 19 (45.2%) | 0 (0.0%) |
| 65 to 74 Years | 93 (35.9%) | 0 (0.0%) |
| 75 Years and over | 3 (10.0%) | 0 (0.0%) |
| Total | 383 (56.7%) | 12 (3.1%) |
Employment Status by Educational Attainment in Kansas
According to labor force statistics for Kansas, 75.4% of individuals (218) out of the total population between 25 and 64 years of age (289) are in the labor force, with 3.2% or 7 of them being unemployed. The group with the highest labor force participation rate are those with the educational attainment of bachelor's degree or higher, with 92.9% or 39 individuals in the labor force. Within the labor force, individuals with college / associate degree education have the highest percentage of unemployment, with 11.4% or 4 of them being unemployed.
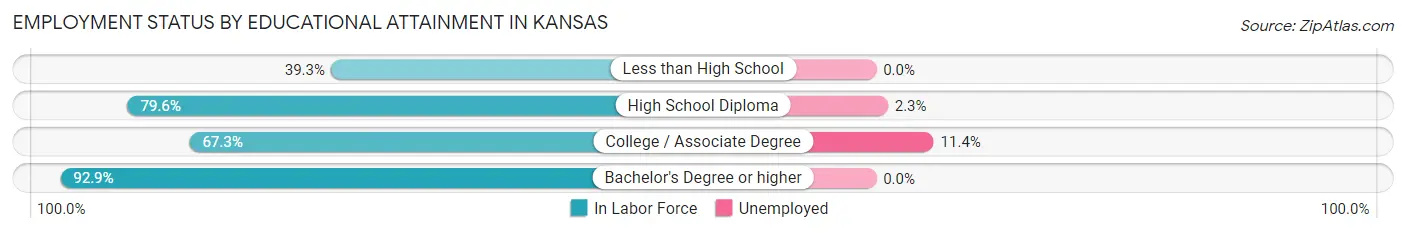
| Educational Attainment | In Labor Force | Unemployed |
| Less than High School | 11 (39.3%) | 0 (0.0%) |
| High School Diploma | 133 (79.6%) | 4 (2.3%) |
| College / Associate Degree | 35 (67.3%) | 6 (11.4%) |
| Bachelor's Degree or higher | 39 (92.9%) | 0 (0.0%) |
| Total | 218 (75.4%) | 9 (3.2%) |
Employment Occupations by Sex in Kansas
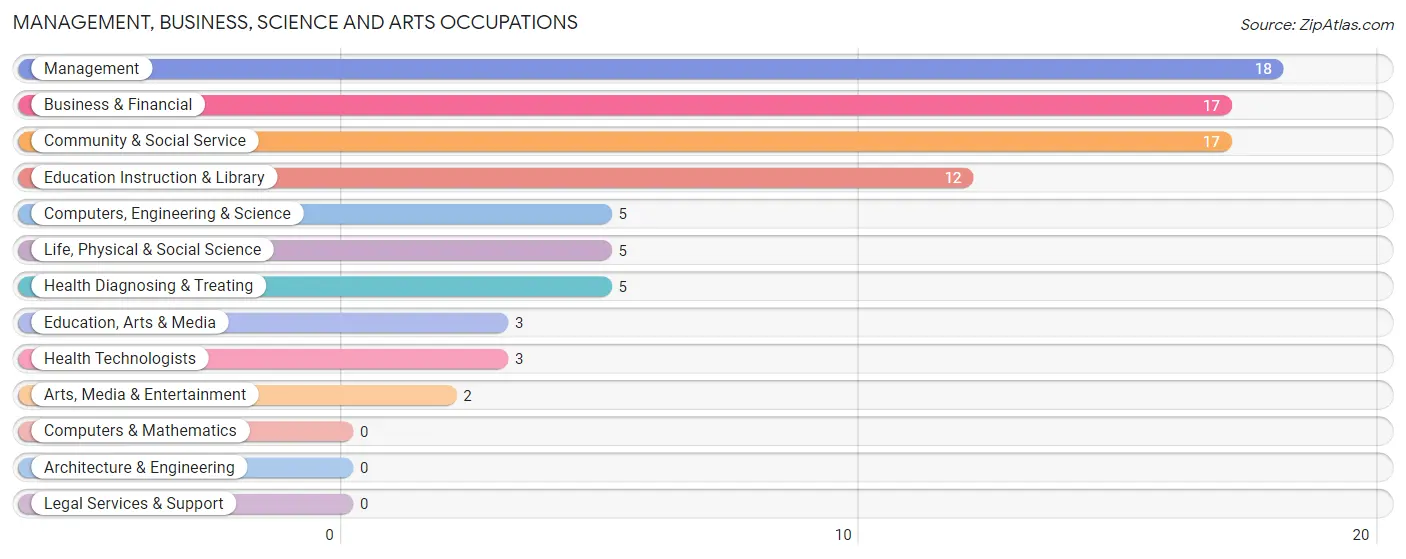
Management, Business, Science and Arts Occupations
The most common Management, Business, Science and Arts occupations in Kansas are Management (18 | 4.9%), Business & Financial (17 | 4.6%), Community & Social Service (17 | 4.6%), Education Instruction & Library (12 | 3.2%), and Computers, Engineering & Science (5 | 1.3%).
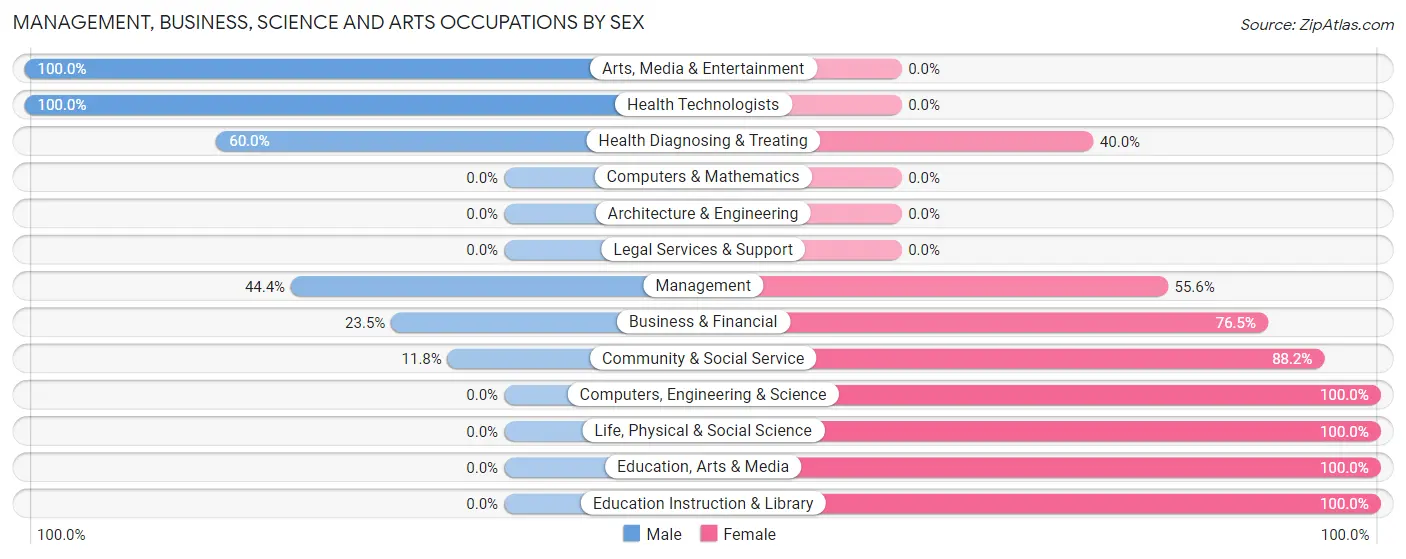
Management, Business, Science and Arts Occupations by Sex
Within the Management, Business, Science and Arts occupations in Kansas, the most male-oriented occupations are Arts, Media & Entertainment (100.0%), Health Technologists (100.0%), and Health Diagnosing & Treating (60.0%), while the most female-oriented occupations are Computers, Engineering & Science (100.0%), Life, Physical & Social Science (100.0%), and Education, Arts & Media (100.0%).
| Occupation | Male | Female |
| Management | 8 (44.4%) | 10 (55.6%) |
| Business & Financial | 4 (23.5%) | 13 (76.5%) |
| Computers, Engineering & Science | 0 (0.0%) | 5 (100.0%) |
| Computers & Mathematics | 0 (0.0%) | 0 (0.0%) |
| Architecture & Engineering | 0 (0.0%) | 0 (0.0%) |
| Life, Physical & Social Science | 0 (0.0%) | 5 (100.0%) |
| Community & Social Service | 2 (11.8%) | 15 (88.2%) |
| Education, Arts & Media | 0 (0.0%) | 3 (100.0%) |
| Legal Services & Support | 0 (0.0%) | 0 (0.0%) |
| Education Instruction & Library | 0 (0.0%) | 12 (100.0%) |
| Arts, Media & Entertainment | 2 (100.0%) | 0 (0.0%) |
| Health Diagnosing & Treating | 3 (60.0%) | 2 (40.0%) |
| Health Technologists | 3 (100.0%) | 0 (0.0%) |
| Total (Category) | 17 (27.4%) | 45 (72.6%) |
| Total (Overall) | 163 (43.9%) | 208 (56.1%) |
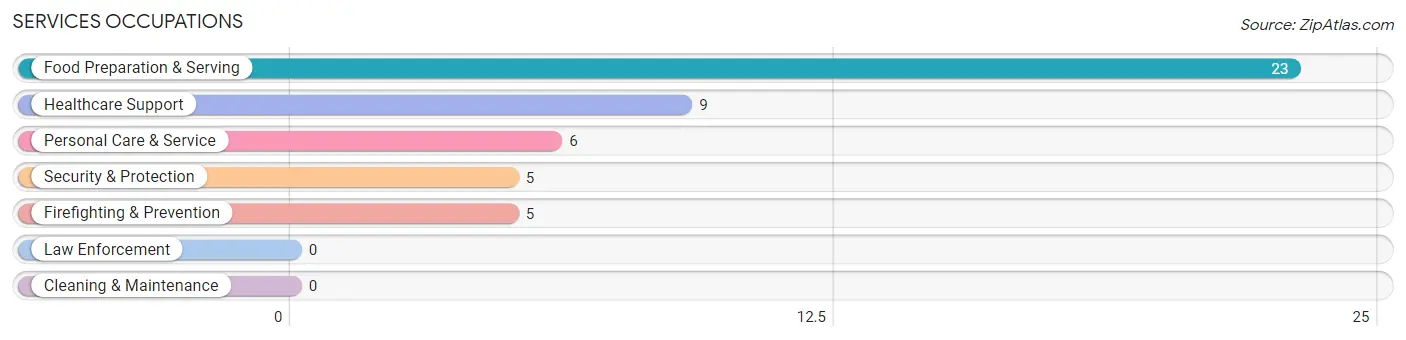
Services Occupations
The most common Services occupations in Kansas are Food Preparation & Serving (23 | 6.2%), Healthcare Support (9 | 2.4%), Personal Care & Service (6 | 1.6%), Security & Protection (5 | 1.3%), and Firefighting & Prevention (5 | 1.3%).
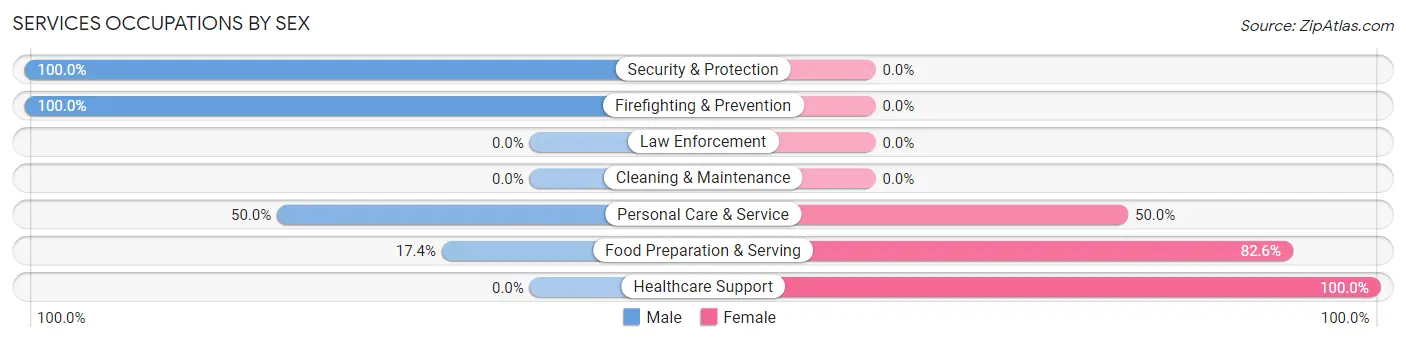
Services Occupations by Sex
Within the Services occupations in Kansas, the most male-oriented occupations are Security & Protection (100.0%), Firefighting & Prevention (100.0%), and Personal Care & Service (50.0%), while the most female-oriented occupations are Healthcare Support (100.0%), Food Preparation & Serving (82.6%), and Personal Care & Service (50.0%).
| Occupation | Male | Female |
| Healthcare Support | 0 (0.0%) | 9 (100.0%) |
| Security & Protection | 5 (100.0%) | 0 (0.0%) |
| Firefighting & Prevention | 5 (100.0%) | 0 (0.0%) |
| Law Enforcement | 0 (0.0%) | 0 (0.0%) |
| Food Preparation & Serving | 4 (17.4%) | 19 (82.6%) |
| Cleaning & Maintenance | 0 (0.0%) | 0 (0.0%) |
| Personal Care & Service | 3 (50.0%) | 3 (50.0%) |
| Total (Category) | 12 (27.9%) | 31 (72.1%) |
| Total (Overall) | 163 (43.9%) | 208 (56.1%) |
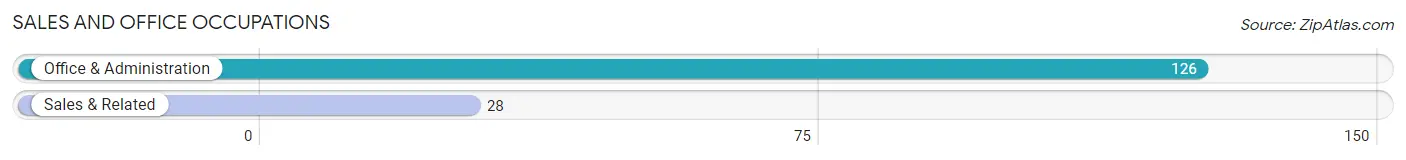
Sales and Office Occupations
The most common Sales and Office occupations in Kansas are Office & Administration (126 | 34.0%), and Sales & Related (28 | 7.5%).
Sales and Office Occupations by Sex
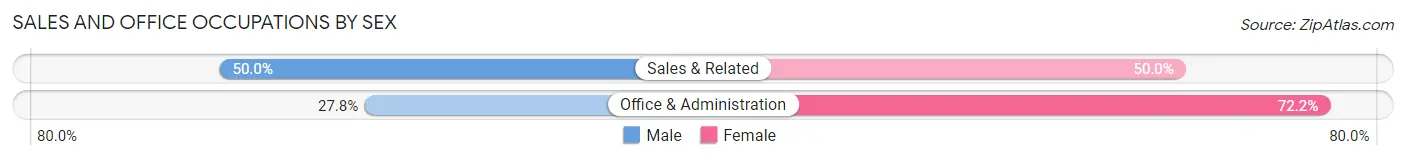
| Occupation | Male | Female |
| Sales & Related | 14 (50.0%) | 14 (50.0%) |
| Office & Administration | 35 (27.8%) | 91 (72.2%) |
| Total (Category) | 49 (31.8%) | 105 (68.2%) |
| Total (Overall) | 163 (43.9%) | 208 (56.1%) |
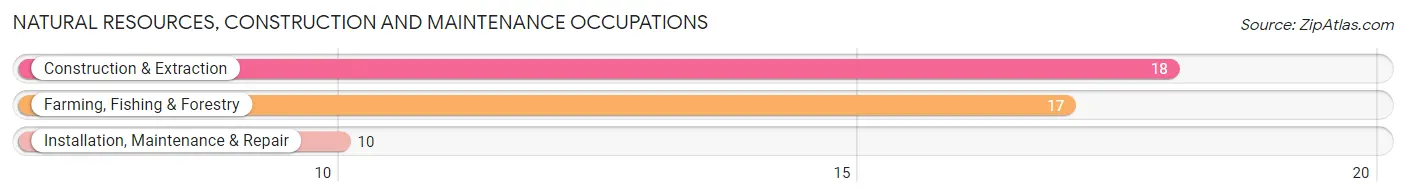
Natural Resources, Construction and Maintenance Occupations
The most common Natural Resources, Construction and Maintenance occupations in Kansas are Construction & Extraction (18 | 4.9%), Farming, Fishing & Forestry (17 | 4.6%), and Installation, Maintenance & Repair (10 | 2.7%).
Natural Resources, Construction and Maintenance Occupations by Sex
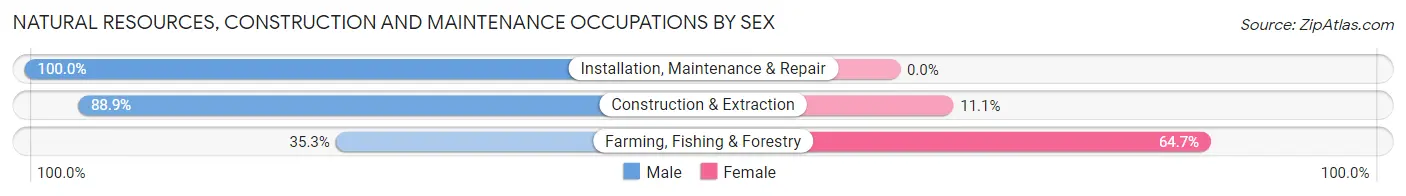
| Occupation | Male | Female |
| Farming, Fishing & Forestry | 6 (35.3%) | 11 (64.7%) |
| Construction & Extraction | 16 (88.9%) | 2 (11.1%) |
| Installation, Maintenance & Repair | 10 (100.0%) | 0 (0.0%) |
| Total (Category) | 32 (71.1%) | 13 (28.9%) |
| Total (Overall) | 163 (43.9%) | 208 (56.1%) |
Production, Transportation and Moving Occupations
The most common Production, Transportation and Moving occupations in Kansas are Production (43 | 11.6%), Transportation (21 | 5.7%), and Material Moving (3 | 0.8%).
Production, Transportation and Moving Occupations by Sex
| Occupation | Male | Female |
| Production | 32 (74.4%) | 11 (25.6%) |
| Transportation | 18 (85.7%) | 3 (14.3%) |
| Material Moving | 3 (100.0%) | 0 (0.0%) |
| Total (Category) | 53 (79.1%) | 14 (20.9%) |
| Total (Overall) | 163 (43.9%) | 208 (56.1%) |
Employment Industries by Sex in Kansas
Employment Industries in Kansas
The major employment industries in Kansas include Finance & Insurance (78 | 21.0%), Manufacturing (52 | 14.0%), Educational Services (45 | 12.1%), Health Care & Social Assistance (26 | 7.0%), and Retail Trade (23 | 6.2%).
Employment Industries by Sex in Kansas
The Kansas industries that see more men than women are Mining, Quarrying, & Extraction (100.0%), Transportation & Warehousing (100.0%), and Real Estate, Rental & Leasing (100.0%), whereas the industries that tend to have a higher number of women are Wholesale Trade (100.0%), Professional & Scientific (100.0%), and Finance & Insurance (98.7%).
| Industry | Male | Female |
| Agriculture, Fishing & Hunting | 6 (35.3%) | 11 (64.7%) |
| Mining, Quarrying, & Extraction | 4 (100.0%) | 0 (0.0%) |
| Construction | 14 (87.5%) | 2 (12.5%) |
| Manufacturing | 43 (82.7%) | 9 (17.3%) |
| Wholesale Trade | 0 (0.0%) | 13 (100.0%) |
| Retail Trade | 8 (34.8%) | 15 (65.2%) |
| Transportation & Warehousing | 7 (100.0%) | 0 (0.0%) |
| Utilities | 0 (0.0%) | 0 (0.0%) |
| Information | 0 (0.0%) | 0 (0.0%) |
| Finance & Insurance | 1 (1.3%) | 77 (98.7%) |
| Real Estate, Rental & Leasing | 12 (100.0%) | 0 (0.0%) |
| Professional & Scientific | 0 (0.0%) | 7 (100.0%) |
| Enterprise Management | 0 (0.0%) | 0 (0.0%) |
| Administrative & Support | 0 (0.0%) | 0 (0.0%) |
| Educational Services | 30 (66.7%) | 15 (33.3%) |
| Health Care & Social Assistance | 3 (11.5%) | 23 (88.5%) |
| Arts, Entertainment & Recreation | 11 (68.8%) | 5 (31.2%) |
| Accommodation & Food Services | 4 (17.4%) | 19 (82.6%) |
| Public Administration | 11 (47.8%) | 12 (52.2%) |
| Total | 163 (43.9%) | 208 (56.1%) |
Education in Kansas
School Enrollment in Kansas
The most common levels of schooling among the 122 students in Kansas are college / undergraduate (37 | 30.3%), middle school (33 | 27.1%), and high school (21 | 17.2%).
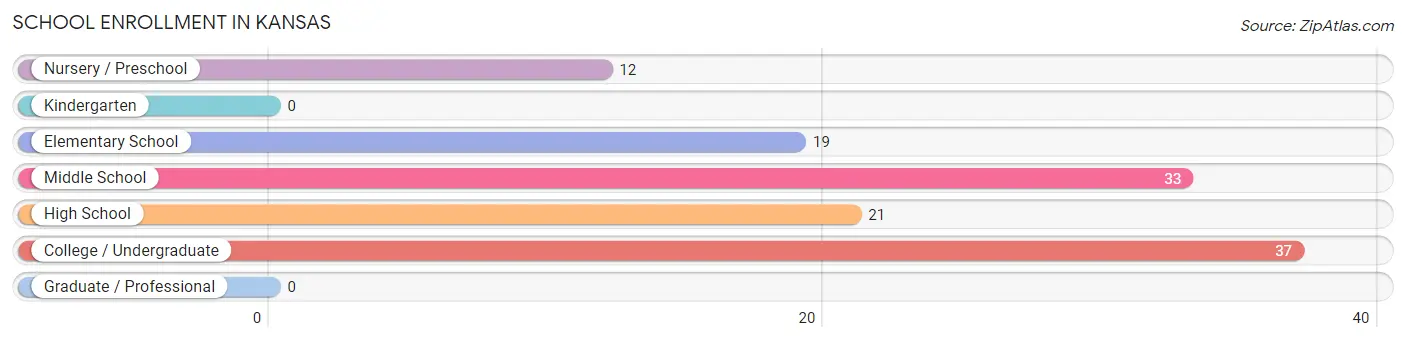
| School Level | # Students | % Students |
| Nursery / Preschool | 12 | 9.8% |
| Kindergarten | 0 | 0.0% |
| Elementary School | 19 | 15.6% |
| Middle School | 33 | 27.1% |
| High School | 21 | 17.2% |
| College / Undergraduate | 37 | 30.3% |
| Graduate / Professional | 0 | 0.0% |
| Total | 122 | 100.0% |
School Enrollment by Age by Funding Source in Kansas
Out of a total of 122 students who are enrolled in schools in Kansas, 12 (9.8%) attend a private institution, while the remaining 110 (90.2%) are enrolled in public schools. The age group of 25 to 34 year olds has the highest likelihood of being enrolled in private schools, with 3 (100.0% in the age bracket) enrolled. Conversely, the age group of 3 to 4 year olds has the lowest likelihood of being enrolled in a private school, with 10 (100.0% in the age bracket) attending a public institution.
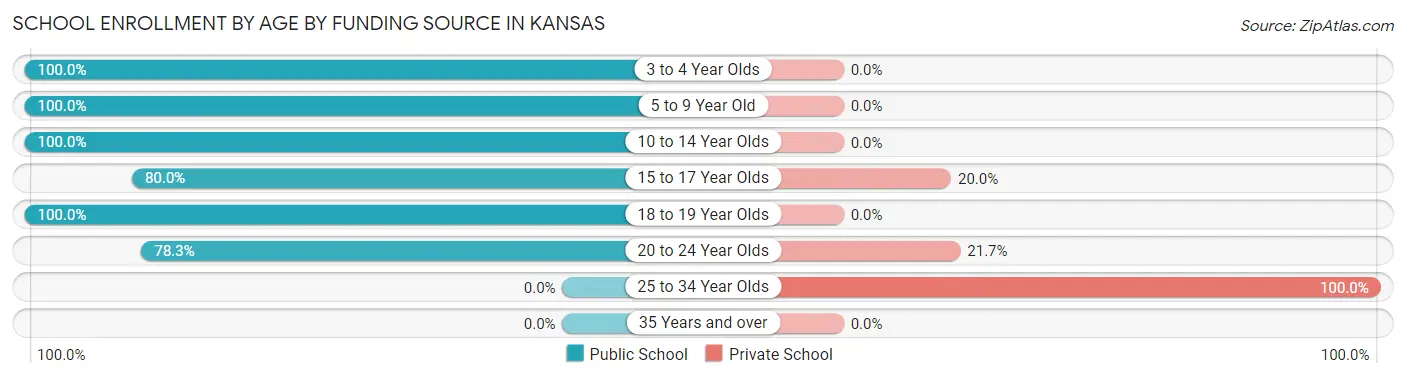
| Age Bracket | Public School | Private School |
| 3 to 4 Year Olds | 10 (100.0%) | 0 (0.0%) |
| 5 to 9 Year Old | 17 (100.0%) | 0 (0.0%) |
| 10 to 14 Year Olds | 38 (100.0%) | 0 (0.0%) |
| 15 to 17 Year Olds | 16 (80.0%) | 4 (20.0%) |
| 18 to 19 Year Olds | 11 (100.0%) | 0 (0.0%) |
| 20 to 24 Year Olds | 18 (78.3%) | 5 (21.7%) |
| 25 to 34 Year Olds | 0 (0.0%) | 3 (100.0%) |
| 35 Years and over | 0 (0.0%) | 0 (0.0%) |
| Total | 110 (90.2%) | 12 (9.8%) |
Educational Attainment by Field of Study in Kansas
Psychology (39 | 44.8%), business (24 | 27.6%), education (15 | 17.2%), arts & humanities (6 | 6.9%), and science & technology (3 | 3.5%) are the most common fields of study among 87 individuals in Kansas who have obtained a bachelor's degree or higher.
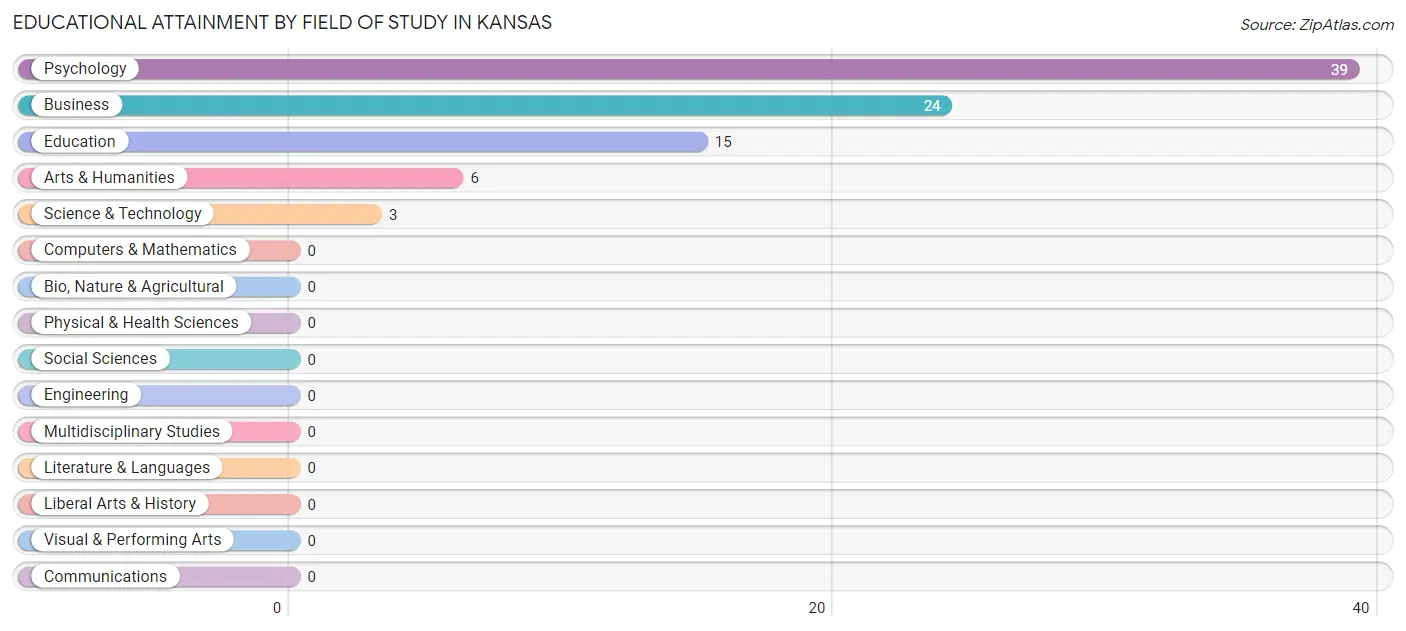
| Field of Study | # Graduates | % Graduates |
| Computers & Mathematics | 0 | 0.0% |
| Bio, Nature & Agricultural | 0 | 0.0% |
| Physical & Health Sciences | 0 | 0.0% |
| Psychology | 39 | 44.8% |
| Social Sciences | 0 | 0.0% |
| Engineering | 0 | 0.0% |
| Multidisciplinary Studies | 0 | 0.0% |
| Science & Technology | 3 | 3.5% |
| Business | 24 | 27.6% |
| Education | 15 | 17.2% |
| Literature & Languages | 0 | 0.0% |
| Liberal Arts & History | 0 | 0.0% |
| Visual & Performing Arts | 0 | 0.0% |
| Communications | 0 | 0.0% |
| Arts & Humanities | 6 | 6.9% |
| Total | 87 | 100.0% |
Transportation & Commute in Kansas
Vehicle Availability by Sex in Kansas
The most prevalent vehicle ownership categories in Kansas are males with 3 vehicles (55, accounting for 34.6%) and females with 3 vehicles (55, making up 26.4%).
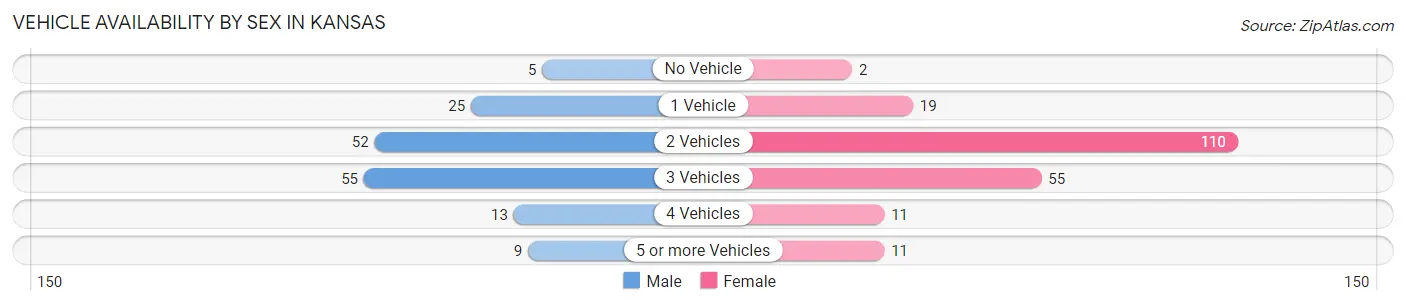
| Vehicles Available | Male | Female |
| No Vehicle | 5 (3.1%) | 2 (1.0%) |
| 1 Vehicle | 25 (15.7%) | 19 (9.1%) |
| 2 Vehicles | 52 (32.7%) | 110 (52.9%) |
| 3 Vehicles | 55 (34.6%) | 55 (26.4%) |
| 4 Vehicles | 13 (8.2%) | 11 (5.3%) |
| 5 or more Vehicles | 9 (5.7%) | 11 (5.3%) |
| Total | 159 (100.0%) | 208 (100.0%) |
Commute Time in Kansas
The most frequently occuring commute durations in Kansas are 25 to 29 minutes (116 commuters, 32.4%), 45 to 59 minutes (38 commuters, 10.6%), and 30 to 34 minutes (34 commuters, 9.5%).
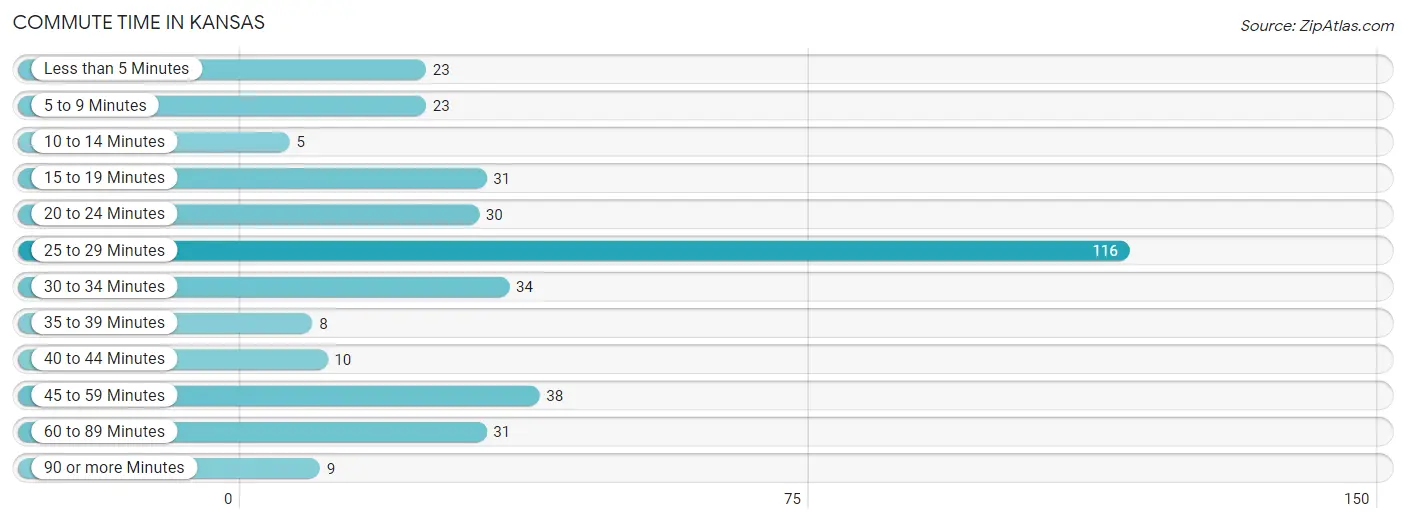
| Commute Time | # Commuters | % Commuters |
| Less than 5 Minutes | 23 | 6.4% |
| 5 to 9 Minutes | 23 | 6.4% |
| 10 to 14 Minutes | 5 | 1.4% |
| 15 to 19 Minutes | 31 | 8.7% |
| 20 to 24 Minutes | 30 | 8.4% |
| 25 to 29 Minutes | 116 | 32.4% |
| 30 to 34 Minutes | 34 | 9.5% |
| 35 to 39 Minutes | 8 | 2.2% |
| 40 to 44 Minutes | 10 | 2.8% |
| 45 to 59 Minutes | 38 | 10.6% |
| 60 to 89 Minutes | 31 | 8.7% |
| 90 or more Minutes | 9 | 2.5% |
Commute Time by Sex in Kansas
The most common commute times in Kansas are 45 to 59 minutes (38 commuters, 24.8%) for males and 25 to 29 minutes (90 commuters, 43.9%) for females.
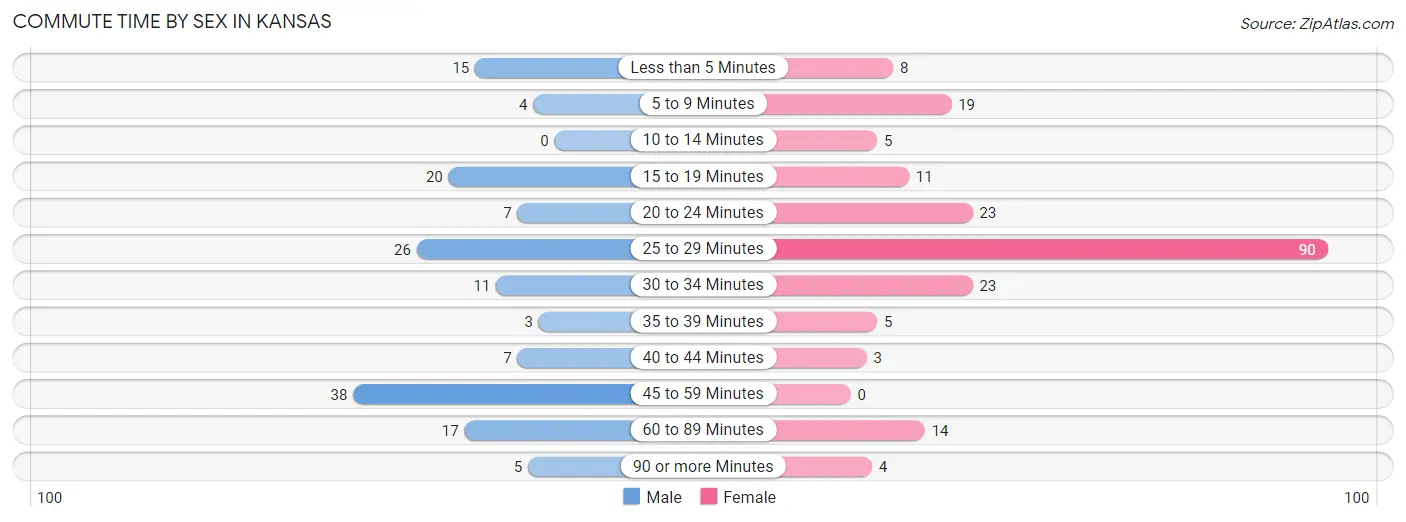
| Commute Time | Male | Female |
| Less than 5 Minutes | 15 (9.8%) | 8 (3.9%) |
| 5 to 9 Minutes | 4 (2.6%) | 19 (9.3%) |
| 10 to 14 Minutes | 0 (0.0%) | 5 (2.4%) |
| 15 to 19 Minutes | 20 (13.1%) | 11 (5.4%) |
| 20 to 24 Minutes | 7 (4.6%) | 23 (11.2%) |
| 25 to 29 Minutes | 26 (17.0%) | 90 (43.9%) |
| 30 to 34 Minutes | 11 (7.2%) | 23 (11.2%) |
| 35 to 39 Minutes | 3 (2.0%) | 5 (2.4%) |
| 40 to 44 Minutes | 7 (4.6%) | 3 (1.5%) |
| 45 to 59 Minutes | 38 (24.8%) | 0 (0.0%) |
| 60 to 89 Minutes | 17 (11.1%) | 14 (6.8%) |
| 90 or more Minutes | 5 (3.3%) | 4 (1.9%) |
Time of Departure to Work by Sex in Kansas
The most frequent times of departure to work in Kansas are 7:30 AM to 7:59 AM (28, 18.3%) for males and 8:00 AM to 8:29 AM (92, 44.9%) for females.
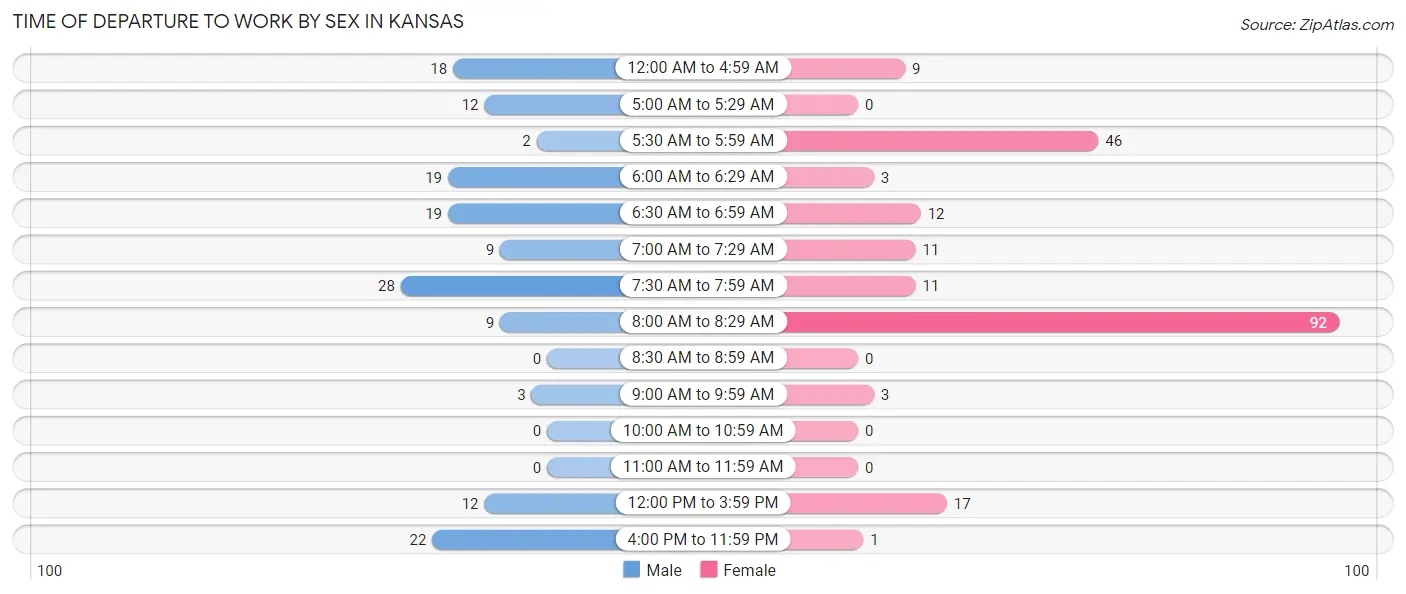
| Time of Departure | Male | Female |
| 12:00 AM to 4:59 AM | 18 (11.8%) | 9 (4.4%) |
| 5:00 AM to 5:29 AM | 12 (7.8%) | 0 (0.0%) |
| 5:30 AM to 5:59 AM | 2 (1.3%) | 46 (22.4%) |
| 6:00 AM to 6:29 AM | 19 (12.4%) | 3 (1.5%) |
| 6:30 AM to 6:59 AM | 19 (12.4%) | 12 (5.9%) |
| 7:00 AM to 7:29 AM | 9 (5.9%) | 11 (5.4%) |
| 7:30 AM to 7:59 AM | 28 (18.3%) | 11 (5.4%) |
| 8:00 AM to 8:29 AM | 9 (5.9%) | 92 (44.9%) |
| 8:30 AM to 8:59 AM | 0 (0.0%) | 0 (0.0%) |
| 9:00 AM to 9:59 AM | 3 (2.0%) | 3 (1.5%) |
| 10:00 AM to 10:59 AM | 0 (0.0%) | 0 (0.0%) |
| 11:00 AM to 11:59 AM | 0 (0.0%) | 0 (0.0%) |
| 12:00 PM to 3:59 PM | 12 (7.8%) | 17 (8.3%) |
| 4:00 PM to 11:59 PM | 22 (14.4%) | 1 (0.5%) |
| Total | 153 (100.0%) | 205 (100.0%) |
Housing Occupancy in Kansas
Occupancy by Ownership in Kansas
Of the total 347 dwellings in Kansas, owner-occupied units account for 272 (78.4%), while renter-occupied units make up 75 (21.6%).
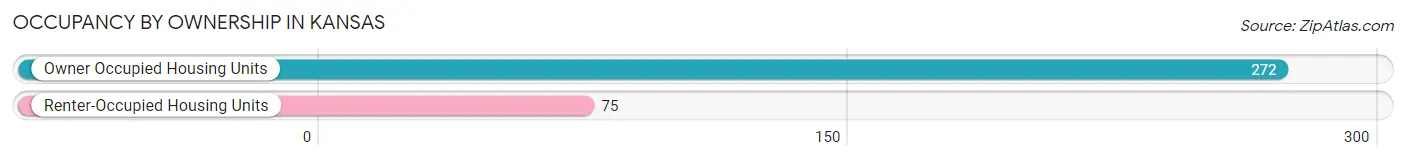
| Occupancy | # Housing Units | % Housing Units |
| Owner Occupied Housing Units | 272 | 78.4% |
| Renter-Occupied Housing Units | 75 | 21.6% |
| Total Occupied Housing Units | 347 | 100.0% |
Occupancy by Household Size in Kansas
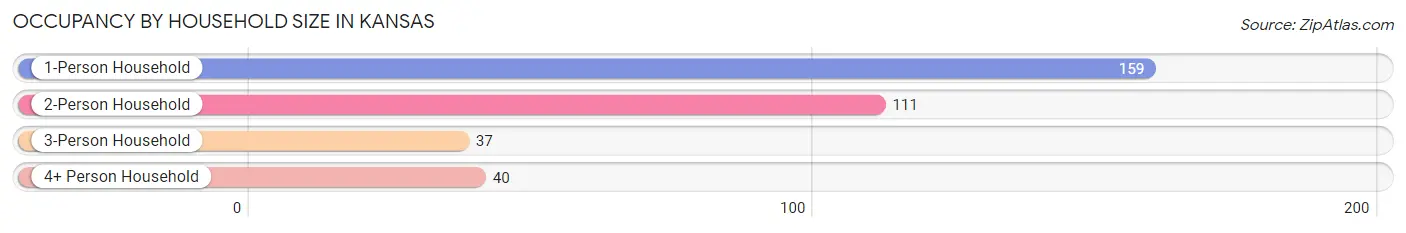
| Household Size | # Housing Units | % Housing Units |
| 1-Person Household | 159 | 45.8% |
| 2-Person Household | 111 | 32.0% |
| 3-Person Household | 37 | 10.7% |
| 4+ Person Household | 40 | 11.5% |
| Total Housing Units | 347 | 100.0% |
Occupancy by Ownership by Household Size in Kansas
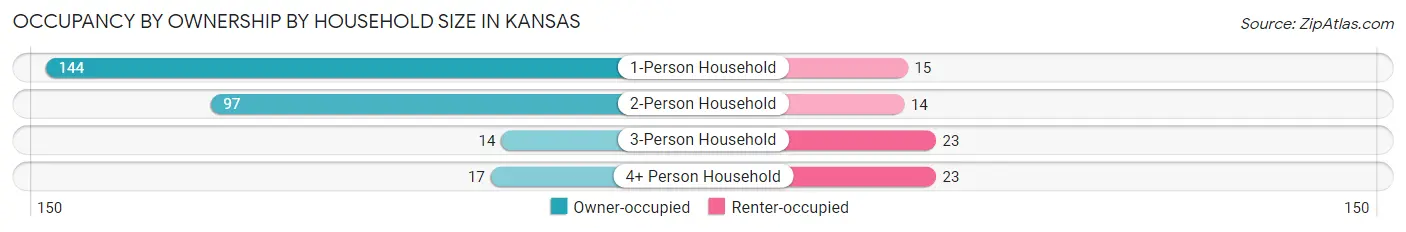
| Household Size | Owner-occupied | Renter-occupied |
| 1-Person Household | 144 (90.6%) | 15 (9.4%) |
| 2-Person Household | 97 (87.4%) | 14 (12.6%) |
| 3-Person Household | 14 (37.8%) | 23 (62.2%) |
| 4+ Person Household | 17 (42.5%) | 23 (57.5%) |
| Total Housing Units | 272 (78.4%) | 75 (21.6%) |
Occupancy by Educational Attainment in Kansas
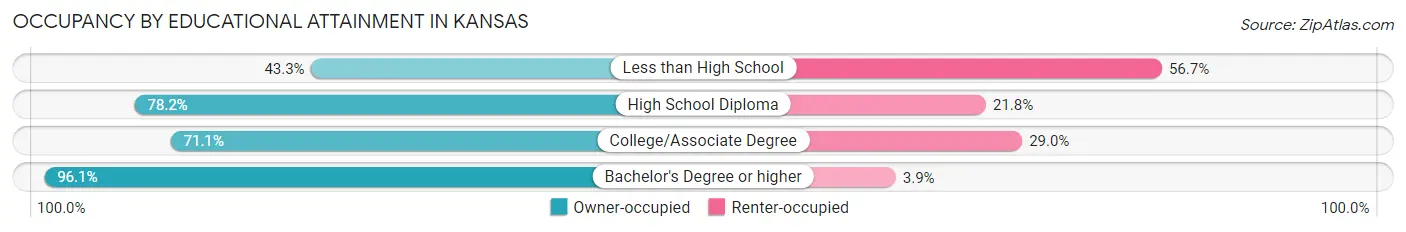
| Household Size | Owner-occupied | Renter-occupied |
| Less than High School | 13 (43.3%) | 17 (56.7%) |
| High School Diploma | 158 (78.2%) | 44 (21.8%) |
| College/Associate Degree | 27 (71.1%) | 11 (28.9%) |
| Bachelor's Degree or higher | 74 (96.1%) | 3 (3.9%) |
Occupancy by Age of Householder in Kansas
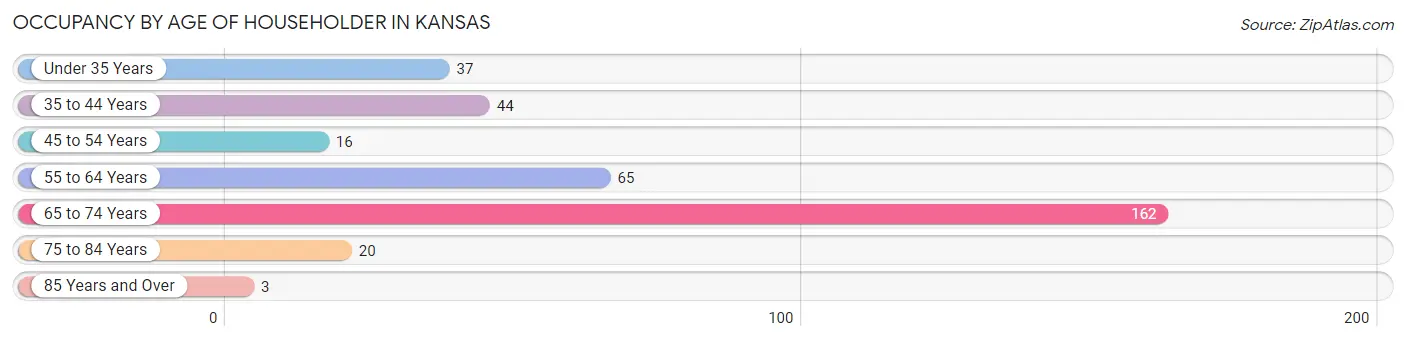
| Age Bracket | # Households | % Households |
| Under 35 Years | 37 | 10.7% |
| 35 to 44 Years | 44 | 12.7% |
| 45 to 54 Years | 16 | 4.6% |
| 55 to 64 Years | 65 | 18.7% |
| 65 to 74 Years | 162 | 46.7% |
| 75 to 84 Years | 20 | 5.8% |
| 85 Years and Over | 3 | 0.9% |
| Total | 347 | 100.0% |
Housing Finances in Kansas
Median Income by Occupancy in Kansas
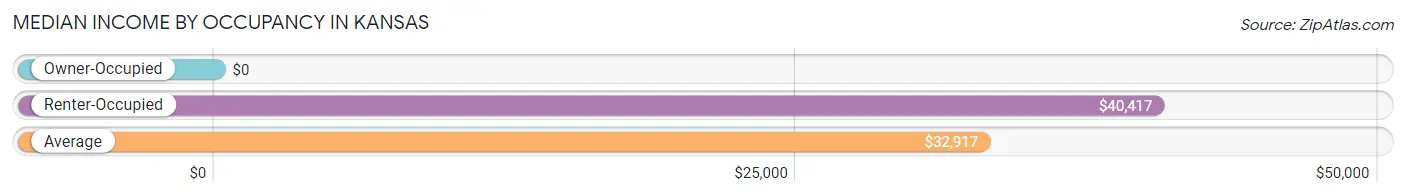
| Occupancy Type | # Households | Median Income |
| Owner-Occupied | 272 (78.4%) | $0 |
| Renter-Occupied | 75 (21.6%) | $40,417 |
| Average | 347 (100.0%) | $32,917 |
Occupancy by Householder Income Bracket in Kansas
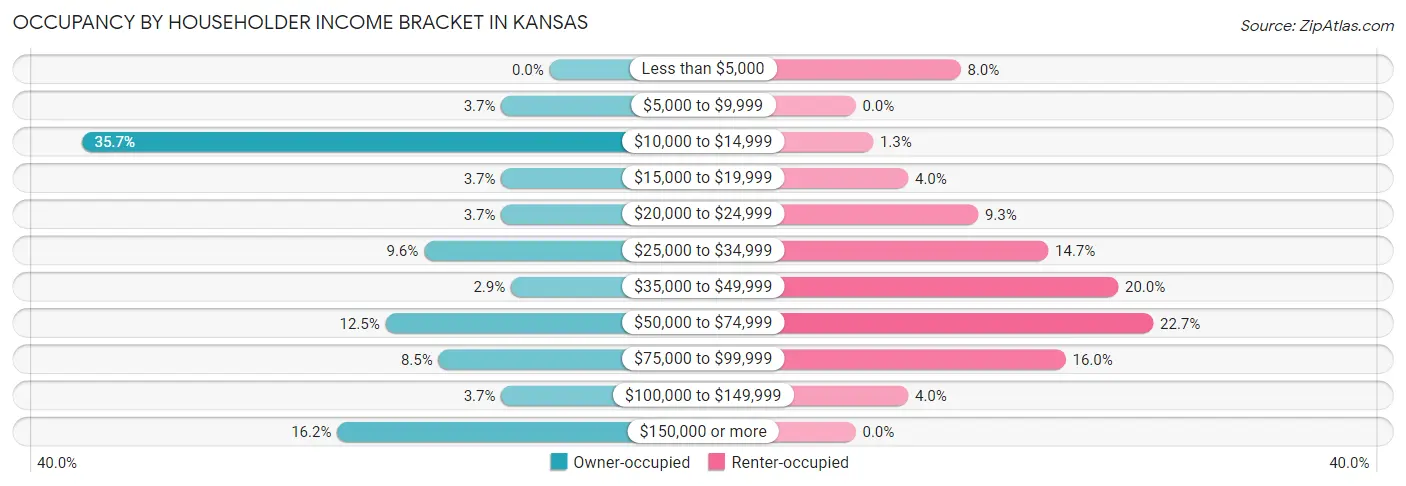
| Income Bracket | Owner-occupied | Renter-occupied |
| Less than $5,000 | 0 (0.0%) | 6 (8.0%) |
| $5,000 to $9,999 | 10 (3.7%) | 0 (0.0%) |
| $10,000 to $14,999 | 97 (35.7%) | 1 (1.3%) |
| $15,000 to $19,999 | 10 (3.7%) | 3 (4.0%) |
| $20,000 to $24,999 | 10 (3.7%) | 7 (9.3%) |
| $25,000 to $34,999 | 26 (9.6%) | 11 (14.7%) |
| $35,000 to $49,999 | 8 (2.9%) | 15 (20.0%) |
| $50,000 to $74,999 | 34 (12.5%) | 17 (22.7%) |
| $75,000 to $99,999 | 23 (8.5%) | 12 (16.0%) |
| $100,000 to $149,999 | 10 (3.7%) | 3 (4.0%) |
| $150,000 or more | 44 (16.2%) | 0 (0.0%) |
| Total | 272 (100.0%) | 75 (100.0%) |
Monthly Housing Cost Tiers in Kansas
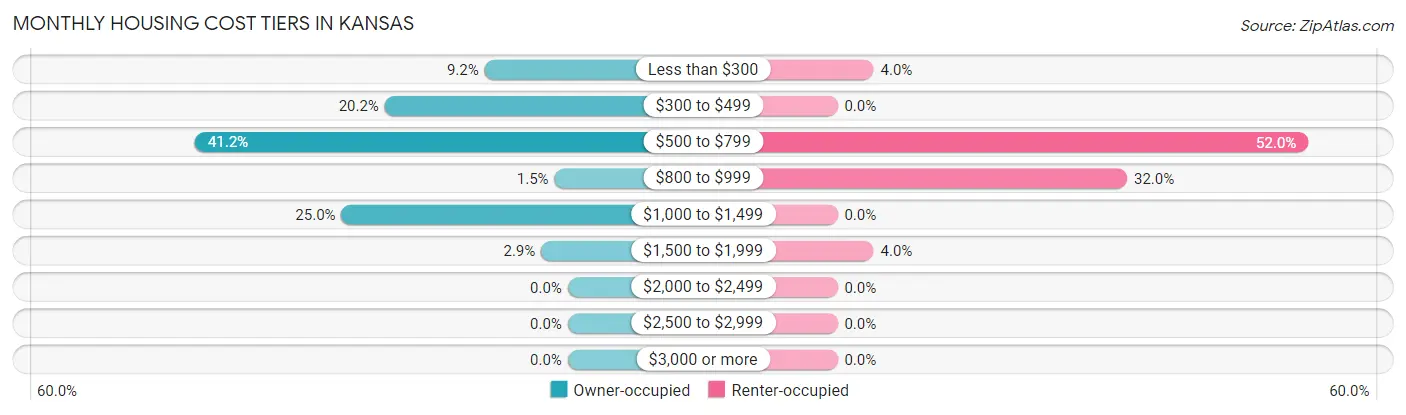
| Monthly Cost | Owner-occupied | Renter-occupied |
| Less than $300 | 25 (9.2%) | 3 (4.0%) |
| $300 to $499 | 55 (20.2%) | 0 (0.0%) |
| $500 to $799 | 112 (41.2%) | 39 (52.0%) |
| $800 to $999 | 4 (1.5%) | 24 (32.0%) |
| $1,000 to $1,499 | 68 (25.0%) | 0 (0.0%) |
| $1,500 to $1,999 | 8 (2.9%) | 3 (4.0%) |
| $2,000 to $2,499 | 0 (0.0%) | 0 (0.0%) |
| $2,500 to $2,999 | 0 (0.0%) | 0 (0.0%) |
| $3,000 or more | 0 (0.0%) | 0 (0.0%) |
| Total | 272 (100.0%) | 75 (100.0%) |
Physical Housing Characteristics in Kansas
Housing Structures in Kansas
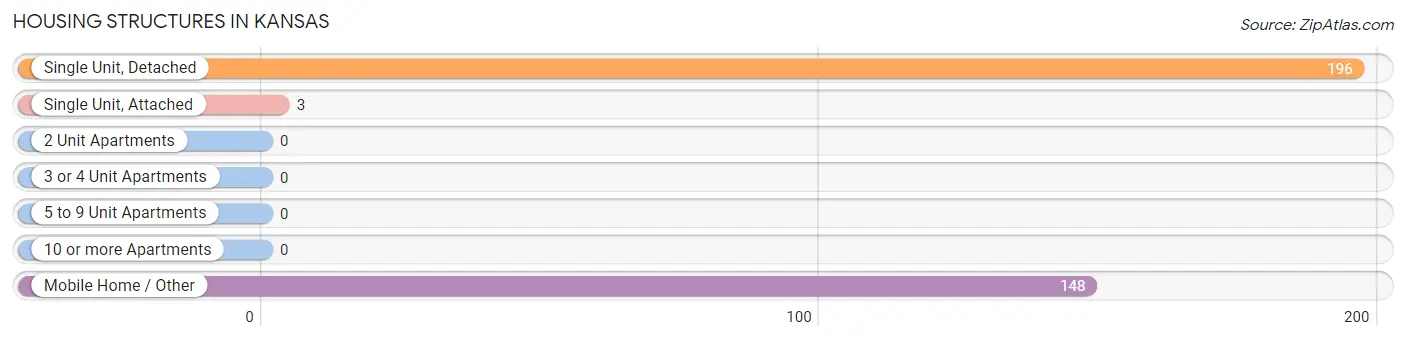
| Structure Type | # Housing Units | % Housing Units |
| Single Unit, Detached | 196 | 56.5% |
| Single Unit, Attached | 3 | 0.9% |
| 2 Unit Apartments | 0 | 0.0% |
| 3 or 4 Unit Apartments | 0 | 0.0% |
| 5 to 9 Unit Apartments | 0 | 0.0% |
| 10 or more Apartments | 0 | 0.0% |
| Mobile Home / Other | 148 | 42.6% |
| Total | 347 | 100.0% |
Housing Structures by Occupancy in Kansas
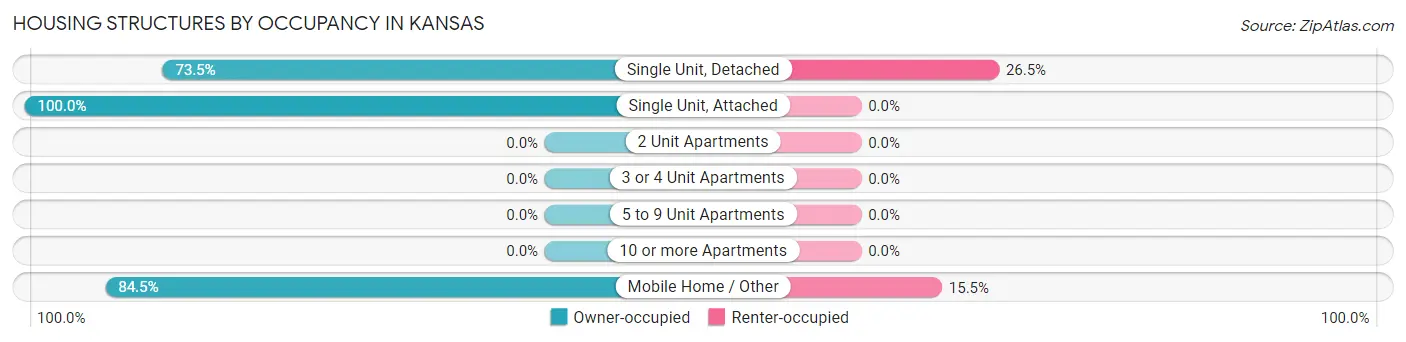
| Structure Type | Owner-occupied | Renter-occupied |
| Single Unit, Detached | 144 (73.5%) | 52 (26.5%) |
| Single Unit, Attached | 3 (100.0%) | 0 (0.0%) |
| 2 Unit Apartments | 0 (0.0%) | 0 (0.0%) |
| 3 or 4 Unit Apartments | 0 (0.0%) | 0 (0.0%) |
| 5 to 9 Unit Apartments | 0 (0.0%) | 0 (0.0%) |
| 10 or more Apartments | 0 (0.0%) | 0 (0.0%) |
| Mobile Home / Other | 125 (84.5%) | 23 (15.5%) |
| Total | 272 (78.4%) | 75 (21.6%) |
Housing Structures by Number of Rooms in Kansas
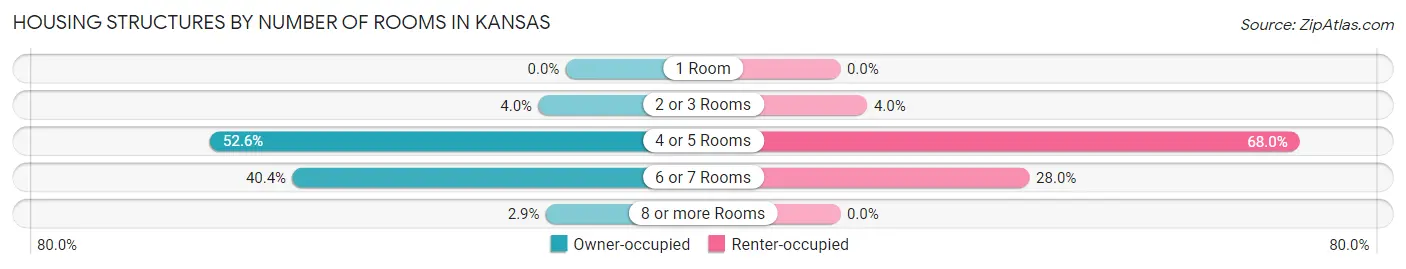
| Number of Rooms | Owner-occupied | Renter-occupied |
| 1 Room | 0 (0.0%) | 0 (0.0%) |
| 2 or 3 Rooms | 11 (4.0%) | 3 (4.0%) |
| 4 or 5 Rooms | 143 (52.6%) | 51 (68.0%) |
| 6 or 7 Rooms | 110 (40.4%) | 21 (28.0%) |
| 8 or more Rooms | 8 (2.9%) | 0 (0.0%) |
| Total | 272 (100.0%) | 75 (100.0%) |
Housing Structure by Heating Type in Kansas
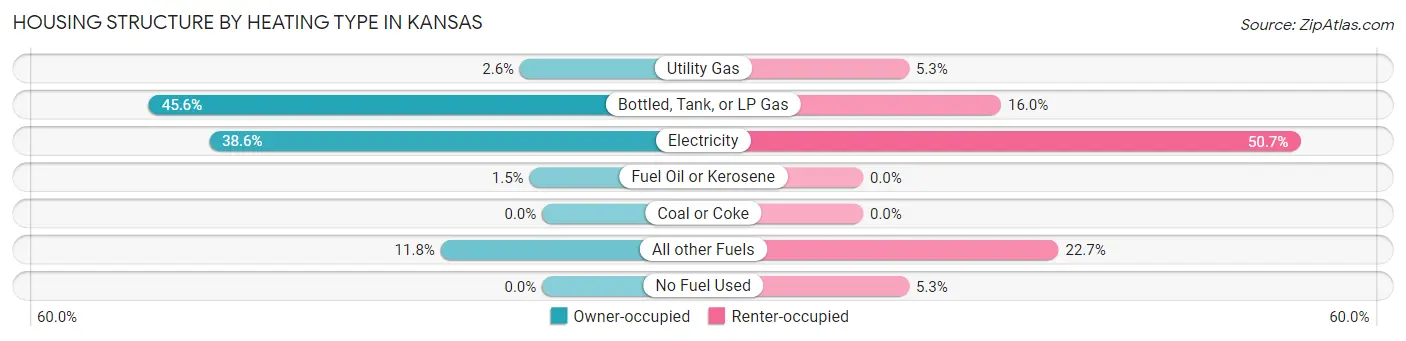
| Heating Type | Owner-occupied | Renter-occupied |
| Utility Gas | 7 (2.6%) | 4 (5.3%) |
| Bottled, Tank, or LP Gas | 124 (45.6%) | 12 (16.0%) |
| Electricity | 105 (38.6%) | 38 (50.7%) |
| Fuel Oil or Kerosene | 4 (1.5%) | 0 (0.0%) |
| Coal or Coke | 0 (0.0%) | 0 (0.0%) |
| All other Fuels | 32 (11.8%) | 17 (22.7%) |
| No Fuel Used | 0 (0.0%) | 4 (5.3%) |
| Total | 272 (100.0%) | 75 (100.0%) |
Household Vehicle Usage in Kansas
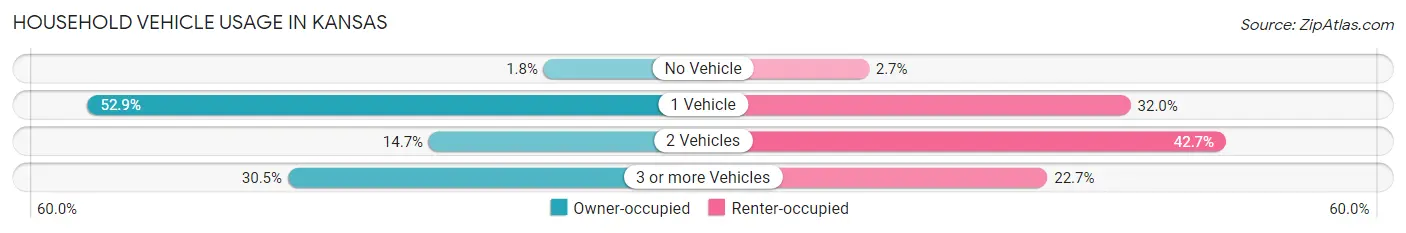
| Vehicles per Household | Owner-occupied | Renter-occupied |
| No Vehicle | 5 (1.8%) | 2 (2.7%) |
| 1 Vehicle | 144 (52.9%) | 24 (32.0%) |
| 2 Vehicles | 40 (14.7%) | 32 (42.7%) |
| 3 or more Vehicles | 83 (30.5%) | 17 (22.7%) |
| Total | 272 (100.0%) | 75 (100.0%) |
Real Estate & Mortgages in Kansas
Real Estate and Mortgage Overview in Kansas
| Characteristic | Without Mortgage | With Mortgage |
| Housing Units | 84 | 188 |
| Median Property Value | $99,000 | $0 |
| Median Household Income | $43,750 | $39 |
| Monthly Housing Costs | $367 | $0 |
| Real Estate Taxes | $555 | $48 |
Property Value by Mortgage Status in Kansas
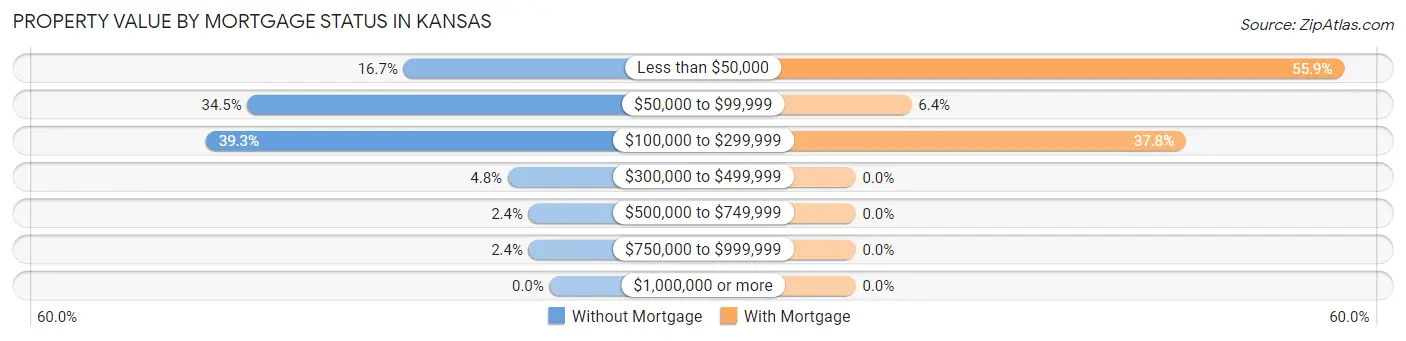
| Property Value | Without Mortgage | With Mortgage |
| Less than $50,000 | 14 (16.7%) | 105 (55.8%) |
| $50,000 to $99,999 | 29 (34.5%) | 12 (6.4%) |
| $100,000 to $299,999 | 33 (39.3%) | 71 (37.8%) |
| $300,000 to $499,999 | 4 (4.8%) | 0 (0.0%) |
| $500,000 to $749,999 | 2 (2.4%) | 0 (0.0%) |
| $750,000 to $999,999 | 2 (2.4%) | 0 (0.0%) |
| $1,000,000 or more | 0 (0.0%) | 0 (0.0%) |
| Total | 84 (100.0%) | 188 (100.0%) |
Household Income by Mortgage Status in Kansas
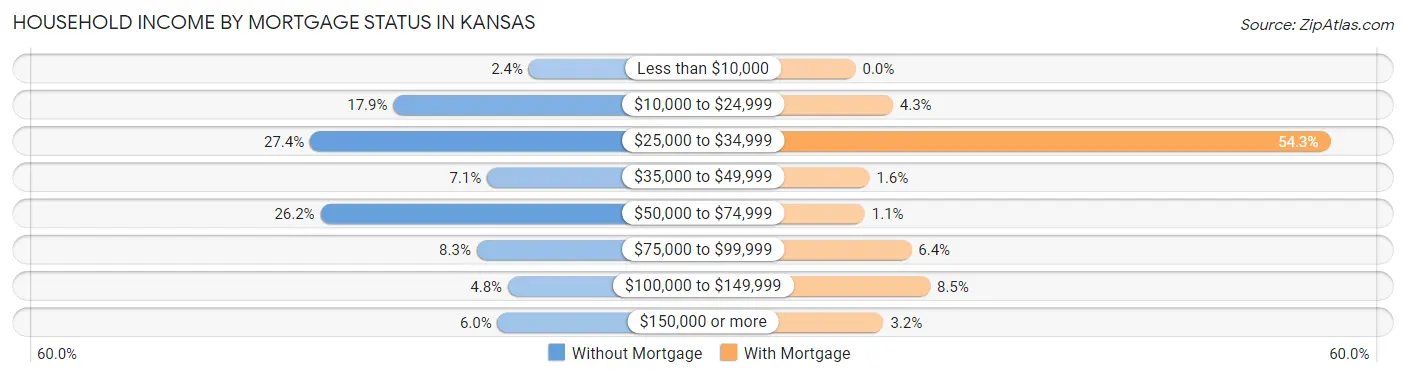
| Household Income | Without Mortgage | With Mortgage |
| Less than $10,000 | 2 (2.4%) | 0 (0.0%) |
| $10,000 to $24,999 | 15 (17.9%) | 8 (4.3%) |
| $25,000 to $34,999 | 23 (27.4%) | 102 (54.3%) |
| $35,000 to $49,999 | 6 (7.1%) | 3 (1.6%) |
| $50,000 to $74,999 | 22 (26.2%) | 2 (1.1%) |
| $75,000 to $99,999 | 7 (8.3%) | 12 (6.4%) |
| $100,000 to $149,999 | 4 (4.8%) | 16 (8.5%) |
| $150,000 or more | 5 (5.9%) | 6 (3.2%) |
| Total | 84 (100.0%) | 188 (100.0%) |
Property Value to Household Income Ratio in Kansas
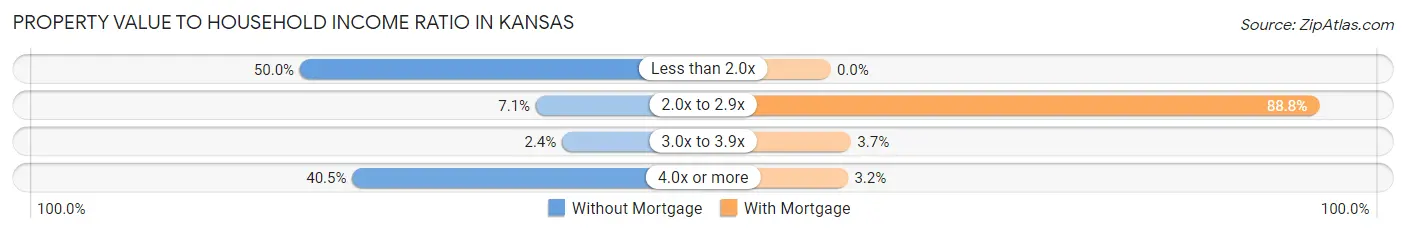
| Value-to-Income Ratio | Without Mortgage | With Mortgage |
| Less than 2.0x | 42 (50.0%) | 0 (0.0%) |
| 2.0x to 2.9x | 6 (7.1%) | 167 (88.8%) |
| 3.0x to 3.9x | 2 (2.4%) | 7 (3.7%) |
| 4.0x or more | 34 (40.5%) | 6 (3.2%) |
| Total | 84 (100.0%) | 188 (100.0%) |
Real Estate Taxes by Mortgage Status in Kansas
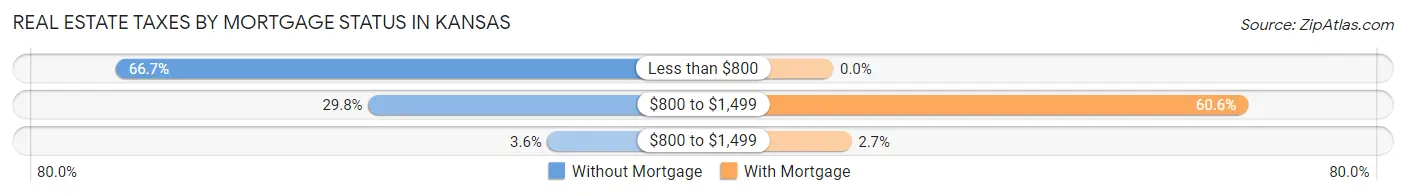
| Property Taxes | Without Mortgage | With Mortgage |
| Less than $800 | 56 (66.7%) | 0 (0.0%) |
| $800 to $1,499 | 25 (29.8%) | 114 (60.6%) |
| $800 to $1,499 | 3 (3.6%) | 5 (2.7%) |
| Total | 84 (100.0%) | 188 (100.0%) |
Health & Disability in Kansas
Health Insurance Coverage by Age in Kansas
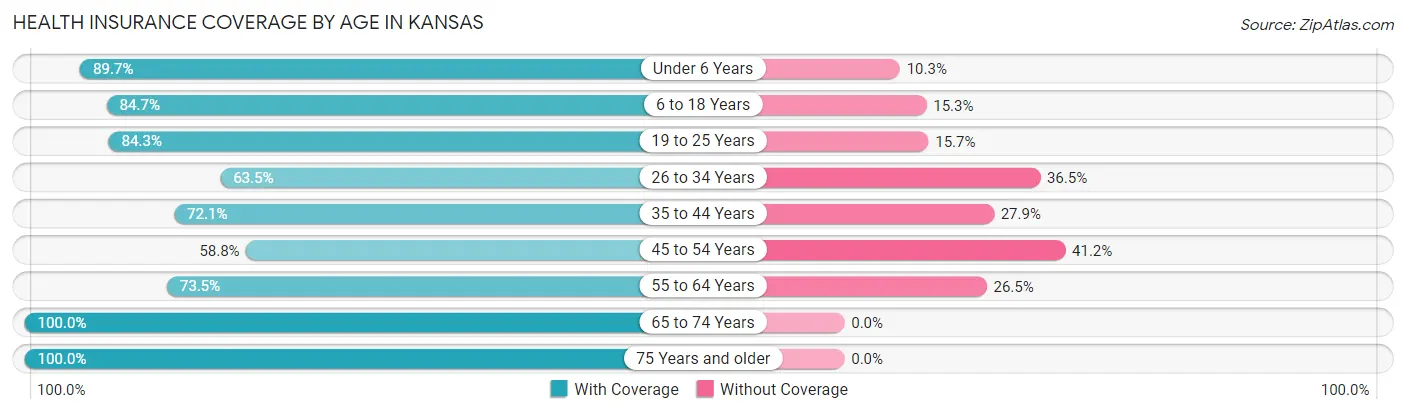
| Age Bracket | With Coverage | Without Coverage |
| Under 6 Years | 26 (89.7%) | 3 (10.3%) |
| 6 to 18 Years | 72 (84.7%) | 13 (15.3%) |
| 19 to 25 Years | 70 (84.3%) | 13 (15.7%) |
| 26 to 34 Years | 47 (63.5%) | 27 (36.5%) |
| 35 to 44 Years | 44 (72.1%) | 17 (27.9%) |
| 45 to 54 Years | 30 (58.8%) | 21 (41.2%) |
| 55 to 64 Years | 72 (73.5%) | 26 (26.5%) |
| 65 to 74 Years | 259 (100.0%) | 0 (0.0%) |
| 75 Years and older | 30 (100.0%) | 0 (0.0%) |
| Total | 650 (84.4%) | 120 (15.6%) |
Health Insurance Coverage by Citizenship Status in Kansas
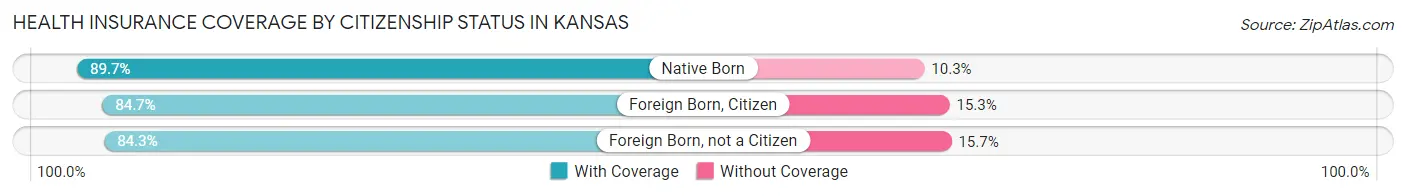
| Citizenship Status | With Coverage | Without Coverage |
| Native Born | 26 (89.7%) | 3 (10.3%) |
| Foreign Born, Citizen | 72 (84.7%) | 13 (15.3%) |
| Foreign Born, not a Citizen | 70 (84.3%) | 13 (15.7%) |
Health Insurance Coverage by Household Income in Kansas
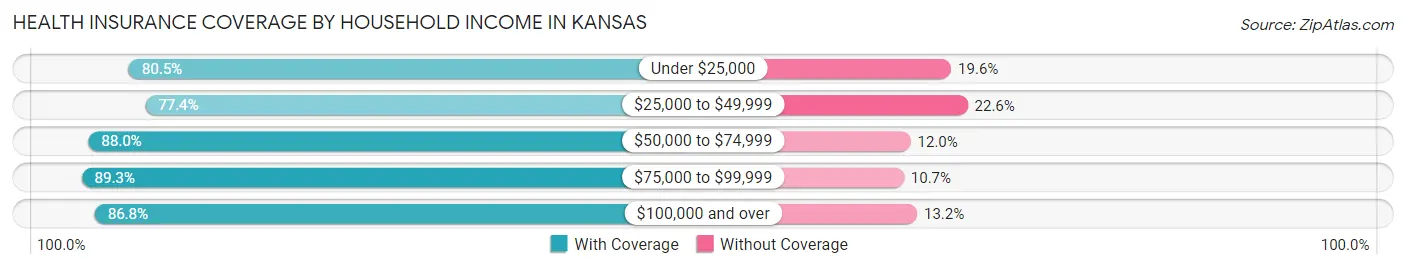
| Household Income | With Coverage | Without Coverage |
| Under $25,000 | 144 (80.4%) | 35 (19.6%) |
| $25,000 to $49,999 | 106 (77.4%) | 31 (22.6%) |
| $50,000 to $74,999 | 184 (88.0%) | 25 (12.0%) |
| $75,000 to $99,999 | 117 (89.3%) | 14 (10.7%) |
| $100,000 and over | 99 (86.8%) | 15 (13.2%) |
Public vs Private Health Insurance Coverage by Age in Kansas
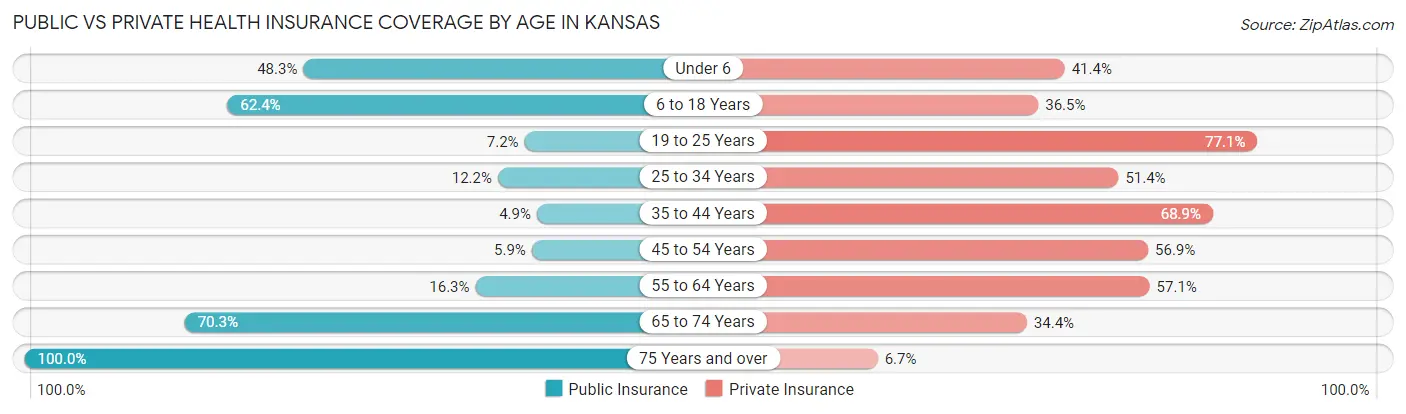
| Age Bracket | Public Insurance | Private Insurance |
| Under 6 | 14 (48.3%) | 12 (41.4%) |
| 6 to 18 Years | 53 (62.4%) | 31 (36.5%) |
| 19 to 25 Years | 6 (7.2%) | 64 (77.1%) |
| 25 to 34 Years | 9 (12.2%) | 38 (51.3%) |
| 35 to 44 Years | 3 (4.9%) | 42 (68.9%) |
| 45 to 54 Years | 3 (5.9%) | 29 (56.9%) |
| 55 to 64 Years | 16 (16.3%) | 56 (57.1%) |
| 65 to 74 Years | 182 (70.3%) | 89 (34.4%) |
| 75 Years and over | 30 (100.0%) | 2 (6.7%) |
| Total | 316 (41.0%) | 363 (47.1%) |
Disability Status by Sex by Age in Kansas
| Age Bracket | Male | Female |
| Under 5 Years | 0 (0.0%) | 0 (0.0%) |
| 5 to 17 Years | 9 (21.4%) | 3 (6.4%) |
| 18 to 34 Years | 0 (0.0%) | 3 (4.3%) |
| 35 to 64 Years | 26 (23.4%) | 16 (16.2%) |
| 65 to 74 Years | 20 (90.9%) | 102 (43.0%) |
| 75 Years and over | 5 (38.5%) | 5 (29.4%) |
Disability Class by Sex by Age in Kansas
Disability Class: Hearing Difficulty
| Age Bracket | Male | Female |
| Under 5 Years | 0 (0.0%) | 0 (0.0%) |
| 5 to 17 Years | 0 (0.0%) | 0 (0.0%) |
| 18 to 34 Years | 0 (0.0%) | 3 (4.3%) |
| 35 to 64 Years | 10 (9.0%) | 2 (2.0%) |
| 65 to 74 Years | 14 (63.6%) | 3 (1.3%) |
| 75 Years and over | 0 (0.0%) | 0 (0.0%) |
Disability Class: Vision Difficulty
| Age Bracket | Male | Female |
| Under 5 Years | 0 (0.0%) | 0 (0.0%) |
| 5 to 17 Years | 0 (0.0%) | 0 (0.0%) |
| 18 to 34 Years | 0 (0.0%) | 0 (0.0%) |
| 35 to 64 Years | 11 (9.9%) | 5 (5.1%) |
| 65 to 74 Years | 0 (0.0%) | 0 (0.0%) |
| 75 Years and over | 2 (15.4%) | 0 (0.0%) |
Disability Class: Cognitive Difficulty
| Age Bracket | Male | Female |
| 5 to 17 Years | 9 (21.4%) | 3 (6.4%) |
| 18 to 34 Years | 0 (0.0%) | 0 (0.0%) |
| 35 to 64 Years | 10 (9.0%) | 7 (7.1%) |
| 65 to 74 Years | 5 (22.7%) | 5 (2.1%) |
| 75 Years and over | 0 (0.0%) | 3 (17.6%) |
Disability Class: Ambulatory Difficulty
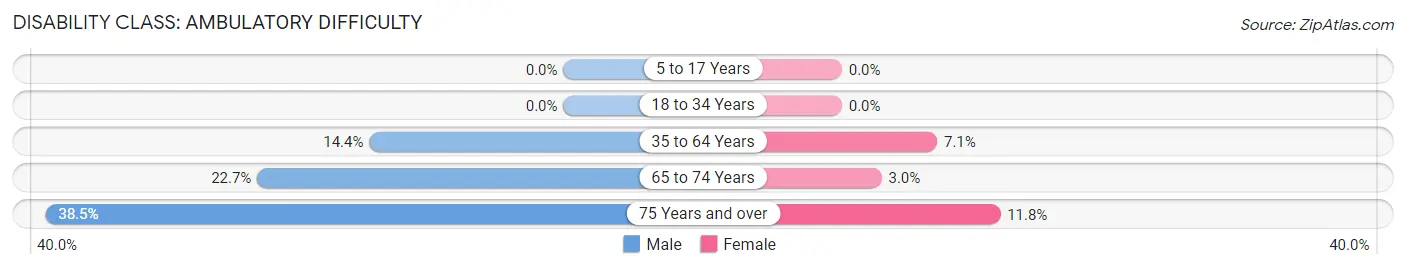
| Age Bracket | Male | Female |
| 5 to 17 Years | 0 (0.0%) | 0 (0.0%) |
| 18 to 34 Years | 0 (0.0%) | 0 (0.0%) |
| 35 to 64 Years | 16 (14.4%) | 7 (7.1%) |
| 65 to 74 Years | 5 (22.7%) | 7 (2.9%) |
| 75 Years and over | 5 (38.5%) | 2 (11.8%) |
Disability Class: Self-Care Difficulty
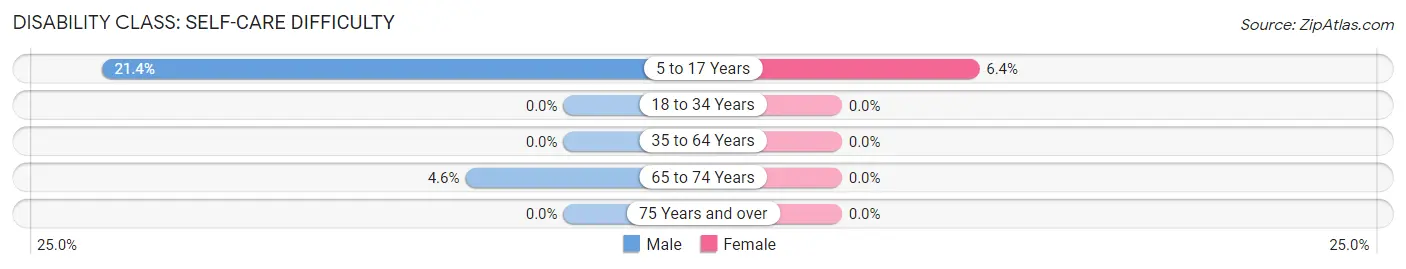
| Age Bracket | Male | Female |
| 5 to 17 Years | 9 (21.4%) | 3 (6.4%) |
| 18 to 34 Years | 0 (0.0%) | 0 (0.0%) |
| 35 to 64 Years | 0 (0.0%) | 0 (0.0%) |
| 65 to 74 Years | 1 (4.5%) | 0 (0.0%) |
| 75 Years and over | 0 (0.0%) | 0 (0.0%) |
Technology Access in Kansas
Computing Device Access in Kansas
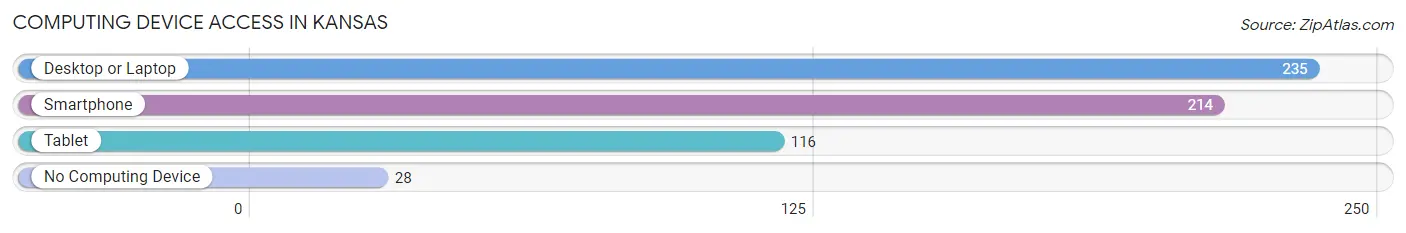
| Device Type | # Households | % Households |
| Desktop or Laptop | 235 | 67.7% |
| Smartphone | 214 | 61.7% |
| Tablet | 116 | 33.4% |
| No Computing Device | 28 | 8.1% |
| Total | 347 | 100.0% |
Internet Access in Kansas
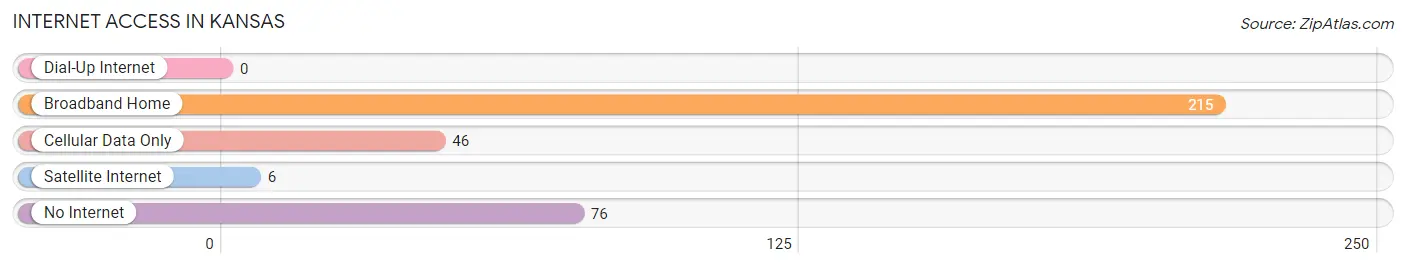
| Internet Type | # Households | % Households |
| Dial-Up Internet | 0 | 0.0% |
| Broadband Home | 215 | 62.0% |
| Cellular Data Only | 46 | 13.3% |
| Satellite Internet | 6 | 1.7% |
| No Internet | 76 | 21.9% |
| Total | 347 | 100.0% |
Kansas Summary
Kansas is a state located in the Midwestern United States. It is bordered by Nebraska to the north, Missouri to the east, Oklahoma to the south, and Colorado to the west. Kansas is the 15th most populous state in the United States, with an estimated population of 2,913,314 in 2019. The state capital is Topeka, and the largest city is Wichita.
Geography
Kansas is located in the Great Plains region of the United States. It is bordered by Nebraska to the north, Missouri to the east, Oklahoma to the south, and Colorado to the west. The state has a total area of 82,278 square miles, making it the 15th largest state in the country. The eastern two-thirds of the state is composed of rolling hills and prairies, while the western third is characterized by the rugged Rocky Mountains. The highest point in Kansas is Mount Sunflower, which has an elevation of 4,041 feet.
The climate of Kansas is generally continental, with hot summers and cold winters. The average annual temperature is 54°F, and the average annual precipitation is about 28 inches.
Economy
The economy of Kansas is largely based on agriculture, with wheat, corn, and sorghum being the state’s top crops. Other important agricultural products include soybeans, hay, and livestock. Kansas is also a major producer of oil and natural gas.
The state’s manufacturing sector is also important, with aircraft, food processing, and transportation equipment being the leading industries. Kansas is also home to several major corporations, including Sprint, Cessna, and Koch Industries.
Demographics
As of 2019, the population of Kansas was estimated to be 2,913,314. The state is predominantly white, with about 82.5% of the population identifying as white. The largest minority group is Hispanic or Latino, which makes up about 8.9% of the population. Other minority groups include African Americans (6.2%), Asians (2.2%), and Native Americans (1.2%).
The median household income in Kansas is $54,935, and the median home value is $153,400. The state’s poverty rate is 11.2%, which is slightly lower than the national average.
Conclusion
Kansas is a state located in the Midwestern United States. It is bordered by Nebraska to the north, Missouri to the east, Oklahoma to the south, and Colorado to the west. The state has a total area of 82,278 square miles, making it the 15th largest state in the country. The economy of Kansas is largely based on agriculture, with wheat, corn, and sorghum being the state’s top crops. The population of Kansas was estimated to be 2,913,314 in 2019, with the largest minority group being Hispanic or Latino. The median household income in Kansas is $54,935, and the median home value is $153,400.
Common Questions
What is Per Capita Income in Kansas?
Per Capita income in Kansas is $23,386.
What is the Median Family Income in Kansas?
Median Family Income in Kansas is $76,250.
What is the Median Household income in Kansas?
Median Household Income in Kansas is $32,917.
What is Income or Wage Gap in Kansas?
Income or Wage Gap in Kansas is 9.5%.
Women in Kansas earn 90.5 cents for every dollar earned by a man.
What is Inequality or Gini Index in Kansas?
Inequality or Gini Index in Kansas is 0.56.
What is the Total Population of Kansas?
Total Population of Kansas is 770.
What is the Total Male Population of Kansas?
Total Male Population of Kansas is 290.
What is the Total Female Population of Kansas?
Total Female Population of Kansas is 480.
What is the Ratio of Males per 100 Females in Kansas?
There are 60.42 Males per 100 Females in Kansas.
What is the Ratio of Females per 100 Males in Kansas?
There are 165.52 Females per 100 Males in Kansas.
What is the Median Population Age in Kansas?
Median Population Age in Kansas is 55.1 Years.
What is the Average Family Size in Kansas
Average Family Size in Kansas is 3.2 People.
What is the Average Household Size in Kansas
Average Household Size in Kansas is 2.2 People.
How Large is the Labor Force in Kansas?
There are 383 People in the Labor Forcein in Kansas.
What is the Percentage of People in the Labor Force in Kansas?
56.7% of People are in the Labor Force in Kansas.
What is the Unemployment Rate in Kansas?
Unemployment Rate in Kansas is 3.1%.