Jones, OK Map & Demographics
Jones Map
Jones Overview
$34,444
PER CAPITA INCOME
$79,420
AVG FAMILY INCOME
$74,750
AVG HOUSEHOLD INCOME
17.9%
WAGE / INCOME GAP [ % ]
82.1¢/ $1
WAGE / INCOME GAP [ $ ]
0.44
INEQUALITY / GINI INDEX
2,925
TOTAL POPULATION
1,407
MALE POPULATION
1,518
FEMALE POPULATION
92.69
MALES / 100 FEMALES
107.89
FEMALES / 100 MALES
36.9
MEDIAN AGE
3.3
AVG FAMILY SIZE
2.8
AVG HOUSEHOLD SIZE
1,289
LABOR FORCE [ PEOPLE ]
59.2%
PERCENT IN LABOR FORCE
5.1%
UNEMPLOYMENT RATE
Jones Zip Codes
Jones Area Codes
Income in Jones
Income Overview in Jones
Per Capita Income in Jones is $34,444, while median incomes of families and households are $79,420 and $74,750 respectively.
| Characteristic | Number | Measure |
| Per Capita Income | 2,925 | $34,444 |
| Median Family Income | 707 | $79,420 |
| Mean Family Income | 707 | $109,044 |
| Median Household Income | 1,012 | $74,750 |
| Mean Household Income | 1,012 | $96,442 |
| Income Deficit | 707 | $0 |
| Wage / Income Gap (%) | 2,925 | 17.90% |
| Wage / Income Gap ($) | 2,925 | 82.10¢ per $1 |
| Gini / Inequality Index | 2,925 | 0.44 |
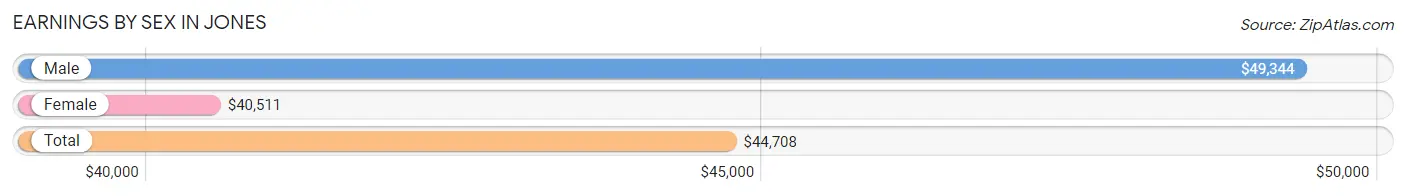
Earnings by Sex in Jones
Average Earnings in Jones are $44,708, $49,344 for men and $40,511 for women, a difference of 17.9%.
| Sex | Number | Average Earnings |
| Male | 705 (52.3%) | $49,344 |
| Female | 643 (47.7%) | $40,511 |
| Total | 1,348 (100.0%) | $44,708 |
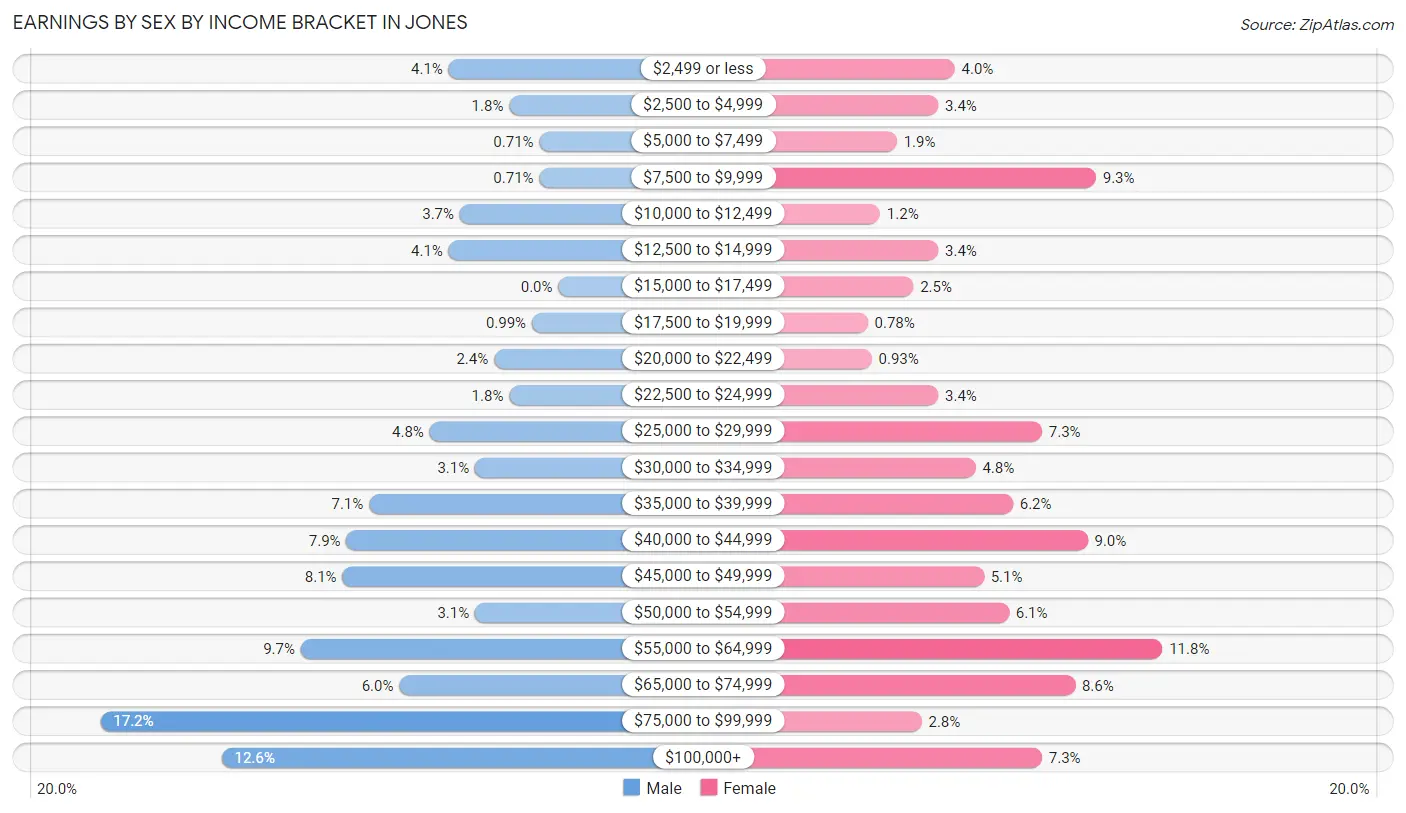
Earnings by Sex by Income Bracket in Jones
The most common earnings brackets in Jones are $75,000 to $99,999 for men (121 | 17.2%) and $55,000 to $64,999 for women (76 | 11.8%).
| Income | Male | Female |
| $2,499 or less | 29 (4.1%) | 26 (4.0%) |
| $2,500 to $4,999 | 13 (1.8%) | 22 (3.4%) |
| $5,000 to $7,499 | 5 (0.7%) | 12 (1.9%) |
| $7,500 to $9,999 | 5 (0.7%) | 60 (9.3%) |
| $10,000 to $12,499 | 26 (3.7%) | 8 (1.2%) |
| $12,500 to $14,999 | 29 (4.1%) | 22 (3.4%) |
| $15,000 to $17,499 | 0 (0.0%) | 16 (2.5%) |
| $17,500 to $19,999 | 7 (1.0%) | 5 (0.8%) |
| $20,000 to $22,499 | 17 (2.4%) | 6 (0.9%) |
| $22,500 to $24,999 | 13 (1.8%) | 22 (3.4%) |
| $25,000 to $29,999 | 34 (4.8%) | 47 (7.3%) |
| $30,000 to $34,999 | 22 (3.1%) | 31 (4.8%) |
| $35,000 to $39,999 | 50 (7.1%) | 40 (6.2%) |
| $40,000 to $44,999 | 56 (7.9%) | 58 (9.0%) |
| $45,000 to $49,999 | 57 (8.1%) | 33 (5.1%) |
| $50,000 to $54,999 | 22 (3.1%) | 39 (6.1%) |
| $55,000 to $64,999 | 68 (9.7%) | 76 (11.8%) |
| $65,000 to $74,999 | 42 (6.0%) | 55 (8.6%) |
| $75,000 to $99,999 | 121 (17.2%) | 18 (2.8%) |
| $100,000+ | 89 (12.6%) | 47 (7.3%) |
| Total | 705 (100.0%) | 643 (100.0%) |
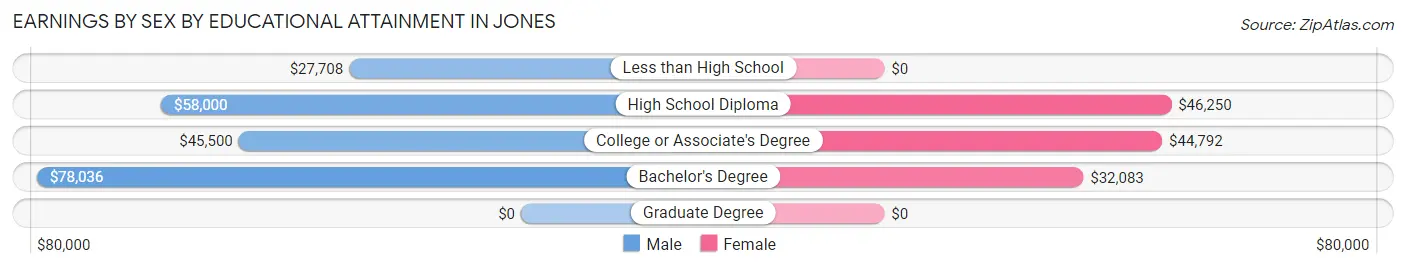
Earnings by Sex by Educational Attainment in Jones
Average earnings in Jones are $55,469 for men and $40,739 for women, a difference of 26.6%. Men with an educational attainment of bachelor's degree enjoy the highest average annual earnings of $78,036, while those with less than high school education earn the least with $27,708. Women with an educational attainment of high school diploma earn the most with the average annual earnings of $46,250, while those with bachelor's degree education have the smallest earnings of $32,083.
| Educational Attainment | Male Income | Female Income |
| Less than High School | $27,708 | $0 |
| High School Diploma | $58,000 | $46,250 |
| College or Associate's Degree | $45,500 | $44,792 |
| Bachelor's Degree | $78,036 | $32,083 |
| Graduate Degree | - | - |
| Total | $55,469 | $40,739 |
Family Income in Jones
Family Income Brackets in Jones
According to the Jones family income data, there are 144 families falling into the $100,000 to $149,999 income range, which is the most common income bracket and makes up 20.4% of all families. Conversely, the $10,000 to $14,999 income bracket is the least frequent group with only 10 families (1.4%) belonging to this category.
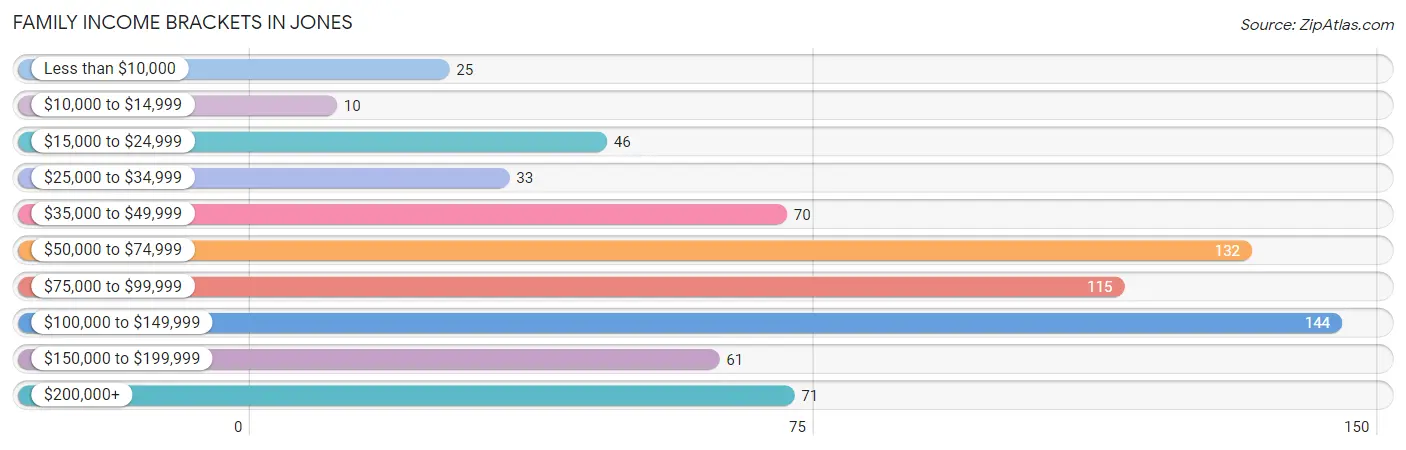
| Income Bracket | # Families | % Families |
| Less than $10,000 | 25 | 3.5% |
| $10,000 to $14,999 | 10 | 1.4% |
| $15,000 to $24,999 | 46 | 6.5% |
| $25,000 to $34,999 | 33 | 4.7% |
| $35,000 to $49,999 | 70 | 9.9% |
| $50,000 to $74,999 | 132 | 18.7% |
| $75,000 to $99,999 | 115 | 16.3% |
| $100,000 to $149,999 | 144 | 20.4% |
| $150,000 to $199,999 | 61 | 8.6% |
| $200,000+ | 71 | 10.0% |
Family Income by Famaliy Size in Jones
6-person families (32 | 4.5%) account for the highest median family income in Jones with $101,447 per family, while 2-person families (342 | 48.4%) have the highest median income of $36,458 per family member.
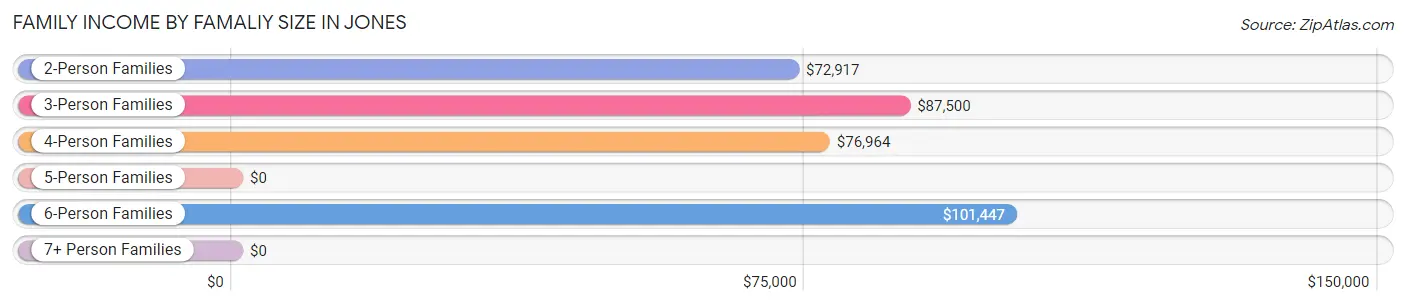
| Income Bracket | # Families | Median Income |
| 2-Person Families | 342 (48.4%) | $72,917 |
| 3-Person Families | 128 (18.1%) | $87,500 |
| 4-Person Families | 155 (21.9%) | $76,964 |
| 5-Person Families | 32 (4.5%) | $0 |
| 6-Person Families | 32 (4.5%) | $101,447 |
| 7+ Person Families | 18 (2.5%) | $0 |
| Total | 707 (100.0%) | $79,420 |
Family Income by Number of Earners in Jones
The median family income in Jones is $79,420, with families comprising 3+ earners (49) having the highest median family income of $159,821, while families with 1 earner (233) have the lowest median family income of $50,114, accounting for 6.9% and 33.0% of families, respectively.
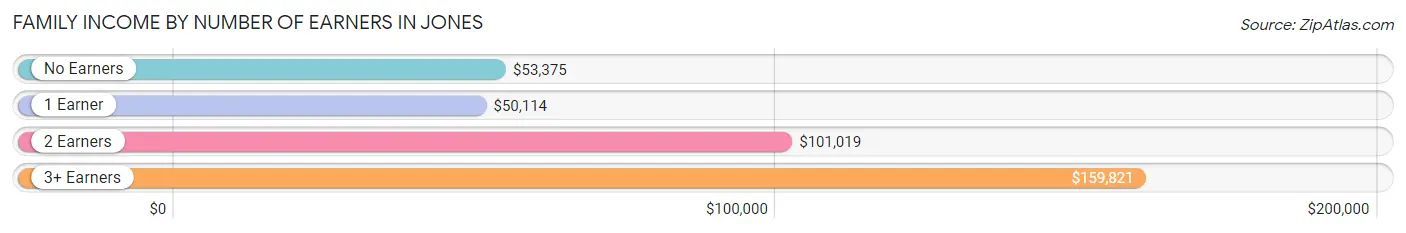
| Number of Earners | # Families | Median Income |
| No Earners | 135 (19.1%) | $53,375 |
| 1 Earner | 233 (33.0%) | $50,114 |
| 2 Earners | 290 (41.0%) | $101,019 |
| 3+ Earners | 49 (6.9%) | $159,821 |
| Total | 707 (100.0%) | $79,420 |
Household Income in Jones
Household Income Brackets in Jones
With 179 households falling in the category, the $50,000 to $74,999 income range is the most frequent in Jones, accounting for 17.7% of all households. In contrast, only 27 households (2.7%) fall into the less than $10,000 income bracket, making it the least populous group.
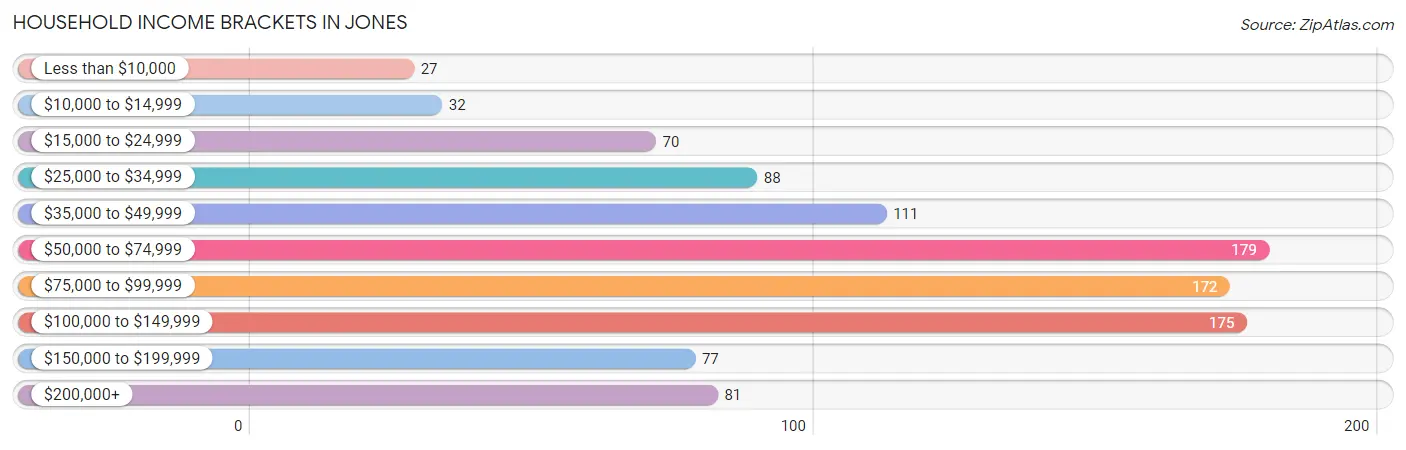
| Income Bracket | # Households | % Households |
| Less than $10,000 | 27 | 2.7% |
| $10,000 to $14,999 | 32 | 3.2% |
| $15,000 to $24,999 | 70 | 6.9% |
| $25,000 to $34,999 | 88 | 8.7% |
| $35,000 to $49,999 | 111 | 11.0% |
| $50,000 to $74,999 | 179 | 17.7% |
| $75,000 to $99,999 | 172 | 17.0% |
| $100,000 to $149,999 | 175 | 17.3% |
| $150,000 to $199,999 | 77 | 7.6% |
| $200,000+ | 81 | 8.0% |
Household Income by Householder Age in Jones
The median household income in Jones is $74,750, with the highest median household income of $95,427 found in the 45 to 64 years age bracket for the primary householder. A total of 368 households (36.4%) fall into this category. Meanwhile, the 65+ years age bracket for the primary householder has the lowest median household income of $53,375, with 235 households (23.2%) in this group.
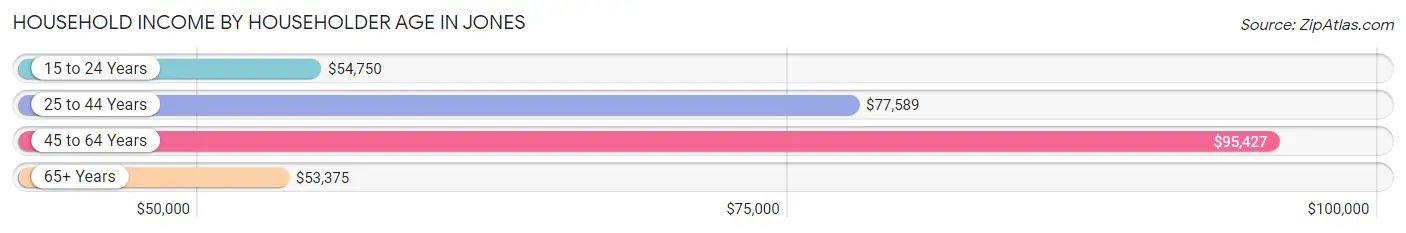
| Income Bracket | # Households | Median Income |
| 15 to 24 Years | 29 (2.9%) | $54,750 |
| 25 to 44 Years | 380 (37.6%) | $77,589 |
| 45 to 64 Years | 368 (36.4%) | $95,427 |
| 65+ Years | 235 (23.2%) | $53,375 |
| Total | 1,012 (100.0%) | $74,750 |
Poverty in Jones
Income Below Poverty by Sex and Age in Jones
With 12.3% poverty level for males and 17.9% for females among the residents of Jones, 15 year old males and 5 year old females are the most vulnerable to poverty, with 6 males (40.0%) and 9 females (100.0%) in their respective age groups living below the poverty level.
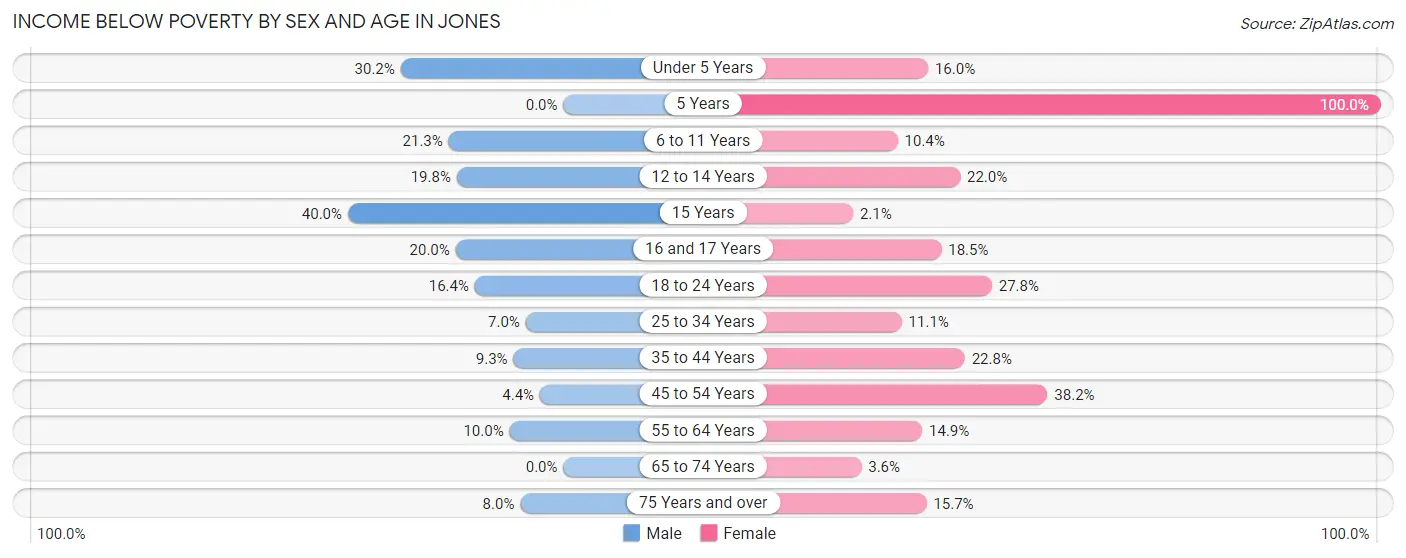
| Age Bracket | Male | Female |
| Under 5 Years | 29 (30.2%) | 16 (16.0%) |
| 5 Years | 0 (0.0%) | 9 (100.0%) |
| 6 to 11 Years | 23 (21.3%) | 20 (10.4%) |
| 12 to 14 Years | 19 (19.8%) | 9 (22.0%) |
| 15 Years | 6 (40.0%) | 1 (2.1%) |
| 16 and 17 Years | 10 (20.0%) | 12 (18.5%) |
| 18 to 24 Years | 23 (16.4%) | 27 (27.8%) |
| 25 to 34 Years | 10 (7.0%) | 16 (11.1%) |
| 35 to 44 Years | 20 (9.3%) | 47 (22.8%) |
| 45 to 54 Years | 7 (4.3%) | 58 (38.2%) |
| 55 to 64 Years | 15 (10.0%) | 24 (14.9%) |
| 65 to 74 Years | 0 (0.0%) | 5 (3.6%) |
| 75 Years and over | 6 (8.0%) | 11 (15.7%) |
| Total | 168 (12.3%) | 255 (17.9%) |
Income Above Poverty by Sex and Age in Jones
According to the poverty statistics in Jones, males aged 5 years and females aged 15 years are the age groups that are most secure financially, with 100.0% of males and 97.9% of females in these age groups living above the poverty line.
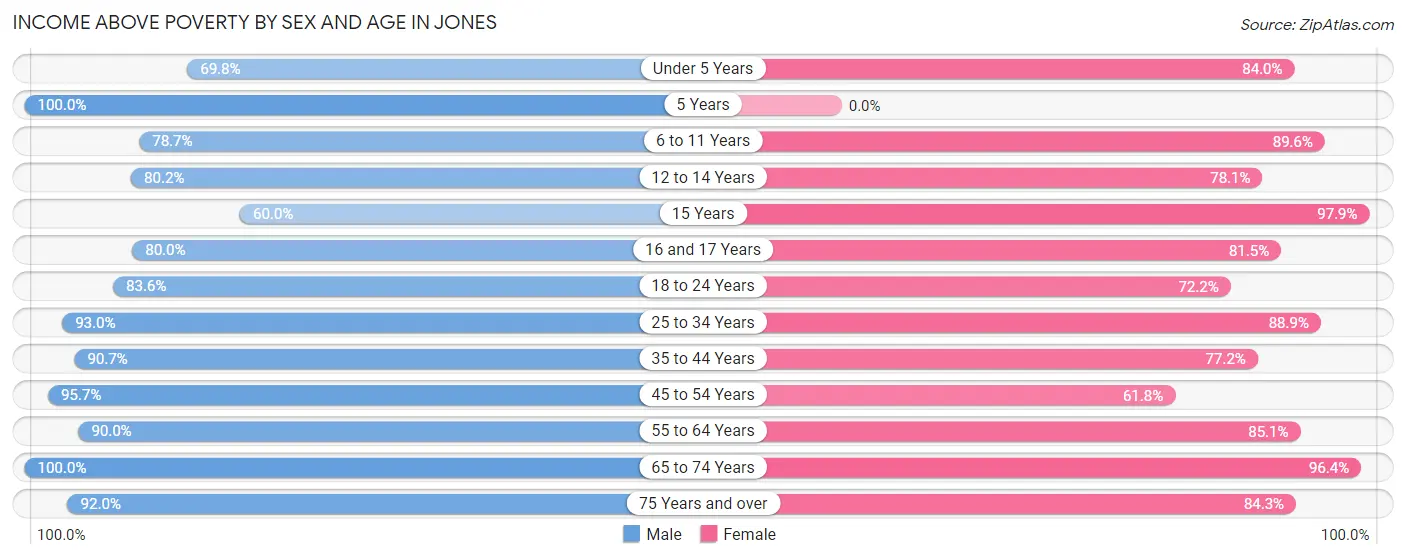
| Age Bracket | Male | Female |
| Under 5 Years | 67 (69.8%) | 84 (84.0%) |
| 5 Years | 7 (100.0%) | 0 (0.0%) |
| 6 to 11 Years | 85 (78.7%) | 173 (89.6%) |
| 12 to 14 Years | 77 (80.2%) | 32 (78.0%) |
| 15 Years | 9 (60.0%) | 47 (97.9%) |
| 16 and 17 Years | 40 (80.0%) | 53 (81.5%) |
| 18 to 24 Years | 117 (83.6%) | 70 (72.2%) |
| 25 to 34 Years | 133 (93.0%) | 128 (88.9%) |
| 35 to 44 Years | 196 (90.7%) | 159 (77.2%) |
| 45 to 54 Years | 154 (95.7%) | 94 (61.8%) |
| 55 to 64 Years | 135 (90.0%) | 137 (85.1%) |
| 65 to 74 Years | 106 (100.0%) | 133 (96.4%) |
| 75 Years and over | 69 (92.0%) | 59 (84.3%) |
| Total | 1,195 (87.7%) | 1,169 (82.1%) |
Income Below Poverty Among Married-Couple Families in Jones
The poverty statistics for married-couple families in Jones show that 2.5% or 12 of the total 483 families live below the poverty line. Families with 3 or 4 children have the highest poverty rate of 10.5%, comprising of 6 families. On the other hand, families with 1 or 2 children have the lowest poverty rate of 0.0%, which includes 0 families.
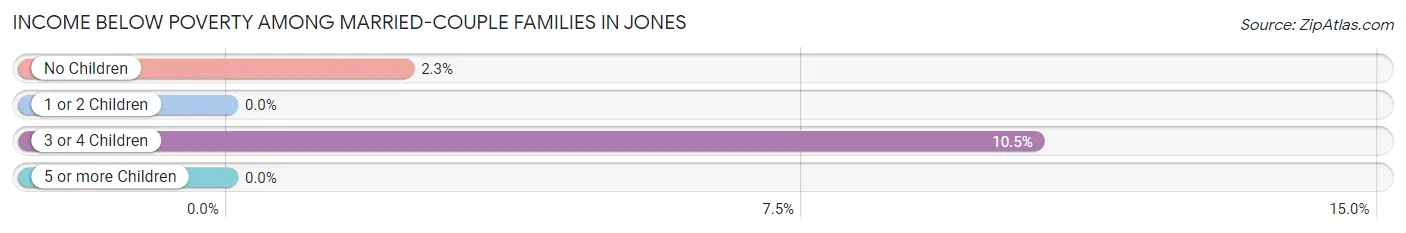
| Children | Above Poverty | Below Poverty |
| No Children | 255 (97.7%) | 6 (2.3%) |
| 1 or 2 Children | 161 (100.0%) | 0 (0.0%) |
| 3 or 4 Children | 51 (89.5%) | 6 (10.5%) |
| 5 or more Children | 4 (100.0%) | 0 (0.0%) |
| Total | 471 (97.5%) | 12 (2.5%) |
Income Below Poverty Among Single-Parent Households in Jones
According to the poverty data in Jones, 20.7% or 18 single-father households and 38.0% or 52 single-mother households are living below the poverty line. Among single-father households, those with 3 or 4 children have the highest poverty rate, with 7 households (70.0%) experiencing poverty. Likewise, among single-mother households, those with 3 or 4 children have the highest poverty rate, with 16 households (47.1%) falling below the poverty line.
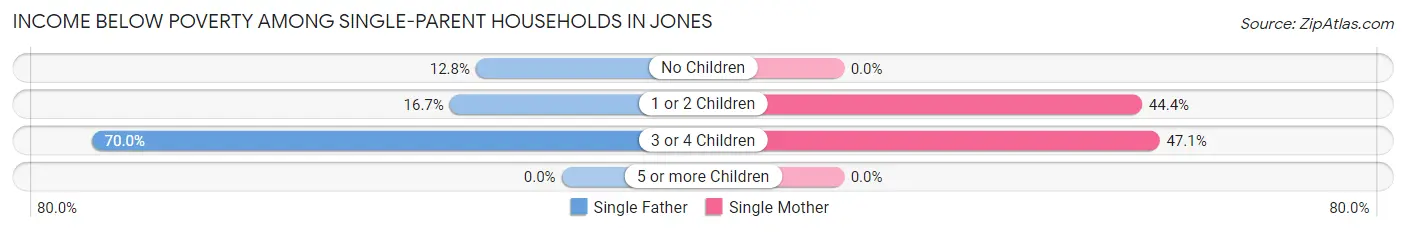
| Children | Single Father | Single Mother |
| No Children | 6 (12.8%) | 0 (0.0%) |
| 1 or 2 Children | 5 (16.7%) | 36 (44.4%) |
| 3 or 4 Children | 7 (70.0%) | 16 (47.1%) |
| 5 or more Children | 0 (0.0%) | 0 (0.0%) |
| Total | 18 (20.7%) | 52 (38.0%) |
Income Below Poverty Among Married-Couple vs Single-Parent Households in Jones
The poverty data for Jones shows that 12 of the married-couple family households (2.5%) and 70 of the single-parent households (31.2%) are living below the poverty level. Within the married-couple family households, those with 3 or 4 children have the highest poverty rate, with 6 households (10.5%) falling below the poverty line. Among the single-parent households, those with 3 or 4 children have the highest poverty rate, with 23 household (52.3%) living below poverty.
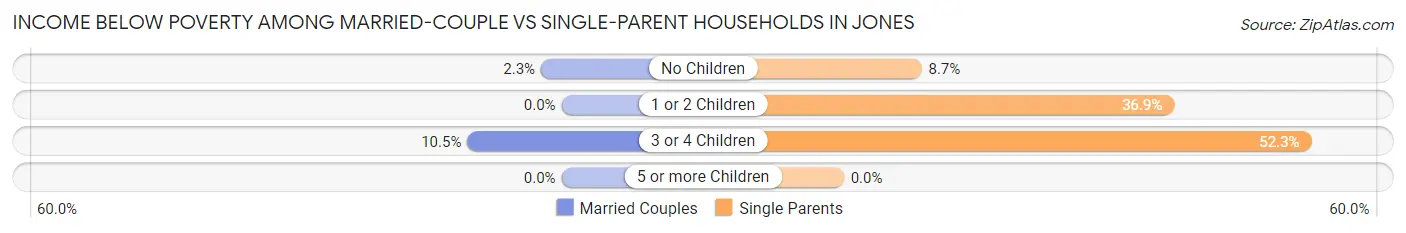
| Children | Married-Couple Families | Single-Parent Households |
| No Children | 6 (2.3%) | 6 (8.7%) |
| 1 or 2 Children | 0 (0.0%) | 41 (36.9%) |
| 3 or 4 Children | 6 (10.5%) | 23 (52.3%) |
| 5 or more Children | 0 (0.0%) | 0 (0.0%) |
| Total | 12 (2.5%) | 70 (31.2%) |
Race in Jones
The most populous races in Jones are White / Caucasian (2,472 | 84.5%), Two or more Races (222 | 7.6%), and Black / African American (161 | 5.5%).
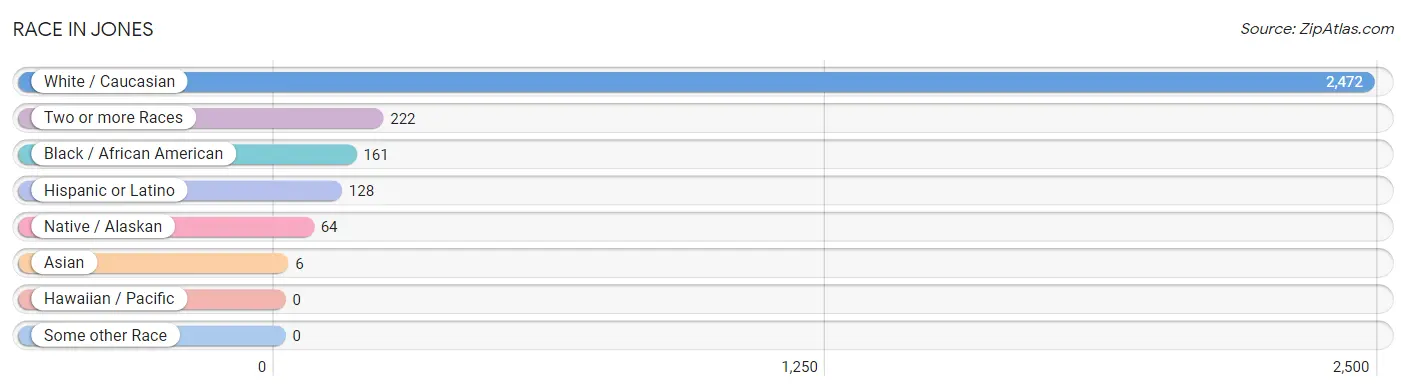
| Race | # Population | % Population |
| Asian | 6 | 0.2% |
| Black / African American | 161 | 5.5% |
| Hawaiian / Pacific | 0 | 0.0% |
| Hispanic or Latino | 128 | 4.4% |
| Native / Alaskan | 64 | 2.2% |
| White / Caucasian | 2,472 | 84.5% |
| Two or more Races | 222 | 7.6% |
| Some other Race | 0 | 0.0% |
| Total | 2,925 | 100.0% |
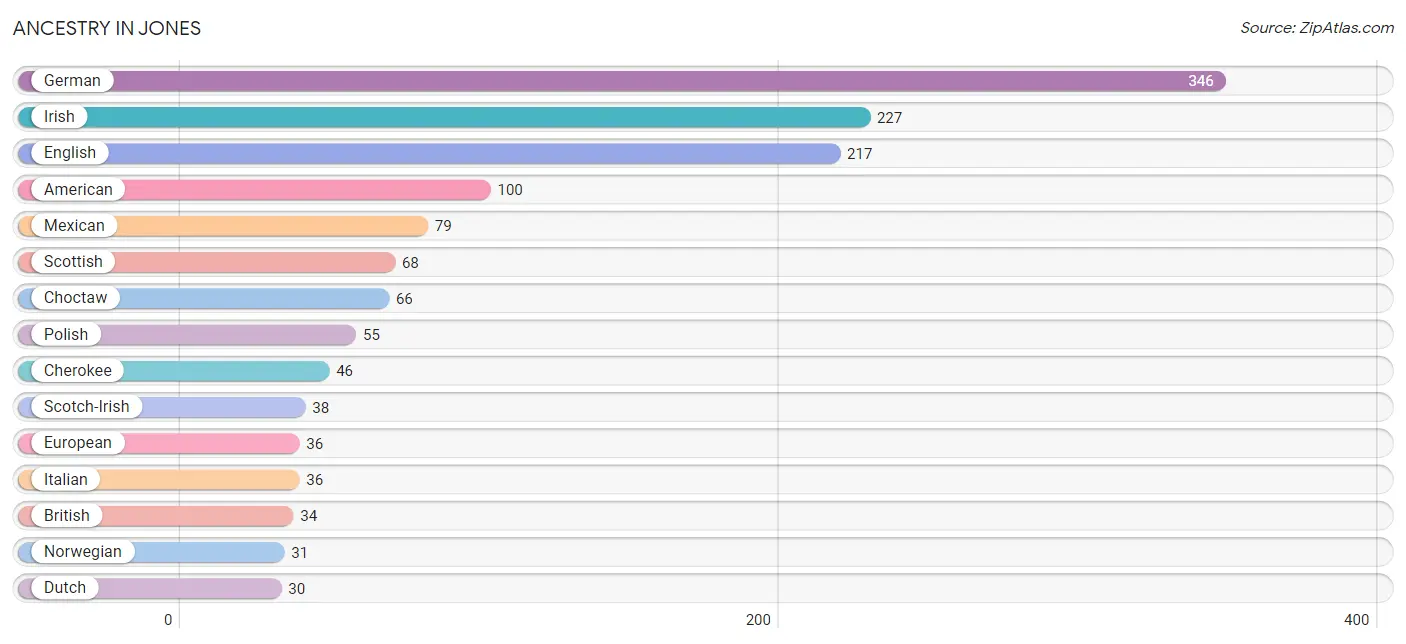
Ancestry in Jones
The most populous ancestries reported in Jones are German (346 | 11.8%), Irish (227 | 7.8%), English (217 | 7.4%), American (100 | 3.4%), and Mexican (79 | 2.7%), together accounting for 33.1% of all Jones residents.
| Ancestry | # Population | % Population |
| Aleut | 6 | 0.2% |
| American | 100 | 3.4% |
| Apache | 6 | 0.2% |
| Bhutanese | 4 | 0.1% |
| British | 34 | 1.2% |
| Central American | 5 | 0.2% |
| Central American Indian | 5 | 0.2% |
| Cherokee | 46 | 1.6% |
| Chickasaw | 4 | 0.1% |
| Choctaw | 66 | 2.3% |
| Creek | 4 | 0.1% |
| Czech | 2 | 0.1% |
| Dutch | 30 | 1.0% |
| English | 217 | 7.4% |
| European | 36 | 1.2% |
| French | 16 | 0.5% |
| French Canadian | 18 | 0.6% |
| German | 346 | 11.8% |
| Indian (Asian) | 4 | 0.1% |
| Iranian | 5 | 0.2% |
| Irish | 227 | 7.8% |
| Italian | 36 | 1.2% |
| Kenyan | 11 | 0.4% |
| Korean | 14 | 0.5% |
| Mexican | 79 | 2.7% |
| Native Hawaiian | 7 | 0.2% |
| Norwegian | 31 | 1.1% |
| Polish | 55 | 1.9% |
| Portuguese | 7 | 0.2% |
| Potawatomi | 19 | 0.6% |
| Puerto Rican | 12 | 0.4% |
| Salvadoran | 5 | 0.2% |
| Scandinavian | 16 | 0.5% |
| Scotch-Irish | 38 | 1.3% |
| Scottish | 68 | 2.3% |
| Seminole | 1 | 0.0% |
| Spanish | 26 | 0.9% |
| Sri Lankan | 7 | 0.2% |
| Subsaharan African | 11 | 0.4% |
| Swedish | 30 | 1.0% |
| Swiss | 5 | 0.2% |
| Welsh | 20 | 0.7% | View All 42 Rows |
Immigrants in Jones
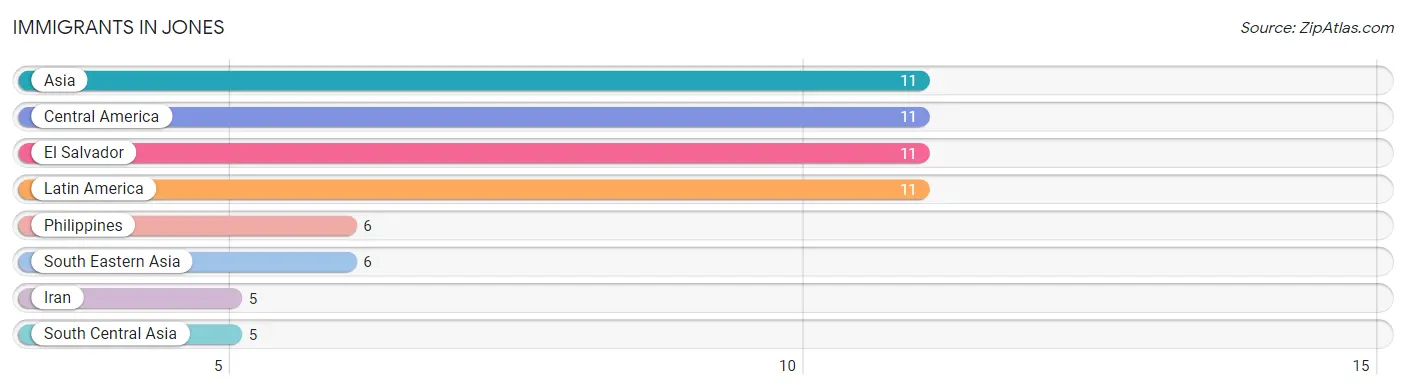
The most numerous immigrant groups reported in Jones came from Asia (11 | 0.4%), Central America (11 | 0.4%), El Salvador (11 | 0.4%), Latin America (11 | 0.4%), and Philippines (6 | 0.2%), together accounting for 1.7% of all Jones residents.
| Immigration Origin | # Population | % Population |
| Asia | 11 | 0.4% |
| Central America | 11 | 0.4% |
| El Salvador | 11 | 0.4% |
| Iran | 5 | 0.2% |
| Latin America | 11 | 0.4% |
| Philippines | 6 | 0.2% |
| South Central Asia | 5 | 0.2% |
| South Eastern Asia | 6 | 0.2% | View All 8 Rows |
Sex and Age in Jones
Sex and Age in Jones
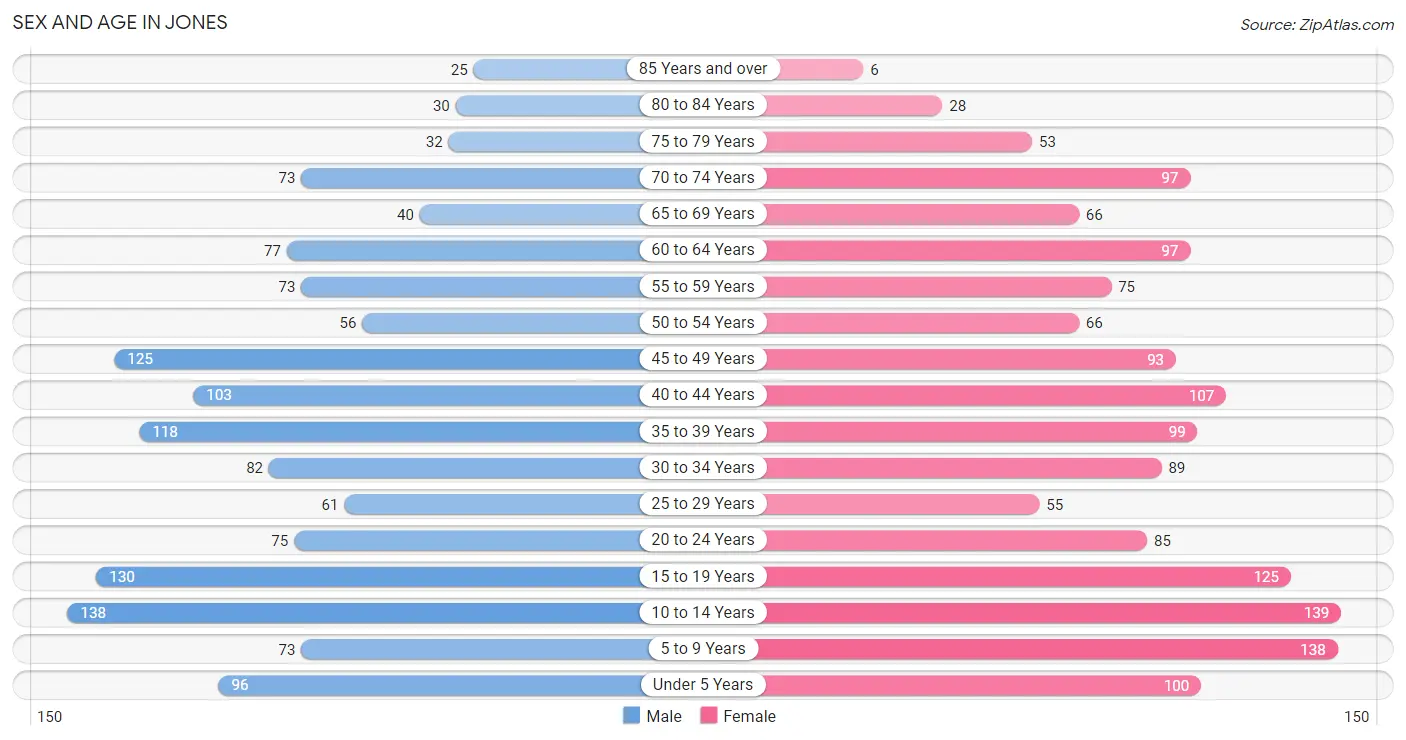
The most populous age groups in Jones are 10 to 14 Years (138 | 9.8%) for men and 10 to 14 Years (139 | 9.2%) for women.
| Age Bracket | Male | Female |
| Under 5 Years | 96 (6.8%) | 100 (6.6%) |
| 5 to 9 Years | 73 (5.2%) | 138 (9.1%) |
| 10 to 14 Years | 138 (9.8%) | 139 (9.2%) |
| 15 to 19 Years | 130 (9.2%) | 125 (8.2%) |
| 20 to 24 Years | 75 (5.3%) | 85 (5.6%) |
| 25 to 29 Years | 61 (4.3%) | 55 (3.6%) |
| 30 to 34 Years | 82 (5.8%) | 89 (5.9%) |
| 35 to 39 Years | 118 (8.4%) | 99 (6.5%) |
| 40 to 44 Years | 103 (7.3%) | 107 (7.0%) |
| 45 to 49 Years | 125 (8.9%) | 93 (6.1%) |
| 50 to 54 Years | 56 (4.0%) | 66 (4.3%) |
| 55 to 59 Years | 73 (5.2%) | 75 (4.9%) |
| 60 to 64 Years | 77 (5.5%) | 97 (6.4%) |
| 65 to 69 Years | 40 (2.8%) | 66 (4.3%) |
| 70 to 74 Years | 73 (5.2%) | 97 (6.4%) |
| 75 to 79 Years | 32 (2.3%) | 53 (3.5%) |
| 80 to 84 Years | 30 (2.1%) | 28 (1.8%) |
| 85 Years and over | 25 (1.8%) | 6 (0.4%) |
| Total | 1,407 (100.0%) | 1,518 (100.0%) |
Families and Households in Jones
Median Family Size in Jones
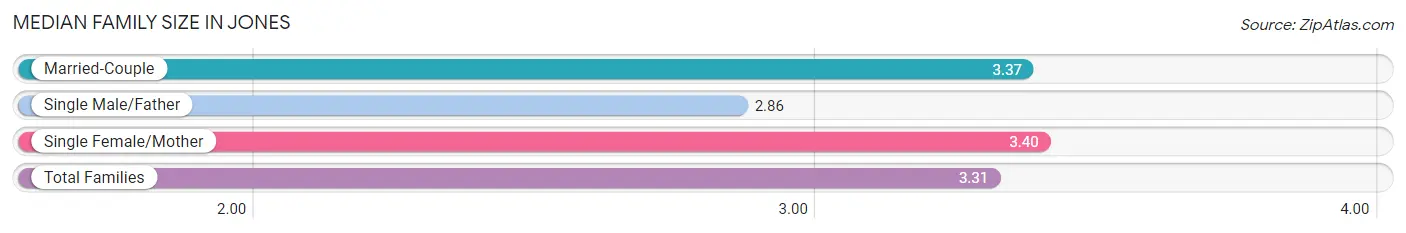
The median family size in Jones is 3.31 persons per family, with single female/mother families (137 | 19.4%) accounting for the largest median family size of 3.4 persons per family. On the other hand, single male/father families (87 | 12.3%) represent the smallest median family size with 2.86 persons per family.
| Family Type | # Families | Family Size |
| Married-Couple | 483 (68.3%) | 3.37 |
| Single Male/Father | 87 (12.3%) | 2.86 |
| Single Female/Mother | 137 (19.4%) | 3.40 |
| Total Families | 707 (100.0%) | 3.31 |
Median Household Size in Jones
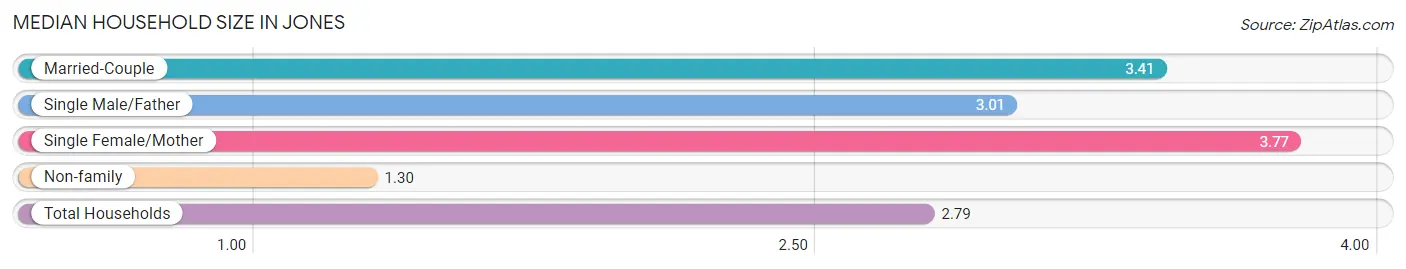
The median household size in Jones is 2.79 persons per household, with single female/mother households (137 | 13.5%) accounting for the largest median household size of 3.77 persons per household. non-family households (305 | 30.1%) represent the smallest median household size with 1.30 persons per household.
| Household Type | # Households | Household Size |
| Married-Couple | 483 (47.7%) | 3.41 |
| Single Male/Father | 87 (8.6%) | 3.01 |
| Single Female/Mother | 137 (13.5%) | 3.77 |
| Non-family | 305 (30.1%) | 1.30 |
| Total Households | 1,012 (100.0%) | 2.79 |
Household Size by Marriage Status in Jones
Out of a total of 1,012 households in Jones, 707 (69.9%) are family households, while 305 (30.1%) are nonfamily households. The most numerous type of family households are 2-person households, comprising 323, and the most common type of nonfamily households are 1-person households, comprising 225.
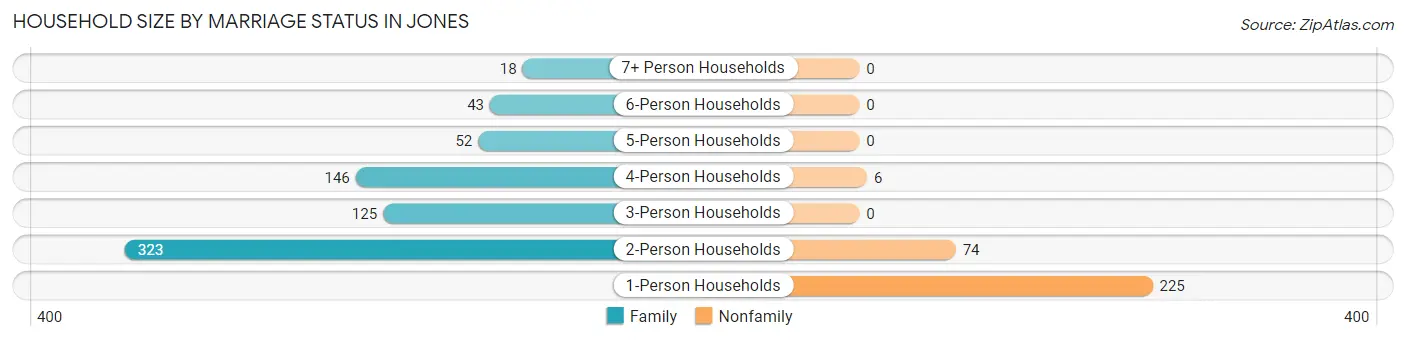
| Household Size | Family Households | Nonfamily Households |
| 1-Person Households | - | 225 (22.2%) |
| 2-Person Households | 323 (31.9%) | 74 (7.3%) |
| 3-Person Households | 125 (12.3%) | 0 (0.0%) |
| 4-Person Households | 146 (14.4%) | 6 (0.6%) |
| 5-Person Households | 52 (5.1%) | 0 (0.0%) |
| 6-Person Households | 43 (4.3%) | 0 (0.0%) |
| 7+ Person Households | 18 (1.8%) | 0 (0.0%) |
| Total | 707 (69.9%) | 305 (30.1%) |
Female Fertility in Jones
Fertility by Age in Jones
Average fertility rate in Jones is 95.0 births per 1,000 women. Women in the age bracket of 20 to 34 years have the highest fertility rate with 218.0 births per 1,000 women. Women in the age bracket of 20 to 34 years acount for 80.6% of all women with births.
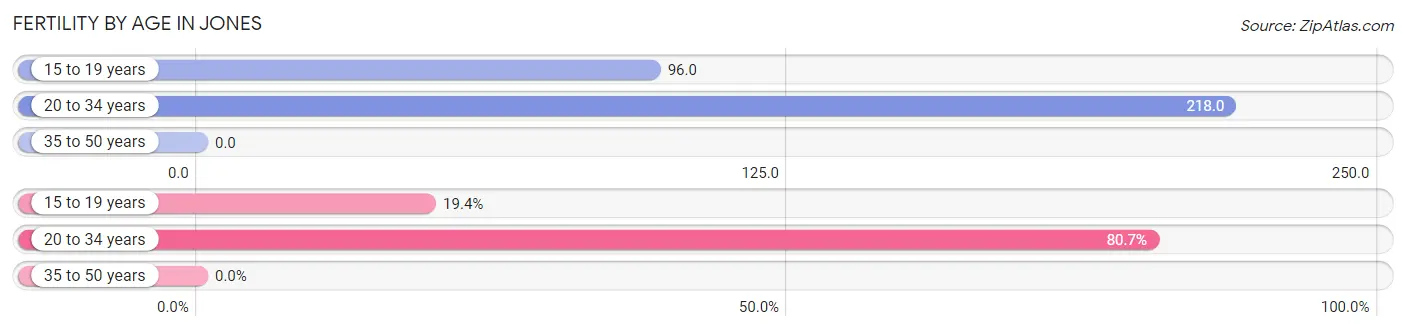
| Age Bracket | Women with Births | Births / 1,000 Women |
| 15 to 19 years | 12 (19.4%) | 96.0 |
| 20 to 34 years | 50 (80.6%) | 218.0 |
| 35 to 50 years | 0 (0.0%) | 0.0 |
| Total | 62 (100.0%) | 95.0 |
Fertility by Age by Marriage Status in Jones
50.0% of women with births (62) in Jones are married. The highest percentage of unmarried women with births falls into 15 to 19 years age bracket with 100.0% of them unmarried at the time of birth, while the lowest percentage of unmarried women with births belong to 20 to 34 years age bracket with 38.0% of them unmarried.
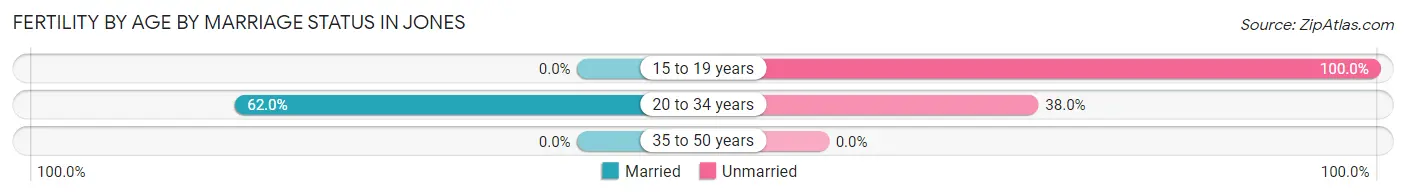
| Age Bracket | Married | Unmarried |
| 15 to 19 years | 0 (0.0%) | 12 (100.0%) |
| 20 to 34 years | 31 (62.0%) | 19 (38.0%) |
| 35 to 50 years | 0 (0.0%) | 0 (0.0%) |
| Total | 31 (50.0%) | 31 (50.0%) |
Fertility by Education in Jones
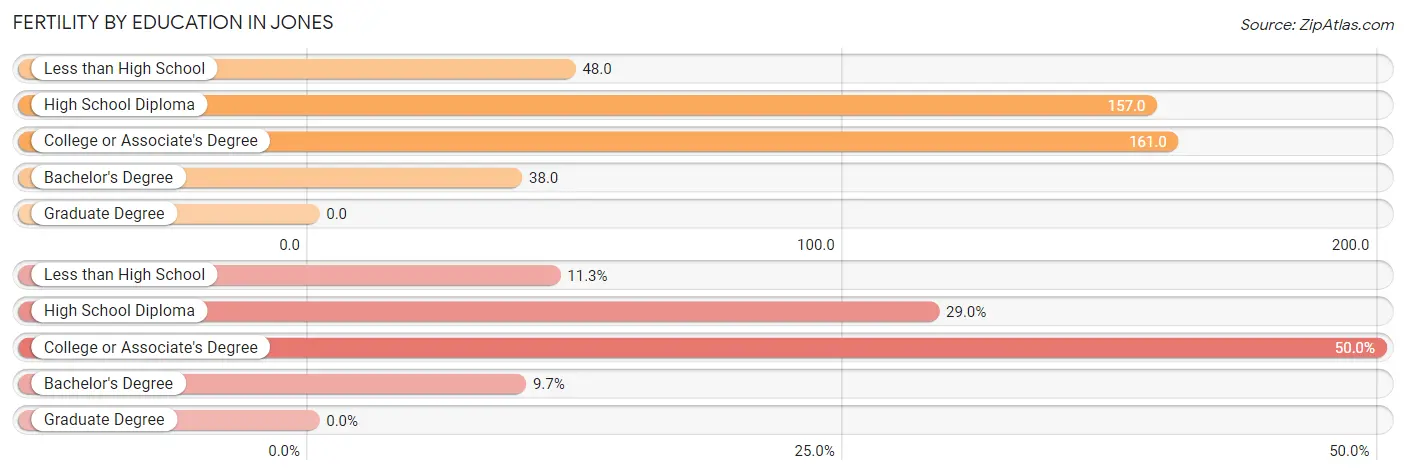
| Educational Attainment | Women with Births | Births / 1,000 Women |
| Less than High School | 7 (11.3%) | 48.0 |
| High School Diploma | 18 (29.0%) | 157.0 |
| College or Associate's Degree | 31 (50.0%) | 161.0 |
| Bachelor's Degree | 6 (9.7%) | 38.0 |
| Graduate Degree | 0 (0.0%) | 0.0 |
| Total | 62 (100.0%) | 95.0 |
Fertility by Education by Marriage Status in Jones
50.0% of women with births in Jones are unmarried. Women with the educational attainment of bachelor's degree are most likely to be married with 100.0% of them married at childbirth, while women with the educational attainment of less than high school are least likely to be married with 100.0% of them unmarried at childbirth.
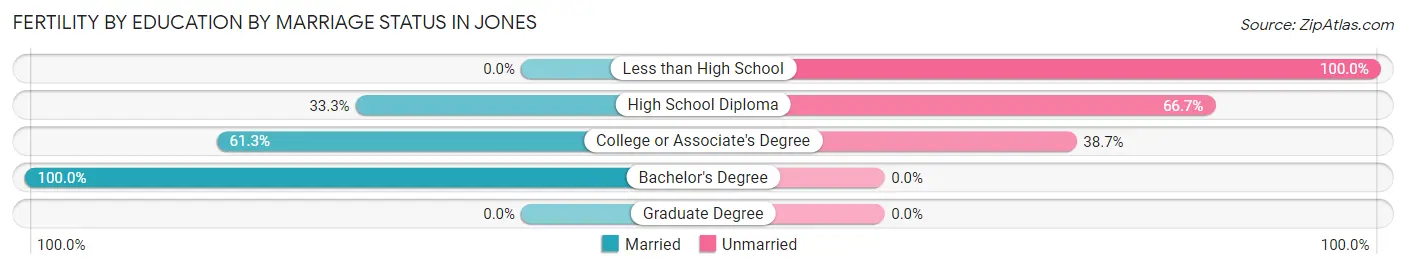
| Educational Attainment | Married | Unmarried |
| Less than High School | 0 (0.0%) | 7 (100.0%) |
| High School Diploma | 6 (33.3%) | 12 (66.7%) |
| College or Associate's Degree | 19 (61.3%) | 12 (38.7%) |
| Bachelor's Degree | 6 (100.0%) | 0 (0.0%) |
| Graduate Degree | 0 (0.0%) | 0 (0.0%) |
| Total | 31 (50.0%) | 31 (50.0%) |
Employment Characteristics in Jones
Employment by Class of Employer in Jones
Among the 1,219 employed individuals in Jones, private company employees (618 | 50.7%), state government employees (164 | 13.5%), and local government employees (150 | 12.3%) make up the most common classes of employment.
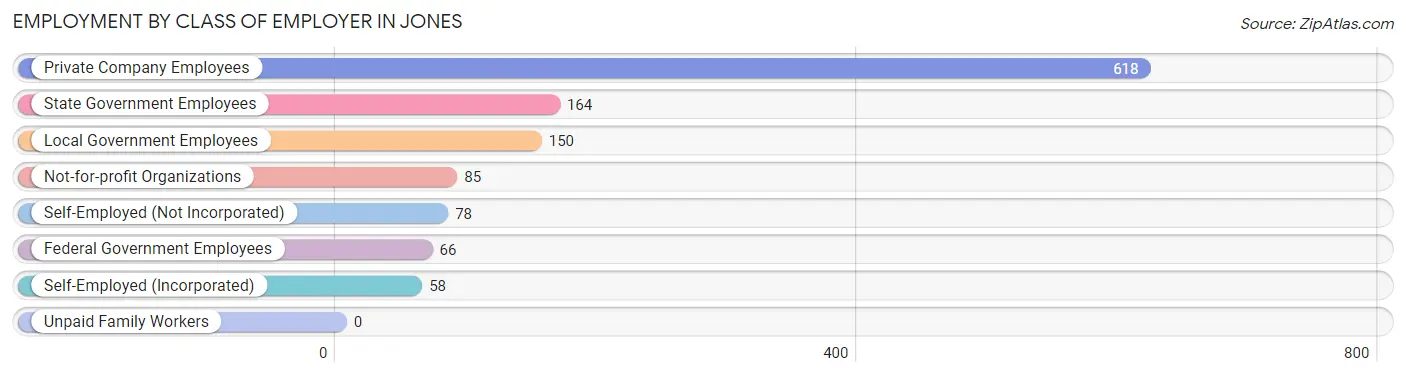
| Employer Class | # Employees | % Employees |
| Private Company Employees | 618 | 50.7% |
| Self-Employed (Incorporated) | 58 | 4.8% |
| Self-Employed (Not Incorporated) | 78 | 6.4% |
| Not-for-profit Organizations | 85 | 7.0% |
| Local Government Employees | 150 | 12.3% |
| State Government Employees | 164 | 13.5% |
| Federal Government Employees | 66 | 5.4% |
| Unpaid Family Workers | 0 | 0.0% |
| Total | 1,219 | 100.0% |
Employment Status by Age in Jones
According to the labor force statistics for Jones, out of the total population over 16 years of age (2,178), 59.2% or 1,289 individuals are in the labor force, with 5.1% or 66 of them unemployed. The age group with the highest labor force participation rate is 30 to 34 years, with 85.4% or 146 individuals in the labor force. Within the labor force, the 20 to 24 years age range has the highest percentage of unemployed individuals, with 17.4% or 23 of them being unemployed.
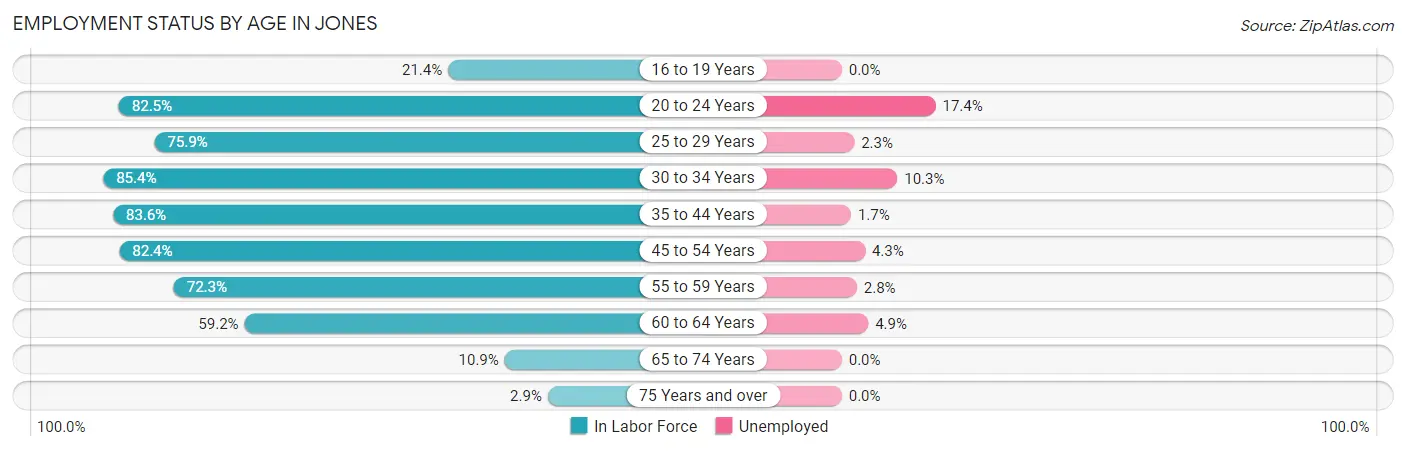
| Age Bracket | In Labor Force | Unemployed |
| 16 to 19 Years | 41 (21.4%) | 0 (0.0%) |
| 20 to 24 Years | 132 (82.5%) | 23 (17.4%) |
| 25 to 29 Years | 88 (75.9%) | 2 (2.3%) |
| 30 to 34 Years | 146 (85.4%) | 15 (10.3%) |
| 35 to 44 Years | 357 (83.6%) | 6 (1.7%) |
| 45 to 54 Years | 280 (82.4%) | 12 (4.3%) |
| 55 to 59 Years | 107 (72.3%) | 3 (2.8%) |
| 60 to 64 Years | 103 (59.2%) | 5 (4.9%) |
| 65 to 74 Years | 30 (10.9%) | 0 (0.0%) |
| 75 Years and over | 5 (2.9%) | 0 (0.0%) |
| Total | 1,289 (59.2%) | 66 (5.1%) |
Employment Status by Educational Attainment in Jones
According to labor force statistics for Jones, 78.6% of individuals (1,082) out of the total population between 25 and 64 years of age (1,376) are in the labor force, with 4.0% or 43 of them being unemployed. The group with the highest labor force participation rate are those with the educational attainment of bachelor's degree or higher, with 91.3% or 366 individuals in the labor force. Within the labor force, individuals with less than high school education have the highest percentage of unemployment, with 14.8% or 9 of them being unemployed.
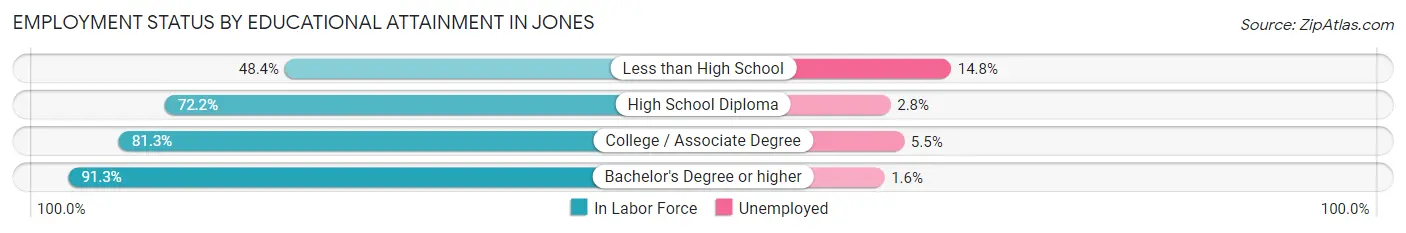
| Educational Attainment | In Labor Force | Unemployed |
| Less than High School | 61 (48.4%) | 19 (14.8%) |
| High School Diploma | 288 (72.2%) | 11 (2.8%) |
| College / Associate Degree | 366 (81.3%) | 25 (5.5%) |
| Bachelor's Degree or higher | 366 (91.3%) | 6 (1.6%) |
| Total | 1,082 (78.6%) | 55 (4.0%) |
Employment Occupations by Sex in Jones
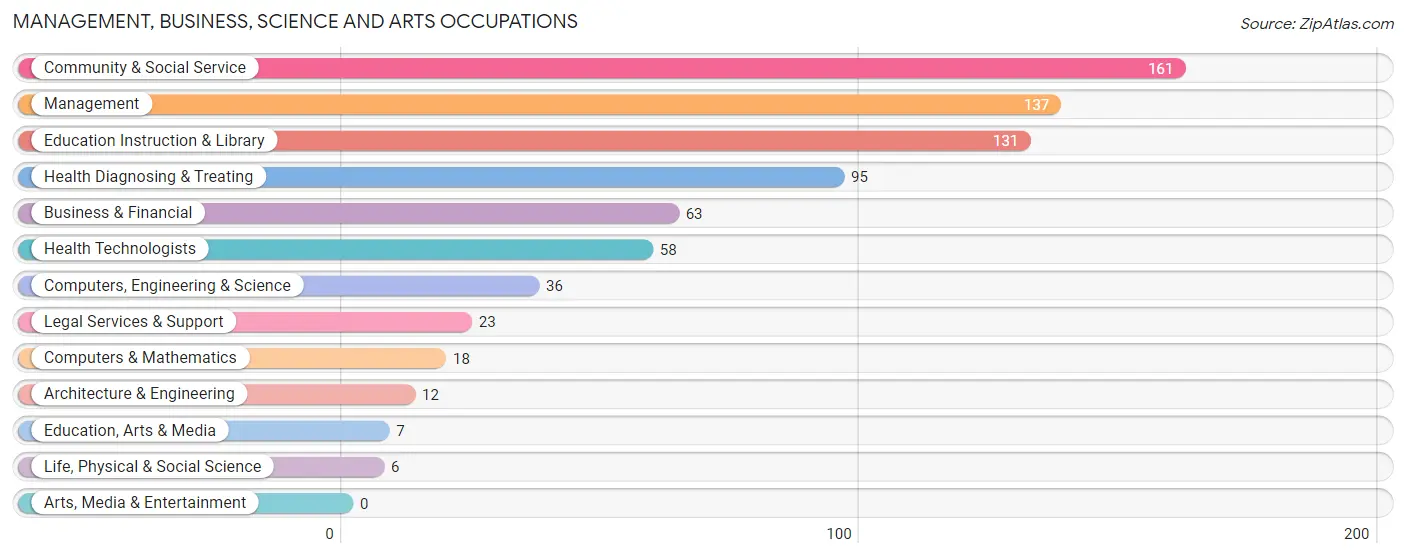
Management, Business, Science and Arts Occupations
The most common Management, Business, Science and Arts occupations in Jones are Community & Social Service (161 | 13.2%), Management (137 | 11.2%), Education Instruction & Library (131 | 10.7%), Health Diagnosing & Treating (95 | 7.8%), and Business & Financial (63 | 5.1%).
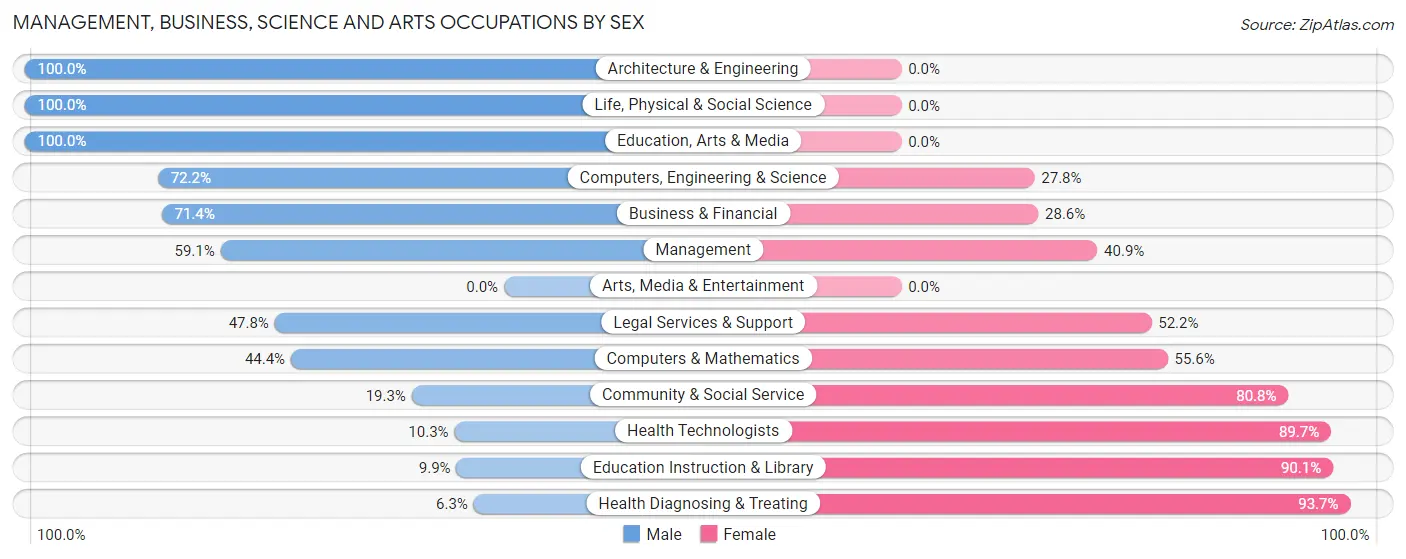
Management, Business, Science and Arts Occupations by Sex
Within the Management, Business, Science and Arts occupations in Jones, the most male-oriented occupations are Architecture & Engineering (100.0%), Life, Physical & Social Science (100.0%), and Education, Arts & Media (100.0%), while the most female-oriented occupations are Health Diagnosing & Treating (93.7%), Education Instruction & Library (90.1%), and Health Technologists (89.7%).
| Occupation | Male | Female |
| Management | 81 (59.1%) | 56 (40.9%) |
| Business & Financial | 45 (71.4%) | 18 (28.6%) |
| Computers, Engineering & Science | 26 (72.2%) | 10 (27.8%) |
| Computers & Mathematics | 8 (44.4%) | 10 (55.6%) |
| Architecture & Engineering | 12 (100.0%) | 0 (0.0%) |
| Life, Physical & Social Science | 6 (100.0%) | 0 (0.0%) |
| Community & Social Service | 31 (19.3%) | 130 (80.7%) |
| Education, Arts & Media | 7 (100.0%) | 0 (0.0%) |
| Legal Services & Support | 11 (47.8%) | 12 (52.2%) |
| Education Instruction & Library | 13 (9.9%) | 118 (90.1%) |
| Arts, Media & Entertainment | 0 (0.0%) | 0 (0.0%) |
| Health Diagnosing & Treating | 6 (6.3%) | 89 (93.7%) |
| Health Technologists | 6 (10.3%) | 52 (89.7%) |
| Total (Category) | 189 (38.4%) | 303 (61.6%) |
| Total (Overall) | 652 (53.3%) | 571 (46.7%) |
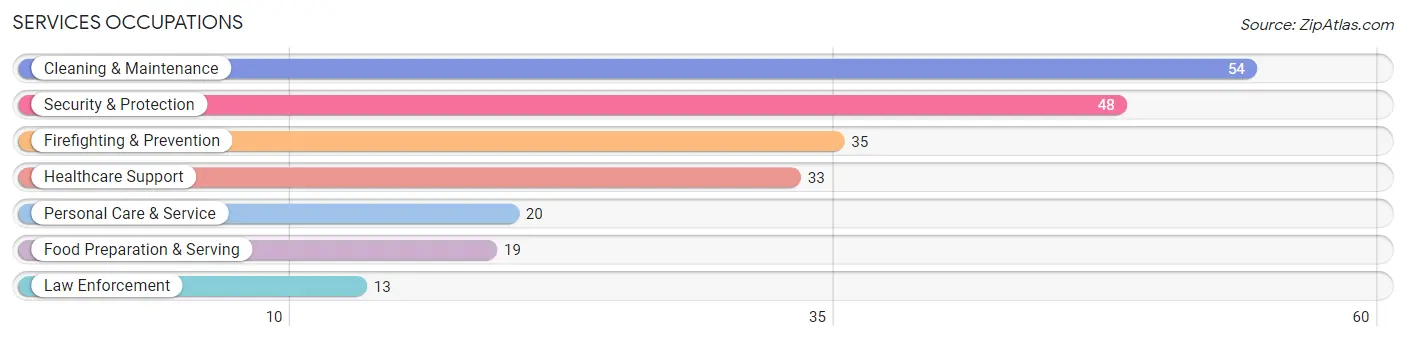
Services Occupations
The most common Services occupations in Jones are Cleaning & Maintenance (54 | 4.4%), Security & Protection (48 | 3.9%), Firefighting & Prevention (35 | 2.9%), Healthcare Support (33 | 2.7%), and Personal Care & Service (20 | 1.6%).
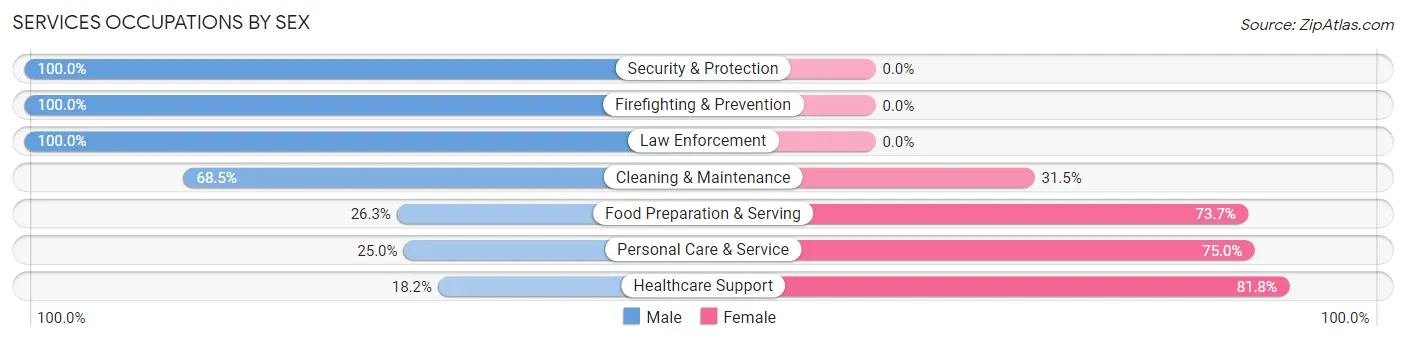
Services Occupations by Sex
Within the Services occupations in Jones, the most male-oriented occupations are Security & Protection (100.0%), Firefighting & Prevention (100.0%), and Law Enforcement (100.0%), while the most female-oriented occupations are Healthcare Support (81.8%), Personal Care & Service (75.0%), and Food Preparation & Serving (73.7%).
| Occupation | Male | Female |
| Healthcare Support | 6 (18.2%) | 27 (81.8%) |
| Security & Protection | 48 (100.0%) | 0 (0.0%) |
| Firefighting & Prevention | 35 (100.0%) | 0 (0.0%) |
| Law Enforcement | 13 (100.0%) | 0 (0.0%) |
| Food Preparation & Serving | 5 (26.3%) | 14 (73.7%) |
| Cleaning & Maintenance | 37 (68.5%) | 17 (31.5%) |
| Personal Care & Service | 5 (25.0%) | 15 (75.0%) |
| Total (Category) | 101 (58.1%) | 73 (41.9%) |
| Total (Overall) | 652 (53.3%) | 571 (46.7%) |
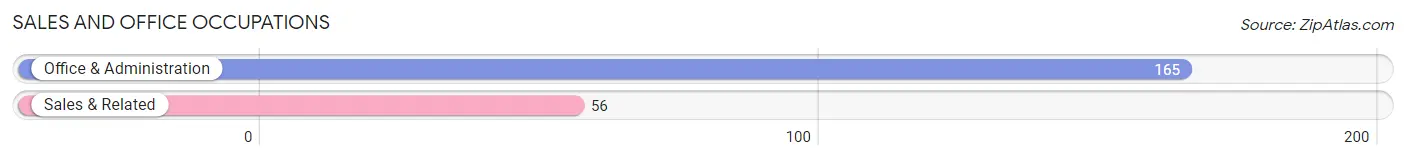
Sales and Office Occupations
The most common Sales and Office occupations in Jones are Office & Administration (165 | 13.5%), and Sales & Related (56 | 4.6%).
Sales and Office Occupations by Sex
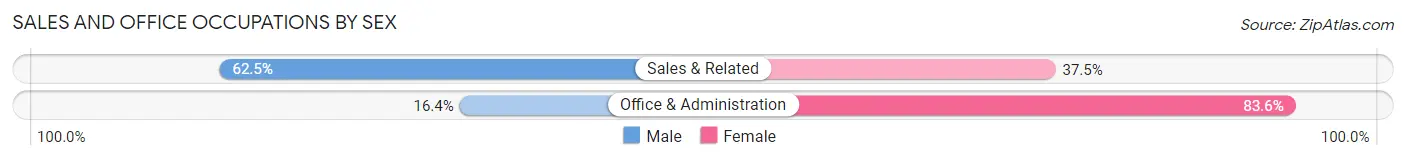
| Occupation | Male | Female |
| Sales & Related | 35 (62.5%) | 21 (37.5%) |
| Office & Administration | 27 (16.4%) | 138 (83.6%) |
| Total (Category) | 62 (28.1%) | 159 (72.0%) |
| Total (Overall) | 652 (53.3%) | 571 (46.7%) |
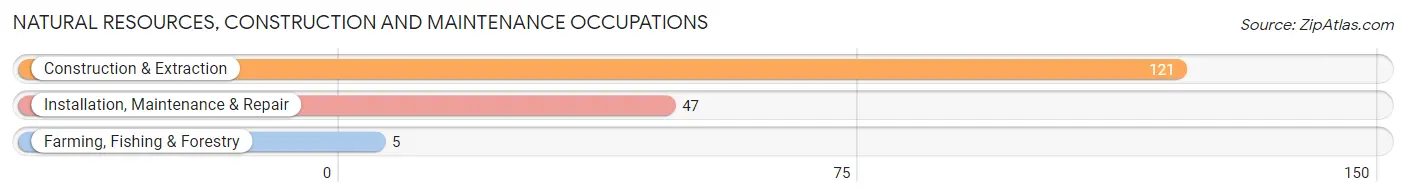
Natural Resources, Construction and Maintenance Occupations
The most common Natural Resources, Construction and Maintenance occupations in Jones are Construction & Extraction (121 | 9.9%), Installation, Maintenance & Repair (47 | 3.8%), and Farming, Fishing & Forestry (5 | 0.4%).
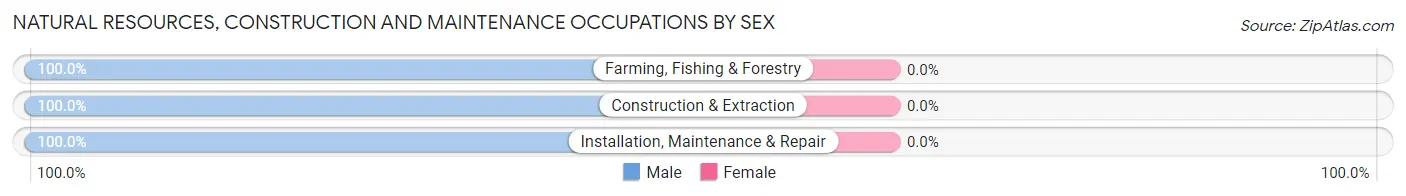
Natural Resources, Construction and Maintenance Occupations by Sex
| Occupation | Male | Female |
| Farming, Fishing & Forestry | 5 (100.0%) | 0 (0.0%) |
| Construction & Extraction | 121 (100.0%) | 0 (0.0%) |
| Installation, Maintenance & Repair | 47 (100.0%) | 0 (0.0%) |
| Total (Category) | 173 (100.0%) | 0 (0.0%) |
| Total (Overall) | 652 (53.3%) | 571 (46.7%) |
Production, Transportation and Moving Occupations
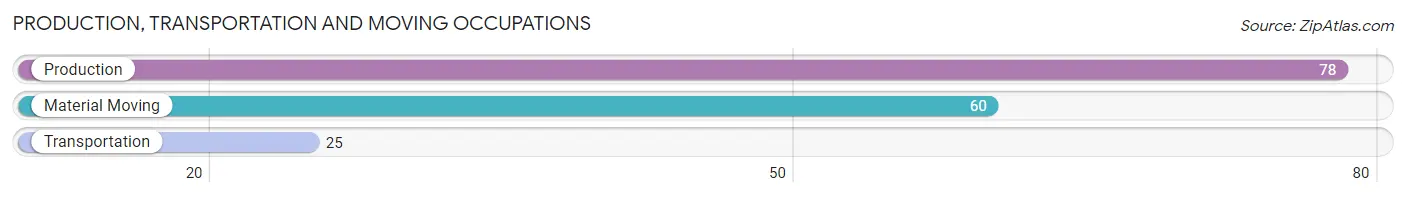
The most common Production, Transportation and Moving occupations in Jones are Production (78 | 6.4%), Material Moving (60 | 4.9%), and Transportation (25 | 2.0%).
Production, Transportation and Moving Occupations by Sex
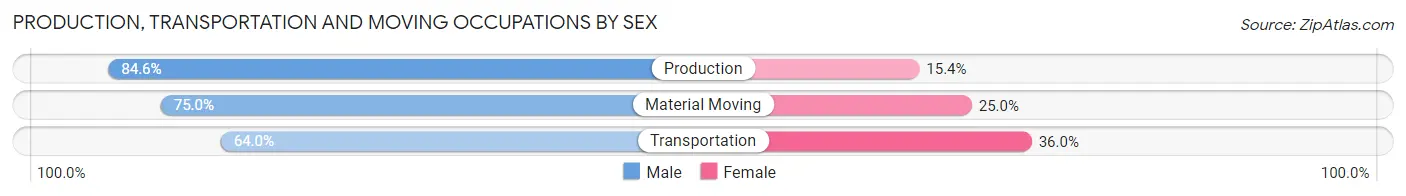
| Occupation | Male | Female |
| Production | 66 (84.6%) | 12 (15.4%) |
| Transportation | 16 (64.0%) | 9 (36.0%) |
| Material Moving | 45 (75.0%) | 15 (25.0%) |
| Total (Category) | 127 (77.9%) | 36 (22.1%) |
| Total (Overall) | 652 (53.3%) | 571 (46.7%) |
Employment Industries by Sex in Jones
Employment Industries in Jones
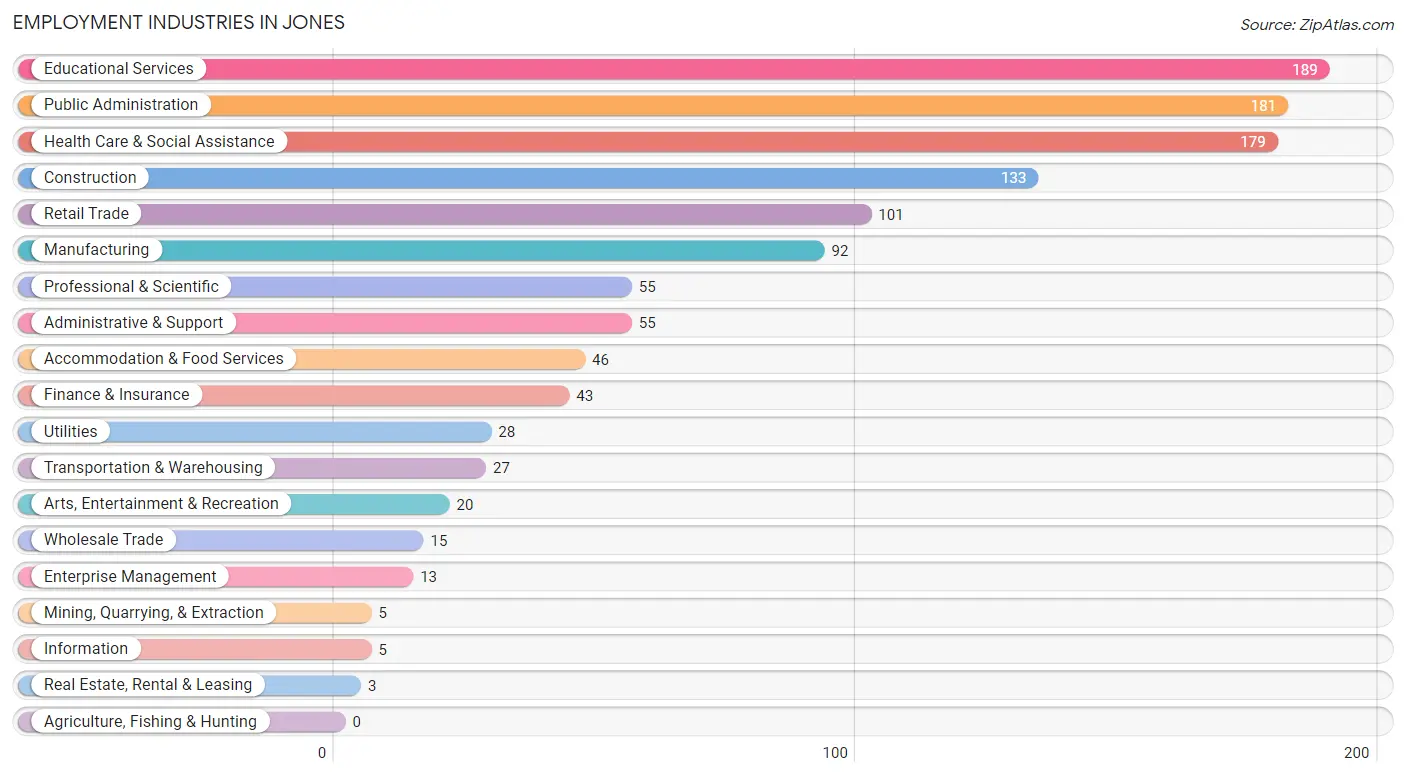
The major employment industries in Jones include Educational Services (189 | 15.4%), Public Administration (181 | 14.8%), Health Care & Social Assistance (179 | 14.6%), Construction (133 | 10.9%), and Retail Trade (101 | 8.3%).
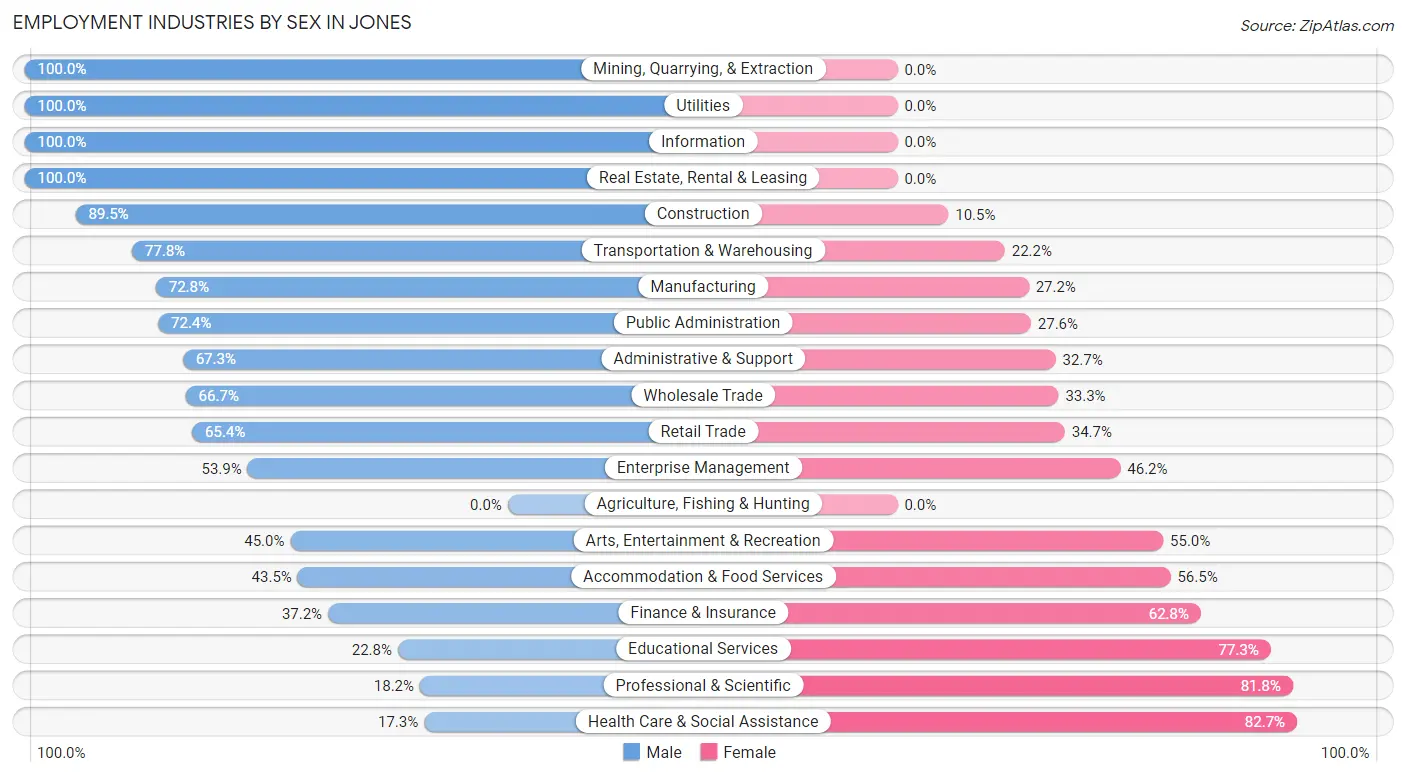
Employment Industries by Sex in Jones
The Jones industries that see more men than women are Mining, Quarrying, & Extraction (100.0%), Utilities (100.0%), and Information (100.0%), whereas the industries that tend to have a higher number of women are Health Care & Social Assistance (82.7%), Professional & Scientific (81.8%), and Educational Services (77.2%).
| Industry | Male | Female |
| Agriculture, Fishing & Hunting | 0 (0.0%) | 0 (0.0%) |
| Mining, Quarrying, & Extraction | 5 (100.0%) | 0 (0.0%) |
| Construction | 119 (89.5%) | 14 (10.5%) |
| Manufacturing | 67 (72.8%) | 25 (27.2%) |
| Wholesale Trade | 10 (66.7%) | 5 (33.3%) |
| Retail Trade | 66 (65.3%) | 35 (34.6%) |
| Transportation & Warehousing | 21 (77.8%) | 6 (22.2%) |
| Utilities | 28 (100.0%) | 0 (0.0%) |
| Information | 5 (100.0%) | 0 (0.0%) |
| Finance & Insurance | 16 (37.2%) | 27 (62.8%) |
| Real Estate, Rental & Leasing | 3 (100.0%) | 0 (0.0%) |
| Professional & Scientific | 10 (18.2%) | 45 (81.8%) |
| Enterprise Management | 7 (53.8%) | 6 (46.2%) |
| Administrative & Support | 37 (67.3%) | 18 (32.7%) |
| Educational Services | 43 (22.8%) | 146 (77.2%) |
| Health Care & Social Assistance | 31 (17.3%) | 148 (82.7%) |
| Arts, Entertainment & Recreation | 9 (45.0%) | 11 (55.0%) |
| Accommodation & Food Services | 20 (43.5%) | 26 (56.5%) |
| Public Administration | 131 (72.4%) | 50 (27.6%) |
| Total | 652 (53.3%) | 571 (46.7%) |
Education in Jones
School Enrollment in Jones
The most common levels of schooling among the 844 students in Jones are high school (242 | 28.7%), elementary school (236 | 28.0%), and middle school (205 | 24.3%).
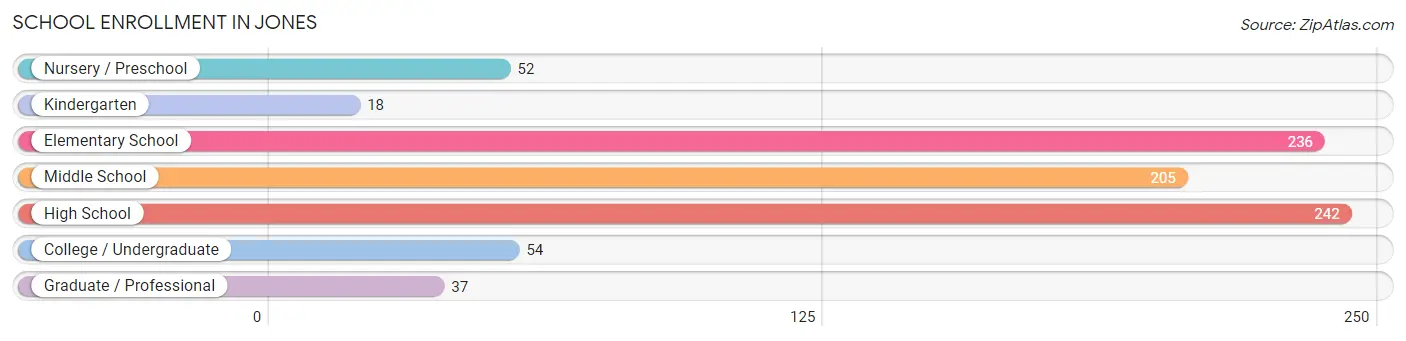
| School Level | # Students | % Students |
| Nursery / Preschool | 52 | 6.2% |
| Kindergarten | 18 | 2.1% |
| Elementary School | 236 | 28.0% |
| Middle School | 205 | 24.3% |
| High School | 242 | 28.7% |
| College / Undergraduate | 54 | 6.4% |
| Graduate / Professional | 37 | 4.4% |
| Total | 844 | 100.0% |
School Enrollment by Age by Funding Source in Jones
Out of a total of 844 students who are enrolled in schools in Jones, 75 (8.9%) attend a private institution, while the remaining 769 (91.1%) are enrolled in public schools. The age group of 20 to 24 year olds has the highest likelihood of being enrolled in private schools, with 9 (25.0% in the age bracket) enrolled. Conversely, the age group of 5 to 9 year old has the lowest likelihood of being enrolled in a private school, with 199 (100.0% in the age bracket) attending a public institution.
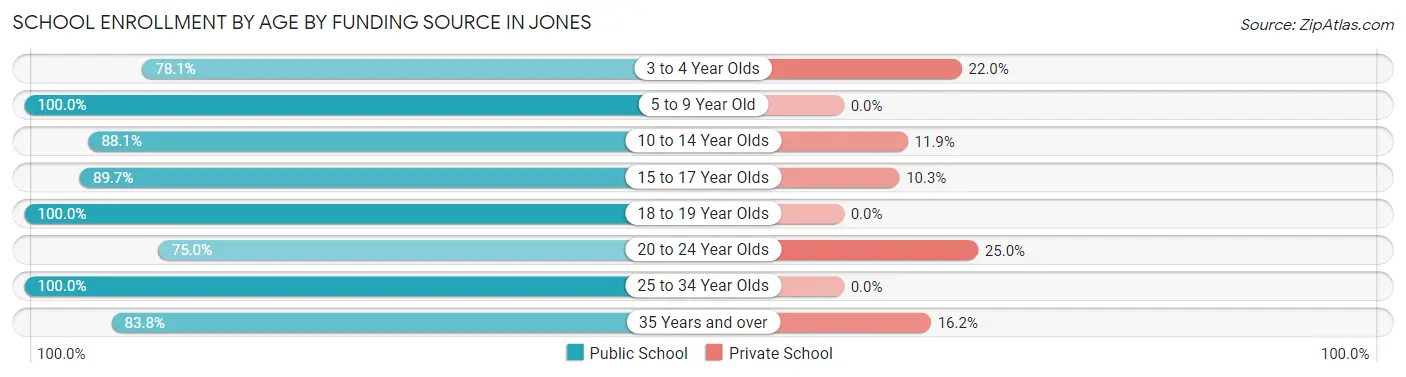
| Age Bracket | Public School | Private School |
| 3 to 4 Year Olds | 32 (78.0%) | 9 (22.0%) |
| 5 to 9 Year Old | 199 (100.0%) | 0 (0.0%) |
| 10 to 14 Year Olds | 244 (88.1%) | 33 (11.9%) |
| 15 to 17 Year Olds | 156 (89.7%) | 18 (10.3%) |
| 18 to 19 Year Olds | 62 (100.0%) | 0 (0.0%) |
| 20 to 24 Year Olds | 27 (75.0%) | 9 (25.0%) |
| 25 to 34 Year Olds | 18 (100.0%) | 0 (0.0%) |
| 35 Years and over | 31 (83.8%) | 6 (16.2%) |
| Total | 769 (91.1%) | 75 (8.9%) |
Educational Attainment by Field of Study in Jones
Education (151 | 30.4%), business (96 | 19.3%), science & technology (69 | 13.9%), liberal arts & history (46 | 9.3%), and bio, nature & agricultural (27 | 5.4%) are the most common fields of study among 497 individuals in Jones who have obtained a bachelor's degree or higher.
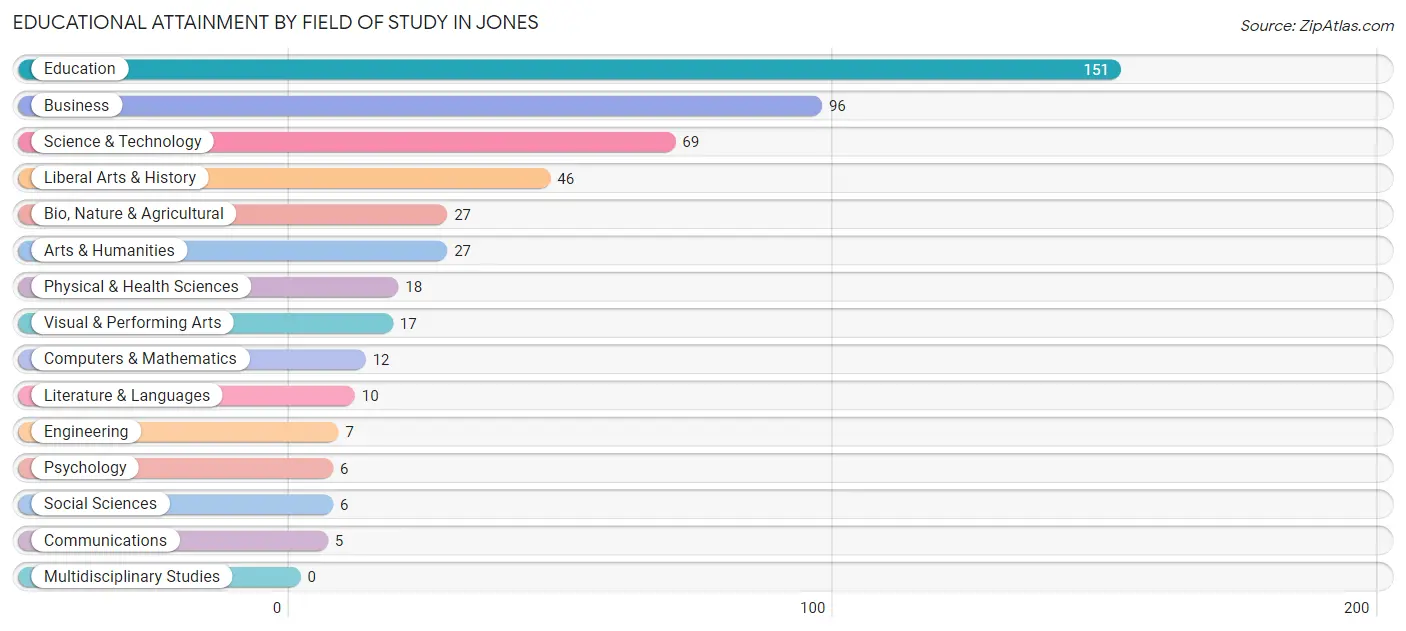
| Field of Study | # Graduates | % Graduates |
| Computers & Mathematics | 12 | 2.4% |
| Bio, Nature & Agricultural | 27 | 5.4% |
| Physical & Health Sciences | 18 | 3.6% |
| Psychology | 6 | 1.2% |
| Social Sciences | 6 | 1.2% |
| Engineering | 7 | 1.4% |
| Multidisciplinary Studies | 0 | 0.0% |
| Science & Technology | 69 | 13.9% |
| Business | 96 | 19.3% |
| Education | 151 | 30.4% |
| Literature & Languages | 10 | 2.0% |
| Liberal Arts & History | 46 | 9.3% |
| Visual & Performing Arts | 17 | 3.4% |
| Communications | 5 | 1.0% |
| Arts & Humanities | 27 | 5.4% |
| Total | 497 | 100.0% |
Transportation & Commute in Jones
Vehicle Availability by Sex in Jones
The most prevalent vehicle ownership categories in Jones are males with 2 vehicles (325, accounting for 49.8%) and females with 2 vehicles (258, making up 57.3%).
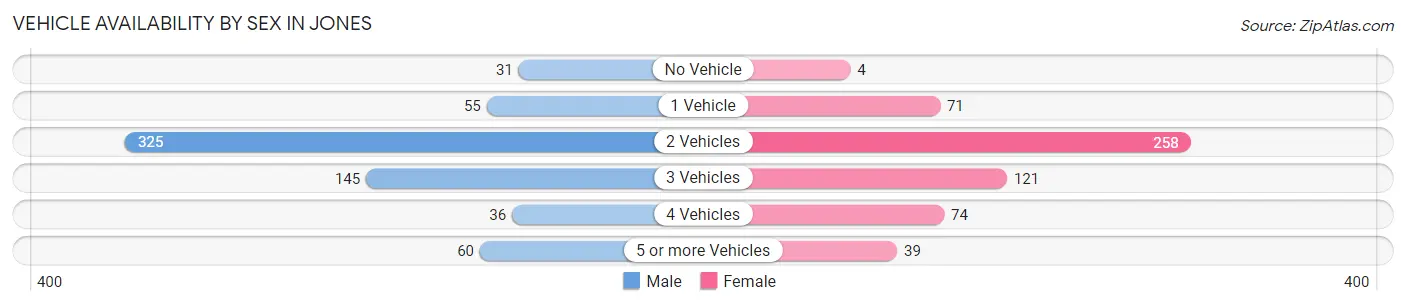
| Vehicles Available | Male | Female |
| No Vehicle | 31 (4.8%) | 4 (0.7%) |
| 1 Vehicle | 55 (8.4%) | 71 (12.5%) |
| 2 Vehicles | 325 (49.8%) | 258 (45.5%) |
| 3 Vehicles | 145 (22.2%) | 121 (21.3%) |
| 4 Vehicles | 36 (5.5%) | 74 (13.1%) |
| 5 or more Vehicles | 60 (9.2%) | 39 (6.9%) |
| Total | 652 (100.0%) | 567 (100.0%) |
Commute Time in Jones
The most frequently occuring commute durations in Jones are 30 to 34 minutes (304 commuters, 26.3%), 20 to 24 minutes (256 commuters, 22.2%), and 25 to 29 minutes (132 commuters, 11.4%).
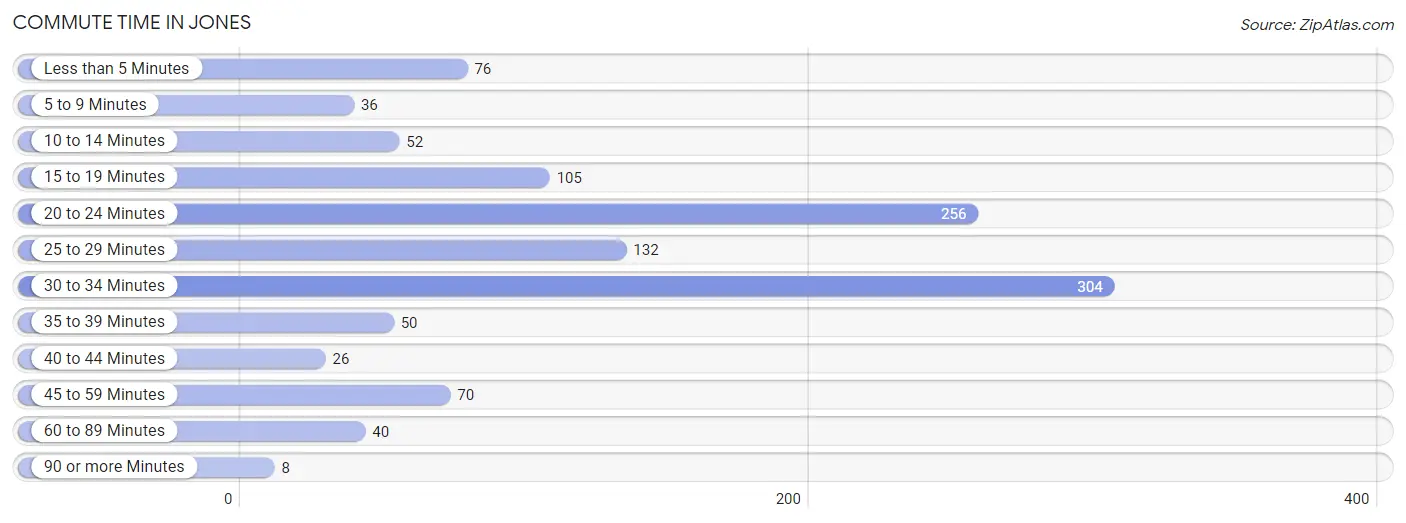
| Commute Time | # Commuters | % Commuters |
| Less than 5 Minutes | 76 | 6.6% |
| 5 to 9 Minutes | 36 | 3.1% |
| 10 to 14 Minutes | 52 | 4.5% |
| 15 to 19 Minutes | 105 | 9.1% |
| 20 to 24 Minutes | 256 | 22.2% |
| 25 to 29 Minutes | 132 | 11.4% |
| 30 to 34 Minutes | 304 | 26.3% |
| 35 to 39 Minutes | 50 | 4.3% |
| 40 to 44 Minutes | 26 | 2.2% |
| 45 to 59 Minutes | 70 | 6.1% |
| 60 to 89 Minutes | 40 | 3.5% |
| 90 or more Minutes | 8 | 0.7% |
Commute Time by Sex in Jones
The most common commute times in Jones are 20 to 24 minutes (162 commuters, 25.5%) for males and 30 to 34 minutes (159 commuters, 30.6%) for females.
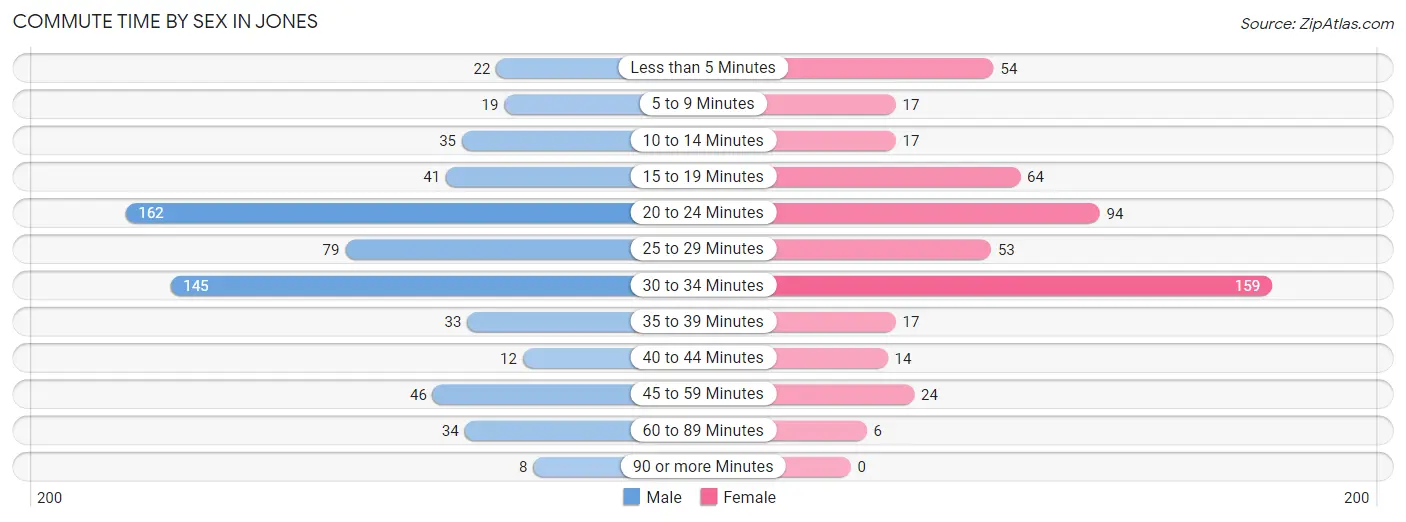
| Commute Time | Male | Female |
| Less than 5 Minutes | 22 (3.5%) | 54 (10.4%) |
| 5 to 9 Minutes | 19 (3.0%) | 17 (3.3%) |
| 10 to 14 Minutes | 35 (5.5%) | 17 (3.3%) |
| 15 to 19 Minutes | 41 (6.5%) | 64 (12.3%) |
| 20 to 24 Minutes | 162 (25.5%) | 94 (18.1%) |
| 25 to 29 Minutes | 79 (12.4%) | 53 (10.2%) |
| 30 to 34 Minutes | 145 (22.8%) | 159 (30.6%) |
| 35 to 39 Minutes | 33 (5.2%) | 17 (3.3%) |
| 40 to 44 Minutes | 12 (1.9%) | 14 (2.7%) |
| 45 to 59 Minutes | 46 (7.2%) | 24 (4.6%) |
| 60 to 89 Minutes | 34 (5.3%) | 6 (1.2%) |
| 90 or more Minutes | 8 (1.3%) | 0 (0.0%) |
Time of Departure to Work by Sex in Jones
The most frequent times of departure to work in Jones are 7:30 AM to 7:59 AM (117, 18.4%) for males and 7:30 AM to 7:59 AM (182, 35.1%) for females.
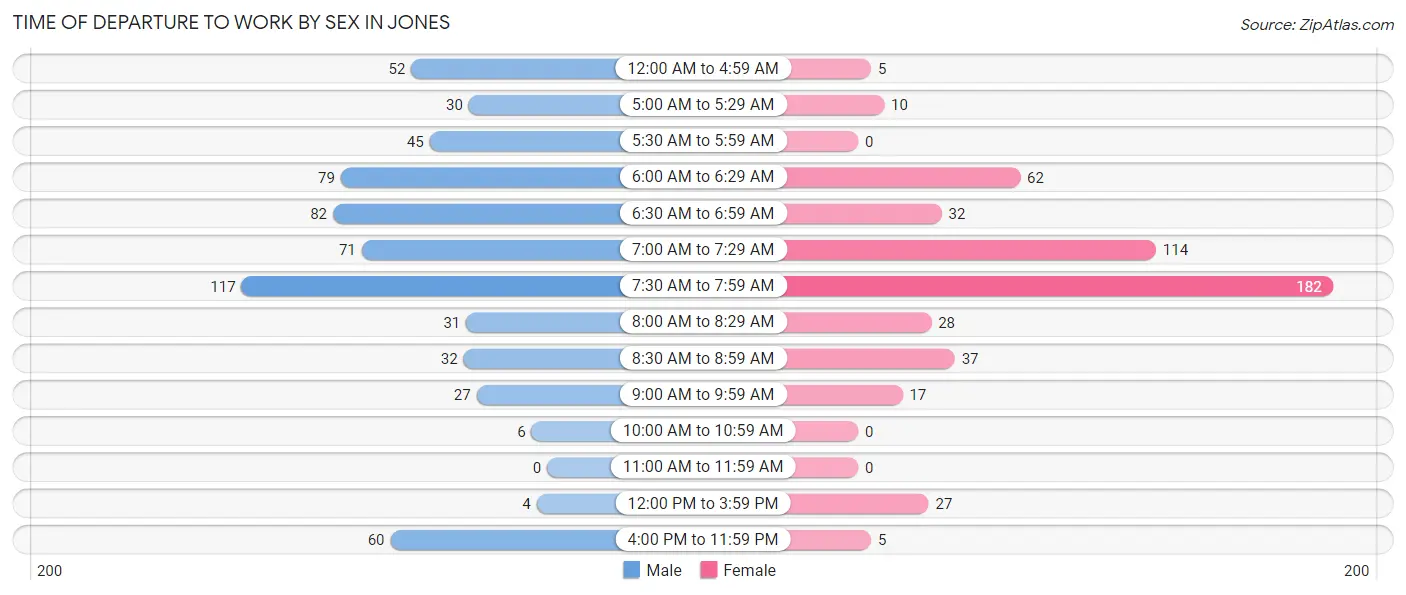
| Time of Departure | Male | Female |
| 12:00 AM to 4:59 AM | 52 (8.2%) | 5 (1.0%) |
| 5:00 AM to 5:29 AM | 30 (4.7%) | 10 (1.9%) |
| 5:30 AM to 5:59 AM | 45 (7.1%) | 0 (0.0%) |
| 6:00 AM to 6:29 AM | 79 (12.4%) | 62 (11.9%) |
| 6:30 AM to 6:59 AM | 82 (12.9%) | 32 (6.2%) |
| 7:00 AM to 7:29 AM | 71 (11.2%) | 114 (22.0%) |
| 7:30 AM to 7:59 AM | 117 (18.4%) | 182 (35.1%) |
| 8:00 AM to 8:29 AM | 31 (4.9%) | 28 (5.4%) |
| 8:30 AM to 8:59 AM | 32 (5.0%) | 37 (7.1%) |
| 9:00 AM to 9:59 AM | 27 (4.3%) | 17 (3.3%) |
| 10:00 AM to 10:59 AM | 6 (0.9%) | 0 (0.0%) |
| 11:00 AM to 11:59 AM | 0 (0.0%) | 0 (0.0%) |
| 12:00 PM to 3:59 PM | 4 (0.6%) | 27 (5.2%) |
| 4:00 PM to 11:59 PM | 60 (9.4%) | 5 (1.0%) |
| Total | 636 (100.0%) | 519 (100.0%) |
Housing Occupancy in Jones
Occupancy by Ownership in Jones
Of the total 1,012 dwellings in Jones, owner-occupied units account for 726 (71.7%), while renter-occupied units make up 286 (28.3%).
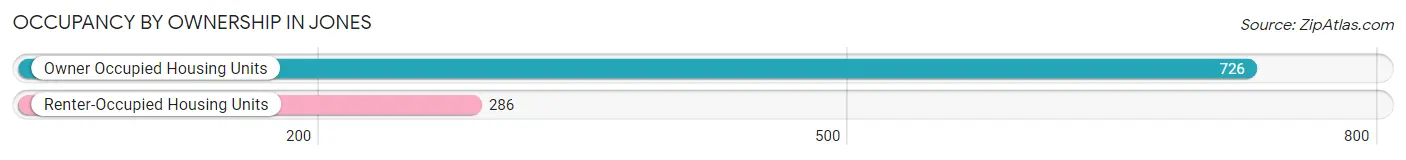
| Occupancy | # Housing Units | % Housing Units |
| Owner Occupied Housing Units | 726 | 71.7% |
| Renter-Occupied Housing Units | 286 | 28.3% |
| Total Occupied Housing Units | 1,012 | 100.0% |
Occupancy by Household Size in Jones
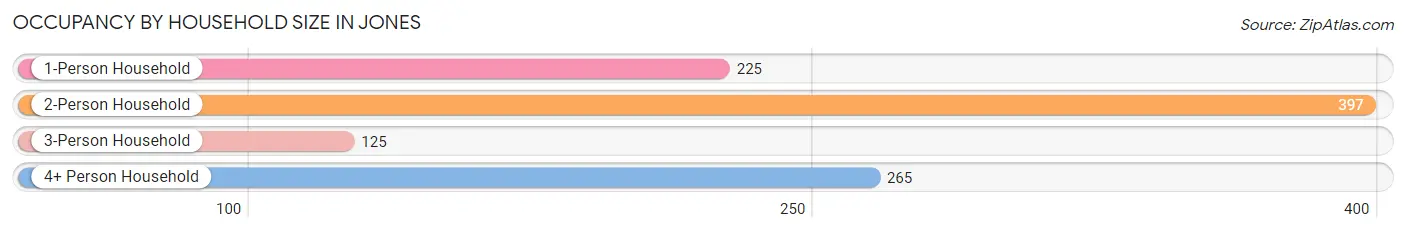
| Household Size | # Housing Units | % Housing Units |
| 1-Person Household | 225 | 22.2% |
| 2-Person Household | 397 | 39.2% |
| 3-Person Household | 125 | 12.3% |
| 4+ Person Household | 265 | 26.2% |
| Total Housing Units | 1,012 | 100.0% |
Occupancy by Ownership by Household Size in Jones
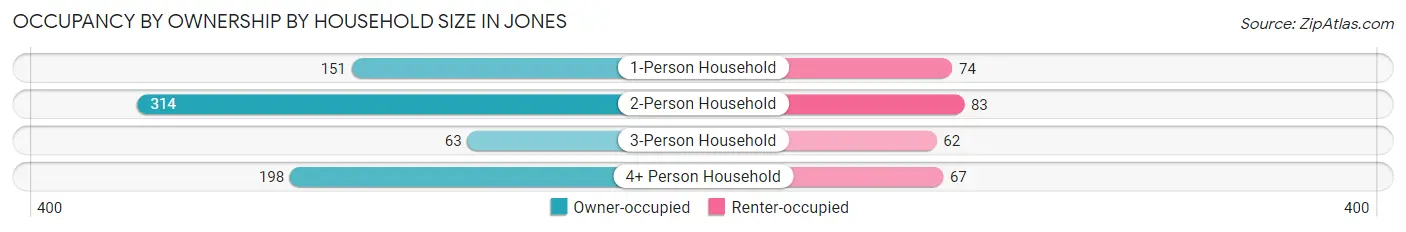
| Household Size | Owner-occupied | Renter-occupied |
| 1-Person Household | 151 (67.1%) | 74 (32.9%) |
| 2-Person Household | 314 (79.1%) | 83 (20.9%) |
| 3-Person Household | 63 (50.4%) | 62 (49.6%) |
| 4+ Person Household | 198 (74.7%) | 67 (25.3%) |
| Total Housing Units | 726 (71.7%) | 286 (28.3%) |
Occupancy by Educational Attainment in Jones
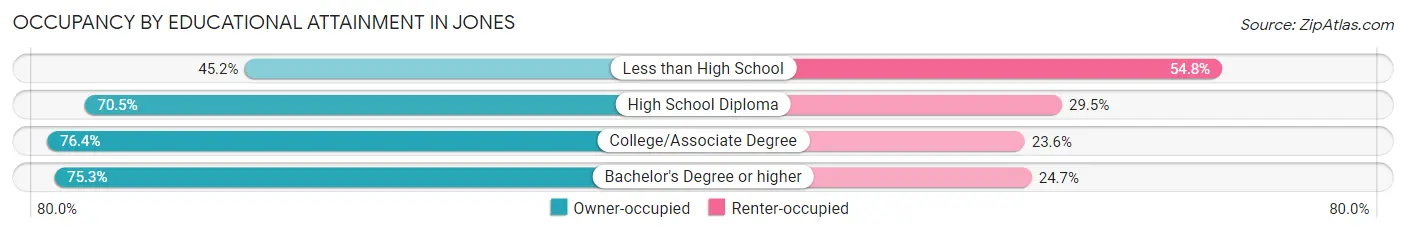
| Household Size | Owner-occupied | Renter-occupied |
| Less than High School | 42 (45.2%) | 51 (54.8%) |
| High School Diploma | 177 (70.5%) | 74 (29.5%) |
| College/Associate Degree | 269 (76.4%) | 83 (23.6%) |
| Bachelor's Degree or higher | 238 (75.3%) | 78 (24.7%) |
Occupancy by Age of Householder in Jones
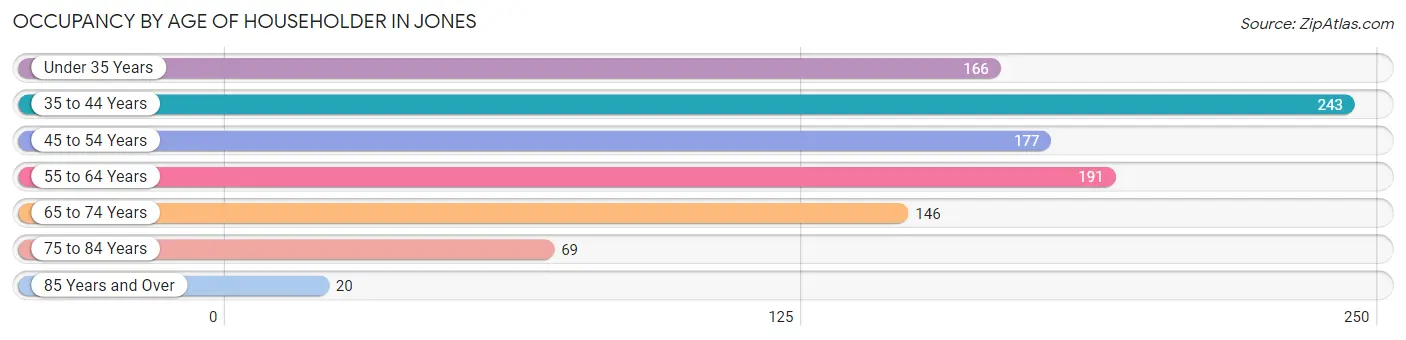
| Age Bracket | # Households | % Households |
| Under 35 Years | 166 | 16.4% |
| 35 to 44 Years | 243 | 24.0% |
| 45 to 54 Years | 177 | 17.5% |
| 55 to 64 Years | 191 | 18.9% |
| 65 to 74 Years | 146 | 14.4% |
| 75 to 84 Years | 69 | 6.8% |
| 85 Years and Over | 20 | 2.0% |
| Total | 1,012 | 100.0% |
Housing Finances in Jones
Median Income by Occupancy in Jones
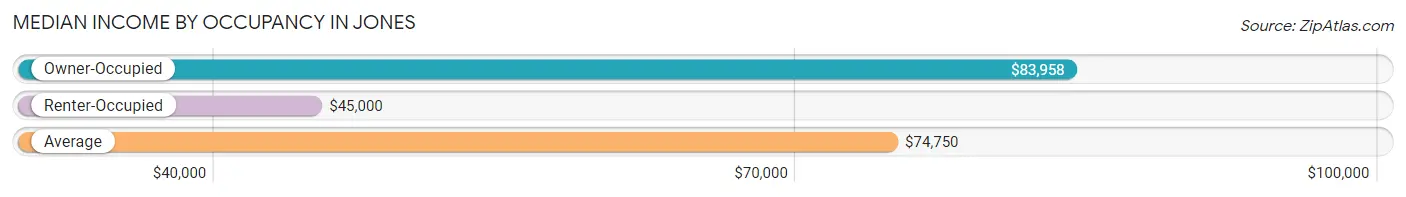
| Occupancy Type | # Households | Median Income |
| Owner-Occupied | 726 (71.7%) | $83,958 |
| Renter-Occupied | 286 (28.3%) | $45,000 |
| Average | 1,012 (100.0%) | $74,750 |
Occupancy by Householder Income Bracket in Jones
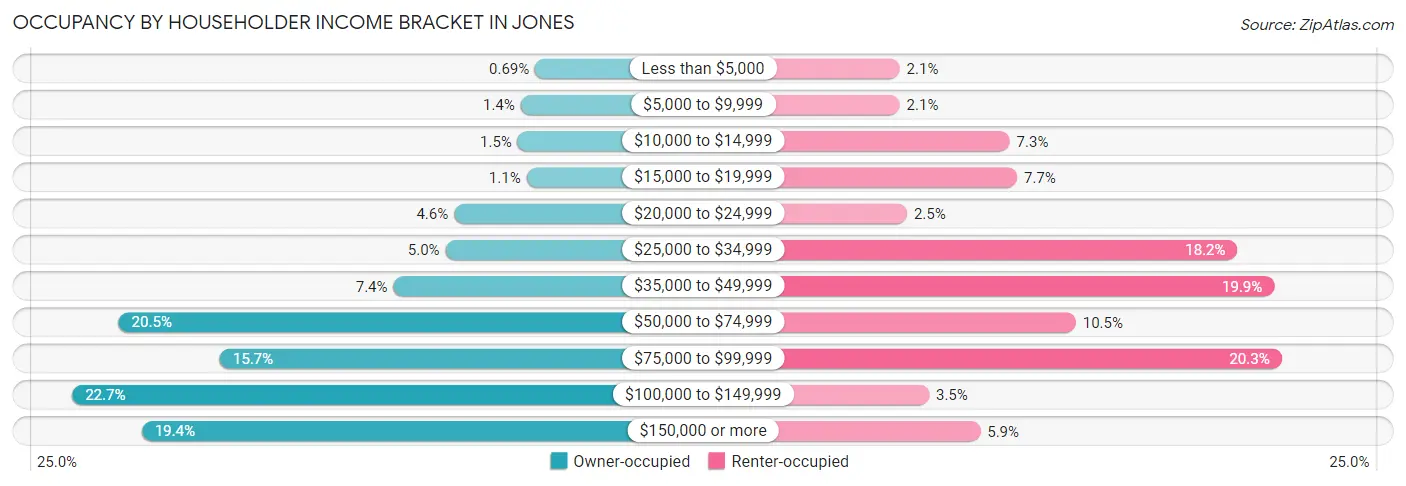
| Income Bracket | Owner-occupied | Renter-occupied |
| Less than $5,000 | 5 (0.7%) | 6 (2.1%) |
| $5,000 to $9,999 | 10 (1.4%) | 6 (2.1%) |
| $10,000 to $14,999 | 11 (1.5%) | 21 (7.3%) |
| $15,000 to $19,999 | 8 (1.1%) | 22 (7.7%) |
| $20,000 to $24,999 | 33 (4.5%) | 7 (2.5%) |
| $25,000 to $34,999 | 36 (5.0%) | 52 (18.2%) |
| $35,000 to $49,999 | 54 (7.4%) | 57 (19.9%) |
| $50,000 to $74,999 | 149 (20.5%) | 30 (10.5%) |
| $75,000 to $99,999 | 114 (15.7%) | 58 (20.3%) |
| $100,000 to $149,999 | 165 (22.7%) | 10 (3.5%) |
| $150,000 or more | 141 (19.4%) | 17 (5.9%) |
| Total | 726 (100.0%) | 286 (100.0%) |
Monthly Housing Cost Tiers in Jones
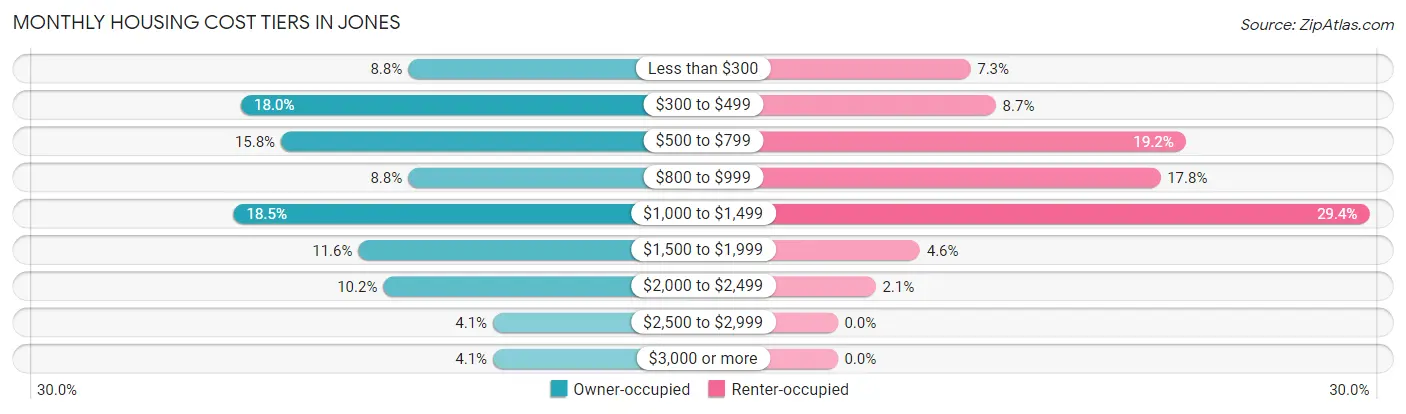
| Monthly Cost | Owner-occupied | Renter-occupied |
| Less than $300 | 64 (8.8%) | 21 (7.3%) |
| $300 to $499 | 131 (18.0%) | 25 (8.7%) |
| $500 to $799 | 115 (15.8%) | 55 (19.2%) |
| $800 to $999 | 64 (8.8%) | 51 (17.8%) |
| $1,000 to $1,499 | 134 (18.5%) | 84 (29.4%) |
| $1,500 to $1,999 | 84 (11.6%) | 13 (4.5%) |
| $2,000 to $2,499 | 74 (10.2%) | 6 (2.1%) |
| $2,500 to $2,999 | 30 (4.1%) | 0 (0.0%) |
| $3,000 or more | 30 (4.1%) | 0 (0.0%) |
| Total | 726 (100.0%) | 286 (100.0%) |
Physical Housing Characteristics in Jones
Housing Structures in Jones
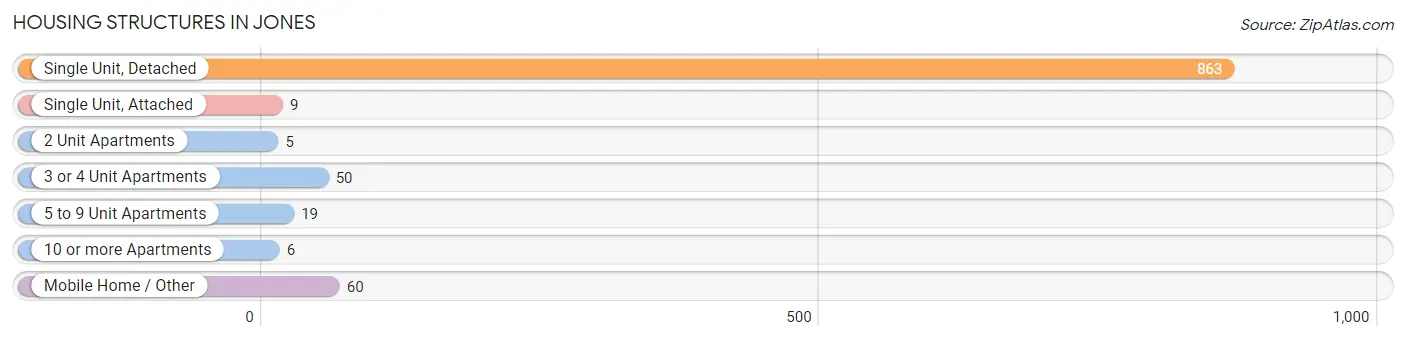
| Structure Type | # Housing Units | % Housing Units |
| Single Unit, Detached | 863 | 85.3% |
| Single Unit, Attached | 9 | 0.9% |
| 2 Unit Apartments | 5 | 0.5% |
| 3 or 4 Unit Apartments | 50 | 4.9% |
| 5 to 9 Unit Apartments | 19 | 1.9% |
| 10 or more Apartments | 6 | 0.6% |
| Mobile Home / Other | 60 | 5.9% |
| Total | 1,012 | 100.0% |
Housing Structures by Occupancy in Jones
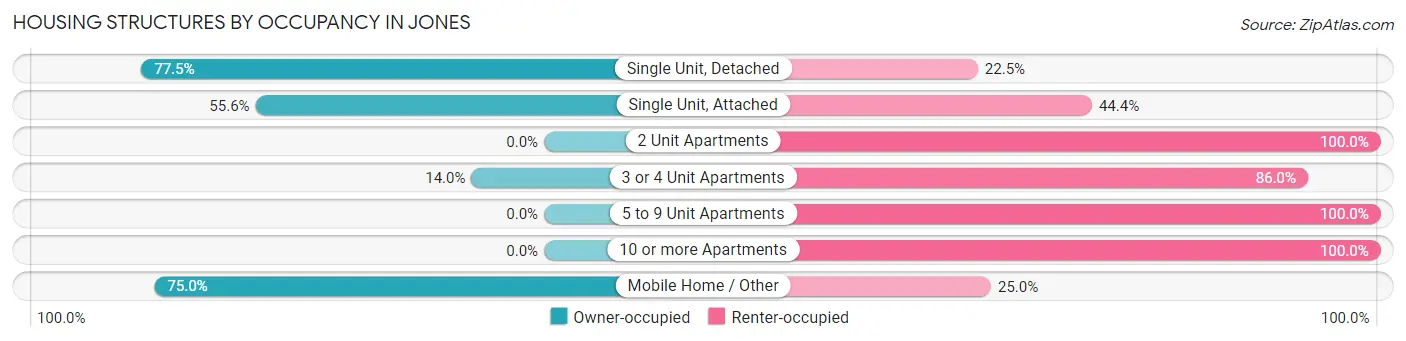
| Structure Type | Owner-occupied | Renter-occupied |
| Single Unit, Detached | 669 (77.5%) | 194 (22.5%) |
| Single Unit, Attached | 5 (55.6%) | 4 (44.4%) |
| 2 Unit Apartments | 0 (0.0%) | 5 (100.0%) |
| 3 or 4 Unit Apartments | 7 (14.0%) | 43 (86.0%) |
| 5 to 9 Unit Apartments | 0 (0.0%) | 19 (100.0%) |
| 10 or more Apartments | 0 (0.0%) | 6 (100.0%) |
| Mobile Home / Other | 45 (75.0%) | 15 (25.0%) |
| Total | 726 (71.7%) | 286 (28.3%) |
Housing Structures by Number of Rooms in Jones
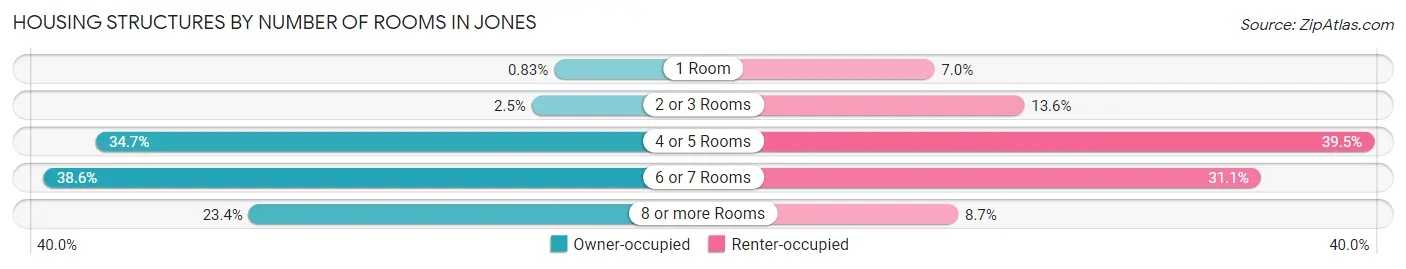
| Number of Rooms | Owner-occupied | Renter-occupied |
| 1 Room | 6 (0.8%) | 20 (7.0%) |
| 2 or 3 Rooms | 18 (2.5%) | 39 (13.6%) |
| 4 or 5 Rooms | 252 (34.7%) | 113 (39.5%) |
| 6 or 7 Rooms | 280 (38.6%) | 89 (31.1%) |
| 8 or more Rooms | 170 (23.4%) | 25 (8.7%) |
| Total | 726 (100.0%) | 286 (100.0%) |
Housing Structure by Heating Type in Jones
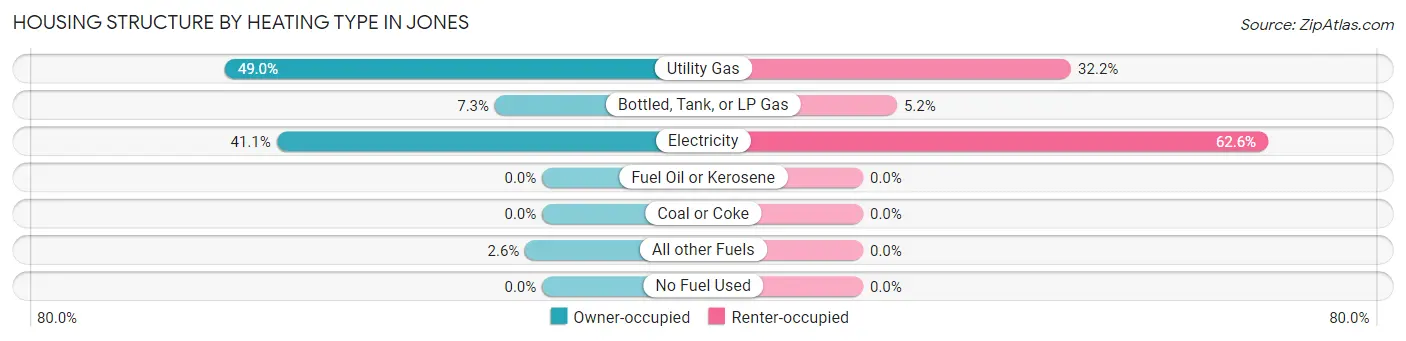
| Heating Type | Owner-occupied | Renter-occupied |
| Utility Gas | 356 (49.0%) | 92 (32.2%) |
| Bottled, Tank, or LP Gas | 53 (7.3%) | 15 (5.2%) |
| Electricity | 298 (41.0%) | 179 (62.6%) |
| Fuel Oil or Kerosene | 0 (0.0%) | 0 (0.0%) |
| Coal or Coke | 0 (0.0%) | 0 (0.0%) |
| All other Fuels | 19 (2.6%) | 0 (0.0%) |
| No Fuel Used | 0 (0.0%) | 0 (0.0%) |
| Total | 726 (100.0%) | 286 (100.0%) |
Household Vehicle Usage in Jones
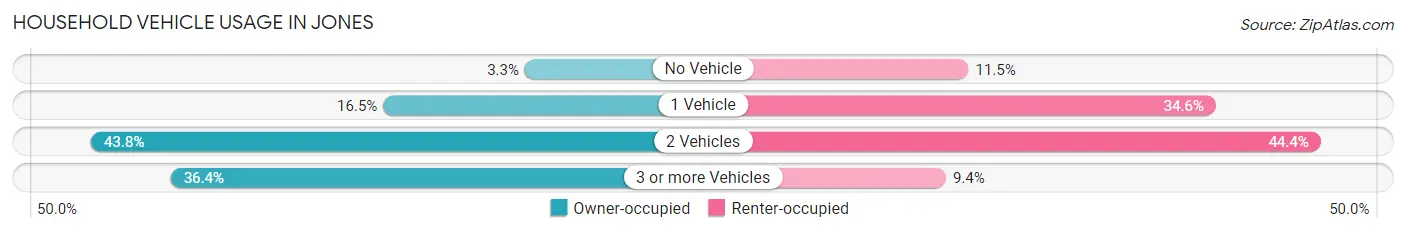
| Vehicles per Household | Owner-occupied | Renter-occupied |
| No Vehicle | 24 (3.3%) | 33 (11.5%) |
| 1 Vehicle | 120 (16.5%) | 99 (34.6%) |
| 2 Vehicles | 318 (43.8%) | 127 (44.4%) |
| 3 or more Vehicles | 264 (36.4%) | 27 (9.4%) |
| Total | 726 (100.0%) | 286 (100.0%) |
Real Estate & Mortgages in Jones
Real Estate and Mortgage Overview in Jones
| Characteristic | Without Mortgage | With Mortgage |
| Housing Units | 309 | 417 |
| Median Property Value | $154,900 | $202,300 |
| Median Household Income | $67,250 | $97 |
| Monthly Housing Costs | $452 | $30 |
| Real Estate Taxes | $1,477 | $21 |
Property Value by Mortgage Status in Jones
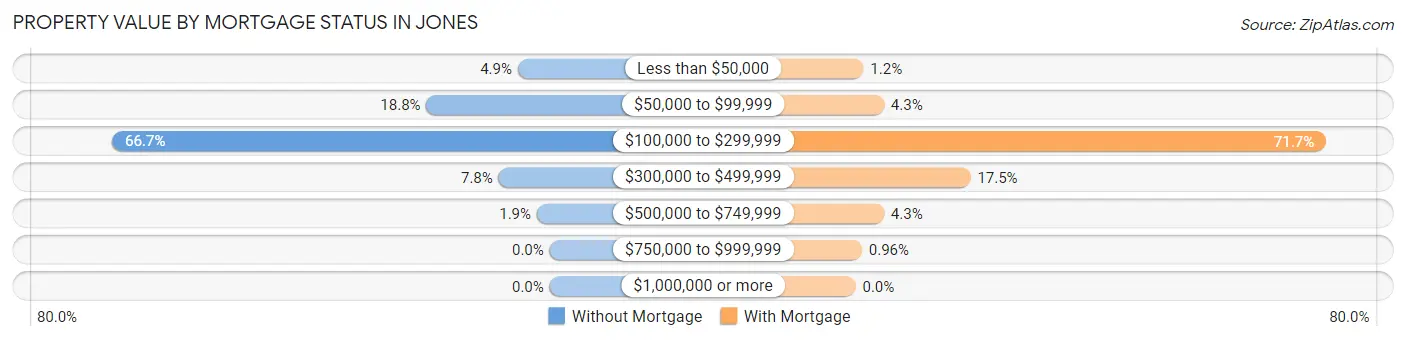
| Property Value | Without Mortgage | With Mortgage |
| Less than $50,000 | 15 (4.9%) | 5 (1.2%) |
| $50,000 to $99,999 | 58 (18.8%) | 18 (4.3%) |
| $100,000 to $299,999 | 206 (66.7%) | 299 (71.7%) |
| $300,000 to $499,999 | 24 (7.8%) | 73 (17.5%) |
| $500,000 to $749,999 | 6 (1.9%) | 18 (4.3%) |
| $750,000 to $999,999 | 0 (0.0%) | 4 (1.0%) |
| $1,000,000 or more | 0 (0.0%) | 0 (0.0%) |
| Total | 309 (100.0%) | 417 (100.0%) |
Household Income by Mortgage Status in Jones
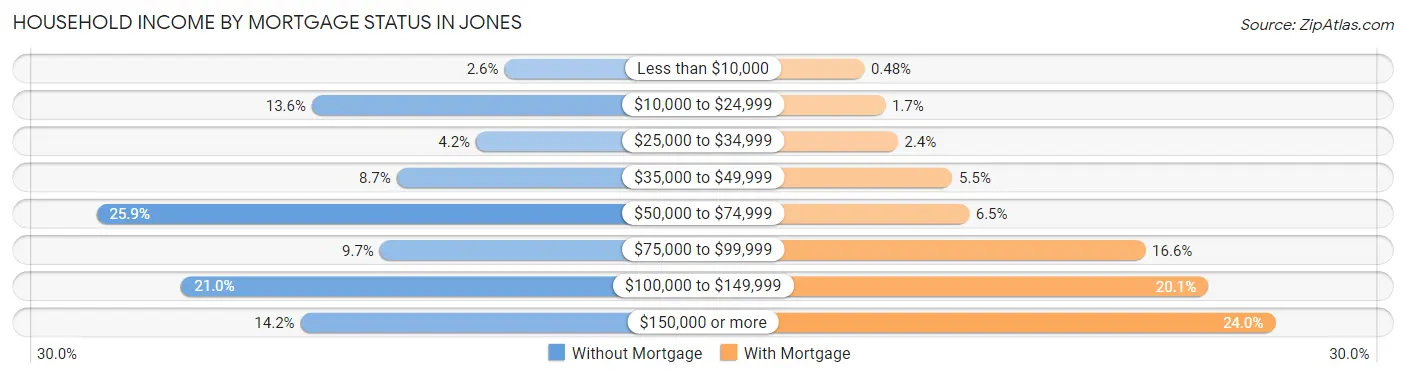
| Household Income | Without Mortgage | With Mortgage |
| Less than $10,000 | 8 (2.6%) | 2 (0.5%) |
| $10,000 to $24,999 | 42 (13.6%) | 7 (1.7%) |
| $25,000 to $34,999 | 13 (4.2%) | 10 (2.4%) |
| $35,000 to $49,999 | 27 (8.7%) | 23 (5.5%) |
| $50,000 to $74,999 | 80 (25.9%) | 27 (6.5%) |
| $75,000 to $99,999 | 30 (9.7%) | 69 (16.6%) |
| $100,000 to $149,999 | 65 (21.0%) | 84 (20.1%) |
| $150,000 or more | 44 (14.2%) | 100 (24.0%) |
| Total | 309 (100.0%) | 417 (100.0%) |
Property Value to Household Income Ratio in Jones
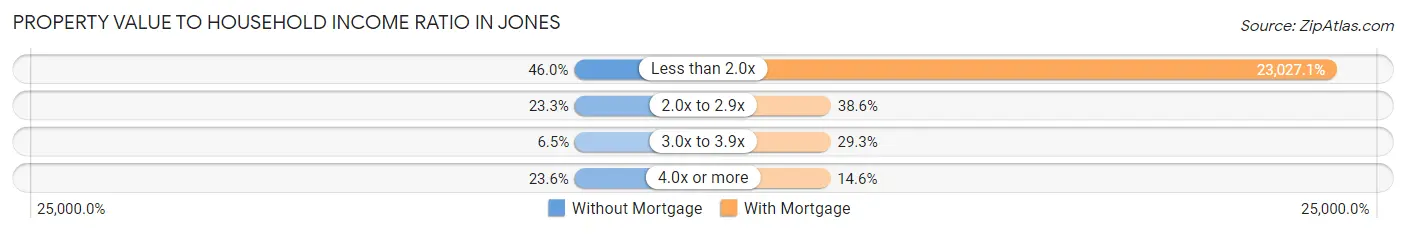
| Value-to-Income Ratio | Without Mortgage | With Mortgage |
| Less than 2.0x | 142 (46.0%) | 96,023 (23,027.1%) |
| 2.0x to 2.9x | 72 (23.3%) | 161 (38.6%) |
| 3.0x to 3.9x | 20 (6.5%) | 122 (29.3%) |
| 4.0x or more | 73 (23.6%) | 61 (14.6%) |
| Total | 309 (100.0%) | 417 (100.0%) |
Real Estate Taxes by Mortgage Status in Jones
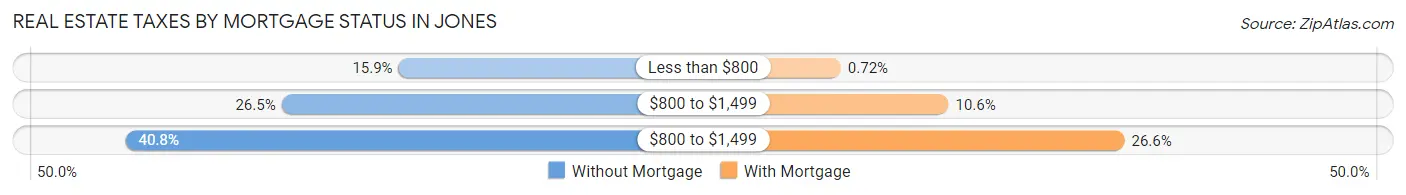
| Property Taxes | Without Mortgage | With Mortgage |
| Less than $800 | 49 (15.9%) | 3 (0.7%) |
| $800 to $1,499 | 82 (26.5%) | 44 (10.5%) |
| $800 to $1,499 | 126 (40.8%) | 111 (26.6%) |
| Total | 309 (100.0%) | 417 (100.0%) |
Health & Disability in Jones
Health Insurance Coverage by Age in Jones
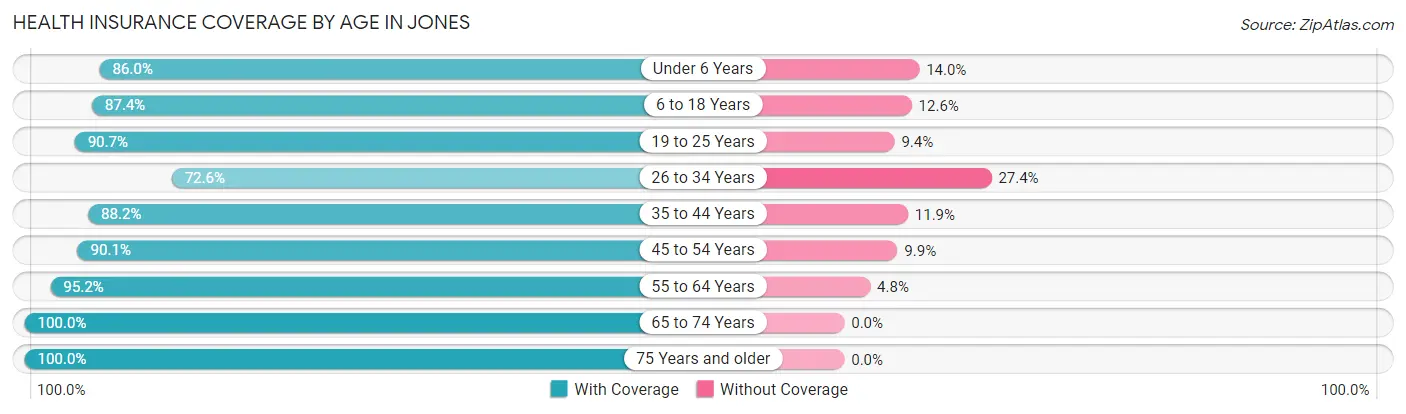
| Age Bracket | With Coverage | Without Coverage |
| Under 6 Years | 197 (86.0%) | 32 (14.0%) |
| 6 to 18 Years | 592 (87.4%) | 85 (12.6%) |
| 19 to 25 Years | 194 (90.6%) | 20 (9.3%) |
| 26 to 34 Years | 193 (72.6%) | 73 (27.4%) |
| 35 to 44 Years | 372 (88.1%) | 50 (11.8%) |
| 45 to 54 Years | 282 (90.1%) | 31 (9.9%) |
| 55 to 64 Years | 296 (95.2%) | 15 (4.8%) |
| 65 to 74 Years | 244 (100.0%) | 0 (0.0%) |
| 75 Years and older | 145 (100.0%) | 0 (0.0%) |
| Total | 2,515 (89.1%) | 306 (10.8%) |
Health Insurance Coverage by Citizenship Status in Jones
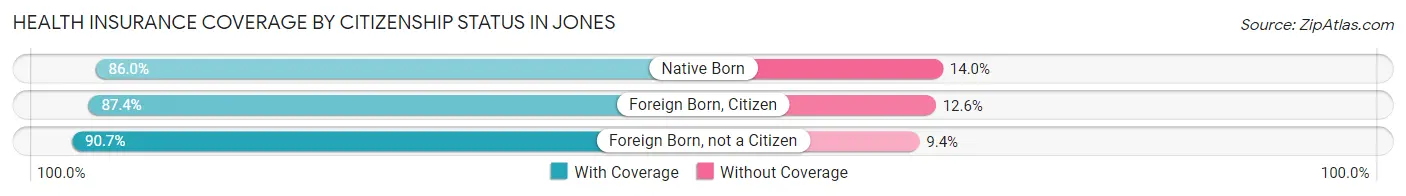
| Citizenship Status | With Coverage | Without Coverage |
| Native Born | 197 (86.0%) | 32 (14.0%) |
| Foreign Born, Citizen | 592 (87.4%) | 85 (12.6%) |
| Foreign Born, not a Citizen | 194 (90.6%) | 20 (9.3%) |
Health Insurance Coverage by Household Income in Jones
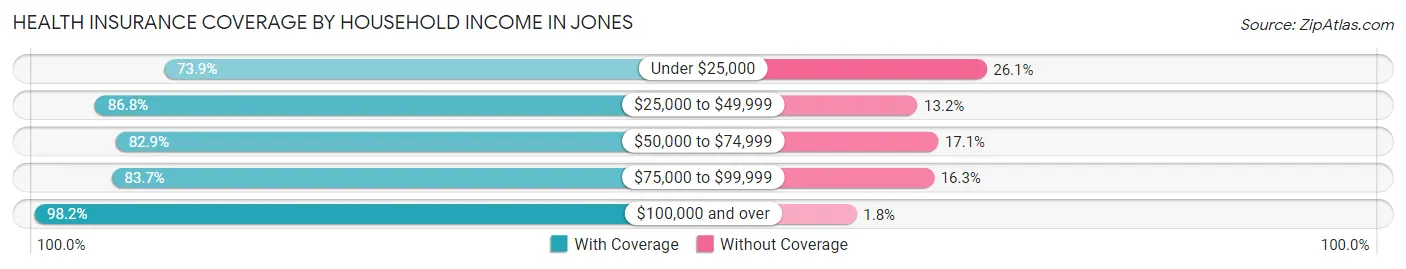
| Household Income | With Coverage | Without Coverage |
| Under $25,000 | 195 (73.9%) | 69 (26.1%) |
| $25,000 to $49,999 | 369 (86.8%) | 56 (13.2%) |
| $50,000 to $74,999 | 398 (82.9%) | 82 (17.1%) |
| $75,000 to $99,999 | 401 (83.7%) | 78 (16.3%) |
| $100,000 and over | 1,152 (98.2%) | 21 (1.8%) |
Public vs Private Health Insurance Coverage by Age in Jones
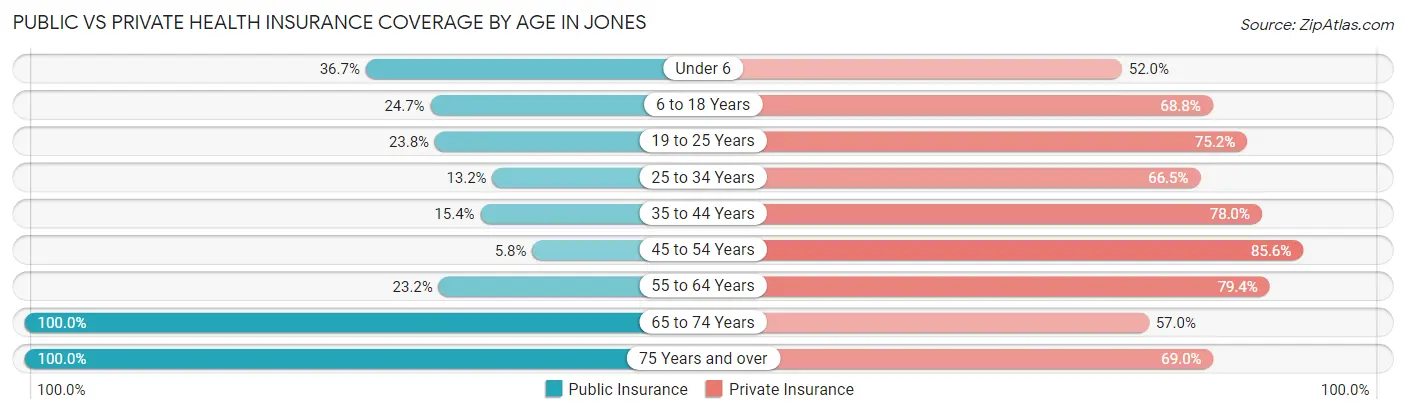
| Age Bracket | Public Insurance | Private Insurance |
| Under 6 | 84 (36.7%) | 119 (52.0%) |
| 6 to 18 Years | 167 (24.7%) | 466 (68.8%) |
| 19 to 25 Years | 51 (23.8%) | 161 (75.2%) |
| 25 to 34 Years | 35 (13.2%) | 177 (66.5%) |
| 35 to 44 Years | 65 (15.4%) | 329 (78.0%) |
| 45 to 54 Years | 18 (5.8%) | 268 (85.6%) |
| 55 to 64 Years | 72 (23.2%) | 247 (79.4%) |
| 65 to 74 Years | 244 (100.0%) | 139 (57.0%) |
| 75 Years and over | 145 (100.0%) | 100 (69.0%) |
| Total | 881 (31.2%) | 2,006 (71.1%) |
Disability Status by Sex by Age in Jones
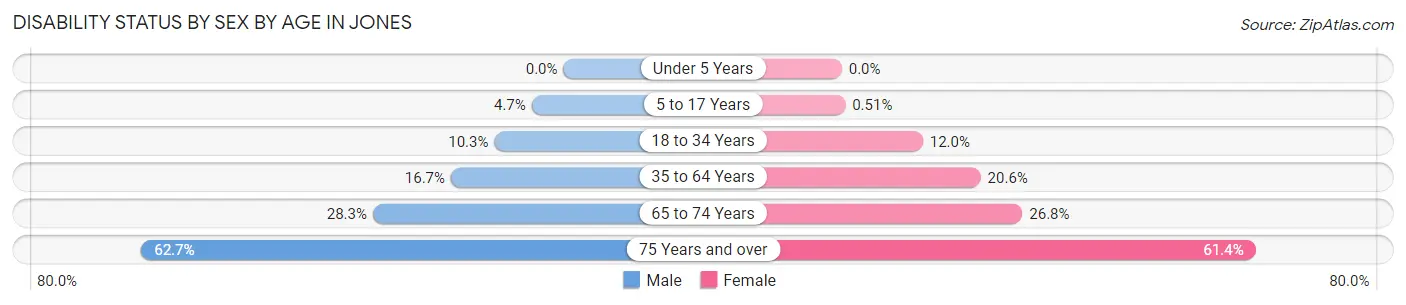
| Age Bracket | Male | Female |
| Under 5 Years | 0 (0.0%) | 0 (0.0%) |
| 5 to 17 Years | 13 (4.7%) | 2 (0.5%) |
| 18 to 34 Years | 29 (10.2%) | 29 (12.0%) |
| 35 to 64 Years | 88 (16.7%) | 107 (20.6%) |
| 65 to 74 Years | 30 (28.3%) | 37 (26.8%) |
| 75 Years and over | 47 (62.7%) | 43 (61.4%) |
Disability Class by Sex by Age in Jones
Disability Class: Hearing Difficulty
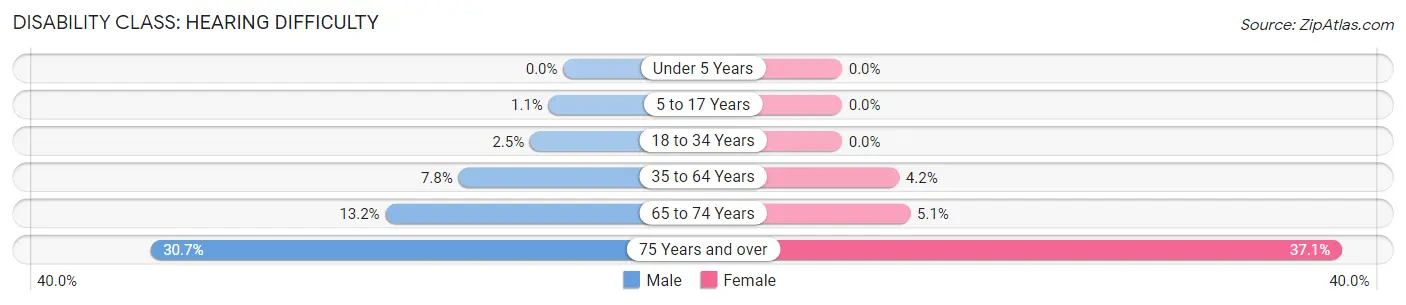
| Age Bracket | Male | Female |
| Under 5 Years | 0 (0.0%) | 0 (0.0%) |
| 5 to 17 Years | 3 (1.1%) | 0 (0.0%) |
| 18 to 34 Years | 7 (2.5%) | 0 (0.0%) |
| 35 to 64 Years | 41 (7.8%) | 22 (4.2%) |
| 65 to 74 Years | 14 (13.2%) | 7 (5.1%) |
| 75 Years and over | 23 (30.7%) | 26 (37.1%) |
Disability Class: Vision Difficulty
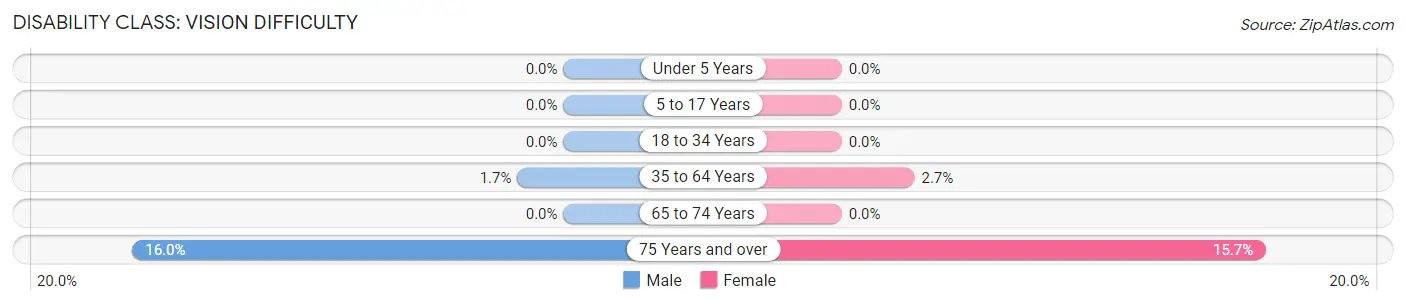
| Age Bracket | Male | Female |
| Under 5 Years | 0 (0.0%) | 0 (0.0%) |
| 5 to 17 Years | 0 (0.0%) | 0 (0.0%) |
| 18 to 34 Years | 0 (0.0%) | 0 (0.0%) |
| 35 to 64 Years | 9 (1.7%) | 14 (2.7%) |
| 65 to 74 Years | 0 (0.0%) | 0 (0.0%) |
| 75 Years and over | 12 (16.0%) | 11 (15.7%) |
Disability Class: Cognitive Difficulty
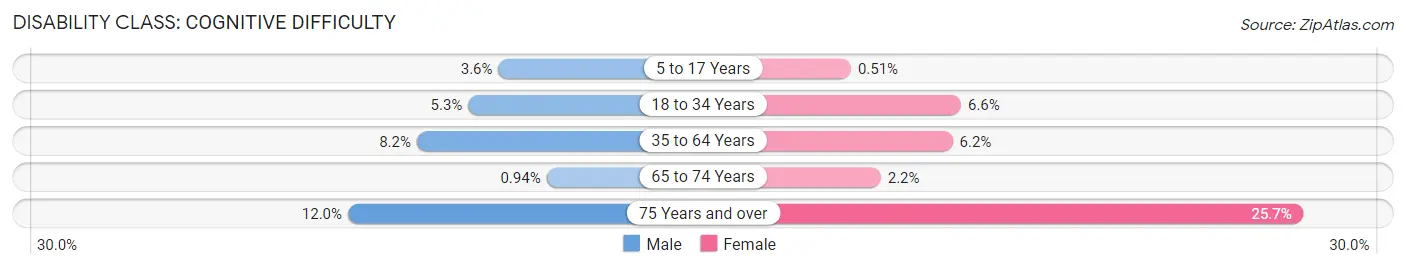
| Age Bracket | Male | Female |
| 5 to 17 Years | 10 (3.6%) | 2 (0.5%) |
| 18 to 34 Years | 15 (5.3%) | 16 (6.6%) |
| 35 to 64 Years | 43 (8.2%) | 32 (6.2%) |
| 65 to 74 Years | 1 (0.9%) | 3 (2.2%) |
| 75 Years and over | 9 (12.0%) | 18 (25.7%) |
Disability Class: Ambulatory Difficulty
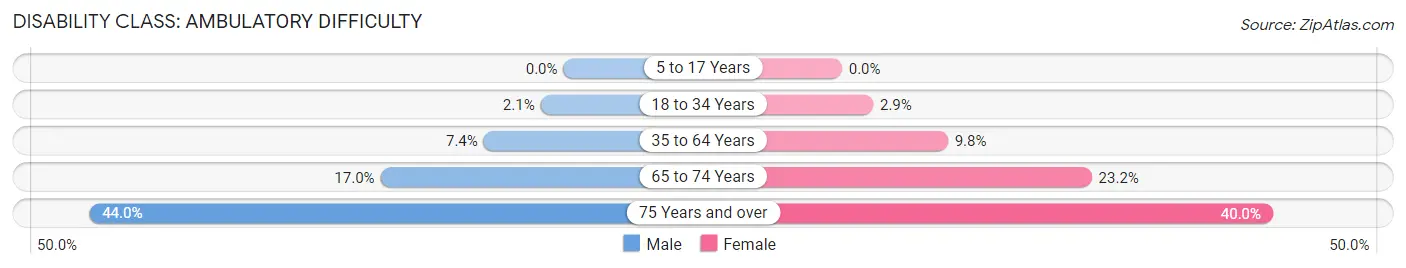
| Age Bracket | Male | Female |
| 5 to 17 Years | 0 (0.0%) | 0 (0.0%) |
| 18 to 34 Years | 6 (2.1%) | 7 (2.9%) |
| 35 to 64 Years | 39 (7.4%) | 51 (9.8%) |
| 65 to 74 Years | 18 (17.0%) | 32 (23.2%) |
| 75 Years and over | 33 (44.0%) | 28 (40.0%) |
Disability Class: Self-Care Difficulty
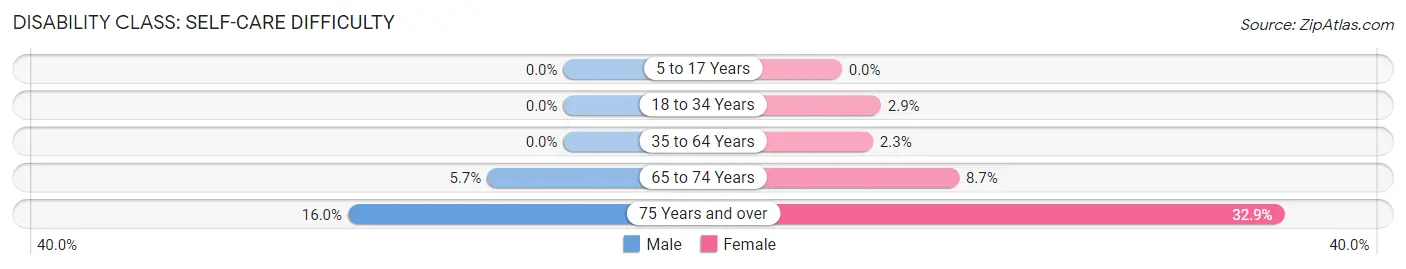
| Age Bracket | Male | Female |
| 5 to 17 Years | 0 (0.0%) | 0 (0.0%) |
| 18 to 34 Years | 0 (0.0%) | 7 (2.9%) |
| 35 to 64 Years | 0 (0.0%) | 12 (2.3%) |
| 65 to 74 Years | 6 (5.7%) | 12 (8.7%) |
| 75 Years and over | 12 (16.0%) | 23 (32.9%) |
Technology Access in Jones
Computing Device Access in Jones
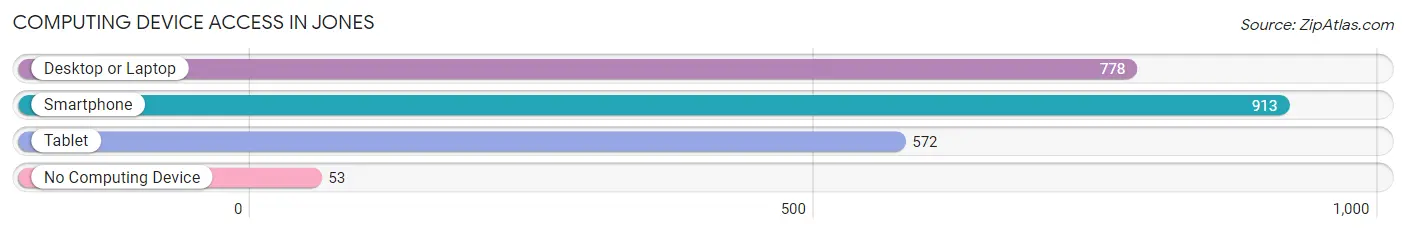
| Device Type | # Households | % Households |
| Desktop or Laptop | 778 | 76.9% |
| Smartphone | 913 | 90.2% |
| Tablet | 572 | 56.5% |
| No Computing Device | 53 | 5.2% |
| Total | 1,012 | 100.0% |
Internet Access in Jones
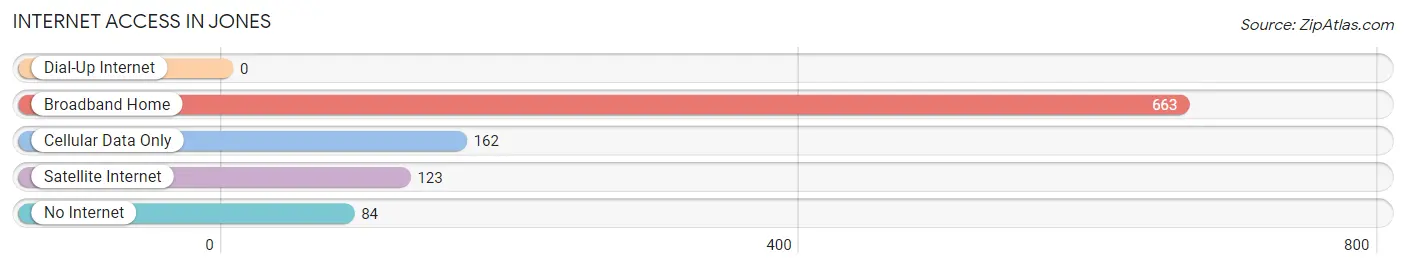
| Internet Type | # Households | % Households |
| Dial-Up Internet | 0 | 0.0% |
| Broadband Home | 663 | 65.5% |
| Cellular Data Only | 162 | 16.0% |
| Satellite Internet | 123 | 12.1% |
| No Internet | 84 | 8.3% |
| Total | 1,012 | 100.0% |
Jones Summary
Jones, Oklahoma is a small town located in Oklahoma County, Oklahoma. It is situated approximately 20 miles south of Oklahoma City and is part of the Oklahoma City metropolitan area. The town was founded in 1891 and was named after the local postmaster, John Jones. The population of Jones was estimated to be 4,845 in 2019.
Geography
Jones is located in the central part of Oklahoma County, Oklahoma. It is situated at the intersection of State Highway 3 and State Highway 102. The town is located in the Cross Timbers region of Oklahoma, which is characterized by rolling hills and wooded areas. The town is located in the Central Great Plains ecoregion, which is characterized by grasslands and prairies. The town is located in the Central Flyway, which is a major migratory route for birds. The town is located in the Central Time Zone.
The climate in Jones is characterized by hot, humid summers and mild winters. The average annual temperature is around 64°F. The average annual precipitation is around 37 inches.
Economy
The economy of Jones is largely based on agriculture and manufacturing. The town is home to several large agricultural operations, including cattle ranches, poultry farms, and grain elevators. The town is also home to several manufacturing companies, including a plastics factory and a metal fabrication plant.
The town is also home to several retail stores, restaurants, and other businesses. The town is served by several banks, including Bank of America, Wells Fargo, and First National Bank.
Demographics
As of the 2019 census, the population of Jones was estimated to be 4,845. The racial makeup of the town was 94.3% White, 1.2% African American, 0.7% Native American, 0.3% Asian, 0.1% Pacific Islander, and 2.4% from other races. The median household income was $50,945, and the median family income was $60,945. The per capita income was $25,945.
Conclusion
Jones, Oklahoma is a small town located in Oklahoma County, Oklahoma. It is situated approximately 20 miles south of Oklahoma City and is part of the Oklahoma City metropolitan area. The town was founded in 1891 and was named after the local postmaster, John Jones. The economy of Jones is largely based on agriculture and manufacturing. The town is home to several large agricultural operations, including cattle ranches, poultry farms, and grain elevators. The town is also home to several manufacturing companies, including a plastics factory and a metal fabrication plant. As of the 2019 census, the population of Jones was estimated to be 4,845. The racial makeup of the town was 94.3% White, 1.2% African American, 0.7% Native American, 0.3% Asian, 0.1% Pacific Islander, and 2.4% from other races. The median household income was $50,945, and the median family income was $60,945. The per capita income was $25,945. Jones is a small town with a rich history and a diverse economy.
Common Questions
What is Per Capita Income in Jones?
Per Capita income in Jones is $34,444.
What is the Median Family Income in Jones?
Median Family Income in Jones is $79,420.
What is the Median Household income in Jones?
Median Household Income in Jones is $74,750.
What is Income or Wage Gap in Jones?
Income or Wage Gap in Jones is 17.9%.
Women in Jones earn 82.1 cents for every dollar earned by a man.
What is Inequality or Gini Index in Jones?
Inequality or Gini Index in Jones is 0.44.
What is the Total Population of Jones?
Total Population of Jones is 2,925.
What is the Total Male Population of Jones?
Total Male Population of Jones is 1,407.
What is the Total Female Population of Jones?
Total Female Population of Jones is 1,518.
What is the Ratio of Males per 100 Females in Jones?
There are 92.69 Males per 100 Females in Jones.
What is the Ratio of Females per 100 Males in Jones?
There are 107.89 Females per 100 Males in Jones.
What is the Median Population Age in Jones?
Median Population Age in Jones is 36.9 Years.
What is the Average Family Size in Jones
Average Family Size in Jones is 3.3 People.
What is the Average Household Size in Jones
Average Household Size in Jones is 2.8 People.
How Large is the Labor Force in Jones?
There are 1,289 People in the Labor Forcein in Jones.
What is the Percentage of People in the Labor Force in Jones?
59.2% of People are in the Labor Force in Jones.
What is the Unemployment Rate in Jones?
Unemployment Rate in Jones is 5.1%.