Garber, OK Map & Demographics
Garber Map
Garber Overview
$29,342
PER CAPITA INCOME
$72,321
AVG FAMILY INCOME
$58,750
AVG HOUSEHOLD INCOME
20.2%
WAGE / INCOME GAP [ % ]
79.8¢/ $1
WAGE / INCOME GAP [ $ ]
0.41
INEQUALITY / GINI INDEX
664
TOTAL POPULATION
306
MALE POPULATION
358
FEMALE POPULATION
85.47
MALES / 100 FEMALES
116.99
FEMALES / 100 MALES
35.5
MEDIAN AGE
3.8
AVG FAMILY SIZE
2.6
AVG HOUSEHOLD SIZE
373
LABOR FORCE [ PEOPLE ]
68.3%
PERCENT IN LABOR FORCE
4.3%
UNEMPLOYMENT RATE
Garber Zip Codes
Garber Area Codes
Income in Garber
Income Overview in Garber
Per Capita Income in Garber is $29,342, while median incomes of families and households are $72,321 and $58,750 respectively.
| Characteristic | Number | Measure |
| Per Capita Income | 664 | $29,342 |
| Median Family Income | 145 | $72,321 |
| Mean Family Income | 145 | $82,383 |
| Median Household Income | 256 | $58,750 |
| Mean Household Income | 256 | $64,975 |
| Income Deficit | 145 | $0 |
| Wage / Income Gap (%) | 664 | 20.19% |
| Wage / Income Gap ($) | 664 | 79.81¢ per $1 |
| Gini / Inequality Index | 664 | 0.41 |
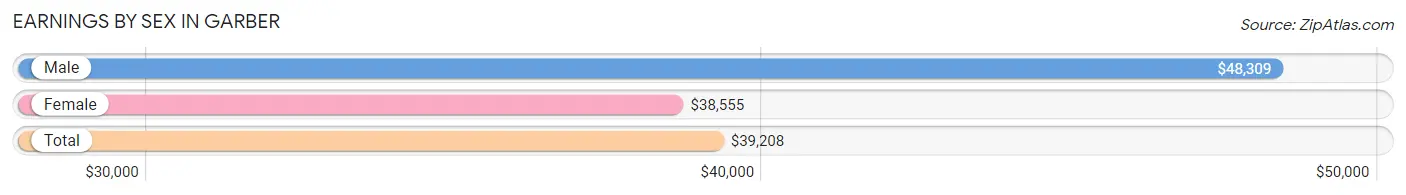
Earnings by Sex in Garber
Average Earnings in Garber are $39,208, $48,309 for men and $38,555 for women, a difference of 20.2%.
| Sex | Number | Average Earnings |
| Male | 201 (53.6%) | $48,309 |
| Female | 174 (46.4%) | $38,555 |
| Total | 375 (100.0%) | $39,208 |
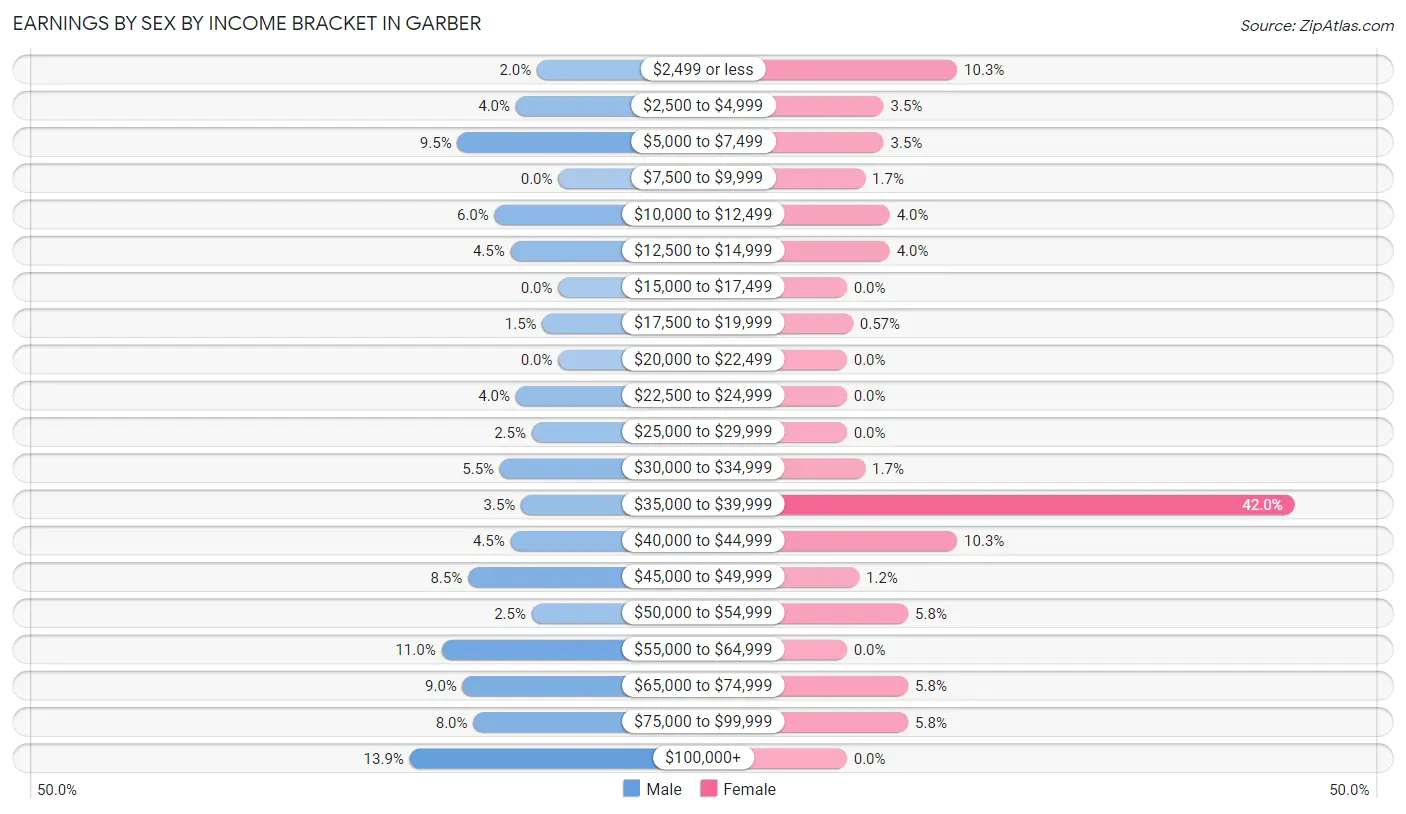
Earnings by Sex by Income Bracket in Garber
The most common earnings brackets in Garber are $100,000+ for men (28 | 13.9%) and $35,000 to $39,999 for women (73 | 41.9%).
| Income | Male | Female |
| $2,499 or less | 4 (2.0%) | 18 (10.3%) |
| $2,500 to $4,999 | 8 (4.0%) | 6 (3.5%) |
| $5,000 to $7,499 | 19 (9.5%) | 6 (3.5%) |
| $7,500 to $9,999 | 0 (0.0%) | 3 (1.7%) |
| $10,000 to $12,499 | 12 (6.0%) | 7 (4.0%) |
| $12,500 to $14,999 | 9 (4.5%) | 7 (4.0%) |
| $15,000 to $17,499 | 0 (0.0%) | 0 (0.0%) |
| $17,500 to $19,999 | 3 (1.5%) | 1 (0.6%) |
| $20,000 to $22,499 | 0 (0.0%) | 0 (0.0%) |
| $22,500 to $24,999 | 8 (4.0%) | 0 (0.0%) |
| $25,000 to $29,999 | 5 (2.5%) | 0 (0.0%) |
| $30,000 to $34,999 | 11 (5.5%) | 3 (1.7%) |
| $35,000 to $39,999 | 7 (3.5%) | 73 (41.9%) |
| $40,000 to $44,999 | 9 (4.5%) | 18 (10.3%) |
| $45,000 to $49,999 | 17 (8.5%) | 2 (1.1%) |
| $50,000 to $54,999 | 5 (2.5%) | 10 (5.8%) |
| $55,000 to $64,999 | 22 (11.0%) | 0 (0.0%) |
| $65,000 to $74,999 | 18 (9.0%) | 10 (5.8%) |
| $75,000 to $99,999 | 16 (8.0%) | 10 (5.8%) |
| $100,000+ | 28 (13.9%) | 0 (0.0%) |
| Total | 201 (100.0%) | 174 (100.0%) |
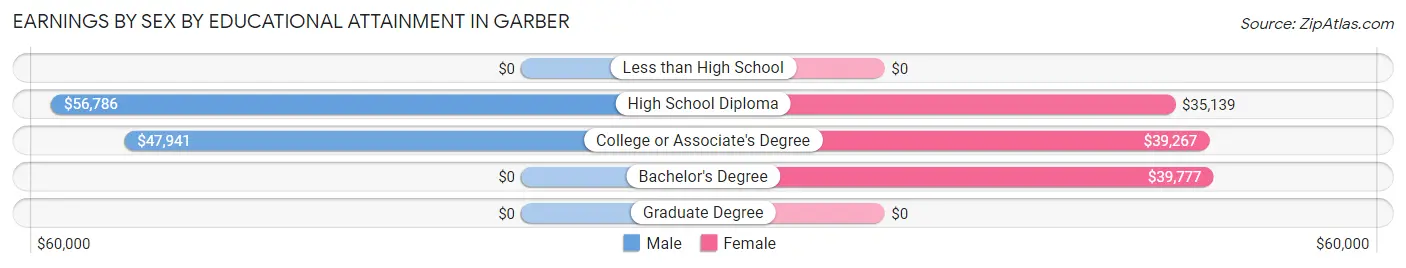
Earnings by Sex by Educational Attainment in Garber
Average earnings in Garber are $55,714 for men and $38,809 for women, a difference of 30.3%. Men with an educational attainment of high school diploma enjoy the highest average annual earnings of $56,786, while those with college or associate's degree education earn the least with $47,941. Women with an educational attainment of bachelor's degree earn the most with the average annual earnings of $39,777, while those with high school diploma education have the smallest earnings of $35,139.
| Educational Attainment | Male Income | Female Income |
| Less than High School | - | - |
| High School Diploma | $56,786 | $35,139 |
| College or Associate's Degree | $47,941 | $39,267 |
| Bachelor's Degree | - | - |
| Graduate Degree | - | - |
| Total | $55,714 | $38,809 |
Family Income in Garber
Family Income Brackets in Garber
According to the Garber family income data, there are 40 families falling into the $100,000 to $149,999 income range, which is the most common income bracket and makes up 27.6% of all families. Conversely, the less than $10,000 income bracket is the least frequent group with only 2 families (1.4%) belonging to this category.
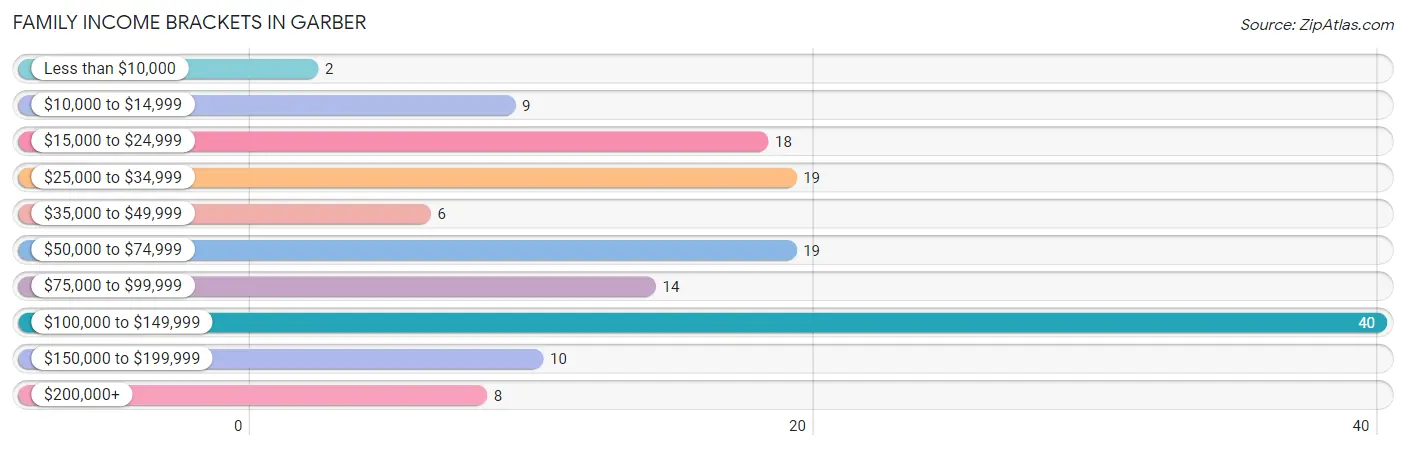
| Income Bracket | # Families | % Families |
| Less than $10,000 | 2 | 1.4% |
| $10,000 to $14,999 | 9 | 6.2% |
| $15,000 to $24,999 | 18 | 12.4% |
| $25,000 to $34,999 | 19 | 13.1% |
| $35,000 to $49,999 | 6 | 4.1% |
| $50,000 to $74,999 | 19 | 13.1% |
| $75,000 to $99,999 | 14 | 9.7% |
| $100,000 to $149,999 | 40 | 27.6% |
| $150,000 to $199,999 | 10 | 6.9% |
| $200,000+ | 8 | 5.5% |
Family Income by Famaliy Size in Garber
5-person families (35 | 24.1%) account for the highest median family income in Garber with $101,094 per family, while 5-person families (35 | 24.1%) have the highest median income of $20,219 per family member.
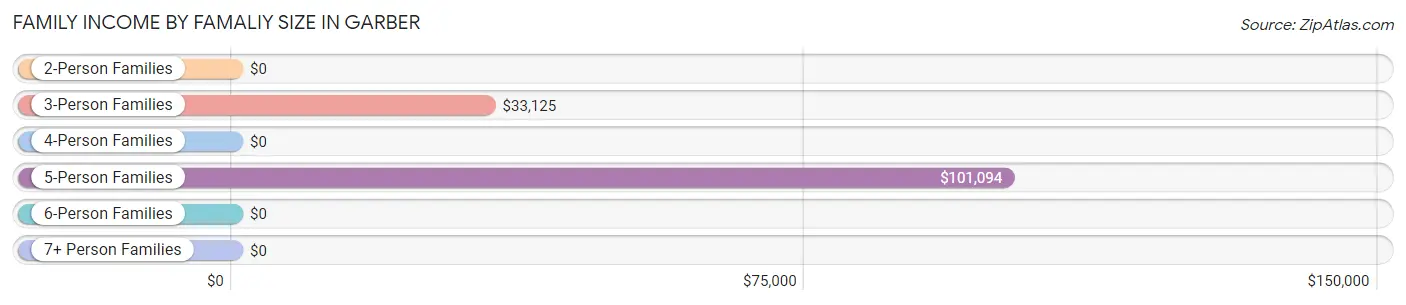
| Income Bracket | # Families | Median Income |
| 2-Person Families | 65 (44.8%) | $0 |
| 3-Person Families | 15 (10.3%) | $33,125 |
| 4-Person Families | 30 (20.7%) | $0 |
| 5-Person Families | 35 (24.1%) | $101,094 |
| 6-Person Families | 0 (0.0%) | $0 |
| 7+ Person Families | 0 (0.0%) | $0 |
| Total | 145 (100.0%) | $72,321 |
Family Income by Number of Earners in Garber
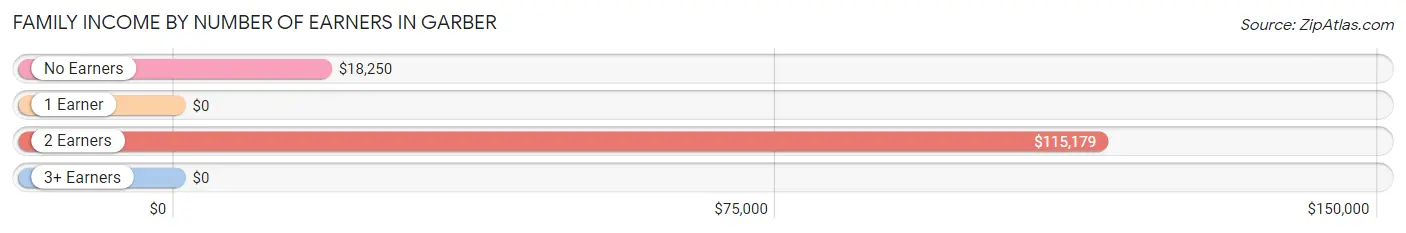
| Number of Earners | # Families | Median Income |
| No Earners | 20 (13.8%) | $18,250 |
| 1 Earner | 45 (31.0%) | $0 |
| 2 Earners | 49 (33.8%) | $115,179 |
| 3+ Earners | 31 (21.4%) | $0 |
| Total | 145 (100.0%) | $72,321 |
Household Income in Garber
Household Income Brackets in Garber
With 50 households falling in the category, the $50,000 to $74,999 income range is the most frequent in Garber, accounting for 19.5% of all households. In contrast, only 8 households (3.1%) fall into the $200,000+ income bracket, making it the least populous group.
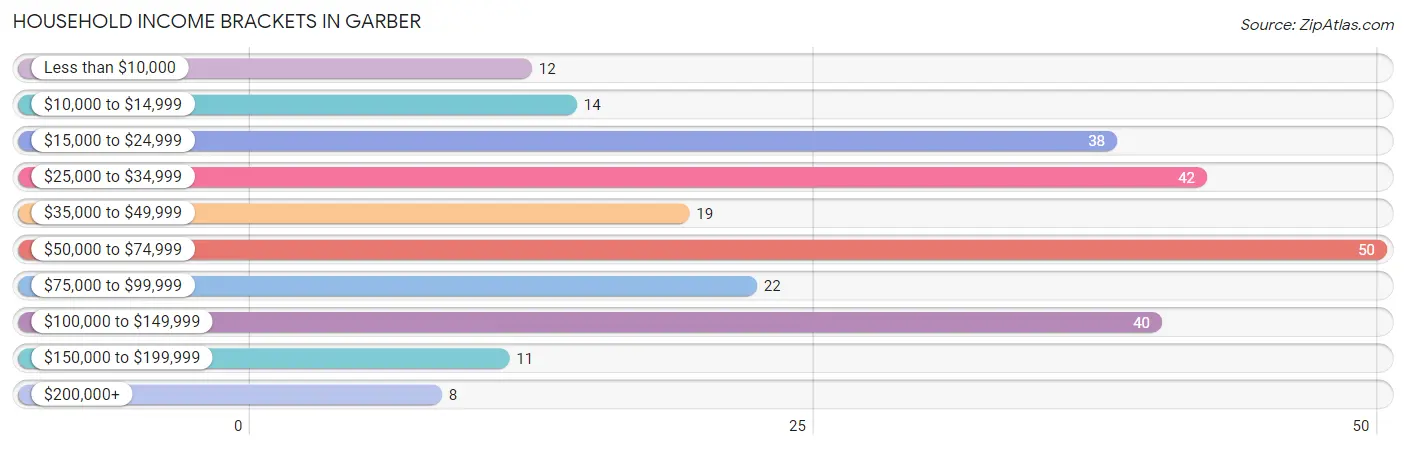
| Income Bracket | # Households | % Households |
| Less than $10,000 | 12 | 4.7% |
| $10,000 to $14,999 | 14 | 5.5% |
| $15,000 to $24,999 | 38 | 14.8% |
| $25,000 to $34,999 | 42 | 16.4% |
| $35,000 to $49,999 | 19 | 7.4% |
| $50,000 to $74,999 | 50 | 19.5% |
| $75,000 to $99,999 | 22 | 8.6% |
| $100,000 to $149,999 | 40 | 15.6% |
| $150,000 to $199,999 | 11 | 4.3% |
| $200,000+ | 8 | 3.1% |
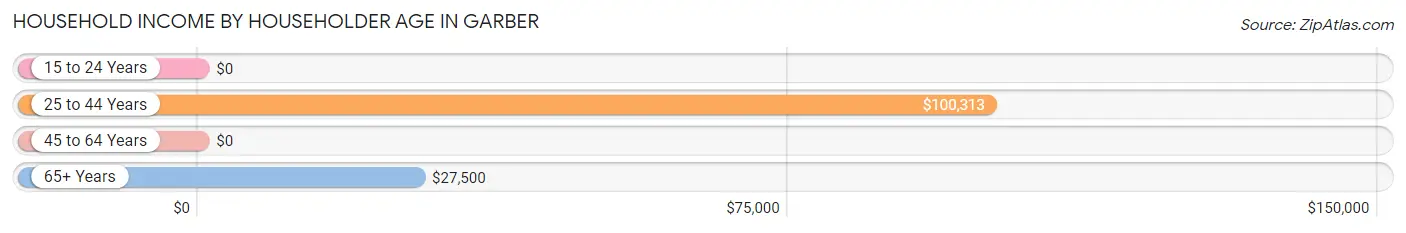
Household Income by Householder Age in Garber
The median household income in Garber is $58,750, with the highest median household income of $100,313 found in the 25 to 44 years age bracket for the primary householder. A total of 94 households (36.7%) fall into this category. Meanwhile, the 15 to 24 years age bracket for the primary householder has the lowest median household income of $0, with 9 households (3.5%) in this group.
| Income Bracket | # Households | Median Income |
| 15 to 24 Years | 9 (3.5%) | $0 |
| 25 to 44 Years | 94 (36.7%) | $100,313 |
| 45 to 64 Years | 107 (41.8%) | $0 |
| 65+ Years | 46 (18.0%) | $27,500 |
| Total | 256 (100.0%) | $58,750 |
Poverty in Garber
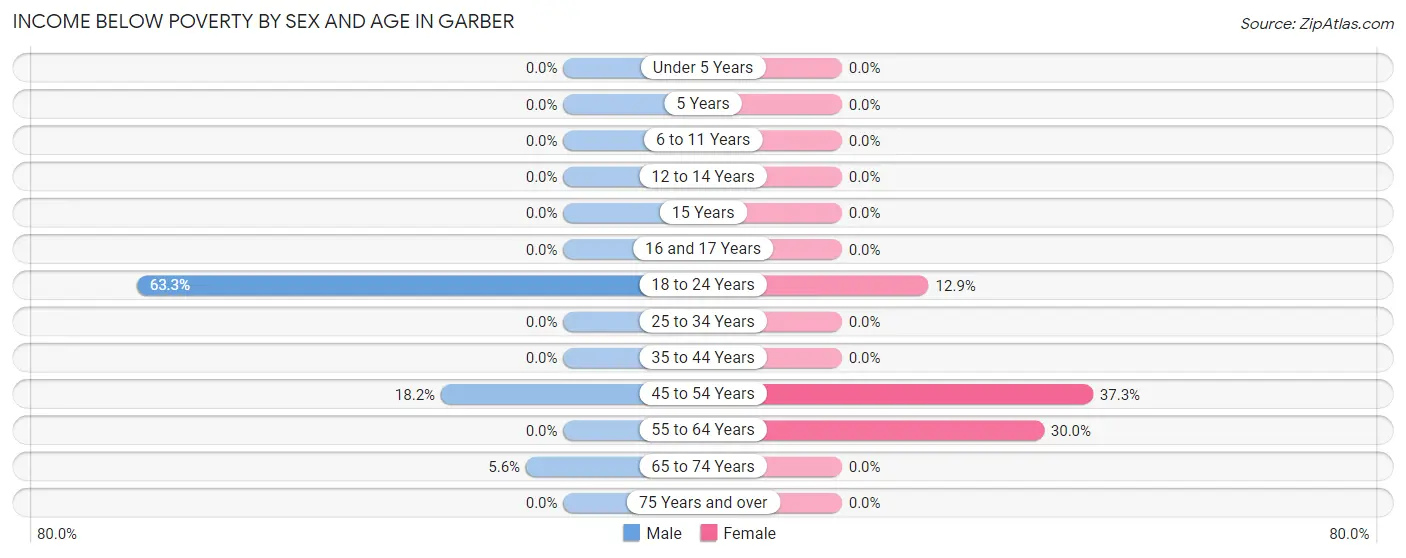
Income Below Poverty by Sex and Age in Garber
With 10.1% poverty level for males and 8.9% for females among the residents of Garber, 18 to 24 year old males and 45 to 54 year old females are the most vulnerable to poverty, with 19 males (63.3%) and 22 females (37.3%) in their respective age groups living below the poverty level.
| Age Bracket | Male | Female |
| Under 5 Years | 0 (0.0%) | 0 (0.0%) |
| 5 Years | 0 (0.0%) | 0 (0.0%) |
| 6 to 11 Years | 0 (0.0%) | 0 (0.0%) |
| 12 to 14 Years | 0 (0.0%) | 0 (0.0%) |
| 15 Years | 0 (0.0%) | 0 (0.0%) |
| 16 and 17 Years | 0 (0.0%) | 0 (0.0%) |
| 18 to 24 Years | 19 (63.3%) | 4 (12.9%) |
| 25 to 34 Years | 0 (0.0%) | 0 (0.0%) |
| 35 to 44 Years | 0 (0.0%) | 0 (0.0%) |
| 45 to 54 Years | 10 (18.2%) | 22 (37.3%) |
| 55 to 64 Years | 0 (0.0%) | 6 (30.0%) |
| 65 to 74 Years | 2 (5.6%) | 0 (0.0%) |
| 75 Years and over | 0 (0.0%) | 0 (0.0%) |
| Total | 31 (10.1%) | 32 (8.9%) |
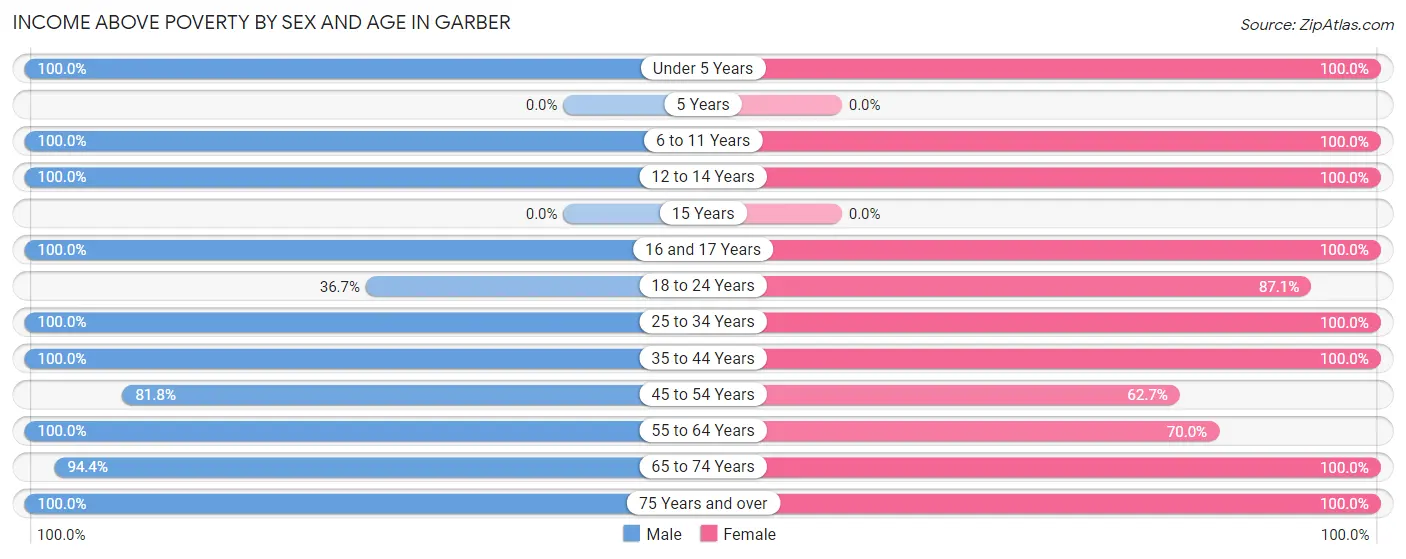
Income Above Poverty by Sex and Age in Garber
According to the poverty statistics in Garber, males aged under 5 years and females aged under 5 years are the age groups that are most secure financially, with 100.0% of males and 100.0% of females in these age groups living above the poverty line.
| Age Bracket | Male | Female |
| Under 5 Years | 13 (100.0%) | 4 (100.0%) |
| 5 Years | 0 (0.0%) | 0 (0.0%) |
| 6 to 11 Years | 9 (100.0%) | 12 (100.0%) |
| 12 to 14 Years | 24 (100.0%) | 56 (100.0%) |
| 15 Years | 0 (0.0%) | 0 (0.0%) |
| 16 and 17 Years | 15 (100.0%) | 12 (100.0%) |
| 18 to 24 Years | 11 (36.7%) | 27 (87.1%) |
| 25 to 34 Years | 28 (100.0%) | 89 (100.0%) |
| 35 to 44 Years | 36 (100.0%) | 48 (100.0%) |
| 45 to 54 Years | 45 (81.8%) | 37 (62.7%) |
| 55 to 64 Years | 53 (100.0%) | 14 (70.0%) |
| 65 to 74 Years | 34 (94.4%) | 17 (100.0%) |
| 75 Years and over | 7 (100.0%) | 10 (100.0%) |
| Total | 275 (89.9%) | 326 (91.1%) |
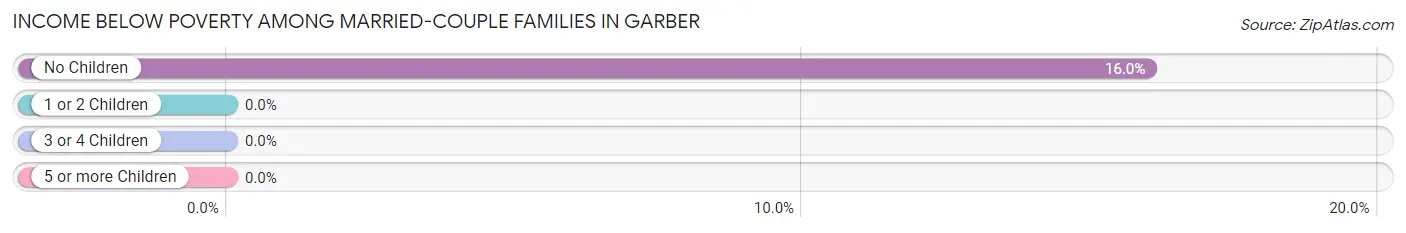
Income Below Poverty Among Married-Couple Families in Garber
The poverty statistics for married-couple families in Garber show that 10.0% or 12 of the total 120 families live below the poverty line. Families with no children have the highest poverty rate of 16.0%, comprising of 12 families. On the other hand, families with 1 or 2 children have the lowest poverty rate of 0.0%, which includes 0 families.
| Children | Above Poverty | Below Poverty |
| No Children | 63 (84.0%) | 12 (16.0%) |
| 1 or 2 Children | 20 (100.0%) | 0 (0.0%) |
| 3 or 4 Children | 25 (100.0%) | 0 (0.0%) |
| 5 or more Children | 0 (0.0%) | 0 (0.0%) |
| Total | 108 (90.0%) | 12 (10.0%) |
Income Below Poverty Among Single-Parent Households in Garber
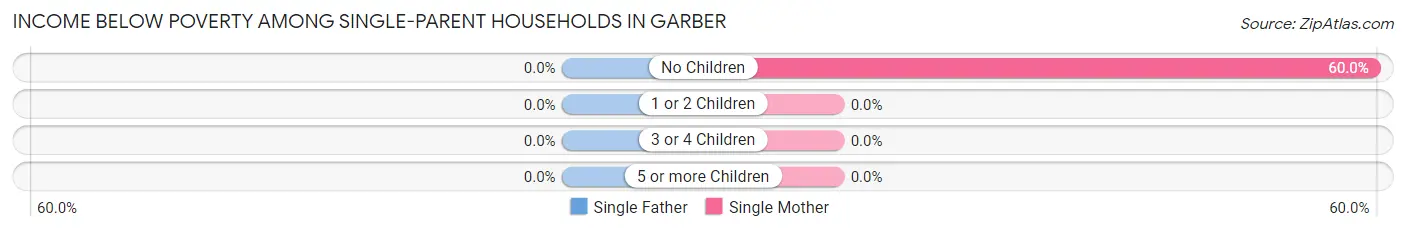
| Children | Single Father | Single Mother |
| No Children | 0 (0.0%) | 9 (60.0%) |
| 1 or 2 Children | 0 (0.0%) | 0 (0.0%) |
| 3 or 4 Children | 0 (0.0%) | 0 (0.0%) |
| 5 or more Children | 0 (0.0%) | 0 (0.0%) |
| Total | 0 (0.0%) | 9 (36.0%) |
Income Below Poverty Among Married-Couple vs Single-Parent Households in Garber
The poverty data for Garber shows that 12 of the married-couple family households (10.0%) and 9 of the single-parent households (36.0%) are living below the poverty level. Within the married-couple family households, those with no children have the highest poverty rate, with 12 households (16.0%) falling below the poverty line. Among the single-parent households, those with no children have the highest poverty rate, with 9 household (60.0%) living below poverty.
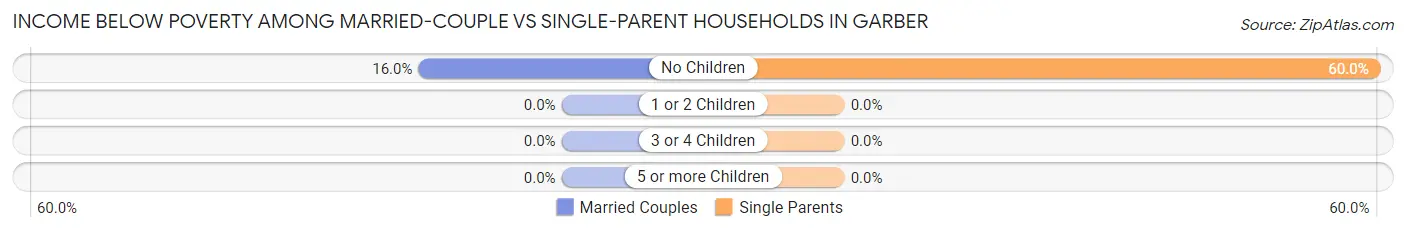
| Children | Married-Couple Families | Single-Parent Households |
| No Children | 12 (16.0%) | 9 (60.0%) |
| 1 or 2 Children | 0 (0.0%) | 0 (0.0%) |
| 3 or 4 Children | 0 (0.0%) | 0 (0.0%) |
| 5 or more Children | 0 (0.0%) | 0 (0.0%) |
| Total | 12 (10.0%) | 9 (36.0%) |
Race in Garber
The most populous races in Garber are White / Caucasian (582 | 87.6%), Two or more Races (58 | 8.7%), and Hispanic or Latino (41 | 6.2%).
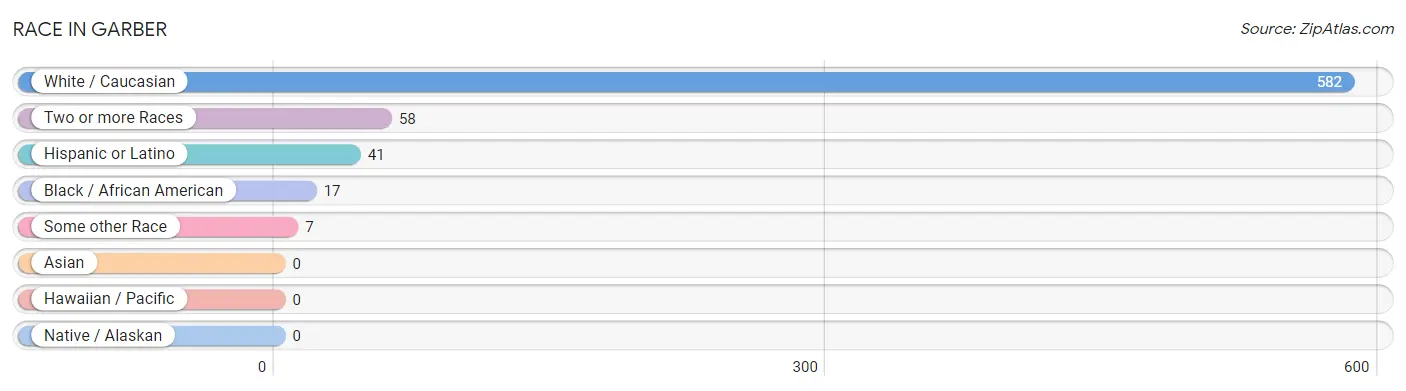
| Race | # Population | % Population |
| Asian | 0 | 0.0% |
| Black / African American | 17 | 2.6% |
| Hawaiian / Pacific | 0 | 0.0% |
| Hispanic or Latino | 41 | 6.2% |
| Native / Alaskan | 0 | 0.0% |
| White / Caucasian | 582 | 87.6% |
| Two or more Races | 58 | 8.7% |
| Some other Race | 7 | 1.1% |
| Total | 664 | 100.0% |
Ancestry in Garber
The most populous ancestries reported in Garber are German (217 | 32.7%), Irish (93 | 14.0%), Scottish (90 | 13.6%), English (53 | 8.0%), and Mexican (41 | 6.2%), together accounting for 74.4% of all Garber residents.
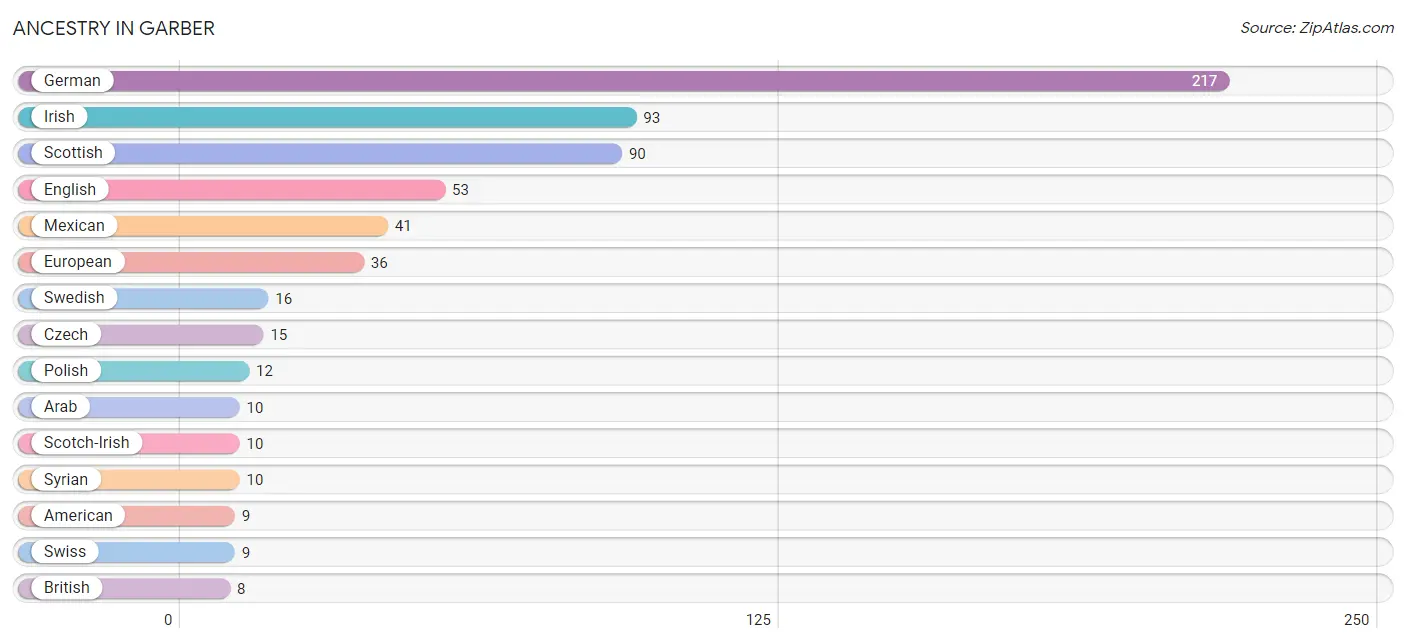
| Ancestry | # Population | % Population |
| American | 9 | 1.4% |
| Arab | 10 | 1.5% |
| British | 8 | 1.2% |
| Cheyenne | 7 | 1.1% |
| Choctaw | 4 | 0.6% |
| Creek | 8 | 1.2% |
| Czech | 15 | 2.3% |
| Dutch | 2 | 0.3% |
| English | 53 | 8.0% |
| European | 36 | 5.4% |
| French | 6 | 0.9% |
| German | 217 | 32.7% |
| Irish | 93 | 14.0% |
| Mexican | 41 | 6.2% |
| Polish | 12 | 1.8% |
| Scotch-Irish | 10 | 1.5% |
| Scottish | 90 | 13.6% |
| Swedish | 16 | 2.4% |
| Swiss | 9 | 1.4% |
| Syrian | 10 | 1.5% |
| Welsh | 5 | 0.7% | View All 21 Rows |
Immigrants in Garber
The most numerous immigrant groups reported in Garber came from Central America (7 | 1.1%), Latin America (7 | 1.1%), and Mexico (7 | 1.1%), together accounting for 3.2% of all Garber residents.
| Immigration Origin | # Population | % Population |
| Central America | 7 | 1.1% |
| Latin America | 7 | 1.1% |
| Mexico | 7 | 1.1% | View All 3 Rows |
Sex and Age in Garber
Sex and Age in Garber
The most populous age groups in Garber are 45 to 49 Years (37 | 12.1%) for men and 25 to 29 Years (75 | 20.9%) for women.
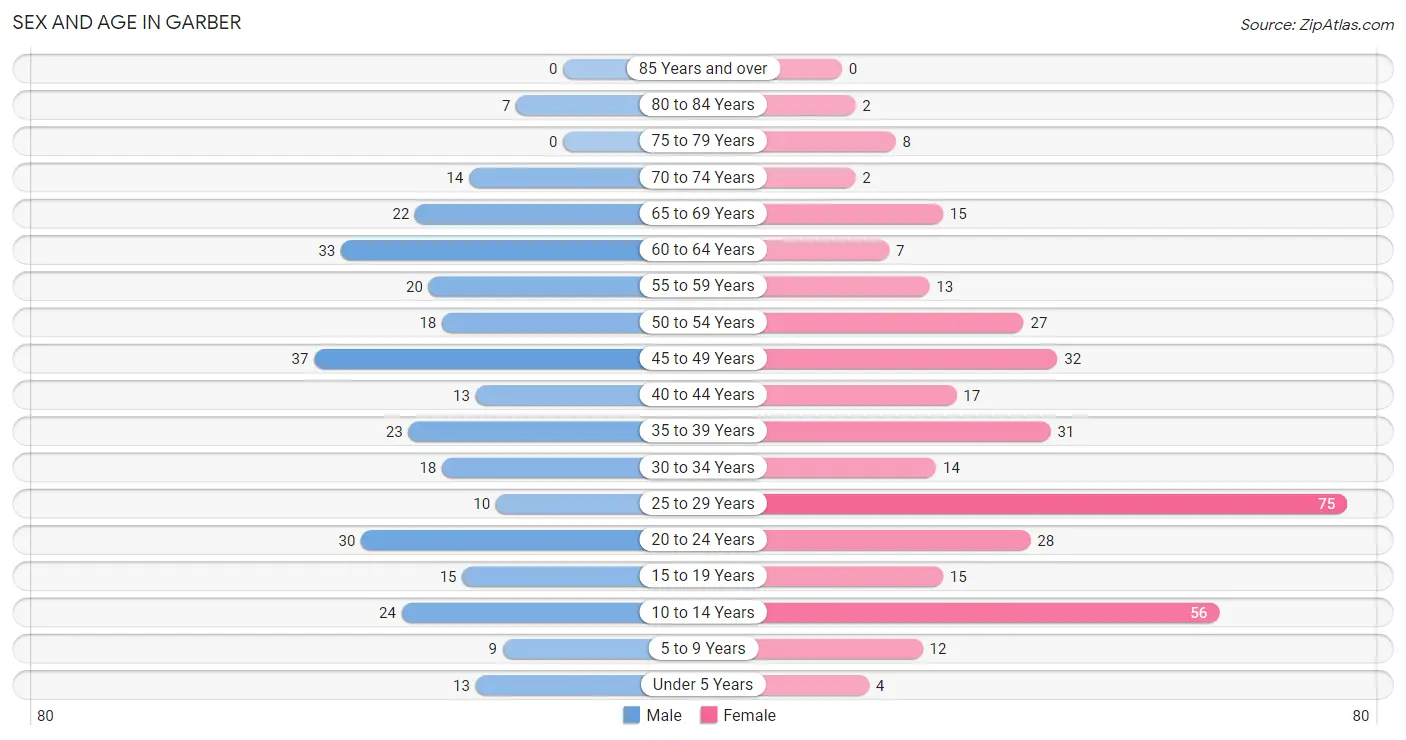
| Age Bracket | Male | Female |
| Under 5 Years | 13 (4.3%) | 4 (1.1%) |
| 5 to 9 Years | 9 (2.9%) | 12 (3.4%) |
| 10 to 14 Years | 24 (7.8%) | 56 (15.6%) |
| 15 to 19 Years | 15 (4.9%) | 15 (4.2%) |
| 20 to 24 Years | 30 (9.8%) | 28 (7.8%) |
| 25 to 29 Years | 10 (3.3%) | 75 (20.9%) |
| 30 to 34 Years | 18 (5.9%) | 14 (3.9%) |
| 35 to 39 Years | 23 (7.5%) | 31 (8.7%) |
| 40 to 44 Years | 13 (4.3%) | 17 (4.8%) |
| 45 to 49 Years | 37 (12.1%) | 32 (8.9%) |
| 50 to 54 Years | 18 (5.9%) | 27 (7.5%) |
| 55 to 59 Years | 20 (6.5%) | 13 (3.6%) |
| 60 to 64 Years | 33 (10.8%) | 7 (2.0%) |
| 65 to 69 Years | 22 (7.2%) | 15 (4.2%) |
| 70 to 74 Years | 14 (4.6%) | 2 (0.6%) |
| 75 to 79 Years | 0 (0.0%) | 8 (2.2%) |
| 80 to 84 Years | 7 (2.3%) | 2 (0.6%) |
| 85 Years and over | 0 (0.0%) | 0 (0.0%) |
| Total | 306 (100.0%) | 358 (100.0%) |
Families and Households in Garber
Median Family Size in Garber
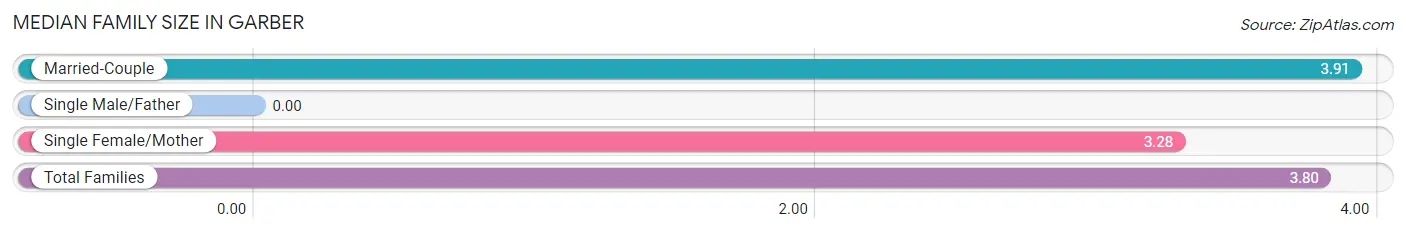
| Family Type | # Families | Family Size |
| Married-Couple | 120 (82.8%) | 3.91 |
| Single Male/Father | 0 (0.0%) | - |
| Single Female/Mother | 25 (17.2%) | 3.28 |
| Total Families | 145 (100.0%) | 3.80 |
Median Household Size in Garber
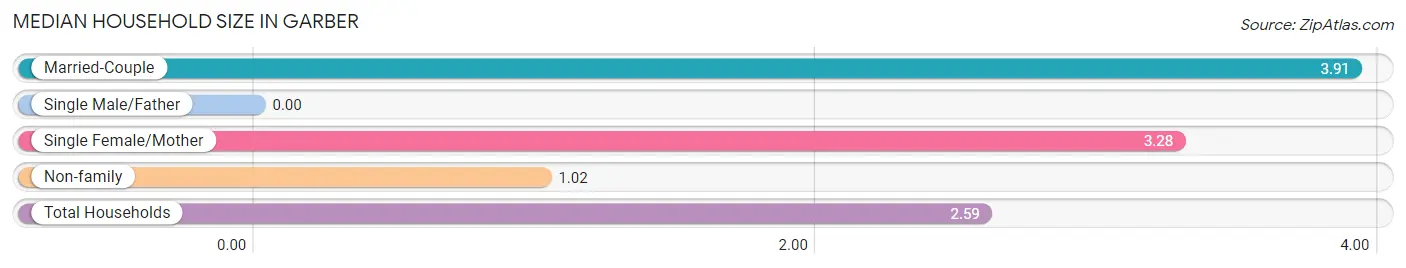
| Household Type | # Households | Household Size |
| Married-Couple | 120 (46.9%) | 3.91 |
| Single Male/Father | 0 (0.0%) | - |
| Single Female/Mother | 25 (9.8%) | 3.28 |
| Non-family | 111 (43.4%) | 1.02 |
| Total Households | 256 (100.0%) | 2.59 |
Household Size by Marriage Status in Garber
Out of a total of 256 households in Garber, 145 (56.6%) are family households, while 111 (43.4%) are nonfamily households. The most numerous type of family households are 2-person households, comprising 65, and the most common type of nonfamily households are 1-person households, comprising 109.
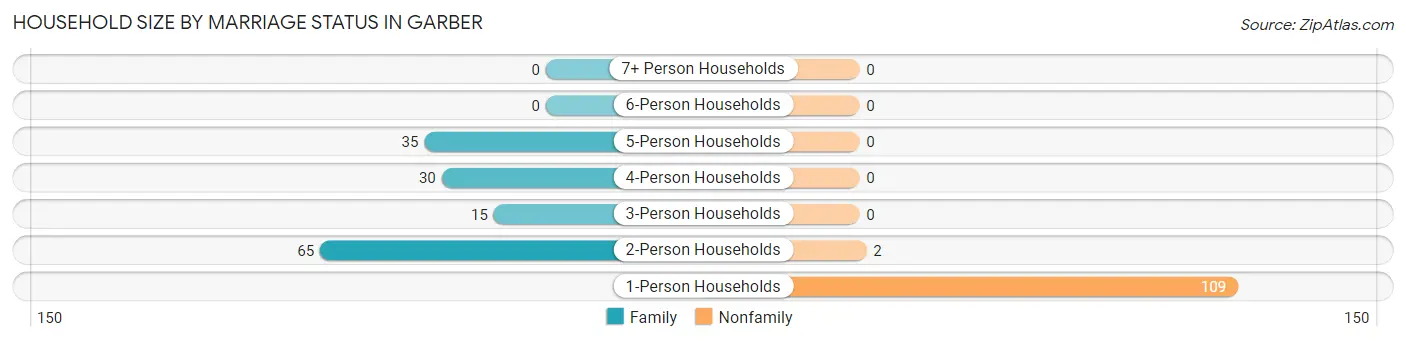
| Household Size | Family Households | Nonfamily Households |
| 1-Person Households | - | 109 (42.6%) |
| 2-Person Households | 65 (25.4%) | 2 (0.8%) |
| 3-Person Households | 15 (5.9%) | 0 (0.0%) |
| 4-Person Households | 30 (11.7%) | 0 (0.0%) |
| 5-Person Households | 35 (13.7%) | 0 (0.0%) |
| 6-Person Households | 0 (0.0%) | 0 (0.0%) |
| 7+ Person Households | 0 (0.0%) | 0 (0.0%) |
| Total | 145 (56.6%) | 111 (43.4%) |
Female Fertility in Garber
Fertility by Age in Garber
Average fertility rate in Garber is 23.0 births per 1,000 women. Women in the age bracket of 20 to 34 years have the highest fertility rate with 43.0 births per 1,000 women. Women in the age bracket of 20 to 34 years acount for 100.0% of all women with births.
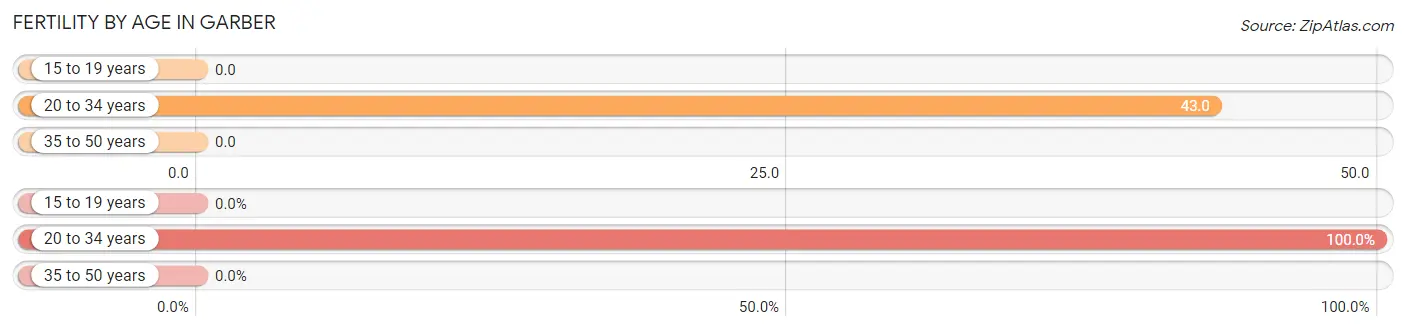
| Age Bracket | Women with Births | Births / 1,000 Women |
| 15 to 19 years | 0 (0.0%) | 0.0 |
| 20 to 34 years | 5 (100.0%) | 43.0 |
| 35 to 50 years | 0 (0.0%) | 0.0 |
| Total | 5 (100.0%) | 23.0 |
Fertility by Age by Marriage Status in Garber
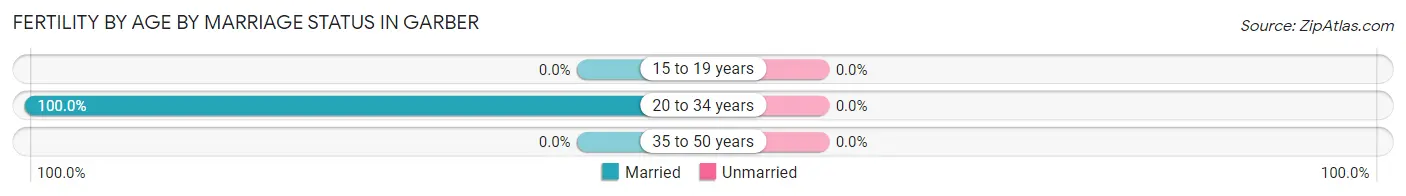
| Age Bracket | Married | Unmarried |
| 15 to 19 years | 0 (0.0%) | 0 (0.0%) |
| 20 to 34 years | 5 (100.0%) | 0 (0.0%) |
| 35 to 50 years | 0 (0.0%) | 0 (0.0%) |
| Total | 5 (100.0%) | 0 (0.0%) |
Fertility by Education in Garber
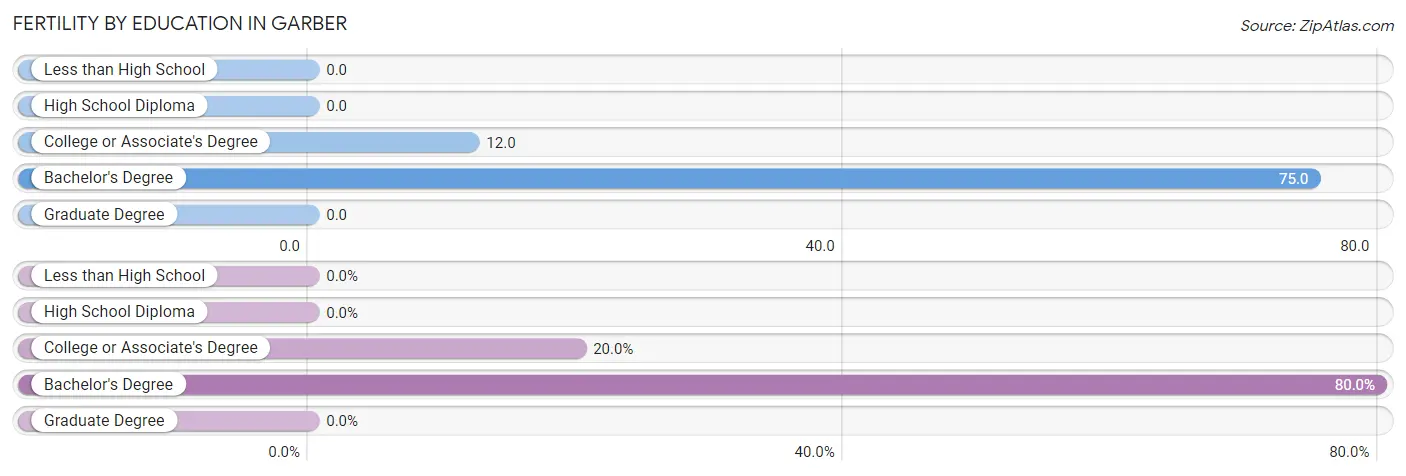
| Educational Attainment | Women with Births | Births / 1,000 Women |
| Less than High School | 0 (0.0%) | 0.0 |
| High School Diploma | 0 (0.0%) | 0.0 |
| College or Associate's Degree | 1 (20.0%) | 12.0 |
| Bachelor's Degree | 4 (80.0%) | 75.0 |
| Graduate Degree | 0 (0.0%) | 0.0 |
| Total | 5 (100.0%) | 23.0 |
Fertility by Education by Marriage Status in Garber
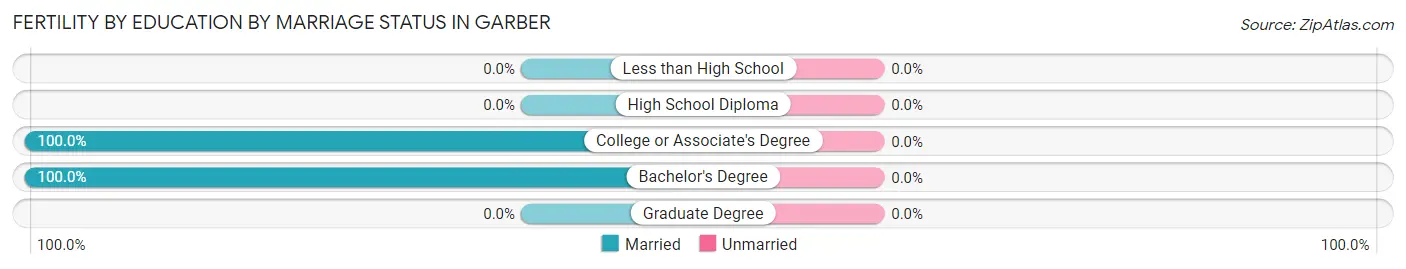
| Educational Attainment | Married | Unmarried |
| Less than High School | 0 (0.0%) | 0 (0.0%) |
| High School Diploma | 0 (0.0%) | 0 (0.0%) |
| College or Associate's Degree | 1 (100.0%) | 0 (0.0%) |
| Bachelor's Degree | 4 (100.0%) | 0 (0.0%) |
| Graduate Degree | 0 (0.0%) | 0 (0.0%) |
| Total | 5 (100.0%) | 0 (0.0%) |
Employment Characteristics in Garber
Employment by Class of Employer in Garber
Among the 339 employed individuals in Garber, private company employees (222 | 65.5%), local government employees (27 | 8.0%), and state government employees (27 | 8.0%) make up the most common classes of employment.
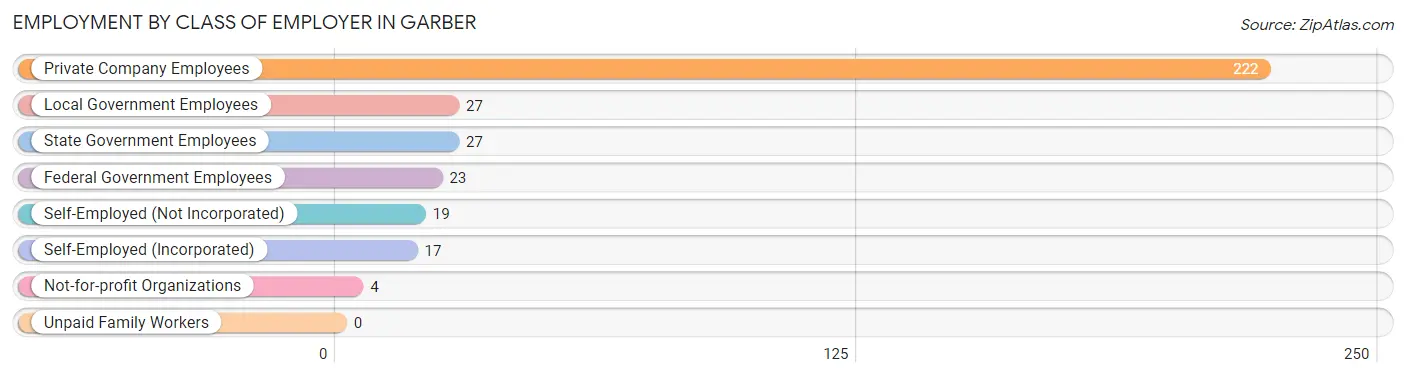
| Employer Class | # Employees | % Employees |
| Private Company Employees | 222 | 65.5% |
| Self-Employed (Incorporated) | 17 | 5.0% |
| Self-Employed (Not Incorporated) | 19 | 5.6% |
| Not-for-profit Organizations | 4 | 1.2% |
| Local Government Employees | 27 | 8.0% |
| State Government Employees | 27 | 8.0% |
| Federal Government Employees | 23 | 6.8% |
| Unpaid Family Workers | 0 | 0.0% |
| Total | 339 | 100.0% |
Employment Status by Age in Garber
According to the labor force statistics for Garber, out of the total population over 16 years of age (546), 68.3% or 373 individuals are in the labor force, with 4.3% or 16 of them unemployed. The age group with the highest labor force participation rate is 30 to 34 years, with 100.0% or 32 individuals in the labor force. Within the labor force, the 55 to 59 years age range has the highest percentage of unemployed individuals, with 20.0% or 5 of them being unemployed.
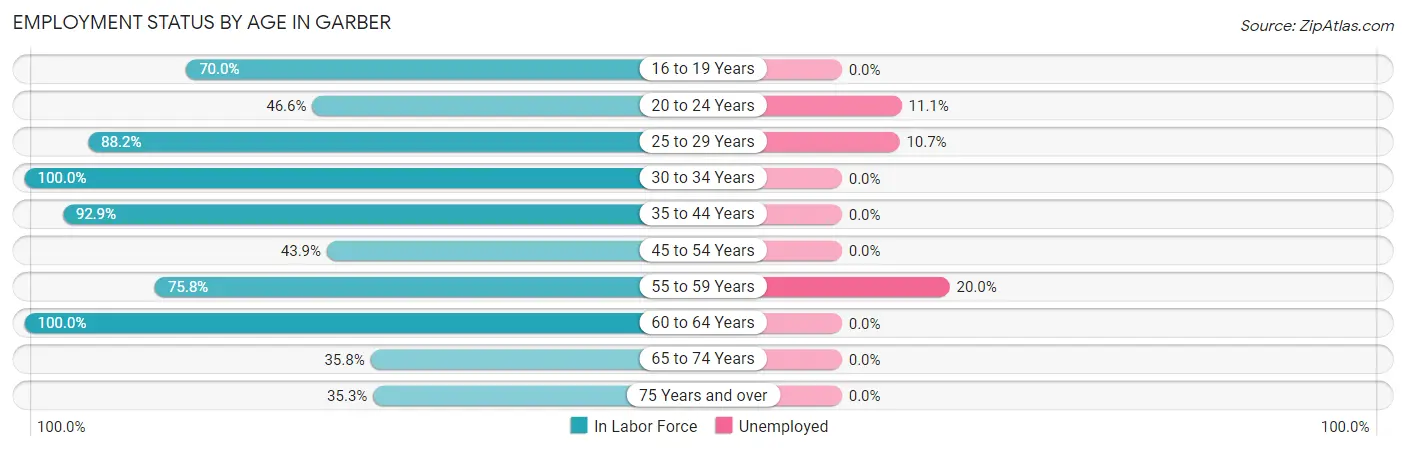
| Age Bracket | In Labor Force | Unemployed |
| 16 to 19 Years | 21 (70.0%) | 0 (0.0%) |
| 20 to 24 Years | 27 (46.6%) | 3 (11.1%) |
| 25 to 29 Years | 75 (88.2%) | 8 (10.7%) |
| 30 to 34 Years | 32 (100.0%) | 0 (0.0%) |
| 35 to 44 Years | 78 (92.9%) | 0 (0.0%) |
| 45 to 54 Years | 50 (43.9%) | 0 (0.0%) |
| 55 to 59 Years | 25 (75.8%) | 5 (20.0%) |
| 60 to 64 Years | 40 (100.0%) | 0 (0.0%) |
| 65 to 74 Years | 19 (35.8%) | 0 (0.0%) |
| 75 Years and over | 6 (35.3%) | 0 (0.0%) |
| Total | 373 (68.3%) | 16 (4.3%) |
Employment Status by Educational Attainment in Garber
According to labor force statistics for Garber, 77.3% of individuals (300) out of the total population between 25 and 64 years of age (388) are in the labor force, with 4.3% or 13 of them being unemployed. The group with the highest labor force participation rate are those with the educational attainment of bachelor's degree or higher, with 100.0% or 82 individuals in the labor force. Within the labor force, individuals with high school diploma education have the highest percentage of unemployment, with 8.0% or 8 of them being unemployed.
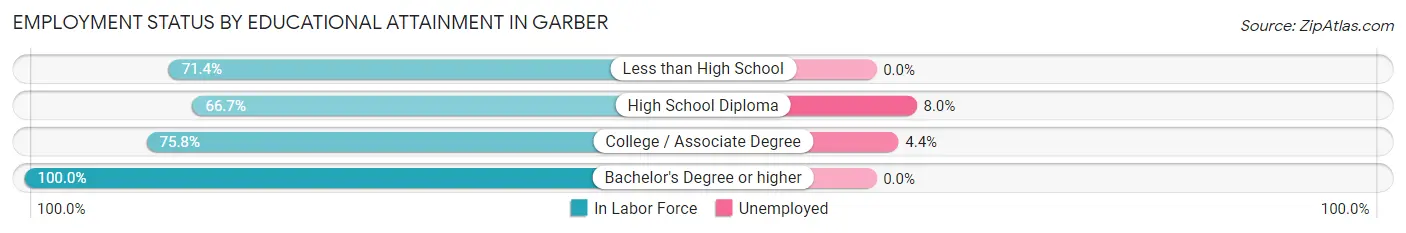
| Educational Attainment | In Labor Force | Unemployed |
| Less than High School | 5 (71.4%) | 0 (0.0%) |
| High School Diploma | 100 (66.7%) | 12 (8.0%) |
| College / Associate Degree | 113 (75.8%) | 7 (4.4%) |
| Bachelor's Degree or higher | 82 (100.0%) | 0 (0.0%) |
| Total | 300 (77.3%) | 17 (4.3%) |
Employment Occupations by Sex in Garber
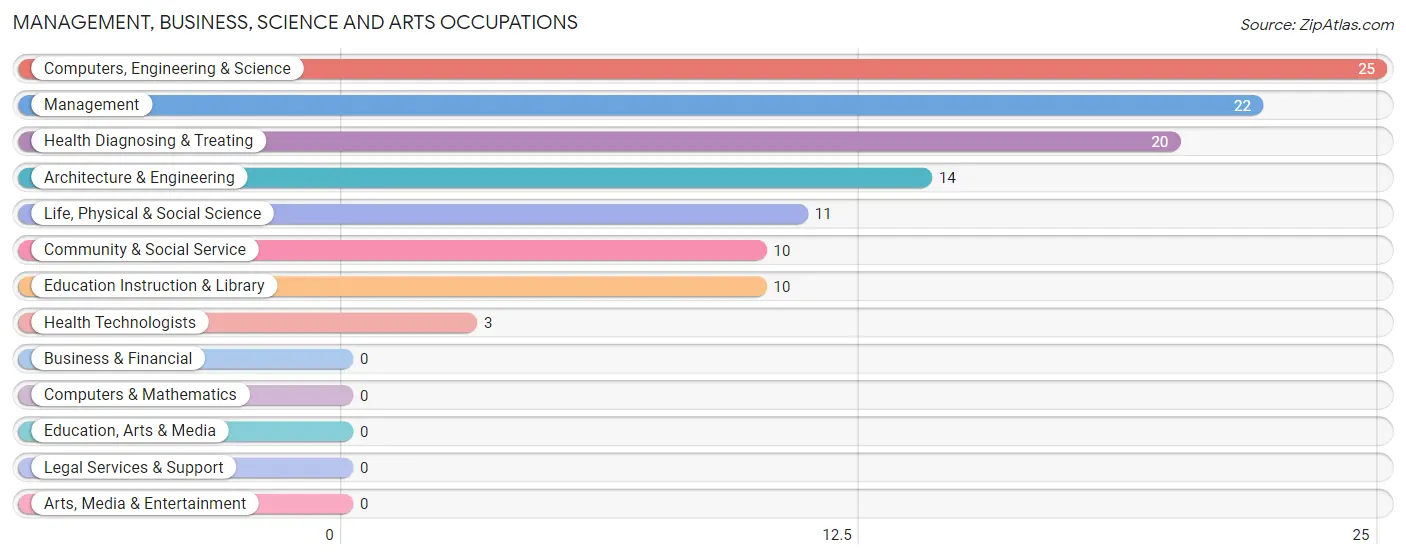
Management, Business, Science and Arts Occupations
The most common Management, Business, Science and Arts occupations in Garber are Computers, Engineering & Science (25 | 7.0%), Management (22 | 6.2%), Health Diagnosing & Treating (20 | 5.6%), Architecture & Engineering (14 | 3.9%), and Life, Physical & Social Science (11 | 3.1%).
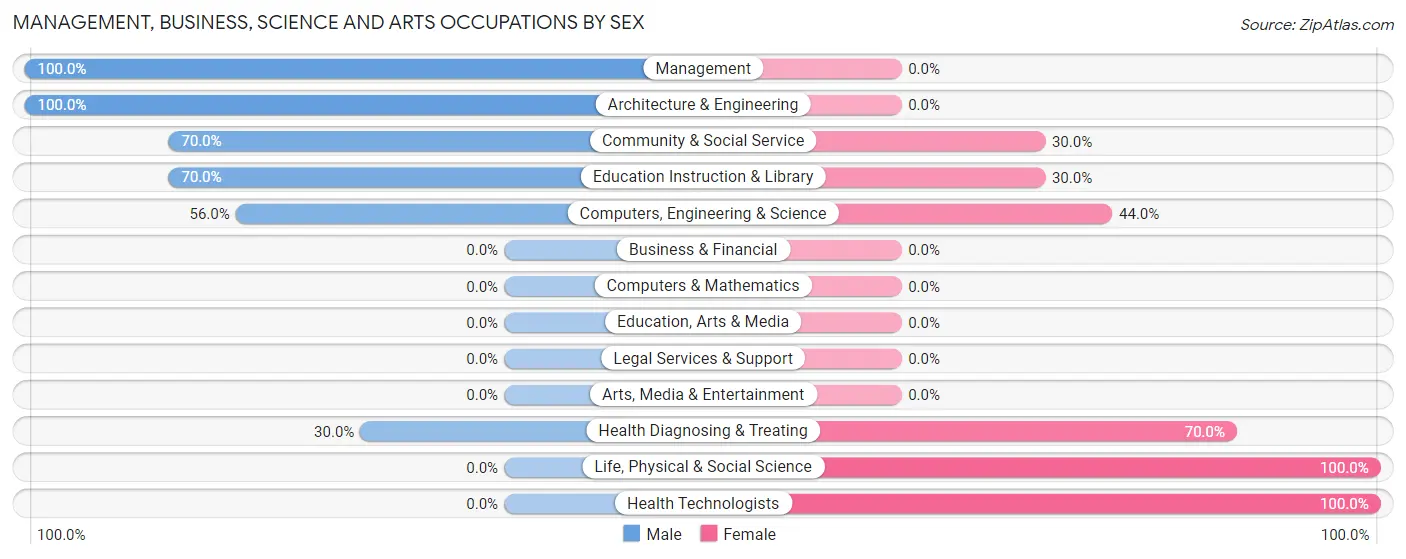
Management, Business, Science and Arts Occupations by Sex
Within the Management, Business, Science and Arts occupations in Garber, the most male-oriented occupations are Management (100.0%), Architecture & Engineering (100.0%), and Community & Social Service (70.0%), while the most female-oriented occupations are Life, Physical & Social Science (100.0%), Health Technologists (100.0%), and Health Diagnosing & Treating (70.0%).
| Occupation | Male | Female |
| Management | 22 (100.0%) | 0 (0.0%) |
| Business & Financial | 0 (0.0%) | 0 (0.0%) |
| Computers, Engineering & Science | 14 (56.0%) | 11 (44.0%) |
| Computers & Mathematics | 0 (0.0%) | 0 (0.0%) |
| Architecture & Engineering | 14 (100.0%) | 0 (0.0%) |
| Life, Physical & Social Science | 0 (0.0%) | 11 (100.0%) |
| Community & Social Service | 7 (70.0%) | 3 (30.0%) |
| Education, Arts & Media | 0 (0.0%) | 0 (0.0%) |
| Legal Services & Support | 0 (0.0%) | 0 (0.0%) |
| Education Instruction & Library | 7 (70.0%) | 3 (30.0%) |
| Arts, Media & Entertainment | 0 (0.0%) | 0 (0.0%) |
| Health Diagnosing & Treating | 6 (30.0%) | 14 (70.0%) |
| Health Technologists | 0 (0.0%) | 3 (100.0%) |
| Total (Category) | 49 (63.6%) | 28 (36.4%) |
| Total (Overall) | 199 (55.7%) | 158 (44.3%) |
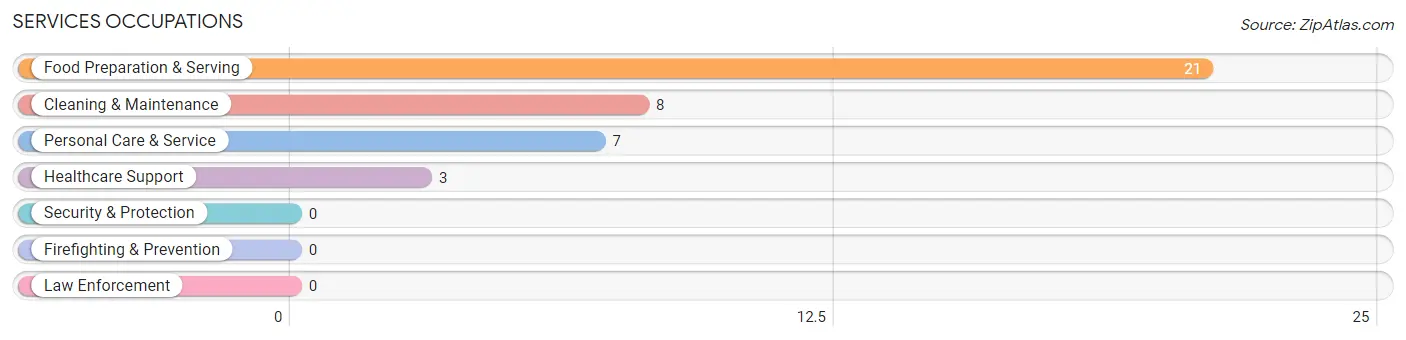
Services Occupations
The most common Services occupations in Garber are Food Preparation & Serving (21 | 5.9%), Cleaning & Maintenance (8 | 2.2%), Personal Care & Service (7 | 2.0%), and Healthcare Support (3 | 0.8%).
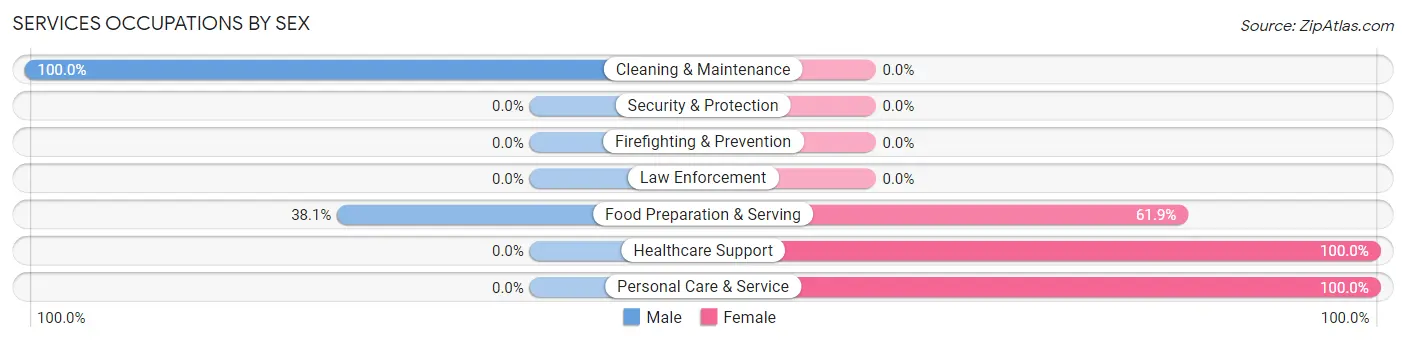
Services Occupations by Sex
Within the Services occupations in Garber, the most male-oriented occupations are Cleaning & Maintenance (100.0%), and Food Preparation & Serving (38.1%), while the most female-oriented occupations are Healthcare Support (100.0%), Personal Care & Service (100.0%), and Food Preparation & Serving (61.9%).
| Occupation | Male | Female |
| Healthcare Support | 0 (0.0%) | 3 (100.0%) |
| Security & Protection | 0 (0.0%) | 0 (0.0%) |
| Firefighting & Prevention | 0 (0.0%) | 0 (0.0%) |
| Law Enforcement | 0 (0.0%) | 0 (0.0%) |
| Food Preparation & Serving | 8 (38.1%) | 13 (61.9%) |
| Cleaning & Maintenance | 8 (100.0%) | 0 (0.0%) |
| Personal Care & Service | 0 (0.0%) | 7 (100.0%) |
| Total (Category) | 16 (41.0%) | 23 (59.0%) |
| Total (Overall) | 199 (55.7%) | 158 (44.3%) |
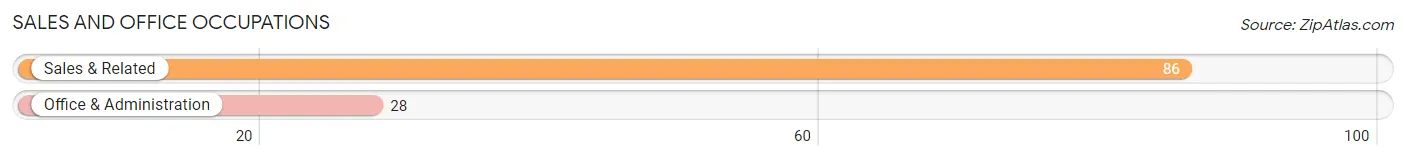
Sales and Office Occupations
The most common Sales and Office occupations in Garber are Sales & Related (86 | 24.1%), and Office & Administration (28 | 7.8%).
Sales and Office Occupations by Sex
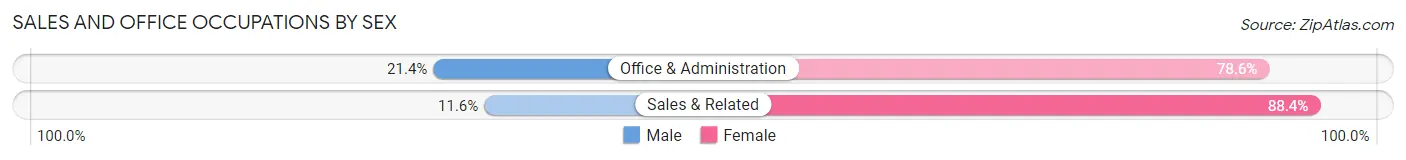
| Occupation | Male | Female |
| Sales & Related | 10 (11.6%) | 76 (88.4%) |
| Office & Administration | 6 (21.4%) | 22 (78.6%) |
| Total (Category) | 16 (14.0%) | 98 (86.0%) |
| Total (Overall) | 199 (55.7%) | 158 (44.3%) |
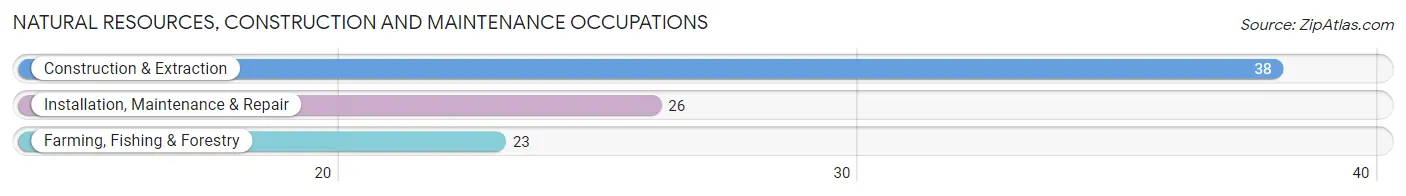
Natural Resources, Construction and Maintenance Occupations
The most common Natural Resources, Construction and Maintenance occupations in Garber are Construction & Extraction (38 | 10.6%), Installation, Maintenance & Repair (26 | 7.3%), and Farming, Fishing & Forestry (23 | 6.4%).
Natural Resources, Construction and Maintenance Occupations by Sex
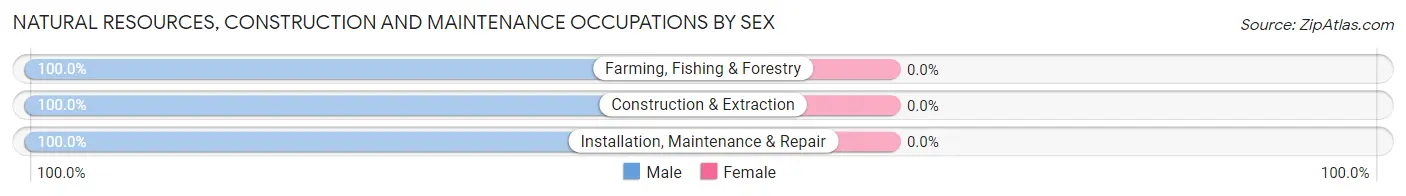
| Occupation | Male | Female |
| Farming, Fishing & Forestry | 23 (100.0%) | 0 (0.0%) |
| Construction & Extraction | 38 (100.0%) | 0 (0.0%) |
| Installation, Maintenance & Repair | 26 (100.0%) | 0 (0.0%) |
| Total (Category) | 87 (100.0%) | 0 (0.0%) |
| Total (Overall) | 199 (55.7%) | 158 (44.3%) |
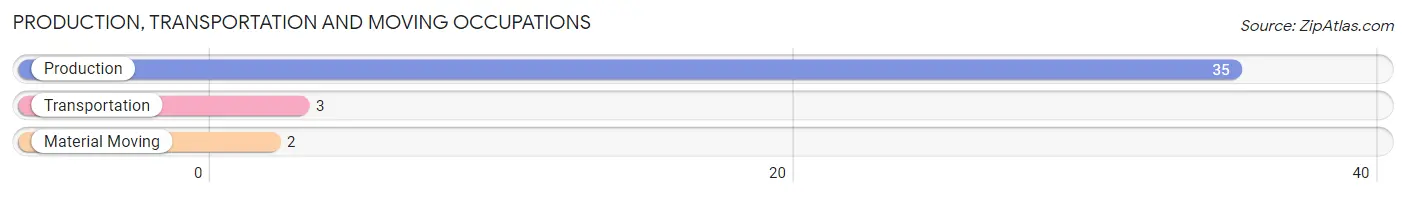
Production, Transportation and Moving Occupations
The most common Production, Transportation and Moving occupations in Garber are Production (35 | 9.8%), Transportation (3 | 0.8%), and Material Moving (2 | 0.6%).
Production, Transportation and Moving Occupations by Sex
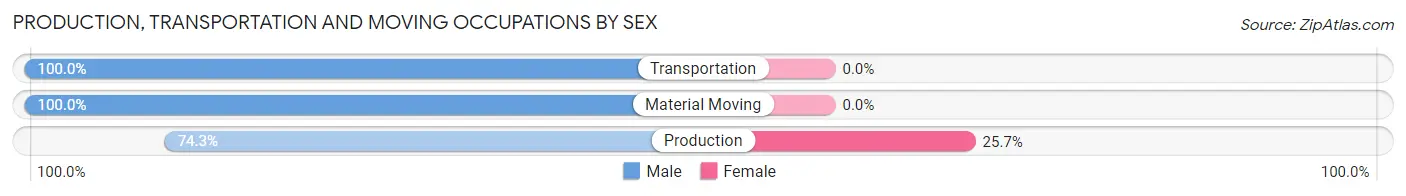
| Occupation | Male | Female |
| Production | 26 (74.3%) | 9 (25.7%) |
| Transportation | 3 (100.0%) | 0 (0.0%) |
| Material Moving | 2 (100.0%) | 0 (0.0%) |
| Total (Category) | 31 (77.5%) | 9 (22.5%) |
| Total (Overall) | 199 (55.7%) | 158 (44.3%) |
Employment Industries by Sex in Garber
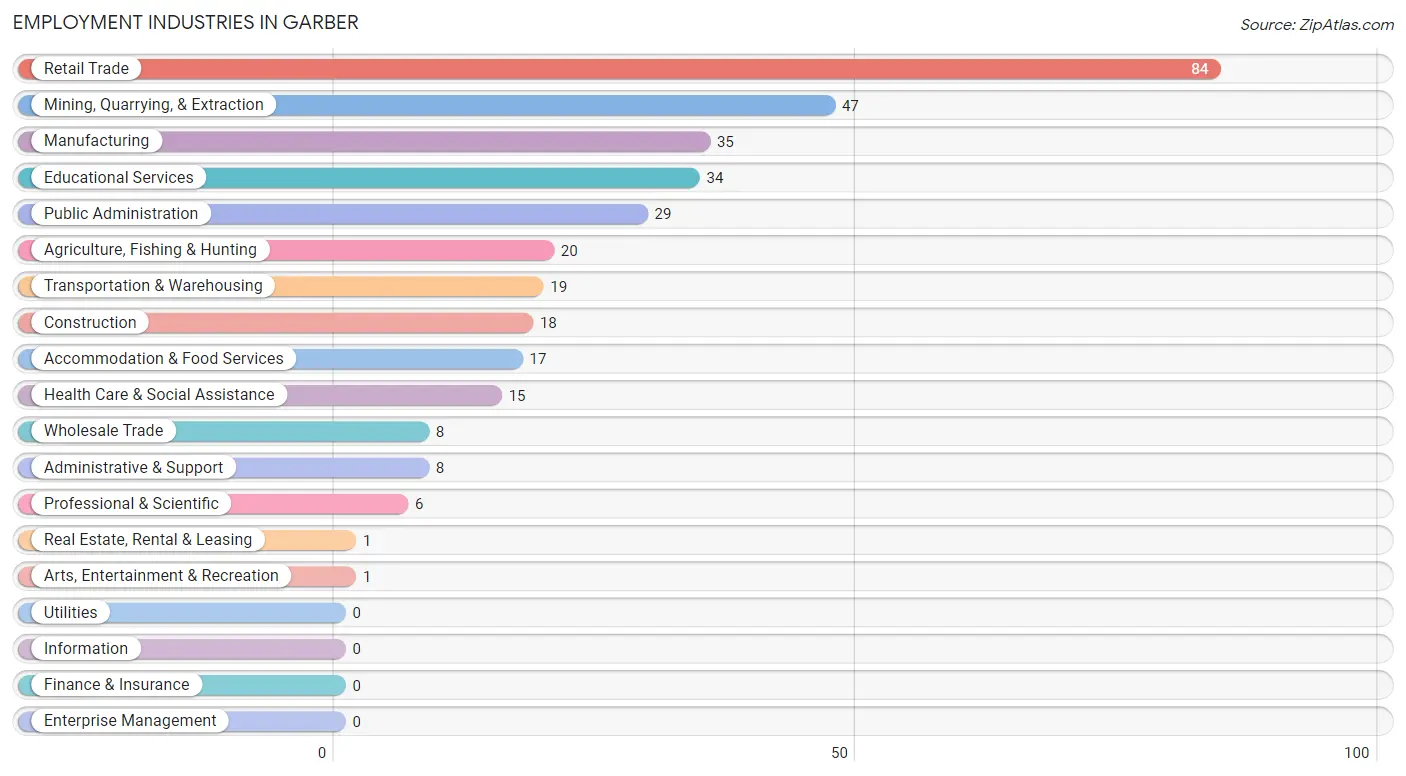
Employment Industries in Garber
The major employment industries in Garber include Retail Trade (84 | 23.5%), Mining, Quarrying, & Extraction (47 | 13.2%), Manufacturing (35 | 9.8%), Educational Services (34 | 9.5%), and Public Administration (29 | 8.1%).
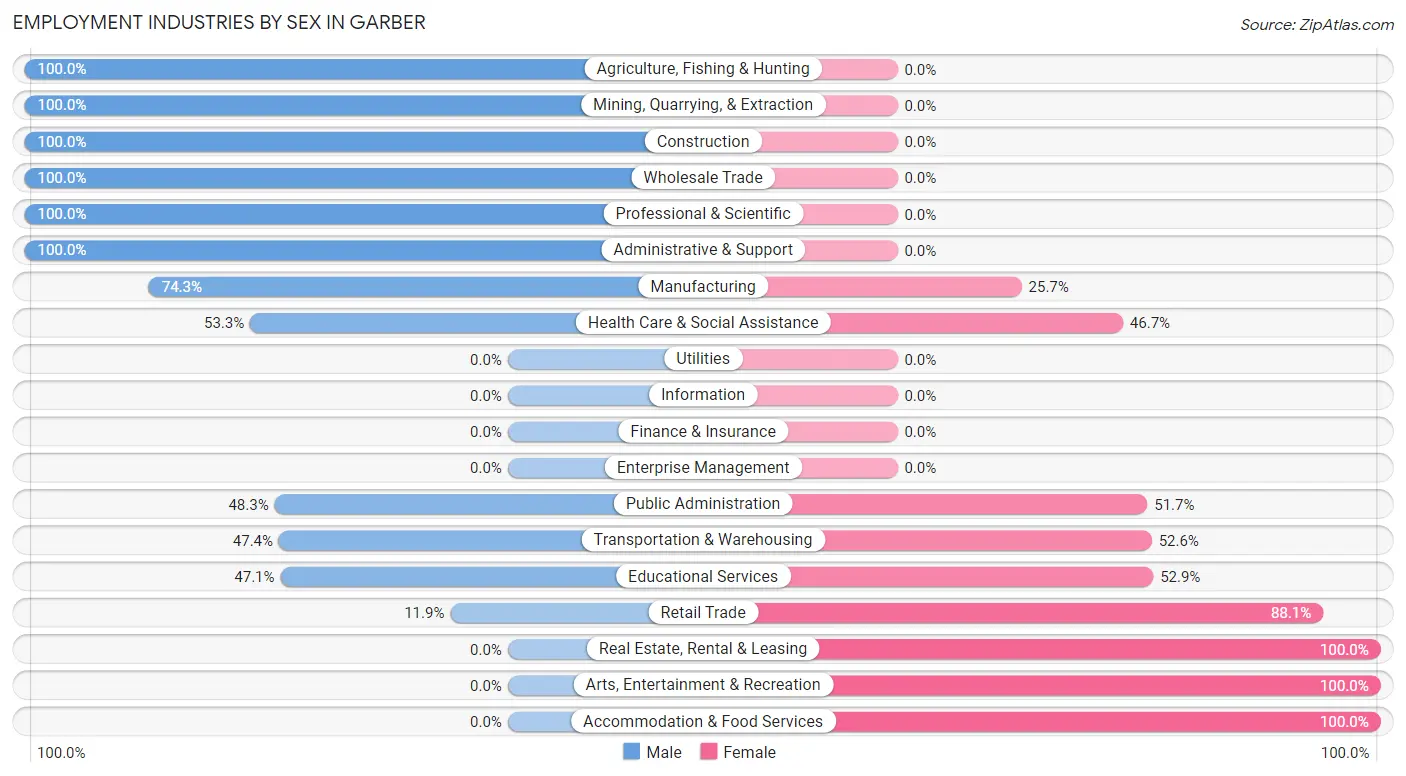
Employment Industries by Sex in Garber
The Garber industries that see more men than women are Agriculture, Fishing & Hunting (100.0%), Mining, Quarrying, & Extraction (100.0%), and Construction (100.0%), whereas the industries that tend to have a higher number of women are Real Estate, Rental & Leasing (100.0%), Arts, Entertainment & Recreation (100.0%), and Accommodation & Food Services (100.0%).
| Industry | Male | Female |
| Agriculture, Fishing & Hunting | 20 (100.0%) | 0 (0.0%) |
| Mining, Quarrying, & Extraction | 47 (100.0%) | 0 (0.0%) |
| Construction | 18 (100.0%) | 0 (0.0%) |
| Manufacturing | 26 (74.3%) | 9 (25.7%) |
| Wholesale Trade | 8 (100.0%) | 0 (0.0%) |
| Retail Trade | 10 (11.9%) | 74 (88.1%) |
| Transportation & Warehousing | 9 (47.4%) | 10 (52.6%) |
| Utilities | 0 (0.0%) | 0 (0.0%) |
| Information | 0 (0.0%) | 0 (0.0%) |
| Finance & Insurance | 0 (0.0%) | 0 (0.0%) |
| Real Estate, Rental & Leasing | 0 (0.0%) | 1 (100.0%) |
| Professional & Scientific | 6 (100.0%) | 0 (0.0%) |
| Enterprise Management | 0 (0.0%) | 0 (0.0%) |
| Administrative & Support | 8 (100.0%) | 0 (0.0%) |
| Educational Services | 16 (47.1%) | 18 (52.9%) |
| Health Care & Social Assistance | 8 (53.3%) | 7 (46.7%) |
| Arts, Entertainment & Recreation | 0 (0.0%) | 1 (100.0%) |
| Accommodation & Food Services | 0 (0.0%) | 17 (100.0%) |
| Public Administration | 14 (48.3%) | 15 (51.7%) |
| Total | 199 (55.7%) | 158 (44.3%) |
Education in Garber
School Enrollment in Garber
The most common levels of schooling among the 155 students in Garber are middle school (80 | 51.6%), high school (39 | 25.2%), and elementary school (21 | 13.6%).

| School Level | # Students | % Students |
| Nursery / Preschool | 0 | 0.0% |
| Kindergarten | 0 | 0.0% |
| Elementary School | 21 | 13.6% |
| Middle School | 80 | 51.6% |
| High School | 39 | 25.2% |
| College / Undergraduate | 8 | 5.2% |
| Graduate / Professional | 7 | 4.5% |
| Total | 155 | 100.0% |
School Enrollment by Age by Funding Source in Garber
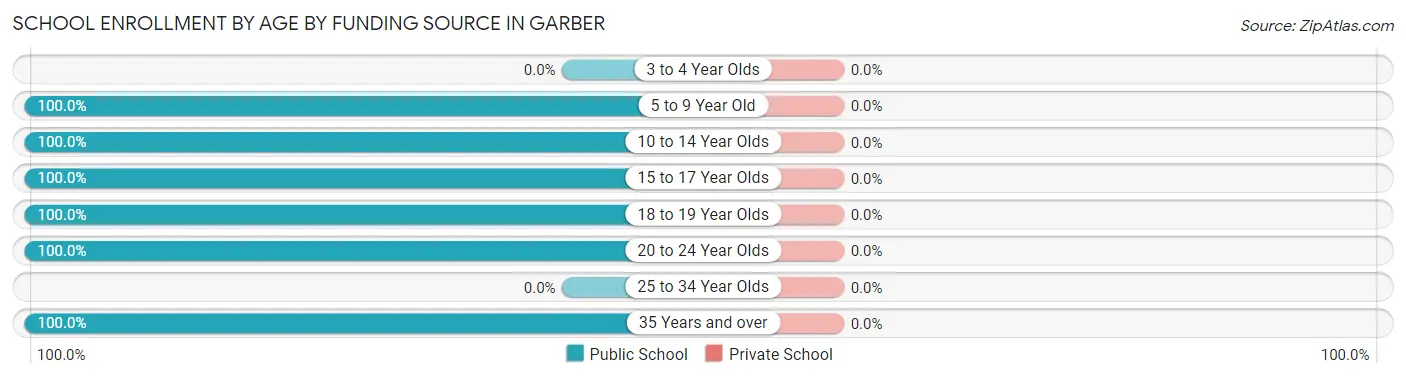
| Age Bracket | Public School | Private School |
| 3 to 4 Year Olds | 0 (0.0%) | 0 (0.0%) |
| 5 to 9 Year Old | 21 (100.0%) | 0 (0.0%) |
| 10 to 14 Year Olds | 80 (100.0%) | 0 (0.0%) |
| 15 to 17 Year Olds | 27 (100.0%) | 0 (0.0%) |
| 18 to 19 Year Olds | 3 (100.0%) | 0 (0.0%) |
| 20 to 24 Year Olds | 12 (100.0%) | 0 (0.0%) |
| 25 to 34 Year Olds | 0 (0.0%) | 0 (0.0%) |
| 35 Years and over | 12 (100.0%) | 0 (0.0%) |
| Total | 155 (100.0%) | 0 (0.0%) |
Educational Attainment by Field of Study in Garber
Liberal arts & history (38 | 39.2%), science & technology (16 | 16.5%), bio, nature & agricultural (11 | 11.3%), psychology (8 | 8.3%), and business (8 | 8.3%) are the most common fields of study among 97 individuals in Garber who have obtained a bachelor's degree or higher.
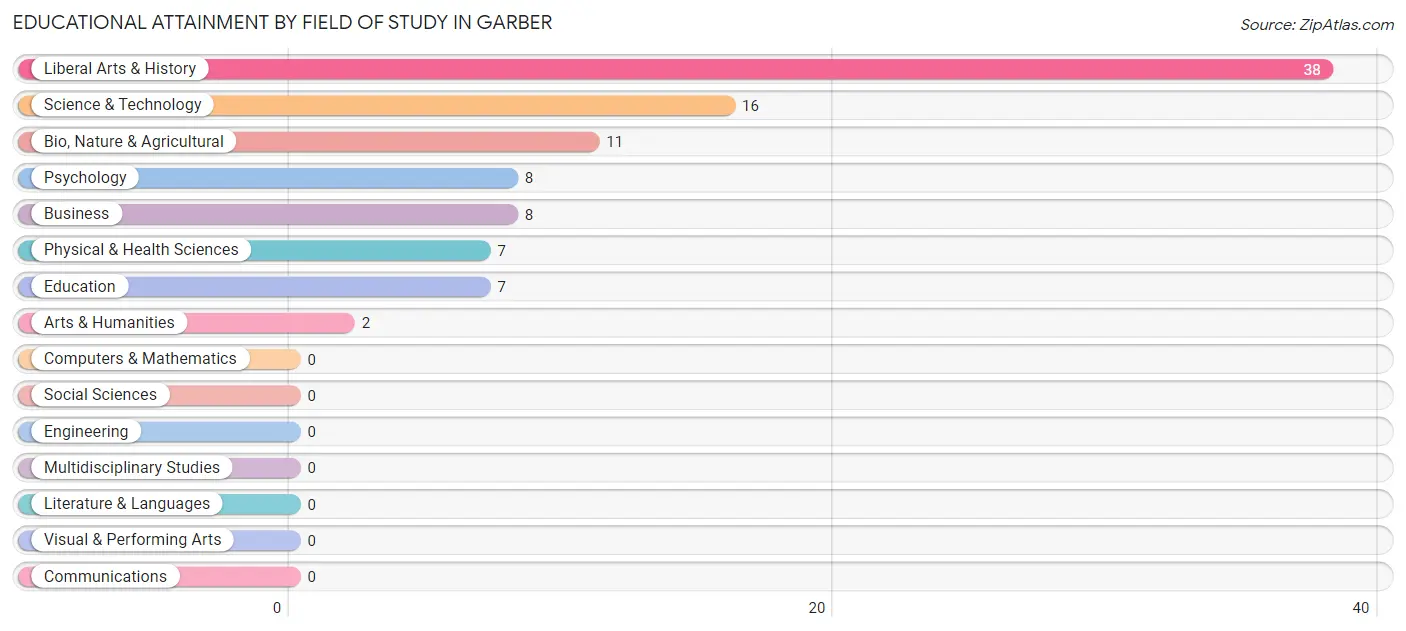
| Field of Study | # Graduates | % Graduates |
| Computers & Mathematics | 0 | 0.0% |
| Bio, Nature & Agricultural | 11 | 11.3% |
| Physical & Health Sciences | 7 | 7.2% |
| Psychology | 8 | 8.3% |
| Social Sciences | 0 | 0.0% |
| Engineering | 0 | 0.0% |
| Multidisciplinary Studies | 0 | 0.0% |
| Science & Technology | 16 | 16.5% |
| Business | 8 | 8.3% |
| Education | 7 | 7.2% |
| Literature & Languages | 0 | 0.0% |
| Liberal Arts & History | 38 | 39.2% |
| Visual & Performing Arts | 0 | 0.0% |
| Communications | 0 | 0.0% |
| Arts & Humanities | 2 | 2.1% |
| Total | 97 | 100.0% |
Transportation & Commute in Garber
Vehicle Availability by Sex in Garber
The most prevalent vehicle ownership categories in Garber are males with 2 vehicles (69, accounting for 38.1%) and females with 2 vehicles (35, making up 43.7%).
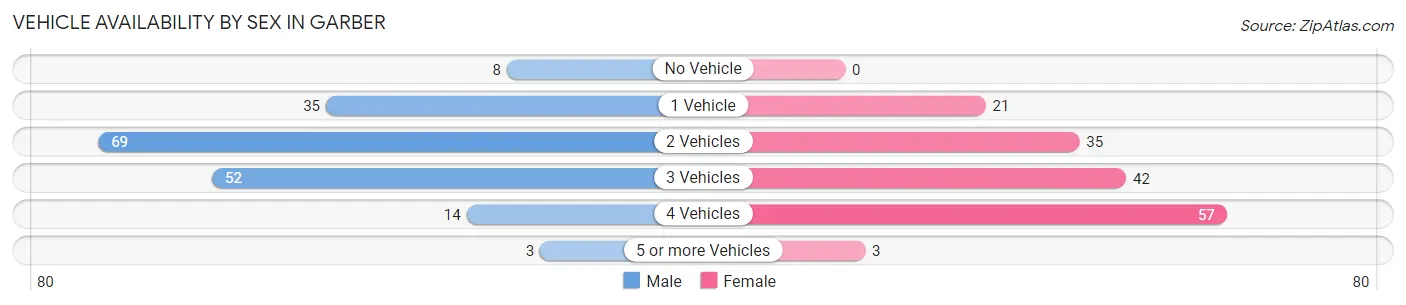
| Vehicles Available | Male | Female |
| No Vehicle | 8 (4.4%) | 0 (0.0%) |
| 1 Vehicle | 35 (19.3%) | 21 (13.3%) |
| 2 Vehicles | 69 (38.1%) | 35 (22.2%) |
| 3 Vehicles | 52 (28.7%) | 42 (26.6%) |
| 4 Vehicles | 14 (7.7%) | 57 (36.1%) |
| 5 or more Vehicles | 3 (1.7%) | 3 (1.9%) |
| Total | 181 (100.0%) | 158 (100.0%) |
Commute Time in Garber
The most frequently occuring commute durations in Garber are 30 to 34 minutes (91 commuters, 26.8%), less than 5 minutes (76 commuters, 22.4%), and 20 to 24 minutes (53 commuters, 15.6%).
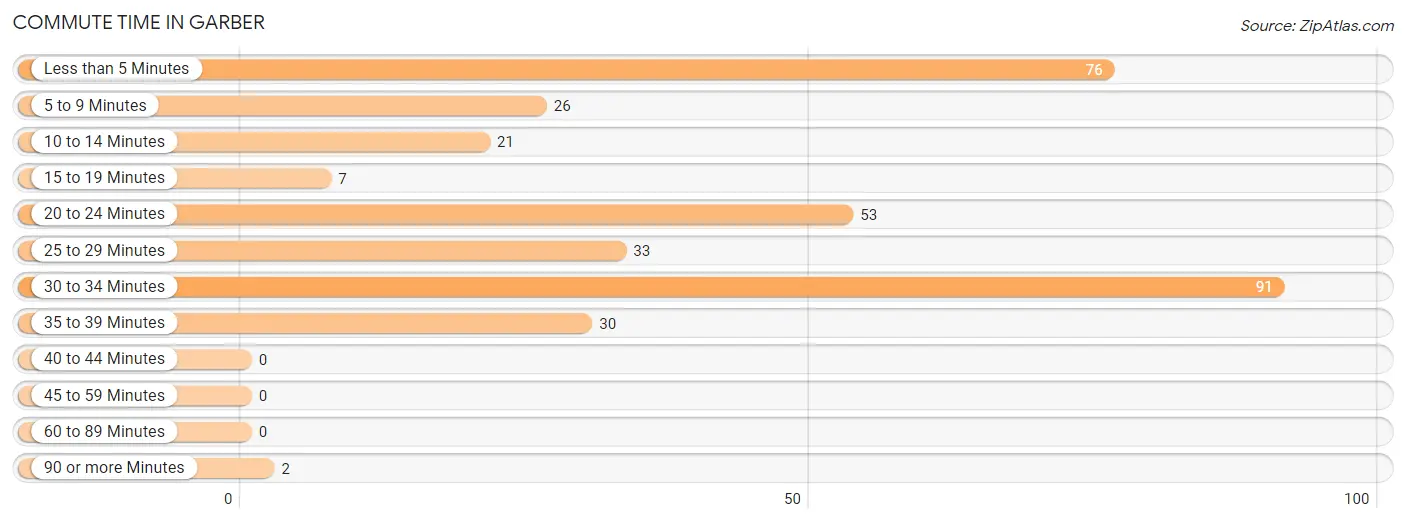
| Commute Time | # Commuters | % Commuters |
| Less than 5 Minutes | 76 | 22.4% |
| 5 to 9 Minutes | 26 | 7.7% |
| 10 to 14 Minutes | 21 | 6.2% |
| 15 to 19 Minutes | 7 | 2.1% |
| 20 to 24 Minutes | 53 | 15.6% |
| 25 to 29 Minutes | 33 | 9.7% |
| 30 to 34 Minutes | 91 | 26.8% |
| 35 to 39 Minutes | 30 | 8.8% |
| 40 to 44 Minutes | 0 | 0.0% |
| 45 to 59 Minutes | 0 | 0.0% |
| 60 to 89 Minutes | 0 | 0.0% |
| 90 or more Minutes | 2 | 0.6% |
Commute Time by Sex in Garber
The most common commute times in Garber are less than 5 minutes (41 commuters, 22.7%) for males and 30 to 34 minutes (57 commuters, 36.1%) for females.
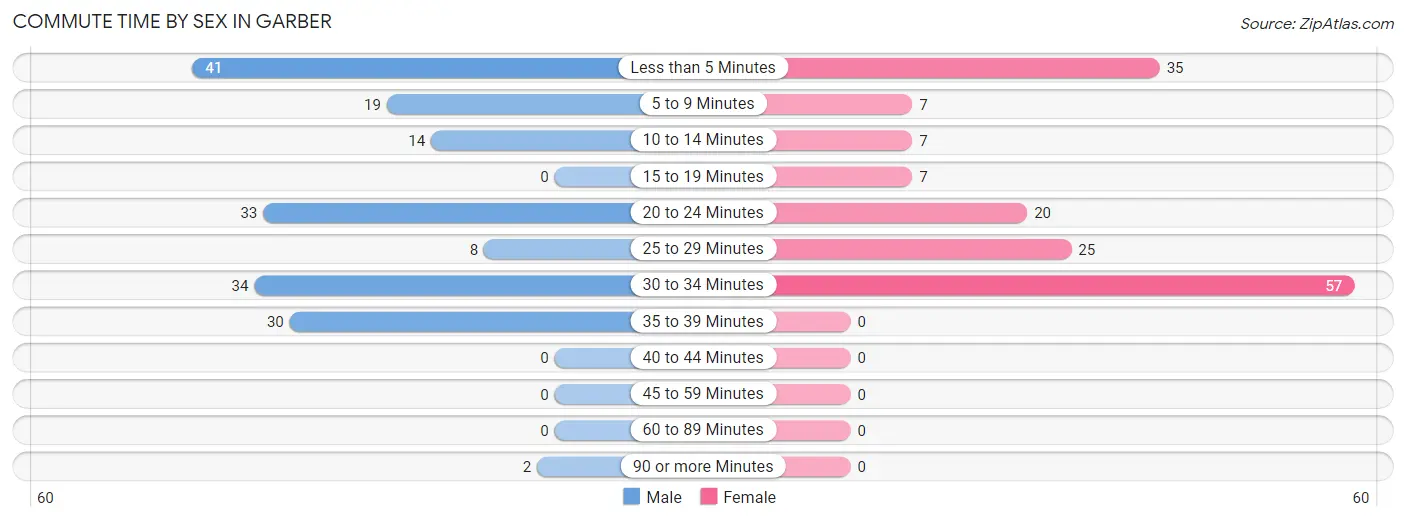
| Commute Time | Male | Female |
| Less than 5 Minutes | 41 (22.7%) | 35 (22.2%) |
| 5 to 9 Minutes | 19 (10.5%) | 7 (4.4%) |
| 10 to 14 Minutes | 14 (7.7%) | 7 (4.4%) |
| 15 to 19 Minutes | 0 (0.0%) | 7 (4.4%) |
| 20 to 24 Minutes | 33 (18.2%) | 20 (12.7%) |
| 25 to 29 Minutes | 8 (4.4%) | 25 (15.8%) |
| 30 to 34 Minutes | 34 (18.8%) | 57 (36.1%) |
| 35 to 39 Minutes | 30 (16.6%) | 0 (0.0%) |
| 40 to 44 Minutes | 0 (0.0%) | 0 (0.0%) |
| 45 to 59 Minutes | 0 (0.0%) | 0 (0.0%) |
| 60 to 89 Minutes | 0 (0.0%) | 0 (0.0%) |
| 90 or more Minutes | 2 (1.1%) | 0 (0.0%) |
Time of Departure to Work by Sex in Garber
The most frequent times of departure to work in Garber are 7:00 AM to 7:29 AM (47, 26.0%) for males and 9:00 AM to 9:59 AM (63, 39.9%) for females.
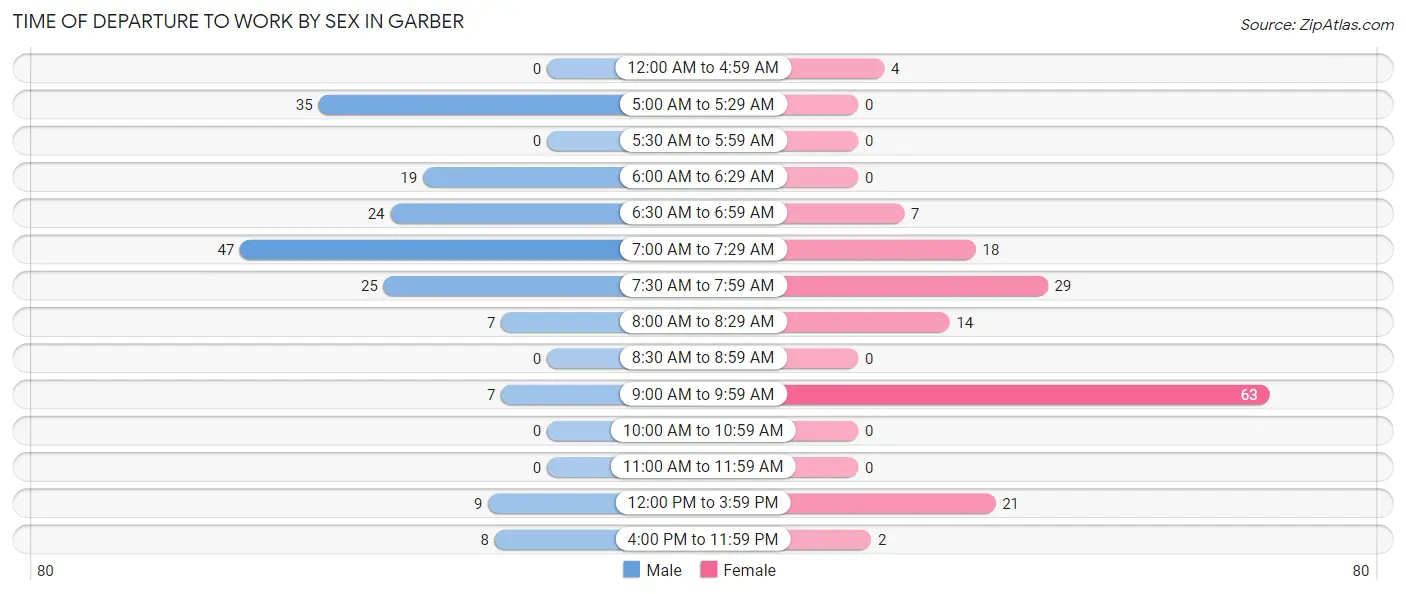
| Time of Departure | Male | Female |
| 12:00 AM to 4:59 AM | 0 (0.0%) | 4 (2.5%) |
| 5:00 AM to 5:29 AM | 35 (19.3%) | 0 (0.0%) |
| 5:30 AM to 5:59 AM | 0 (0.0%) | 0 (0.0%) |
| 6:00 AM to 6:29 AM | 19 (10.5%) | 0 (0.0%) |
| 6:30 AM to 6:59 AM | 24 (13.3%) | 7 (4.4%) |
| 7:00 AM to 7:29 AM | 47 (26.0%) | 18 (11.4%) |
| 7:30 AM to 7:59 AM | 25 (13.8%) | 29 (18.3%) |
| 8:00 AM to 8:29 AM | 7 (3.9%) | 14 (8.9%) |
| 8:30 AM to 8:59 AM | 0 (0.0%) | 0 (0.0%) |
| 9:00 AM to 9:59 AM | 7 (3.9%) | 63 (39.9%) |
| 10:00 AM to 10:59 AM | 0 (0.0%) | 0 (0.0%) |
| 11:00 AM to 11:59 AM | 0 (0.0%) | 0 (0.0%) |
| 12:00 PM to 3:59 PM | 9 (5.0%) | 21 (13.3%) |
| 4:00 PM to 11:59 PM | 8 (4.4%) | 2 (1.3%) |
| Total | 181 (100.0%) | 158 (100.0%) |
Housing Occupancy in Garber
Occupancy by Ownership in Garber
Of the total 256 dwellings in Garber, owner-occupied units account for 211 (82.4%), while renter-occupied units make up 45 (17.6%).
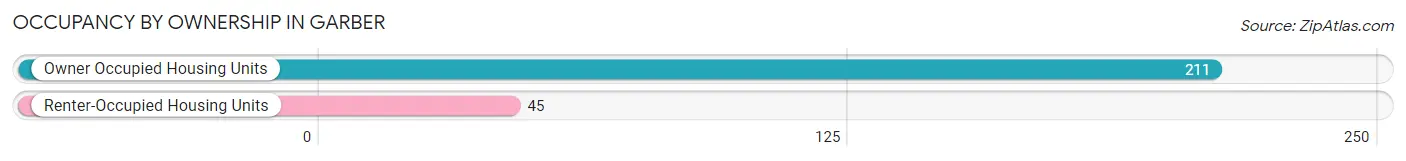
| Occupancy | # Housing Units | % Housing Units |
| Owner Occupied Housing Units | 211 | 82.4% |
| Renter-Occupied Housing Units | 45 | 17.6% |
| Total Occupied Housing Units | 256 | 100.0% |
Occupancy by Household Size in Garber
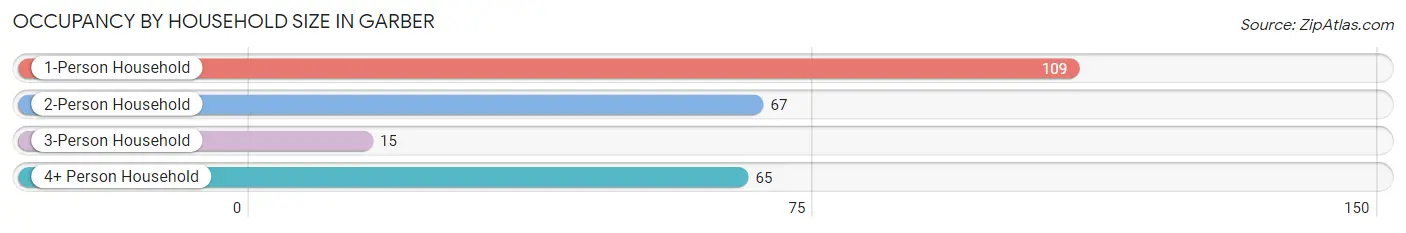
| Household Size | # Housing Units | % Housing Units |
| 1-Person Household | 109 | 42.6% |
| 2-Person Household | 67 | 26.2% |
| 3-Person Household | 15 | 5.9% |
| 4+ Person Household | 65 | 25.4% |
| Total Housing Units | 256 | 100.0% |
Occupancy by Ownership by Household Size in Garber
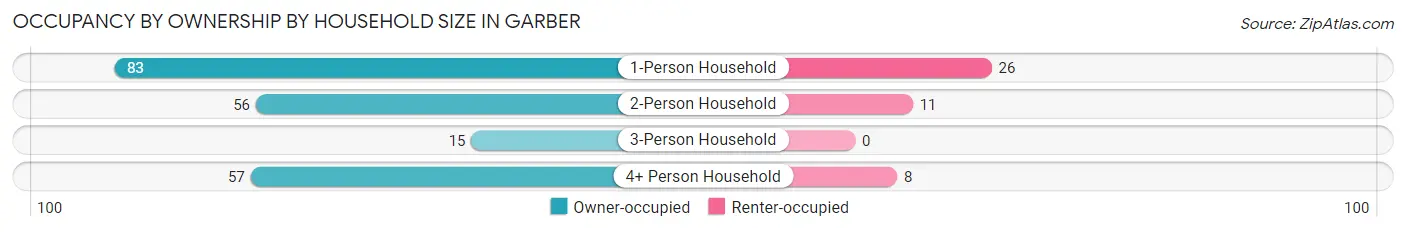
| Household Size | Owner-occupied | Renter-occupied |
| 1-Person Household | 83 (76.1%) | 26 (23.8%) |
| 2-Person Household | 56 (83.6%) | 11 (16.4%) |
| 3-Person Household | 15 (100.0%) | 0 (0.0%) |
| 4+ Person Household | 57 (87.7%) | 8 (12.3%) |
| Total Housing Units | 211 (82.4%) | 45 (17.6%) |
Occupancy by Educational Attainment in Garber
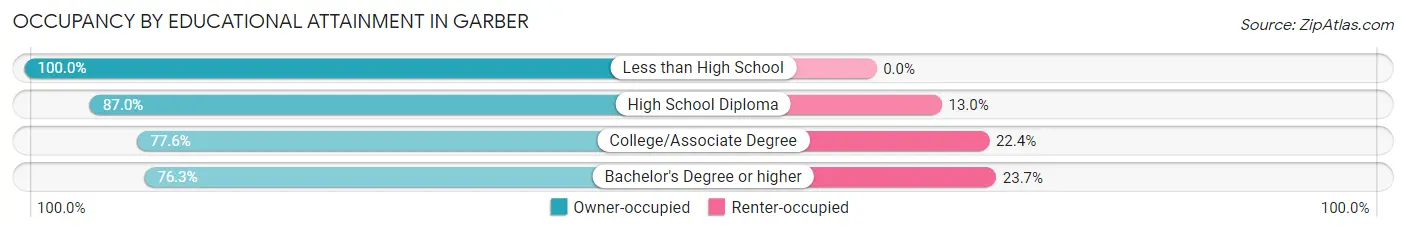
| Household Size | Owner-occupied | Renter-occupied |
| Less than High School | 13 (100.0%) | 0 (0.0%) |
| High School Diploma | 94 (87.0%) | 14 (13.0%) |
| College/Associate Degree | 59 (77.6%) | 17 (22.4%) |
| Bachelor's Degree or higher | 45 (76.3%) | 14 (23.7%) |
Occupancy by Age of Householder in Garber
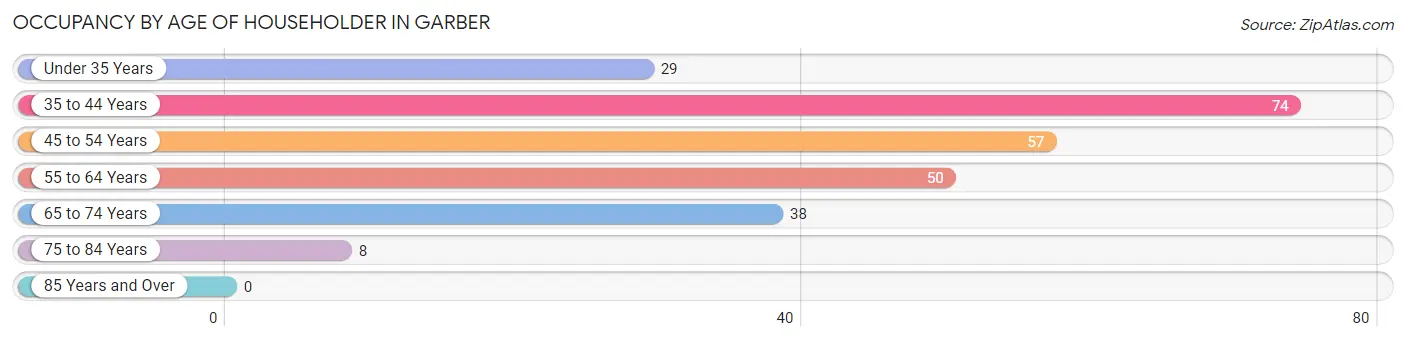
| Age Bracket | # Households | % Households |
| Under 35 Years | 29 | 11.3% |
| 35 to 44 Years | 74 | 28.9% |
| 45 to 54 Years | 57 | 22.3% |
| 55 to 64 Years | 50 | 19.5% |
| 65 to 74 Years | 38 | 14.8% |
| 75 to 84 Years | 8 | 3.1% |
| 85 Years and Over | 0 | 0.0% |
| Total | 256 | 100.0% |
Housing Finances in Garber
Median Income by Occupancy in Garber
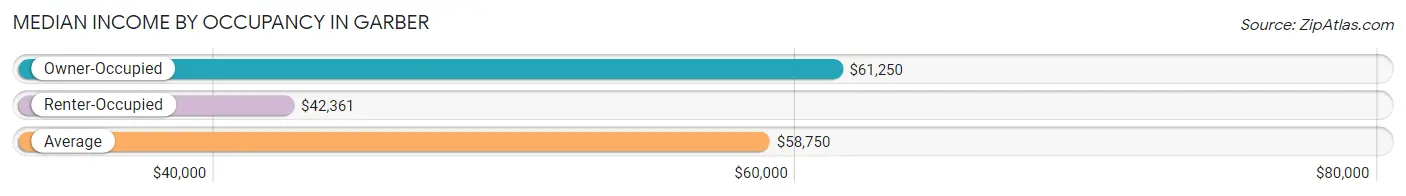
| Occupancy Type | # Households | Median Income |
| Owner-Occupied | 211 (82.4%) | $61,250 |
| Renter-Occupied | 45 (17.6%) | $42,361 |
| Average | 256 (100.0%) | $58,750 |
Occupancy by Householder Income Bracket in Garber
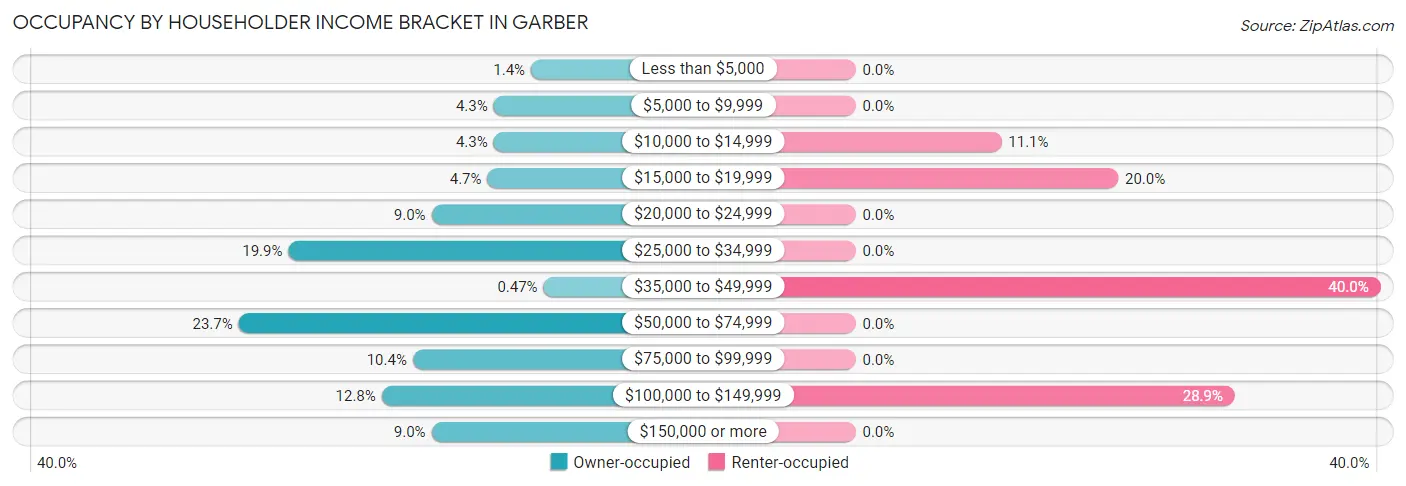
| Income Bracket | Owner-occupied | Renter-occupied |
| Less than $5,000 | 3 (1.4%) | 0 (0.0%) |
| $5,000 to $9,999 | 9 (4.3%) | 0 (0.0%) |
| $10,000 to $14,999 | 9 (4.3%) | 5 (11.1%) |
| $15,000 to $19,999 | 10 (4.7%) | 9 (20.0%) |
| $20,000 to $24,999 | 19 (9.0%) | 0 (0.0%) |
| $25,000 to $34,999 | 42 (19.9%) | 0 (0.0%) |
| $35,000 to $49,999 | 1 (0.5%) | 18 (40.0%) |
| $50,000 to $74,999 | 50 (23.7%) | 0 (0.0%) |
| $75,000 to $99,999 | 22 (10.4%) | 0 (0.0%) |
| $100,000 to $149,999 | 27 (12.8%) | 13 (28.9%) |
| $150,000 or more | 19 (9.0%) | 0 (0.0%) |
| Total | 211 (100.0%) | 45 (100.0%) |
Monthly Housing Cost Tiers in Garber
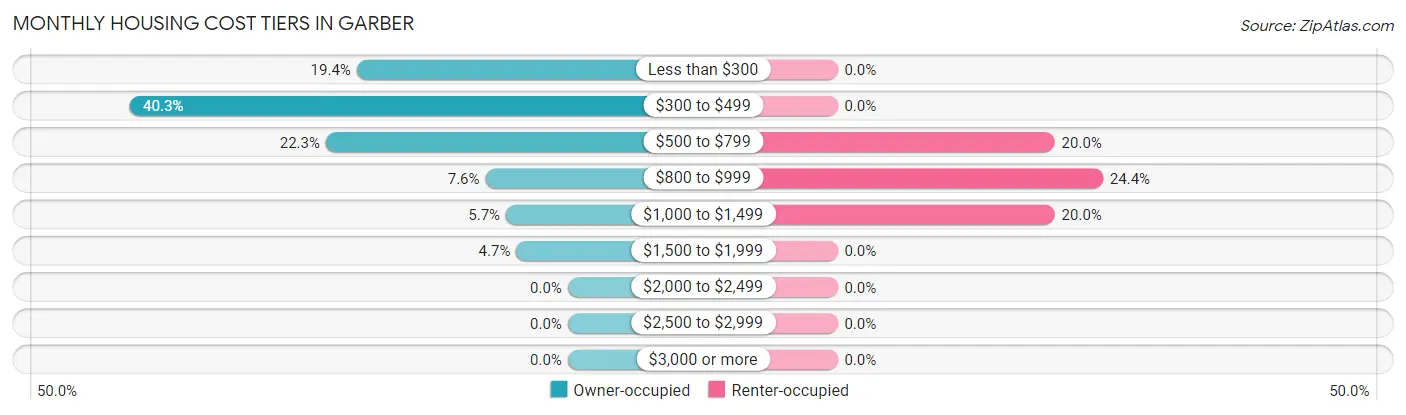
| Monthly Cost | Owner-occupied | Renter-occupied |
| Less than $300 | 41 (19.4%) | 0 (0.0%) |
| $300 to $499 | 85 (40.3%) | 0 (0.0%) |
| $500 to $799 | 47 (22.3%) | 9 (20.0%) |
| $800 to $999 | 16 (7.6%) | 11 (24.4%) |
| $1,000 to $1,499 | 12 (5.7%) | 9 (20.0%) |
| $1,500 to $1,999 | 10 (4.7%) | 0 (0.0%) |
| $2,000 to $2,499 | 0 (0.0%) | 0 (0.0%) |
| $2,500 to $2,999 | 0 (0.0%) | 0 (0.0%) |
| $3,000 or more | 0 (0.0%) | 0 (0.0%) |
| Total | 211 (100.0%) | 45 (100.0%) |
Physical Housing Characteristics in Garber
Housing Structures in Garber
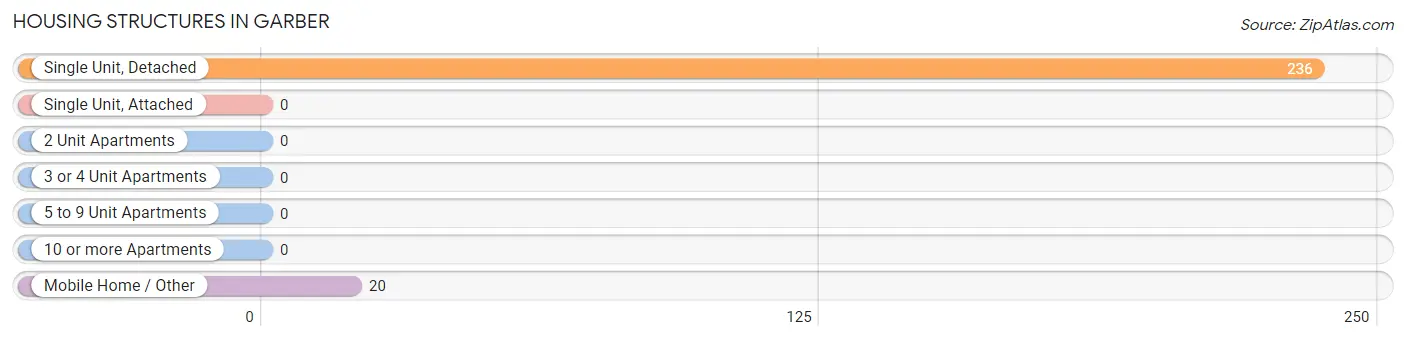
| Structure Type | # Housing Units | % Housing Units |
| Single Unit, Detached | 236 | 92.2% |
| Single Unit, Attached | 0 | 0.0% |
| 2 Unit Apartments | 0 | 0.0% |
| 3 or 4 Unit Apartments | 0 | 0.0% |
| 5 to 9 Unit Apartments | 0 | 0.0% |
| 10 or more Apartments | 0 | 0.0% |
| Mobile Home / Other | 20 | 7.8% |
| Total | 256 | 100.0% |
Housing Structures by Occupancy in Garber
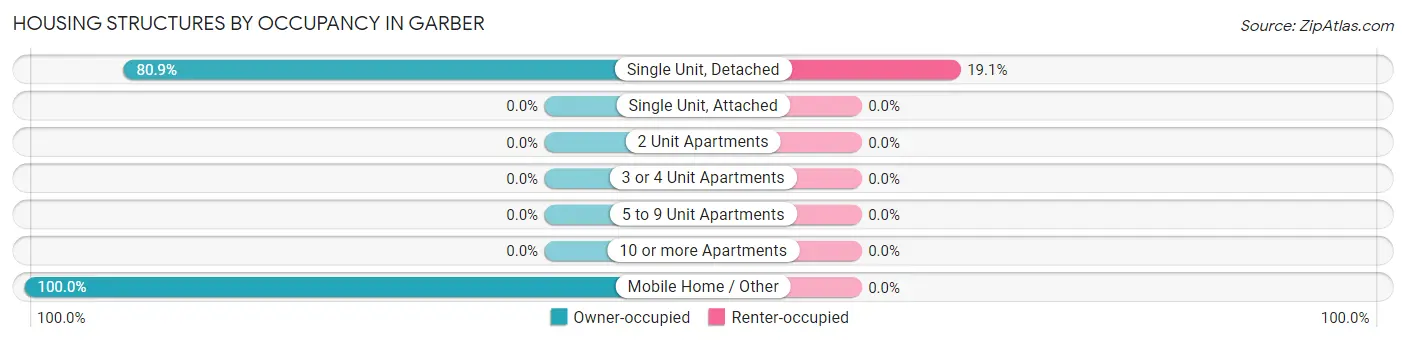
| Structure Type | Owner-occupied | Renter-occupied |
| Single Unit, Detached | 191 (80.9%) | 45 (19.1%) |
| Single Unit, Attached | 0 (0.0%) | 0 (0.0%) |
| 2 Unit Apartments | 0 (0.0%) | 0 (0.0%) |
| 3 or 4 Unit Apartments | 0 (0.0%) | 0 (0.0%) |
| 5 to 9 Unit Apartments | 0 (0.0%) | 0 (0.0%) |
| 10 or more Apartments | 0 (0.0%) | 0 (0.0%) |
| Mobile Home / Other | 20 (100.0%) | 0 (0.0%) |
| Total | 211 (82.4%) | 45 (17.6%) |
Housing Structures by Number of Rooms in Garber
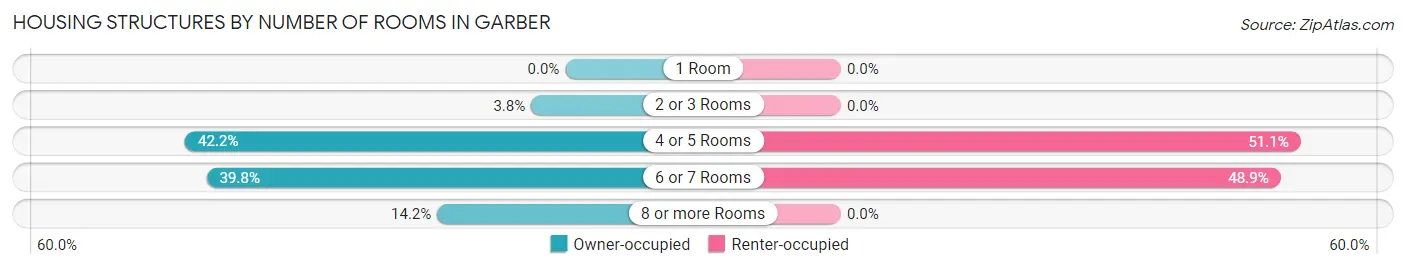
| Number of Rooms | Owner-occupied | Renter-occupied |
| 1 Room | 0 (0.0%) | 0 (0.0%) |
| 2 or 3 Rooms | 8 (3.8%) | 0 (0.0%) |
| 4 or 5 Rooms | 89 (42.2%) | 23 (51.1%) |
| 6 or 7 Rooms | 84 (39.8%) | 22 (48.9%) |
| 8 or more Rooms | 30 (14.2%) | 0 (0.0%) |
| Total | 211 (100.0%) | 45 (100.0%) |
Housing Structure by Heating Type in Garber
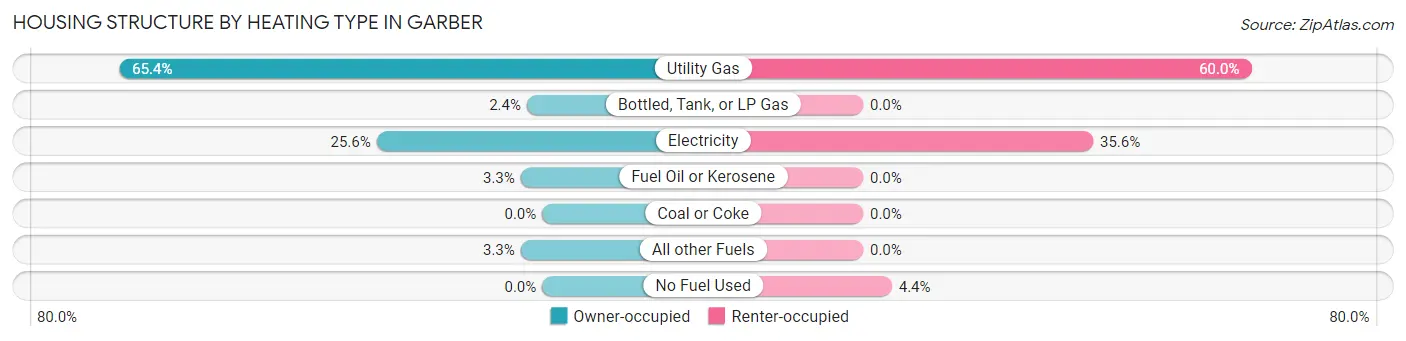
| Heating Type | Owner-occupied | Renter-occupied |
| Utility Gas | 138 (65.4%) | 27 (60.0%) |
| Bottled, Tank, or LP Gas | 5 (2.4%) | 0 (0.0%) |
| Electricity | 54 (25.6%) | 16 (35.6%) |
| Fuel Oil or Kerosene | 7 (3.3%) | 0 (0.0%) |
| Coal or Coke | 0 (0.0%) | 0 (0.0%) |
| All other Fuels | 7 (3.3%) | 0 (0.0%) |
| No Fuel Used | 0 (0.0%) | 2 (4.4%) |
| Total | 211 (100.0%) | 45 (100.0%) |
Household Vehicle Usage in Garber
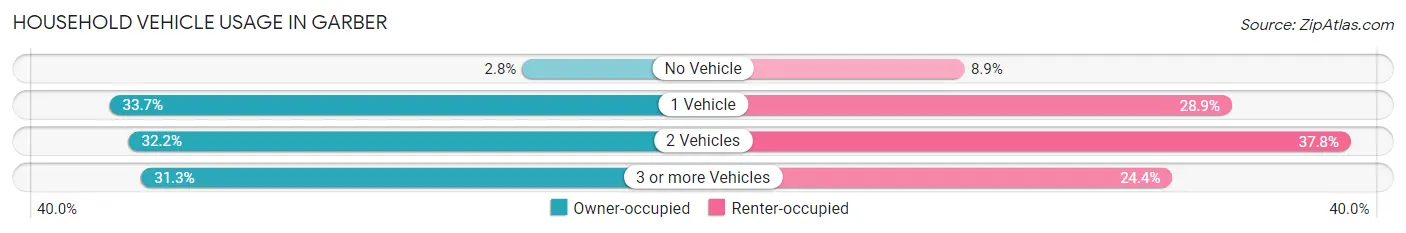
| Vehicles per Household | Owner-occupied | Renter-occupied |
| No Vehicle | 6 (2.8%) | 4 (8.9%) |
| 1 Vehicle | 71 (33.7%) | 13 (28.9%) |
| 2 Vehicles | 68 (32.2%) | 17 (37.8%) |
| 3 or more Vehicles | 66 (31.3%) | 11 (24.4%) |
| Total | 211 (100.0%) | 45 (100.0%) |
Real Estate & Mortgages in Garber
Real Estate and Mortgage Overview in Garber
| Characteristic | Without Mortgage | With Mortgage |
| Housing Units | 158 | 53 |
| Median Property Value | $70,000 | $96,400 |
| Median Household Income | $60,441 | $3 |
| Monthly Housing Costs | $367 | $0 |
| Real Estate Taxes | $322 | $0 |
Property Value by Mortgage Status in Garber
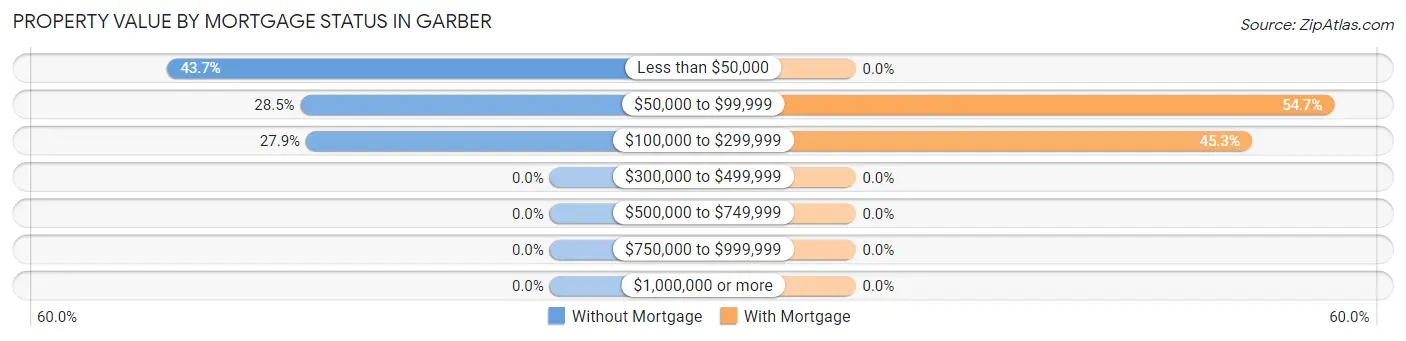
| Property Value | Without Mortgage | With Mortgage |
| Less than $50,000 | 69 (43.7%) | 0 (0.0%) |
| $50,000 to $99,999 | 45 (28.5%) | 29 (54.7%) |
| $100,000 to $299,999 | 44 (27.9%) | 24 (45.3%) |
| $300,000 to $499,999 | 0 (0.0%) | 0 (0.0%) |
| $500,000 to $749,999 | 0 (0.0%) | 0 (0.0%) |
| $750,000 to $999,999 | 0 (0.0%) | 0 (0.0%) |
| $1,000,000 or more | 0 (0.0%) | 0 (0.0%) |
| Total | 158 (100.0%) | 53 (100.0%) |
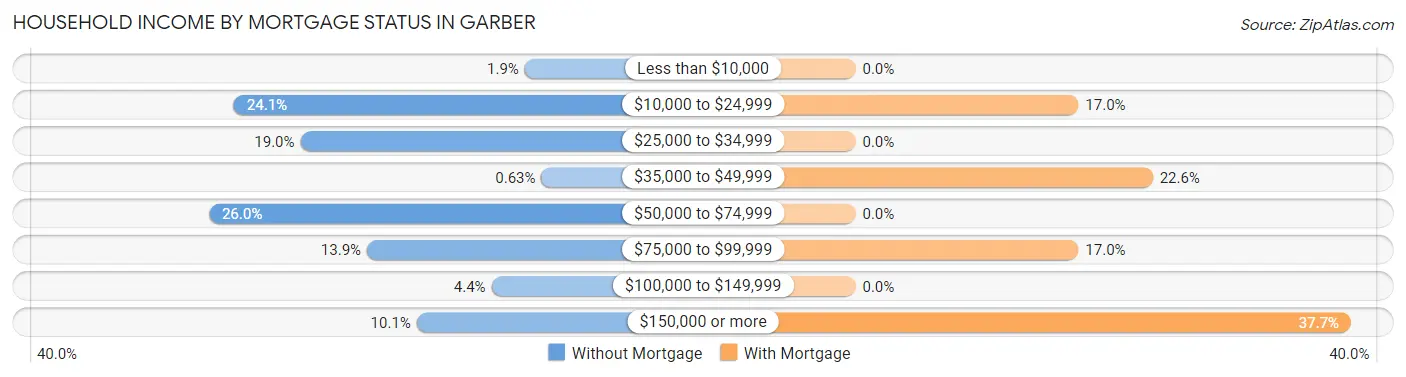
Household Income by Mortgage Status in Garber
| Household Income | Without Mortgage | With Mortgage |
| Less than $10,000 | 3 (1.9%) | 0 (0.0%) |
| $10,000 to $24,999 | 38 (24.0%) | 9 (17.0%) |
| $25,000 to $34,999 | 30 (19.0%) | 0 (0.0%) |
| $35,000 to $49,999 | 1 (0.6%) | 12 (22.6%) |
| $50,000 to $74,999 | 41 (26.0%) | 0 (0.0%) |
| $75,000 to $99,999 | 22 (13.9%) | 9 (17.0%) |
| $100,000 to $149,999 | 7 (4.4%) | 0 (0.0%) |
| $150,000 or more | 16 (10.1%) | 20 (37.7%) |
| Total | 158 (100.0%) | 53 (100.0%) |
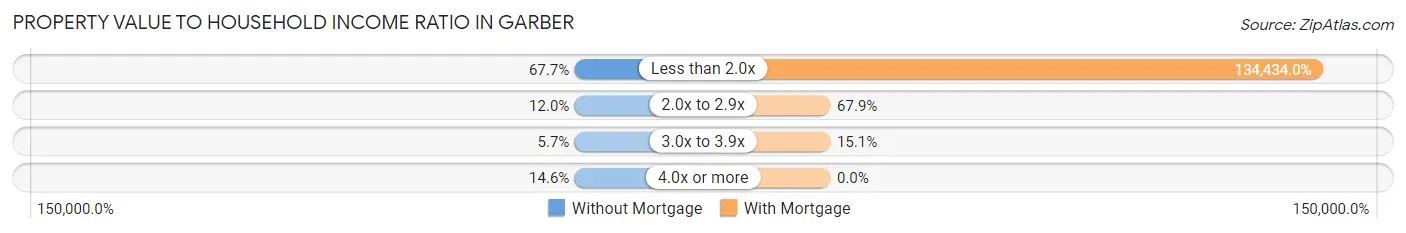
Property Value to Household Income Ratio in Garber
| Value-to-Income Ratio | Without Mortgage | With Mortgage |
| Less than 2.0x | 107 (67.7%) | 71,250 (134,434.0%) |
| 2.0x to 2.9x | 19 (12.0%) | 36 (67.9%) |
| 3.0x to 3.9x | 9 (5.7%) | 8 (15.1%) |
| 4.0x or more | 23 (14.6%) | 0 (0.0%) |
| Total | 158 (100.0%) | 53 (100.0%) |
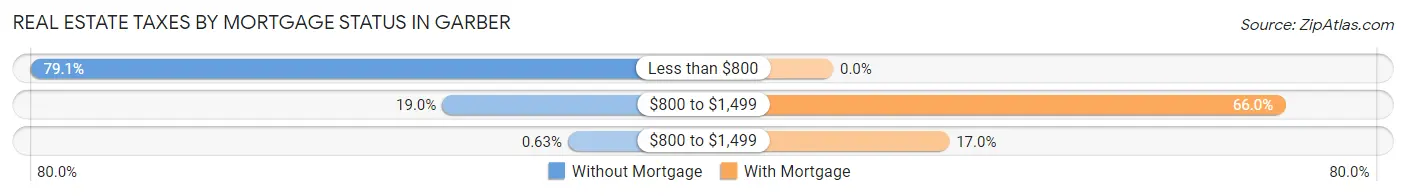
Real Estate Taxes by Mortgage Status in Garber
| Property Taxes | Without Mortgage | With Mortgage |
| Less than $800 | 125 (79.1%) | 0 (0.0%) |
| $800 to $1,499 | 30 (19.0%) | 35 (66.0%) |
| $800 to $1,499 | 1 (0.6%) | 9 (17.0%) |
| Total | 158 (100.0%) | 53 (100.0%) |
Health & Disability in Garber
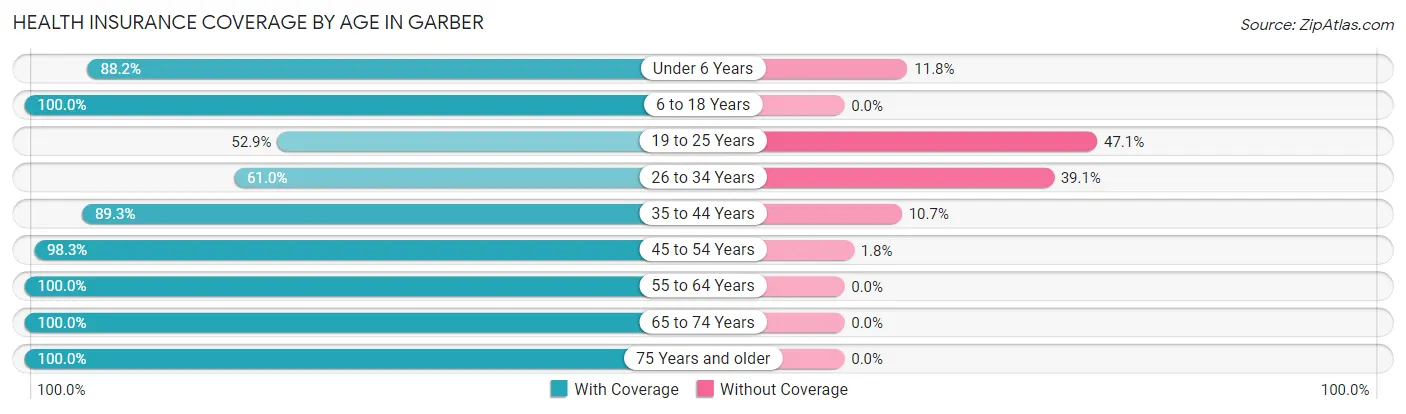
Health Insurance Coverage by Age in Garber
| Age Bracket | With Coverage | Without Coverage |
| Under 6 Years | 15 (88.2%) | 2 (11.8%) |
| 6 to 18 Years | 131 (100.0%) | 0 (0.0%) |
| 19 to 25 Years | 37 (52.9%) | 33 (47.1%) |
| 26 to 34 Years | 64 (61.0%) | 41 (39.1%) |
| 35 to 44 Years | 75 (89.3%) | 9 (10.7%) |
| 45 to 54 Years | 112 (98.3%) | 2 (1.8%) |
| 55 to 64 Years | 73 (100.0%) | 0 (0.0%) |
| 65 to 74 Years | 53 (100.0%) | 0 (0.0%) |
| 75 Years and older | 17 (100.0%) | 0 (0.0%) |
| Total | 577 (86.9%) | 87 (13.1%) |
Health Insurance Coverage by Citizenship Status in Garber
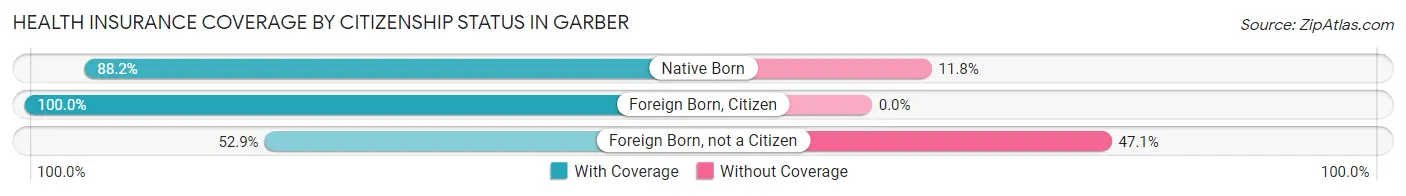
| Citizenship Status | With Coverage | Without Coverage |
| Native Born | 15 (88.2%) | 2 (11.8%) |
| Foreign Born, Citizen | 131 (100.0%) | 0 (0.0%) |
| Foreign Born, not a Citizen | 37 (52.9%) | 33 (47.1%) |
Health Insurance Coverage by Household Income in Garber
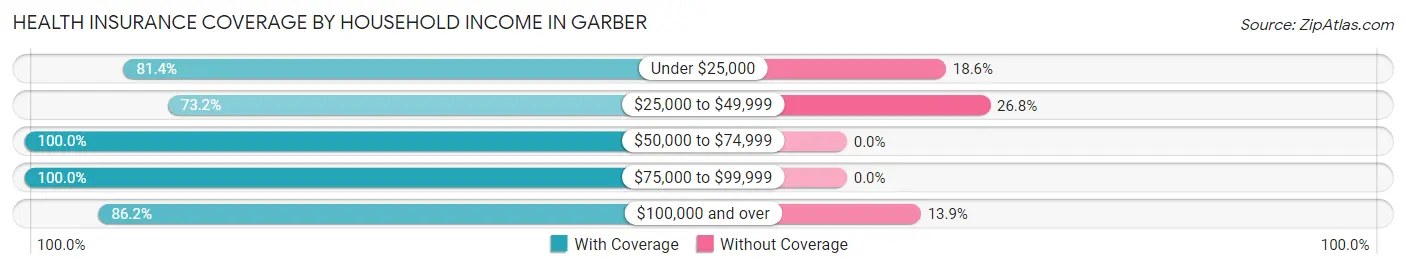
| Household Income | With Coverage | Without Coverage |
| Under $25,000 | 79 (81.4%) | 18 (18.6%) |
| $25,000 to $49,999 | 90 (73.2%) | 33 (26.8%) |
| $50,000 to $74,999 | 114 (100.0%) | 0 (0.0%) |
| $75,000 to $99,999 | 70 (100.0%) | 0 (0.0%) |
| $100,000 and over | 224 (86.2%) | 36 (13.9%) |
Public vs Private Health Insurance Coverage by Age in Garber
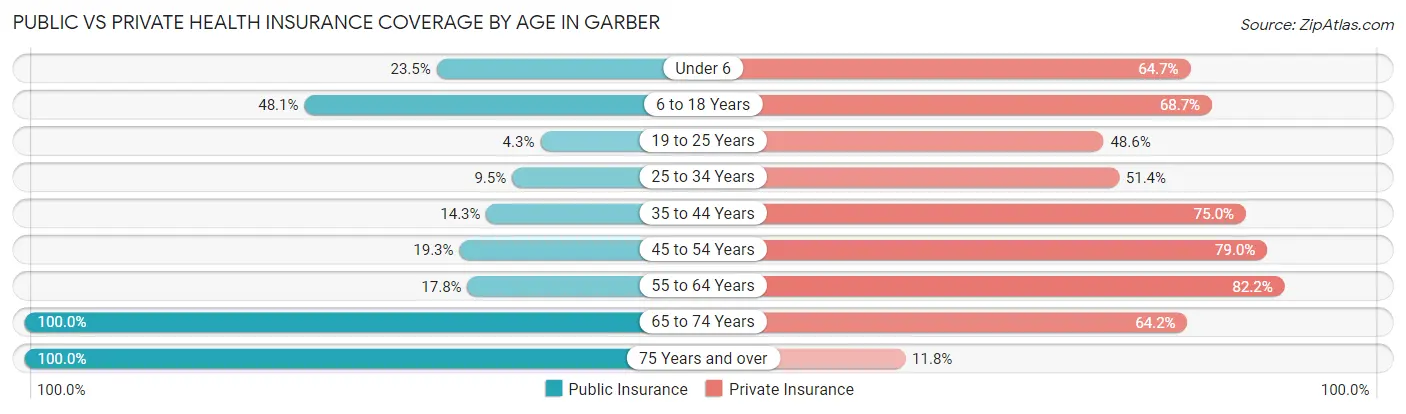
| Age Bracket | Public Insurance | Private Insurance |
| Under 6 | 4 (23.5%) | 11 (64.7%) |
| 6 to 18 Years | 63 (48.1%) | 90 (68.7%) |
| 19 to 25 Years | 3 (4.3%) | 34 (48.6%) |
| 25 to 34 Years | 10 (9.5%) | 54 (51.4%) |
| 35 to 44 Years | 12 (14.3%) | 63 (75.0%) |
| 45 to 54 Years | 22 (19.3%) | 90 (78.9%) |
| 55 to 64 Years | 13 (17.8%) | 60 (82.2%) |
| 65 to 74 Years | 53 (100.0%) | 34 (64.1%) |
| 75 Years and over | 17 (100.0%) | 2 (11.8%) |
| Total | 197 (29.7%) | 438 (66.0%) |
Disability Status by Sex by Age in Garber
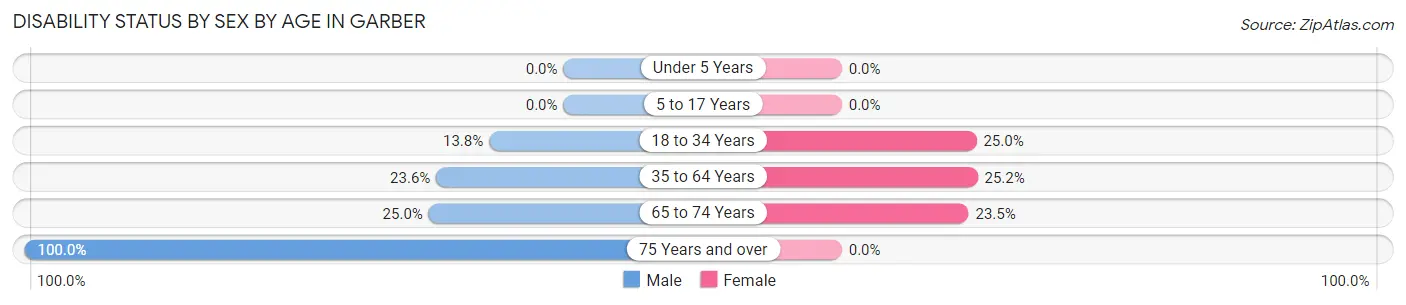
| Age Bracket | Male | Female |
| Under 5 Years | 0 (0.0%) | 0 (0.0%) |
| 5 to 17 Years | 0 (0.0%) | 0 (0.0%) |
| 18 to 34 Years | 8 (13.8%) | 30 (25.0%) |
| 35 to 64 Years | 34 (23.6%) | 32 (25.2%) |
| 65 to 74 Years | 9 (25.0%) | 4 (23.5%) |
| 75 Years and over | 7 (100.0%) | 0 (0.0%) |
Disability Class by Sex by Age in Garber
Disability Class: Hearing Difficulty
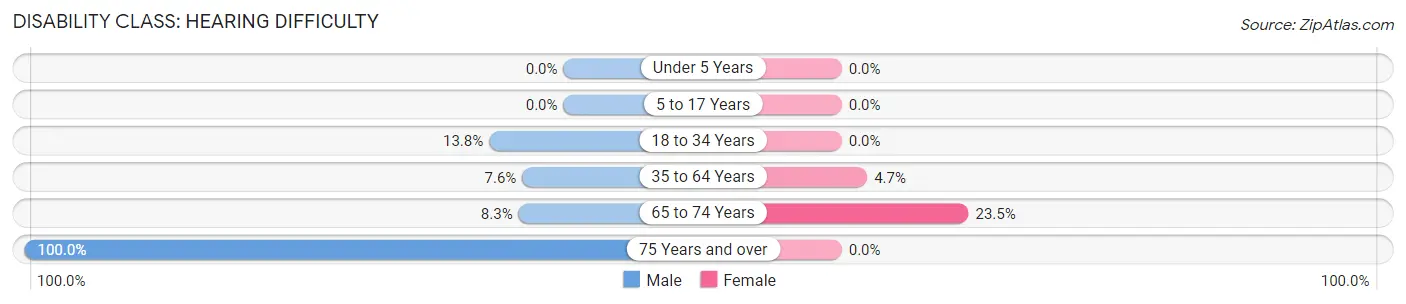
| Age Bracket | Male | Female |
| Under 5 Years | 0 (0.0%) | 0 (0.0%) |
| 5 to 17 Years | 0 (0.0%) | 0 (0.0%) |
| 18 to 34 Years | 8 (13.8%) | 0 (0.0%) |
| 35 to 64 Years | 11 (7.6%) | 6 (4.7%) |
| 65 to 74 Years | 3 (8.3%) | 4 (23.5%) |
| 75 Years and over | 7 (100.0%) | 0 (0.0%) |
Disability Class: Vision Difficulty
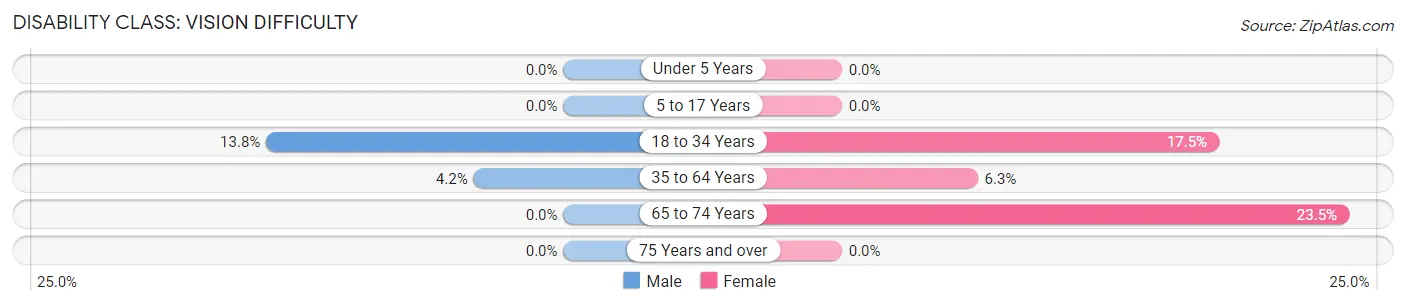
| Age Bracket | Male | Female |
| Under 5 Years | 0 (0.0%) | 0 (0.0%) |
| 5 to 17 Years | 0 (0.0%) | 0 (0.0%) |
| 18 to 34 Years | 8 (13.8%) | 21 (17.5%) |
| 35 to 64 Years | 6 (4.2%) | 8 (6.3%) |
| 65 to 74 Years | 0 (0.0%) | 4 (23.5%) |
| 75 Years and over | 0 (0.0%) | 0 (0.0%) |
Disability Class: Cognitive Difficulty
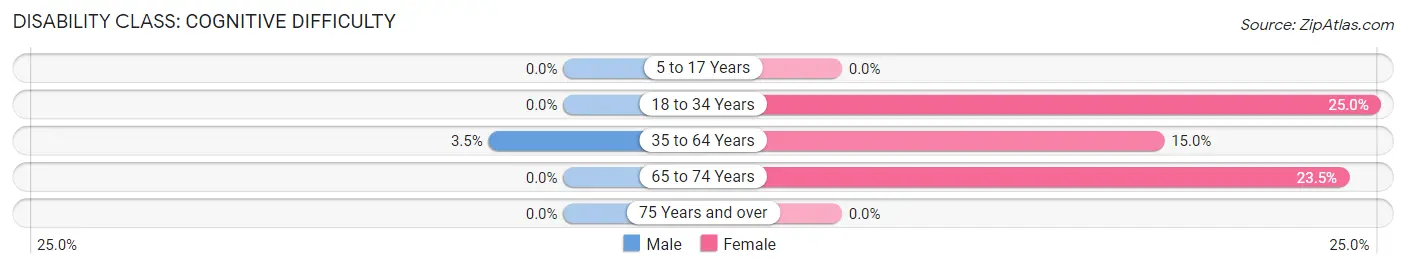
| Age Bracket | Male | Female |
| 5 to 17 Years | 0 (0.0%) | 0 (0.0%) |
| 18 to 34 Years | 0 (0.0%) | 30 (25.0%) |
| 35 to 64 Years | 5 (3.5%) | 19 (15.0%) |
| 65 to 74 Years | 0 (0.0%) | 4 (23.5%) |
| 75 Years and over | 0 (0.0%) | 0 (0.0%) |
Disability Class: Ambulatory Difficulty
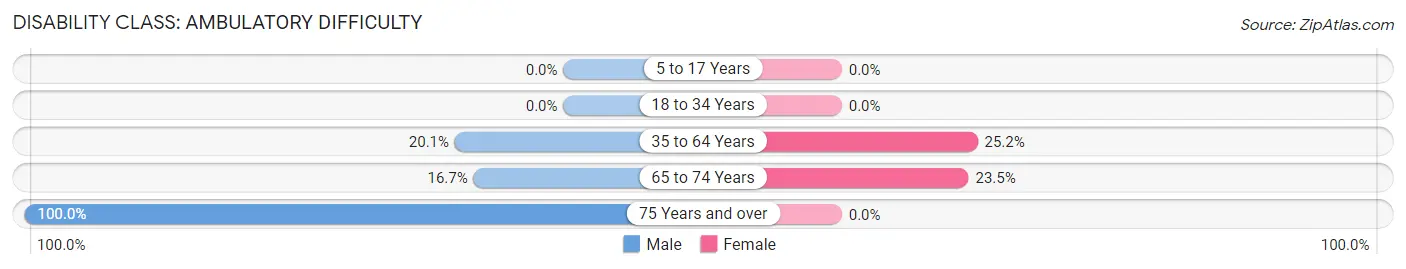
| Age Bracket | Male | Female |
| 5 to 17 Years | 0 (0.0%) | 0 (0.0%) |
| 18 to 34 Years | 0 (0.0%) | 0 (0.0%) |
| 35 to 64 Years | 29 (20.1%) | 32 (25.2%) |
| 65 to 74 Years | 6 (16.7%) | 4 (23.5%) |
| 75 Years and over | 7 (100.0%) | 0 (0.0%) |
Disability Class: Self-Care Difficulty
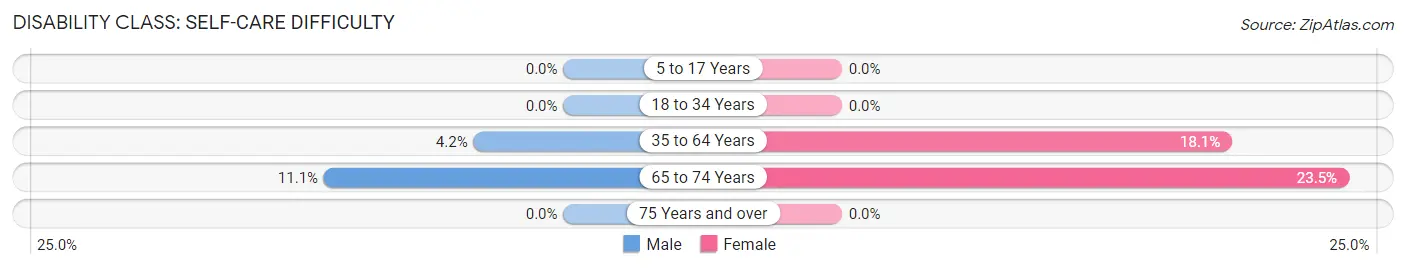
| Age Bracket | Male | Female |
| 5 to 17 Years | 0 (0.0%) | 0 (0.0%) |
| 18 to 34 Years | 0 (0.0%) | 0 (0.0%) |
| 35 to 64 Years | 6 (4.2%) | 23 (18.1%) |
| 65 to 74 Years | 4 (11.1%) | 4 (23.5%) |
| 75 Years and over | 0 (0.0%) | 0 (0.0%) |
Technology Access in Garber
Computing Device Access in Garber
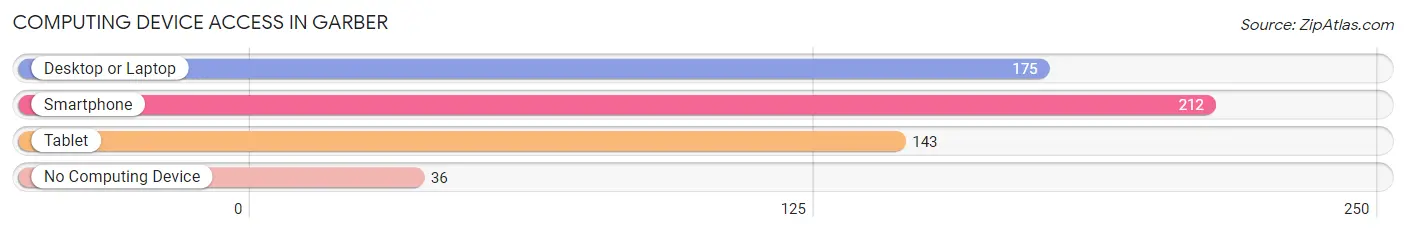
| Device Type | # Households | % Households |
| Desktop or Laptop | 175 | 68.4% |
| Smartphone | 212 | 82.8% |
| Tablet | 143 | 55.9% |
| No Computing Device | 36 | 14.1% |
| Total | 256 | 100.0% |
Internet Access in Garber
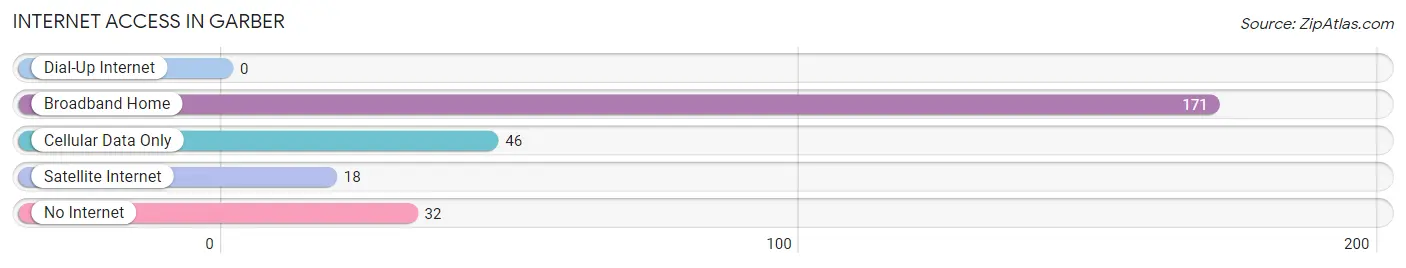
| Internet Type | # Households | % Households |
| Dial-Up Internet | 0 | 0.0% |
| Broadband Home | 171 | 66.8% |
| Cellular Data Only | 46 | 18.0% |
| Satellite Internet | 18 | 7.0% |
| No Internet | 32 | 12.5% |
| Total | 256 | 100.0% |
Garber Summary
Garber is a small town located in Garfield County, Oklahoma. It is situated approximately 20 miles northwest of Enid, Oklahoma, and is part of the Enid Metropolitan Statistical Area. The town was founded in 1901 and was named after the Garber family, who were among the first settlers in the area. As of the 2010 census, the population of Garber was 1,092.
Geography
Garber is located at 36°37'45" North, 97°45'45" West (36.629167, -97.762500). It is situated in the Red Bed Plains region of Oklahoma, which is characterized by flat terrain and red-colored soil. The town is located at an elevation of 1,068 feet above sea level.
The town is located in the Central Standard Time Zone and observes Daylight Saving Time. The nearest major cities are Oklahoma City, which is located approximately 75 miles to the south, and Tulsa, which is located approximately 90 miles to the east.
Climate
Garber has a humid subtropical climate, with hot summers and mild winters. The average annual temperature is 61.3°F, with an average high of 79.2°F in July and an average low of 43.4°F in January. The average annual precipitation is 33.3 inches, with an average of 4.3 inches of snowfall per year.
Demographics
As of the 2010 census, the population of Garber was 1,092, with a population density of 1,092 people per square mile. The racial makeup of the town was 95.2% White, 0.7% African American, 0.7% Native American, 0.3% Asian, 0.1% Pacific Islander, 1.2% from other races, and 1.8% from two or more races. Hispanic or Latino of any race were 3.2% of the population.
The median age in Garber was 37.2 years, with 24.2% of the population under the age of 18, 8.2% between the ages of 18 and 24, 25.2% between the ages of 25 and 44, 24.2% between the ages of 45 and 64, and 18.2% 65 years of age or older. The median household income was $37,917, and the median family income was $45,000.
Economy
Garber’s economy is largely based on agriculture and oil production. The town is home to several grain elevators, as well as a number of oil and gas wells. The town is also home to a number of small businesses, including a grocery store, a hardware store, and a few restaurants.
Education
Garber is served by the Garber Public School District, which includes an elementary school, a middle school, and a high school. The town is also home to a branch of Northern Oklahoma College, which offers a variety of associate degree and certificate programs.
Transportation
Garber is served by U.S. Route 412, which runs east-west through the town. The nearest airport is Enid Woodring Regional Airport, located approximately 20 miles to the southeast. The nearest major airport is Will Rogers World Airport in Oklahoma City, located approximately 75 miles to the south.
Common Questions
What is Per Capita Income in Garber?
Per Capita income in Garber is $29,342.
What is the Median Family Income in Garber?
Median Family Income in Garber is $72,321.
What is the Median Household income in Garber?
Median Household Income in Garber is $58,750.
What is Income or Wage Gap in Garber?
Income or Wage Gap in Garber is 20.2%.
Women in Garber earn 79.8 cents for every dollar earned by a man.
What is Inequality or Gini Index in Garber?
Inequality or Gini Index in Garber is 0.41.
What is the Total Population of Garber?
Total Population of Garber is 664.
What is the Total Male Population of Garber?
Total Male Population of Garber is 306.
What is the Total Female Population of Garber?
Total Female Population of Garber is 358.
What is the Ratio of Males per 100 Females in Garber?
There are 85.47 Males per 100 Females in Garber.
What is the Ratio of Females per 100 Males in Garber?
There are 116.99 Females per 100 Males in Garber.
What is the Median Population Age in Garber?
Median Population Age in Garber is 35.5 Years.
What is the Average Family Size in Garber
Average Family Size in Garber is 3.8 People.
What is the Average Household Size in Garber
Average Household Size in Garber is 2.6 People.
How Large is the Labor Force in Garber?
There are 373 People in the Labor Forcein in Garber.
What is the Percentage of People in the Labor Force in Garber?
68.3% of People are in the Labor Force in Garber.
What is the Unemployment Rate in Garber?
Unemployment Rate in Garber is 4.3%.