Zip Codes with the Highest Percentage of Population Employed in Community & Social Service in Edmond, OK

RELATED REPORTS & OPTIONS

Community & Social Service
Population
Families and Households
Female Fertility
Female Fertility (Unmarried)
Race (Community Size)
Race (Percentage)
Ancestry (Community Size)
AfricanAlbanianAmericanArabArgentineanArmenianAustralianAustrianBelgianBhutaneseBrazilianBritishBurmeseCajunCanadianCentral AmericanCentral American IndianCherokeeChickasawChoctawColombianComancheCosta RicanCreekCroatianCubanCzechCzechoslovakianDanishDelawareDutchDutch West IndianEastern EuropeanEcuadorianEnglishEthiopianEuropeanFilipinoFinnishFrenchFrench CanadianGermanGhanaianGreekGuamanian / ChamorroGuatemalanHonduranHungarianIndian (Asian)IranianIraqiIrishIroquoisIsraeliItalianJamaicanJordanianKiowaKoreanLebaneseLithuanianMalaysianMexicanMoroccanNative HawaiianNigerianNorthern EuropeanNorwegianOsagePakistaniPanamanianPeruvianPolishPortuguesePotawatomiPuerto RicanRomanianRussianSalvadoranSamoanScandinavianScotch-IrishScottishSeminoleSiouxSlovakSloveneSouth AmericanSpaniardSpanishSri LankanSubsaharan AfricanSwedishSwissSyrianThaiTurkishUkrainianVenezuelanVietnameseWelshYugoslavian
Ancestry (Percentage)
AfricanAlbanianAmericanArabArgentineanArmenianAustralianAustrianBelgianBhutaneseBrazilianBritishBurmeseCajunCanadianCentral AmericanCentral American IndianCherokeeChickasawChoctawColombianComancheCosta RicanCreekCroatianCubanCzechCzechoslovakianDanishDelawareDutchDutch West IndianEastern EuropeanEcuadorianEnglishEthiopianEuropeanFilipinoFinnishFrenchFrench CanadianGermanGhanaianGreekGuamanian / ChamorroGuatemalanHonduranHungarianIndian (Asian)IranianIraqiIrishIroquoisIsraeliItalianJamaicanJordanianKiowaKoreanLebaneseLithuanianMalaysianMexicanMoroccanNative HawaiianNigerianNorthern EuropeanNorwegianOsagePakistaniPanamanianPeruvianPolishPortuguesePotawatomiPuerto RicanRomanianRussianSalvadoranSamoanScandinavianScotch-IrishScottishSeminoleSiouxSlovakSloveneSouth AmericanSpaniardSpanishSri LankanSubsaharan AfricanSwedishSwissSyrianThaiTurkishUkrainianVenezuelanVietnameseWelshYugoslavian
Immigrant Origin (Total)
Immigrant Origin (Percentage)
Income
Income (Families)
Income (Households)
Poverty
Poverty (Families)
Unemployment
Employment Occupations
Employment Industries
Employer Class
Commute Time
Commute Means
School Enrollment
Education by Degree Field
Occupancy
Finances
Physical Characteristics
Edmond
Compare Zip Codes
Comparison Subject

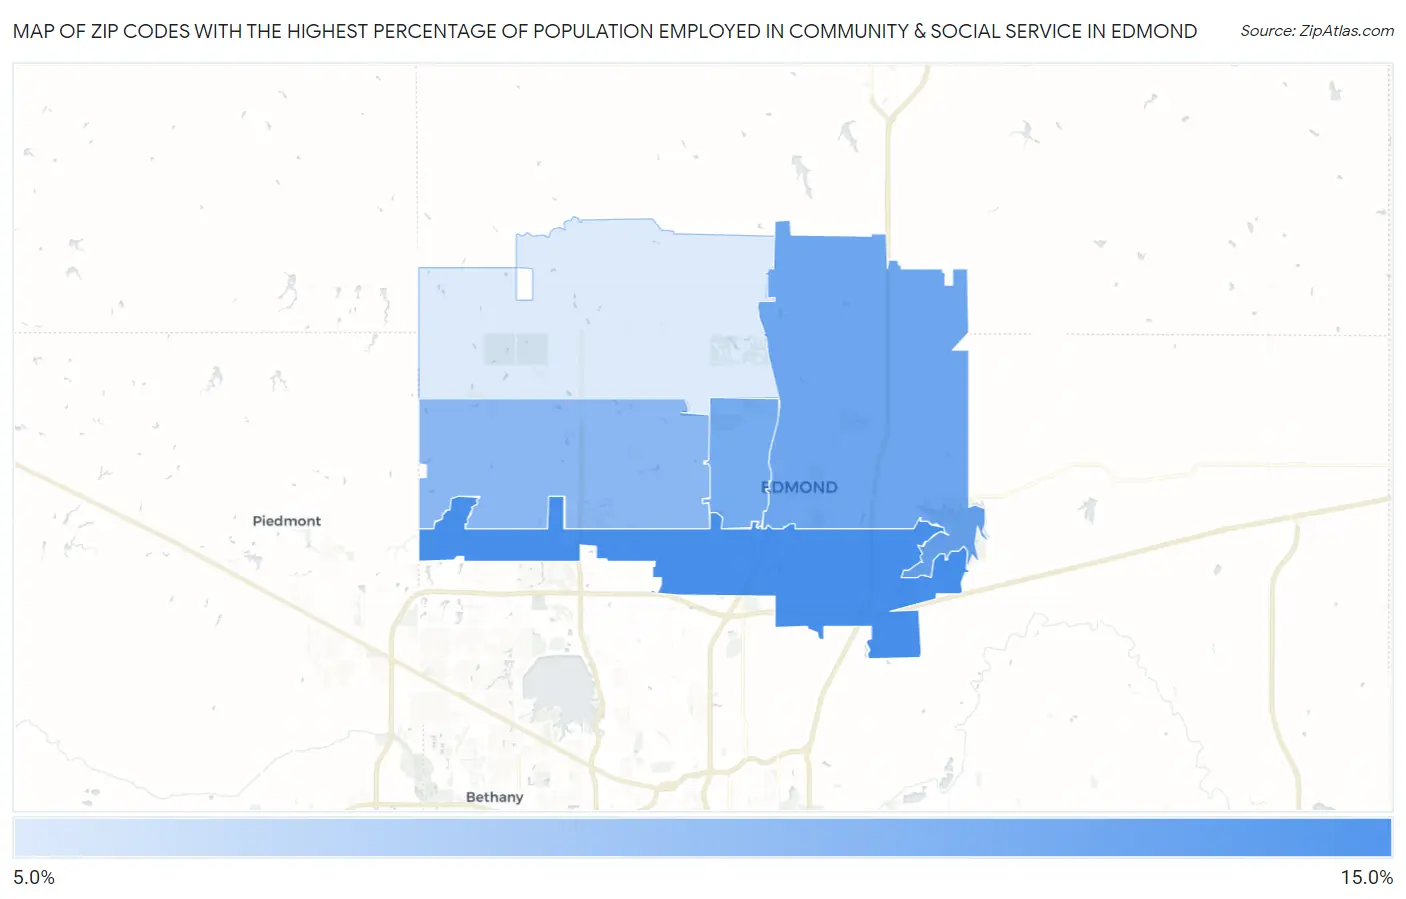
Map of Zip Codes with the Highest Percentage of Population Employed in Community & Social Service in Edmond

0.0%
15.0%
Zip Codes with the Highest Percentage of Population Employed in Community & Social Service  in Edmond Map

Zip Codes with the Highest Percentage of Population Employed in Community & Social Service in Edmond, OK

Zip Code % Employed vs State vs National
1.7301314.6%10.6%(+3.99)#9311.2%(+3.38)#5,374
2.7303413.4%10.6%(+2.84)#12211.2%(+2.23)#6,832
3.7300313.2%10.6%(+2.64)#12611.2%(+2.03)#7,165
4.7301212.6%10.6%(+1.96)#14611.2%(+1.35)#8,308
5.7302510.2%10.6%(-0.433)#25011.2%(-1.04)#13,677

Common Questions

What are the Top 3 Zip Codes with the Highest Percentage of Population Employed in Community & Social Service in Edmond, OK?
Top 3 Zip Codes with the Highest Percentage of Population Employed in Community & Social Service in Edmond, OK are:
#1
14.6%
#2
13.4%
#3
13.2%
What zip code has the Highest Percentage of Population Employed in Community & Social Service in Edmond, OK?
73013 has the Highest Percentage of Population Employed in Community & Social Service in Edmond, OK with 14.6%.
What is the Percentage of Population Employed in Community & Social Service in Edmond, OK?
Percentage of Population Employed in Community & Social Service in Edmond is 14.1%.
What is the Percentage of Population Employed in Community & Social Service in Oklahoma?
Percentage of Population Employed in Community & Social Service in Oklahoma is 10.6%.
What is the Percentage of Population Employed in Community & Social Service in the United States?
Percentage of Population Employed in Community & Social Service in the United States is 11.2%.