Drummond, OK Map & Demographics
Drummond Map
Drummond Overview
$48,753
PER CAPITA INCOME
$165,215
AVG FAMILY INCOME
$117,788
AVG HOUSEHOLD INCOME
69.6%
WAGE / INCOME GAP [ % ]
30.4¢/ $1
WAGE / INCOME GAP [ $ ]
0.37
INEQUALITY / GINI INDEX
412
TOTAL POPULATION
226
MALE POPULATION
186
FEMALE POPULATION
121.51
MALES / 100 FEMALES
82.30
FEMALES / 100 MALES
37.5
MEDIAN AGE
2.5
AVG FAMILY SIZE
2.2
AVG HOUSEHOLD SIZE
190
LABOR FORCE [ PEOPLE ]
60.9%
PERCENT IN LABOR FORCE
8.4%
UNEMPLOYMENT RATE
Drummond Zip Codes
Drummond Area Codes
Income in Drummond
Income Overview in Drummond
Per Capita Income in Drummond is $48,753, while median incomes of families and households are $165,215 and $117,788 respectively.
| Characteristic | Number | Measure |
| Per Capita Income | 412 | $48,753 |
| Median Family Income | 139 | $165,215 |
| Mean Family Income | 139 | $131,077 |
| Median Household Income | 189 | $117,788 |
| Mean Household Income | 189 | $107,688 |
| Income Deficit | 139 | $0 |
| Wage / Income Gap (%) | 412 | 69.64% |
| Wage / Income Gap ($) | 412 | 30.36¢ per $1 |
| Gini / Inequality Index | 412 | 0.37 |
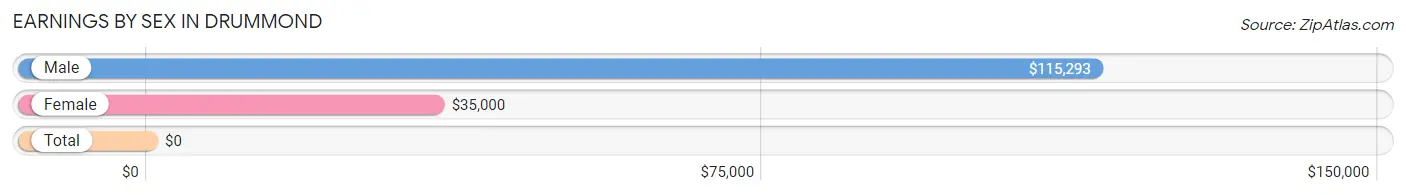
Earnings by Sex in Drummond
| Sex | Number | Average Earnings |
| Male | 113 (59.2%) | $115,293 |
| Female | 78 (40.8%) | $35,000 |
| Total | 191 (100.0%) | $0 |
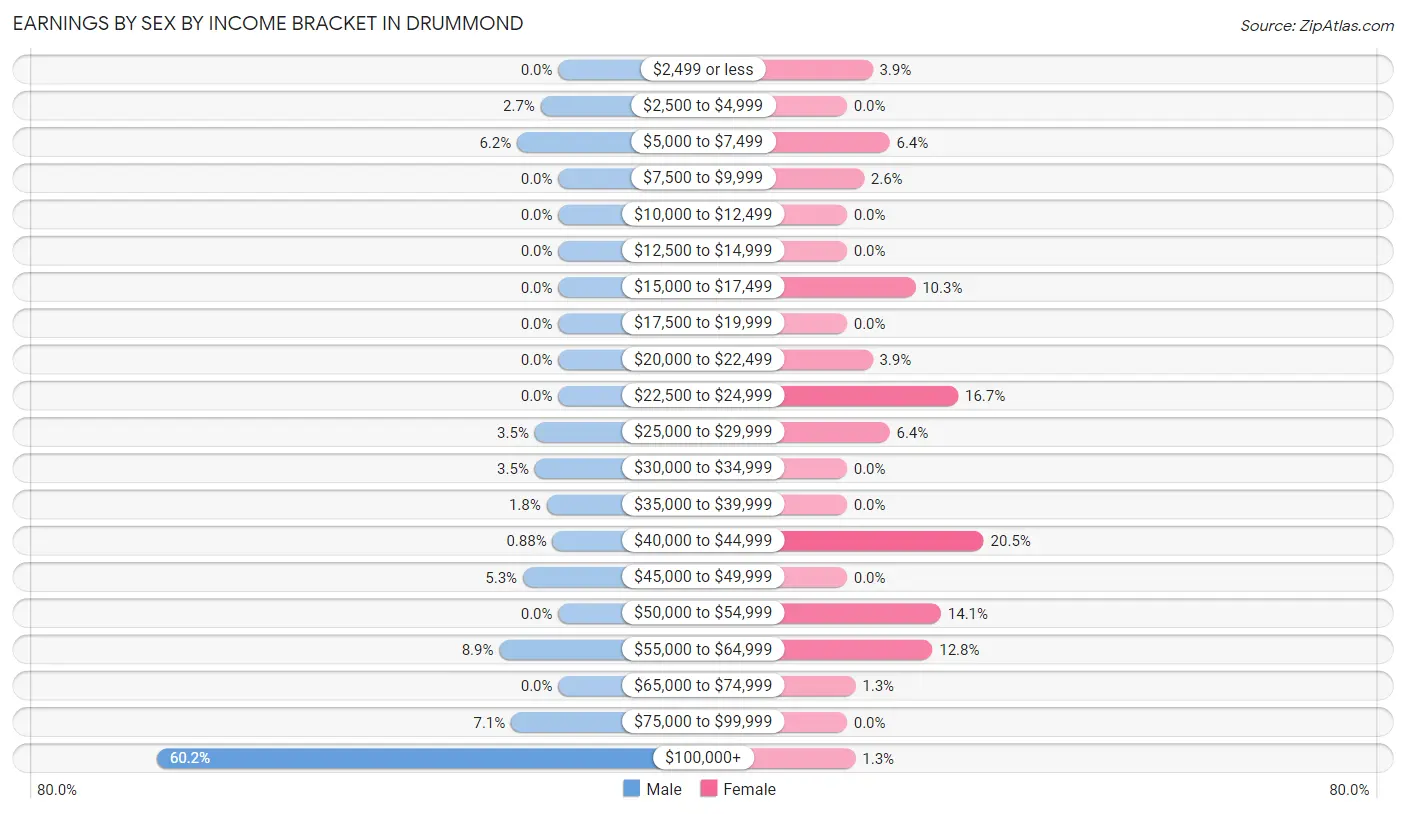
Earnings by Sex by Income Bracket in Drummond
The most common earnings brackets in Drummond are $100,000+ for men (68 | 60.2%) and $40,000 to $44,999 for women (16 | 20.5%).
| Income | Male | Female |
| $2,499 or less | 0 (0.0%) | 3 (3.8%) |
| $2,500 to $4,999 | 3 (2.6%) | 0 (0.0%) |
| $5,000 to $7,499 | 7 (6.2%) | 5 (6.4%) |
| $7,500 to $9,999 | 0 (0.0%) | 2 (2.6%) |
| $10,000 to $12,499 | 0 (0.0%) | 0 (0.0%) |
| $12,500 to $14,999 | 0 (0.0%) | 0 (0.0%) |
| $15,000 to $17,499 | 0 (0.0%) | 8 (10.3%) |
| $17,500 to $19,999 | 0 (0.0%) | 0 (0.0%) |
| $20,000 to $22,499 | 0 (0.0%) | 3 (3.8%) |
| $22,500 to $24,999 | 0 (0.0%) | 13 (16.7%) |
| $25,000 to $29,999 | 4 (3.5%) | 5 (6.4%) |
| $30,000 to $34,999 | 4 (3.5%) | 0 (0.0%) |
| $35,000 to $39,999 | 2 (1.8%) | 0 (0.0%) |
| $40,000 to $44,999 | 1 (0.9%) | 16 (20.5%) |
| $45,000 to $49,999 | 6 (5.3%) | 0 (0.0%) |
| $50,000 to $54,999 | 0 (0.0%) | 11 (14.1%) |
| $55,000 to $64,999 | 10 (8.8%) | 10 (12.8%) |
| $65,000 to $74,999 | 0 (0.0%) | 1 (1.3%) |
| $75,000 to $99,999 | 8 (7.1%) | 0 (0.0%) |
| $100,000+ | 68 (60.2%) | 1 (1.3%) |
| Total | 113 (100.0%) | 78 (100.0%) |
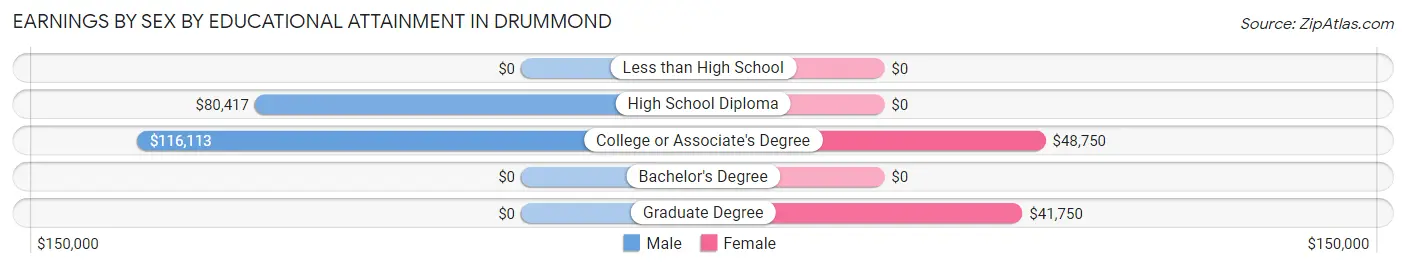
Earnings by Sex by Educational Attainment in Drummond
Average earnings in Drummond are $115,293 for men and $42,614 for women, a difference of 63.0%. Men with an educational attainment of college or associate's degree enjoy the highest average annual earnings of $116,113, while those with high school diploma education earn the least with $80,417. Women with an educational attainment of college or associate's degree earn the most with the average annual earnings of $48,750, while those with graduate degree education have the smallest earnings of $41,750.
| Educational Attainment | Male Income | Female Income |
| Less than High School | - | - |
| High School Diploma | $80,417 | $0 |
| College or Associate's Degree | $116,113 | $48,750 |
| Bachelor's Degree | - | - |
| Graduate Degree | - | - |
| Total | $115,293 | $42,614 |
Family Income in Drummond
Family Income Brackets in Drummond
According to the Drummond family income data, there are 78 families falling into the $150,000 to $199,999 income range, which is the most common income bracket and makes up 56.1% of all families.
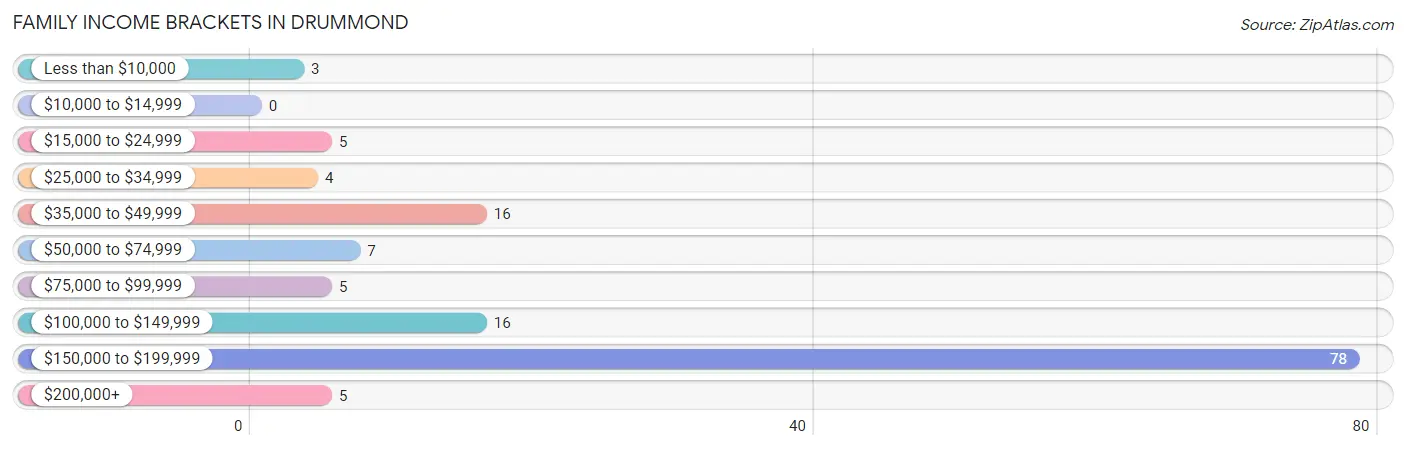
| Income Bracket | # Families | % Families |
| Less than $10,000 | 3 | 2.2% |
| $10,000 to $14,999 | 0 | 0.0% |
| $15,000 to $24,999 | 5 | 3.6% |
| $25,000 to $34,999 | 4 | 2.9% |
| $35,000 to $49,999 | 16 | 11.5% |
| $50,000 to $74,999 | 7 | 5.0% |
| $75,000 to $99,999 | 5 | 3.6% |
| $100,000 to $149,999 | 16 | 11.5% |
| $150,000 to $199,999 | 78 | 56.1% |
| $200,000+ | 5 | 3.6% |
Family Income by Famaliy Size in Drummond
3-person families (81 | 58.3%) account for the highest median family income in Drummond with $165,918 per family, while 3-person families (81 | 58.3%) have the highest median income of $55,306 per family member.
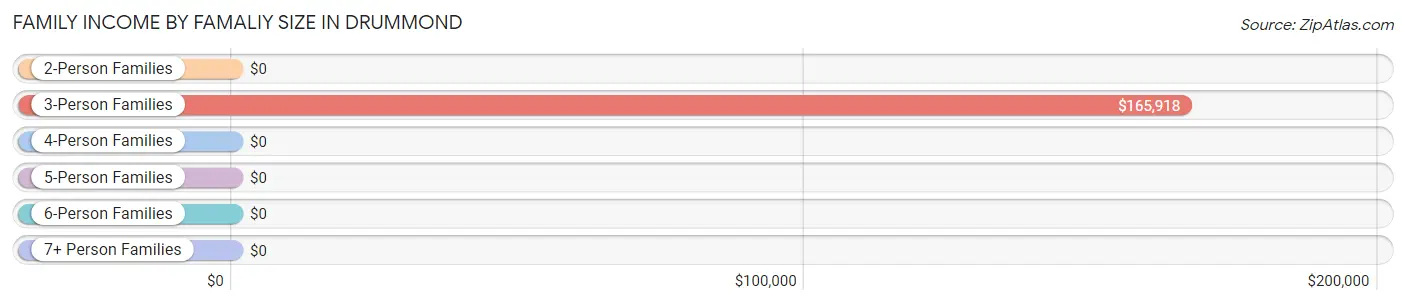
| Income Bracket | # Families | Median Income |
| 2-Person Families | 30 (21.6%) | $0 |
| 3-Person Families | 81 (58.3%) | $165,918 |
| 4-Person Families | 8 (5.8%) | $0 |
| 5-Person Families | 20 (14.4%) | $0 |
| 6-Person Families | 0 (0.0%) | $0 |
| 7+ Person Families | 0 (0.0%) | $0 |
| Total | 139 (100.0%) | $165,215 |
Family Income by Number of Earners in Drummond
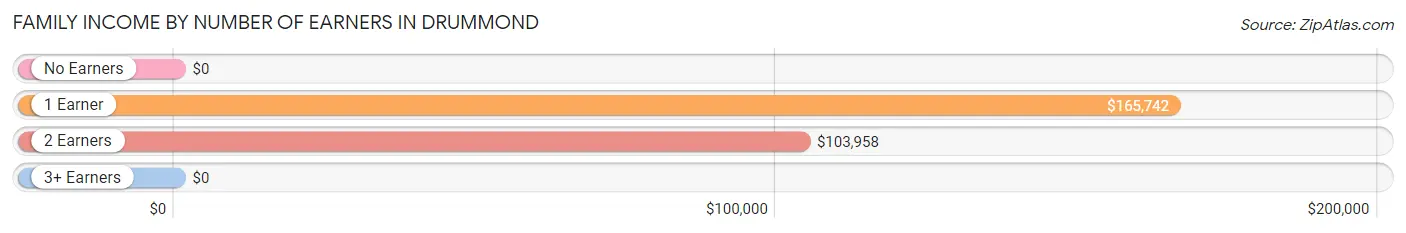
| Number of Earners | # Families | Median Income |
| No Earners | 10 (7.2%) | $0 |
| 1 Earner | 92 (66.2%) | $165,742 |
| 2 Earners | 37 (26.6%) | $103,958 |
| 3+ Earners | 0 (0.0%) | $0 |
| Total | 139 (100.0%) | $165,215 |
Household Income in Drummond
Household Income Brackets in Drummond
With 78 households falling in the category, the $150,000 to $199,999 income range is the most frequent in Drummond, accounting for 41.3% of all households. In contrast, only 3 households (1.6%) fall into the less than $10,000 income bracket, making it the least populous group.
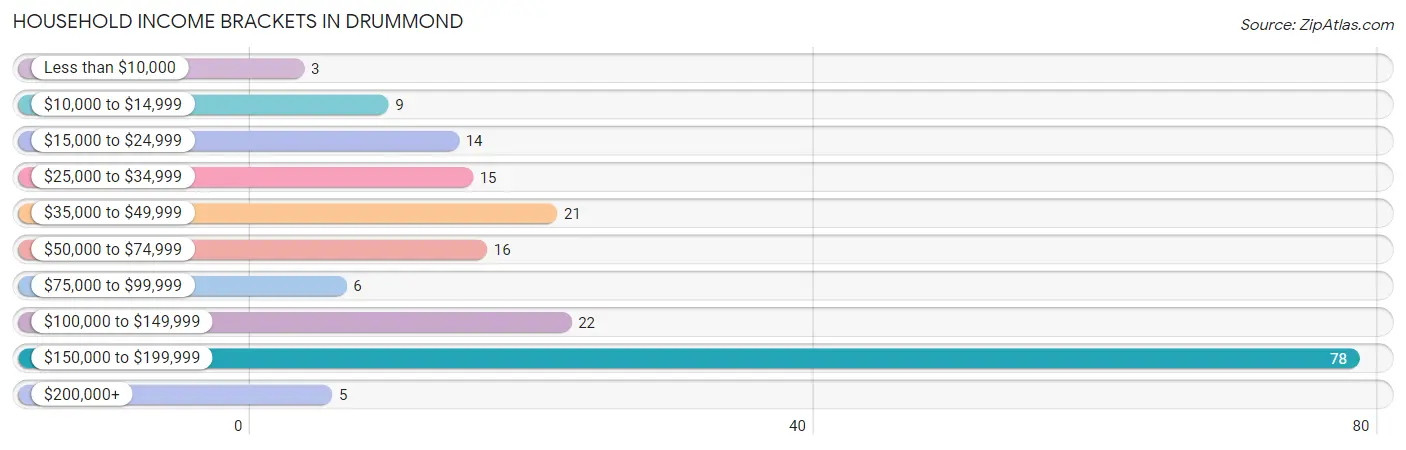
| Income Bracket | # Households | % Households |
| Less than $10,000 | 3 | 1.6% |
| $10,000 to $14,999 | 9 | 4.8% |
| $15,000 to $24,999 | 14 | 7.4% |
| $25,000 to $34,999 | 15 | 7.9% |
| $35,000 to $49,999 | 21 | 11.1% |
| $50,000 to $74,999 | 16 | 8.5% |
| $75,000 to $99,999 | 6 | 3.2% |
| $100,000 to $149,999 | 22 | 11.6% |
| $150,000 to $199,999 | 78 | 41.3% |
| $200,000+ | 5 | 2.6% |
Household Income by Householder Age in Drummond
The median household income in Drummond is $117,788, with the highest median household income of $87,000 found in the 45 to 64 years age bracket for the primary householder. A total of 38 households (20.1%) fall into this category. Meanwhile, the 15 to 24 years age bracket for the primary householder has the lowest median household income of $0, with 3 households (1.6%) in this group.
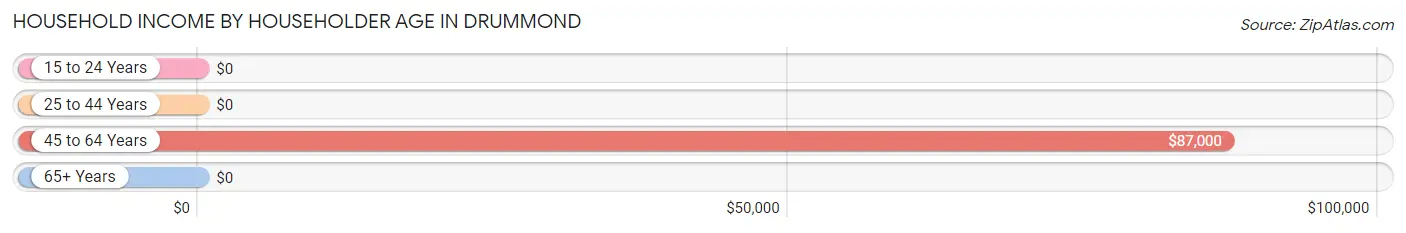
| Income Bracket | # Households | Median Income |
| 15 to 24 Years | 3 (1.6%) | $0 |
| 25 to 44 Years | 44 (23.3%) | $0 |
| 45 to 64 Years | 38 (20.1%) | $87,000 |
| 65+ Years | 104 (55.0%) | $0 |
| Total | 189 (100.0%) | $117,788 |
Poverty in Drummond
Income Below Poverty by Sex and Age in Drummond
With 17.7% poverty level for males and 29.6% for females among the residents of Drummond, 6 to 11 year old males and 6 to 11 year old females are the most vulnerable to poverty, with 22 males (84.6%) and 21 females (67.7%) in their respective age groups living below the poverty level.
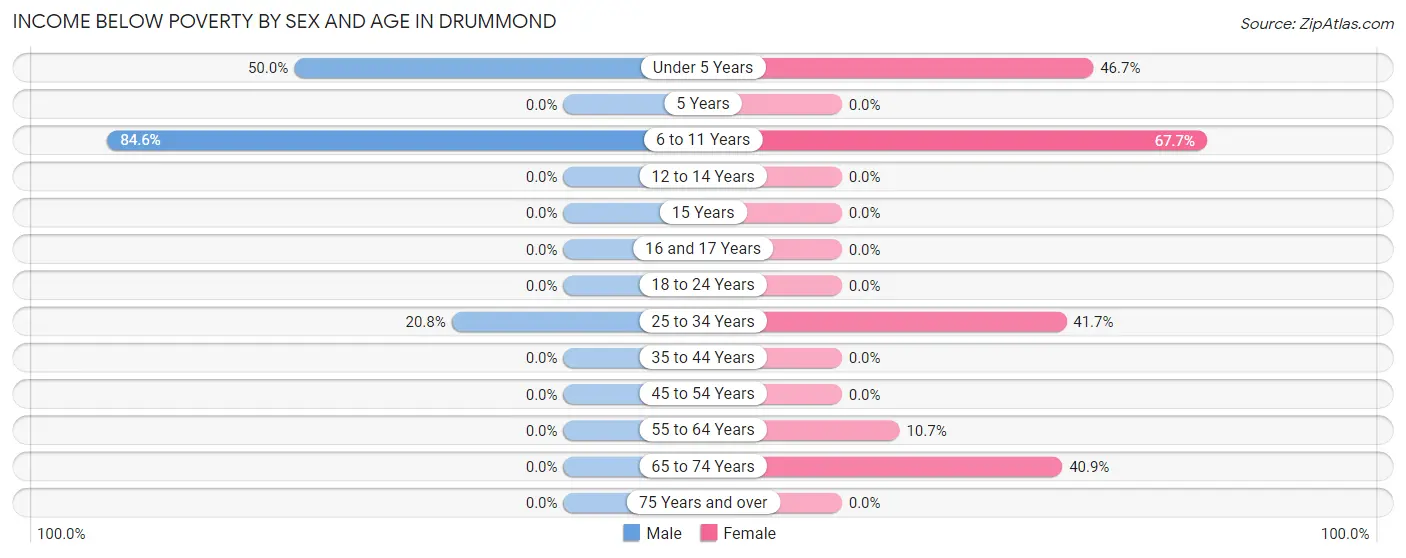
| Age Bracket | Male | Female |
| Under 5 Years | 7 (50.0%) | 7 (46.7%) |
| 5 Years | 0 (0.0%) | 0 (0.0%) |
| 6 to 11 Years | 22 (84.6%) | 21 (67.7%) |
| 12 to 14 Years | 0 (0.0%) | 0 (0.0%) |
| 15 Years | 0 (0.0%) | 0 (0.0%) |
| 16 and 17 Years | 0 (0.0%) | 0 (0.0%) |
| 18 to 24 Years | 0 (0.0%) | 0 (0.0%) |
| 25 to 34 Years | 11 (20.7%) | 15 (41.7%) |
| 35 to 44 Years | 0 (0.0%) | 0 (0.0%) |
| 45 to 54 Years | 0 (0.0%) | 0 (0.0%) |
| 55 to 64 Years | 0 (0.0%) | 3 (10.7%) |
| 65 to 74 Years | 0 (0.0%) | 9 (40.9%) |
| 75 Years and over | 0 (0.0%) | 0 (0.0%) |
| Total | 40 (17.7%) | 55 (29.6%) |
Income Above Poverty by Sex and Age in Drummond
According to the poverty statistics in Drummond, males aged 5 years and females aged 12 to 14 years are the age groups that are most secure financially, with 100.0% of males and 100.0% of females in these age groups living above the poverty line.
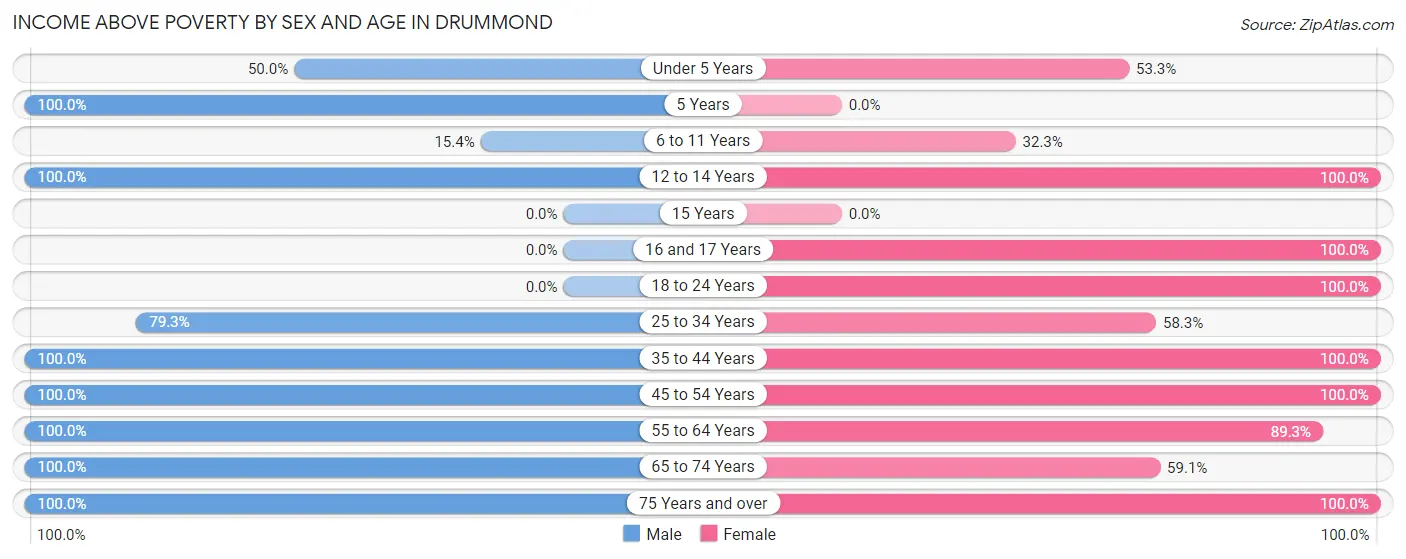
| Age Bracket | Male | Female |
| Under 5 Years | 7 (50.0%) | 8 (53.3%) |
| 5 Years | 4 (100.0%) | 0 (0.0%) |
| 6 to 11 Years | 4 (15.4%) | 10 (32.3%) |
| 12 to 14 Years | 3 (100.0%) | 7 (100.0%) |
| 15 Years | 0 (0.0%) | 0 (0.0%) |
| 16 and 17 Years | 0 (0.0%) | 4 (100.0%) |
| 18 to 24 Years | 0 (0.0%) | 11 (100.0%) |
| 25 to 34 Years | 42 (79.2%) | 21 (58.3%) |
| 35 to 44 Years | 13 (100.0%) | 5 (100.0%) |
| 45 to 54 Years | 6 (100.0%) | 26 (100.0%) |
| 55 to 64 Years | 18 (100.0%) | 25 (89.3%) |
| 65 to 74 Years | 77 (100.0%) | 13 (59.1%) |
| 75 Years and over | 12 (100.0%) | 1 (100.0%) |
| Total | 186 (82.3%) | 131 (70.4%) |
Income Below Poverty Among Married-Couple Families in Drummond
The poverty statistics for married-couple families in Drummond show that 3.2% or 4 of the total 124 families live below the poverty line. Families with 3 or 4 children have the highest poverty rate of 26.7%, comprising of 4 families. On the other hand, families with no children have the lowest poverty rate of 0.0%, which includes 0 families.
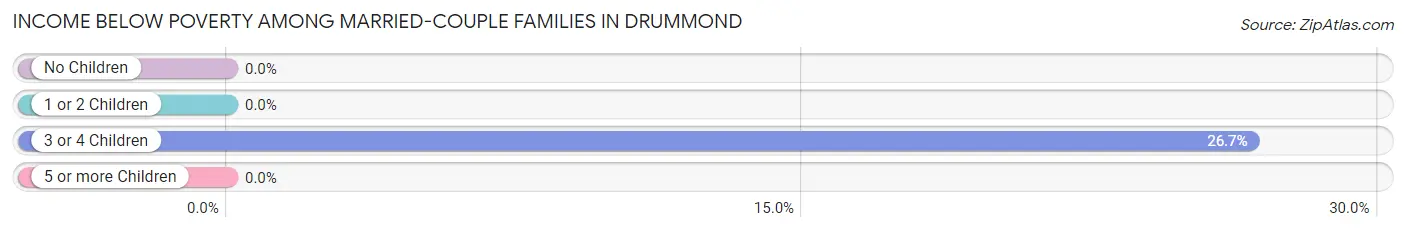
| Children | Above Poverty | Below Poverty |
| No Children | 34 (100.0%) | 0 (0.0%) |
| 1 or 2 Children | 75 (100.0%) | 0 (0.0%) |
| 3 or 4 Children | 11 (73.3%) | 4 (26.7%) |
| 5 or more Children | 0 (0.0%) | 0 (0.0%) |
| Total | 120 (96.8%) | 4 (3.2%) |
Income Below Poverty Among Single-Parent Households in Drummond
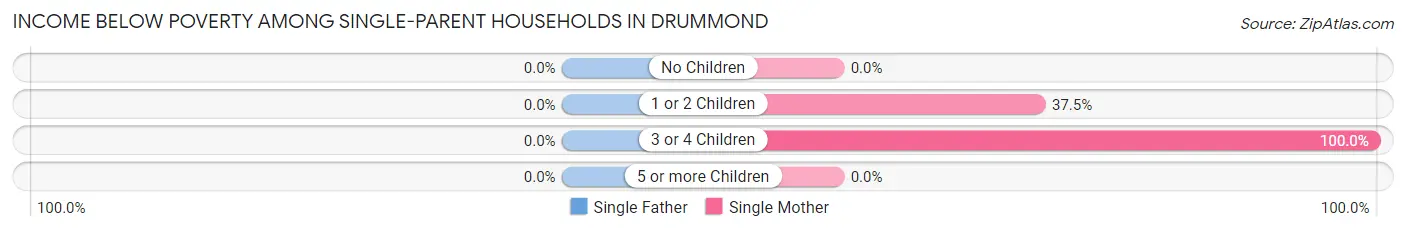
| Children | Single Father | Single Mother |
| No Children | 0 (0.0%) | 0 (0.0%) |
| 1 or 2 Children | 0 (0.0%) | 3 (37.5%) |
| 3 or 4 Children | 0 (0.0%) | 5 (100.0%) |
| 5 or more Children | 0 (0.0%) | 0 (0.0%) |
| Total | 0 (0.0%) | 8 (53.3%) |
Income Below Poverty Among Married-Couple vs Single-Parent Households in Drummond
The poverty data for Drummond shows that 4 of the married-couple family households (3.2%) and 8 of the single-parent households (53.3%) are living below the poverty level. Within the married-couple family households, those with 3 or 4 children have the highest poverty rate, with 4 households (26.7%) falling below the poverty line. Among the single-parent households, those with 3 or 4 children have the highest poverty rate, with 5 household (100.0%) living below poverty.
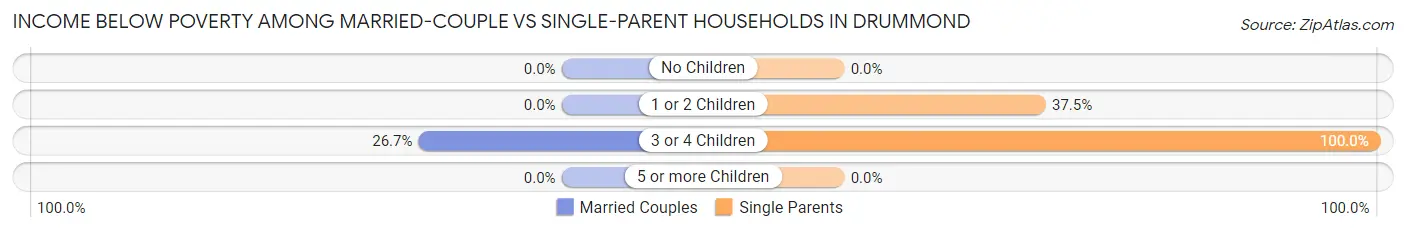
| Children | Married-Couple Families | Single-Parent Households |
| No Children | 0 (0.0%) | 0 (0.0%) |
| 1 or 2 Children | 0 (0.0%) | 3 (37.5%) |
| 3 or 4 Children | 4 (26.7%) | 5 (100.0%) |
| 5 or more Children | 0 (0.0%) | 0 (0.0%) |
| Total | 4 (3.2%) | 8 (53.3%) |
Race in Drummond
The most populous races in Drummond are White / Caucasian (280 | 68.0%), Hispanic or Latino (111 | 26.9%), and Some other Race (111 | 26.9%).
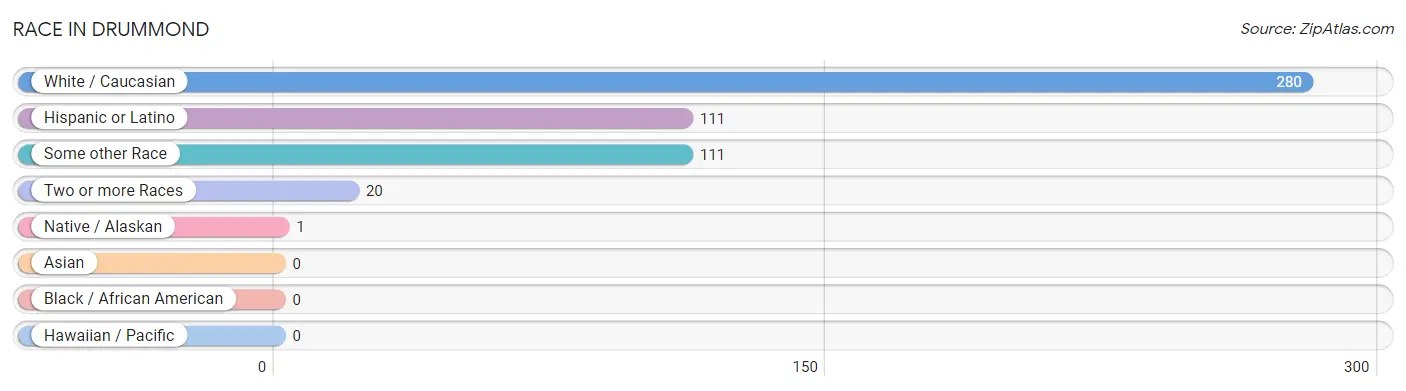
| Race | # Population | % Population |
| Asian | 0 | 0.0% |
| Black / African American | 0 | 0.0% |
| Hawaiian / Pacific | 0 | 0.0% |
| Hispanic or Latino | 111 | 26.9% |
| Native / Alaskan | 1 | 0.2% |
| White / Caucasian | 280 | 68.0% |
| Two or more Races | 20 | 4.9% |
| Some other Race | 111 | 26.9% |
| Total | 412 | 100.0% |
Ancestry in Drummond
The most populous ancestries reported in Drummond are Mexican (111 | 26.9%), German (110 | 26.7%), Irish (66 | 16.0%), English (18 | 4.4%), and Cherokee (17 | 4.1%), together accounting for 78.2% of all Drummond residents.
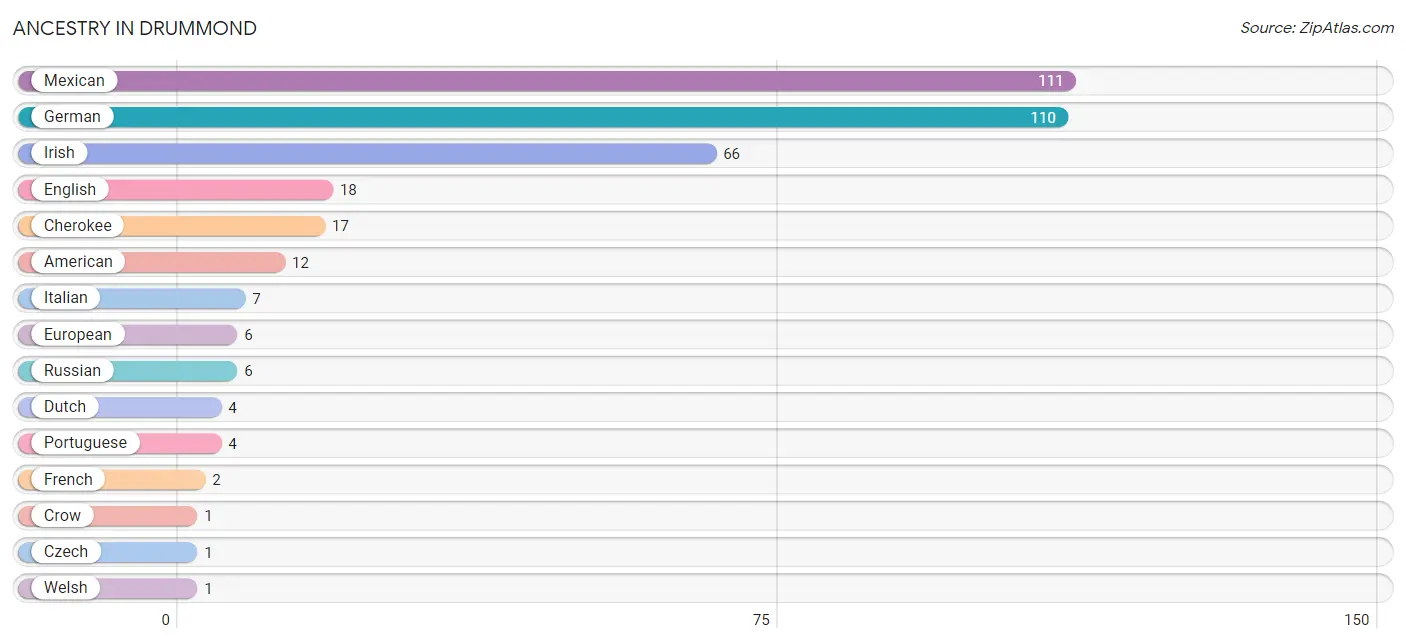
| Ancestry | # Population | % Population |
| American | 12 | 2.9% |
| Cherokee | 17 | 4.1% |
| Crow | 1 | 0.2% |
| Czech | 1 | 0.2% |
| Dutch | 4 | 1.0% |
| English | 18 | 4.4% |
| European | 6 | 1.5% |
| French | 2 | 0.5% |
| German | 110 | 26.7% |
| Irish | 66 | 16.0% |
| Italian | 7 | 1.7% |
| Mexican | 111 | 26.9% |
| Portuguese | 4 | 1.0% |
| Russian | 6 | 1.5% |
| Welsh | 1 | 0.2% | View All 15 Rows |
Immigrants in Drummond
The most numerous immigrant groups reported in Drummond came from Central America (97 | 23.5%), Latin America (97 | 23.5%), and Mexico (97 | 23.5%), together accounting for 70.6% of all Drummond residents.
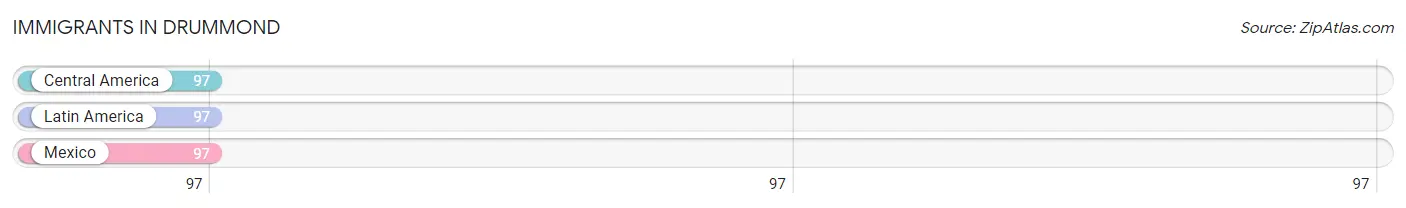
| Immigration Origin | # Population | % Population |
| Central America | 97 | 23.5% |
| Latin America | 97 | 23.5% |
| Mexico | 97 | 23.5% | View All 3 Rows |
Sex and Age in Drummond
Sex and Age in Drummond
The most populous age groups in Drummond are 70 to 74 Years (77 | 34.1%) for men and 5 to 9 Years (27 | 14.5%) for women.
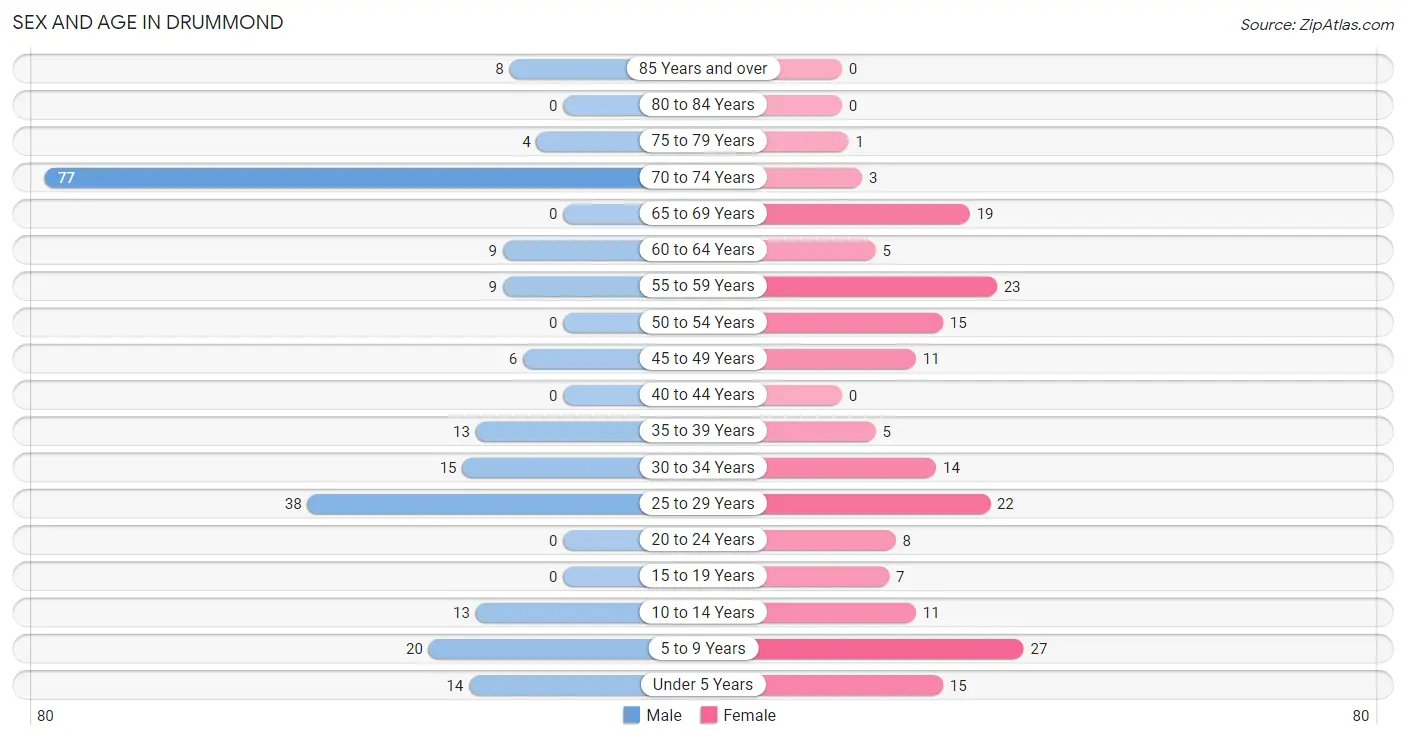
| Age Bracket | Male | Female |
| Under 5 Years | 14 (6.2%) | 15 (8.1%) |
| 5 to 9 Years | 20 (8.8%) | 27 (14.5%) |
| 10 to 14 Years | 13 (5.8%) | 11 (5.9%) |
| 15 to 19 Years | 0 (0.0%) | 7 (3.8%) |
| 20 to 24 Years | 0 (0.0%) | 8 (4.3%) |
| 25 to 29 Years | 38 (16.8%) | 22 (11.8%) |
| 30 to 34 Years | 15 (6.6%) | 14 (7.5%) |
| 35 to 39 Years | 13 (5.8%) | 5 (2.7%) |
| 40 to 44 Years | 0 (0.0%) | 0 (0.0%) |
| 45 to 49 Years | 6 (2.6%) | 11 (5.9%) |
| 50 to 54 Years | 0 (0.0%) | 15 (8.1%) |
| 55 to 59 Years | 9 (4.0%) | 23 (12.4%) |
| 60 to 64 Years | 9 (4.0%) | 5 (2.7%) |
| 65 to 69 Years | 0 (0.0%) | 19 (10.2%) |
| 70 to 74 Years | 77 (34.1%) | 3 (1.6%) |
| 75 to 79 Years | 4 (1.8%) | 1 (0.5%) |
| 80 to 84 Years | 0 (0.0%) | 0 (0.0%) |
| 85 Years and over | 8 (3.5%) | 0 (0.0%) |
| Total | 226 (100.0%) | 186 (100.0%) |
Families and Households in Drummond
Median Family Size in Drummond
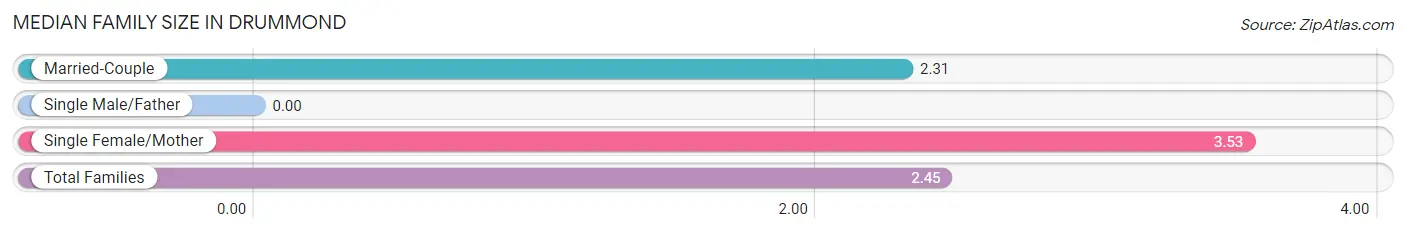
| Family Type | # Families | Family Size |
| Married-Couple | 124 (89.2%) | 2.31 |
| Single Male/Father | 0 (0.0%) | - |
| Single Female/Mother | 15 (10.8%) | 3.53 |
| Total Families | 139 (100.0%) | 2.45 |
Median Household Size in Drummond
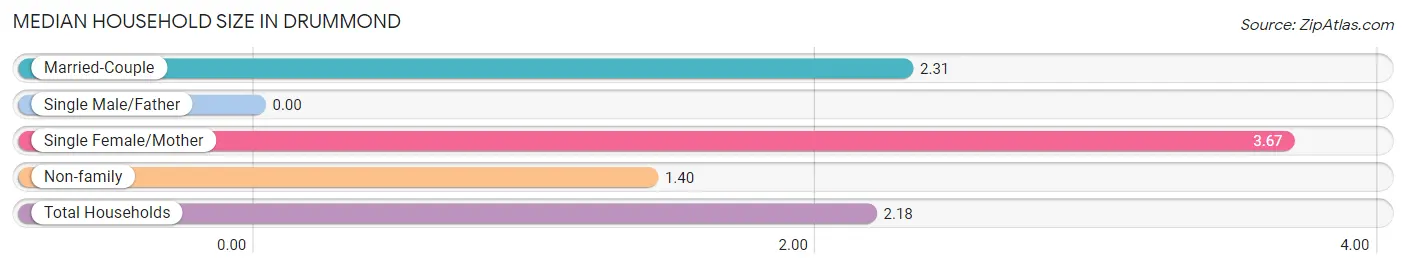
| Household Type | # Households | Household Size |
| Married-Couple | 124 (65.6%) | 2.31 |
| Single Male/Father | 0 (0.0%) | - |
| Single Female/Mother | 15 (7.9%) | 3.67 |
| Non-family | 50 (26.5%) | 1.40 |
| Total Households | 189 (100.0%) | 2.18 |
Household Size by Marriage Status in Drummond
Out of a total of 189 households in Drummond, 139 (73.5%) are family households, while 50 (26.5%) are nonfamily households. The most numerous type of family households are 3-person households, comprising 83, and the most common type of nonfamily households are 1-person households, comprising 39.
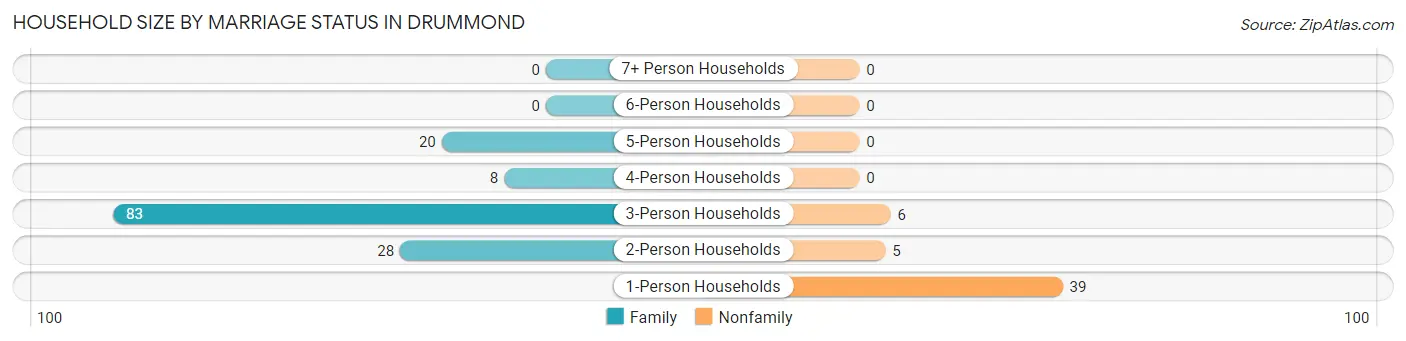
| Household Size | Family Households | Nonfamily Households |
| 1-Person Households | - | 39 (20.6%) |
| 2-Person Households | 28 (14.8%) | 5 (2.6%) |
| 3-Person Households | 83 (43.9%) | 6 (3.2%) |
| 4-Person Households | 8 (4.2%) | 0 (0.0%) |
| 5-Person Households | 20 (10.6%) | 0 (0.0%) |
| 6-Person Households | 0 (0.0%) | 0 (0.0%) |
| 7+ Person Households | 0 (0.0%) | 0 (0.0%) |
| Total | 139 (73.5%) | 50 (26.5%) |
Female Fertility in Drummond
Fertility by Age in Drummond
Average fertility rate in Drummond is 75.0 births per 1,000 women. Women in the age bracket of 20 to 34 years have the highest fertility rate with 114.0 births per 1,000 women. Women in the age bracket of 20 to 34 years acount for 100.0% of all women with births.
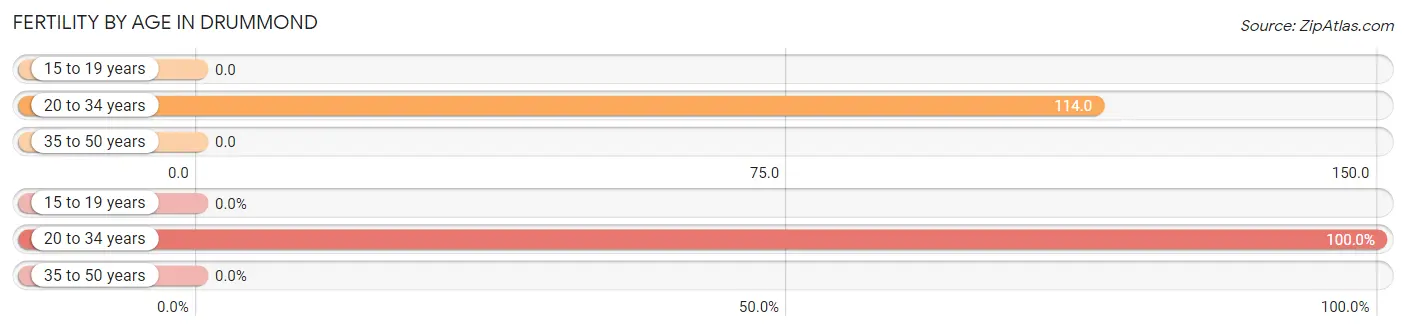
| Age Bracket | Women with Births | Births / 1,000 Women |
| 15 to 19 years | 0 (0.0%) | 0.0 |
| 20 to 34 years | 5 (100.0%) | 114.0 |
| 35 to 50 years | 0 (0.0%) | 0.0 |
| Total | 5 (100.0%) | 75.0 |
Fertility by Age by Marriage Status in Drummond
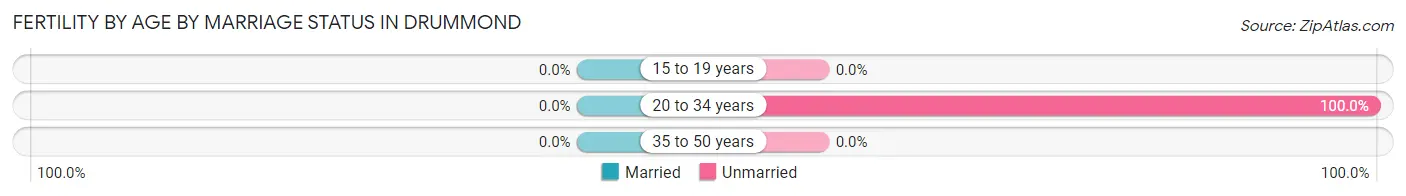
| Age Bracket | Married | Unmarried |
| 15 to 19 years | 0 (0.0%) | 0 (0.0%) |
| 20 to 34 years | 0 (0.0%) | 5 (100.0%) |
| 35 to 50 years | 0 (0.0%) | 0 (0.0%) |
| Total | 0 (0.0%) | 5 (100.0%) |
Fertility by Education in Drummond
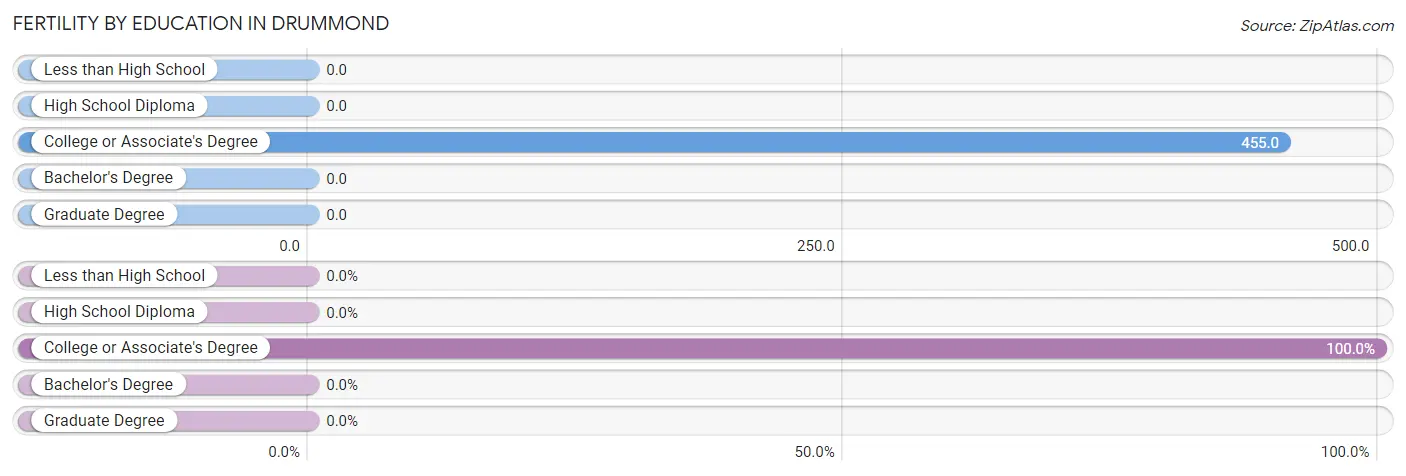
| Educational Attainment | Women with Births | Births / 1,000 Women |
| Less than High School | 0 (0.0%) | 0.0 |
| High School Diploma | 0 (0.0%) | 0.0 |
| College or Associate's Degree | 5 (100.0%) | 455.0 |
| Bachelor's Degree | 0 (0.0%) | 0.0 |
| Graduate Degree | 0 (0.0%) | 0.0 |
| Total | 5 (100.0%) | 75.0 |
Fertility by Education by Marriage Status in Drummond
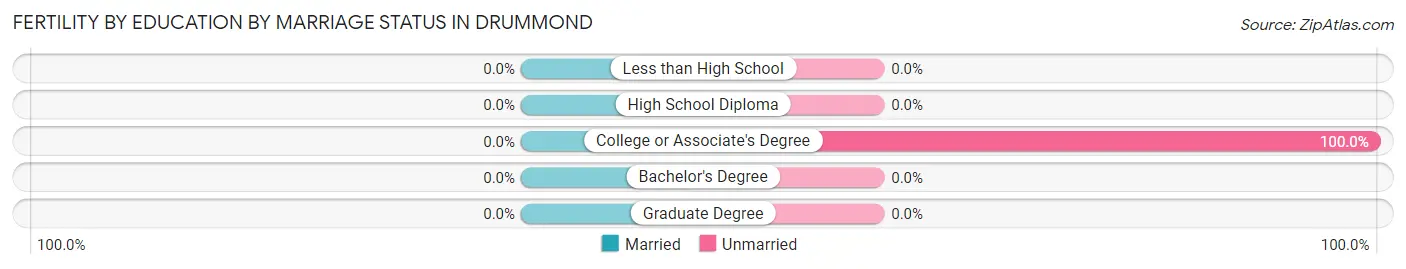
| Educational Attainment | Married | Unmarried |
| Less than High School | 0 (0.0%) | 0 (0.0%) |
| High School Diploma | 0 (0.0%) | 0 (0.0%) |
| College or Associate's Degree | 0 (0.0%) | 5 (100.0%) |
| Bachelor's Degree | 0 (0.0%) | 0 (0.0%) |
| Graduate Degree | 0 (0.0%) | 0 (0.0%) |
| Total | 0 (0.0%) | 5 (100.0%) |
Employment Characteristics in Drummond
Employment by Class of Employer in Drummond
Among the 171 employed individuals in Drummond, private company employees (146 | 85.4%), local government employees (15 | 8.8%), and state government employees (5 | 2.9%) make up the most common classes of employment.
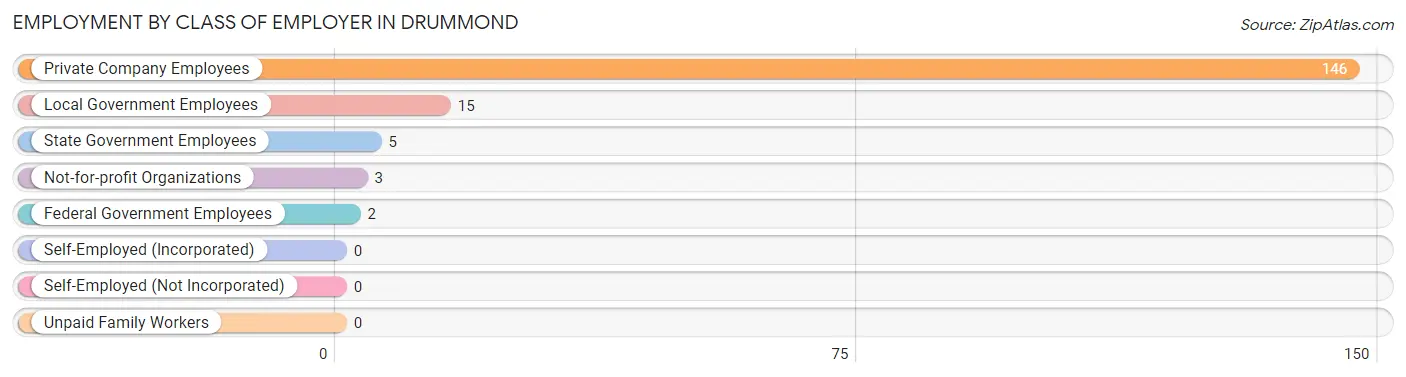
| Employer Class | # Employees | % Employees |
| Private Company Employees | 146 | 85.4% |
| Self-Employed (Incorporated) | 0 | 0.0% |
| Self-Employed (Not Incorporated) | 0 | 0.0% |
| Not-for-profit Organizations | 3 | 1.8% |
| Local Government Employees | 15 | 8.8% |
| State Government Employees | 5 | 2.9% |
| Federal Government Employees | 2 | 1.2% |
| Unpaid Family Workers | 0 | 0.0% |
| Total | 171 | 100.0% |
Employment Status by Age in Drummond
According to the labor force statistics for Drummond, out of the total population over 16 years of age (312), 60.9% or 190 individuals are in the labor force, with 8.4% or 16 of them unemployed. The age group with the highest labor force participation rate is 16 to 19 years, with 100.0% or 7 individuals in the labor force. Within the labor force, the 16 to 19 years age range has the highest percentage of unemployed individuals, with 100.0% or 7 of them being unemployed.
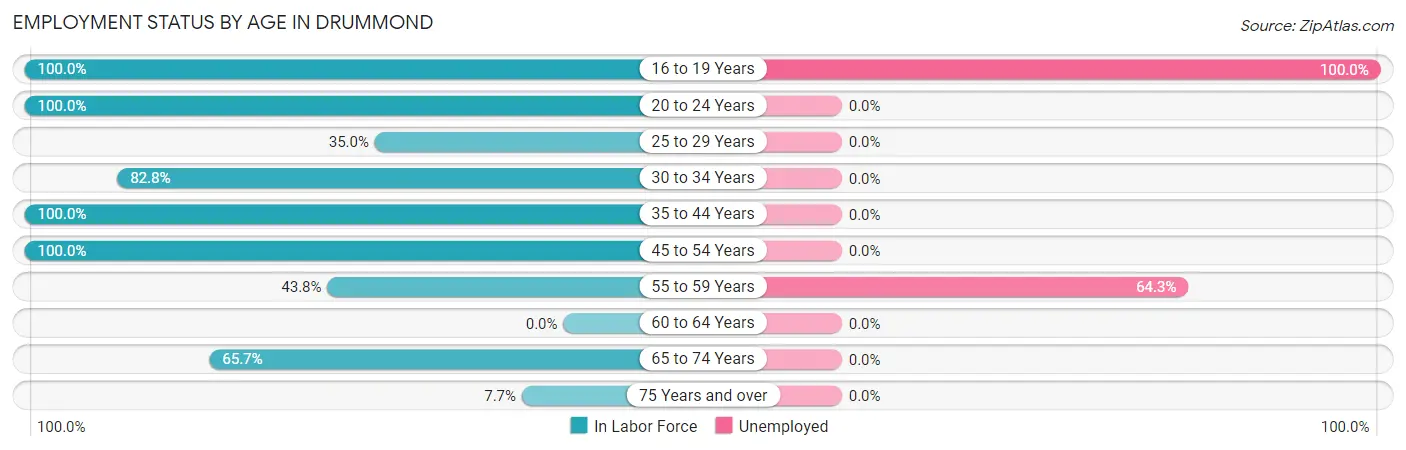
| Age Bracket | In Labor Force | Unemployed |
| 16 to 19 Years | 7 (100.0%) | 7 (100.0%) |
| 20 to 24 Years | 8 (100.0%) | 0 (0.0%) |
| 25 to 29 Years | 21 (35.0%) | 0 (0.0%) |
| 30 to 34 Years | 24 (82.8%) | 0 (0.0%) |
| 35 to 44 Years | 18 (100.0%) | 0 (0.0%) |
| 45 to 54 Years | 32 (100.0%) | 0 (0.0%) |
| 55 to 59 Years | 14 (43.8%) | 9 (64.3%) |
| 60 to 64 Years | 0 (0.0%) | 0 (0.0%) |
| 65 to 74 Years | 65 (65.7%) | 0 (0.0%) |
| 75 Years and over | 1 (7.7%) | 0 (0.0%) |
| Total | 190 (60.9%) | 16 (8.4%) |
Employment Status by Educational Attainment in Drummond
According to labor force statistics for Drummond, 58.9% of individuals (109) out of the total population between 25 and 64 years of age (185) are in the labor force, with 8.3% or 9 of them being unemployed. The group with the highest labor force participation rate are those with the educational attainment of high school diploma, with 79.2% or 61 individuals in the labor force. Within the labor force, individuals with high school diploma education have the highest percentage of unemployment, with 14.8% or 9 of them being unemployed.
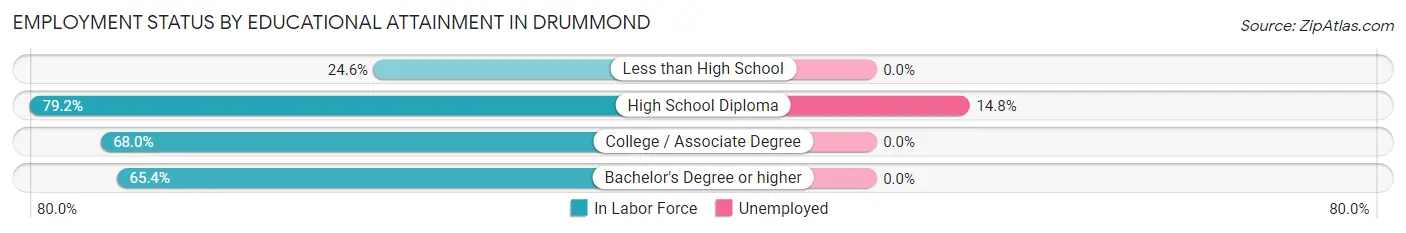
| Educational Attainment | In Labor Force | Unemployed |
| Less than High School | 14 (24.6%) | 0 (0.0%) |
| High School Diploma | 61 (79.2%) | 11 (14.8%) |
| College / Associate Degree | 17 (68.0%) | 0 (0.0%) |
| Bachelor's Degree or higher | 17 (65.4%) | 0 (0.0%) |
| Total | 109 (58.9%) | 15 (8.3%) |
Employment Occupations by Sex in Drummond
Management, Business, Science and Arts Occupations
The most common Management, Business, Science and Arts occupations in Drummond are Management (16 | 9.2%), Health Diagnosing & Treating (11 | 6.3%), Community & Social Service (10 | 5.8%), and Education Instruction & Library (10 | 5.8%).
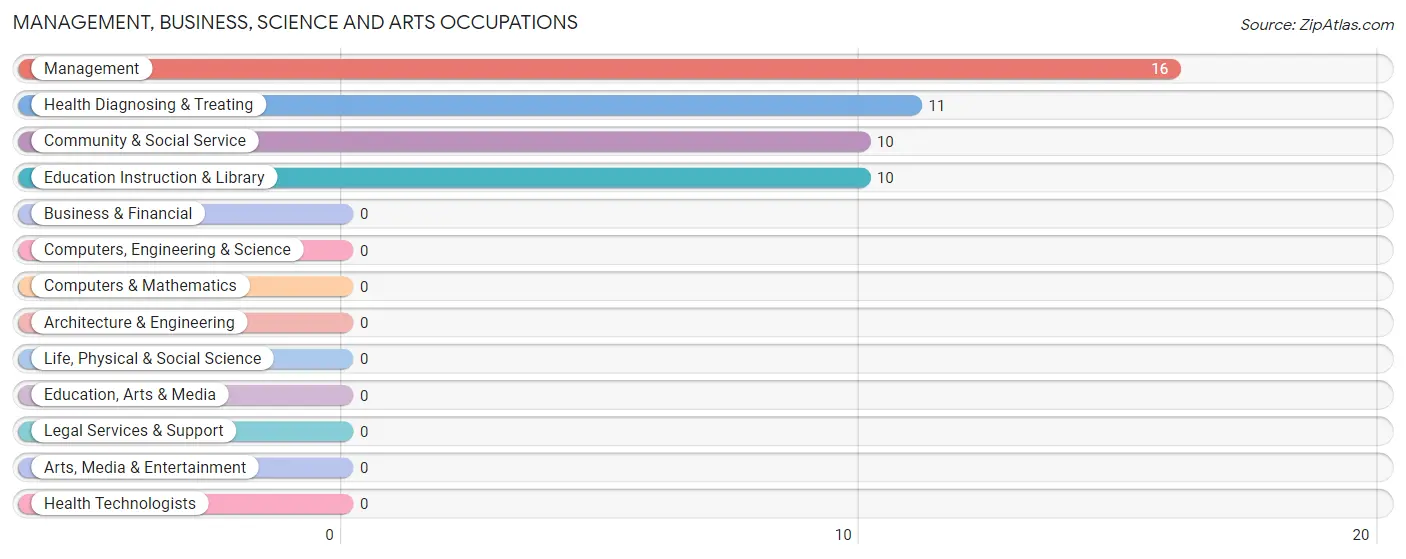
Management, Business, Science and Arts Occupations by Sex
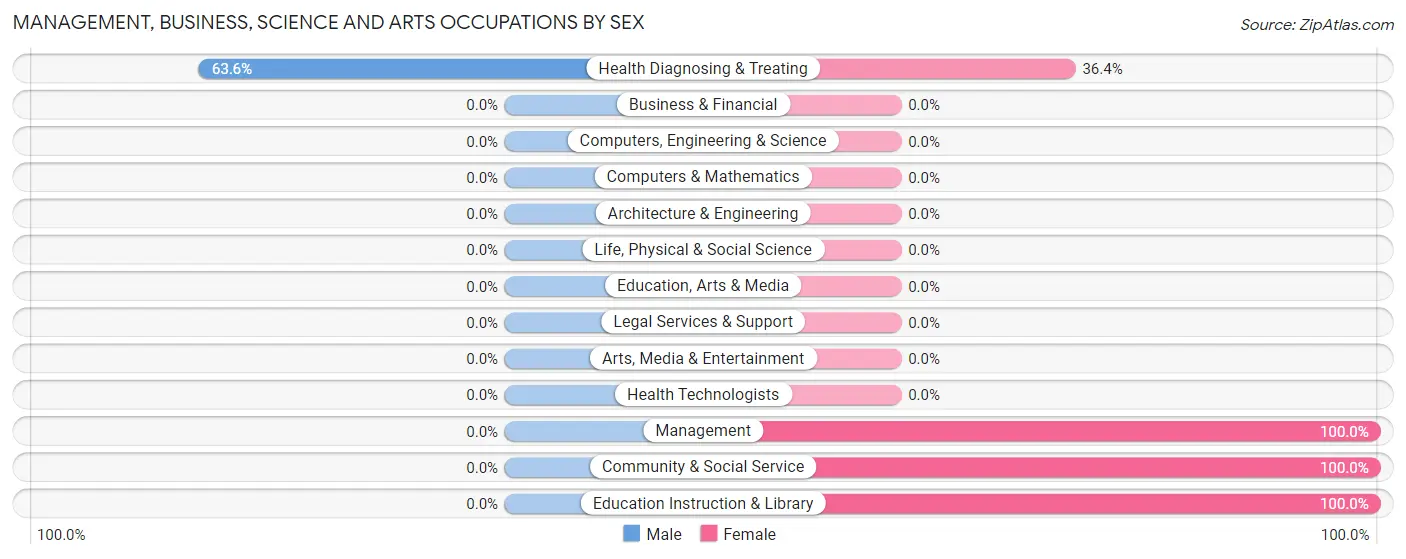
| Occupation | Male | Female |
| Management | 0 (0.0%) | 16 (100.0%) |
| Business & Financial | 0 (0.0%) | 0 (0.0%) |
| Computers, Engineering & Science | 0 (0.0%) | 0 (0.0%) |
| Computers & Mathematics | 0 (0.0%) | 0 (0.0%) |
| Architecture & Engineering | 0 (0.0%) | 0 (0.0%) |
| Life, Physical & Social Science | 0 (0.0%) | 0 (0.0%) |
| Community & Social Service | 0 (0.0%) | 10 (100.0%) |
| Education, Arts & Media | 0 (0.0%) | 0 (0.0%) |
| Legal Services & Support | 0 (0.0%) | 0 (0.0%) |
| Education Instruction & Library | 0 (0.0%) | 10 (100.0%) |
| Arts, Media & Entertainment | 0 (0.0%) | 0 (0.0%) |
| Health Diagnosing & Treating | 7 (63.6%) | 4 (36.4%) |
| Health Technologists | 0 (0.0%) | 0 (0.0%) |
| Total (Category) | 7 (18.9%) | 30 (81.1%) |
| Total (Overall) | 112 (64.4%) | 62 (35.6%) |
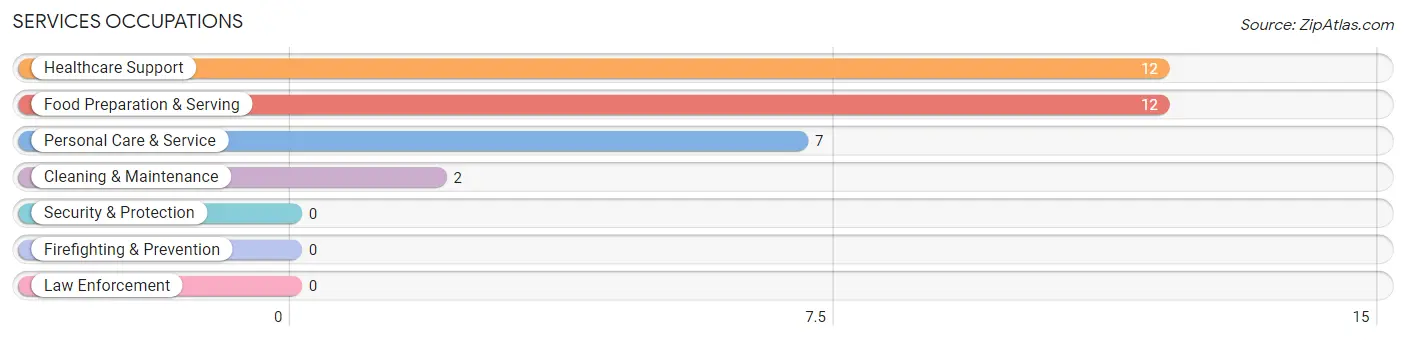
Services Occupations
The most common Services occupations in Drummond are Healthcare Support (12 | 6.9%), Food Preparation & Serving (12 | 6.9%), Personal Care & Service (7 | 4.0%), and Cleaning & Maintenance (2 | 1.1%).
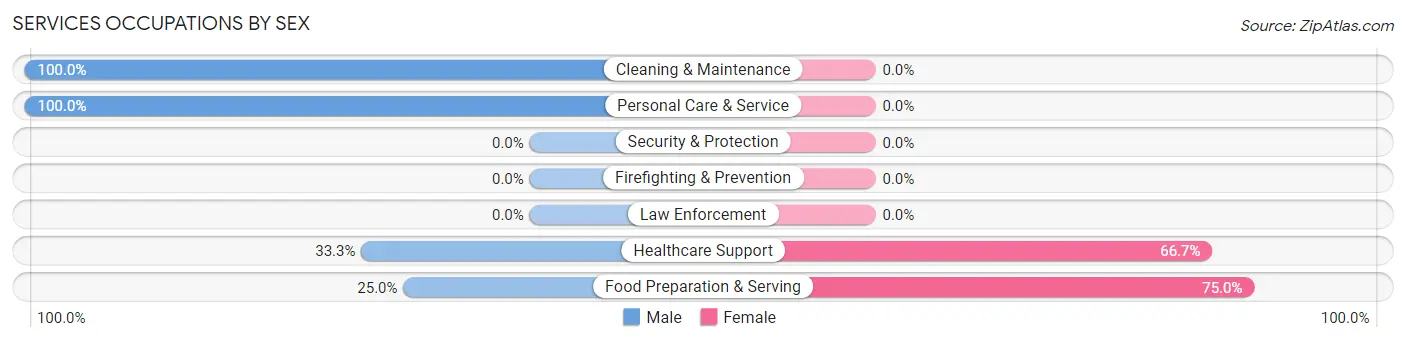
Services Occupations by Sex
Within the Services occupations in Drummond, the most male-oriented occupations are Cleaning & Maintenance (100.0%), Personal Care & Service (100.0%), and Healthcare Support (33.3%), while the most female-oriented occupations are Food Preparation & Serving (75.0%), and Healthcare Support (66.7%).
| Occupation | Male | Female |
| Healthcare Support | 4 (33.3%) | 8 (66.7%) |
| Security & Protection | 0 (0.0%) | 0 (0.0%) |
| Firefighting & Prevention | 0 (0.0%) | 0 (0.0%) |
| Law Enforcement | 0 (0.0%) | 0 (0.0%) |
| Food Preparation & Serving | 3 (25.0%) | 9 (75.0%) |
| Cleaning & Maintenance | 2 (100.0%) | 0 (0.0%) |
| Personal Care & Service | 7 (100.0%) | 0 (0.0%) |
| Total (Category) | 16 (48.5%) | 17 (51.5%) |
| Total (Overall) | 112 (64.4%) | 62 (35.6%) |
Sales and Office Occupations
The most common Sales and Office occupations in Drummond are Office & Administration (11 | 6.3%), and Sales & Related (7 | 4.0%).
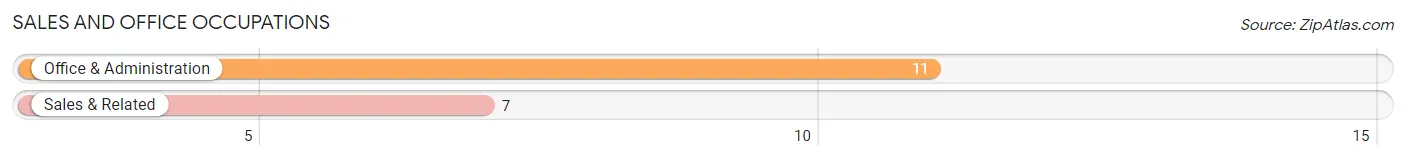
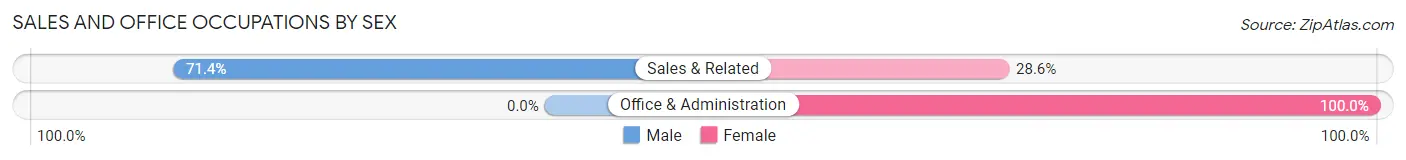
Sales and Office Occupations by Sex
| Occupation | Male | Female |
| Sales & Related | 5 (71.4%) | 2 (28.6%) |
| Office & Administration | 0 (0.0%) | 11 (100.0%) |
| Total (Category) | 5 (27.8%) | 13 (72.2%) |
| Total (Overall) | 112 (64.4%) | 62 (35.6%) |
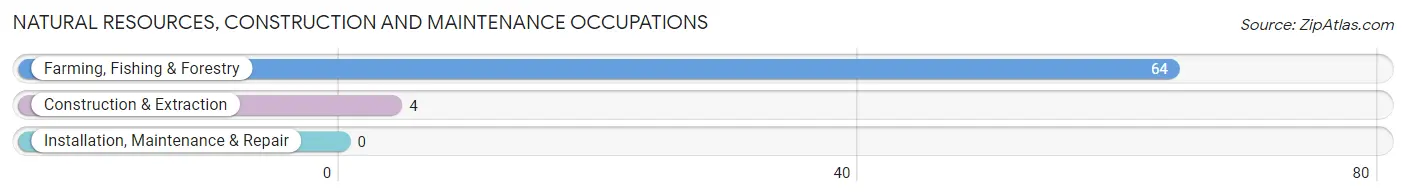
Natural Resources, Construction and Maintenance Occupations
The most common Natural Resources, Construction and Maintenance occupations in Drummond are Farming, Fishing & Forestry (64 | 36.8%), and Construction & Extraction (4 | 2.3%).
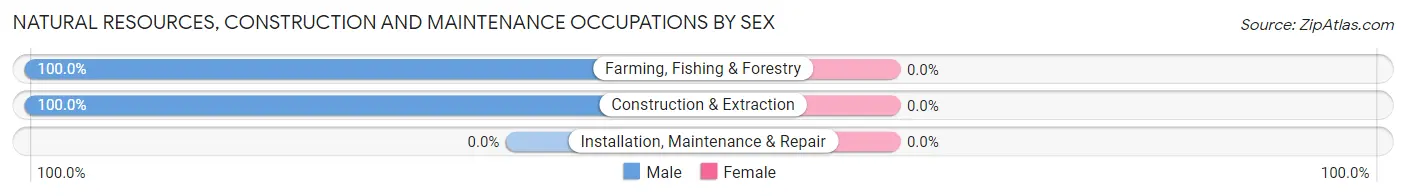
Natural Resources, Construction and Maintenance Occupations by Sex
| Occupation | Male | Female |
| Farming, Fishing & Forestry | 64 (100.0%) | 0 (0.0%) |
| Construction & Extraction | 4 (100.0%) | 0 (0.0%) |
| Installation, Maintenance & Repair | 0 (0.0%) | 0 (0.0%) |
| Total (Category) | 68 (100.0%) | 0 (0.0%) |
| Total (Overall) | 112 (64.4%) | 62 (35.6%) |
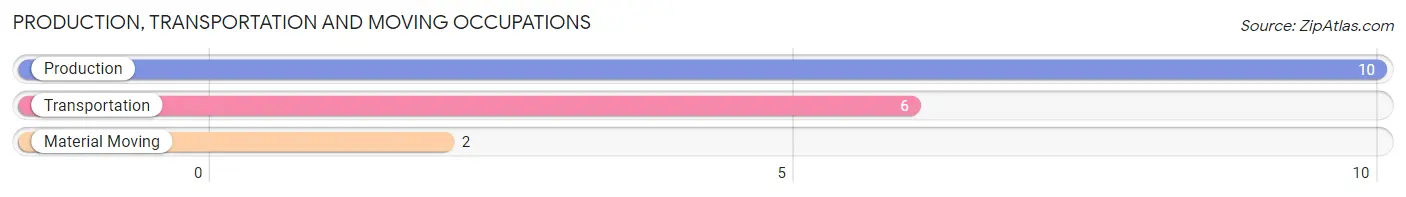
Production, Transportation and Moving Occupations
The most common Production, Transportation and Moving occupations in Drummond are Production (10 | 5.8%), Transportation (6 | 3.5%), and Material Moving (2 | 1.1%).
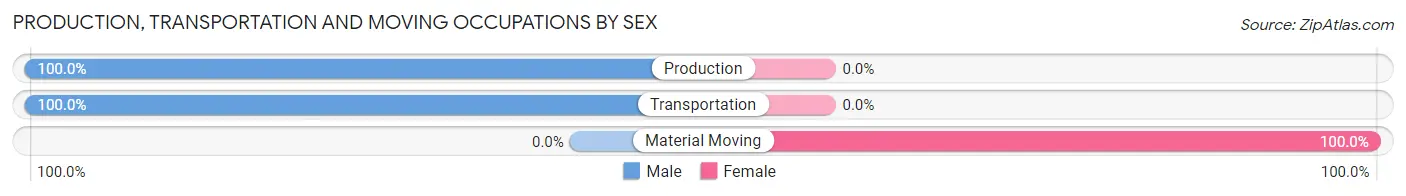
Production, Transportation and Moving Occupations by Sex
| Occupation | Male | Female |
| Production | 10 (100.0%) | 0 (0.0%) |
| Transportation | 6 (100.0%) | 0 (0.0%) |
| Material Moving | 0 (0.0%) | 2 (100.0%) |
| Total (Category) | 16 (88.9%) | 2 (11.1%) |
| Total (Overall) | 112 (64.4%) | 62 (35.6%) |
Employment Industries by Sex in Drummond
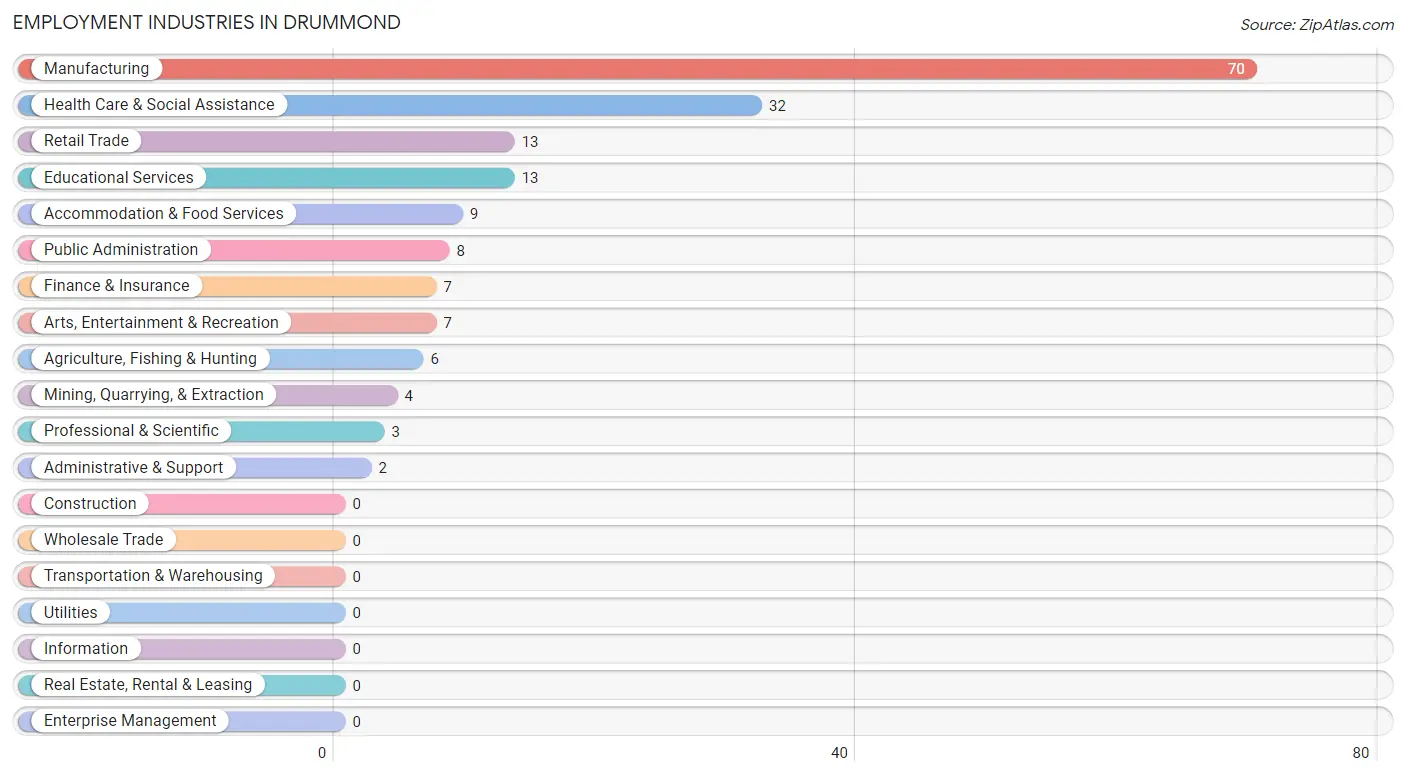
Employment Industries in Drummond
The major employment industries in Drummond include Manufacturing (70 | 40.2%), Health Care & Social Assistance (32 | 18.4%), Retail Trade (13 | 7.5%), Educational Services (13 | 7.5%), and Accommodation & Food Services (9 | 5.2%).
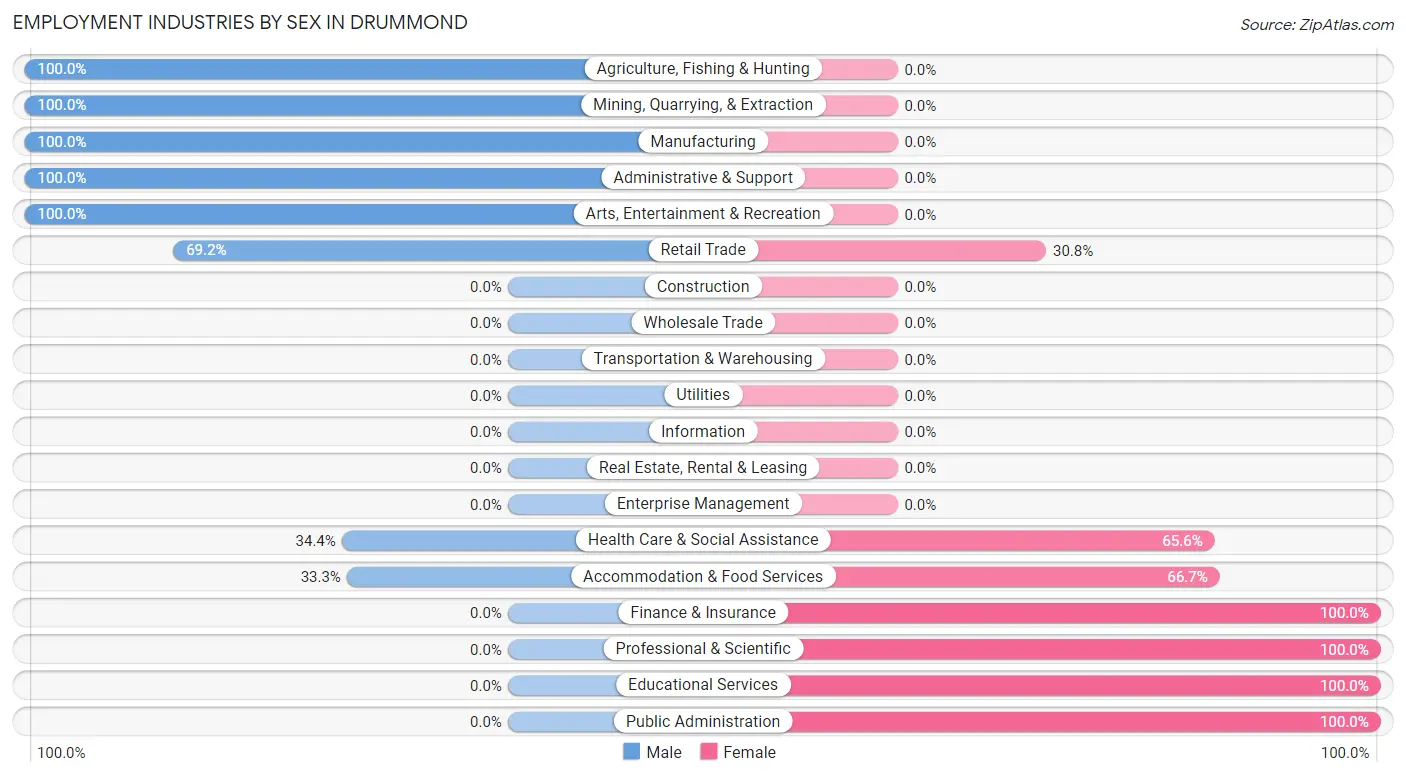
Employment Industries by Sex in Drummond
The Drummond industries that see more men than women are Agriculture, Fishing & Hunting (100.0%), Mining, Quarrying, & Extraction (100.0%), and Manufacturing (100.0%), whereas the industries that tend to have a higher number of women are Finance & Insurance (100.0%), Professional & Scientific (100.0%), and Educational Services (100.0%).
| Industry | Male | Female |
| Agriculture, Fishing & Hunting | 6 (100.0%) | 0 (0.0%) |
| Mining, Quarrying, & Extraction | 4 (100.0%) | 0 (0.0%) |
| Construction | 0 (0.0%) | 0 (0.0%) |
| Manufacturing | 70 (100.0%) | 0 (0.0%) |
| Wholesale Trade | 0 (0.0%) | 0 (0.0%) |
| Retail Trade | 9 (69.2%) | 4 (30.8%) |
| Transportation & Warehousing | 0 (0.0%) | 0 (0.0%) |
| Utilities | 0 (0.0%) | 0 (0.0%) |
| Information | 0 (0.0%) | 0 (0.0%) |
| Finance & Insurance | 0 (0.0%) | 7 (100.0%) |
| Real Estate, Rental & Leasing | 0 (0.0%) | 0 (0.0%) |
| Professional & Scientific | 0 (0.0%) | 3 (100.0%) |
| Enterprise Management | 0 (0.0%) | 0 (0.0%) |
| Administrative & Support | 2 (100.0%) | 0 (0.0%) |
| Educational Services | 0 (0.0%) | 13 (100.0%) |
| Health Care & Social Assistance | 11 (34.4%) | 21 (65.6%) |
| Arts, Entertainment & Recreation | 7 (100.0%) | 0 (0.0%) |
| Accommodation & Food Services | 3 (33.3%) | 6 (66.7%) |
| Public Administration | 0 (0.0%) | 8 (100.0%) |
| Total | 112 (64.4%) | 62 (35.6%) |
Education in Drummond
School Enrollment in Drummond
The most common levels of schooling among the 92 students in Drummond are elementary school (43 | 46.7%), middle school (18 | 19.6%), and high school (14 | 15.2%).
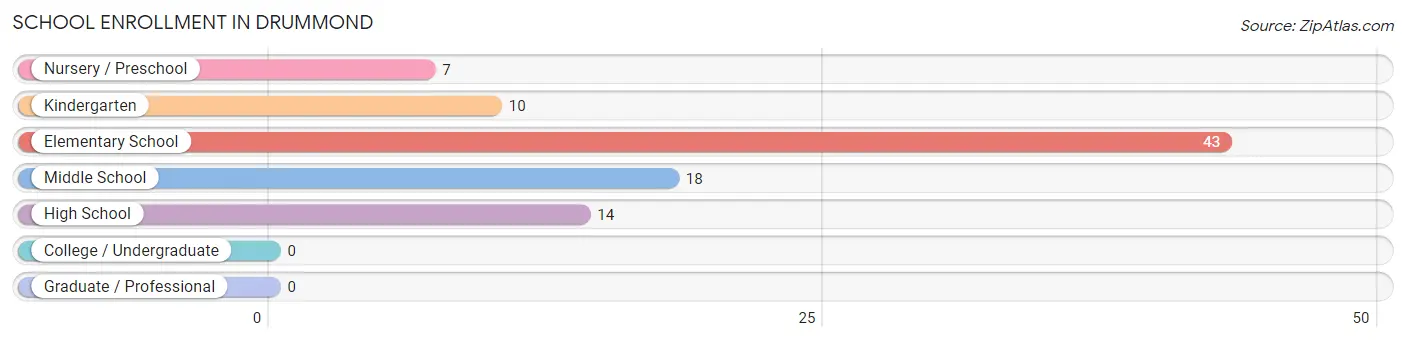
| School Level | # Students | % Students |
| Nursery / Preschool | 7 | 7.6% |
| Kindergarten | 10 | 10.9% |
| Elementary School | 43 | 46.7% |
| Middle School | 18 | 19.6% |
| High School | 14 | 15.2% |
| College / Undergraduate | 0 | 0.0% |
| Graduate / Professional | 0 | 0.0% |
| Total | 92 | 100.0% |
School Enrollment by Age by Funding Source in Drummond
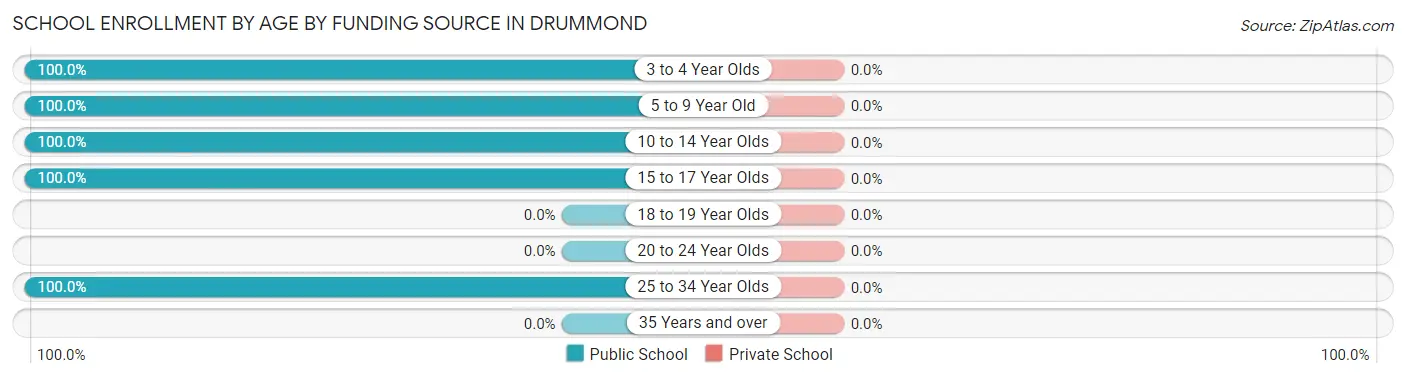
| Age Bracket | Public School | Private School |
| 3 to 4 Year Olds | 7 (100.0%) | 0 (0.0%) |
| 5 to 9 Year Old | 47 (100.0%) | 0 (0.0%) |
| 10 to 14 Year Olds | 24 (100.0%) | 0 (0.0%) |
| 15 to 17 Year Olds | 4 (100.0%) | 0 (0.0%) |
| 18 to 19 Year Olds | 0 (0.0%) | 0 (0.0%) |
| 20 to 24 Year Olds | 0 (0.0%) | 0 (0.0%) |
| 25 to 34 Year Olds | 10 (100.0%) | 0 (0.0%) |
| 35 Years and over | 0 (0.0%) | 0 (0.0%) |
| Total | 92 (100.0%) | 0 (0.0%) |
Educational Attainment by Field of Study in Drummond
Education (18 | 60.0%), psychology (7 | 23.3%), business (4 | 13.3%), and physical & health sciences (1 | 3.3%) are the most common fields of study among 30 individuals in Drummond who have obtained a bachelor's degree or higher.
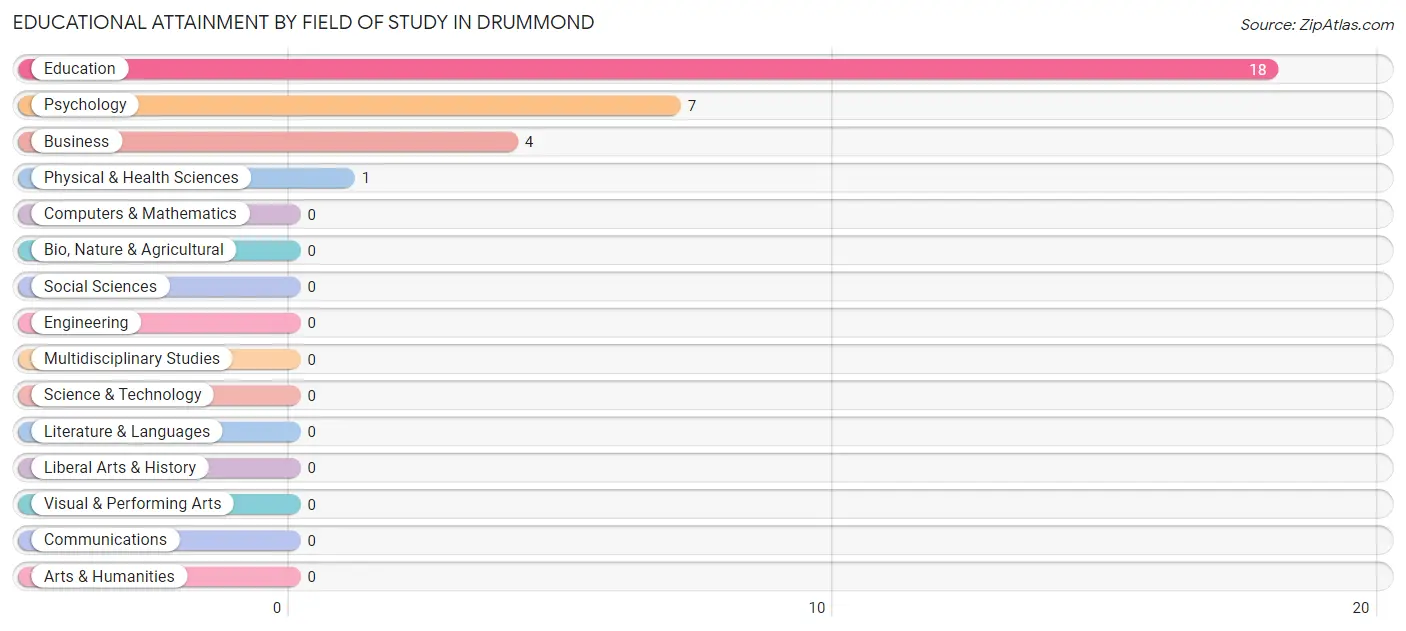
| Field of Study | # Graduates | % Graduates |
| Computers & Mathematics | 0 | 0.0% |
| Bio, Nature & Agricultural | 0 | 0.0% |
| Physical & Health Sciences | 1 | 3.3% |
| Psychology | 7 | 23.3% |
| Social Sciences | 0 | 0.0% |
| Engineering | 0 | 0.0% |
| Multidisciplinary Studies | 0 | 0.0% |
| Science & Technology | 0 | 0.0% |
| Business | 4 | 13.3% |
| Education | 18 | 60.0% |
| Literature & Languages | 0 | 0.0% |
| Liberal Arts & History | 0 | 0.0% |
| Visual & Performing Arts | 0 | 0.0% |
| Communications | 0 | 0.0% |
| Arts & Humanities | 0 | 0.0% |
| Total | 30 | 100.0% |
Transportation & Commute in Drummond
Vehicle Availability by Sex in Drummond
The most prevalent vehicle ownership categories in Drummond are males with 2 vehicles (98, accounting for 89.9%) and females with 2 vehicles (31, making up 158.1%).
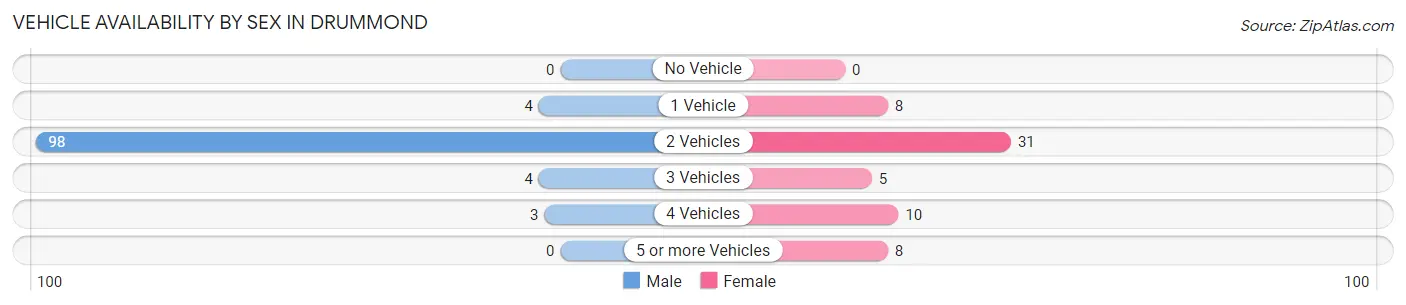
| Vehicles Available | Male | Female |
| No Vehicle | 0 (0.0%) | 0 (0.0%) |
| 1 Vehicle | 4 (3.7%) | 8 (12.9%) |
| 2 Vehicles | 98 (89.9%) | 31 (50.0%) |
| 3 Vehicles | 4 (3.7%) | 5 (8.1%) |
| 4 Vehicles | 3 (2.8%) | 10 (16.1%) |
| 5 or more Vehicles | 0 (0.0%) | 8 (12.9%) |
| Total | 109 (100.0%) | 62 (100.0%) |
Commute Time in Drummond
The most frequently occuring commute durations in Drummond are 60 to 89 minutes (66 commuters, 38.6%), 15 to 19 minutes (32 commuters, 18.7%), and 20 to 24 minutes (24 commuters, 14.0%).
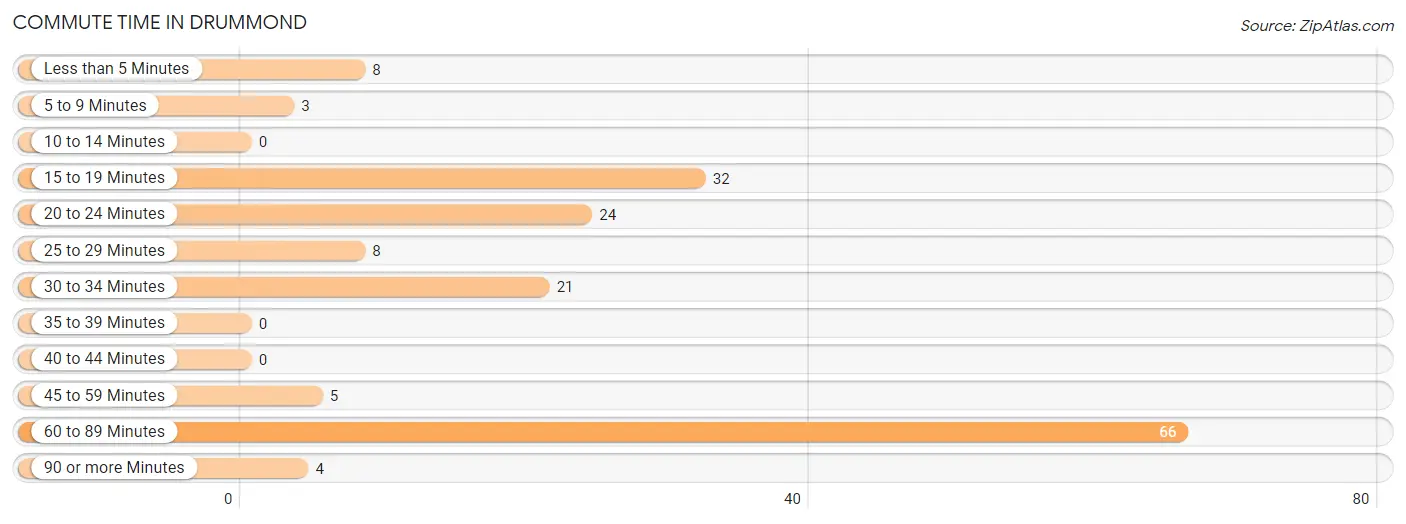
| Commute Time | # Commuters | % Commuters |
| Less than 5 Minutes | 8 | 4.7% |
| 5 to 9 Minutes | 3 | 1.8% |
| 10 to 14 Minutes | 0 | 0.0% |
| 15 to 19 Minutes | 32 | 18.7% |
| 20 to 24 Minutes | 24 | 14.0% |
| 25 to 29 Minutes | 8 | 4.7% |
| 30 to 34 Minutes | 21 | 12.3% |
| 35 to 39 Minutes | 0 | 0.0% |
| 40 to 44 Minutes | 0 | 0.0% |
| 45 to 59 Minutes | 5 | 2.9% |
| 60 to 89 Minutes | 66 | 38.6% |
| 90 or more Minutes | 4 | 2.3% |
Commute Time by Sex in Drummond
The most common commute times in Drummond are 60 to 89 minutes (66 commuters, 60.6%) for males and 15 to 19 minutes (25 commuters, 40.3%) for females.
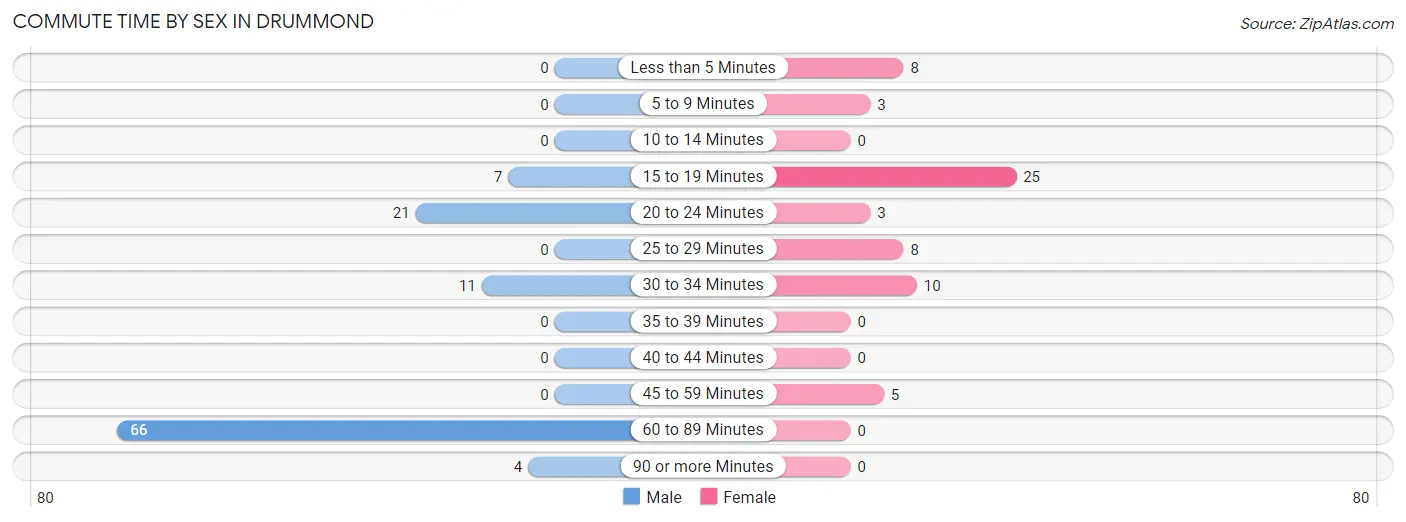
| Commute Time | Male | Female |
| Less than 5 Minutes | 0 (0.0%) | 8 (12.9%) |
| 5 to 9 Minutes | 0 (0.0%) | 3 (4.8%) |
| 10 to 14 Minutes | 0 (0.0%) | 0 (0.0%) |
| 15 to 19 Minutes | 7 (6.4%) | 25 (40.3%) |
| 20 to 24 Minutes | 21 (19.3%) | 3 (4.8%) |
| 25 to 29 Minutes | 0 (0.0%) | 8 (12.9%) |
| 30 to 34 Minutes | 11 (10.1%) | 10 (16.1%) |
| 35 to 39 Minutes | 0 (0.0%) | 0 (0.0%) |
| 40 to 44 Minutes | 0 (0.0%) | 0 (0.0%) |
| 45 to 59 Minutes | 0 (0.0%) | 5 (8.1%) |
| 60 to 89 Minutes | 66 (60.6%) | 0 (0.0%) |
| 90 or more Minutes | 4 (3.7%) | 0 (0.0%) |
Time of Departure to Work by Sex in Drummond
The most frequent times of departure to work in Drummond are 8:00 AM to 8:29 AM (68, 62.4%) for males and 7:30 AM to 7:59 AM (23, 37.1%) for females.
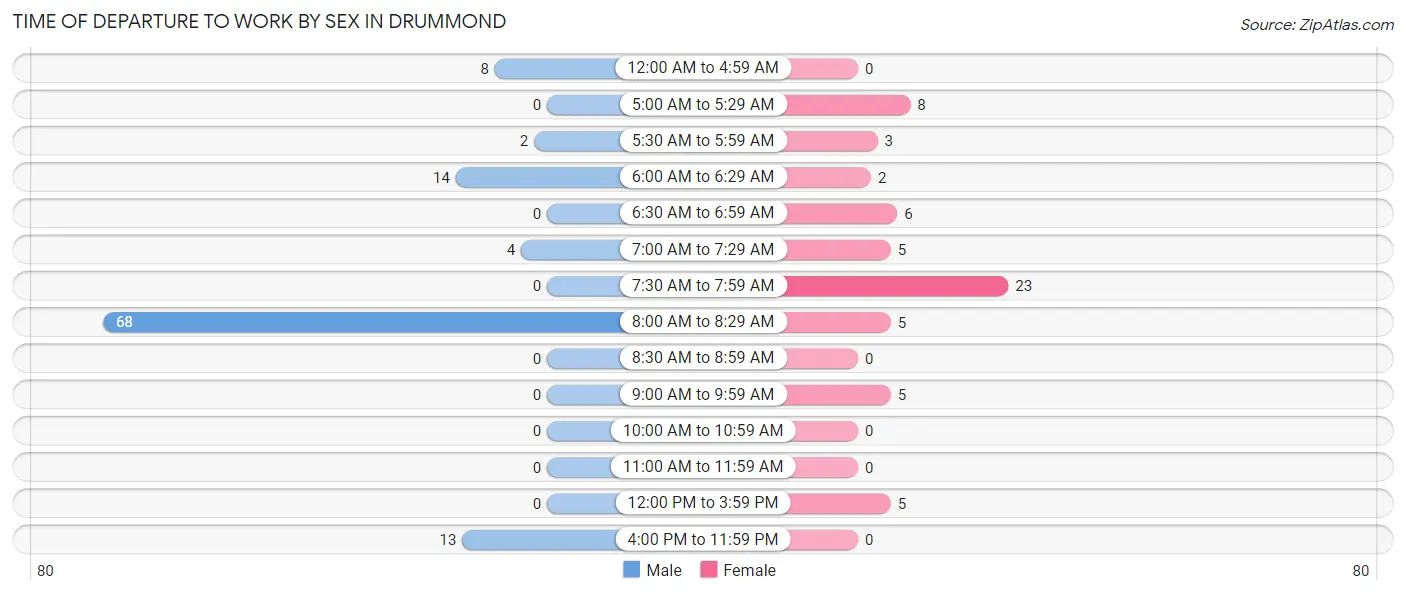
| Time of Departure | Male | Female |
| 12:00 AM to 4:59 AM | 8 (7.3%) | 0 (0.0%) |
| 5:00 AM to 5:29 AM | 0 (0.0%) | 8 (12.9%) |
| 5:30 AM to 5:59 AM | 2 (1.8%) | 3 (4.8%) |
| 6:00 AM to 6:29 AM | 14 (12.8%) | 2 (3.2%) |
| 6:30 AM to 6:59 AM | 0 (0.0%) | 6 (9.7%) |
| 7:00 AM to 7:29 AM | 4 (3.7%) | 5 (8.1%) |
| 7:30 AM to 7:59 AM | 0 (0.0%) | 23 (37.1%) |
| 8:00 AM to 8:29 AM | 68 (62.4%) | 5 (8.1%) |
| 8:30 AM to 8:59 AM | 0 (0.0%) | 0 (0.0%) |
| 9:00 AM to 9:59 AM | 0 (0.0%) | 5 (8.1%) |
| 10:00 AM to 10:59 AM | 0 (0.0%) | 0 (0.0%) |
| 11:00 AM to 11:59 AM | 0 (0.0%) | 0 (0.0%) |
| 12:00 PM to 3:59 PM | 0 (0.0%) | 5 (8.1%) |
| 4:00 PM to 11:59 PM | 13 (11.9%) | 0 (0.0%) |
| Total | 109 (100.0%) | 62 (100.0%) |
Housing Occupancy in Drummond
Occupancy by Ownership in Drummond
Of the total 189 dwellings in Drummond, owner-occupied units account for 170 (89.9%), while renter-occupied units make up 19 (10.1%).
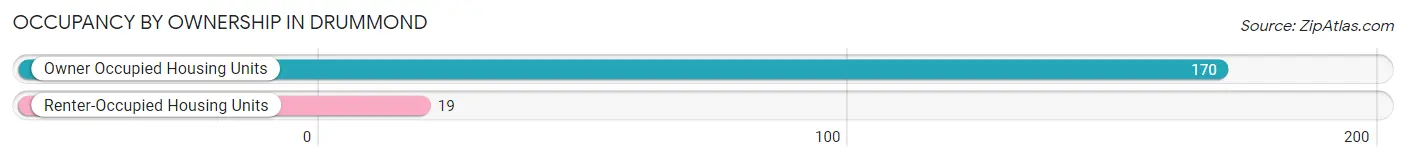
| Occupancy | # Housing Units | % Housing Units |
| Owner Occupied Housing Units | 170 | 89.9% |
| Renter-Occupied Housing Units | 19 | 10.1% |
| Total Occupied Housing Units | 189 | 100.0% |
Occupancy by Household Size in Drummond
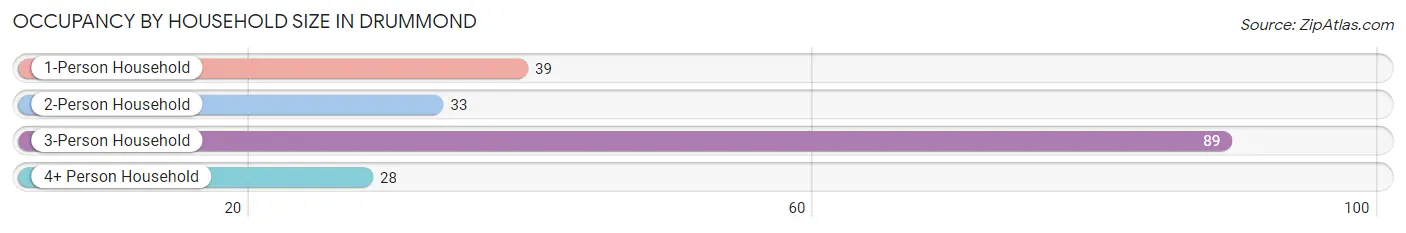
| Household Size | # Housing Units | % Housing Units |
| 1-Person Household | 39 | 20.6% |
| 2-Person Household | 33 | 17.5% |
| 3-Person Household | 89 | 47.1% |
| 4+ Person Household | 28 | 14.8% |
| Total Housing Units | 189 | 100.0% |
Occupancy by Ownership by Household Size in Drummond
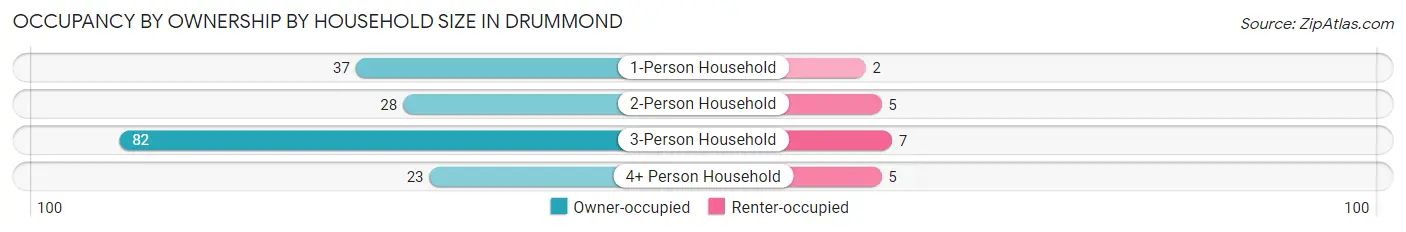
| Household Size | Owner-occupied | Renter-occupied |
| 1-Person Household | 37 (94.9%) | 2 (5.1%) |
| 2-Person Household | 28 (84.9%) | 5 (15.1%) |
| 3-Person Household | 82 (92.1%) | 7 (7.9%) |
| 4+ Person Household | 23 (82.1%) | 5 (17.9%) |
| Total Housing Units | 170 (89.9%) | 19 (10.1%) |
Occupancy by Educational Attainment in Drummond
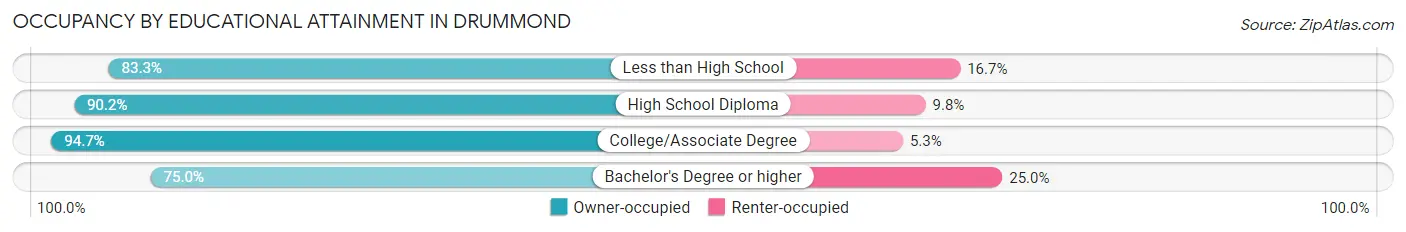
| Household Size | Owner-occupied | Renter-occupied |
| Less than High School | 20 (83.3%) | 4 (16.7%) |
| High School Diploma | 46 (90.2%) | 5 (9.8%) |
| College/Associate Degree | 89 (94.7%) | 5 (5.3%) |
| Bachelor's Degree or higher | 15 (75.0%) | 5 (25.0%) |
Occupancy by Age of Householder in Drummond
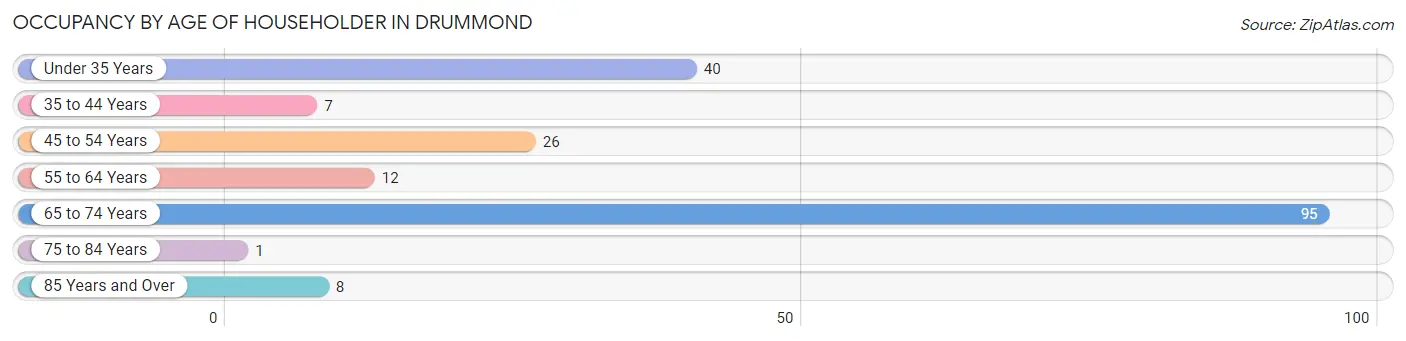
| Age Bracket | # Households | % Households |
| Under 35 Years | 40 | 21.2% |
| 35 to 44 Years | 7 | 3.7% |
| 45 to 54 Years | 26 | 13.8% |
| 55 to 64 Years | 12 | 6.4% |
| 65 to 74 Years | 95 | 50.3% |
| 75 to 84 Years | 1 | 0.5% |
| 85 Years and Over | 8 | 4.2% |
| Total | 189 | 100.0% |
Housing Finances in Drummond
Median Income by Occupancy in Drummond
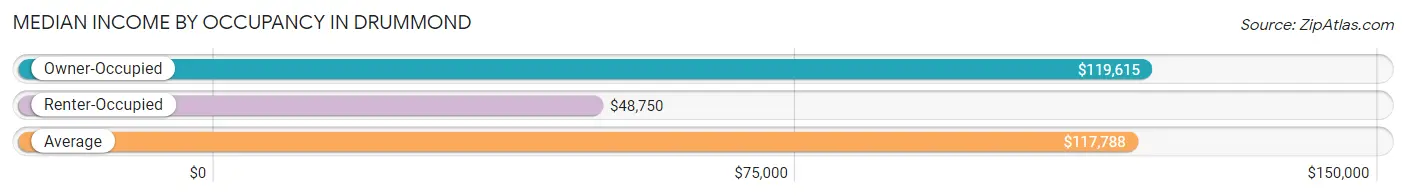
| Occupancy Type | # Households | Median Income |
| Owner-Occupied | 170 (89.9%) | $119,615 |
| Renter-Occupied | 19 (10.1%) | $48,750 |
| Average | 189 (100.0%) | $117,788 |
Occupancy by Householder Income Bracket in Drummond
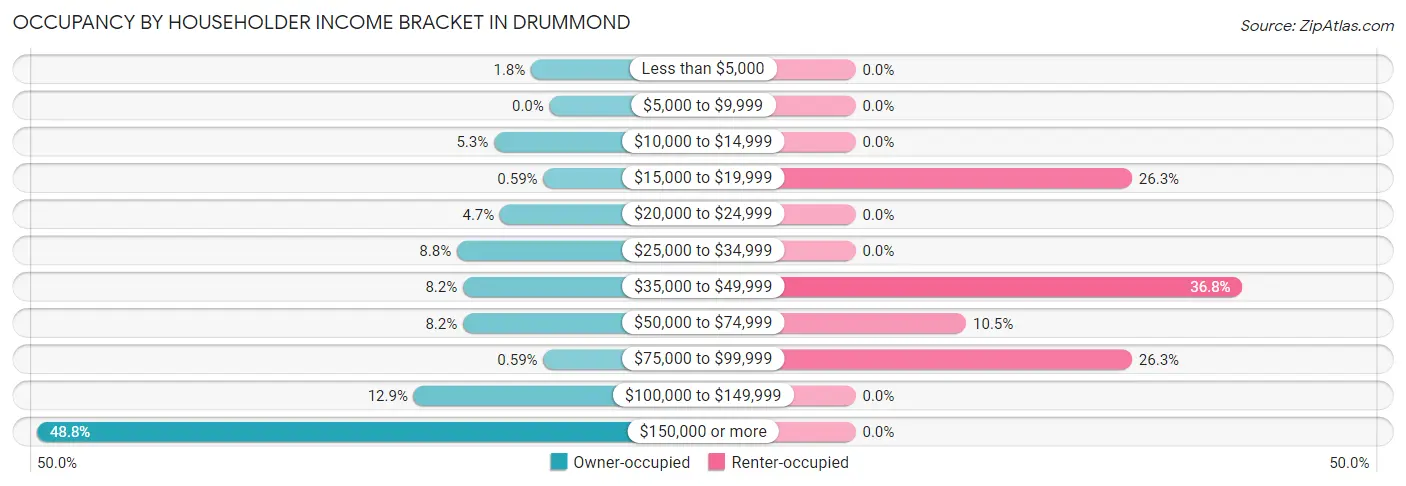
| Income Bracket | Owner-occupied | Renter-occupied |
| Less than $5,000 | 3 (1.8%) | 0 (0.0%) |
| $5,000 to $9,999 | 0 (0.0%) | 0 (0.0%) |
| $10,000 to $14,999 | 9 (5.3%) | 0 (0.0%) |
| $15,000 to $19,999 | 1 (0.6%) | 5 (26.3%) |
| $20,000 to $24,999 | 8 (4.7%) | 0 (0.0%) |
| $25,000 to $34,999 | 15 (8.8%) | 0 (0.0%) |
| $35,000 to $49,999 | 14 (8.2%) | 7 (36.8%) |
| $50,000 to $74,999 | 14 (8.2%) | 2 (10.5%) |
| $75,000 to $99,999 | 1 (0.6%) | 5 (26.3%) |
| $100,000 to $149,999 | 22 (12.9%) | 0 (0.0%) |
| $150,000 or more | 83 (48.8%) | 0 (0.0%) |
| Total | 170 (100.0%) | 19 (100.0%) |
Monthly Housing Cost Tiers in Drummond
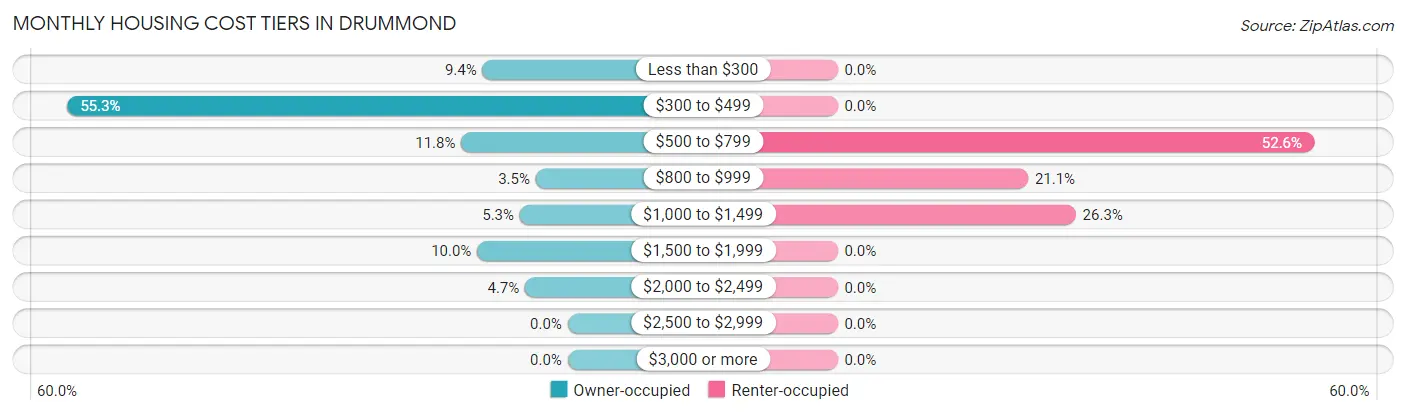
| Monthly Cost | Owner-occupied | Renter-occupied |
| Less than $300 | 16 (9.4%) | 0 (0.0%) |
| $300 to $499 | 94 (55.3%) | 0 (0.0%) |
| $500 to $799 | 20 (11.8%) | 10 (52.6%) |
| $800 to $999 | 6 (3.5%) | 4 (21.0%) |
| $1,000 to $1,499 | 9 (5.3%) | 5 (26.3%) |
| $1,500 to $1,999 | 17 (10.0%) | 0 (0.0%) |
| $2,000 to $2,499 | 8 (4.7%) | 0 (0.0%) |
| $2,500 to $2,999 | 0 (0.0%) | 0 (0.0%) |
| $3,000 or more | 0 (0.0%) | 0 (0.0%) |
| Total | 170 (100.0%) | 19 (100.0%) |
Physical Housing Characteristics in Drummond
Housing Structures in Drummond
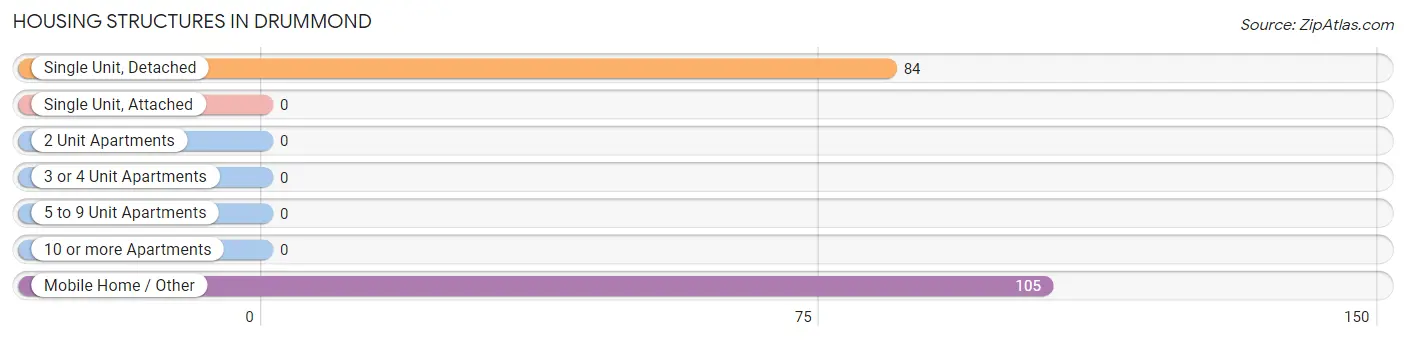
| Structure Type | # Housing Units | % Housing Units |
| Single Unit, Detached | 84 | 44.4% |
| Single Unit, Attached | 0 | 0.0% |
| 2 Unit Apartments | 0 | 0.0% |
| 3 or 4 Unit Apartments | 0 | 0.0% |
| 5 to 9 Unit Apartments | 0 | 0.0% |
| 10 or more Apartments | 0 | 0.0% |
| Mobile Home / Other | 105 | 55.6% |
| Total | 189 | 100.0% |
Housing Structures by Occupancy in Drummond
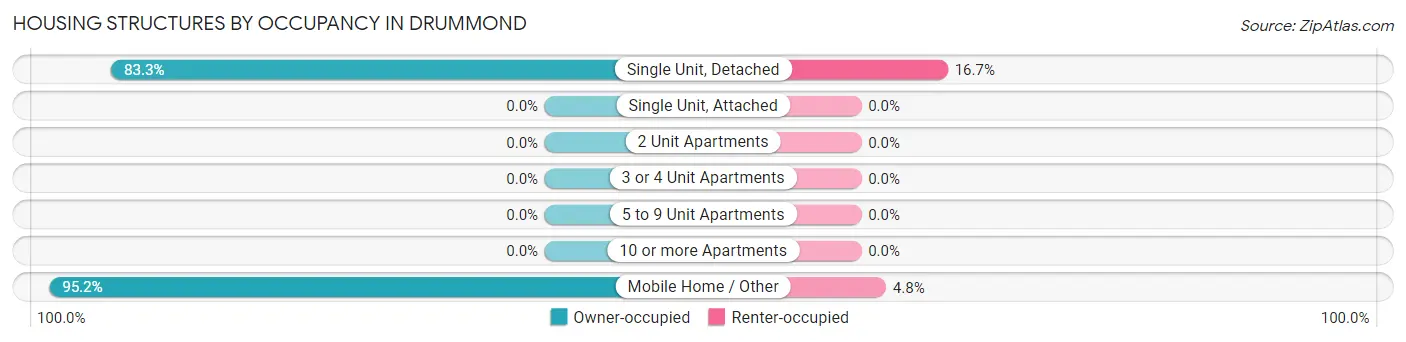
| Structure Type | Owner-occupied | Renter-occupied |
| Single Unit, Detached | 70 (83.3%) | 14 (16.7%) |
| Single Unit, Attached | 0 (0.0%) | 0 (0.0%) |
| 2 Unit Apartments | 0 (0.0%) | 0 (0.0%) |
| 3 or 4 Unit Apartments | 0 (0.0%) | 0 (0.0%) |
| 5 to 9 Unit Apartments | 0 (0.0%) | 0 (0.0%) |
| 10 or more Apartments | 0 (0.0%) | 0 (0.0%) |
| Mobile Home / Other | 100 (95.2%) | 5 (4.8%) |
| Total | 170 (89.9%) | 19 (10.1%) |
Housing Structures by Number of Rooms in Drummond
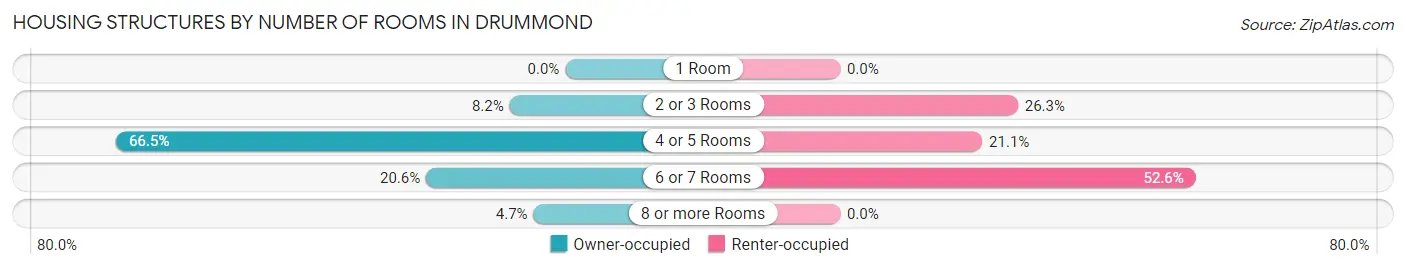
| Number of Rooms | Owner-occupied | Renter-occupied |
| 1 Room | 0 (0.0%) | 0 (0.0%) |
| 2 or 3 Rooms | 14 (8.2%) | 5 (26.3%) |
| 4 or 5 Rooms | 113 (66.5%) | 4 (21.0%) |
| 6 or 7 Rooms | 35 (20.6%) | 10 (52.6%) |
| 8 or more Rooms | 8 (4.7%) | 0 (0.0%) |
| Total | 170 (100.0%) | 19 (100.0%) |
Housing Structure by Heating Type in Drummond
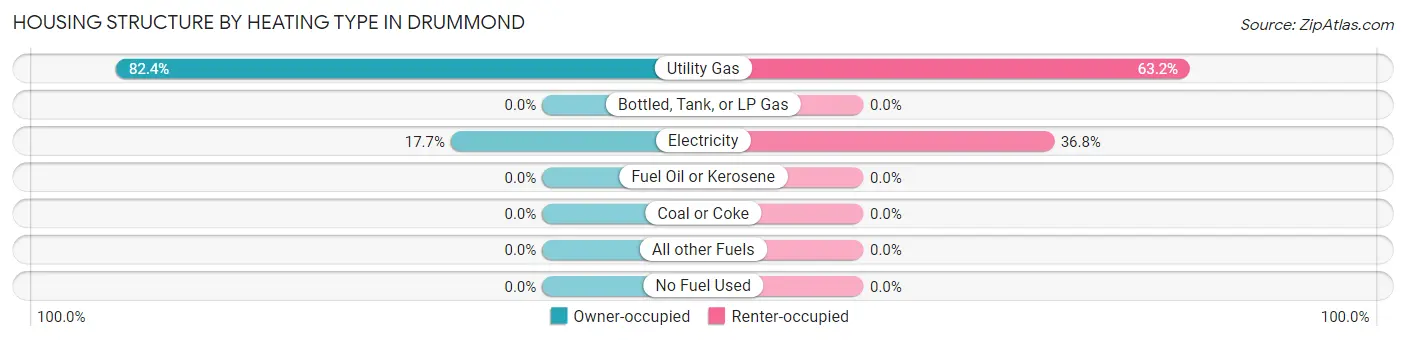
| Heating Type | Owner-occupied | Renter-occupied |
| Utility Gas | 140 (82.4%) | 12 (63.2%) |
| Bottled, Tank, or LP Gas | 0 (0.0%) | 0 (0.0%) |
| Electricity | 30 (17.6%) | 7 (36.8%) |
| Fuel Oil or Kerosene | 0 (0.0%) | 0 (0.0%) |
| Coal or Coke | 0 (0.0%) | 0 (0.0%) |
| All other Fuels | 0 (0.0%) | 0 (0.0%) |
| No Fuel Used | 0 (0.0%) | 0 (0.0%) |
| Total | 170 (100.0%) | 19 (100.0%) |
Household Vehicle Usage in Drummond
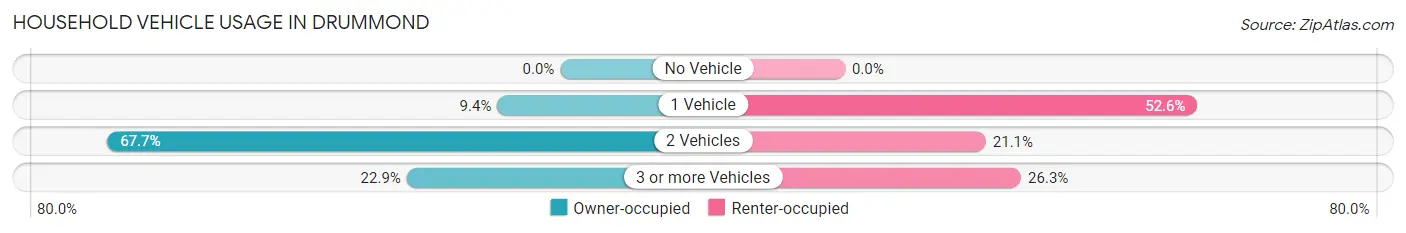
| Vehicles per Household | Owner-occupied | Renter-occupied |
| No Vehicle | 0 (0.0%) | 0 (0.0%) |
| 1 Vehicle | 16 (9.4%) | 10 (52.6%) |
| 2 Vehicles | 115 (67.6%) | 4 (21.0%) |
| 3 or more Vehicles | 39 (22.9%) | 5 (26.3%) |
| Total | 170 (100.0%) | 19 (100.0%) |
Real Estate & Mortgages in Drummond
Real Estate and Mortgage Overview in Drummond
| Characteristic | Without Mortgage | With Mortgage |
| Housing Units | 113 | 57 |
| Median Property Value | $13,600 | $157,500 |
| Median Household Income | - | - |
| Monthly Housing Costs | $328 | $0 |
| Real Estate Taxes | $199 | $3 |
Property Value by Mortgage Status in Drummond
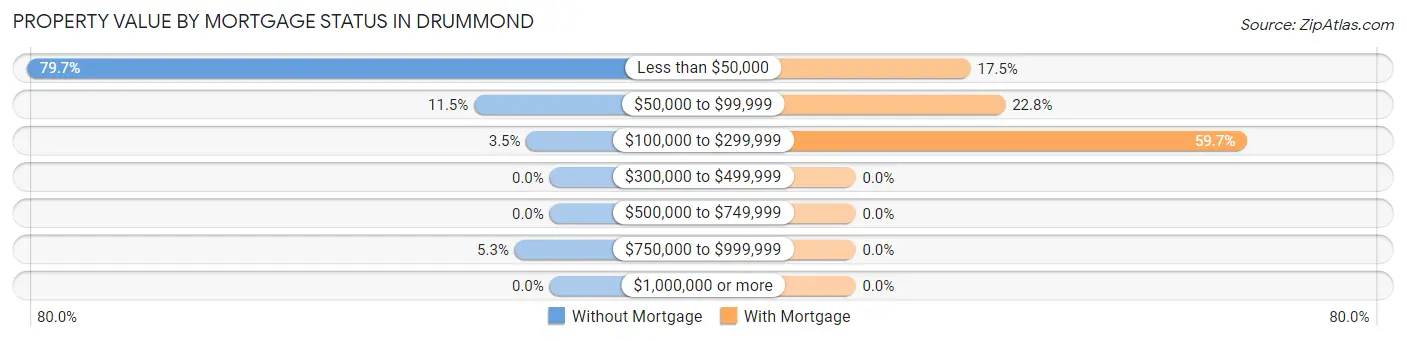
| Property Value | Without Mortgage | With Mortgage |
| Less than $50,000 | 90 (79.6%) | 10 (17.5%) |
| $50,000 to $99,999 | 13 (11.5%) | 13 (22.8%) |
| $100,000 to $299,999 | 4 (3.5%) | 34 (59.7%) |
| $300,000 to $499,999 | 0 (0.0%) | 0 (0.0%) |
| $500,000 to $749,999 | 0 (0.0%) | 0 (0.0%) |
| $750,000 to $999,999 | 6 (5.3%) | 0 (0.0%) |
| $1,000,000 or more | 0 (0.0%) | 0 (0.0%) |
| Total | 113 (100.0%) | 57 (100.0%) |
Household Income by Mortgage Status in Drummond
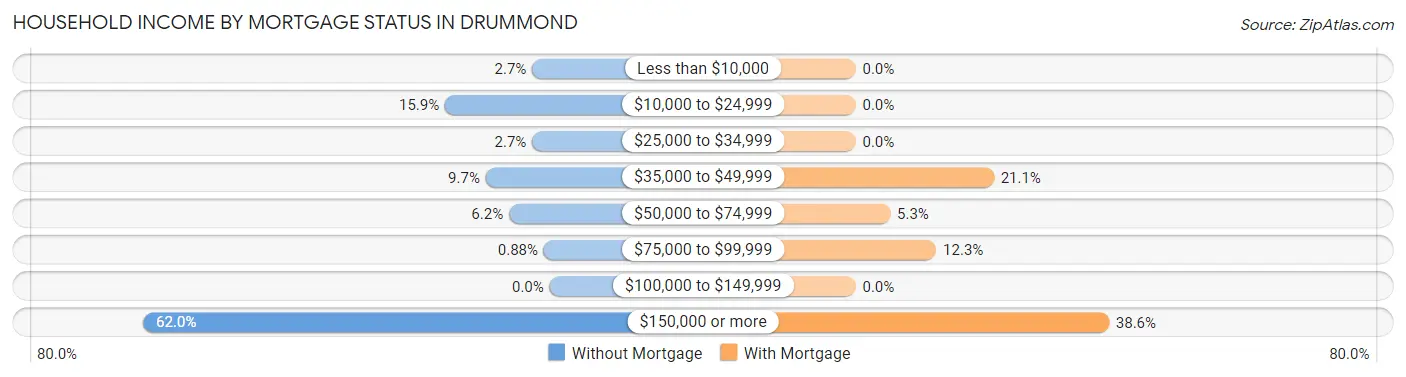
| Household Income | Without Mortgage | With Mortgage |
| Less than $10,000 | 3 (2.6%) | 0 (0.0%) |
| $10,000 to $24,999 | 18 (15.9%) | 0 (0.0%) |
| $25,000 to $34,999 | 3 (2.6%) | 0 (0.0%) |
| $35,000 to $49,999 | 11 (9.7%) | 12 (21.0%) |
| $50,000 to $74,999 | 7 (6.2%) | 3 (5.3%) |
| $75,000 to $99,999 | 1 (0.9%) | 7 (12.3%) |
| $100,000 to $149,999 | 0 (0.0%) | 0 (0.0%) |
| $150,000 or more | 70 (62.0%) | 22 (38.6%) |
| Total | 113 (100.0%) | 57 (100.0%) |
Property Value to Household Income Ratio in Drummond
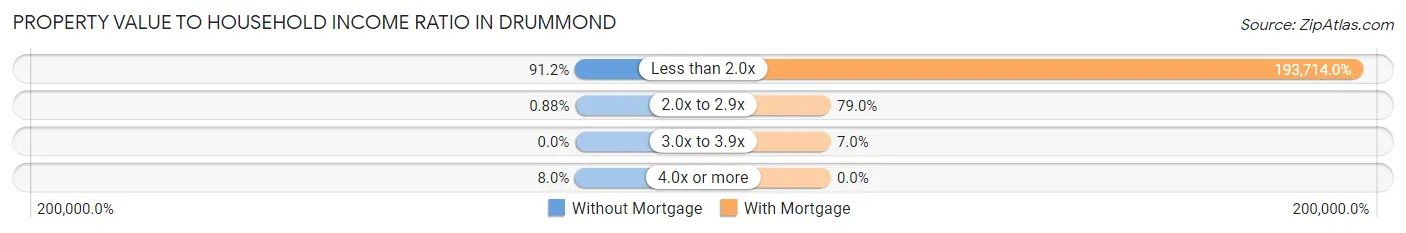
| Value-to-Income Ratio | Without Mortgage | With Mortgage |
| Less than 2.0x | 103 (91.1%) | 110,417 (193,714.0%) |
| 2.0x to 2.9x | 1 (0.9%) | 45 (78.9%) |
| 3.0x to 3.9x | 0 (0.0%) | 4 (7.0%) |
| 4.0x or more | 9 (8.0%) | 0 (0.0%) |
| Total | 113 (100.0%) | 57 (100.0%) |
Real Estate Taxes by Mortgage Status in Drummond
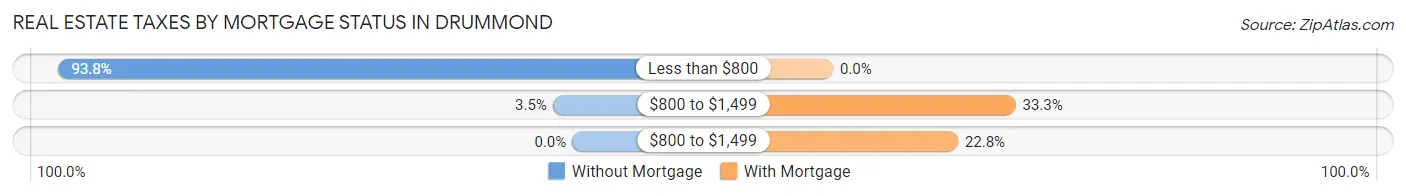
| Property Taxes | Without Mortgage | With Mortgage |
| Less than $800 | 106 (93.8%) | 0 (0.0%) |
| $800 to $1,499 | 4 (3.5%) | 19 (33.3%) |
| $800 to $1,499 | 0 (0.0%) | 13 (22.8%) |
| Total | 113 (100.0%) | 57 (100.0%) |
Health & Disability in Drummond
Health Insurance Coverage by Age in Drummond
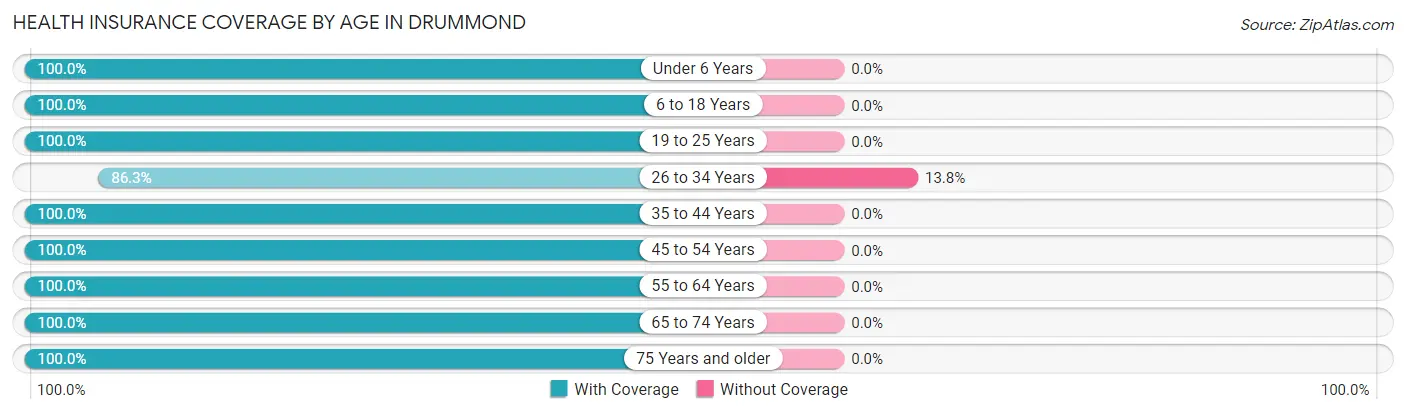
| Age Bracket | With Coverage | Without Coverage |
| Under 6 Years | 33 (100.0%) | 0 (0.0%) |
| 6 to 18 Years | 71 (100.0%) | 0 (0.0%) |
| 19 to 25 Years | 20 (100.0%) | 0 (0.0%) |
| 26 to 34 Years | 69 (86.3%) | 11 (13.8%) |
| 35 to 44 Years | 18 (100.0%) | 0 (0.0%) |
| 45 to 54 Years | 32 (100.0%) | 0 (0.0%) |
| 55 to 64 Years | 46 (100.0%) | 0 (0.0%) |
| 65 to 74 Years | 99 (100.0%) | 0 (0.0%) |
| 75 Years and older | 13 (100.0%) | 0 (0.0%) |
| Total | 401 (97.3%) | 11 (2.7%) |
Health Insurance Coverage by Citizenship Status in Drummond
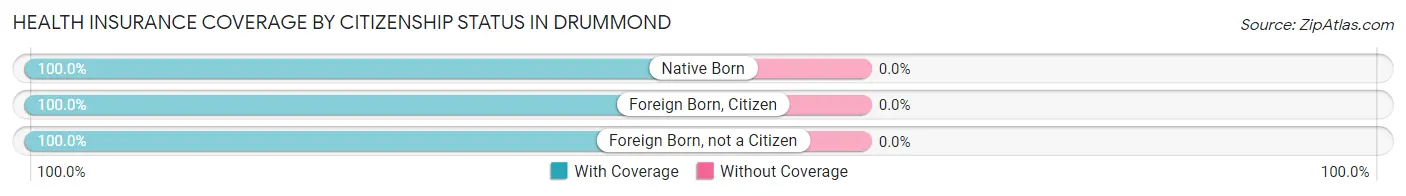
| Citizenship Status | With Coverage | Without Coverage |
| Native Born | 33 (100.0%) | 0 (0.0%) |
| Foreign Born, Citizen | 71 (100.0%) | 0 (0.0%) |
| Foreign Born, not a Citizen | 20 (100.0%) | 0 (0.0%) |
Health Insurance Coverage by Household Income in Drummond
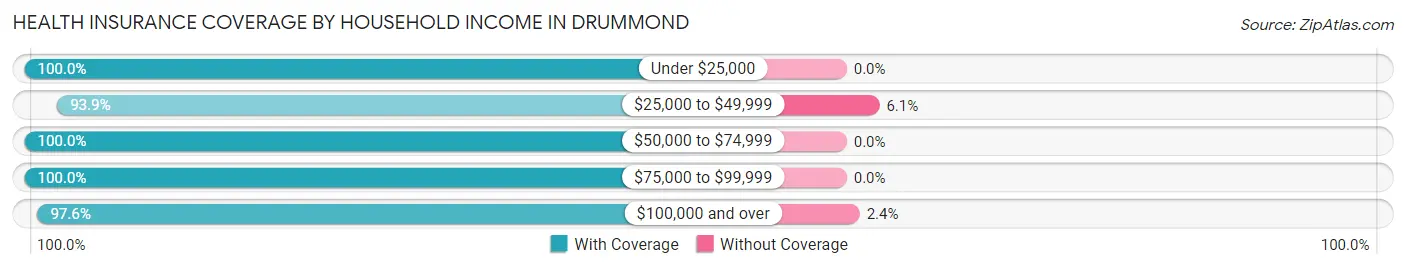
| Household Income | With Coverage | Without Coverage |
| Under $25,000 | 55 (100.0%) | 0 (0.0%) |
| $25,000 to $49,999 | 92 (93.9%) | 6 (6.1%) |
| $50,000 to $74,999 | 39 (100.0%) | 0 (0.0%) |
| $75,000 to $99,999 | 13 (100.0%) | 0 (0.0%) |
| $100,000 and over | 202 (97.6%) | 5 (2.4%) |
Public vs Private Health Insurance Coverage by Age in Drummond
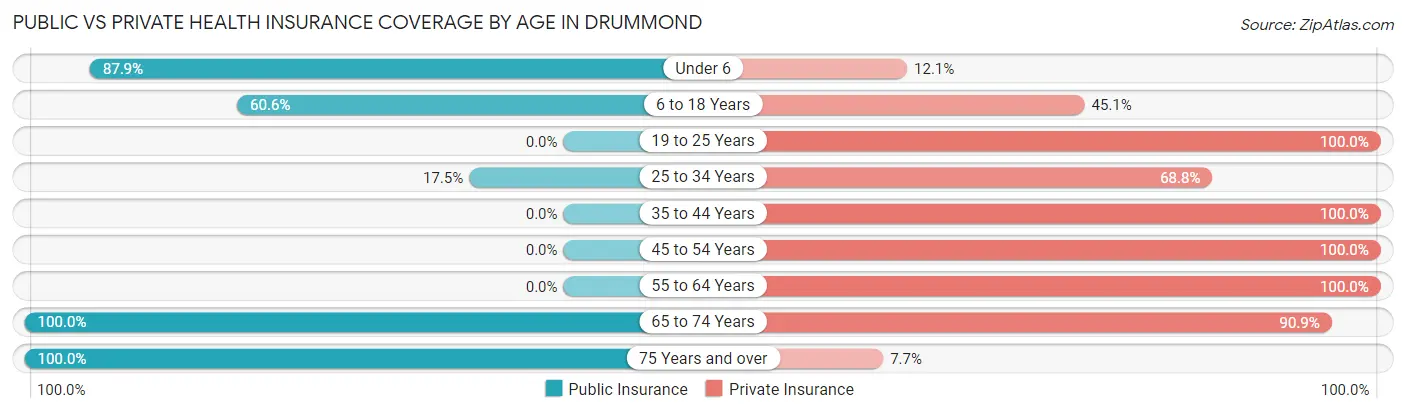
| Age Bracket | Public Insurance | Private Insurance |
| Under 6 | 29 (87.9%) | 4 (12.1%) |
| 6 to 18 Years | 43 (60.6%) | 32 (45.1%) |
| 19 to 25 Years | 0 (0.0%) | 20 (100.0%) |
| 25 to 34 Years | 14 (17.5%) | 55 (68.8%) |
| 35 to 44 Years | 0 (0.0%) | 18 (100.0%) |
| 45 to 54 Years | 0 (0.0%) | 32 (100.0%) |
| 55 to 64 Years | 0 (0.0%) | 46 (100.0%) |
| 65 to 74 Years | 99 (100.0%) | 90 (90.9%) |
| 75 Years and over | 13 (100.0%) | 1 (7.7%) |
| Total | 198 (48.1%) | 298 (72.3%) |
Disability Status by Sex by Age in Drummond
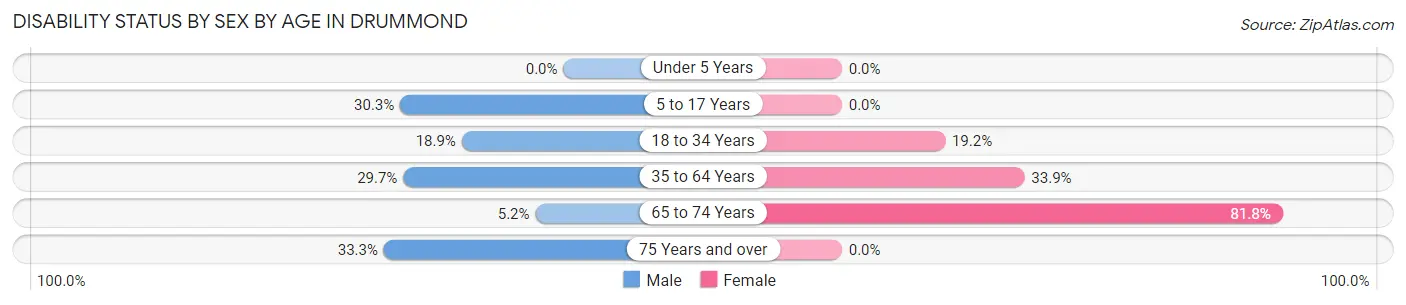
| Age Bracket | Male | Female |
| Under 5 Years | 0 (0.0%) | 0 (0.0%) |
| 5 to 17 Years | 10 (30.3%) | 0 (0.0%) |
| 18 to 34 Years | 10 (18.9%) | 9 (19.2%) |
| 35 to 64 Years | 11 (29.7%) | 20 (33.9%) |
| 65 to 74 Years | 4 (5.2%) | 18 (81.8%) |
| 75 Years and over | 4 (33.3%) | 0 (0.0%) |
Disability Class by Sex by Age in Drummond
Disability Class: Hearing Difficulty
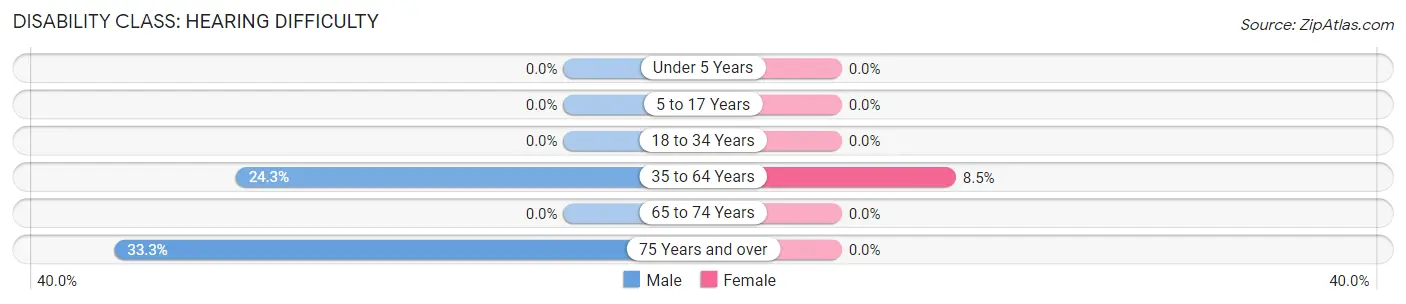
| Age Bracket | Male | Female |
| Under 5 Years | 0 (0.0%) | 0 (0.0%) |
| 5 to 17 Years | 0 (0.0%) | 0 (0.0%) |
| 18 to 34 Years | 0 (0.0%) | 0 (0.0%) |
| 35 to 64 Years | 9 (24.3%) | 5 (8.5%) |
| 65 to 74 Years | 0 (0.0%) | 0 (0.0%) |
| 75 Years and over | 4 (33.3%) | 0 (0.0%) |
Disability Class: Vision Difficulty
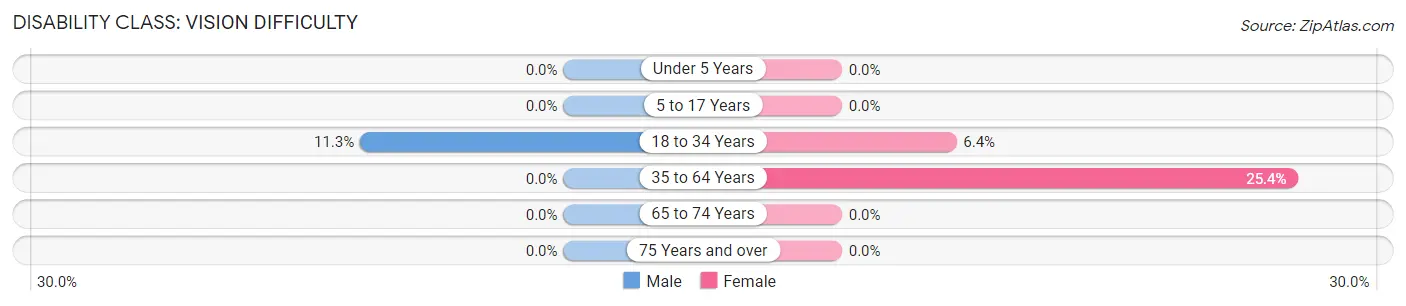
| Age Bracket | Male | Female |
| Under 5 Years | 0 (0.0%) | 0 (0.0%) |
| 5 to 17 Years | 0 (0.0%) | 0 (0.0%) |
| 18 to 34 Years | 6 (11.3%) | 3 (6.4%) |
| 35 to 64 Years | 0 (0.0%) | 15 (25.4%) |
| 65 to 74 Years | 0 (0.0%) | 0 (0.0%) |
| 75 Years and over | 0 (0.0%) | 0 (0.0%) |
Disability Class: Cognitive Difficulty
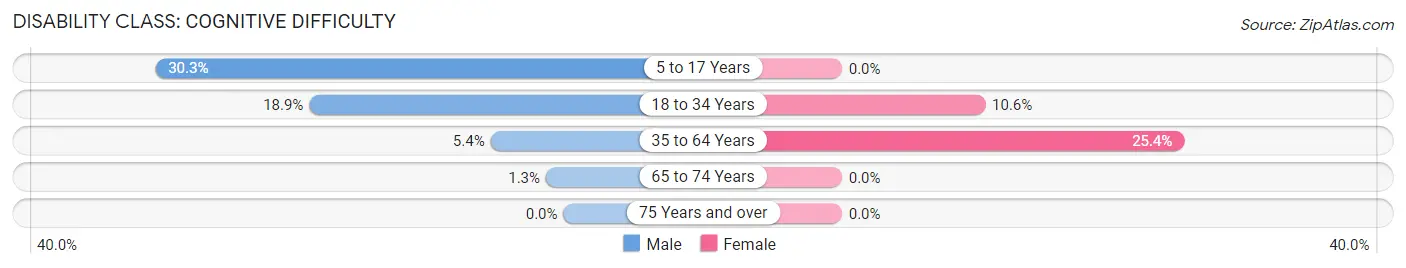
| Age Bracket | Male | Female |
| 5 to 17 Years | 10 (30.3%) | 0 (0.0%) |
| 18 to 34 Years | 10 (18.9%) | 5 (10.6%) |
| 35 to 64 Years | 2 (5.4%) | 15 (25.4%) |
| 65 to 74 Years | 1 (1.3%) | 0 (0.0%) |
| 75 Years and over | 0 (0.0%) | 0 (0.0%) |
Disability Class: Ambulatory Difficulty
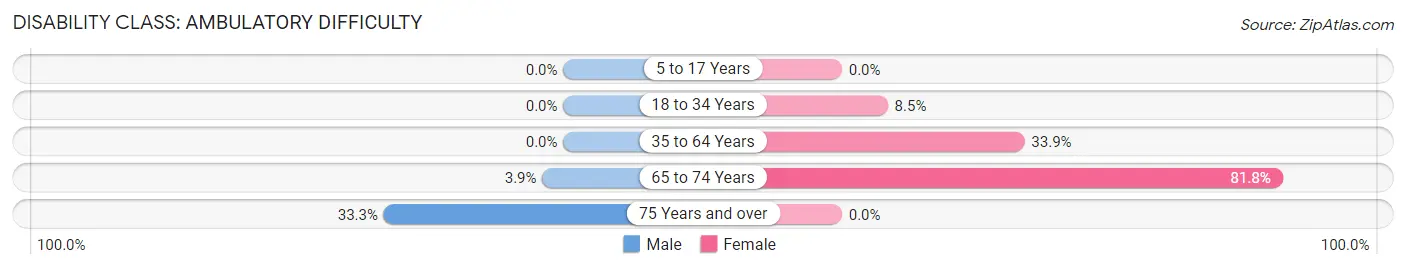
| Age Bracket | Male | Female |
| 5 to 17 Years | 0 (0.0%) | 0 (0.0%) |
| 18 to 34 Years | 0 (0.0%) | 4 (8.5%) |
| 35 to 64 Years | 0 (0.0%) | 20 (33.9%) |
| 65 to 74 Years | 3 (3.9%) | 18 (81.8%) |
| 75 Years and over | 4 (33.3%) | 0 (0.0%) |
Disability Class: Self-Care Difficulty
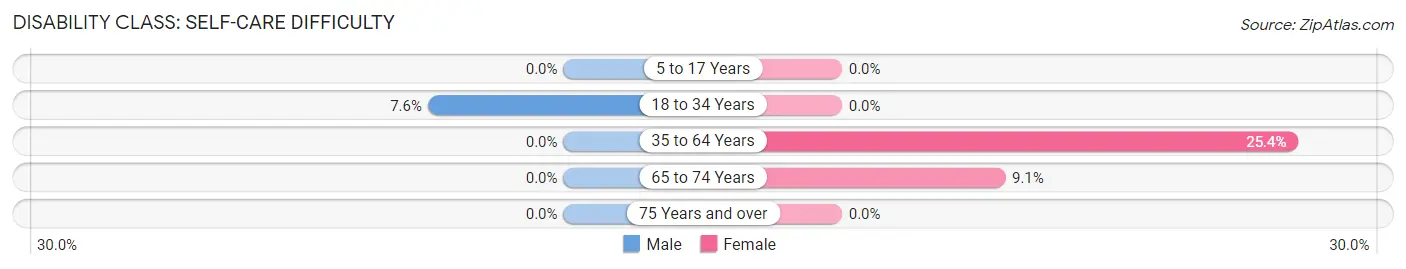
| Age Bracket | Male | Female |
| 5 to 17 Years | 0 (0.0%) | 0 (0.0%) |
| 18 to 34 Years | 4 (7.5%) | 0 (0.0%) |
| 35 to 64 Years | 0 (0.0%) | 15 (25.4%) |
| 65 to 74 Years | 0 (0.0%) | 2 (9.1%) |
| 75 Years and over | 0 (0.0%) | 0 (0.0%) |
Technology Access in Drummond
Computing Device Access in Drummond
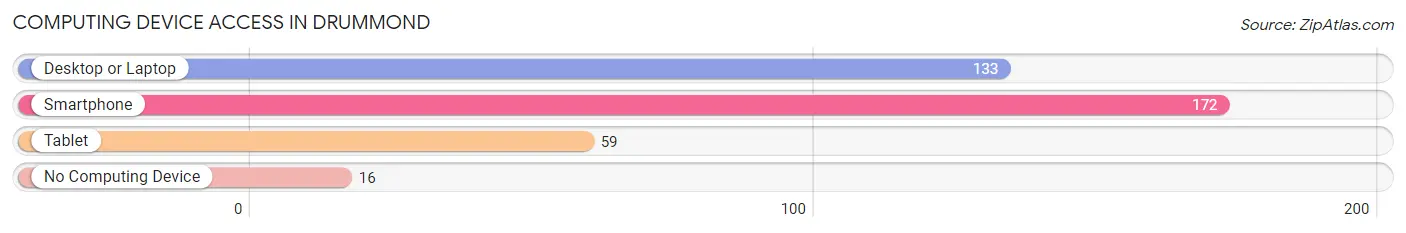
| Device Type | # Households | % Households |
| Desktop or Laptop | 133 | 70.4% |
| Smartphone | 172 | 91.0% |
| Tablet | 59 | 31.2% |
| No Computing Device | 16 | 8.5% |
| Total | 189 | 100.0% |
Internet Access in Drummond
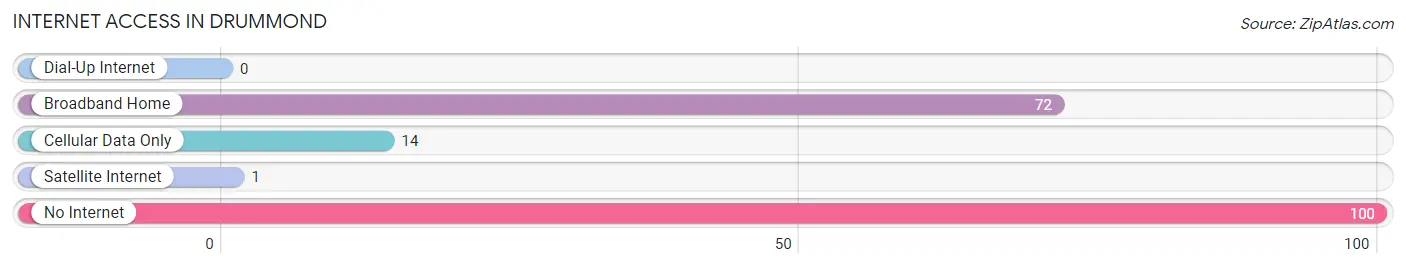
| Internet Type | # Households | % Households |
| Dial-Up Internet | 0 | 0.0% |
| Broadband Home | 72 | 38.1% |
| Cellular Data Only | 14 | 7.4% |
| Satellite Internet | 1 | 0.5% |
| No Internet | 100 | 52.9% |
| Total | 189 | 100.0% |
Drummond Summary
Drummond is a small town located in the state of Oklahoma, in the United States. It is situated in the southwestern part of the state, in the county of Garfield. The town has a population of approximately 500 people, and is located about 20 miles south of Enid, the county seat.
History
Drummond was founded in 1891 by a group of settlers from Kansas. The town was named after a local rancher, William Drummond, who had a large ranch in the area. The town was originally a farming community, and the main crops grown were wheat, corn, and cotton. In the early 1900s, the town began to grow and develop, and by the 1920s, it had become a thriving community.
In the 1930s, the Great Depression hit the town hard, and many of the businesses and farms in the area closed down. However, the town was able to survive, and by the 1940s, it had begun to recover. During World War II, the town was home to a large military base, which provided jobs and economic stability to the area.
In the 1950s, the town began to grow again, and by the 1960s, it had become a popular tourist destination. The town was home to several resorts, and it was also a popular spot for fishing and hunting. In the 1970s, the town began to decline, as many of the businesses and resorts closed down.
Geography
Drummond is located in the southwestern part of Oklahoma, in Garfield County. The town is situated on the banks of the Cimarron River, and is surrounded by rolling hills and prairies. The town is located about 20 miles south of Enid, the county seat. The town is located at an elevation of 1,000 feet above sea level.
Economy
The economy of Drummond is largely based on agriculture. The main crops grown in the area are wheat, corn, and cotton. The town is also home to several small businesses, including a grocery store, a hardware store, and a few restaurants.
Demographics
As of the 2010 census, the population of Drummond was 498 people. The racial makeup of the town was 95.2% White, 0.2% African American, 0.4% Native American, 0.2% Asian, 0.2% from other races, and 3.8% from two or more races. The median household income in the town was $31,250, and the median family income was $37,500. The per capita income in the town was $15,845.
Conclusion
Drummond is a small town located in the southwestern part of Oklahoma. It has a population of approximately 500 people, and is largely an agricultural community. The town has a rich history, and has been able to survive and thrive despite the economic hardships of the Great Depression and World War II. The town is home to several small businesses, and is a popular tourist destination. The population of the town is largely white, and the median household income is $31,250.
Common Questions
What is Per Capita Income in Drummond?
Per Capita income in Drummond is $48,753.
What is the Median Family Income in Drummond?
Median Family Income in Drummond is $165,215.
What is the Median Household income in Drummond?
Median Household Income in Drummond is $117,788.
What is Income or Wage Gap in Drummond?
Income or Wage Gap in Drummond is 69.6%.
Women in Drummond earn 30.4 cents for every dollar earned by a man.
What is Inequality or Gini Index in Drummond?
Inequality or Gini Index in Drummond is 0.37.
What is the Total Population of Drummond?
Total Population of Drummond is 412.
What is the Total Male Population of Drummond?
Total Male Population of Drummond is 226.
What is the Total Female Population of Drummond?
Total Female Population of Drummond is 186.
What is the Ratio of Males per 100 Females in Drummond?
There are 121.51 Males per 100 Females in Drummond.
What is the Ratio of Females per 100 Males in Drummond?
There are 82.30 Females per 100 Males in Drummond.
What is the Median Population Age in Drummond?
Median Population Age in Drummond is 37.5 Years.
What is the Average Family Size in Drummond
Average Family Size in Drummond is 2.5 People.
What is the Average Household Size in Drummond
Average Household Size in Drummond is 2.2 People.
How Large is the Labor Force in Drummond?
There are 190 People in the Labor Forcein in Drummond.
What is the Percentage of People in the Labor Force in Drummond?
60.9% of People are in the Labor Force in Drummond.
What is the Unemployment Rate in Drummond?
Unemployment Rate in Drummond is 8.4%.