Devol, OK Map & Demographics
Devol Map
Devol Overview
$23,919
PER CAPITA INCOME
$71,250
AVG HOUSEHOLD INCOME
2.8%
WAGE / INCOME GAP [ % ]
97.2¢/ $1
WAGE / INCOME GAP [ $ ]
0.41
INEQUALITY / GINI INDEX
166
TOTAL POPULATION
103
MALE POPULATION
63
FEMALE POPULATION
163.49
MALES / 100 FEMALES
61.17
FEMALES / 100 MALES
33.4
MEDIAN AGE
3.6
AVG FAMILY SIZE
3.7
AVG HOUSEHOLD SIZE
84
LABOR FORCE [ PEOPLE ]
77.1%
PERCENT IN LABOR FORCE
15.5%
UNEMPLOYMENT RATE
Devol Zip Codes
Devol Area Codes
Income in Devol
Income Overview in Devol
| Characteristic | Number | Measure |
| Per Capita Income | 166 | $23,919 |
| Median Family Income | 37 | $0 |
| Mean Family Income | 37 | $74,832 |
| Median Household Income | 45 | $71,250 |
| Mean Household Income | 45 | $77,962 |
| Income Deficit | 37 | $0 |
| Wage / Income Gap (%) | 166 | 2.76% |
| Wage / Income Gap ($) | 166 | 97.24¢ per $1 |
| Gini / Inequality Index | 166 | 0.41 |
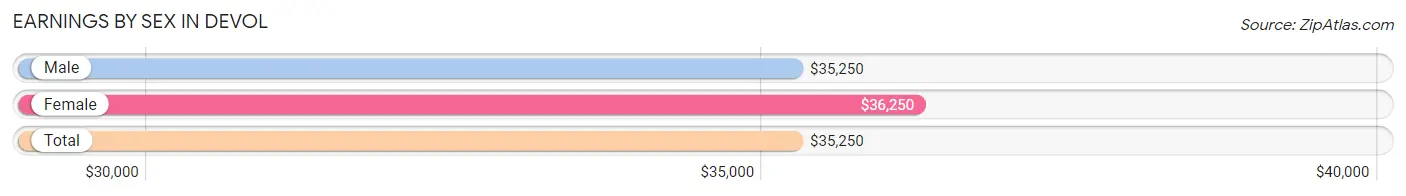
Earnings by Sex in Devol
Average Earnings in Devol are $35,250, $35,250 for men and $36,250 for women, a difference of 2.8%.
| Sex | Number | Average Earnings |
| Male | 53 (63.9%) | $35,250 |
| Female | 30 (36.1%) | $36,250 |
| Total | 83 (100.0%) | $35,250 |
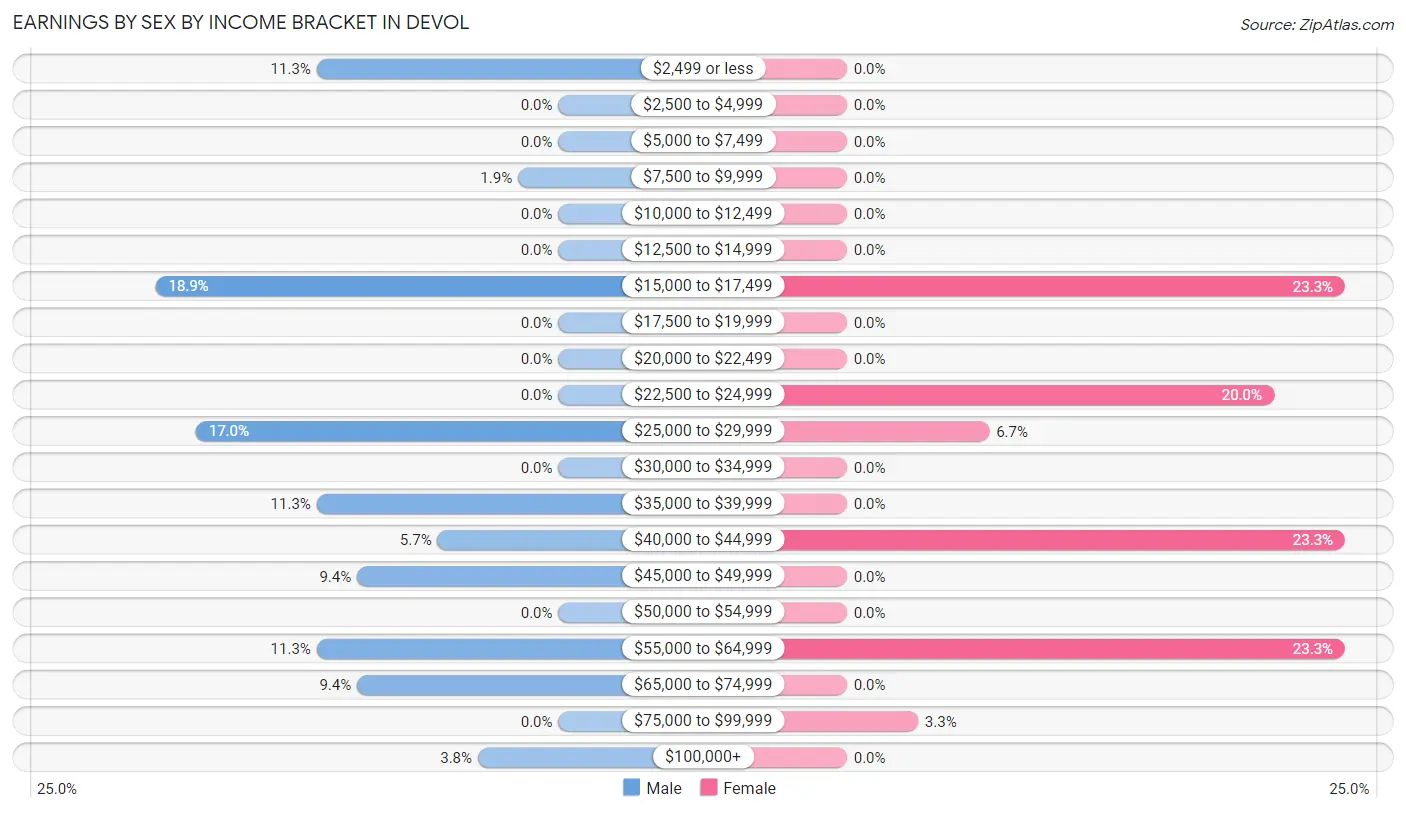
Earnings by Sex by Income Bracket in Devol
The most common earnings brackets in Devol are $15,000 to $17,499 for men (10 | 18.9%) and $15,000 to $17,499 for women (7 | 23.3%).
| Income | Male | Female |
| $2,499 or less | 6 (11.3%) | 0 (0.0%) |
| $2,500 to $4,999 | 0 (0.0%) | 0 (0.0%) |
| $5,000 to $7,499 | 0 (0.0%) | 0 (0.0%) |
| $7,500 to $9,999 | 1 (1.9%) | 0 (0.0%) |
| $10,000 to $12,499 | 0 (0.0%) | 0 (0.0%) |
| $12,500 to $14,999 | 0 (0.0%) | 0 (0.0%) |
| $15,000 to $17,499 | 10 (18.9%) | 7 (23.3%) |
| $17,500 to $19,999 | 0 (0.0%) | 0 (0.0%) |
| $20,000 to $22,499 | 0 (0.0%) | 0 (0.0%) |
| $22,500 to $24,999 | 0 (0.0%) | 6 (20.0%) |
| $25,000 to $29,999 | 9 (17.0%) | 2 (6.7%) |
| $30,000 to $34,999 | 0 (0.0%) | 0 (0.0%) |
| $35,000 to $39,999 | 6 (11.3%) | 0 (0.0%) |
| $40,000 to $44,999 | 3 (5.7%) | 7 (23.3%) |
| $45,000 to $49,999 | 5 (9.4%) | 0 (0.0%) |
| $50,000 to $54,999 | 0 (0.0%) | 0 (0.0%) |
| $55,000 to $64,999 | 6 (11.3%) | 7 (23.3%) |
| $65,000 to $74,999 | 5 (9.4%) | 0 (0.0%) |
| $75,000 to $99,999 | 0 (0.0%) | 1 (3.3%) |
| $100,000+ | 2 (3.8%) | 0 (0.0%) |
| Total | 53 (100.0%) | 30 (100.0%) |
Earnings by Sex by Educational Attainment in Devol
| Educational Attainment | Male Income | Female Income |
| Less than High School | - | - |
| High School Diploma | - | - |
| College or Associate's Degree | - | - |
| Bachelor's Degree | - | - |
| Graduate Degree | - | - |
| Total | $37,500 | $42,857 |
Family Income in Devol
Family Income Brackets in Devol
According to the Devol family income data, there are 9 families falling into the $15,000 to $24,999 income range, which is the most common income bracket and makes up 24.3% of all families.
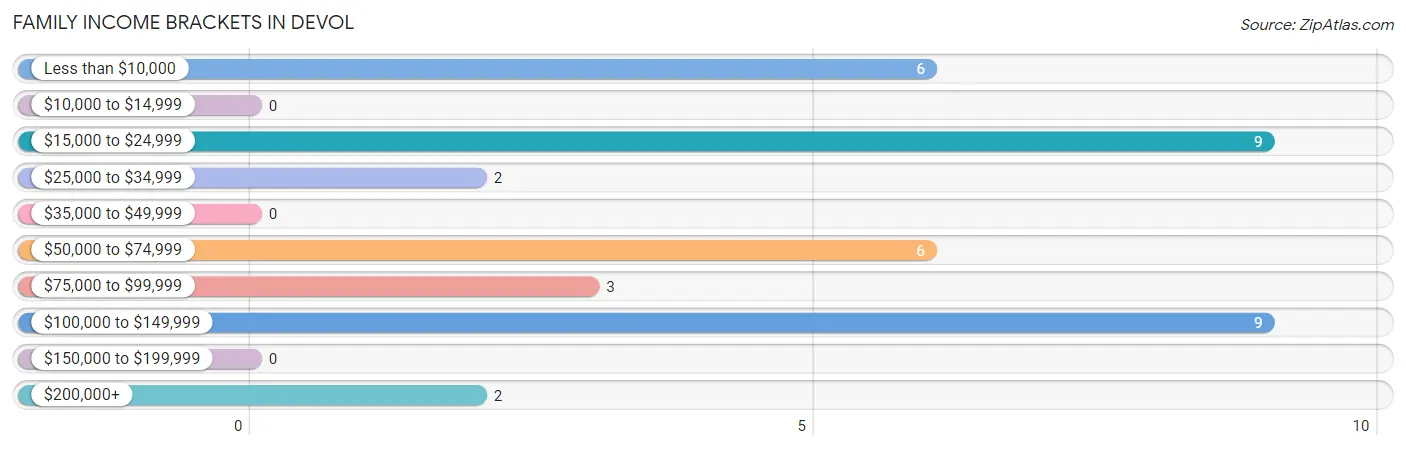
| Income Bracket | # Families | % Families |
| Less than $10,000 | 6 | 16.2% |
| $10,000 to $14,999 | 0 | 0.0% |
| $15,000 to $24,999 | 9 | 24.3% |
| $25,000 to $34,999 | 2 | 5.4% |
| $35,000 to $49,999 | 0 | 0.0% |
| $50,000 to $74,999 | 6 | 16.2% |
| $75,000 to $99,999 | 3 | 8.1% |
| $100,000 to $149,999 | 9 | 24.3% |
| $150,000 to $199,999 | 0 | 0.0% |
| $200,000+ | 2 | 5.4% |
Family Income by Famaliy Size in Devol
2-person families (11 | 29.7%) account for the highest median family income in Devol with $71,750 per family, while 2-person families (11 | 29.7%) have the highest median income of $35,875 per family member.
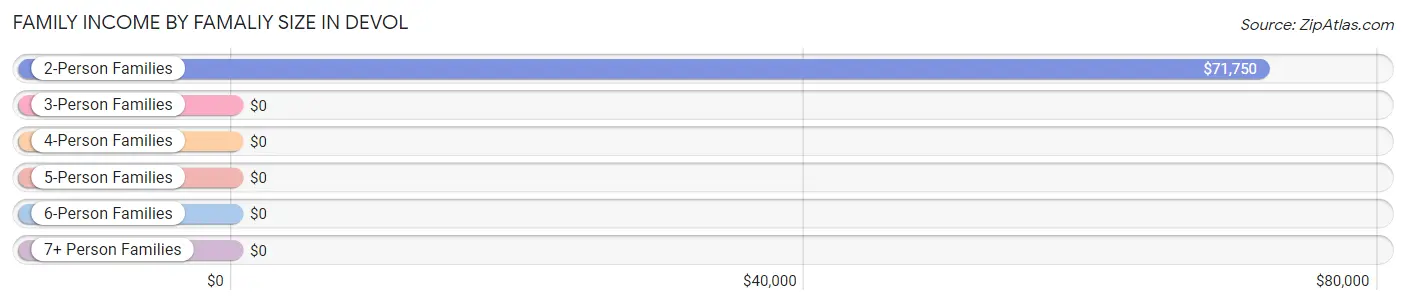
| Income Bracket | # Families | Median Income |
| 2-Person Families | 11 (29.7%) | $71,750 |
| 3-Person Families | 19 (51.3%) | $0 |
| 4-Person Families | 7 (18.9%) | $0 |
| 5-Person Families | 0 (0.0%) | $0 |
| 6-Person Families | 0 (0.0%) | $0 |
| 7+ Person Families | 0 (0.0%) | $0 |
| Total | 37 (100.0%) | $0 |
Family Income by Number of Earners in Devol
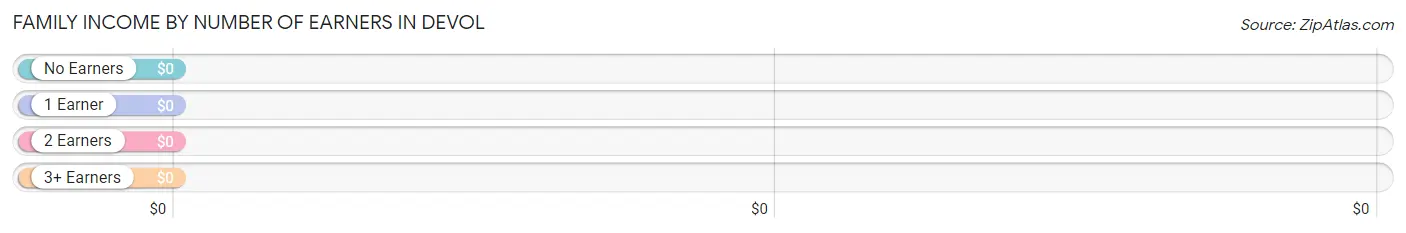
| Number of Earners | # Families | Median Income |
| No Earners | 3 (8.1%) | $0 |
| 1 Earner | 25 (67.6%) | $0 |
| 2 Earners | 2 (5.4%) | $0 |
| 3+ Earners | 7 (18.9%) | $0 |
| Total | 37 (100.0%) | $0 |
Household Income in Devol
Household Income Brackets in Devol
With 12 households falling in the category, the $15,000 to $24,999 income range is the most frequent in Devol, accounting for 26.7% of all households.
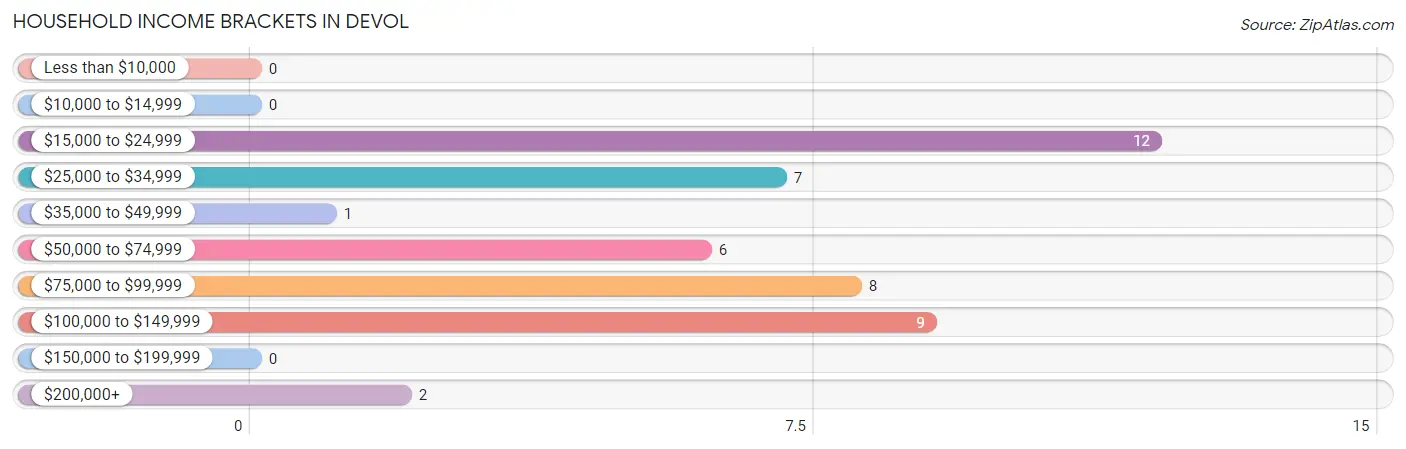
| Income Bracket | # Households | % Households |
| Less than $10,000 | 0 | 0.0% |
| $10,000 to $14,999 | 0 | 0.0% |
| $15,000 to $24,999 | 12 | 26.7% |
| $25,000 to $34,999 | 7 | 15.6% |
| $35,000 to $49,999 | 1 | 2.2% |
| $50,000 to $74,999 | 6 | 13.3% |
| $75,000 to $99,999 | 8 | 17.8% |
| $100,000 to $149,999 | 9 | 20.0% |
| $150,000 to $199,999 | 0 | 0.0% |
| $200,000+ | 2 | 4.4% |
Household Income by Householder Age in Devol
The median household income in Devol is $71,250, with the highest median household income of $143,036 found in the 45 to 64 years age bracket for the primary householder. A total of 15 households (33.3%) fall into this category. Meanwhile, the 15 to 24 years age bracket for the primary householder has the lowest median household income of $0, with 2 households (4.4%) in this group.
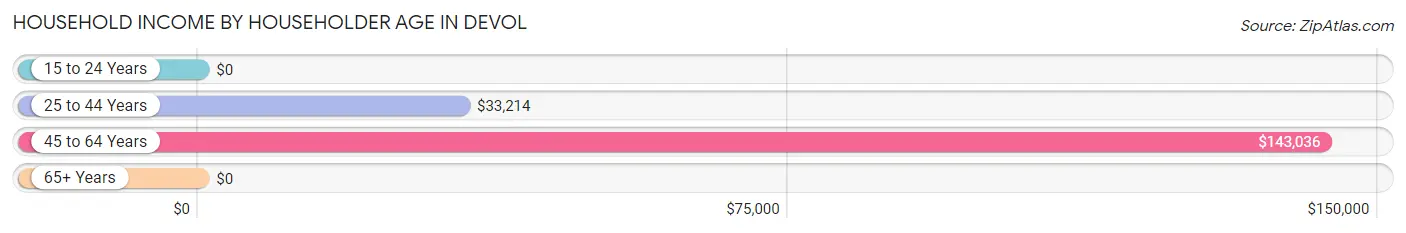
| Income Bracket | # Households | Median Income |
| 15 to 24 Years | 2 (4.4%) | $0 |
| 25 to 44 Years | 16 (35.6%) | $33,214 |
| 45 to 64 Years | 15 (33.3%) | $143,036 |
| 65+ Years | 12 (26.7%) | $0 |
| Total | 45 (100.0%) | $71,250 |
Poverty in Devol
Income Below Poverty by Sex and Age in Devol
With 37.6% poverty level for males and 23.8% for females among the residents of Devol, 6 to 11 year old males and under 5 year old females are the most vulnerable to poverty, with 14 males (100.0%) and 8 females (100.0%) in their respective age groups living below the poverty level.
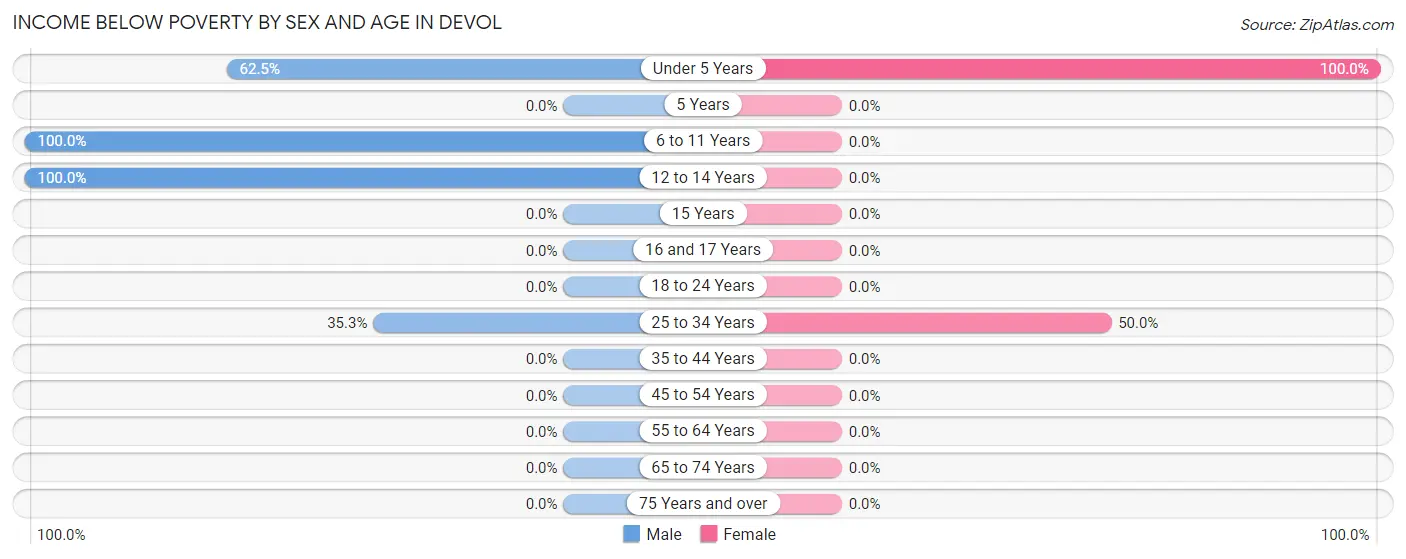
| Age Bracket | Male | Female |
| Under 5 Years | 10 (62.5%) | 8 (100.0%) |
| 5 Years | 0 (0.0%) | 0 (0.0%) |
| 6 to 11 Years | 14 (100.0%) | 0 (0.0%) |
| 12 to 14 Years | 8 (100.0%) | 0 (0.0%) |
| 15 Years | 0 (0.0%) | 0 (0.0%) |
| 16 and 17 Years | 0 (0.0%) | 0 (0.0%) |
| 18 to 24 Years | 0 (0.0%) | 0 (0.0%) |
| 25 to 34 Years | 6 (35.3%) | 7 (50.0%) |
| 35 to 44 Years | 0 (0.0%) | 0 (0.0%) |
| 45 to 54 Years | 0 (0.0%) | 0 (0.0%) |
| 55 to 64 Years | 0 (0.0%) | 0 (0.0%) |
| 65 to 74 Years | 0 (0.0%) | 0 (0.0%) |
| 75 Years and over | 0 (0.0%) | 0 (0.0%) |
| Total | 38 (37.6%) | 15 (23.8%) |
Income Above Poverty by Sex and Age in Devol
According to the poverty statistics in Devol, males aged 18 to 24 years and females aged 6 to 11 years are the age groups that are most secure financially, with 100.0% of males and 100.0% of females in these age groups living above the poverty line.
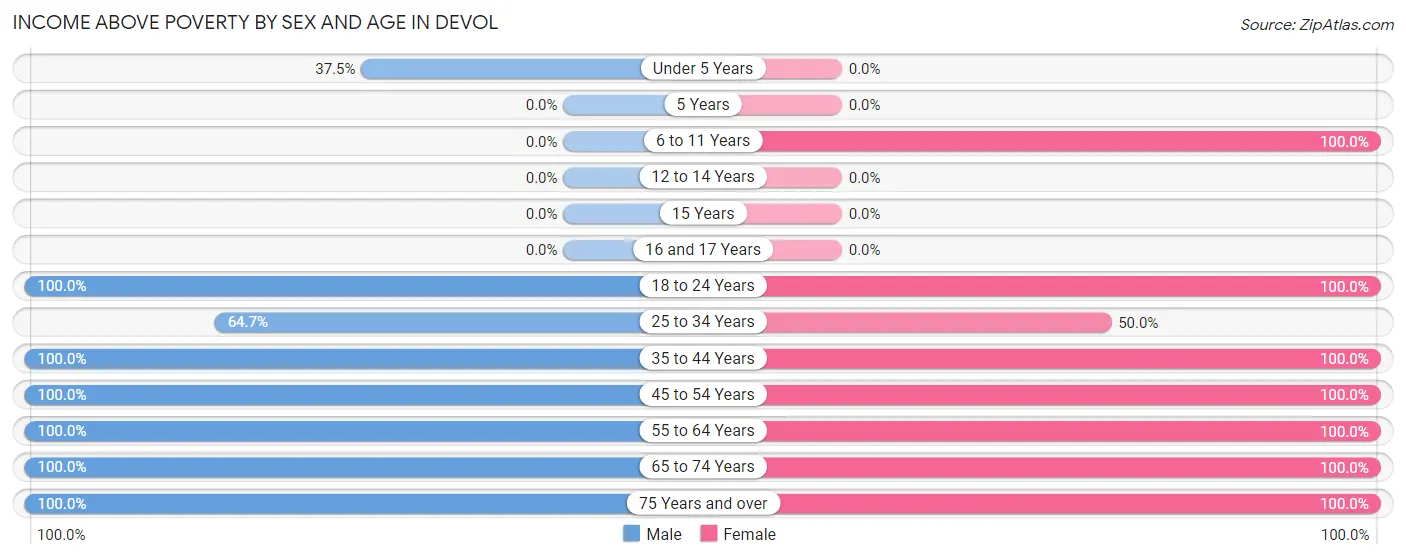
| Age Bracket | Male | Female |
| Under 5 Years | 6 (37.5%) | 0 (0.0%) |
| 5 Years | 0 (0.0%) | 0 (0.0%) |
| 6 to 11 Years | 0 (0.0%) | 9 (100.0%) |
| 12 to 14 Years | 0 (0.0%) | 0 (0.0%) |
| 15 Years | 0 (0.0%) | 0 (0.0%) |
| 16 and 17 Years | 0 (0.0%) | 0 (0.0%) |
| 18 to 24 Years | 9 (100.0%) | 2 (100.0%) |
| 25 to 34 Years | 11 (64.7%) | 7 (50.0%) |
| 35 to 44 Years | 8 (100.0%) | 6 (100.0%) |
| 45 to 54 Years | 5 (100.0%) | 7 (100.0%) |
| 55 to 64 Years | 15 (100.0%) | 7 (100.0%) |
| 65 to 74 Years | 3 (100.0%) | 6 (100.0%) |
| 75 Years and over | 6 (100.0%) | 4 (100.0%) |
| Total | 63 (62.4%) | 48 (76.2%) |
Income Below Poverty Among Married-Couple Families in Devol
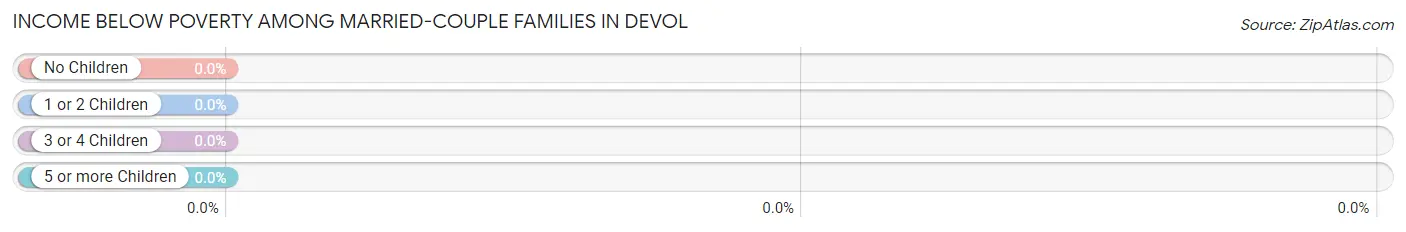
| Children | Above Poverty | Below Poverty |
| No Children | 20 (100.0%) | 0 (0.0%) |
| 1 or 2 Children | 0 (0.0%) | 0 (0.0%) |
| 3 or 4 Children | 0 (0.0%) | 0 (0.0%) |
| 5 or more Children | 0 (0.0%) | 0 (0.0%) |
| Total | 20 (100.0%) | 0 (0.0%) |
Income Below Poverty Among Single-Parent Households in Devol
According to the poverty data in Devol, 75.0% or 6 single-father households and 77.8% or 7 single-mother households are living below the poverty line. Among single-father households, those with 1 or 2 children have the highest poverty rate, with 6 households (100.0%) experiencing poverty. Likewise, among single-mother households, those with 3 or 4 children have the highest poverty rate, with 7 households (100.0%) falling below the poverty line.
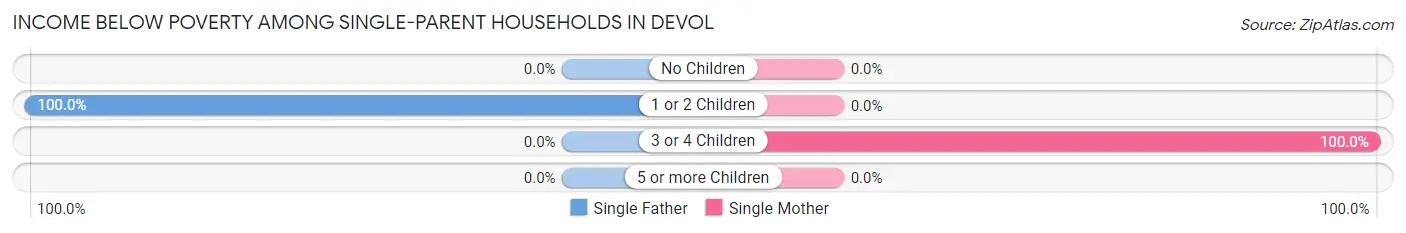
| Children | Single Father | Single Mother |
| No Children | 0 (0.0%) | 0 (0.0%) |
| 1 or 2 Children | 6 (100.0%) | 0 (0.0%) |
| 3 or 4 Children | 0 (0.0%) | 7 (100.0%) |
| 5 or more Children | 0 (0.0%) | 0 (0.0%) |
| Total | 6 (75.0%) | 7 (77.8%) |
Income Below Poverty Among Married-Couple vs Single-Parent Households in Devol
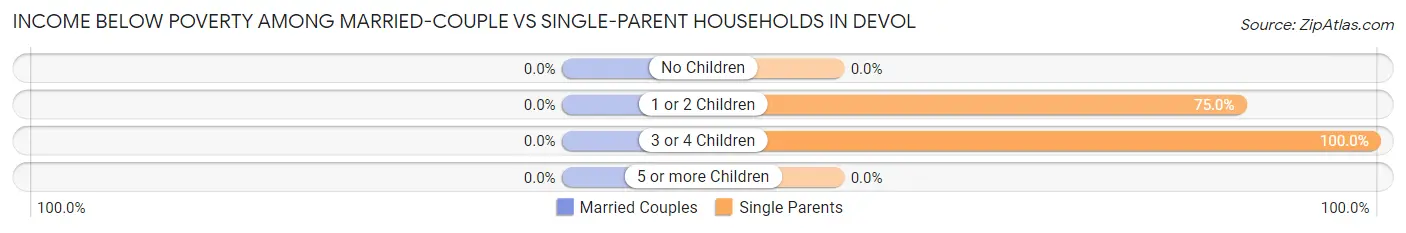
| Children | Married-Couple Families | Single-Parent Households |
| No Children | 0 (0.0%) | 0 (0.0%) |
| 1 or 2 Children | 0 (0.0%) | 6 (75.0%) |
| 3 or 4 Children | 0 (0.0%) | 7 (100.0%) |
| 5 or more Children | 0 (0.0%) | 0 (0.0%) |
| Total | 0 (0.0%) | 13 (76.5%) |
Race in Devol
The most populous races in Devol are White / Caucasian (146 | 87.9%), and Two or more Races (20 | 12.0%).
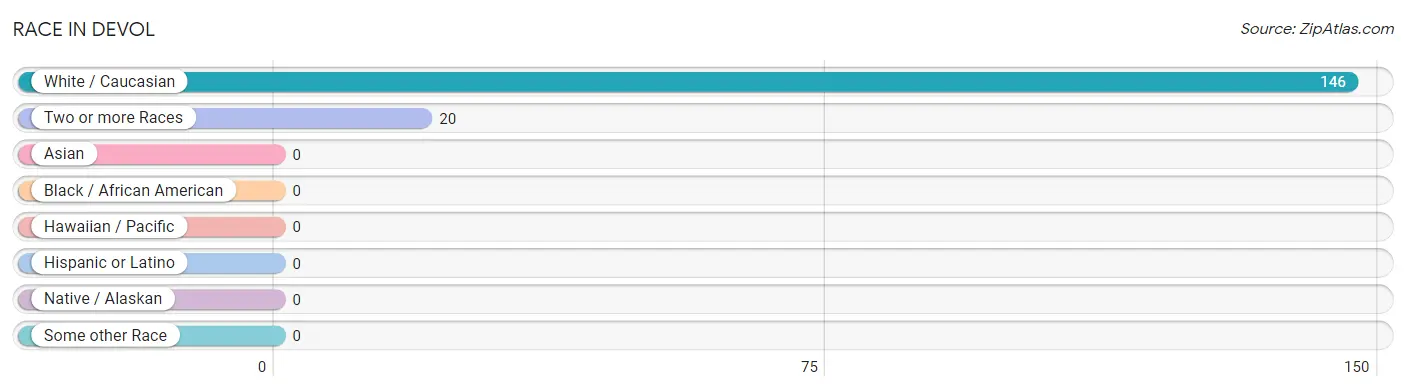
| Race | # Population | % Population |
| Asian | 0 | 0.0% |
| Black / African American | 0 | 0.0% |
| Hawaiian / Pacific | 0 | 0.0% |
| Hispanic or Latino | 0 | 0.0% |
| Native / Alaskan | 0 | 0.0% |
| White / Caucasian | 146 | 87.9% |
| Two or more Races | 20 | 12.0% |
| Some other Race | 0 | 0.0% |
| Total | 166 | 100.0% |
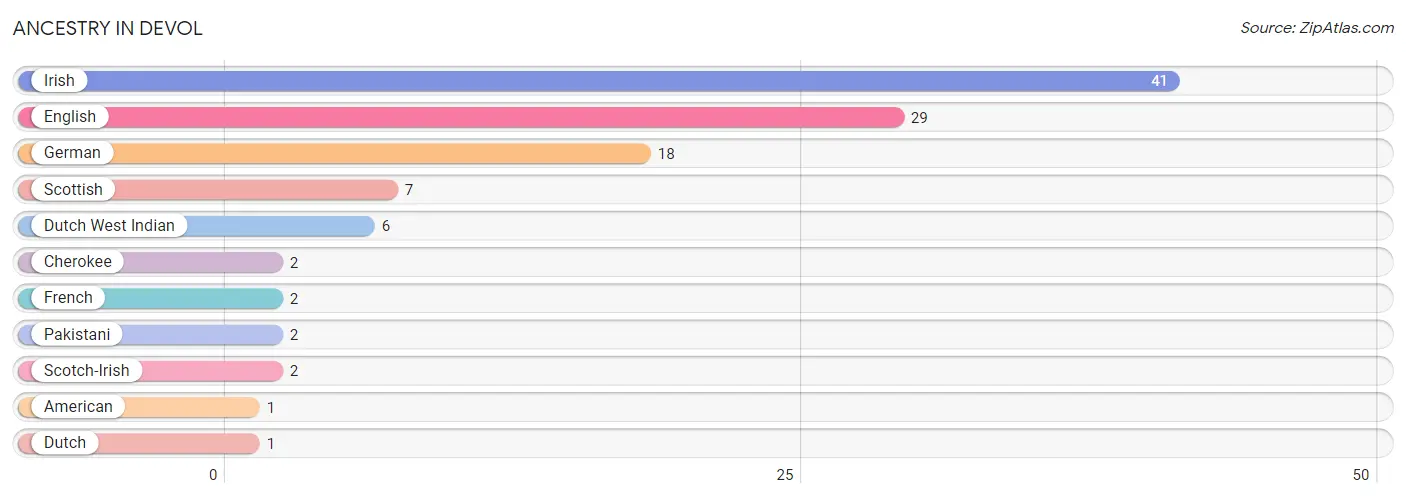
Ancestry in Devol
The most populous ancestries reported in Devol are Irish (41 | 24.7%), English (29 | 17.5%), German (18 | 10.8%), Scottish (7 | 4.2%), and Dutch West Indian (6 | 3.6%), together accounting for 60.8% of all Devol residents.
| Ancestry | # Population | % Population |
| American | 1 | 0.6% |
| Cherokee | 2 | 1.2% |
| Dutch | 1 | 0.6% |
| Dutch West Indian | 6 | 3.6% |
| English | 29 | 17.5% |
| French | 2 | 1.2% |
| German | 18 | 10.8% |
| Irish | 41 | 24.7% |
| Pakistani | 2 | 1.2% |
| Scotch-Irish | 2 | 1.2% |
| Scottish | 7 | 4.2% | View All 11 Rows |
Immigrants in Devol
The most numerous immigrant groups reported in Devol came from Asia (2 | 1.2%), South Eastern Asia (2 | 1.2%), and Thailand (2 | 1.2%), together accounting for 3.6% of all Devol residents.
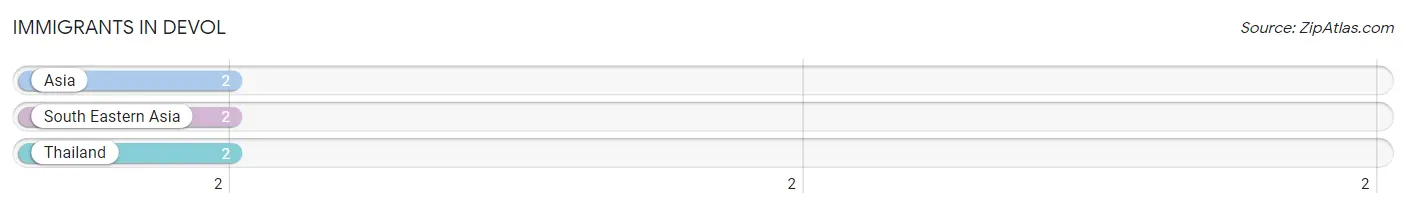
| Immigration Origin | # Population | % Population |
| Asia | 2 | 1.2% |
| South Eastern Asia | 2 | 1.2% |
| Thailand | 2 | 1.2% | View All 3 Rows |
Sex and Age in Devol
Sex and Age in Devol
The most populous age groups in Devol are 30 to 34 Years (17 | 16.5%) for men and 30 to 34 Years (14 | 22.2%) for women.
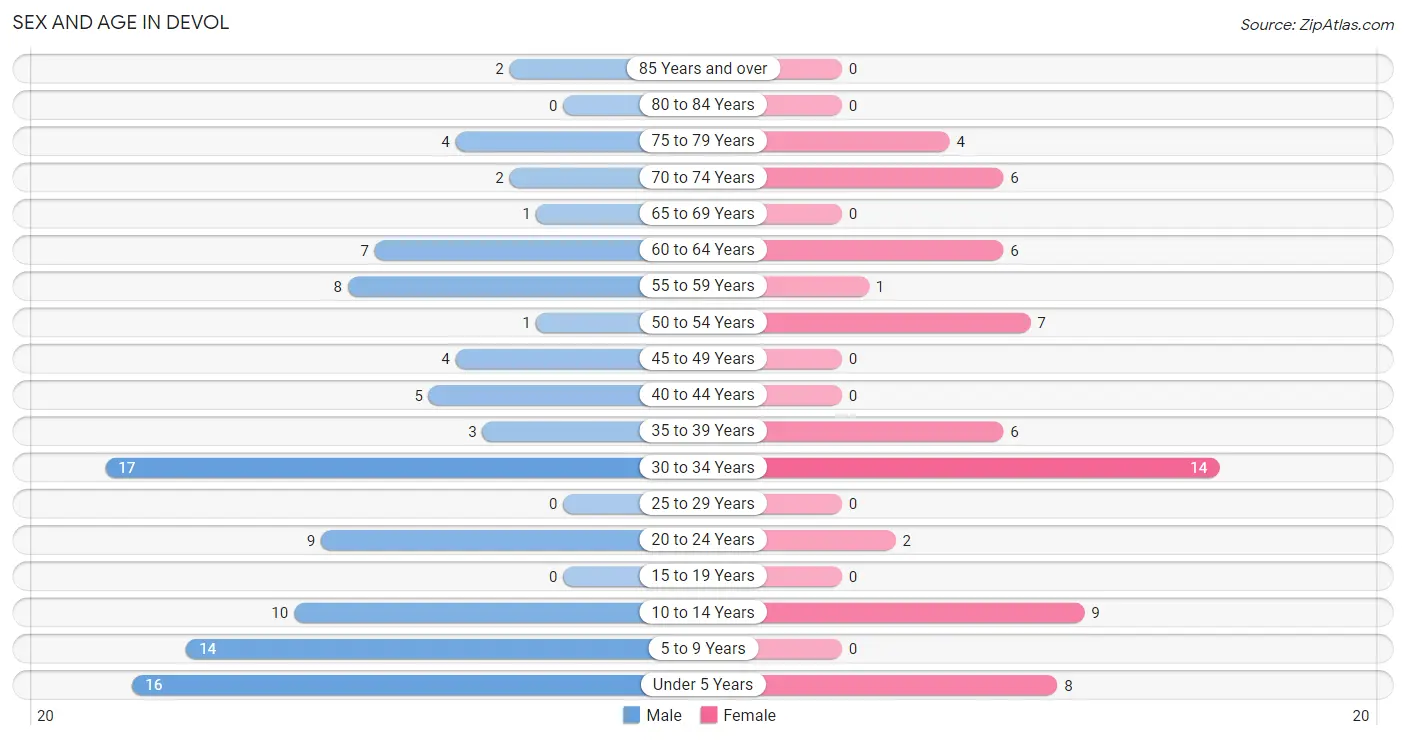
| Age Bracket | Male | Female |
| Under 5 Years | 16 (15.5%) | 8 (12.7%) |
| 5 to 9 Years | 14 (13.6%) | 0 (0.0%) |
| 10 to 14 Years | 10 (9.7%) | 9 (14.3%) |
| 15 to 19 Years | 0 (0.0%) | 0 (0.0%) |
| 20 to 24 Years | 9 (8.7%) | 2 (3.2%) |
| 25 to 29 Years | 0 (0.0%) | 0 (0.0%) |
| 30 to 34 Years | 17 (16.5%) | 14 (22.2%) |
| 35 to 39 Years | 3 (2.9%) | 6 (9.5%) |
| 40 to 44 Years | 5 (4.9%) | 0 (0.0%) |
| 45 to 49 Years | 4 (3.9%) | 0 (0.0%) |
| 50 to 54 Years | 1 (1.0%) | 7 (11.1%) |
| 55 to 59 Years | 8 (7.8%) | 1 (1.6%) |
| 60 to 64 Years | 7 (6.8%) | 6 (9.5%) |
| 65 to 69 Years | 1 (1.0%) | 0 (0.0%) |
| 70 to 74 Years | 2 (1.9%) | 6 (9.5%) |
| 75 to 79 Years | 4 (3.9%) | 4 (6.4%) |
| 80 to 84 Years | 0 (0.0%) | 0 (0.0%) |
| 85 Years and over | 2 (1.9%) | 0 (0.0%) |
| Total | 103 (100.0%) | 63 (100.0%) |
Families and Households in Devol
Median Family Size in Devol
The median family size in Devol is 3.57 persons per family, with single female/mother families (9 | 24.3%) accounting for the largest median family size of 5.11 persons per family. On the other hand, married-couple families (20 | 54.0%) represent the smallest median family size with 2.55 persons per family.
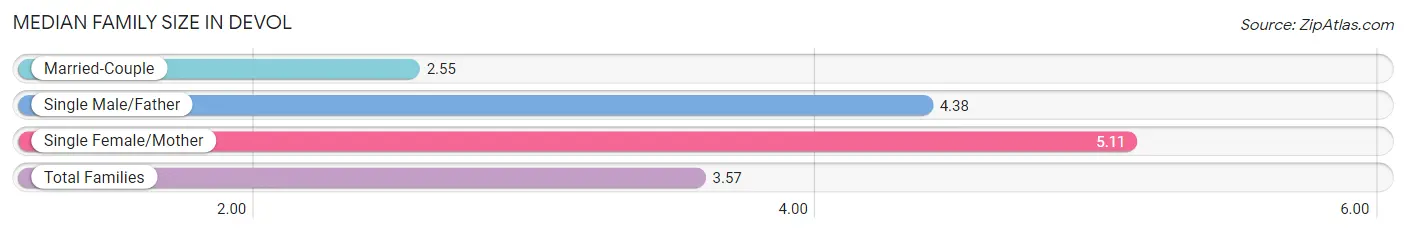
| Family Type | # Families | Family Size |
| Married-Couple | 20 (54.0%) | 2.55 |
| Single Male/Father | 8 (21.6%) | 4.38 |
| Single Female/Mother | 9 (24.3%) | 5.11 |
| Total Families | 37 (100.0%) | 3.57 |
Median Household Size in Devol
The median household size in Devol is 3.69 persons per household, with single female/mother households (9 | 20.0%) accounting for the largest median household size of 6.33 persons per household. non-family households (8 | 17.8%) represent the smallest median household size with 1.88 persons per household.
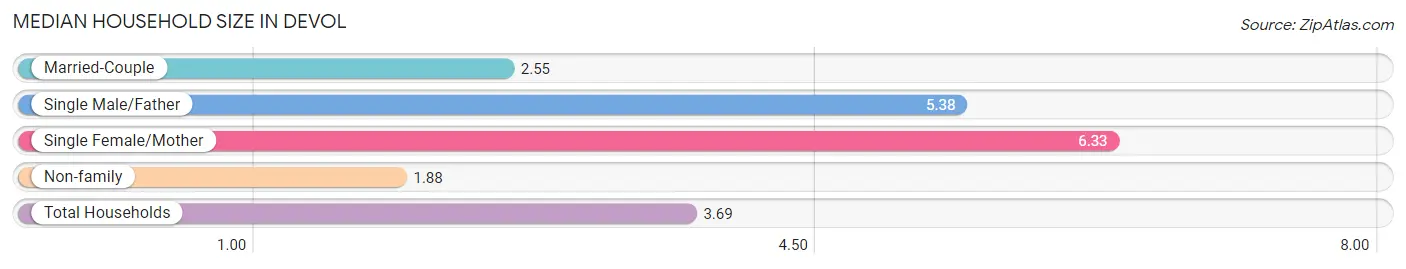
| Household Type | # Households | Household Size |
| Married-Couple | 20 (44.4%) | 2.55 |
| Single Male/Father | 8 (17.8%) | 5.38 |
| Single Female/Mother | 9 (20.0%) | 6.33 |
| Non-family | 8 (17.8%) | 1.88 |
| Total Households | 45 (100.0%) | 3.69 |
Household Size by Marriage Status in Devol
Out of a total of 45 households in Devol, 37 (82.2%) are family households, while 8 (17.8%) are nonfamily households. The most numerous type of family households are 2-person households, comprising 11, and the most common type of nonfamily households are 1-person households, comprising 5.
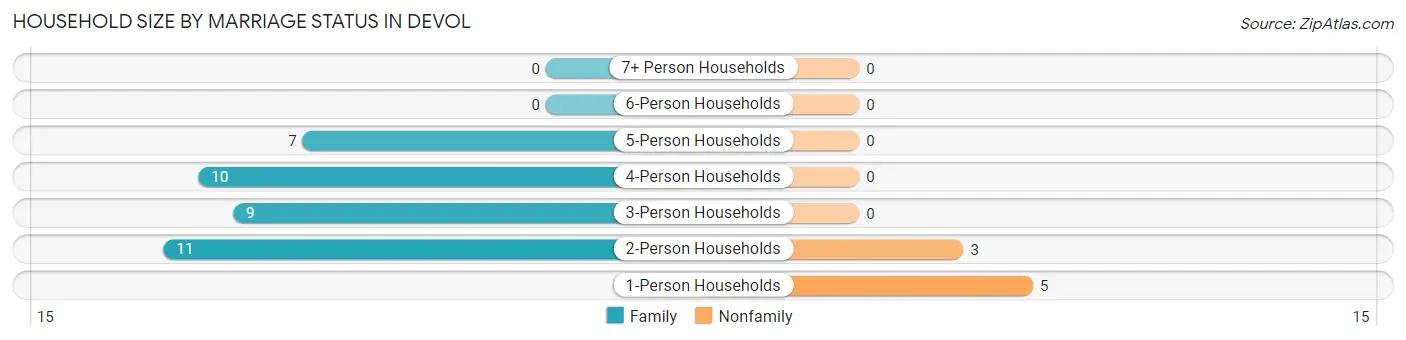
| Household Size | Family Households | Nonfamily Households |
| 1-Person Households | - | 5 (11.1%) |
| 2-Person Households | 11 (24.4%) | 3 (6.7%) |
| 3-Person Households | 9 (20.0%) | 0 (0.0%) |
| 4-Person Households | 10 (22.2%) | 0 (0.0%) |
| 5-Person Households | 7 (15.6%) | 0 (0.0%) |
| 6-Person Households | 0 (0.0%) | 0 (0.0%) |
| 7+ Person Households | 0 (0.0%) | 0 (0.0%) |
| Total | 37 (82.2%) | 8 (17.8%) |
Female Fertility in Devol
Fertility by Age in Devol
Average fertility rate in Devol is 318.0 births per 1,000 women. Women in the age bracket of 20 to 34 years have the highest fertility rate with 438.0 births per 1,000 women. Women in the age bracket of 20 to 34 years acount for 100.0% of all women with births.
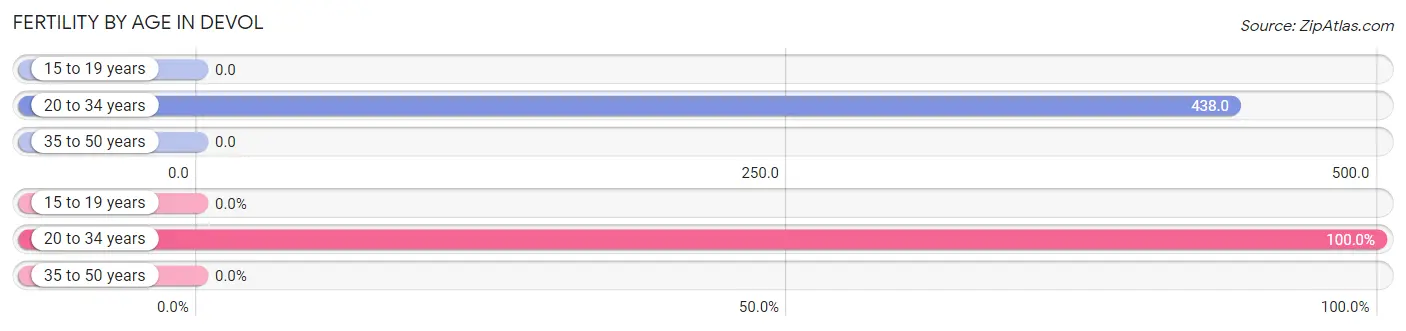
| Age Bracket | Women with Births | Births / 1,000 Women |
| 15 to 19 years | 0 (0.0%) | 0.0 |
| 20 to 34 years | 7 (100.0%) | 438.0 |
| 35 to 50 years | 0 (0.0%) | 0.0 |
| Total | 7 (100.0%) | 318.0 |
Fertility by Age by Marriage Status in Devol
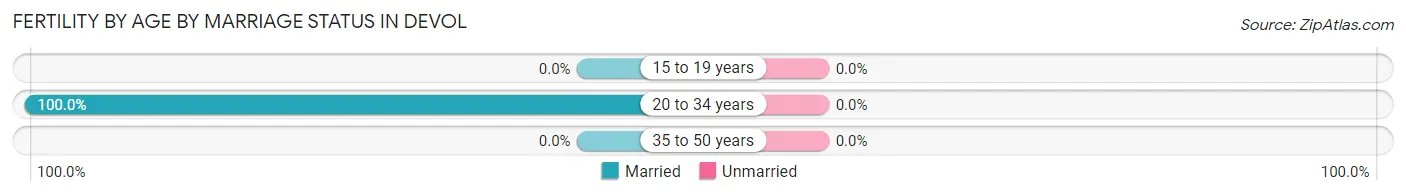
| Age Bracket | Married | Unmarried |
| 15 to 19 years | 0 (0.0%) | 0 (0.0%) |
| 20 to 34 years | 7 (100.0%) | 0 (0.0%) |
| 35 to 50 years | 0 (0.0%) | 0 (0.0%) |
| Total | 7 (100.0%) | 0 (0.0%) |
Fertility by Education in Devol
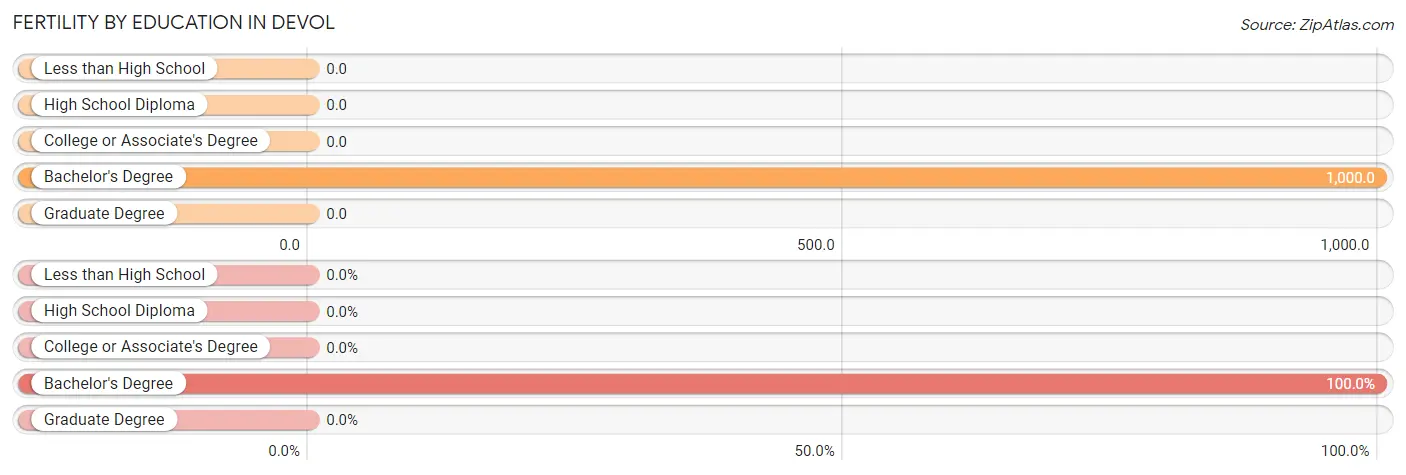
| Educational Attainment | Women with Births | Births / 1,000 Women |
| Less than High School | 0 (0.0%) | 0.0 |
| High School Diploma | 0 (0.0%) | 0.0 |
| College or Associate's Degree | 0 (0.0%) | 0.0 |
| Bachelor's Degree | 7 (100.0%) | 1,000.0 |
| Graduate Degree | 0 (0.0%) | 0.0 |
| Total | 7 (100.0%) | 318.0 |
Fertility by Education by Marriage Status in Devol
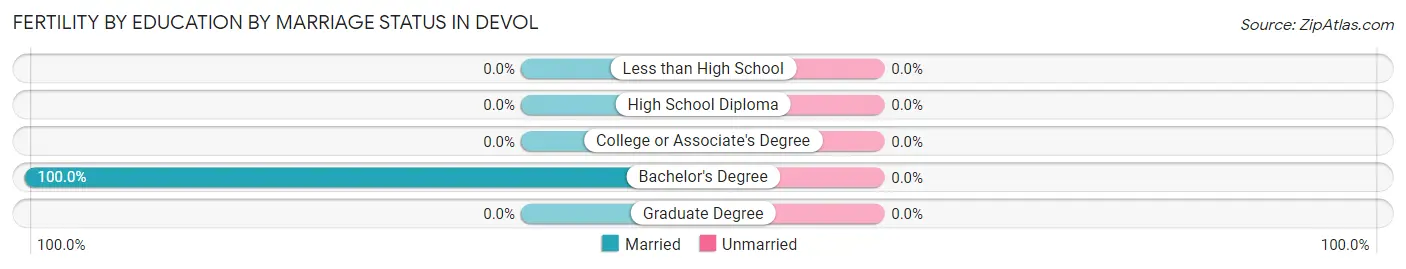
| Educational Attainment | Married | Unmarried |
| Less than High School | 0 (0.0%) | 0 (0.0%) |
| High School Diploma | 0 (0.0%) | 0 (0.0%) |
| College or Associate's Degree | 0 (0.0%) | 0 (0.0%) |
| Bachelor's Degree | 7 (100.0%) | 0 (0.0%) |
| Graduate Degree | 0 (0.0%) | 0 (0.0%) |
| Total | 7 (100.0%) | 0 (0.0%) |
Employment Characteristics in Devol
Employment by Class of Employer in Devol
Among the 71 employed individuals in Devol, private company employees (41 | 57.8%), state government employees (14 | 19.7%), and federal government employees (9 | 12.7%) make up the most common classes of employment.
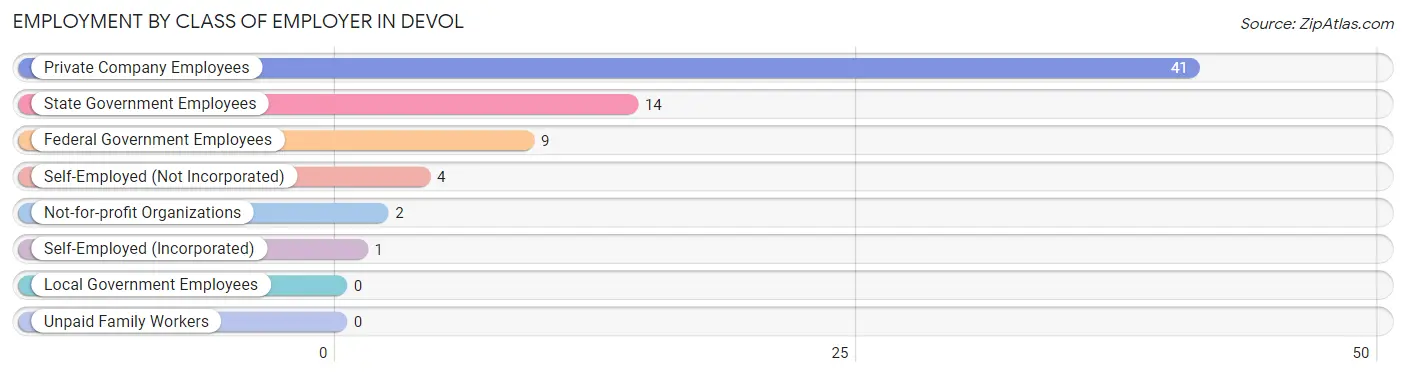
| Employer Class | # Employees | % Employees |
| Private Company Employees | 41 | 57.8% |
| Self-Employed (Incorporated) | 1 | 1.4% |
| Self-Employed (Not Incorporated) | 4 | 5.6% |
| Not-for-profit Organizations | 2 | 2.8% |
| Local Government Employees | 0 | 0.0% |
| State Government Employees | 14 | 19.7% |
| Federal Government Employees | 9 | 12.7% |
| Unpaid Family Workers | 0 | 0.0% |
| Total | 71 | 100.0% |
Employment Status by Age in Devol
According to the labor force statistics for Devol, out of the total population over 16 years of age (109), 77.1% or 84 individuals are in the labor force, with 15.5% or 13 of them unemployed. The age group with the highest labor force participation rate is 20 to 24 years, with 100.0% or 11 individuals in the labor force. Within the labor force, the 30 to 34 years age range has the highest percentage of unemployed individuals, with 38.7% or 12 of them being unemployed.
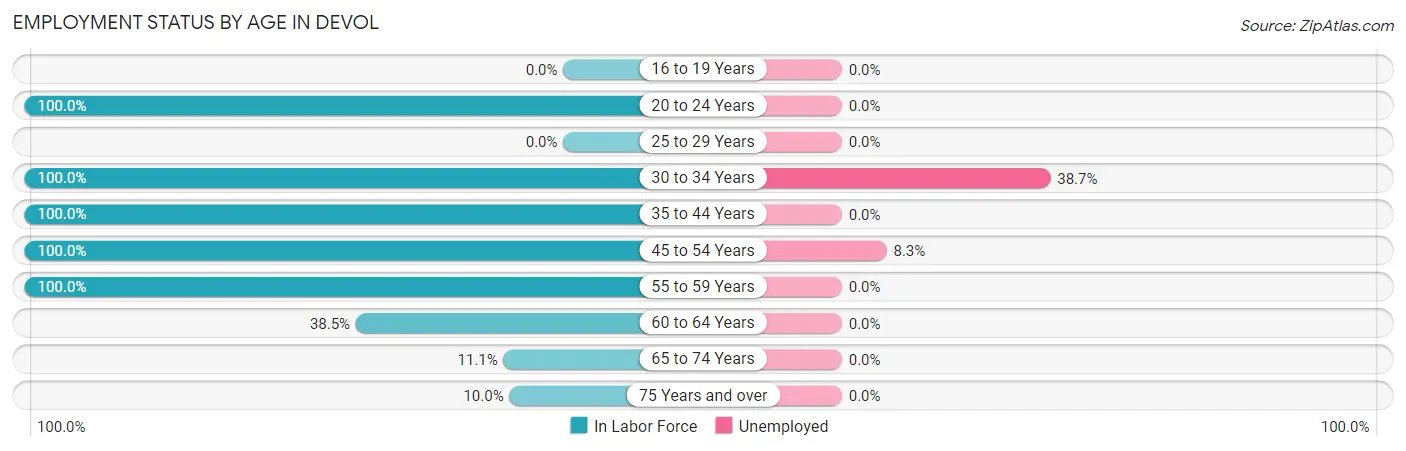
| Age Bracket | In Labor Force | Unemployed |
| 16 to 19 Years | 0 (0.0%) | 0 (0.0%) |
| 20 to 24 Years | 11 (100.0%) | 0 (0.0%) |
| 25 to 29 Years | 0 (0.0%) | 0 (0.0%) |
| 30 to 34 Years | 31 (100.0%) | 12 (38.7%) |
| 35 to 44 Years | 14 (100.0%) | 0 (0.0%) |
| 45 to 54 Years | 12 (100.0%) | 1 (8.3%) |
| 55 to 59 Years | 9 (100.0%) | 0 (0.0%) |
| 60 to 64 Years | 5 (38.5%) | 0 (0.0%) |
| 65 to 74 Years | 1 (11.1%) | 0 (0.0%) |
| 75 Years and over | 1 (10.0%) | 0 (0.0%) |
| Total | 84 (77.1%) | 13 (15.5%) |
Employment Status by Educational Attainment in Devol
According to labor force statistics for Devol, 89.9% of individuals (71) out of the total population between 25 and 64 years of age (79) are in the labor force, with 18.3% or 13 of them being unemployed. The group with the highest labor force participation rate are those with the educational attainment of less than high school, with 100.0% or 17 individuals in the labor force. Within the labor force, individuals with college / associate degree education have the highest percentage of unemployment, with 61.5% or 8 of them being unemployed.
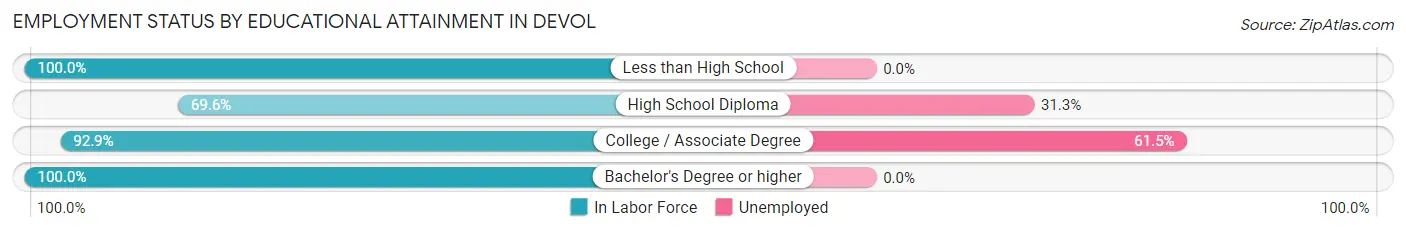
| Educational Attainment | In Labor Force | Unemployed |
| Less than High School | 17 (100.0%) | 0 (0.0%) |
| High School Diploma | 16 (69.6%) | 7 (31.3%) |
| College / Associate Degree | 13 (92.9%) | 9 (61.5%) |
| Bachelor's Degree or higher | 25 (100.0%) | 0 (0.0%) |
| Total | 71 (89.9%) | 14 (18.3%) |
Employment Occupations by Sex in Devol
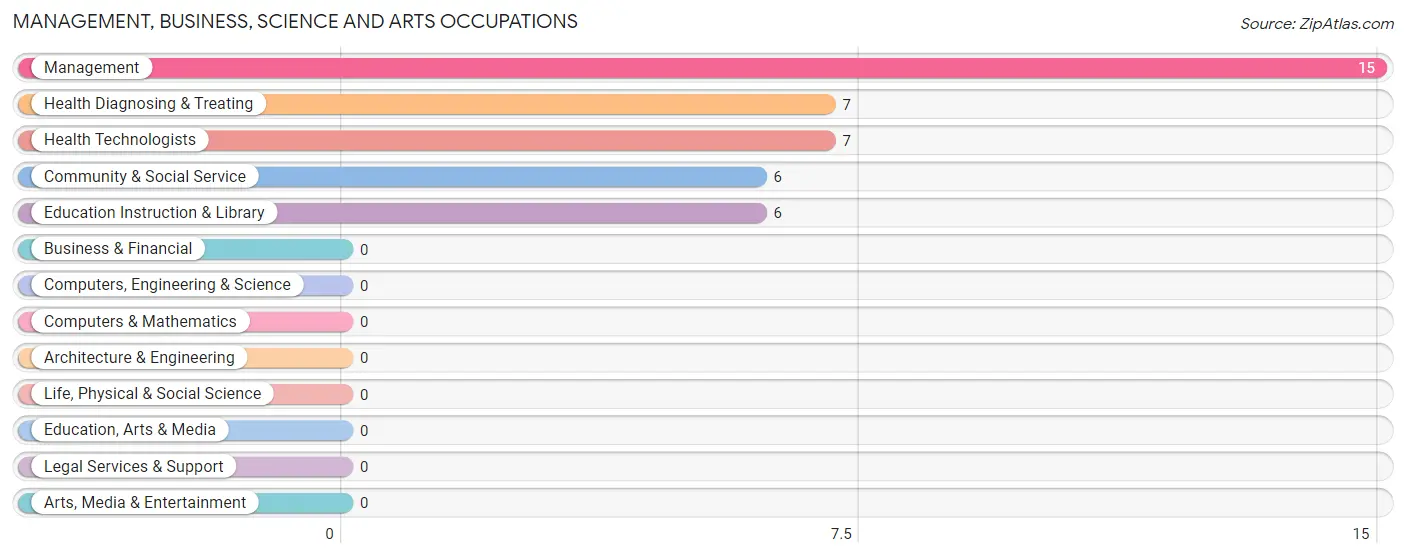
Management, Business, Science and Arts Occupations
The most common Management, Business, Science and Arts occupations in Devol are Management (15 | 21.1%), Health Diagnosing & Treating (7 | 9.9%), Health Technologists (7 | 9.9%), Community & Social Service (6 | 8.5%), and Education Instruction & Library (6 | 8.5%).
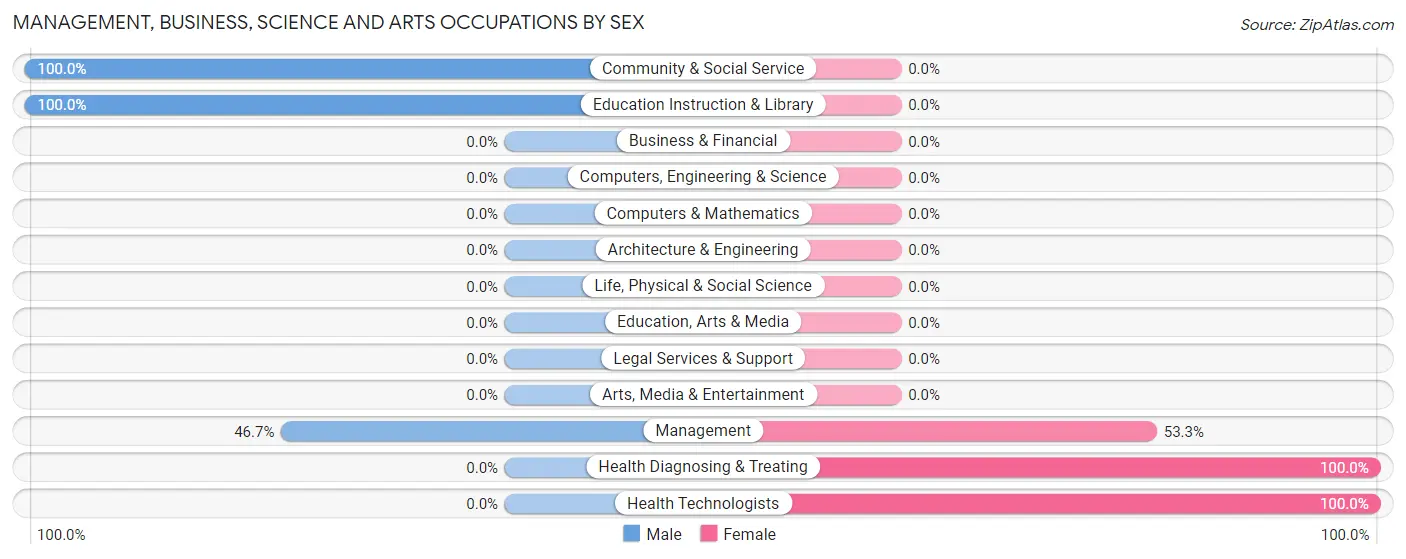
Management, Business, Science and Arts Occupations by Sex
Within the Management, Business, Science and Arts occupations in Devol, the most male-oriented occupations are Community & Social Service (100.0%), Education Instruction & Library (100.0%), and Management (46.7%), while the most female-oriented occupations are Health Diagnosing & Treating (100.0%), Health Technologists (100.0%), and Management (53.3%).
| Occupation | Male | Female |
| Management | 7 (46.7%) | 8 (53.3%) |
| Business & Financial | 0 (0.0%) | 0 (0.0%) |
| Computers, Engineering & Science | 0 (0.0%) | 0 (0.0%) |
| Computers & Mathematics | 0 (0.0%) | 0 (0.0%) |
| Architecture & Engineering | 0 (0.0%) | 0 (0.0%) |
| Life, Physical & Social Science | 0 (0.0%) | 0 (0.0%) |
| Community & Social Service | 6 (100.0%) | 0 (0.0%) |
| Education, Arts & Media | 0 (0.0%) | 0 (0.0%) |
| Legal Services & Support | 0 (0.0%) | 0 (0.0%) |
| Education Instruction & Library | 6 (100.0%) | 0 (0.0%) |
| Arts, Media & Entertainment | 0 (0.0%) | 0 (0.0%) |
| Health Diagnosing & Treating | 0 (0.0%) | 7 (100.0%) |
| Health Technologists | 0 (0.0%) | 7 (100.0%) |
| Total (Category) | 13 (46.4%) | 15 (53.6%) |
| Total (Overall) | 48 (67.6%) | 23 (32.4%) |
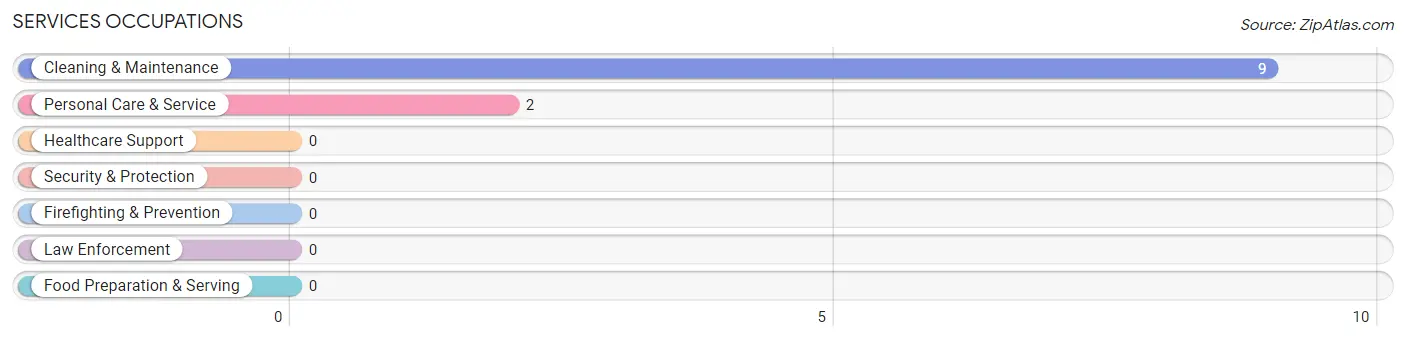
Services Occupations
The most common Services occupations in Devol are Cleaning & Maintenance (9 | 12.7%), and Personal Care & Service (2 | 2.8%).
Services Occupations by Sex
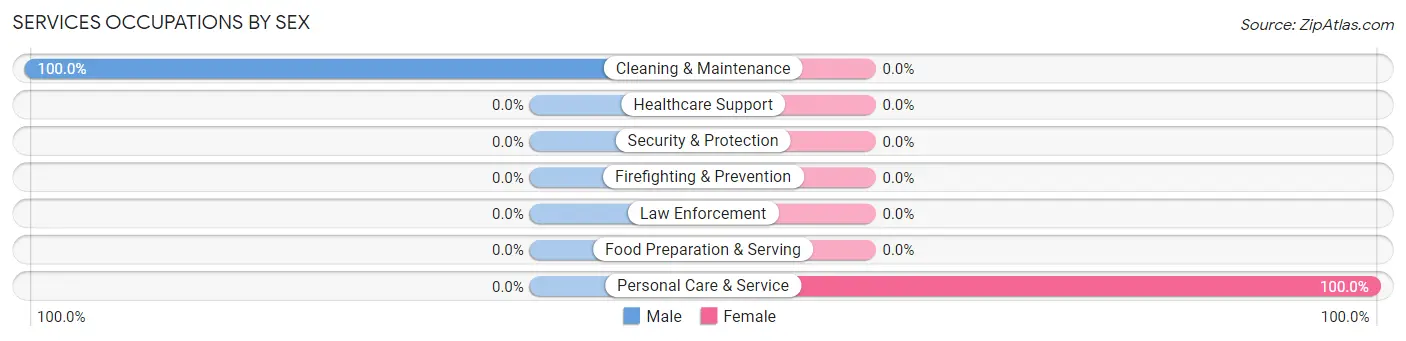
| Occupation | Male | Female |
| Healthcare Support | 0 (0.0%) | 0 (0.0%) |
| Security & Protection | 0 (0.0%) | 0 (0.0%) |
| Firefighting & Prevention | 0 (0.0%) | 0 (0.0%) |
| Law Enforcement | 0 (0.0%) | 0 (0.0%) |
| Food Preparation & Serving | 0 (0.0%) | 0 (0.0%) |
| Cleaning & Maintenance | 9 (100.0%) | 0 (0.0%) |
| Personal Care & Service | 0 (0.0%) | 2 (100.0%) |
| Total (Category) | 9 (81.8%) | 2 (18.2%) |
| Total (Overall) | 48 (67.6%) | 23 (32.4%) |
Sales and Office Occupations
The most common Sales and Office occupations in Devol are , and Sales & Related (12 | 16.9%).
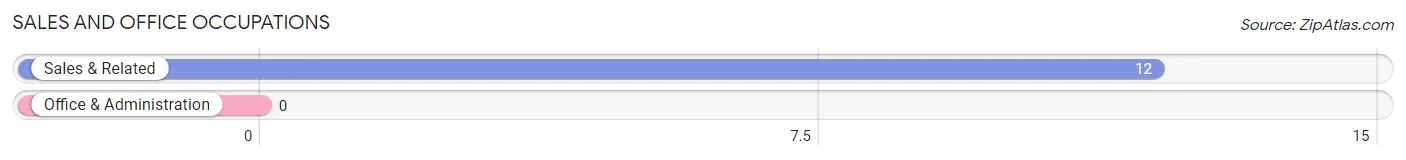
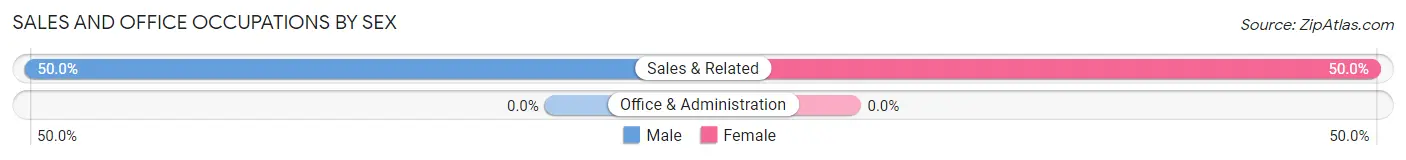
Sales and Office Occupations by Sex
| Occupation | Male | Female |
| Sales & Related | 6 (50.0%) | 6 (50.0%) |
| Office & Administration | 0 (0.0%) | 0 (0.0%) |
| Total (Category) | 6 (50.0%) | 6 (50.0%) |
| Total (Overall) | 48 (67.6%) | 23 (32.4%) |
Natural Resources, Construction and Maintenance Occupations
The most common Natural Resources, Construction and Maintenance occupations in Devol are , and Construction & Extraction (6 | 8.5%).
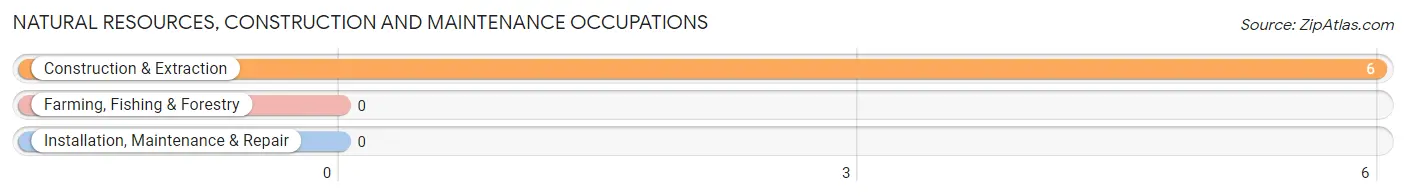
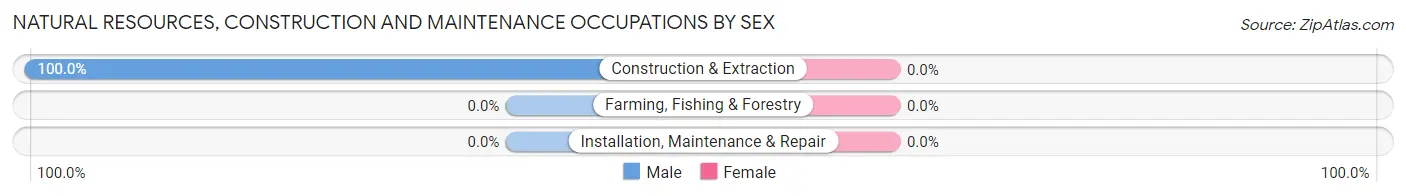
Natural Resources, Construction and Maintenance Occupations by Sex
| Occupation | Male | Female |
| Farming, Fishing & Forestry | 0 (0.0%) | 0 (0.0%) |
| Construction & Extraction | 6 (100.0%) | 0 (0.0%) |
| Installation, Maintenance & Repair | 0 (0.0%) | 0 (0.0%) |
| Total (Category) | 6 (100.0%) | 0 (0.0%) |
| Total (Overall) | 48 (67.6%) | 23 (32.4%) |
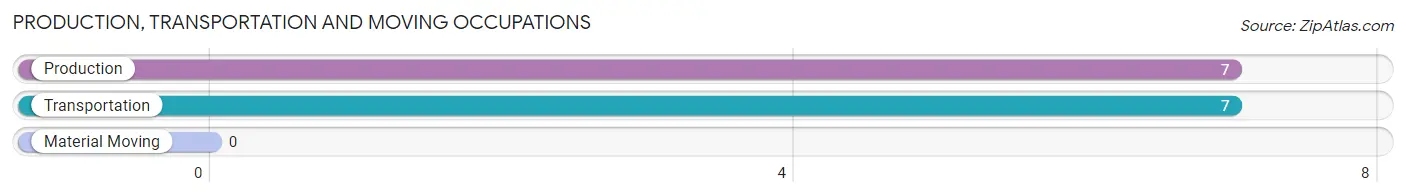
Production, Transportation and Moving Occupations
The most common Production, Transportation and Moving occupations in Devol are Production (7 | 9.9%), and Transportation (7 | 9.9%).
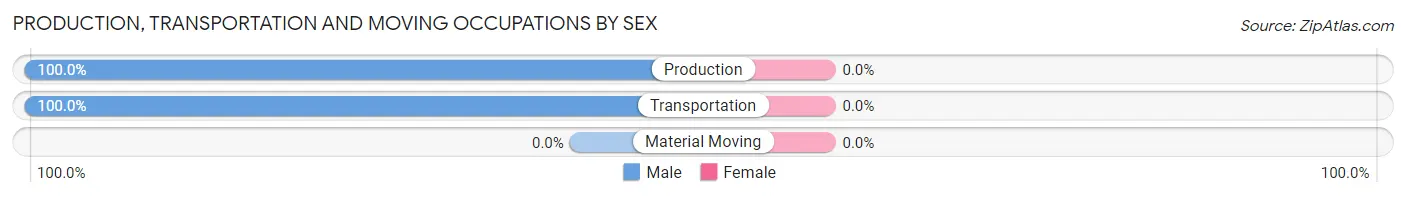
Production, Transportation and Moving Occupations by Sex
| Occupation | Male | Female |
| Production | 7 (100.0%) | 0 (0.0%) |
| Transportation | 7 (100.0%) | 0 (0.0%) |
| Material Moving | 0 (0.0%) | 0 (0.0%) |
| Total (Category) | 14 (100.0%) | 0 (0.0%) |
| Total (Overall) | 48 (67.6%) | 23 (32.4%) |
Employment Industries by Sex in Devol
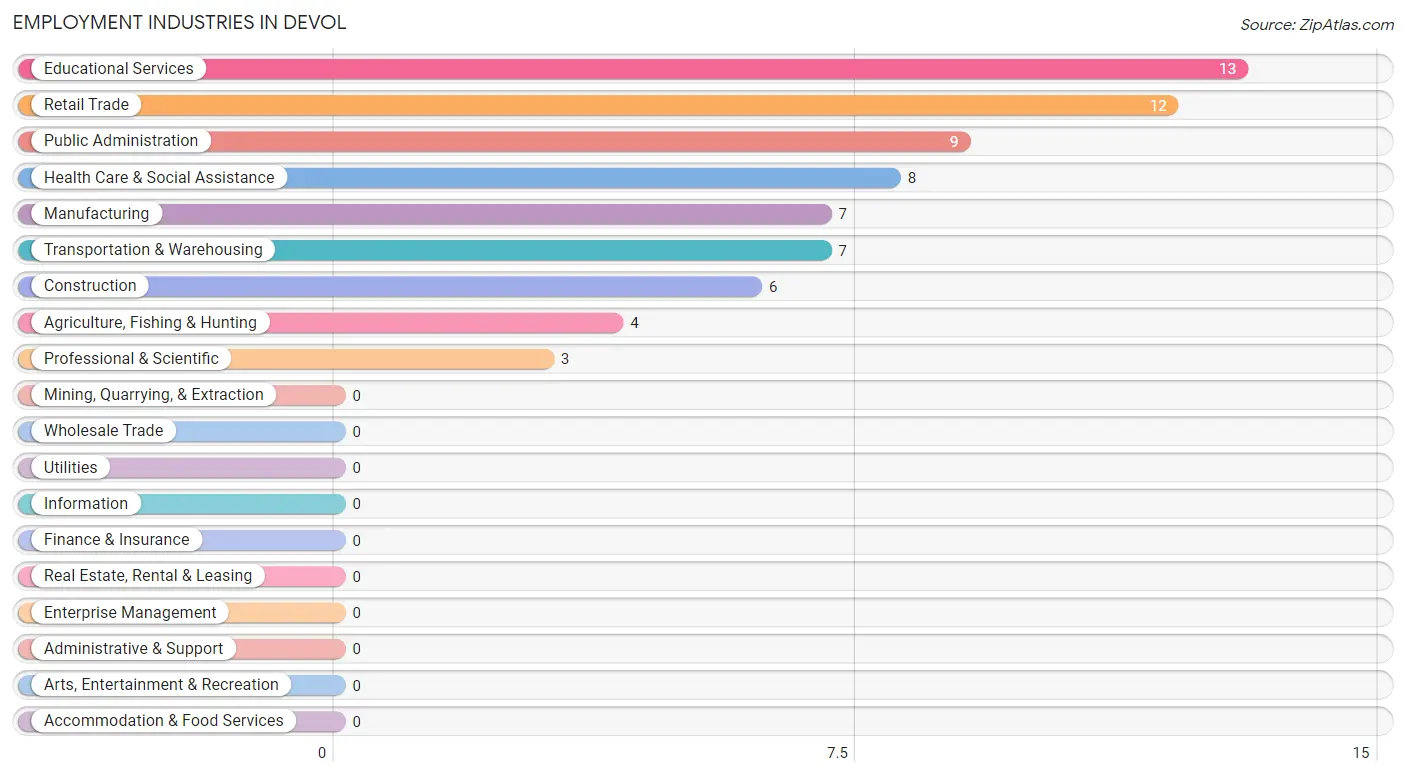
Employment Industries in Devol
The major employment industries in Devol include Educational Services (13 | 18.3%), Retail Trade (12 | 16.9%), Public Administration (9 | 12.7%), Health Care & Social Assistance (8 | 11.3%), and Manufacturing (7 | 9.9%).
Employment Industries by Sex in Devol
The Devol industries that see more men than women are Agriculture, Fishing & Hunting (100.0%), Construction (100.0%), and Manufacturing (100.0%), whereas the industries that tend to have a higher number of women are Health Care & Social Assistance (100.0%), Educational Services (53.8%), and Retail Trade (50.0%).
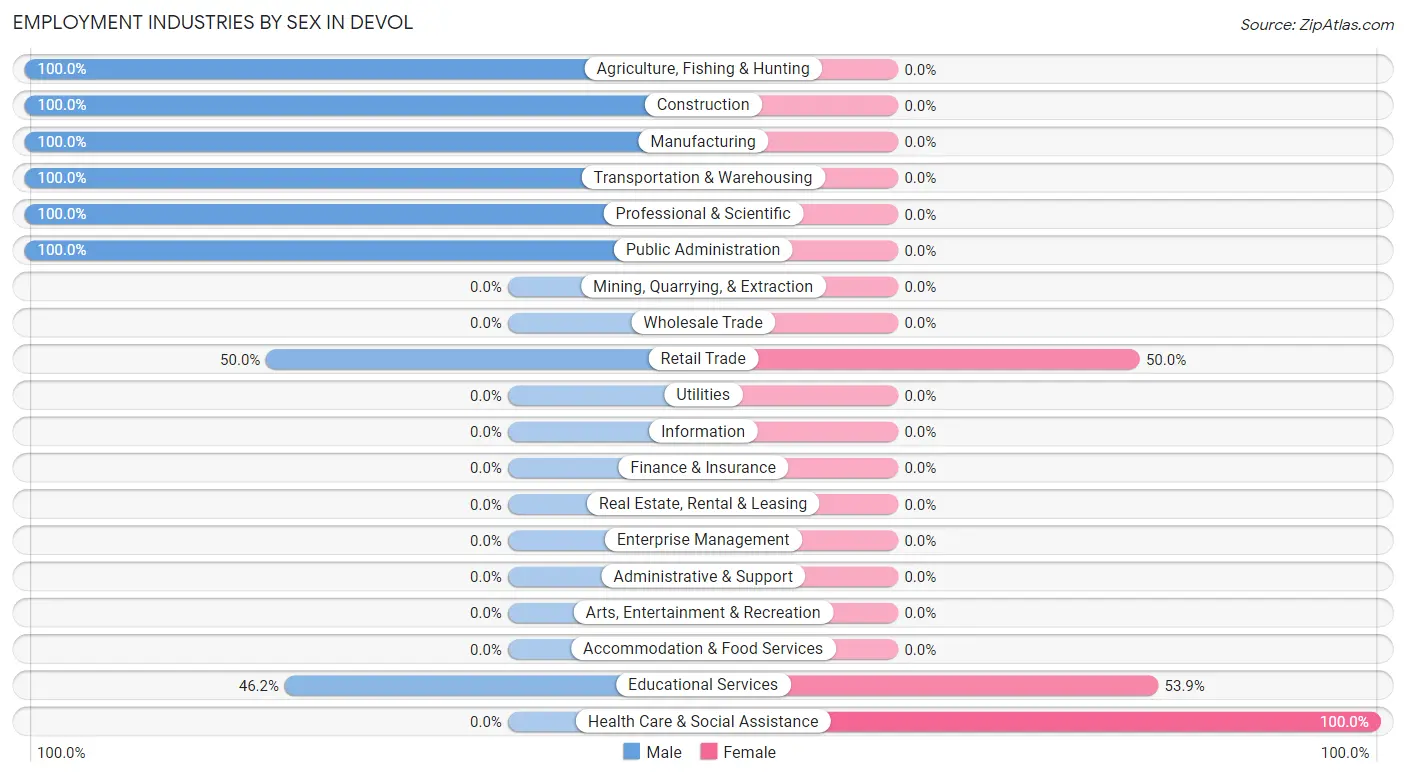
| Industry | Male | Female |
| Agriculture, Fishing & Hunting | 4 (100.0%) | 0 (0.0%) |
| Mining, Quarrying, & Extraction | 0 (0.0%) | 0 (0.0%) |
| Construction | 6 (100.0%) | 0 (0.0%) |
| Manufacturing | 7 (100.0%) | 0 (0.0%) |
| Wholesale Trade | 0 (0.0%) | 0 (0.0%) |
| Retail Trade | 6 (50.0%) | 6 (50.0%) |
| Transportation & Warehousing | 7 (100.0%) | 0 (0.0%) |
| Utilities | 0 (0.0%) | 0 (0.0%) |
| Information | 0 (0.0%) | 0 (0.0%) |
| Finance & Insurance | 0 (0.0%) | 0 (0.0%) |
| Real Estate, Rental & Leasing | 0 (0.0%) | 0 (0.0%) |
| Professional & Scientific | 3 (100.0%) | 0 (0.0%) |
| Enterprise Management | 0 (0.0%) | 0 (0.0%) |
| Administrative & Support | 0 (0.0%) | 0 (0.0%) |
| Educational Services | 6 (46.2%) | 7 (53.8%) |
| Health Care & Social Assistance | 0 (0.0%) | 8 (100.0%) |
| Arts, Entertainment & Recreation | 0 (0.0%) | 0 (0.0%) |
| Accommodation & Food Services | 0 (0.0%) | 0 (0.0%) |
| Public Administration | 9 (100.0%) | 0 (0.0%) |
| Total | 48 (67.6%) | 23 (32.4%) |
Education in Devol
School Enrollment in Devol
The most common levels of schooling among the 42 students in Devol are elementary school (25 | 59.5%), college / undergraduate (9 | 21.4%), and middle school (8 | 19.1%).
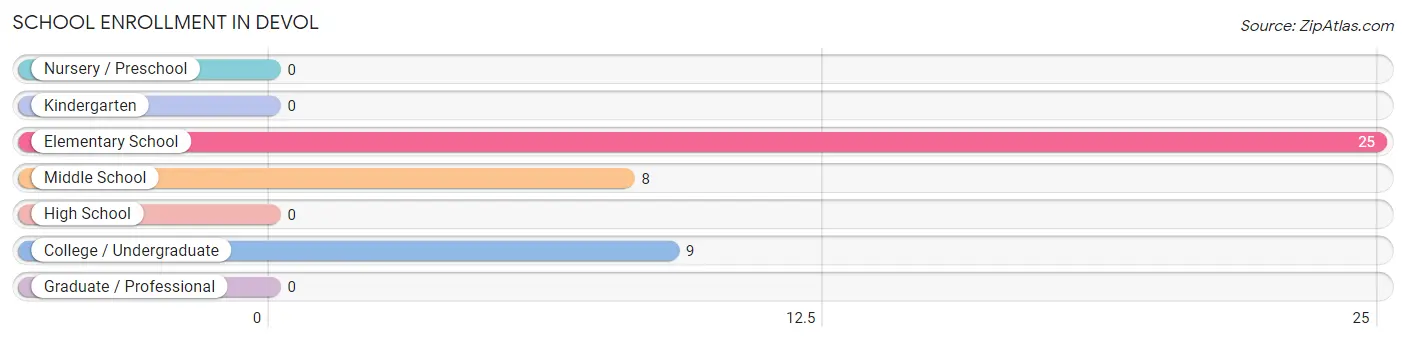
| School Level | # Students | % Students |
| Nursery / Preschool | 0 | 0.0% |
| Kindergarten | 0 | 0.0% |
| Elementary School | 25 | 59.5% |
| Middle School | 8 | 19.1% |
| High School | 0 | 0.0% |
| College / Undergraduate | 9 | 21.4% |
| Graduate / Professional | 0 | 0.0% |
| Total | 42 | 100.0% |
School Enrollment by Age by Funding Source in Devol
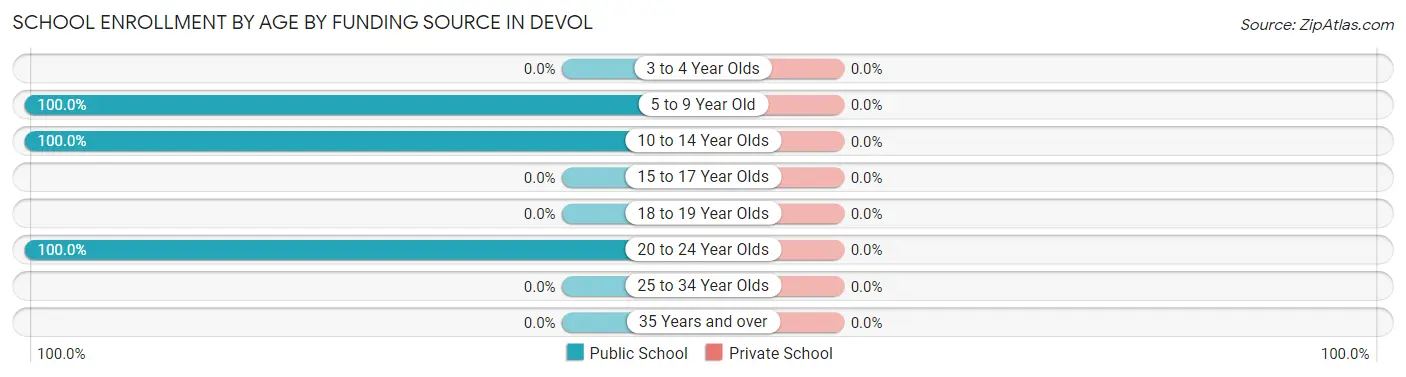
| Age Bracket | Public School | Private School |
| 3 to 4 Year Olds | 0 (0.0%) | 0 (0.0%) |
| 5 to 9 Year Old | 14 (100.0%) | 0 (0.0%) |
| 10 to 14 Year Olds | 19 (100.0%) | 0 (0.0%) |
| 15 to 17 Year Olds | 0 (0.0%) | 0 (0.0%) |
| 18 to 19 Year Olds | 0 (0.0%) | 0 (0.0%) |
| 20 to 24 Year Olds | 9 (100.0%) | 0 (0.0%) |
| 25 to 34 Year Olds | 0 (0.0%) | 0 (0.0%) |
| 35 Years and over | 0 (0.0%) | 0 (0.0%) |
| Total | 42 (100.0%) | 0 (0.0%) |
Educational Attainment by Field of Study in Devol
Education (18 | 60.0%), science & technology (7 | 23.3%), business (4 | 13.3%), and psychology (1 | 3.3%) are the most common fields of study among 30 individuals in Devol who have obtained a bachelor's degree or higher.
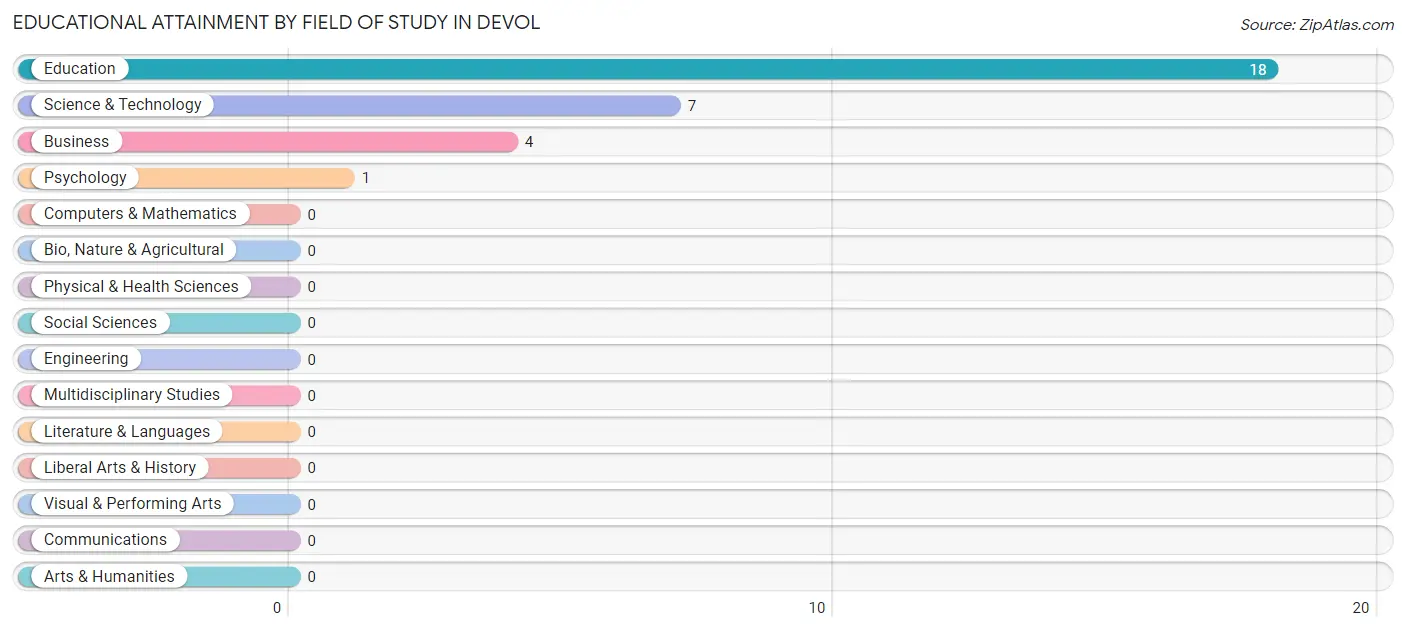
| Field of Study | # Graduates | % Graduates |
| Computers & Mathematics | 0 | 0.0% |
| Bio, Nature & Agricultural | 0 | 0.0% |
| Physical & Health Sciences | 0 | 0.0% |
| Psychology | 1 | 3.3% |
| Social Sciences | 0 | 0.0% |
| Engineering | 0 | 0.0% |
| Multidisciplinary Studies | 0 | 0.0% |
| Science & Technology | 7 | 23.3% |
| Business | 4 | 13.3% |
| Education | 18 | 60.0% |
| Literature & Languages | 0 | 0.0% |
| Liberal Arts & History | 0 | 0.0% |
| Visual & Performing Arts | 0 | 0.0% |
| Communications | 0 | 0.0% |
| Arts & Humanities | 0 | 0.0% |
| Total | 30 | 100.0% |
Transportation & Commute in Devol
Vehicle Availability by Sex in Devol
The most prevalent vehicle ownership categories in Devol are males with 3 vehicles (15, accounting for 31.2%) and females with 3 vehicles (8, making up 65.2%).
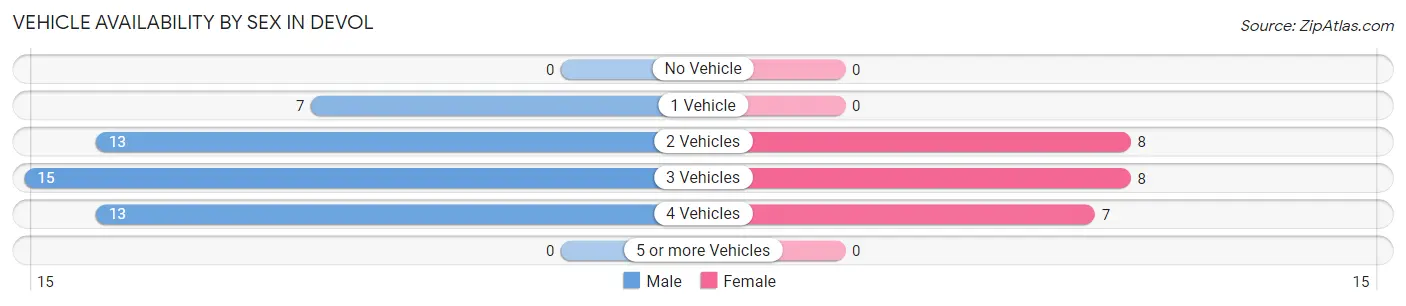
| Vehicles Available | Male | Female |
| No Vehicle | 0 (0.0%) | 0 (0.0%) |
| 1 Vehicle | 7 (14.6%) | 0 (0.0%) |
| 2 Vehicles | 13 (27.1%) | 8 (34.8%) |
| 3 Vehicles | 15 (31.2%) | 8 (34.8%) |
| 4 Vehicles | 13 (27.1%) | 7 (30.4%) |
| 5 or more Vehicles | 0 (0.0%) | 0 (0.0%) |
| Total | 48 (100.0%) | 23 (100.0%) |
Commute Time in Devol
The most frequently occuring commute durations in Devol are 10 to 14 minutes (22 commuters, 31.4%), 45 to 59 minutes (16 commuters, 22.9%), and 15 to 19 minutes (12 commuters, 17.1%).
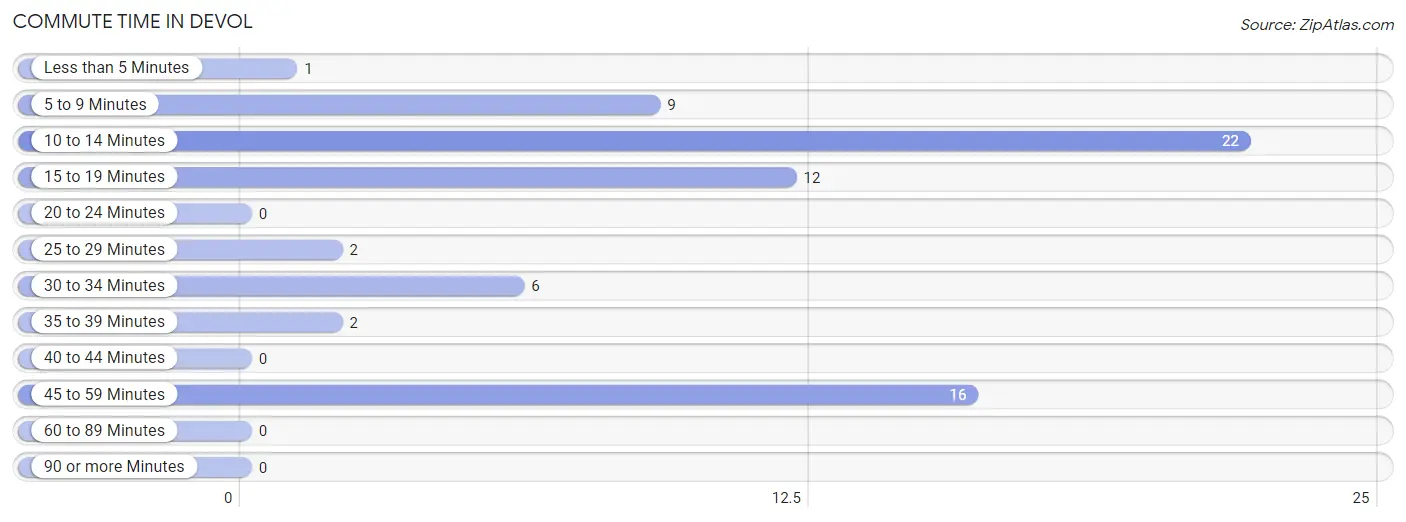
| Commute Time | # Commuters | % Commuters |
| Less than 5 Minutes | 1 | 1.4% |
| 5 to 9 Minutes | 9 | 12.9% |
| 10 to 14 Minutes | 22 | 31.4% |
| 15 to 19 Minutes | 12 | 17.1% |
| 20 to 24 Minutes | 0 | 0.0% |
| 25 to 29 Minutes | 2 | 2.9% |
| 30 to 34 Minutes | 6 | 8.6% |
| 35 to 39 Minutes | 2 | 2.9% |
| 40 to 44 Minutes | 0 | 0.0% |
| 45 to 59 Minutes | 16 | 22.9% |
| 60 to 89 Minutes | 0 | 0.0% |
| 90 or more Minutes | 0 | 0.0% |
Commute Time by Sex in Devol
The most common commute times in Devol are 15 to 19 minutes (12 commuters, 25.5%) for males and 10 to 14 minutes (13 commuters, 56.5%) for females.
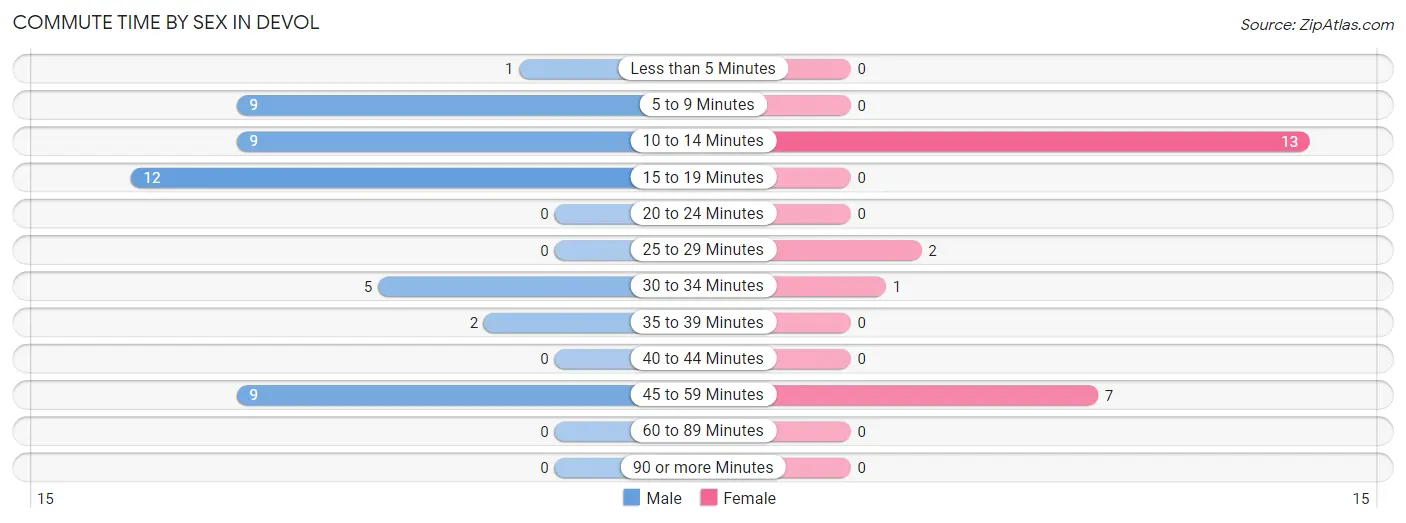
| Commute Time | Male | Female |
| Less than 5 Minutes | 1 (2.1%) | 0 (0.0%) |
| 5 to 9 Minutes | 9 (19.2%) | 0 (0.0%) |
| 10 to 14 Minutes | 9 (19.2%) | 13 (56.5%) |
| 15 to 19 Minutes | 12 (25.5%) | 0 (0.0%) |
| 20 to 24 Minutes | 0 (0.0%) | 0 (0.0%) |
| 25 to 29 Minutes | 0 (0.0%) | 2 (8.7%) |
| 30 to 34 Minutes | 5 (10.6%) | 1 (4.3%) |
| 35 to 39 Minutes | 2 (4.3%) | 0 (0.0%) |
| 40 to 44 Minutes | 0 (0.0%) | 0 (0.0%) |
| 45 to 59 Minutes | 9 (19.2%) | 7 (30.4%) |
| 60 to 89 Minutes | 0 (0.0%) | 0 (0.0%) |
| 90 or more Minutes | 0 (0.0%) | 0 (0.0%) |
Time of Departure to Work by Sex in Devol
The most frequent times of departure to work in Devol are 5:30 AM to 5:59 AM (12, 25.5%) for males and 6:00 AM to 6:29 AM (13, 56.5%) for females.
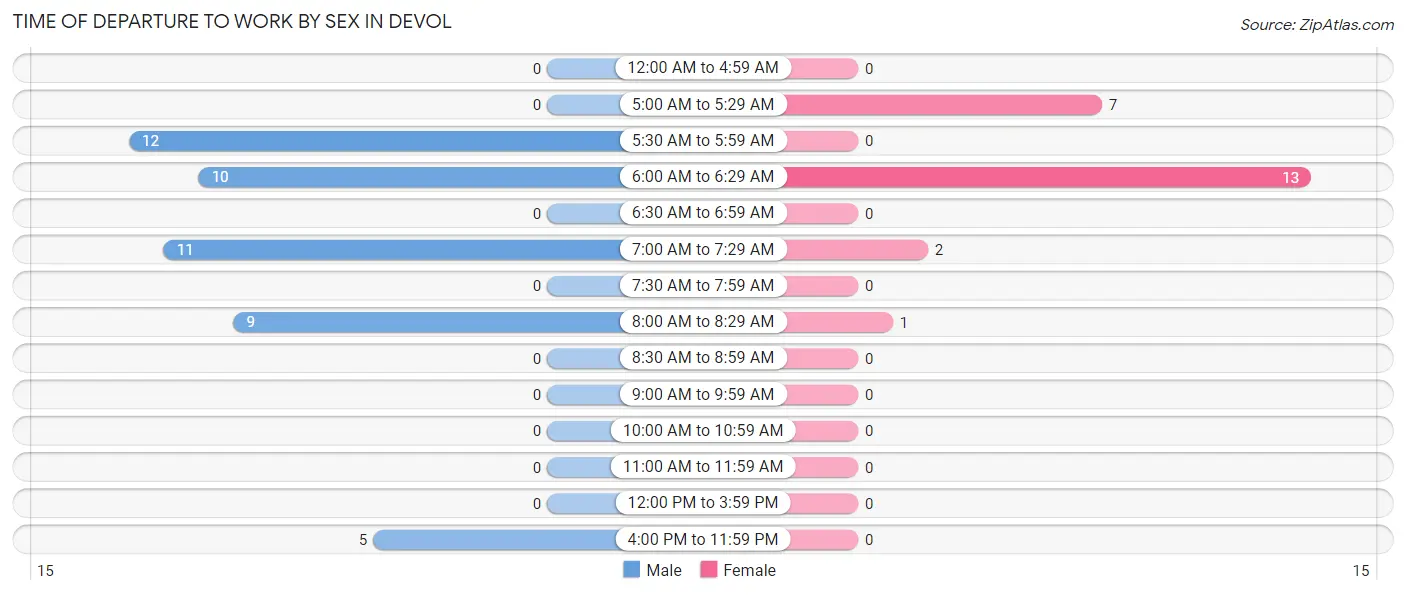
| Time of Departure | Male | Female |
| 12:00 AM to 4:59 AM | 0 (0.0%) | 0 (0.0%) |
| 5:00 AM to 5:29 AM | 0 (0.0%) | 7 (30.4%) |
| 5:30 AM to 5:59 AM | 12 (25.5%) | 0 (0.0%) |
| 6:00 AM to 6:29 AM | 10 (21.3%) | 13 (56.5%) |
| 6:30 AM to 6:59 AM | 0 (0.0%) | 0 (0.0%) |
| 7:00 AM to 7:29 AM | 11 (23.4%) | 2 (8.7%) |
| 7:30 AM to 7:59 AM | 0 (0.0%) | 0 (0.0%) |
| 8:00 AM to 8:29 AM | 9 (19.2%) | 1 (4.3%) |
| 8:30 AM to 8:59 AM | 0 (0.0%) | 0 (0.0%) |
| 9:00 AM to 9:59 AM | 0 (0.0%) | 0 (0.0%) |
| 10:00 AM to 10:59 AM | 0 (0.0%) | 0 (0.0%) |
| 11:00 AM to 11:59 AM | 0 (0.0%) | 0 (0.0%) |
| 12:00 PM to 3:59 PM | 0 (0.0%) | 0 (0.0%) |
| 4:00 PM to 11:59 PM | 5 (10.6%) | 0 (0.0%) |
| Total | 47 (100.0%) | 23 (100.0%) |
Housing Occupancy in Devol
Occupancy by Ownership in Devol
Of the total 45 dwellings in Devol, owner-occupied units account for 34 (75.6%), while renter-occupied units make up 11 (24.4%).
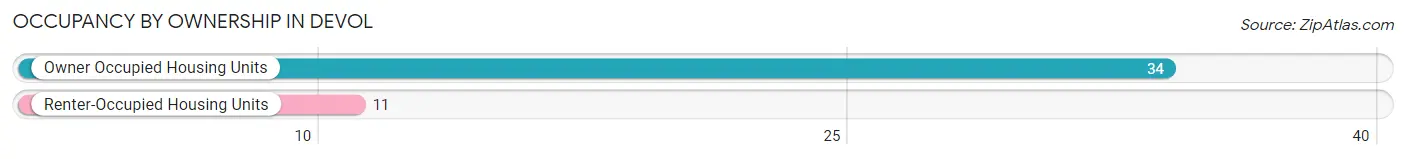
| Occupancy | # Housing Units | % Housing Units |
| Owner Occupied Housing Units | 34 | 75.6% |
| Renter-Occupied Housing Units | 11 | 24.4% |
| Total Occupied Housing Units | 45 | 100.0% |
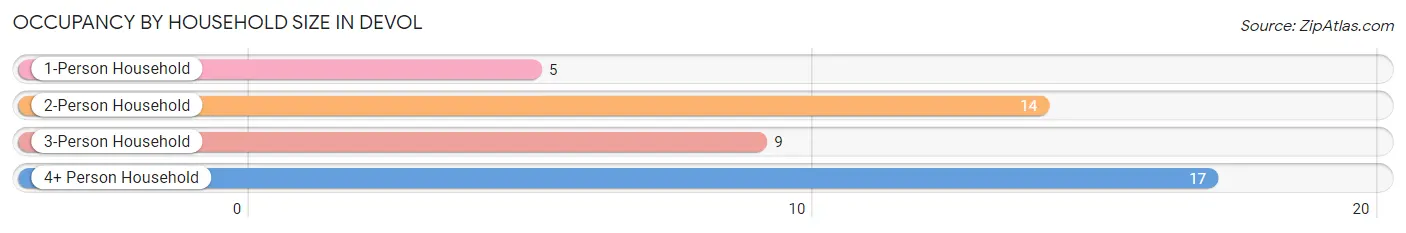
Occupancy by Household Size in Devol
| Household Size | # Housing Units | % Housing Units |
| 1-Person Household | 5 | 11.1% |
| 2-Person Household | 14 | 31.1% |
| 3-Person Household | 9 | 20.0% |
| 4+ Person Household | 17 | 37.8% |
| Total Housing Units | 45 | 100.0% |
Occupancy by Ownership by Household Size in Devol
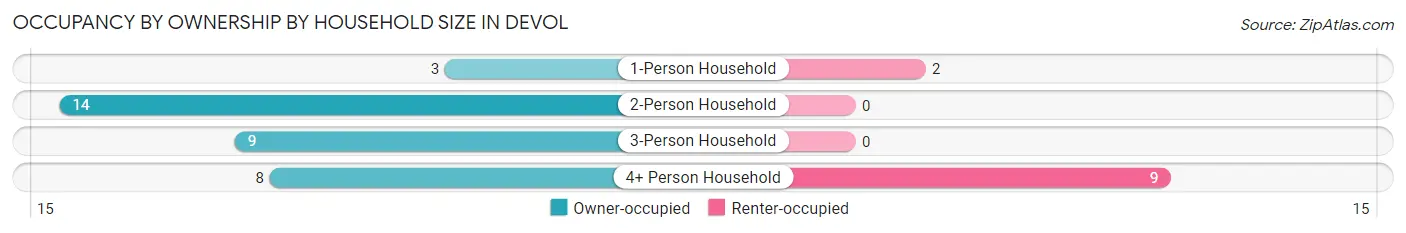
| Household Size | Owner-occupied | Renter-occupied |
| 1-Person Household | 3 (60.0%) | 2 (40.0%) |
| 2-Person Household | 14 (100.0%) | 0 (0.0%) |
| 3-Person Household | 9 (100.0%) | 0 (0.0%) |
| 4+ Person Household | 8 (47.1%) | 9 (52.9%) |
| Total Housing Units | 34 (75.6%) | 11 (24.4%) |
Occupancy by Educational Attainment in Devol
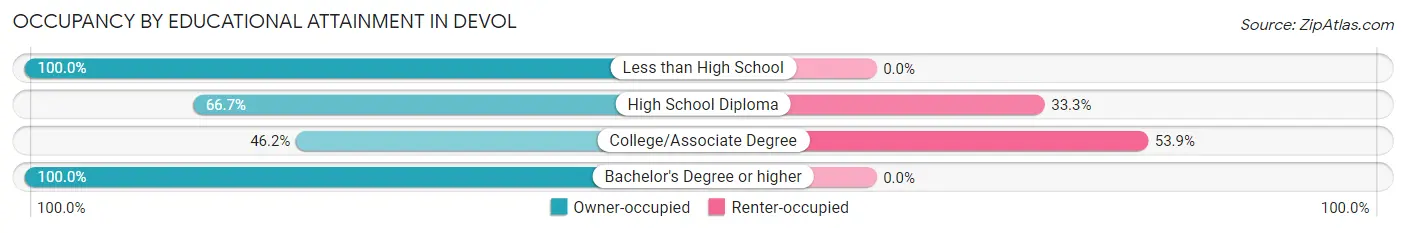
| Household Size | Owner-occupied | Renter-occupied |
| Less than High School | 7 (100.0%) | 0 (0.0%) |
| High School Diploma | 8 (66.7%) | 4 (33.3%) |
| College/Associate Degree | 6 (46.2%) | 7 (53.8%) |
| Bachelor's Degree or higher | 13 (100.0%) | 0 (0.0%) |
Occupancy by Age of Householder in Devol
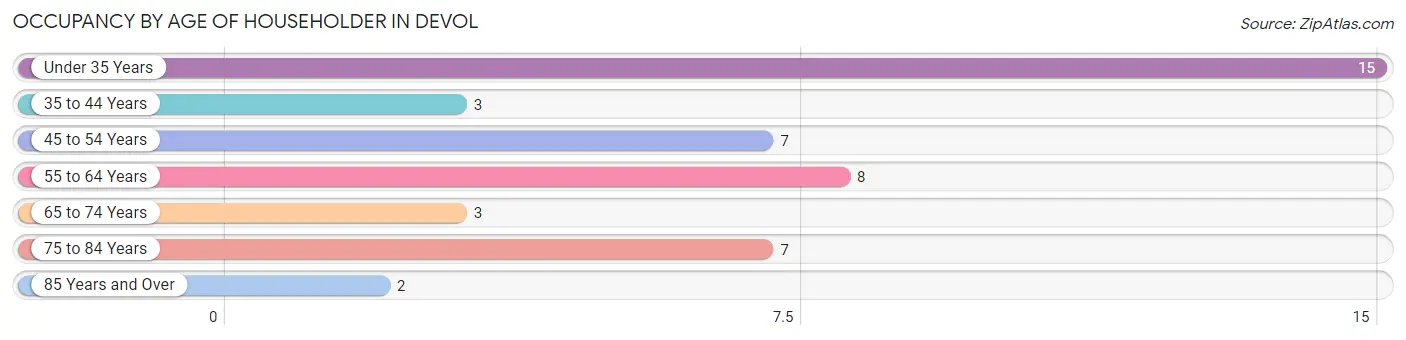
| Age Bracket | # Households | % Households |
| Under 35 Years | 15 | 33.3% |
| 35 to 44 Years | 3 | 6.7% |
| 45 to 54 Years | 7 | 15.6% |
| 55 to 64 Years | 8 | 17.8% |
| 65 to 74 Years | 3 | 6.7% |
| 75 to 84 Years | 7 | 15.6% |
| 85 Years and Over | 2 | 4.4% |
| Total | 45 | 100.0% |
Housing Finances in Devol
Median Income by Occupancy in Devol
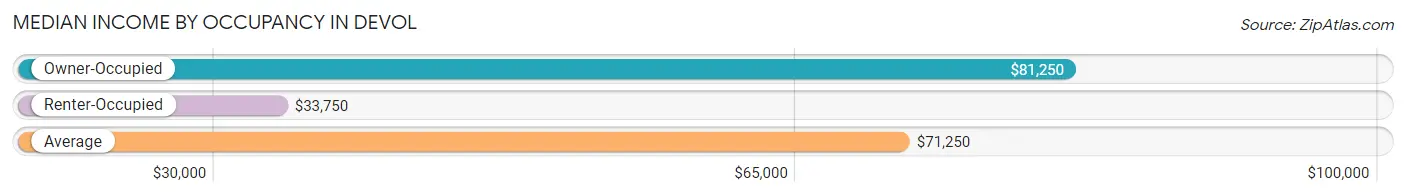
| Occupancy Type | # Households | Median Income |
| Owner-Occupied | 34 (75.6%) | $81,250 |
| Renter-Occupied | 11 (24.4%) | $33,750 |
| Average | 45 (100.0%) | $71,250 |
Occupancy by Householder Income Bracket in Devol
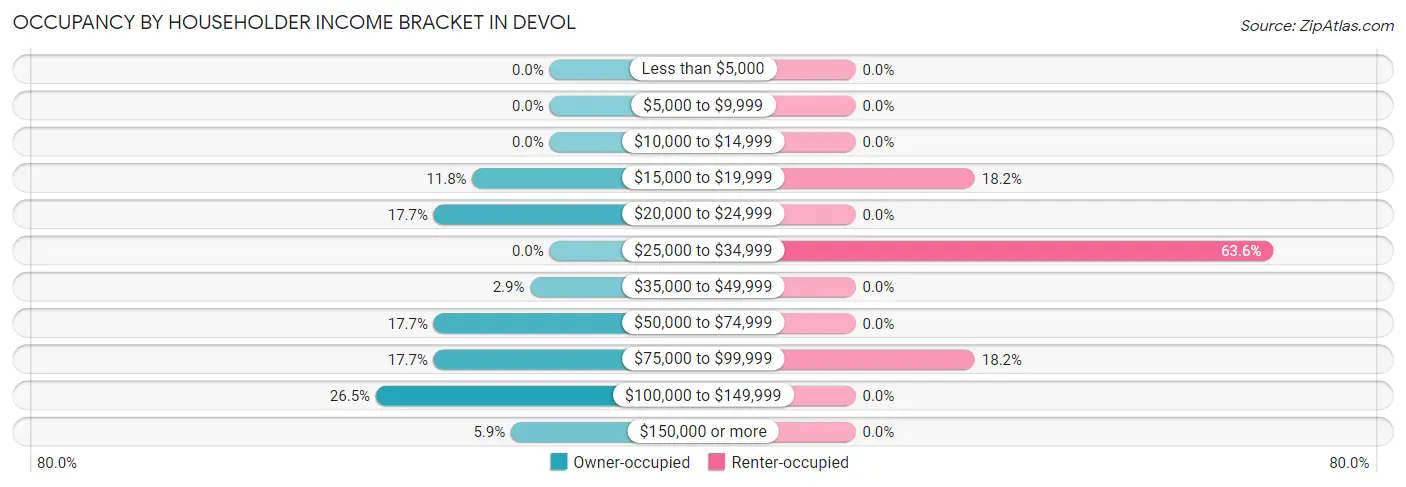
| Income Bracket | Owner-occupied | Renter-occupied |
| Less than $5,000 | 0 (0.0%) | 0 (0.0%) |
| $5,000 to $9,999 | 0 (0.0%) | 0 (0.0%) |
| $10,000 to $14,999 | 0 (0.0%) | 0 (0.0%) |
| $15,000 to $19,999 | 4 (11.8%) | 2 (18.2%) |
| $20,000 to $24,999 | 6 (17.6%) | 0 (0.0%) |
| $25,000 to $34,999 | 0 (0.0%) | 7 (63.6%) |
| $35,000 to $49,999 | 1 (2.9%) | 0 (0.0%) |
| $50,000 to $74,999 | 6 (17.6%) | 0 (0.0%) |
| $75,000 to $99,999 | 6 (17.6%) | 2 (18.2%) |
| $100,000 to $149,999 | 9 (26.5%) | 0 (0.0%) |
| $150,000 or more | 2 (5.9%) | 0 (0.0%) |
| Total | 34 (100.0%) | 11 (100.0%) |
Monthly Housing Cost Tiers in Devol
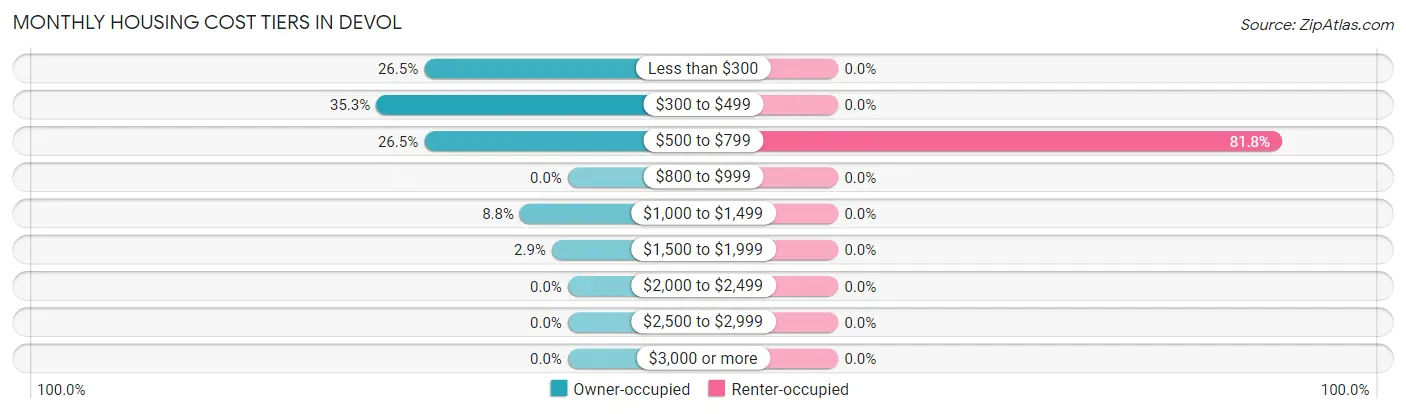
| Monthly Cost | Owner-occupied | Renter-occupied |
| Less than $300 | 9 (26.5%) | 0 (0.0%) |
| $300 to $499 | 12 (35.3%) | 0 (0.0%) |
| $500 to $799 | 9 (26.5%) | 9 (81.8%) |
| $800 to $999 | 0 (0.0%) | 0 (0.0%) |
| $1,000 to $1,499 | 3 (8.8%) | 0 (0.0%) |
| $1,500 to $1,999 | 1 (2.9%) | 0 (0.0%) |
| $2,000 to $2,499 | 0 (0.0%) | 0 (0.0%) |
| $2,500 to $2,999 | 0 (0.0%) | 0 (0.0%) |
| $3,000 or more | 0 (0.0%) | 0 (0.0%) |
| Total | 34 (100.0%) | 11 (100.0%) |
Physical Housing Characteristics in Devol
Housing Structures in Devol
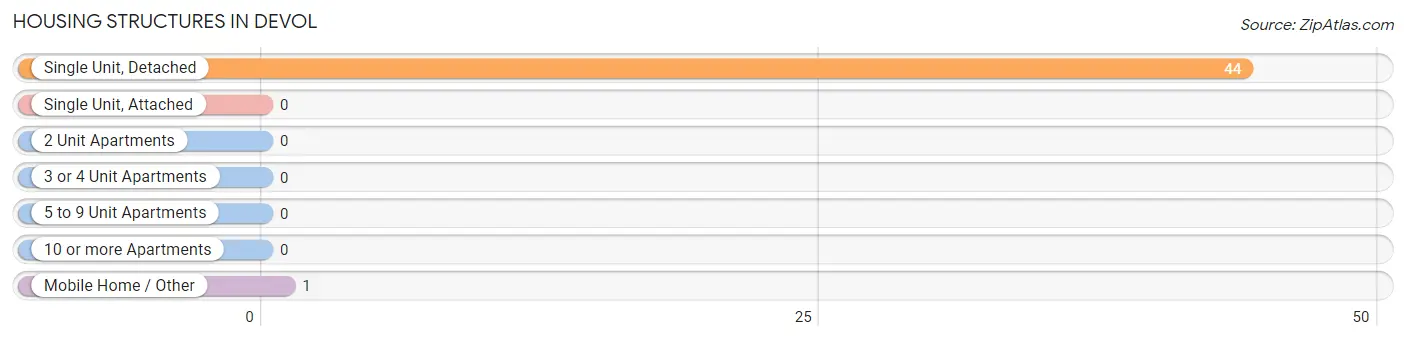
| Structure Type | # Housing Units | % Housing Units |
| Single Unit, Detached | 44 | 97.8% |
| Single Unit, Attached | 0 | 0.0% |
| 2 Unit Apartments | 0 | 0.0% |
| 3 or 4 Unit Apartments | 0 | 0.0% |
| 5 to 9 Unit Apartments | 0 | 0.0% |
| 10 or more Apartments | 0 | 0.0% |
| Mobile Home / Other | 1 | 2.2% |
| Total | 45 | 100.0% |
Housing Structures by Occupancy in Devol
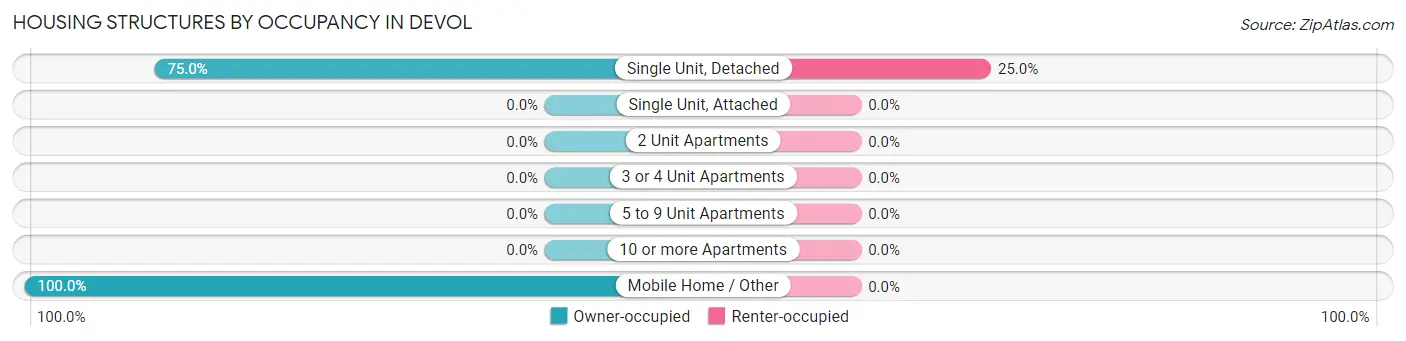
| Structure Type | Owner-occupied | Renter-occupied |
| Single Unit, Detached | 33 (75.0%) | 11 (25.0%) |
| Single Unit, Attached | 0 (0.0%) | 0 (0.0%) |
| 2 Unit Apartments | 0 (0.0%) | 0 (0.0%) |
| 3 or 4 Unit Apartments | 0 (0.0%) | 0 (0.0%) |
| 5 to 9 Unit Apartments | 0 (0.0%) | 0 (0.0%) |
| 10 or more Apartments | 0 (0.0%) | 0 (0.0%) |
| Mobile Home / Other | 1 (100.0%) | 0 (0.0%) |
| Total | 34 (75.6%) | 11 (24.4%) |
Housing Structures by Number of Rooms in Devol
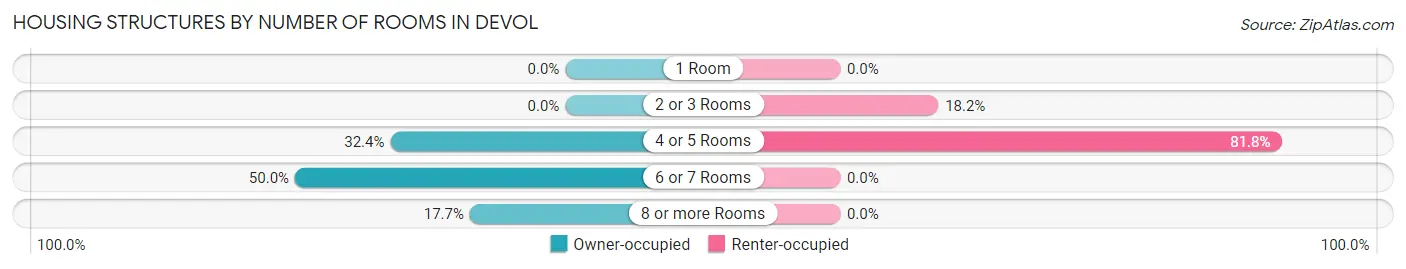
| Number of Rooms | Owner-occupied | Renter-occupied |
| 1 Room | 0 (0.0%) | 0 (0.0%) |
| 2 or 3 Rooms | 0 (0.0%) | 2 (18.2%) |
| 4 or 5 Rooms | 11 (32.4%) | 9 (81.8%) |
| 6 or 7 Rooms | 17 (50.0%) | 0 (0.0%) |
| 8 or more Rooms | 6 (17.6%) | 0 (0.0%) |
| Total | 34 (100.0%) | 11 (100.0%) |
Housing Structure by Heating Type in Devol
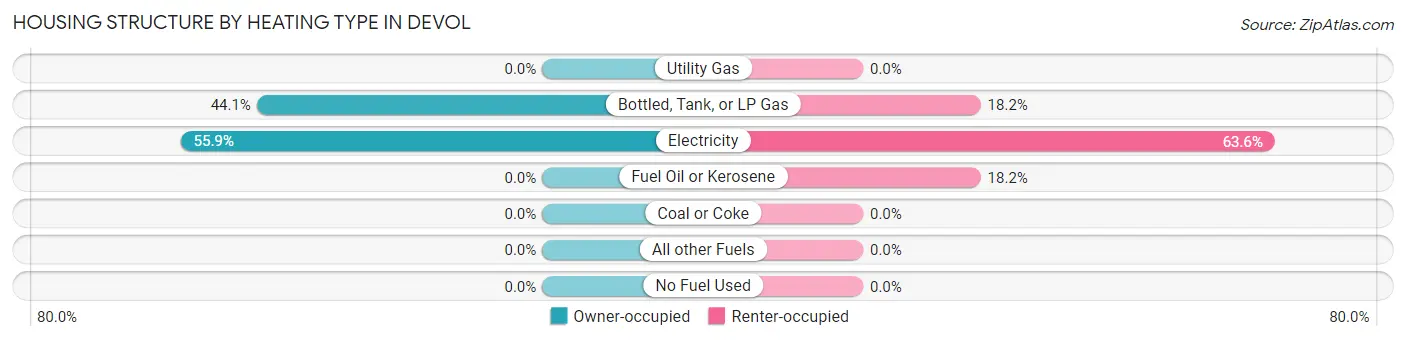
| Heating Type | Owner-occupied | Renter-occupied |
| Utility Gas | 0 (0.0%) | 0 (0.0%) |
| Bottled, Tank, or LP Gas | 15 (44.1%) | 2 (18.2%) |
| Electricity | 19 (55.9%) | 7 (63.6%) |
| Fuel Oil or Kerosene | 0 (0.0%) | 2 (18.2%) |
| Coal or Coke | 0 (0.0%) | 0 (0.0%) |
| All other Fuels | 0 (0.0%) | 0 (0.0%) |
| No Fuel Used | 0 (0.0%) | 0 (0.0%) |
| Total | 34 (100.0%) | 11 (100.0%) |
Household Vehicle Usage in Devol
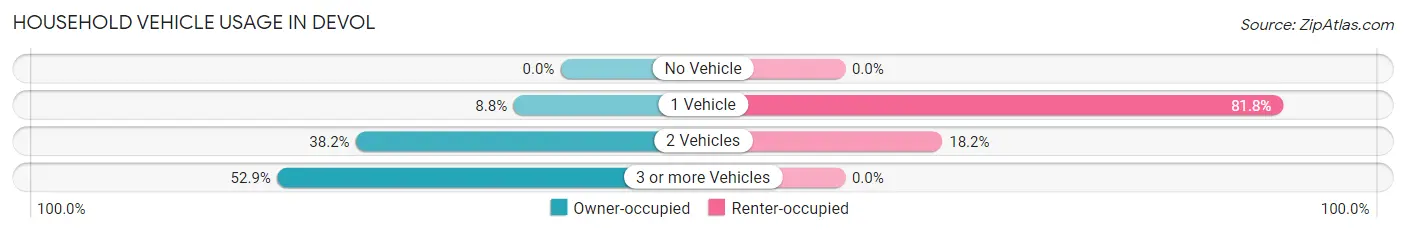
| Vehicles per Household | Owner-occupied | Renter-occupied |
| No Vehicle | 0 (0.0%) | 0 (0.0%) |
| 1 Vehicle | 3 (8.8%) | 9 (81.8%) |
| 2 Vehicles | 13 (38.2%) | 2 (18.2%) |
| 3 or more Vehicles | 18 (52.9%) | 0 (0.0%) |
| Total | 34 (100.0%) | 11 (100.0%) |
Real Estate & Mortgages in Devol
Real Estate and Mortgage Overview in Devol
| Characteristic | Without Mortgage | With Mortgage |
| Housing Units | 28 | 6 |
| Median Property Value | $85,000 | $93,300 |
| Median Household Income | $80,000 | $0 |
| Monthly Housing Costs | $400 | $0 |
| Real Estate Taxes | $425 | $0 |
Property Value by Mortgage Status in Devol
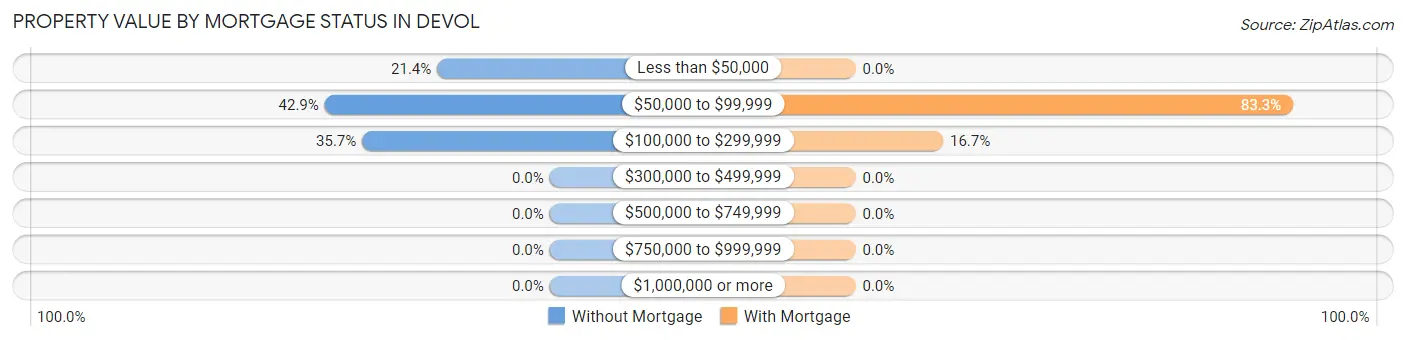
| Property Value | Without Mortgage | With Mortgage |
| Less than $50,000 | 6 (21.4%) | 0 (0.0%) |
| $50,000 to $99,999 | 12 (42.9%) | 5 (83.3%) |
| $100,000 to $299,999 | 10 (35.7%) | 1 (16.7%) |
| $300,000 to $499,999 | 0 (0.0%) | 0 (0.0%) |
| $500,000 to $749,999 | 0 (0.0%) | 0 (0.0%) |
| $750,000 to $999,999 | 0 (0.0%) | 0 (0.0%) |
| $1,000,000 or more | 0 (0.0%) | 0 (0.0%) |
| Total | 28 (100.0%) | 6 (100.0%) |
Household Income by Mortgage Status in Devol
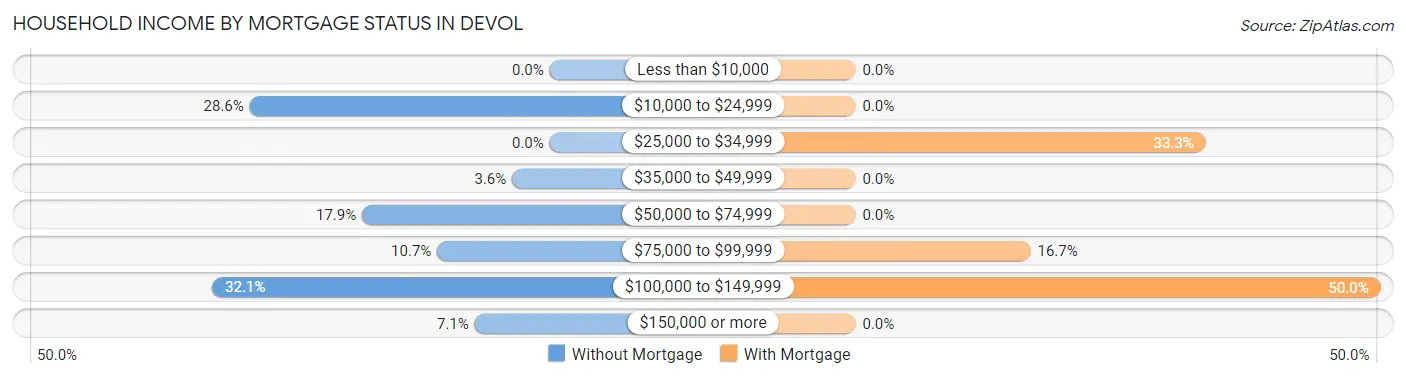
| Household Income | Without Mortgage | With Mortgage |
| Less than $10,000 | 0 (0.0%) | 0 (0.0%) |
| $10,000 to $24,999 | 8 (28.6%) | 0 (0.0%) |
| $25,000 to $34,999 | 0 (0.0%) | 2 (33.3%) |
| $35,000 to $49,999 | 1 (3.6%) | 0 (0.0%) |
| $50,000 to $74,999 | 5 (17.9%) | 0 (0.0%) |
| $75,000 to $99,999 | 3 (10.7%) | 1 (16.7%) |
| $100,000 to $149,999 | 9 (32.1%) | 3 (50.0%) |
| $150,000 or more | 2 (7.1%) | 0 (0.0%) |
| Total | 28 (100.0%) | 6 (100.0%) |
Property Value to Household Income Ratio in Devol
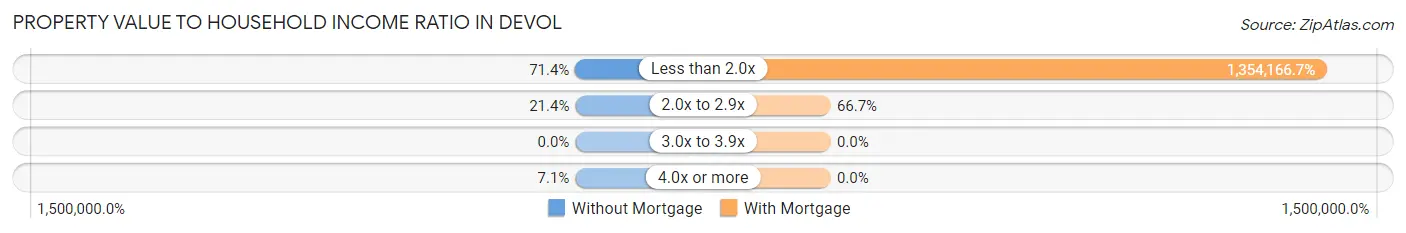
| Value-to-Income Ratio | Without Mortgage | With Mortgage |
| Less than 2.0x | 20 (71.4%) | 81,250 (1,354,166.7%) |
| 2.0x to 2.9x | 6 (21.4%) | 4 (66.7%) |
| 3.0x to 3.9x | 0 (0.0%) | 0 (0.0%) |
| 4.0x or more | 2 (7.1%) | 0 (0.0%) |
| Total | 28 (100.0%) | 6 (100.0%) |
Real Estate Taxes by Mortgage Status in Devol
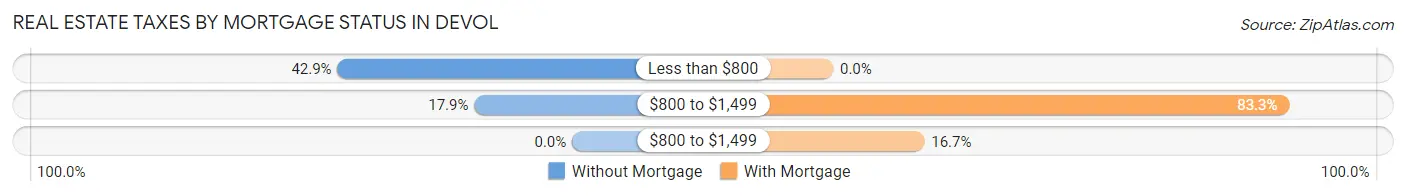
| Property Taxes | Without Mortgage | With Mortgage |
| Less than $800 | 12 (42.9%) | 0 (0.0%) |
| $800 to $1,499 | 5 (17.9%) | 5 (83.3%) |
| $800 to $1,499 | 0 (0.0%) | 1 (16.7%) |
| Total | 28 (100.0%) | 6 (100.0%) |
Health & Disability in Devol
Health Insurance Coverage by Age in Devol
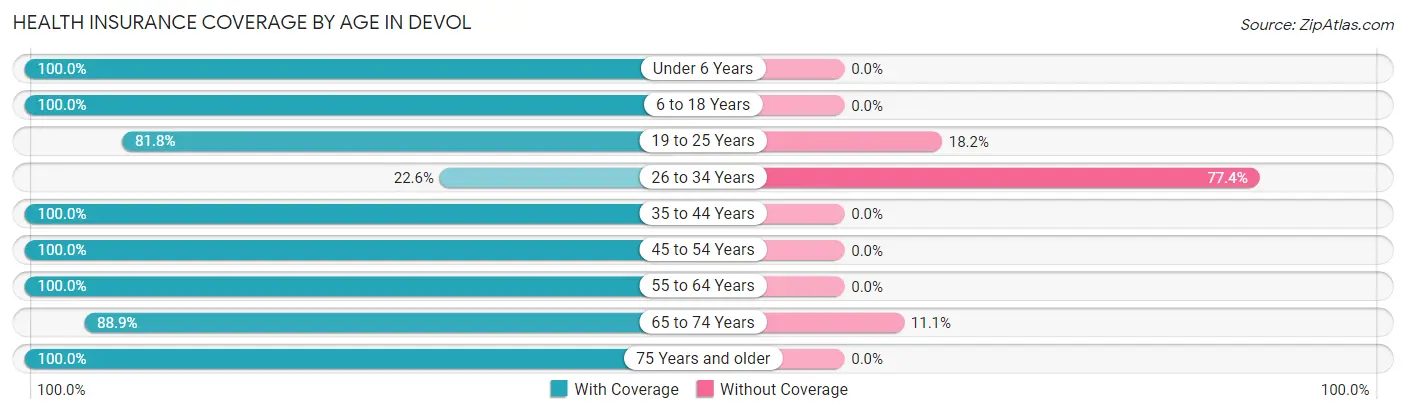
| Age Bracket | With Coverage | Without Coverage |
| Under 6 Years | 24 (100.0%) | 0 (0.0%) |
| 6 to 18 Years | 33 (100.0%) | 0 (0.0%) |
| 19 to 25 Years | 9 (81.8%) | 2 (18.2%) |
| 26 to 34 Years | 7 (22.6%) | 24 (77.4%) |
| 35 to 44 Years | 14 (100.0%) | 0 (0.0%) |
| 45 to 54 Years | 12 (100.0%) | 0 (0.0%) |
| 55 to 64 Years | 22 (100.0%) | 0 (0.0%) |
| 65 to 74 Years | 8 (88.9%) | 1 (11.1%) |
| 75 Years and older | 10 (100.0%) | 0 (0.0%) |
| Total | 139 (83.7%) | 27 (16.3%) |
Health Insurance Coverage by Citizenship Status in Devol
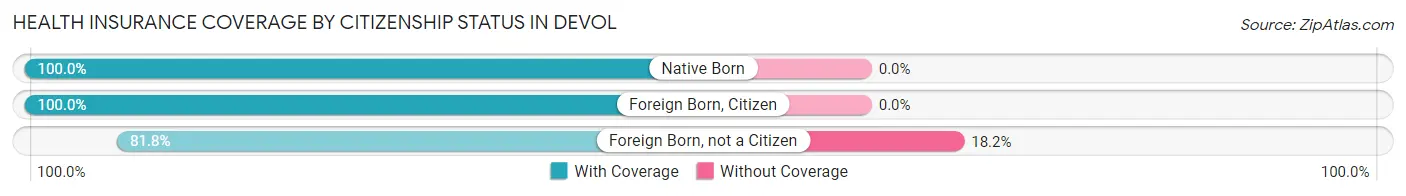
| Citizenship Status | With Coverage | Without Coverage |
| Native Born | 24 (100.0%) | 0 (0.0%) |
| Foreign Born, Citizen | 33 (100.0%) | 0 (0.0%) |
| Foreign Born, not a Citizen | 9 (81.8%) | 2 (18.2%) |
Health Insurance Coverage by Household Income in Devol
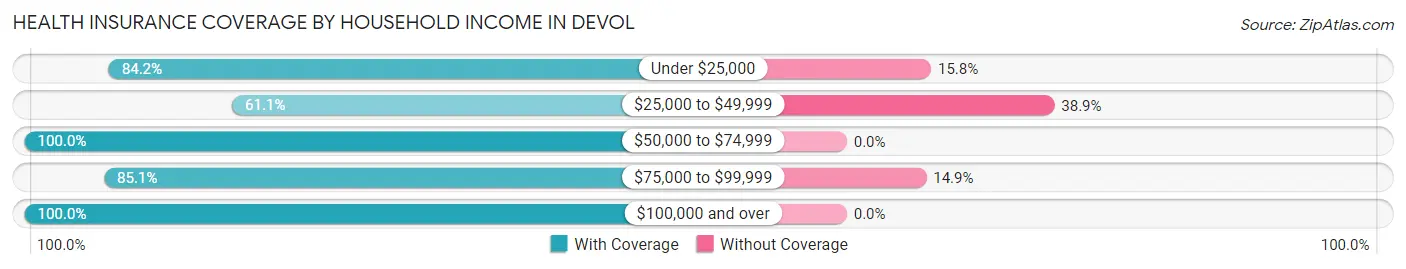
| Household Income | With Coverage | Without Coverage |
| Under $25,000 | 32 (84.2%) | 6 (15.8%) |
| $25,000 to $49,999 | 22 (61.1%) | 14 (38.9%) |
| $50,000 to $74,999 | 13 (100.0%) | 0 (0.0%) |
| $75,000 to $99,999 | 40 (85.1%) | 7 (14.9%) |
| $100,000 and over | 32 (100.0%) | 0 (0.0%) |
Public vs Private Health Insurance Coverage by Age in Devol
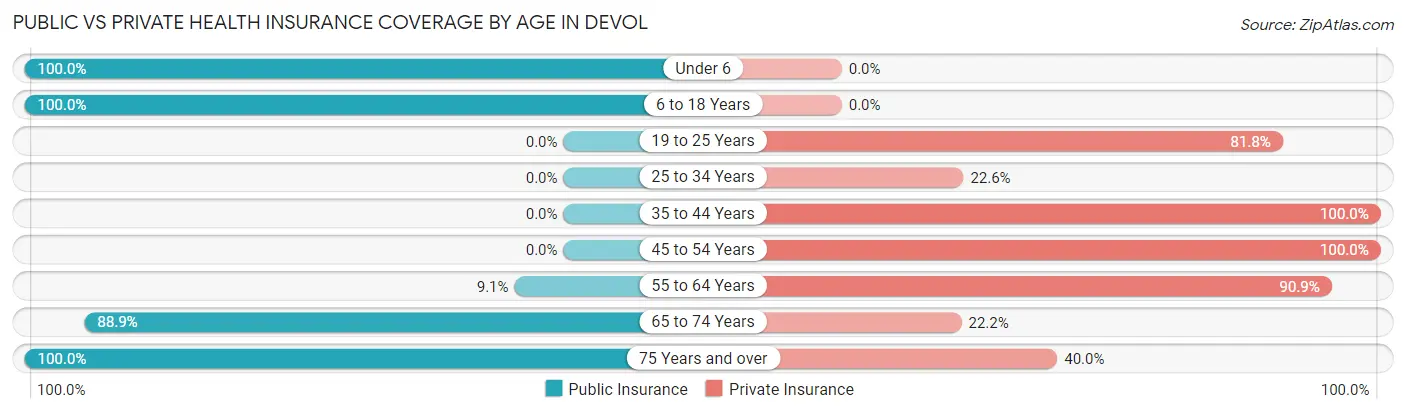
| Age Bracket | Public Insurance | Private Insurance |
| Under 6 | 24 (100.0%) | 0 (0.0%) |
| 6 to 18 Years | 33 (100.0%) | 0 (0.0%) |
| 19 to 25 Years | 0 (0.0%) | 9 (81.8%) |
| 25 to 34 Years | 0 (0.0%) | 7 (22.6%) |
| 35 to 44 Years | 0 (0.0%) | 14 (100.0%) |
| 45 to 54 Years | 0 (0.0%) | 12 (100.0%) |
| 55 to 64 Years | 2 (9.1%) | 20 (90.9%) |
| 65 to 74 Years | 8 (88.9%) | 2 (22.2%) |
| 75 Years and over | 10 (100.0%) | 4 (40.0%) |
| Total | 77 (46.4%) | 68 (41.0%) |
Disability Status by Sex by Age in Devol
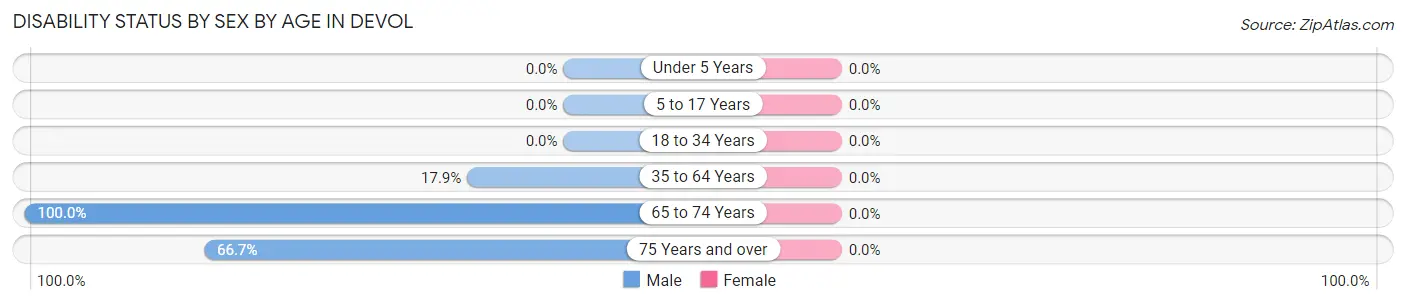
| Age Bracket | Male | Female |
| Under 5 Years | 0 (0.0%) | 0 (0.0%) |
| 5 to 17 Years | 0 (0.0%) | 0 (0.0%) |
| 18 to 34 Years | 0 (0.0%) | 0 (0.0%) |
| 35 to 64 Years | 5 (17.9%) | 0 (0.0%) |
| 65 to 74 Years | 3 (100.0%) | 0 (0.0%) |
| 75 Years and over | 4 (66.7%) | 0 (0.0%) |
Disability Class by Sex by Age in Devol
Disability Class: Hearing Difficulty

| Age Bracket | Male | Female |
| Under 5 Years | 0 (0.0%) | 0 (0.0%) |
| 5 to 17 Years | 0 (0.0%) | 0 (0.0%) |
| 18 to 34 Years | 0 (0.0%) | 0 (0.0%) |
| 35 to 64 Years | 5 (17.9%) | 0 (0.0%) |
| 65 to 74 Years | 3 (100.0%) | 0 (0.0%) |
| 75 Years and over | 4 (66.7%) | 0 (0.0%) |
Disability Class: Vision Difficulty

| Age Bracket | Male | Female |
| Under 5 Years | 0 (0.0%) | 0 (0.0%) |
| 5 to 17 Years | 0 (0.0%) | 0 (0.0%) |
| 18 to 34 Years | 0 (0.0%) | 0 (0.0%) |
| 35 to 64 Years | 3 (10.7%) | 0 (0.0%) |
| 65 to 74 Years | 0 (0.0%) | 0 (0.0%) |
| 75 Years and over | 0 (0.0%) | 0 (0.0%) |
Disability Class: Cognitive Difficulty
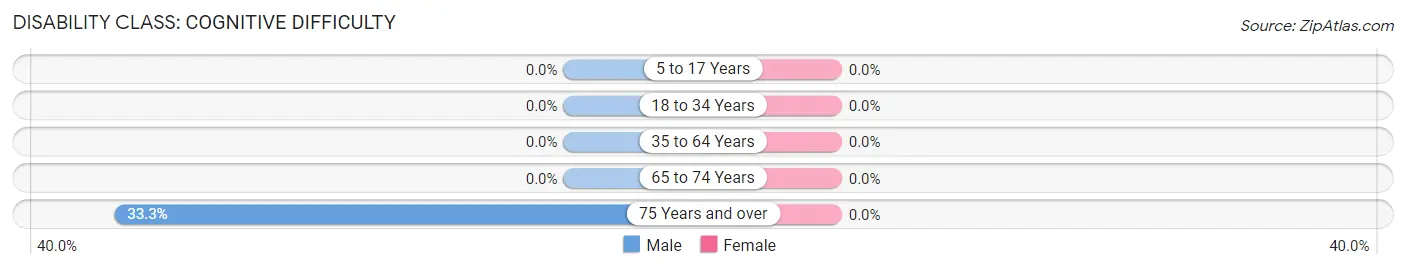
| Age Bracket | Male | Female |
| 5 to 17 Years | 0 (0.0%) | 0 (0.0%) |
| 18 to 34 Years | 0 (0.0%) | 0 (0.0%) |
| 35 to 64 Years | 0 (0.0%) | 0 (0.0%) |
| 65 to 74 Years | 0 (0.0%) | 0 (0.0%) |
| 75 Years and over | 2 (33.3%) | 0 (0.0%) |
Disability Class: Ambulatory Difficulty
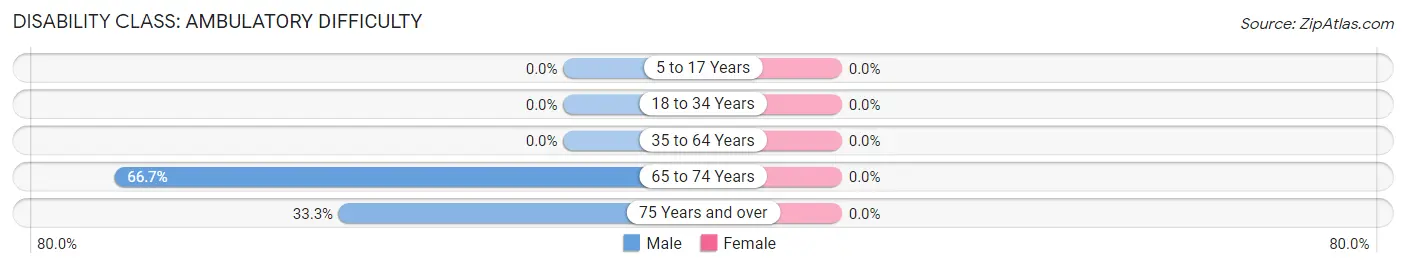
| Age Bracket | Male | Female |
| 5 to 17 Years | 0 (0.0%) | 0 (0.0%) |
| 18 to 34 Years | 0 (0.0%) | 0 (0.0%) |
| 35 to 64 Years | 0 (0.0%) | 0 (0.0%) |
| 65 to 74 Years | 2 (66.7%) | 0 (0.0%) |
| 75 Years and over | 2 (33.3%) | 0 (0.0%) |
Disability Class: Self-Care Difficulty
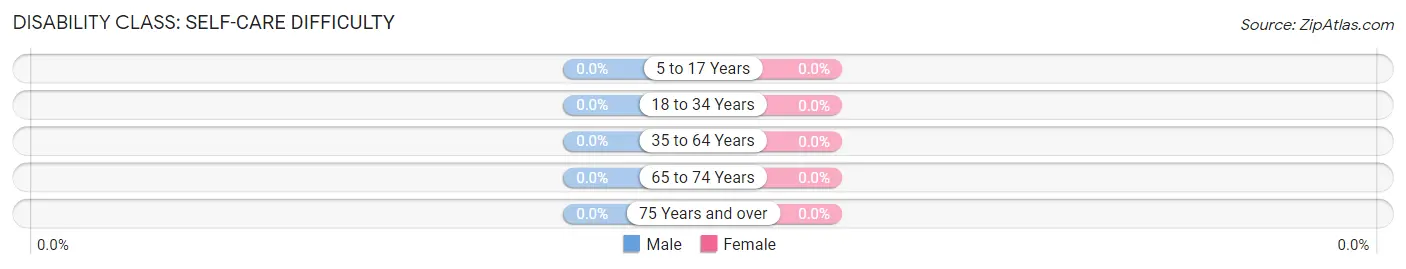
| Age Bracket | Male | Female |
| 5 to 17 Years | 0 (0.0%) | 0 (0.0%) |
| 18 to 34 Years | 0 (0.0%) | 0 (0.0%) |
| 35 to 64 Years | 0 (0.0%) | 0 (0.0%) |
| 65 to 74 Years | 0 (0.0%) | 0 (0.0%) |
| 75 Years and over | 0 (0.0%) | 0 (0.0%) |
Technology Access in Devol
Computing Device Access in Devol
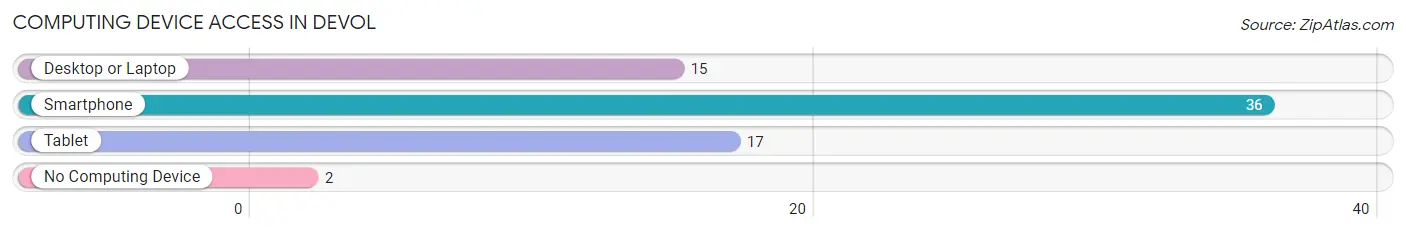
| Device Type | # Households | % Households |
| Desktop or Laptop | 15 | 33.3% |
| Smartphone | 36 | 80.0% |
| Tablet | 17 | 37.8% |
| No Computing Device | 2 | 4.4% |
| Total | 45 | 100.0% |
Internet Access in Devol
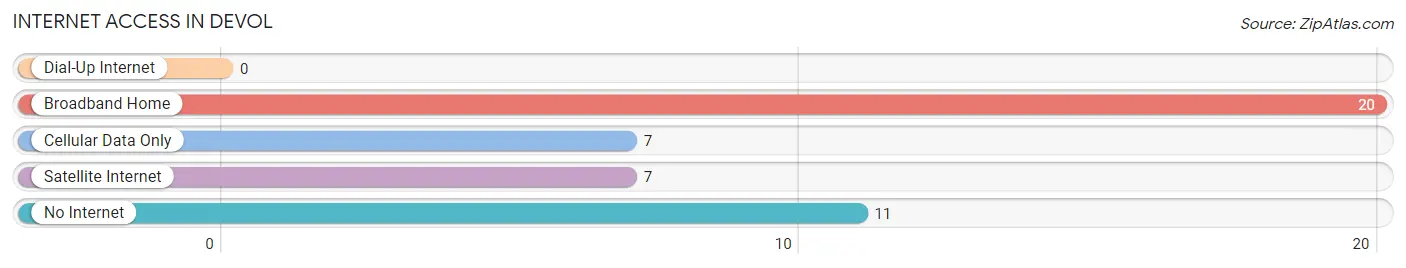
| Internet Type | # Households | % Households |
| Dial-Up Internet | 0 | 0.0% |
| Broadband Home | 20 | 44.4% |
| Cellular Data Only | 7 | 15.6% |
| Satellite Internet | 7 | 15.6% |
| No Internet | 11 | 24.4% |
| Total | 45 | 100.0% |
Devol Summary
Devol, Oklahoma is a small town located in Cotton County, Oklahoma. It is situated in the southwestern part of the state, approximately 10 miles east of the Texas border. The town was founded in 1901 and was named after the nearby Devol Creek. The population of Devol was estimated to be 545 in 2020.
Geography
Devol is located in the Red River Valley, a region of Oklahoma known for its rolling hills and fertile soil. The town is situated on the banks of the Red River, which forms the border between Oklahoma and Texas. The town is surrounded by farmland and is located near the Wichita Mountains Wildlife Refuge. The climate in Devol is characterized by hot summers and mild winters.
Economy
The economy of Devol is largely based on agriculture. The town is home to several farms and ranches, which produce a variety of crops, including cotton, corn, wheat, and soybeans. The town is also home to several small businesses, including a grocery store, a hardware store, and a restaurant.
Demographics
The population of Devol is predominantly white, with a small minority of African Americans and Native Americans. The median household income in Devol is $37,000, and the median home value is $90,000. The town has a low unemployment rate of 3.2%.
Education
Devol is served by the Cotton County School District, which includes two elementary schools, one middle school, and one high school. The town is also home to a branch of the Red River Technology Center, which offers vocational and technical training.
Conclusion
Devol, Oklahoma is a small town located in Cotton County, Oklahoma. It is situated in the southwestern part of the state, approximately 10 miles east of the Texas border. The town was founded in 1901 and was named after the nearby Devol Creek. The population of Devol was estimated to be 545 in 2020. The economy of Devol is largely based on agriculture, and the town is home to several small businesses. The population of Devol is predominantly white, with a small minority of African Americans and Native Americans. The town is served by the Cotton County School District, which includes two elementary schools, one middle school, and one high school. The town is also home to a branch of the Red River Technology Center, which offers vocational and technical training.
Common Questions
What is Per Capita Income in Devol?
Per Capita income in Devol is $23,919.
What is the Median Household income in Devol?
Median Household Income in Devol is $71,250.
What is Income or Wage Gap in Devol?
Income or Wage Gap in Devol is 2.8%.
Women in Devol earn 97.2 cents for every dollar earned by a man.
What is Inequality or Gini Index in Devol?
Inequality or Gini Index in Devol is 0.41.
What is the Total Population of Devol?
Total Population of Devol is 166.
What is the Total Male Population of Devol?
Total Male Population of Devol is 103.
What is the Total Female Population of Devol?
Total Female Population of Devol is 63.
What is the Ratio of Males per 100 Females in Devol?
There are 163.49 Males per 100 Females in Devol.
What is the Ratio of Females per 100 Males in Devol?
There are 61.17 Females per 100 Males in Devol.
What is the Median Population Age in Devol?
Median Population Age in Devol is 33.4 Years.
What is the Average Family Size in Devol
Average Family Size in Devol is 3.6 People.
What is the Average Household Size in Devol
Average Household Size in Devol is 3.7 People.
How Large is the Labor Force in Devol?
There are 84 People in the Labor Forcein in Devol.
What is the Percentage of People in the Labor Force in Devol?
77.1% of People are in the Labor Force in Devol.
What is the Unemployment Rate in Devol?
Unemployment Rate in Devol is 15.5%.