Council Hill, OK Map & Demographics
Council Hill Map
Council Hill Overview
$18,980
PER CAPITA INCOME
$47,188
AVG FAMILY INCOME
$31,875
AVG HOUSEHOLD INCOME
11.6%
WAGE / INCOME GAP [ % ]
88.4¢/ $1
WAGE / INCOME GAP [ $ ]
0.51
INEQUALITY / GINI INDEX
88
TOTAL POPULATION
47
MALE POPULATION
41
FEMALE POPULATION
114.63
MALES / 100 FEMALES
87.23
FEMALES / 100 MALES
25.7
MEDIAN AGE
3.2
AVG FAMILY SIZE
2.7
AVG HOUSEHOLD SIZE
34
LABOR FORCE [ PEOPLE ]
57.6%
PERCENT IN LABOR FORCE
11.8%
UNEMPLOYMENT RATE
Council Hill Zip Codes
Council Hill Area Codes
Income in Council Hill
Income Overview in Council Hill
Per Capita Income in Council Hill is $18,980, while median incomes of families and households are $47,188 and $31,875 respectively.
| Characteristic | Number | Measure |
| Per Capita Income | 88 | $18,980 |
| Median Family Income | 23 | $47,188 |
| Mean Family Income | 23 | $63,896 |
| Median Household Income | 33 | $31,875 |
| Mean Household Income | 33 | $50,897 |
| Income Deficit | 23 | $0 |
| Wage / Income Gap (%) | 88 | 11.63% |
| Wage / Income Gap ($) | 88 | 88.37¢ per $1 |
| Gini / Inequality Index | 88 | 0.51 |
Earnings by Sex in Council Hill
Average Earnings in Council Hill are $24,500, $26,875 for men and $23,750 for women, a difference of 11.6%.
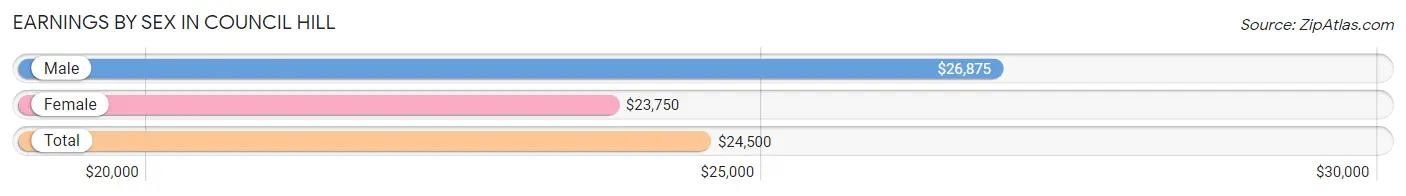
| Sex | Number | Average Earnings |
| Male | 19 (55.9%) | $26,875 |
| Female | 15 (44.1%) | $23,750 |
| Total | 34 (100.0%) | $24,500 |
Earnings by Sex by Income Bracket in Council Hill
The most common earnings brackets in Council Hill are $2,499 or less for men (4 | 21.0%) and $22,500 to $24,999 for women (7 | 46.7%).
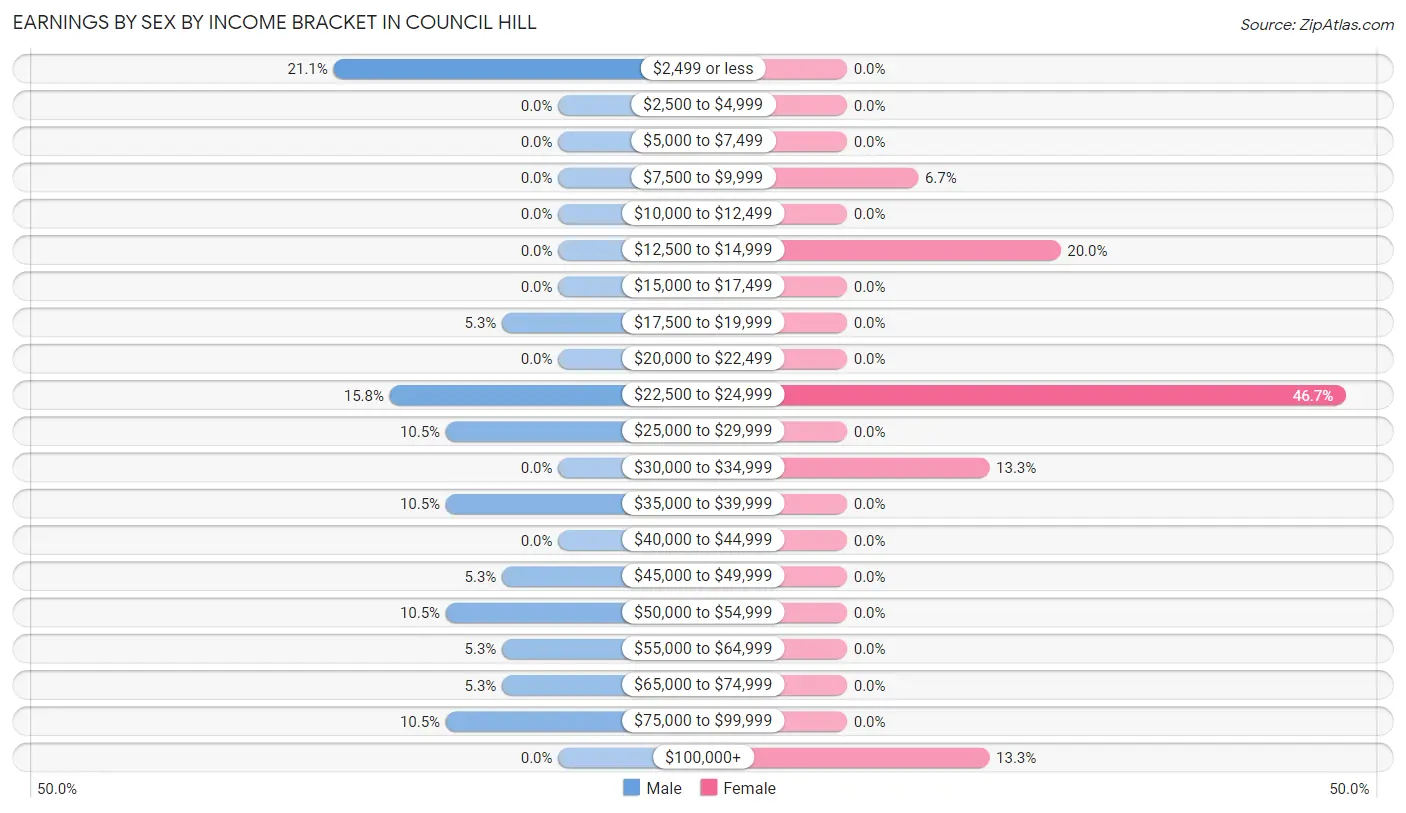
| Income | Male | Female |
| $2,499 or less | 4 (21.0%) | 0 (0.0%) |
| $2,500 to $4,999 | 0 (0.0%) | 0 (0.0%) |
| $5,000 to $7,499 | 0 (0.0%) | 0 (0.0%) |
| $7,500 to $9,999 | 0 (0.0%) | 1 (6.7%) |
| $10,000 to $12,499 | 0 (0.0%) | 0 (0.0%) |
| $12,500 to $14,999 | 0 (0.0%) | 3 (20.0%) |
| $15,000 to $17,499 | 0 (0.0%) | 0 (0.0%) |
| $17,500 to $19,999 | 1 (5.3%) | 0 (0.0%) |
| $20,000 to $22,499 | 0 (0.0%) | 0 (0.0%) |
| $22,500 to $24,999 | 3 (15.8%) | 7 (46.7%) |
| $25,000 to $29,999 | 2 (10.5%) | 0 (0.0%) |
| $30,000 to $34,999 | 0 (0.0%) | 2 (13.3%) |
| $35,000 to $39,999 | 2 (10.5%) | 0 (0.0%) |
| $40,000 to $44,999 | 0 (0.0%) | 0 (0.0%) |
| $45,000 to $49,999 | 1 (5.3%) | 0 (0.0%) |
| $50,000 to $54,999 | 2 (10.5%) | 0 (0.0%) |
| $55,000 to $64,999 | 1 (5.3%) | 0 (0.0%) |
| $65,000 to $74,999 | 1 (5.3%) | 0 (0.0%) |
| $75,000 to $99,999 | 2 (10.5%) | 0 (0.0%) |
| $100,000+ | 0 (0.0%) | 2 (13.3%) |
| Total | 19 (100.0%) | 15 (100.0%) |
Earnings by Sex by Educational Attainment in Council Hill
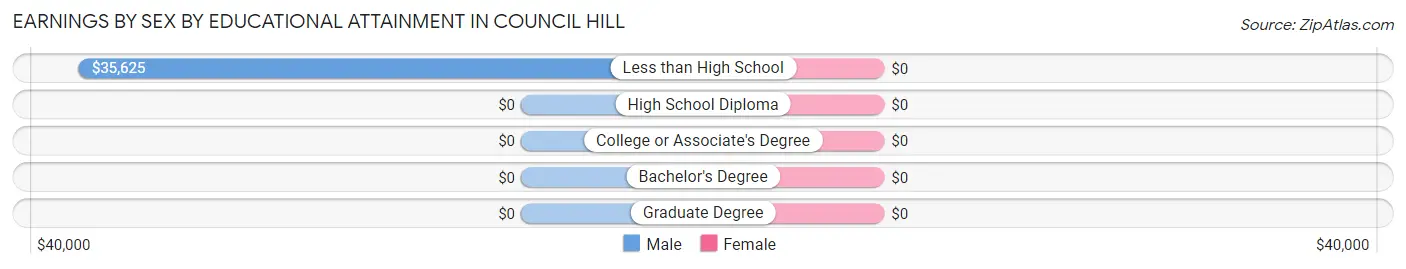
| Educational Attainment | Male Income | Female Income |
| Less than High School | $35,625 | $0 |
| High School Diploma | - | - |
| College or Associate's Degree | - | - |
| Bachelor's Degree | - | - |
| Graduate Degree | - | - |
| Total | $36,875 | $23,750 |
Family Income in Council Hill
Family Income Brackets in Council Hill
According to the Council Hill family income data, there are 5 families falling into the $50,000 to $74,999 income range, which is the most common income bracket and makes up 21.7% of all families.
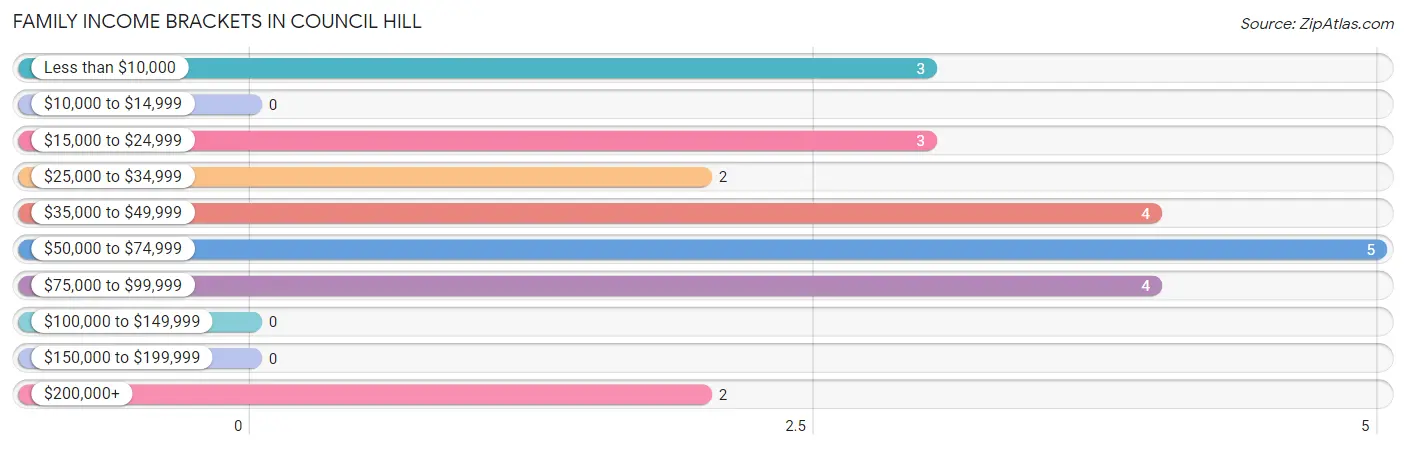
| Income Bracket | # Families | % Families |
| Less than $10,000 | 3 | 13.0% |
| $10,000 to $14,999 | 0 | 0.0% |
| $15,000 to $24,999 | 3 | 13.0% |
| $25,000 to $34,999 | 2 | 8.7% |
| $35,000 to $49,999 | 4 | 17.4% |
| $50,000 to $74,999 | 5 | 21.7% |
| $75,000 to $99,999 | 4 | 17.4% |
| $100,000 to $149,999 | 0 | 0.0% |
| $150,000 to $199,999 | 0 | 0.0% |
| $200,000+ | 2 | 8.7% |
Family Income by Famaliy Size in Council Hill
5-person families (5 | 21.7%) account for the highest median family income in Council Hill with $63,750 per family, while 2-person families (9 | 39.1%) have the highest median income of $30,312 per family member.
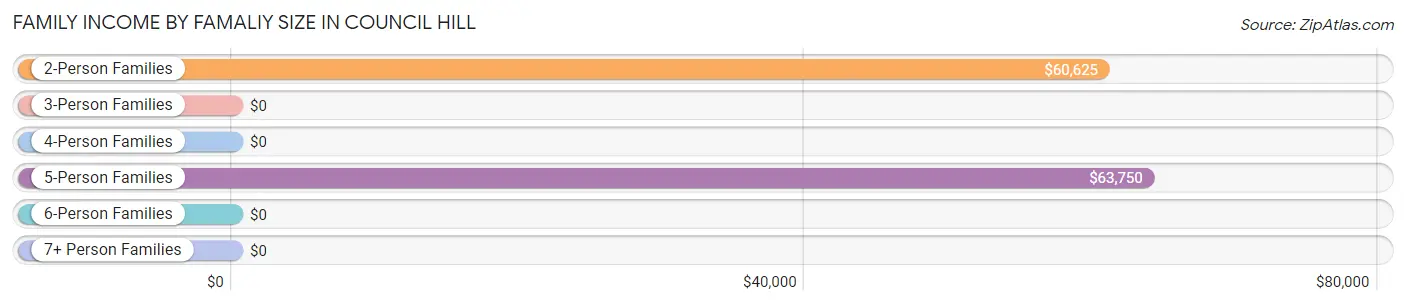
| Income Bracket | # Families | Median Income |
| 2-Person Families | 9 (39.1%) | $60,625 |
| 3-Person Families | 4 (17.4%) | $0 |
| 4-Person Families | 4 (17.4%) | $0 |
| 5-Person Families | 5 (21.7%) | $63,750 |
| 6-Person Families | 0 (0.0%) | $0 |
| 7+ Person Families | 1 (4.3%) | $0 |
| Total | 23 (100.0%) | $47,188 |
Family Income by Number of Earners in Council Hill
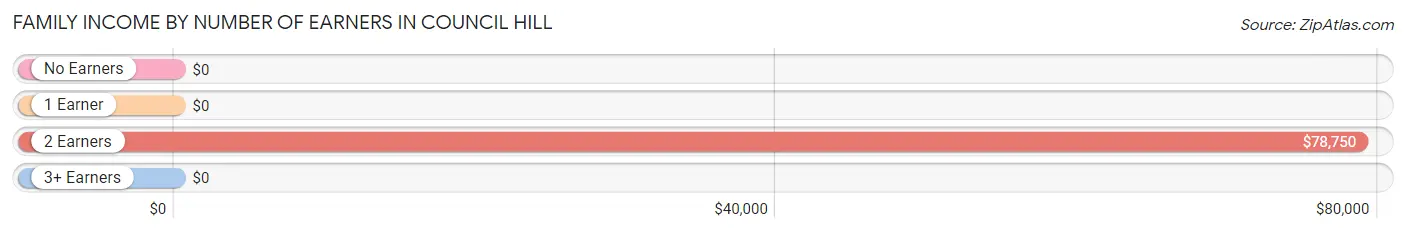
| Number of Earners | # Families | Median Income |
| No Earners | 8 (34.8%) | $0 |
| 1 Earner | 3 (13.0%) | $0 |
| 2 Earners | 12 (52.2%) | $78,750 |
| 3+ Earners | 0 (0.0%) | $0 |
| Total | 23 (100.0%) | $47,188 |
Household Income in Council Hill
Household Income Brackets in Council Hill
With 8 households falling in the category, the $15,000 to $24,999 income range is the most frequent in Council Hill, accounting for 24.2% of all households.
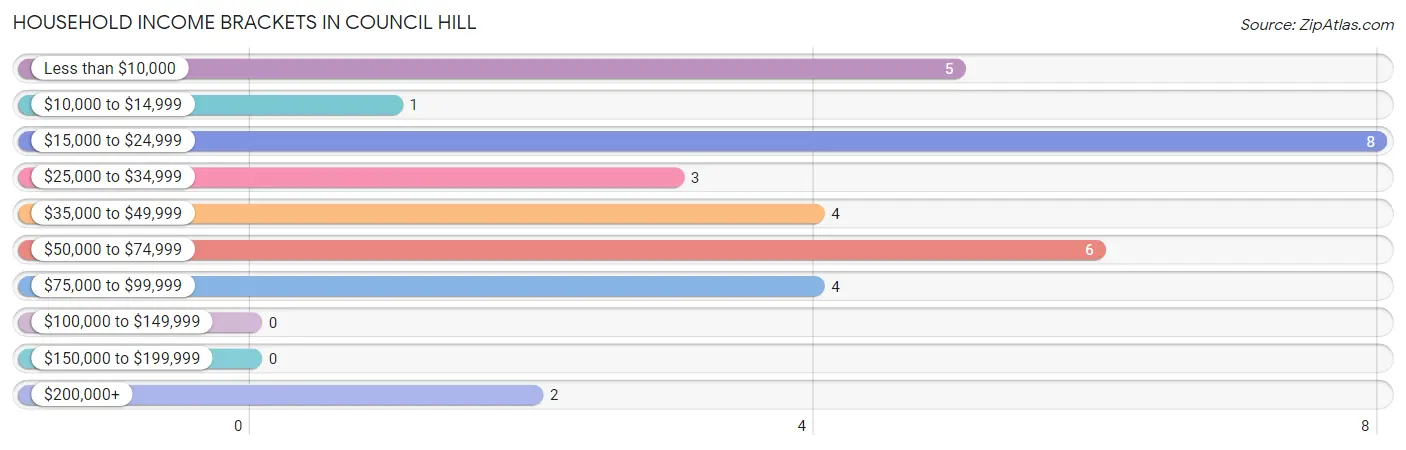
| Income Bracket | # Households | % Households |
| Less than $10,000 | 5 | 15.2% |
| $10,000 to $14,999 | 1 | 3.0% |
| $15,000 to $24,999 | 8 | 24.2% |
| $25,000 to $34,999 | 3 | 9.1% |
| $35,000 to $49,999 | 4 | 12.1% |
| $50,000 to $74,999 | 6 | 18.2% |
| $75,000 to $99,999 | 4 | 12.1% |
| $100,000 to $149,999 | 0 | 0.0% |
| $150,000 to $199,999 | 0 | 0.0% |
| $200,000+ | 2 | 6.1% |
Household Income by Householder Age in Council Hill
The median household income in Council Hill is $31,875, with the highest median household income of $45,625 found in the 65+ years age bracket for the primary householder. A total of 5 households (15.1%) fall into this category. Meanwhile, the 15 to 24 years age bracket for the primary householder has the lowest median household income of $0, with 6 households (18.2%) in this group.
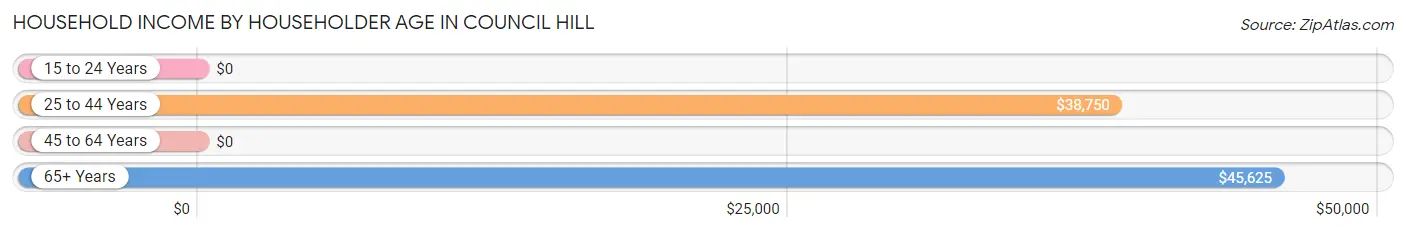
| Income Bracket | # Households | Median Income |
| 15 to 24 Years | 6 (18.2%) | $0 |
| 25 to 44 Years | 8 (24.2%) | $38,750 |
| 45 to 64 Years | 14 (42.4%) | $0 |
| 65+ Years | 5 (15.1%) | $45,625 |
| Total | 33 (100.0%) | $31,875 |
Poverty in Council Hill
Income Below Poverty by Sex and Age in Council Hill
With 34.0% poverty level for males and 17.1% for females among the residents of Council Hill, 16 and 17 year old males and 55 to 64 year old females are the most vulnerable to poverty, with 3 males (100.0%) and 3 females (42.9%) in their respective age groups living below the poverty level.
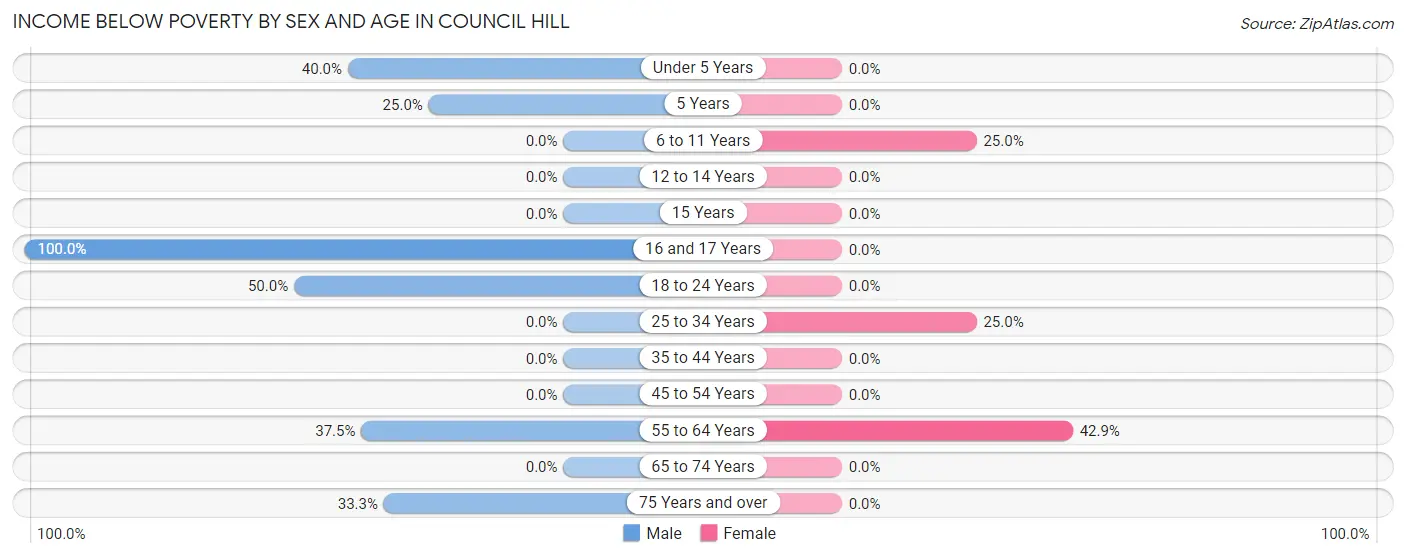
| Age Bracket | Male | Female |
| Under 5 Years | 4 (40.0%) | 0 (0.0%) |
| 5 Years | 1 (25.0%) | 0 (0.0%) |
| 6 to 11 Years | 0 (0.0%) | 2 (25.0%) |
| 12 to 14 Years | 0 (0.0%) | 0 (0.0%) |
| 15 Years | 0 (0.0%) | 0 (0.0%) |
| 16 and 17 Years | 3 (100.0%) | 0 (0.0%) |
| 18 to 24 Years | 4 (50.0%) | 0 (0.0%) |
| 25 to 34 Years | 0 (0.0%) | 2 (25.0%) |
| 35 to 44 Years | 0 (0.0%) | 0 (0.0%) |
| 45 to 54 Years | 0 (0.0%) | 0 (0.0%) |
| 55 to 64 Years | 3 (37.5%) | 3 (42.9%) |
| 65 to 74 Years | 0 (0.0%) | 0 (0.0%) |
| 75 Years and over | 1 (33.3%) | 0 (0.0%) |
| Total | 16 (34.0%) | 7 (17.1%) |
Income Above Poverty by Sex and Age in Council Hill
According to the poverty statistics in Council Hill, males aged 6 to 11 years and females aged 12 to 14 years are the age groups that are most secure financially, with 100.0% of males and 100.0% of females in these age groups living above the poverty line.
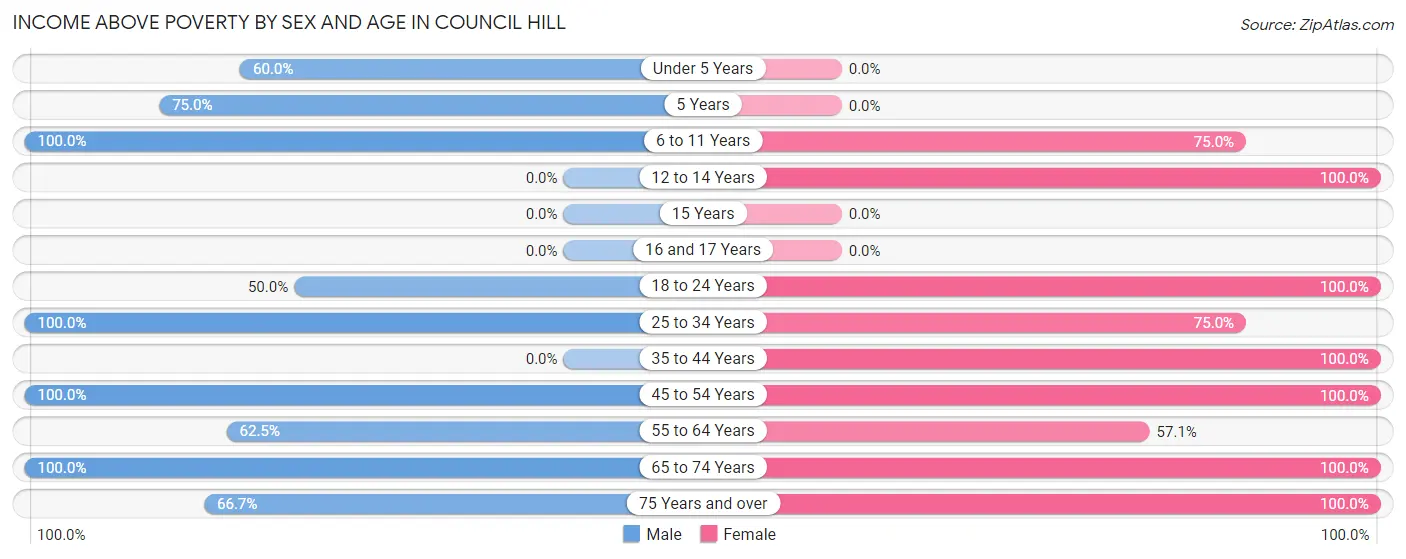
| Age Bracket | Male | Female |
| Under 5 Years | 6 (60.0%) | 0 (0.0%) |
| 5 Years | 3 (75.0%) | 0 (0.0%) |
| 6 to 11 Years | 2 (100.0%) | 6 (75.0%) |
| 12 to 14 Years | 0 (0.0%) | 5 (100.0%) |
| 15 Years | 0 (0.0%) | 0 (0.0%) |
| 16 and 17 Years | 0 (0.0%) | 0 (0.0%) |
| 18 to 24 Years | 4 (50.0%) | 2 (100.0%) |
| 25 to 34 Years | 3 (100.0%) | 6 (75.0%) |
| 35 to 44 Years | 0 (0.0%) | 2 (100.0%) |
| 45 to 54 Years | 3 (100.0%) | 4 (100.0%) |
| 55 to 64 Years | 5 (62.5%) | 4 (57.1%) |
| 65 to 74 Years | 3 (100.0%) | 2 (100.0%) |
| 75 Years and over | 2 (66.7%) | 3 (100.0%) |
| Total | 31 (66.0%) | 34 (82.9%) |
Income Below Poverty Among Married-Couple Families in Council Hill
The poverty statistics for married-couple families in Council Hill show that 5.9% or 1 of the total 17 families live below the poverty line. Families with no children have the highest poverty rate of 11.1%, comprising of 1 families. On the other hand, families with 1 or 2 children have the lowest poverty rate of 0.0%, which includes 0 families.
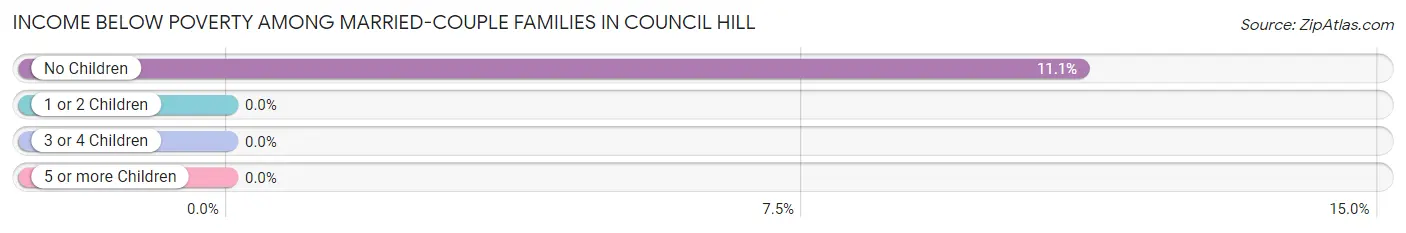
| Children | Above Poverty | Below Poverty |
| No Children | 8 (88.9%) | 1 (11.1%) |
| 1 or 2 Children | 2 (100.0%) | 0 (0.0%) |
| 3 or 4 Children | 6 (100.0%) | 0 (0.0%) |
| 5 or more Children | 0 (0.0%) | 0 (0.0%) |
| Total | 16 (94.1%) | 1 (5.9%) |
Income Below Poverty Among Single-Parent Households in Council Hill
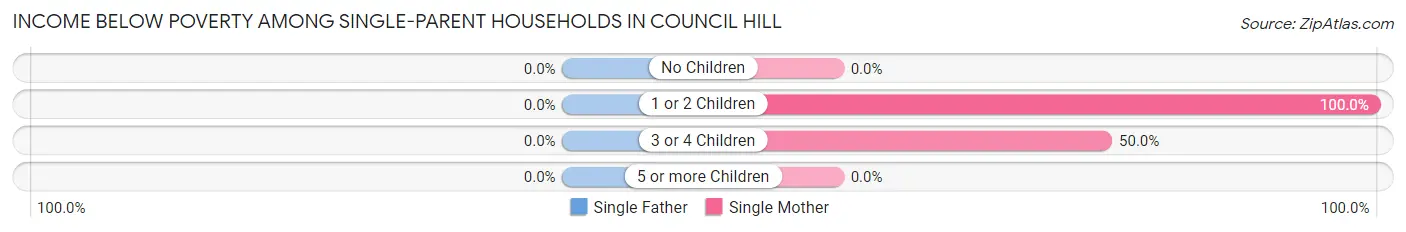
| Children | Single Father | Single Mother |
| No Children | 0 (0.0%) | 0 (0.0%) |
| 1 or 2 Children | 0 (0.0%) | 2 (100.0%) |
| 3 or 4 Children | 0 (0.0%) | 2 (50.0%) |
| 5 or more Children | 0 (0.0%) | 0 (0.0%) |
| Total | 0 (0.0%) | 4 (66.7%) |
Income Below Poverty Among Married-Couple vs Single-Parent Households in Council Hill
The poverty data for Council Hill shows that 1 of the married-couple family households (5.9%) and 4 of the single-parent households (66.7%) are living below the poverty level. Within the married-couple family households, those with no children have the highest poverty rate, with 1 households (11.1%) falling below the poverty line. Among the single-parent households, those with 1 or 2 children have the highest poverty rate, with 2 household (100.0%) living below poverty.
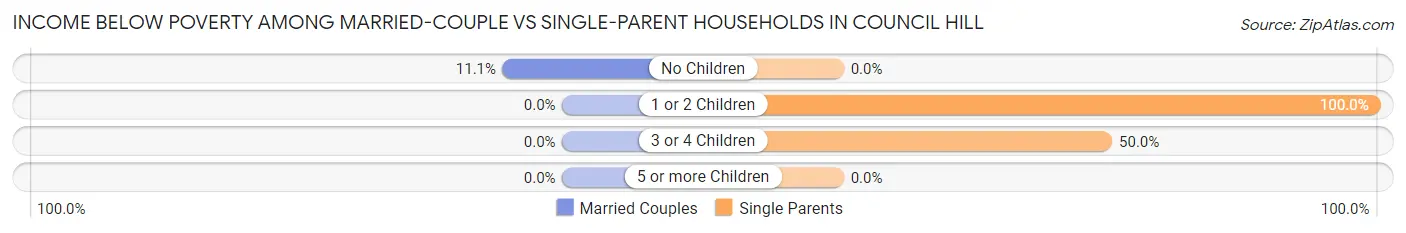
| Children | Married-Couple Families | Single-Parent Households |
| No Children | 1 (11.1%) | 0 (0.0%) |
| 1 or 2 Children | 0 (0.0%) | 2 (100.0%) |
| 3 or 4 Children | 0 (0.0%) | 2 (50.0%) |
| 5 or more Children | 0 (0.0%) | 0 (0.0%) |
| Total | 1 (5.9%) | 4 (66.7%) |
Race in Council Hill
The most populous races in Council Hill are White / Caucasian (57 | 64.8%), Native / Alaskan (30 | 34.1%), and Two or more Races (1 | 1.1%).
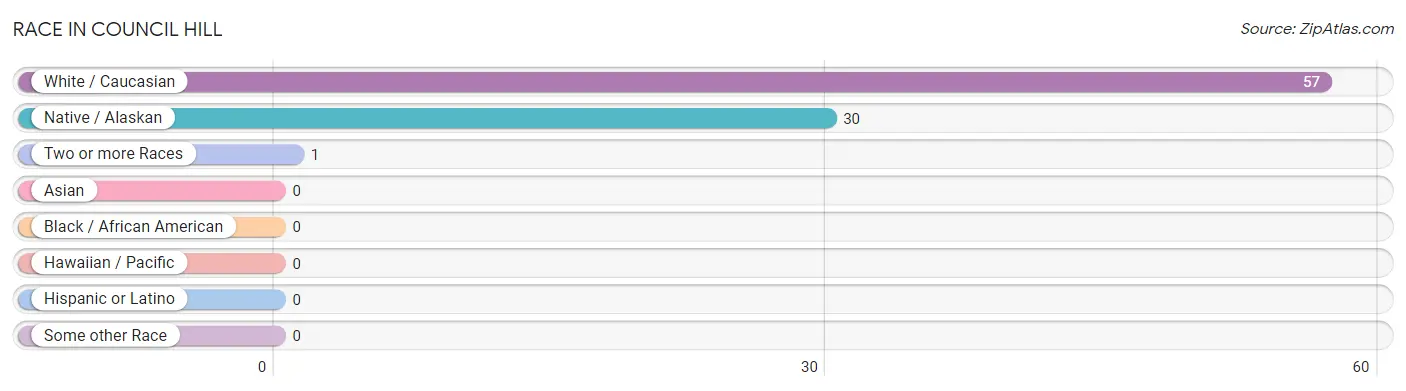
| Race | # Population | % Population |
| Asian | 0 | 0.0% |
| Black / African American | 0 | 0.0% |
| Hawaiian / Pacific | 0 | 0.0% |
| Hispanic or Latino | 0 | 0.0% |
| Native / Alaskan | 30 | 34.1% |
| White / Caucasian | 57 | 64.8% |
| Two or more Races | 1 | 1.1% |
| Some other Race | 0 | 0.0% |
| Total | 88 | 100.0% |
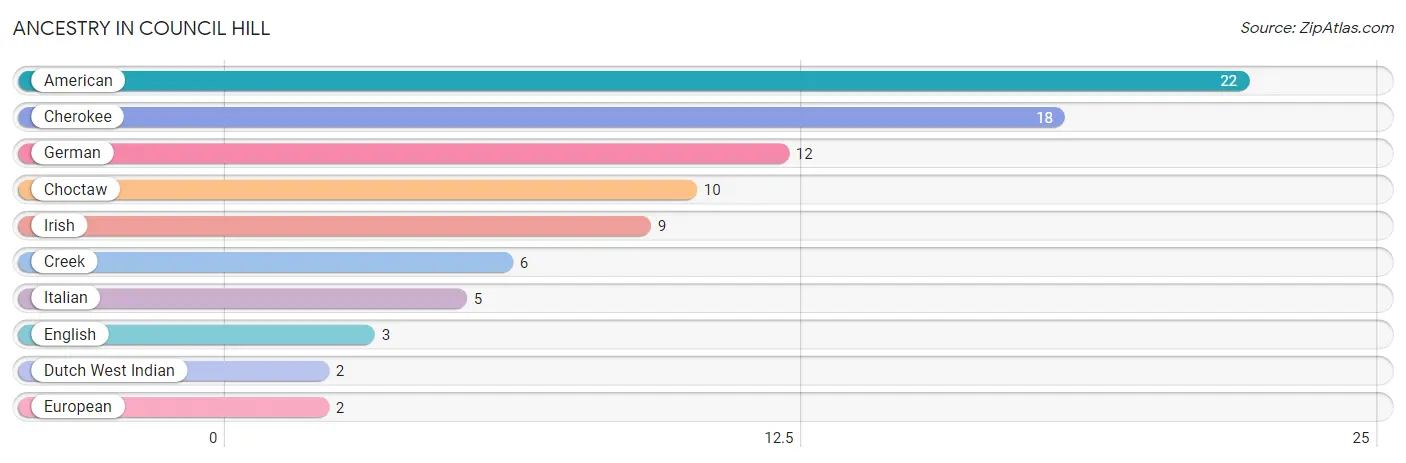
Ancestry in Council Hill
The most populous ancestries reported in Council Hill are American (22 | 25.0%), Cherokee (18 | 20.4%), German (12 | 13.6%), Choctaw (10 | 11.4%), and Irish (9 | 10.2%), together accounting for 80.7% of all Council Hill residents.
| Ancestry | # Population | % Population |
| American | 22 | 25.0% |
| Cherokee | 18 | 20.4% |
| Choctaw | 10 | 11.4% |
| Creek | 6 | 6.8% |
| Dutch West Indian | 2 | 2.3% |
| English | 3 | 3.4% |
| European | 2 | 2.3% |
| German | 12 | 13.6% |
| Irish | 9 | 10.2% |
| Italian | 5 | 5.7% | View All 10 Rows |
Immigrants in Council Hill

| Immigration Origin | # Population | % Population | View All 0 Rows |
Sex and Age in Council Hill
Sex and Age in Council Hill
The most populous age groups in Council Hill are Under 5 Years (10 | 21.3%) for men and 10 to 14 Years (9 | 22.0%) for women.
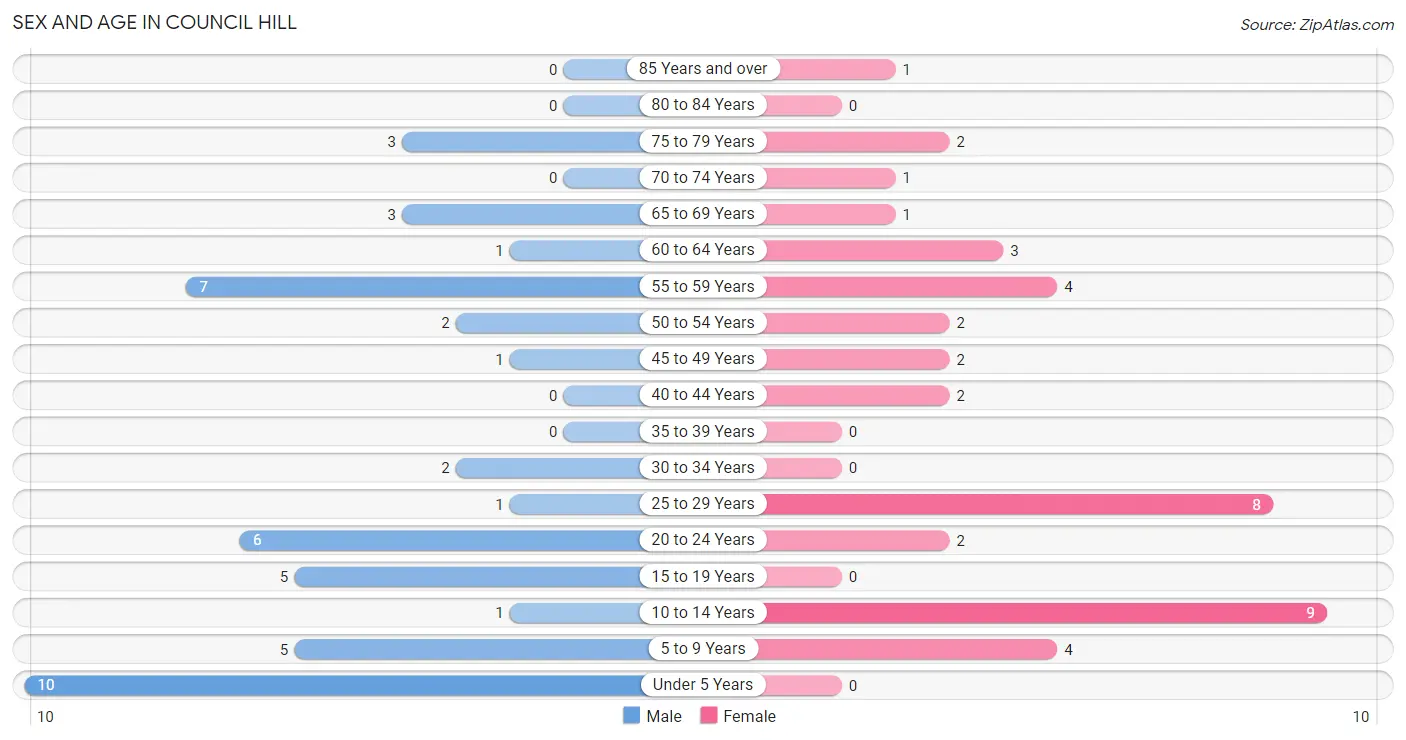
| Age Bracket | Male | Female |
| Under 5 Years | 10 (21.3%) | 0 (0.0%) |
| 5 to 9 Years | 5 (10.6%) | 4 (9.8%) |
| 10 to 14 Years | 1 (2.1%) | 9 (22.0%) |
| 15 to 19 Years | 5 (10.6%) | 0 (0.0%) |
| 20 to 24 Years | 6 (12.8%) | 2 (4.9%) |
| 25 to 29 Years | 1 (2.1%) | 8 (19.5%) |
| 30 to 34 Years | 2 (4.3%) | 0 (0.0%) |
| 35 to 39 Years | 0 (0.0%) | 0 (0.0%) |
| 40 to 44 Years | 0 (0.0%) | 2 (4.9%) |
| 45 to 49 Years | 1 (2.1%) | 2 (4.9%) |
| 50 to 54 Years | 2 (4.3%) | 2 (4.9%) |
| 55 to 59 Years | 7 (14.9%) | 4 (9.8%) |
| 60 to 64 Years | 1 (2.1%) | 3 (7.3%) |
| 65 to 69 Years | 3 (6.4%) | 1 (2.4%) |
| 70 to 74 Years | 0 (0.0%) | 1 (2.4%) |
| 75 to 79 Years | 3 (6.4%) | 2 (4.9%) |
| 80 to 84 Years | 0 (0.0%) | 0 (0.0%) |
| 85 Years and over | 0 (0.0%) | 1 (2.4%) |
| Total | 47 (100.0%) | 41 (100.0%) |
Families and Households in Council Hill
Median Family Size in Council Hill
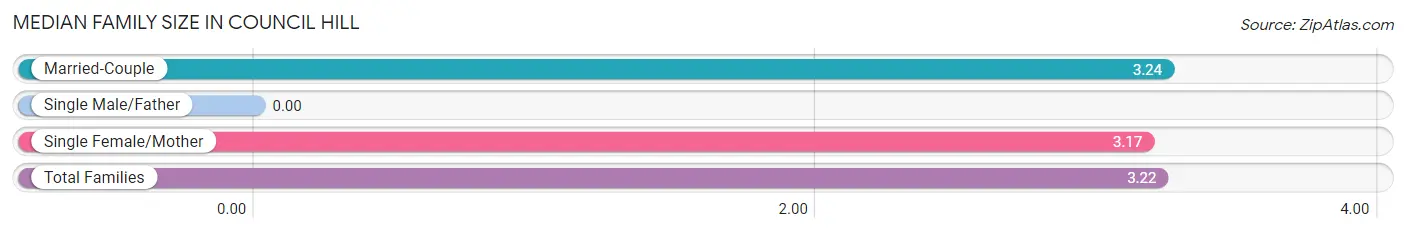
| Family Type | # Families | Family Size |
| Married-Couple | 17 (73.9%) | 3.24 |
| Single Male/Father | 0 (0.0%) | - |
| Single Female/Mother | 6 (26.1%) | 3.17 |
| Total Families | 23 (100.0%) | 3.22 |
Median Household Size in Council Hill
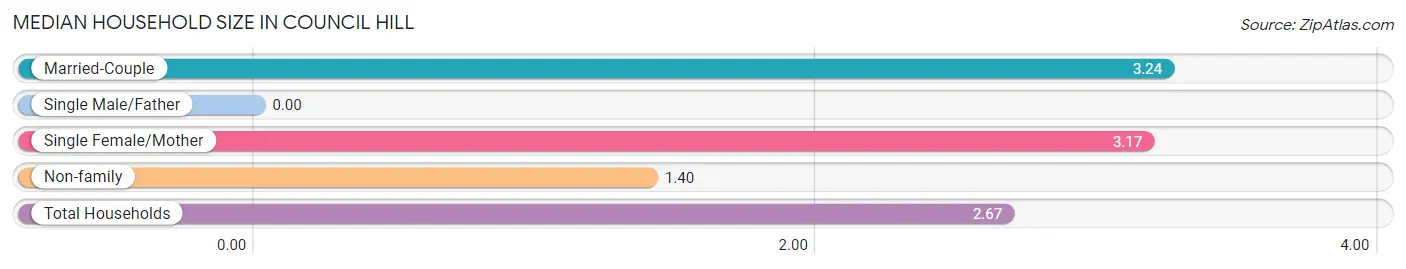
| Household Type | # Households | Household Size |
| Married-Couple | 17 (51.5%) | 3.24 |
| Single Male/Father | 0 (0.0%) | - |
| Single Female/Mother | 6 (18.2%) | 3.17 |
| Non-family | 10 (30.3%) | 1.40 |
| Total Households | 33 (100.0%) | 2.67 |
Household Size by Marriage Status in Council Hill
Out of a total of 33 households in Council Hill, 23 (69.7%) are family households, while 10 (30.3%) are nonfamily households. The most numerous type of family households are 2-person households, comprising 9, and the most common type of nonfamily households are 1-person households, comprising 6.
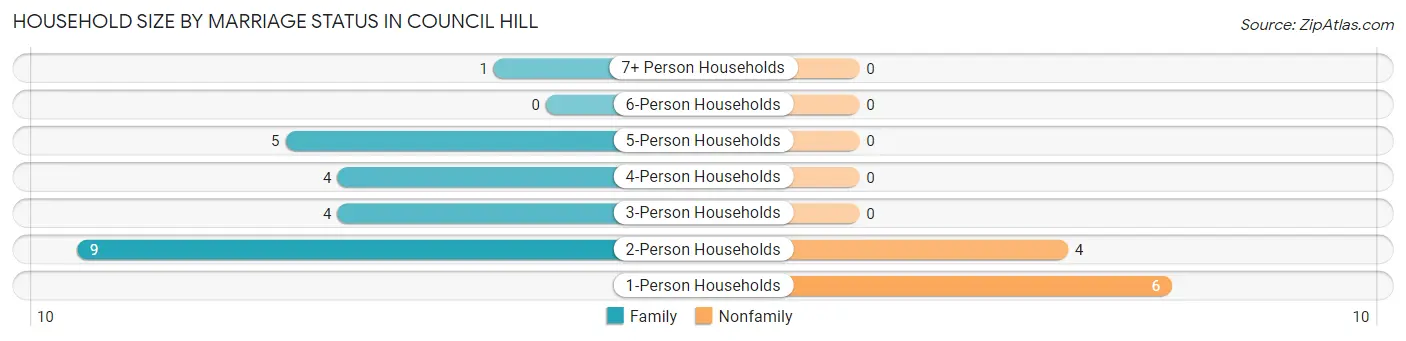
| Household Size | Family Households | Nonfamily Households |
| 1-Person Households | - | 6 (18.2%) |
| 2-Person Households | 9 (27.3%) | 4 (12.1%) |
| 3-Person Households | 4 (12.1%) | 0 (0.0%) |
| 4-Person Households | 4 (12.1%) | 0 (0.0%) |
| 5-Person Households | 5 (15.1%) | 0 (0.0%) |
| 6-Person Households | 0 (0.0%) | 0 (0.0%) |
| 7+ Person Households | 1 (3.0%) | 0 (0.0%) |
| Total | 23 (69.7%) | 10 (30.3%) |
Female Fertility in Council Hill
Fertility by Age in Council Hill
Average fertility rate in Council Hill is 357.0 births per 1,000 women. Women in the age bracket of 20 to 34 years have the highest fertility rate with 500.0 births per 1,000 women. Women in the age bracket of 20 to 34 years acount for 100.0% of all women with births.
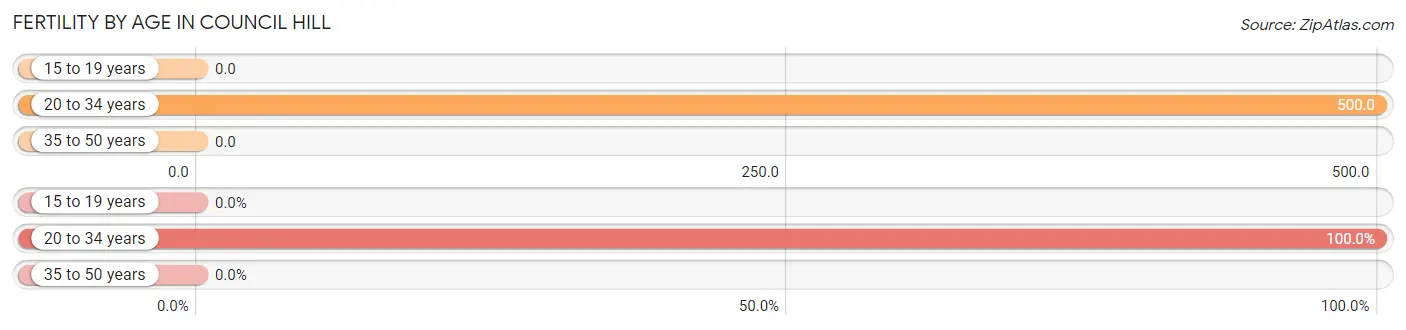
| Age Bracket | Women with Births | Births / 1,000 Women |
| 15 to 19 years | 0 (0.0%) | 0.0 |
| 20 to 34 years | 5 (100.0%) | 500.0 |
| 35 to 50 years | 0 (0.0%) | 0.0 |
| Total | 5 (100.0%) | 357.0 |
Fertility by Age by Marriage Status in Council Hill
60.0% of women with births (5) in Council Hill are married. The highest percentage of unmarried women with births falls into 20 to 34 years age bracket with 40.0% of them unmarried at the time of birth, while the lowest percentage of unmarried women with births belong to 20 to 34 years age bracket with 40.0% of them unmarried.
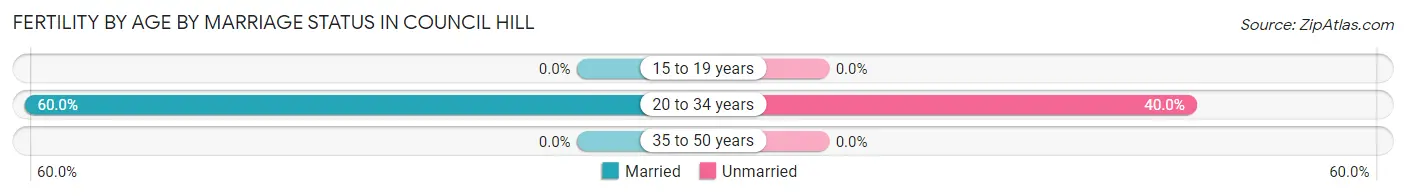
| Age Bracket | Married | Unmarried |
| 15 to 19 years | 0 (0.0%) | 0 (0.0%) |
| 20 to 34 years | 3 (60.0%) | 2 (40.0%) |
| 35 to 50 years | 0 (0.0%) | 0 (0.0%) |
| Total | 3 (60.0%) | 2 (40.0%) |
Fertility by Education in Council Hill
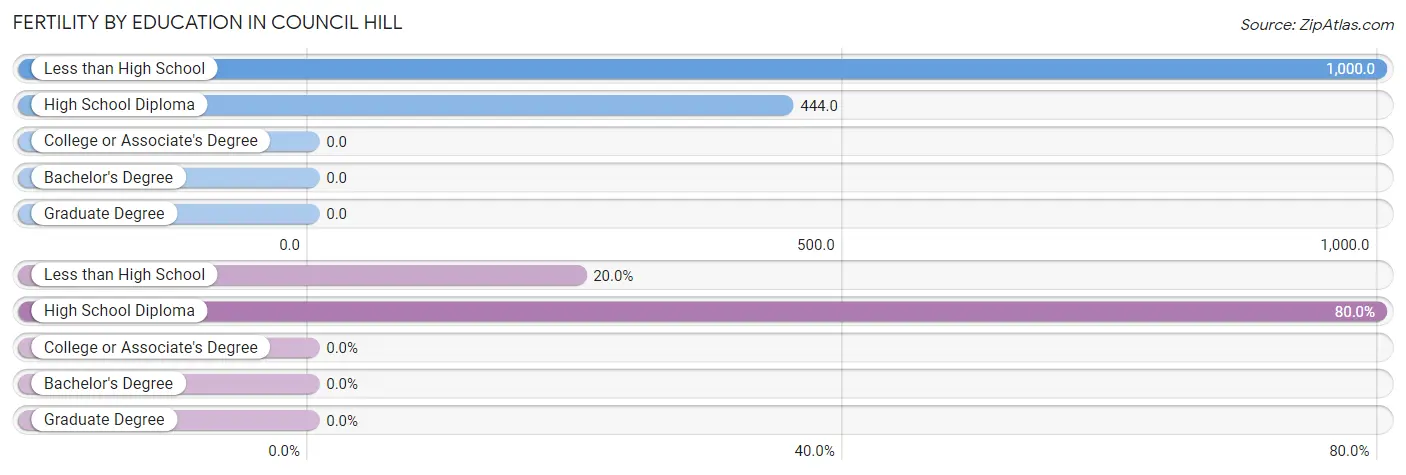
| Educational Attainment | Women with Births | Births / 1,000 Women |
| Less than High School | 1 (20.0%) | 1,000.0 |
| High School Diploma | 4 (80.0%) | 444.0 |
| College or Associate's Degree | 0 (0.0%) | 0.0 |
| Bachelor's Degree | 0 (0.0%) | 0.0 |
| Graduate Degree | 0 (0.0%) | 0.0 |
| Total | 5 (100.0%) | 357.0 |
Fertility by Education by Marriage Status in Council Hill
40.0% of women with births in Council Hill are unmarried. Women with the educational attainment of less than high school are most likely to be married with 100.0% of them married at childbirth, while women with the educational attainment of high school diploma are least likely to be married with 50.0% of them unmarried at childbirth.
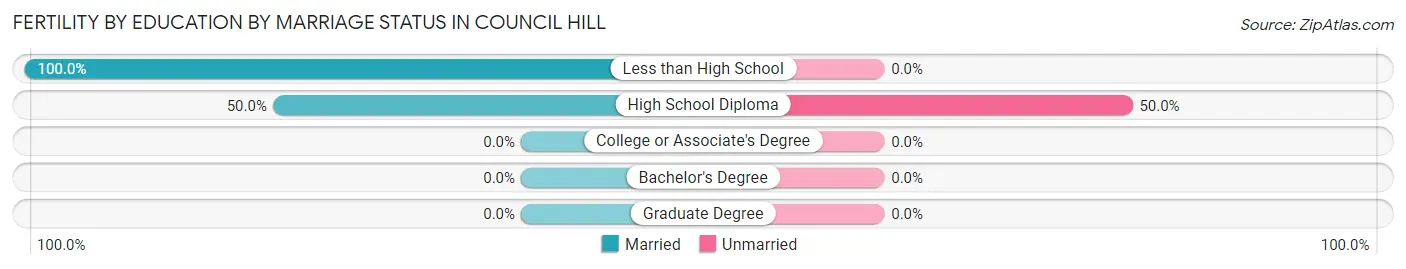
| Educational Attainment | Married | Unmarried |
| Less than High School | 1 (100.0%) | 0 (0.0%) |
| High School Diploma | 2 (50.0%) | 2 (50.0%) |
| College or Associate's Degree | 0 (0.0%) | 0 (0.0%) |
| Bachelor's Degree | 0 (0.0%) | 0 (0.0%) |
| Graduate Degree | 0 (0.0%) | 0 (0.0%) |
| Total | 3 (60.0%) | 2 (40.0%) |
Employment Characteristics in Council Hill
Employment by Class of Employer in Council Hill
Among the 30 employed individuals in Council Hill, private company employees (23 | 76.7%), self-employed (not incorporated) (4 | 13.3%), and state government employees (2 | 6.7%) make up the most common classes of employment.
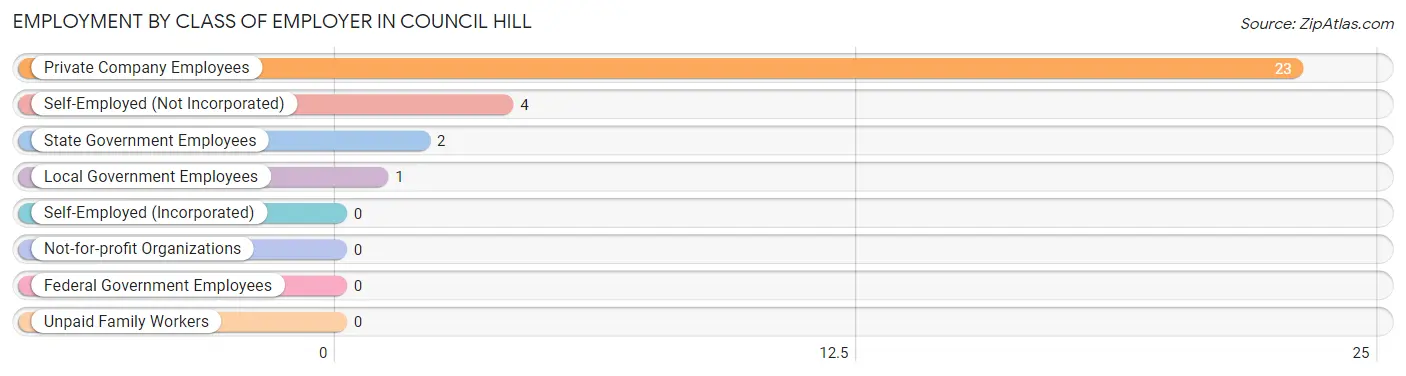
| Employer Class | # Employees | % Employees |
| Private Company Employees | 23 | 76.7% |
| Self-Employed (Incorporated) | 0 | 0.0% |
| Self-Employed (Not Incorporated) | 4 | 13.3% |
| Not-for-profit Organizations | 0 | 0.0% |
| Local Government Employees | 1 | 3.3% |
| State Government Employees | 2 | 6.7% |
| Federal Government Employees | 0 | 0.0% |
| Unpaid Family Workers | 0 | 0.0% |
| Total | 30 | 100.0% |
Employment Status by Age in Council Hill
According to the labor force statistics for Council Hill, out of the total population over 16 years of age (59), 57.6% or 34 individuals are in the labor force, with 11.8% or 4 of them unemployed. The age group with the highest labor force participation rate is 20 to 24 years, with 100.0% or 8 individuals in the labor force. Within the labor force, the 25 to 29 years age range has the highest percentage of unemployed individuals, with 50.0% or 4 of them being unemployed.
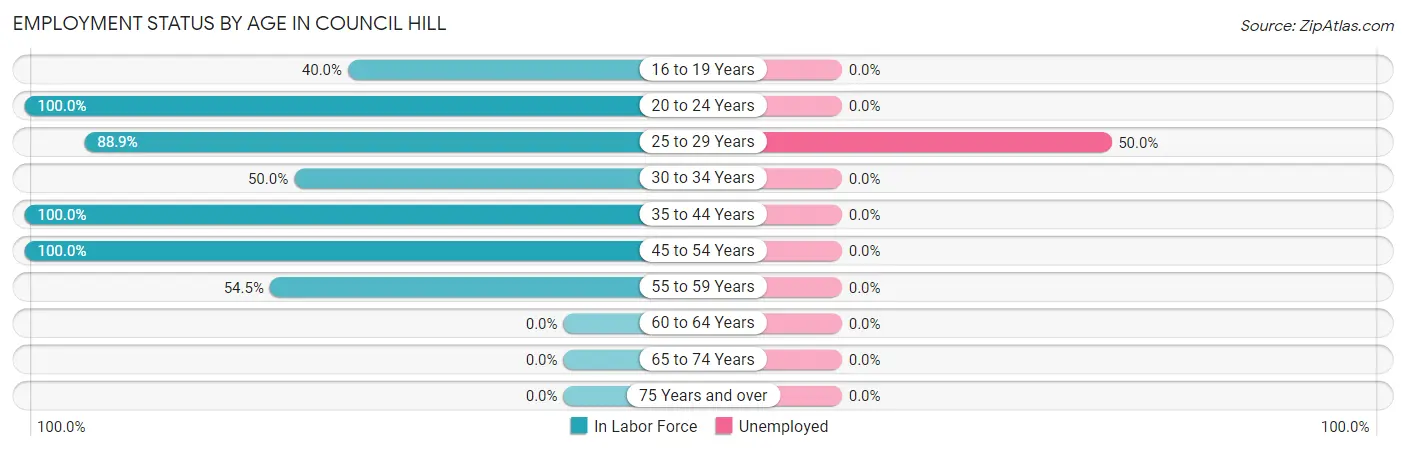
| Age Bracket | In Labor Force | Unemployed |
| 16 to 19 Years | 2 (40.0%) | 0 (0.0%) |
| 20 to 24 Years | 8 (100.0%) | 0 (0.0%) |
| 25 to 29 Years | 8 (88.9%) | 4 (50.0%) |
| 30 to 34 Years | 1 (50.0%) | 0 (0.0%) |
| 35 to 44 Years | 2 (100.0%) | 0 (0.0%) |
| 45 to 54 Years | 7 (100.0%) | 0 (0.0%) |
| 55 to 59 Years | 6 (54.5%) | 0 (0.0%) |
| 60 to 64 Years | 0 (0.0%) | 0 (0.0%) |
| 65 to 74 Years | 0 (0.0%) | 0 (0.0%) |
| 75 Years and over | 0 (0.0%) | 0 (0.0%) |
| Total | 34 (57.6%) | 4 (11.8%) |
Employment Status by Educational Attainment in Council Hill
According to labor force statistics for Council Hill, 68.6% of individuals (24) out of the total population between 25 and 64 years of age (35) are in the labor force, with 16.7% or 4 of them being unemployed. The group with the highest labor force participation rate are those with the educational attainment of high school diploma, with 73.7% or 14 individuals in the labor force. Within the labor force, individuals with high school diploma education have the highest percentage of unemployment, with 28.6% or 4 of them being unemployed.
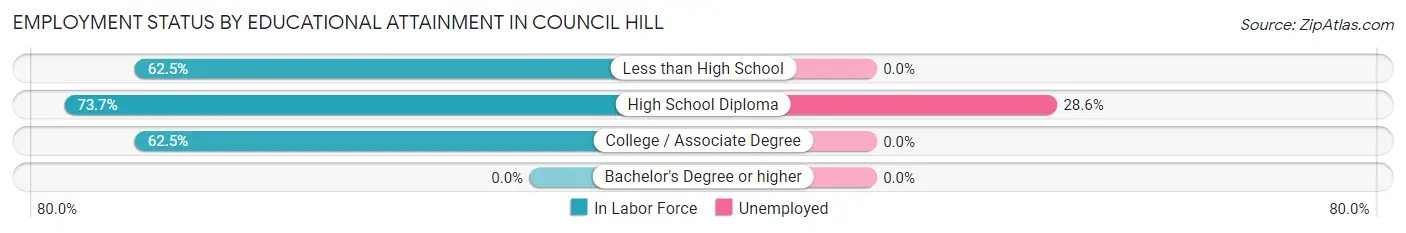
| Educational Attainment | In Labor Force | Unemployed |
| Less than High School | 5 (62.5%) | 0 (0.0%) |
| High School Diploma | 14 (73.7%) | 5 (28.6%) |
| College / Associate Degree | 5 (62.5%) | 0 (0.0%) |
| Bachelor's Degree or higher | 0 (0.0%) | 0 (0.0%) |
| Total | 24 (68.6%) | 6 (16.7%) |
Employment Occupations by Sex in Council Hill
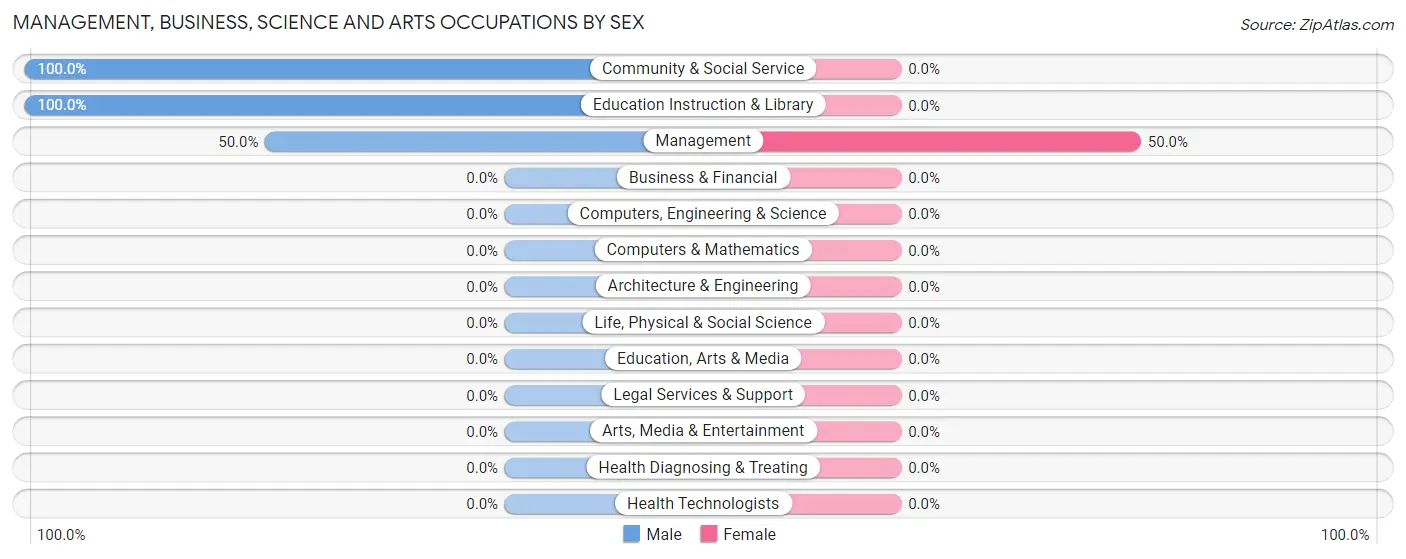
Management, Business, Science and Arts Occupations
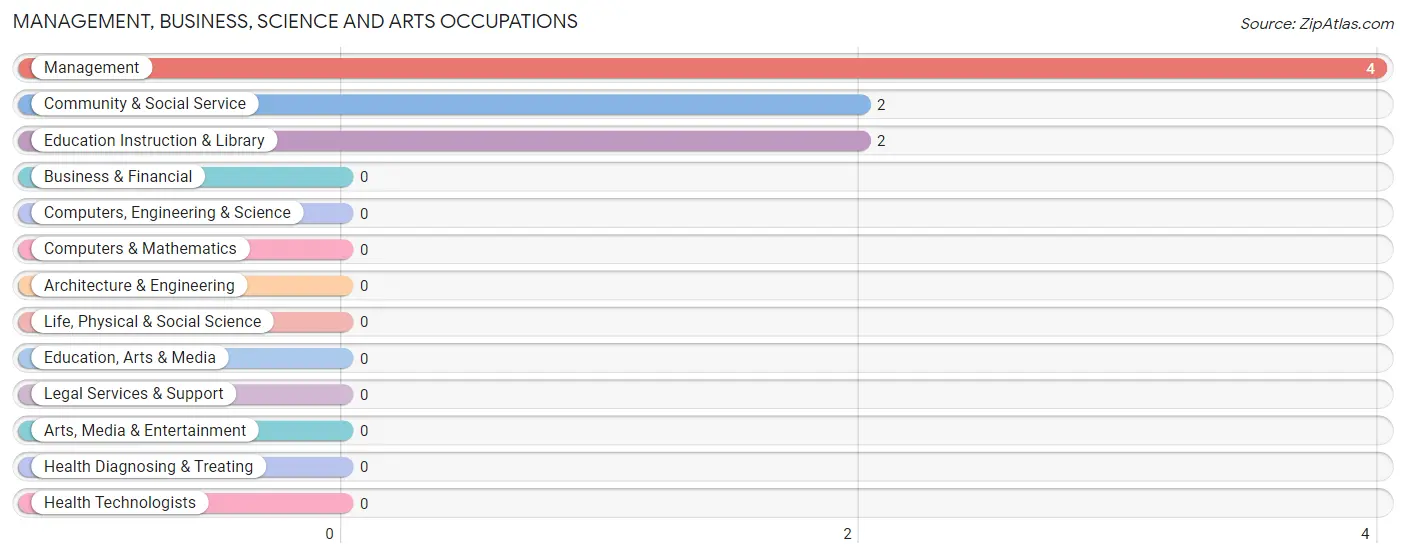
The most common Management, Business, Science and Arts occupations in Council Hill are Management (4 | 13.3%), Community & Social Service (2 | 6.7%), and Education Instruction & Library (2 | 6.7%).
Management, Business, Science and Arts Occupations by Sex
| Occupation | Male | Female |
| Management | 2 (50.0%) | 2 (50.0%) |
| Business & Financial | 0 (0.0%) | 0 (0.0%) |
| Computers, Engineering & Science | 0 (0.0%) | 0 (0.0%) |
| Computers & Mathematics | 0 (0.0%) | 0 (0.0%) |
| Architecture & Engineering | 0 (0.0%) | 0 (0.0%) |
| Life, Physical & Social Science | 0 (0.0%) | 0 (0.0%) |
| Community & Social Service | 2 (100.0%) | 0 (0.0%) |
| Education, Arts & Media | 0 (0.0%) | 0 (0.0%) |
| Legal Services & Support | 0 (0.0%) | 0 (0.0%) |
| Education Instruction & Library | 2 (100.0%) | 0 (0.0%) |
| Arts, Media & Entertainment | 0 (0.0%) | 0 (0.0%) |
| Health Diagnosing & Treating | 0 (0.0%) | 0 (0.0%) |
| Health Technologists | 0 (0.0%) | 0 (0.0%) |
| Total (Category) | 4 (66.7%) | 2 (33.3%) |
| Total (Overall) | 18 (60.0%) | 12 (40.0%) |
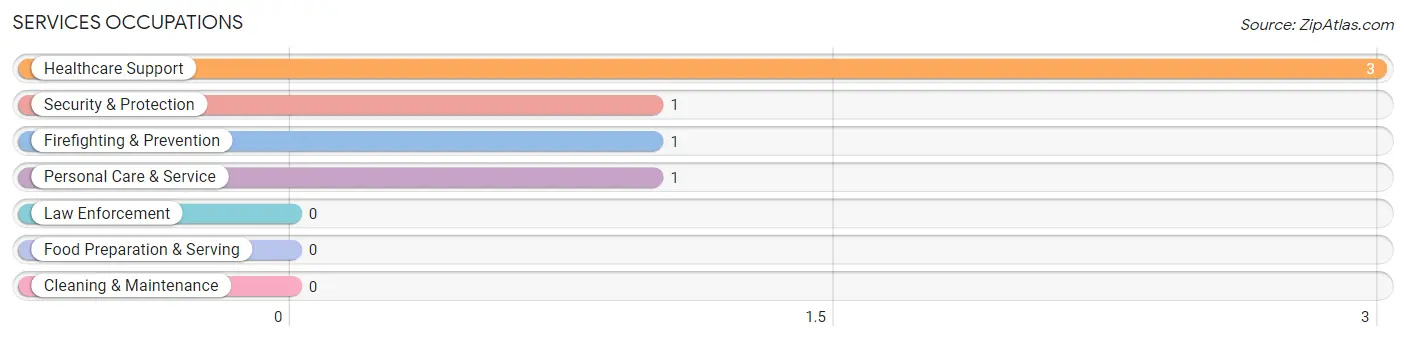
Services Occupations
The most common Services occupations in Council Hill are Healthcare Support (3 | 10.0%), Security & Protection (1 | 3.3%), Firefighting & Prevention (1 | 3.3%), and Personal Care & Service (1 | 3.3%).
Services Occupations by Sex
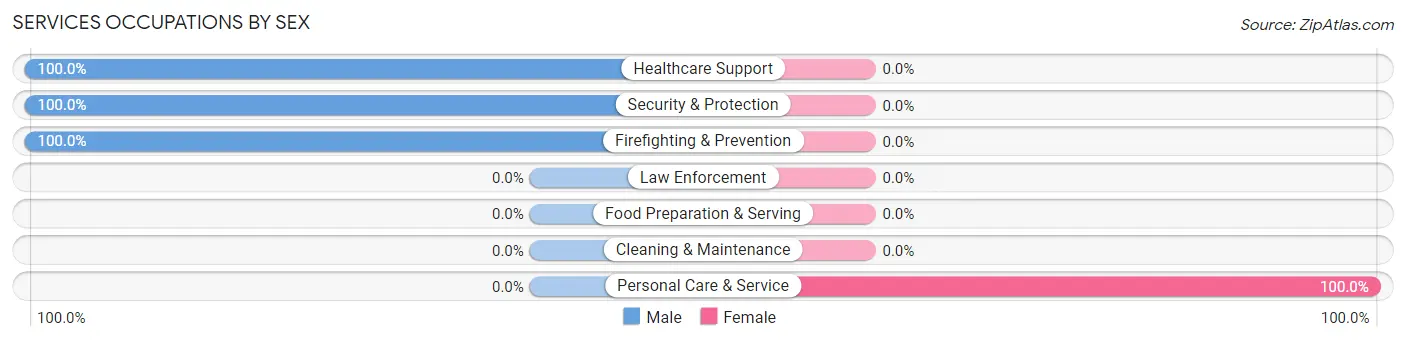
| Occupation | Male | Female |
| Healthcare Support | 3 (100.0%) | 0 (0.0%) |
| Security & Protection | 1 (100.0%) | 0 (0.0%) |
| Firefighting & Prevention | 1 (100.0%) | 0 (0.0%) |
| Law Enforcement | 0 (0.0%) | 0 (0.0%) |
| Food Preparation & Serving | 0 (0.0%) | 0 (0.0%) |
| Cleaning & Maintenance | 0 (0.0%) | 0 (0.0%) |
| Personal Care & Service | 0 (0.0%) | 1 (100.0%) |
| Total (Category) | 4 (80.0%) | 1 (20.0%) |
| Total (Overall) | 18 (60.0%) | 12 (40.0%) |
Sales and Office Occupations
The most common Sales and Office occupations in Council Hill are , and Office & Administration (7 | 23.3%).
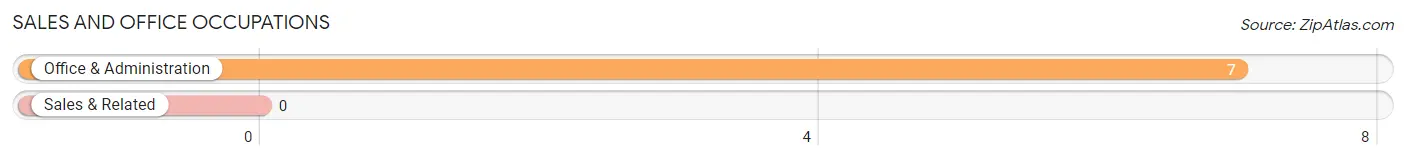
Sales and Office Occupations by Sex
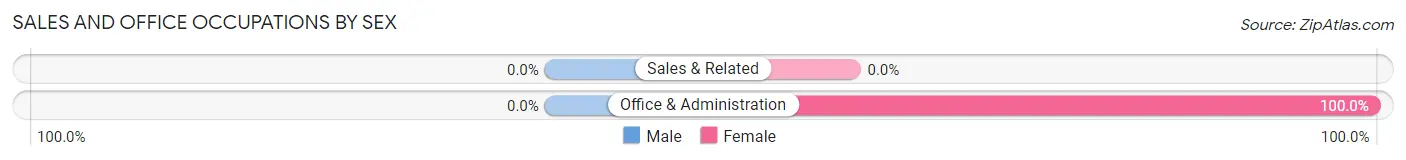
| Occupation | Male | Female |
| Sales & Related | 0 (0.0%) | 0 (0.0%) |
| Office & Administration | 0 (0.0%) | 7 (100.0%) |
| Total (Category) | 0 (0.0%) | 7 (100.0%) |
| Total (Overall) | 18 (60.0%) | 12 (40.0%) |
Natural Resources, Construction and Maintenance Occupations
The most common Natural Resources, Construction and Maintenance occupations in Council Hill are Installation, Maintenance & Repair (3 | 10.0%), and Construction & Extraction (2 | 6.7%).
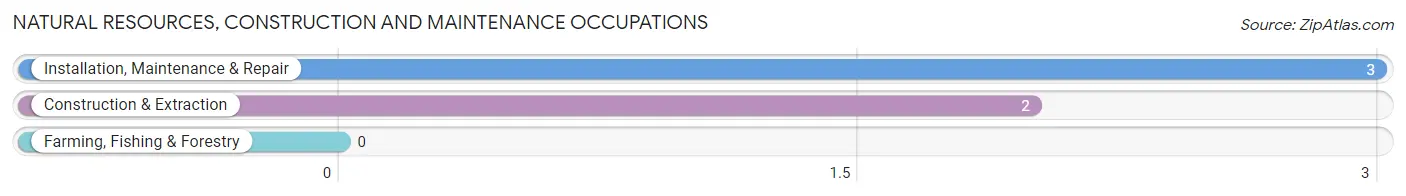
Natural Resources, Construction and Maintenance Occupations by Sex
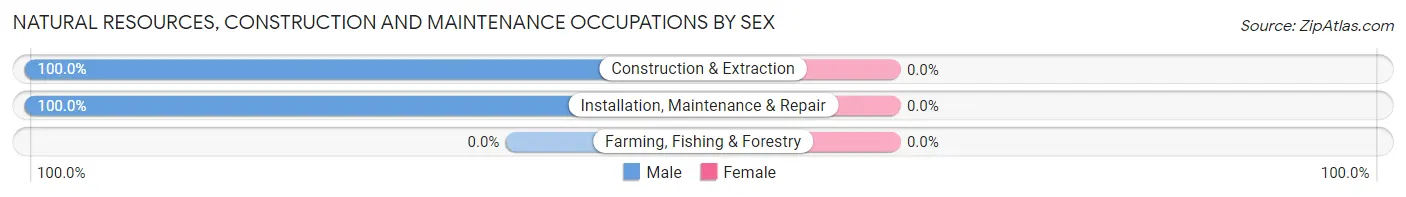
| Occupation | Male | Female |
| Farming, Fishing & Forestry | 0 (0.0%) | 0 (0.0%) |
| Construction & Extraction | 2 (100.0%) | 0 (0.0%) |
| Installation, Maintenance & Repair | 3 (100.0%) | 0 (0.0%) |
| Total (Category) | 5 (100.0%) | 0 (0.0%) |
| Total (Overall) | 18 (60.0%) | 12 (40.0%) |
Production, Transportation and Moving Occupations
The most common Production, Transportation and Moving occupations in Council Hill are Transportation (3 | 10.0%), Production (2 | 6.7%), and Material Moving (2 | 6.7%).
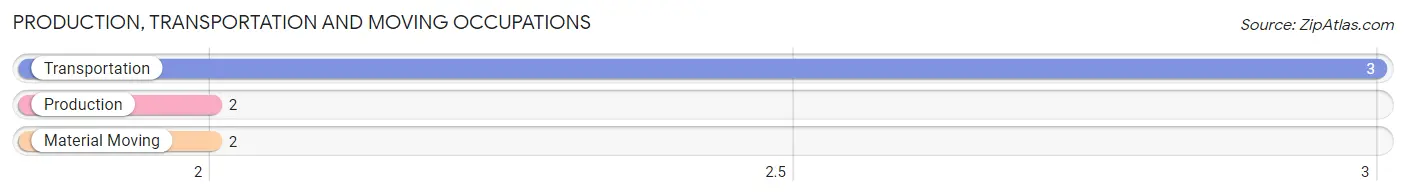
Production, Transportation and Moving Occupations by Sex
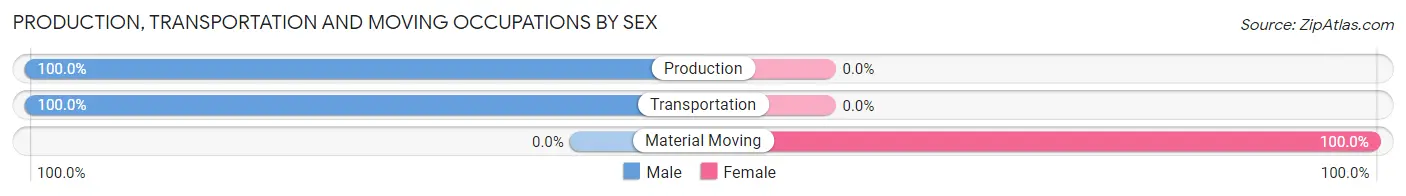
| Occupation | Male | Female |
| Production | 2 (100.0%) | 0 (0.0%) |
| Transportation | 3 (100.0%) | 0 (0.0%) |
| Material Moving | 0 (0.0%) | 2 (100.0%) |
| Total (Category) | 5 (71.4%) | 2 (28.6%) |
| Total (Overall) | 18 (60.0%) | 12 (40.0%) |
Employment Industries by Sex in Council Hill
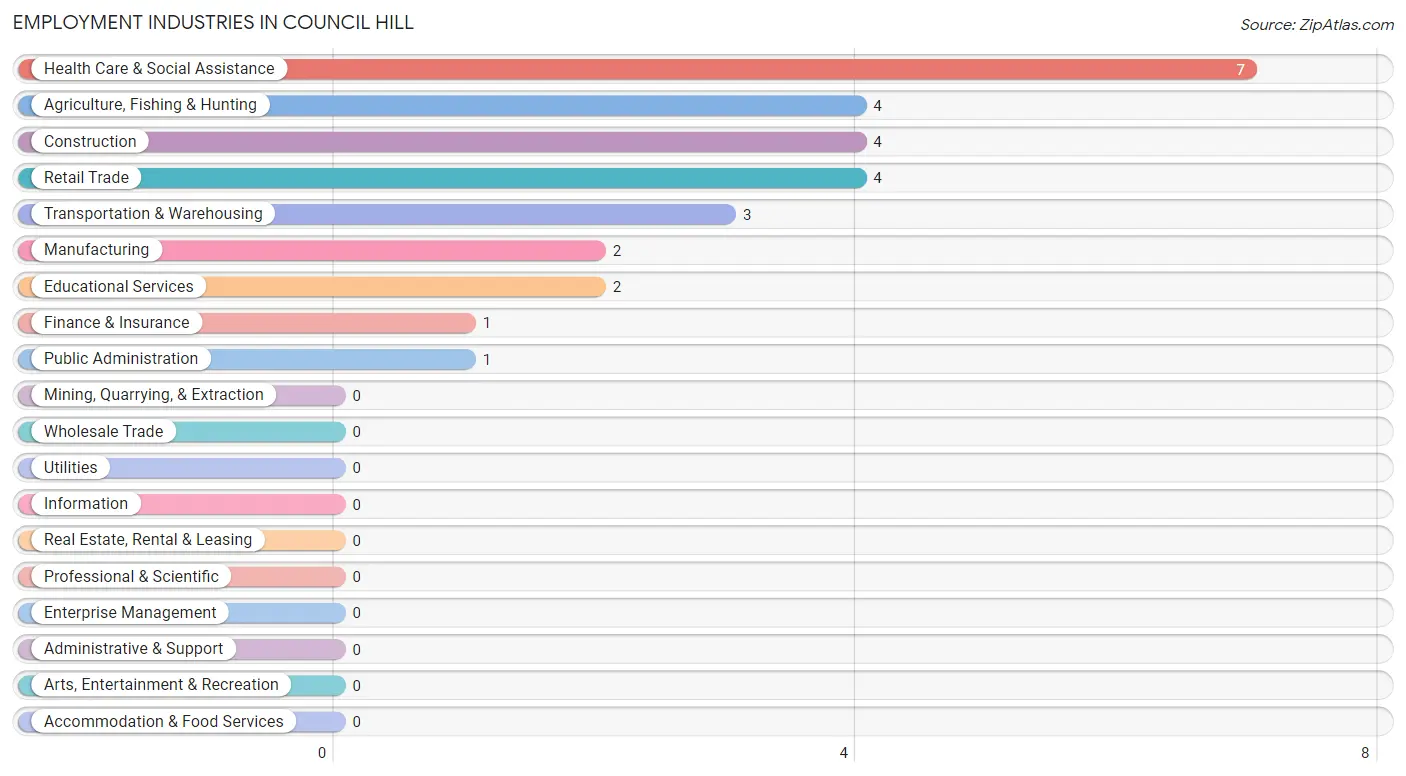
Employment Industries in Council Hill
The major employment industries in Council Hill include Health Care & Social Assistance (7 | 23.3%), Agriculture, Fishing & Hunting (4 | 13.3%), Construction (4 | 13.3%), Retail Trade (4 | 13.3%), and Transportation & Warehousing (3 | 10.0%).
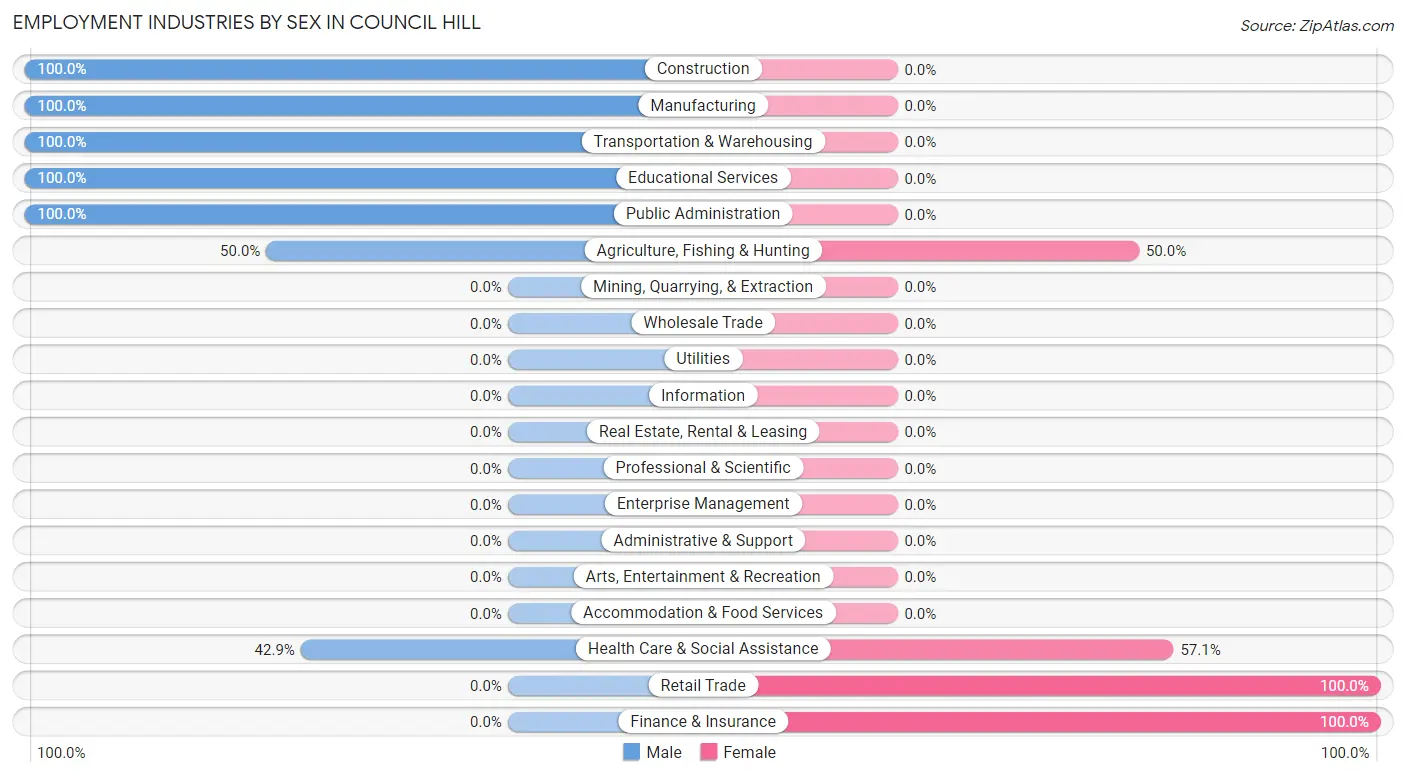
Employment Industries by Sex in Council Hill
The Council Hill industries that see more men than women are Construction (100.0%), Manufacturing (100.0%), and Transportation & Warehousing (100.0%), whereas the industries that tend to have a higher number of women are Retail Trade (100.0%), Finance & Insurance (100.0%), and Health Care & Social Assistance (57.1%).
| Industry | Male | Female |
| Agriculture, Fishing & Hunting | 2 (50.0%) | 2 (50.0%) |
| Mining, Quarrying, & Extraction | 0 (0.0%) | 0 (0.0%) |
| Construction | 4 (100.0%) | 0 (0.0%) |
| Manufacturing | 2 (100.0%) | 0 (0.0%) |
| Wholesale Trade | 0 (0.0%) | 0 (0.0%) |
| Retail Trade | 0 (0.0%) | 4 (100.0%) |
| Transportation & Warehousing | 3 (100.0%) | 0 (0.0%) |
| Utilities | 0 (0.0%) | 0 (0.0%) |
| Information | 0 (0.0%) | 0 (0.0%) |
| Finance & Insurance | 0 (0.0%) | 1 (100.0%) |
| Real Estate, Rental & Leasing | 0 (0.0%) | 0 (0.0%) |
| Professional & Scientific | 0 (0.0%) | 0 (0.0%) |
| Enterprise Management | 0 (0.0%) | 0 (0.0%) |
| Administrative & Support | 0 (0.0%) | 0 (0.0%) |
| Educational Services | 2 (100.0%) | 0 (0.0%) |
| Health Care & Social Assistance | 3 (42.9%) | 4 (57.1%) |
| Arts, Entertainment & Recreation | 0 (0.0%) | 0 (0.0%) |
| Accommodation & Food Services | 0 (0.0%) | 0 (0.0%) |
| Public Administration | 1 (100.0%) | 0 (0.0%) |
| Total | 18 (60.0%) | 12 (40.0%) |
Education in Council Hill
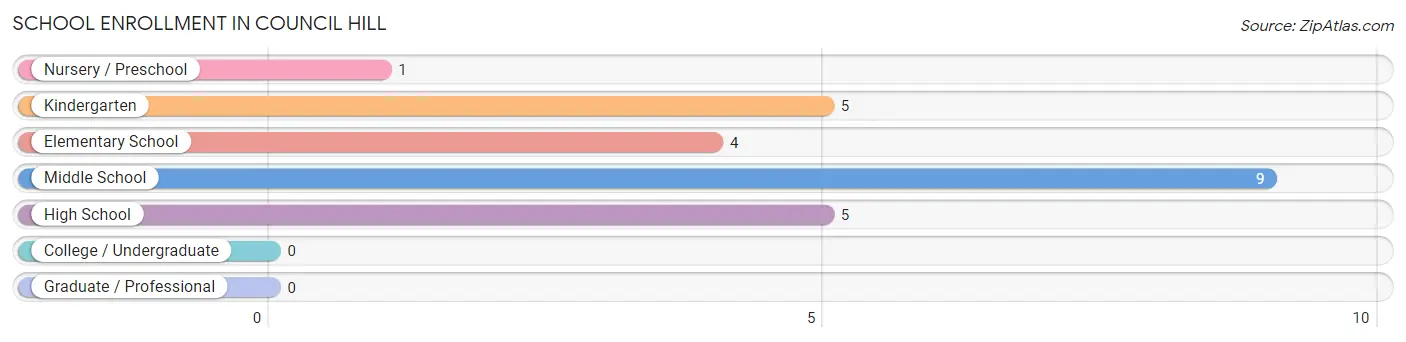
School Enrollment in Council Hill
The most common levels of schooling among the 24 students in Council Hill are middle school (9 | 37.5%), kindergarten (5 | 20.8%), and high school (5 | 20.8%).
| School Level | # Students | % Students |
| Nursery / Preschool | 1 | 4.2% |
| Kindergarten | 5 | 20.8% |
| Elementary School | 4 | 16.7% |
| Middle School | 9 | 37.5% |
| High School | 5 | 20.8% |
| College / Undergraduate | 0 | 0.0% |
| Graduate / Professional | 0 | 0.0% |
| Total | 24 | 100.0% |
School Enrollment by Age by Funding Source in Council Hill
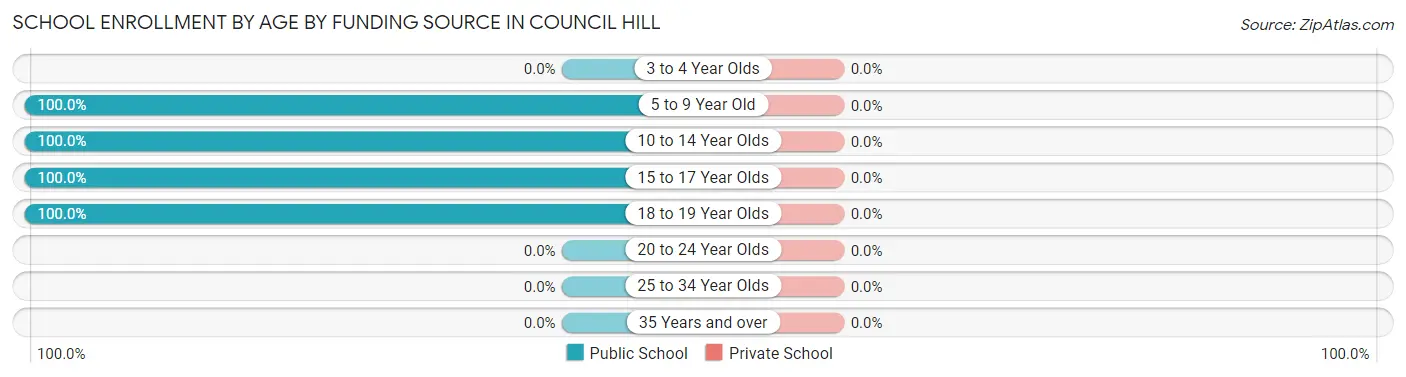
| Age Bracket | Public School | Private School |
| 3 to 4 Year Olds | 0 (0.0%) | 0 (0.0%) |
| 5 to 9 Year Old | 9 (100.0%) | 0 (0.0%) |
| 10 to 14 Year Olds | 10 (100.0%) | 0 (0.0%) |
| 15 to 17 Year Olds | 3 (100.0%) | 0 (0.0%) |
| 18 to 19 Year Olds | 2 (100.0%) | 0 (0.0%) |
| 20 to 24 Year Olds | 0 (0.0%) | 0 (0.0%) |
| 25 to 34 Year Olds | 0 (0.0%) | 0 (0.0%) |
| 35 Years and over | 0 (0.0%) | 0 (0.0%) |
| Total | 24 (100.0%) | 0 (0.0%) |
Educational Attainment by Field of Study in Council Hill
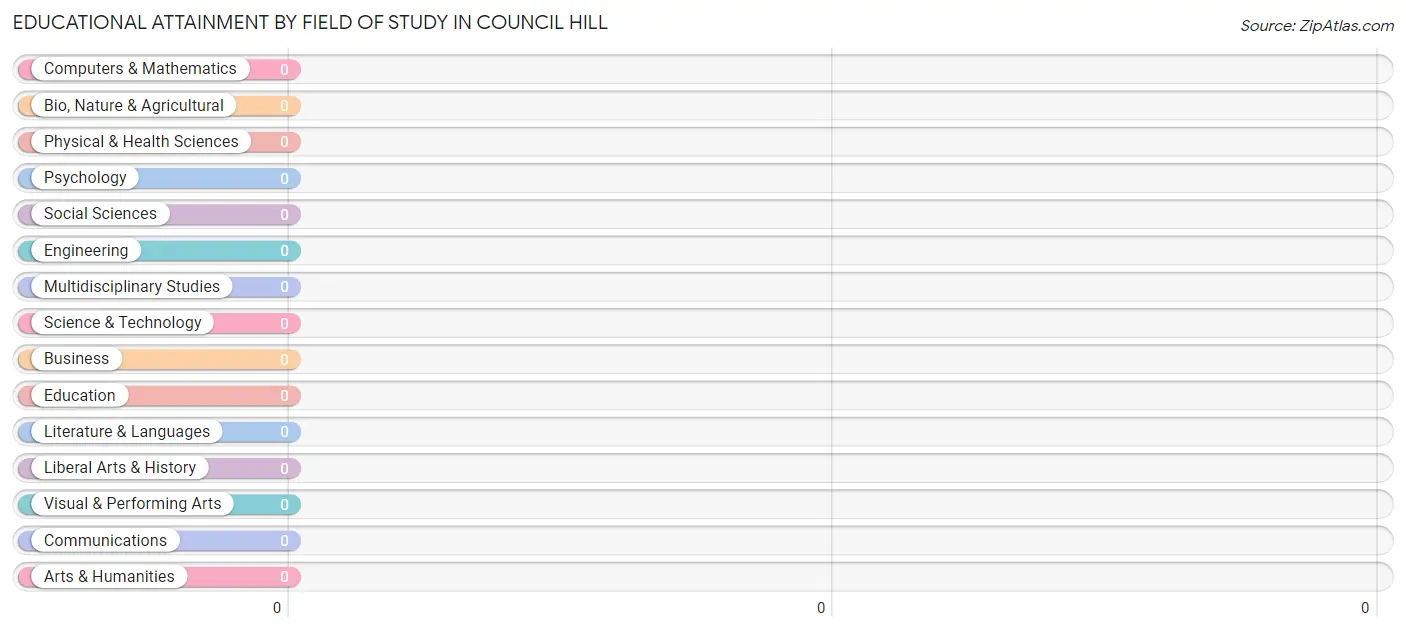
| Field of Study | # Graduates | % Graduates |
| Computers & Mathematics | 0 | 0.0% |
| Bio, Nature & Agricultural | 0 | 0.0% |
| Physical & Health Sciences | 0 | 0.0% |
| Psychology | 0 | 0.0% |
| Social Sciences | 0 | 0.0% |
| Engineering | 0 | 0.0% |
| Multidisciplinary Studies | 0 | 0.0% |
| Science & Technology | 0 | 0.0% |
| Business | 0 | 0.0% |
| Education | 0 | 0.0% |
| Literature & Languages | 0 | 0.0% |
| Liberal Arts & History | 0 | 0.0% |
| Visual & Performing Arts | 0 | 0.0% |
| Communications | 0 | 0.0% |
| Arts & Humanities | 0 | 0.0% |
| Total | 0 | 0.0% |
Transportation & Commute in Council Hill
Vehicle Availability by Sex in Council Hill
The most prevalent vehicle ownership categories in Council Hill are males with 1 vehicle (7, accounting for 38.9%) and females with 1 vehicle (2, making up 58.3%).
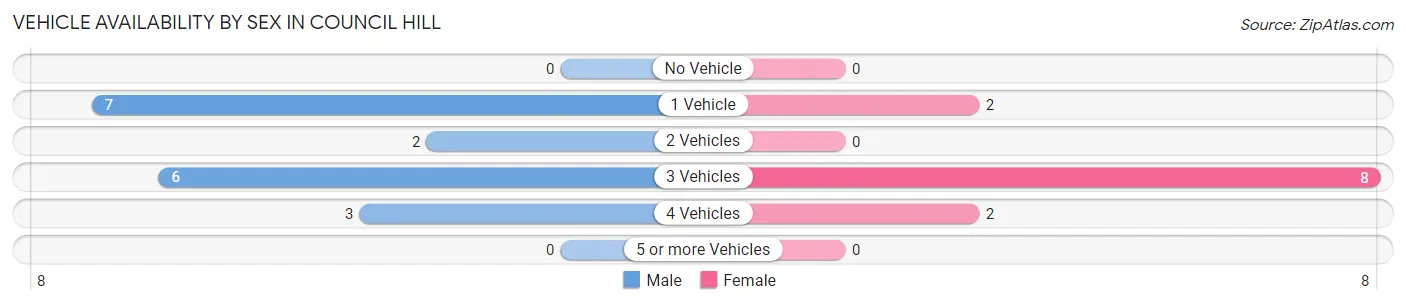
| Vehicles Available | Male | Female |
| No Vehicle | 0 (0.0%) | 0 (0.0%) |
| 1 Vehicle | 7 (38.9%) | 2 (16.7%) |
| 2 Vehicles | 2 (11.1%) | 0 (0.0%) |
| 3 Vehicles | 6 (33.3%) | 8 (66.7%) |
| 4 Vehicles | 3 (16.7%) | 2 (16.7%) |
| 5 or more Vehicles | 0 (0.0%) | 0 (0.0%) |
| Total | 18 (100.0%) | 12 (100.0%) |
Commute Time in Council Hill
The most frequently occuring commute durations in Council Hill are 25 to 29 minutes (10 commuters, 33.3%), 5 to 9 minutes (5 commuters, 16.7%), and 15 to 19 minutes (5 commuters, 16.7%).
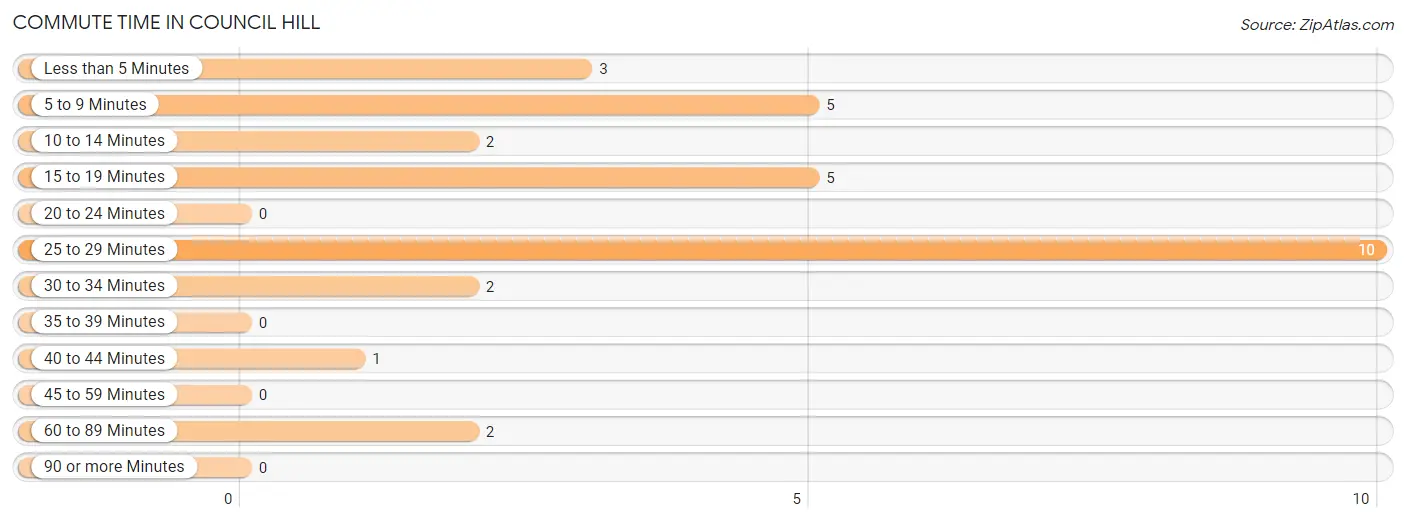
| Commute Time | # Commuters | % Commuters |
| Less than 5 Minutes | 3 | 10.0% |
| 5 to 9 Minutes | 5 | 16.7% |
| 10 to 14 Minutes | 2 | 6.7% |
| 15 to 19 Minutes | 5 | 16.7% |
| 20 to 24 Minutes | 0 | 0.0% |
| 25 to 29 Minutes | 10 | 33.3% |
| 30 to 34 Minutes | 2 | 6.7% |
| 35 to 39 Minutes | 0 | 0.0% |
| 40 to 44 Minutes | 1 | 3.3% |
| 45 to 59 Minutes | 0 | 0.0% |
| 60 to 89 Minutes | 2 | 6.7% |
| 90 or more Minutes | 0 | 0.0% |
Commute Time by Sex in Council Hill
The most common commute times in Council Hill are 5 to 9 minutes (4 commuters, 22.2%) for males and 25 to 29 minutes (6 commuters, 50.0%) for females.
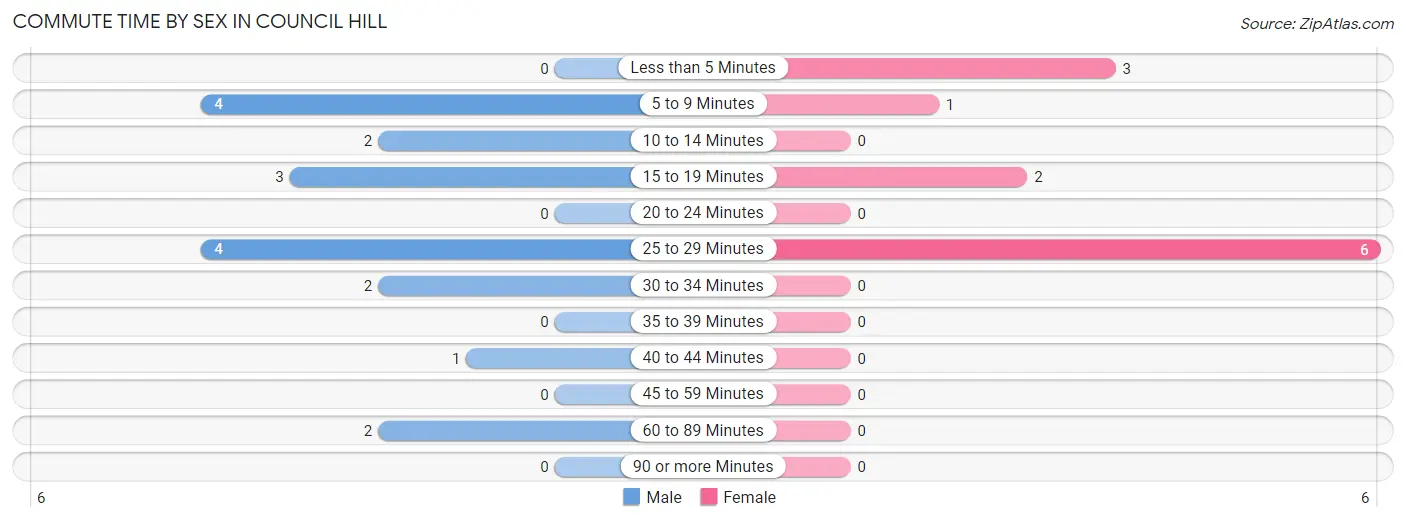
| Commute Time | Male | Female |
| Less than 5 Minutes | 0 (0.0%) | 3 (25.0%) |
| 5 to 9 Minutes | 4 (22.2%) | 1 (8.3%) |
| 10 to 14 Minutes | 2 (11.1%) | 0 (0.0%) |
| 15 to 19 Minutes | 3 (16.7%) | 2 (16.7%) |
| 20 to 24 Minutes | 0 (0.0%) | 0 (0.0%) |
| 25 to 29 Minutes | 4 (22.2%) | 6 (50.0%) |
| 30 to 34 Minutes | 2 (11.1%) | 0 (0.0%) |
| 35 to 39 Minutes | 0 (0.0%) | 0 (0.0%) |
| 40 to 44 Minutes | 1 (5.6%) | 0 (0.0%) |
| 45 to 59 Minutes | 0 (0.0%) | 0 (0.0%) |
| 60 to 89 Minutes | 2 (11.1%) | 0 (0.0%) |
| 90 or more Minutes | 0 (0.0%) | 0 (0.0%) |
Time of Departure to Work by Sex in Council Hill
The most frequent times of departure to work in Council Hill are 4:00 PM to 11:59 PM (5, 27.8%) for males and 6:30 AM to 6:59 AM (4, 33.3%) for females.
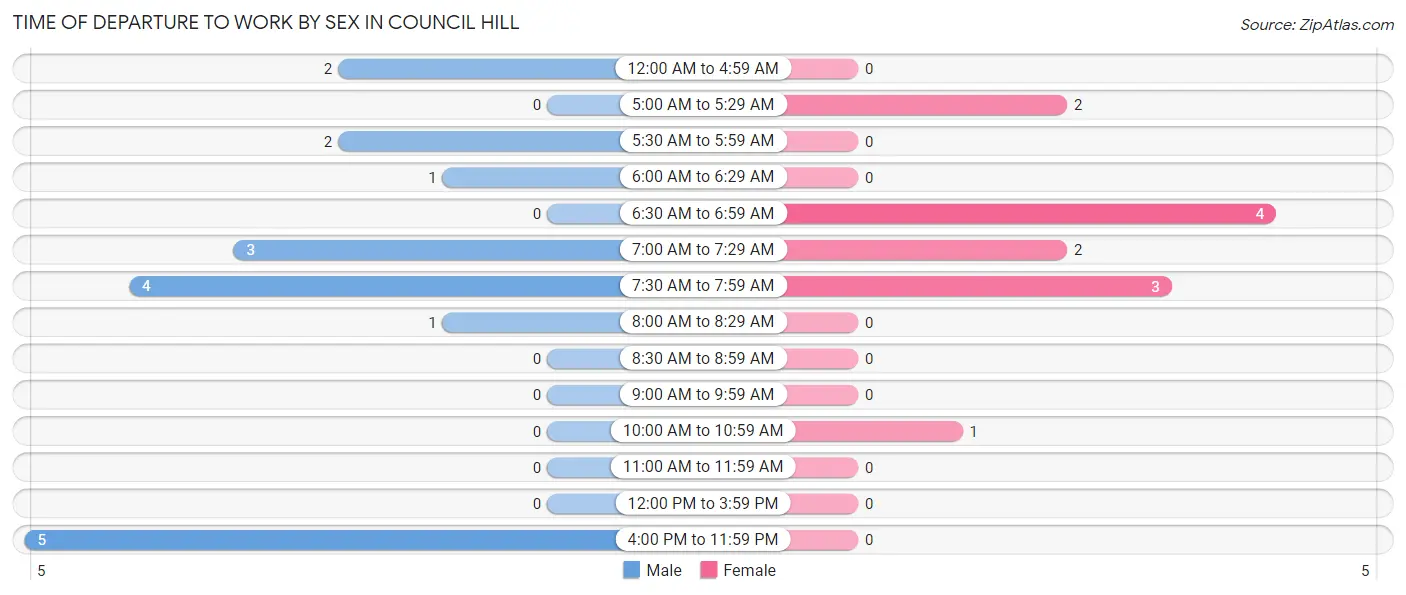
| Time of Departure | Male | Female |
| 12:00 AM to 4:59 AM | 2 (11.1%) | 0 (0.0%) |
| 5:00 AM to 5:29 AM | 0 (0.0%) | 2 (16.7%) |
| 5:30 AM to 5:59 AM | 2 (11.1%) | 0 (0.0%) |
| 6:00 AM to 6:29 AM | 1 (5.6%) | 0 (0.0%) |
| 6:30 AM to 6:59 AM | 0 (0.0%) | 4 (33.3%) |
| 7:00 AM to 7:29 AM | 3 (16.7%) | 2 (16.7%) |
| 7:30 AM to 7:59 AM | 4 (22.2%) | 3 (25.0%) |
| 8:00 AM to 8:29 AM | 1 (5.6%) | 0 (0.0%) |
| 8:30 AM to 8:59 AM | 0 (0.0%) | 0 (0.0%) |
| 9:00 AM to 9:59 AM | 0 (0.0%) | 0 (0.0%) |
| 10:00 AM to 10:59 AM | 0 (0.0%) | 1 (8.3%) |
| 11:00 AM to 11:59 AM | 0 (0.0%) | 0 (0.0%) |
| 12:00 PM to 3:59 PM | 0 (0.0%) | 0 (0.0%) |
| 4:00 PM to 11:59 PM | 5 (27.8%) | 0 (0.0%) |
| Total | 18 (100.0%) | 12 (100.0%) |
Housing Occupancy in Council Hill
Occupancy by Ownership in Council Hill
Of the total 33 dwellings in Council Hill, owner-occupied units account for 21 (63.6%), while renter-occupied units make up 12 (36.4%).
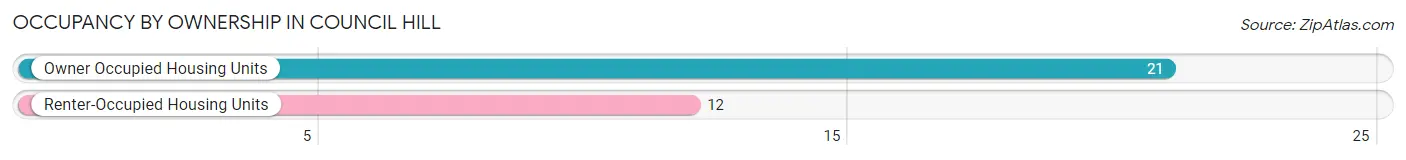
| Occupancy | # Housing Units | % Housing Units |
| Owner Occupied Housing Units | 21 | 63.6% |
| Renter-Occupied Housing Units | 12 | 36.4% |
| Total Occupied Housing Units | 33 | 100.0% |
Occupancy by Household Size in Council Hill
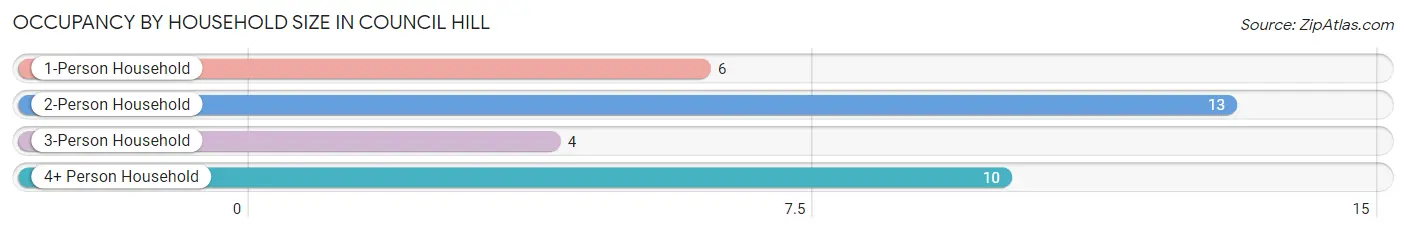
| Household Size | # Housing Units | % Housing Units |
| 1-Person Household | 6 | 18.2% |
| 2-Person Household | 13 | 39.4% |
| 3-Person Household | 4 | 12.1% |
| 4+ Person Household | 10 | 30.3% |
| Total Housing Units | 33 | 100.0% |
Occupancy by Ownership by Household Size in Council Hill
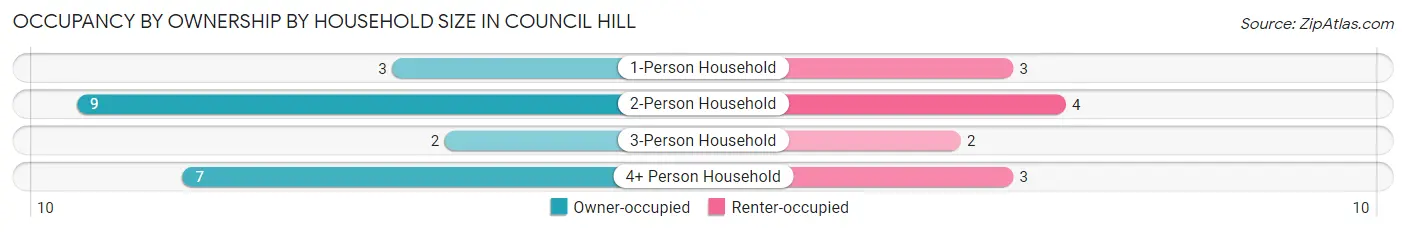
| Household Size | Owner-occupied | Renter-occupied |
| 1-Person Household | 3 (50.0%) | 3 (50.0%) |
| 2-Person Household | 9 (69.2%) | 4 (30.8%) |
| 3-Person Household | 2 (50.0%) | 2 (50.0%) |
| 4+ Person Household | 7 (70.0%) | 3 (30.0%) |
| Total Housing Units | 21 (63.6%) | 12 (36.4%) |
Occupancy by Educational Attainment in Council Hill
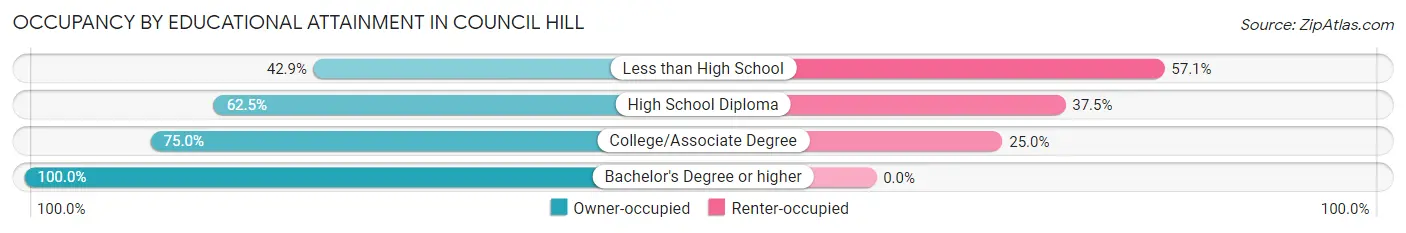
| Household Size | Owner-occupied | Renter-occupied |
| Less than High School | 3 (42.9%) | 4 (57.1%) |
| High School Diploma | 10 (62.5%) | 6 (37.5%) |
| College/Associate Degree | 6 (75.0%) | 2 (25.0%) |
| Bachelor's Degree or higher | 2 (100.0%) | 0 (0.0%) |
Occupancy by Age of Householder in Council Hill
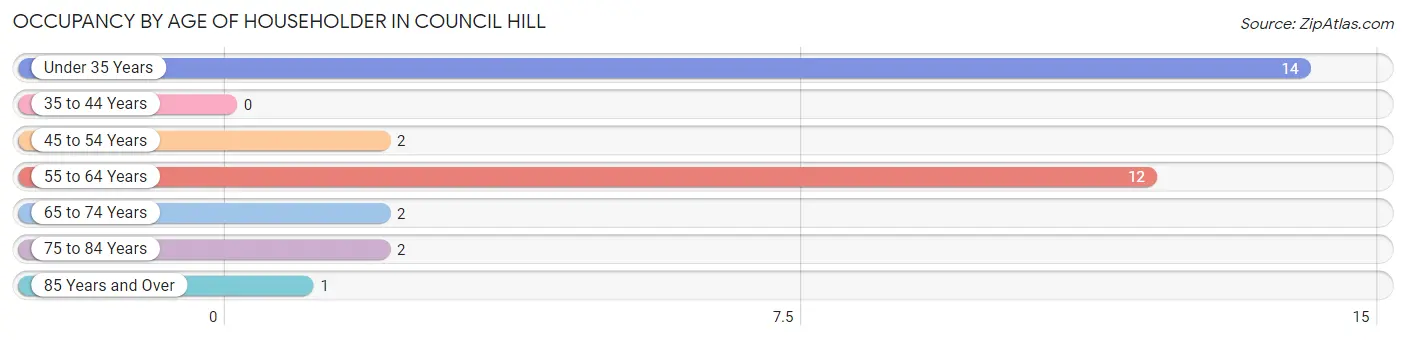
| Age Bracket | # Households | % Households |
| Under 35 Years | 14 | 42.4% |
| 35 to 44 Years | 0 | 0.0% |
| 45 to 54 Years | 2 | 6.1% |
| 55 to 64 Years | 12 | 36.4% |
| 65 to 74 Years | 2 | 6.1% |
| 75 to 84 Years | 2 | 6.1% |
| 85 Years and Over | 1 | 3.0% |
| Total | 33 | 100.0% |
Housing Finances in Council Hill
Median Income by Occupancy in Council Hill
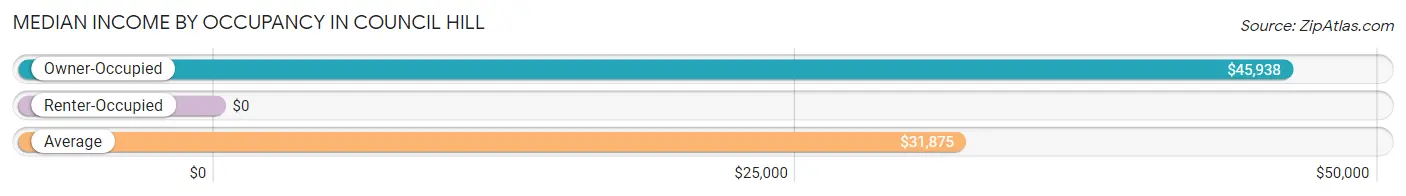
| Occupancy Type | # Households | Median Income |
| Owner-Occupied | 21 (63.6%) | $45,938 |
| Renter-Occupied | 12 (36.4%) | $0 |
| Average | 33 (100.0%) | $31,875 |
Occupancy by Householder Income Bracket in Council Hill
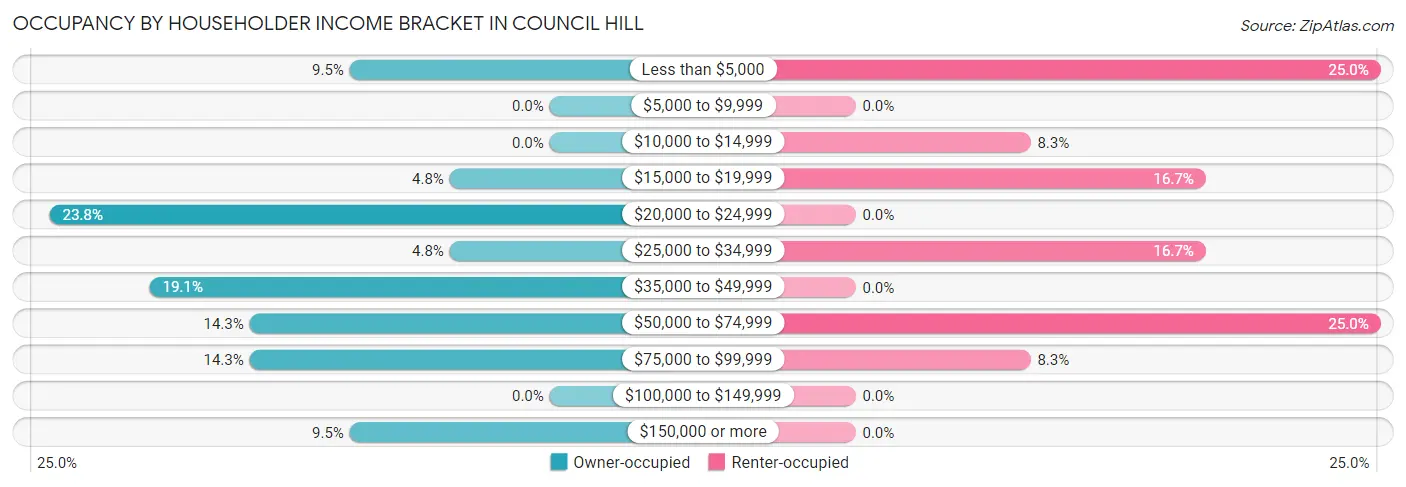
| Income Bracket | Owner-occupied | Renter-occupied |
| Less than $5,000 | 2 (9.5%) | 3 (25.0%) |
| $5,000 to $9,999 | 0 (0.0%) | 0 (0.0%) |
| $10,000 to $14,999 | 0 (0.0%) | 1 (8.3%) |
| $15,000 to $19,999 | 1 (4.8%) | 2 (16.7%) |
| $20,000 to $24,999 | 5 (23.8%) | 0 (0.0%) |
| $25,000 to $34,999 | 1 (4.8%) | 2 (16.7%) |
| $35,000 to $49,999 | 4 (19.1%) | 0 (0.0%) |
| $50,000 to $74,999 | 3 (14.3%) | 3 (25.0%) |
| $75,000 to $99,999 | 3 (14.3%) | 1 (8.3%) |
| $100,000 to $149,999 | 0 (0.0%) | 0 (0.0%) |
| $150,000 or more | 2 (9.5%) | 0 (0.0%) |
| Total | 21 (100.0%) | 12 (100.0%) |
Monthly Housing Cost Tiers in Council Hill
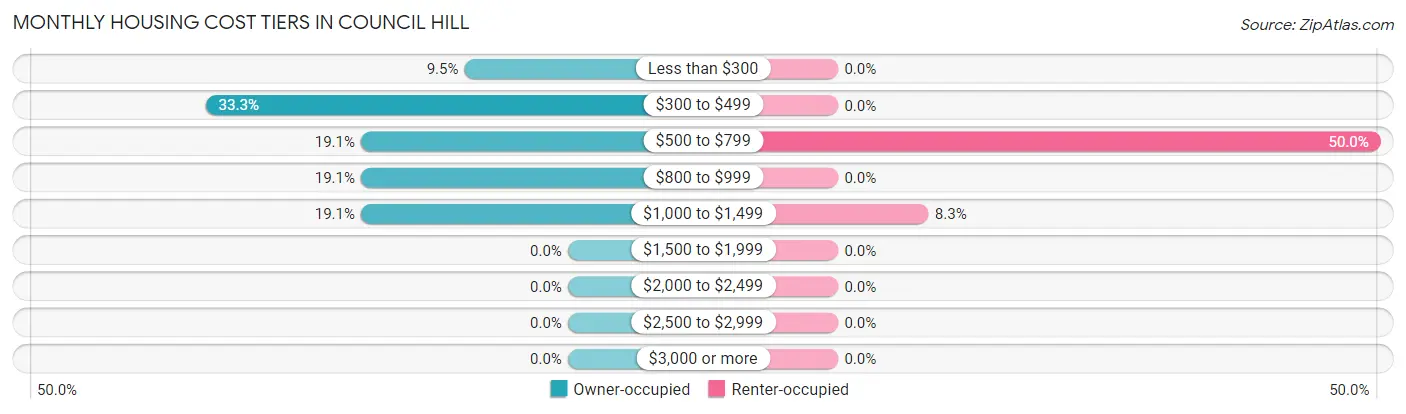
| Monthly Cost | Owner-occupied | Renter-occupied |
| Less than $300 | 2 (9.5%) | 0 (0.0%) |
| $300 to $499 | 7 (33.3%) | 0 (0.0%) |
| $500 to $799 | 4 (19.1%) | 6 (50.0%) |
| $800 to $999 | 4 (19.1%) | 0 (0.0%) |
| $1,000 to $1,499 | 4 (19.1%) | 1 (8.3%) |
| $1,500 to $1,999 | 0 (0.0%) | 0 (0.0%) |
| $2,000 to $2,499 | 0 (0.0%) | 0 (0.0%) |
| $2,500 to $2,999 | 0 (0.0%) | 0 (0.0%) |
| $3,000 or more | 0 (0.0%) | 0 (0.0%) |
| Total | 21 (100.0%) | 12 (100.0%) |
Physical Housing Characteristics in Council Hill
Housing Structures in Council Hill
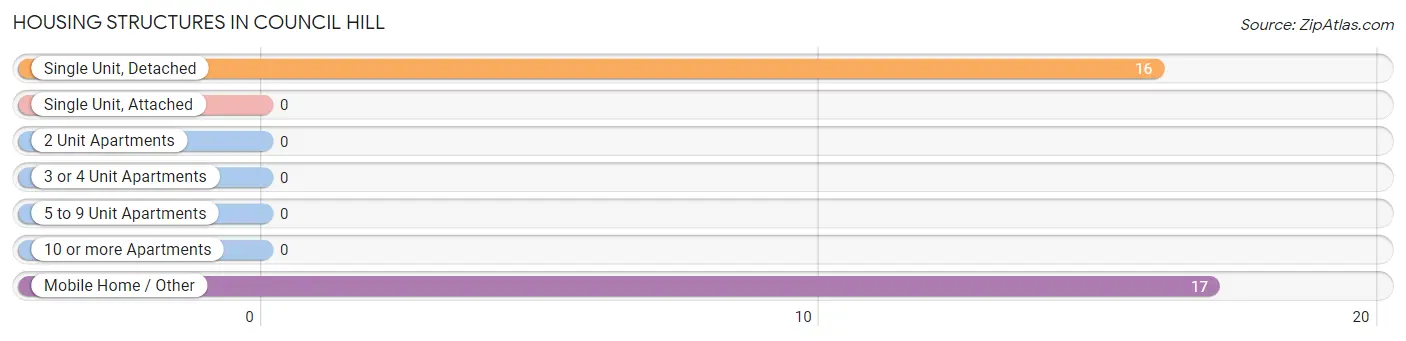
| Structure Type | # Housing Units | % Housing Units |
| Single Unit, Detached | 16 | 48.5% |
| Single Unit, Attached | 0 | 0.0% |
| 2 Unit Apartments | 0 | 0.0% |
| 3 or 4 Unit Apartments | 0 | 0.0% |
| 5 to 9 Unit Apartments | 0 | 0.0% |
| 10 or more Apartments | 0 | 0.0% |
| Mobile Home / Other | 17 | 51.5% |
| Total | 33 | 100.0% |
Housing Structures by Occupancy in Council Hill
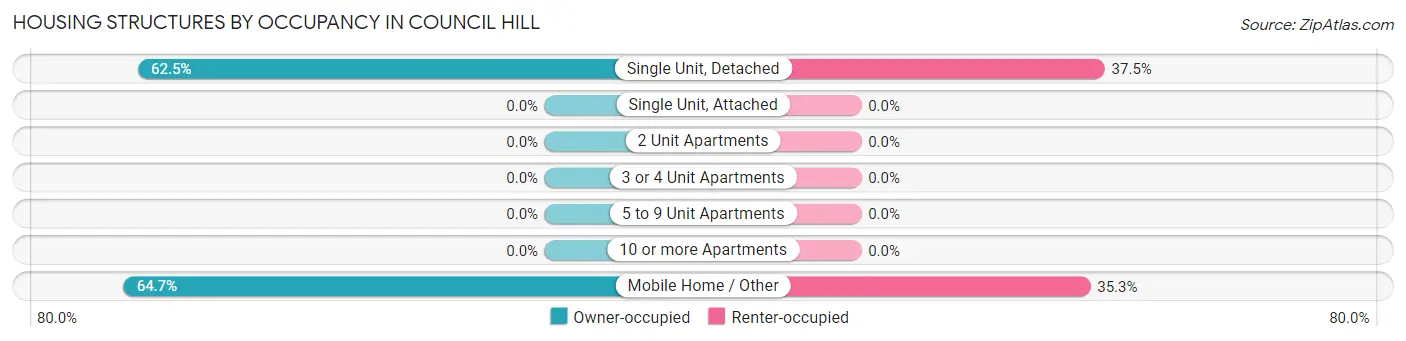
| Structure Type | Owner-occupied | Renter-occupied |
| Single Unit, Detached | 10 (62.5%) | 6 (37.5%) |
| Single Unit, Attached | 0 (0.0%) | 0 (0.0%) |
| 2 Unit Apartments | 0 (0.0%) | 0 (0.0%) |
| 3 or 4 Unit Apartments | 0 (0.0%) | 0 (0.0%) |
| 5 to 9 Unit Apartments | 0 (0.0%) | 0 (0.0%) |
| 10 or more Apartments | 0 (0.0%) | 0 (0.0%) |
| Mobile Home / Other | 11 (64.7%) | 6 (35.3%) |
| Total | 21 (63.6%) | 12 (36.4%) |
Housing Structures by Number of Rooms in Council Hill
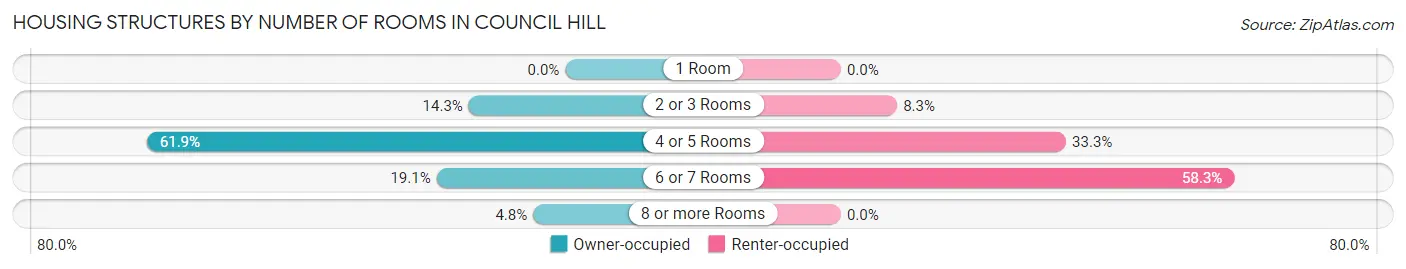
| Number of Rooms | Owner-occupied | Renter-occupied |
| 1 Room | 0 (0.0%) | 0 (0.0%) |
| 2 or 3 Rooms | 3 (14.3%) | 1 (8.3%) |
| 4 or 5 Rooms | 13 (61.9%) | 4 (33.3%) |
| 6 or 7 Rooms | 4 (19.1%) | 7 (58.3%) |
| 8 or more Rooms | 1 (4.8%) | 0 (0.0%) |
| Total | 21 (100.0%) | 12 (100.0%) |
Housing Structure by Heating Type in Council Hill
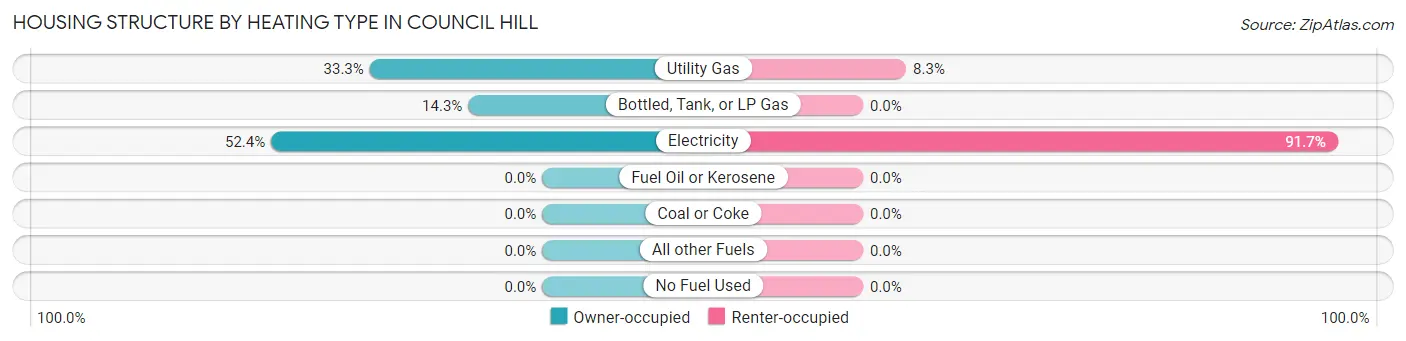
| Heating Type | Owner-occupied | Renter-occupied |
| Utility Gas | 7 (33.3%) | 1 (8.3%) |
| Bottled, Tank, or LP Gas | 3 (14.3%) | 0 (0.0%) |
| Electricity | 11 (52.4%) | 11 (91.7%) |
| Fuel Oil or Kerosene | 0 (0.0%) | 0 (0.0%) |
| Coal or Coke | 0 (0.0%) | 0 (0.0%) |
| All other Fuels | 0 (0.0%) | 0 (0.0%) |
| No Fuel Used | 0 (0.0%) | 0 (0.0%) |
| Total | 21 (100.0%) | 12 (100.0%) |
Household Vehicle Usage in Council Hill
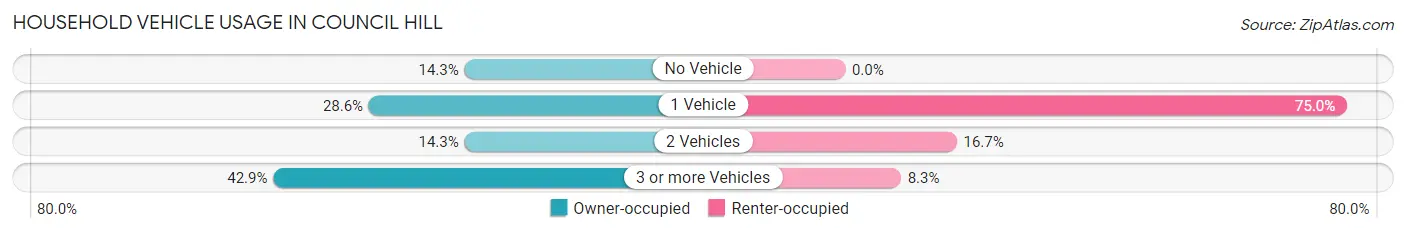
| Vehicles per Household | Owner-occupied | Renter-occupied |
| No Vehicle | 3 (14.3%) | 0 (0.0%) |
| 1 Vehicle | 6 (28.6%) | 9 (75.0%) |
| 2 Vehicles | 3 (14.3%) | 2 (16.7%) |
| 3 or more Vehicles | 9 (42.9%) | 1 (8.3%) |
| Total | 21 (100.0%) | 12 (100.0%) |
Real Estate & Mortgages in Council Hill
Real Estate and Mortgage Overview in Council Hill
| Characteristic | Without Mortgage | With Mortgage |
| Housing Units | 8 | 13 |
| Median Property Value | - | - |
| Median Household Income | - | - |
| Monthly Housing Costs | $375 | $0 |
| Real Estate Taxes | $250 | $2 |
Property Value by Mortgage Status in Council Hill
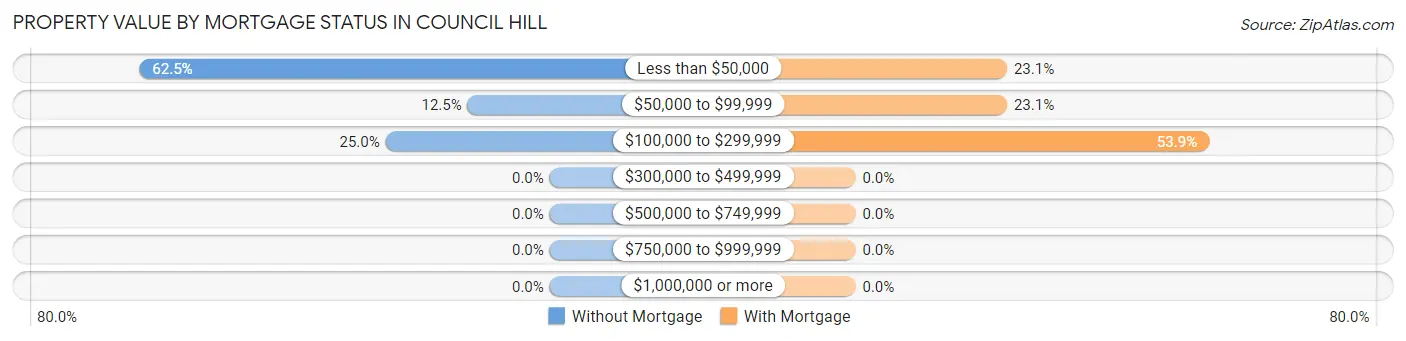
| Property Value | Without Mortgage | With Mortgage |
| Less than $50,000 | 5 (62.5%) | 3 (23.1%) |
| $50,000 to $99,999 | 1 (12.5%) | 3 (23.1%) |
| $100,000 to $299,999 | 2 (25.0%) | 7 (53.8%) |
| $300,000 to $499,999 | 0 (0.0%) | 0 (0.0%) |
| $500,000 to $749,999 | 0 (0.0%) | 0 (0.0%) |
| $750,000 to $999,999 | 0 (0.0%) | 0 (0.0%) |
| $1,000,000 or more | 0 (0.0%) | 0 (0.0%) |
| Total | 8 (100.0%) | 13 (100.0%) |
Household Income by Mortgage Status in Council Hill
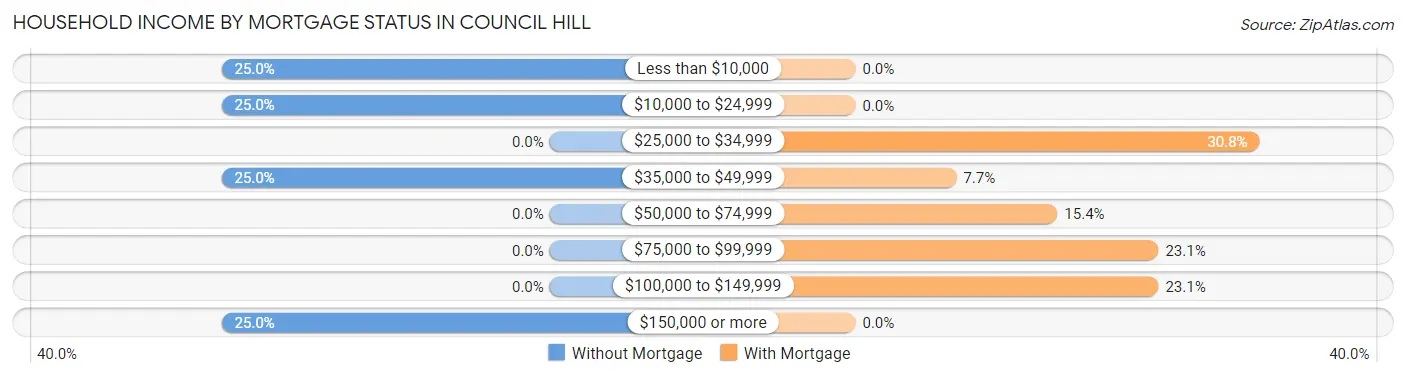
| Household Income | Without Mortgage | With Mortgage |
| Less than $10,000 | 2 (25.0%) | 0 (0.0%) |
| $10,000 to $24,999 | 2 (25.0%) | 0 (0.0%) |
| $25,000 to $34,999 | 0 (0.0%) | 4 (30.8%) |
| $35,000 to $49,999 | 2 (25.0%) | 1 (7.7%) |
| $50,000 to $74,999 | 0 (0.0%) | 2 (15.4%) |
| $75,000 to $99,999 | 0 (0.0%) | 3 (23.1%) |
| $100,000 to $149,999 | 0 (0.0%) | 3 (23.1%) |
| $150,000 or more | 2 (25.0%) | 0 (0.0%) |
| Total | 8 (100.0%) | 13 (100.0%) |
Property Value to Household Income Ratio in Council Hill
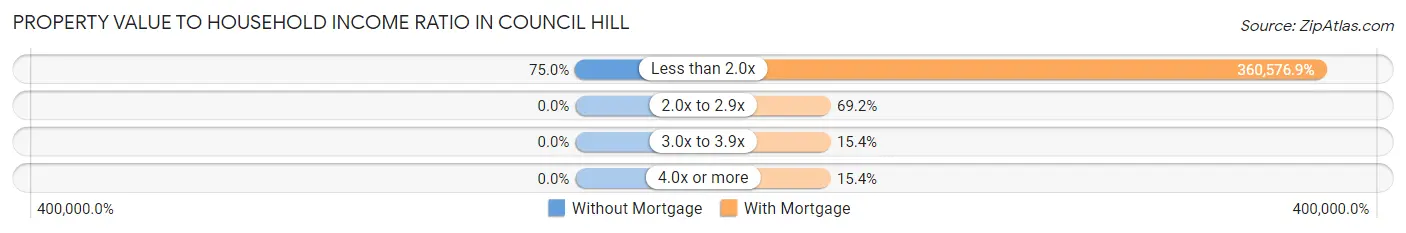
| Value-to-Income Ratio | Without Mortgage | With Mortgage |
| Less than 2.0x | 6 (75.0%) | 46,875 (360,576.9%) |
| 2.0x to 2.9x | 0 (0.0%) | 9 (69.2%) |
| 3.0x to 3.9x | 0 (0.0%) | 2 (15.4%) |
| 4.0x or more | 0 (0.0%) | 2 (15.4%) |
| Total | 8 (100.0%) | 13 (100.0%) |
Real Estate Taxes by Mortgage Status in Council Hill
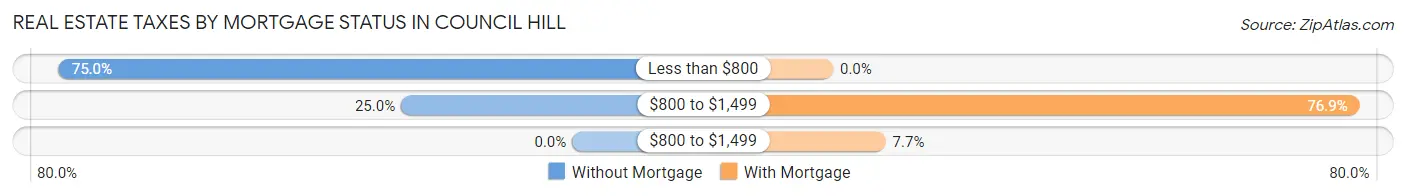
| Property Taxes | Without Mortgage | With Mortgage |
| Less than $800 | 6 (75.0%) | 0 (0.0%) |
| $800 to $1,499 | 2 (25.0%) | 10 (76.9%) |
| $800 to $1,499 | 0 (0.0%) | 1 (7.7%) |
| Total | 8 (100.0%) | 13 (100.0%) |
Health & Disability in Council Hill
Health Insurance Coverage by Age in Council Hill
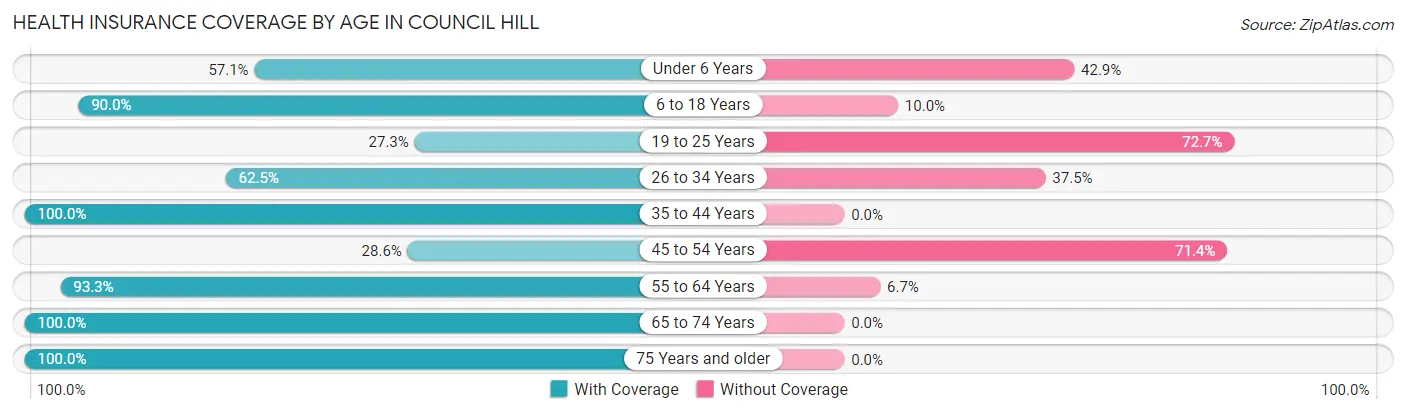
| Age Bracket | With Coverage | Without Coverage |
| Under 6 Years | 8 (57.1%) | 6 (42.9%) |
| 6 to 18 Years | 18 (90.0%) | 2 (10.0%) |
| 19 to 25 Years | 3 (27.3%) | 8 (72.7%) |
| 26 to 34 Years | 5 (62.5%) | 3 (37.5%) |
| 35 to 44 Years | 2 (100.0%) | 0 (0.0%) |
| 45 to 54 Years | 2 (28.6%) | 5 (71.4%) |
| 55 to 64 Years | 14 (93.3%) | 1 (6.7%) |
| 65 to 74 Years | 5 (100.0%) | 0 (0.0%) |
| 75 Years and older | 6 (100.0%) | 0 (0.0%) |
| Total | 63 (71.6%) | 25 (28.4%) |
Health Insurance Coverage by Citizenship Status in Council Hill
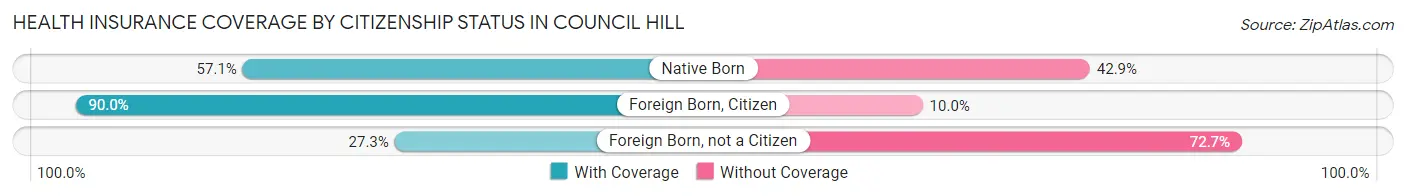
| Citizenship Status | With Coverage | Without Coverage |
| Native Born | 8 (57.1%) | 6 (42.9%) |
| Foreign Born, Citizen | 18 (90.0%) | 2 (10.0%) |
| Foreign Born, not a Citizen | 3 (27.3%) | 8 (72.7%) |
Health Insurance Coverage by Household Income in Council Hill
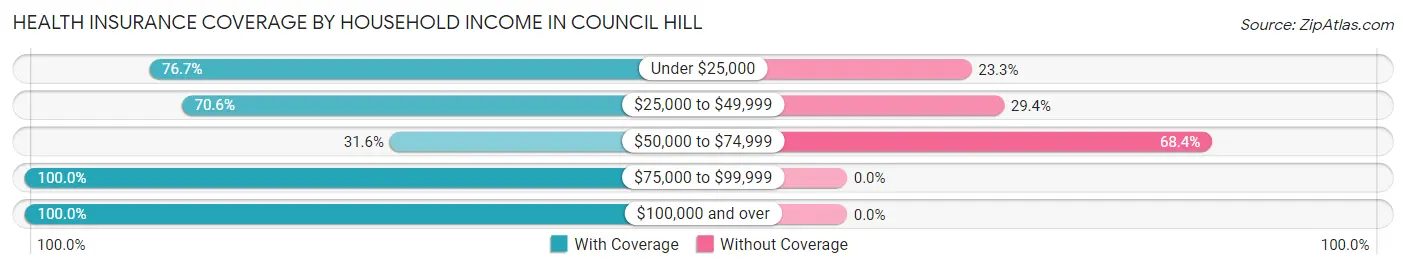
| Household Income | With Coverage | Without Coverage |
| Under $25,000 | 23 (76.7%) | 7 (23.3%) |
| $25,000 to $49,999 | 12 (70.6%) | 5 (29.4%) |
| $50,000 to $74,999 | 6 (31.6%) | 13 (68.4%) |
| $75,000 to $99,999 | 15 (100.0%) | 0 (0.0%) |
| $100,000 and over | 7 (100.0%) | 0 (0.0%) |
Public vs Private Health Insurance Coverage by Age in Council Hill
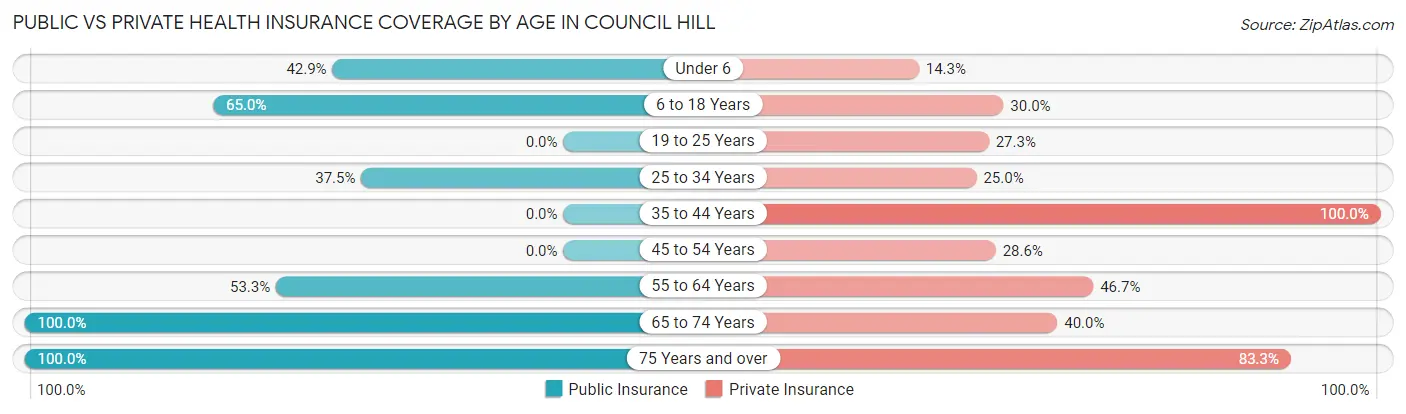
| Age Bracket | Public Insurance | Private Insurance |
| Under 6 | 6 (42.9%) | 2 (14.3%) |
| 6 to 18 Years | 13 (65.0%) | 6 (30.0%) |
| 19 to 25 Years | 0 (0.0%) | 3 (27.3%) |
| 25 to 34 Years | 3 (37.5%) | 2 (25.0%) |
| 35 to 44 Years | 0 (0.0%) | 2 (100.0%) |
| 45 to 54 Years | 0 (0.0%) | 2 (28.6%) |
| 55 to 64 Years | 8 (53.3%) | 7 (46.7%) |
| 65 to 74 Years | 5 (100.0%) | 2 (40.0%) |
| 75 Years and over | 6 (100.0%) | 5 (83.3%) |
| Total | 41 (46.6%) | 31 (35.2%) |
Disability Status by Sex by Age in Council Hill
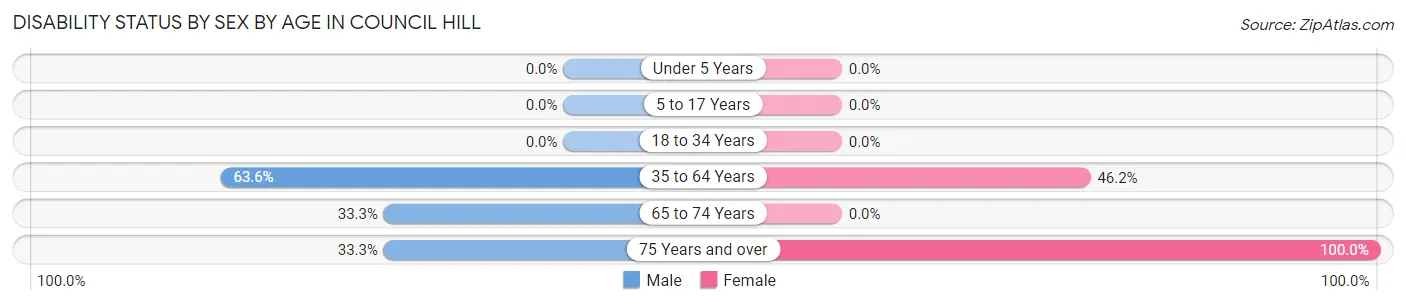
| Age Bracket | Male | Female |
| Under 5 Years | 0 (0.0%) | 0 (0.0%) |
| 5 to 17 Years | 0 (0.0%) | 0 (0.0%) |
| 18 to 34 Years | 0 (0.0%) | 0 (0.0%) |
| 35 to 64 Years | 7 (63.6%) | 6 (46.2%) |
| 65 to 74 Years | 1 (33.3%) | 0 (0.0%) |
| 75 Years and over | 1 (33.3%) | 3 (100.0%) |
Disability Class by Sex by Age in Council Hill
Disability Class: Hearing Difficulty
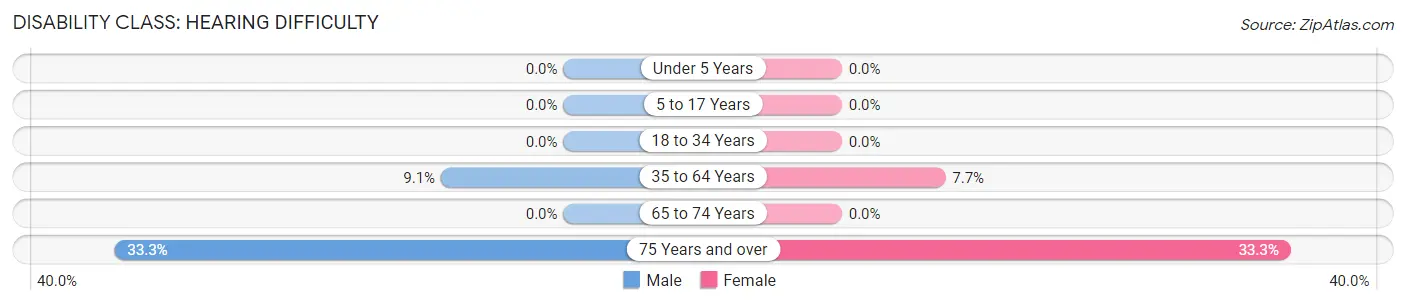
| Age Bracket | Male | Female |
| Under 5 Years | 0 (0.0%) | 0 (0.0%) |
| 5 to 17 Years | 0 (0.0%) | 0 (0.0%) |
| 18 to 34 Years | 0 (0.0%) | 0 (0.0%) |
| 35 to 64 Years | 1 (9.1%) | 1 (7.7%) |
| 65 to 74 Years | 0 (0.0%) | 0 (0.0%) |
| 75 Years and over | 1 (33.3%) | 1 (33.3%) |
Disability Class: Vision Difficulty
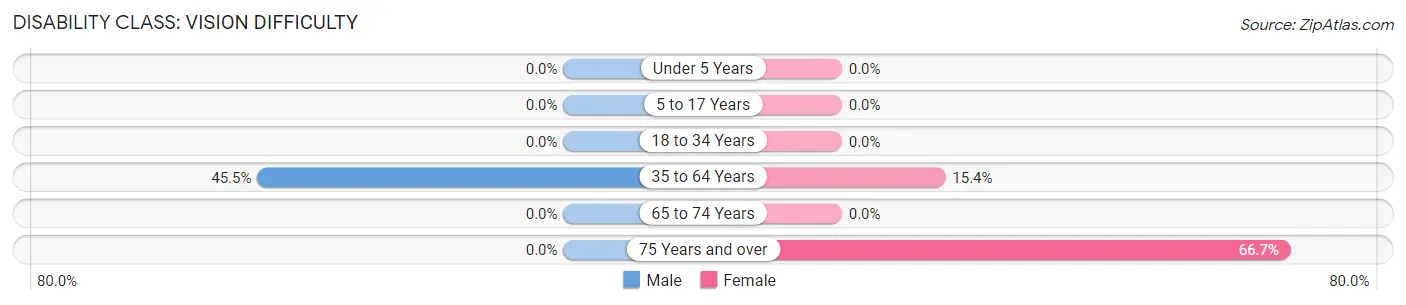
| Age Bracket | Male | Female |
| Under 5 Years | 0 (0.0%) | 0 (0.0%) |
| 5 to 17 Years | 0 (0.0%) | 0 (0.0%) |
| 18 to 34 Years | 0 (0.0%) | 0 (0.0%) |
| 35 to 64 Years | 5 (45.5%) | 2 (15.4%) |
| 65 to 74 Years | 0 (0.0%) | 0 (0.0%) |
| 75 Years and over | 0 (0.0%) | 2 (66.7%) |
Disability Class: Cognitive Difficulty
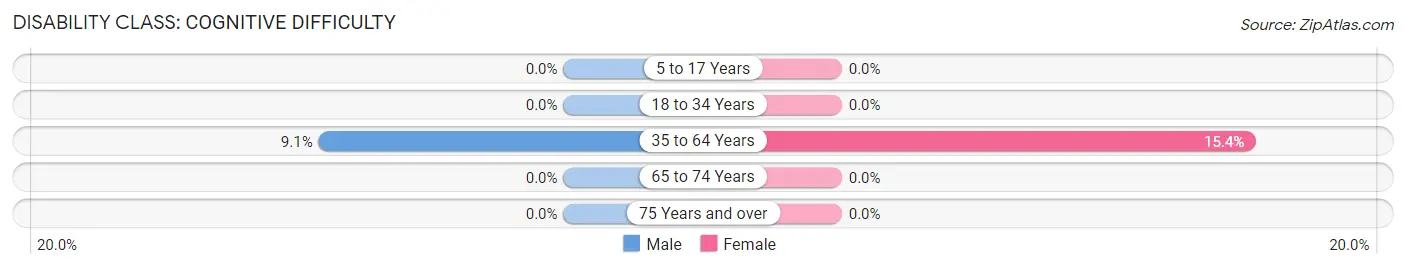
| Age Bracket | Male | Female |
| 5 to 17 Years | 0 (0.0%) | 0 (0.0%) |
| 18 to 34 Years | 0 (0.0%) | 0 (0.0%) |
| 35 to 64 Years | 1 (9.1%) | 2 (15.4%) |
| 65 to 74 Years | 0 (0.0%) | 0 (0.0%) |
| 75 Years and over | 0 (0.0%) | 0 (0.0%) |
Disability Class: Ambulatory Difficulty
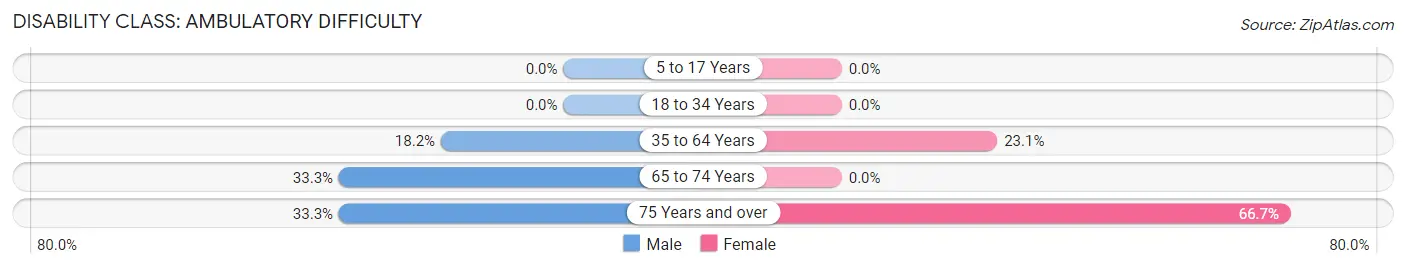
| Age Bracket | Male | Female |
| 5 to 17 Years | 0 (0.0%) | 0 (0.0%) |
| 18 to 34 Years | 0 (0.0%) | 0 (0.0%) |
| 35 to 64 Years | 2 (18.2%) | 3 (23.1%) |
| 65 to 74 Years | 1 (33.3%) | 0 (0.0%) |
| 75 Years and over | 1 (33.3%) | 2 (66.7%) |
Disability Class: Self-Care Difficulty
| Age Bracket | Male | Female |
| 5 to 17 Years | 0 (0.0%) | 0 (0.0%) |
| 18 to 34 Years | 0 (0.0%) | 0 (0.0%) |
| 35 to 64 Years | 0 (0.0%) | 0 (0.0%) |
| 65 to 74 Years | 1 (33.3%) | 0 (0.0%) |
| 75 Years and over | 0 (0.0%) | 0 (0.0%) |
Technology Access in Council Hill
Computing Device Access in Council Hill
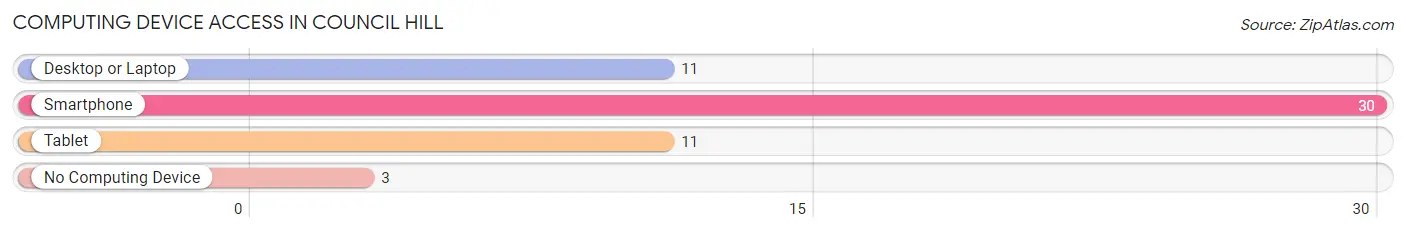
| Device Type | # Households | % Households |
| Desktop or Laptop | 11 | 33.3% |
| Smartphone | 30 | 90.9% |
| Tablet | 11 | 33.3% |
| No Computing Device | 3 | 9.1% |
| Total | 33 | 100.0% |
Internet Access in Council Hill
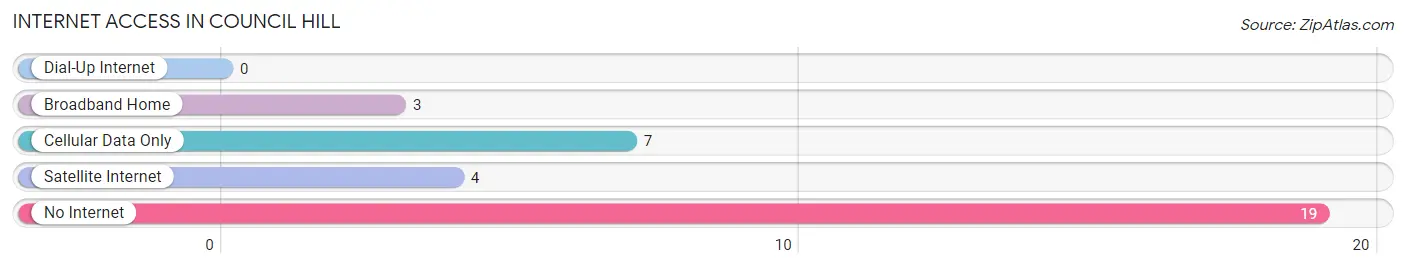
| Internet Type | # Households | % Households |
| Dial-Up Internet | 0 | 0.0% |
| Broadband Home | 3 | 9.1% |
| Cellular Data Only | 7 | 21.2% |
| Satellite Internet | 4 | 12.1% |
| No Internet | 19 | 57.6% |
| Total | 33 | 100.0% |
Council Hill Summary
Introduction
Located in the northeastern corner of Oklahoma, Council Hill is a small unincorporated community in Muskogee County. It is situated on the banks of the Arkansas River, and is home to a population of just over 200 people. The town is known for its rich history, which dates back to the early 1800s when it was first settled by the Creek Nation. The town has a unique geography, with its location on the Arkansas River providing a variety of recreational activities. The economy of Council Hill is largely based on agriculture, with the town being home to several farms and ranches. The demographics of the town are largely rural, with a majority of the population being of Native American descent.
History
Council Hill was first settled by the Creek Nation in the early 1800s. The town was originally known as “Creek Hill”, and was the site of a major council meeting between the Creek Nation and the United States government in 1832. The meeting was held in order to negotiate the terms of the Treaty of New Echota, which resulted in the removal of the Creek Nation from their ancestral lands in Georgia and Alabama. The town was renamed “Council Hill” in 1836, and has remained so ever since.
The town was officially incorporated in 1891, and has remained a small, rural community ever since. The town was home to a variety of businesses, including a general store, a blacksmith shop, and a cotton gin. The town also had a post office, which operated from 1891 until it was closed in the early 2000s.
Geography
Council Hill is located in the northeastern corner of Oklahoma, in Muskogee County. The town is situated on the banks of the Arkansas River, and is surrounded by rolling hills and wooded areas. The town is located approximately 25 miles south of Tulsa, and is accessible via State Highway 16.
The town has a total area of 0.6 square miles, all of which is land. The town has a humid subtropical climate, with hot summers and mild winters. The average annual temperature is around 65 degrees Fahrenheit, and the average annual precipitation is around 40 inches.
Economy
The economy of Council Hill is largely based on agriculture. The town is home to several farms and ranches, which produce a variety of crops, including corn, soybeans, and wheat. The town is also home to a number of small businesses, including a general store, a gas station, and a restaurant.
Demographics
As of the 2010 census, the population of Council Hill was 203. The town has a population that is largely rural, with a majority of the population being of Native American descent. The median household income in the town is $30,000, and the median age is 40. The town has a poverty rate of 22.5%, and the unemployment rate is 8.2%.
Conclusion
Council Hill is a small, rural community located in the northeastern corner of Oklahoma. The town has a rich history, dating back to the early 1800s when it was first settled by the Creek Nation. The town has a unique geography, with its location on the Arkansas River providing a variety of recreational activities. The economy of Council Hill is largely based on agriculture, with the town being home to several farms and ranches. The demographics of the town are largely rural, with a majority of the population being of Native American descent.
Common Questions
What is Per Capita Income in Council Hill?
Per Capita income in Council Hill is $18,980.
What is the Median Family Income in Council Hill?
Median Family Income in Council Hill is $47,188.
What is the Median Household income in Council Hill?
Median Household Income in Council Hill is $31,875.
What is Income or Wage Gap in Council Hill?
Income or Wage Gap in Council Hill is 11.6%.
Women in Council Hill earn 88.4 cents for every dollar earned by a man.
What is Inequality or Gini Index in Council Hill?
Inequality or Gini Index in Council Hill is 0.51.
What is the Total Population of Council Hill?
Total Population of Council Hill is 88.
What is the Total Male Population of Council Hill?
Total Male Population of Council Hill is 47.
What is the Total Female Population of Council Hill?
Total Female Population of Council Hill is 41.
What is the Ratio of Males per 100 Females in Council Hill?
There are 114.63 Males per 100 Females in Council Hill.
What is the Ratio of Females per 100 Males in Council Hill?
There are 87.23 Females per 100 Males in Council Hill.
What is the Median Population Age in Council Hill?
Median Population Age in Council Hill is 25.7 Years.
What is the Average Family Size in Council Hill
Average Family Size in Council Hill is 3.2 People.
What is the Average Household Size in Council Hill
Average Household Size in Council Hill is 2.7 People.
How Large is the Labor Force in Council Hill?
There are 34 People in the Labor Forcein in Council Hill.
What is the Percentage of People in the Labor Force in Council Hill?
57.6% of People are in the Labor Force in Council Hill.
What is the Unemployment Rate in Council Hill?
Unemployment Rate in Council Hill is 11.8%.