Colcord, OK Map & Demographics
Colcord Map
Colcord Overview
$17,679
PER CAPITA INCOME
$30,917
AVG FAMILY INCOME
$29,792
AVG HOUSEHOLD INCOME
59.9%
WAGE / INCOME GAP [ % ]
40.1¢/ $1
WAGE / INCOME GAP [ $ ]
0.40
INEQUALITY / GINI INDEX
827
TOTAL POPULATION
382
MALE POPULATION
445
FEMALE POPULATION
85.84
MALES / 100 FEMALES
116.49
FEMALES / 100 MALES
40.2
MEDIAN AGE
3.0
AVG FAMILY SIZE
2.6
AVG HOUSEHOLD SIZE
344
LABOR FORCE [ PEOPLE ]
51.5%
PERCENT IN LABOR FORCE
7.6%
UNEMPLOYMENT RATE
Colcord Zip Codes
Colcord Area Codes
Income in Colcord
Income Overview in Colcord
Per Capita Income in Colcord is $17,679, while median incomes of families and households are $30,917 and $29,792 respectively.
| Characteristic | Number | Measure |
| Per Capita Income | 827 | $17,679 |
| Median Family Income | 227 | $30,917 |
| Mean Family Income | 227 | $46,597 |
| Median Household Income | 322 | $29,792 |
| Mean Household Income | 322 | $43,721 |
| Income Deficit | 227 | $0 |
| Wage / Income Gap (%) | 827 | 59.93% |
| Wage / Income Gap ($) | 827 | 40.07¢ per $1 |
| Gini / Inequality Index | 827 | 0.40 |
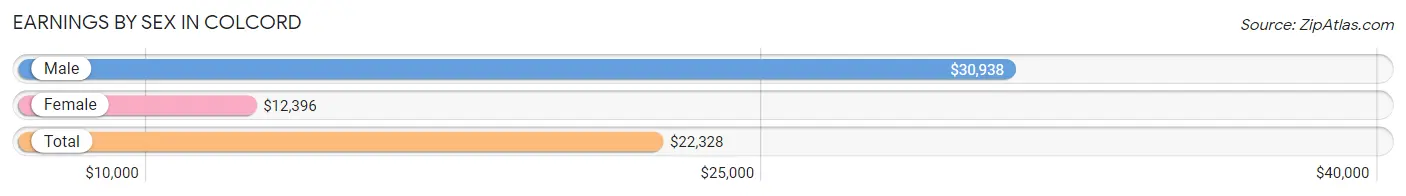
Earnings by Sex in Colcord
Average Earnings in Colcord are $22,328, $30,938 for men and $12,396 for women, a difference of 59.9%.
| Sex | Number | Average Earnings |
| Male | 181 (46.2%) | $30,938 |
| Female | 211 (53.8%) | $12,396 |
| Total | 392 (100.0%) | $22,328 |
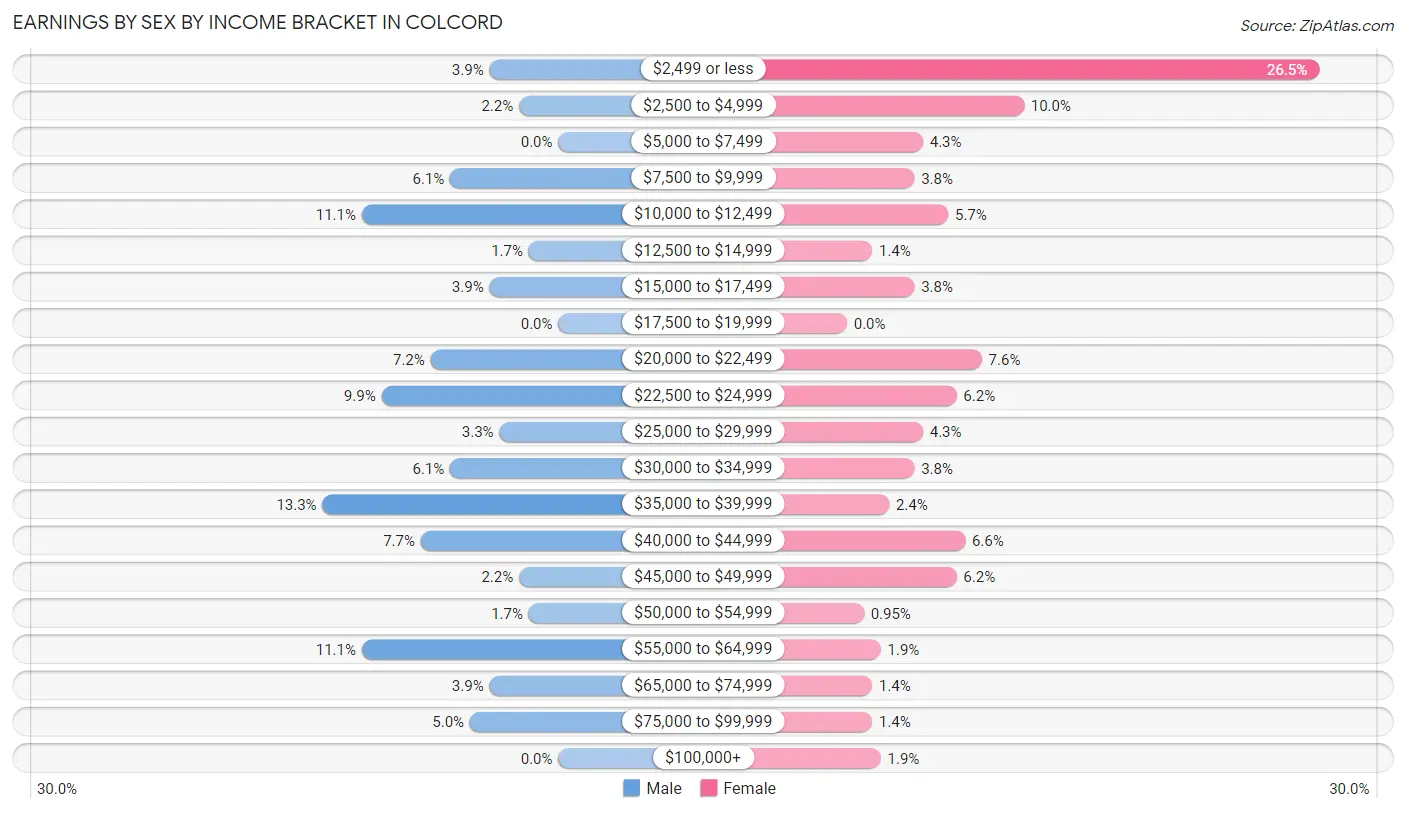
Earnings by Sex by Income Bracket in Colcord
The most common earnings brackets in Colcord are $35,000 to $39,999 for men (24 | 13.3%) and $2,499 or less for women (56 | 26.5%).
| Income | Male | Female |
| $2,499 or less | 7 (3.9%) | 56 (26.5%) |
| $2,500 to $4,999 | 4 (2.2%) | 21 (10.0%) |
| $5,000 to $7,499 | 0 (0.0%) | 9 (4.3%) |
| $7,500 to $9,999 | 11 (6.1%) | 8 (3.8%) |
| $10,000 to $12,499 | 20 (11.1%) | 12 (5.7%) |
| $12,500 to $14,999 | 3 (1.7%) | 3 (1.4%) |
| $15,000 to $17,499 | 7 (3.9%) | 8 (3.8%) |
| $17,500 to $19,999 | 0 (0.0%) | 0 (0.0%) |
| $20,000 to $22,499 | 13 (7.2%) | 16 (7.6%) |
| $22,500 to $24,999 | 18 (9.9%) | 13 (6.2%) |
| $25,000 to $29,999 | 6 (3.3%) | 9 (4.3%) |
| $30,000 to $34,999 | 11 (6.1%) | 8 (3.8%) |
| $35,000 to $39,999 | 24 (13.3%) | 5 (2.4%) |
| $40,000 to $44,999 | 14 (7.7%) | 14 (6.6%) |
| $45,000 to $49,999 | 4 (2.2%) | 13 (6.2%) |
| $50,000 to $54,999 | 3 (1.7%) | 2 (0.9%) |
| $55,000 to $64,999 | 20 (11.1%) | 4 (1.9%) |
| $65,000 to $74,999 | 7 (3.9%) | 3 (1.4%) |
| $75,000 to $99,999 | 9 (5.0%) | 3 (1.4%) |
| $100,000+ | 0 (0.0%) | 4 (1.9%) |
| Total | 181 (100.0%) | 211 (100.0%) |
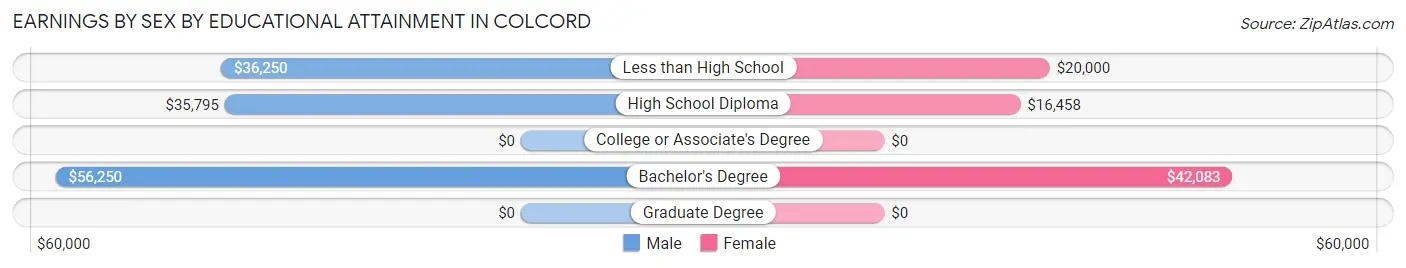
Earnings by Sex by Educational Attainment in Colcord
Average earnings in Colcord are $36,477 for men and $17,344 for women, a difference of 52.4%. Men with an educational attainment of bachelor's degree enjoy the highest average annual earnings of $56,250, while those with high school diploma education earn the least with $35,795. Women with an educational attainment of bachelor's degree earn the most with the average annual earnings of $42,083, while those with high school diploma education have the smallest earnings of $16,458.
| Educational Attainment | Male Income | Female Income |
| Less than High School | $36,250 | $20,000 |
| High School Diploma | $35,795 | $16,458 |
| College or Associate's Degree | - | - |
| Bachelor's Degree | $56,250 | $42,083 |
| Graduate Degree | - | - |
| Total | $36,477 | $17,344 |
Family Income in Colcord
Family Income Brackets in Colcord
According to the Colcord family income data, there are 52 families falling into the $25,000 to $34,999 income range, which is the most common income bracket and makes up 22.9% of all families.
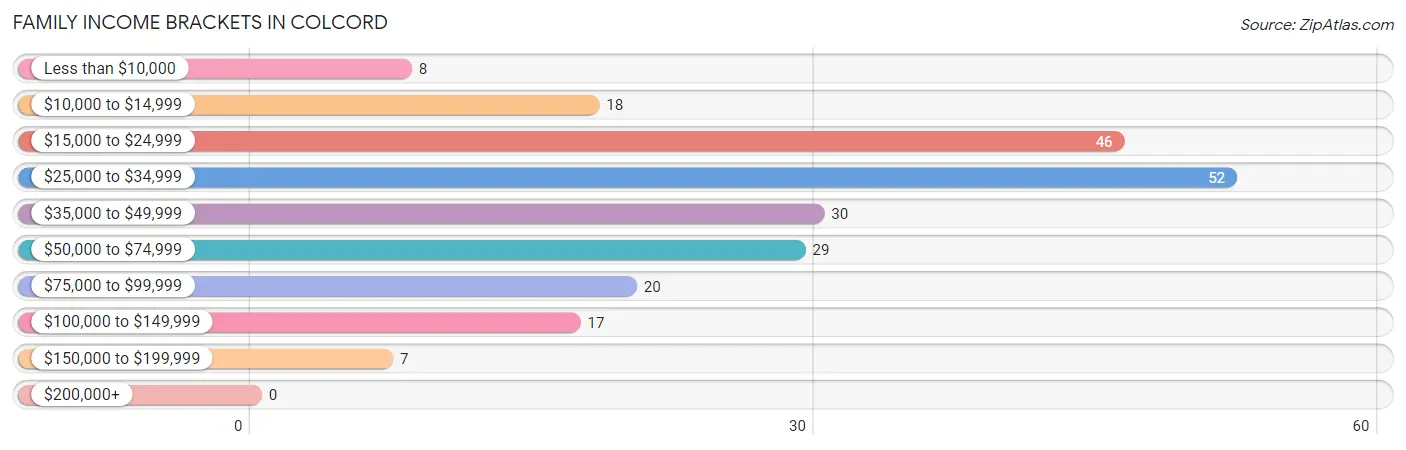
| Income Bracket | # Families | % Families |
| Less than $10,000 | 8 | 3.5% |
| $10,000 to $14,999 | 18 | 7.9% |
| $15,000 to $24,999 | 46 | 20.3% |
| $25,000 to $34,999 | 52 | 22.9% |
| $35,000 to $49,999 | 30 | 13.2% |
| $50,000 to $74,999 | 29 | 12.8% |
| $75,000 to $99,999 | 20 | 8.8% |
| $100,000 to $149,999 | 17 | 7.5% |
| $150,000 to $199,999 | 7 | 3.1% |
| $200,000+ | 0 | 0.0% |
Family Income by Famaliy Size in Colcord
4-person families (36 | 15.9%) account for the highest median family income in Colcord with $36,250 per family, while 2-person families (115 | 50.7%) have the highest median income of $13,642 per family member.
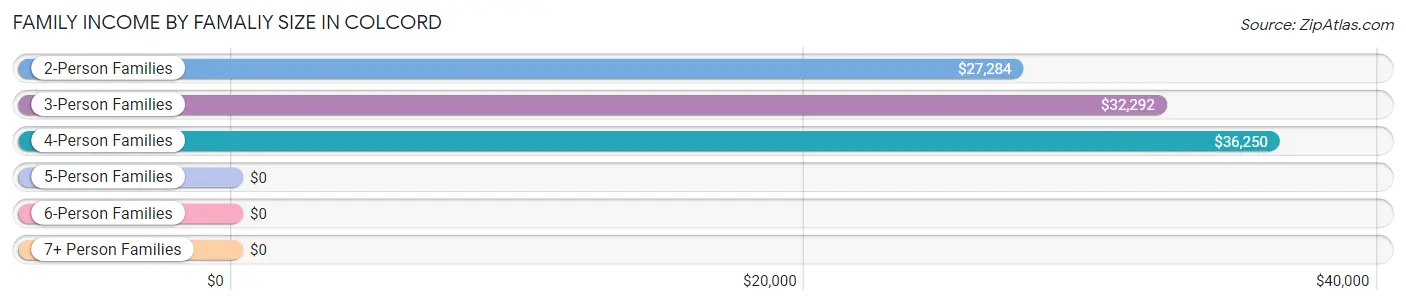
| Income Bracket | # Families | Median Income |
| 2-Person Families | 115 (50.7%) | $27,284 |
| 3-Person Families | 56 (24.7%) | $32,292 |
| 4-Person Families | 36 (15.9%) | $36,250 |
| 5-Person Families | 5 (2.2%) | $0 |
| 6-Person Families | 15 (6.6%) | $0 |
| 7+ Person Families | 0 (0.0%) | $0 |
| Total | 227 (100.0%) | $30,917 |
Family Income by Number of Earners in Colcord
The median family income in Colcord is $30,917, with families comprising 3+ earners (11) having the highest median family income of $102,917, while families with no earners (42) have the lowest median family income of $23,182, accounting for 4.9% and 18.5% of families, respectively.
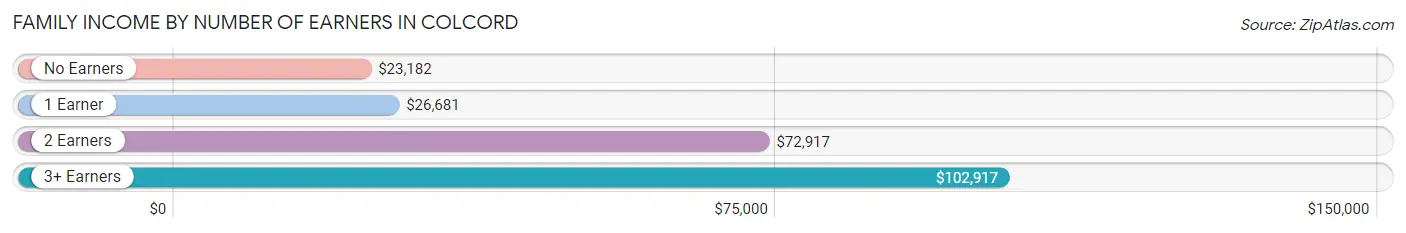
| Number of Earners | # Families | Median Income |
| No Earners | 42 (18.5%) | $23,182 |
| 1 Earner | 115 (50.7%) | $26,681 |
| 2 Earners | 59 (26.0%) | $72,917 |
| 3+ Earners | 11 (4.9%) | $102,917 |
| Total | 227 (100.0%) | $30,917 |
Household Income in Colcord
Household Income Brackets in Colcord
With 83 households falling in the category, the $25,000 to $34,999 income range is the most frequent in Colcord, accounting for 25.8% of all households. In contrast, only 3 households (0.9%) fall into the $150,000 to $199,999 income bracket, making it the least populous group.
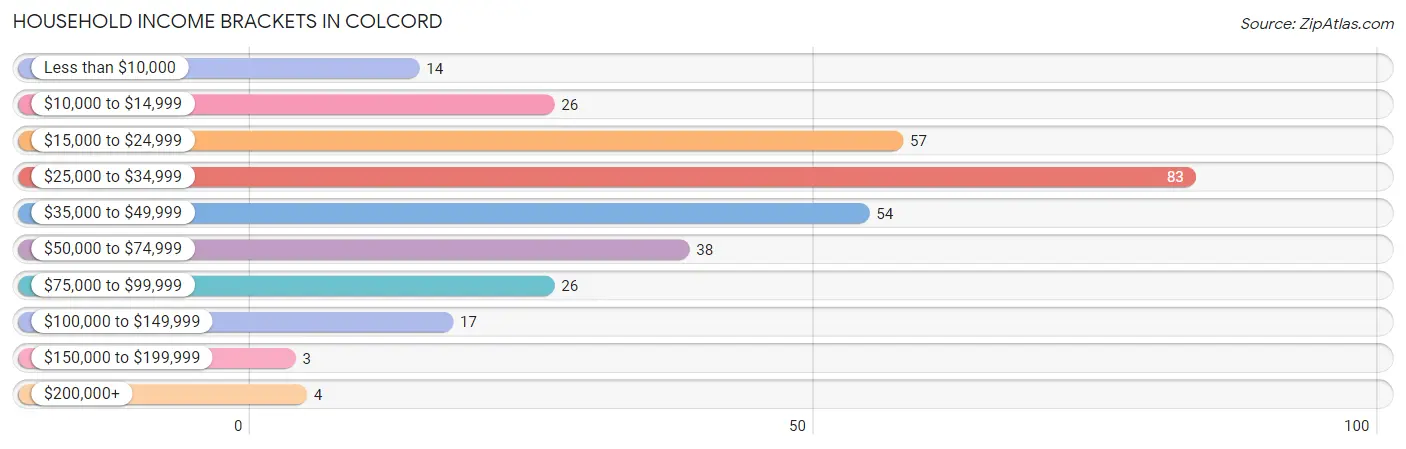
| Income Bracket | # Households | % Households |
| Less than $10,000 | 14 | 4.3% |
| $10,000 to $14,999 | 26 | 8.1% |
| $15,000 to $24,999 | 57 | 17.7% |
| $25,000 to $34,999 | 83 | 25.8% |
| $35,000 to $49,999 | 54 | 16.8% |
| $50,000 to $74,999 | 38 | 11.8% |
| $75,000 to $99,999 | 26 | 8.1% |
| $100,000 to $149,999 | 17 | 5.3% |
| $150,000 to $199,999 | 3 | 0.9% |
| $200,000+ | 4 | 1.2% |
Household Income by Householder Age in Colcord
The median household income in Colcord is $29,792, with the highest median household income of $42,750 found in the 25 to 44 years age bracket for the primary householder. A total of 102 households (31.7%) fall into this category. Meanwhile, the 15 to 24 years age bracket for the primary householder has the lowest median household income of $16,563, with 15 households (4.7%) in this group.
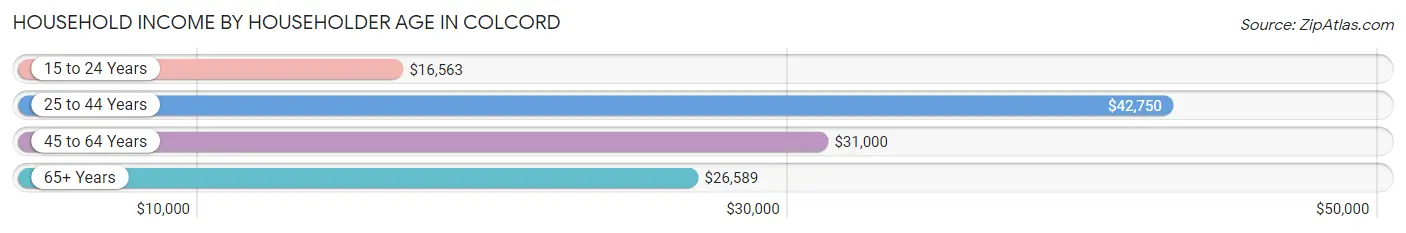
| Income Bracket | # Households | Median Income |
| 15 to 24 Years | 15 (4.7%) | $16,563 |
| 25 to 44 Years | 102 (31.7%) | $42,750 |
| 45 to 64 Years | 104 (32.3%) | $31,000 |
| 65+ Years | 101 (31.4%) | $26,589 |
| Total | 322 (100.0%) | $29,792 |
Poverty in Colcord
Income Below Poverty by Sex and Age in Colcord
With 29.7% poverty level for males and 32.4% for females among the residents of Colcord, under 5 year old males and under 5 year old females are the most vulnerable to poverty, with 15 males (78.9%) and 13 females (86.7%) in their respective age groups living below the poverty level.
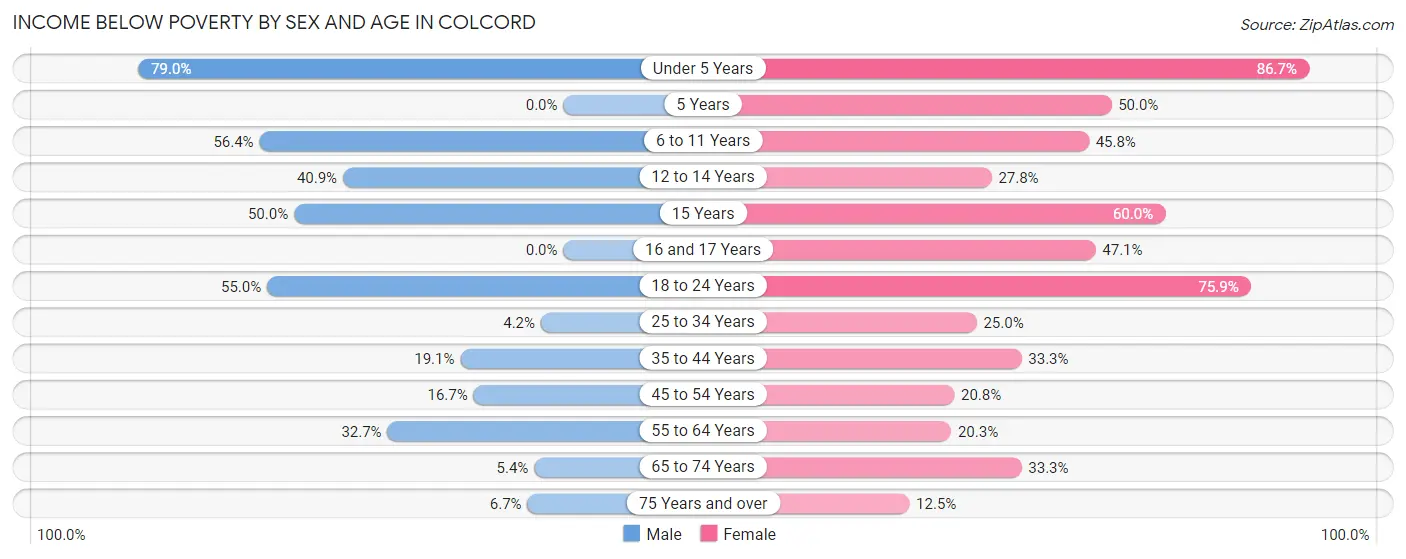
| Age Bracket | Male | Female |
| Under 5 Years | 15 (78.9%) | 13 (86.7%) |
| 5 Years | 0 (0.0%) | 3 (50.0%) |
| 6 to 11 Years | 22 (56.4%) | 11 (45.8%) |
| 12 to 14 Years | 9 (40.9%) | 5 (27.8%) |
| 15 Years | 3 (50.0%) | 3 (60.0%) |
| 16 and 17 Years | 0 (0.0%) | 8 (47.1%) |
| 18 to 24 Years | 22 (55.0%) | 22 (75.9%) |
| 25 to 34 Years | 1 (4.2%) | 17 (25.0%) |
| 35 to 44 Years | 13 (19.1%) | 19 (33.3%) |
| 45 to 54 Years | 9 (16.7%) | 10 (20.8%) |
| 55 to 64 Years | 16 (32.7%) | 15 (20.3%) |
| 65 to 74 Years | 2 (5.4%) | 11 (33.3%) |
| 75 Years and over | 1 (6.7%) | 6 (12.5%) |
| Total | 113 (29.7%) | 143 (32.4%) |
Income Above Poverty by Sex and Age in Colcord
According to the poverty statistics in Colcord, males aged 16 and 17 years and females aged 75 years and over are the age groups that are most secure financially, with 100.0% of males and 87.5% of females in these age groups living above the poverty line.
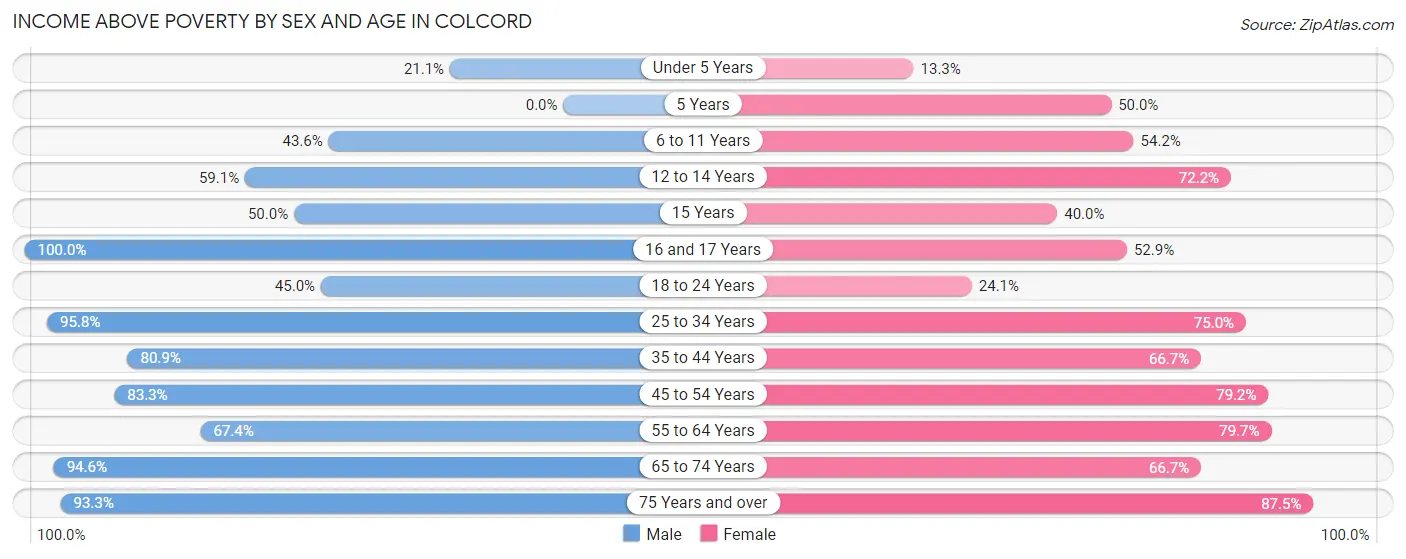
| Age Bracket | Male | Female |
| Under 5 Years | 4 (21.0%) | 2 (13.3%) |
| 5 Years | 0 (0.0%) | 3 (50.0%) |
| 6 to 11 Years | 17 (43.6%) | 13 (54.2%) |
| 12 to 14 Years | 13 (59.1%) | 13 (72.2%) |
| 15 Years | 3 (50.0%) | 2 (40.0%) |
| 16 and 17 Years | 7 (100.0%) | 9 (52.9%) |
| 18 to 24 Years | 18 (45.0%) | 7 (24.1%) |
| 25 to 34 Years | 23 (95.8%) | 51 (75.0%) |
| 35 to 44 Years | 55 (80.9%) | 38 (66.7%) |
| 45 to 54 Years | 45 (83.3%) | 38 (79.2%) |
| 55 to 64 Years | 33 (67.3%) | 59 (79.7%) |
| 65 to 74 Years | 35 (94.6%) | 22 (66.7%) |
| 75 Years and over | 14 (93.3%) | 42 (87.5%) |
| Total | 267 (70.3%) | 299 (67.6%) |
Income Below Poverty Among Married-Couple Families in Colcord
The poverty statistics for married-couple families in Colcord show that 17.9% or 22 of the total 123 families live below the poverty line. Families with 3 or 4 children have the highest poverty rate of 58.3%, comprising of 7 families. On the other hand, families with no children have the lowest poverty rate of 11.3%, which includes 9 families.
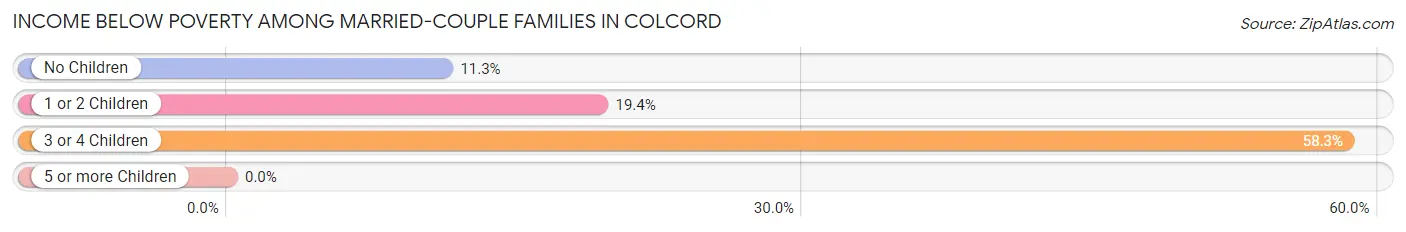
| Children | Above Poverty | Below Poverty |
| No Children | 71 (88.7%) | 9 (11.3%) |
| 1 or 2 Children | 25 (80.6%) | 6 (19.4%) |
| 3 or 4 Children | 5 (41.7%) | 7 (58.3%) |
| 5 or more Children | 0 (0.0%) | 0 (0.0%) |
| Total | 101 (82.1%) | 22 (17.9%) |
Income Below Poverty Among Single-Parent Households in Colcord
According to the poverty data in Colcord, 23.5% or 4 single-father households and 43.7% or 38 single-mother households are living below the poverty line. Among single-father households, those with no children have the highest poverty rate, with 4 households (36.4%) experiencing poverty. Likewise, among single-mother households, those with 5 or more children have the highest poverty rate, with 3 households (100.0%) falling below the poverty line.
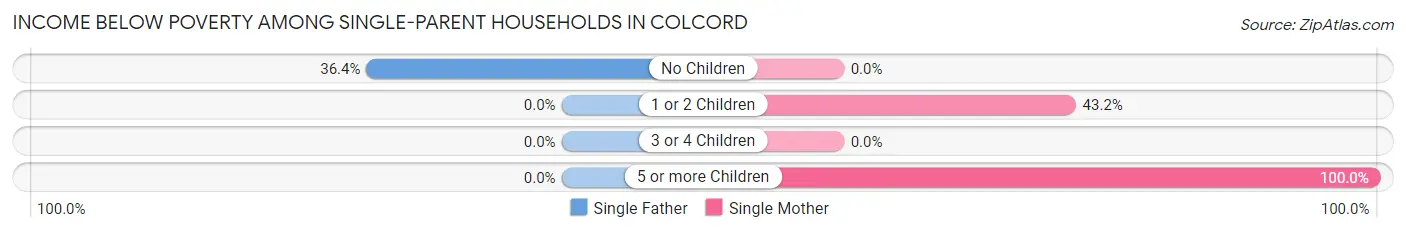
| Children | Single Father | Single Mother |
| No Children | 4 (36.4%) | 0 (0.0%) |
| 1 or 2 Children | 0 (0.0%) | 35 (43.2%) |
| 3 or 4 Children | 0 (0.0%) | 0 (0.0%) |
| 5 or more Children | 0 (0.0%) | 3 (100.0%) |
| Total | 4 (23.5%) | 38 (43.7%) |
Income Below Poverty Among Married-Couple vs Single-Parent Households in Colcord
The poverty data for Colcord shows that 22 of the married-couple family households (17.9%) and 42 of the single-parent households (40.4%) are living below the poverty level. Within the married-couple family households, those with 3 or 4 children have the highest poverty rate, with 7 households (58.3%) falling below the poverty line. Among the single-parent households, those with 5 or more children have the highest poverty rate, with 3 household (100.0%) living below poverty.
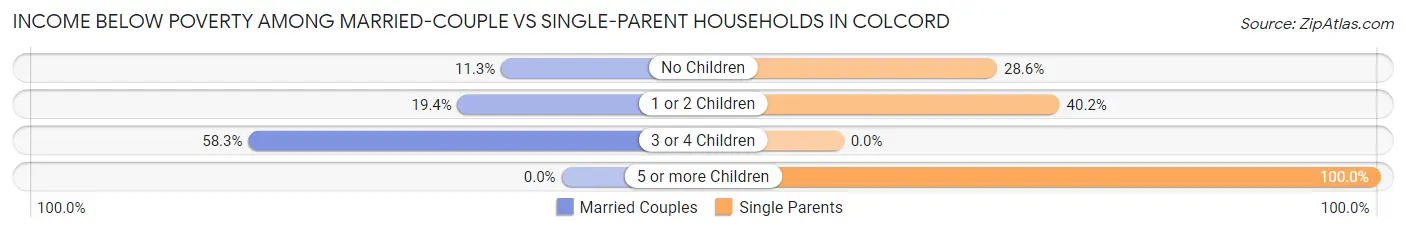
| Children | Married-Couple Families | Single-Parent Households |
| No Children | 9 (11.3%) | 4 (28.6%) |
| 1 or 2 Children | 6 (19.4%) | 35 (40.2%) |
| 3 or 4 Children | 7 (58.3%) | 0 (0.0%) |
| 5 or more Children | 0 (0.0%) | 3 (100.0%) |
| Total | 22 (17.9%) | 42 (40.4%) |
Race in Colcord
The most populous races in Colcord are White / Caucasian (472 | 57.1%), Native / Alaskan (204 | 24.7%), and Two or more Races (145 | 17.5%).
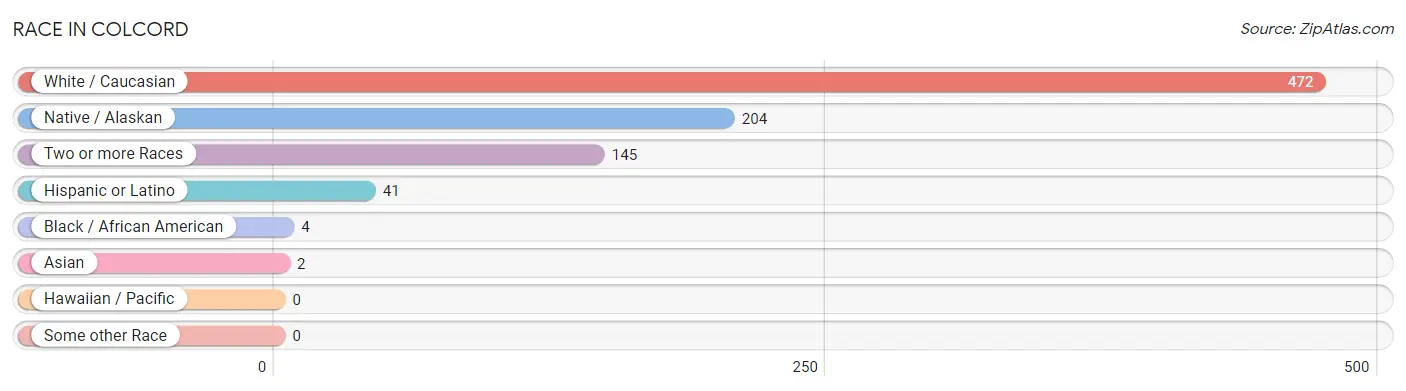
| Race | # Population | % Population |
| Asian | 2 | 0.2% |
| Black / African American | 4 | 0.5% |
| Hawaiian / Pacific | 0 | 0.0% |
| Hispanic or Latino | 41 | 5.0% |
| Native / Alaskan | 204 | 24.7% |
| White / Caucasian | 472 | 57.1% |
| Two or more Races | 145 | 17.5% |
| Some other Race | 0 | 0.0% |
| Total | 827 | 100.0% |
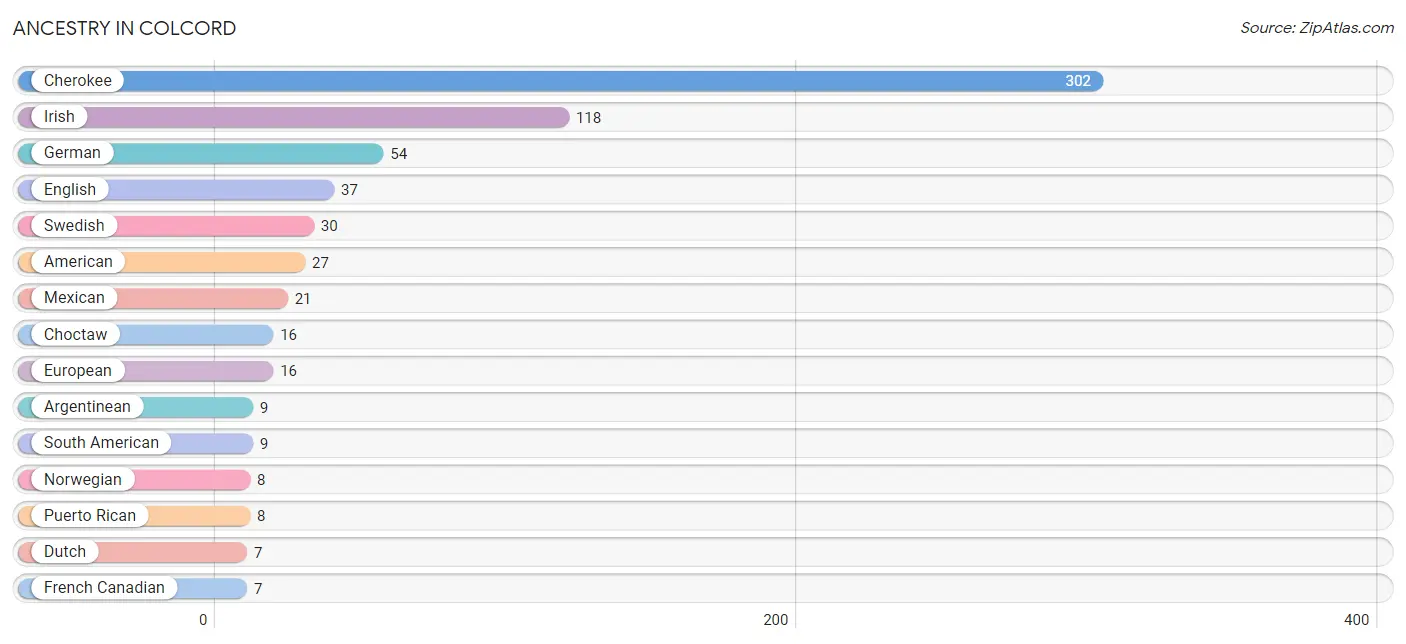
Ancestry in Colcord
The most populous ancestries reported in Colcord are Cherokee (302 | 36.5%), Irish (118 | 14.3%), German (54 | 6.5%), English (37 | 4.5%), and Swedish (30 | 3.6%), together accounting for 65.4% of all Colcord residents.
| Ancestry | # Population | % Population |
| American | 27 | 3.3% |
| Argentinean | 9 | 1.1% |
| Austrian | 6 | 0.7% |
| Bangladeshi | 2 | 0.2% |
| Central American | 3 | 0.4% |
| Cherokee | 302 | 36.5% |
| Choctaw | 16 | 1.9% |
| Creek | 5 | 0.6% |
| Dutch | 7 | 0.9% |
| Dutch West Indian | 3 | 0.4% |
| English | 37 | 4.5% |
| European | 16 | 1.9% |
| French Canadian | 7 | 0.9% |
| German | 54 | 6.5% |
| Honduran | 3 | 0.4% |
| Irish | 118 | 14.3% |
| Mexican | 21 | 2.5% |
| Native Hawaiian | 2 | 0.2% |
| Norwegian | 8 | 1.0% |
| Polish | 3 | 0.4% |
| Puerto Rican | 8 | 1.0% |
| Scotch-Irish | 2 | 0.2% |
| South American | 9 | 1.1% |
| Swedish | 30 | 3.6% |
| Welsh | 3 | 0.4% | View All 25 Rows |
Immigrants in Colcord
The most numerous immigrant groups reported in Colcord came from Central America (2 | 0.2%), Latin America (2 | 0.2%), Mexico (2 | 0.2%), Asia (1 | 0.1%), and South Eastern Asia (1 | 0.1%), together accounting for 1.0% of all Colcord residents.
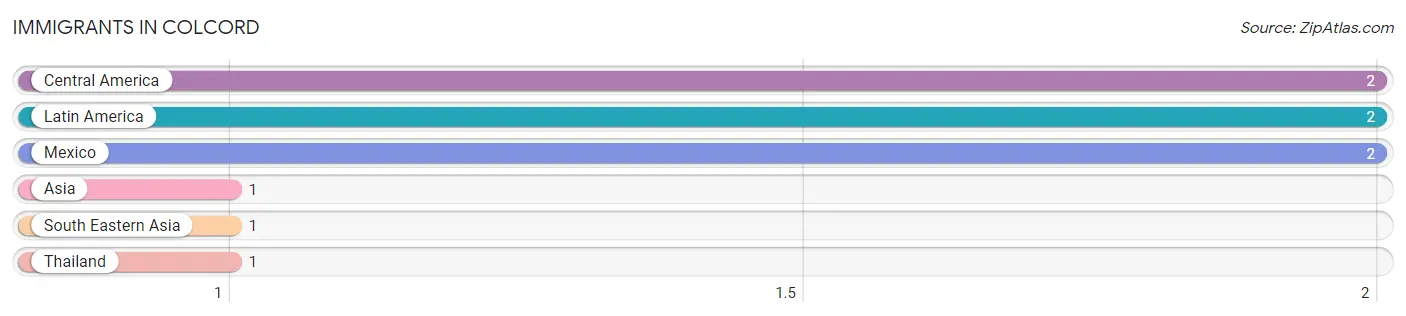
| Immigration Origin | # Population | % Population |
| Asia | 1 | 0.1% |
| Central America | 2 | 0.2% |
| Latin America | 2 | 0.2% |
| Mexico | 2 | 0.2% |
| South Eastern Asia | 1 | 0.1% |
| Thailand | 1 | 0.1% | View All 6 Rows |
Sex and Age in Colcord
Sex and Age in Colcord
The most populous age groups in Colcord are 40 to 44 Years (38 | 10.0%) for men and 60 to 64 Years (51 | 11.5%) for women.
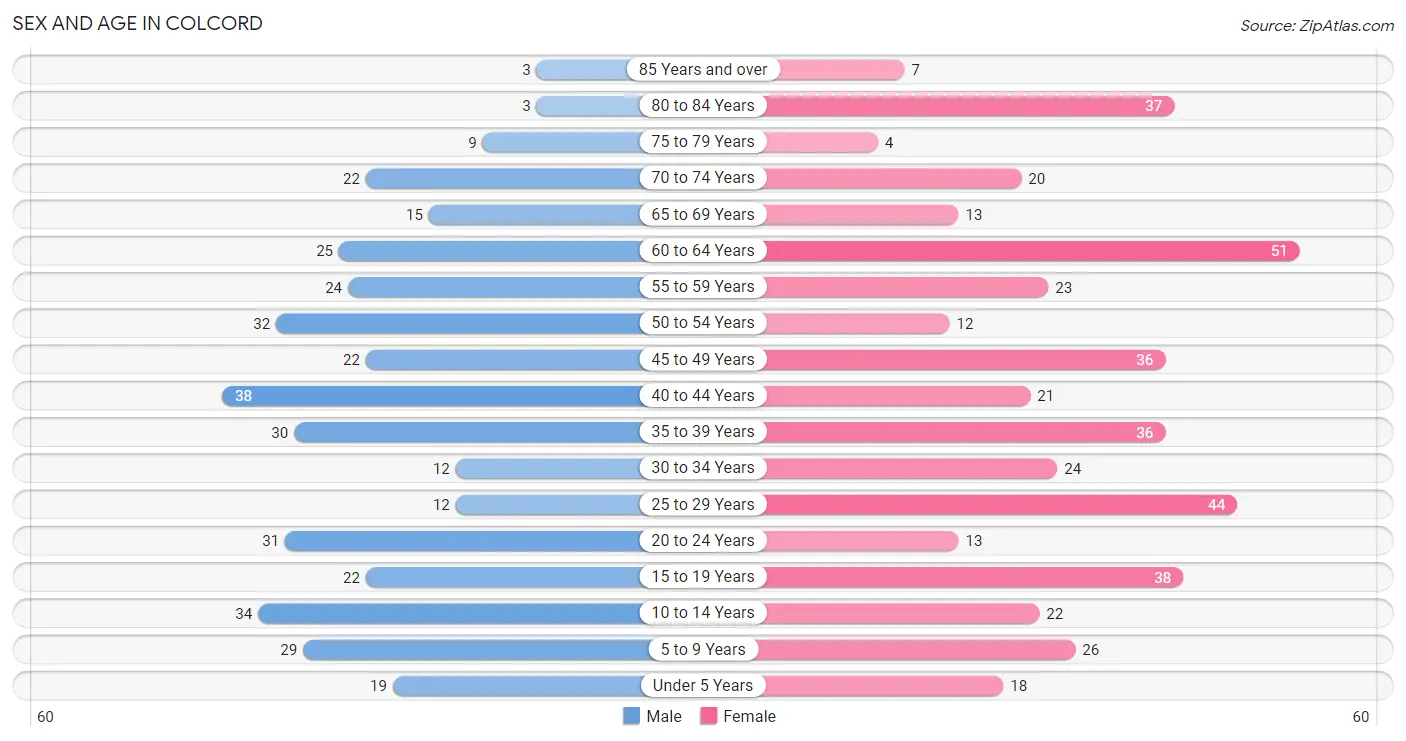
| Age Bracket | Male | Female |
| Under 5 Years | 19 (5.0%) | 18 (4.0%) |
| 5 to 9 Years | 29 (7.6%) | 26 (5.8%) |
| 10 to 14 Years | 34 (8.9%) | 22 (4.9%) |
| 15 to 19 Years | 22 (5.8%) | 38 (8.5%) |
| 20 to 24 Years | 31 (8.1%) | 13 (2.9%) |
| 25 to 29 Years | 12 (3.1%) | 44 (9.9%) |
| 30 to 34 Years | 12 (3.1%) | 24 (5.4%) |
| 35 to 39 Years | 30 (7.9%) | 36 (8.1%) |
| 40 to 44 Years | 38 (10.0%) | 21 (4.7%) |
| 45 to 49 Years | 22 (5.8%) | 36 (8.1%) |
| 50 to 54 Years | 32 (8.4%) | 12 (2.7%) |
| 55 to 59 Years | 24 (6.3%) | 23 (5.2%) |
| 60 to 64 Years | 25 (6.5%) | 51 (11.5%) |
| 65 to 69 Years | 15 (3.9%) | 13 (2.9%) |
| 70 to 74 Years | 22 (5.8%) | 20 (4.5%) |
| 75 to 79 Years | 9 (2.4%) | 4 (0.9%) |
| 80 to 84 Years | 3 (0.8%) | 37 (8.3%) |
| 85 Years and over | 3 (0.8%) | 7 (1.6%) |
| Total | 382 (100.0%) | 445 (100.0%) |
Families and Households in Colcord
Median Family Size in Colcord
The median family size in Colcord is 2.99 persons per family, with married-couple families (123 | 54.2%) accounting for the largest median family size of 3.36 persons per family. On the other hand, single female/mother families (87 | 38.3%) represent the smallest median family size with 2.40 persons per family.
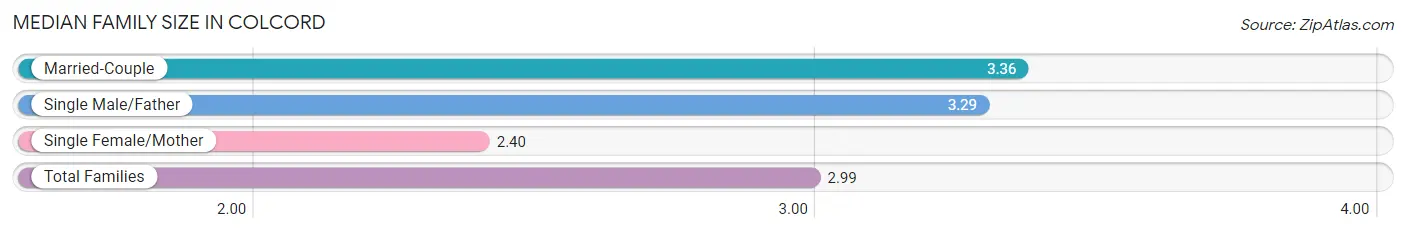
| Family Type | # Families | Family Size |
| Married-Couple | 123 (54.2%) | 3.36 |
| Single Male/Father | 17 (7.5%) | 3.29 |
| Single Female/Mother | 87 (38.3%) | 2.40 |
| Total Families | 227 (100.0%) | 2.99 |
Median Household Size in Colcord
The median household size in Colcord is 2.57 persons per household, with single male/father households (17 | 5.3%) accounting for the largest median household size of 3.59 persons per household. non-family households (95 | 29.5%) represent the smallest median household size with 1.19 persons per household.
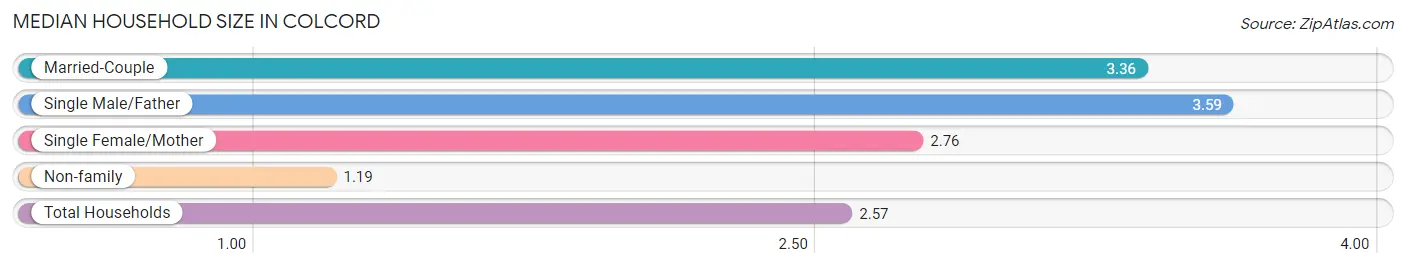
| Household Type | # Households | Household Size |
| Married-Couple | 123 (38.2%) | 3.36 |
| Single Male/Father | 17 (5.3%) | 3.59 |
| Single Female/Mother | 87 (27.0%) | 2.76 |
| Non-family | 95 (29.5%) | 1.19 |
| Total Households | 322 (100.0%) | 2.57 |
Household Size by Marriage Status in Colcord
Out of a total of 322 households in Colcord, 227 (70.5%) are family households, while 95 (29.5%) are nonfamily households. The most numerous type of family households are 2-person households, comprising 101, and the most common type of nonfamily households are 1-person households, comprising 84.
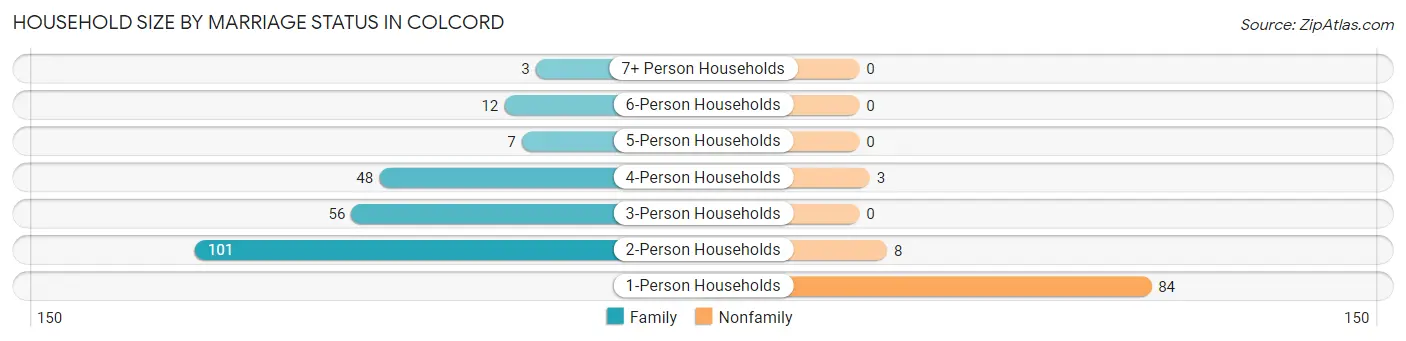
| Household Size | Family Households | Nonfamily Households |
| 1-Person Households | - | 84 (26.1%) |
| 2-Person Households | 101 (31.4%) | 8 (2.5%) |
| 3-Person Households | 56 (17.4%) | 0 (0.0%) |
| 4-Person Households | 48 (14.9%) | 3 (0.9%) |
| 5-Person Households | 7 (2.2%) | 0 (0.0%) |
| 6-Person Households | 12 (3.7%) | 0 (0.0%) |
| 7+ Person Households | 3 (0.9%) | 0 (0.0%) |
| Total | 227 (70.5%) | 95 (29.5%) |
Female Fertility in Colcord
Fertility by Age in Colcord
Average fertility rate in Colcord is 66.0 births per 1,000 women. Women in the age bracket of 35 to 50 years have the highest fertility rate with 75.0 births per 1,000 women. Women in the age bracket of 35 to 50 years acount for 50.0% of all women with births.
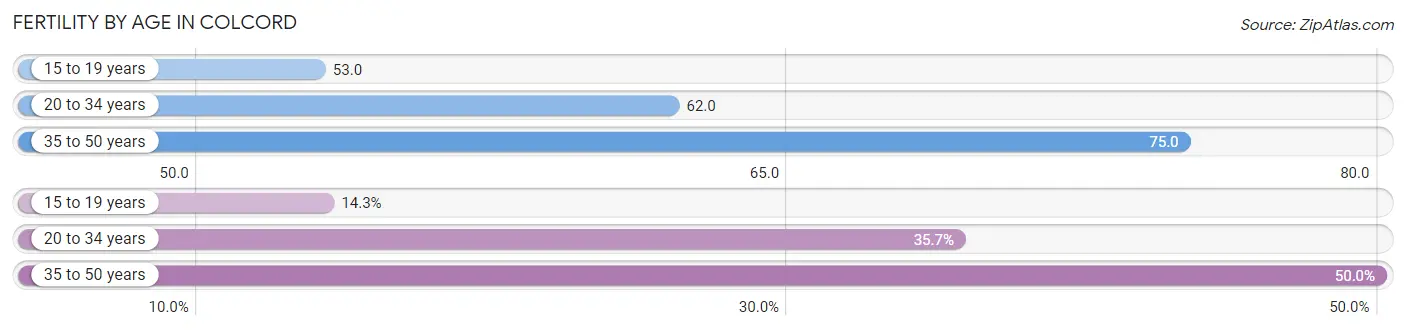
| Age Bracket | Women with Births | Births / 1,000 Women |
| 15 to 19 years | 2 (14.3%) | 53.0 |
| 20 to 34 years | 5 (35.7%) | 62.0 |
| 35 to 50 years | 7 (50.0%) | 75.0 |
| Total | 14 (100.0%) | 66.0 |
Fertility by Age by Marriage Status in Colcord
57.1% of women with births (14) in Colcord are married. The highest percentage of unmarried women with births falls into 15 to 19 years age bracket with 100.0% of them unmarried at the time of birth, while the lowest percentage of unmarried women with births belong to 20 to 34 years age bracket with 0.0% of them unmarried.
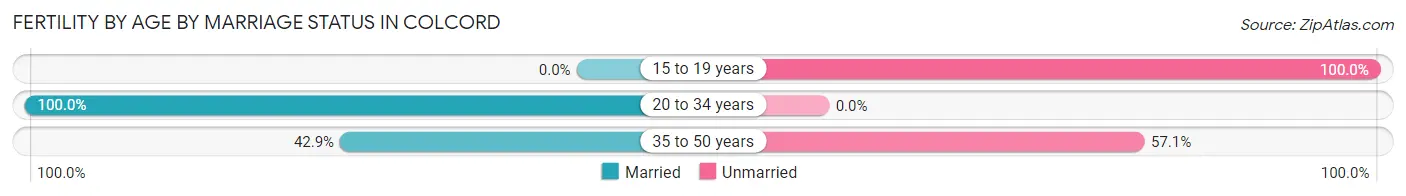
| Age Bracket | Married | Unmarried |
| 15 to 19 years | 0 (0.0%) | 2 (100.0%) |
| 20 to 34 years | 5 (100.0%) | 0 (0.0%) |
| 35 to 50 years | 3 (42.9%) | 4 (57.1%) |
| Total | 8 (57.1%) | 6 (42.9%) |
Fertility by Education in Colcord
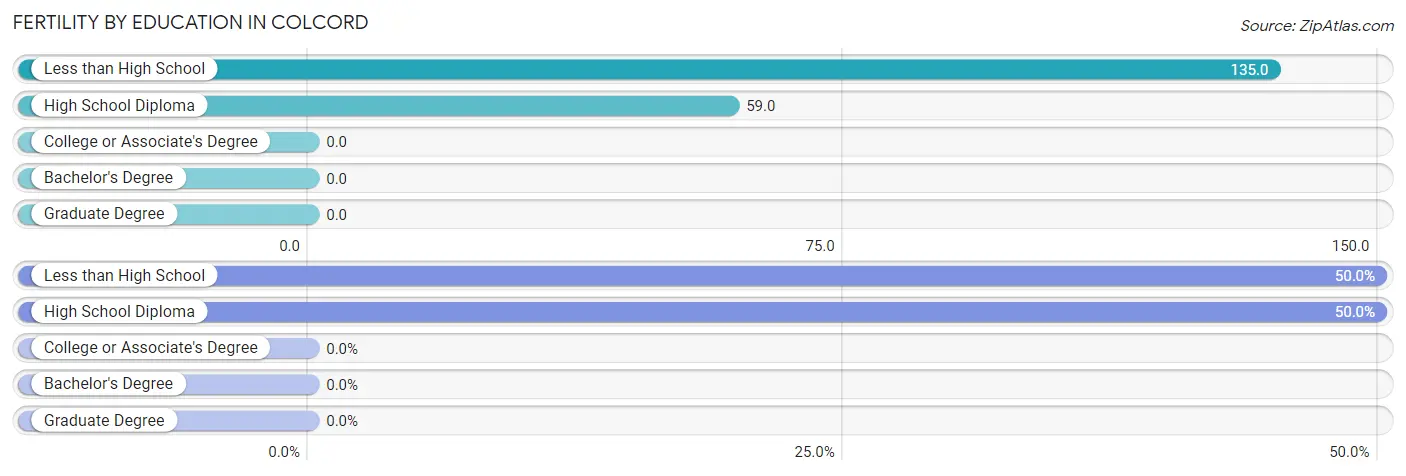
| Educational Attainment | Women with Births | Births / 1,000 Women |
| Less than High School | 7 (50.0%) | 135.0 |
| High School Diploma | 7 (50.0%) | 59.0 |
| College or Associate's Degree | 0 (0.0%) | 0.0 |
| Bachelor's Degree | 0 (0.0%) | 0.0 |
| Graduate Degree | 0 (0.0%) | 0.0 |
| Total | 14 (100.0%) | 66.0 |
Fertility by Education by Marriage Status in Colcord
42.9% of women with births in Colcord are unmarried. Women with the educational attainment of high school diploma are most likely to be married with 71.4% of them married at childbirth, while women with the educational attainment of less than high school are least likely to be married with 57.1% of them unmarried at childbirth.
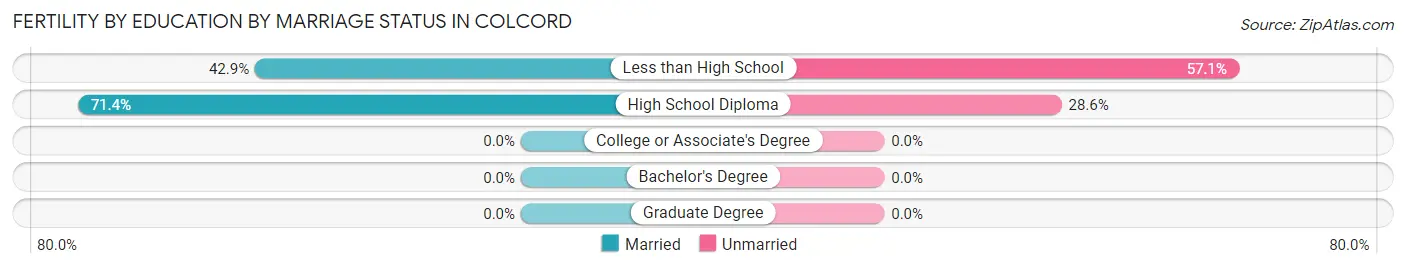
| Educational Attainment | Married | Unmarried |
| Less than High School | 3 (42.9%) | 4 (57.1%) |
| High School Diploma | 5 (71.4%) | 2 (28.6%) |
| College or Associate's Degree | 0 (0.0%) | 0 (0.0%) |
| Bachelor's Degree | 0 (0.0%) | 0 (0.0%) |
| Graduate Degree | 0 (0.0%) | 0 (0.0%) |
| Total | 8 (57.1%) | 6 (42.9%) |
Employment Characteristics in Colcord
Employment by Class of Employer in Colcord
Among the 318 employed individuals in Colcord, private company employees (226 | 71.1%), local government employees (34 | 10.7%), and state government employees (18 | 5.7%) make up the most common classes of employment.
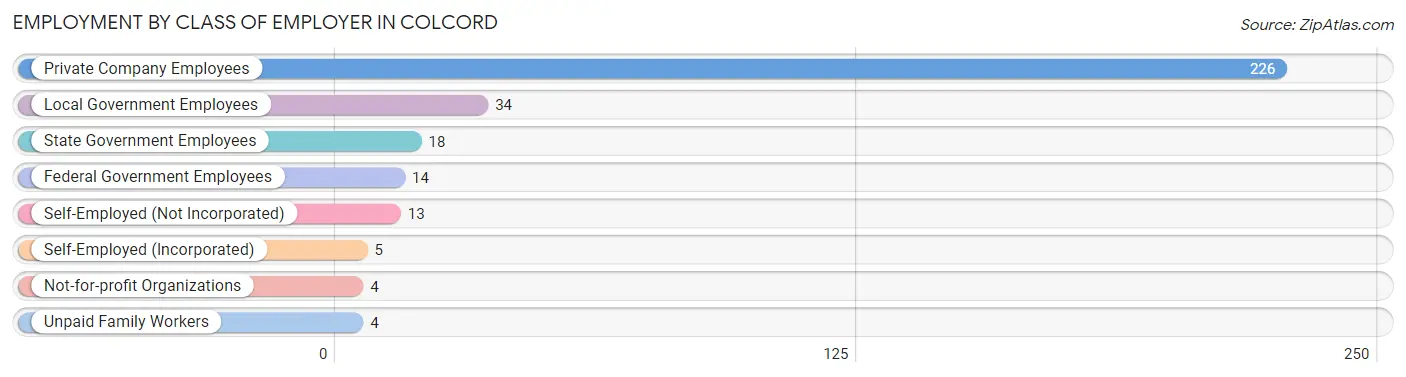
| Employer Class | # Employees | % Employees |
| Private Company Employees | 226 | 71.1% |
| Self-Employed (Incorporated) | 5 | 1.6% |
| Self-Employed (Not Incorporated) | 13 | 4.1% |
| Not-for-profit Organizations | 4 | 1.3% |
| Local Government Employees | 34 | 10.7% |
| State Government Employees | 18 | 5.7% |
| Federal Government Employees | 14 | 4.4% |
| Unpaid Family Workers | 4 | 1.3% |
| Total | 318 | 100.0% |
Employment Status by Age in Colcord
According to the labor force statistics for Colcord, out of the total population over 16 years of age (668), 51.5% or 344 individuals are in the labor force, with 7.6% or 26 of them unemployed. The age group with the highest labor force participation rate is 35 to 44 years, with 81.6% or 102 individuals in the labor force. Within the labor force, the 16 to 19 years age range has the highest percentage of unemployed individuals, with 29.2% or 7 of them being unemployed.
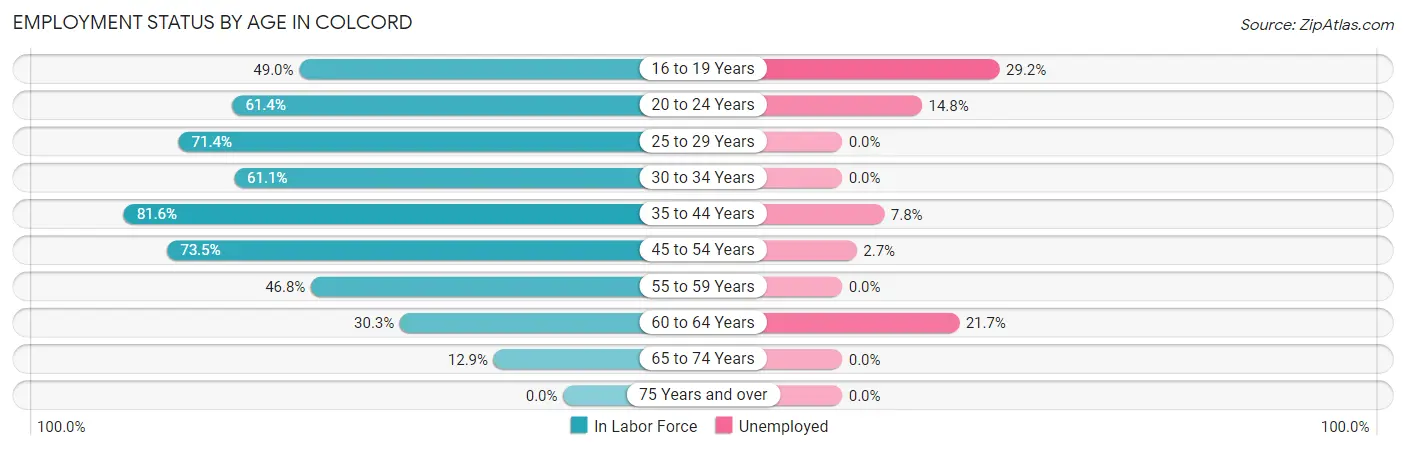
| Age Bracket | In Labor Force | Unemployed |
| 16 to 19 Years | 24 (49.0%) | 7 (29.2%) |
| 20 to 24 Years | 27 (61.4%) | 4 (14.8%) |
| 25 to 29 Years | 40 (71.4%) | 0 (0.0%) |
| 30 to 34 Years | 22 (61.1%) | 0 (0.0%) |
| 35 to 44 Years | 102 (81.6%) | 8 (7.8%) |
| 45 to 54 Years | 75 (73.5%) | 2 (2.7%) |
| 55 to 59 Years | 22 (46.8%) | 0 (0.0%) |
| 60 to 64 Years | 23 (30.3%) | 5 (21.7%) |
| 65 to 74 Years | 9 (12.9%) | 0 (0.0%) |
| 75 Years and over | 0 (0.0%) | 0 (0.0%) |
| Total | 344 (51.5%) | 26 (7.6%) |
Employment Status by Educational Attainment in Colcord
According to labor force statistics for Colcord, 64.3% of individuals (284) out of the total population between 25 and 64 years of age (442) are in the labor force, with 5.3% or 15 of them being unemployed. The group with the highest labor force participation rate are those with the educational attainment of bachelor's degree or higher, with 82.6% or 19 individuals in the labor force. Within the labor force, individuals with less than high school education have the highest percentage of unemployment, with 10.0% or 3 of them being unemployed.
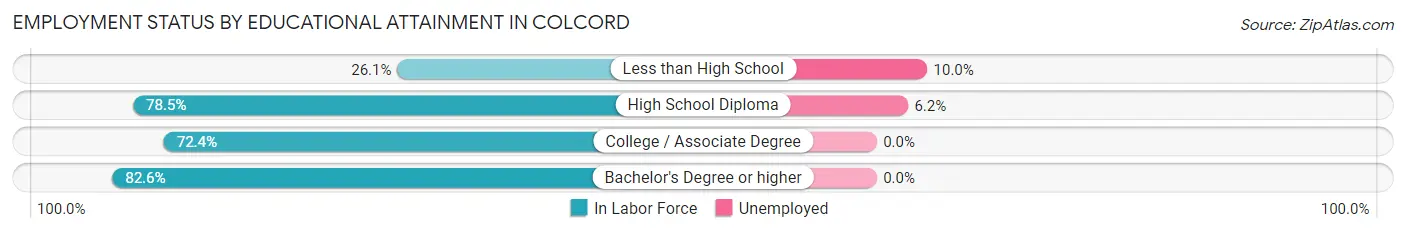
| Educational Attainment | In Labor Force | Unemployed |
| Less than High School | 30 (26.1%) | 12 (10.0%) |
| High School Diploma | 193 (78.5%) | 15 (6.2%) |
| College / Associate Degree | 42 (72.4%) | 0 (0.0%) |
| Bachelor's Degree or higher | 19 (82.6%) | 0 (0.0%) |
| Total | 284 (64.3%) | 23 (5.3%) |
Employment Occupations by Sex in Colcord
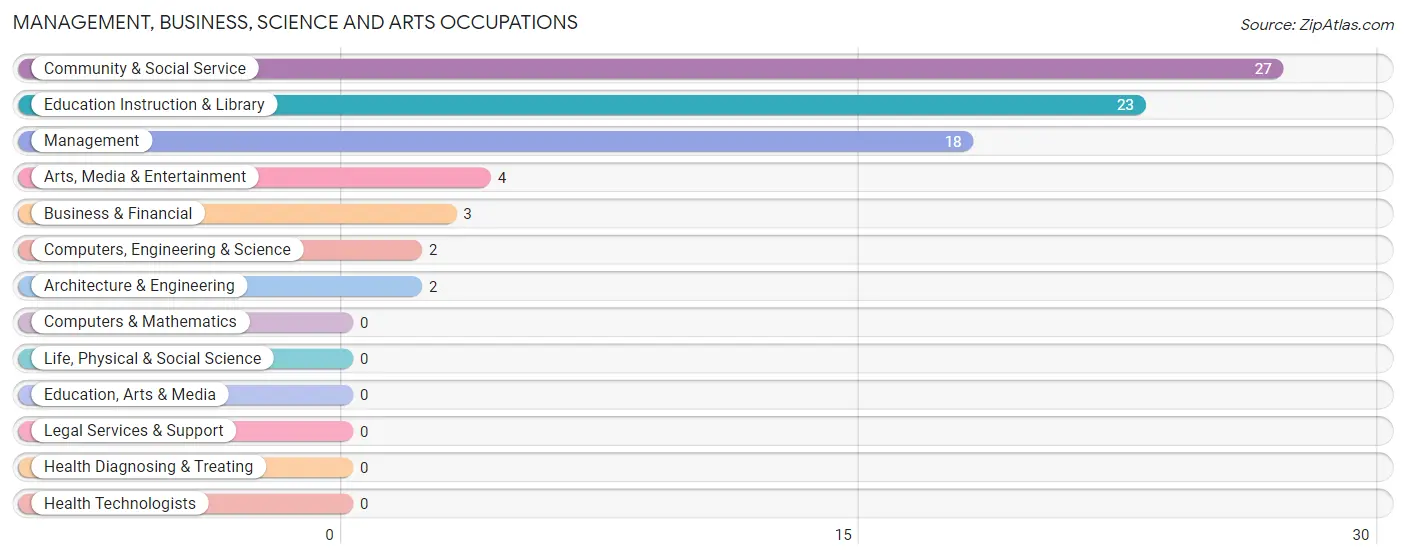
Management, Business, Science and Arts Occupations
The most common Management, Business, Science and Arts occupations in Colcord are Community & Social Service (27 | 8.5%), Education Instruction & Library (23 | 7.2%), Management (18 | 5.7%), Arts, Media & Entertainment (4 | 1.3%), and Business & Financial (3 | 0.9%).
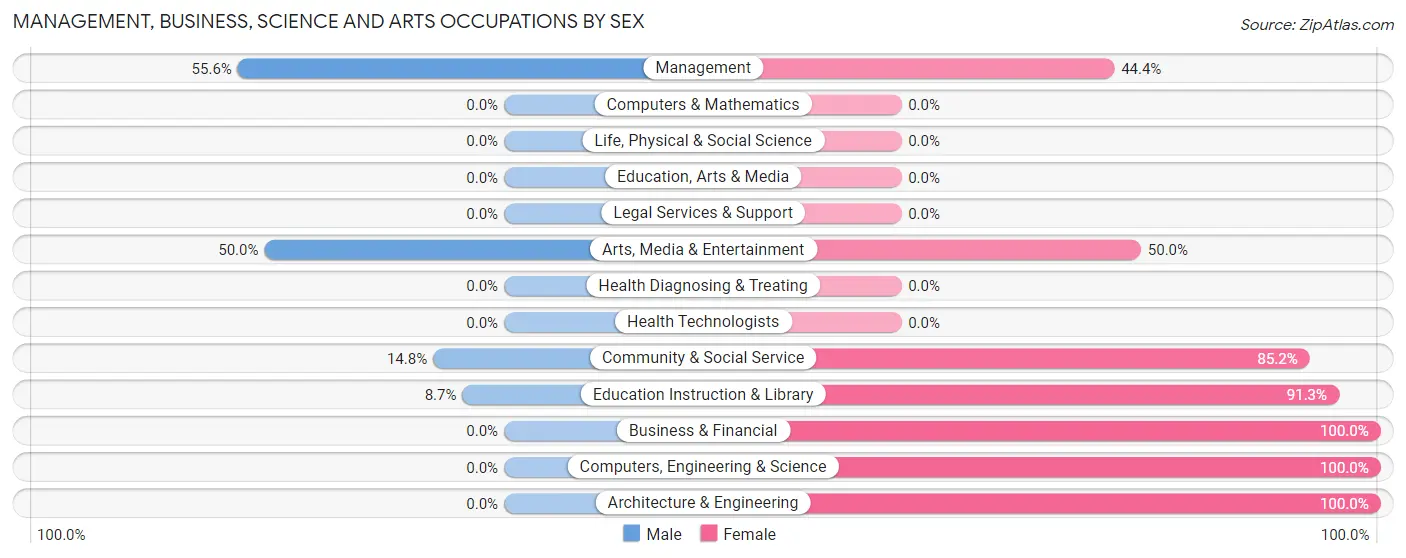
Management, Business, Science and Arts Occupations by Sex
Within the Management, Business, Science and Arts occupations in Colcord, the most male-oriented occupations are Management (55.6%), Arts, Media & Entertainment (50.0%), and Community & Social Service (14.8%), while the most female-oriented occupations are Business & Financial (100.0%), Computers, Engineering & Science (100.0%), and Architecture & Engineering (100.0%).
| Occupation | Male | Female |
| Management | 10 (55.6%) | 8 (44.4%) |
| Business & Financial | 0 (0.0%) | 3 (100.0%) |
| Computers, Engineering & Science | 0 (0.0%) | 2 (100.0%) |
| Computers & Mathematics | 0 (0.0%) | 0 (0.0%) |
| Architecture & Engineering | 0 (0.0%) | 2 (100.0%) |
| Life, Physical & Social Science | 0 (0.0%) | 0 (0.0%) |
| Community & Social Service | 4 (14.8%) | 23 (85.2%) |
| Education, Arts & Media | 0 (0.0%) | 0 (0.0%) |
| Legal Services & Support | 0 (0.0%) | 0 (0.0%) |
| Education Instruction & Library | 2 (8.7%) | 21 (91.3%) |
| Arts, Media & Entertainment | 2 (50.0%) | 2 (50.0%) |
| Health Diagnosing & Treating | 0 (0.0%) | 0 (0.0%) |
| Health Technologists | 0 (0.0%) | 0 (0.0%) |
| Total (Category) | 14 (28.0%) | 36 (72.0%) |
| Total (Overall) | 163 (51.3%) | 155 (48.7%) |
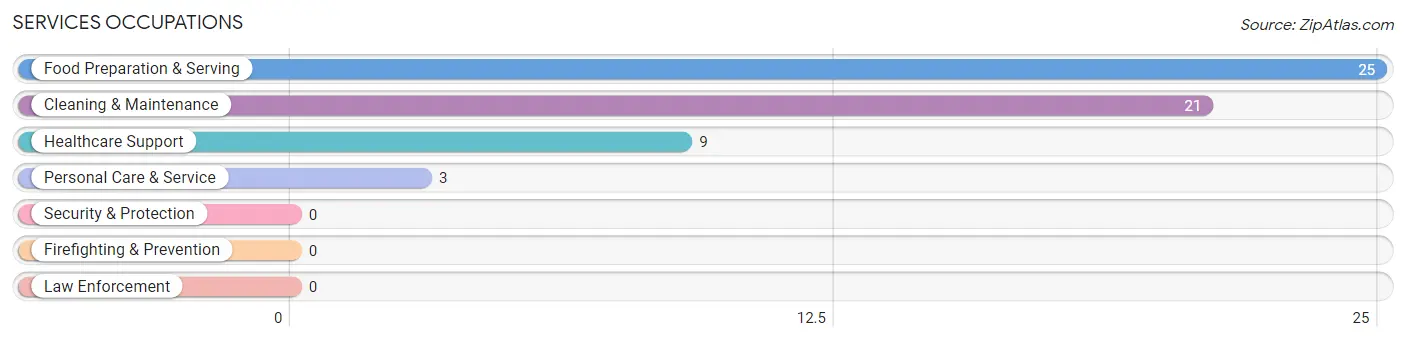
Services Occupations
The most common Services occupations in Colcord are Food Preparation & Serving (25 | 7.9%), Cleaning & Maintenance (21 | 6.6%), Healthcare Support (9 | 2.8%), and Personal Care & Service (3 | 0.9%).
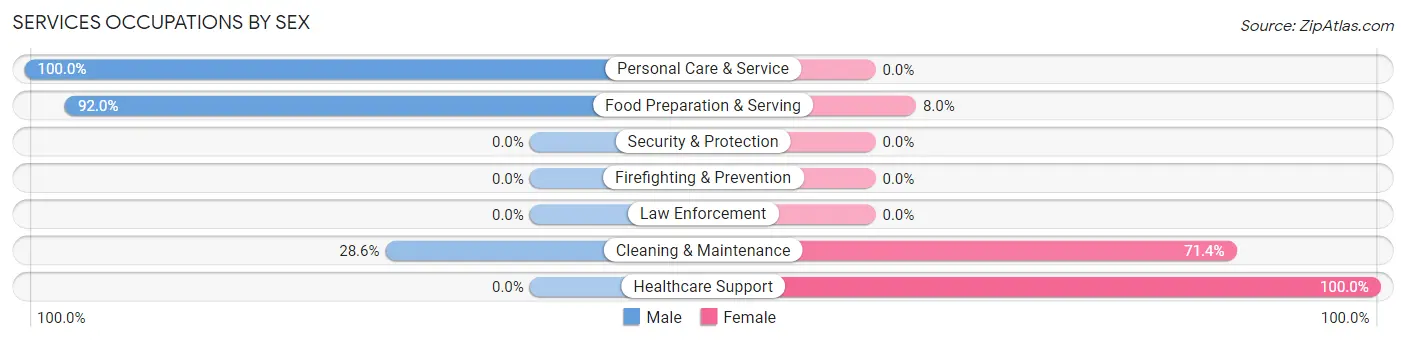
Services Occupations by Sex
Within the Services occupations in Colcord, the most male-oriented occupations are Personal Care & Service (100.0%), Food Preparation & Serving (92.0%), and Cleaning & Maintenance (28.6%), while the most female-oriented occupations are Healthcare Support (100.0%), Cleaning & Maintenance (71.4%), and Food Preparation & Serving (8.0%).
| Occupation | Male | Female |
| Healthcare Support | 0 (0.0%) | 9 (100.0%) |
| Security & Protection | 0 (0.0%) | 0 (0.0%) |
| Firefighting & Prevention | 0 (0.0%) | 0 (0.0%) |
| Law Enforcement | 0 (0.0%) | 0 (0.0%) |
| Food Preparation & Serving | 23 (92.0%) | 2 (8.0%) |
| Cleaning & Maintenance | 6 (28.6%) | 15 (71.4%) |
| Personal Care & Service | 3 (100.0%) | 0 (0.0%) |
| Total (Category) | 32 (55.2%) | 26 (44.8%) |
| Total (Overall) | 163 (51.3%) | 155 (48.7%) |
Sales and Office Occupations
The most common Sales and Office occupations in Colcord are Sales & Related (33 | 10.4%), and Office & Administration (28 | 8.8%).
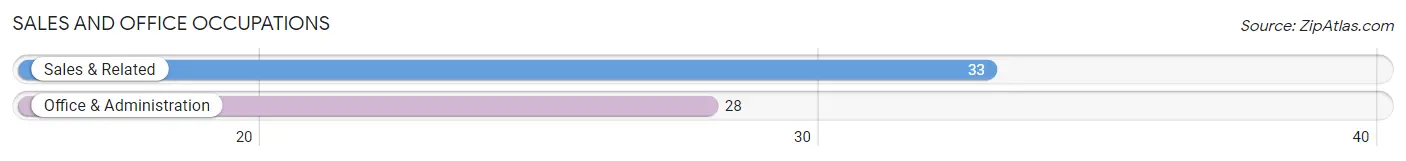
Sales and Office Occupations by Sex
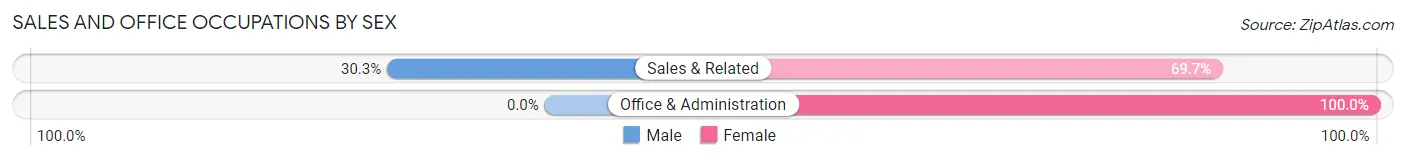
| Occupation | Male | Female |
| Sales & Related | 10 (30.3%) | 23 (69.7%) |
| Office & Administration | 0 (0.0%) | 28 (100.0%) |
| Total (Category) | 10 (16.4%) | 51 (83.6%) |
| Total (Overall) | 163 (51.3%) | 155 (48.7%) |
Natural Resources, Construction and Maintenance Occupations
The most common Natural Resources, Construction and Maintenance occupations in Colcord are Installation, Maintenance & Repair (12 | 3.8%), Construction & Extraction (8 | 2.5%), and Farming, Fishing & Forestry (7 | 2.2%).
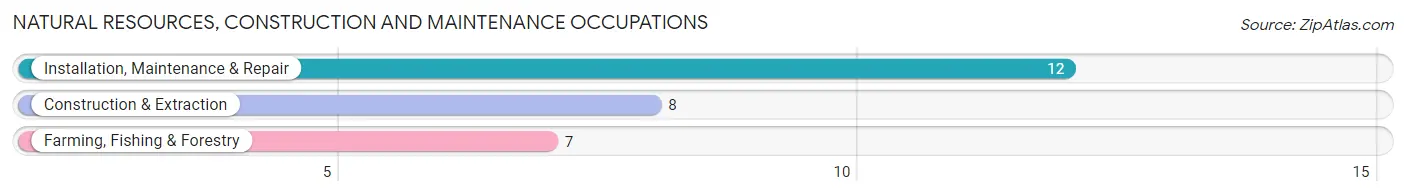
Natural Resources, Construction and Maintenance Occupations by Sex
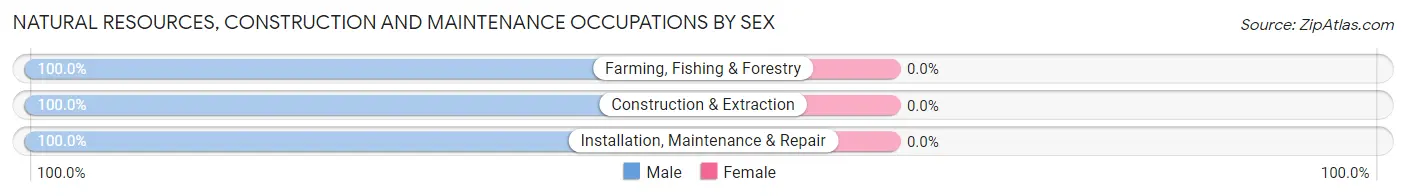
| Occupation | Male | Female |
| Farming, Fishing & Forestry | 7 (100.0%) | 0 (0.0%) |
| Construction & Extraction | 8 (100.0%) | 0 (0.0%) |
| Installation, Maintenance & Repair | 12 (100.0%) | 0 (0.0%) |
| Total (Category) | 27 (100.0%) | 0 (0.0%) |
| Total (Overall) | 163 (51.3%) | 155 (48.7%) |
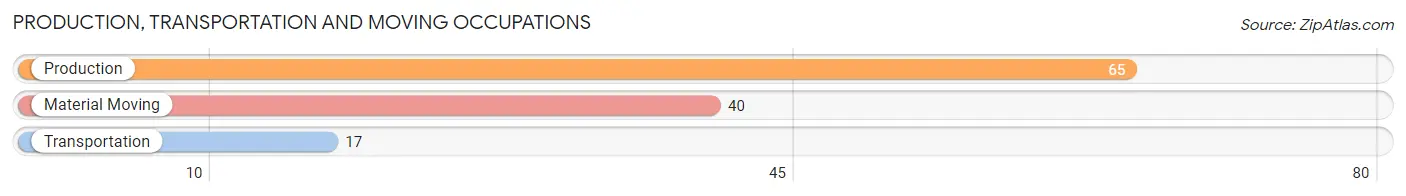
Production, Transportation and Moving Occupations
The most common Production, Transportation and Moving occupations in Colcord are Production (65 | 20.4%), Material Moving (40 | 12.6%), and Transportation (17 | 5.3%).
Production, Transportation and Moving Occupations by Sex
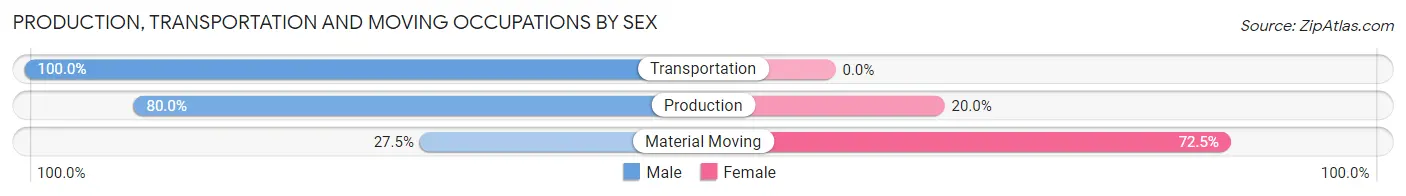
| Occupation | Male | Female |
| Production | 52 (80.0%) | 13 (20.0%) |
| Transportation | 17 (100.0%) | 0 (0.0%) |
| Material Moving | 11 (27.5%) | 29 (72.5%) |
| Total (Category) | 80 (65.6%) | 42 (34.4%) |
| Total (Overall) | 163 (51.3%) | 155 (48.7%) |
Employment Industries by Sex in Colcord
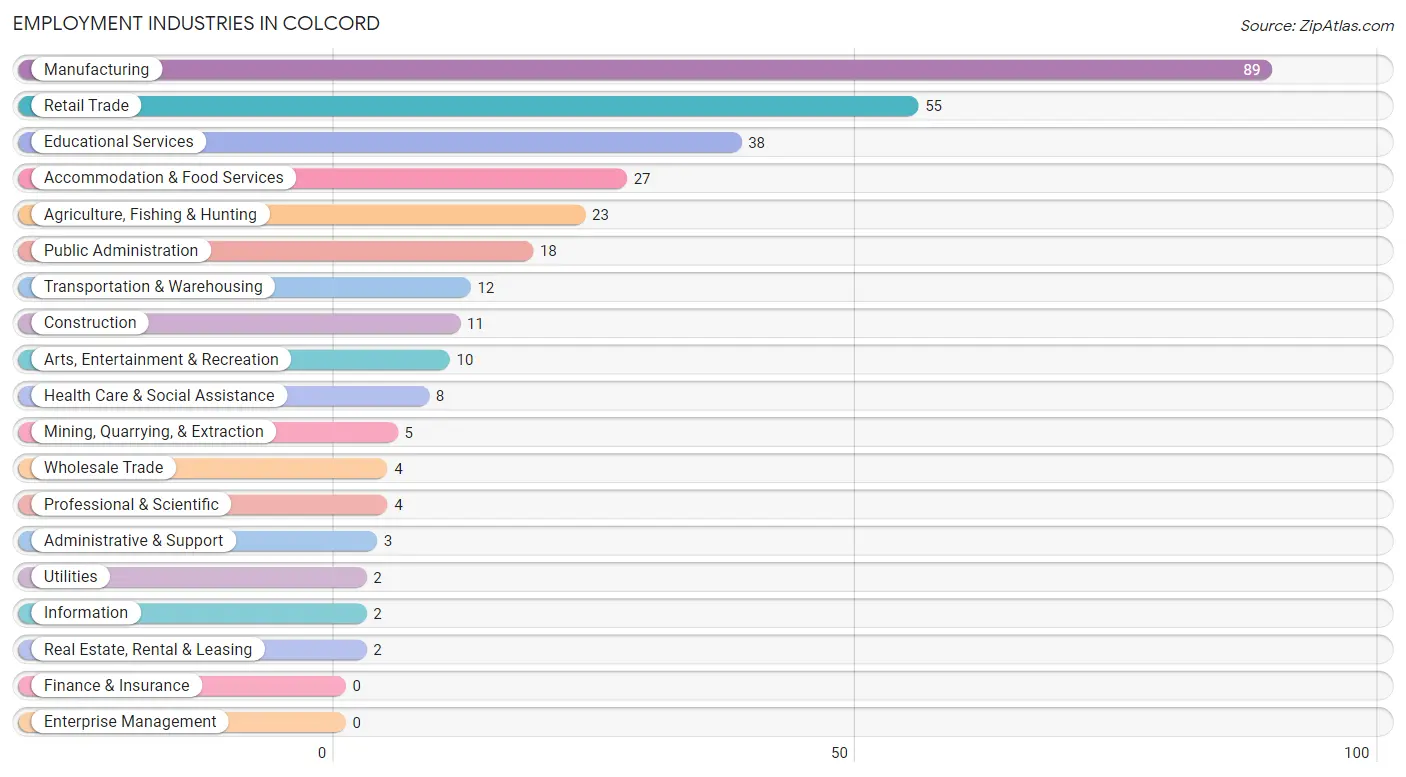
Employment Industries in Colcord
The major employment industries in Colcord include Manufacturing (89 | 28.0%), Retail Trade (55 | 17.3%), Educational Services (38 | 11.9%), Accommodation & Food Services (27 | 8.5%), and Agriculture, Fishing & Hunting (23 | 7.2%).
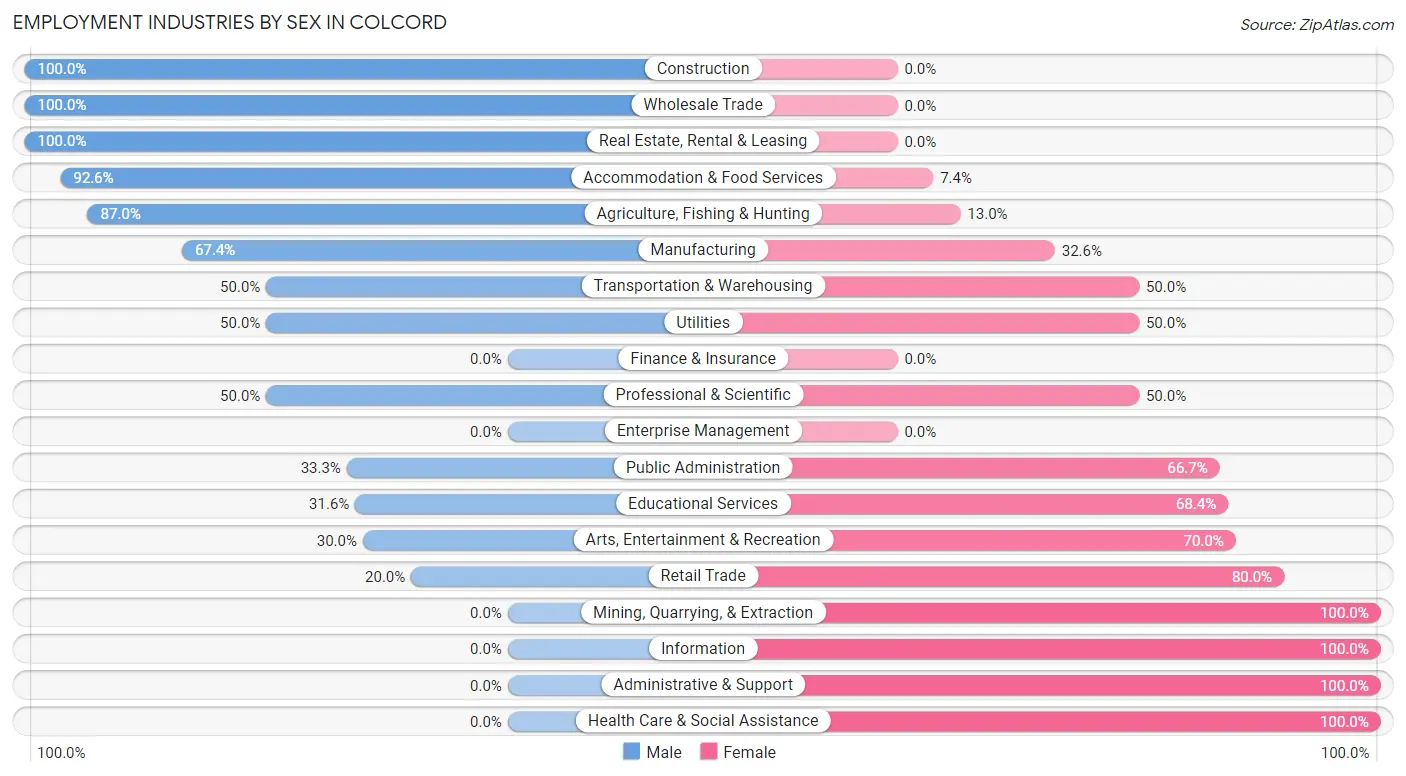
Employment Industries by Sex in Colcord
The Colcord industries that see more men than women are Construction (100.0%), Wholesale Trade (100.0%), and Real Estate, Rental & Leasing (100.0%), whereas the industries that tend to have a higher number of women are Mining, Quarrying, & Extraction (100.0%), Information (100.0%), and Administrative & Support (100.0%).
| Industry | Male | Female |
| Agriculture, Fishing & Hunting | 20 (87.0%) | 3 (13.0%) |
| Mining, Quarrying, & Extraction | 0 (0.0%) | 5 (100.0%) |
| Construction | 11 (100.0%) | 0 (0.0%) |
| Manufacturing | 60 (67.4%) | 29 (32.6%) |
| Wholesale Trade | 4 (100.0%) | 0 (0.0%) |
| Retail Trade | 11 (20.0%) | 44 (80.0%) |
| Transportation & Warehousing | 6 (50.0%) | 6 (50.0%) |
| Utilities | 1 (50.0%) | 1 (50.0%) |
| Information | 0 (0.0%) | 2 (100.0%) |
| Finance & Insurance | 0 (0.0%) | 0 (0.0%) |
| Real Estate, Rental & Leasing | 2 (100.0%) | 0 (0.0%) |
| Professional & Scientific | 2 (50.0%) | 2 (50.0%) |
| Enterprise Management | 0 (0.0%) | 0 (0.0%) |
| Administrative & Support | 0 (0.0%) | 3 (100.0%) |
| Educational Services | 12 (31.6%) | 26 (68.4%) |
| Health Care & Social Assistance | 0 (0.0%) | 8 (100.0%) |
| Arts, Entertainment & Recreation | 3 (30.0%) | 7 (70.0%) |
| Accommodation & Food Services | 25 (92.6%) | 2 (7.4%) |
| Public Administration | 6 (33.3%) | 12 (66.7%) |
| Total | 163 (51.3%) | 155 (48.7%) |
Education in Colcord
School Enrollment in Colcord
The most common levels of schooling among the 146 students in Colcord are middle school (48 | 32.9%), elementary school (39 | 26.7%), and high school (33 | 22.6%).
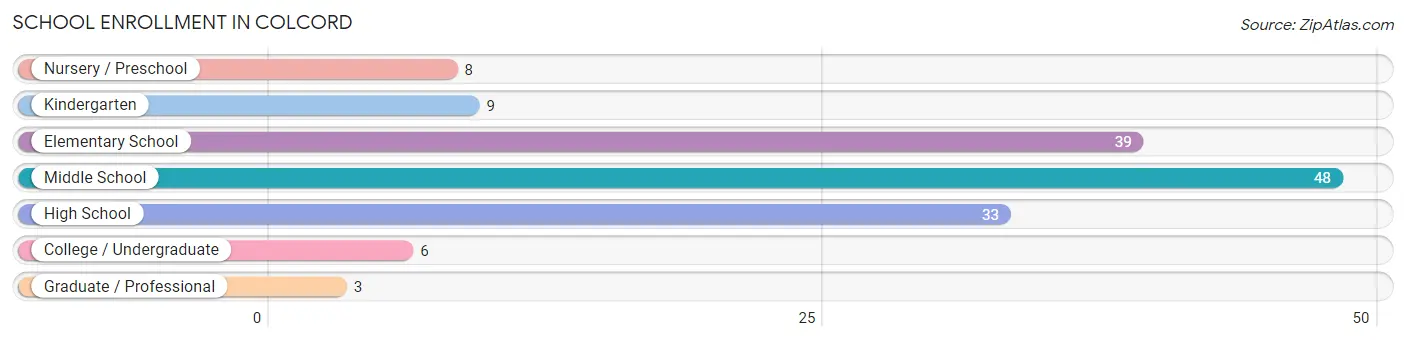
| School Level | # Students | % Students |
| Nursery / Preschool | 8 | 5.5% |
| Kindergarten | 9 | 6.2% |
| Elementary School | 39 | 26.7% |
| Middle School | 48 | 32.9% |
| High School | 33 | 22.6% |
| College / Undergraduate | 6 | 4.1% |
| Graduate / Professional | 3 | 2.1% |
| Total | 146 | 100.0% |
School Enrollment by Age by Funding Source in Colcord
Out of a total of 146 students who are enrolled in schools in Colcord, 5 (3.4%) attend a private institution, while the remaining 141 (96.6%) are enrolled in public schools. The age group of 15 to 17 year olds has the highest likelihood of being enrolled in private schools, with 5 (14.3% in the age bracket) enrolled. Conversely, the age group of 3 to 4 year olds has the lowest likelihood of being enrolled in a private school, with 5 (100.0% in the age bracket) attending a public institution.
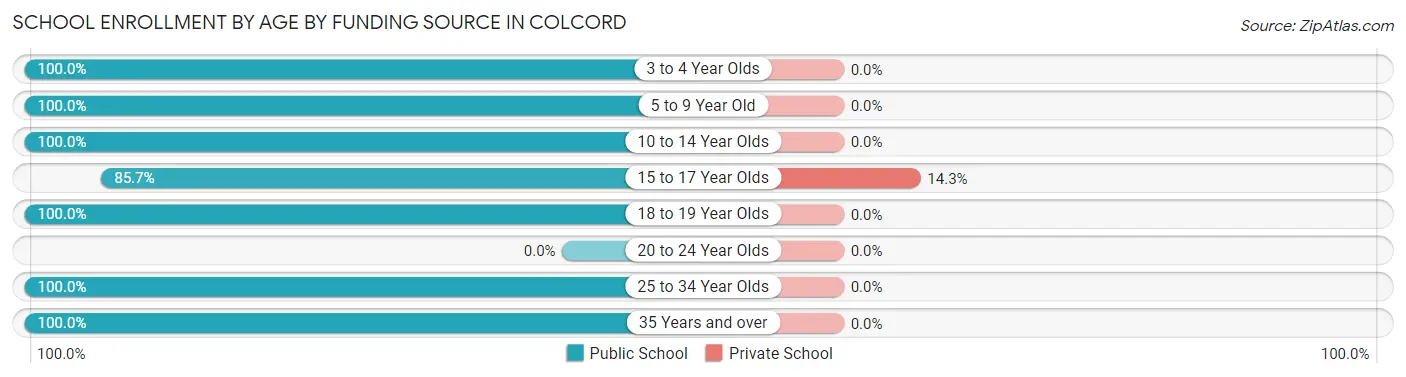
| Age Bracket | Public School | Private School |
| 3 to 4 Year Olds | 5 (100.0%) | 0 (0.0%) |
| 5 to 9 Year Old | 41 (100.0%) | 0 (0.0%) |
| 10 to 14 Year Olds | 56 (100.0%) | 0 (0.0%) |
| 15 to 17 Year Olds | 30 (85.7%) | 5 (14.3%) |
| 18 to 19 Year Olds | 3 (100.0%) | 0 (0.0%) |
| 20 to 24 Year Olds | 0 (0.0%) | 0 (0.0%) |
| 25 to 34 Year Olds | 3 (100.0%) | 0 (0.0%) |
| 35 Years and over | 3 (100.0%) | 0 (0.0%) |
| Total | 141 (96.6%) | 5 (3.4%) |
Educational Attainment by Field of Study in Colcord
Business (13 | 39.4%), education (11 | 33.3%), bio, nature & agricultural (5 | 15.1%), and communications (4 | 12.1%) are the most common fields of study among 33 individuals in Colcord who have obtained a bachelor's degree or higher.
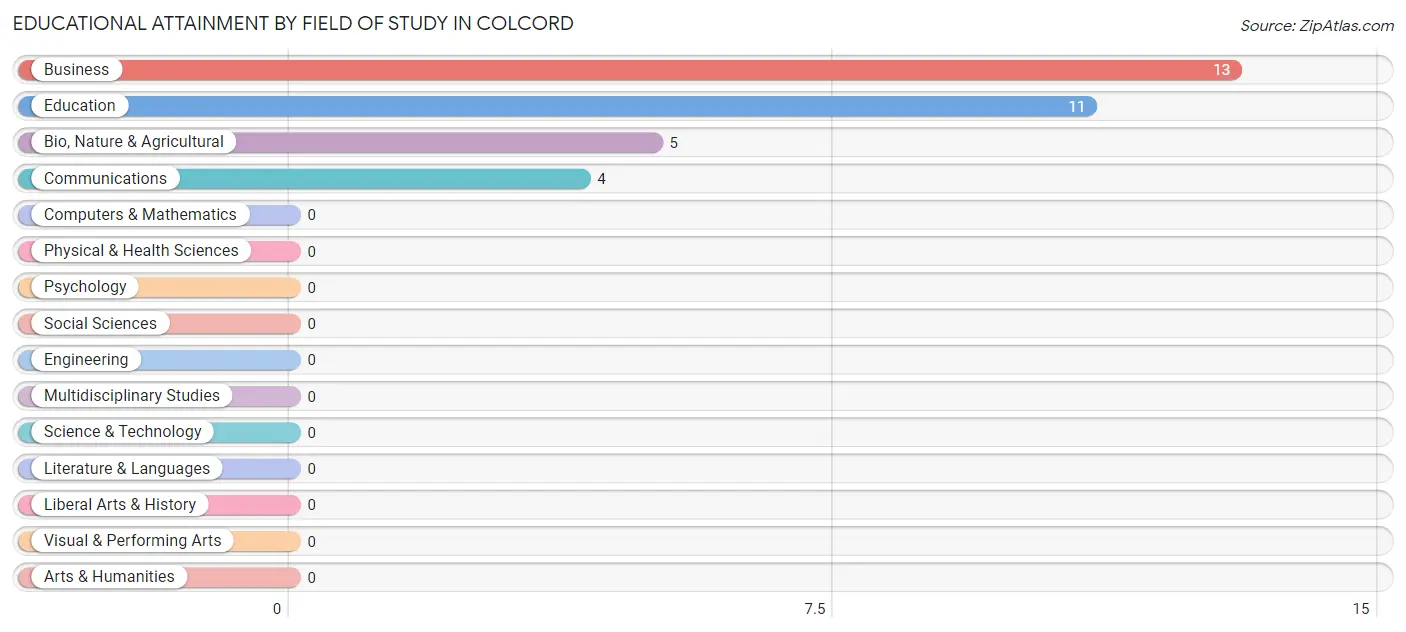
| Field of Study | # Graduates | % Graduates |
| Computers & Mathematics | 0 | 0.0% |
| Bio, Nature & Agricultural | 5 | 15.1% |
| Physical & Health Sciences | 0 | 0.0% |
| Psychology | 0 | 0.0% |
| Social Sciences | 0 | 0.0% |
| Engineering | 0 | 0.0% |
| Multidisciplinary Studies | 0 | 0.0% |
| Science & Technology | 0 | 0.0% |
| Business | 13 | 39.4% |
| Education | 11 | 33.3% |
| Literature & Languages | 0 | 0.0% |
| Liberal Arts & History | 0 | 0.0% |
| Visual & Performing Arts | 0 | 0.0% |
| Communications | 4 | 12.1% |
| Arts & Humanities | 0 | 0.0% |
| Total | 33 | 100.0% |
Transportation & Commute in Colcord
Vehicle Availability by Sex in Colcord
The most prevalent vehicle ownership categories in Colcord are males with 2 vehicles (60, accounting for 36.8%) and females with 2 vehicles (57, making up 38.7%).
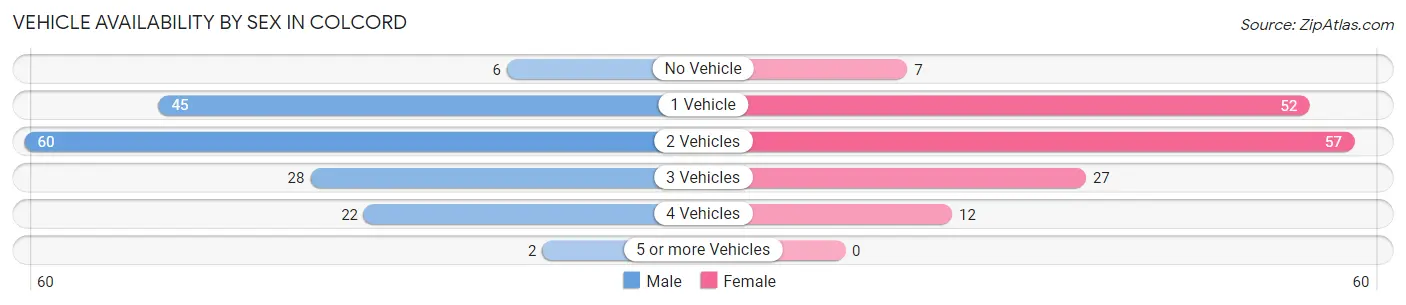
| Vehicles Available | Male | Female |
| No Vehicle | 6 (3.7%) | 7 (4.5%) |
| 1 Vehicle | 45 (27.6%) | 52 (33.6%) |
| 2 Vehicles | 60 (36.8%) | 57 (36.8%) |
| 3 Vehicles | 28 (17.2%) | 27 (17.4%) |
| 4 Vehicles | 22 (13.5%) | 12 (7.7%) |
| 5 or more Vehicles | 2 (1.2%) | 0 (0.0%) |
| Total | 163 (100.0%) | 155 (100.0%) |
Commute Time in Colcord
The most frequently occuring commute durations in Colcord are 30 to 34 minutes (72 commuters, 22.9%), 20 to 24 minutes (53 commuters, 16.9%), and 60 to 89 minutes (48 commuters, 15.3%).
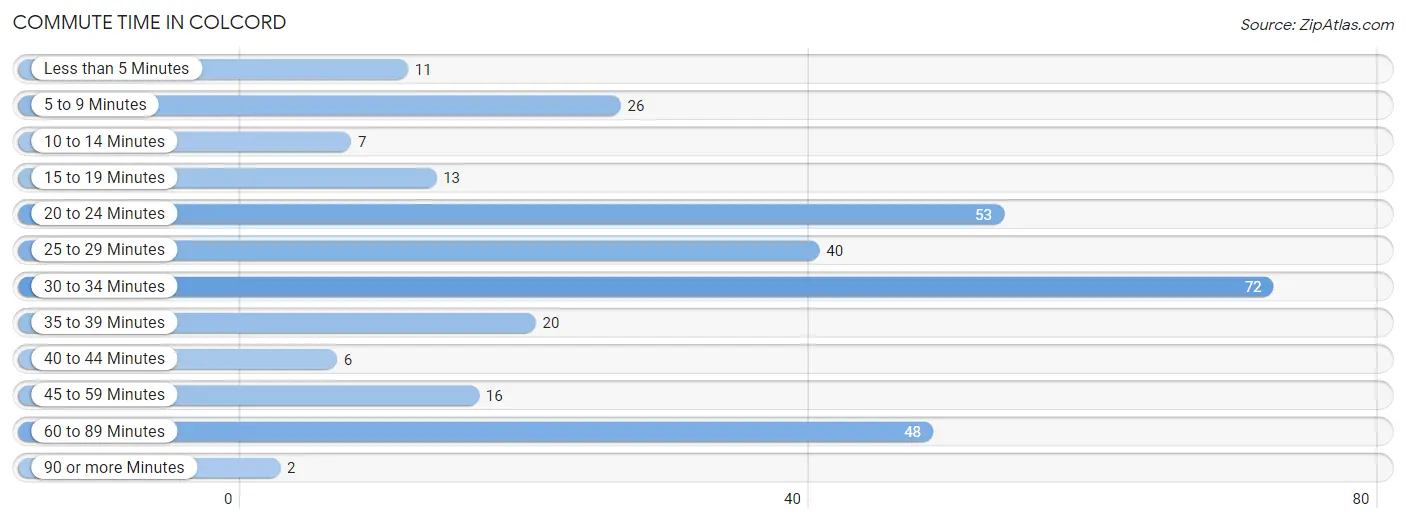
| Commute Time | # Commuters | % Commuters |
| Less than 5 Minutes | 11 | 3.5% |
| 5 to 9 Minutes | 26 | 8.3% |
| 10 to 14 Minutes | 7 | 2.2% |
| 15 to 19 Minutes | 13 | 4.1% |
| 20 to 24 Minutes | 53 | 16.9% |
| 25 to 29 Minutes | 40 | 12.7% |
| 30 to 34 Minutes | 72 | 22.9% |
| 35 to 39 Minutes | 20 | 6.4% |
| 40 to 44 Minutes | 6 | 1.9% |
| 45 to 59 Minutes | 16 | 5.1% |
| 60 to 89 Minutes | 48 | 15.3% |
| 90 or more Minutes | 2 | 0.6% |
Commute Time by Sex in Colcord
The most common commute times in Colcord are 30 to 34 minutes (44 commuters, 27.7%) for males and 60 to 89 minutes (32 commuters, 20.6%) for females.
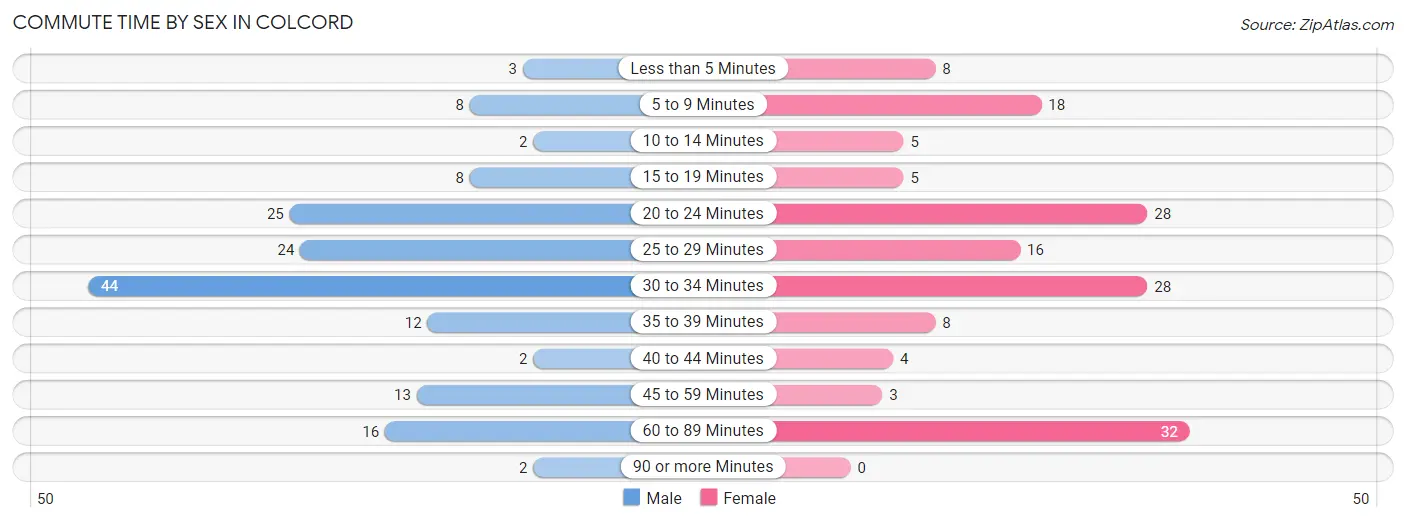
| Commute Time | Male | Female |
| Less than 5 Minutes | 3 (1.9%) | 8 (5.2%) |
| 5 to 9 Minutes | 8 (5.0%) | 18 (11.6%) |
| 10 to 14 Minutes | 2 (1.3%) | 5 (3.2%) |
| 15 to 19 Minutes | 8 (5.0%) | 5 (3.2%) |
| 20 to 24 Minutes | 25 (15.7%) | 28 (18.1%) |
| 25 to 29 Minutes | 24 (15.1%) | 16 (10.3%) |
| 30 to 34 Minutes | 44 (27.7%) | 28 (18.1%) |
| 35 to 39 Minutes | 12 (7.5%) | 8 (5.2%) |
| 40 to 44 Minutes | 2 (1.3%) | 4 (2.6%) |
| 45 to 59 Minutes | 13 (8.2%) | 3 (1.9%) |
| 60 to 89 Minutes | 16 (10.1%) | 32 (20.6%) |
| 90 or more Minutes | 2 (1.3%) | 0 (0.0%) |
Time of Departure to Work by Sex in Colcord
The most frequent times of departure to work in Colcord are 12:00 AM to 4:59 AM (21, 13.2%) for males and 5:00 AM to 5:29 AM (37, 23.9%) for females.
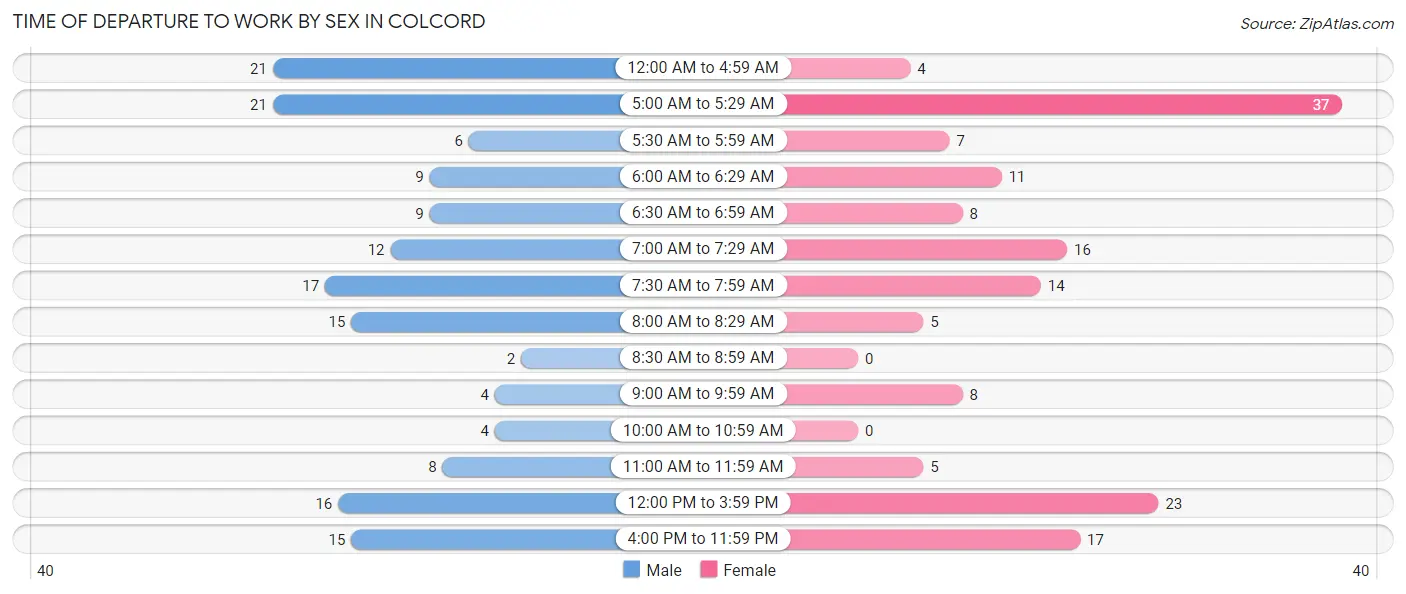
| Time of Departure | Male | Female |
| 12:00 AM to 4:59 AM | 21 (13.2%) | 4 (2.6%) |
| 5:00 AM to 5:29 AM | 21 (13.2%) | 37 (23.9%) |
| 5:30 AM to 5:59 AM | 6 (3.8%) | 7 (4.5%) |
| 6:00 AM to 6:29 AM | 9 (5.7%) | 11 (7.1%) |
| 6:30 AM to 6:59 AM | 9 (5.7%) | 8 (5.2%) |
| 7:00 AM to 7:29 AM | 12 (7.5%) | 16 (10.3%) |
| 7:30 AM to 7:59 AM | 17 (10.7%) | 14 (9.0%) |
| 8:00 AM to 8:29 AM | 15 (9.4%) | 5 (3.2%) |
| 8:30 AM to 8:59 AM | 2 (1.3%) | 0 (0.0%) |
| 9:00 AM to 9:59 AM | 4 (2.5%) | 8 (5.2%) |
| 10:00 AM to 10:59 AM | 4 (2.5%) | 0 (0.0%) |
| 11:00 AM to 11:59 AM | 8 (5.0%) | 5 (3.2%) |
| 12:00 PM to 3:59 PM | 16 (10.1%) | 23 (14.8%) |
| 4:00 PM to 11:59 PM | 15 (9.4%) | 17 (11.0%) |
| Total | 159 (100.0%) | 155 (100.0%) |
Housing Occupancy in Colcord
Occupancy by Ownership in Colcord
Of the total 322 dwellings in Colcord, owner-occupied units account for 169 (52.5%), while renter-occupied units make up 153 (47.5%).
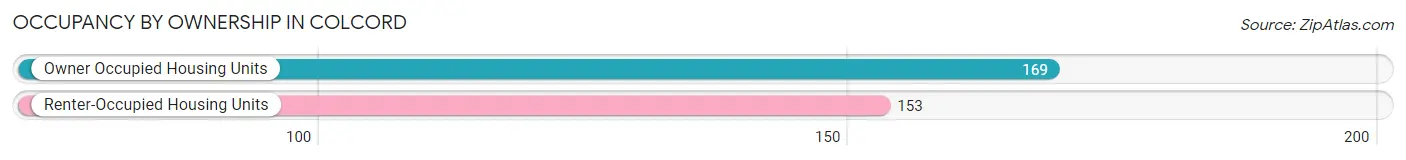
| Occupancy | # Housing Units | % Housing Units |
| Owner Occupied Housing Units | 169 | 52.5% |
| Renter-Occupied Housing Units | 153 | 47.5% |
| Total Occupied Housing Units | 322 | 100.0% |
Occupancy by Household Size in Colcord
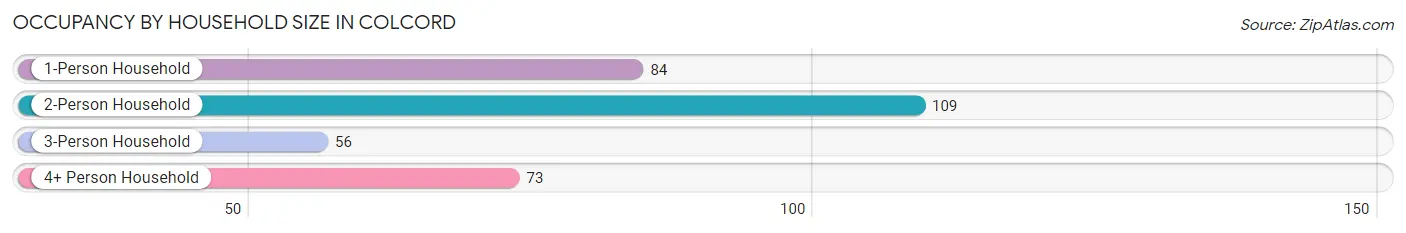
| Household Size | # Housing Units | % Housing Units |
| 1-Person Household | 84 | 26.1% |
| 2-Person Household | 109 | 33.9% |
| 3-Person Household | 56 | 17.4% |
| 4+ Person Household | 73 | 22.7% |
| Total Housing Units | 322 | 100.0% |
Occupancy by Ownership by Household Size in Colcord
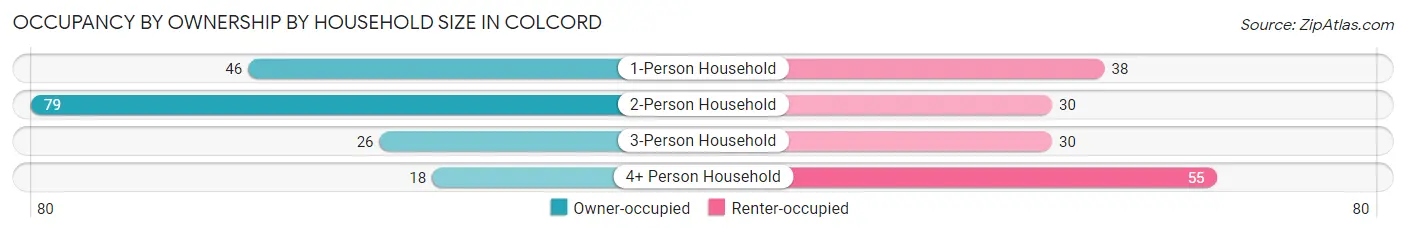
| Household Size | Owner-occupied | Renter-occupied |
| 1-Person Household | 46 (54.8%) | 38 (45.2%) |
| 2-Person Household | 79 (72.5%) | 30 (27.5%) |
| 3-Person Household | 26 (46.4%) | 30 (53.6%) |
| 4+ Person Household | 18 (24.7%) | 55 (75.3%) |
| Total Housing Units | 169 (52.5%) | 153 (47.5%) |
Occupancy by Educational Attainment in Colcord
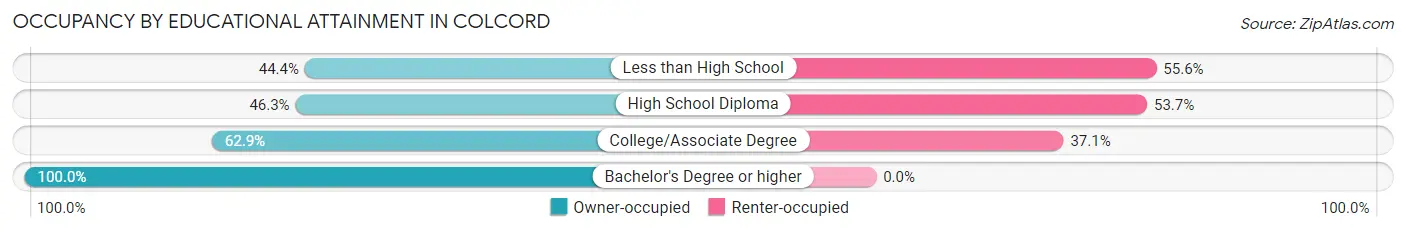
| Household Size | Owner-occupied | Renter-occupied |
| Less than High School | 32 (44.4%) | 40 (55.6%) |
| High School Diploma | 75 (46.3%) | 87 (53.7%) |
| College/Associate Degree | 44 (62.9%) | 26 (37.1%) |
| Bachelor's Degree or higher | 18 (100.0%) | 0 (0.0%) |
Occupancy by Age of Householder in Colcord
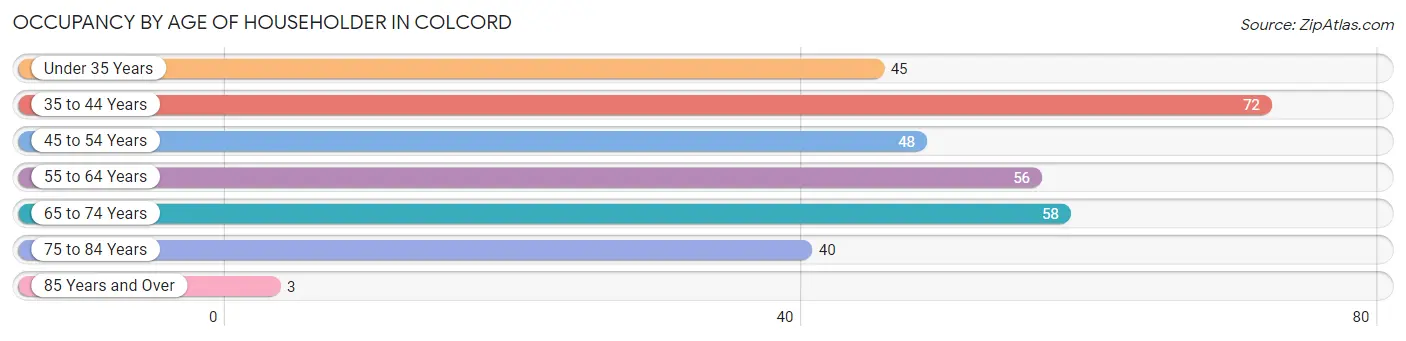
| Age Bracket | # Households | % Households |
| Under 35 Years | 45 | 14.0% |
| 35 to 44 Years | 72 | 22.4% |
| 45 to 54 Years | 48 | 14.9% |
| 55 to 64 Years | 56 | 17.4% |
| 65 to 74 Years | 58 | 18.0% |
| 75 to 84 Years | 40 | 12.4% |
| 85 Years and Over | 3 | 0.9% |
| Total | 322 | 100.0% |
Housing Finances in Colcord
Median Income by Occupancy in Colcord
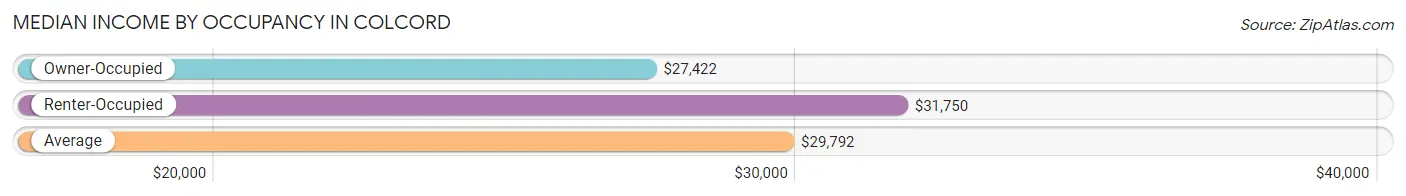
| Occupancy Type | # Households | Median Income |
| Owner-Occupied | 169 (52.5%) | $27,422 |
| Renter-Occupied | 153 (47.5%) | $31,750 |
| Average | 322 (100.0%) | $29,792 |
Occupancy by Householder Income Bracket in Colcord
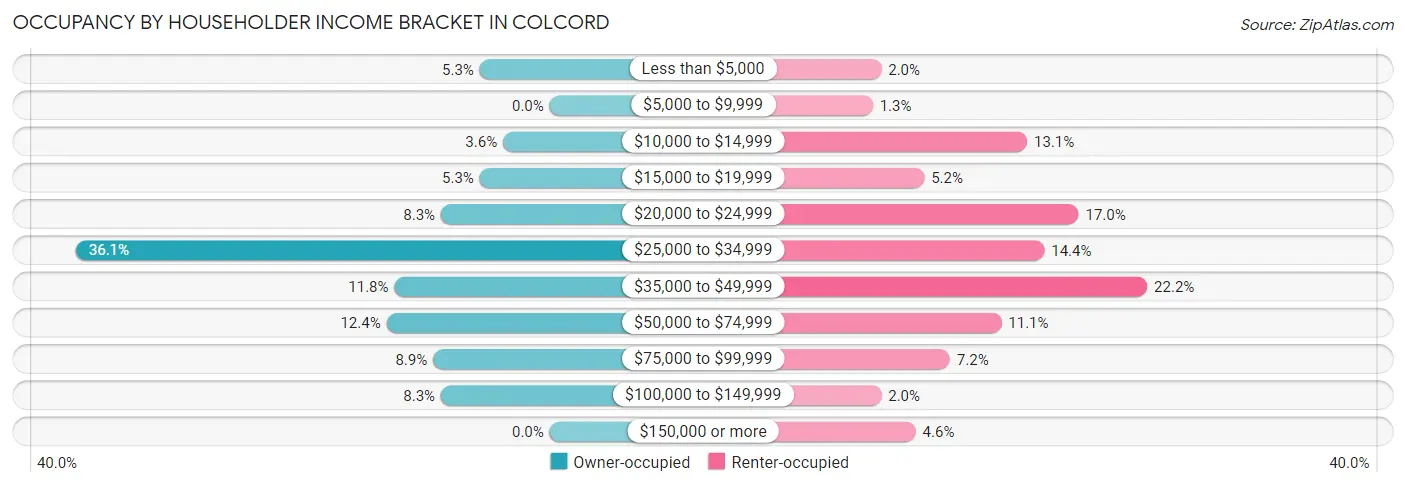
| Income Bracket | Owner-occupied | Renter-occupied |
| Less than $5,000 | 9 (5.3%) | 3 (2.0%) |
| $5,000 to $9,999 | 0 (0.0%) | 2 (1.3%) |
| $10,000 to $14,999 | 6 (3.5%) | 20 (13.1%) |
| $15,000 to $19,999 | 9 (5.3%) | 8 (5.2%) |
| $20,000 to $24,999 | 14 (8.3%) | 26 (17.0%) |
| $25,000 to $34,999 | 61 (36.1%) | 22 (14.4%) |
| $35,000 to $49,999 | 20 (11.8%) | 34 (22.2%) |
| $50,000 to $74,999 | 21 (12.4%) | 17 (11.1%) |
| $75,000 to $99,999 | 15 (8.9%) | 11 (7.2%) |
| $100,000 to $149,999 | 14 (8.3%) | 3 (2.0%) |
| $150,000 or more | 0 (0.0%) | 7 (4.6%) |
| Total | 169 (100.0%) | 153 (100.0%) |
Monthly Housing Cost Tiers in Colcord
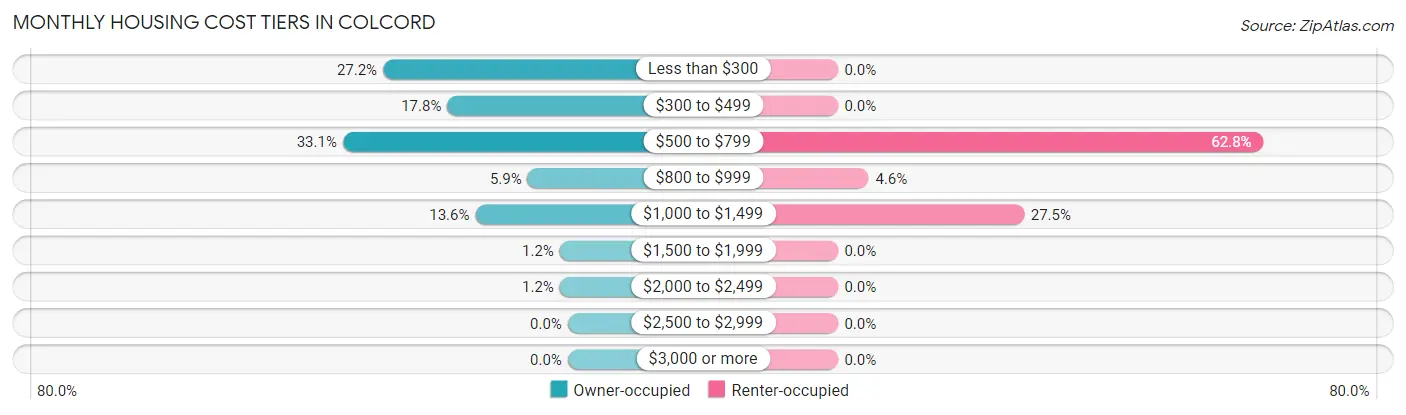
| Monthly Cost | Owner-occupied | Renter-occupied |
| Less than $300 | 46 (27.2%) | 0 (0.0%) |
| $300 to $499 | 30 (17.7%) | 0 (0.0%) |
| $500 to $799 | 56 (33.1%) | 96 (62.7%) |
| $800 to $999 | 10 (5.9%) | 7 (4.6%) |
| $1,000 to $1,499 | 23 (13.6%) | 42 (27.5%) |
| $1,500 to $1,999 | 2 (1.2%) | 0 (0.0%) |
| $2,000 to $2,499 | 2 (1.2%) | 0 (0.0%) |
| $2,500 to $2,999 | 0 (0.0%) | 0 (0.0%) |
| $3,000 or more | 0 (0.0%) | 0 (0.0%) |
| Total | 169 (100.0%) | 153 (100.0%) |
Physical Housing Characteristics in Colcord
Housing Structures in Colcord
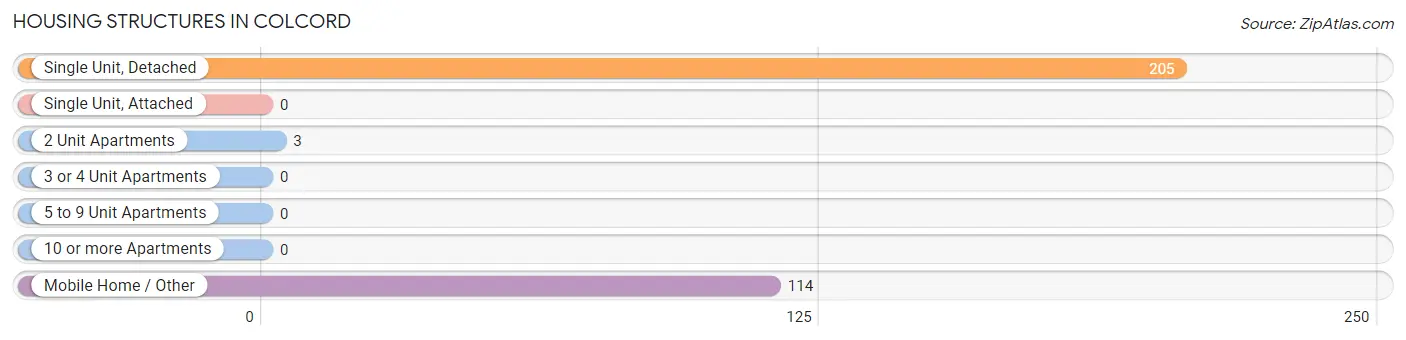
| Structure Type | # Housing Units | % Housing Units |
| Single Unit, Detached | 205 | 63.7% |
| Single Unit, Attached | 0 | 0.0% |
| 2 Unit Apartments | 3 | 0.9% |
| 3 or 4 Unit Apartments | 0 | 0.0% |
| 5 to 9 Unit Apartments | 0 | 0.0% |
| 10 or more Apartments | 0 | 0.0% |
| Mobile Home / Other | 114 | 35.4% |
| Total | 322 | 100.0% |
Housing Structures by Occupancy in Colcord
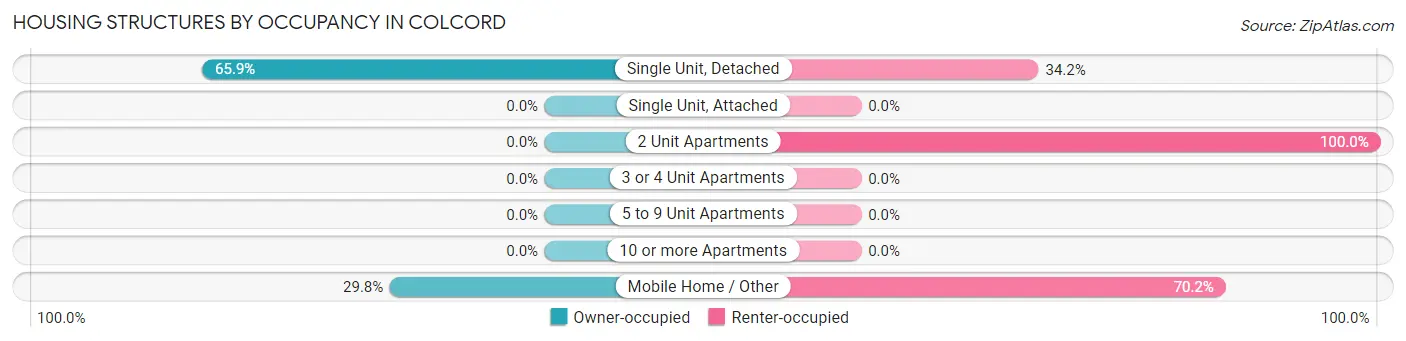
| Structure Type | Owner-occupied | Renter-occupied |
| Single Unit, Detached | 135 (65.8%) | 70 (34.2%) |
| Single Unit, Attached | 0 (0.0%) | 0 (0.0%) |
| 2 Unit Apartments | 0 (0.0%) | 3 (100.0%) |
| 3 or 4 Unit Apartments | 0 (0.0%) | 0 (0.0%) |
| 5 to 9 Unit Apartments | 0 (0.0%) | 0 (0.0%) |
| 10 or more Apartments | 0 (0.0%) | 0 (0.0%) |
| Mobile Home / Other | 34 (29.8%) | 80 (70.2%) |
| Total | 169 (52.5%) | 153 (47.5%) |
Housing Structures by Number of Rooms in Colcord
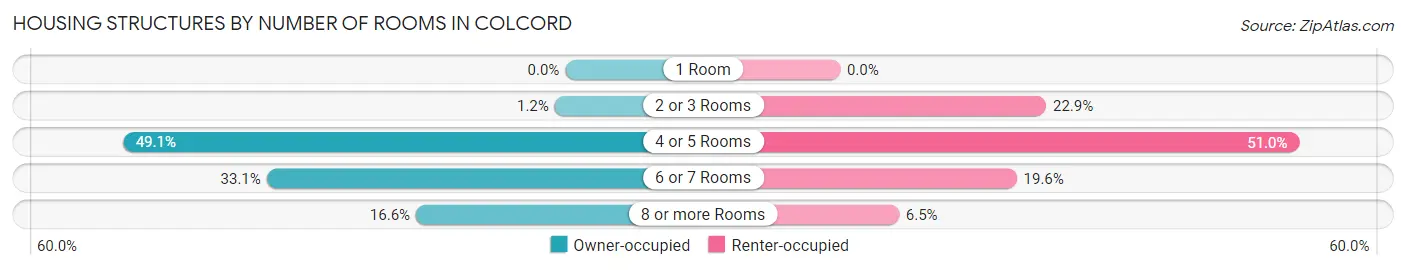
| Number of Rooms | Owner-occupied | Renter-occupied |
| 1 Room | 0 (0.0%) | 0 (0.0%) |
| 2 or 3 Rooms | 2 (1.2%) | 35 (22.9%) |
| 4 or 5 Rooms | 83 (49.1%) | 78 (51.0%) |
| 6 or 7 Rooms | 56 (33.1%) | 30 (19.6%) |
| 8 or more Rooms | 28 (16.6%) | 10 (6.5%) |
| Total | 169 (100.0%) | 153 (100.0%) |
Housing Structure by Heating Type in Colcord
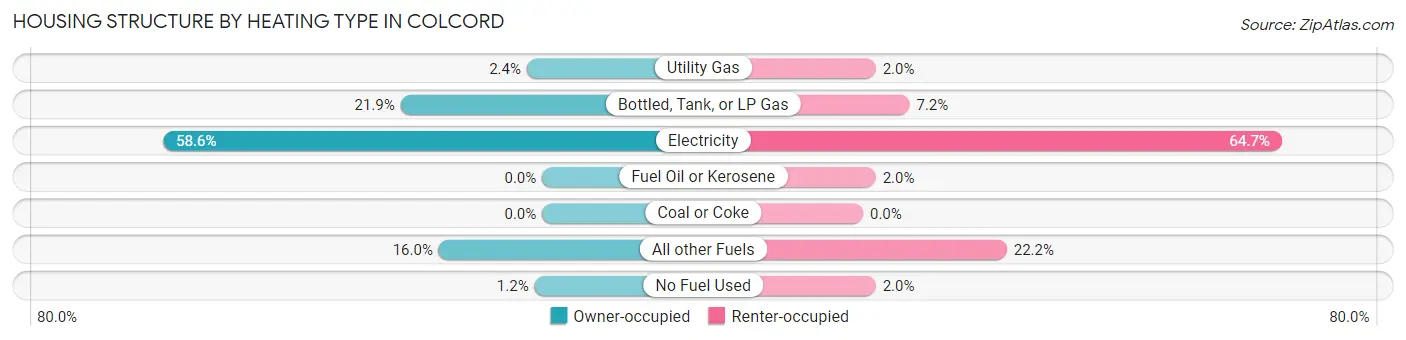
| Heating Type | Owner-occupied | Renter-occupied |
| Utility Gas | 4 (2.4%) | 3 (2.0%) |
| Bottled, Tank, or LP Gas | 37 (21.9%) | 11 (7.2%) |
| Electricity | 99 (58.6%) | 99 (64.7%) |
| Fuel Oil or Kerosene | 0 (0.0%) | 3 (2.0%) |
| Coal or Coke | 0 (0.0%) | 0 (0.0%) |
| All other Fuels | 27 (16.0%) | 34 (22.2%) |
| No Fuel Used | 2 (1.2%) | 3 (2.0%) |
| Total | 169 (100.0%) | 153 (100.0%) |
Household Vehicle Usage in Colcord
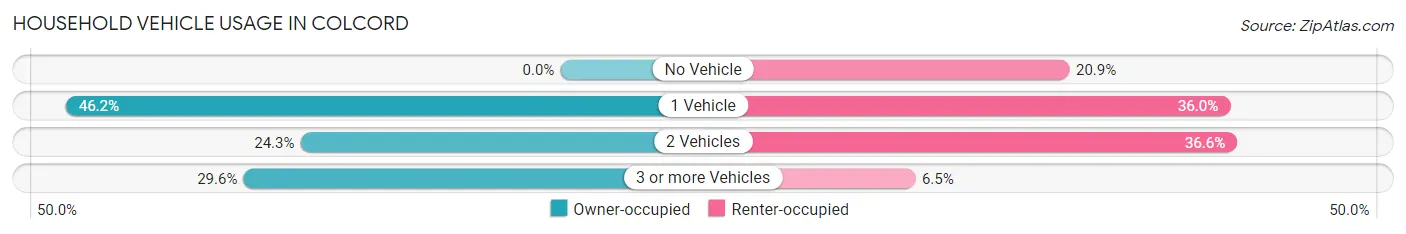
| Vehicles per Household | Owner-occupied | Renter-occupied |
| No Vehicle | 0 (0.0%) | 32 (20.9%) |
| 1 Vehicle | 78 (46.2%) | 55 (35.9%) |
| 2 Vehicles | 41 (24.3%) | 56 (36.6%) |
| 3 or more Vehicles | 50 (29.6%) | 10 (6.5%) |
| Total | 169 (100.0%) | 153 (100.0%) |
Real Estate & Mortgages in Colcord
Real Estate and Mortgage Overview in Colcord
| Characteristic | Without Mortgage | With Mortgage |
| Housing Units | 99 | 70 |
| Median Property Value | $94,200 | $77,500 |
| Median Household Income | $27,171 | $0 |
| Monthly Housing Costs | $329 | $0 |
| Real Estate Taxes | $483 | $0 |
Property Value by Mortgage Status in Colcord
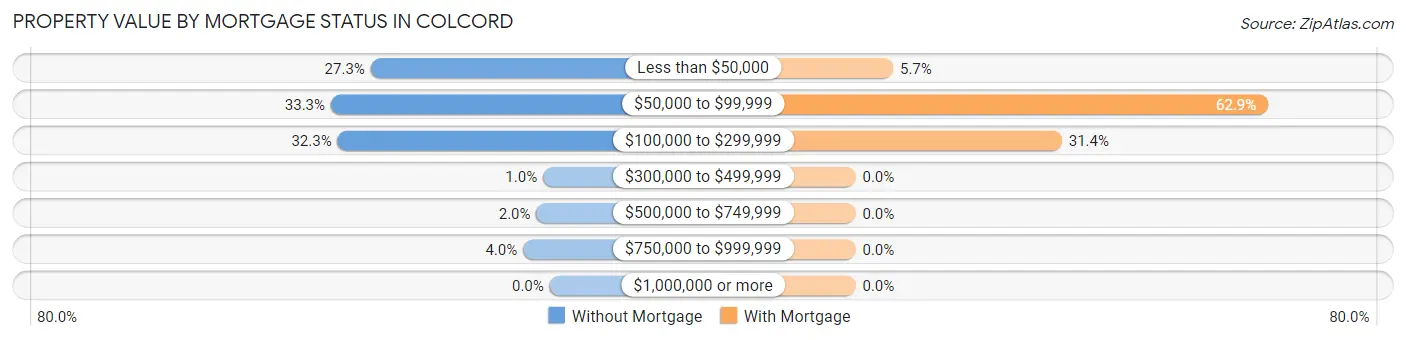
| Property Value | Without Mortgage | With Mortgage |
| Less than $50,000 | 27 (27.3%) | 4 (5.7%) |
| $50,000 to $99,999 | 33 (33.3%) | 44 (62.9%) |
| $100,000 to $299,999 | 32 (32.3%) | 22 (31.4%) |
| $300,000 to $499,999 | 1 (1.0%) | 0 (0.0%) |
| $500,000 to $749,999 | 2 (2.0%) | 0 (0.0%) |
| $750,000 to $999,999 | 4 (4.0%) | 0 (0.0%) |
| $1,000,000 or more | 0 (0.0%) | 0 (0.0%) |
| Total | 99 (100.0%) | 70 (100.0%) |
Household Income by Mortgage Status in Colcord
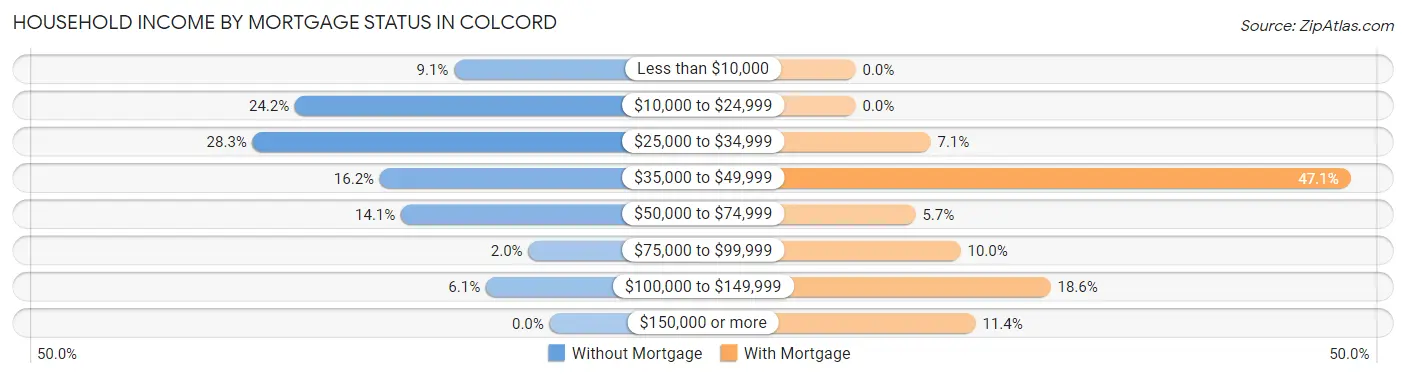
| Household Income | Without Mortgage | With Mortgage |
| Less than $10,000 | 9 (9.1%) | 0 (0.0%) |
| $10,000 to $24,999 | 24 (24.2%) | 0 (0.0%) |
| $25,000 to $34,999 | 28 (28.3%) | 5 (7.1%) |
| $35,000 to $49,999 | 16 (16.2%) | 33 (47.1%) |
| $50,000 to $74,999 | 14 (14.1%) | 4 (5.7%) |
| $75,000 to $99,999 | 2 (2.0%) | 7 (10.0%) |
| $100,000 to $149,999 | 6 (6.1%) | 13 (18.6%) |
| $150,000 or more | 0 (0.0%) | 8 (11.4%) |
| Total | 99 (100.0%) | 70 (100.0%) |
Property Value to Household Income Ratio in Colcord
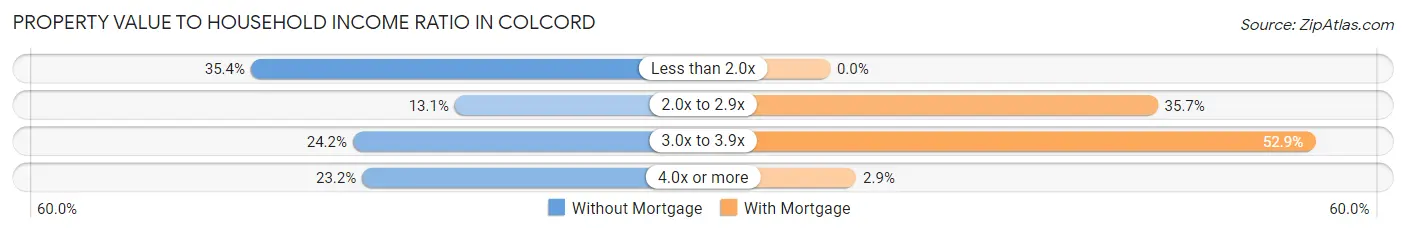
| Value-to-Income Ratio | Without Mortgage | With Mortgage |
| Less than 2.0x | 35 (35.3%) | 0 (0.0%) |
| 2.0x to 2.9x | 13 (13.1%) | 25 (35.7%) |
| 3.0x to 3.9x | 24 (24.2%) | 37 (52.9%) |
| 4.0x or more | 23 (23.2%) | 2 (2.9%) |
| Total | 99 (100.0%) | 70 (100.0%) |
Real Estate Taxes by Mortgage Status in Colcord
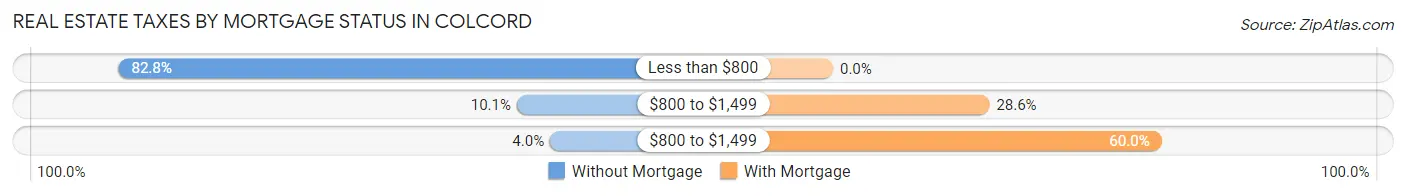
| Property Taxes | Without Mortgage | With Mortgage |
| Less than $800 | 82 (82.8%) | 0 (0.0%) |
| $800 to $1,499 | 10 (10.1%) | 20 (28.6%) |
| $800 to $1,499 | 4 (4.0%) | 42 (60.0%) |
| Total | 99 (100.0%) | 70 (100.0%) |
Health & Disability in Colcord
Health Insurance Coverage by Age in Colcord
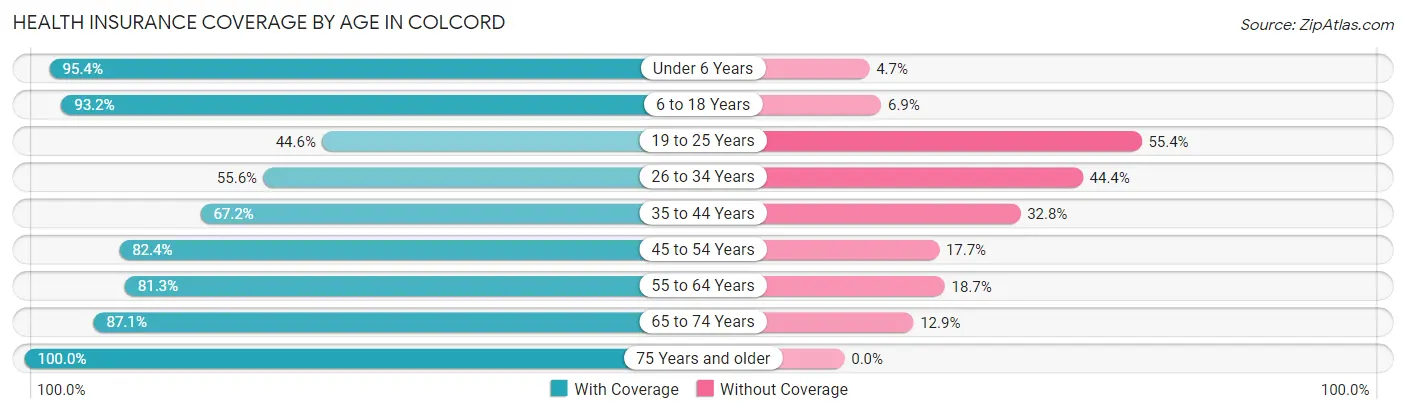
| Age Bracket | With Coverage | Without Coverage |
| Under 6 Years | 41 (95.4%) | 2 (4.6%) |
| 6 to 18 Years | 136 (93.1%) | 10 (6.9%) |
| 19 to 25 Years | 33 (44.6%) | 41 (55.4%) |
| 26 to 34 Years | 45 (55.6%) | 36 (44.4%) |
| 35 to 44 Years | 84 (67.2%) | 41 (32.8%) |
| 45 to 54 Years | 84 (82.4%) | 18 (17.6%) |
| 55 to 64 Years | 100 (81.3%) | 23 (18.7%) |
| 65 to 74 Years | 61 (87.1%) | 9 (12.9%) |
| 75 Years and older | 63 (100.0%) | 0 (0.0%) |
| Total | 647 (78.2%) | 180 (21.8%) |
Health Insurance Coverage by Citizenship Status in Colcord
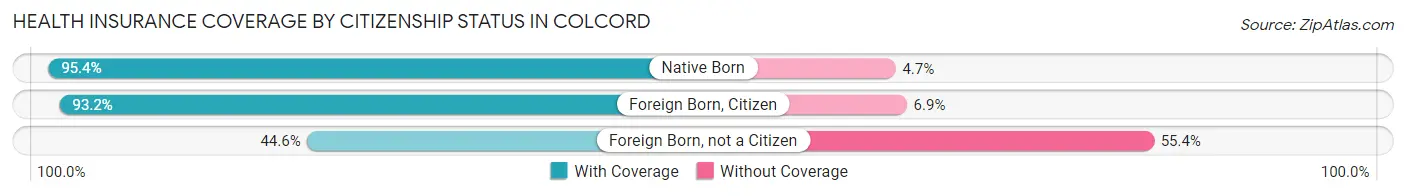
| Citizenship Status | With Coverage | Without Coverage |
| Native Born | 41 (95.4%) | 2 (4.6%) |
| Foreign Born, Citizen | 136 (93.1%) | 10 (6.9%) |
| Foreign Born, not a Citizen | 33 (44.6%) | 41 (55.4%) |
Health Insurance Coverage by Household Income in Colcord
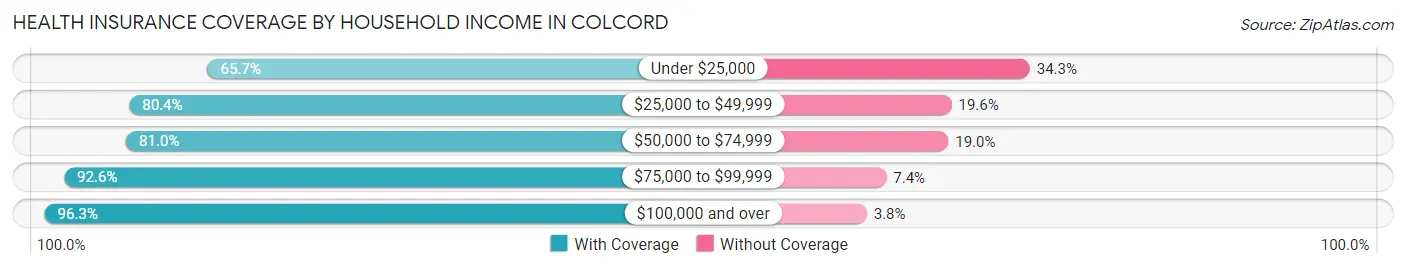
| Household Income | With Coverage | Without Coverage |
| Under $25,000 | 184 (65.7%) | 96 (34.3%) |
| $25,000 to $49,999 | 213 (80.4%) | 52 (19.6%) |
| $50,000 to $74,999 | 98 (81.0%) | 23 (19.0%) |
| $75,000 to $99,999 | 75 (92.6%) | 6 (7.4%) |
| $100,000 and over | 77 (96.3%) | 3 (3.7%) |
Public vs Private Health Insurance Coverage by Age in Colcord
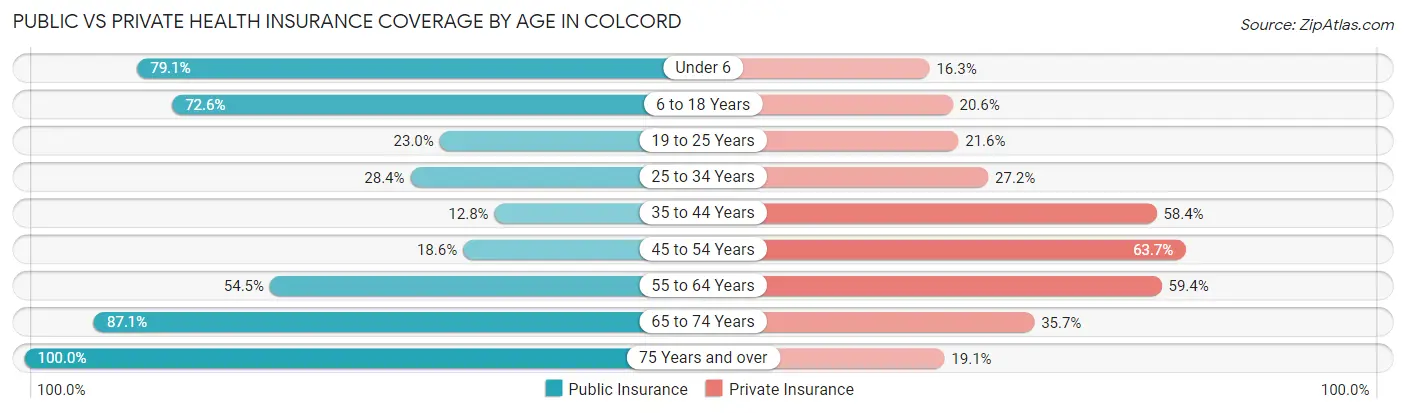
| Age Bracket | Public Insurance | Private Insurance |
| Under 6 | 34 (79.1%) | 7 (16.3%) |
| 6 to 18 Years | 106 (72.6%) | 30 (20.5%) |
| 19 to 25 Years | 17 (23.0%) | 16 (21.6%) |
| 25 to 34 Years | 23 (28.4%) | 22 (27.2%) |
| 35 to 44 Years | 16 (12.8%) | 73 (58.4%) |
| 45 to 54 Years | 19 (18.6%) | 65 (63.7%) |
| 55 to 64 Years | 67 (54.5%) | 73 (59.4%) |
| 65 to 74 Years | 61 (87.1%) | 25 (35.7%) |
| 75 Years and over | 63 (100.0%) | 12 (19.1%) |
| Total | 406 (49.1%) | 323 (39.1%) |
Disability Status by Sex by Age in Colcord
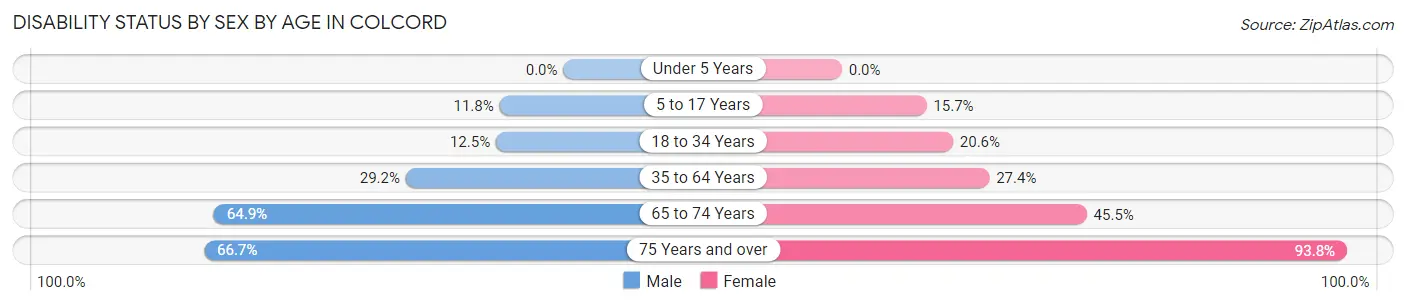
| Age Bracket | Male | Female |
| Under 5 Years | 0 (0.0%) | 0 (0.0%) |
| 5 to 17 Years | 9 (11.8%) | 11 (15.7%) |
| 18 to 34 Years | 8 (12.5%) | 20 (20.6%) |
| 35 to 64 Years | 50 (29.2%) | 49 (27.4%) |
| 65 to 74 Years | 24 (64.9%) | 15 (45.5%) |
| 75 Years and over | 10 (66.7%) | 45 (93.8%) |
Disability Class by Sex by Age in Colcord
Disability Class: Hearing Difficulty
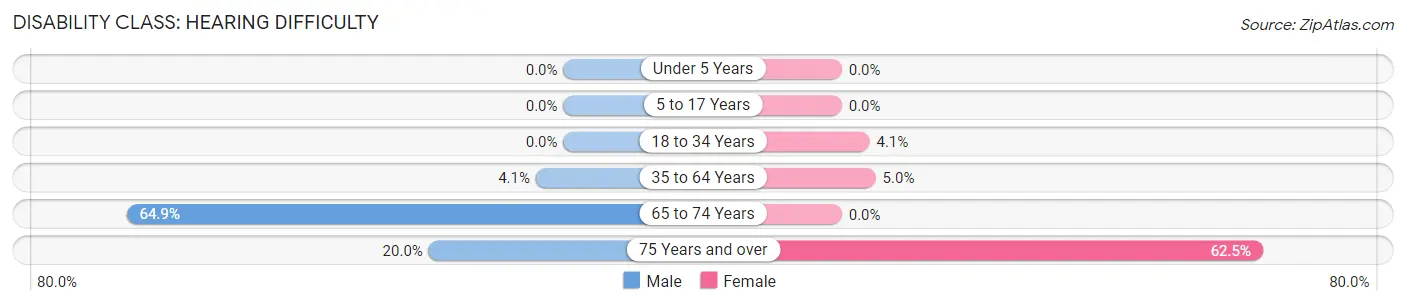
| Age Bracket | Male | Female |
| Under 5 Years | 0 (0.0%) | 0 (0.0%) |
| 5 to 17 Years | 0 (0.0%) | 0 (0.0%) |
| 18 to 34 Years | 0 (0.0%) | 4 (4.1%) |
| 35 to 64 Years | 7 (4.1%) | 9 (5.0%) |
| 65 to 74 Years | 24 (64.9%) | 0 (0.0%) |
| 75 Years and over | 3 (20.0%) | 30 (62.5%) |
Disability Class: Vision Difficulty
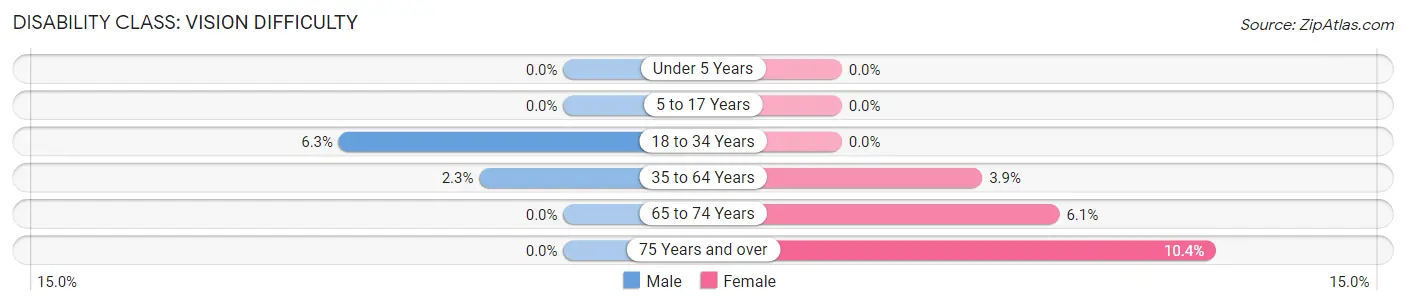
| Age Bracket | Male | Female |
| Under 5 Years | 0 (0.0%) | 0 (0.0%) |
| 5 to 17 Years | 0 (0.0%) | 0 (0.0%) |
| 18 to 34 Years | 4 (6.2%) | 0 (0.0%) |
| 35 to 64 Years | 4 (2.3%) | 7 (3.9%) |
| 65 to 74 Years | 0 (0.0%) | 2 (6.1%) |
| 75 Years and over | 0 (0.0%) | 5 (10.4%) |
Disability Class: Cognitive Difficulty
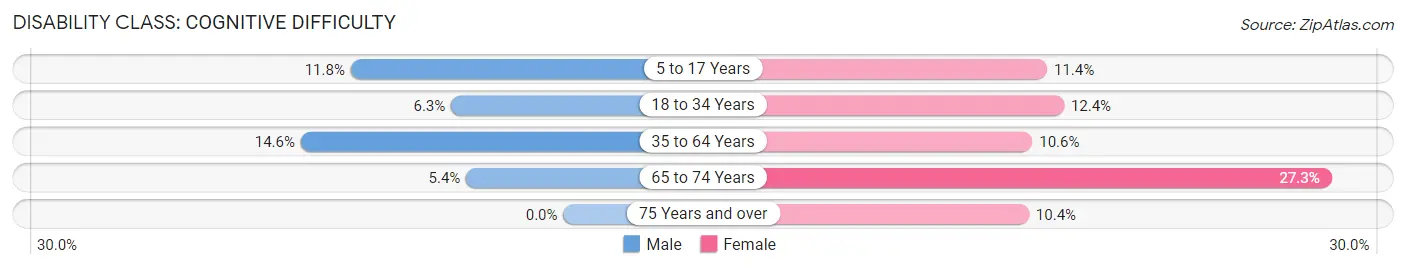
| Age Bracket | Male | Female |
| 5 to 17 Years | 9 (11.8%) | 8 (11.4%) |
| 18 to 34 Years | 4 (6.2%) | 12 (12.4%) |
| 35 to 64 Years | 25 (14.6%) | 19 (10.6%) |
| 65 to 74 Years | 2 (5.4%) | 9 (27.3%) |
| 75 Years and over | 0 (0.0%) | 5 (10.4%) |
Disability Class: Ambulatory Difficulty
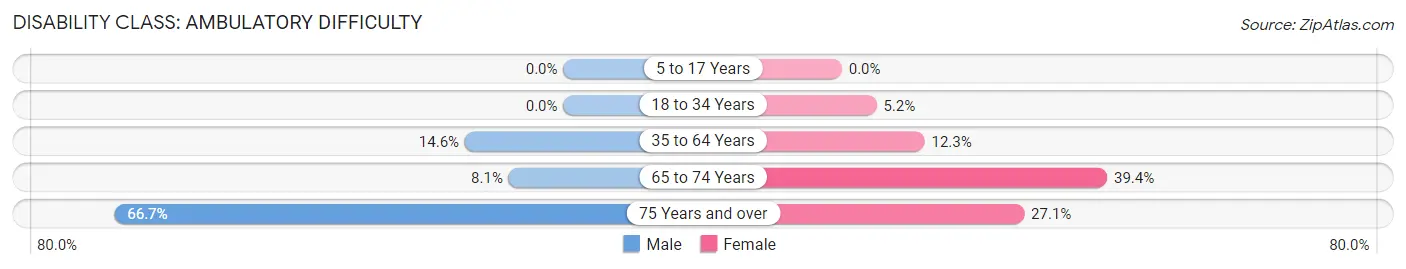
| Age Bracket | Male | Female |
| 5 to 17 Years | 0 (0.0%) | 0 (0.0%) |
| 18 to 34 Years | 0 (0.0%) | 5 (5.1%) |
| 35 to 64 Years | 25 (14.6%) | 22 (12.3%) |
| 65 to 74 Years | 3 (8.1%) | 13 (39.4%) |
| 75 Years and over | 10 (66.7%) | 13 (27.1%) |
Disability Class: Self-Care Difficulty
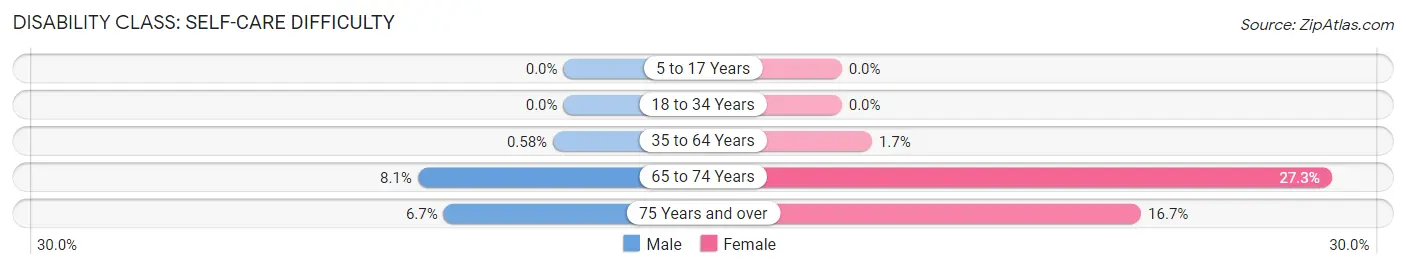
| Age Bracket | Male | Female |
| 5 to 17 Years | 0 (0.0%) | 0 (0.0%) |
| 18 to 34 Years | 0 (0.0%) | 0 (0.0%) |
| 35 to 64 Years | 1 (0.6%) | 3 (1.7%) |
| 65 to 74 Years | 3 (8.1%) | 9 (27.3%) |
| 75 Years and over | 1 (6.7%) | 8 (16.7%) |
Technology Access in Colcord
Computing Device Access in Colcord
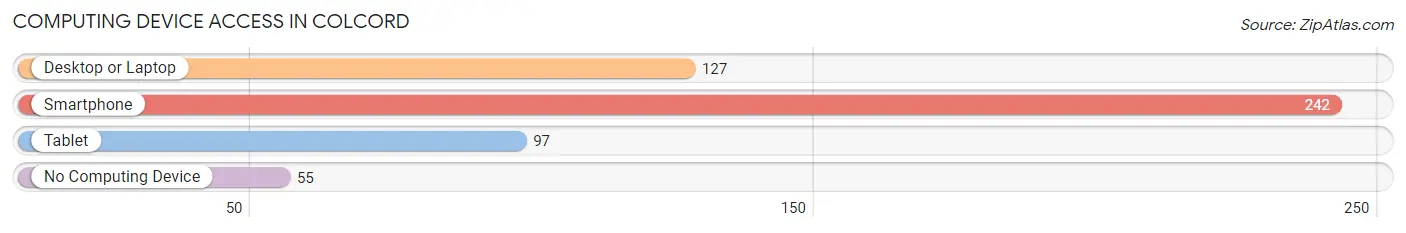
| Device Type | # Households | % Households |
| Desktop or Laptop | 127 | 39.4% |
| Smartphone | 242 | 75.2% |
| Tablet | 97 | 30.1% |
| No Computing Device | 55 | 17.1% |
| Total | 322 | 100.0% |
Internet Access in Colcord
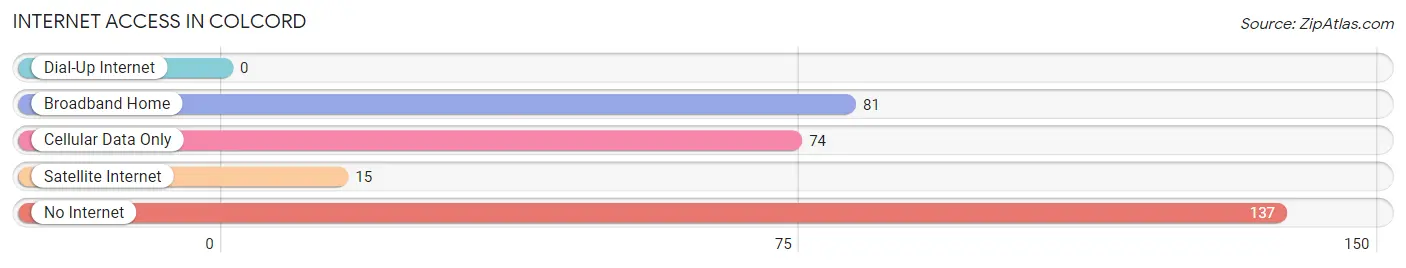
| Internet Type | # Households | % Households |
| Dial-Up Internet | 0 | 0.0% |
| Broadband Home | 81 | 25.2% |
| Cellular Data Only | 74 | 23.0% |
| Satellite Internet | 15 | 4.7% |
| No Internet | 137 | 42.5% |
| Total | 322 | 100.0% |
Colcord Summary
Colcord, Oklahoma is a small town located in the northeast corner of the state, near the Arkansas border. It is part of Delaware County and is situated in the foothills of the Ozark Mountains. The town was founded in 1891 and was named after the Colcord family, who were early settlers in the area. The population of Colcord was 1,092 in the 2010 census.
Geography
Colcord is located in the foothills of the Ozark Mountains, in the northeast corner of Oklahoma. It is situated in the Ozark Plateau, which is characterized by rolling hills and valleys. The town is located on the banks of the Illinois River, which is a tributary of the Arkansas River. The town is surrounded by forests and is home to a variety of wildlife, including deer, turkey, and other small game.
The climate in Colcord is temperate, with hot summers and mild winters. The average temperature in the summer is around 80 degrees Fahrenheit, and the average temperature in the winter is around 40 degrees Fahrenheit. The town receives an average of 40 inches of precipitation per year, with most of it falling in the spring and summer months.
Economy
The economy of Colcord is largely based on agriculture and tourism. The town is home to several farms, which produce a variety of crops, including corn, soybeans, wheat, and hay. The town is also home to several small businesses, including restaurants, retail stores, and service providers.
Tourism is an important part of the economy in Colcord. The town is home to several attractions, including the Illinois River, which is a popular spot for fishing and boating. The town is also home to several parks, including the Colcord State Park, which offers camping, hiking, and other outdoor activities.
Demographics
The population of Colcord was 1,092 in the 2010 census. The town is predominantly white, with 92.3% of the population identifying as white. The remaining population is made up of African Americans (3.2%), Native Americans (2.2%), and other races (2.3%).
The median household income in Colcord is $35,938, which is lower than the state average of $48,977. The median age in Colcord is 41.3, which is slightly higher than the state average of 37.7. The town has a poverty rate of 17.3%, which is higher than the state average of 14.7%.
Conclusion
Colcord, Oklahoma is a small town located in the northeast corner of the state, near the Arkansas border. It is part of Delaware County and is situated in the foothills of the Ozark Mountains. The town was founded in 1891 and was named after the Colcord family, who were early settlers in the area. The population of Colcord was 1,092 in the 2010 census. The economy of Colcord is largely based on agriculture and tourism, and the town is home to several attractions, including the Illinois River. The population of Colcord is predominantly white, with a median household income of $35,938 and a poverty rate of 17.3%.
Common Questions
What is Per Capita Income in Colcord?
Per Capita income in Colcord is $17,679.
What is the Median Family Income in Colcord?
Median Family Income in Colcord is $30,917.
What is the Median Household income in Colcord?
Median Household Income in Colcord is $29,792.
What is Income or Wage Gap in Colcord?
Income or Wage Gap in Colcord is 59.9%.
Women in Colcord earn 40.1 cents for every dollar earned by a man.
What is Inequality or Gini Index in Colcord?
Inequality or Gini Index in Colcord is 0.40.
What is the Total Population of Colcord?
Total Population of Colcord is 827.
What is the Total Male Population of Colcord?
Total Male Population of Colcord is 382.
What is the Total Female Population of Colcord?
Total Female Population of Colcord is 445.
What is the Ratio of Males per 100 Females in Colcord?
There are 85.84 Males per 100 Females in Colcord.
What is the Ratio of Females per 100 Males in Colcord?
There are 116.49 Females per 100 Males in Colcord.
What is the Median Population Age in Colcord?
Median Population Age in Colcord is 40.2 Years.
What is the Average Family Size in Colcord
Average Family Size in Colcord is 3.0 People.
What is the Average Household Size in Colcord
Average Household Size in Colcord is 2.6 People.
How Large is the Labor Force in Colcord?
There are 344 People in the Labor Forcein in Colcord.
What is the Percentage of People in the Labor Force in Colcord?
51.5% of People are in the Labor Force in Colcord.
What is the Unemployment Rate in Colcord?
Unemployment Rate in Colcord is 7.6%.