Clinton, OK Map & Demographics
Clinton Map
Clinton Overview
$33,591
PER CAPITA INCOME
$80,288
AVG FAMILY INCOME
$62,368
AVG HOUSEHOLD INCOME
46.3%
WAGE / INCOME GAP [ % ]
53.7¢/ $1
WAGE / INCOME GAP [ $ ]
0.48
INEQUALITY / GINI INDEX
8,499
TOTAL POPULATION
4,266
MALE POPULATION
4,233
FEMALE POPULATION
100.78
MALES / 100 FEMALES
99.23
FEMALES / 100 MALES
37.4
MEDIAN AGE
3.0
AVG FAMILY SIZE
2.5
AVG HOUSEHOLD SIZE
4,419
LABOR FORCE [ PEOPLE ]
68.2%
PERCENT IN LABOR FORCE
Clinton Zip Codes
Clinton Area Codes
Income in Clinton
Income Overview in Clinton
Per Capita Income in Clinton is $33,591, while median incomes of families and households are $80,288 and $62,368 respectively.
| Characteristic | Number | Measure |
| Per Capita Income | 8,499 | $33,591 |
| Median Family Income | 2,347 | $80,288 |
| Mean Family Income | 2,347 | $111,092 |
| Median Household Income | 3,259 | $62,368 |
| Mean Household Income | 3,259 | $94,084 |
| Income Deficit | 2,347 | $0 |
| Wage / Income Gap (%) | 8,499 | 46.28% |
| Wage / Income Gap ($) | 8,499 | 53.72¢ per $1 |
| Gini / Inequality Index | 8,499 | 0.48 |
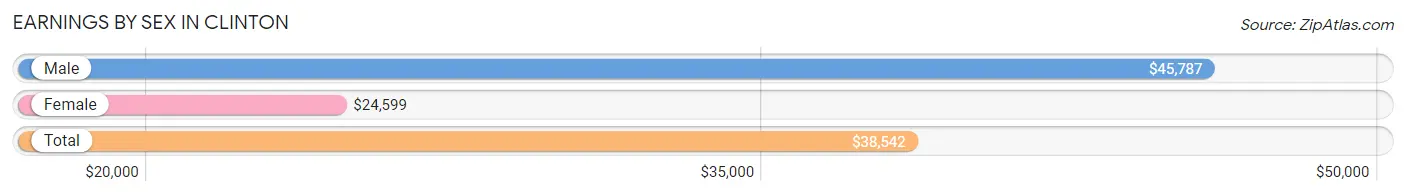
Earnings by Sex in Clinton
Average Earnings in Clinton are $38,542, $45,787 for men and $24,599 for women, a difference of 46.3%.
| Sex | Number | Average Earnings |
| Male | 2,477 (54.6%) | $45,787 |
| Female | 2,061 (45.4%) | $24,599 |
| Total | 4,538 (100.0%) | $38,542 |
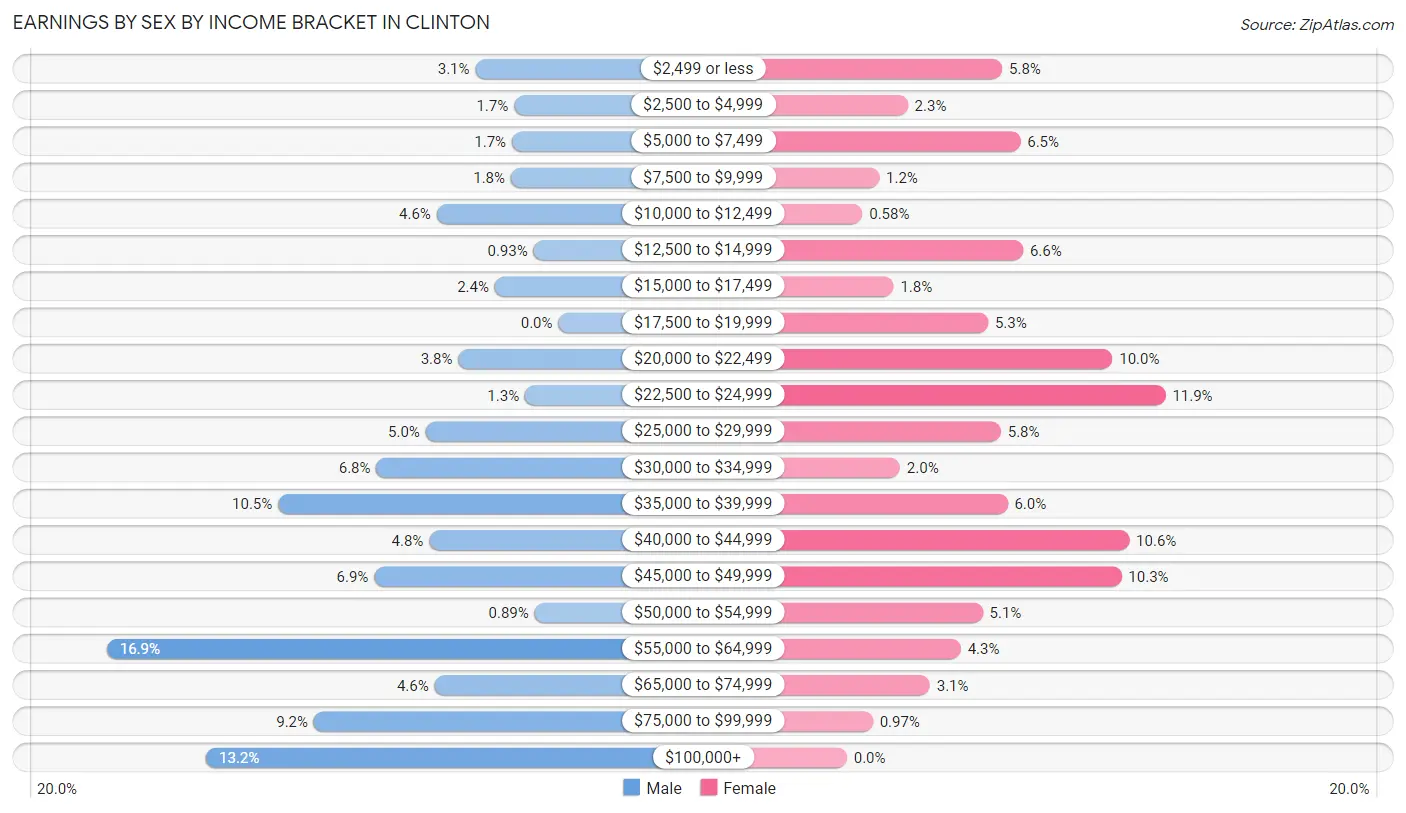
Earnings by Sex by Income Bracket in Clinton
The most common earnings brackets in Clinton are $55,000 to $64,999 for men (419 | 16.9%) and $22,500 to $24,999 for women (246 | 11.9%).
| Income | Male | Female |
| $2,499 or less | 77 (3.1%) | 120 (5.8%) |
| $2,500 to $4,999 | 41 (1.7%) | 47 (2.3%) |
| $5,000 to $7,499 | 43 (1.7%) | 134 (6.5%) |
| $7,500 to $9,999 | 44 (1.8%) | 25 (1.2%) |
| $10,000 to $12,499 | 113 (4.6%) | 12 (0.6%) |
| $12,500 to $14,999 | 23 (0.9%) | 136 (6.6%) |
| $15,000 to $17,499 | 59 (2.4%) | 36 (1.8%) |
| $17,500 to $19,999 | 0 (0.0%) | 109 (5.3%) |
| $20,000 to $22,499 | 93 (3.7%) | 205 (10.0%) |
| $22,500 to $24,999 | 31 (1.3%) | 246 (11.9%) |
| $25,000 to $29,999 | 123 (5.0%) | 119 (5.8%) |
| $30,000 to $34,999 | 169 (6.8%) | 41 (2.0%) |
| $35,000 to $39,999 | 260 (10.5%) | 124 (6.0%) |
| $40,000 to $44,999 | 120 (4.8%) | 218 (10.6%) |
| $45,000 to $49,999 | 171 (6.9%) | 212 (10.3%) |
| $50,000 to $54,999 | 22 (0.9%) | 105 (5.1%) |
| $55,000 to $64,999 | 419 (16.9%) | 88 (4.3%) |
| $65,000 to $74,999 | 115 (4.6%) | 64 (3.1%) |
| $75,000 to $99,999 | 227 (9.2%) | 20 (1.0%) |
| $100,000+ | 327 (13.2%) | 0 (0.0%) |
| Total | 2,477 (100.0%) | 2,061 (100.0%) |
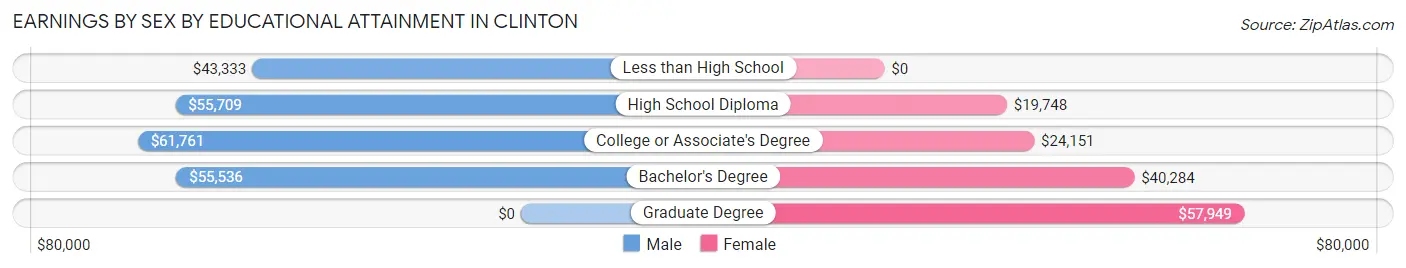
Earnings by Sex by Educational Attainment in Clinton
Average earnings in Clinton are $55,161 for men and $24,478 for women, a difference of 55.6%. Men with an educational attainment of college or associate's degree enjoy the highest average annual earnings of $61,761, while those with less than high school education earn the least with $43,333. Women with an educational attainment of graduate degree earn the most with the average annual earnings of $57,949, while those with high school diploma education have the smallest earnings of $19,748.
| Educational Attainment | Male Income | Female Income |
| Less than High School | $43,333 | $0 |
| High School Diploma | $55,709 | $19,748 |
| College or Associate's Degree | $61,761 | $24,151 |
| Bachelor's Degree | $55,536 | $40,284 |
| Graduate Degree | - | - |
| Total | $55,161 | $24,478 |
Family Income in Clinton
Family Income Brackets in Clinton
According to the Clinton family income data, there are 535 families falling into the $75,000 to $99,999 income range, which is the most common income bracket and makes up 22.8% of all families. Conversely, the less than $10,000 income bracket is the least frequent group with only 14 families (0.6%) belonging to this category.
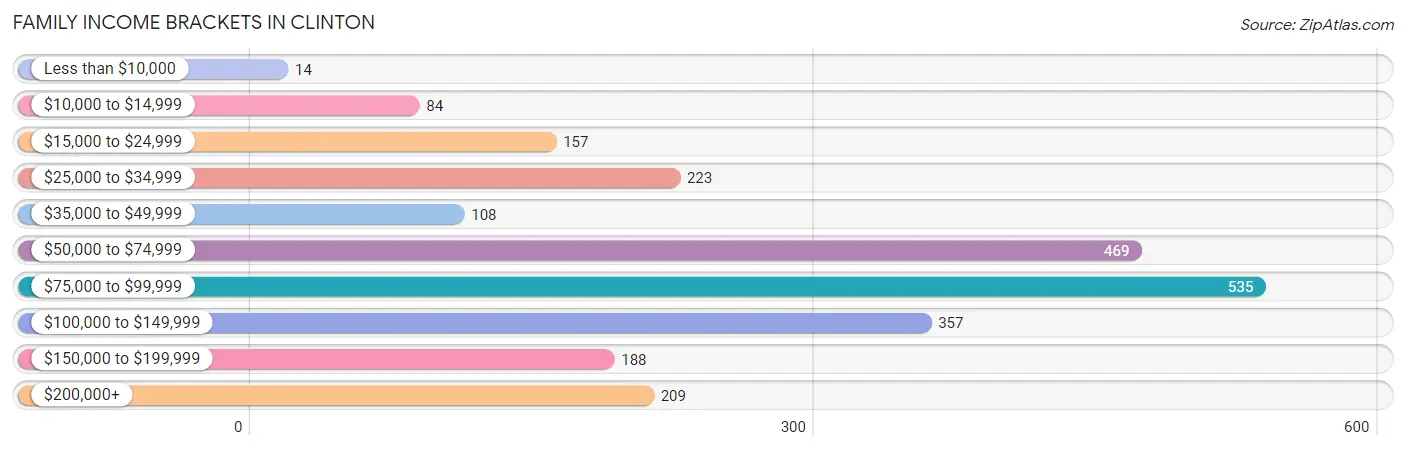
| Income Bracket | # Families | % Families |
| Less than $10,000 | 14 | 0.6% |
| $10,000 to $14,999 | 84 | 3.6% |
| $15,000 to $24,999 | 157 | 6.7% |
| $25,000 to $34,999 | 223 | 9.5% |
| $35,000 to $49,999 | 108 | 4.6% |
| $50,000 to $74,999 | 469 | 20.0% |
| $75,000 to $99,999 | 535 | 22.8% |
| $100,000 to $149,999 | 357 | 15.2% |
| $150,000 to $199,999 | 188 | 8.0% |
| $200,000+ | 209 | 8.9% |
Family Income by Famaliy Size in Clinton
4-person families (437 | 18.6%) account for the highest median family income in Clinton with $112,909 per family, while 2-person families (1,012 | 43.1%) have the highest median income of $41,905 per family member.
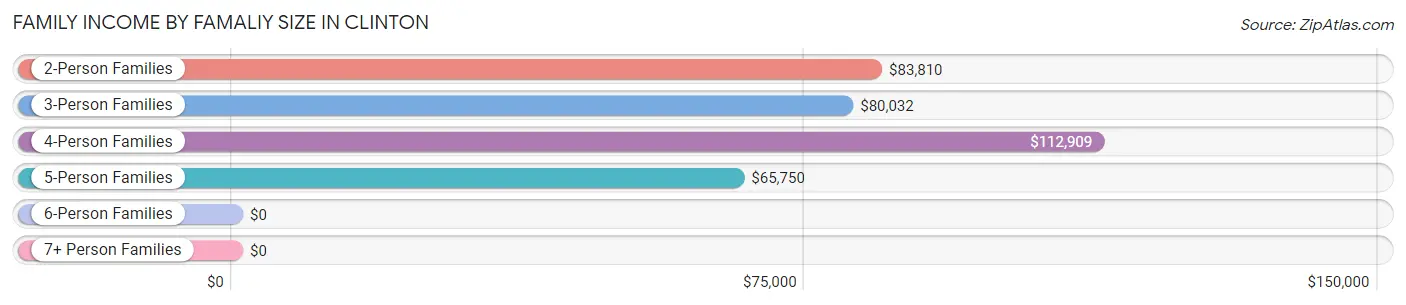
| Income Bracket | # Families | Median Income |
| 2-Person Families | 1,012 (43.1%) | $83,810 |
| 3-Person Families | 741 (31.6%) | $80,032 |
| 4-Person Families | 437 (18.6%) | $112,909 |
| 5-Person Families | 118 (5.0%) | $65,750 |
| 6-Person Families | 21 (0.9%) | $0 |
| 7+ Person Families | 18 (0.8%) | $0 |
| Total | 2,347 (100.0%) | $80,288 |
Family Income by Number of Earners in Clinton
The median family income in Clinton is $80,288, with families comprising 3+ earners (192) having the highest median family income of $113,873, while families with 1 earner (823) have the lowest median family income of $37,721, accounting for 8.2% and 35.1% of families, respectively.
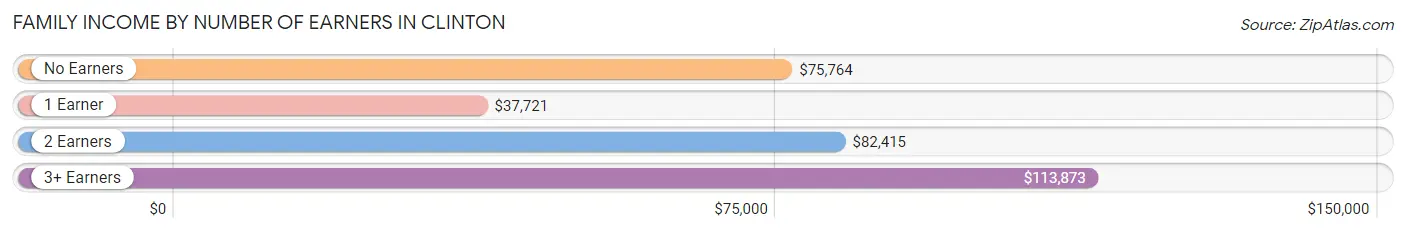
| Number of Earners | # Families | Median Income |
| No Earners | 153 (6.5%) | $75,764 |
| 1 Earner | 823 (35.1%) | $37,721 |
| 2 Earners | 1,179 (50.2%) | $82,415 |
| 3+ Earners | 192 (8.2%) | $113,873 |
| Total | 2,347 (100.0%) | $80,288 |
Household Income in Clinton
Household Income Brackets in Clinton
With 590 households falling in the category, the $50,000 to $74,999 income range is the most frequent in Clinton, accounting for 18.1% of all households. In contrast, only 65 households (2.0%) fall into the less than $10,000 income bracket, making it the least populous group.
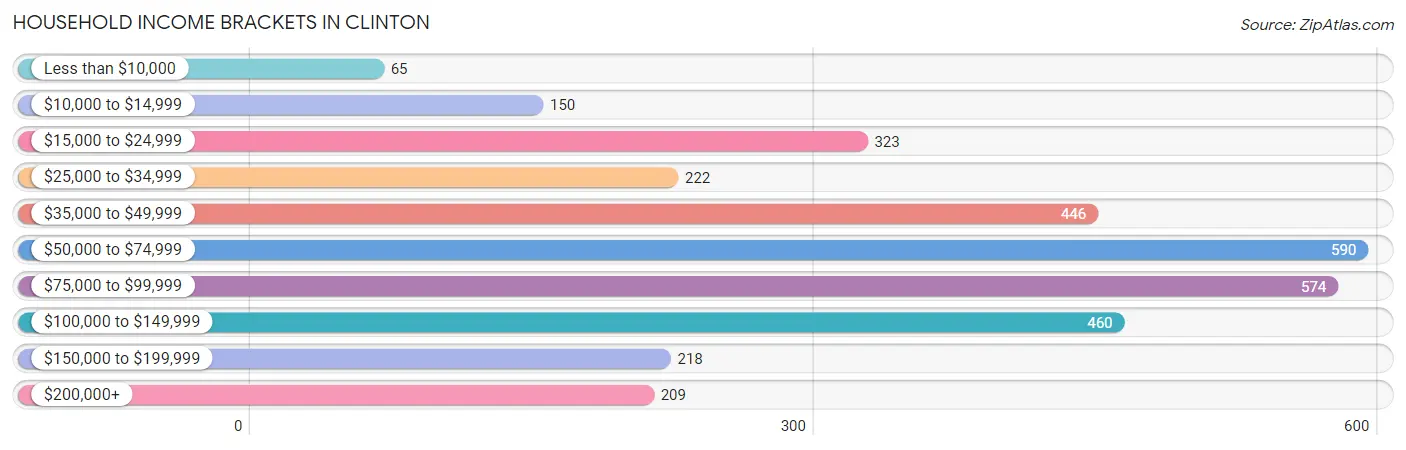
| Income Bracket | # Households | % Households |
| Less than $10,000 | 65 | 2.0% |
| $10,000 to $14,999 | 150 | 4.6% |
| $15,000 to $24,999 | 323 | 9.9% |
| $25,000 to $34,999 | 222 | 6.8% |
| $35,000 to $49,999 | 446 | 13.7% |
| $50,000 to $74,999 | 590 | 18.1% |
| $75,000 to $99,999 | 574 | 17.6% |
| $100,000 to $149,999 | 460 | 14.1% |
| $150,000 to $199,999 | 218 | 6.7% |
| $200,000+ | 209 | 6.4% |
Household Income by Householder Age in Clinton
The median household income in Clinton is $62,368, with the highest median household income of $80,451 found in the 45 to 64 years age bracket for the primary householder. A total of 1,031 households (31.6%) fall into this category. Meanwhile, the 15 to 24 years age bracket for the primary householder has the lowest median household income of $0, with 261 households (8.0%) in this group.
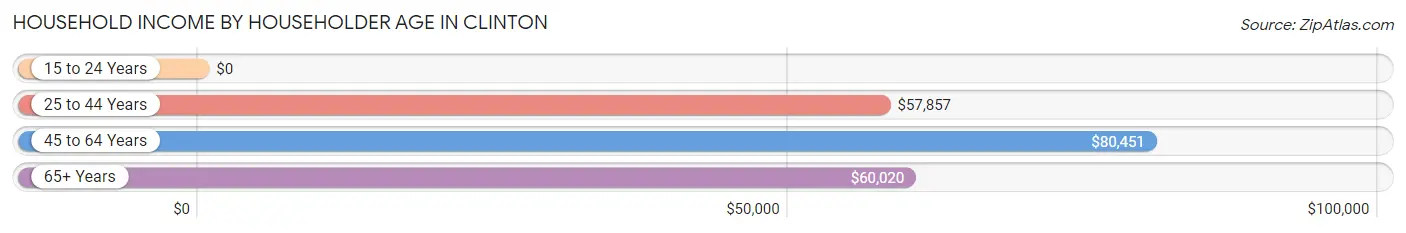
| Income Bracket | # Households | Median Income |
| 15 to 24 Years | 261 (8.0%) | $0 |
| 25 to 44 Years | 1,320 (40.5%) | $57,857 |
| 45 to 64 Years | 1,031 (31.6%) | $80,451 |
| 65+ Years | 647 (19.9%) | $60,020 |
| Total | 3,259 (100.0%) | $62,368 |
Poverty in Clinton
Income Below Poverty by Sex and Age in Clinton
With 7.8% poverty level for males and 11.1% for females among the residents of Clinton, 12 to 14 year old males and 15 year old females are the most vulnerable to poverty, with 101 males (43.9%) and 18 females (100.0%) in their respective age groups living below the poverty level.
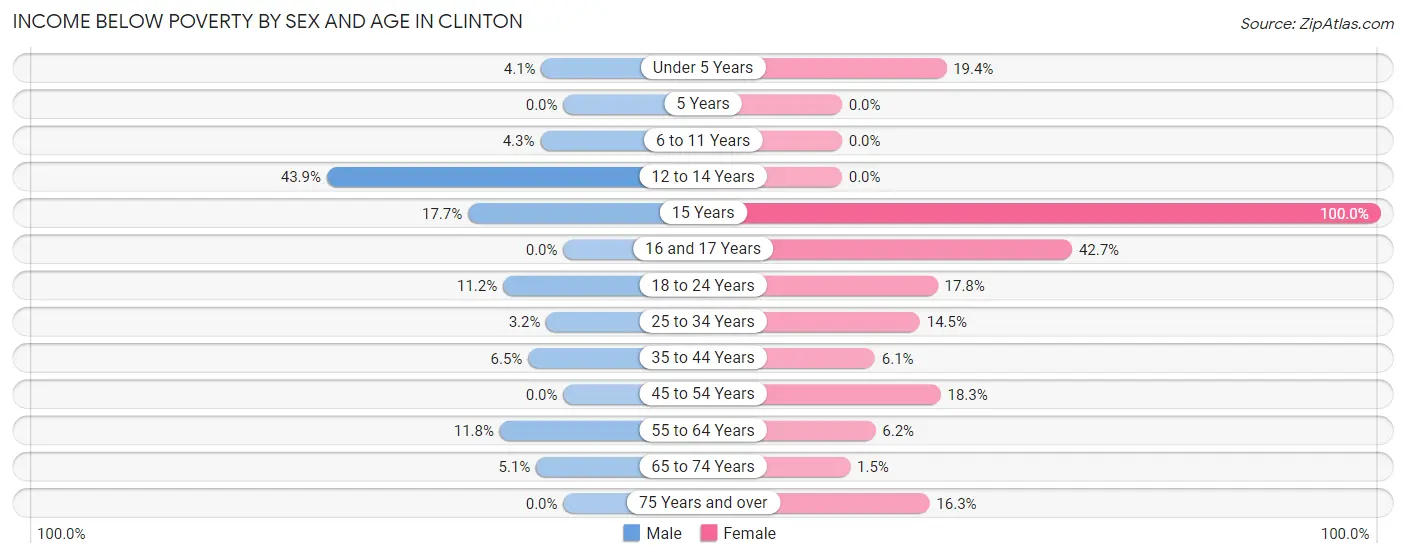
| Age Bracket | Male | Female |
| Under 5 Years | 10 (4.1%) | 62 (19.4%) |
| 5 Years | 0 (0.0%) | 0 (0.0%) |
| 6 to 11 Years | 16 (4.3%) | 0 (0.0%) |
| 12 to 14 Years | 101 (43.9%) | 0 (0.0%) |
| 15 Years | 23 (17.7%) | 18 (100.0%) |
| 16 and 17 Years | 0 (0.0%) | 44 (42.7%) |
| 18 to 24 Years | 33 (11.2%) | 61 (17.8%) |
| 25 to 34 Years | 15 (3.2%) | 64 (14.5%) |
| 35 to 44 Years | 44 (6.5%) | 40 (6.1%) |
| 45 to 54 Years | 0 (0.0%) | 81 (18.3%) |
| 55 to 64 Years | 61 (11.8%) | 36 (6.2%) |
| 65 to 74 Years | 14 (5.1%) | 5 (1.5%) |
| 75 Years and over | 0 (0.0%) | 47 (16.3%) |
| Total | 317 (7.8%) | 458 (11.1%) |
Income Above Poverty by Sex and Age in Clinton
According to the poverty statistics in Clinton, males aged 5 years and females aged 5 years are the age groups that are most secure financially, with 100.0% of males and 100.0% of females in these age groups living above the poverty line.
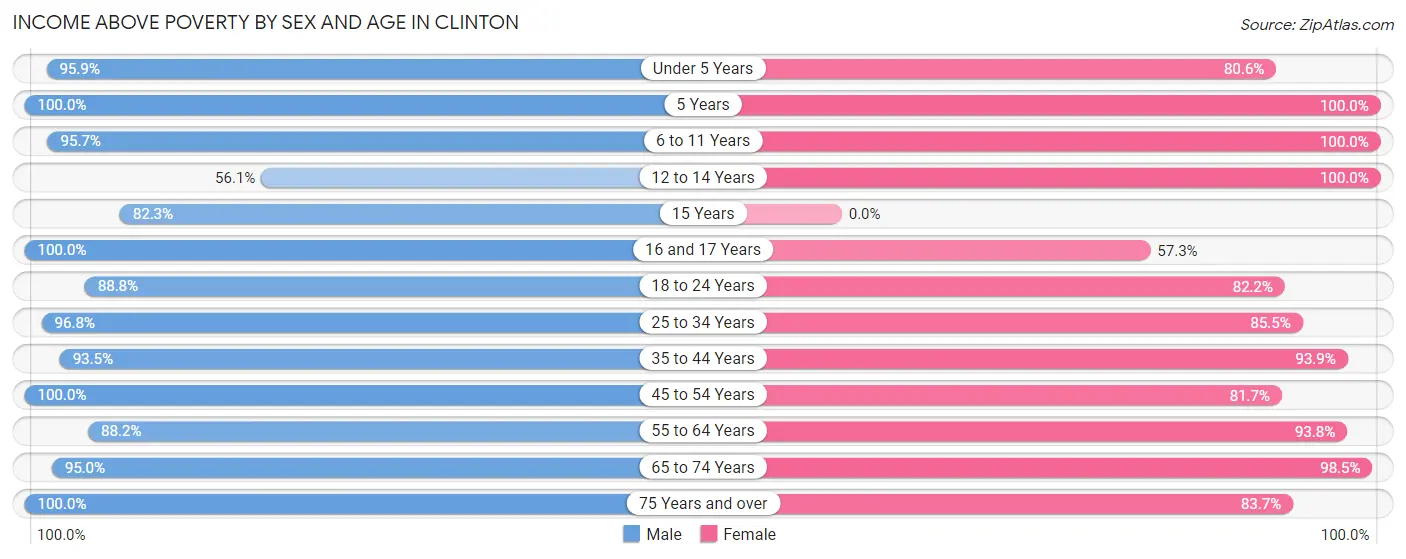
| Age Bracket | Male | Female |
| Under 5 Years | 236 (95.9%) | 258 (80.6%) |
| 5 Years | 48 (100.0%) | 112 (100.0%) |
| 6 to 11 Years | 358 (95.7%) | 279 (100.0%) |
| 12 to 14 Years | 129 (56.1%) | 224 (100.0%) |
| 15 Years | 107 (82.3%) | 0 (0.0%) |
| 16 and 17 Years | 131 (100.0%) | 59 (57.3%) |
| 18 to 24 Years | 262 (88.8%) | 282 (82.2%) |
| 25 to 34 Years | 458 (96.8%) | 378 (85.5%) |
| 35 to 44 Years | 630 (93.5%) | 612 (93.9%) |
| 45 to 54 Years | 480 (100.0%) | 361 (81.7%) |
| 55 to 64 Years | 456 (88.2%) | 542 (93.8%) |
| 65 to 74 Years | 263 (95.0%) | 320 (98.5%) |
| 75 Years and over | 172 (100.0%) | 242 (83.7%) |
| Total | 3,730 (92.2%) | 3,669 (88.9%) |
Income Below Poverty Among Married-Couple Families in Clinton
The poverty statistics for married-couple families in Clinton show that 1.7% or 29 of the total 1,719 families live below the poverty line. Families with 1 or 2 children have the highest poverty rate of 3.0%, comprising of 22 families. On the other hand, families with 3 or 4 children have the lowest poverty rate of 0.0%, which includes 0 families.
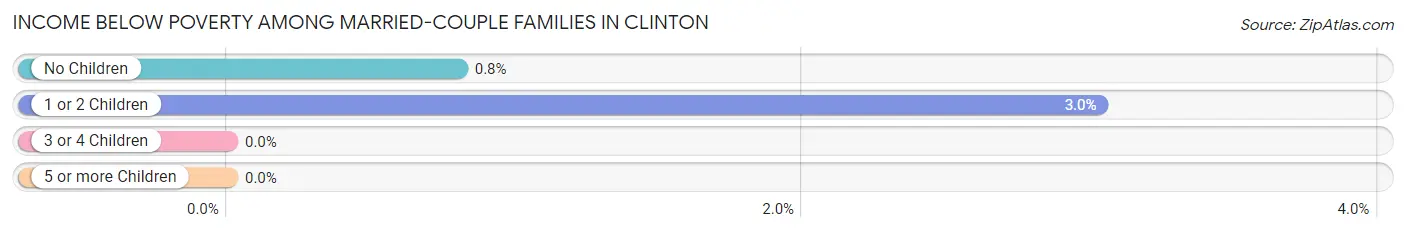
| Children | Above Poverty | Below Poverty |
| No Children | 873 (99.2%) | 7 (0.8%) |
| 1 or 2 Children | 705 (97.0%) | 22 (3.0%) |
| 3 or 4 Children | 94 (100.0%) | 0 (0.0%) |
| 5 or more Children | 18 (100.0%) | 0 (0.0%) |
| Total | 1,690 (98.3%) | 29 (1.7%) |
Income Below Poverty Among Single-Parent Households in Clinton
According to the poverty data in Clinton, 11.3% or 36 single-father households and 51.6% or 159 single-mother households are living below the poverty line. Among single-father households, those with 1 or 2 children have the highest poverty rate, with 36 households (11.4%) experiencing poverty. Likewise, among single-mother households, those with 3 or 4 children have the highest poverty rate, with 23 households (100.0%) falling below the poverty line.
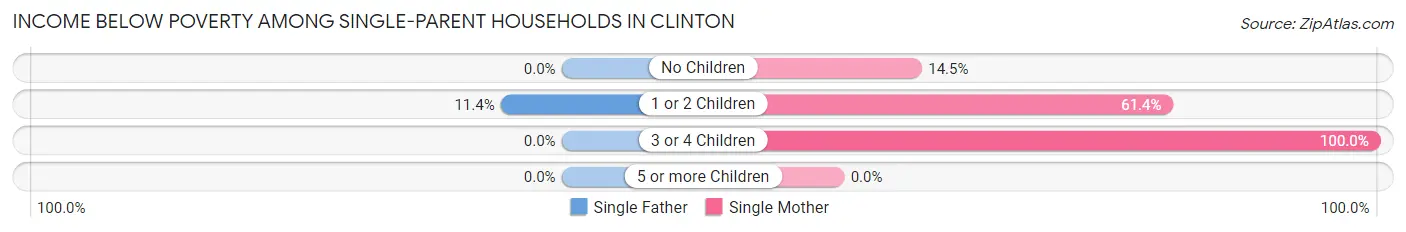
| Children | Single Father | Single Mother |
| No Children | 0 (0.0%) | 12 (14.5%) |
| 1 or 2 Children | 36 (11.4%) | 124 (61.4%) |
| 3 or 4 Children | 0 (0.0%) | 23 (100.0%) |
| 5 or more Children | 0 (0.0%) | 0 (0.0%) |
| Total | 36 (11.3%) | 159 (51.6%) |
Income Below Poverty Among Married-Couple vs Single-Parent Households in Clinton
The poverty data for Clinton shows that 29 of the married-couple family households (1.7%) and 195 of the single-parent households (31.0%) are living below the poverty level. Within the married-couple family households, those with 1 or 2 children have the highest poverty rate, with 22 households (3.0%) falling below the poverty line. Among the single-parent households, those with 3 or 4 children have the highest poverty rate, with 23 household (100.0%) living below poverty.
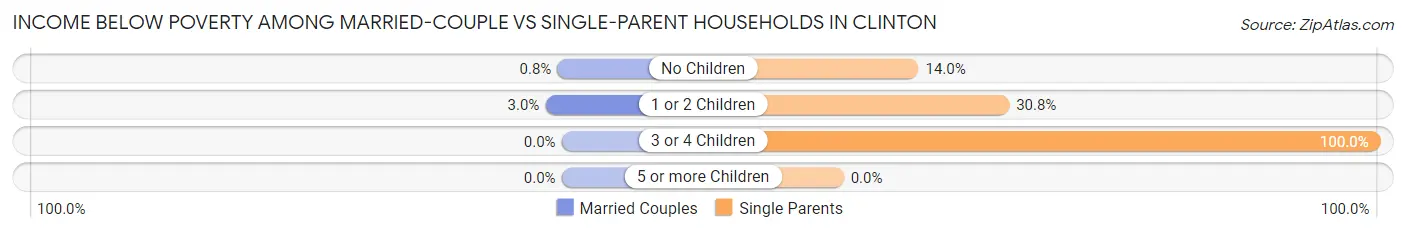
| Children | Married-Couple Families | Single-Parent Households |
| No Children | 7 (0.8%) | 12 (14.0%) |
| 1 or 2 Children | 22 (3.0%) | 160 (30.8%) |
| 3 or 4 Children | 0 (0.0%) | 23 (100.0%) |
| 5 or more Children | 0 (0.0%) | 0 (0.0%) |
| Total | 29 (1.7%) | 195 (31.0%) |
Race in Clinton
The most populous races in Clinton are White / Caucasian (4,804 | 56.5%), Hispanic or Latino (3,124 | 36.8%), and Two or more Races (1,343 | 15.8%).
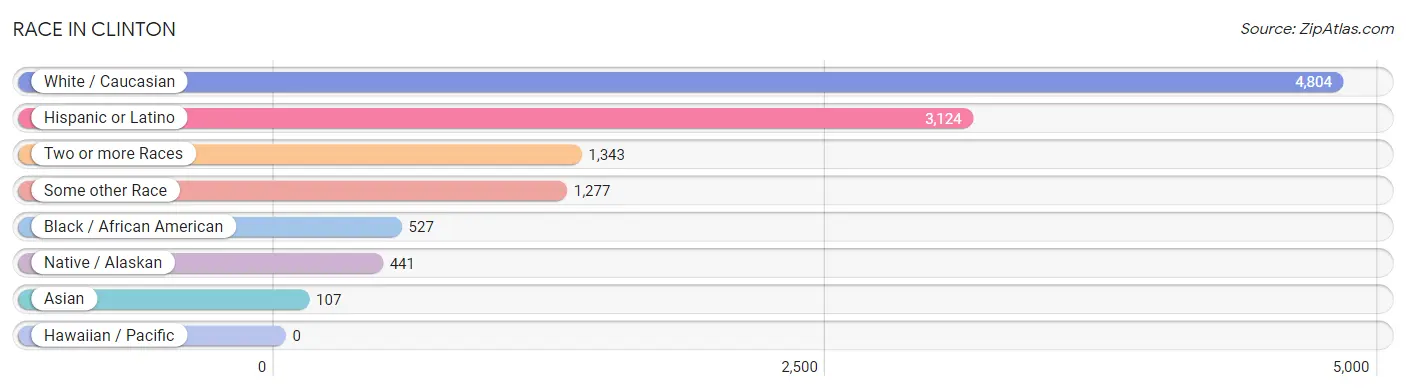
| Race | # Population | % Population |
| Asian | 107 | 1.3% |
| Black / African American | 527 | 6.2% |
| Hawaiian / Pacific | 0 | 0.0% |
| Hispanic or Latino | 3,124 | 36.8% |
| Native / Alaskan | 441 | 5.2% |
| White / Caucasian | 4,804 | 56.5% |
| Two or more Races | 1,343 | 15.8% |
| Some other Race | 1,277 | 15.0% |
| Total | 8,499 | 100.0% |
Ancestry in Clinton
The most populous ancestries reported in Clinton are Mexican (2,778 | 32.7%), German (1,107 | 13.0%), Irish (662 | 7.8%), English (428 | 5.0%), and American (295 | 3.5%), together accounting for 62.0% of all Clinton residents.
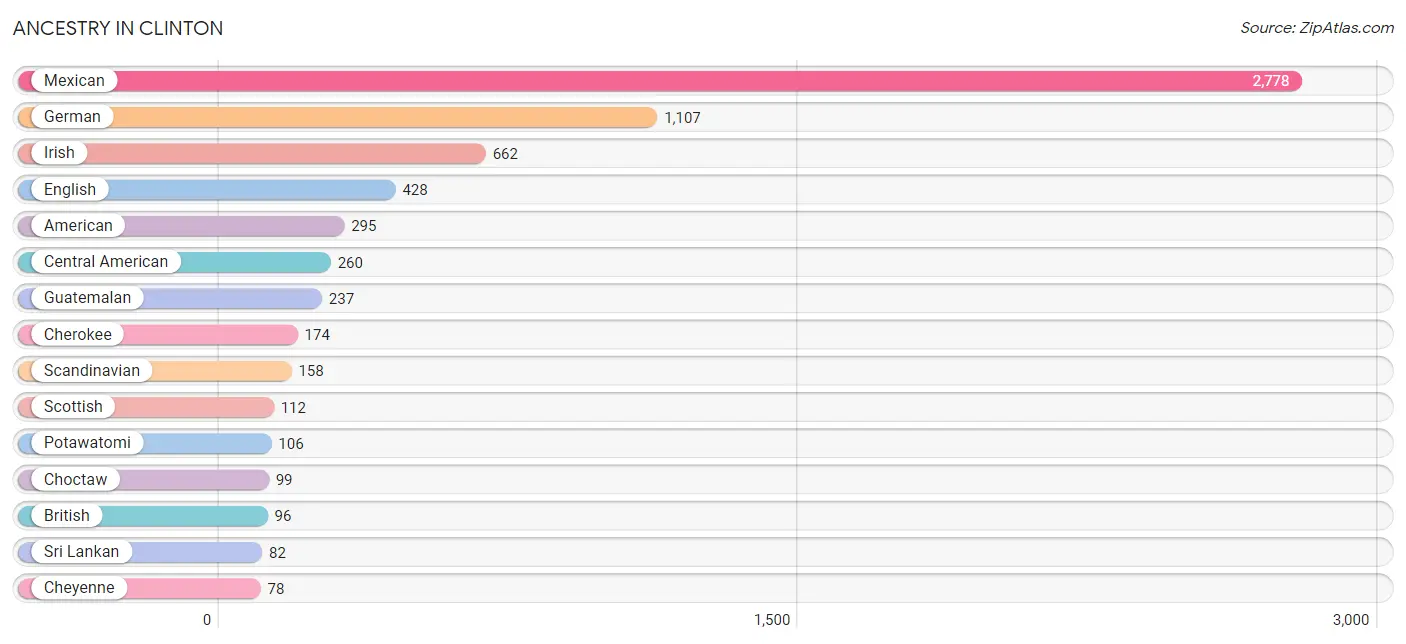
| Ancestry | # Population | % Population |
| American | 295 | 3.5% |
| Apache | 61 | 0.7% |
| British | 96 | 1.1% |
| Central American | 260 | 3.1% |
| Cherokee | 174 | 2.1% |
| Cheyenne | 78 | 0.9% |
| Chickasaw | 39 | 0.5% |
| Choctaw | 99 | 1.2% |
| Comanche | 10 | 0.1% |
| Creek | 57 | 0.7% |
| Dutch | 12 | 0.1% |
| Dutch West Indian | 25 | 0.3% |
| English | 428 | 5.0% |
| European | 30 | 0.4% |
| French | 52 | 0.6% |
| German | 1,107 | 13.0% |
| Guatemalan | 237 | 2.8% |
| Indian (Asian) | 77 | 0.9% |
| Irish | 662 | 7.8% |
| Italian | 30 | 0.4% |
| Mexican | 2,778 | 32.7% |
| Native Hawaiian | 14 | 0.2% |
| Northern European | 10 | 0.1% |
| Norwegian | 10 | 0.1% |
| Polish | 22 | 0.3% |
| Potawatomi | 106 | 1.3% |
| Salvadoran | 23 | 0.3% |
| Scandinavian | 158 | 1.9% |
| Scotch-Irish | 17 | 0.2% |
| Scottish | 112 | 1.3% |
| Sioux | 13 | 0.2% |
| Sri Lankan | 82 | 1.0% |
| Swedish | 15 | 0.2% |
| Swiss | 25 | 0.3% |
| Ukrainian | 22 | 0.3% | View All 35 Rows |
Immigrants in Clinton
The most numerous immigrant groups reported in Clinton came from Central America (959 | 11.3%), Latin America (959 | 11.3%), Mexico (741 | 8.7%), Guatemala (195 | 2.3%), and Asia (65 | 0.8%), together accounting for 34.3% of all Clinton residents.
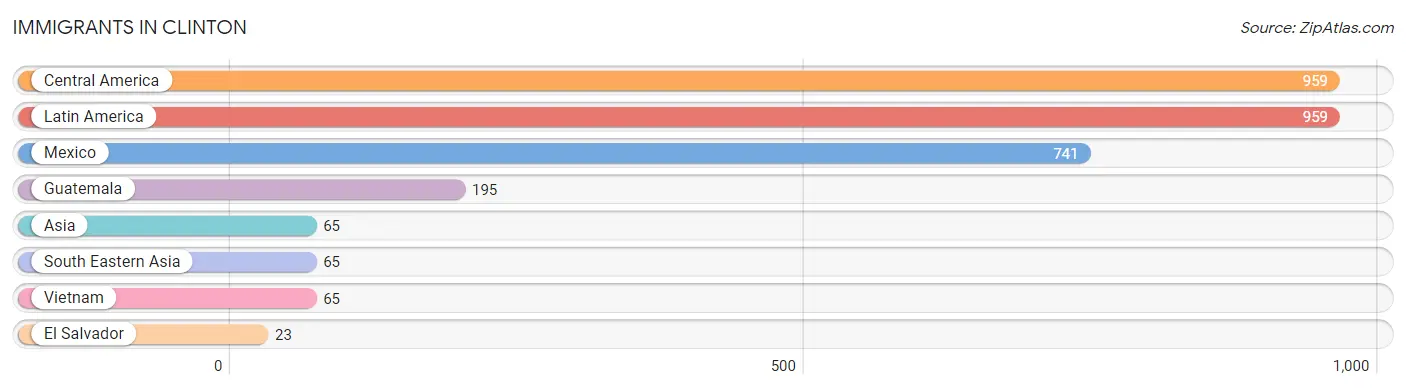
| Immigration Origin | # Population | % Population |
| Asia | 65 | 0.8% |
| Central America | 959 | 11.3% |
| El Salvador | 23 | 0.3% |
| Guatemala | 195 | 2.3% |
| Latin America | 959 | 11.3% |
| Mexico | 741 | 8.7% |
| South Eastern Asia | 65 | 0.8% |
| Vietnam | 65 | 0.8% | View All 8 Rows |
Sex and Age in Clinton
Sex and Age in Clinton
The most populous age groups in Clinton are 35 to 39 Years (385 | 9.0%) for men and 35 to 39 Years (483 | 11.4%) for women.
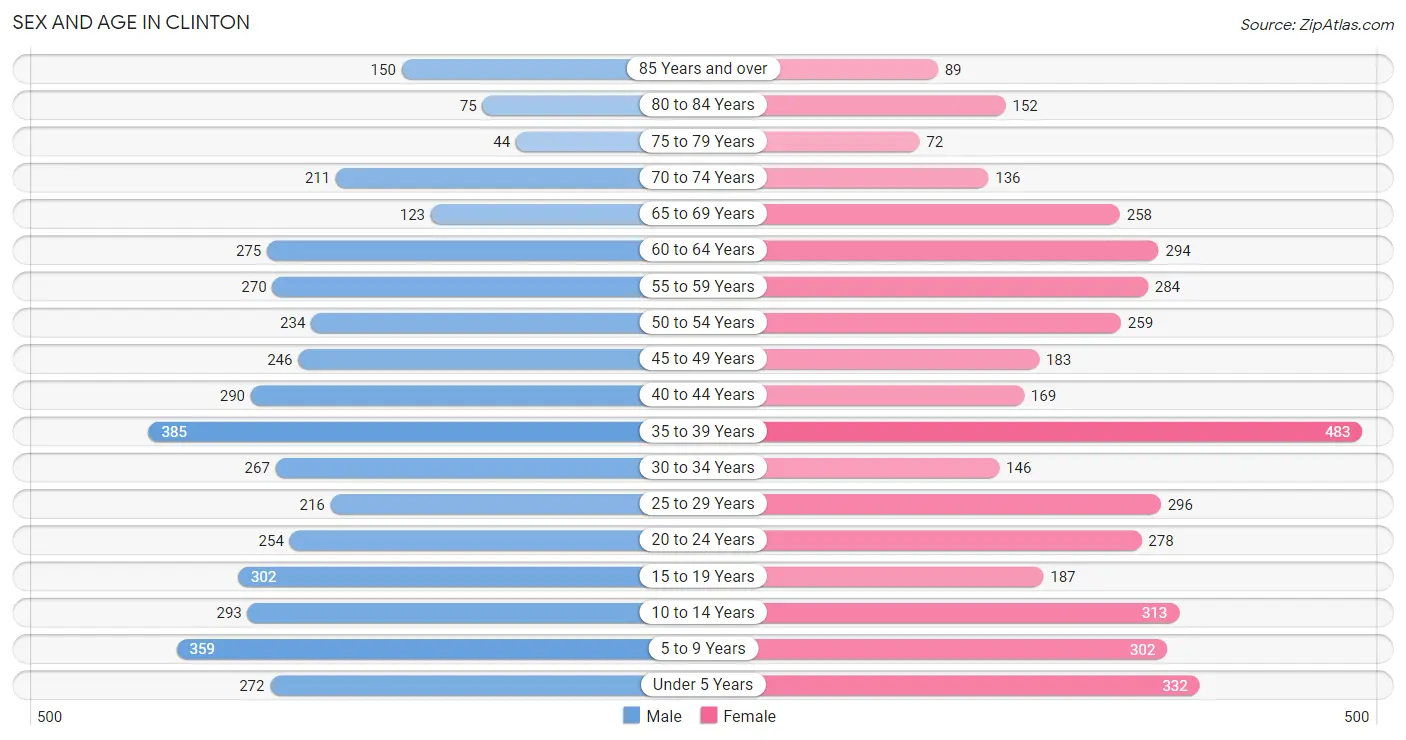
| Age Bracket | Male | Female |
| Under 5 Years | 272 (6.4%) | 332 (7.8%) |
| 5 to 9 Years | 359 (8.4%) | 302 (7.1%) |
| 10 to 14 Years | 293 (6.9%) | 313 (7.4%) |
| 15 to 19 Years | 302 (7.1%) | 187 (4.4%) |
| 20 to 24 Years | 254 (5.9%) | 278 (6.6%) |
| 25 to 29 Years | 216 (5.1%) | 296 (7.0%) |
| 30 to 34 Years | 267 (6.3%) | 146 (3.5%) |
| 35 to 39 Years | 385 (9.0%) | 483 (11.4%) |
| 40 to 44 Years | 290 (6.8%) | 169 (4.0%) |
| 45 to 49 Years | 246 (5.8%) | 183 (4.3%) |
| 50 to 54 Years | 234 (5.5%) | 259 (6.1%) |
| 55 to 59 Years | 270 (6.3%) | 284 (6.7%) |
| 60 to 64 Years | 275 (6.5%) | 294 (7.0%) |
| 65 to 69 Years | 123 (2.9%) | 258 (6.1%) |
| 70 to 74 Years | 211 (5.0%) | 136 (3.2%) |
| 75 to 79 Years | 44 (1.0%) | 72 (1.7%) |
| 80 to 84 Years | 75 (1.8%) | 152 (3.6%) |
| 85 Years and over | 150 (3.5%) | 89 (2.1%) |
| Total | 4,266 (100.0%) | 4,233 (100.0%) |
Families and Households in Clinton
Median Family Size in Clinton
The median family size in Clinton is 2.99 persons per family, with married-couple families (1,719 | 73.2%) accounting for the largest median family size of 3.03 persons per family. On the other hand, single male/father families (320 | 13.6%) represent the smallest median family size with 2.85 persons per family.
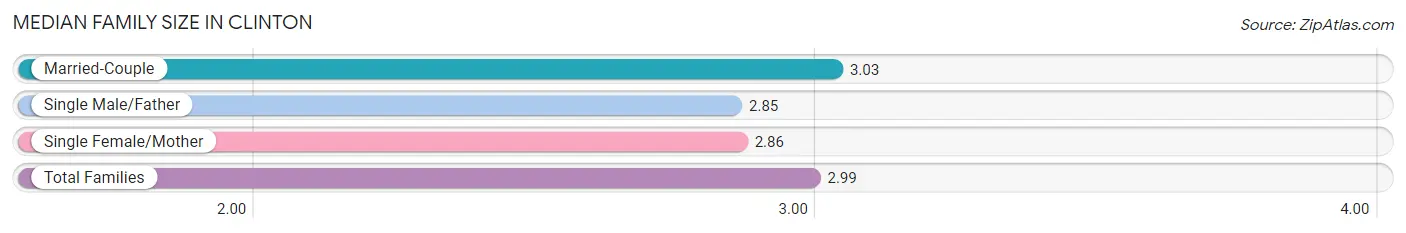
| Family Type | # Families | Family Size |
| Married-Couple | 1,719 (73.2%) | 3.03 |
| Single Male/Father | 320 (13.6%) | 2.85 |
| Single Female/Mother | 308 (13.1%) | 2.86 |
| Total Families | 2,347 (100.0%) | 2.99 |
Median Household Size in Clinton
The median household size in Clinton is 2.51 persons per household, with single male/father households (320 | 9.8%) accounting for the largest median household size of 3.19 persons per household. non-family households (912 | 28.0%) represent the smallest median household size with 1.07 persons per household.
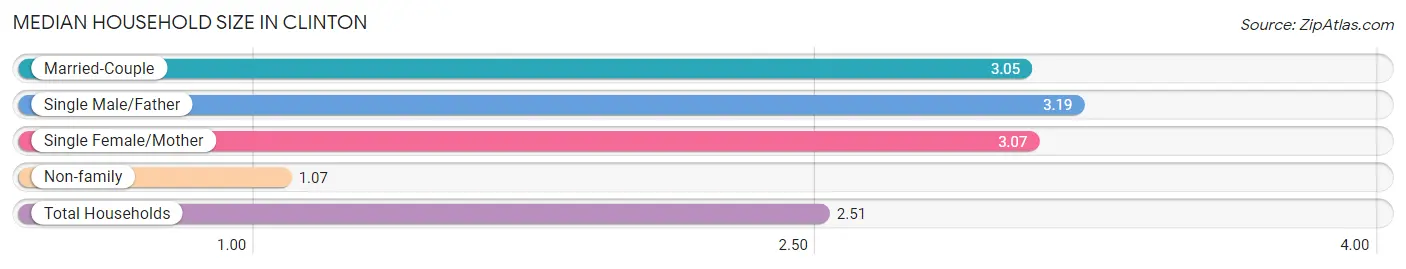
| Household Type | # Households | Household Size |
| Married-Couple | 1,719 (52.7%) | 3.05 |
| Single Male/Father | 320 (9.8%) | 3.19 |
| Single Female/Mother | 308 (9.5%) | 3.07 |
| Non-family | 912 (28.0%) | 1.07 |
| Total Households | 3,259 (100.0%) | 2.51 |
Household Size by Marriage Status in Clinton
Out of a total of 3,259 households in Clinton, 2,347 (72.0%) are family households, while 912 (28.0%) are nonfamily households. The most numerous type of family households are 2-person households, comprising 984, and the most common type of nonfamily households are 1-person households, comprising 871.
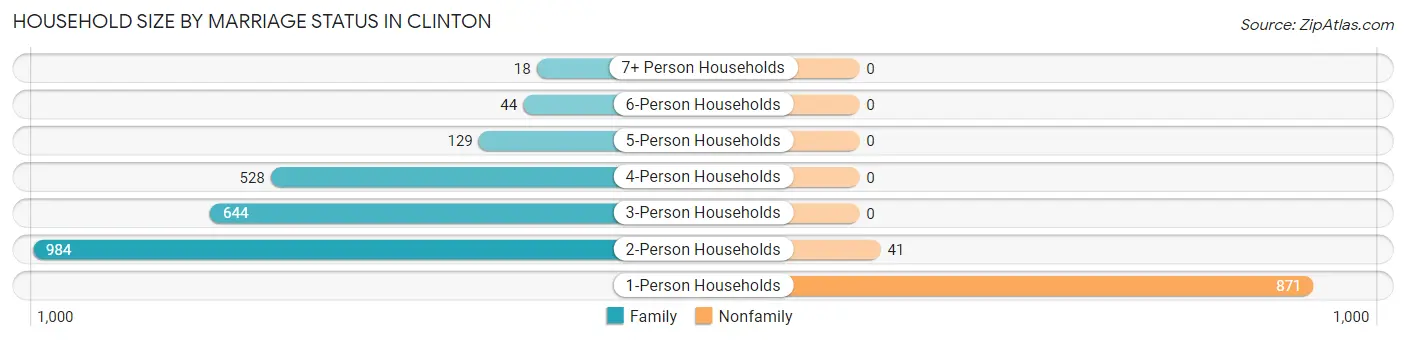
| Household Size | Family Households | Nonfamily Households |
| 1-Person Households | - | 871 (26.7%) |
| 2-Person Households | 984 (30.2%) | 41 (1.3%) |
| 3-Person Households | 644 (19.8%) | 0 (0.0%) |
| 4-Person Households | 528 (16.2%) | 0 (0.0%) |
| 5-Person Households | 129 (4.0%) | 0 (0.0%) |
| 6-Person Households | 44 (1.3%) | 0 (0.0%) |
| 7+ Person Households | 18 (0.5%) | 0 (0.0%) |
| Total | 2,347 (72.0%) | 912 (28.0%) |
Female Fertility in Clinton
Fertility by Age in Clinton
Average fertility rate in Clinton is 79.0 births per 1,000 women. Women in the age bracket of 20 to 34 years have the highest fertility rate with 181.0 births per 1,000 women. Women in the age bracket of 20 to 34 years acount for 88.4% of all women with births.
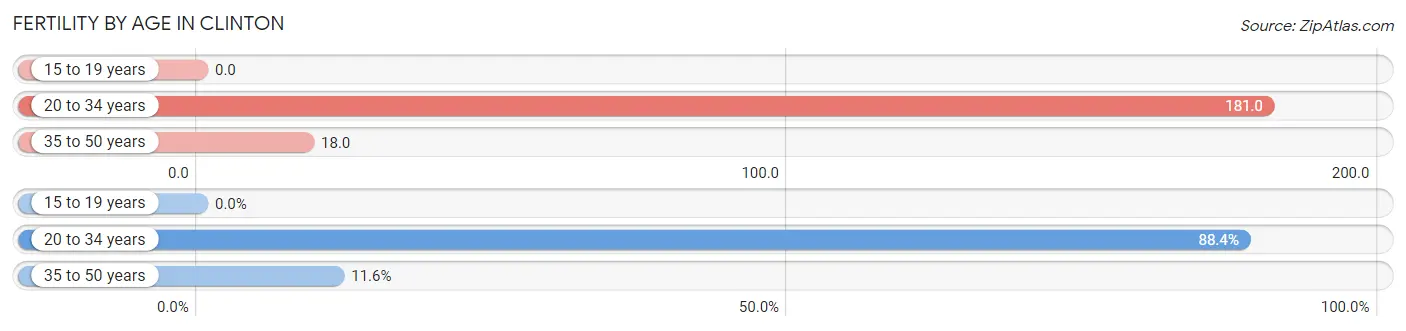
| Age Bracket | Women with Births | Births / 1,000 Women |
| 15 to 19 years | 0 (0.0%) | 0.0 |
| 20 to 34 years | 130 (88.4%) | 181.0 |
| 35 to 50 years | 17 (11.6%) | 18.0 |
| Total | 147 (100.0%) | 79.0 |
Fertility by Age by Marriage Status in Clinton
77.6% of women with births (147) in Clinton are married. The highest percentage of unmarried women with births falls into 20 to 34 years age bracket with 25.4% of them unmarried at the time of birth, while the lowest percentage of unmarried women with births belong to 35 to 50 years age bracket with 0.0% of them unmarried.
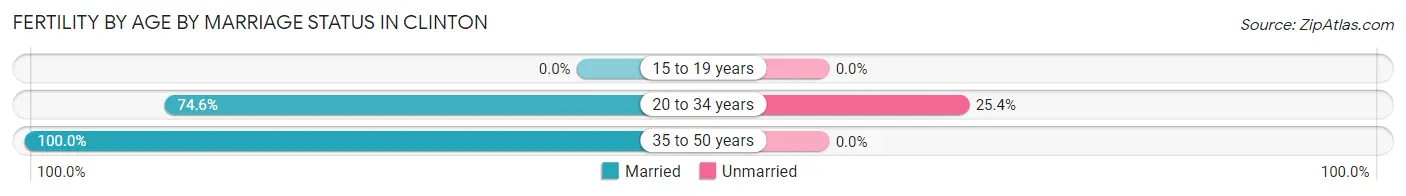
| Age Bracket | Married | Unmarried |
| 15 to 19 years | 0 (0.0%) | 0 (0.0%) |
| 20 to 34 years | 97 (74.6%) | 33 (25.4%) |
| 35 to 50 years | 17 (100.0%) | 0 (0.0%) |
| Total | 114 (77.5%) | 33 (22.5%) |
Fertility by Education in Clinton
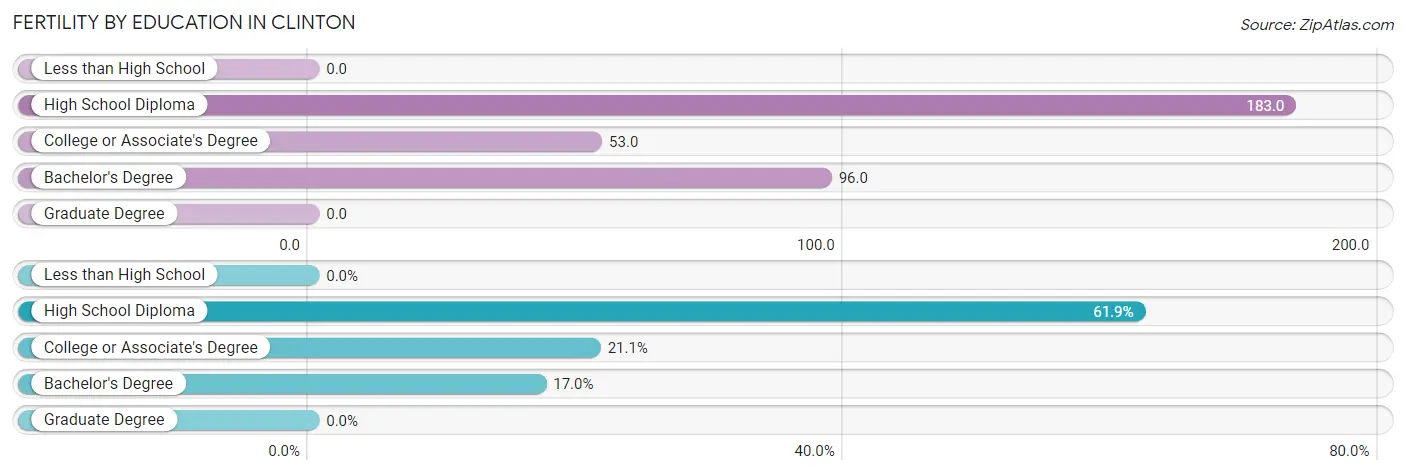
| Educational Attainment | Women with Births | Births / 1,000 Women |
| Less than High School | 0 (0.0%) | 0.0 |
| High School Diploma | 91 (61.9%) | 183.0 |
| College or Associate's Degree | 31 (21.1%) | 53.0 |
| Bachelor's Degree | 25 (17.0%) | 96.0 |
| Graduate Degree | 0 (0.0%) | 0.0 |
| Total | 147 (100.0%) | 79.0 |
Fertility by Education by Marriage Status in Clinton
22.5% of women with births in Clinton are unmarried. Women with the educational attainment of college or associate's degree are most likely to be married with 100.0% of them married at childbirth, while women with the educational attainment of high school diploma are least likely to be married with 36.3% of them unmarried at childbirth.
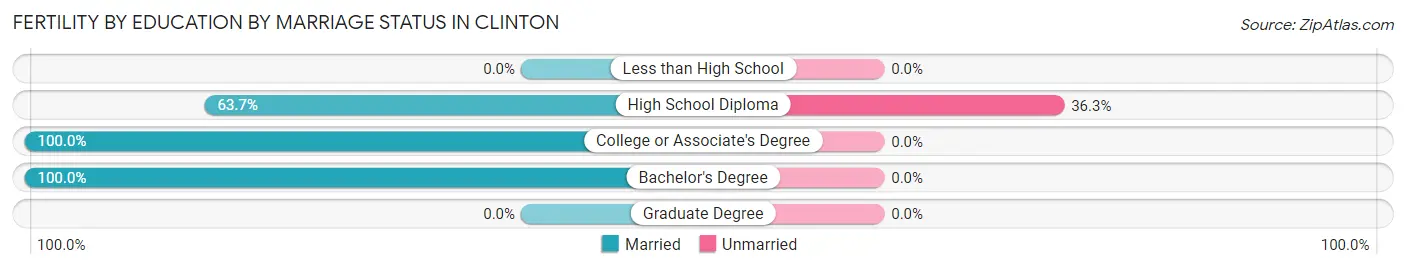
| Educational Attainment | Married | Unmarried |
| Less than High School | 0 (0.0%) | 0 (0.0%) |
| High School Diploma | 58 (63.7%) | 33 (36.3%) |
| College or Associate's Degree | 31 (100.0%) | 0 (0.0%) |
| Bachelor's Degree | 25 (100.0%) | 0 (0.0%) |
| Graduate Degree | 0 (0.0%) | 0 (0.0%) |
| Total | 114 (77.5%) | 33 (22.5%) |
Employment Characteristics in Clinton
Employment by Class of Employer in Clinton
Among the 4,351 employed individuals in Clinton, private company employees (3,169 | 72.8%), not-for-profit organizations (350 | 8.0%), and local government employees (250 | 5.8%) make up the most common classes of employment.
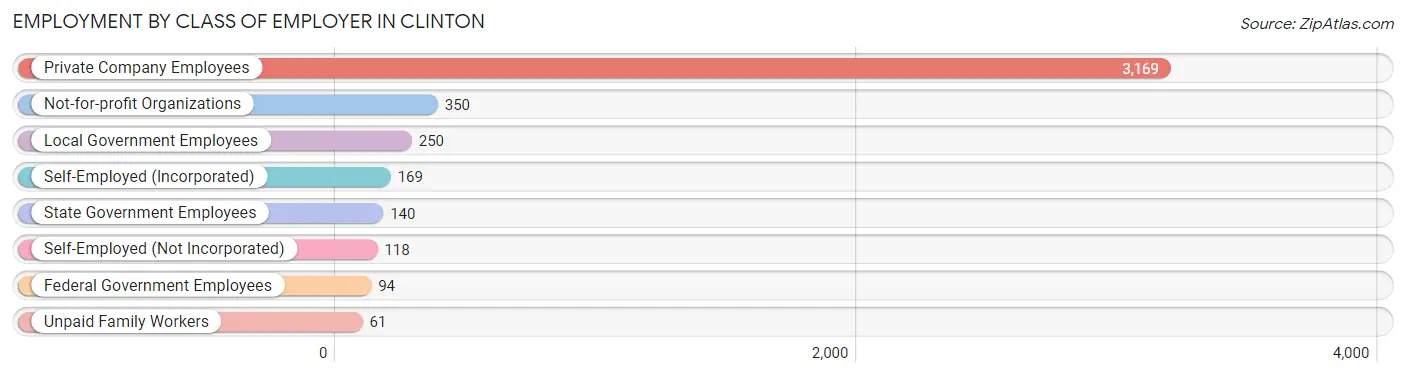
| Employer Class | # Employees | % Employees |
| Private Company Employees | 3,169 | 72.8% |
| Self-Employed (Incorporated) | 169 | 3.9% |
| Self-Employed (Not Incorporated) | 118 | 2.7% |
| Not-for-profit Organizations | 350 | 8.0% |
| Local Government Employees | 250 | 5.8% |
| State Government Employees | 140 | 3.2% |
| Federal Government Employees | 94 | 2.2% |
| Unpaid Family Workers | 61 | 1.4% |
| Total | 4,351 | 100.0% |
Employment Status by Age in Clinton
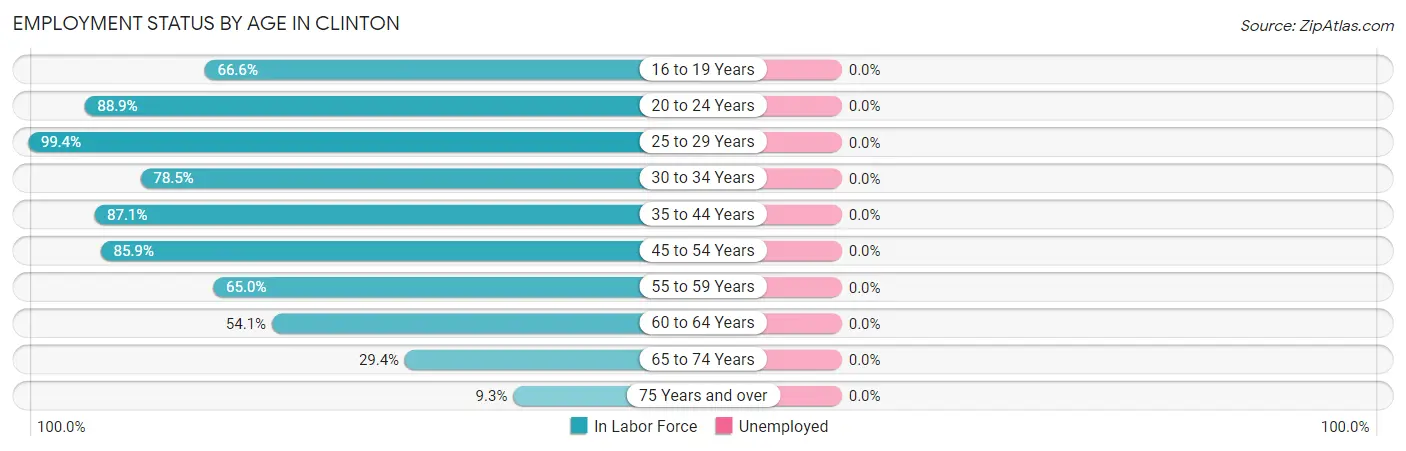
| Age Bracket | In Labor Force | Unemployed |
| 16 to 19 Years | 227 (66.6%) | 0 (0.0%) |
| 20 to 24 Years | 473 (88.9%) | 0 (0.0%) |
| 25 to 29 Years | 509 (99.4%) | 0 (0.0%) |
| 30 to 34 Years | 324 (78.5%) | 0 (0.0%) |
| 35 to 44 Years | 1,156 (87.1%) | 0 (0.0%) |
| 45 to 54 Years | 792 (85.9%) | 0 (0.0%) |
| 55 to 59 Years | 360 (65.0%) | 0 (0.0%) |
| 60 to 64 Years | 308 (54.1%) | 0 (0.0%) |
| 65 to 74 Years | 214 (29.4%) | 0 (0.0%) |
| 75 Years and over | 54 (9.3%) | 0 (0.0%) |
| Total | 4,419 (68.2%) | 0 (0.0%) |
Employment Status by Educational Attainment in Clinton
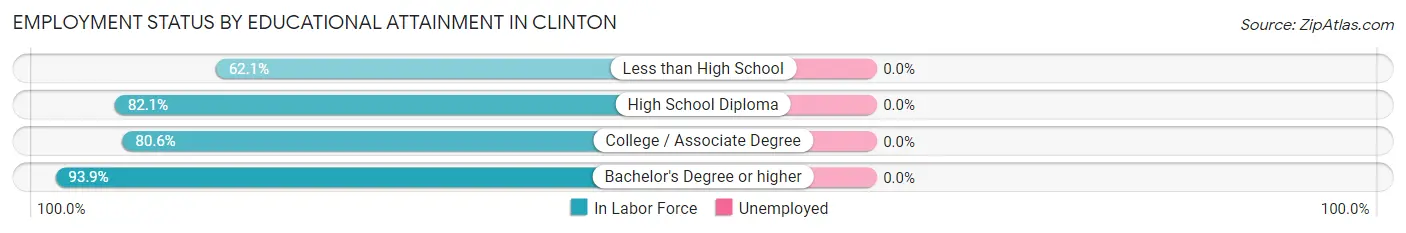
| Educational Attainment | In Labor Force | Unemployed |
| Less than High School | 545 (62.1%) | 0 (0.0%) |
| High School Diploma | 982 (82.1%) | 0 (0.0%) |
| College / Associate Degree | 1,007 (80.6%) | 0 (0.0%) |
| Bachelor's Degree or higher | 915 (93.9%) | 0 (0.0%) |
| Total | 3,450 (80.3%) | 0 (0.0%) |
Employment Occupations by Sex in Clinton
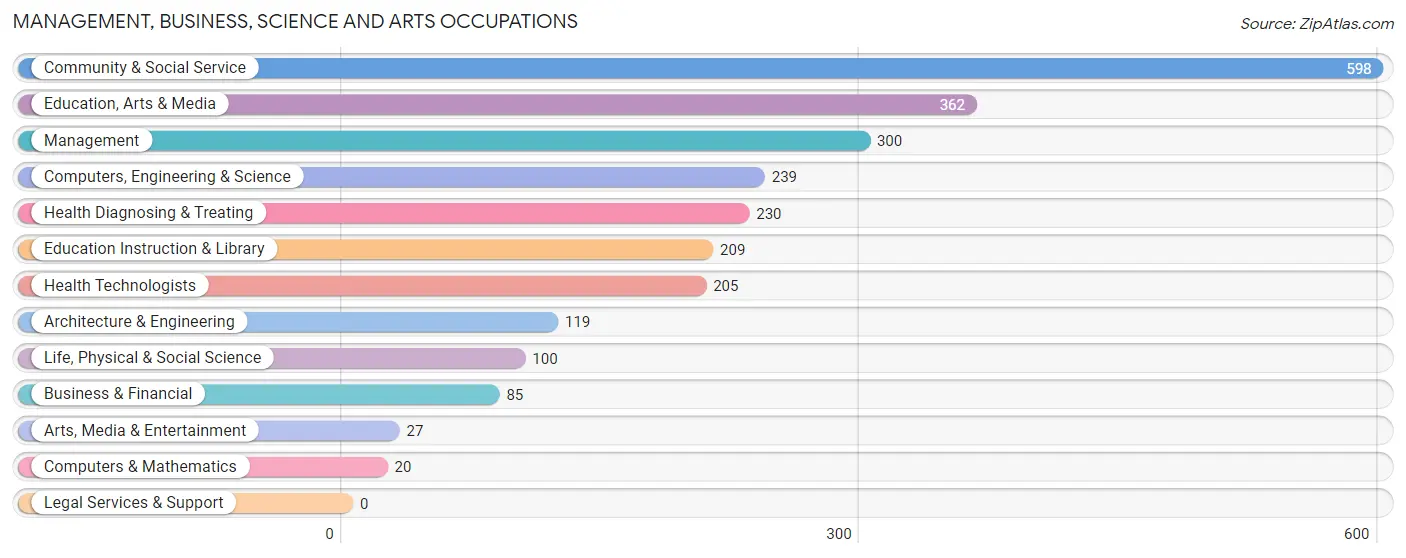
Management, Business, Science and Arts Occupations
The most common Management, Business, Science and Arts occupations in Clinton are Community & Social Service (598 | 13.5%), Education, Arts & Media (362 | 8.2%), Management (300 | 6.8%), Computers, Engineering & Science (239 | 5.4%), and Health Diagnosing & Treating (230 | 5.2%).
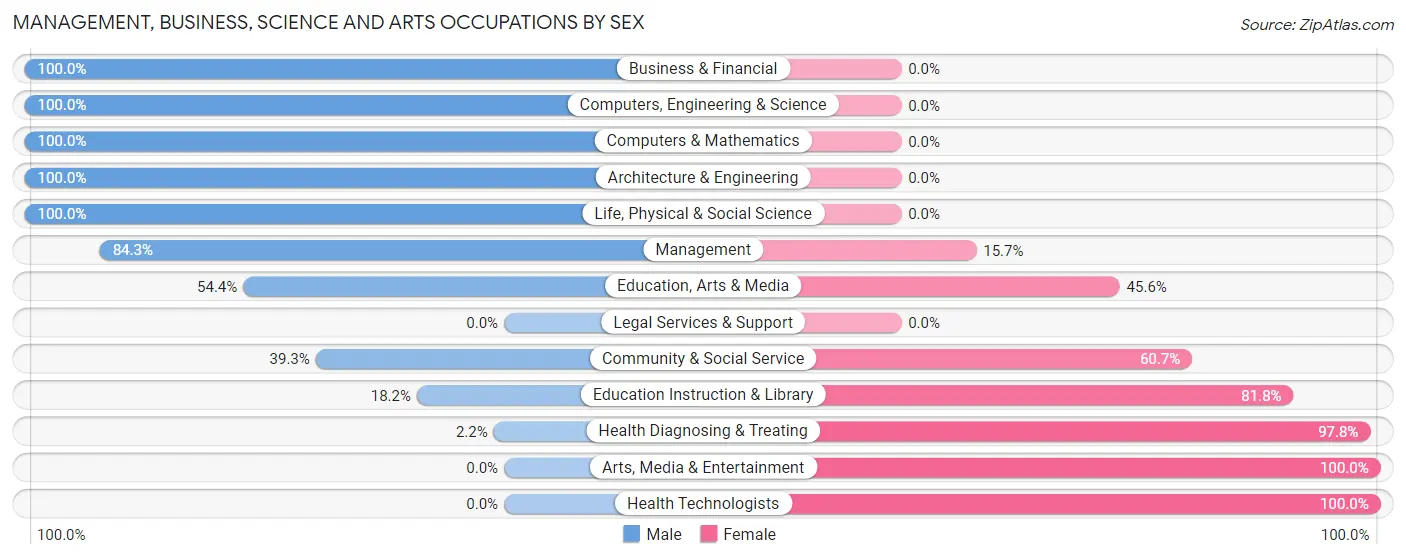
Management, Business, Science and Arts Occupations by Sex
Within the Management, Business, Science and Arts occupations in Clinton, the most male-oriented occupations are Business & Financial (100.0%), Computers, Engineering & Science (100.0%), and Computers & Mathematics (100.0%), while the most female-oriented occupations are Arts, Media & Entertainment (100.0%), Health Technologists (100.0%), and Health Diagnosing & Treating (97.8%).
| Occupation | Male | Female |
| Management | 253 (84.3%) | 47 (15.7%) |
| Business & Financial | 85 (100.0%) | 0 (0.0%) |
| Computers, Engineering & Science | 239 (100.0%) | 0 (0.0%) |
| Computers & Mathematics | 20 (100.0%) | 0 (0.0%) |
| Architecture & Engineering | 119 (100.0%) | 0 (0.0%) |
| Life, Physical & Social Science | 100 (100.0%) | 0 (0.0%) |
| Community & Social Service | 235 (39.3%) | 363 (60.7%) |
| Education, Arts & Media | 197 (54.4%) | 165 (45.6%) |
| Legal Services & Support | 0 (0.0%) | 0 (0.0%) |
| Education Instruction & Library | 38 (18.2%) | 171 (81.8%) |
| Arts, Media & Entertainment | 0 (0.0%) | 27 (100.0%) |
| Health Diagnosing & Treating | 5 (2.2%) | 225 (97.8%) |
| Health Technologists | 0 (0.0%) | 205 (100.0%) |
| Total (Category) | 817 (56.3%) | 635 (43.7%) |
| Total (Overall) | 2,463 (55.8%) | 1,954 (44.2%) |
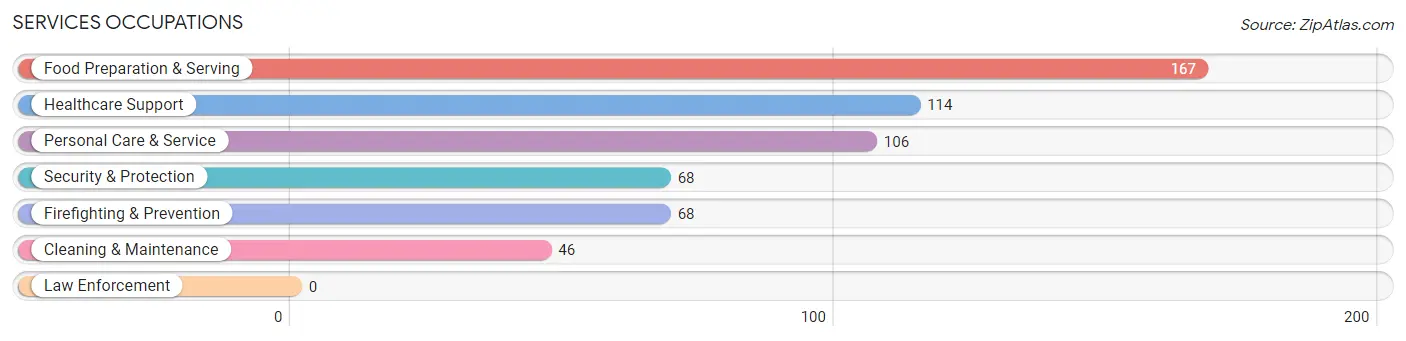
Services Occupations
The most common Services occupations in Clinton are Food Preparation & Serving (167 | 3.8%), Healthcare Support (114 | 2.6%), Personal Care & Service (106 | 2.4%), Security & Protection (68 | 1.5%), and Firefighting & Prevention (68 | 1.5%).
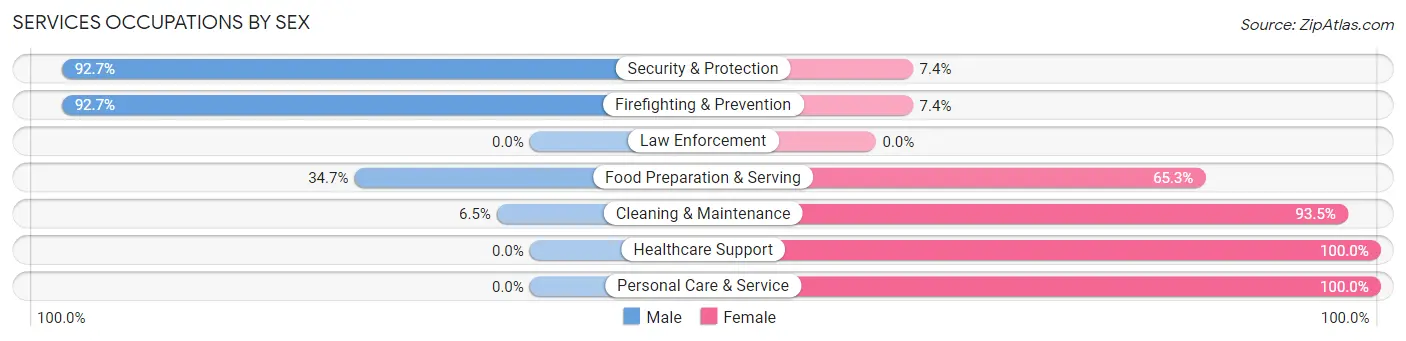
Services Occupations by Sex
Within the Services occupations in Clinton, the most male-oriented occupations are Security & Protection (92.6%), Firefighting & Prevention (92.6%), and Food Preparation & Serving (34.7%), while the most female-oriented occupations are Healthcare Support (100.0%), Personal Care & Service (100.0%), and Cleaning & Maintenance (93.5%).
| Occupation | Male | Female |
| Healthcare Support | 0 (0.0%) | 114 (100.0%) |
| Security & Protection | 63 (92.6%) | 5 (7.3%) |
| Firefighting & Prevention | 63 (92.6%) | 5 (7.3%) |
| Law Enforcement | 0 (0.0%) | 0 (0.0%) |
| Food Preparation & Serving | 58 (34.7%) | 109 (65.3%) |
| Cleaning & Maintenance | 3 (6.5%) | 43 (93.5%) |
| Personal Care & Service | 0 (0.0%) | 106 (100.0%) |
| Total (Category) | 124 (24.7%) | 377 (75.2%) |
| Total (Overall) | 2,463 (55.8%) | 1,954 (44.2%) |
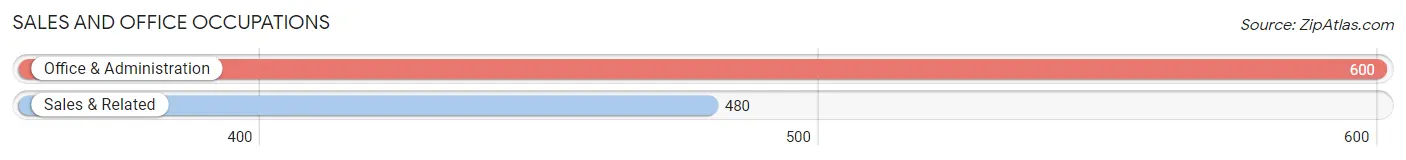
Sales and Office Occupations
The most common Sales and Office occupations in Clinton are Office & Administration (600 | 13.6%), and Sales & Related (480 | 10.9%).
Sales and Office Occupations by Sex
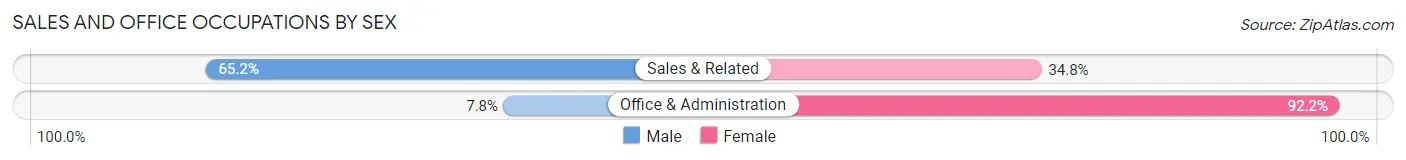
| Occupation | Male | Female |
| Sales & Related | 313 (65.2%) | 167 (34.8%) |
| Office & Administration | 47 (7.8%) | 553 (92.2%) |
| Total (Category) | 360 (33.3%) | 720 (66.7%) |
| Total (Overall) | 2,463 (55.8%) | 1,954 (44.2%) |
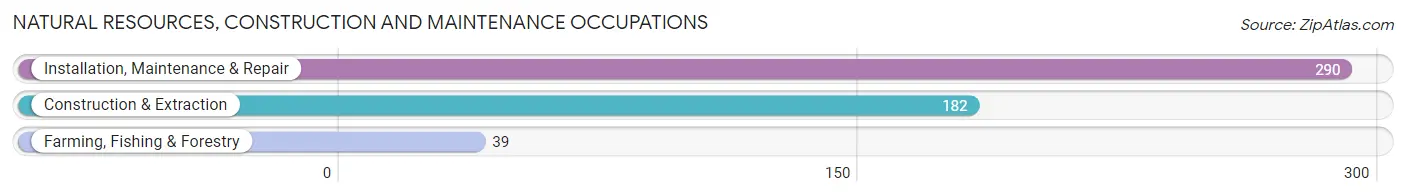
Natural Resources, Construction and Maintenance Occupations
The most common Natural Resources, Construction and Maintenance occupations in Clinton are Installation, Maintenance & Repair (290 | 6.6%), Construction & Extraction (182 | 4.1%), and Farming, Fishing & Forestry (39 | 0.9%).
Natural Resources, Construction and Maintenance Occupations by Sex
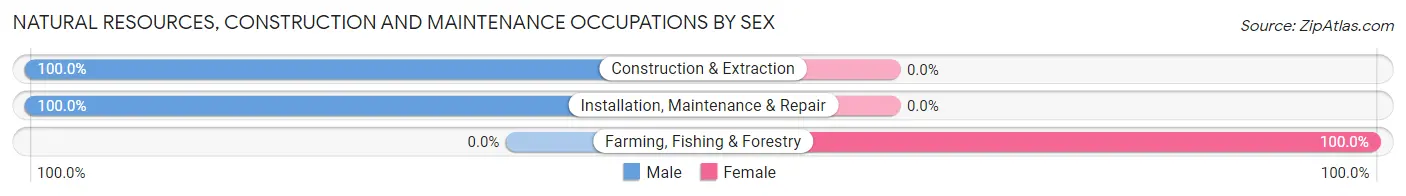
| Occupation | Male | Female |
| Farming, Fishing & Forestry | 0 (0.0%) | 39 (100.0%) |
| Construction & Extraction | 182 (100.0%) | 0 (0.0%) |
| Installation, Maintenance & Repair | 290 (100.0%) | 0 (0.0%) |
| Total (Category) | 472 (92.4%) | 39 (7.6%) |
| Total (Overall) | 2,463 (55.8%) | 1,954 (44.2%) |
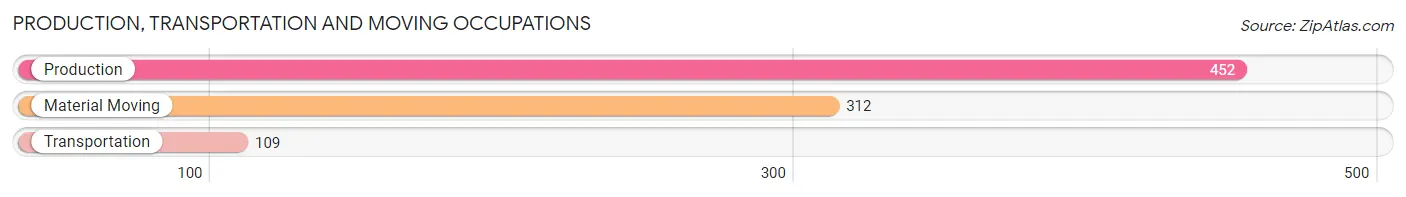
Production, Transportation and Moving Occupations
The most common Production, Transportation and Moving occupations in Clinton are Production (452 | 10.2%), Material Moving (312 | 7.1%), and Transportation (109 | 2.5%).
Production, Transportation and Moving Occupations by Sex
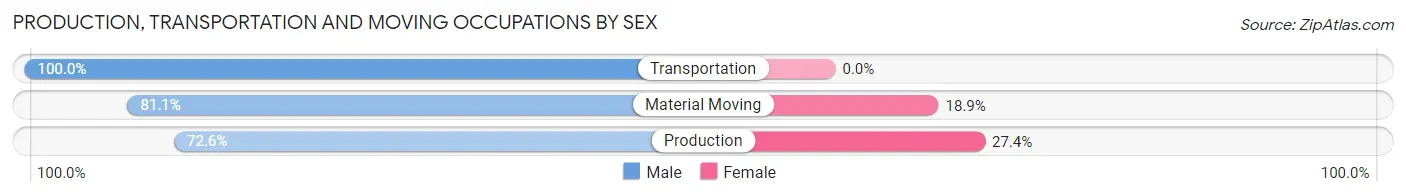
| Occupation | Male | Female |
| Production | 328 (72.6%) | 124 (27.4%) |
| Transportation | 109 (100.0%) | 0 (0.0%) |
| Material Moving | 253 (81.1%) | 59 (18.9%) |
| Total (Category) | 690 (79.0%) | 183 (21.0%) |
| Total (Overall) | 2,463 (55.8%) | 1,954 (44.2%) |
Employment Industries by Sex in Clinton
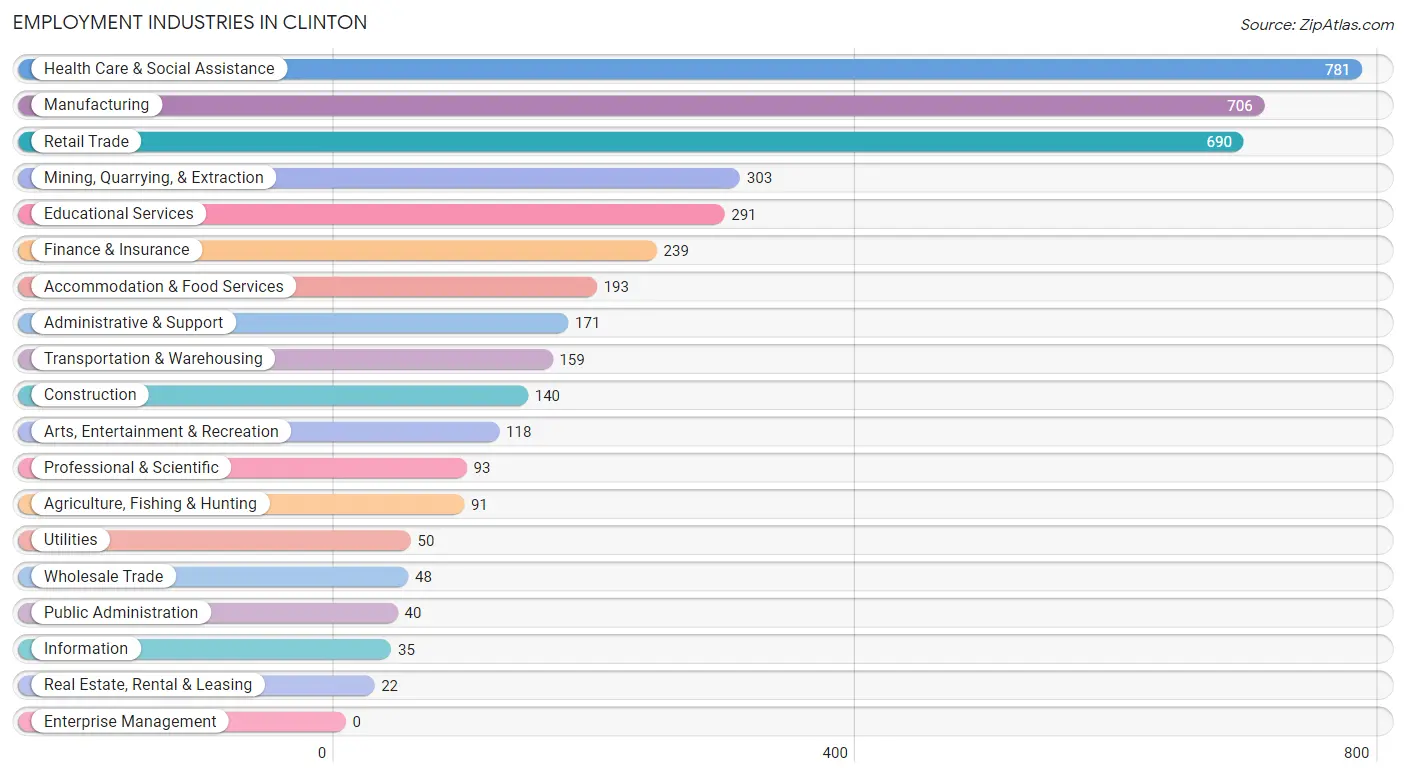
Employment Industries in Clinton
The major employment industries in Clinton include Health Care & Social Assistance (781 | 17.7%), Manufacturing (706 | 16.0%), Retail Trade (690 | 15.6%), Mining, Quarrying, & Extraction (303 | 6.9%), and Educational Services (291 | 6.6%).
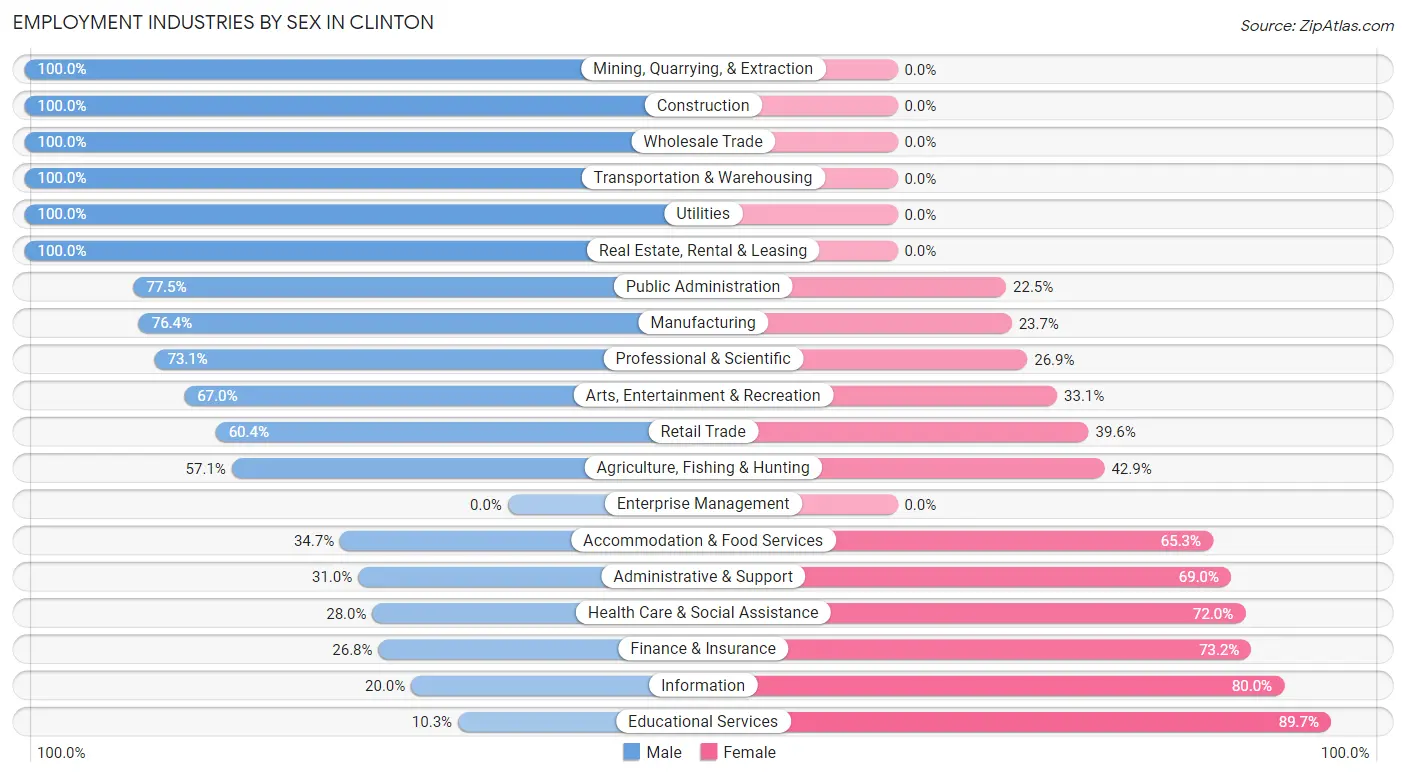
Employment Industries by Sex in Clinton
The Clinton industries that see more men than women are Mining, Quarrying, & Extraction (100.0%), Construction (100.0%), and Wholesale Trade (100.0%), whereas the industries that tend to have a higher number of women are Educational Services (89.7%), Information (80.0%), and Finance & Insurance (73.2%).
| Industry | Male | Female |
| Agriculture, Fishing & Hunting | 52 (57.1%) | 39 (42.9%) |
| Mining, Quarrying, & Extraction | 303 (100.0%) | 0 (0.0%) |
| Construction | 140 (100.0%) | 0 (0.0%) |
| Manufacturing | 539 (76.3%) | 167 (23.6%) |
| Wholesale Trade | 48 (100.0%) | 0 (0.0%) |
| Retail Trade | 417 (60.4%) | 273 (39.6%) |
| Transportation & Warehousing | 159 (100.0%) | 0 (0.0%) |
| Utilities | 50 (100.0%) | 0 (0.0%) |
| Information | 7 (20.0%) | 28 (80.0%) |
| Finance & Insurance | 64 (26.8%) | 175 (73.2%) |
| Real Estate, Rental & Leasing | 22 (100.0%) | 0 (0.0%) |
| Professional & Scientific | 68 (73.1%) | 25 (26.9%) |
| Enterprise Management | 0 (0.0%) | 0 (0.0%) |
| Administrative & Support | 53 (31.0%) | 118 (69.0%) |
| Educational Services | 30 (10.3%) | 261 (89.7%) |
| Health Care & Social Assistance | 219 (28.0%) | 562 (72.0%) |
| Arts, Entertainment & Recreation | 79 (66.9%) | 39 (33.1%) |
| Accommodation & Food Services | 67 (34.7%) | 126 (65.3%) |
| Public Administration | 31 (77.5%) | 9 (22.5%) |
| Total | 2,463 (55.8%) | 1,954 (44.2%) |
Education in Clinton
School Enrollment in Clinton
The most common levels of schooling among the 1,878 students in Clinton are elementary school (558 | 29.7%), middle school (493 | 26.3%), and high school (478 | 25.5%).
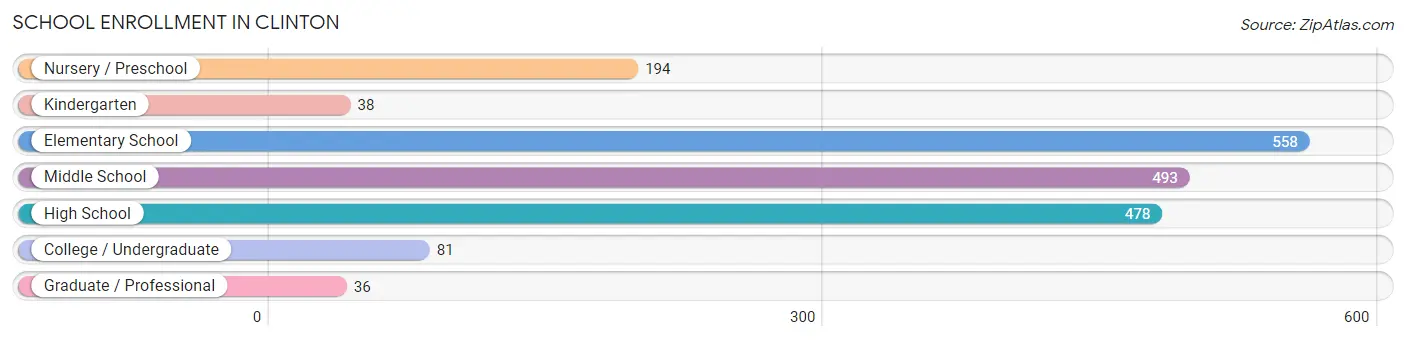
| School Level | # Students | % Students |
| Nursery / Preschool | 194 | 10.3% |
| Kindergarten | 38 | 2.0% |
| Elementary School | 558 | 29.7% |
| Middle School | 493 | 26.3% |
| High School | 478 | 25.5% |
| College / Undergraduate | 81 | 4.3% |
| Graduate / Professional | 36 | 1.9% |
| Total | 1,878 | 100.0% |
School Enrollment by Age by Funding Source in Clinton
Out of a total of 1,878 students who are enrolled in schools in Clinton, 60 (3.2%) attend a private institution, while the remaining 1,818 (96.8%) are enrolled in public schools. The age group of 15 to 17 year olds has the highest likelihood of being enrolled in private schools, with 37 (9.8% in the age bracket) enrolled. Conversely, the age group of 3 to 4 year olds has the lowest likelihood of being enrolled in a private school, with 86 (100.0% in the age bracket) attending a public institution.
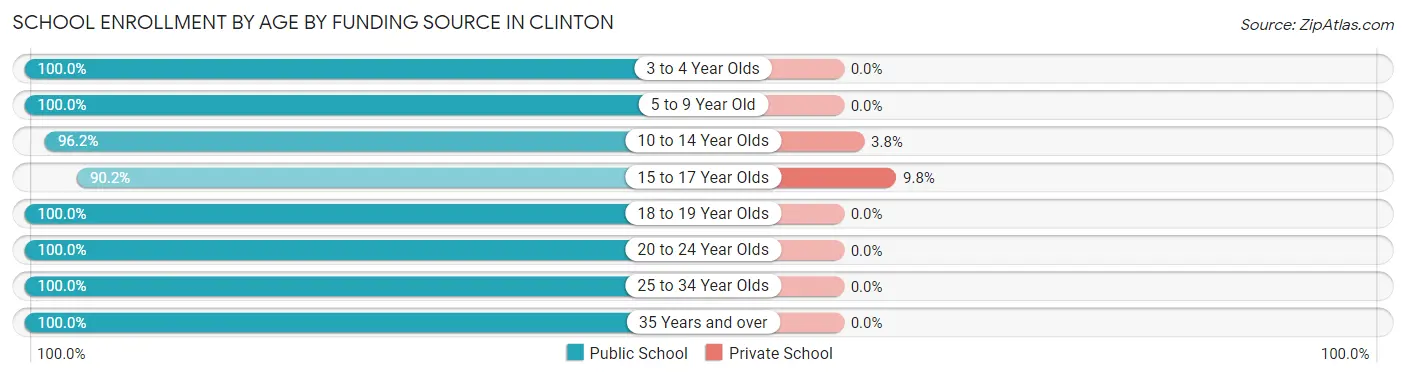
| Age Bracket | Public School | Private School |
| 3 to 4 Year Olds | 86 (100.0%) | 0 (0.0%) |
| 5 to 9 Year Old | 642 (100.0%) | 0 (0.0%) |
| 10 to 14 Year Olds | 583 (96.2%) | 23 (3.8%) |
| 15 to 17 Year Olds | 342 (90.2%) | 37 (9.8%) |
| 18 to 19 Year Olds | 60 (100.0%) | 0 (0.0%) |
| 20 to 24 Year Olds | 15 (100.0%) | 0 (0.0%) |
| 25 to 34 Year Olds | 35 (100.0%) | 0 (0.0%) |
| 35 Years and over | 55 (100.0%) | 0 (0.0%) |
| Total | 1,818 (96.8%) | 60 (3.2%) |
Educational Attainment by Field of Study in Clinton
Business (422 | 28.9%), education (322 | 22.0%), communications (178 | 12.2%), bio, nature & agricultural (117 | 8.0%), and science & technology (114 | 7.8%) are the most common fields of study among 1,461 individuals in Clinton who have obtained a bachelor's degree or higher.
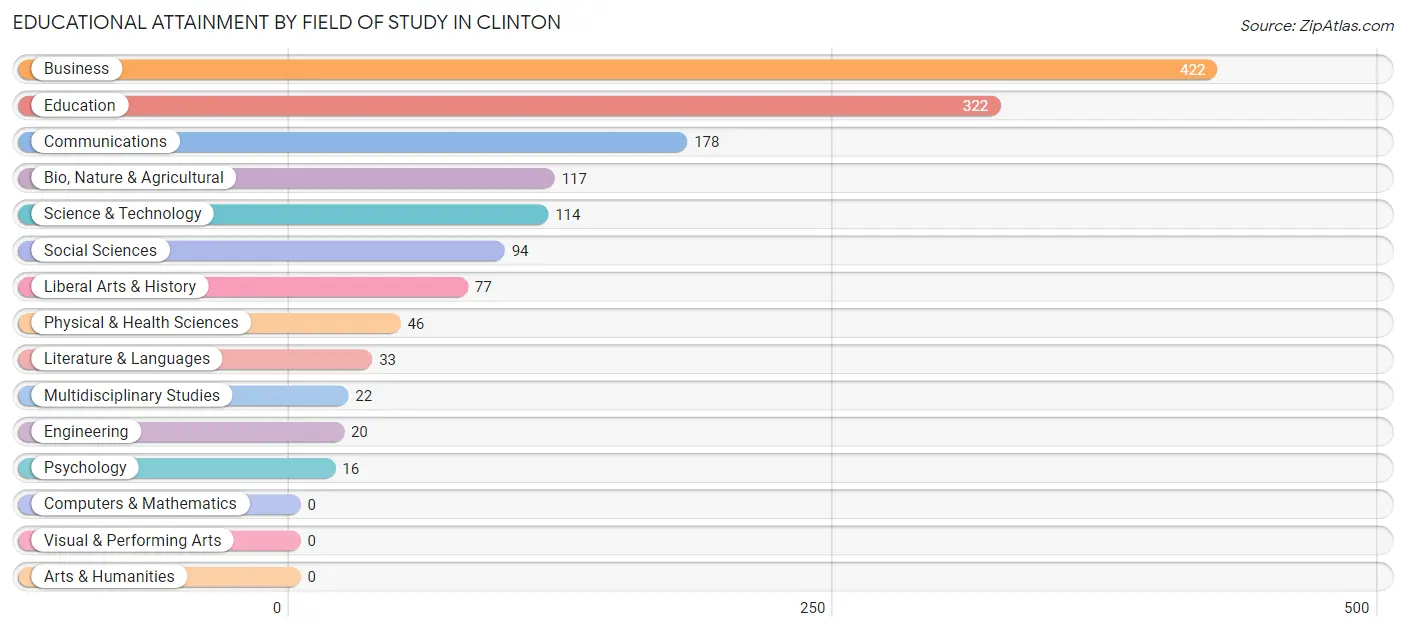
| Field of Study | # Graduates | % Graduates |
| Computers & Mathematics | 0 | 0.0% |
| Bio, Nature & Agricultural | 117 | 8.0% |
| Physical & Health Sciences | 46 | 3.2% |
| Psychology | 16 | 1.1% |
| Social Sciences | 94 | 6.4% |
| Engineering | 20 | 1.4% |
| Multidisciplinary Studies | 22 | 1.5% |
| Science & Technology | 114 | 7.8% |
| Business | 422 | 28.9% |
| Education | 322 | 22.0% |
| Literature & Languages | 33 | 2.3% |
| Liberal Arts & History | 77 | 5.3% |
| Visual & Performing Arts | 0 | 0.0% |
| Communications | 178 | 12.2% |
| Arts & Humanities | 0 | 0.0% |
| Total | 1,461 | 100.0% |
Transportation & Commute in Clinton
Vehicle Availability by Sex in Clinton
The most prevalent vehicle ownership categories in Clinton are males with 2 vehicles (1,167, accounting for 48.4%) and females with 2 vehicles (695, making up 60.3%).
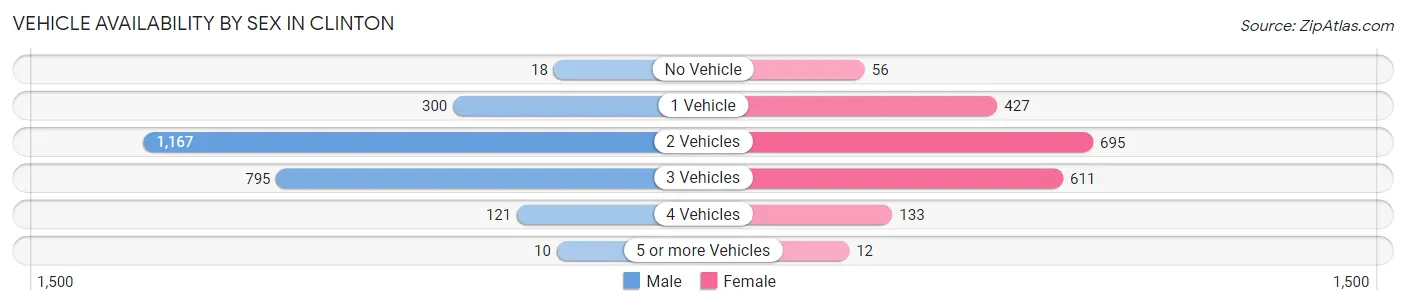
| Vehicles Available | Male | Female |
| No Vehicle | 18 (0.7%) | 56 (2.9%) |
| 1 Vehicle | 300 (12.4%) | 427 (22.1%) |
| 2 Vehicles | 1,167 (48.4%) | 695 (35.9%) |
| 3 Vehicles | 795 (33.0%) | 611 (31.6%) |
| 4 Vehicles | 121 (5.0%) | 133 (6.9%) |
| 5 or more Vehicles | 10 (0.4%) | 12 (0.6%) |
| Total | 2,411 (100.0%) | 1,934 (100.0%) |
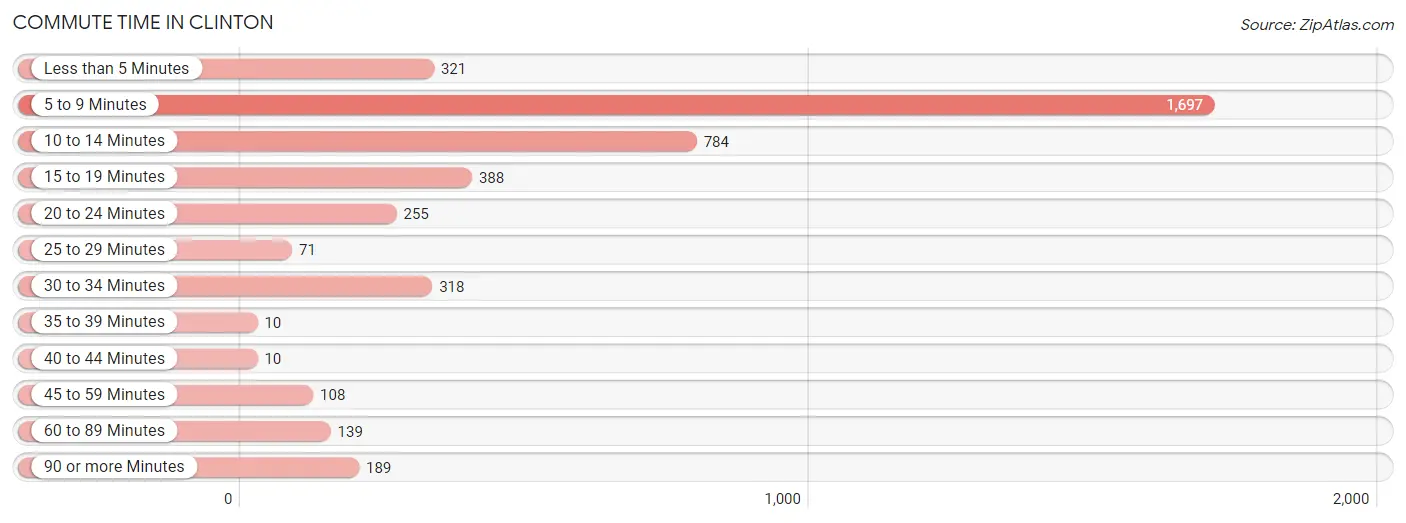
Commute Time in Clinton
The most frequently occuring commute durations in Clinton are 5 to 9 minutes (1,697 commuters, 39.6%), 10 to 14 minutes (784 commuters, 18.3%), and 15 to 19 minutes (388 commuters, 9.0%).
| Commute Time | # Commuters | % Commuters |
| Less than 5 Minutes | 321 | 7.5% |
| 5 to 9 Minutes | 1,697 | 39.6% |
| 10 to 14 Minutes | 784 | 18.3% |
| 15 to 19 Minutes | 388 | 9.0% |
| 20 to 24 Minutes | 255 | 5.9% |
| 25 to 29 Minutes | 71 | 1.7% |
| 30 to 34 Minutes | 318 | 7.4% |
| 35 to 39 Minutes | 10 | 0.2% |
| 40 to 44 Minutes | 10 | 0.2% |
| 45 to 59 Minutes | 108 | 2.5% |
| 60 to 89 Minutes | 139 | 3.2% |
| 90 or more Minutes | 189 | 4.4% |
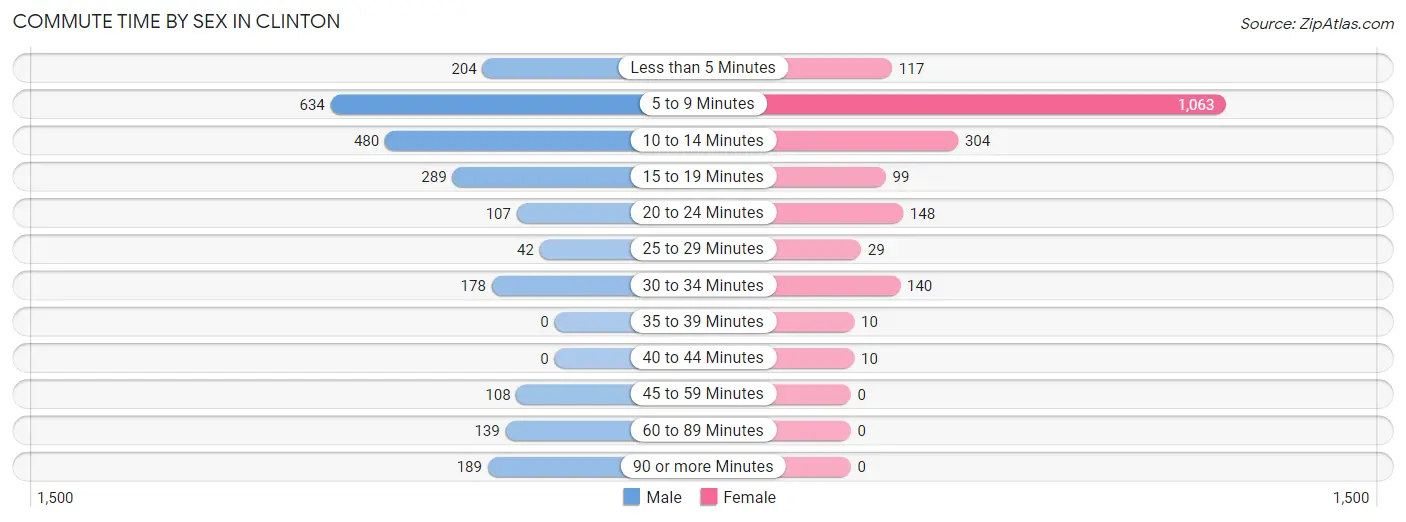
Commute Time by Sex in Clinton
The most common commute times in Clinton are 5 to 9 minutes (634 commuters, 26.8%) for males and 5 to 9 minutes (1,063 commuters, 55.4%) for females.
| Commute Time | Male | Female |
| Less than 5 Minutes | 204 (8.6%) | 117 (6.1%) |
| 5 to 9 Minutes | 634 (26.8%) | 1,063 (55.4%) |
| 10 to 14 Minutes | 480 (20.3%) | 304 (15.8%) |
| 15 to 19 Minutes | 289 (12.2%) | 99 (5.2%) |
| 20 to 24 Minutes | 107 (4.5%) | 148 (7.7%) |
| 25 to 29 Minutes | 42 (1.8%) | 29 (1.5%) |
| 30 to 34 Minutes | 178 (7.5%) | 140 (7.3%) |
| 35 to 39 Minutes | 0 (0.0%) | 10 (0.5%) |
| 40 to 44 Minutes | 0 (0.0%) | 10 (0.5%) |
| 45 to 59 Minutes | 108 (4.6%) | 0 (0.0%) |
| 60 to 89 Minutes | 139 (5.9%) | 0 (0.0%) |
| 90 or more Minutes | 189 (8.0%) | 0 (0.0%) |
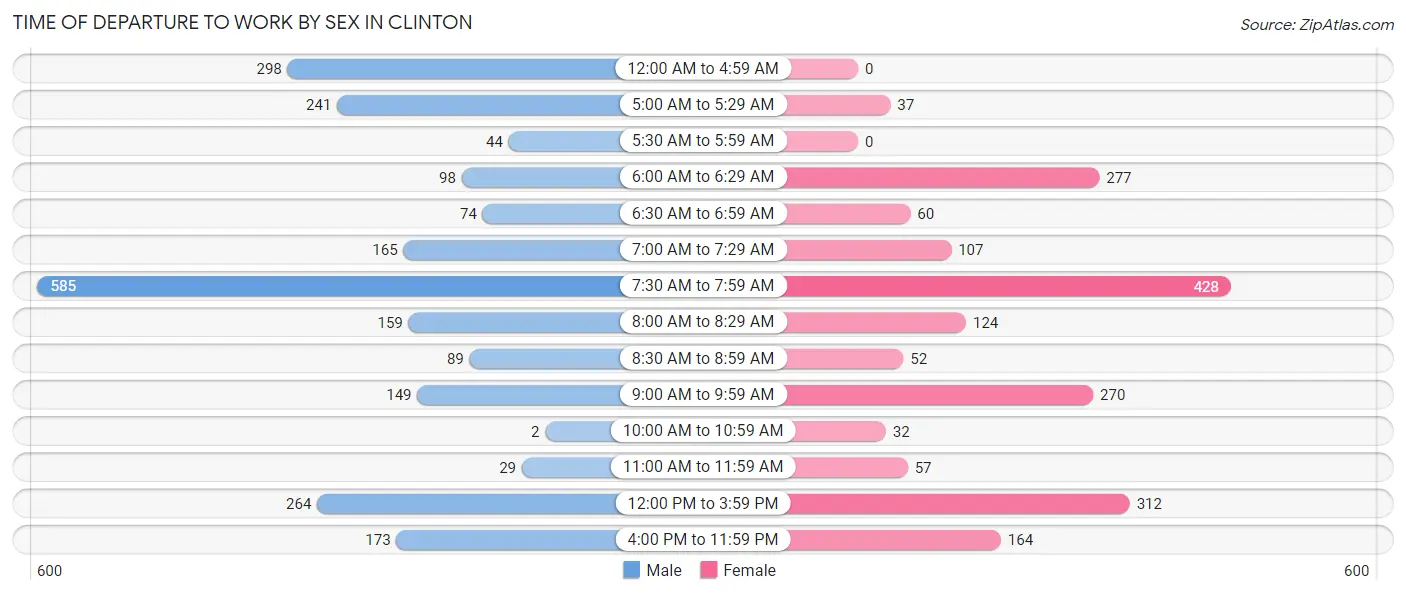
Time of Departure to Work by Sex in Clinton
The most frequent times of departure to work in Clinton are 7:30 AM to 7:59 AM (585, 24.7%) for males and 7:30 AM to 7:59 AM (428, 22.3%) for females.
| Time of Departure | Male | Female |
| 12:00 AM to 4:59 AM | 298 (12.6%) | 0 (0.0%) |
| 5:00 AM to 5:29 AM | 241 (10.2%) | 37 (1.9%) |
| 5:30 AM to 5:59 AM | 44 (1.9%) | 0 (0.0%) |
| 6:00 AM to 6:29 AM | 98 (4.1%) | 277 (14.4%) |
| 6:30 AM to 6:59 AM | 74 (3.1%) | 60 (3.1%) |
| 7:00 AM to 7:29 AM | 165 (7.0%) | 107 (5.6%) |
| 7:30 AM to 7:59 AM | 585 (24.7%) | 428 (22.3%) |
| 8:00 AM to 8:29 AM | 159 (6.7%) | 124 (6.5%) |
| 8:30 AM to 8:59 AM | 89 (3.8%) | 52 (2.7%) |
| 9:00 AM to 9:59 AM | 149 (6.3%) | 270 (14.1%) |
| 10:00 AM to 10:59 AM | 2 (0.1%) | 32 (1.7%) |
| 11:00 AM to 11:59 AM | 29 (1.2%) | 57 (3.0%) |
| 12:00 PM to 3:59 PM | 264 (11.1%) | 312 (16.3%) |
| 4:00 PM to 11:59 PM | 173 (7.3%) | 164 (8.5%) |
| Total | 2,370 (100.0%) | 1,920 (100.0%) |
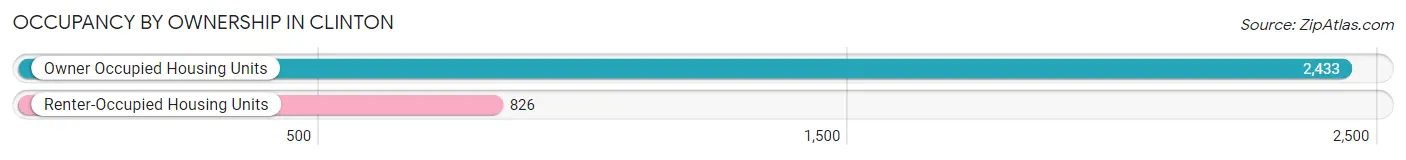
Housing Occupancy in Clinton
Occupancy by Ownership in Clinton
Of the total 3,259 dwellings in Clinton, owner-occupied units account for 2,433 (74.7%), while renter-occupied units make up 826 (25.4%).
| Occupancy | # Housing Units | % Housing Units |
| Owner Occupied Housing Units | 2,433 | 74.7% |
| Renter-Occupied Housing Units | 826 | 25.4% |
| Total Occupied Housing Units | 3,259 | 100.0% |
Occupancy by Household Size in Clinton
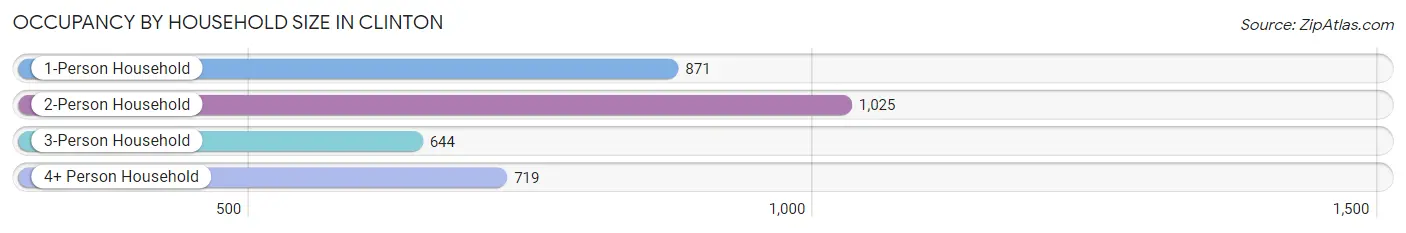
| Household Size | # Housing Units | % Housing Units |
| 1-Person Household | 871 | 26.7% |
| 2-Person Household | 1,025 | 31.5% |
| 3-Person Household | 644 | 19.8% |
| 4+ Person Household | 719 | 22.1% |
| Total Housing Units | 3,259 | 100.0% |
Occupancy by Ownership by Household Size in Clinton
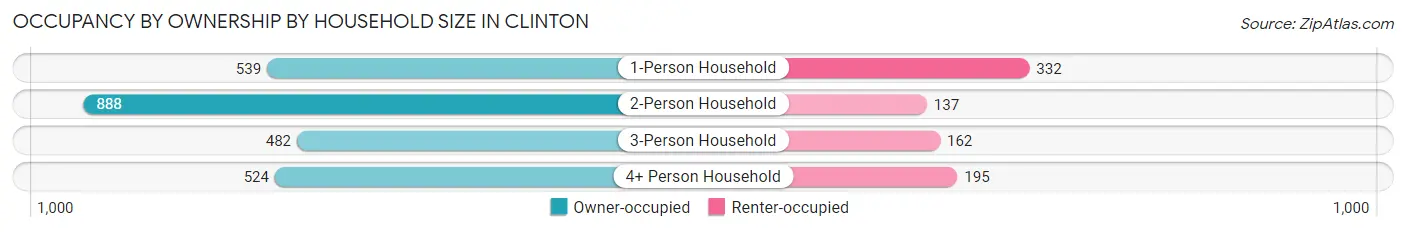
| Household Size | Owner-occupied | Renter-occupied |
| 1-Person Household | 539 (61.9%) | 332 (38.1%) |
| 2-Person Household | 888 (86.6%) | 137 (13.4%) |
| 3-Person Household | 482 (74.8%) | 162 (25.2%) |
| 4+ Person Household | 524 (72.9%) | 195 (27.1%) |
| Total Housing Units | 2,433 (74.7%) | 826 (25.4%) |
Occupancy by Educational Attainment in Clinton
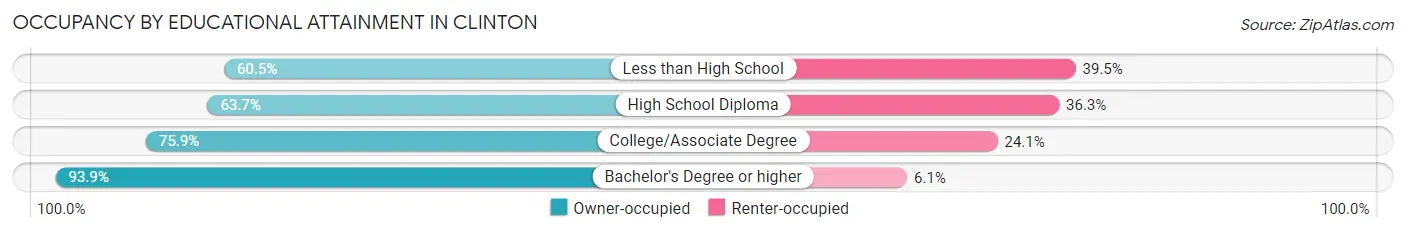
| Household Size | Owner-occupied | Renter-occupied |
| Less than High School | 315 (60.5%) | 206 (39.5%) |
| High School Diploma | 622 (63.7%) | 354 (36.3%) |
| College/Associate Degree | 669 (75.9%) | 212 (24.1%) |
| Bachelor's Degree or higher | 827 (93.9%) | 54 (6.1%) |
Occupancy by Age of Householder in Clinton
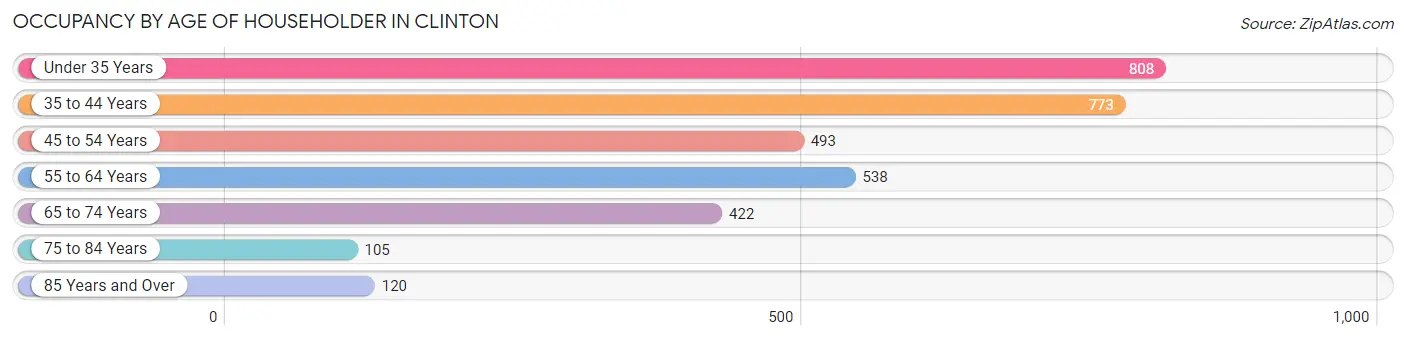
| Age Bracket | # Households | % Households |
| Under 35 Years | 808 | 24.8% |
| 35 to 44 Years | 773 | 23.7% |
| 45 to 54 Years | 493 | 15.1% |
| 55 to 64 Years | 538 | 16.5% |
| 65 to 74 Years | 422 | 13.0% |
| 75 to 84 Years | 105 | 3.2% |
| 85 Years and Over | 120 | 3.7% |
| Total | 3,259 | 100.0% |
Housing Finances in Clinton
Median Income by Occupancy in Clinton
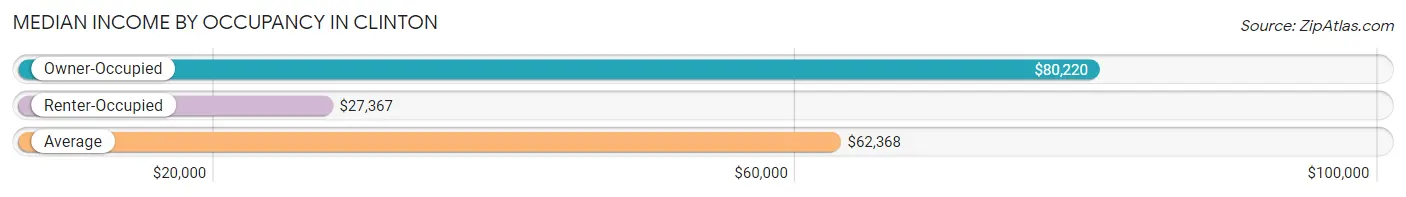
| Occupancy Type | # Households | Median Income |
| Owner-Occupied | 2,433 (74.7%) | $80,220 |
| Renter-Occupied | 826 (25.4%) | $27,367 |
| Average | 3,259 (100.0%) | $62,368 |
Occupancy by Householder Income Bracket in Clinton
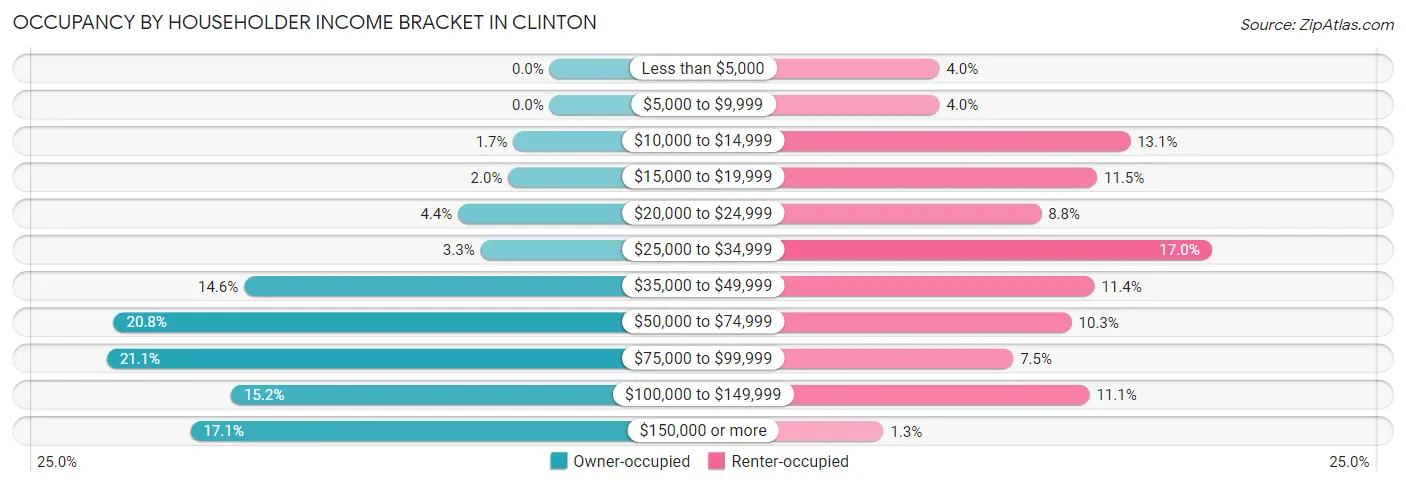
| Income Bracket | Owner-occupied | Renter-occupied |
| Less than $5,000 | 0 (0.0%) | 33 (4.0%) |
| $5,000 to $9,999 | 0 (0.0%) | 33 (4.0%) |
| $10,000 to $14,999 | 42 (1.7%) | 108 (13.1%) |
| $15,000 to $19,999 | 48 (2.0%) | 95 (11.5%) |
| $20,000 to $24,999 | 106 (4.4%) | 73 (8.8%) |
| $25,000 to $34,999 | 80 (3.3%) | 140 (17.0%) |
| $35,000 to $49,999 | 354 (14.5%) | 94 (11.4%) |
| $50,000 to $74,999 | 505 (20.8%) | 85 (10.3%) |
| $75,000 to $99,999 | 513 (21.1%) | 62 (7.5%) |
| $100,000 to $149,999 | 369 (15.2%) | 92 (11.1%) |
| $150,000 or more | 416 (17.1%) | 11 (1.3%) |
| Total | 2,433 (100.0%) | 826 (100.0%) |
Monthly Housing Cost Tiers in Clinton
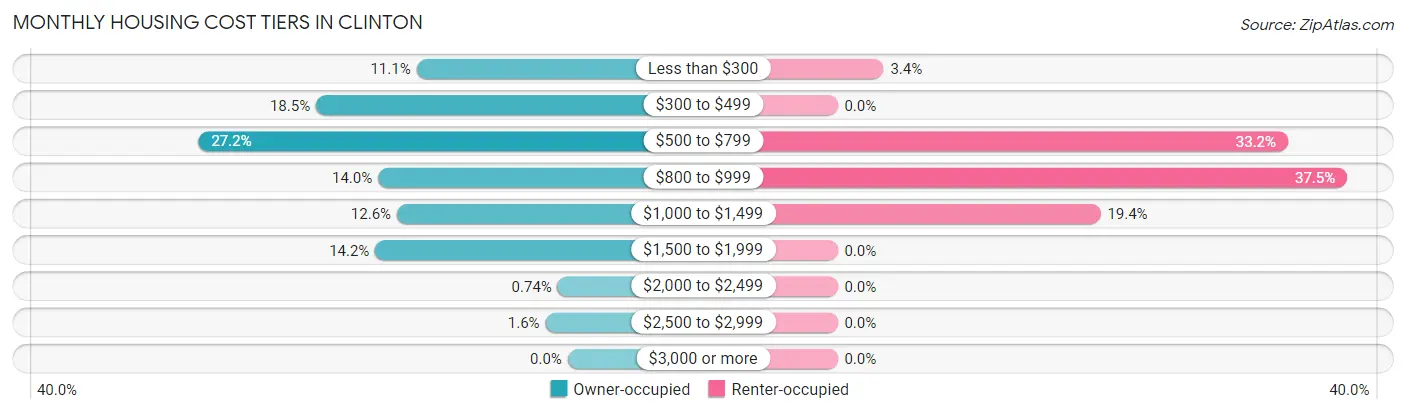
| Monthly Cost | Owner-occupied | Renter-occupied |
| Less than $300 | 271 (11.1%) | 28 (3.4%) |
| $300 to $499 | 451 (18.5%) | 0 (0.0%) |
| $500 to $799 | 662 (27.2%) | 274 (33.2%) |
| $800 to $999 | 340 (14.0%) | 310 (37.5%) |
| $1,000 to $1,499 | 306 (12.6%) | 160 (19.4%) |
| $1,500 to $1,999 | 345 (14.2%) | 0 (0.0%) |
| $2,000 to $2,499 | 18 (0.7%) | 0 (0.0%) |
| $2,500 to $2,999 | 40 (1.6%) | 0 (0.0%) |
| $3,000 or more | 0 (0.0%) | 0 (0.0%) |
| Total | 2,433 (100.0%) | 826 (100.0%) |
Physical Housing Characteristics in Clinton
Housing Structures in Clinton
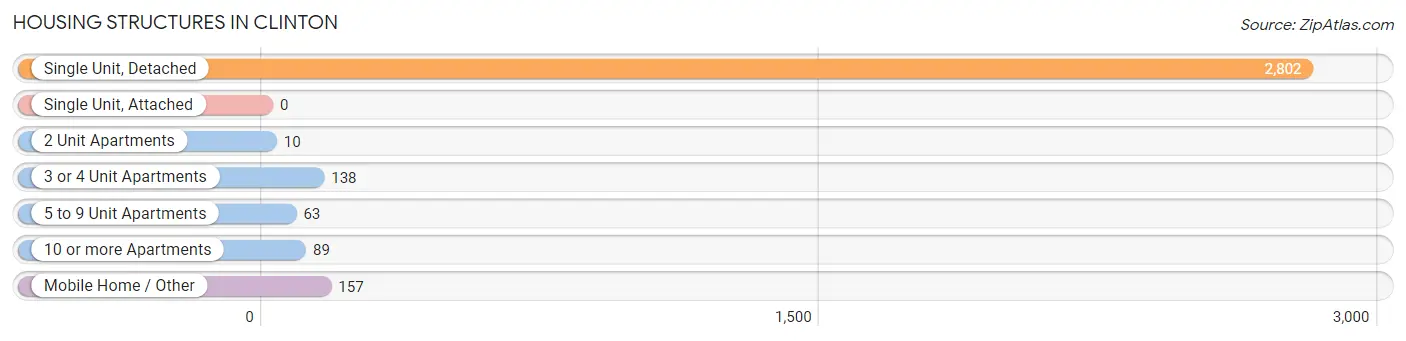
| Structure Type | # Housing Units | % Housing Units |
| Single Unit, Detached | 2,802 | 86.0% |
| Single Unit, Attached | 0 | 0.0% |
| 2 Unit Apartments | 10 | 0.3% |
| 3 or 4 Unit Apartments | 138 | 4.2% |
| 5 to 9 Unit Apartments | 63 | 1.9% |
| 10 or more Apartments | 89 | 2.7% |
| Mobile Home / Other | 157 | 4.8% |
| Total | 3,259 | 100.0% |
Housing Structures by Occupancy in Clinton
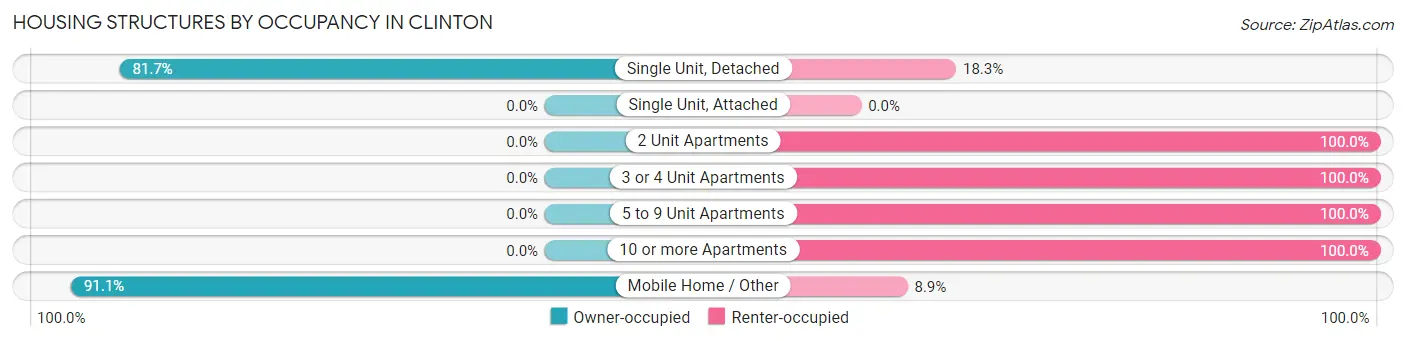
| Structure Type | Owner-occupied | Renter-occupied |
| Single Unit, Detached | 2,290 (81.7%) | 512 (18.3%) |
| Single Unit, Attached | 0 (0.0%) | 0 (0.0%) |
| 2 Unit Apartments | 0 (0.0%) | 10 (100.0%) |
| 3 or 4 Unit Apartments | 0 (0.0%) | 138 (100.0%) |
| 5 to 9 Unit Apartments | 0 (0.0%) | 63 (100.0%) |
| 10 or more Apartments | 0 (0.0%) | 89 (100.0%) |
| Mobile Home / Other | 143 (91.1%) | 14 (8.9%) |
| Total | 2,433 (74.7%) | 826 (25.4%) |
Housing Structures by Number of Rooms in Clinton
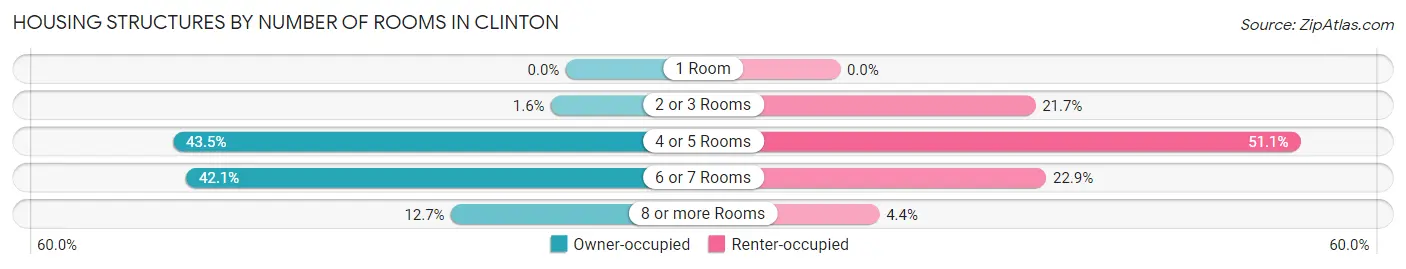
| Number of Rooms | Owner-occupied | Renter-occupied |
| 1 Room | 0 (0.0%) | 0 (0.0%) |
| 2 or 3 Rooms | 40 (1.6%) | 179 (21.7%) |
| 4 or 5 Rooms | 1,059 (43.5%) | 422 (51.1%) |
| 6 or 7 Rooms | 1,024 (42.1%) | 189 (22.9%) |
| 8 or more Rooms | 310 (12.7%) | 36 (4.4%) |
| Total | 2,433 (100.0%) | 826 (100.0%) |
Housing Structure by Heating Type in Clinton
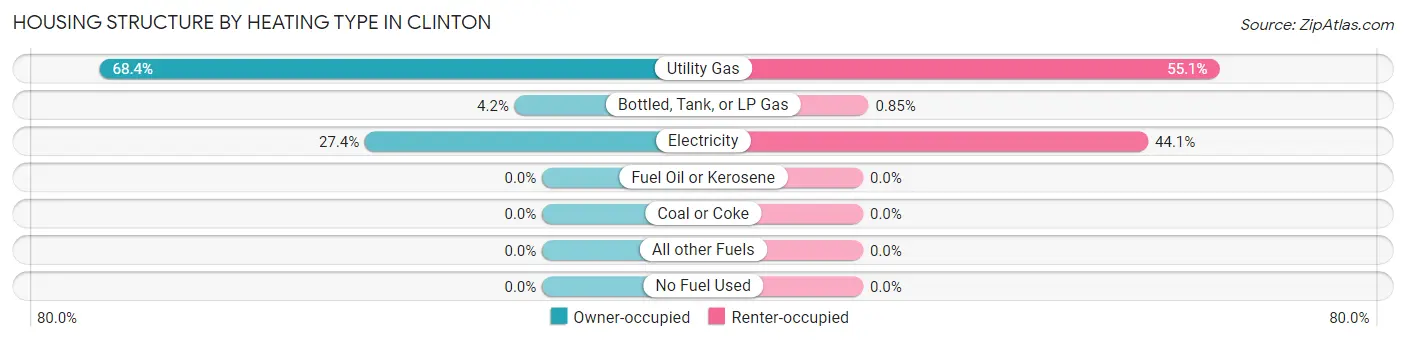
| Heating Type | Owner-occupied | Renter-occupied |
| Utility Gas | 1,664 (68.4%) | 455 (55.1%) |
| Bottled, Tank, or LP Gas | 103 (4.2%) | 7 (0.9%) |
| Electricity | 666 (27.4%) | 364 (44.1%) |
| Fuel Oil or Kerosene | 0 (0.0%) | 0 (0.0%) |
| Coal or Coke | 0 (0.0%) | 0 (0.0%) |
| All other Fuels | 0 (0.0%) | 0 (0.0%) |
| No Fuel Used | 0 (0.0%) | 0 (0.0%) |
| Total | 2,433 (100.0%) | 826 (100.0%) |
Household Vehicle Usage in Clinton
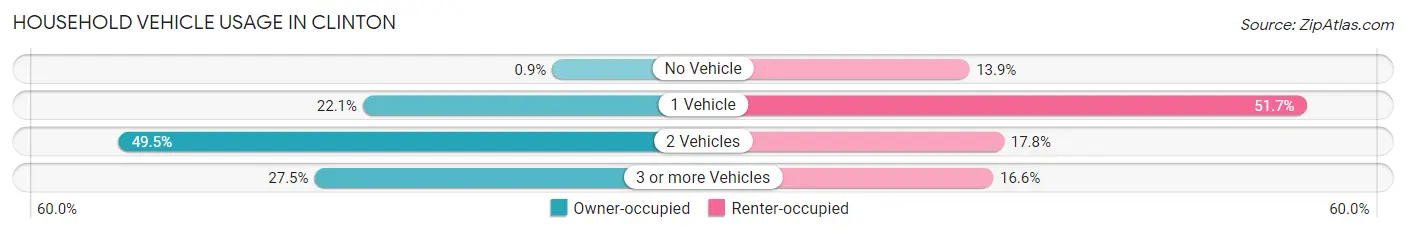
| Vehicles per Household | Owner-occupied | Renter-occupied |
| No Vehicle | 22 (0.9%) | 115 (13.9%) |
| 1 Vehicle | 538 (22.1%) | 427 (51.7%) |
| 2 Vehicles | 1,203 (49.4%) | 147 (17.8%) |
| 3 or more Vehicles | 670 (27.5%) | 137 (16.6%) |
| Total | 2,433 (100.0%) | 826 (100.0%) |
Real Estate & Mortgages in Clinton
Real Estate and Mortgage Overview in Clinton
| Characteristic | Without Mortgage | With Mortgage |
| Housing Units | 1,153 | 1,280 |
| Median Property Value | $96,700 | $151,200 |
| Median Household Income | $62,250 | $323 |
| Monthly Housing Costs | $425 | $0 |
| Real Estate Taxes | $669 | $6 |
Property Value by Mortgage Status in Clinton
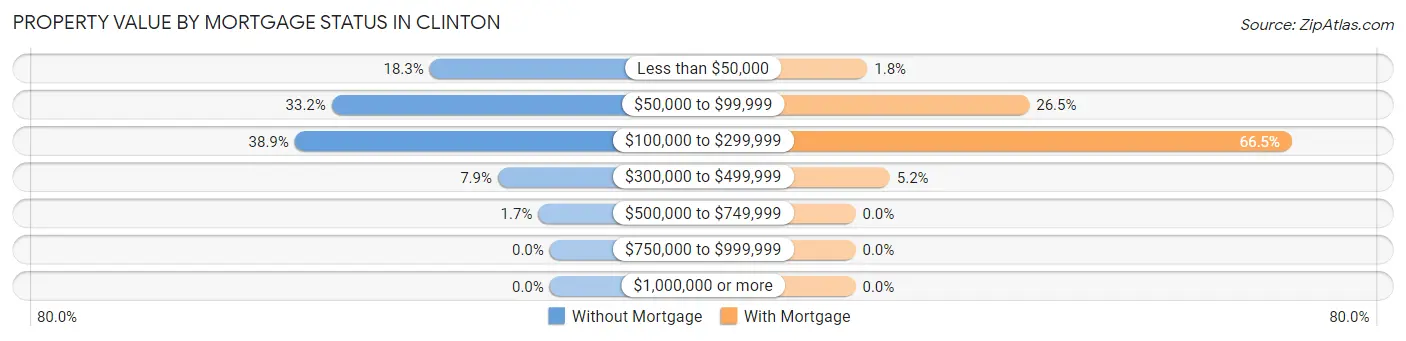
| Property Value | Without Mortgage | With Mortgage |
| Less than $50,000 | 211 (18.3%) | 23 (1.8%) |
| $50,000 to $99,999 | 383 (33.2%) | 339 (26.5%) |
| $100,000 to $299,999 | 448 (38.9%) | 851 (66.5%) |
| $300,000 to $499,999 | 91 (7.9%) | 67 (5.2%) |
| $500,000 to $749,999 | 20 (1.7%) | 0 (0.0%) |
| $750,000 to $999,999 | 0 (0.0%) | 0 (0.0%) |
| $1,000,000 or more | 0 (0.0%) | 0 (0.0%) |
| Total | 1,153 (100.0%) | 1,280 (100.0%) |
Household Income by Mortgage Status in Clinton
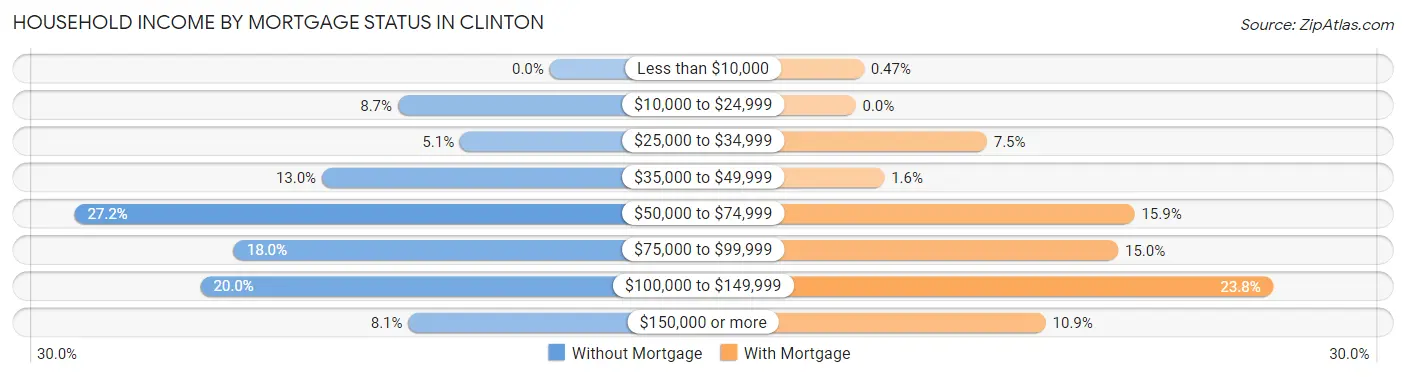
| Household Income | Without Mortgage | With Mortgage |
| Less than $10,000 | 0 (0.0%) | 6 (0.5%) |
| $10,000 to $24,999 | 100 (8.7%) | 0 (0.0%) |
| $25,000 to $34,999 | 59 (5.1%) | 96 (7.5%) |
| $35,000 to $49,999 | 150 (13.0%) | 21 (1.6%) |
| $50,000 to $74,999 | 313 (27.2%) | 204 (15.9%) |
| $75,000 to $99,999 | 208 (18.0%) | 192 (15.0%) |
| $100,000 to $149,999 | 230 (20.0%) | 305 (23.8%) |
| $150,000 or more | 93 (8.1%) | 139 (10.9%) |
| Total | 1,153 (100.0%) | 1,280 (100.0%) |
Property Value to Household Income Ratio in Clinton
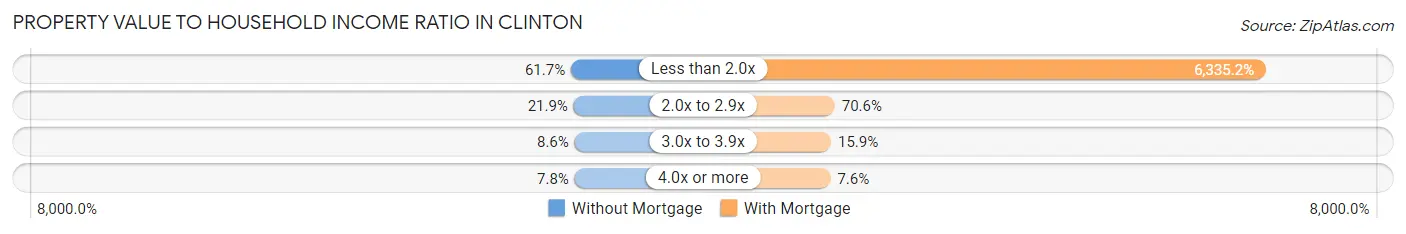
| Value-to-Income Ratio | Without Mortgage | With Mortgage |
| Less than 2.0x | 711 (61.7%) | 81,090 (6,335.2%) |
| 2.0x to 2.9x | 253 (21.9%) | 903 (70.6%) |
| 3.0x to 3.9x | 99 (8.6%) | 204 (15.9%) |
| 4.0x or more | 90 (7.8%) | 97 (7.6%) |
| Total | 1,153 (100.0%) | 1,280 (100.0%) |
Real Estate Taxes by Mortgage Status in Clinton
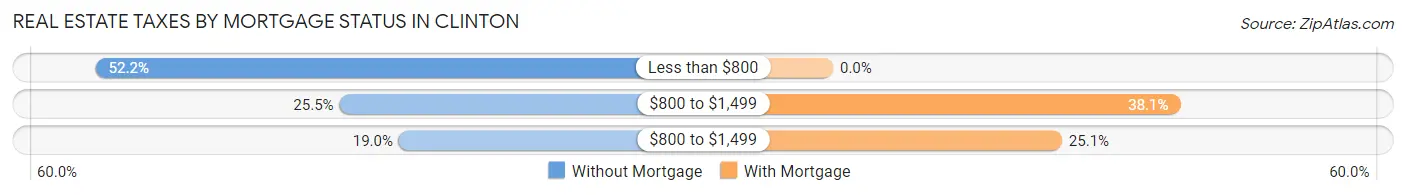
| Property Taxes | Without Mortgage | With Mortgage |
| Less than $800 | 602 (52.2%) | 0 (0.0%) |
| $800 to $1,499 | 294 (25.5%) | 487 (38.1%) |
| $800 to $1,499 | 219 (19.0%) | 321 (25.1%) |
| Total | 1,153 (100.0%) | 1,280 (100.0%) |
Health & Disability in Clinton
Health Insurance Coverage by Age in Clinton
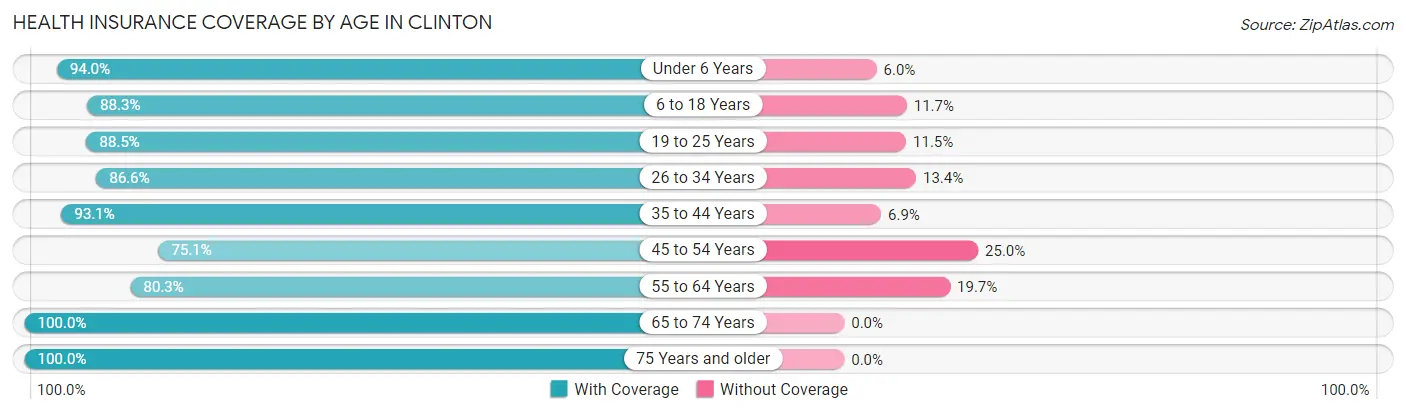
| Age Bracket | With Coverage | Without Coverage |
| Under 6 Years | 718 (94.0%) | 46 (6.0%) |
| 6 to 18 Years | 1,394 (88.3%) | 184 (11.7%) |
| 19 to 25 Years | 614 (88.5%) | 80 (11.5%) |
| 26 to 34 Years | 667 (86.6%) | 103 (13.4%) |
| 35 to 44 Years | 1,235 (93.1%) | 91 (6.9%) |
| 45 to 54 Years | 692 (75.0%) | 230 (24.9%) |
| 55 to 64 Years | 879 (80.3%) | 216 (19.7%) |
| 65 to 74 Years | 602 (100.0%) | 0 (0.0%) |
| 75 Years and older | 461 (100.0%) | 0 (0.0%) |
| Total | 7,262 (88.4%) | 950 (11.6%) |
Health Insurance Coverage by Citizenship Status in Clinton
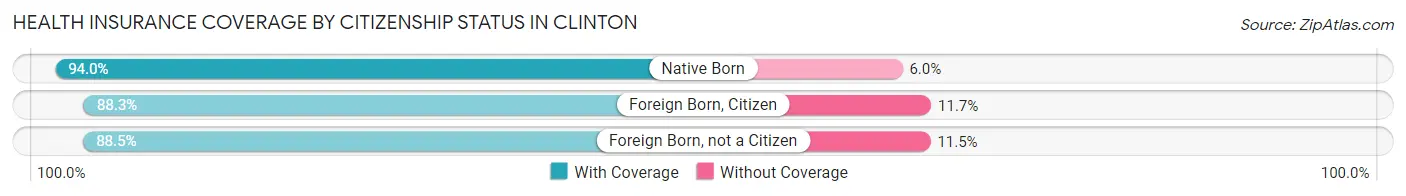
| Citizenship Status | With Coverage | Without Coverage |
| Native Born | 718 (94.0%) | 46 (6.0%) |
| Foreign Born, Citizen | 1,394 (88.3%) | 184 (11.7%) |
| Foreign Born, not a Citizen | 614 (88.5%) | 80 (11.5%) |
Health Insurance Coverage by Household Income in Clinton
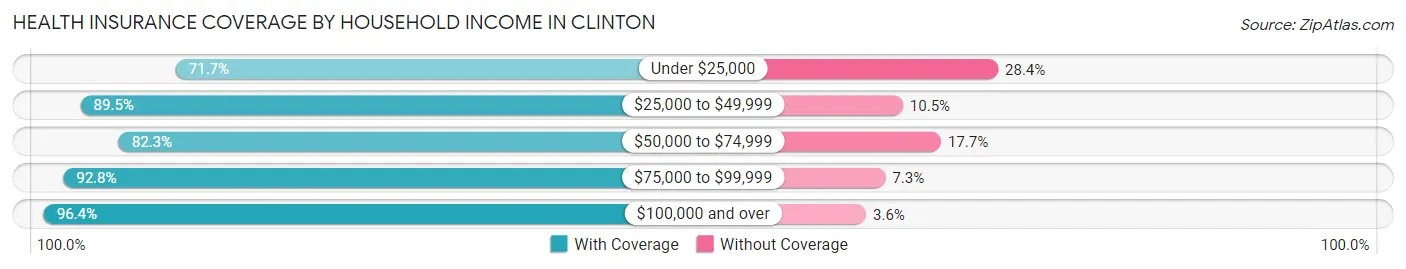
| Household Income | With Coverage | Without Coverage |
| Under $25,000 | 685 (71.7%) | 271 (28.3%) |
| $25,000 to $49,999 | 1,243 (89.5%) | 146 (10.5%) |
| $50,000 to $74,999 | 1,455 (82.3%) | 312 (17.7%) |
| $75,000 to $99,999 | 1,330 (92.7%) | 104 (7.2%) |
| $100,000 and over | 2,536 (96.4%) | 95 (3.6%) |
Public vs Private Health Insurance Coverage by Age in Clinton
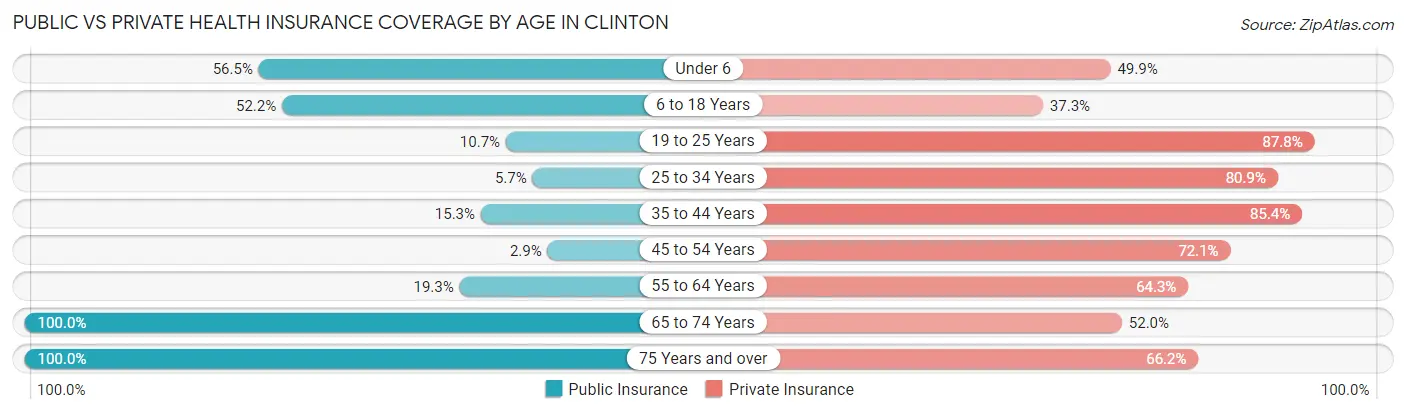
| Age Bracket | Public Insurance | Private Insurance |
| Under 6 | 432 (56.5%) | 381 (49.9%) |
| 6 to 18 Years | 824 (52.2%) | 589 (37.3%) |
| 19 to 25 Years | 74 (10.7%) | 609 (87.7%) |
| 25 to 34 Years | 44 (5.7%) | 623 (80.9%) |
| 35 to 44 Years | 203 (15.3%) | 1,133 (85.4%) |
| 45 to 54 Years | 27 (2.9%) | 665 (72.1%) |
| 55 to 64 Years | 211 (19.3%) | 704 (64.3%) |
| 65 to 74 Years | 602 (100.0%) | 313 (52.0%) |
| 75 Years and over | 461 (100.0%) | 305 (66.2%) |
| Total | 2,878 (35.0%) | 5,322 (64.8%) |
Disability Status by Sex by Age in Clinton
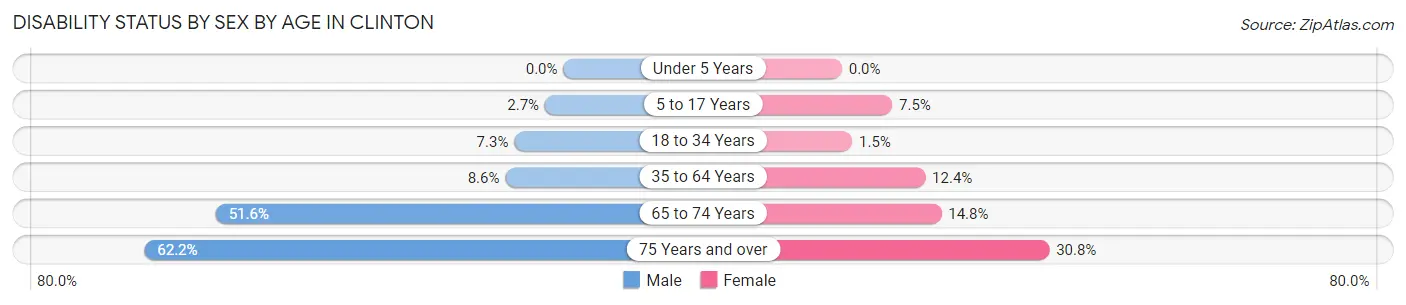
| Age Bracket | Male | Female |
| Under 5 Years | 0 (0.0%) | 0 (0.0%) |
| 5 to 17 Years | 25 (2.7%) | 55 (7.5%) |
| 18 to 34 Years | 56 (7.3%) | 12 (1.5%) |
| 35 to 64 Years | 144 (8.6%) | 207 (12.4%) |
| 65 to 74 Years | 143 (51.6%) | 48 (14.8%) |
| 75 Years and over | 107 (62.2%) | 89 (30.8%) |
Disability Class by Sex by Age in Clinton
Disability Class: Hearing Difficulty
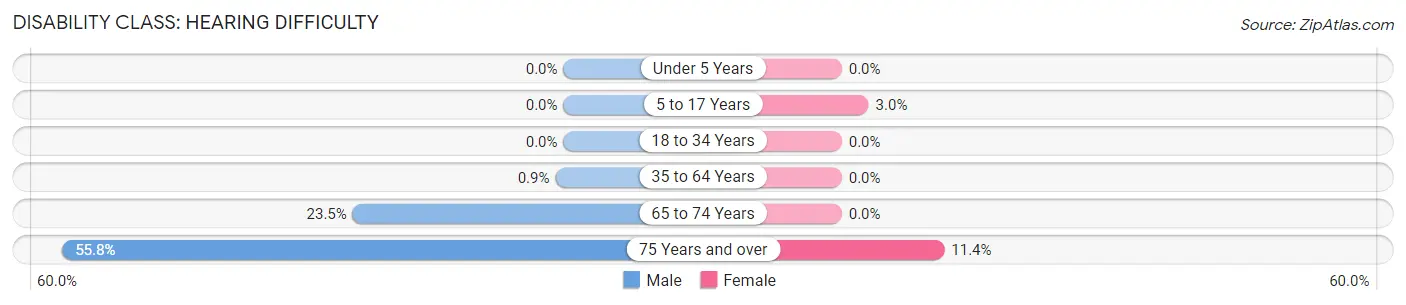
| Age Bracket | Male | Female |
| Under 5 Years | 0 (0.0%) | 0 (0.0%) |
| 5 to 17 Years | 0 (0.0%) | 22 (3.0%) |
| 18 to 34 Years | 0 (0.0%) | 0 (0.0%) |
| 35 to 64 Years | 15 (0.9%) | 0 (0.0%) |
| 65 to 74 Years | 65 (23.5%) | 0 (0.0%) |
| 75 Years and over | 96 (55.8%) | 33 (11.4%) |
Disability Class: Vision Difficulty
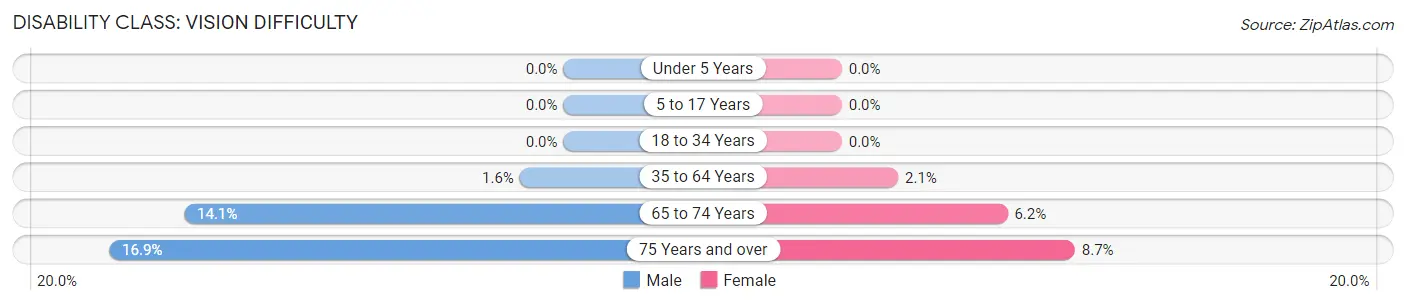
| Age Bracket | Male | Female |
| Under 5 Years | 0 (0.0%) | 0 (0.0%) |
| 5 to 17 Years | 0 (0.0%) | 0 (0.0%) |
| 18 to 34 Years | 0 (0.0%) | 0 (0.0%) |
| 35 to 64 Years | 27 (1.6%) | 35 (2.1%) |
| 65 to 74 Years | 39 (14.1%) | 20 (6.1%) |
| 75 Years and over | 29 (16.9%) | 25 (8.6%) |
Disability Class: Cognitive Difficulty
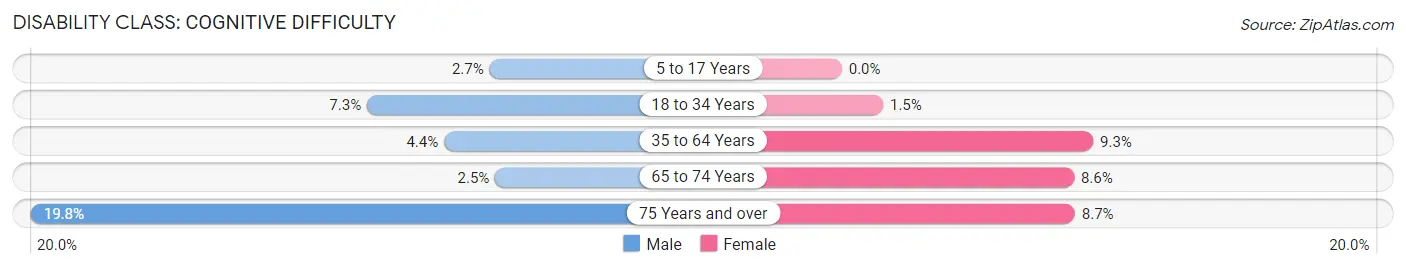
| Age Bracket | Male | Female |
| 5 to 17 Years | 25 (2.7%) | 0 (0.0%) |
| 18 to 34 Years | 56 (7.3%) | 12 (1.5%) |
| 35 to 64 Years | 74 (4.4%) | 156 (9.3%) |
| 65 to 74 Years | 7 (2.5%) | 28 (8.6%) |
| 75 Years and over | 34 (19.8%) | 25 (8.6%) |
Disability Class: Ambulatory Difficulty
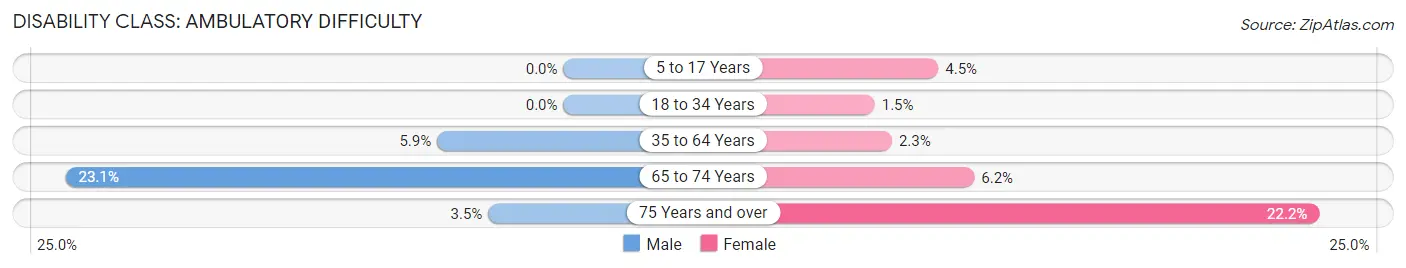
| Age Bracket | Male | Female |
| 5 to 17 Years | 0 (0.0%) | 33 (4.5%) |
| 18 to 34 Years | 0 (0.0%) | 12 (1.5%) |
| 35 to 64 Years | 98 (5.9%) | 39 (2.3%) |
| 65 to 74 Years | 64 (23.1%) | 20 (6.1%) |
| 75 Years and over | 6 (3.5%) | 64 (22.2%) |
Disability Class: Self-Care Difficulty
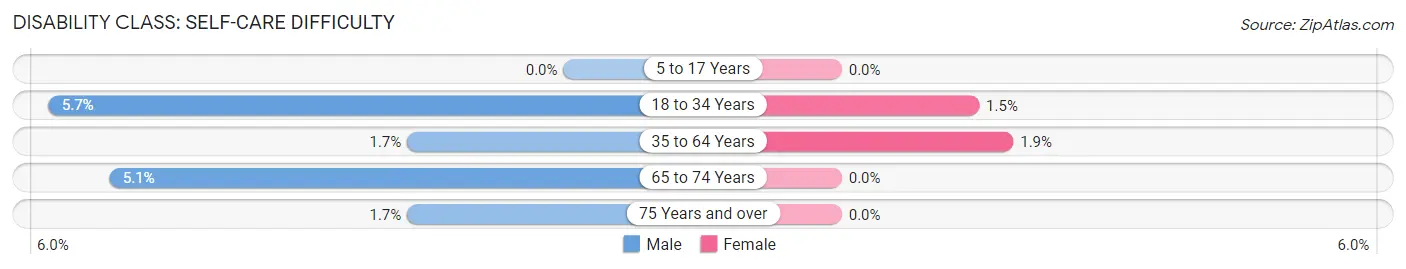
| Age Bracket | Male | Female |
| 5 to 17 Years | 0 (0.0%) | 0 (0.0%) |
| 18 to 34 Years | 44 (5.7%) | 12 (1.5%) |
| 35 to 64 Years | 29 (1.7%) | 32 (1.9%) |
| 65 to 74 Years | 14 (5.1%) | 0 (0.0%) |
| 75 Years and over | 3 (1.7%) | 0 (0.0%) |
Technology Access in Clinton
Computing Device Access in Clinton
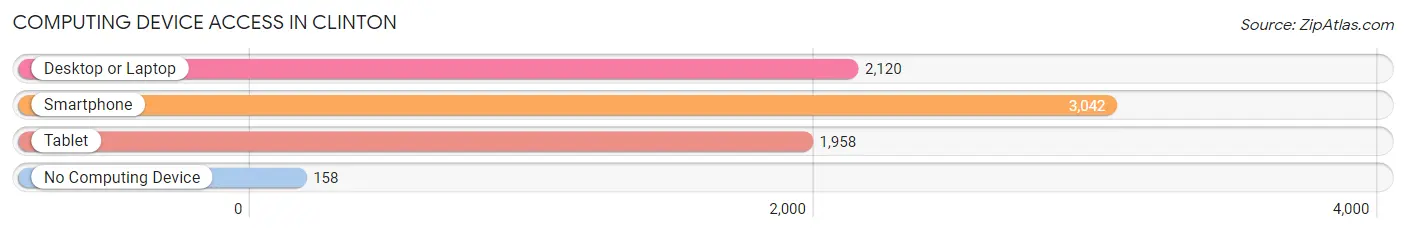
| Device Type | # Households | % Households |
| Desktop or Laptop | 2,120 | 65.0% |
| Smartphone | 3,042 | 93.3% |
| Tablet | 1,958 | 60.1% |
| No Computing Device | 158 | 4.9% |
| Total | 3,259 | 100.0% |
Internet Access in Clinton
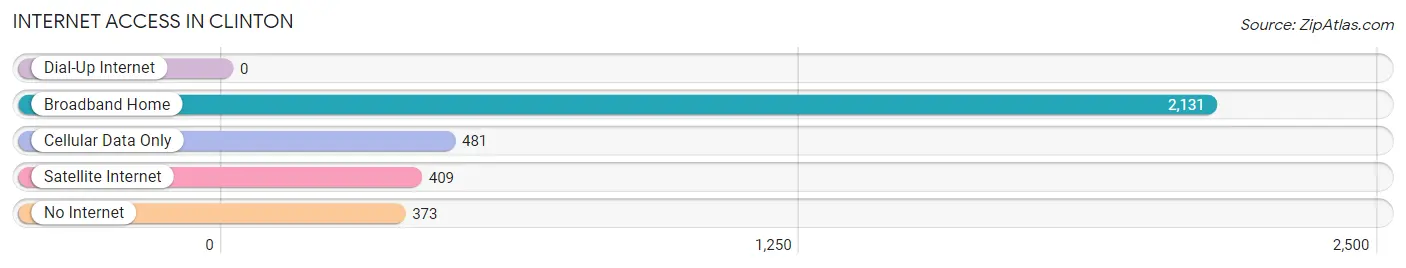
| Internet Type | # Households | % Households |
| Dial-Up Internet | 0 | 0.0% |
| Broadband Home | 2,131 | 65.4% |
| Cellular Data Only | 481 | 14.8% |
| Satellite Internet | 409 | 12.6% |
| No Internet | 373 | 11.5% |
| Total | 3,259 | 100.0% |
Clinton Summary
Clinton, Oklahoma is a city located in Custer County in the western part of the state. It is the county seat and the largest city in the county. The city was founded in 1892 and named after the seventh Governor of Oklahoma, George Clinton. The population of Clinton was 8,717 at the 2010 census, making it the largest city in Custer County.
Geography
Clinton is located at the intersection of US Highway 183 and State Highway 44 in western Oklahoma. It is situated in the Red Bed Plains region of the state, which is characterized by flat terrain and red-colored soil. The city is located approximately 80 miles west of Oklahoma City and is part of the Oklahoma City Metropolitan Statistical Area.
The climate in Clinton is semi-arid, with hot summers and mild winters. The average annual temperature is 64°F, and the average annual precipitation is 33 inches.
Economy
The economy of Clinton is largely based on agriculture and oil and gas production. The city is home to several large oil and gas companies, including Devon Energy, Chesapeake Energy, and Continental Resources. The city is also home to several manufacturing companies, including a Tyson Foods plant and a ConocoPhillips refinery.
The city is also home to several educational institutions, including the University of Oklahoma, Southwestern Oklahoma State University, and Cameron University.
Demographics
As of the 2010 census, the population of Clinton was 8,717. The racial makeup of the city was 79.2% White, 1.2% African American, 0.9% Native American, 0.4% Asian, 0.1% Pacific Islander, and 16.2% from other races. Hispanic or Latino of any race were 4.3% of the population.
The median income for a household in Clinton was $37,945, and the median income for a family was $45,938. The per capita income for the city was $19,845. About 16.2% of families and 19.7% of the population were below the poverty line, including 28.2% of those under age 18 and 11.2% of those age 65 or over.
Education
Clinton is served by the Clinton Public School District, which includes Clinton High School, Clinton Middle School, and Clinton Elementary School. The city is also home to several private schools, including Clinton Christian Academy and Clinton Montessori School.
Conclusion
Clinton, Oklahoma is a city located in Custer County in the western part of the state. It is the county seat and the largest city in the county. The city was founded in 1892 and named after the seventh Governor of Oklahoma, George Clinton. The economy of Clinton is largely based on agriculture and oil and gas production. The population of Clinton was 8,717 at the 2010 census, and the racial makeup of the city was 79.2% White, 1.2% African American, 0.9% Native American, 0.4% Asian, 0.1% Pacific Islander, and 16.2% from other races. The city is served by the Clinton Public School District, which includes Clinton High School, Clinton Middle School, and Clinton Elementary School.
Common Questions
What is Per Capita Income in Clinton?
Per Capita income in Clinton is $33,591.
What is the Median Family Income in Clinton?
Median Family Income in Clinton is $80,288.
What is the Median Household income in Clinton?
Median Household Income in Clinton is $62,368.
What is Income or Wage Gap in Clinton?
Income or Wage Gap in Clinton is 46.3%.
Women in Clinton earn 53.7 cents for every dollar earned by a man.
What is Inequality or Gini Index in Clinton?
Inequality or Gini Index in Clinton is 0.48.
What is the Total Population of Clinton?
Total Population of Clinton is 8,499.
What is the Total Male Population of Clinton?
Total Male Population of Clinton is 4,266.
What is the Total Female Population of Clinton?
Total Female Population of Clinton is 4,233.
What is the Ratio of Males per 100 Females in Clinton?
There are 100.78 Males per 100 Females in Clinton.
What is the Ratio of Females per 100 Males in Clinton?
There are 99.23 Females per 100 Males in Clinton.
What is the Median Population Age in Clinton?
Median Population Age in Clinton is 37.4 Years.
What is the Average Family Size in Clinton
Average Family Size in Clinton is 3.0 People.
What is the Average Household Size in Clinton
Average Household Size in Clinton is 2.5 People.
How Large is the Labor Force in Clinton?
There are 4,419 People in the Labor Forcein in Clinton.
What is the Percentage of People in the Labor Force in Clinton?
68.2% of People are in the Labor Force in Clinton.