Cleo Springs, OK Map & Demographics
Cleo Springs Map
Cleo Springs Overview
$27,246
PER CAPITA INCOME
$42,321
AVG FAMILY INCOME
$41,071
AVG HOUSEHOLD INCOME
63.6%
WAGE / INCOME GAP [ % ]
36.4¢/ $1
WAGE / INCOME GAP [ $ ]
0.42
INEQUALITY / GINI INDEX
360
TOTAL POPULATION
168
MALE POPULATION
192
FEMALE POPULATION
87.50
MALES / 100 FEMALES
114.29
FEMALES / 100 MALES
35.0
MEDIAN AGE
3.7
AVG FAMILY SIZE
2.6
AVG HOUSEHOLD SIZE
117
LABOR FORCE [ PEOPLE ]
56.0%
PERCENT IN LABOR FORCE
Cleo Springs Zip Codes
Cleo Springs Area Codes
Income in Cleo Springs
Income Overview in Cleo Springs
Per Capita Income in Cleo Springs is $27,246, while median incomes of families and households are $42,321 and $41,071 respectively.
| Characteristic | Number | Measure |
| Per Capita Income | 360 | $27,246 |
| Median Family Income | 76 | $42,321 |
| Mean Family Income | 76 | $70,224 |
| Median Household Income | 136 | $41,071 |
| Mean Household Income | 136 | $68,885 |
| Income Deficit | 76 | $0 |
| Wage / Income Gap (%) | 360 | 63.64% |
| Wage / Income Gap ($) | 360 | 36.36¢ per $1 |
| Gini / Inequality Index | 360 | 0.42 |
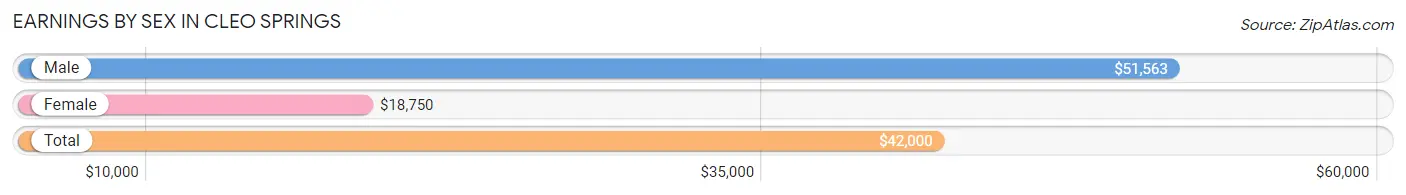
Earnings by Sex in Cleo Springs
Average Earnings in Cleo Springs are $42,000, $51,563 for men and $18,750 for women, a difference of 63.6%.
| Sex | Number | Average Earnings |
| Male | 79 (58.1%) | $51,563 |
| Female | 57 (41.9%) | $18,750 |
| Total | 136 (100.0%) | $42,000 |
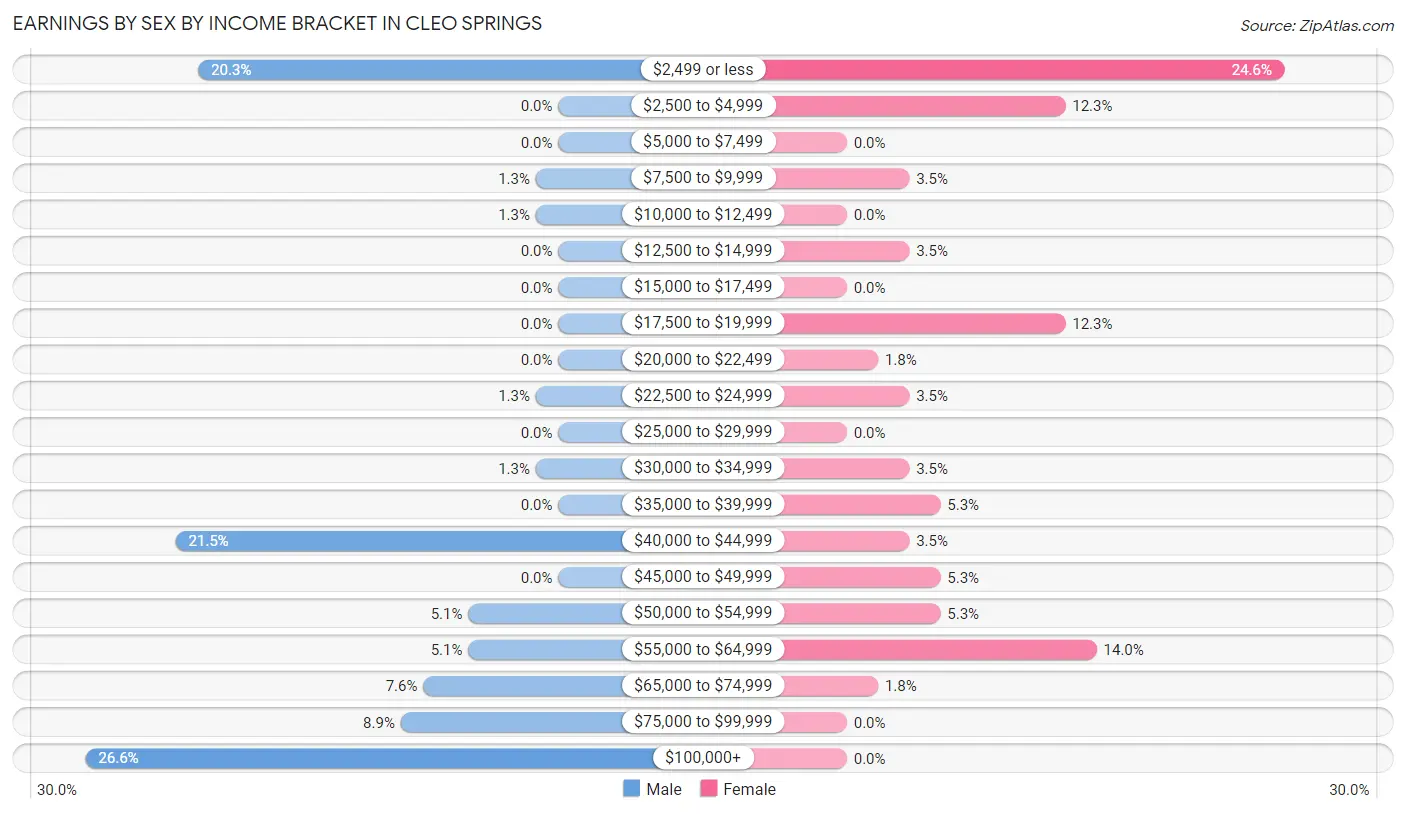
Earnings by Sex by Income Bracket in Cleo Springs
The most common earnings brackets in Cleo Springs are $100,000+ for men (21 | 26.6%) and $2,499 or less for women (14 | 24.6%).
| Income | Male | Female |
| $2,499 or less | 16 (20.3%) | 14 (24.6%) |
| $2,500 to $4,999 | 0 (0.0%) | 7 (12.3%) |
| $5,000 to $7,499 | 0 (0.0%) | 0 (0.0%) |
| $7,500 to $9,999 | 1 (1.3%) | 2 (3.5%) |
| $10,000 to $12,499 | 1 (1.3%) | 0 (0.0%) |
| $12,500 to $14,999 | 0 (0.0%) | 2 (3.5%) |
| $15,000 to $17,499 | 0 (0.0%) | 0 (0.0%) |
| $17,500 to $19,999 | 0 (0.0%) | 7 (12.3%) |
| $20,000 to $22,499 | 0 (0.0%) | 1 (1.8%) |
| $22,500 to $24,999 | 1 (1.3%) | 2 (3.5%) |
| $25,000 to $29,999 | 0 (0.0%) | 0 (0.0%) |
| $30,000 to $34,999 | 1 (1.3%) | 2 (3.5%) |
| $35,000 to $39,999 | 0 (0.0%) | 3 (5.3%) |
| $40,000 to $44,999 | 17 (21.5%) | 2 (3.5%) |
| $45,000 to $49,999 | 0 (0.0%) | 3 (5.3%) |
| $50,000 to $54,999 | 4 (5.1%) | 3 (5.3%) |
| $55,000 to $64,999 | 4 (5.1%) | 8 (14.0%) |
| $65,000 to $74,999 | 6 (7.6%) | 1 (1.8%) |
| $75,000 to $99,999 | 7 (8.9%) | 0 (0.0%) |
| $100,000+ | 21 (26.6%) | 0 (0.0%) |
| Total | 79 (100.0%) | 57 (100.0%) |
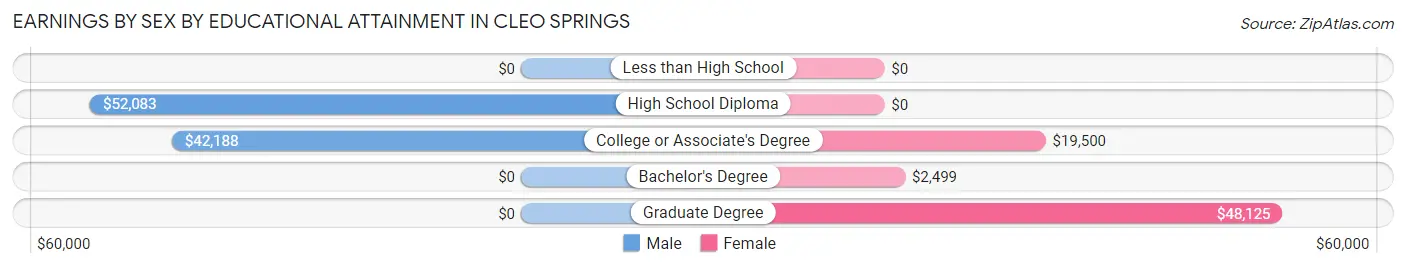
Earnings by Sex by Educational Attainment in Cleo Springs
Average earnings in Cleo Springs are $53,750 for men and $18,750 for women, a difference of 65.1%. Men with an educational attainment of high school diploma enjoy the highest average annual earnings of $52,083, while those with college or associate's degree education earn the least with $42,188. Women with an educational attainment of graduate degree earn the most with the average annual earnings of $48,125, while those with bachelor's degree education have the smallest earnings of $2,499.
| Educational Attainment | Male Income | Female Income |
| Less than High School | - | - |
| High School Diploma | $52,083 | $0 |
| College or Associate's Degree | $42,188 | $19,500 |
| Bachelor's Degree | - | - |
| Graduate Degree | - | - |
| Total | $53,750 | $18,750 |
Family Income in Cleo Springs
Family Income Brackets in Cleo Springs
According to the Cleo Springs family income data, there are 29 families falling into the $35,000 to $49,999 income range, which is the most common income bracket and makes up 38.2% of all families.
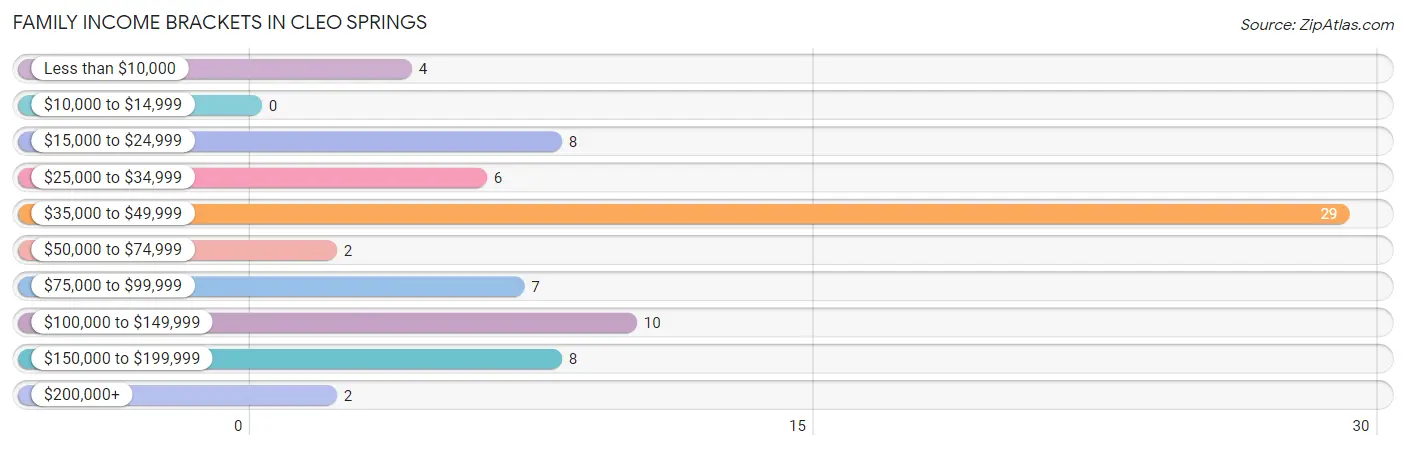
| Income Bracket | # Families | % Families |
| Less than $10,000 | 4 | 5.3% |
| $10,000 to $14,999 | 0 | 0.0% |
| $15,000 to $24,999 | 8 | 10.5% |
| $25,000 to $34,999 | 6 | 7.9% |
| $35,000 to $49,999 | 29 | 38.2% |
| $50,000 to $74,999 | 2 | 2.6% |
| $75,000 to $99,999 | 7 | 9.2% |
| $100,000 to $149,999 | 10 | 13.2% |
| $150,000 to $199,999 | 8 | 10.5% |
| $200,000+ | 2 | 2.6% |
Family Income by Famaliy Size in Cleo Springs
2-person families (46 | 60.5%) account for the highest median family income in Cleo Springs with $45,417 per family, while 2-person families (46 | 60.5%) have the highest median income of $22,708 per family member.
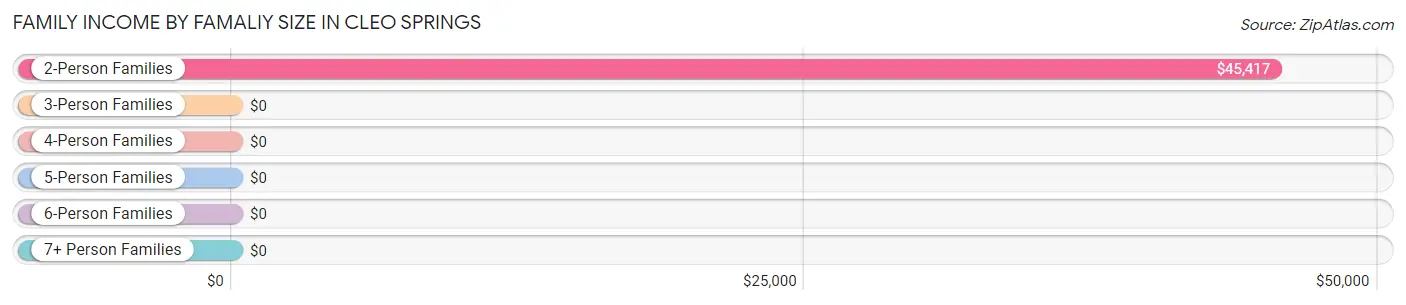
| Income Bracket | # Families | Median Income |
| 2-Person Families | 46 (60.5%) | $45,417 |
| 3-Person Families | 8 (10.5%) | $0 |
| 4-Person Families | 9 (11.8%) | $0 |
| 5-Person Families | 10 (13.2%) | $0 |
| 6-Person Families | 0 (0.0%) | $0 |
| 7+ Person Families | 3 (4.0%) | $0 |
| Total | 76 (100.0%) | $42,321 |
Family Income by Number of Earners in Cleo Springs
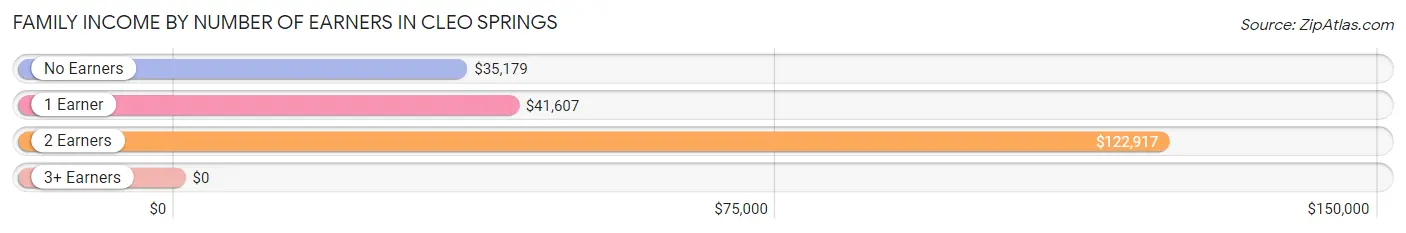
| Number of Earners | # Families | Median Income |
| No Earners | 15 (19.7%) | $35,179 |
| 1 Earner | 40 (52.6%) | $41,607 |
| 2 Earners | 18 (23.7%) | $122,917 |
| 3+ Earners | 3 (4.0%) | $0 |
| Total | 76 (100.0%) | $42,321 |
Household Income in Cleo Springs
Household Income Brackets in Cleo Springs
With 37 households falling in the category, the $35,000 to $49,999 income range is the most frequent in Cleo Springs, accounting for 27.2% of all households.
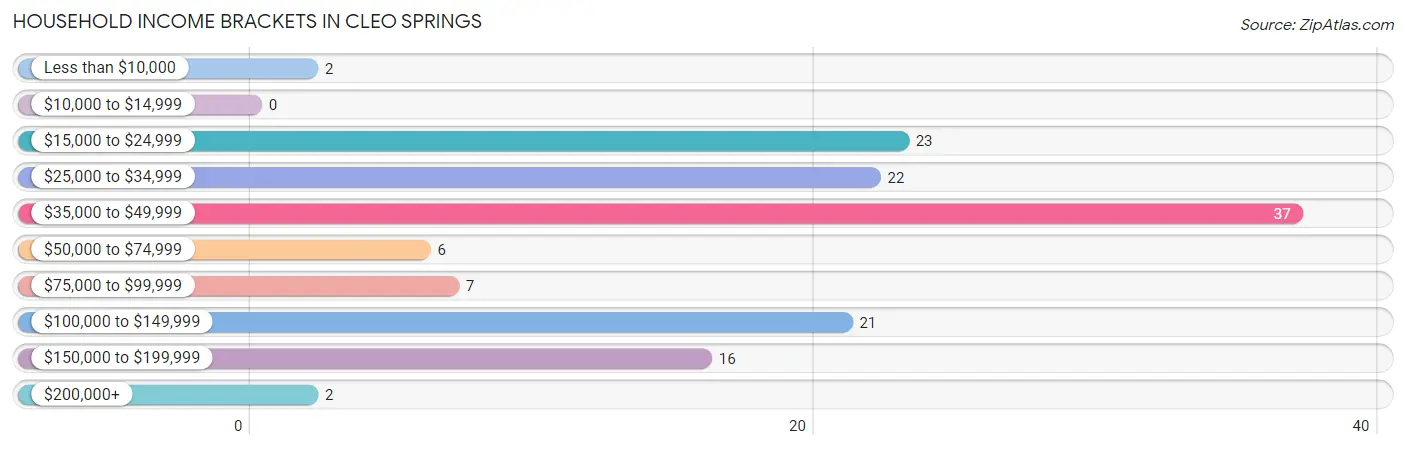
| Income Bracket | # Households | % Households |
| Less than $10,000 | 2 | 1.5% |
| $10,000 to $14,999 | 0 | 0.0% |
| $15,000 to $24,999 | 23 | 16.9% |
| $25,000 to $34,999 | 22 | 16.2% |
| $35,000 to $49,999 | 37 | 27.2% |
| $50,000 to $74,999 | 6 | 4.4% |
| $75,000 to $99,999 | 7 | 5.1% |
| $100,000 to $149,999 | 21 | 15.4% |
| $150,000 to $199,999 | 16 | 11.8% |
| $200,000+ | 2 | 1.5% |
Household Income by Householder Age in Cleo Springs
The median household income in Cleo Springs is $41,071, with the highest median household income of $46,875 found in the 25 to 44 years age bracket for the primary householder. A total of 43 households (31.6%) fall into this category.
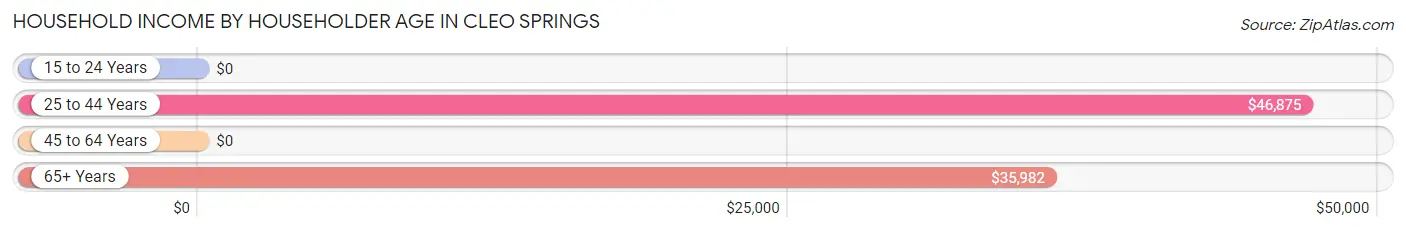
| Income Bracket | # Households | Median Income |
| 15 to 24 Years | 0 (0.0%) | $0 |
| 25 to 44 Years | 43 (31.6%) | $46,875 |
| 45 to 64 Years | 38 (27.9%) | $0 |
| 65+ Years | 55 (40.4%) | $35,982 |
| Total | 136 (100.0%) | $41,071 |
Poverty in Cleo Springs
Income Below Poverty by Sex and Age in Cleo Springs
With 15.5% poverty level for males and 21.2% for females among the residents of Cleo Springs, 18 to 24 year old males and 15 year old females are the most vulnerable to poverty, with 4 males (100.0%) and 10 females (100.0%) in their respective age groups living below the poverty level.
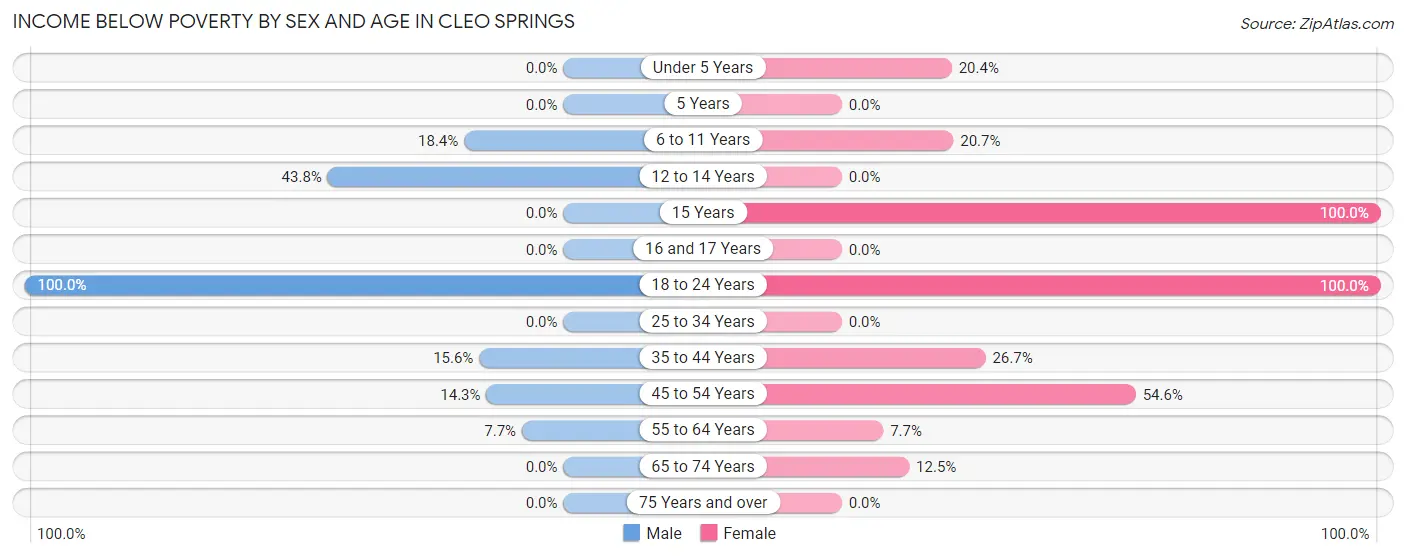
| Age Bracket | Male | Female |
| Under 5 Years | 0 (0.0%) | 10 (20.4%) |
| 5 Years | 0 (0.0%) | 0 (0.0%) |
| 6 to 11 Years | 7 (18.4%) | 6 (20.7%) |
| 12 to 14 Years | 7 (43.8%) | 0 (0.0%) |
| 15 Years | 0 (0.0%) | 10 (100.0%) |
| 16 and 17 Years | 0 (0.0%) | 0 (0.0%) |
| 18 to 24 Years | 4 (100.0%) | 1 (100.0%) |
| 25 to 34 Years | 0 (0.0%) | 0 (0.0%) |
| 35 to 44 Years | 5 (15.6%) | 4 (26.7%) |
| 45 to 54 Years | 1 (14.3%) | 6 (54.5%) |
| 55 to 64 Years | 2 (7.7%) | 1 (7.7%) |
| 65 to 74 Years | 0 (0.0%) | 2 (12.5%) |
| 75 Years and over | 0 (0.0%) | 0 (0.0%) |
| Total | 26 (15.5%) | 40 (21.2%) |
Income Above Poverty by Sex and Age in Cleo Springs
According to the poverty statistics in Cleo Springs, males aged under 5 years and females aged 25 to 34 years are the age groups that are most secure financially, with 100.0% of males and 100.0% of females in these age groups living above the poverty line.
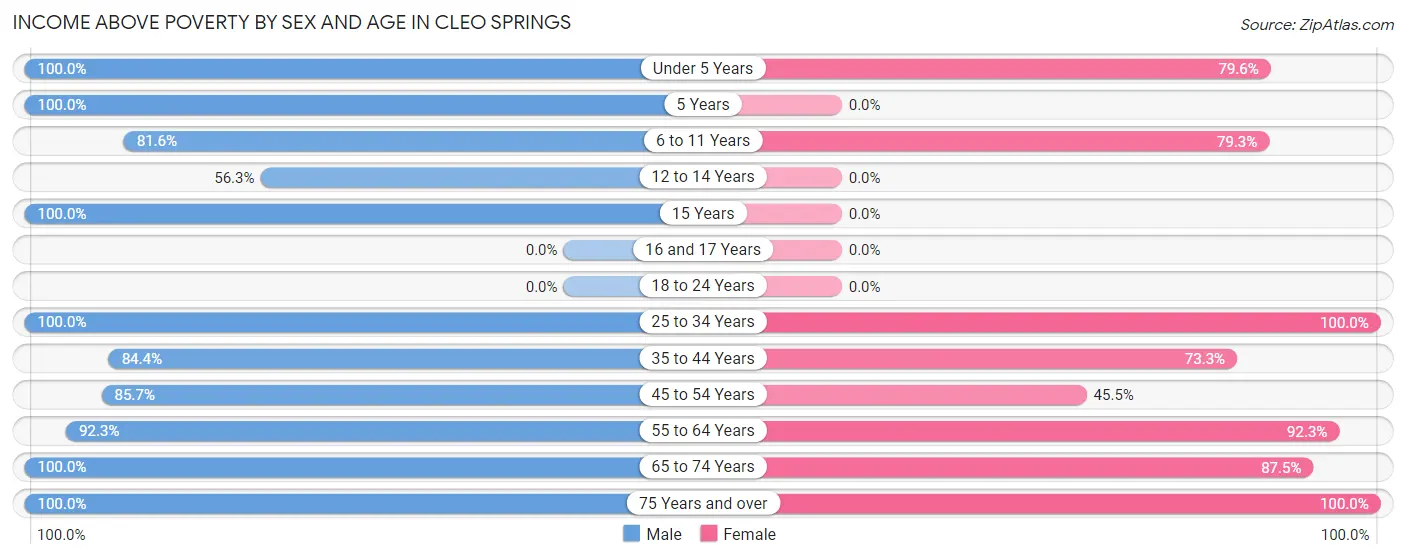
| Age Bracket | Male | Female |
| Under 5 Years | 2 (100.0%) | 39 (79.6%) |
| 5 Years | 2 (100.0%) | 0 (0.0%) |
| 6 to 11 Years | 31 (81.6%) | 23 (79.3%) |
| 12 to 14 Years | 9 (56.2%) | 0 (0.0%) |
| 15 Years | 2 (100.0%) | 0 (0.0%) |
| 16 and 17 Years | 0 (0.0%) | 0 (0.0%) |
| 18 to 24 Years | 0 (0.0%) | 0 (0.0%) |
| 25 to 34 Years | 15 (100.0%) | 9 (100.0%) |
| 35 to 44 Years | 27 (84.4%) | 11 (73.3%) |
| 45 to 54 Years | 6 (85.7%) | 5 (45.5%) |
| 55 to 64 Years | 24 (92.3%) | 12 (92.3%) |
| 65 to 74 Years | 20 (100.0%) | 14 (87.5%) |
| 75 Years and over | 4 (100.0%) | 36 (100.0%) |
| Total | 142 (84.5%) | 149 (78.8%) |
Income Below Poverty Among Married-Couple Families in Cleo Springs
The poverty statistics for married-couple families in Cleo Springs show that 11.1% or 6 of the total 54 families live below the poverty line. Families with 5 or more children have the highest poverty rate of 33.3%, comprising of 1 families. On the other hand, families with 3 or 4 children have the lowest poverty rate of 0.0%, which includes 0 families.
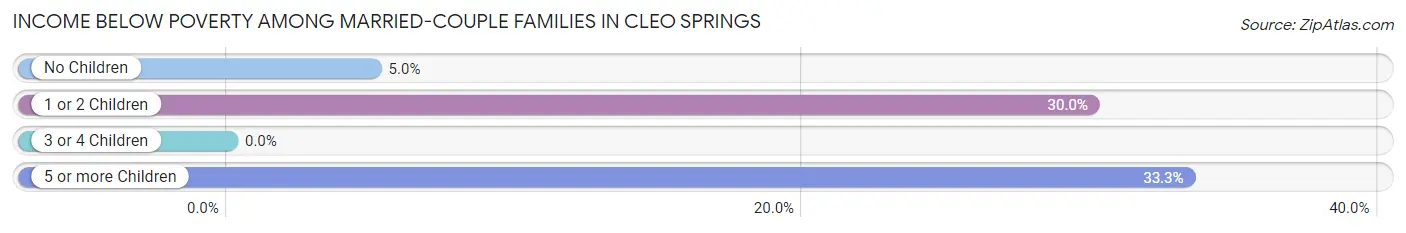
| Children | Above Poverty | Below Poverty |
| No Children | 38 (95.0%) | 2 (5.0%) |
| 1 or 2 Children | 7 (70.0%) | 3 (30.0%) |
| 3 or 4 Children | 1 (100.0%) | 0 (0.0%) |
| 5 or more Children | 2 (66.7%) | 1 (33.3%) |
| Total | 48 (88.9%) | 6 (11.1%) |
Income Below Poverty Among Single-Parent Households in Cleo Springs
According to the poverty data in Cleo Springs, 12.5% or 2 single-father households and 100.0% or 6 single-mother households are living below the poverty line. Among single-father households, those with 1 or 2 children have the highest poverty rate, with 2 households (25.0%) experiencing poverty. Likewise, among single-mother households, those with no children have the highest poverty rate, with 2 households (100.0%) falling below the poverty line.
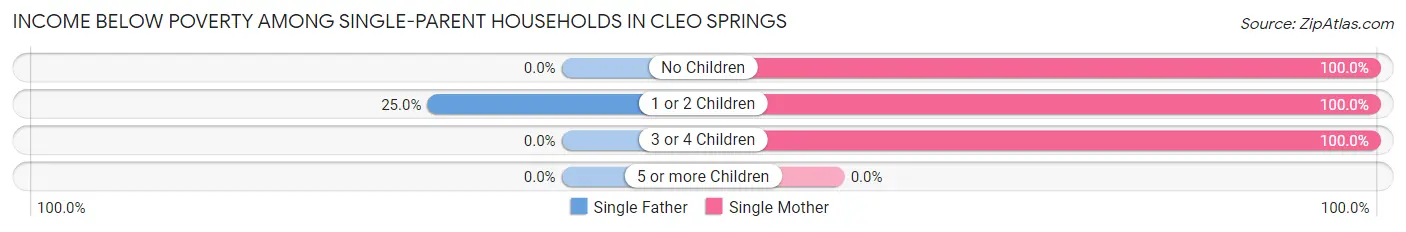
| Children | Single Father | Single Mother |
| No Children | 0 (0.0%) | 2 (100.0%) |
| 1 or 2 Children | 2 (25.0%) | 2 (100.0%) |
| 3 or 4 Children | 0 (0.0%) | 2 (100.0%) |
| 5 or more Children | 0 (0.0%) | 0 (0.0%) |
| Total | 2 (12.5%) | 6 (100.0%) |
Income Below Poverty Among Married-Couple vs Single-Parent Households in Cleo Springs
The poverty data for Cleo Springs shows that 6 of the married-couple family households (11.1%) and 8 of the single-parent households (36.4%) are living below the poverty level. Within the married-couple family households, those with 5 or more children have the highest poverty rate, with 1 households (33.3%) falling below the poverty line. Among the single-parent households, those with no children have the highest poverty rate, with 2 household (100.0%) living below poverty.
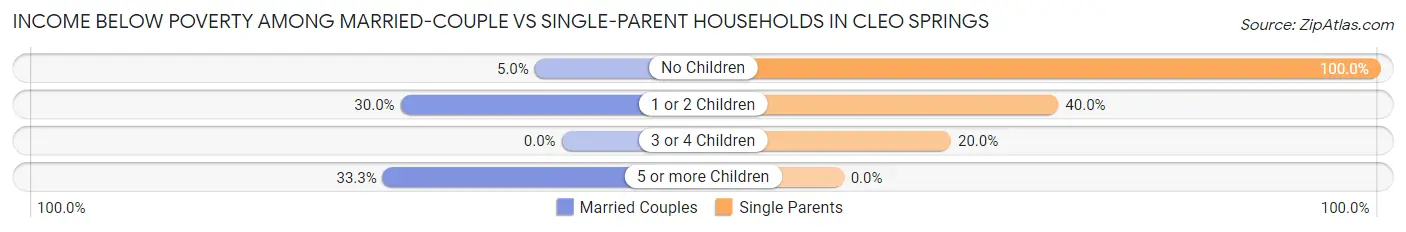
| Children | Married-Couple Families | Single-Parent Households |
| No Children | 2 (5.0%) | 2 (100.0%) |
| 1 or 2 Children | 3 (30.0%) | 4 (40.0%) |
| 3 or 4 Children | 0 (0.0%) | 2 (20.0%) |
| 5 or more Children | 1 (33.3%) | 0 (0.0%) |
| Total | 6 (11.1%) | 8 (36.4%) |
Race in Cleo Springs
The most populous races in Cleo Springs are White / Caucasian (335 | 93.1%), Two or more Races (25 | 6.9%), and Hispanic or Latino (8 | 2.2%).
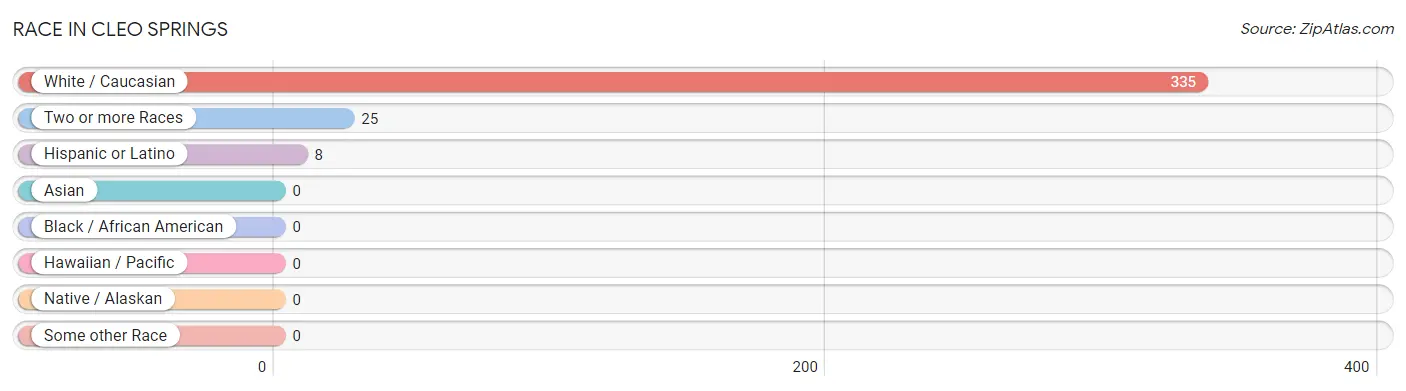
| Race | # Population | % Population |
| Asian | 0 | 0.0% |
| Black / African American | 0 | 0.0% |
| Hawaiian / Pacific | 0 | 0.0% |
| Hispanic or Latino | 8 | 2.2% |
| Native / Alaskan | 0 | 0.0% |
| White / Caucasian | 335 | 93.1% |
| Two or more Races | 25 | 6.9% |
| Some other Race | 0 | 0.0% |
| Total | 360 | 100.0% |
Ancestry in Cleo Springs
The most populous ancestries reported in Cleo Springs are German (68 | 18.9%), Irish (64 | 17.8%), English (46 | 12.8%), European (22 | 6.1%), and French (20 | 5.6%), together accounting for 61.1% of all Cleo Springs residents.
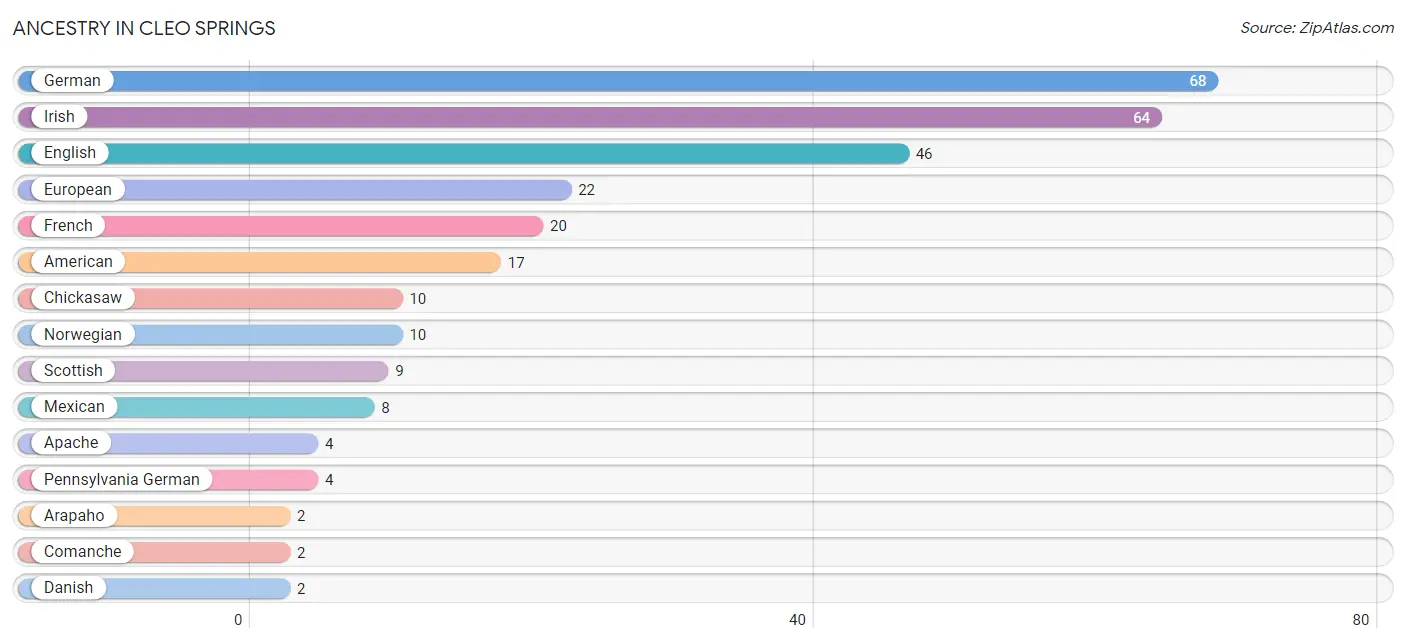
| Ancestry | # Population | % Population |
| American | 17 | 4.7% |
| Apache | 4 | 1.1% |
| Arapaho | 2 | 0.6% |
| Chickasaw | 10 | 2.8% |
| Comanche | 2 | 0.6% |
| Danish | 2 | 0.6% |
| Dutch | 1 | 0.3% |
| English | 46 | 12.8% |
| European | 22 | 6.1% |
| French | 20 | 5.6% |
| German | 68 | 18.9% |
| Irish | 64 | 17.8% |
| Mexican | 8 | 2.2% |
| Norwegian | 10 | 2.8% |
| Pennsylvania German | 4 | 1.1% |
| Polish | 2 | 0.6% |
| Scottish | 9 | 2.5% |
| Seminole | 2 | 0.6% | View All 18 Rows |
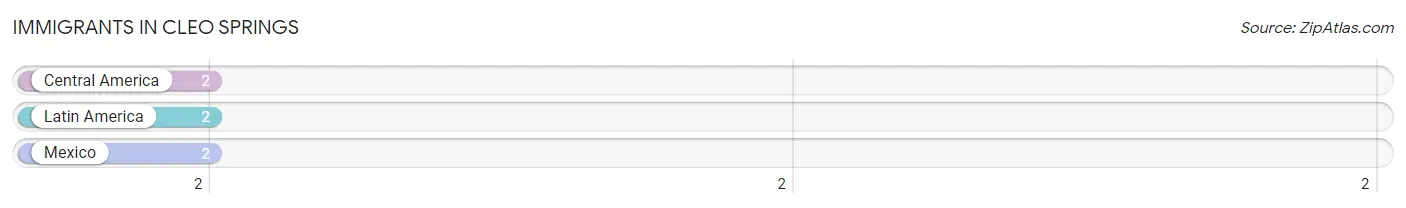
Immigrants in Cleo Springs
The most numerous immigrant groups reported in Cleo Springs came from Central America (2 | 0.6%), Latin America (2 | 0.6%), and Mexico (2 | 0.6%), together accounting for 1.7% of all Cleo Springs residents.
| Immigration Origin | # Population | % Population |
| Central America | 2 | 0.6% |
| Latin America | 2 | 0.6% |
| Mexico | 2 | 0.6% | View All 3 Rows |
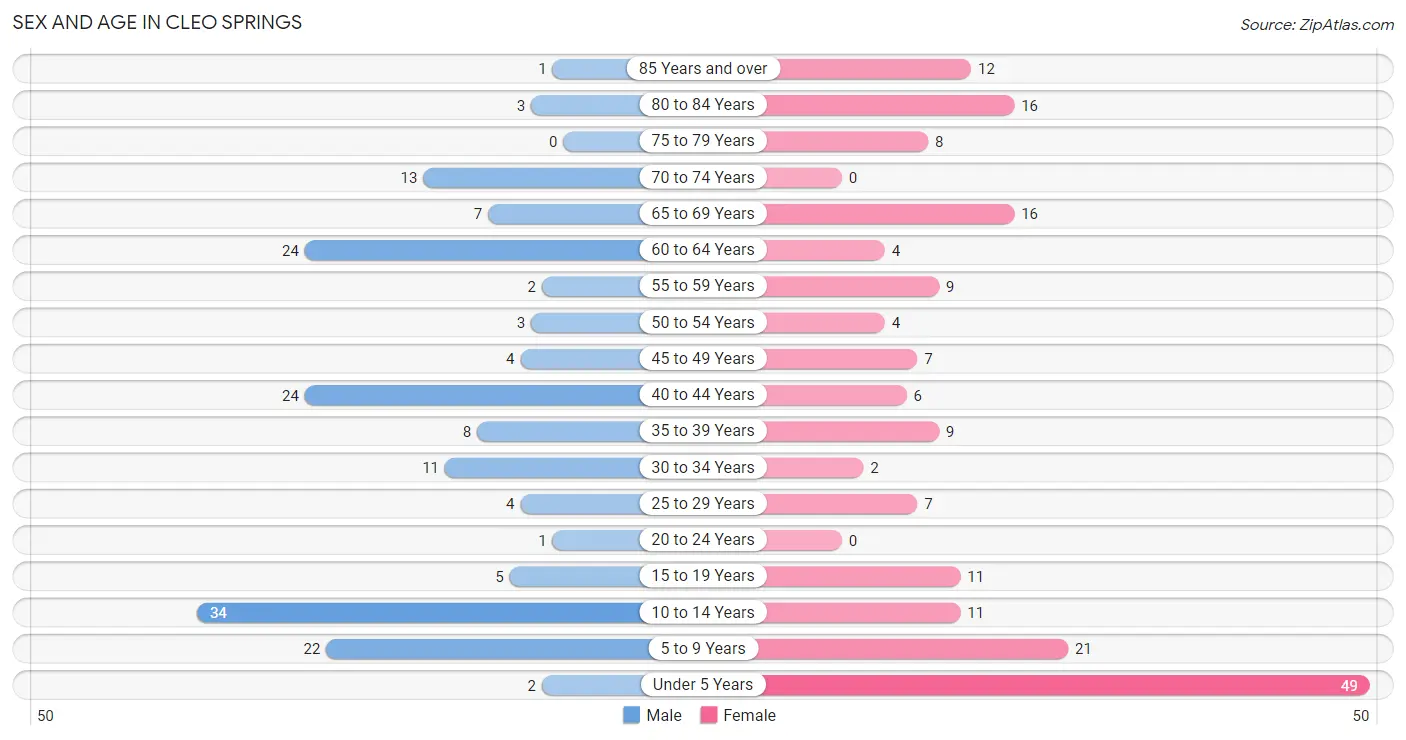
Sex and Age in Cleo Springs
Sex and Age in Cleo Springs
The most populous age groups in Cleo Springs are 10 to 14 Years (34 | 20.2%) for men and Under 5 Years (49 | 25.5%) for women.
| Age Bracket | Male | Female |
| Under 5 Years | 2 (1.2%) | 49 (25.5%) |
| 5 to 9 Years | 22 (13.1%) | 21 (10.9%) |
| 10 to 14 Years | 34 (20.2%) | 11 (5.7%) |
| 15 to 19 Years | 5 (3.0%) | 11 (5.7%) |
| 20 to 24 Years | 1 (0.6%) | 0 (0.0%) |
| 25 to 29 Years | 4 (2.4%) | 7 (3.6%) |
| 30 to 34 Years | 11 (6.6%) | 2 (1.0%) |
| 35 to 39 Years | 8 (4.8%) | 9 (4.7%) |
| 40 to 44 Years | 24 (14.3%) | 6 (3.1%) |
| 45 to 49 Years | 4 (2.4%) | 7 (3.6%) |
| 50 to 54 Years | 3 (1.8%) | 4 (2.1%) |
| 55 to 59 Years | 2 (1.2%) | 9 (4.7%) |
| 60 to 64 Years | 24 (14.3%) | 4 (2.1%) |
| 65 to 69 Years | 7 (4.2%) | 16 (8.3%) |
| 70 to 74 Years | 13 (7.7%) | 0 (0.0%) |
| 75 to 79 Years | 0 (0.0%) | 8 (4.2%) |
| 80 to 84 Years | 3 (1.8%) | 16 (8.3%) |
| 85 Years and over | 1 (0.6%) | 12 (6.2%) |
| Total | 168 (100.0%) | 192 (100.0%) |
Families and Households in Cleo Springs
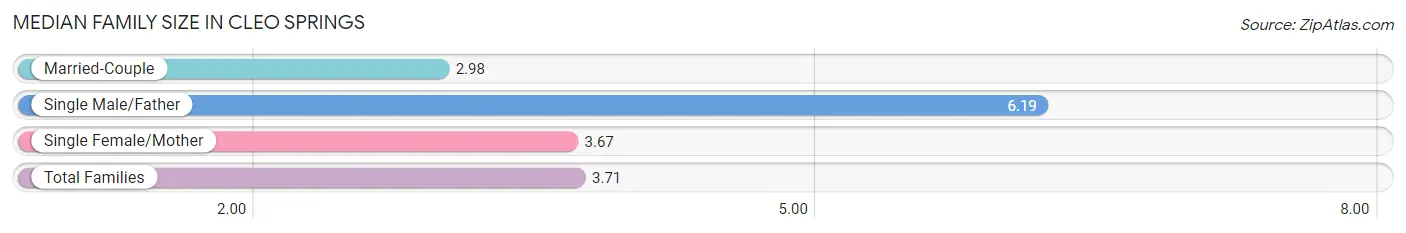
Median Family Size in Cleo Springs
The median family size in Cleo Springs is 3.71 persons per family, with single male/father families (16 | 21.0%) accounting for the largest median family size of 6.19 persons per family. On the other hand, married-couple families (54 | 71.1%) represent the smallest median family size with 2.98 persons per family.
| Family Type | # Families | Family Size |
| Married-Couple | 54 (71.1%) | 2.98 |
| Single Male/Father | 16 (21.0%) | 6.19 |
| Single Female/Mother | 6 (7.9%) | 3.67 |
| Total Families | 76 (100.0%) | 3.71 |
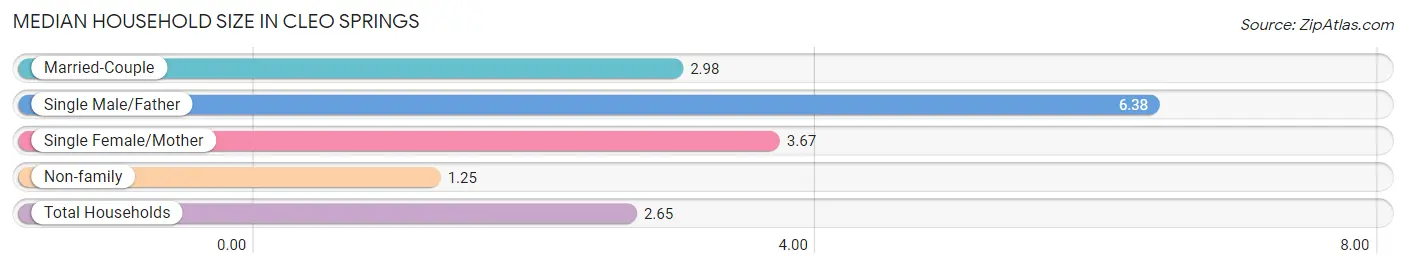
Median Household Size in Cleo Springs
The median household size in Cleo Springs is 2.65 persons per household, with single male/father households (16 | 11.8%) accounting for the largest median household size of 6.38 persons per household. non-family households (60 | 44.1%) represent the smallest median household size with 1.25 persons per household.
| Household Type | # Households | Household Size |
| Married-Couple | 54 (39.7%) | 2.98 |
| Single Male/Father | 16 (11.8%) | 6.38 |
| Single Female/Mother | 6 (4.4%) | 3.67 |
| Non-family | 60 (44.1%) | 1.25 |
| Total Households | 136 (100.0%) | 2.65 |
Household Size by Marriage Status in Cleo Springs
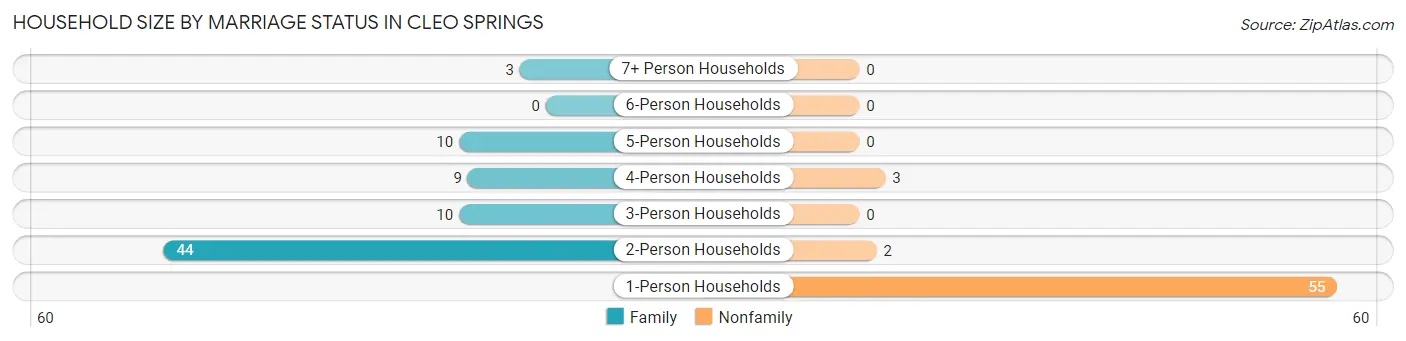
Out of a total of 136 households in Cleo Springs, 76 (55.9%) are family households, while 60 (44.1%) are nonfamily households. The most numerous type of family households are 2-person households, comprising 44, and the most common type of nonfamily households are 1-person households, comprising 55.
| Household Size | Family Households | Nonfamily Households |
| 1-Person Households | - | 55 (40.4%) |
| 2-Person Households | 44 (32.4%) | 2 (1.5%) |
| 3-Person Households | 10 (7.3%) | 0 (0.0%) |
| 4-Person Households | 9 (6.6%) | 3 (2.2%) |
| 5-Person Households | 10 (7.3%) | 0 (0.0%) |
| 6-Person Households | 0 (0.0%) | 0 (0.0%) |
| 7+ Person Households | 3 (2.2%) | 0 (0.0%) |
| Total | 76 (55.9%) | 60 (44.1%) |
Female Fertility in Cleo Springs
Fertility by Age in Cleo Springs
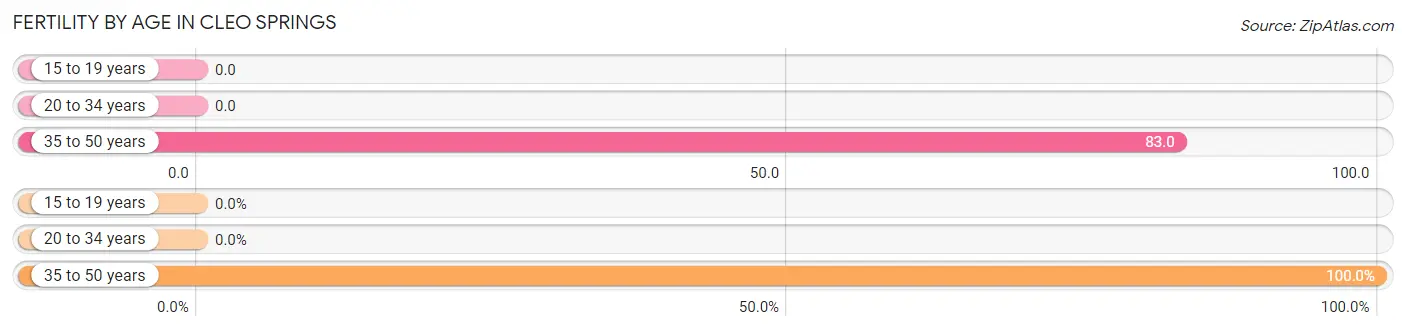
Average fertility rate in Cleo Springs is 45.0 births per 1,000 women. Women in the age bracket of 35 to 50 years have the highest fertility rate with 83.0 births per 1,000 women. Women in the age bracket of 35 to 50 years acount for 100.0% of all women with births.
| Age Bracket | Women with Births | Births / 1,000 Women |
| 15 to 19 years | 0 (0.0%) | 0.0 |
| 20 to 34 years | 0 (0.0%) | 0.0 |
| 35 to 50 years | 2 (100.0%) | 83.0 |
| Total | 2 (100.0%) | 45.0 |
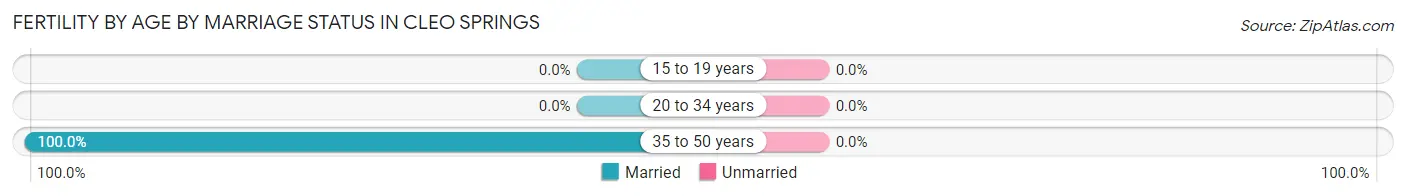
Fertility by Age by Marriage Status in Cleo Springs
| Age Bracket | Married | Unmarried |
| 15 to 19 years | 0 (0.0%) | 0 (0.0%) |
| 20 to 34 years | 0 (0.0%) | 0 (0.0%) |
| 35 to 50 years | 2 (100.0%) | 0 (0.0%) |
| Total | 2 (100.0%) | 0 (0.0%) |
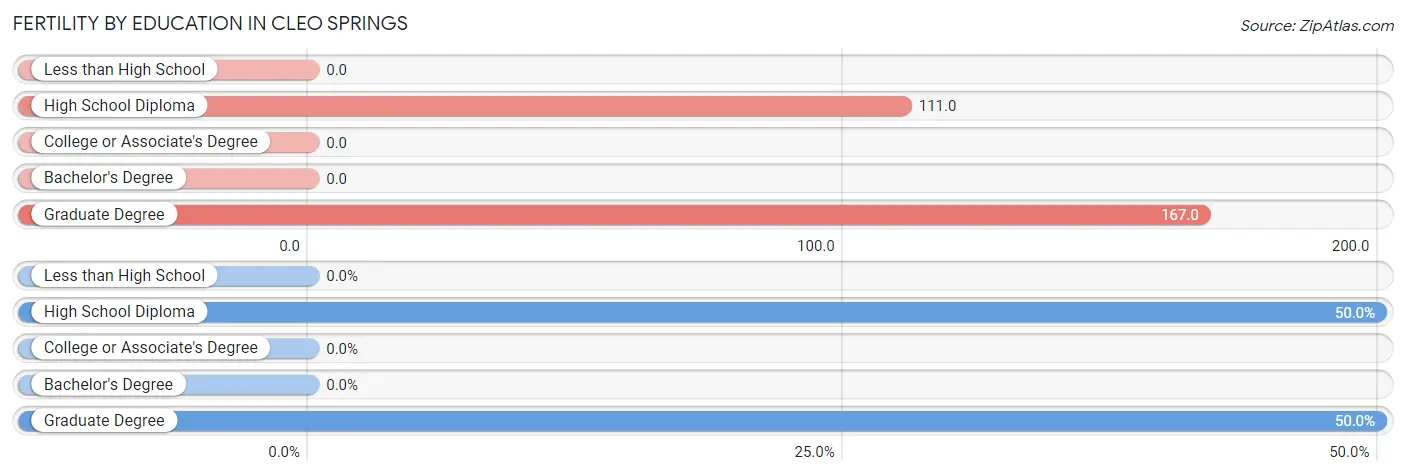
Fertility by Education in Cleo Springs
| Educational Attainment | Women with Births | Births / 1,000 Women |
| Less than High School | 0 (0.0%) | 0.0 |
| High School Diploma | 1 (50.0%) | 111.0 |
| College or Associate's Degree | 0 (0.0%) | 0.0 |
| Bachelor's Degree | 0 (0.0%) | 0.0 |
| Graduate Degree | 1 (50.0%) | 167.0 |
| Total | 2 (100.0%) | 45.0 |
Fertility by Education by Marriage Status in Cleo Springs
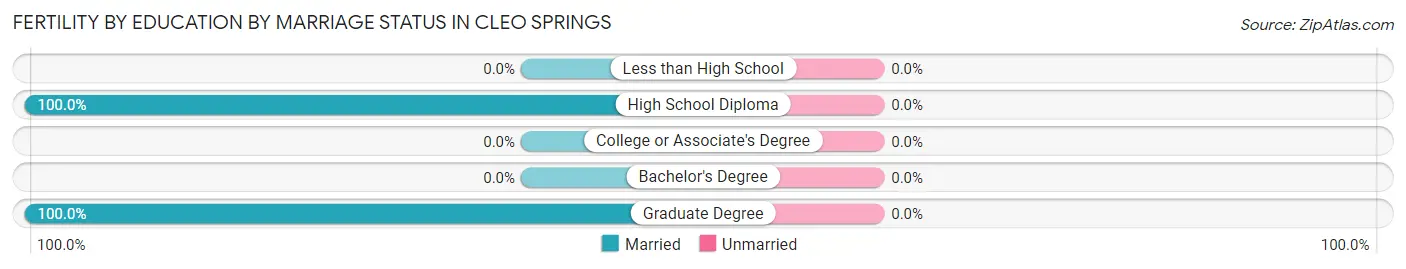
| Educational Attainment | Married | Unmarried |
| Less than High School | 0 (0.0%) | 0 (0.0%) |
| High School Diploma | 1 (100.0%) | 0 (0.0%) |
| College or Associate's Degree | 0 (0.0%) | 0 (0.0%) |
| Bachelor's Degree | 0 (0.0%) | 0 (0.0%) |
| Graduate Degree | 1 (100.0%) | 0 (0.0%) |
| Total | 2 (100.0%) | 0 (0.0%) |
Employment Characteristics in Cleo Springs
Employment by Class of Employer in Cleo Springs
Among the 117 employed individuals in Cleo Springs, private company employees (66 | 56.4%), self-employed (not incorporated) (23 | 19.7%), and local government employees (15 | 12.8%) make up the most common classes of employment.
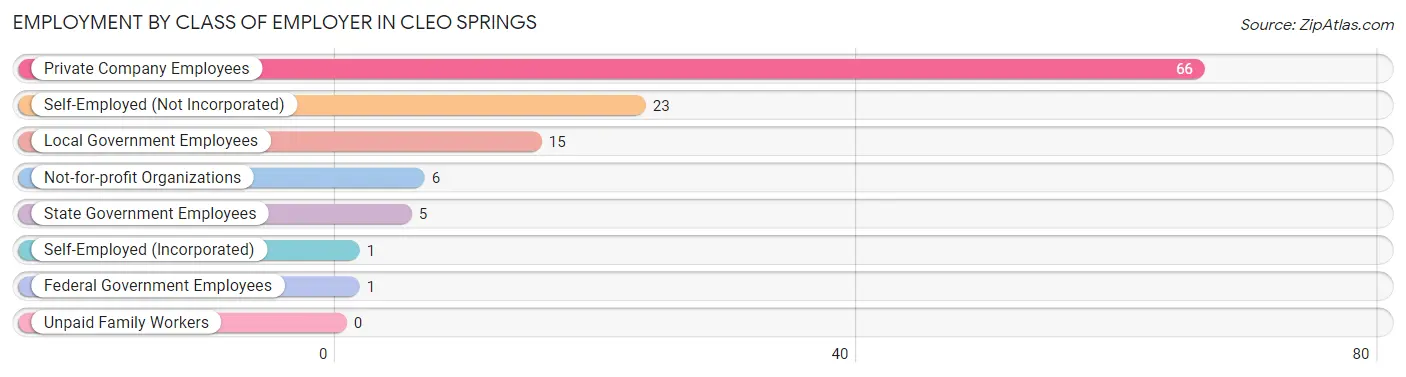
| Employer Class | # Employees | % Employees |
| Private Company Employees | 66 | 56.4% |
| Self-Employed (Incorporated) | 1 | 0.9% |
| Self-Employed (Not Incorporated) | 23 | 19.7% |
| Not-for-profit Organizations | 6 | 5.1% |
| Local Government Employees | 15 | 12.8% |
| State Government Employees | 5 | 4.3% |
| Federal Government Employees | 1 | 0.9% |
| Unpaid Family Workers | 0 | 0.0% |
| Total | 117 | 100.0% |
Employment Status by Age in Cleo Springs
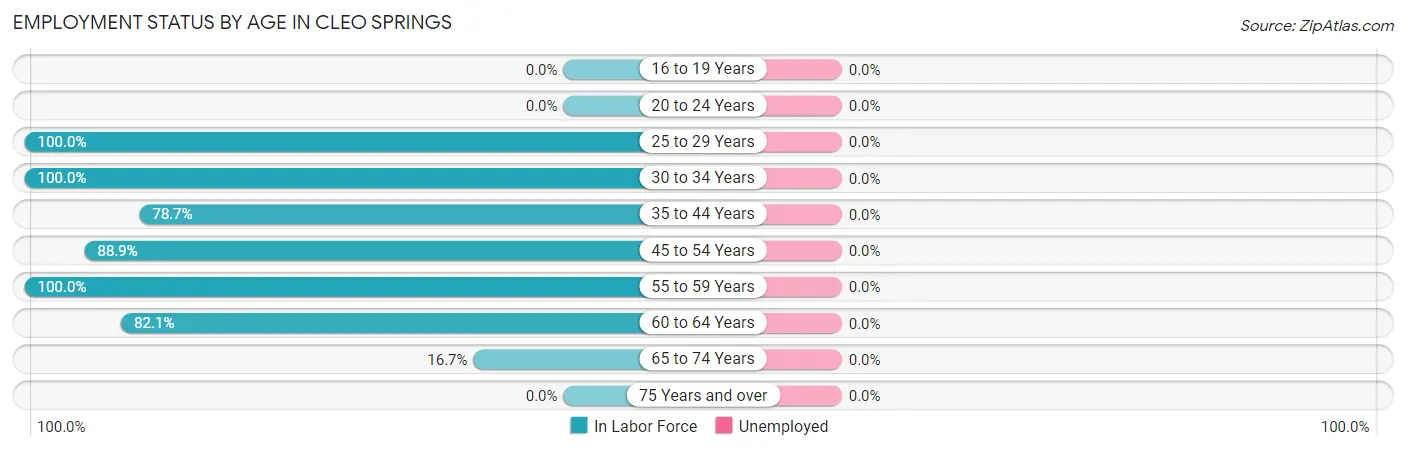
| Age Bracket | In Labor Force | Unemployed |
| 16 to 19 Years | 0 (0.0%) | 0 (0.0%) |
| 20 to 24 Years | 0 (0.0%) | 0 (0.0%) |
| 25 to 29 Years | 11 (100.0%) | 0 (0.0%) |
| 30 to 34 Years | 13 (100.0%) | 0 (0.0%) |
| 35 to 44 Years | 37 (78.7%) | 0 (0.0%) |
| 45 to 54 Years | 16 (88.9%) | 0 (0.0%) |
| 55 to 59 Years | 11 (100.0%) | 0 (0.0%) |
| 60 to 64 Years | 23 (82.1%) | 0 (0.0%) |
| 65 to 74 Years | 6 (16.7%) | 0 (0.0%) |
| 75 Years and over | 0 (0.0%) | 0 (0.0%) |
| Total | 117 (56.0%) | 0 (0.0%) |
Employment Status by Educational Attainment in Cleo Springs
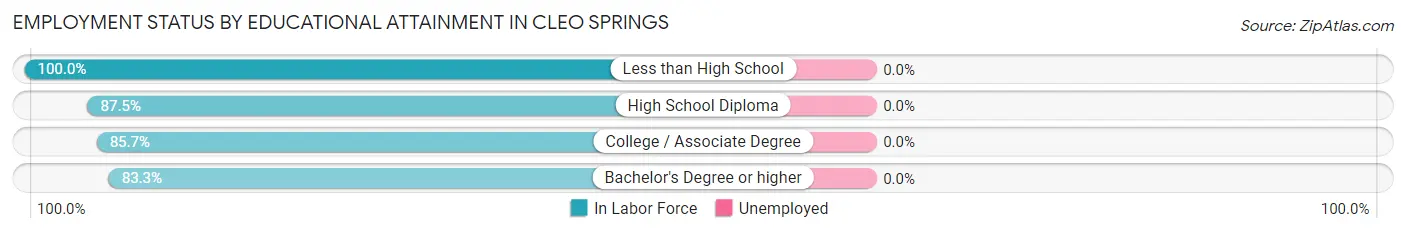
| Educational Attainment | In Labor Force | Unemployed |
| Less than High School | 4 (100.0%) | 0 (0.0%) |
| High School Diploma | 56 (87.5%) | 0 (0.0%) |
| College / Associate Degree | 36 (85.7%) | 0 (0.0%) |
| Bachelor's Degree or higher | 15 (83.3%) | 0 (0.0%) |
| Total | 111 (86.7%) | 0 (0.0%) |
Employment Occupations by Sex in Cleo Springs
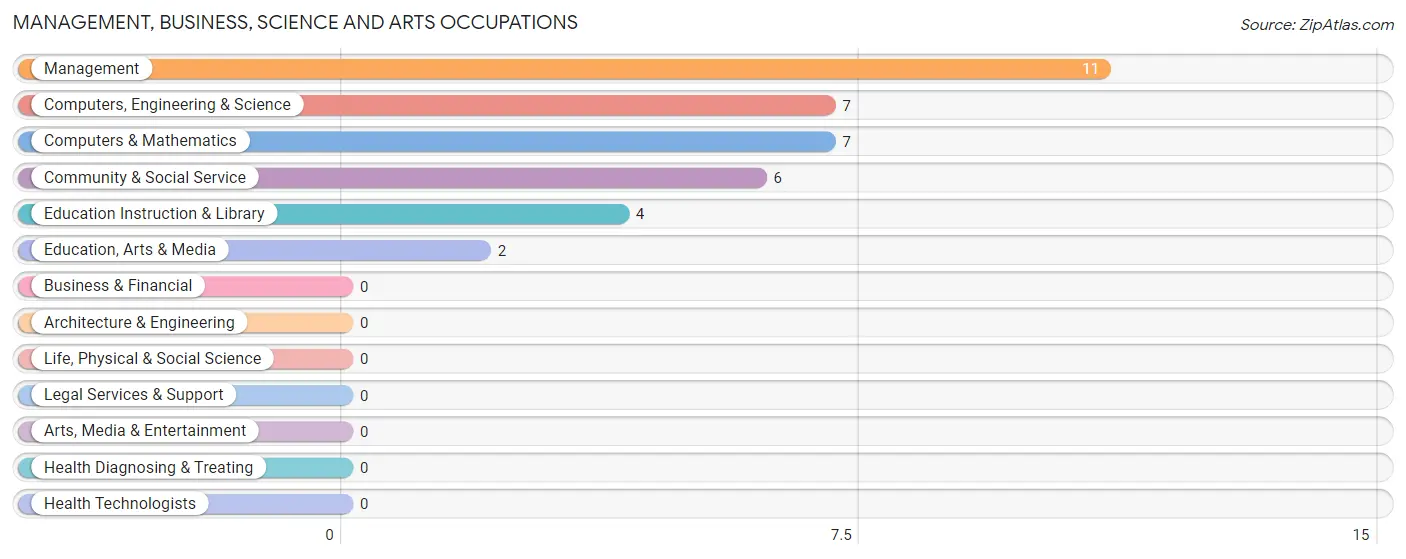
Management, Business, Science and Arts Occupations
The most common Management, Business, Science and Arts occupations in Cleo Springs are Management (11 | 9.4%), Computers, Engineering & Science (7 | 6.0%), Computers & Mathematics (7 | 6.0%), Community & Social Service (6 | 5.1%), and Education Instruction & Library (4 | 3.4%).
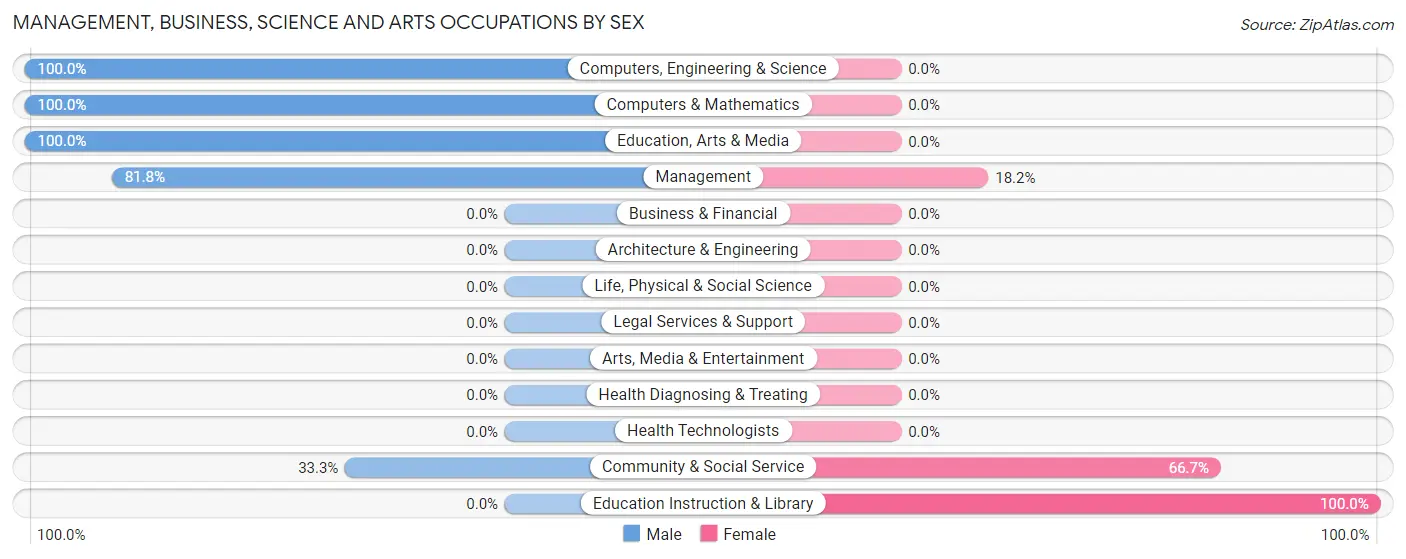
Management, Business, Science and Arts Occupations by Sex
Within the Management, Business, Science and Arts occupations in Cleo Springs, the most male-oriented occupations are Computers, Engineering & Science (100.0%), Computers & Mathematics (100.0%), and Education, Arts & Media (100.0%), while the most female-oriented occupations are Education Instruction & Library (100.0%), Community & Social Service (66.7%), and Management (18.2%).
| Occupation | Male | Female |
| Management | 9 (81.8%) | 2 (18.2%) |
| Business & Financial | 0 (0.0%) | 0 (0.0%) |
| Computers, Engineering & Science | 7 (100.0%) | 0 (0.0%) |
| Computers & Mathematics | 7 (100.0%) | 0 (0.0%) |
| Architecture & Engineering | 0 (0.0%) | 0 (0.0%) |
| Life, Physical & Social Science | 0 (0.0%) | 0 (0.0%) |
| Community & Social Service | 2 (33.3%) | 4 (66.7%) |
| Education, Arts & Media | 2 (100.0%) | 0 (0.0%) |
| Legal Services & Support | 0 (0.0%) | 0 (0.0%) |
| Education Instruction & Library | 0 (0.0%) | 4 (100.0%) |
| Arts, Media & Entertainment | 0 (0.0%) | 0 (0.0%) |
| Health Diagnosing & Treating | 0 (0.0%) | 0 (0.0%) |
| Health Technologists | 0 (0.0%) | 0 (0.0%) |
| Total (Category) | 18 (75.0%) | 6 (25.0%) |
| Total (Overall) | 71 (60.7%) | 46 (39.3%) |
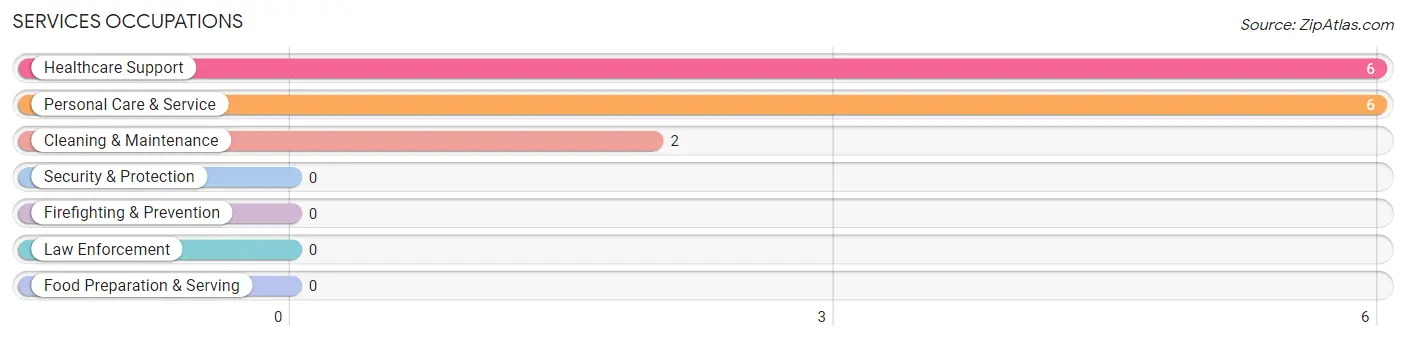
Services Occupations
The most common Services occupations in Cleo Springs are Healthcare Support (6 | 5.1%), Personal Care & Service (6 | 5.1%), and Cleaning & Maintenance (2 | 1.7%).
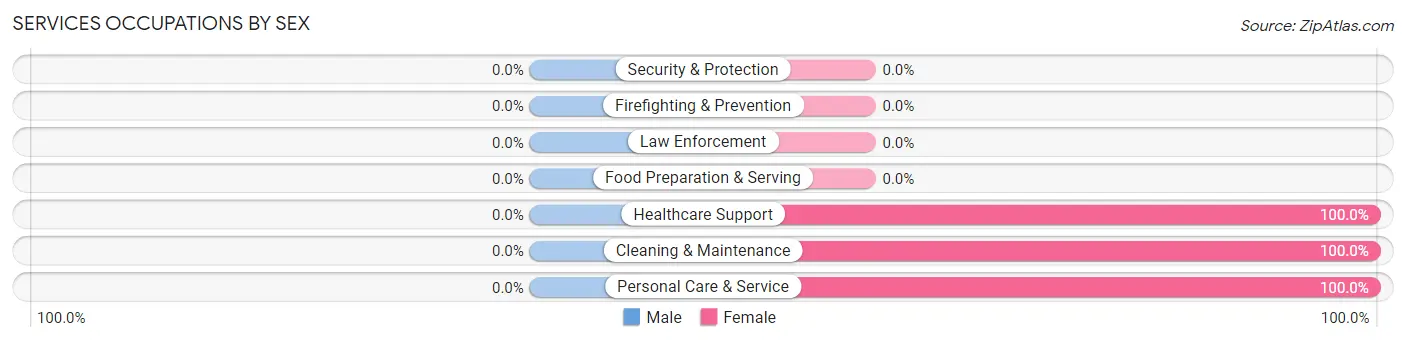
Services Occupations by Sex
| Occupation | Male | Female |
| Healthcare Support | 0 (0.0%) | 6 (100.0%) |
| Security & Protection | 0 (0.0%) | 0 (0.0%) |
| Firefighting & Prevention | 0 (0.0%) | 0 (0.0%) |
| Law Enforcement | 0 (0.0%) | 0 (0.0%) |
| Food Preparation & Serving | 0 (0.0%) | 0 (0.0%) |
| Cleaning & Maintenance | 0 (0.0%) | 2 (100.0%) |
| Personal Care & Service | 0 (0.0%) | 6 (100.0%) |
| Total (Category) | 0 (0.0%) | 14 (100.0%) |
| Total (Overall) | 71 (60.7%) | 46 (39.3%) |
Sales and Office Occupations
The most common Sales and Office occupations in Cleo Springs are Office & Administration (18 | 15.4%), and Sales & Related (5 | 4.3%).
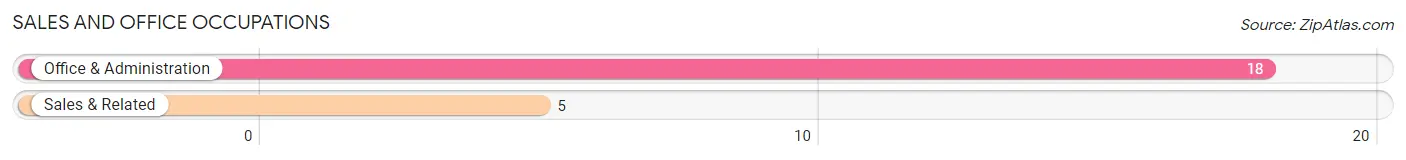
Sales and Office Occupations by Sex
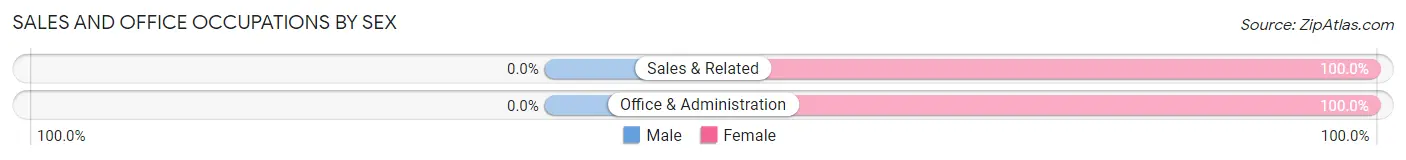
| Occupation | Male | Female |
| Sales & Related | 0 (0.0%) | 5 (100.0%) |
| Office & Administration | 0 (0.0%) | 18 (100.0%) |
| Total (Category) | 0 (0.0%) | 23 (100.0%) |
| Total (Overall) | 71 (60.7%) | 46 (39.3%) |
Natural Resources, Construction and Maintenance Occupations
The most common Natural Resources, Construction and Maintenance occupations in Cleo Springs are Construction & Extraction (25 | 21.4%), and Installation, Maintenance & Repair (12 | 10.3%).
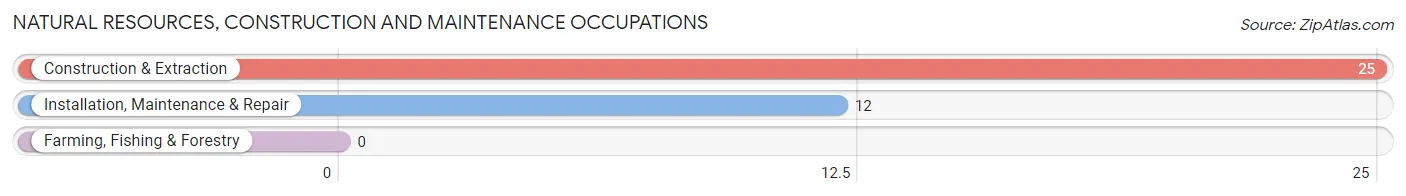
Natural Resources, Construction and Maintenance Occupations by Sex
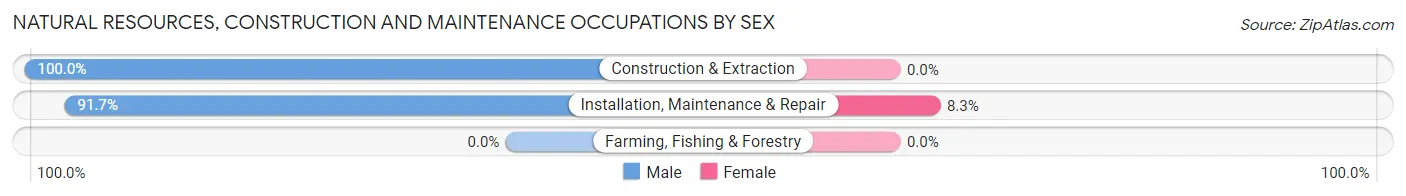
| Occupation | Male | Female |
| Farming, Fishing & Forestry | 0 (0.0%) | 0 (0.0%) |
| Construction & Extraction | 25 (100.0%) | 0 (0.0%) |
| Installation, Maintenance & Repair | 11 (91.7%) | 1 (8.3%) |
| Total (Category) | 36 (97.3%) | 1 (2.7%) |
| Total (Overall) | 71 (60.7%) | 46 (39.3%) |
Production, Transportation and Moving Occupations
The most common Production, Transportation and Moving occupations in Cleo Springs are Production (17 | 14.5%), and Transportation (2 | 1.7%).
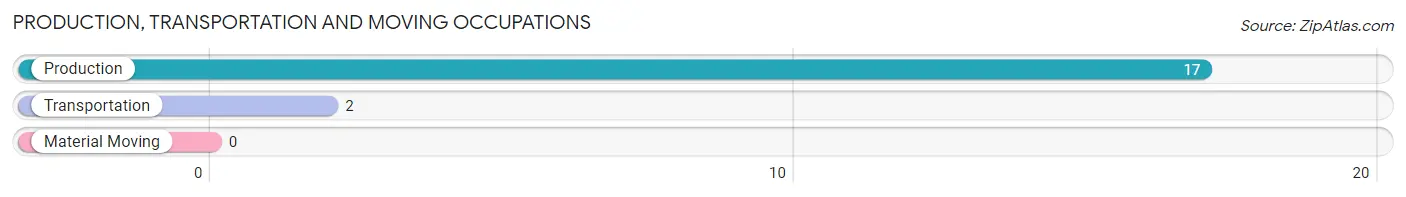
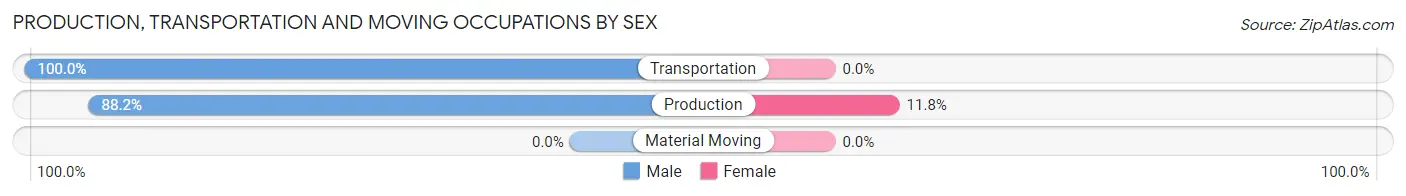
Production, Transportation and Moving Occupations by Sex
| Occupation | Male | Female |
| Production | 15 (88.2%) | 2 (11.8%) |
| Transportation | 2 (100.0%) | 0 (0.0%) |
| Material Moving | 0 (0.0%) | 0 (0.0%) |
| Total (Category) | 17 (89.5%) | 2 (10.5%) |
| Total (Overall) | 71 (60.7%) | 46 (39.3%) |
Employment Industries by Sex in Cleo Springs
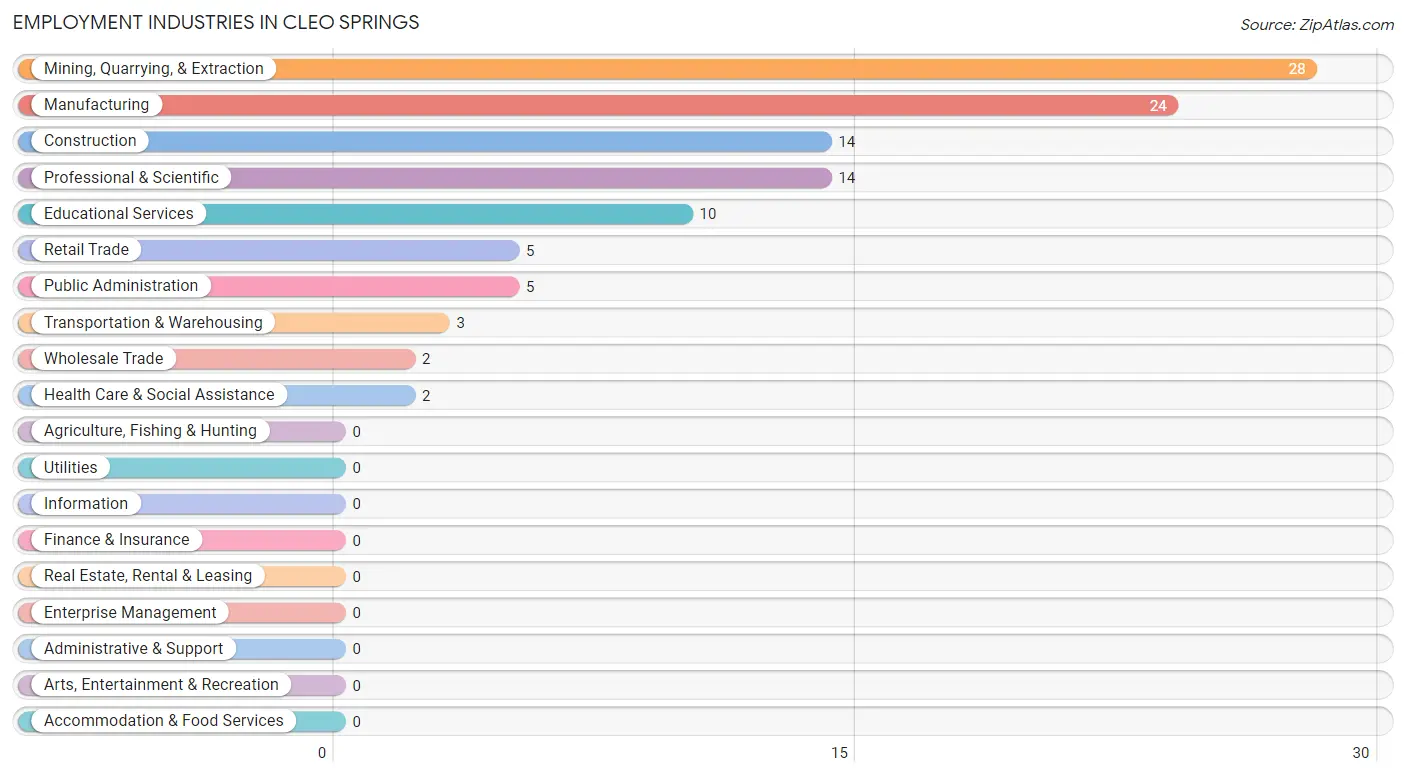
Employment Industries in Cleo Springs
The major employment industries in Cleo Springs include Mining, Quarrying, & Extraction (28 | 23.9%), Manufacturing (24 | 20.5%), Construction (14 | 12.0%), Professional & Scientific (14 | 12.0%), and Educational Services (10 | 8.6%).
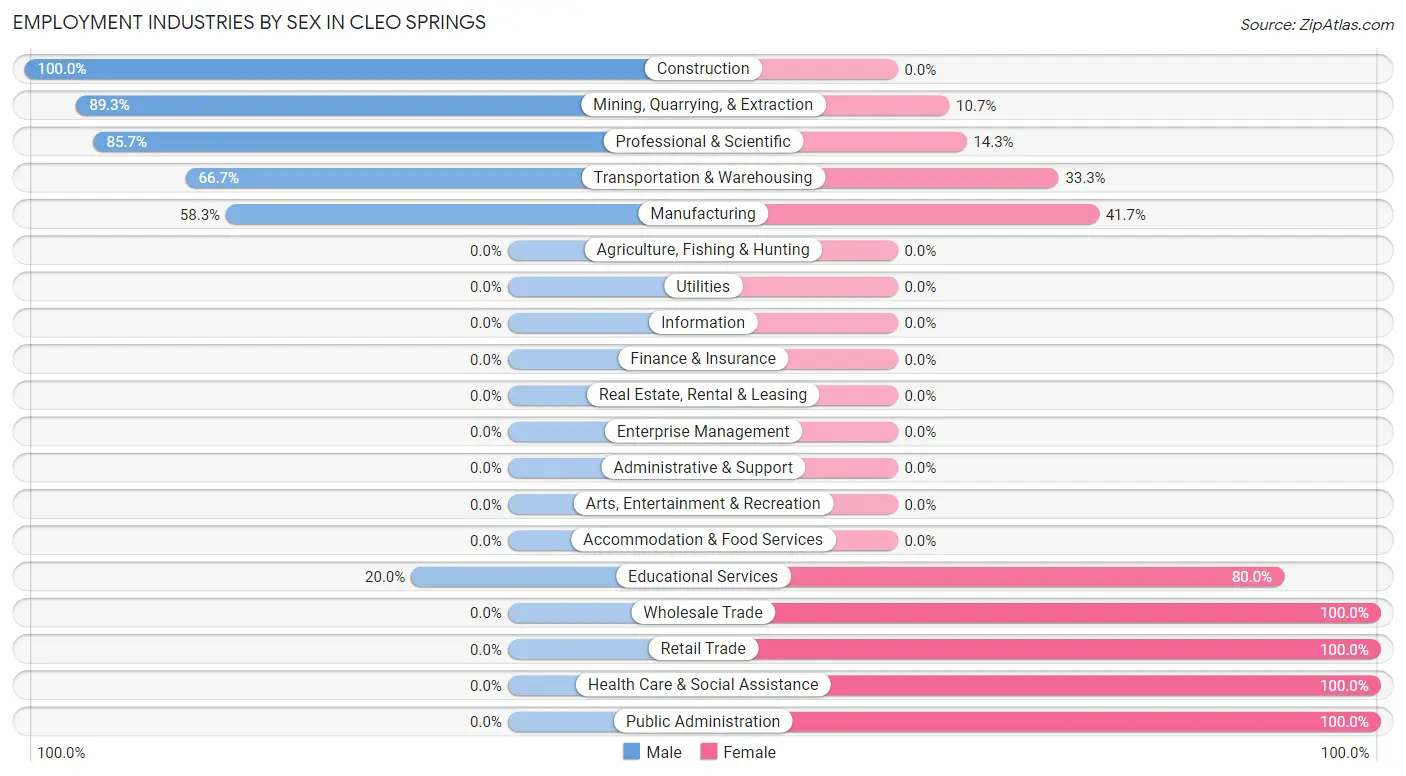
Employment Industries by Sex in Cleo Springs
The Cleo Springs industries that see more men than women are Construction (100.0%), Mining, Quarrying, & Extraction (89.3%), and Professional & Scientific (85.7%), whereas the industries that tend to have a higher number of women are Wholesale Trade (100.0%), Retail Trade (100.0%), and Health Care & Social Assistance (100.0%).
| Industry | Male | Female |
| Agriculture, Fishing & Hunting | 0 (0.0%) | 0 (0.0%) |
| Mining, Quarrying, & Extraction | 25 (89.3%) | 3 (10.7%) |
| Construction | 14 (100.0%) | 0 (0.0%) |
| Manufacturing | 14 (58.3%) | 10 (41.7%) |
| Wholesale Trade | 0 (0.0%) | 2 (100.0%) |
| Retail Trade | 0 (0.0%) | 5 (100.0%) |
| Transportation & Warehousing | 2 (66.7%) | 1 (33.3%) |
| Utilities | 0 (0.0%) | 0 (0.0%) |
| Information | 0 (0.0%) | 0 (0.0%) |
| Finance & Insurance | 0 (0.0%) | 0 (0.0%) |
| Real Estate, Rental & Leasing | 0 (0.0%) | 0 (0.0%) |
| Professional & Scientific | 12 (85.7%) | 2 (14.3%) |
| Enterprise Management | 0 (0.0%) | 0 (0.0%) |
| Administrative & Support | 0 (0.0%) | 0 (0.0%) |
| Educational Services | 2 (20.0%) | 8 (80.0%) |
| Health Care & Social Assistance | 0 (0.0%) | 2 (100.0%) |
| Arts, Entertainment & Recreation | 0 (0.0%) | 0 (0.0%) |
| Accommodation & Food Services | 0 (0.0%) | 0 (0.0%) |
| Public Administration | 0 (0.0%) | 5 (100.0%) |
| Total | 71 (60.7%) | 46 (39.3%) |
Education in Cleo Springs
School Enrollment in Cleo Springs
The most common levels of schooling among the 147 students in Cleo Springs are elementary school (44 | 29.9%), nursery / preschool (43 | 29.2%), and middle school (30 | 20.4%).
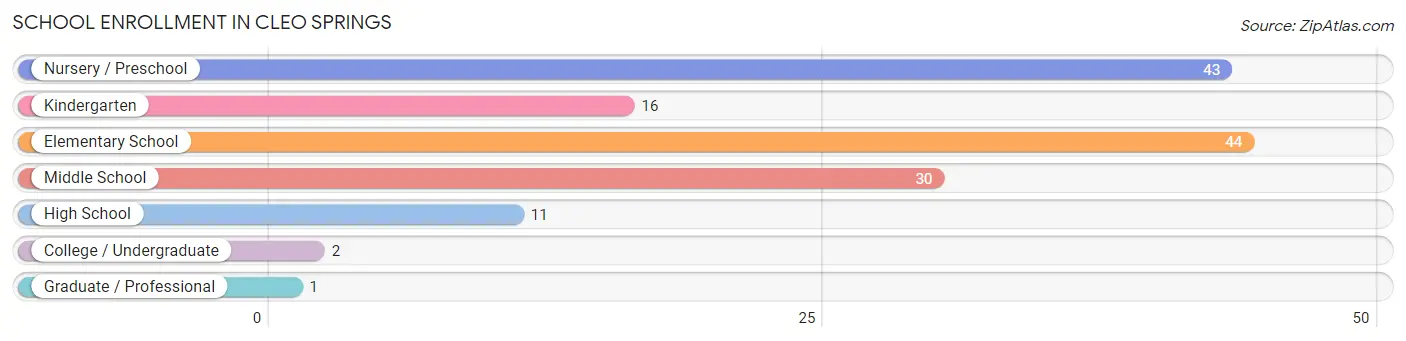
| School Level | # Students | % Students |
| Nursery / Preschool | 43 | 29.2% |
| Kindergarten | 16 | 10.9% |
| Elementary School | 44 | 29.9% |
| Middle School | 30 | 20.4% |
| High School | 11 | 7.5% |
| College / Undergraduate | 2 | 1.4% |
| Graduate / Professional | 1 | 0.7% |
| Total | 147 | 100.0% |
School Enrollment by Age by Funding Source in Cleo Springs
Out of a total of 147 students who are enrolled in schools in Cleo Springs, 9 (6.1%) attend a private institution, while the remaining 138 (93.9%) are enrolled in public schools. The age group of 5 to 9 year old has the highest likelihood of being enrolled in private schools, with 6 (14.0% in the age bracket) enrolled. Conversely, the age group of 3 to 4 year olds has the lowest likelihood of being enrolled in a private school, with 41 (100.0% in the age bracket) attending a public institution.
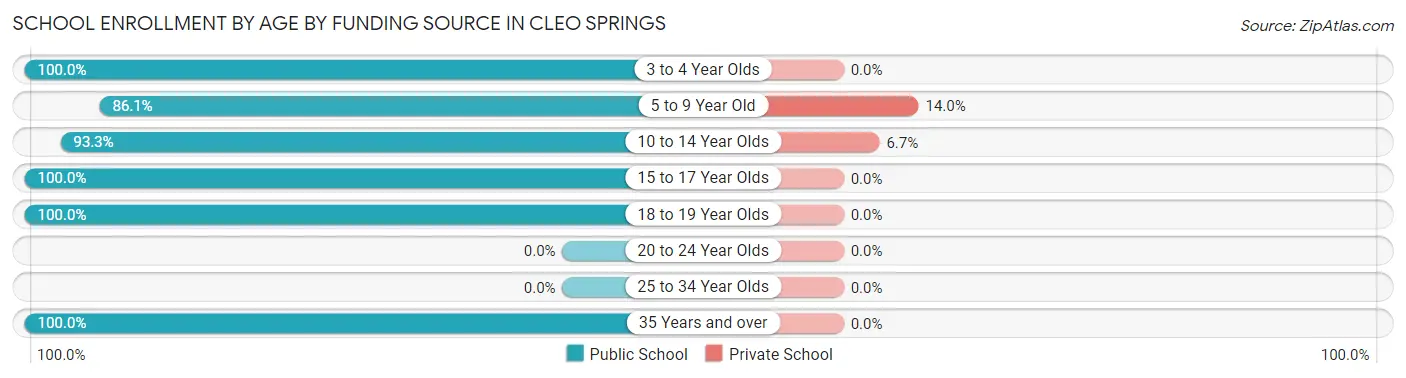
| Age Bracket | Public School | Private School |
| 3 to 4 Year Olds | 41 (100.0%) | 0 (0.0%) |
| 5 to 9 Year Old | 37 (86.1%) | 6 (14.0%) |
| 10 to 14 Year Olds | 42 (93.3%) | 3 (6.7%) |
| 15 to 17 Year Olds | 12 (100.0%) | 0 (0.0%) |
| 18 to 19 Year Olds | 3 (100.0%) | 0 (0.0%) |
| 20 to 24 Year Olds | 0 (0.0%) | 0 (0.0%) |
| 25 to 34 Year Olds | 0 (0.0%) | 0 (0.0%) |
| 35 Years and over | 3 (100.0%) | 0 (0.0%) |
| Total | 138 (93.9%) | 9 (6.1%) |
Educational Attainment by Field of Study in Cleo Springs
Communications (11 | 24.4%), arts & humanities (9 | 20.0%), business (8 | 17.8%), bio, nature & agricultural (3 | 6.7%), and education (3 | 6.7%) are the most common fields of study among 45 individuals in Cleo Springs who have obtained a bachelor's degree or higher.
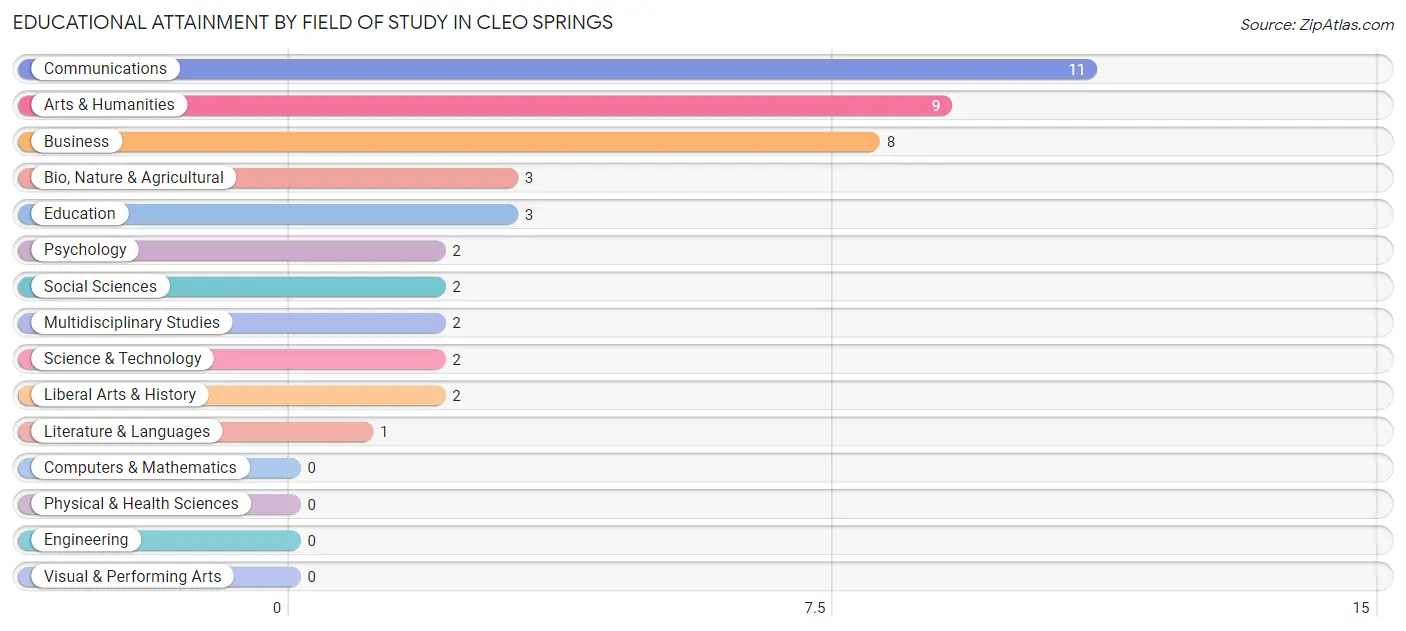
| Field of Study | # Graduates | % Graduates |
| Computers & Mathematics | 0 | 0.0% |
| Bio, Nature & Agricultural | 3 | 6.7% |
| Physical & Health Sciences | 0 | 0.0% |
| Psychology | 2 | 4.4% |
| Social Sciences | 2 | 4.4% |
| Engineering | 0 | 0.0% |
| Multidisciplinary Studies | 2 | 4.4% |
| Science & Technology | 2 | 4.4% |
| Business | 8 | 17.8% |
| Education | 3 | 6.7% |
| Literature & Languages | 1 | 2.2% |
| Liberal Arts & History | 2 | 4.4% |
| Visual & Performing Arts | 0 | 0.0% |
| Communications | 11 | 24.4% |
| Arts & Humanities | 9 | 20.0% |
| Total | 45 | 100.0% |
Transportation & Commute in Cleo Springs
Vehicle Availability by Sex in Cleo Springs
The most prevalent vehicle ownership categories in Cleo Springs are males with 2 vehicles (40, accounting for 56.3%) and females with 2 vehicles (15, making up 87.0%).
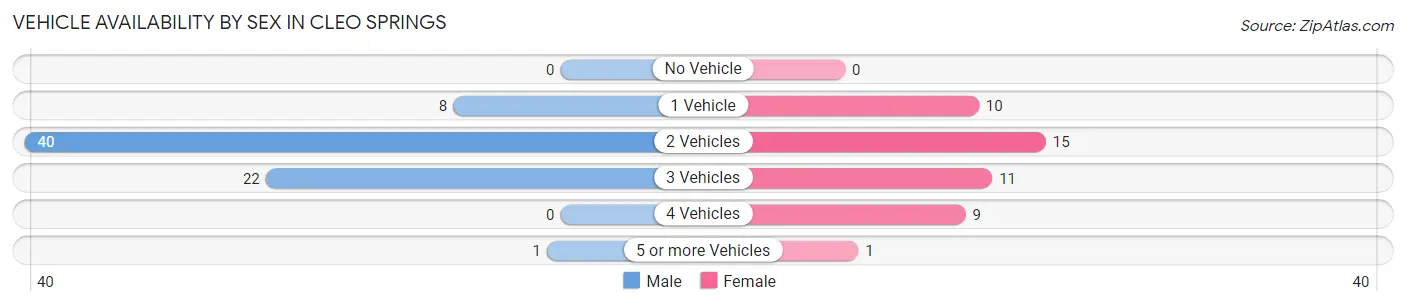
| Vehicles Available | Male | Female |
| No Vehicle | 0 (0.0%) | 0 (0.0%) |
| 1 Vehicle | 8 (11.3%) | 10 (21.7%) |
| 2 Vehicles | 40 (56.3%) | 15 (32.6%) |
| 3 Vehicles | 22 (31.0%) | 11 (23.9%) |
| 4 Vehicles | 0 (0.0%) | 9 (19.6%) |
| 5 or more Vehicles | 1 (1.4%) | 1 (2.2%) |
| Total | 71 (100.0%) | 46 (100.0%) |
Commute Time in Cleo Springs
The most frequently occuring commute durations in Cleo Springs are 10 to 14 minutes (27 commuters, 23.1%), 30 to 34 minutes (20 commuters, 17.1%), and less than 5 minutes (16 commuters, 13.7%).
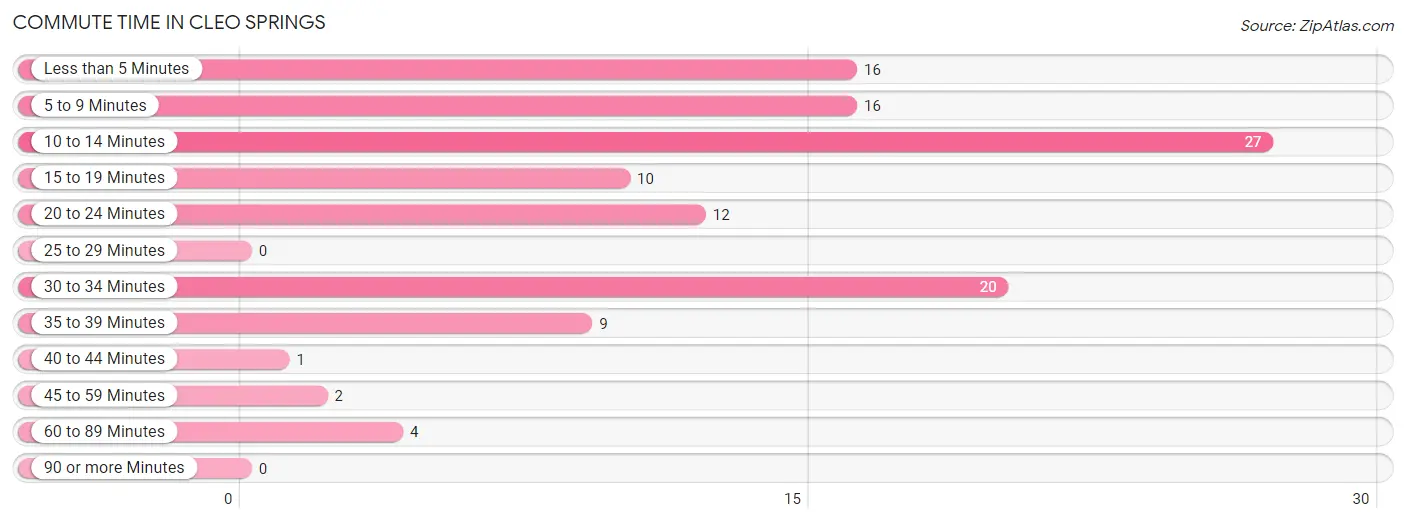
| Commute Time | # Commuters | % Commuters |
| Less than 5 Minutes | 16 | 13.7% |
| 5 to 9 Minutes | 16 | 13.7% |
| 10 to 14 Minutes | 27 | 23.1% |
| 15 to 19 Minutes | 10 | 8.6% |
| 20 to 24 Minutes | 12 | 10.3% |
| 25 to 29 Minutes | 0 | 0.0% |
| 30 to 34 Minutes | 20 | 17.1% |
| 35 to 39 Minutes | 9 | 7.7% |
| 40 to 44 Minutes | 1 | 0.9% |
| 45 to 59 Minutes | 2 | 1.7% |
| 60 to 89 Minutes | 4 | 3.4% |
| 90 or more Minutes | 0 | 0.0% |
Commute Time by Sex in Cleo Springs
The most common commute times in Cleo Springs are 10 to 14 minutes (22 commuters, 31.0%) for males and less than 5 minutes (14 commuters, 30.4%) for females.
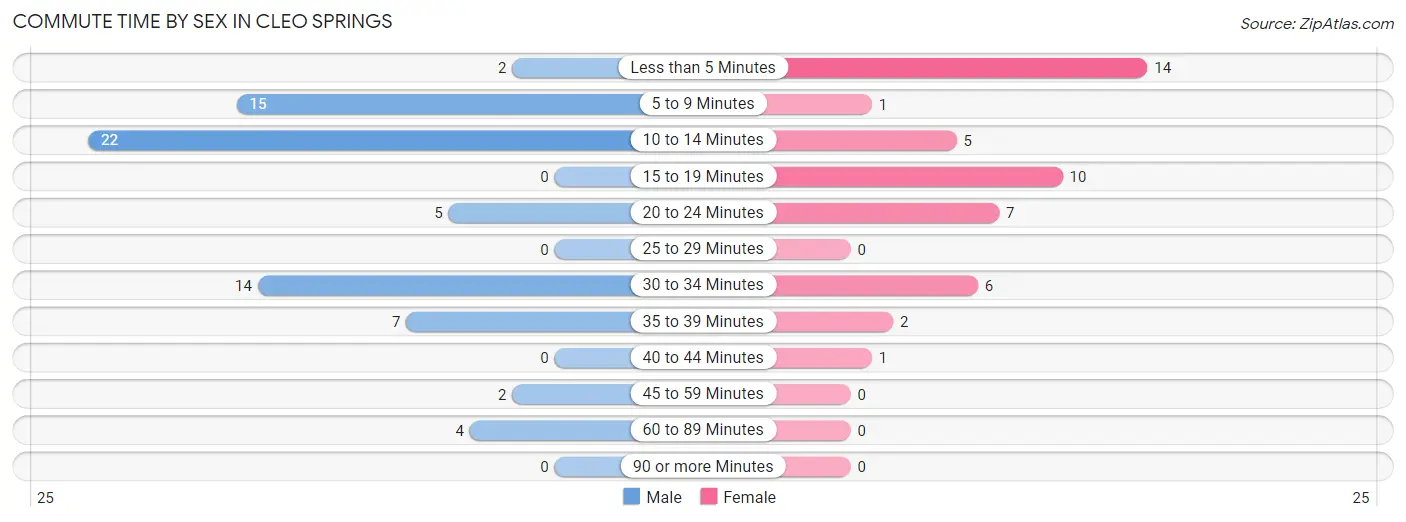
| Commute Time | Male | Female |
| Less than 5 Minutes | 2 (2.8%) | 14 (30.4%) |
| 5 to 9 Minutes | 15 (21.1%) | 1 (2.2%) |
| 10 to 14 Minutes | 22 (31.0%) | 5 (10.9%) |
| 15 to 19 Minutes | 0 (0.0%) | 10 (21.7%) |
| 20 to 24 Minutes | 5 (7.0%) | 7 (15.2%) |
| 25 to 29 Minutes | 0 (0.0%) | 0 (0.0%) |
| 30 to 34 Minutes | 14 (19.7%) | 6 (13.0%) |
| 35 to 39 Minutes | 7 (9.9%) | 2 (4.3%) |
| 40 to 44 Minutes | 0 (0.0%) | 1 (2.2%) |
| 45 to 59 Minutes | 2 (2.8%) | 0 (0.0%) |
| 60 to 89 Minutes | 4 (5.6%) | 0 (0.0%) |
| 90 or more Minutes | 0 (0.0%) | 0 (0.0%) |
Time of Departure to Work by Sex in Cleo Springs
The most frequent times of departure to work in Cleo Springs are 6:30 AM to 6:59 AM (22, 31.0%) for males and 7:30 AM to 7:59 AM (10, 21.7%) for females.
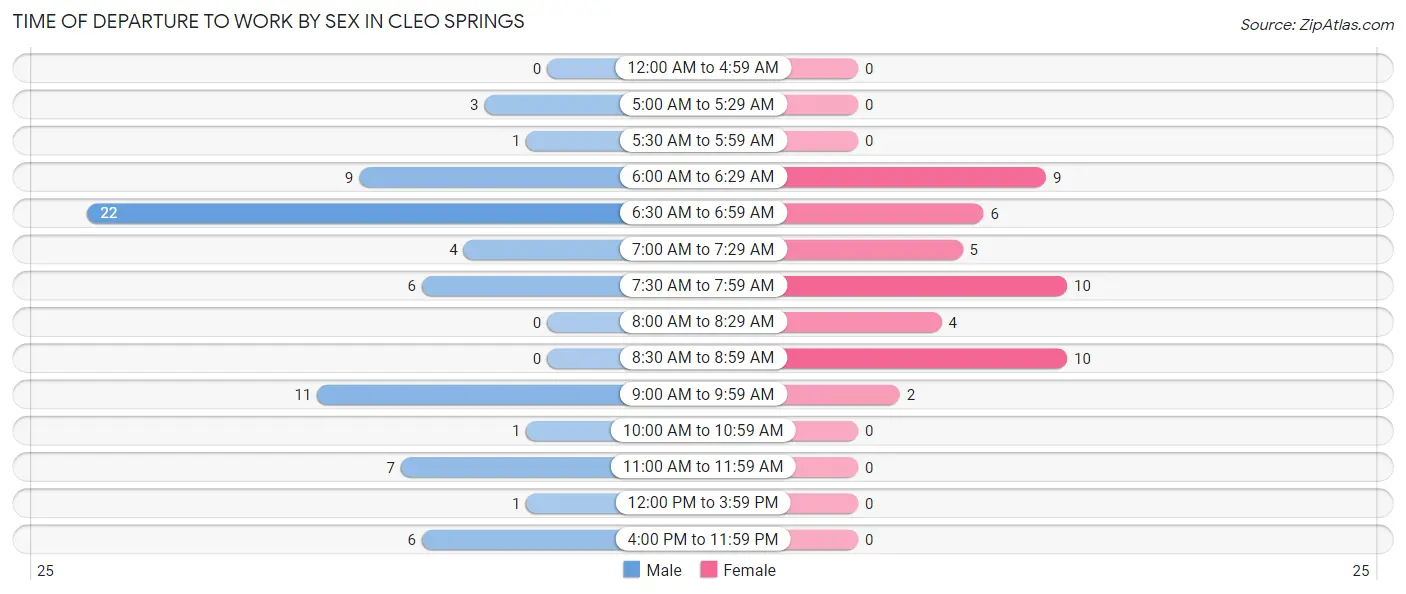
| Time of Departure | Male | Female |
| 12:00 AM to 4:59 AM | 0 (0.0%) | 0 (0.0%) |
| 5:00 AM to 5:29 AM | 3 (4.2%) | 0 (0.0%) |
| 5:30 AM to 5:59 AM | 1 (1.4%) | 0 (0.0%) |
| 6:00 AM to 6:29 AM | 9 (12.7%) | 9 (19.6%) |
| 6:30 AM to 6:59 AM | 22 (31.0%) | 6 (13.0%) |
| 7:00 AM to 7:29 AM | 4 (5.6%) | 5 (10.9%) |
| 7:30 AM to 7:59 AM | 6 (8.5%) | 10 (21.7%) |
| 8:00 AM to 8:29 AM | 0 (0.0%) | 4 (8.7%) |
| 8:30 AM to 8:59 AM | 0 (0.0%) | 10 (21.7%) |
| 9:00 AM to 9:59 AM | 11 (15.5%) | 2 (4.3%) |
| 10:00 AM to 10:59 AM | 1 (1.4%) | 0 (0.0%) |
| 11:00 AM to 11:59 AM | 7 (9.9%) | 0 (0.0%) |
| 12:00 PM to 3:59 PM | 1 (1.4%) | 0 (0.0%) |
| 4:00 PM to 11:59 PM | 6 (8.5%) | 0 (0.0%) |
| Total | 71 (100.0%) | 46 (100.0%) |
Housing Occupancy in Cleo Springs
Occupancy by Ownership in Cleo Springs
Of the total 136 dwellings in Cleo Springs, owner-occupied units account for 122 (89.7%), while renter-occupied units make up 14 (10.3%).
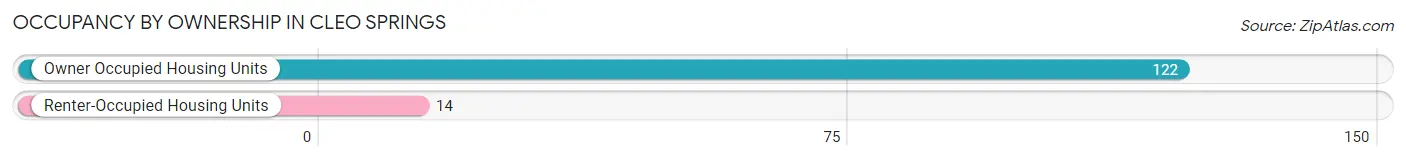
| Occupancy | # Housing Units | % Housing Units |
| Owner Occupied Housing Units | 122 | 89.7% |
| Renter-Occupied Housing Units | 14 | 10.3% |
| Total Occupied Housing Units | 136 | 100.0% |
Occupancy by Household Size in Cleo Springs
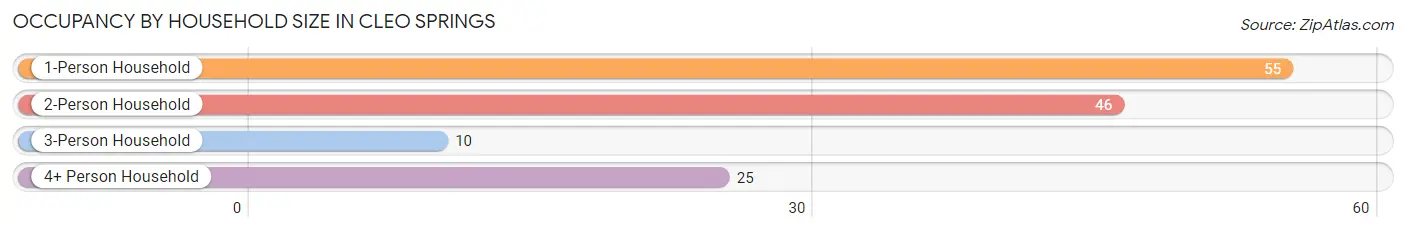
| Household Size | # Housing Units | % Housing Units |
| 1-Person Household | 55 | 40.4% |
| 2-Person Household | 46 | 33.8% |
| 3-Person Household | 10 | 7.3% |
| 4+ Person Household | 25 | 18.4% |
| Total Housing Units | 136 | 100.0% |
Occupancy by Ownership by Household Size in Cleo Springs
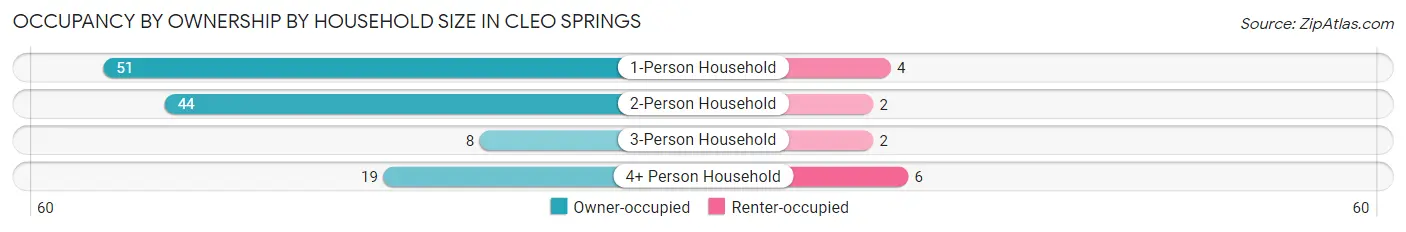
| Household Size | Owner-occupied | Renter-occupied |
| 1-Person Household | 51 (92.7%) | 4 (7.3%) |
| 2-Person Household | 44 (95.7%) | 2 (4.3%) |
| 3-Person Household | 8 (80.0%) | 2 (20.0%) |
| 4+ Person Household | 19 (76.0%) | 6 (24.0%) |
| Total Housing Units | 122 (89.7%) | 14 (10.3%) |
Occupancy by Educational Attainment in Cleo Springs
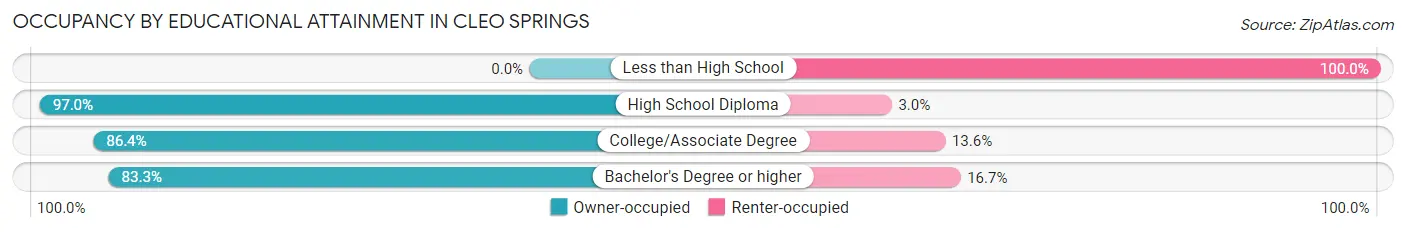
| Household Size | Owner-occupied | Renter-occupied |
| Less than High School | 0 (0.0%) | 2 (100.0%) |
| High School Diploma | 64 (97.0%) | 2 (3.0%) |
| College/Associate Degree | 38 (86.4%) | 6 (13.6%) |
| Bachelor's Degree or higher | 20 (83.3%) | 4 (16.7%) |
Occupancy by Age of Householder in Cleo Springs
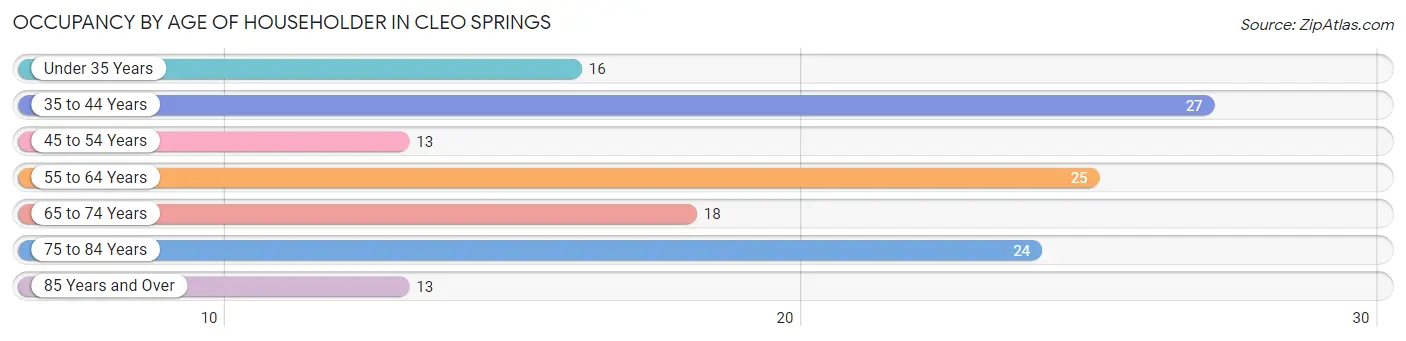
| Age Bracket | # Households | % Households |
| Under 35 Years | 16 | 11.8% |
| 35 to 44 Years | 27 | 19.9% |
| 45 to 54 Years | 13 | 9.6% |
| 55 to 64 Years | 25 | 18.4% |
| 65 to 74 Years | 18 | 13.2% |
| 75 to 84 Years | 24 | 17.6% |
| 85 Years and Over | 13 | 9.6% |
| Total | 136 | 100.0% |
Housing Finances in Cleo Springs
Median Income by Occupancy in Cleo Springs
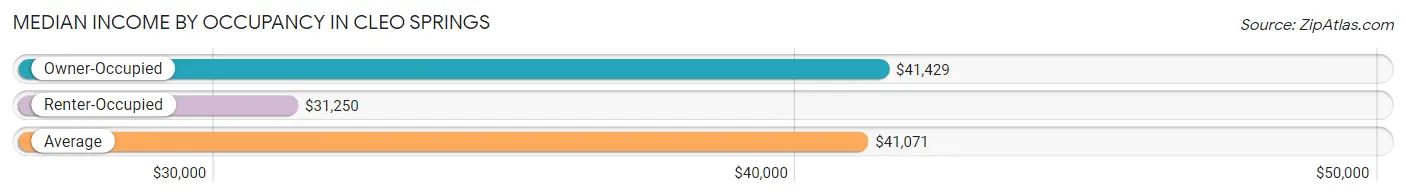
| Occupancy Type | # Households | Median Income |
| Owner-Occupied | 122 (89.7%) | $41,429 |
| Renter-Occupied | 14 (10.3%) | $31,250 |
| Average | 136 (100.0%) | $41,071 |
Occupancy by Householder Income Bracket in Cleo Springs
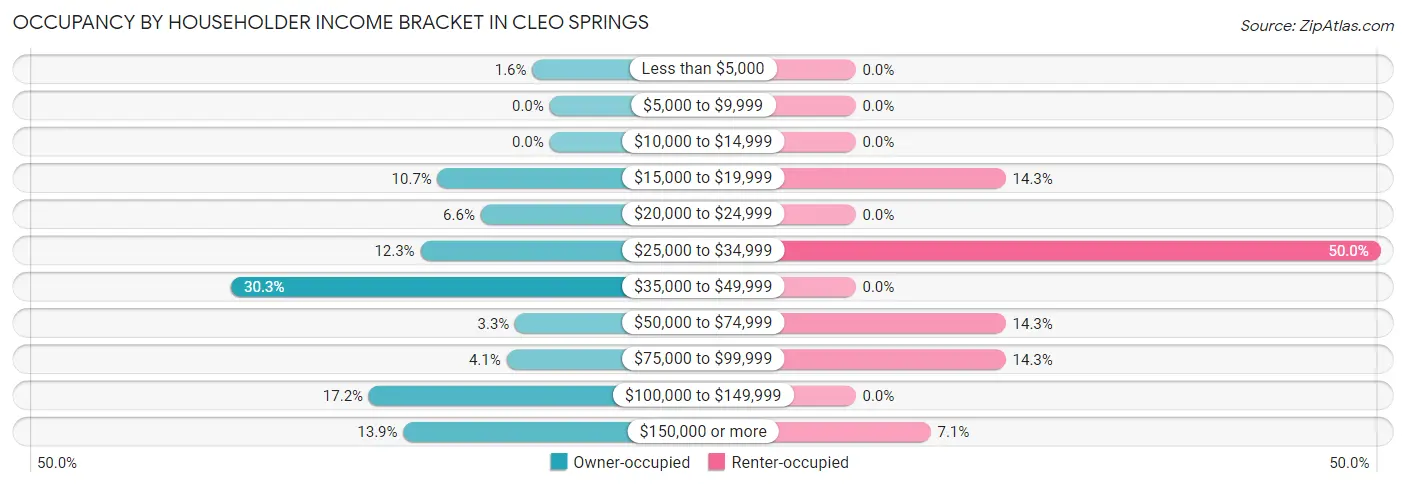
| Income Bracket | Owner-occupied | Renter-occupied |
| Less than $5,000 | 2 (1.6%) | 0 (0.0%) |
| $5,000 to $9,999 | 0 (0.0%) | 0 (0.0%) |
| $10,000 to $14,999 | 0 (0.0%) | 0 (0.0%) |
| $15,000 to $19,999 | 13 (10.7%) | 2 (14.3%) |
| $20,000 to $24,999 | 8 (6.6%) | 0 (0.0%) |
| $25,000 to $34,999 | 15 (12.3%) | 7 (50.0%) |
| $35,000 to $49,999 | 37 (30.3%) | 0 (0.0%) |
| $50,000 to $74,999 | 4 (3.3%) | 2 (14.3%) |
| $75,000 to $99,999 | 5 (4.1%) | 2 (14.3%) |
| $100,000 to $149,999 | 21 (17.2%) | 0 (0.0%) |
| $150,000 or more | 17 (13.9%) | 1 (7.1%) |
| Total | 122 (100.0%) | 14 (100.0%) |
Monthly Housing Cost Tiers in Cleo Springs
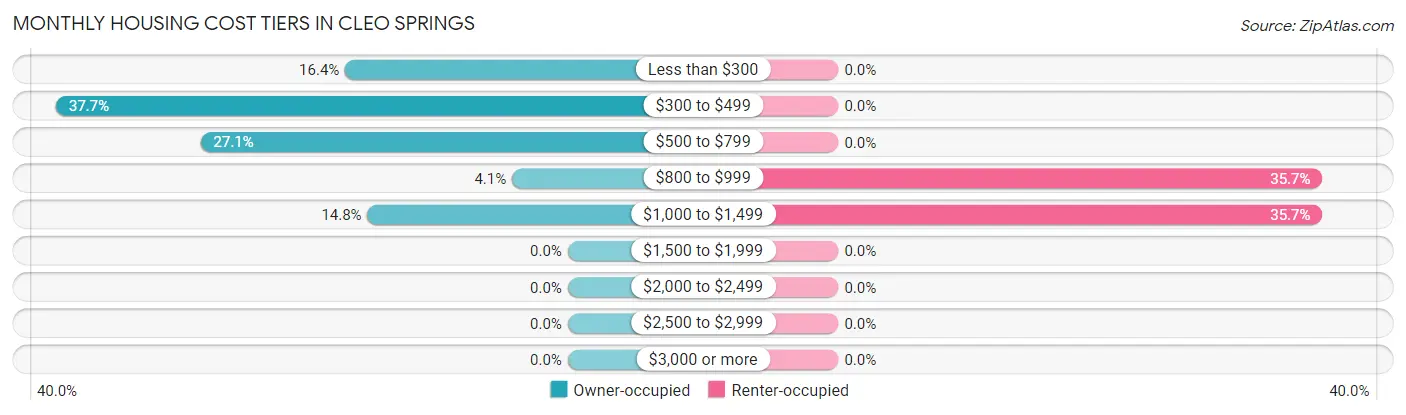
| Monthly Cost | Owner-occupied | Renter-occupied |
| Less than $300 | 20 (16.4%) | 0 (0.0%) |
| $300 to $499 | 46 (37.7%) | 0 (0.0%) |
| $500 to $799 | 33 (27.1%) | 0 (0.0%) |
| $800 to $999 | 5 (4.1%) | 5 (35.7%) |
| $1,000 to $1,499 | 18 (14.7%) | 5 (35.7%) |
| $1,500 to $1,999 | 0 (0.0%) | 0 (0.0%) |
| $2,000 to $2,499 | 0 (0.0%) | 0 (0.0%) |
| $2,500 to $2,999 | 0 (0.0%) | 0 (0.0%) |
| $3,000 or more | 0 (0.0%) | 0 (0.0%) |
| Total | 122 (100.0%) | 14 (100.0%) |
Physical Housing Characteristics in Cleo Springs
Housing Structures in Cleo Springs
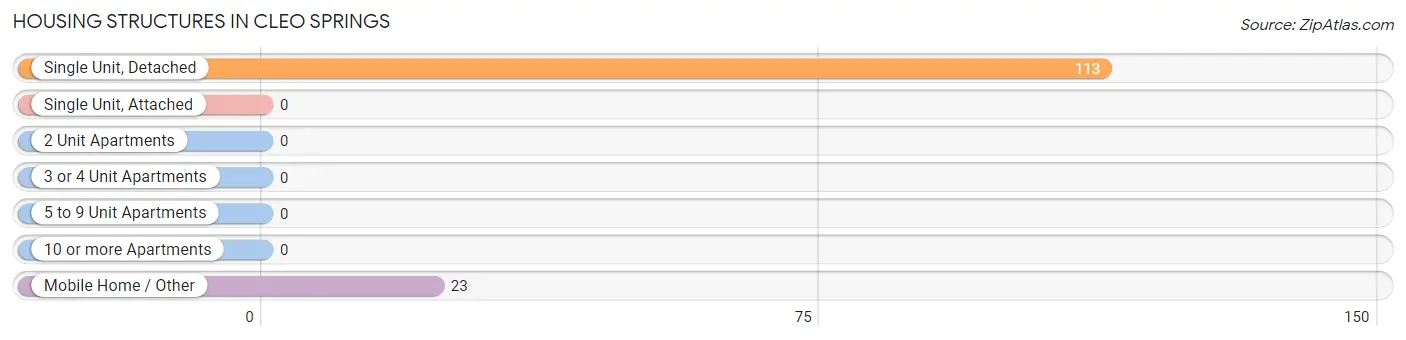
| Structure Type | # Housing Units | % Housing Units |
| Single Unit, Detached | 113 | 83.1% |
| Single Unit, Attached | 0 | 0.0% |
| 2 Unit Apartments | 0 | 0.0% |
| 3 or 4 Unit Apartments | 0 | 0.0% |
| 5 to 9 Unit Apartments | 0 | 0.0% |
| 10 or more Apartments | 0 | 0.0% |
| Mobile Home / Other | 23 | 16.9% |
| Total | 136 | 100.0% |
Housing Structures by Occupancy in Cleo Springs
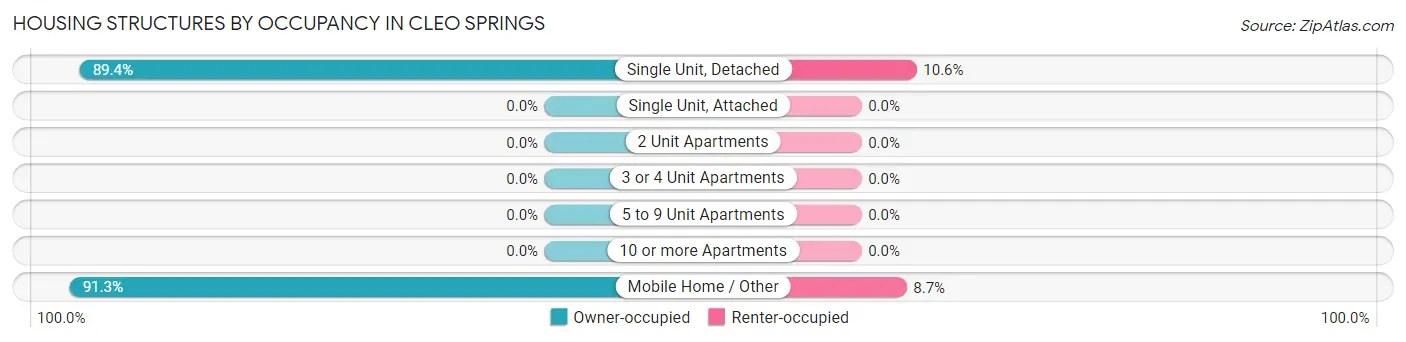
| Structure Type | Owner-occupied | Renter-occupied |
| Single Unit, Detached | 101 (89.4%) | 12 (10.6%) |
| Single Unit, Attached | 0 (0.0%) | 0 (0.0%) |
| 2 Unit Apartments | 0 (0.0%) | 0 (0.0%) |
| 3 or 4 Unit Apartments | 0 (0.0%) | 0 (0.0%) |
| 5 to 9 Unit Apartments | 0 (0.0%) | 0 (0.0%) |
| 10 or more Apartments | 0 (0.0%) | 0 (0.0%) |
| Mobile Home / Other | 21 (91.3%) | 2 (8.7%) |
| Total | 122 (89.7%) | 14 (10.3%) |
Housing Structures by Number of Rooms in Cleo Springs
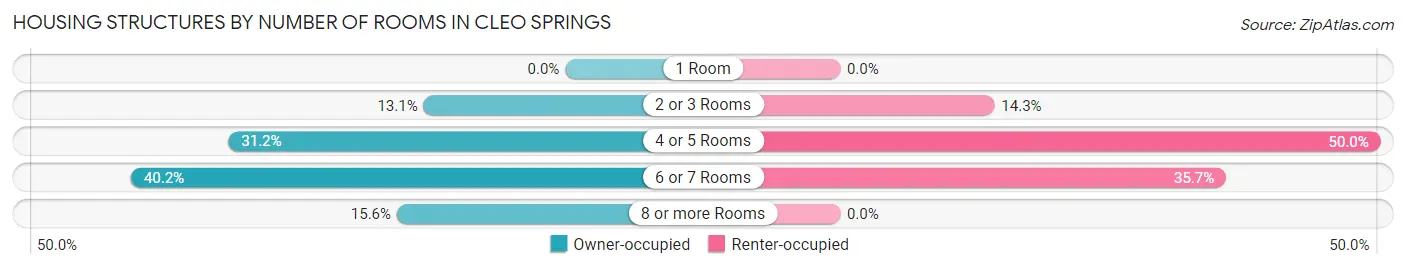
| Number of Rooms | Owner-occupied | Renter-occupied |
| 1 Room | 0 (0.0%) | 0 (0.0%) |
| 2 or 3 Rooms | 16 (13.1%) | 2 (14.3%) |
| 4 or 5 Rooms | 38 (31.1%) | 7 (50.0%) |
| 6 or 7 Rooms | 49 (40.2%) | 5 (35.7%) |
| 8 or more Rooms | 19 (15.6%) | 0 (0.0%) |
| Total | 122 (100.0%) | 14 (100.0%) |
Housing Structure by Heating Type in Cleo Springs
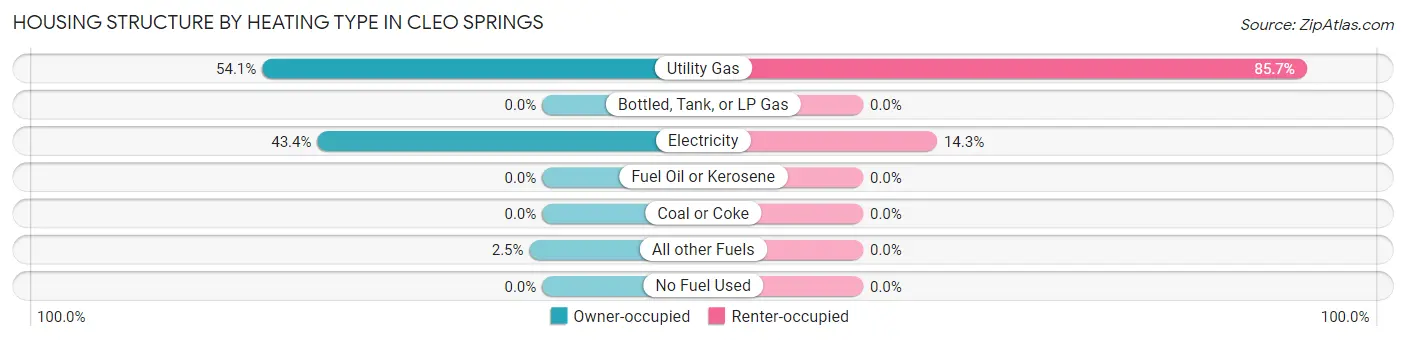
| Heating Type | Owner-occupied | Renter-occupied |
| Utility Gas | 66 (54.1%) | 12 (85.7%) |
| Bottled, Tank, or LP Gas | 0 (0.0%) | 0 (0.0%) |
| Electricity | 53 (43.4%) | 2 (14.3%) |
| Fuel Oil or Kerosene | 0 (0.0%) | 0 (0.0%) |
| Coal or Coke | 0 (0.0%) | 0 (0.0%) |
| All other Fuels | 3 (2.5%) | 0 (0.0%) |
| No Fuel Used | 0 (0.0%) | 0 (0.0%) |
| Total | 122 (100.0%) | 14 (100.0%) |
Household Vehicle Usage in Cleo Springs
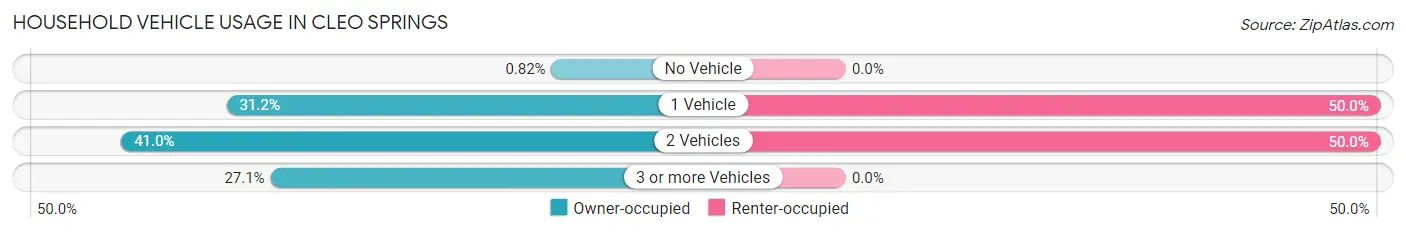
| Vehicles per Household | Owner-occupied | Renter-occupied |
| No Vehicle | 1 (0.8%) | 0 (0.0%) |
| 1 Vehicle | 38 (31.1%) | 7 (50.0%) |
| 2 Vehicles | 50 (41.0%) | 7 (50.0%) |
| 3 or more Vehicles | 33 (27.1%) | 0 (0.0%) |
| Total | 122 (100.0%) | 14 (100.0%) |
Real Estate & Mortgages in Cleo Springs
Real Estate and Mortgage Overview in Cleo Springs
| Characteristic | Without Mortgage | With Mortgage |
| Housing Units | 86 | 36 |
| Median Property Value | $91,800 | $93,800 |
| Median Household Income | $37,143 | $3 |
| Monthly Housing Costs | $365 | $0 |
| Real Estate Taxes | $463 | $2 |
Property Value by Mortgage Status in Cleo Springs
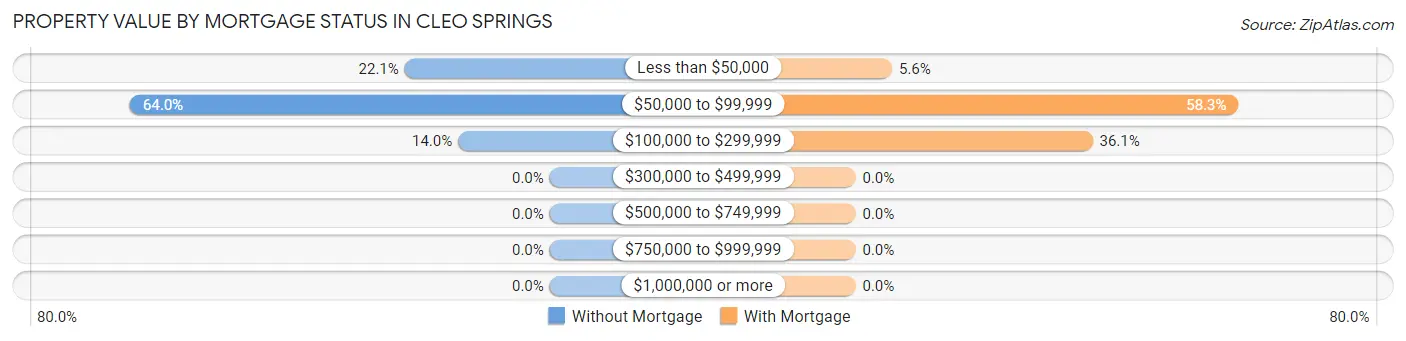
| Property Value | Without Mortgage | With Mortgage |
| Less than $50,000 | 19 (22.1%) | 2 (5.6%) |
| $50,000 to $99,999 | 55 (63.9%) | 21 (58.3%) |
| $100,000 to $299,999 | 12 (14.0%) | 13 (36.1%) |
| $300,000 to $499,999 | 0 (0.0%) | 0 (0.0%) |
| $500,000 to $749,999 | 0 (0.0%) | 0 (0.0%) |
| $750,000 to $999,999 | 0 (0.0%) | 0 (0.0%) |
| $1,000,000 or more | 0 (0.0%) | 0 (0.0%) |
| Total | 86 (100.0%) | 36 (100.0%) |
Household Income by Mortgage Status in Cleo Springs
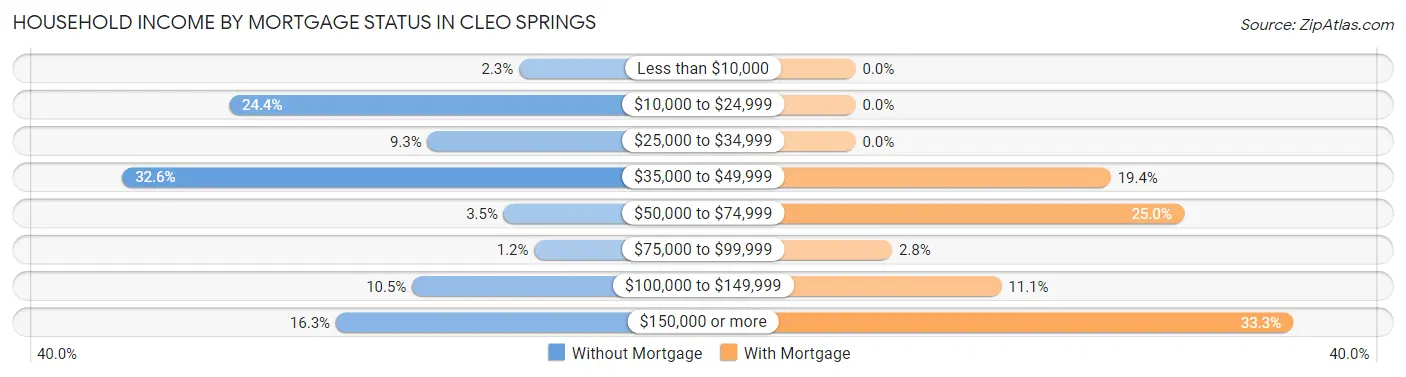
| Household Income | Without Mortgage | With Mortgage |
| Less than $10,000 | 2 (2.3%) | 0 (0.0%) |
| $10,000 to $24,999 | 21 (24.4%) | 0 (0.0%) |
| $25,000 to $34,999 | 8 (9.3%) | 0 (0.0%) |
| $35,000 to $49,999 | 28 (32.6%) | 7 (19.4%) |
| $50,000 to $74,999 | 3 (3.5%) | 9 (25.0%) |
| $75,000 to $99,999 | 1 (1.2%) | 1 (2.8%) |
| $100,000 to $149,999 | 9 (10.5%) | 4 (11.1%) |
| $150,000 or more | 14 (16.3%) | 12 (33.3%) |
| Total | 86 (100.0%) | 36 (100.0%) |
Property Value to Household Income Ratio in Cleo Springs
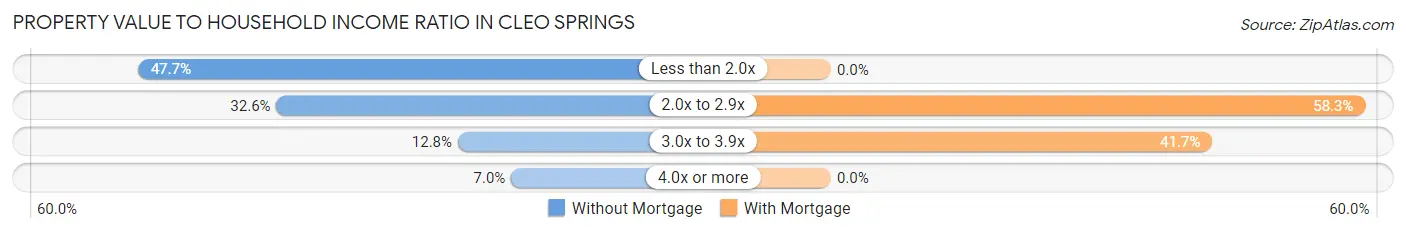
| Value-to-Income Ratio | Without Mortgage | With Mortgage |
| Less than 2.0x | 41 (47.7%) | 0 (0.0%) |
| 2.0x to 2.9x | 28 (32.6%) | 21 (58.3%) |
| 3.0x to 3.9x | 11 (12.8%) | 15 (41.7%) |
| 4.0x or more | 6 (7.0%) | 0 (0.0%) |
| Total | 86 (100.0%) | 36 (100.0%) |
Real Estate Taxes by Mortgage Status in Cleo Springs
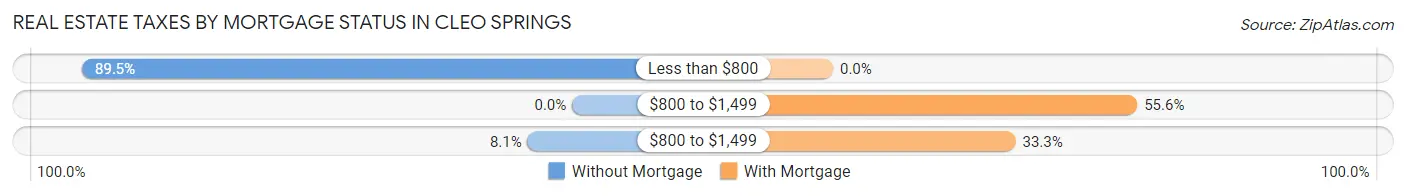
| Property Taxes | Without Mortgage | With Mortgage |
| Less than $800 | 77 (89.5%) | 0 (0.0%) |
| $800 to $1,499 | 0 (0.0%) | 20 (55.6%) |
| $800 to $1,499 | 7 (8.1%) | 12 (33.3%) |
| Total | 86 (100.0%) | 36 (100.0%) |
Health & Disability in Cleo Springs
Health Insurance Coverage by Age in Cleo Springs
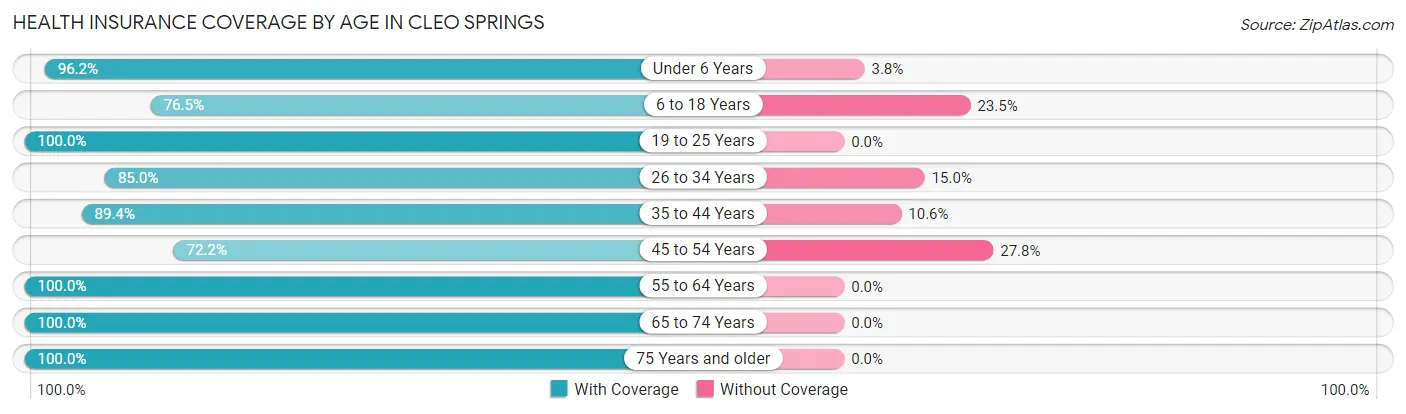
| Age Bracket | With Coverage | Without Coverage |
| Under 6 Years | 51 (96.2%) | 2 (3.8%) |
| 6 to 18 Years | 78 (76.5%) | 24 (23.5%) |
| 19 to 25 Years | 5 (100.0%) | 0 (0.0%) |
| 26 to 34 Years | 17 (85.0%) | 3 (15.0%) |
| 35 to 44 Years | 42 (89.4%) | 5 (10.6%) |
| 45 to 54 Years | 13 (72.2%) | 5 (27.8%) |
| 55 to 64 Years | 39 (100.0%) | 0 (0.0%) |
| 65 to 74 Years | 36 (100.0%) | 0 (0.0%) |
| 75 Years and older | 40 (100.0%) | 0 (0.0%) |
| Total | 321 (89.2%) | 39 (10.8%) |
Health Insurance Coverage by Citizenship Status in Cleo Springs
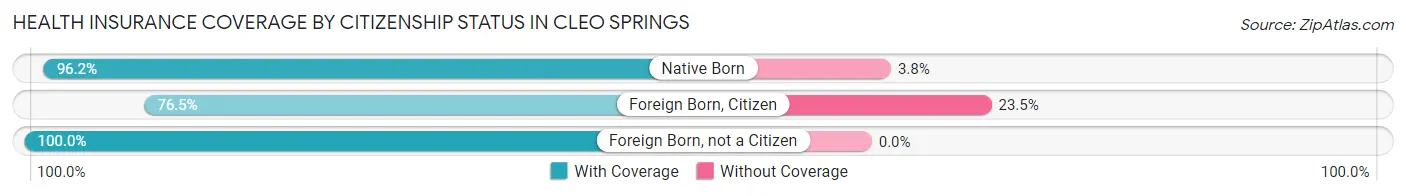
| Citizenship Status | With Coverage | Without Coverage |
| Native Born | 51 (96.2%) | 2 (3.8%) |
| Foreign Born, Citizen | 78 (76.5%) | 24 (23.5%) |
| Foreign Born, not a Citizen | 5 (100.0%) | 0 (0.0%) |
Health Insurance Coverage by Household Income in Cleo Springs
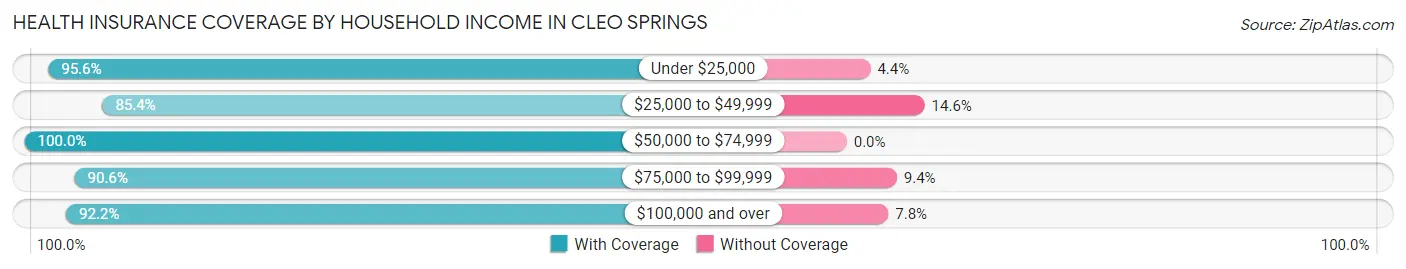
| Household Income | With Coverage | Without Coverage |
| Under $25,000 | 43 (95.6%) | 2 (4.4%) |
| $25,000 to $49,999 | 158 (85.4%) | 27 (14.6%) |
| $50,000 to $74,999 | 8 (100.0%) | 0 (0.0%) |
| $75,000 to $99,999 | 29 (90.6%) | 3 (9.4%) |
| $100,000 and over | 83 (92.2%) | 7 (7.8%) |
Public vs Private Health Insurance Coverage by Age in Cleo Springs
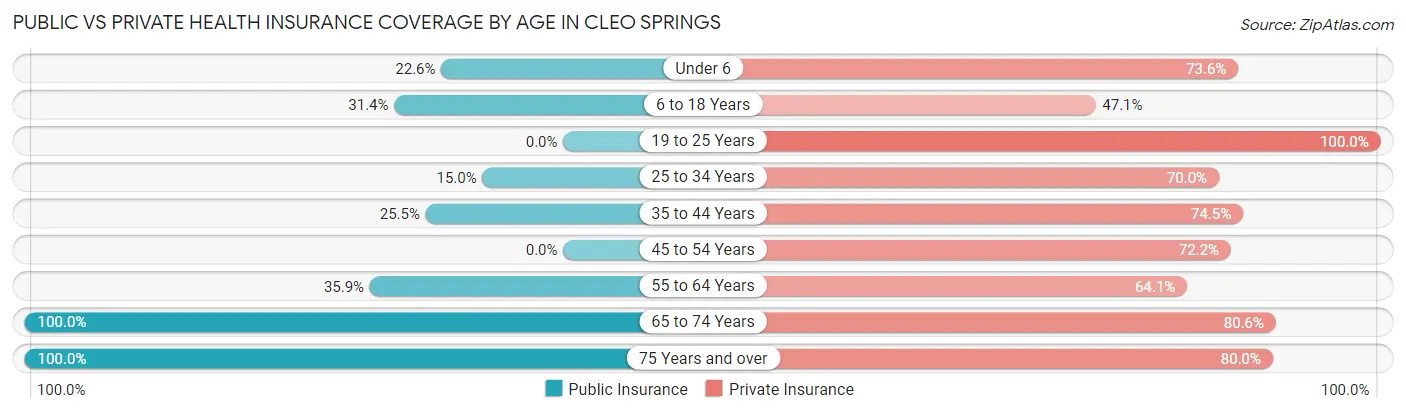
| Age Bracket | Public Insurance | Private Insurance |
| Under 6 | 12 (22.6%) | 39 (73.6%) |
| 6 to 18 Years | 32 (31.4%) | 48 (47.1%) |
| 19 to 25 Years | 0 (0.0%) | 5 (100.0%) |
| 25 to 34 Years | 3 (15.0%) | 14 (70.0%) |
| 35 to 44 Years | 12 (25.5%) | 35 (74.5%) |
| 45 to 54 Years | 0 (0.0%) | 13 (72.2%) |
| 55 to 64 Years | 14 (35.9%) | 25 (64.1%) |
| 65 to 74 Years | 36 (100.0%) | 29 (80.6%) |
| 75 Years and over | 40 (100.0%) | 32 (80.0%) |
| Total | 149 (41.4%) | 240 (66.7%) |
Disability Status by Sex by Age in Cleo Springs
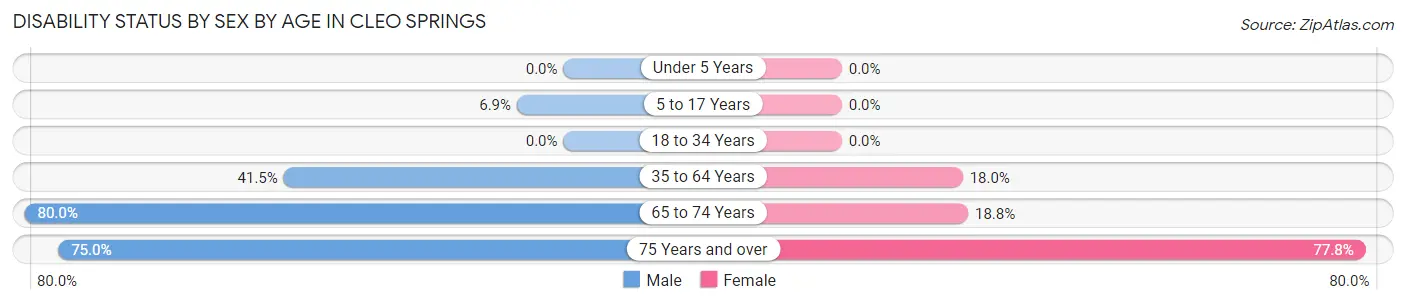
| Age Bracket | Male | Female |
| Under 5 Years | 0 (0.0%) | 0 (0.0%) |
| 5 to 17 Years | 4 (6.9%) | 0 (0.0%) |
| 18 to 34 Years | 0 (0.0%) | 0 (0.0%) |
| 35 to 64 Years | 27 (41.5%) | 7 (17.9%) |
| 65 to 74 Years | 16 (80.0%) | 3 (18.8%) |
| 75 Years and over | 3 (75.0%) | 28 (77.8%) |
Disability Class by Sex by Age in Cleo Springs
Disability Class: Hearing Difficulty
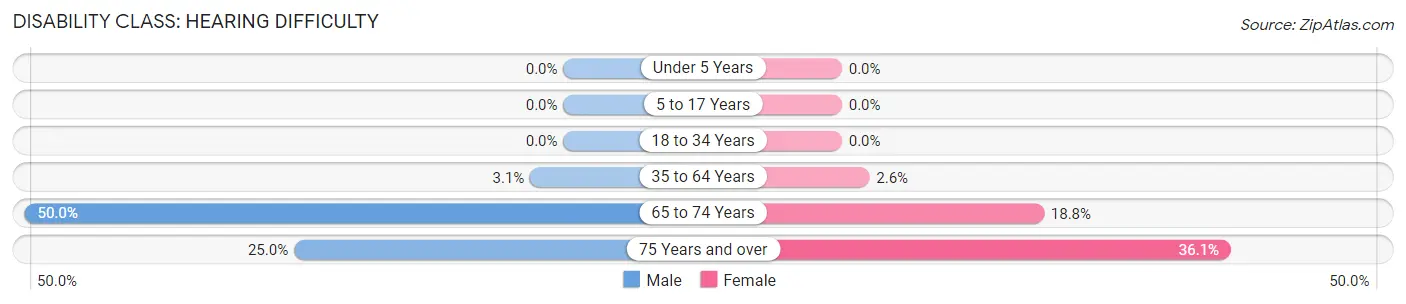
| Age Bracket | Male | Female |
| Under 5 Years | 0 (0.0%) | 0 (0.0%) |
| 5 to 17 Years | 0 (0.0%) | 0 (0.0%) |
| 18 to 34 Years | 0 (0.0%) | 0 (0.0%) |
| 35 to 64 Years | 2 (3.1%) | 1 (2.6%) |
| 65 to 74 Years | 10 (50.0%) | 3 (18.8%) |
| 75 Years and over | 1 (25.0%) | 13 (36.1%) |
Disability Class: Vision Difficulty
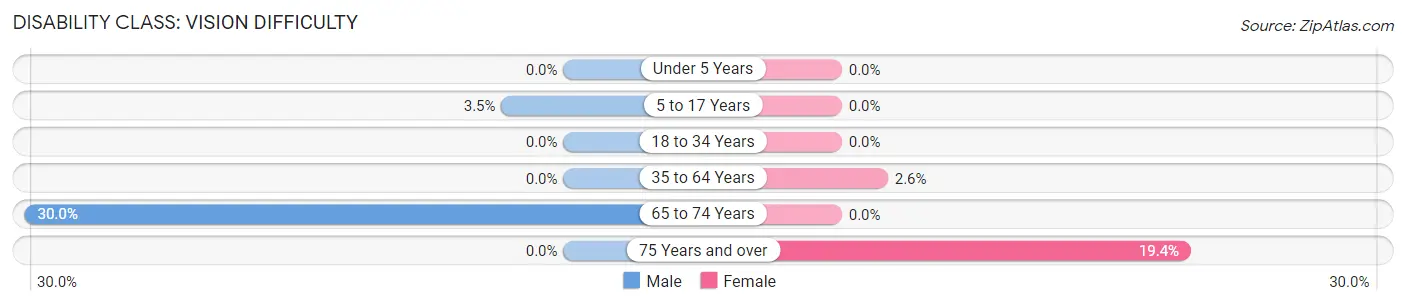
| Age Bracket | Male | Female |
| Under 5 Years | 0 (0.0%) | 0 (0.0%) |
| 5 to 17 Years | 2 (3.5%) | 0 (0.0%) |
| 18 to 34 Years | 0 (0.0%) | 0 (0.0%) |
| 35 to 64 Years | 0 (0.0%) | 1 (2.6%) |
| 65 to 74 Years | 6 (30.0%) | 0 (0.0%) |
| 75 Years and over | 0 (0.0%) | 7 (19.4%) |
Disability Class: Cognitive Difficulty
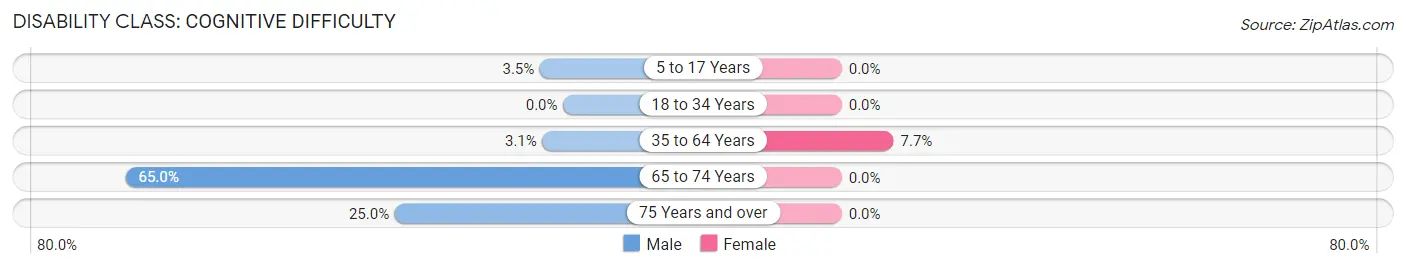
| Age Bracket | Male | Female |
| 5 to 17 Years | 2 (3.5%) | 0 (0.0%) |
| 18 to 34 Years | 0 (0.0%) | 0 (0.0%) |
| 35 to 64 Years | 2 (3.1%) | 3 (7.7%) |
| 65 to 74 Years | 13 (65.0%) | 0 (0.0%) |
| 75 Years and over | 1 (25.0%) | 0 (0.0%) |
Disability Class: Ambulatory Difficulty
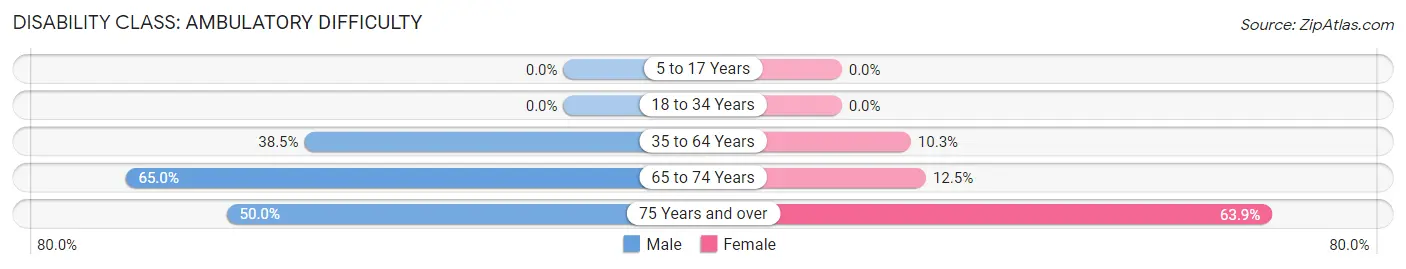
| Age Bracket | Male | Female |
| 5 to 17 Years | 0 (0.0%) | 0 (0.0%) |
| 18 to 34 Years | 0 (0.0%) | 0 (0.0%) |
| 35 to 64 Years | 25 (38.5%) | 4 (10.3%) |
| 65 to 74 Years | 13 (65.0%) | 2 (12.5%) |
| 75 Years and over | 2 (50.0%) | 23 (63.9%) |
Disability Class: Self-Care Difficulty
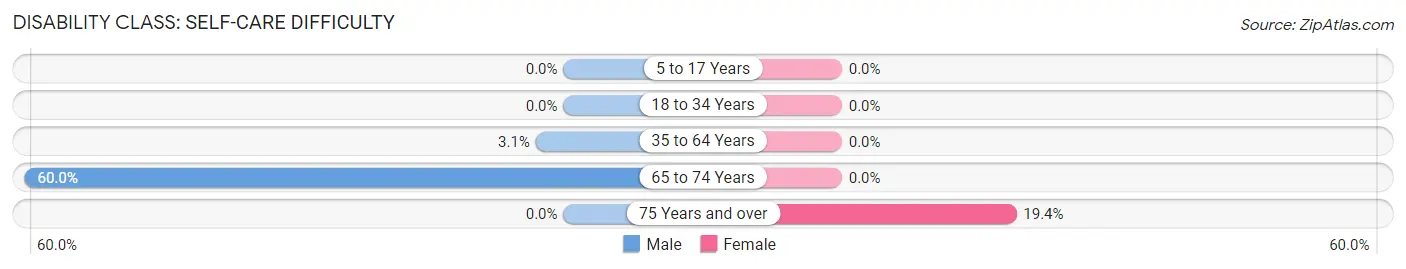
| Age Bracket | Male | Female |
| 5 to 17 Years | 0 (0.0%) | 0 (0.0%) |
| 18 to 34 Years | 0 (0.0%) | 0 (0.0%) |
| 35 to 64 Years | 2 (3.1%) | 0 (0.0%) |
| 65 to 74 Years | 12 (60.0%) | 0 (0.0%) |
| 75 Years and over | 0 (0.0%) | 7 (19.4%) |
Technology Access in Cleo Springs
Computing Device Access in Cleo Springs
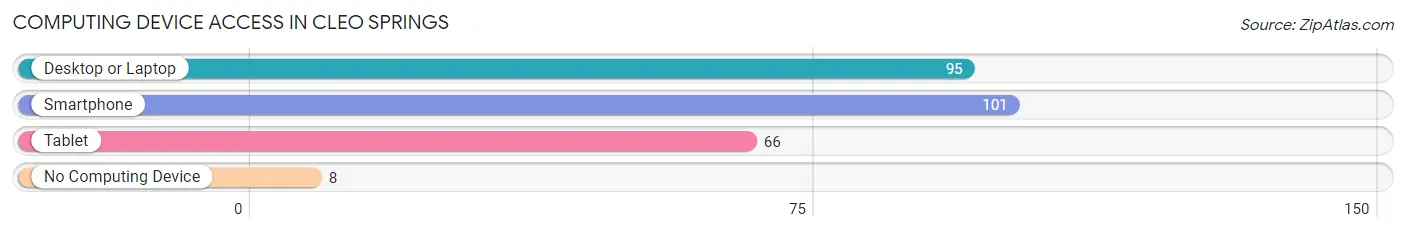
| Device Type | # Households | % Households |
| Desktop or Laptop | 95 | 69.9% |
| Smartphone | 101 | 74.3% |
| Tablet | 66 | 48.5% |
| No Computing Device | 8 | 5.9% |
| Total | 136 | 100.0% |
Internet Access in Cleo Springs
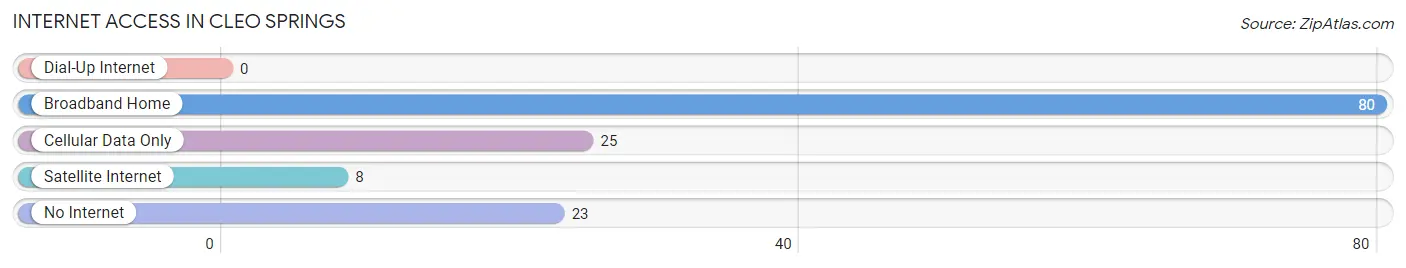
| Internet Type | # Households | % Households |
| Dial-Up Internet | 0 | 0.0% |
| Broadband Home | 80 | 58.8% |
| Cellular Data Only | 25 | 18.4% |
| Satellite Internet | 8 | 5.9% |
| No Internet | 23 | 16.9% |
| Total | 136 | 100.0% |
Cleo Springs Summary
Cleo Springs is a small town located in Major County, Oklahoma. It is situated in the northwest corner of the state, approximately 20 miles east of the Kansas border. The town was founded in 1901 and was named after the daughter of the first postmaster, Cleo Mayfield. The population of Cleo Springs was estimated to be around 500 people in 2020.
Geography
Cleo Springs is located in the northwest corner of Oklahoma, approximately 20 miles east of the Kansas border. The town is situated in the Red Bed Plains region of the state, which is characterized by flat terrain and sandy soils. The town is located in Major County, which is part of the Oklahoma Panhandle. The nearest major city is Enid, which is located about 40 miles to the south.
The climate in Cleo Springs is semi-arid, with hot summers and cold winters. The average annual temperature is around 60 degrees Fahrenheit, with average highs in the summer reaching into the mid-90s and lows in the winter dipping into the mid-20s. The average annual precipitation is around 20 inches, with most of it falling in the spring and summer months.
Economy
The economy of Cleo Springs is largely based on agriculture. The town is home to several farms and ranches, which produce a variety of crops and livestock. The town is also home to a few small businesses, including a grocery store, a hardware store, and a few restaurants.
The town is also home to a few manufacturing companies, which produce a variety of products, including furniture, clothing, and automotive parts. The town is also home to a few oil and gas companies, which are involved in the exploration and production of oil and natural gas in the area.
Demographics
The population of Cleo Springs was estimated to be around 500 people in 2020. The town is predominantly white, with around 95% of the population identifying as such. The remaining 5% of the population is made up of African Americans, Native Americans, and other races.
The median household income in Cleo Springs is around $35,000, which is slightly lower than the state average. The town has a relatively low unemployment rate, with only around 4% of the population being unemployed.
The town is served by the Cleo Springs Public School District, which consists of one elementary school, one middle school, and one high school. The town is also home to a few churches, including the First Baptist Church and the Church of Christ.
Conclusion
Cleo Springs is a small town located in Major County, Oklahoma. It is situated in the northwest corner of the state, approximately 20 miles east of the Kansas border. The town was founded in 1901 and was named after the daughter of the first postmaster, Cleo Mayfield. The population of Cleo Springs was estimated to be around 500 people in 2020. The economy of Cleo Springs is largely based on agriculture, with a few small businesses and manufacturing companies also present in the town. The town is predominantly white, with around 95% of the population identifying as such. The median household income in Cleo Springs is around $35,000, which is slightly lower than the state average. The town is served by the Cleo Springs Public School District, which consists of one elementary school, one middle school, and one high school.
Common Questions
What is Per Capita Income in Cleo Springs?
Per Capita income in Cleo Springs is $27,246.
What is the Median Family Income in Cleo Springs?
Median Family Income in Cleo Springs is $42,321.
What is the Median Household income in Cleo Springs?
Median Household Income in Cleo Springs is $41,071.
What is Income or Wage Gap in Cleo Springs?
Income or Wage Gap in Cleo Springs is 63.6%.
Women in Cleo Springs earn 36.4 cents for every dollar earned by a man.
What is Inequality or Gini Index in Cleo Springs?
Inequality or Gini Index in Cleo Springs is 0.42.
What is the Total Population of Cleo Springs?
Total Population of Cleo Springs is 360.
What is the Total Male Population of Cleo Springs?
Total Male Population of Cleo Springs is 168.
What is the Total Female Population of Cleo Springs?
Total Female Population of Cleo Springs is 192.
What is the Ratio of Males per 100 Females in Cleo Springs?
There are 87.50 Males per 100 Females in Cleo Springs.
What is the Ratio of Females per 100 Males in Cleo Springs?
There are 114.29 Females per 100 Males in Cleo Springs.
What is the Median Population Age in Cleo Springs?
Median Population Age in Cleo Springs is 35.0 Years.
What is the Average Family Size in Cleo Springs
Average Family Size in Cleo Springs is 3.7 People.
What is the Average Household Size in Cleo Springs
Average Household Size in Cleo Springs is 2.6 People.
How Large is the Labor Force in Cleo Springs?
There are 117 People in the Labor Forcein in Cleo Springs.
What is the Percentage of People in the Labor Force in Cleo Springs?
56.0% of People are in the Labor Force in Cleo Springs.